canada1 - international nuclear information system (inis)
TRANSCRIPT
INFO 0598CA9600090
1*1 Atomic Energy Commission de contrôleControl Board de l'énergie atomique Canada1
INFO-0598
I—icu .
Dose from OrganicallyBound Tritium After anAcute Tritiated Water
Intake in Humans
by
A. Trivedi,R.B. Richardson and D. Galeriu
AECL ResearchChalk River Laboratories
Prepared forthe Atomic Energy Control Board
under its Regulatory Researchand Support Program
Ottawa, Canada
AECB Project No. 7.155.
October 1995
IE 1*1 Atomic Energy Commission de contrôle
Control Board de l'énergie atomique CanadaI NEXT PAGE(S) left BLANK.
DOSE FROM ORGANICALLY BOUND TRITIUM AFTERAN ACUTE TRITIATED WATER INTAKE IN HUMANS
A report prepared by A. Trivedi, R.B. Richardson and D. Galeriu, AECL Research, ChalkRiver Laboratories, under contract to the Atomic Energy Control Board.
ABSTRACT
We have analyzed the urinary excretion data from eight male workers following an acuteintake of tritiated water (HTO) and assessed the dose contribution from organically boundtritium (OBT) in the body. The individuals affected increased their fluid intakes during thefirst month or more post-exposure, to accelerate the turnover of tritium in the body water fordose mitigation purposes. The volumes of cumulative 24 h urine samples were similar toReference Man in the latter part of the study (100-300 d post-exposure). The workers' urinesamples were analyzed for total tritium up to 300 d post-exposure. The analysis of thebioassay data showed that the mean body water turnover half-time, with standard deviation,was 6.3 + 1.0 d and 8.4 ± 2.0 d during the period of increased fluid intake and normal fluidintake, respectively. A longer-term component of tritium excretion was also observed (half-life 74 + 18 d), indicating the incorporation of tritium and its retention in the organic fractionsof the soft tissues. Cumulative 24 h urine samples, fecal samples and blood samples werecollected and analyzed for HTO and OBT from a control group of workers and the exposedworkers during the latter part of the study (100-300 d post-exposure). The activityconcentrations of HTO-in-urine and HTO-in-feces were in equilibrium and were representativeof HTO in the body water (HTO-tn-blood). The ratio of bound tritium per gram hydrogen(Bq«gH'1) in organic matter in feces (OBT,eces) to urine (OBTurine) was 1.0 ± 0.1. The ratio ofOBTbtood to OBTurine and OBTbl0Otf to OBT,eces was 0.9 ± 0.2 and 1.1 ± 0.2, respectively. Theseresults suggest that a measurement of the tritium activity per unit mass of organic matter inurine can provide an assessment of the specific activity of tritium in the organic fraction of thesoft tissue, providing an equilibrium condition exists. A mathematical model is proposed toestimate the dose increase from the retained OBT by examining the kinetics of total tritiumexcretion in urine. The model accounts for the variable rates of fluid intake. The influence ofmeasurement errors and the limited duration of the study (0-300 d post-exposure) on theOBT dose contribution was assessed through statistical analysis, while the role of direct OBTexcretion in urine was estimated by using metabolic models. Based on the time series oftritium concentration in urine, the average dose increase to the workers from the metabolisedOBT was calculated as 6.2 ± 1.3% of the HTO dose.
RESUME
Nous avons analysé des données sur l'excrétion urinaire obtenues chez huit travailleurs desexe masculin victimes d'une absorption aiguë d'eau tritiée (ET) et évalué la contribution dutritium lié organiquement (TLO) à la dose reçue par l'organisme. Les travailleurs touchés ontaccru leur apport en liquide durant le premier mois ou plus après l'exposition afin d'accélérerle renouvellement de l'eau corporelle et, ainsi, atténuer les effets de l'exposition au tritium.Les volumes des échantillons d'urine cumulés sur 24 h étaient semblables à ceux de
IV
l'homme de référence dans la dernière partie de l'étude (100-300 jours après l'exposition).Les échantillons d'urine des travailleurs ont fait l'objet d'un dosage du tritium total jusqu'à300 jours après l'exposition. L'analyse des données du dosage biologique a indiqué que lapériode de renouvellement moyenne de l'eau corporelle (avec écart-type) était de6,3 ± 1,0 jours et de 8,4 ± 2,0 jours respectivement pour la période où l'apport en liquide aété accru et pour la période où il a été normal. Une composante à plus long terme del'excrétion du tritium a également été observée (période de 74 + 18 jours), ce qui indiquequ'il y a incorporation et rétention du tritium dans les fractions organiques des tissus mous.L'ET et le TLO ont été dosés dans l'urine (échantillons cumulés sur 24 h), dans les matièresfécales et dans le sang des travailleurs exposés et d'un groupe de travailleurs témoins aucours de la dernière partie de l'étude (100-300 jours après l'exposition). Les concentrationsd'activité de l'ET d'origine urinaire et de PET d'origine fécale étaient en équilibre et étaientreprésentatives de l'ET dans l'eau corporelle (ET d'origine sanguine). Le rapport du tritium liépar gramme d'hydrogène (Bq«gH'1) dans la fraction organique des matières fécales (TLO,écJpar rapport au tritium lié présent dans l'urine (TLOunn,,J était de 1,0 ± 0,1. Les rapports duTLO,angu,n au TLOufinaire et du TLO,,nguin au TLO(écal étaient respectivement de 0,9 ± 0,2 et de1,1 + 0,2. Ces résultats indiquent qu'une mesure de l'activité du tritium par unité de massede matière organique dans l'urine peut donner une évaluation de l'activité massique dutritium dans la fraction organique des tissus mous, pourvu qu'existe un état d'équilibre. Unmodèle mathématique fondé sur la cinétique de l'excrétion urinaire du tritium total estproposé pour l'estimation de l'augmentation de la dose attribuable au TLO retenu. Le modèletient compte d'un apport de liquide variable. L'effet des erreurs de mesure et de la duréelimitée de l'étude (0-300 jours après l'exposition) sur la contribution du TLO à la dose a étéévalué par analyse statistique, tandis que le rôle de l'excrétion directe de TLO dans l'urine aété estimé à l'aide de modèles métaboliques. D'après les séries chronologiques de laconcentration de tritium dans l'urine, il a été calculé que l'augmentation moyenne de la dosechez les travailleurs attribuable au TLO métabolisé était de 6,1 + 1,3 % de la doseattribuable à l'ET.
DISCLAIMER
The Atomic Energy Control Board is not responsible for the accuracy of the statements madeor opinions expressed in this publication and neither the Board nor the authors assumeliability with respect to any damage or loss incurred as a result of the use made of theinformation contained in this publication.
V
TABLE OF CONTENTS
Page
ABSTRACT iii
GLOSSARY OF TERMS viii
1. INTRODUCTION 1
2. METHODS 2
2.1 Case History 22.1.1 Mode of HTO Contamination 22.1.2 Physiological Parameters of Exposed Workers (A-H) 3
2.3 Sample Collection and Storage 42.3.1 Urine 42.3.2 Feces 42.3.3 Whole Blood 4
2.4 Sample Analysis 52.4.1 Removal and Measurement of HTO and Exchangeable Tritium . . . . 52.4.2 Combustion and Determination of OBT 6
2.5 Activity Measurement 62.6 Data Analysis 7
3.0 INTERPRETATION OF BIOASSAY MEASUREMENTS 83.1 Tritium-in-Urine 8
3.1.1 Total tritium-in-urine for the exposed workers 83.1.1.1 Kinetics of tritium-in-urine with constant rate of fluid
intake 83.1.1.2 Kinetics of tritium-in-urine with variable rates of fluid
intake ' 103.1.2 HTO-in-urine and OBT-in-urine of the Exposed and Control
Group Workers 123.1.3 Kinetics of HTO-in-urine and OBT-in-urine of the Exposed
Workers 133.2 Tritium in Whole Blood 143.3 Tritium in Feces " 153.4 Tritium in Organic Fraction of Urine, Blood and Feces 16
4. DOSIMETRIC CONSIDERATIONS " 184.1 Dosimetry of Metabolised OBT 18
4.1.1 Role of Tritium-hydrogen Exchange in Dosimetry 194.1.2 Mathematical Model for OBT Dose Fraction (A) 20
4.1.2.1 Under constant rate of fluid intake and urinaryexcretion 23
4.1.2.2 Under variable rates of fluid intake and urinaryexcretion 25
4.2 OBT Dose Fraction (A) in the Exposed Workers 26
VI
5. DISCUSSION 28
6. FUTURE WORK 31
7. CONCLUSIONS 32
8. RECOMMENDATIONS 35
9. ACKNOWLEDGMENTS 35
10. REFERENCES 36
APPENDIX A TRITIUM-IN-URINE MEASUREMENTS AND STATISTICAL ANALYSISOF THE KINETIC DATA (0-300 DAYS POST-EXPOSURE) 54
A.1 Tritium-in-Urine Measurements 54A.2 Tritium-in-Urine Measurements and Residual Plots 63A.3 Statistical Analysis of the Tritium-in-Urine Data 72A.4 The influence of variable rates of fluid intake on the chi-square value
since HTO intake 74
APPENDIX B BIOASSAY DATA FOR THE EXPOSED (A-H) AND CONTROL (I-L)INDIVIDUALS (>100 DAYS POST-EXPOSURE) 76
APPENDIX C MEASUREMENTS OF HTO-IN-URINE AND OBT-IN-URINE OFEXPOSED WORKERS D AND G 90
C.1 HTO-in-Urine and OBT-in-Urine Data 90C.2 Urinary excretion of HTO-in-urine and OBT-in-urine 93
APPENDIX D OBT DOSE IN VARIOUS BIOLOGICAL SYSTEMS 96
APPENDIX E SOURCES OF UNCERTAINTY IN A VALUES 99E.1 Ratio of F*u to Fu 99E.2 Fitted Parameters 99E.3 HTO Metabolic Models 100
VII
LIST OF TABLES
Page
I The Physiological Parameters of the Exposed Individuals 42
II The Reproducibility and Reliability of Tritium Measurements in Urine 43
III The Zero Time Concentrations and the Biological Half-lives for the Urinary Excretion ofTritium in the Exposed Individuals (A-H) Assuming a Constant Rate of Fluid Intake anda Sum of Three Exponentials 44
IV The Zero Time Concentrations and the Biological Half-lives for the Urinary Excretion ofTritium in the Exposed Individuals (A-H) Assuming Variable Rates of Fluid Intake andBivariate Biexponential Function 45
V The Fractional Compartment Sizes and the Biological Half-lives of Tritium Per UnitIntake of HTO Under Variable Rates of Fluid Intake and a Bivariate Biexponentia!Function 46
VI The Zero Time Concentrations and the Biological Half-lives for the Urinary
Excretion of HTO and OBT in Individuals D and G 47
VII Reported Tritium Elimination Half-lives for Man 48
VIII The Composition of Soft Tissues in the Body 49
IX Reported Contribution of the OBT Dose to the Effective Dose in Humans After Acute orChronic HTO Intakes .' 50
X Dose Increase (A) from OBT as a Fraction of Dose due to Tritium in BodyWater of Exposed Workers 51
XI Summary of Compartment Sizes and Biological Half-lives of Tritium-in-urine PerUnit Intake of HTO and Estimated Dose Increase Factor (A) for the MetabolisedOBT From Other Reported Studies 52
XII Average Ratio of HTO and OBT in Bioassay Samples From 100 d to 300 DPost-exposure 53
VIII
GLOSSARY OF TERMS
HTO: is used in this report to mean the sum of tritium as water and the exchangeable boundtritium. The exchangeable tritium is bound to N, 0, P, and S moeties of the biomolecules andis readily exchangeable with the body fluids.
OBT: Organically bound tritium means the tritium bound directly to carbon in biologicalmolecules. The stable carbon-tritium bond is disassociated only by enzymatic reactions toexchange tritium with the hydrogen in body fluids.
tc: Apparent time post exposure when change in rates of fluid intake and urinary excretionoccurs.
A: Ratio of time-integral activity of OBT in the soft tissues of the body to the time-integralactivity of tritium in the body fluids.
AV: Ratio of time-integral activity of OBT in the soft tissues of the body to the time-integralactivity of tritium in the body fluids under variable rates of fluid intake and urine excretion.
Ac: Ratio of time-integral activity of OBT in the soft tissues of the body to the time-integralactivity of tritium in the body fluids under constant rate of fluid intake and urine excretion.
BIVARIATE BI-EXPONENTIAL FUNCTION: A bi-exponential function where the time constantpertaining to the first component changes discontinuously at tc. The time constant of secondcomponent is common to all time period, before and after time, tc.
DOSE FROM ORGANICALLY BOUND TRITIUM AFTER AN ACUTE TRITIATED WATERINTAKE IN HUMANS
1. INTRODUCTION
Studies of the uptake and retention of tritium in the body following tritiated water (HTO) intakein humans have provided confidence in our understanding of the metabolism of tritium (Saito,1992; Hill and Johnson, 1993). HTO that enters the body becomes uniformly distributedthroughout the body water within a few hours (Osborne, 1972; Pinson and Langham, 1980).The residence time of tritium in the body is governed primarily by the turnover of body water(Osborne, 1966; Balonov et al., 1974; Llyod et al., 1986). However, since tritium can replaceordinary hydrogen in chemical and biochemical processes in the body, a small fraction oftritium also binds to organic compounds and is retained in the form of organically boundtritium (OBT) (Feinendegen et al., 1980; Belloni et al., 1983; Rudran, 1988; Myers andJohnson, 1991). The distribution and rate of metabolic degradation of OBT vary, dependingon the type of organic molecules (Smith and Taylor, 1969; Diabaté and Strack, 1993). Theretention of tritium in the body following an exposure to HTO has at least two components.The short-term component is dominated by the retention of HTO and exchangeable tritium,while a longer-term component is controlled by OBT. This means that the concentration in theorganic compounds in the body can be at a much higher level than the corresponding HTOconcentration at long times after exposure. This situation has a significant bearing on thedosimetry from HTO intake (Bush, 1972; Bard, 1978; Balonov and Likhtarve, 1984).
The International Commission on Radiological Protection (ICRP) considers that a singlemetabolic compartment with a retention half-life of 10 d is adequate for dosimetry purposes(ICRP, 1991). The ICRP also recognizes the existence of at least one additional compartmentwith a retention half-life much greater than 10 d. The argument has been that the time-integrated tritium concentration in any organ or tissue (which is proportional to accumulateddose) cannot exceed that in the body water (Sanders and Reinig, 1968; Snyders et al., 1968;Osborne, 1972; NCRP, 1979). This hypothesis has been reevaluated following the publicationof the concept of the committed effective dose for settling limits on intake of radionuclides(ICRP 1979-1982). From Reference Man data and the published results of intakes of tritium,Johnson (1982) estimated that the error from ignoring dose contribution from the metabolisedOBT after HTO intakes was less than 10%. In other words, the dose contribution from OBTcan be ignored for dosimetric purposes. Despite this, argument persists about the amount oftritium fixing in organic compounds of the soft tissues, in estimating the internal radiationdoses remain. Rudran (1988) argued that the dose contribution from OBT to the whole-bodycommitted dose equivalent could be significantly higher (three-fold) than that calculated on thebasis of the body water alone. Rudran's argument was based on the bioassay data fromindividuals who had significant quantities of HTO intakes. Subsequently, Taylor (1989) raisedquestions on the validity of the current ICRP recommendations for the annual limit on intake(ALI) for HTO.
Since then, an unplanned acute intake of large quantities of HTO by workers occurred in aCanadian nuclear generating station (Paciga and Skinner, 1991; Burnham, 1992). On 1990February 22, eight male workers were accidentally contaminated. The workers drank from anorange juice dispenser that was later found to be spiked with tritiated heavy water. We had
the assurance of knowing not only the form of tritium intake but also the time of intake as theevidence of contamination came within 24 h of exposure.1 This situation has provided a rareopportunity to obtain human data on the retention of tritium in the body after an acute intakeof HTO (Trivedi et al., 1993). The concentration of total tritium-in-urine was monitored fromthese workers a few hours after HTO intake up to 300 d post-exposure. In addition, theconcentration of HTO and OBT in urine, blood and feces samples from these exposedworkers, designated as individuals A-H, were analyzed from samples collected from 100 dafter the exposure up to 300 d post-exposure. The present report documents the collection ofthe bioassay samples from the eight exposed workers (A-H) and four workers in a controlgroup2 (individuals I-L). The methods used in measuring total tritium, HTO and OBTconcentration in the bioassay samples are described. The measurement results of the tritiumanalysis in bioassay samples are reported. The kinetics of tritium turnover in the body hasbeen analyzed from the measured tritium-in-urine concentrations.
The report has examined the current knowledge of HTO dosimetry, and has evaluated theuncertainties that pertain to the dose contribution from metabolised OBT. A mathematicalmodel is proposed to estimate the dose increase from the OBT iri the body by examining thekinetics of total tritium excretion in urine (Galeriu and Trivedi, 1994). The model accounts forthe variable rates of fluid intake by the workers over the period of study. The influence ofmeasurement errors and a limited duration of the study (up to 300 d post-exposure) on theOBT dose assessment are assessed. We also assessed the influence on the OBT dosefraction when assuming constant or variable rates of fluid intake. An attempt has been madeto examine what fraction of ingested HTO incorporates or metabolizes into OBT. The dosecontribution from OBT in terms of dosimetry is judged and recommended for estimating thedose following an HTO intake.
2. METHODS
2.1 Case History
2.1.1 Mode of HTO Contamination
Eight male workers (A-H) had a high intake of HTO after they drank from an orange juicedispenser that was later found to be contaminated with tritiated heavy water (approximately 20GBq«L'1)3. On learning of the possible exposure through tritium measurement in urine, the
Although the first urine samples were collected within 4 h of exposure, these samples were notanalyzed until the next day. The measurement of a high-activity concentration of tritium in urine(10s Bq«L"1) resulted in suspecting an acute intake of HTO (Nason, C, personal communication,New Brunswick Power Corporation, Point Lepreau Generating Station, New Brunswick, Canada).
The control group workers were from the same nuclear generating station and had a similar historyof employment. They were actively involved in the regular duty of operation and maintenance inthe workplace, where they might have been exposed to a working level of tritium.
John Paciga, Health Physicist, NB Power, Point Lepreau, New Brunswick, Canada.
workers were removed from their regular jobs. All workers, except individual A, showed acontinuous decline of tritium concentration in urine during a 300 d post-exposure monitoringperiod. For individual A, the urine sample collected 231 d after the intake showed that thetritium-in-urine had increased from the previous sample taken at 157 d post-exposure. Thebioassay laboratory at Point Lepreau reported that individual A had resumed normal duties ataround 190 days after the initial intake, and that there was the possibility of further intakes ofHTO. Note that prior to the unplanned incident, the eight workers were monitored regularlythrough tritium-in-urine measurements at occupational levels of HTO exposures.
The measurement of total tritium-in-urine was conducted in two phases. The routine analysisof total tritium-in-urine from small volume samples was carried out for the duration of the studyperiod (up to 300 d post-exposure) by the established protocols of the bioassay laboratory atPoint Lepreau (O'Donnell, 1991; Paciga and Skinner, 1991). These measurements are usedin this report to analyze the kinetics of tritium-in-urine for the exposed workers (A-H).
Cumulative 24 h urine and fecal samples, and 25 mL whole blood samples, were collected atregular periods from about 100 d to 300 d post-exposure from the exposed workers,- andduring the same period from the control group workers at Point Lepreau. These sampleswere analyzed for HTO and OBT at Chalk River. A few small-volume urine samples fromindividuals D and G were obtained up to 100 d post-exposure and also analyzed for HTO andOBT at Chalk River (see section 2.3.1).
2.1.2 Physiological Parameters of Exposed Workers (A-H)
Table I shows the physiological parameters of the exposed workers. The weight, height andage of these workers ranged between 59 and 109 kg, 160 and 183 cm and 28 and 57 years,respectively. No diuretic or medication was prescribed to any of these exposed individualsafter the incident. No metabolic disorder was known for any of the individuals affected.These individuals were asked to increase their liquid intakes (e.g., water, fruit juices, beer)during the first month after exposure of the incident in order to enhance the turnover rate ofthe body water. The recorded amount of fluid intakes for 30 d (between 1990 February 27and 1990 March 28) after the incident is shown in Table I. The ratio of the fluid intake of theexposed workers to the fluid intake of Reference Man,4 adjusted for the body mass of theexposed workers,5 was calculated (Table I). This ratio showed that the exposed individualshad higher fluid intakes (1.3 to 2.0) than Reference Man, except for individuals A (1.0) and F(0.9).
4 The daily fluid intake for Reference Man is 1.95 L (ICRP, 1975; Geigy Scientific Tables, 1981).
5 The daily volume of urine for Reference Man is 1.4 L (ICRP, 1975; Geigy Scientific Tables, 1981).The expected daily volume of urine was assumed to be 1.4 L modified by the ratio of theindividual's weight to the weight of Reference Man (70 kg).
The average ratio of the daily volume of urine (from 100 d to 300 d after HTO intake) to theexpected daily volume of urine in the exposed individuals (by scaling Reference Man data6)was close to unity (0.93 ± 0.14). The similarity between the daily amount of excreted urine inthe exposed workers in the later phase of the study and the controlled group workers as wellas Reference Man data (mean and range) are consistent with the claim that increased fluidintake was curtailed around 30-40 d post-exposure.
2.3 Sample Collection and Storage
2.3.1 Urine
The urine samples, both routine and cumulative 24 h samples, were collected in clean sterilecontainers. No preservative was added to the urine. In some cases, urine samples werecollected within a few hours of the exposure from the exposed workers (see footnote #3). Theroutine bioassay samples were collected at least daily up to 50 d from the estimated time ofHTO intake. The collection intervals then increased to a period of normal tritium monitoring inurine (at least bimonthly) up to 300 d post-exposure. The exposed workers were requested tosubmit cumulative 24 h urine samples from about 100 d post-exposure onwards. The 24 hurine samples were submitted on a monthly basis up to 300 d post-exposure. Cumulative 24h urine samples were collected from the four control group workers with the same frequencyand duration as the exposed workers. The urine samples were stored frozen to minimizemicrobial action, which could affect the ratio of tritiated species (HTO and OBT) in thesamples. The small urine samples were analyzed within a day from collection, whilecumulative 24 h urine samples were processed for total tritium, HTO and OBT analysis withina month from the day of collection.
2.3.2 Feces
The cumulative 24 h fecal samples from the exposed and control group workers werecollected in clean plastic containers. The mass of the collected feces varied (30-350 gsample) among individuals. The samples were collected every second month in the interval100-300 d post-exposure. No preservative was added to the feces. The samples were storedfrozen to minimize microbial action to change the ratio of HTO and OBT in the samples. Thefeces samples were analyzed within a month from the day of collection.
2.3.3 Whole Blood
Whole blood samples were collected from the exposed, and control group of workers, in theinterval between 100-300 d post-exposure. About 25 mL of blood was obtained from eachindividual, preferably on the day a cumulative 24 h urine sample was collected. Each bloodsample was collected in a Vacutainer™ brand blood-collection tube7 with anti-coagulant.
The daily volume of fluid intake of the exposed workers was adjusted for the body mass of theindividual by a modifying factor equal to the ratio of the individual's weight to the weight ofReference Man (70 kg).
Becton Dickinson Canada Inc., 2464 S Sheridan Way, Mississauga, Ontario, L5J 2M8.
Blood samples were mixed thoroughly in the tube and refrigerated at 4°C for storage. Theanalysis of HTO and OBT was performed within a reasonable time from the day of collection.
2.4 Sample Analysis
The total tritium-in-urine was measured by the direct liquid scintillation counting method (LSC)in routine bioassay samples at Point Lepreau's bioassay laboratory (Burnham, 1992). Themeasurement data were reported by O'Donnell (1991). The total tritium-in-urine wasmeasured at Chalk River on the aliquots of the urine samples, collected as a cumulative 24 hsample using the established bioassay protocol.
The small-volume urine samples from individuals D and G were pooled only and analyzed fortotal tritium, OBT and HTO by independent methods. Those individuals were assessed ashaving the highest levels of tritium intake (~ 109 Bq). An equal volume (20 mL) of the routineurine samples was#pooled for each individual (e.g., individual D) separately in a 10 dconsecutive period, in order to attain a minimum of a 200 mL pooled-urine sample. Thatvolume limitation was made necessary by the method employed in analyzing OBT-in-urine.Aliquots of the cumulative 24 h urine and feces samples, and 25 mL blood samples, wereanalyzed at Chalk River.
Rudran's method (1988) was modified to improve the sensitivity and reliability of the OBT andHTO measurements in urine, feces and blood. Samples from individuals at Chalk River, whohad no known history of substantial exposure to tritium, were collected and used for thispurpose. The minimum amounts required for the analysis of HTO and OBT in bioassaysamples were 200 mL of urine, 15 mL of blood and 15 g of feces. The complete technicaldescriptions are discussed elsewhere (Trivedi et al., 1993; Duong et al., 1994). However, abrief description of the bioassay methods is described in the sections below. Samples firstunderwent low-temperature distillation and vacuum separation to separate HTO. The sampleswere repeatedly washed with tritium-free water to remove exchangeable tritium. The OBTwas then converted to HTO through oxygen combustion. The separated fractions weremeasured independently.
2.4.1 Removal and Measurement of HTO and Exchangeable Tritium
HTO in urine, feces and blood samples was determined from the distillate following low-temperature vacuum evaporation at 30° to 40° C using a rotary flash evaporator.8 Distillationat low temperature was required to avoid decomposition of the OBT. Since someexchangeable tritium in the labile parts of organic molecules can remain in the residue, thesamples were washed repeatedly with tritium-free water until tritium activity in the réhydratewas returned to the background level. Usually, two to three sample volume washes withwater were enough to remove the labile (exchangeable) tritium from the samples. Forexample, if 200 mL of urine (108 Bq*L"1) was analyzed, then about three washes with 200 mLof tritium-free water was capable of removing labile tritium. The tritium concentration in thedistillates (initial distillate plus distillates after rehydrations) represented the concentration oftotal exchangeable tritium and HTO in the samples. The distilled samples were vacuum-dried
Model RE-111, Buchi Laboratories-Technik AG, Flawil, Switzerland.
to constant weights to remove any traces of water. The samples were assumed to becompletely dried when three consecutive weighings of the samples indicated no significantdecrease in mass.
2.4.2 Combustion and Determination of OBT
Tritium in dried samples was determined using the oxygen-combustion technique as describedby Rudran (1988). Dried samples (maximum 1 g) were compressed into a pellet and placedin the crucible of a small oxygen bomb.9 The pellet was ignited electrically in the airtightbomb at 30 atmospheres of O2. The bomb was cooled during the firing by placing it in an ice-water container. The water of combustion condensed on the inside of the bomb. After cooling•for 10 min, the water was collected in a liquid nitrogen cold-trap by connecting the bomb to avacuum pump. The tritium in the condensate was the measured OBT activity in the sample.The organic fraction of the dry residues of urine, blood and fecal samples were determined byestimating the loss in the weight of the sample after ashing in a muffle furnace at 450° C asdescribed by Rudran (1988).
2.5 Activity Measurement
The tritium concentration in the water extracted either by distillation or combustion wasmeasured in a liquid scintillation counter.10 The room temperature and humidity in thecounting room was controlled. The processed water samples were counted with differentliquid scintillation cocktails to keep the self-absorption effects (quench) to a minimum. Forexample, an aliquot (0.5 mL) of the distilled water samples (HTO + exchangeable tritium) wasmixed with 4.5 mL of Ecoscint11 scintillation cocktail. The sample water from the combustionprocedure for OBT was mixed with Universal12 cocktail. The scintillation vial was allowed tosit in the dark for at least 4 h prior to counting, in order to decrease chemiluminescence.
The samples were counted long enough to give counting errors of 5% or less. The countswere corrected for quench and recovery. The counting efficiencies of the scintillation cocktailand the scintillation counter were assessed for varying colour quench levels in prepared tritiumstandards. The total error of radioactivity measurements was estimated to be about 10% forthe 1 kBq activity samples and < 10% for the higher activity samples. The errors on volumemeasurements were negligible compared to counting and quench correction errors, asdiscussed elsewhere (Trivedi and Duong, 1993). The minimal detectable activityconcentration for tritium-in-urine or in distillate (as HTO ) was about 200 Bq«L*1 when 0.5 mLof samples were counted with 4.5 mL of scintillation cocktail for 2 min (Trivedi and Duong,1993). The detection limit for OBT in urine, feces and blood was. calculated as describedelsewhere (Trivedi et al., 1993 ; Duong et al., 1994). The detection limit for OBT in urine was
9 Model 1108, Parr Instrument Company, Moline, Illinois, USA.
10 Model 7000 LS, Beckman, Mississauga, Ontario, Canada.
11 National Diagnostics, 1013-1017 Kennedy Blvd., Manville, New Jersey 08835, USA.
12 ICN Biomédical, USA.
20 Bq«L'1 as the weight of dried residue from 100 mL of urine was ~ 2 g. The detection limit forOBT in blood was 30 Bq«L'1 as the weight of dried residue from 15 mL of blood was ~ 4 g. Thedetection limit for OBT in feces was 0.2 Bq«g'1 of wet feces where the weight of dried residuefrom 15 g of faecal sample was ~ 5 g.
The spiked samples were repeatedly analyzed to check the reliability and accuracy of thetritium analysis procedure. The mean recovery of HTO from all spiked matrices was 98 ± 1%.The total recovery of a known amount of OBT (tritiated thymidine13) from a suitable matrix (aspiked bioassay sample) after being washed, lyophilized and then combusted was 74 ± 2% forurine, 83 ± 6% for feces and 84 ± 3% for blood. The reproducibility of HTO and OBTmeasurements for one urine sample is shown in Table II. Four independent tritiummeasurements were performed on a single urine sample. The repeated analysis of the urinesample showed a satisfactory reproducibility, with a standard deviation of 4% and 20% for theHTO and OBT measurements. The sum of the HTO and OBT concentration in the urinesample was in good agreement with the directly measured concentration of the total tritium-in-urine (± 2%).
2.6 Data Analysis
The variation in the activity concentrations of tritium in the biological samples was analyzedusing the standard statistical code in the Excel14 software program on a Macintosh15 personalcomputer. The non-linear regression analysis of the data on total tritium, HTO and OBTexcretion in urine was performed using the KaleidaGraph16 software program on a Macintoshpersonal computer. Data were analyzed with different models including two, three or fourexponential components. Goodness of fit was assessed by the value of minimized y}, whichwas calculated using the standard deviation of the tritium measurements. Data points wereinternally weighted by the square of the inverse of the uncertainty. Statistical evaluation andcomparison between results obtained with different decay models employing different numbersof fitting parameters were carried out using F-statistical analysis (Douglas and Davies, 1992).
The independent variable, time post-exposure in days, was the period in which the sampleswere collected or pooled after the intake of HTO. The actual dates for routine urine sampleswere used in the analysis of the total tritium-in-urine data. The average dates for the routineurine samples pooled at specific time intervals, and the actual dates for cumulative 24 h urinesamples (i.e, samples submitted about 100-300 d after the HTO intake), were used in theanalysis of HTO and OBT excretion in urine.
13 Amersham Canada Ltd., Oakville, Ontario, Canada.
14 Microsoft Corporation, Seattle, USA.
15 Apple Computer Inc., Cupertino, California, USA.
16 Synergy Software, Reading, PA, USA.
8
3.0 INTERPRETATION OF BIOASSAY MEASUREMENTS
3.1 Tritium-in-Urine
3.1.1 Total tritium-in-urine for the exposed workers
The activity concentrations of the total tritium-in-urine of the exposed workers were measuredat the bioassay laboratory at Point Lepreau, and the results utilized in the kinetic analysis aredescribed in this section. None of the tritium-in-urine measurement data from Chalk River wasused in analyzing the urinary excretion pattern of total tritium. This step was taken tominimize the effect of systematic differences between the two sets of measurement data,since minor bias at long times after exposure between the Chalk River and the Point Lepreaudata was seen. The activity concentrations used in plotting the excretion patterns for exposedindividuals (A-H) are listed in Appendix A.1, Tables 1-8. Urinary excretion of total tritium areillustrated in Appendix A.2, Figures 1-8.
The measurement results for exposed individuals were obtained up to 300 d post-exposure.Individual A had useful urine data only up to 186 d post-exposure (see section 2.1). Themaximum monitored concentration of tritium-in-urine was about 108 Bq*L'1 at 24 h post-exposure. The activity concentration declined with time and fell to about 103 Bq«L'1 at 300 dpost-exposure. The calculated standard deviation on each measured data point was between2% and 3% for 0.5 mL samples of urine (O'Donnell, 1991).
The total tritium-in-urine data were analyzed by various non-linear regressional fits in anattempt to understand the kinetics of tritium retention and excretion. In section 3.1.1.1, a sumof exponential functions, Equation (1), was performed over the period for which data wascollected (up to 300 d post-exposure). However, the later analysis, in section 3.1.1.2, takesaccount of the observation that the rates of fluid intake were elevated in the initial period afterexposure (ending from 30 to 35 d post-exposure, depending on the individual), but thendeclined to normal intake rates over the remaining period of the study.
3.1.1.1 Kinetics of tritium-in-urine with constant rate of fluid intake
The non-linear regression analysis of the measurement data for each individual affected (A-H)showed a multiphasic excretion of tritium-in-urine:
f(t) = L a, exp (-Alt) Equation (1)
where a, and Xt are the ith fractional compartment and rate constant, respectively.
The data analysis demonstrated that the fitting parameters and chi-square values using thesum of three exponentials agreed with the earlier reported results (O'Donnell, 1991). We alsochecked the fit for tritium-in-urine with the sum of two exponentials and four exponential decayconstants (data not shown). An examination of the residual plots has shown a reasonabledegree of consistency and randomness for a sum of three exponential functions (AppendixA.2, Figures 1-8) and randomness.
The chi-square statistical test for the suitability of fitting functions was performed. Thenormalised chi-square value per degree of freedom for the ideal fit will be one. The number ofdata points of total tritium-in-urine versus time post-exposure ranged from 38 to 73 for eightexposed workers (Appendix A.3, Table 9). The chi-square values per degree of freedom for athree exponential function fit for individuals A-H ranged from 4 to 13.
The difference between the observed and fitted values was sometimes larger than the statederror on a measurement that was estimated to be ± 2.6% (Douglas and Davies, 1992). Asystematic correlation between the residual errors and time since exposure is shown in theresidual plots of a few exposed workers (Appendix A.2, Figures 1-8). The higher-than-expected chi-square values and the residual plots for exposed workers indicated possibleextra factors that need to be considered in the fitting procedure. These factors may includethe existence of unaccounted for errors in measurements, variable rates of fluid intake, ormetabolic fluctuation among the individuals.
The chi-square values per degree of freedom on a two exponent fit were large compared tothe corresponding three exponent fits (e.g., Individual A: 20.2 versus 4.6). Also, the caseswith two decaying exponentials gave residual plots with non-random scatter (see O'Donnoll,1991), while the cases with four decaying exponentials had parameters in the kinetic termsthat were too strongly correlated (data not shown). At this point in the data analysis, based onthe non-linear regression and statistical analysis, a sum of three exponential functions wasconsidered to be a suitable choice for fits with this type of functional dependence. Twoindividuals, E and F, had small negative exponents with corresponding small coefficients(Appendix A.3, Table 9). In our analysis, trie standard deviations of the components for thesetwo individuals showed that the third exponents were not significantly different from zero.
The sum of three exponential fits to the urinary excretion data for the eight exposed workers issummarized in Table III. The average biological half-life for the first component had a value of5.2 ± 1.1 d. The average biological half-life for the second component was 11.9 ± 5.3 d. Thethird component showed a biological half-life between 50 and 80 d except for the individual Bwith a biological half-life of 133 d. The average biological half-life for the third component was76 ± 27 d. The average fractional value for the first exponential component was 0.76 ± 0.23(range, 0.35-1.0). Similarly, the second and third fractional exponential components hadvalues of 0.24 ± 0.23 (range, 0.02-0.65) and 0.004 ± 0.002 (range, 0.003-0.007), respectively.
Three studies are reported in the literature where tritium clearance in urine was representedby a sum of three exponential components (Sanders and Reining, 1968; Moghissi et al., 1972;Bennet, 1972). There are noticeable differences between the values of our observedclearance kinetics and those of other studies. The range of the reported biological half-livesfor the first, second and third component is 6.1-9.1 d, 23-30 d and 344-550 d, respectively.The component fractions for a three exponential fit were reported for one study (Sanders andReinig, 1968), and were 9.97 x 10'1 for the first component, 2.78 x 10'3 for the second and4.57 x 10-5 for the third.
The mean body water turnover half-time for workers exposed to tritium in a Savannah Riverstudy was 9.4 ± 2.5 (Butler and Leroy, 1965); for Reference Man it is 10 d (ICRP publication#30, 1979-1982). We believe that the clearance half-lives of the first (5.2 ±1.1 d) and second(11.9 ± 5.3 d) exponential components are due to the body water turnover, since our method
10
of data analysis does not account for variability in fluid intakes. The third component, with anaverage half-life of 76 ± 27 d, may be interpreted as representing, the slow catabolism of OBTin the body. However, under the limited duration of the study (0-300 d post-exposure), theanalysis of the data did not show a very long-term excretion of tritium-in-urine—ranging from139 d to 2020 d—as reported by Sanders and Reinig (1968), Minder (1969), Moghissi andCarter (1971), Moghissi et al. (1972) and Bennet (1972).
3.1.1.2 Kinetics of tritium-in-urine with variable rates of fluid intake
The non-linear regression of tritium-in-urine in the previous section assumed a constant rate offluid intake. Employing this form of analysis, the clearance kinetic parameters of tritium-in-urine are different from the reported results of similar types of HTO exposure. We attributethis discrepancy to the fact that no account was taken of variable rates of fluid intake for theanalysis of the tritium-in-urine data. Since the fluid intake rates can influence the urinaryexcretion function, it was considered that the fitting function should directly reflect this changein body water turnover. A kinetic theory of tritium retention and clearance was developed, toaccount for a hypothetical change in the rates of fluid intake and urine excretion of theexposed workers at a particular time after exposure.
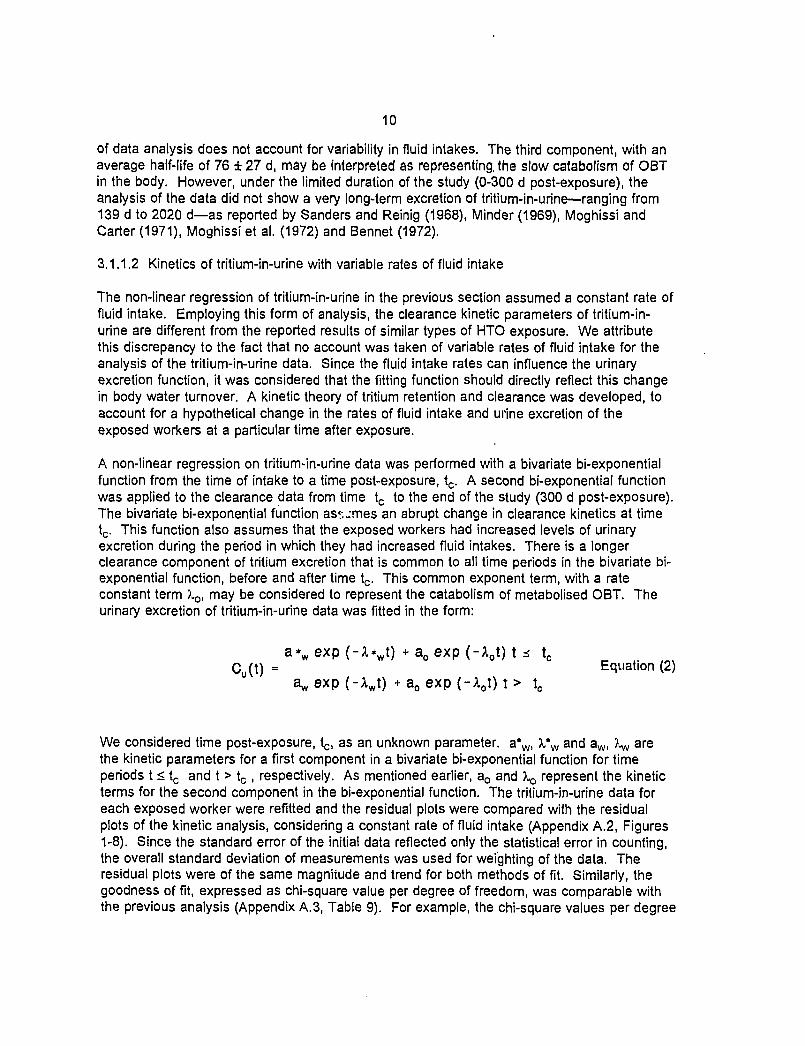
A non-linear regression on tritium-in-urine data was performed with a bivariate bi-exponentialfunction from the time of intake to a time post-exposure, tc. A second bi-exponential functionwas applied to the clearance data from time tc to the end of the study (300 d post-exposure).The bivariate bi-exponential function assumes an abrupt change in clearance kinetics at timetc. This function also assumes that the exposed workers had increased levels of urinaryexcretion during the period in which they had increased fluid intakes. There is a longerclearance component of tritium excretion that is common to all time periods in the bivariate bi-exponential function, before and after time tc. This common exponent term, with a rateconstant term ).o, may be considered to represent the catabolism of metabolised OBT. Theurinary excretion of tritium-in-urine data was fitted in the form:
a * w e x p ( - A * w t ) + a0 exp (-Ao t ) t * tcCu(t) = Equation (2)
^ x p f - V ) + a o e x p ( - V ) t > to
We considered time post-exposure, tc, as an unknown parameter. a*w, X*w and aw, X^ arethe kinetic parameters for a first component in a bivariate bi-exponential function for timeperiods t < tc and t > tc , respectively. As mentioned earlier, a0 and XQ represent the kineticterms for the second component in the bi-exponential function. The tritium-in-urine data foreach exposed worker were refitted and the residual plots were compared with the residualplots of the kinetic analysis, considering a constant rate of fluid intake (Appendix A.2, Figures1-8). Since the standard error of the initial data reflected only the statistical error in counting,the overall standard deviation of measurements was used for weighting of the data. Theresidual plots were of the same magnitude and trend for both methods of fit. Similarly, thegoodness of fit, expressed as chi-square value per degree of freedom, was comparable withthe previous analysis (Appendix A.3, Table 9). For example, the chi-square values per degree
11
of freedom for individual A were 4.6 and 3.8 for constant and variable rates of fluid intake,respectively.
The bivariate bi-exponential function is considered to be an adequate representation of theclearance kinetics of tritium-in-urine in our subjects. The usefulness of the fitting functionchosen was seen from the goodness of fit sensitivity to the day, tc , of change in the fluidintake rate. For example, Appendix A.4, Figure 9 illustrates the sensitivity fit for individual G,considering a change in the rate of fluid intake and excretion that occurred between 0 and 50d post-exposure. A minimum value in the chi-square was seen near 32 d post-exposure,indicating that the fit was maximised when tc was equal to 32 d (Appendix A.4, Figure 9).This change in the goodness of fit suggests that individual G had changed drinking habitsaround 32 d post-exposure. The analysis of goodness of fit for all exposed workers indicatedthat the change of drinking habit was between 22 and 40 d post-exposure (data not shown).We do not have definite experimental evidence for this theoretically evaluated time of changein the fluid intake rate. However, high rates of fluid intakes, compared with Reference Man,were observed for seven of the eight exposed workers who recorded their cumulative fluidintakes between 5 and 35 d post-exposure (Table I). A relatively normal rate of urineexcretion as compared to Reference Man was recorded in all eight exposed workers from 100d to 300 d post-exposure. The similarity between the daily amount of excreted urine in theexposed workers in the later phase of the study and the controlled group workers as well asReference Man data are consistent with the claim that increased fluid intake was stoppedaround 30-40 d post-exposure.
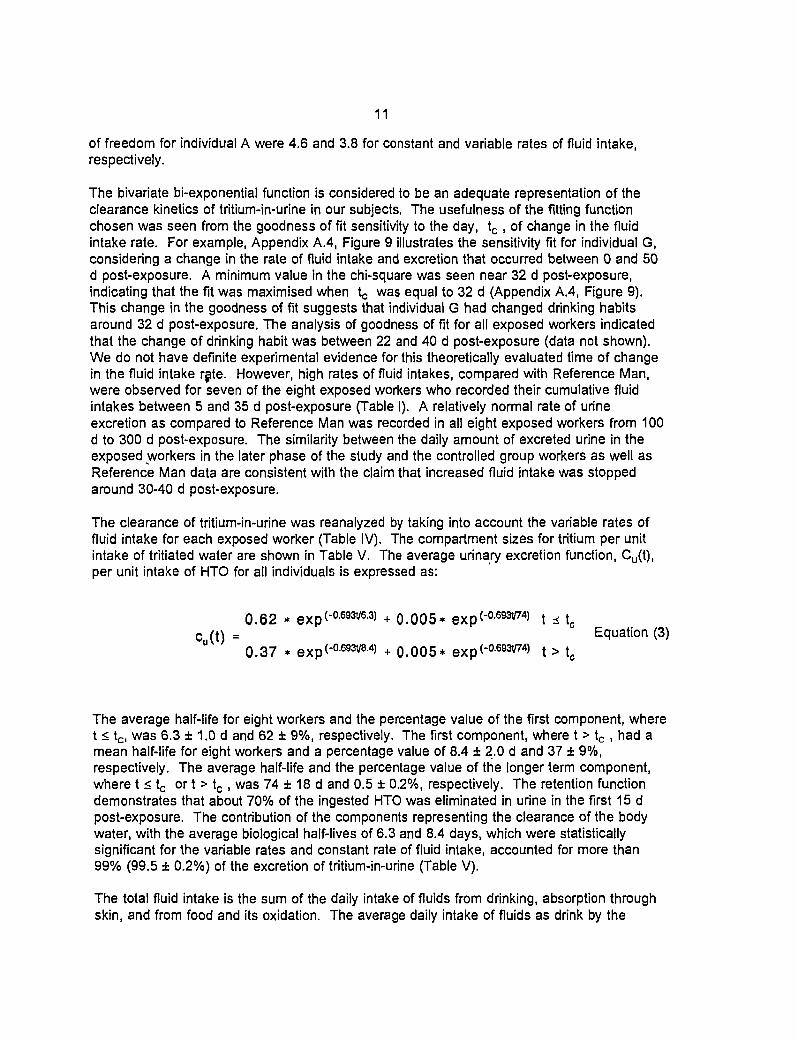
The clearance of tritium-in-urine was reanalyzed by taking into account the variable rates offluid intake for each exposed worker (Table IV). The compartment sizes for tritium per unitintake of tritiated water are shown in Table V. The average urinary excretion function, C^t),per unit intake of HTO for all individuals is expressed as:
0.62 * exp("°-693t/6-3) + 0 .005* exp ( -a693V74) t * tc
Cu(t) = Equation (3)0.37 * exp(-°-693V8-4' + 0 .005* exp<-°-69W74) t > tc
The average half-life for eight workers and the percentage value of the first component, wheret < tc, was 6.3 ± 1.0 d and 62 ± 9%, respectively. The first component, where t > tc , had amean half-life for eight workers and a percentage value of 8.4 ± 2.0 d and 37 ± 9%,respectively. The average half-life and the percentage value of trie longer term component,where t < tc or t > tc , was 74 ± 18 d and 0.5 ± 0.2%, respectively. The retention functiondemonstrates that about 70% of the ingested HTO was eliminated in urine in the first 15 dpost-exposure. The contribution of the components representing the clearance of the bodywater, with the average biological half-lives of 6.3 and 8.4 days, which were statisticallysignificant for the variable rates and constant rate of fluid intake, accounted for more than99% (99.5 ± 0.2%) of the excretion of tritium-in-urine (Table V).
The total fluid intake is the sum of the daily intake of fluids from drinking, absorption throughskin, and from food and its oxidation. The average daily intake of fluids as drink by the
12
exposed workers was measured (by seven of eight exposed workers) as 3.2 ± 1.1 L»d'1 over30 days, soon after exposure. The first component of the tritium-in-urine kinetics, relating tothe initial phase of the study (t < tc), corresponds to a total daily fluid intake of 4.7 ± 0.7 L»d'1
if we assume a total body water mass of 42 kg corresponding to Reference Man. Theaverage totai body water mass of the eight male workers was estimated as 43.7 ± 4.2 kgwhen allowing for gender, age and body mass (Moore et al., 1963).
With this appropriate value of body water, the daily total fluid intake is about 5 ± 1 L»d'\From this, the recorded direct fluid intake from food is 63% of total fluid intake, which is closeto Reference Man value of 65%. Using the appropriate estimate of body water and the fittedvalue of 7^ for late period (t > tc), a daily total fluid intake of 3.8 ± 0.7 L«d'1 is obtained.Although the value for total fluid intake is higher than the Reference Man value (3 L»d'1), theestimated value is in the range of normal physiological variations of individuals in a temperateclimate.
The average half-life of the first component (8.4 ± 2.0 d) for eight workers, where t > tc , forthe period of normal water intake is comparable to the mean value of 9.4 ± 2,5 as reported byButler and Leroy (1965) and Osborne (1966). The average half-life for the longer-termcomponent (74 ± 18 d) is similar to the estimated value (76 ± 27 d) from the fitting functionunder continuous fluid intake assumption. This may imply that the longer-term component oftritium-in-urine is solely influenced by metabolised OBT in the body.
3.1.2 HTO-in-urine and OBT-in-urine of the Exposed and Control Group Workers
The HTO and OBT concentrations were analyzed in a limited number of 24 h urine samplescollected from the exposed workers (A-H) beyond 100 d post-exposure. The urine samplesfrom the control group of workers (I-L) were also analyzed during'this collection period. Thedirect total tritium-in-urine was also measured in these urine samples, to verify that the totalinventory of tritium is the sum of HTO-in-urine and OBT-in-urine. The bioassay data showedthat the activity concentrations of total tritium-in-urine were comparable to the sum of HTOand OBT concentrations in urine when measurement errors (Section 2.5) were taken intoaccount. The results of the tritium analysis of urine samples are listed in Appendix B, Tables1-12.
The activity concentration of HTO (< 105 Bq«L'1) was always higher than the concentration ofOBT (< 103 Bq«L'1) in urine samples from the exposed workers from 100 d to 300 d post-exposure. The ratio of OBT to HTO in urine had a mean value of 0.07 ± 0.05, based on theaverage OBT/HTO ratios for the eight exposed workers. There was a wide distribution of theOBT to HTO ratio (between 0.03 and 0.18) among the exposed workers. Highest averagevalues of the OBT to HTO ratio were observed for individual C (0.18 ± 0.08) and individual E(0.14 ± 0.06), while other six exposed workers had less than 0.1. The variability in the ratioprobably reflects differences in individual metabolism. However, due to insufficient population(number of workers = 8) and limited results available in this study, we cannot investigate thisaspect further. No noticeable trend was seen in the ratios of OBT to HTO with time, between100 d to 300 d post-exposure.
The urine samples analyzed beyond 231 d post-exposure from individual A (Appendix B,Table 1) may indicate that the unexpected elevated levels of HTO-in-urine were influenced by
13
additional intakes of tritium. The bioassay laboratory at Point Lepreau reported that individualA had resumed normal duties at around 190 d after the initial intake, and that there was thepossibility of further intakes of HTO. Notably, no detectable increase in OBT-in-urine wasmeasured in samples collected beyond 231 d post-exposure for individual A. Theindependent monitoring of HTO and OBT in urine may therefore provide useful information onthe chemical forms of possible tritium intakes.
The measurement of tritium-in-urine samples from the control group workers (I-L), not involvedin the regular duty of operation and maintenance of reactor at Point Lepreau, was below thelevel of detection (< 103 Bq»L"1) (Appendix B, Tables 9-12 ). However, when tritium wasmeasured above the limit of detection (200 Bq»L'1) in the urine samples of the control group,the ratios of OBT to HTO were always less than 0.06.
Individuals D and G had the highest intake of HTO. As discussed in section 2.3.1, theirroutine small volume urine samples were pooled at specific time intervals. The activityconcentration of HTO and OBT in pooled urine samples (2-100 d'post-exposure) andcumulative 24 h urine samples (between 100 d and 300 d post-exposure) are listed inAppendix C.1, Tables 1 and 2. The HTO in the pooled urine samples of individuals D and Gwas about 108 Bq«L"1 at 2.5 d post-exposure. The activity concentration of OBT-in-urine wasabout 105 Bq«L'1 at 2.5 d post-exposure. The early presence of OBT-in-urine may indicatethat a portion of tritium from the ingested HTO is rapidly fixed into organic constituents of thebody. The ratio of OBT to HTO in the pooled and cumulative 24 h urine samples increasedfrom 0.001 at 2.5 d post-exposure to a maximum value of 0.09 at 100 d post-exposure forindividuals D and G. After 100 d post-exposure, no noticeable trend in the OBT/HTO ratioswas observed. The initial increase in the OBT to HTO ratios was mainly due to the rapidclearance of HTO-in-urine, as the OBT-in-urine concentrations were relatively stable duringthis period.
3.1.3 Kinetics of HTO-in-urine and OBT-in-urine of the Exposed Workers
The HTO and OBT measurements from the pooled and cumulative 24 h urine samples ofindividuals D and G were used to determine the kinetic parameters of those two tritiatedspecies. The urinary excretion of HTO-in-urine and OBT-in-urine for both individuals is shownin Appendix C.2, Figures 1 and 2.
Similar to the total tritium-in-urine kinetics, a non-linear regression fit of the HTO excretiondata showed that a sum of three exponential decay terms was sufficient to express the urinaryexcretions of HTO. No further fitting analysis was performed. Specifically, no attempt wasmade to fit a bivariate bi-exponential function as performed for the total tritium-in-urine data.Kinetic analysis for HTO-in-urine was not pursued further because the limitations in using thedata on the pooled samples collected at early times post-exposure.
At this point, we compare the urinary excretion of HTO-in-urine to total tritium-in-urine basedon their sum of three exponential fits. The kinetics of the HTO-in-urine showed that theaverage biological half-lives for the three exponential components are 5.9 ± 0.2 d, 14.5 ± 1.8 dand 63 ± 1.0 d, respectively (Table VI). It is evident from this kinetic data that the HTO-in-urine clearance is similar to that of total tritium-in-urine (Section 3.1.1.1). This is notsurprising, since measurements of tritium-in-urine showed that the HTO was the dominant
14
form {>. 99% of total activity concentration) of tritium excreted in all post-exposureexaminations.
The non-linear regression analysis of OBT-in-urine showed that a sum of two exponentialfunctions was satisfactory for representing OBT kinetics in urine. Table VI shows the kineticparameters of OBT-in-urine for individuals D and G. The addition of a third component to theregression yielded higher chi-square values (data not shown), representing a poorer fit to thedata. The elimination of OBT-in-urine for the two individuals has a biological half-life for thefirst component of 4 to 5 d and a second component of 63 to 69 d. The half-life for the thirdcomponent of HTO (64 d) is comparable with the half-life for the second component of OBT(69 d) for individual D, and similarly for individual G. The close relationship between the
• longer-term excretion of HTO-in-urine and OBT-in-urine may indicate that most of the HTOproduced in the longer-term component is a product of metabolised OBT. However, thepresence of OBT-in-urine indicates that not all of the metabolically fixed OBT is catabolized toHTO during the period of study (up to 300 d post-exposure).
3.2 Tritium in Whole Blood
Blood samples were collected from both the exposed (A-H) and control (I-L) group workersbetween 100 d and 300 d post-exposure. The number of blood samples was from two to fourfor all workers studied. The measurement data on tritium-in-blood is insufficient for kineticanalysis; however, it has provided an insight on the tritium level in the metabolic pool of thebody. The measured HTO (Bq«L"1) and OBT (Bq»L1) in whole blood are listed in Appendix B,Tables 1-12. No direct measurement of total tritium-in-blood was performed.
The HTO level in the blood of the exposed workers rapidly declined with time, while the OBTin their blood decreased gradually. The activity concentration ratio of OBT to HTO in theblood samples of the exposed individuals ranged between 0.5 and 8.6. There was a commontrend in the OBT/HTO ratio with time since exposure. For example, individual B had a highOBT/HTO ratio of 8.6 at 104 d post-exposure; however, the ratio declined to 1.1 at 301 dpost-exposure. The range of OBT to HTO ratios in blood samples (0.5-8.5) was higher thanthe OBT/HTO ratios in urine (0.03-0.18). The ratio of OBT-in-blood to OBT-in-urine variedwidely (range, 10 - 225), while the ratio of HTO-in-blood to HTO-in-urine was close to unity(0.9 to 1.1) for the exposed workers.
The HTO and OBT in blood from the control group individuals was measured whenever therespective cumulative 24 h urine samples had a detectable amount of tritium (Appendix B,Tables 9-12). Similar to exposed individuals, the range of the ratio of OBT to HTO in bloodwas higher (0.12-0.49) than the corresponding ratios of OBT to HTO in urine (0.013-0.064).The ratio of OBT-in-blood to OBT-in-urine varied widely (ranged between 5 and 50), while theratio of HTO-in-blood to HTO-in-urine was close to unity.
The activity concentration of total tritium (sum of OBT and HTO) in whole blood samples fromthe exposed workers was higher (2 -10 times) than in urine from 100-300 d post-exposure.The higher concentration of total tritium-in-blood is attributed to the higher concentration ofhydrogen per g of organic matter. No trend in the ratio of total tritium-in-blood to total tritium-in-urine with time post-exposure was observable. The variable ratio of total tritium-in-blood
15
and total tritium-in-urine was related to the level of OBT-in-blood and OBT-in-urine, since HTOconcentrations in the blood were comparable with HTO-in-urine.
The analysis of the whole blood has indicated that the HTO-in-blood was in equilibrium withthe HTO-in-urine for both the exposed and control group workers: However, no relationshipbetween tritium-in-blood and tritium-in-urine was established for 100-300 d post-exposure, dueto a large variability in the ratio of OBT-in-blood to OBT-in-urine. The reason for a wide rangeof distribution in the ratio of OBT concentration in blood and urine is unknown, and may beattributed to physiological varhbility among the individuals. The data are insufficient forexamining the relationship between tritium-in-urine and tritium-in-blood, especially the OBTcomponents. However, the blood and urine sampling has shown that the activityconcentration of the HTO-in-blood and HTO-in-urine are in equilibrium and are representativeof HTO in the body water. The tritium monitoring in blood offers no advantage over urine ifthe dose to the body water is dominant for dosimetry purposes.
3.3 Tritium in Feces
The number of fecal samples analyzed for each individual ranged from zero to 4 for allworkers studied. The measurement data on tritium-in-feces is insufficient for kinetic analysis.The measured activity concentrations of tritium (Bq*L'1) in the distillate and the combustedwater from the dry residue of fecal samples were converted to the appropriate unit (Bq«g"1 wetfeces) for HTO and OBT measurements in feces. The results of activity concentrationmeasurements for samples, collected between 100 d and 300 d post-exposure, from theexposed group (A-H) are listed in Appendix B, Tables 1-8. Feces samples were collected inthe same time period from the control group (I-L), and the measurements are listed inAppendix B, Tables 9-12. No direct measurement of the total tritium-in-feces was performed.
There was a wide variation of tritium activity concentrations (sum of HTO and OBT) in thesamples analyzed. For example, the concentration of total tritium in feces at 109 d post-exposure was 38-fold higher in individual A than individual C. The variability of theconcentration of total tritium in feces among the exposed workers is attributed to the dietaryhabit of individuals. The dilution of tritium-in-the gastero-intestinal tract of the body by thevarying daily food could influence total tritium concentration in feces. In general, the tritium-in-feces declined with time after exposure.
The predominant tritiated species in feces from the exposed workers throughout the studyperiod was HTO, and it varied between 73% and 94% of the total tritium. The remainderactivity concentration in feces was measured as OBT. The ratio of OBT (Bq«g'1 wet feces) toHTO (Bq«g"1wet feces) in feces ranged between 0.06 to 0.55 from 100 d to 300 d post-exposure, with no trend with time observable.
The activity concentration of HTO and OBT in feces from the control group workers was belowthe limit of detection for all but one sample (Appendix B, Tables 9-12). In that one sample,92% of the total tritium was measured as HTO (Appendix B, Tables 12).
When the measured activity concentration of tritium (Bq«L1) in the distillate (i.e., HTO-in-feces)was compared with HTO-in-urine (Bq*L1), between 100 d and 300 d post-exposure, theactivity concentration ratio of HTO-in-feces and HTO-in-urine for the exposed workers were
16
close to unity (1.1 ± 0.4). This analysis of the data has indicated that the HTO activityconcentration excreted in urine and feces was in equilibrium with the body water.
It is not feasible to compare the measured activity concentration of OBT-in-feces (Bq^g'1 wetfeces) to OBT-in-urine (Bq«L"1), because of the difference in measurement units. A moresuitable comparison can be made by comparing the tritium activity per unit mass of organicmatter (Bq«g"1 organic matter) in feces to that of urine (see section 3.4). The ratio was closeto 1.0 ± 0.1 (range, 0.95-1.2), and indicated that a similar level of OBT is present per unitmass of excreta via the urinary and fecal pathways.
There are no reported measurements in the literature of OBT in feces and urine after an acuteHTO intake. Since we measured a detectable quantity of OBT in feces and urine, it wasnecessary to substantiate that its presence was not the result of a trace amount of OBT in thetotal tritium intake. We first investigated whether tritium was ingested in a form other thanHTO. An experiment was performed simulating the exposure conditions for the accidentalintake of HTO. An orange juice sample from a cooler at Chalk River was spiked with a highconcentration of HTO (10fl Bq«ml_'1). This simulated the exposure condition for accidentaltritium intake by the workers at Point Lepreau. The tritium analysis of the contaminated juiceindicated no detectable amount of OBT, even after incubating the orange juice for more than 3h in the presence of HTO. Furthermore, we considered the possibility that OBT-in-urine is dueto direct OBT intake from food. Using available data for food items around nuclear facilities inOntario (Brown, 1994), we assessed the body burden of OBT from dietary intake. Under theassumption that OBT-in-urine is in equilibrium with the OBT-in-the body, the daily diet'scontribution to OBT-in-urine is less than 0.5 Bq«L'1. This predicted value of OBT-in-urine is atleast 200 times less than the measured concentration of OBT-in-urine of exposed workers.Therefore, we concluded that OBT excreted in urine and feces is due to the metabolicassimilation of tritium from HTO intake in the exposed individuals, and not due to the intake oftritium partially in the form of OBT.
The concentration of HTO-in-feces and HTO-in-urine remained in equilibrium with the bodywater from 100 d to 300 d post-exposure. The presence of OBT-in-urine and OBT-in-fecessamples, obtained during the same period, indicated that a small .portion of the initiallyingested HTO was metabolized into complex organic forms and retained in the body with alonger clearance half-life than HTO. Therefore, a portion of the metabolized OBT was notcatabolized to HTO, and was directly excreted from the body.
3.4 Tritium in Organic Fraction of Urine, Blood and Feces
The previous activity concentration measurements (Sections 3.1 to 3.3) involved OBT in agiven volume (urine and blood) or weight (feces) of the whole bioassay samples. Here, themeasured activity concentration of tritium in the organic fraction (Bq« g'1 organic matter) ofurine, blood and feces of the exposed and control group workers (Appendix B, Tables 1-12)are compared.
The average ratio of OBTb,ood to OBTurjne in a unit mass of organic matter was 2.3 ± 0.5 (range,1.8-3.5 for all samples) from the exposed workers (A-H) at 100-300 d post-exposure.Similarly, the ratio of OBTb,ood to OBTfeces was 2.2 ± 0.6 (range, 1.1-2.6). However, the ratio ofOBTreces and OBTurine was 1.0 ± 0.1 (range, 0.95-1.2).
17
The control group workers (I-L) exhibited lower ratios of OBT per g organic matter (AppendixB, Tables 9-12). The ratio of OBTbl0Od to OBTurine in organic matter was 1.4 ± 0.5. Nomeasurements of tritium in a unit mass of organic matter of feces were available.
It is expected that the OBT concentration in a whole bioassay sample will be proportional tothe organic fraction of the material. For example, the mass of the organic fraction in normalblood is ~ 1.3 times higher than the mass of the organic fraction in urine.17 Furthermore, thespecific activity of tritium in the organic fraction will be dependent on the hydrogenconcentration. The hydrogen in blood is 13.5% by mass of the organic content18 and thehydrogen in urine is 7% by mass of the organic content.19 Therefore, the ratio of hydrogenper g of organic matter in blood to the hydrogen per g of organic matter in urine is about 1.9.This ratio may be an important parameter for comparing the retaining tritium content per gH inorganic fraction of soft tissue (if we assume that blood represents the chemical composition ofsoft tissue) with the excreted tritium content per gH in organic fraction of urine. However, theratio of tritium per j)H in organic matter of one sample to the tritium per gH in organic matterof another sample should not be confused with the specific activity ratio (SAR), which is theratio of Bq per gH in OBT to HTO for any one sample, used in representing the relativeconcentration of tritiated species in a biological sample.
From the observations made above, the organically bound hydrogen in blood (OBHbk,od) toOBH in urine (OBHurine) in a unit mass of organic matter is expected to be about 2.5. Thisvalue is calculated by multiplying the ratio of the organic matter per g of blood to urine (1.3)and the ratio of hydrogen contents per g of organic matter of the samples (1.9). The 2.5 valuefor the ratio of OBHblood to OBHunne per g of organic matter may be attained under theequilibrium conditions.
The averaged ratio of OBTbtood to OBTunne in per g of organic matter for the exposed workers ofthis study is 2.3 ± 0.5 between 100 d and 300 d post-exposure. This measured value issimilar to the estimated value of 2.5 as given above, based on the ratio of OBHb,ood to OBHurjne
per g of organic matter. The measured ratio of OBTblood to OBTurine in organic matter was also2.5 ± 0.1 for the exposed workers in Rudran's (1988) paper. Furthermore, when tritiumconcentration in terms of Bq*gH"1 in organic matter in each bioassay sample was compared,the ratio of bound fraction of tritium in blood to urine was 0.9 ± 0.2. The ratio of bound tritiumin feces to urine and feces to blood was estimated to be 1.0 ± 0.1 and 1.1 ± 0.2, respectively.These data indicated that equilibrium conditions exist for tritium per gH in the body fluids after100 d post-exposure of an acute intake of HTO, which suggests that a knowledge of the
17 The blood has 0.9 g organic matter per g of dry residue (Duong et al., 1994), while the urine has0.7 g organic matter per g of dry residue (Trivedi et al., 1993). This gives the ratio of organicmatter per g of dry residue to be 1.3.
18 Protein is the major constituent of organics in the blood. The hydrogen content of protein (e.g.,haemoglobin) is 13.5% of the total elemental composition by mass (Bhandal and Singh, 1993).
19 Urea is the major constituent of excreted organics in urine; it contains 7% hydrogen by mass(ICRP, 1975).
18
tritium activity per unit mass of organic matter in urine can permit a measurement of thespecific activity of OBT in soft tissues, providing equilibrium conditions exist.20
4. DOSIMETRIC CONSIDERATIONS
Knowledge of the average distribution of tritium in time and space (in body water and softtissues) is a prerequisite for dosimetry. The standardization of tritium dosimetry is based onthe calculation of tissue dose due to HTO that is assumed to be uniformly distributedthroughout the soft tissues of the body (Till et al., 1980; Pinson and Langham, 1980; Johnson,1982). HTO is distributed in the intracellular and extracelluar body fluids. The concentrationin urine, 3 or 4 h post-exposure, is the same as in the other body fluids (Pinson et al., 1952;Osborne, 1972; Mathur-De Vre and Binet, 1984).
Studies have shown that the retention of tritium by measuring tritium-in-urine following HTOintake can essentially be described by a single exponential over the first month or more(IAEA, 1991; also see Table VI). However, cases have been reported also where a secondexponential term or even a third exponential term have been observed (Sanders and Reinig,1968; Snyders et al., 1968; Cawley et al., 1984; Llyod et al., 1986; Rudran, 1988). The firstcomponent is seen by ICRP 56 (1989) to approximate the turnover of body water with a half-time of about 10 d (range 4-18 d); the second and third components represent tritiumincorporated into organic matters of the soft tissue.
The values of the first term of bivariate bi-exponential function, employed in this work, relate tothe turnover of body water as discussed in section 3.1. The values for HTO clearance in theexposed workers lie between the 90% confidence interval of the half-times (5.4 to 13.6 d)reviewed by Butler and Leroy (1965). The presence of the longer exponential term for 0 < t <oo is interpreted as being due to the assimilation of tritium in body compartments other thanHTO. There has been direct evidence of this longer-term compartment by the measurementof OBT-in-urine. In this section, our discussion and interpretation on fractional dose increasefrom the metabolised OBT (A) after HTO intakes are limited to the tritium-in-urine data.Section 4.1 discusses the significance of metabolized OBT in HTO dosimetry, and section 4.2estimates the fractional dose increase from OBT (A) in exposed workers (A-H).
4.1 Dosimetrv of Metabolised OBT
The determination of cumulative dose from tritium to the body may be assessed by aquantitative relationship between the dose received from the tritium concentration in the bodywater and from metabolised OBT in the soft tissues. A HTO compartmental model having abody water compartment and two separate compartments for fast and slow OBT components
20 We are testing this hypothesis currently with the chronically exposed workers to HTO, assumingthat tritium in their soft tissues exists in equilibrium with the body fluids. The OBT and HTO inurine and blood are measured to calculate the specific activity,ratio (SAR in Bq^gH'1) of OBT toHTO in the soft tissues. In calculating the dose contribution from OBT, we have assumed that theratio of OBT to HTO in urine is representative of that ratio for soft tissues and for blood (Trivediet al., in preparation).
19
is discussed in recent reviews (Saito, 1992; Hill and Johnson, 1993). However, the labellingand fixing of tritium in the soft tissues is dependent on the intake route and metabolism ofhydrogen in the body. Hence, another approach to OBT dosimetry is to examine thephysiological significance of hydrogen metabolism in humans and calculate the theoretical limitfor dose increase from metabolised OBT on the basis of the tritium/hydrogen balance in thebody.
Section 4.1.1 discusses the theoretical limit of OBT dose contribution using the physiologicaldata for hydrogen metabolism in Reference Man. The experimental limit for OBT doseincrease has been examined by reviewing and using the data from various animal and humanstudies in Appendix D. In section 4.1.2, the discussion focusses on the development of amathematical model that takes account of the variable rates of fluid intake and underlyingconcepts of the metabolic model employed. The proposed model has used the kinetic valuesfor tritium-in-urine to estimate the dose increase from metabolised OBT in the workersexposed to HTO (Section 4.2).
4.1.1 Role of Tritium-hydrogen Exchange in Dosimetry
Selected aspects of hydrogen metabolism in Reference Man are examined, to demonstrate atheoretical limit to the dose from tritium fixing into organic matters of the body due to HTOintake. Table VIII lists the hydrogen content of the soft tissues. None of the soft tissue has ahydrogen content in excess of 12% of the total elemental mass. The hydrogen concentrationin the extracelluar and intracellular water is in equilibrium. The water accounts for ~ 80%(range, 72-81%) of the total mass of the soft tissues, excluding the adipose tissues (11-31%water).
In evaluating the theoretical limit for OBT fraction, we assume that the body hydrogen isuniformly labelled with tritium. The dose to the body from retained tritium will be proportionalto the sum of the time-integrated concentration of tritium in the body water and in the organicmatter of the soft tissues. At equilibrium, the effective dose-rate to soft tissue can beunderestimated, by the ratio of tritium concentration in the soft tissues to the tritiumconcentration in the body water, if account is only taken of dose from the body v-ster. Thefactor or the percentage of OBT dose after HTO intake is estimated here for Reference Man.
The physiological data for Reference Man shows that the mass of hydrogen in soft tissue,including body water, is about 6300 g. The mass of hydrogen in the total body water is 4600g (2000 g extracelluar, 2600 g intracellular). As such, the limit of mass ratio of tritiumincorporation into soft tissue to tritium in body water cannot exceed 1.37. This value isobtained by dividing tritium in soft tissues (6300 g) by tritium in body water (4600 g).
The different retention times for tritium in body water and organic fractions will not influencetheir fractional contribution to the total dose under steady-stats equilibrium, since the entry oftritium into body water and different forms of OBT will be inversely proportional to theirbiological half-lives in order to preserve the balance of hydrogen mass in the body water anddry matter of the soft tissue. This condition applies to the normal healthy adult humans;however, this situation may vary with individuals in other age groups (infant, child, etc.) orindividuals with metabolic disorders, where the balance of hydrogen mass in the bodycompartments varies with physiological conditions.
20
For an adult individual, Osborne (1972) considered an actively metabolizing tissue where acompound (or group of compounds), which is being synthesized, is incorporating tritium fromthe body water after HTO intakes. It is assumed that this compound is not accumulatingmass, so catabolism will be occurring at the same rate as synthesis. Consider a pulse oflabelled hydrogen injected into this particular cycle. If the cycle is long, then the label willconstitute a small proportion of the total hydrogen in the cycle, but will be in the cycle a longtime. However, if the cycle is short, then the labelled hydrogen will be a large fraction of thetotal, but will only be in the cycle for a short time. Therefore, under equilibrium conditions, theonly parameter that matters is the proportion of bound hydrogen derivable from the bodywater.
Studies in animals exposed to acute or chronic HTO intakes show that the proportion ofbound hydrogen derivable from the drinking water is about 30% for the soft tissues (seeAppendix D). The dose increase (A) from metabolized OBT is then limited at 11% of the totalbody water dose. This value can be computed by multiplying the ratio of hydrogen mass inthe organic matters of the soft tissue to hydrogen mass in the body water (0.37) with thepercentage of tritium derived from the body water (30%) in the organic matters of soft tissue.Therefore, theoretical and experimental evidence demonstrate that, under equiltrinum, tritiumbound in the soft tissue is unlikely to exceed 11% of total body water dose if ingested in theform of HTO. However, the intake of tritium in chemical forms other than HTO (e.g.,ingestion of OBT) may preferentially enter into compartments with a long turnover time,resulting in higher doses than those from HTO intakes.
4.1.2 Mathematical Model for OBT Dose Fraction (A)
It is standard practice to assign the effective dose,21 E due to tritium, on the basis of themeasured dose to urine that is assumed to represent the dose to body water. It is taken intoaccount that the dose is delivered to the entire soft tissue mass of the body and not just to thebody water. It is also recognized that some of the tritium uptake from HTO will beincorporated into organic forms. A mathematical model of this argument is presented here.
The amount of tritium in the body water, Aw, as a function of time, t, is given quite generallyby a function of the form:
Aw( t) = / g ( i ) I7(t - T)CIT Equation (4)
where I'(T) is the input rate at time T and g(i) is the appropriate response function for tritium inbody water. Similarly, the amount of tritium metabolized in the body as OBT, A0BT is retainedand given by:
In assigning the effective dose, the value for tritium radiation weighting factor (WR) is consideredto be one.
21
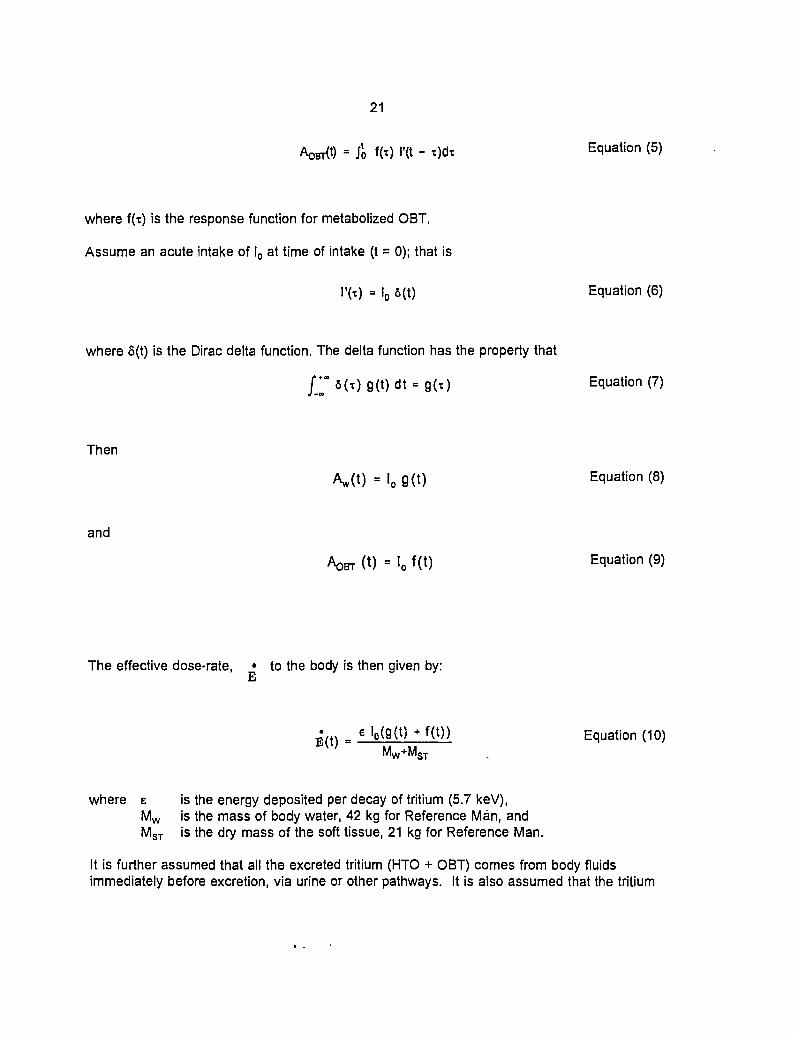
JÔ Equation (5)
where f(t) is the response function for metabolized OBT.
Assume an acute intake of l0 at time of intake (t = 0); that is
I'(T) = l0 6(t) Equation (6)
where 6(t) is the Dirac delta function. The delta function has the property that
/ " " M O S(t) dt = g( t ) Equation (7)J -00
Then
A w ( t ) - i o g ( t ) Equation (8)
and
f (t) Equation (9)
The effective dose-rate, • to the body is then given by:E
B- ( t ) = e l o ( g ( t ) . f ( t ) )MW+MST
Equation (10)
where e is the energy deposited per decay of tritium (5.7 keV),Mw is the mass of body water, 42 kg for Reference Man, andMST is the dry mass of the soft tissue, 21 kg for Reference Man.
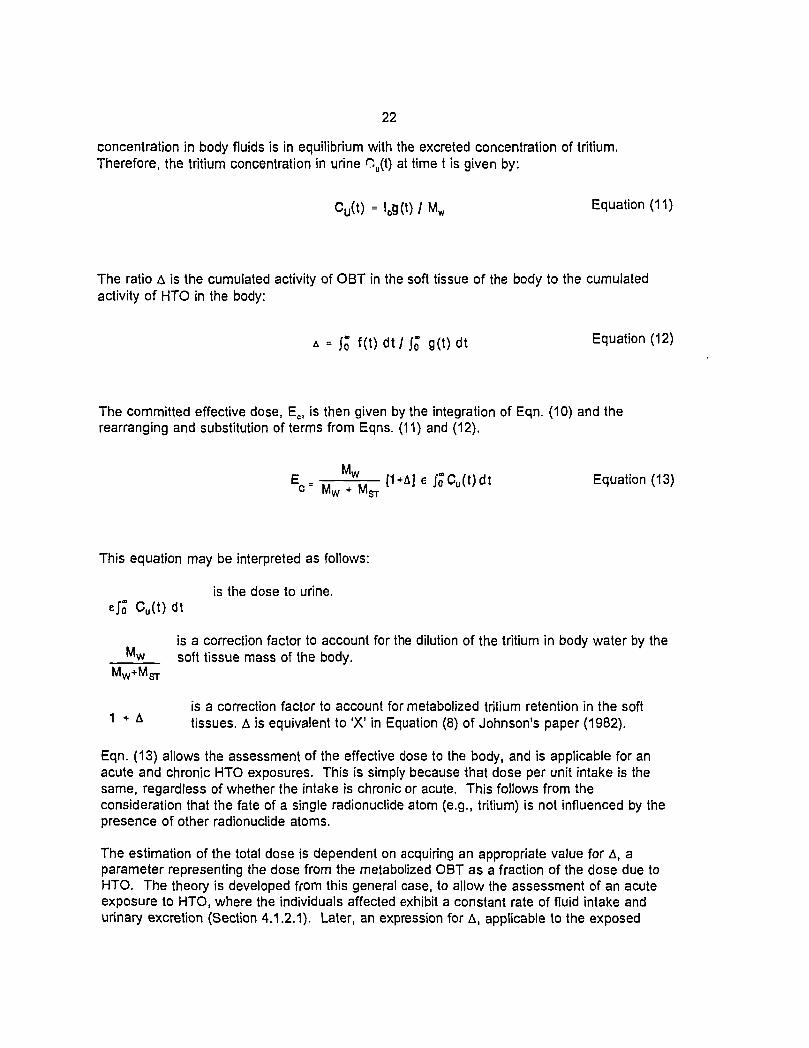
It is further assumed that all the excreted tritium (HTO + OBT) comes from body fluidsimmediately before excretion, via urine or other pathways. It is also assumed that the tritium
22
concentration in body fluids is in equilibrium with the excreted concentration of tritium.Therefore, the tritium concentration in urine Ou(t) at time t is given by:
Cu(t) = lo9(t ) /Mw Equation (11)
The ratio A is the cumulated activity of OBT in the soft tissue of the body to the cumulatedactivity of HTO in the body:
W o " f(t) dt / JÔ g(t)dt Equation (12)
The committed effective dose, Ec, is then given by the integration of Eqn. (10) and therearranging and substitution of terms from Eqns. (11) and (12).
e Jo"Cu(t)dt Equation (13)
w
This equation may be interpreted as follows:
is the dose to urine.ejo" Cu(t) dt
is a correction factor to account for the dilution of the tritium in body water by thesoft tissue mass of the body.
is a correction factor to account for metabolized tritium retention in the soft1 + A tissues. A is equivalent to 'X' in Equation (8) of Johnson's paper (1982).
Eqn. (13) allows the assessment of the effective dose to the body, and is applicable for anacute and chronic HTO exposures. This is simply because that dose per unit intake is thesame, regardless of whether the intake is chronic or acute. This follows from theconsideration that the fate of a single radionuclide atom (e.g., tritium) is not influenced by thepresence of other radionuclide atoms.
The estimation of the total dose is dependent on acquiring an appropriate value for A, aparameter representing the dose from the metabolized OBT as a fraction of the dose due toHTO. The theory is developed from this general case, to allow the assessment of an acuteexposure to HTO, where the individuals affected exhibit a constant rate of fluid intake andurinary excretion (Section 4.1.2.1). Later, an expression for A, applicable to the exposed
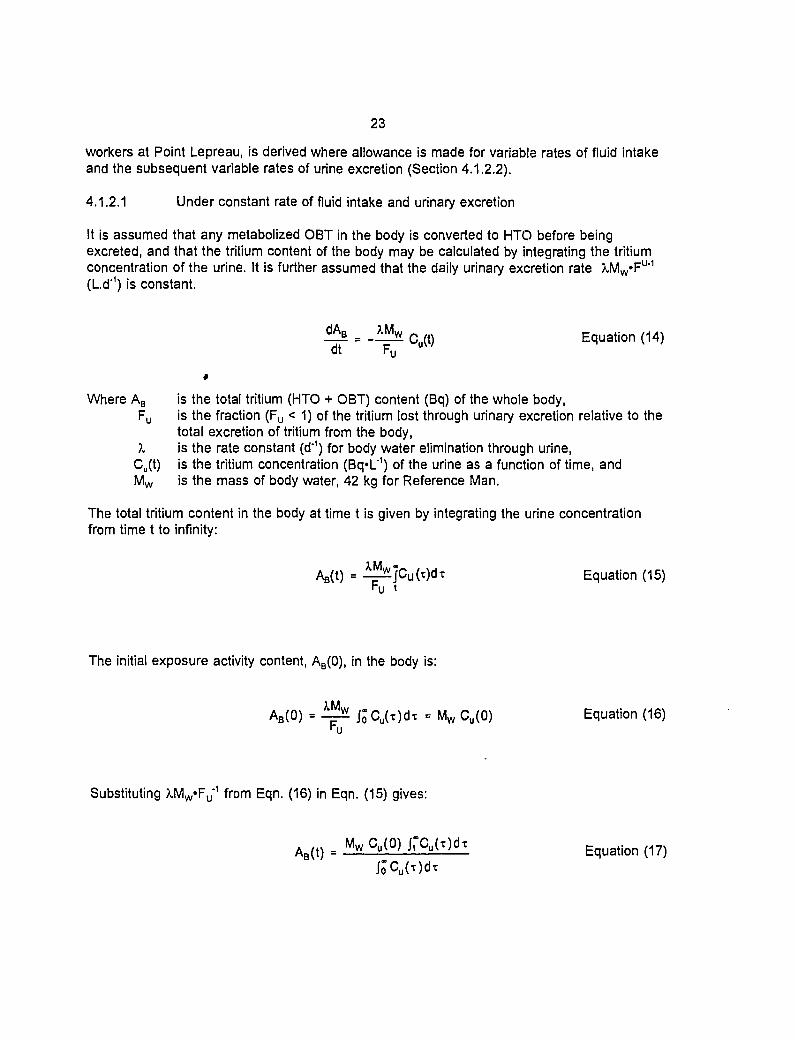
23
workers at Point Lepreau, is derived where allowance is made for variable rates of fluid intakeand the subsequent variable rates of urine excretion (Section 4.1.2.2).
4.1.2.1 Under constant rate of fluid intake and urinary excretion
It is assumed that any metabolized OBT in the body is converted to HTO before beingexcreted, and that the tritium content of the body may be calculated by integrating the tritiumconcentration of the urine. It is further assumed that the daily urinary excretion rate XMW«FU'1
(L.d'1) is constant.
E q u a t i o n
Where AB is the total tritium (HTO + OBT) content (Bq) of the whole body,Fu is the fraction (Fu < 1) of the tritium lost through urinary excretion relative to the
total excretion of tritium from the body,X is the rate constant (d'1) for body water elimination through urine,
Cu(t) is the tritium concentration (Bq«L"1) of the urine as a function of time, andMw is the mass of body water, 42 kg for Reference Man.
The total tritium content in the body at time t is given by integrating the urine concentrationfrom time t to infinity:
Ae(t) = ^ J C u ( x ) d T Equation (15)F t
The initial exposure activity content, AB(0), in the body is:
AB(0) = ^ iSCu(T)dt = Mw Cu(0) Equation (16)
Substituting 7MwmF^ from Eqn. (16) in Eqn. (15) gives:
AB(t) = —-—" u Equation
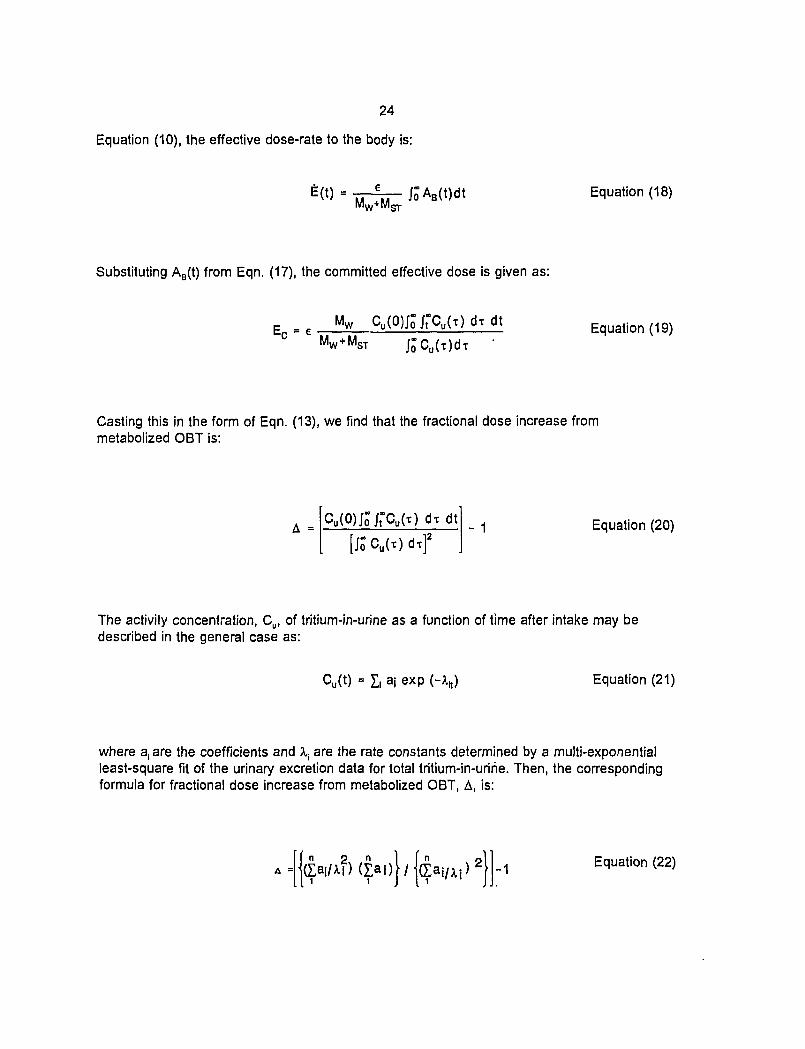
24
Equation (10), the effective dose-rate to the body is:
MW+MOT
Equation (18)
Substituting AB(t) from Eqn. (17), the committed effective dose is given as:
Equation (19)
Casting this in the form of Eqn. (13), we find that the fractional dose increase frommetabolized OBT is:
A =Cu(O)Jo"Jt"Cu(t)dtdt
[jôCu(T)dt]2- 1 Equation (20)
The activity concentration, Cu, of tritium-in-urine as a function of time after intake may bedescribed in the general case as:
Cu(t) = I, aj exp (- Equation (21)
where a, are the coefficients and \ are the rate constants determined by a multi-exponentialleast-square fit of the urinary excretion data for total tritium-in-urine. Then, the correspondingformula for fractional dose increase from metabolized OBT, A, is:
I I{ÇaiMÎ)(Çai)|/ -1 Equation (22)
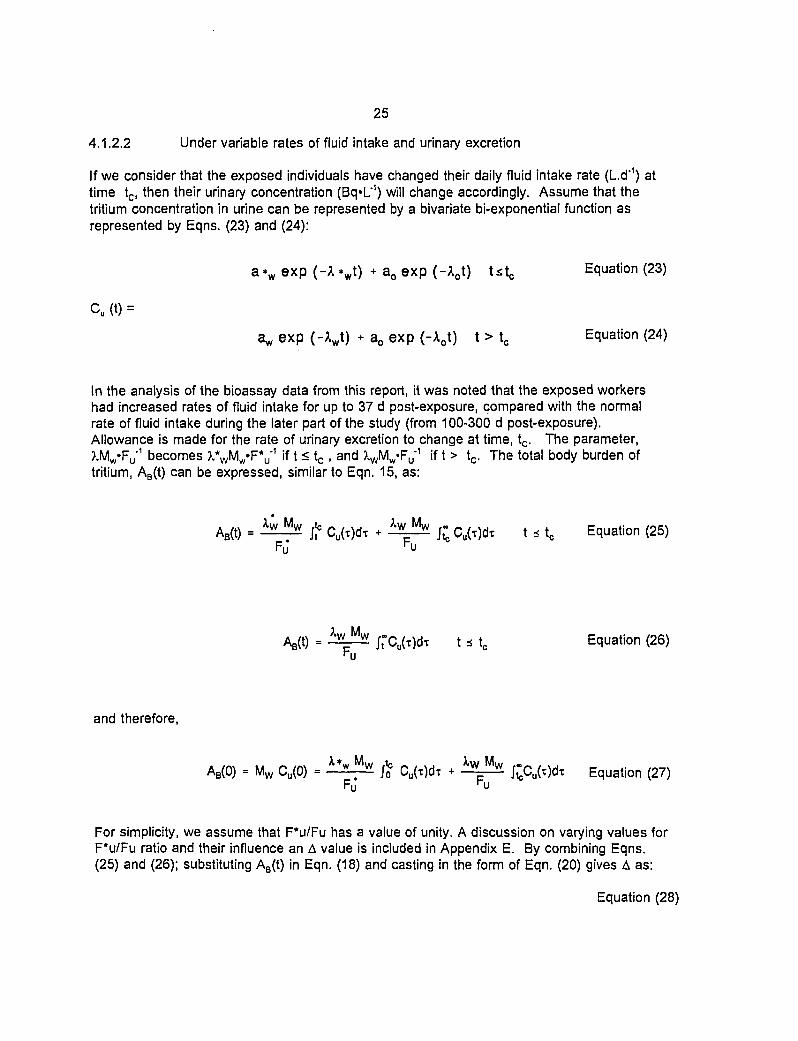
25
4.1.2.2 Under variable rates of fluid intake and urinary excretion
If we consider that the exposed individuals have changed their daily fluid intake rate (Ld'1) attime tc, then their urinary concentration (Bq«L1) will change accordingly. Assume that thetritium concentration in urine can be represented by a bivariate bi-exponential function asrepresented by Eqns. (23) and (24):
a * w e x p (-A*w t ) + a o e x p ( - X o t ) t s t c Equation (23)
Cu (t) =
a^ exp (-XJ) + a0 exp (-Aot) t > tc Equation (24)
In the analysis of the bioassay data from this report, it was noted that the exposed workershad increased rates of fluid intake for up to 37 d post-exposure, compared with the normalrate of fluid intake during the later part of the study (from 100-300 d post-exposure).Allowance is made for the rate of urinary excretion to change at time, tc. The parameter,7MW'F^ becomes ?.*WMW«FV1 if t < tc , and ?̂ VMW«FU-
1 if t > tc. The total body burden oftritium, AB(t) can be expressed, similar to Eqn. 15, as:
AB(t) = ^ ^ j f Cu(x)dt + ^Ç^ £ Cu(x)dT t * tc Equation (25)FJ hu
/t-Cu(t)dt t s t0 Equation (26)
and therefore,
AB(0) = Mw Cu(0) = wt w jo Cu(T)dT + w w i^Cu(t)dT Equation (27)
Fo r u
For simplicity, we assume that F*u/Fu has a value of unity. A discussion on varying values forF*u/Fu ratio and their influence an A value is included in Appendix E. By combining Eqns.(25) and (26); substituting AB(t) in Eqn. (18) and casting in the form of Eqn. (20) gives A as:
Equation (28)
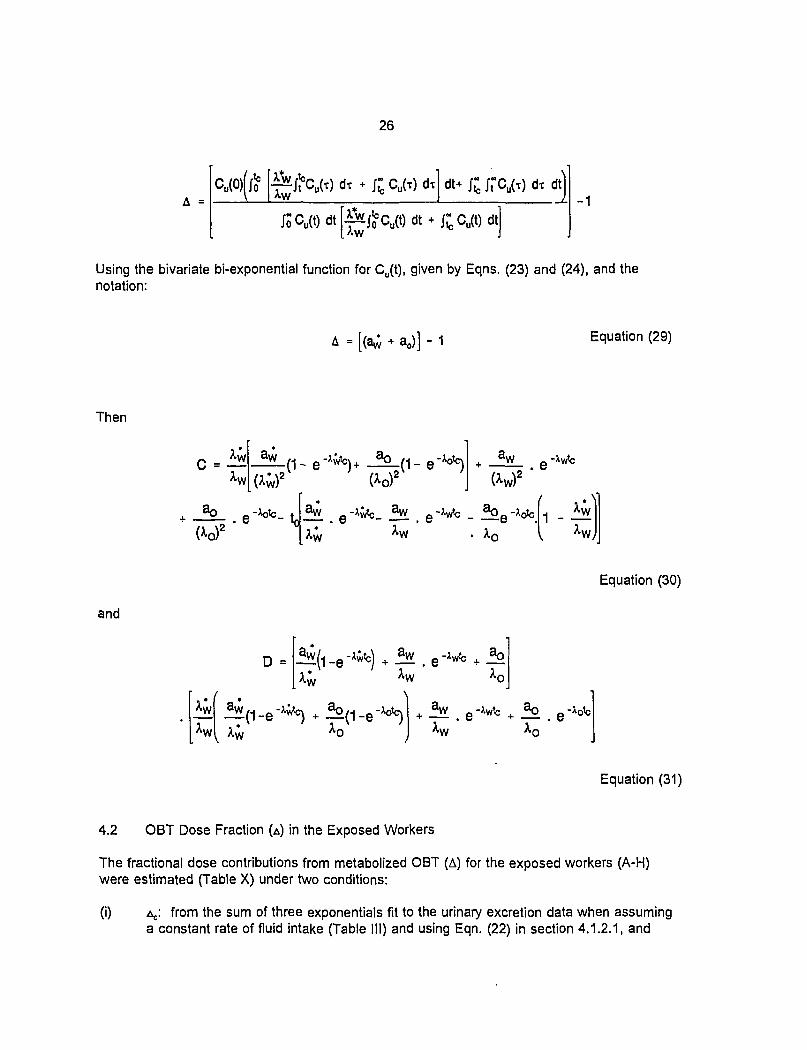
26
A = °u(0)(J° ["^^CU H -1
Using the bivariate bi-exponential function for Cu(t), given by Eqns. (23) and (24), and thenotation:
W + a0)] - Equation (29)
Then
C =
3 - to
and
_e. e -*wtc + o
Equation (30)
4.2 OBT Dose Fraction (A) in the Exposed Workers
Equation (31)
The fractional dose contributions from metabolized OBT (A) for the exposed workers (A-H)were estimated (Table X) under two conditions:
(i) A,.: from the sum of three exponentials fit to the urinary excretion data when assuminga constant rate of fluid intake (Table III) and using Eqn. (22) in section 4.1.2.1, and
27
(ii) v from the bivariate bi-exponential fit when assuming variable rates of fluid intake(Table IV) and using Eqn. (28) in section 4.1.2.2.
The average AC value for the exposed workers was 0.10 ± 0.01 with a range from 0.03 to 0.32(Table X). The analysis of the data showed that the maximum AC value of 0.32 was obtainedfor exposed worker A. Using the covariance matrix produced by the fitting routine on theurinary excretion data, error propagation in the AC values were performed (Douglas and Davis,1992). The average percentage error value for seven out of the eight exposed workers was11 ± 6. The error for A,, for worker E was greater than three times of the mean percentageerror for the other workers.
The average ^ value was 0.062 ± 0.013 with a range of 0.035 to 0.089 for the eight exposedworkers (Table X). The error propagation in the AV values was also estimated from thecovariance matrices produced from the fitting parameters. The average percentage errorvalue for the exposed workers was 26 ± 12%, with a range of from 10% to 40%.
The average ratio of the \ to AC values was 0.72 ± 0.59. For six of the eight exposedworkers, the ratio of A, to AC ranged from 0.3-0.6. The \ value was, however, greater than theAC value for worker E (2.2-times) and worker F (1.1-times). This discrepancy is attributed tosmall negative components with corresponding fractional components of low value for both Eand F workers, when assuming a constant rate of fluid intake and sum of three exponentials.However, the fractional components observed for workers E and F when considering variablerates of fluid intake were in the range similar to the other exposed workers, indicating that theAv values, accounting for the variable rates of fluid intake, are closer to the physiologicalreality.
A few urinary excretion data for total tritium-in-urine, reported in the literature (Table IX), werereanalyzed employing the theoretical methods given in this report. Our theoretical analysis ofA assumes that the excreted concentration of tritium-in-urine is in equilibrium with the tritiumconcentration in body fluids of the people affected. In analyzing these data, we assumed thatthe individuals affected had a constant rate of fluid intake, since no explicit explanation of theirdrinking habit was given in the published papers. The range of A value after HTO intake wascomputed from the normalized kinetic data of these studies (Table XI). When the normalizedvalues for fractional components and rate constants were substituted in the Eqn. (22), the Avalues ranging from 0.03 to 0.16 were obtained for the urinary excretion data of Sanders andReinig (1968), Snyders et al. (1968), Henry (1972) and Balonov et al. (1974). However, the Avalues ranging from 0.11 to 1.63 were derived for the normalized data from Rudran's study(1988).
Rudran (1988) concluded that the underestimation of the total dose was of the order of 2.4-times if the OBT dose contribution is ignored after HTO intakes. No definitive explanation ofthis discrepancy can be given on the basis of the information in the published paper fromRudran's laboratory. In particular, there is no information given with respect to theuncertainties inherent in tritium-in-urine measurements. The A values for Rudran's subjectswere noticeably different than what we estimated as theoretical upper limit (0.11) for HTOintakes. An independent check of Rudran's data by La Bone (1992) concluded that theurinary excretion data presented in Rudran's report are inconsistent with the assumedbiokinetic model of HTO.
28
The tritium-in-urine kinetic data of this report were compared against the kinetic results fromthe eight individuals who had HTO intakes in Rudran's study (1988). The biological half-livesfor tritium turnover in the body water (6.0 ± 1.7 d) and the longer-term component (82 ± 67 d)of Rudran's publication are comparable to the reported values in this study. The averagevalue for the first compartment size was 0.986 ± 0.013 (range, 0.962 to 0.999), while theaverage value for the second compartment size was 0.014 ± 0.013 (range, 0.001 to 0.038).The average fractional size of the second compartment was about 3.5-times larger than otherreported studies, including our present study. We assume that the larger size of the secondcompartment in Rudran's study might be due to significant quantities of OBT in the bodies ofthe exposed workers from previous intakes (Trivedi and Galeriu, 1993).
5. DISCUSSION
One of the important features of this study is that the time and the route of HTO intake wereknown. The drinking habits of the people affected were also recorded. There were frequentsample collections and analyses of tritium-in-urine from the eight exposed workers from thetime of intake up to 300 d post-exposure. The study also provided a good opportunity tostudy the incorporation of tritium into the organic compounds of blood, urine and feces.Although bioassay samples were obtained for HTO and OBT in blood and feces for theexposed and control group workers, the data were insufficient (n= 0 to 5) to assess the dosearising from the metabolised OBT. In addition, there were no blood or feces samplesavailable in the first 100 d post-exposure.
Some information relevant to the dosimetry of an acute HTO intake were obtained. Firstly, theactivity concentrations of HTO-in-urine, HTO-in-feces and HTO-in-blood were in equilibriumbetween 100 d and 300 d post-exposure. Secondly, the measurements showed that the ratioof tritium per gH in organic matter in feces (OBTfeces) to urine (OBTurine) was 1.0 ± 0.1 from 100d to 300 d post-exposure. Thirdly, the ratio of OBTblood to OBTurine per gH in organic matterwas 0.92 ± 0.2 between 100 d and 300 d post-exposure. It may be inferred that at periods>100 d post-exposure, HTO in body fluids is in a steady-state equilibrium. Furthermore, OBT-in-blood and OBT-in-urine and perhaps in all body fluids and soft tissues of the body is inequilibrium during this late period after HTO intake. This may indicate that both tritiatedspecies (HTO and OBT) in body fluids are in dynamic equilibrium at times >100 d post-exposure (Table XII).
This report has focussed on interpreting the dosimetric significance of the longer-termretention of tritium following an acute HTO intake. Our analysis of HTO-in-urine and OBT-in-urine data has shown that the time-integrated tritium activity in urine is dominated by HTO (~99%), with the remainder due to OBT. This experimental observation is in agreement with thevalues assigned to tritium-in-urine being in the HTO compartment (Croach, 1973; Balonov etal., 1974; Rohwer and Wilcox, 1976), and implies that the major part of the tritium from aHTO intake was not fixed in the organic residues of the body. While only a minor fraction oftritium was metabolically processed into OBT, the residence time'of OBT in the body is longerthan the tritium in body water. It is important that the dose from the retention andincorporation of such OBT be evaluated for dosimetric purposes. Hence, we have attemptedin this report to demonstrate what the dose fraction from such metabolized OBT would be. An
29
examination of the urinary excretion of total tritium in eight exposed workers (A-H) made itpossible to estimate the OBT dose contribution to the body.
Initial attempts to analyze the urinary excretion data assuming a constant rate of fluid intakeover the duration of the study were only partially satisfactory (Trivedi et al., 1993). Themaximum value for Ac was 0.32 for individual A (Section 4.2). This value was close to theupper theoretical limit for ^ of 0.37 (as discussed in Section 4.1.1), considering the uniformdistribution of hydrogen in the body from Reference Man data. Also, such a high value of Acwould have required that most of worker A's bound hydrogen in the soft tissue was derivedfrom the body water. However, animal studies have demonstrated that less than 30% of thehydrogen in organically bound hydrogen (OBH) is derived from the body water, with the majorpart fixed from the dietary intakes of food (Appendix D). The maximum possible dose fractionfrom metabolized OBT (A) for HTO intakes is then estimated to be about 11% of the total bodywater dose under steady-state equilibrium conditions22 (see section 4.1.1).
•
The relatively high A value for exposed worker A was re-examined in the light of observationsrelated to tritium turnover in urine and the physiological parameters. An examination of thekinetic values for a sum of three exponential functions, assuming a constant rate of fluidintake, demonstrated that the biological half-lives and fractional compartment sizes of thesefunctions were significantly different than the reported results in the literature (see section3.1.1.1). It was also noted that the fractional size (0.24 ± 0.23) and the biological half-life(11.9 ± 5.3 d) of the second component in our analysis of the total tritium-in-urine data for alleight exposed workers (A-H) were incomparable with the fractional size (0.003) and thebiological half-life (23 d) of the second component of a three exponential component fit asreported by Sanders and Reinig (1968) (Table VIA). This analysis indicated that employing asum of three exponentials fit was inappropriate for interpreting the clearance kinetics of totaltritium-in-urine in our subjects.
The discrepancy in our and reported kinetic values for tritium clearance in urine was attributeddue to the fact that no account was taken of variable rates of fluid intake by the exposedworkers. Since the fluid intake rates influence the urinary excretion function, a kinetic theorywas developed to account for a hypothetical change in the rates of fluid intake and urineexcretion of the exposed workers at a particular time post-exposure, tc (see section 3.1.1.2).Based on the variable rates of fluid intake, recorded as the cumulative amount of fluid intakein the first month or so post-exposure, the urinary excretion data from total tritium-in-urinewere reanalyzed utilizing a bivariate bi-exponential function. The average biological half-livescorresponding to the initial (< tc) and later (>tc to 300 d post-exposure) were 6.3 ± 1.0 d and8.4 ± 2.0 d) respectively, for the first component in the bivariate bi-exponential function, andwere in the range of reported values for the body water turnover (Table VIA) (see section3.1.1.2). The total contribution of the first component before and after tc, representing theclearance of the body water, accounted for approximately 99.5% of the excretion of totaltritium-in-urine. Similarly, the percentage value of the longer-term component at 0.5%, asreported in other studies (Table XI), implies that the fractional size of the first component is ofthe same order. This reanalysis of the bioassay data suggested that the bivariate bi-
22 The A value was calculated by multiplying the upper limit of dose contribution from OBH (0.37) tothe fraction of tissue-bound hydrogen derived from the body water (30%).
30
exponential function for total tritium-in-urine kinetics, considering variable rates of fluid intake,is an adequate representation of the clearance kinetics of tritium for our subjects.
The average fractional dose increase from the metabolized OBT (AV), considering variablerates of fluid intake for the exposed workers (A-H), was computed using the reanalyzed kineticvalues and Eqn. (28) (see section 4.2). The average AV value was 0.062 ± 0.013 (Table X).The AV values for all eight male exposed workers were under 0.10 (range, 0.035 to 0.089).The range of AV values among the exposed workers is assumed to arise from the variation inphysical and biological factors, including individual variability in drinking habits and metabolismamong workers and experimental measurement errors. Some possible sources of error in AV
were examined and evaluated for an estimate of the uncertainty of this parameter on the AV
values (see Appendix E).
Firstly, the loss of the body water in urine ÇFU) as a fraction of the total loss of water from thebody (including loss by feces, sweat, expiration and insensible loss), adjusted to the bodymass of the workers and the variable rates (F*u, t < tc) and constant rate (Fu, t > tc) of fluidintake, was employed in calculating the uncertainty in the value of AV. It was assumed thatthe fraction of body water lost through urinary excretion (Fu), relative to the total loss, isconstant throughout the period. However, the urinary excretion fraction Fu of the exposedworkers will change with the fluid intake rates, which was initially high at times <tc, and thenbecame normal after time tc post-exposure. In terms of the dosimetric theory described insection 4.1.2, it is important to estimate the magnitude of the ratio F*u/Fu and its affect on thevalue of A. The analysis of the exposed workers' data showed that the estimated values forF*u and Fu introduced an average increase in the AV value of 25% (range -7% to +44%) (seeAppendix E.1).
Secondly, The uncertainty in A values due to statistical errors on the fitted parameters of thebivariate bi-exponential function (a, and X() was investigated. The average standard deviationfor a*w and aw of the first component of the function was about 3% and 9%, respectively.Similarly, for X*w and 7^, the standard deviations were about 2% and 3%, respectively. Theparameters of longer-term components (a0 and ).o) had larger standard deviation values thanthe first component of the bivariate bi-exponential function. The uncertainties in AV valueswere propagated from the covariance matrix produced by the fitting parameters for individualexposed workers. The average percentage error value for eight exposed workers wasestimated to be 26 ± 12%, with a range of from 10 to 40% (Appendix E.2).
Thirdly, another source of error that involves ignoring the excretion of OBT-in-urine inassessing the uncertainty in the AV value was evaluated by employing compartmental analysis.A three compartments metabolic model of Saito (1992) was modified to account for OBTexcretion in urine. Numerical experiments using the modified model were conducted toassess the uncertainty of the AV value in a limited observation time (300 d post-exposure).The numerically computed values for AV from Saito's original model and the modified model,which includes direct OBT excretion in urine, were compared. The effect of ignoring OBTexcretion from the body was demonstrated to be minor for the AV value (1-2 %)(Appendix E.3).
Some of the other sources of variation that may influence the assessment of A value arerecognized, but were not explicitly evaluated in this work. No allowance was made for
31
physiological sources of variation in the body water clearance half-time or mass of the bodywater that can vary with habit and habitat of the individual affected. There is evidence thatthe environmental factors (e.g., humidity, temperature) and biological factors (e.g., age,gender, health) are capable of influencing the parameters that are important for dosemitigation. The techniques for amelioration of radiation dose include elevated level of fluidintake, diuretic drugs and haemodylasis. The variation of the environmental and physiologicalcondition can also influence the HTO dosimetry. (Sandarangani et al., 1971; Rudran et al.,1992). In summary, the evaluation of the sources of error variation showed that themagnitude of the uncertainty in the AV values, obtained by fractional loss of the body water inurine (Fu) and statistical analysis of fitting parameters, is far more important than consideringOBT-in-urine. Subsequently, the overall uncertainty in the OBT dose contribution wasestimated to be about 50% at the 95% confidence level (Appendix E, Table 1).
This report has given an account of the progress that has been made in the understanding ofmany aspects of the OBT dosimetry after an acute intake of HTO. It has demonstrated thatthe dose contribution from the metabolised OBT is less than 10% for the eight male exposedworkers (AV, between 3.5% and 8.9%). This provides a strong basis for the acceptance ofcurrent recommendations for HTO dosimetry as given in Federal/Provincial Bioassay guideline2 (1982). The reduction of uncertainties in the value of A may require, however, a greaterunderstanding of the urinary excretion rate and the mass of the body water with varyingphysiological conditions. It is envisaged that this will entail approaches where factorsresponsible for influencing the sensitive parameters in OBT dose contribution need to bebetter understood through further animal and human studies.
6. FUTURE WORK
The scientific findings from this report are sufficient to recommend that the dose from themetabolized OBT in the exposed workers (A-H) contributes less than 10% of the total bodywater dose after HTO intake and the current understanding for HTO dosimetry is adequate fordosimetric purposes (Federal/Provincial Bioassay Guideline 2, 1982). Although thecontribution to dose from the metabolized OBT is small, it is important for our understandingto develop a physiologically based metabolic model for tritium intakes that accounts for ourexperimental findings. This work has demonstrated, for the first time, that OBT is excreted inurine in all post-exposure examinations (0-300 d post-exposure), and that a fraction of themetabolized OBT was also excreted in feces. It is expected that the kinetic analysis of tritium-in-blood may result in a retention function that is more directly applicable to the tritiumdynamics in the body than that obtained from the analysis of total tritium-in-urine. Theanalysis of OBTblood to OBTurine per gH in this study has indicated that OBT per gH in bodyfluids is near or in equilibrium at or > 100 d post-exposure. No measurements were made ofthe ratio of OBTblood to OBTurine per gH in this study before 100 d post-exposure. Future workin this area is needed to specify the kinetics and distribution of OBT per gH in body fluids andsoft tissue early after post-exposure. This work will require the preparation of a writtenprotocol for collecting, submitting and analyzing the bioassay samples for the total tritium,HTO and OBT).
The concentrations of HTO and OBT in the bioassay samples of the exposed workers (A-H)were measured reliably by the established bioassay methods (Trivedi et al., 1993; Duong et
32
al., 1994). However, as noted, difficulty was encountered in getting an accurate measurementof tritiated species in the bioassay samples obtained from the controlled group of workers. Anability to measure low levels of tritium, especially OBT, would be useful. Future work in thisarea needs a radioanalytical method that can reliably, accurately and reproducibly measureOBT in biosamples at lower levels (< 1 Bq«L*1) than the methods used in this study. The,dose assessment from tritium intakes, other than HTO intakes, requires the use of a validtritium metabolic model that can reflect the dynamics of tritium metabolism as HTO and OBTand excretion (Brown, in press). The current metabolic models do no account for direct OBTexcretion, as the present study shows. Such a modified metabolic model is in thedevelopmental stage at this time, and it will need to be validated against the physiologicallyrelevant data. To do this, a better understanding of tritium metabolism is required not only forthe adult individuals, but also for the members of different gender, age and health status.Future work in this area must consider a study of the dietary intake and excretion of tritium bya few individual members of the public.
7. CONCLUSIONS
The following conclusions can be drawn:
• The exposed workers (A-H) recorded a higher ratio of cumulative fluid intakes (1.3 to2.0) from 5 to 37 d post-exposure relative to the fluid intake of Reference Man, exceptfor individuals A (1.0) and F (0.9).
• The average ratio of the daily volume of urine from 100 d to 300 d post-exposure, tothe expected daily volume of urine in the exposed individuals, was close to unity (0.93±0.14).
• The repeated analysis of one urine sample showed a satisfactory reproducibility for theHTO and OBT measurements, with a standard deviation of 4% and 20%, respectively.The sum of the HTO and OBT concentration in the urine sample was in goodagreement with the directly measured concentration of the total tritium-in-urine (± 2%).
• Measurements of total tritium-in-urine from the exposed individuals were obtained from4 h to 300 d post-exposure. Initially, the clearance of tritium-in-urine was analyzed bytaking into account the constant rate of fluid intake and urine excretion for eachexposed worker. A sum of three exponentials provided the best-fit parameter valuesfor all exposed workers. However, employing this form of analysis, the kinetic data oftritium-in-urine demonstrated noticeable differences in the values of our clearancekinetics and those from other studies (Section 3.1.1.1). We attribute this discrepancyto the fact that no account was taken of variable rates of fluid intake for the analysis ofthe tritium-in-urine data for our subjects.
• A kinetic theory of tritium clearance in urine was developed to account for an abruptchange in the rates of fluid intake and urine excretion of tritium from the exposedworkers at a particular time after exposure (tc). A bivariate bi-exponential function thatassumed an abrupt change in clearance kinetics time of intake to a time tc post-exposure was applied to the tritium-in-urine data. These functions also assumed that
33
the exposed workers had an increased levels of urinary excretion during the period inwhich they had increased fluid intakes.
The urinary excretion of tritium-in-urine data was fitted in the form:
a* w exp ( -A*w t ) + a0 exp ( -x o t ) t * tc
Cu(t) =
p ( - V ) + aoexp(-V) t > te
a*w, X*w and aw, 1^ are the kinetic parameters for a first component in abivariate bi-exponential function for time periods t < tc and t > tc, respectively.a0 and Xo, which is a common exponent term, represent the second-longestterm component and may be considered as representing the catabolism ofmetabolized OBT.
The contribution of the components representing the clearance of the body water, withaverage biological half-lives of 6.3 ± 1.0 d and 8.4 ± 2.0 d, accounted for more than99% of the excretion of tritium-in-urine.
The average biological half-life and the percentage value of the longer-termcomponent, where t < tc or t > tCl was 74 ± 18 d and 0.5± 0.2%, respectively.
Under the limited duration of this study (0-300 d post-exposure), the analysis of thedata did not show a very long-term excretion of tritium-in-urine, ranging from 139 d to2020 d, as reported by Sanders and Reinig (1968), Minder (1969), Moghissi andCarter (1971), Moghissi et al. (1972) and Bennet (1972).
The HTO-in-urine clearance kinetics are similar to that of total tritium-in-urine. Themeasurements of tritium-in-urine showed that HTO was the dominant form (>99% oftotal activity concentration) of tritium excreted in all post-exposure examinations.
A sum of two exponential functions was satisfactory for representing OBT kinetics inurine. The elimination of OBT-in-urine for two exposed workers (D and G) had abiological half-life for the first component of 4 to 5 d, and a second component of 63 to69 d.
The average half-life for the longer component of HTO-in-urine (64 d) is comparablewith the average half-life for the second component of OBT (69 d) for individuals Dand G. The close relationship between the longer term excretion of HTO-in-urine andOBT-in-urine may indicate that most of the HTO produced in the longer-termcomponent of OBT is a product of metabolised OBT.
The number of blood samples was between 2 to 4 for all workers studied, and wasinsufficient for kinetic analysis of tritium-in-blood. However, the results have providedinsight into the tritium level in the metabolic pool of the body. The HTO level in theblood of the exposed workers rapidly declined with time, while the OBT in blood
34
decreased more gradually. The ratio of HTO-in-blood to HTO-in-urine was close tounity. However, no relationship between tritium-in-blood and tritium-in-urine wasestablished for 100-300 d post-exposure, due to a large variability in the ratio of OBT-in-blood to OBT-in-urine. The reason for the wide range of distribution in the ratio ofOBT concentration in blood and urine is unknown, and may be because ofphysiological variability among the individuals.
The predominant tritiated species in feces from the exposed workers in the later periodof study (>100 d post-exposure) was HTO, and it varied between 73% and 94% of thetotal tritium-in-feces. The ratio of OBT (Bq«g"1 wet feces) to HTO (Bq«g"1 wet feces) infeces ranged between 0.06 to 0.55 from 100 d to 300 d post-exposure, with no trendwith time observable.
The concentration of HTO in feces and urine was shown to be in equilibrium with thebody water from samples obtained between 100 d and 300 d post-exposure. Acomparison of OBT-in-feces (Bq»g'1 wet feces) to OBT-in-urine (Bq«L'1) was made bycomparing the tritium activity per unit mass of organic matter (Bq*g"1 organic matter) infeces to that of urine. The ratio was 1.0 ± 0.1, and indicated that a similar level oforganically bound tritium is present per unit mass of excreta via the urinary and fecalpathways.
The average ratio of OBTblood to OBTurine in a unit mass of organic matter was 2.3 ± 0.5in samples obtained from the exposed workers (A-H) collected 100 d to 300 d post-exposure. This measured value is similar to the estimated value of 2.5 as estimatedfor the ratio of OBHbl00(J to OBHurtne per g of organic matter. The ratio of the measuredaverage value 2.3 of OBTblood to OBTunno to the estimated value 2.5 of OBTblood toOBTurine in a unit mass of organic matter is close to unity (0.92), indicating thatequilibrium conditions exist for tritium per gH in the body fluids after 100 d post-exposure.
The study has provided tritium measurement data for blood, urine and feces samplesfrom a controlled group of workers (I-L) that were chronically exposed to environmentallevel of tritium at Point Lepreau. These workers had no acute intake of HTO. Theanalysis of the samples showed that the measurable tritium activity in the blood, urineand feces was chiefly in the form of HTO.
A mathematical model was developed to estimate the dose from HTO and thefractional dose increase (A) from the metabolized OBT in the body, by examining thekinetics of total tritium-in-urine. The model recognizes that the dose is delivered to theentire soft tissue mass of the body and not just to the body water, and some of thetritium uptake from HTO incorporates into organic forms (OBT). The model assumesthat all the excreted tritium (HTO + OBT) comes from body fluids immediately beforeexcretion, via urine or other pathways. The model further assumes that the tritiumconcentration in body fluids is in equilibrium with the excreted concentration of tritium-in-urine and all activity excreted in the form of HTO. Evidence from records ofcumulative fluid intakes and a reanalysis of the data led to the refinement of themathematical model by accounting for the variable rates of fluid intake by the workers(Section 4.1.2).
35
The average A value was 0.062 ± 0.013, with a range of 0.035 to 0.089 for the eightexposed male workers. The error propagation in the A values was estimated from thecovariance matrix produced by the fitting parameters for each exposed worker. Theaverage percentage error value for the exposed workers was 26 ± 12%, with a rangeof from 10 to 40%. An overall uncertainty of 50% is assigned at a 95% confidencelevel.
This report has demonstrated that the OBT dose is in the range of 10% of total bodywater dose after HTO intake, for the eight male exposed workers (A-H) and thereforesupports the current understanding of HTO dosimetry.
8. RECOMMENDATIONS
The analysis of trititim measurements in urine from eight male exposed workers, after anacute HTO intake, resulted in dose contributions from metabolized OBT between 3.5% and8.9% of the total body water dose. This value for OBT dose fraction is in the range of currentdosimetric recommendations i.e., OBT pools in the soft tissue of the body contribute less than10% of the dose to the body water contained in national (Bioassay Guideline 2, Guidelines forTritium Bioassay, 1982) and international guidelines (ICRP, 1991). Nevertheless, furtherrefinement in the dosimetry of HTO intakes can be achieved, and we recommend that:
(a) a written protocol for collecting and submitting bioassay samples for the analysis oftotal tritium, HTO and OBT be prepared and be readily available in the event of anacute intake of high activity HTO (more than an ALI).
(b) the accuracy and sensitivity of tritium monitoring, especially for OBT in bioassaysamples, be improved to distinguish the shorter- and longer-term componentsattributed to OBT metabolism from the occupational level of chronic exposure totritium, and
(c) the current metabolic models be improved to relate accurately the information obtainedin this report. The analysis of biosamples has recognized that the current metabolicmodels for HTO are inappropriate and do not account for the level of OBT excretionfrom the body. A better understanding of OBT metabolism is needed to improve doseassessment for the general public.
9. ACKNOWLEDGMENTS
We owe much to Dr. R.G.C. McElroy, Manager, Radiation Biology and Health Physics Branch,for his advice and comments. He has contributed in many ways to this report. His mostimportant contribution was to the section on the dosimetry of OBT (Section 4.1.2.1).
The help from Dr. W. Davies (Nuclear Physics Branch), Mr. S. Douglas (Mathematics andComputation Branch) and Dr. P. Davis (Environmental Research Branch) during the course ofdata analysis and interpretation is duly acknowledged. We are also grateful toMr. S.H. Linauskas for his constructive suggestions throughout the course of this study. The
36
authors wish to acknowledge the contribution of members of the dosimetry and dose controlworking party of CANDU Owners Group (COG) in critically appraising an earlier version of thereport.
Technical help from Mr. J.W. Leon in improving the bioanalytical techniques for tritiummeasurement, and Mr. T. Duong's assistance in analyzing the biological samples, are dulyacknowledged.
Also, we are indebted to all individuals whose co-operation in obtaining the bioassay sampleswas indispensable. Deep appreciation is extended to the staff of the Health Physics Divisionof New Brunswick Power, Point Lepreau Generating Station, Point Lepreau, New Brunswick.
The Atomic Energy Control Board of Canada supported this work through contract AECB7.155.1.
10. REFERENCES
Balonov, M.I., Dolgirev, E.I. and Likhtarev, I.A. Exchange kinetics and dosimetry of tritiumoxide in man for different routes of administration. Health Phys., 1974, 27, 367-375.
Balonov, M.I. and Likhtarev, I.A. The metabolism of 3H compounds and limits for intakes byworkers. Health Phys., 1984, 47, 761-773.
Bard, ST . A re-evaluation of the use of bioassay data to determine tritium body burdens inman: chronic vs. acute exposure., 1978, IAEA-SM-232/52.
Belloni, P., Clémente, G.F., Di Pietro, S. and Ingrao, G. Tritium levels in blood and urinesamples of the members of the Italian general population and some exposed subjects.Radiât. Prot. Dosim., 1983, 4, 109-113.
Bennett, B.G. The radiation dose due to acute intake of tritium by man. USAEC Report, 1972,HASL-253.
Bhandal, G.S. and Singh, K. Effective atomic number studies in different biological samplesfor partial and total photon interactions in the energy region 10'3 to 105 Mev. Appl. Radiât.Isot., 1993, 44, 505-510.
Brown, R.M. The measurement of tritium in Canadian food items. AECB Info, in press.
Burnham, J.U. Radiation Protection. New Brunswick Power Corporation, Point LepreauGenerating Station, New Brunswick, Canada, 1992.
Bush, W.R. Assessing and controlling the hazard from tritiated water. AECL Report, ChalkRiver, AECL-4150, 1972.
Butler, H.L and LeRoy, J.H. Observations of biological half-life of tritium. Health Phys., 1965,11, 283-290.
37
Cahill, D.F. and Yuile, C.L Tritium: Some effects of continuous exposure in utero onmammalian development. Radiât. Res., 1970, 44, 727-737.
Cawley, C.H., Cannon, L.A. and Moschella, J.J. Models of tritium excretion followingprolonged occupational exposure. Health Phys., 1984, 47, 102-106.
Commerford, S.L., Carsten, A.L and Cronkite, E.P. The distribution of tritium among theamino acids of proteins obtained from mice exposed to tritiated water. Radiât. Res., 1983, 94,151-155.
Croach, J.W. Theoretical radiation dose to the human system from assimilated tritium. HealthPhys., 1973, 24, 17-22.
Diabaté, S. and Strack, S. Organically Bound Tritium. Health Physics, 1993, 65, 698-712.
Douglas, S. and Davies, W. Personal communication, Mathematics and Computation Branchand Nuclear Physics Branch, AECL Research, Chalk River, Canada, 1992.
Duong, T., Leon, J.W. and Trivedi, A. (1994) A method for organically bound tritiummeasurement in blood. Chalk River Laboratories, Chalk River, Ontario, Canada, COG-94-128.
Etnier, E.L., Travis, C.C. and Hetrick, D.M. Metabolism of Organically Bound Tritium in Man.Radiation Research, 1984, 100, 487-502.
Fallot, P., Aeberhardt, A. and Masson, J. Méthode de dosage de l'eau tritide et sesapplications en clinique humaine. Int. J. Appl. Radiât. Isotopes, 1957, 1, 237-245.
Federal/Provincial Working Group on Bioassay and in vivo Monitoring Criteria, BioassayGuideline 2, Guidelines for Tritium Bioassay. Health Protection Branch, Health and Welfare(Canada), 1982, 83-EHD-87.
Feinendegen, L.E., Cronkite, E.P. and Bond, V.P. Radiation problems in fusion energyproduction. Radiât. Environ. Biophys., 1980, 18, 157-183.
Foy, J.M. and Schneieden, H. Estimation of total body water (virtual tritium space) in the rat,cat, rabbit, guinea-pig and man, and of the biological half-life of tritium in man. J. Physiol.,1960, 18, 157-183.
Galeriu, D. and Trivedi, A. Dose Contribution from metabolized organically bound tritium aftertritiated water intake. Health Phys., 1994, 66, S73.
Geigy Scientific Tables, vol. 1, Units of Measurement, Body Fluids, Composition of the Body,Nutrition (Lentner, C , éd.), 1981, Ciba-Geigy Ltd, Basel, Switzerland.
Hatch, F.T. and Mazrimas, J.A. Tritiation of animals from tritiated water. Radiât. Res., 1972,50, 339-357.
38
Henry, P. Etude d'une contamination accidentelle par l'eau tritiee. ln,"Assessment ofRadioactive Contamination in Man", STI/PUB/290, 1972, IAEA (Vienna), pp. 641-657.
Hill, R.L and Johnson, J.R. Metabolism and Dosimetry of Tritium. Health Physics, 1993, 65,628-647.
International Atomic Energy Agency. Safe Handling of Tritium. Review of data andexperience. IAEA, Vienna, 1991, IAEA technical report series # 324.
International Commission on Radiation Protection. Reference Man: Anatomical, physiologicaland metabolic characteristics. ICRP Publication #23 (Report of the Task Group on ReferenceMan), Pergamon Press, New York, 1975.
International Commission on Radiation Protection. Recommendations of the InternationalCommission on Radiological Protection. ICRP Publication #26, Pergamon Press, New York,1977.
International Commission on Radiation Protection. Limits for intakes of Recommendations ofthe International Commission on Radiological Protection. ICRP Publication #30, PergamonPress, New York, 1979-1982.
International Commission on Radiation Protection. 1990 Recommendations of theInternational Commission on Radiological Protection. ICRP Publication #60, Pergamon Press,New York, 1991.
Jeanmaire, L. and Vernois, Y. Métabolisme de Molecules, Tritees chez le Rat. Etuse sourl'Angle de la Radioprotection. In,"Behaviour of Tritium in the Environment", STI/PUB/498,1979, IAEA (Vienna), pp. 453-462.
Johnson, ,'.R. The estimation of the effective dose equivalent from tritiated water exposuresusing tritium concentrations in urine. Radiât. Prot. Dosim., 1982, 2, 245-247.
Kowalska, M. Incorporation of tritiated water (HTO) and organically bound tritium (OBT) intoamino acids of rat brain. J. Radiât. Res., 1985, 25, 99-108.
La Bone, T.R. Internal dosimetry of tritium. Presented at 37th annual Health Physics SocietyMeeting at Columbus, Ohio; Westinghouse Savannah River Company, Savannah River Site,South Carolina, USA, WSRC-MS-92-072, 1992.
Lambert, B.E. Cytological damage produced in the mouse testis by tritiated water, tritiatedthymidine and X-rays. Health Phys., 1969, 17, 547-557.
Lambert, B.E., Sharpe, B.A. and Dawson, K.B. An accidental intake of tritiated water. Am.Ind. Hygiene Assoc. J., 1971, 32, 682-686.
Lloyd, D.C., Edwards, A.A. and Prosser, J.S. Accidental intake of tritiated water: a report oftwo cases. Radiât. Prot. Dosim., 1986, 15, 191-196.
39
Matasudaria, H. Effect of tritium in mammals. Radial Prot. Dosim., 1986, 16, 173-174.
Mathur-De Vre, R. and Binet, J. Molecular aspects of tritiated water and natural water inradiation biology. Prog. Biophys. Mole. Biol., 1984, 43, 161-193.
Minder, W. Internal contamination with tritium. Strahlentherapie, 1969, 137, 700-704.
Moghissi, A.A. and Carter, M.W. Long-term evaluation of the biological half-life of tritium.Health Phys., 1971, 21, 57-60.
Moghissi, A.A., Carter, M.W. and Lieberman, R. Further studies on the long-term evaluationof the biological half-life of tritium. Health Phys., 1972, 23, 805-806.
Moore, F.D., Olesen, K.H., McMurrey, HJ.D., Parker, H.V., Ball, M.R. and Boyden, C M . Thebody cell mass and its supporting environment, W.B. Saunders, Philadelphia and London,1963.
Myers, D.K. and Johnson, J.R. Toxicity and dosimetry of tritium. A review for the CanadianAdvisory Committee on Radiological Protection, Atomic Energy Control Board, Ottawa, 1991,lnfo-0377.
National Council on Radiation Protection and Measurements. Tritium and other RadionuclideLabelled Organic Compounds Incorporated in Genetic Material. National Council on RadiationProtection and Measurements, Washington, 1979, NCRP Report #63.
O'Donnell, J. Letter to Dr. J.R. Johnson, 1991 February 2, Health Physicist, NB Power, PointLepreau, New Brunswick, Canada.
Osborne, R.V. Absorption of tritiated water vapour by people. Health Phys., 1966, 12, 1527-1537.
Osborne, R.V. Permissible levels of tritium in man and the environment. Radiât. Res., 1972,50, 197-211.
Paciga, J.J. and Skinner, M.A. A case of high tritium uptakes by eight people. Health Phys.,1991,60, 737 (Abstract).
Pietrzak-Flis, Z., Radwan, I. and Indeka, L. Tritium in rabbits after ingestion of freeze-driedtritiated food and tritiated water. Radiât. Res., 1978, 76, 420-428.
Pinson, E.A., Anderson, E.C. and Lotz, V. The specific activity of tritium in the organiccomponents of the skin and fat of man following eight months' chronic exposure to HTO inbody fluids. USAEC Report LA-1468, 1952.
Pinson, E.A. and Langham, W.H. Physiology and toxicology of tritium in man. Health Phys.,1980,38, 1087-1110.
40
Richmond, C. R., Landham, W.H. and Trujillo, T.T. Comparative metabolism of tritiated waterby mammals. J. Cell Comparative Physiol., 1962, 59, 45-53.
Rochalska, M. and Szot, A. The incorporation of organically bound tritium of food into someorgans of the rat. Int. J. Radiat. Biol., 1977, 31, 391-395.
Rodgers, D.W. Tritium dynamics in mice exposed to tritiated water and diet. Health Phys.,1992, 63, 331-337.
Rohwer, P.S. and Wilcox, H.W. Radiological aspects of environmental tritium. Nucl. Saf.,1976, 17, 216-222.
Rudran, K., Significance of in vivo organic binding of tritium following intake of tritiated water.Radiat. Prot. Dosim., 1988, 25, 5-13.
Rudran, K., Sawant, J.V., Thampan, S. and Banera, V.S. Assessment of intakes and radiationdoses following exposure to tritiated water. Proc. 8th Int. Radiat. Protec. Assoc, Montreal,1992, 1, 1018-1021.
Sanders, S.M. Jr. and Reinig, W.C. Assessment of tritium in man. In "Diagnosis andTreatment of Deposited Radionuclides", 1968, Excerpta Medica Foundation, Amsterdam, pp.534-542.
Saito, M. A Modified Three-Compartment Model for Tritium Metabolism in Man. Radiat. Prot.Dosim., 1992, 42, 17-24.
Sandarangani, S.H., Sahasrabudhe, S.G. and Soman, S.D. Tritium excretion in man undertropical conditions. In: "Tritium" (Moghissi, A.A. and Carter, M.W., eds.), MessengerGraphics, Phoenix, Arizona, USA, pp. 327-333, 1971.
Smith, L.R., Brantley, D.D., Swain, K.A. and Dennis, D.A. Human excretion patterns followingoccupational uptake of 3H-, 14C-, and 35S-labelled compounds. Health Phys., 1983, 44, 221-234.
Smith, T.E. and Taylor, R.T. Incorporation of tritium from tritiated water into carbohydrates,lipids and nucleic acid. Lawrence Livermore Radiation Laboratory, Livermore, USA, ReportUCRL-50781, 1969.
Snyders. W.S., Fish, B.R., Bernard, S.R., Ford, M.R. and Muir, J.R. Urinary excretion oftritium following exposure of man to HTO- a two exponential model. Phys. Med. Biol., 1968,13, 547-559.
Takeda, H. Incorporation and distribution of tritium in rats after chronic exposure to varioustritiated compounds. Int. J. Radiat. Biol., 1991, 59, 843-853.
Taylor, D.M. An approach to the proposal of an annual limit of intake for the general public fororganically bound tritium. Radiat. Prot. Dosim., 1989, 28, 211-213.
41
Taylor, D.M., Moroni, J.P., Snihs, J.-O. and Richmond, C.R. The metabolism of 3H and 14Cwith special reference to radiation protection. Radiât. Prot. Dosim., 1990, 30, 87-93.
Thompson, R.C. and Ballou, J.E. Studies of metabolic turnover with tritium as a tracer. V. Thepredominantly non-dynamic state of body constituents in the rat. J. Biol. Chem., 1956, 223,795- 809.
Till, J.E., Meyer, H.R., Etnier, E.L, Bomar, E.S., Gentry, R.D., Killough, G.G., Rohwer, P.S.,Tennery, V.J. and Travis, C.C. Tritium - an analysis of key environmental and dosimetricquestions. ORNUTM-6990, 1980.
Trivedi, A., Duong, T., Leon J.W. and Linauskas, S.H. Measurement of organically boundtritium in urine and fèces. AECL Report, AECL-10925/COG-93-313, 1993.
Trivedi, A. and DudYig, T. (1993) An evaluation of an organically bound tritium measurementmethod in artificial and natural urine. AECL Report, AECL-10802/COG-93-101, 1993.
Trivedi, A. and Galeriu, D. (1993) Limitations of Metabolic Models for Tritiated Water Intake. Apresentation given at Health Physics Division, Bhabha Atomic Research Centre, Bombay on1993 December3.
Trivedi, A., Horvath, F. and McElroy, R.G.C. Kinetics of tritium excretion following an acuteintake of tritiated water. Health Phys., 1993, 64, S77.
Van den Hoek, J. Tritium metabolism in animals. Radiât. Prot. Dosim., 1986, 16, 117-121.
White, D.R., Widdowson, E.M., Woodard, H.Q. and Dickerson, J.W.T. The composition of softtissues. (II). Fetus to young adult. British J. Radiology, 1991, 64, 149-159.
Wylie, K.F., Bigler, W.A. and Grove, G.R. Biological half-life of tritium. Health Phys., 1963, 9,911-914.
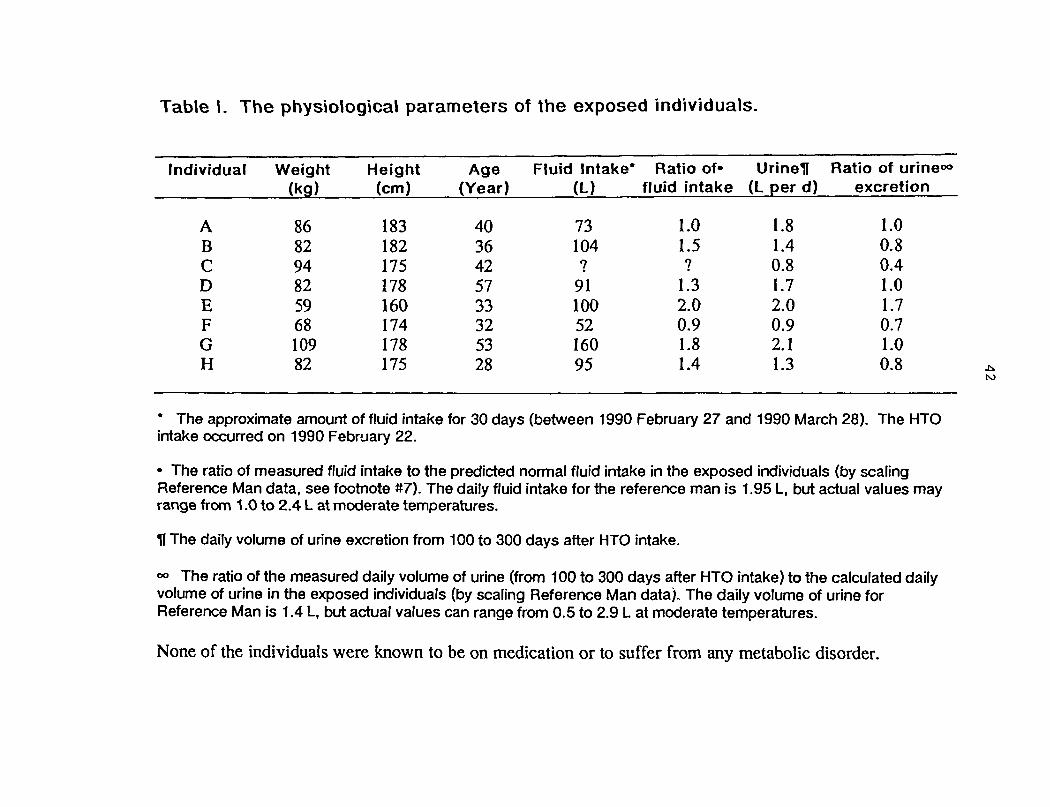
Table l. The physiological parameters of the exposed individuals.
Individual Weight Height Age Fluid Intake* Ratio of- Urineil(kgj (cm) (Year) (L) fluid intake (L per d)
Ratio of urine00
excretion
ABCDEFGH
86829482596810982
183182175178160174178175
4036425733325328
73104?911005216095
1.01.5?1.32.00.91.81.4
1.81.40.81.72.00.92.11.3
1.00.80.41.01.70.71.00.8
to
* The approximate amount of fluid intake for 30 days (between 1990 February 27 and 1990 March 28). The HTOintake occurred on 1990 February 22.
• The ratio of measured fluid intake to the predicted normal fluid intake in the exposed individuals (by scalingReference Man data, see footnote #7). The daily fluid intake for the reference man is 1.95 L, but actual values mayrange from 1.0 to 2.4 L at moderate temperatures.
H The daily volume of urine excretion from 100 to 300 days after HTO intake.
°° The ratio of the measured daily volume of urine (from 100 to 300 days after HTO intake) to the calculated dailyvolume of urine in the exposed individuals (by scaling Reference Man data). The daily volume of urine forReference Man is 1.4 L, but actual values can range from 0.5 to 2.9 L at moderate temperatures.
None of the individuals were known to be on medication or to suffer from any metabolic disorder.
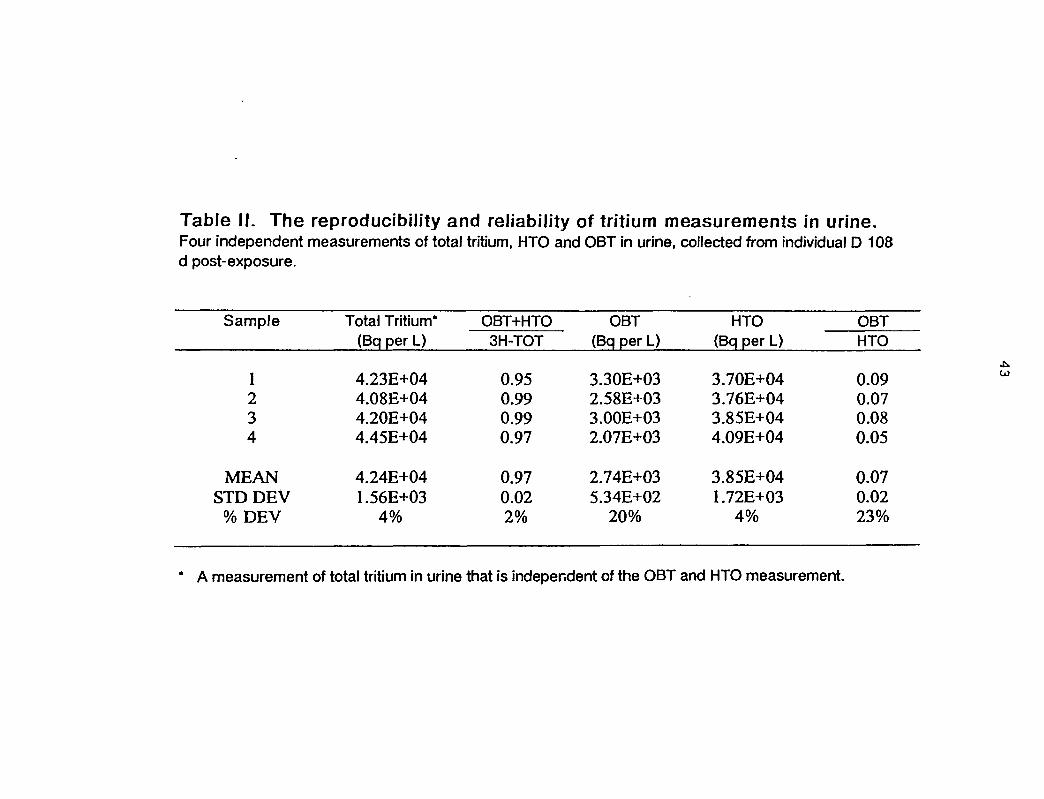
Table II. The reproducibility and reliability of tritium measurements in urine.Four independent measurements of total tritium, HTO and OBT in urine, collected from individual D 108d post-exposure.
Sample
1234
MEANSTD DEV
% DEV
Total Tritium*(Bq per L)
4.23E+044.08E+044.20E+044.45E+04
4.24E+041.56E+03
4%
OBT+HTO3H-TOT
0.950.990.990.97
0.970.022%
OBT(Bq per L)
3.30E+032.58E+033.00E+032.07E+03
2.74E+035.34E+02
20%
HTO(Bq per L)
3.70E+043.76E+043.85E+044.09E+04
3.85E+041.72E+03
4%
OBTHTO
0.090.070.080.05
0.070.0223%
A measurement of total tritium in urine that is independent of the OBT and HTO measurement.
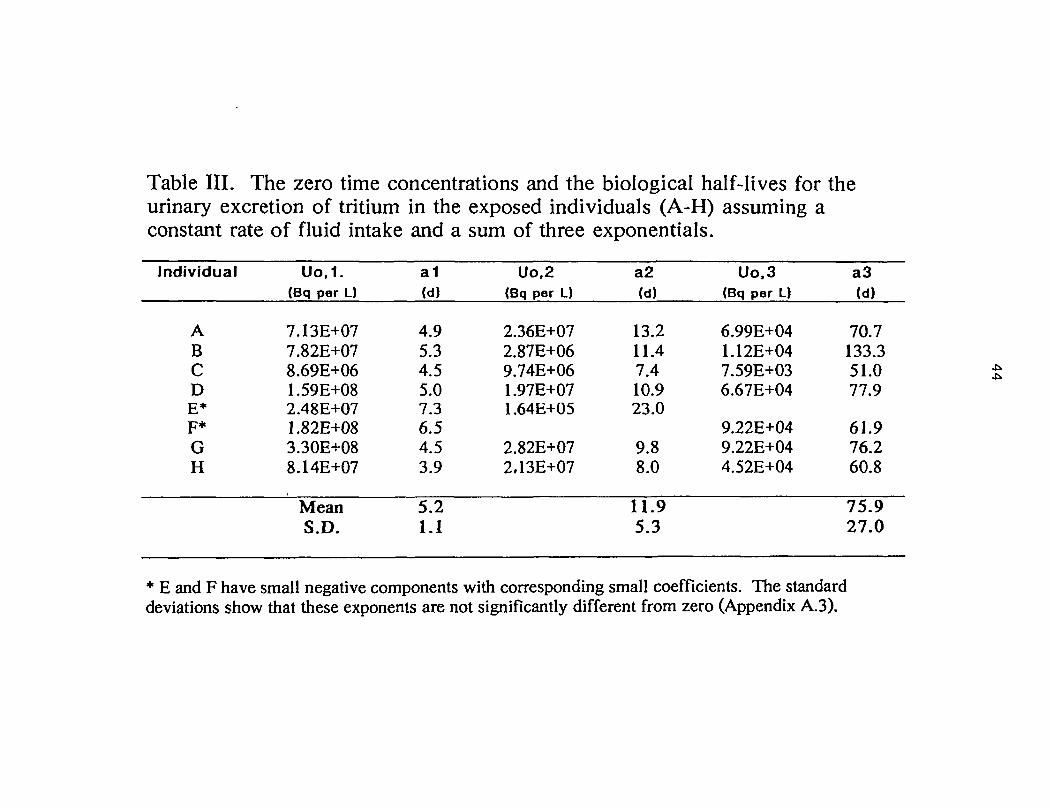
Table III. The zero time concentrations and the biological half-lives for theurinary excretion of tritium in the exposed individuals (A-H) assuming aconstant rate of fluid intake and a sum of three exponentials.
Individual
ABCDE*F*GH
Uo,1.(Bq per L)
7.13E+077.82E+078.69E+061.59E+082.48E+071.82E+083.30E+088.14E+07
MeanS.D.
a1(d)
4.95.34.55.07.36.54.53.9
5.21.1
Uo,2(Bq per L)
2.36E+072.87E+069.74E+061.97E+071.64E+05
2.82E+072.13E+07
a2(d)
13.211.47.410.923.0
9.88.0
11.95.3
Uo.3(Bq per L)
6.99E+041.12E+047.59E+036.67E+04
9.22E+049.22E+044.52E+04
a3(d)
70.7133.351.077.9
61.976.260.8
75.927.0
* E and F have small negative components with corresponding small coefficients. The standarddeviations show that these exponents are not significantly different from zero (Appendix A.3).
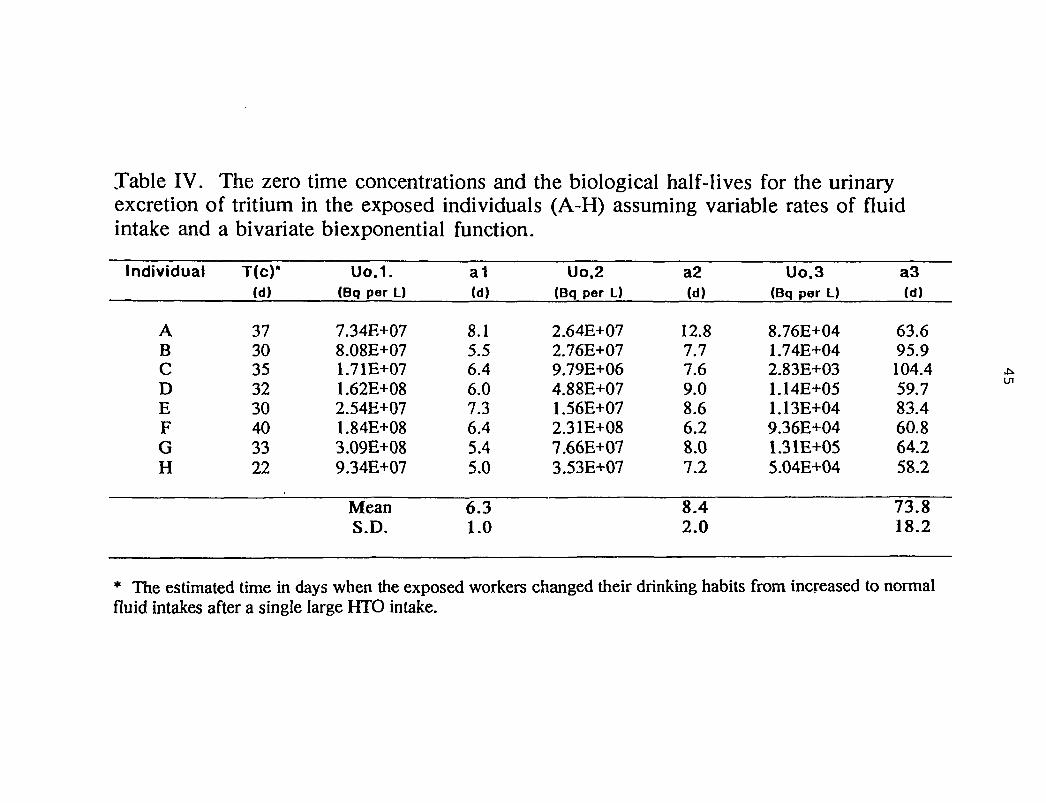
Table IV. The zero time concentrations and the biological half-lives for the urinaryexcretion of tritium in the exposed individuals (A-H) assuming variable rates of fluidintake and a bivariate biexponential function.
Individual
ABCDEFGH
T(c)-(d)
3730353230403322
Uo.1.(Bq per L)
7.34E+078.08E+071.71E+071.62E+082.54E+071.84E+083.09E+089.34E+07
MeanS.D.
a1(d)
8.15.56.46.07.36.45.45.0
6.31.0
Uo.2(Bq per L)
2.64E+072.76E+079.79E+064.88E+071.56E+072.31E+087.66E+073.53E+07
a2(d)
12.87.77.69.08.66.28.07.2
8.42.0
Uo.3(Bq per L)
8.76E+041.74E+042.83E+031.14E+051.13E+049.36E+041.31E+055.04E+04
a3(d)
63.695.9104.459.783.460.864.258.2
73.818.2
* The estimated time in days when the exposed workers changed their drinking habits from increased to normalfluid intakes after a single large HTO intake.
UI
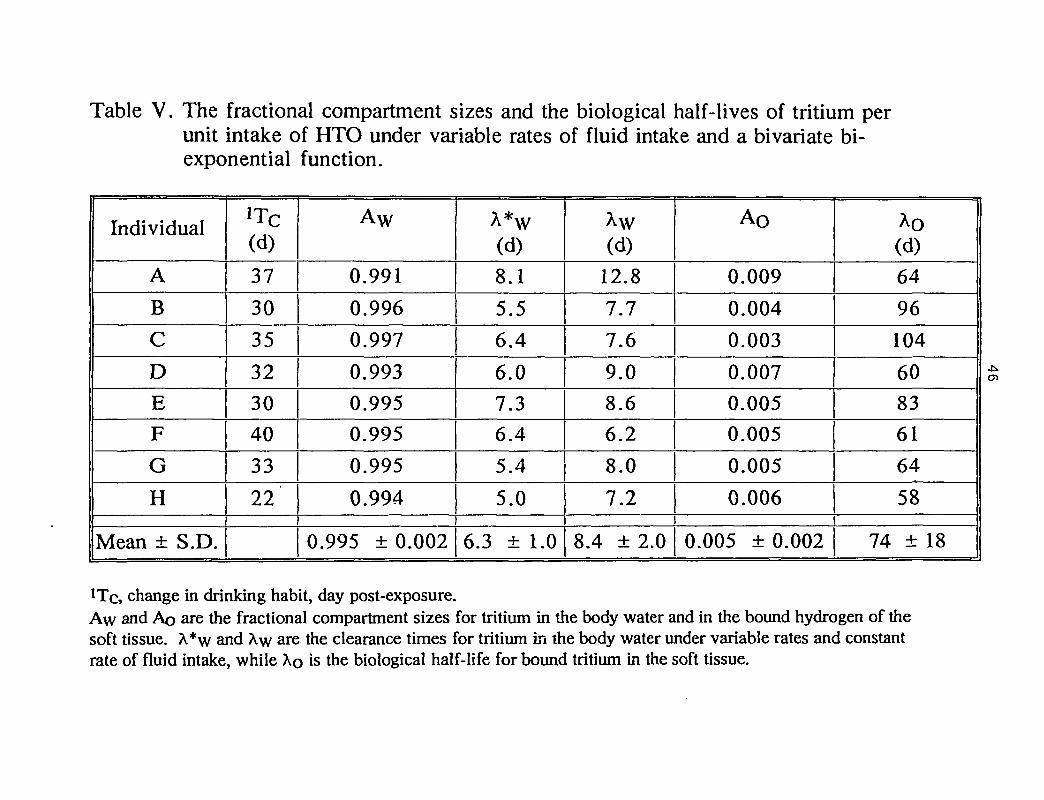
Table V. The fractional compartment sizes and the biological half-lives of tritium perunit intake of HTO under variable rates of fluid intake and a bivariate bi-exponential function.
Individual
A
B
C
D
E
F
G
H
Mean ± S.D.
(d)
37
30
35
32
30
40
33
22
Aw
0.991
0.996
0.997
0.993
0.995
0.995
0.995
0.994
0.995 ±0.002
À*w(d)
8.1
5.56.4
6.0
7.3
6.4
5.4
5.0
6.3 ± 1.0
À\v(d)
12.8
7.7
7.6
9.0
8.6
6.2
8.0
7.2
8.4 ± 2.0
Ao
0.009
0.004
0.003
0.007
0.005
0.005
0.005
0.006
0.005 ± 0.002
Ao(d)64
96
104
60
83
61
64
58
74 ± 18
, change in drinking habit, day post-exposure.Aw and Ao are the fractional compartment sizes for tritium in the body water and in the bound hydrogen of thesoft tissue. X*w and Xw are the clearance times for tritium in the body water under variable rates and constantrate of fluid intake, while XQ is the biological half-life for bound tritium in the soft tissue.
CD
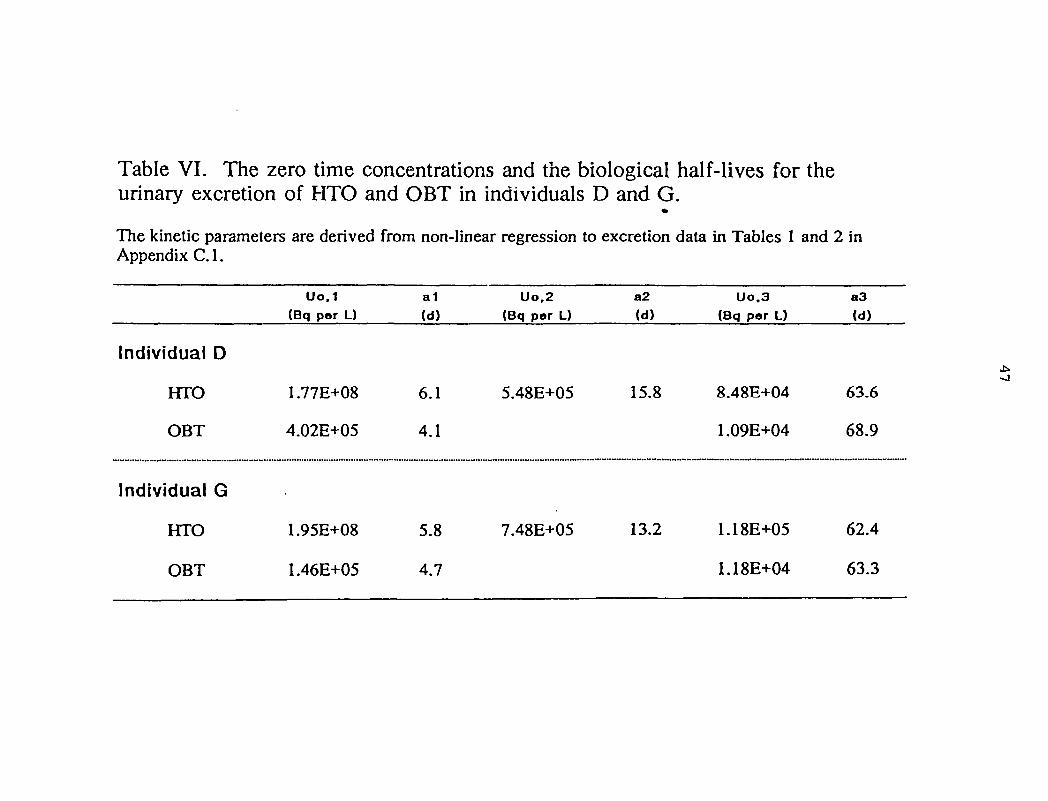
Table VI. The zero time concentrations and the biological half-lives for theurinary excretion of HTO and OBT in individuals D and G.
The kinetic parameters are derived from non-linear regression to excretion data in Tables 1 and 2 inAppendix C.I.
Individual D
HTO
OBT
Individual G
HTO
OBT
Uo.1(Bq per L)
1.77E+08
4.02E+05
1.95E+08
1.46E+05
a1(d)
6.1
4.1
5.8
4.7
Uo.2(Bq per L)
5.48E+05
7.48E+05
a2
(d)
15.8
13.2
Uo.3(Bq per L)
8.48E+04
1.09E+04
1.18E+05
1.18E+04
a 3(d)
63.6
68.9
62.4
63.3
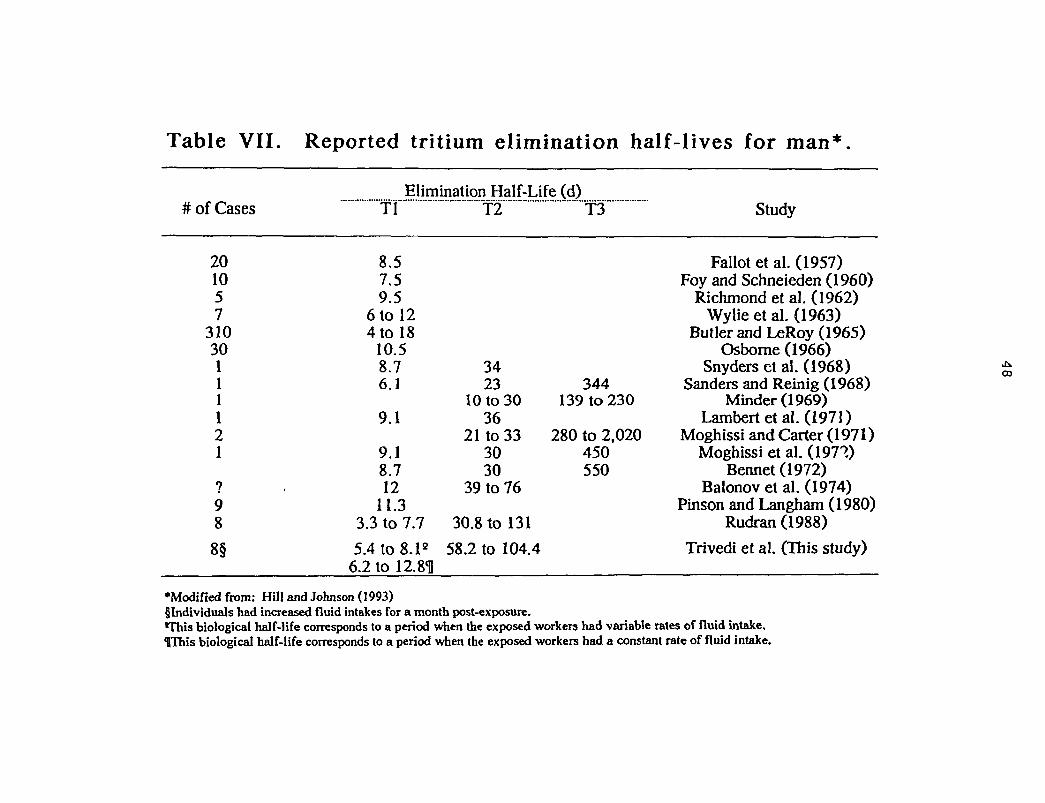
Table VII. Reported tritium elimination half-lives for man*
# of CasesElimination Half-Life (d)
201057
31030111121
98
8§
Tl
8.57.59.5
6 to 124 to 18
10.58.76.1
9.1
9.18.712
11.33.3 to 7.7
5.4 to 8.1e
6.2 to 12.811
T2
3423
10 to 3036
21 to 333030
39 to 76
30.8 to 131
58.2 to 104.4
T3
344139 to 230
280 to 2,020450550
Study
Fallot et al. (1957)Foy and Schneieden (1960)
Richmond et al. (1962)Wylie et al. (1963)
Butler and LeRoy (1965)Osborne (1966)
Snyders et al. (1968)Sanders and Reinig (1968)
Minder (1969)Lambert et al. (1971)
Moghissi and Carter (1971)Moghissi et al. (197?)
Bennet (1972)Balonov et al. (1974)
Pinson and Langham (1980)Rudran (1988)
Trivedi et al. (This study)
•Modified from: Hill and Johnson (1993)§ Individuals had increased fluid intakes for a month post-exposure.This biological half-life corresponds to a period when the exposed workers had variable rates of fluid intake.IThis biological half-life corresponds to a period when the exposed workers had a constant rate of fluid intake.
ra
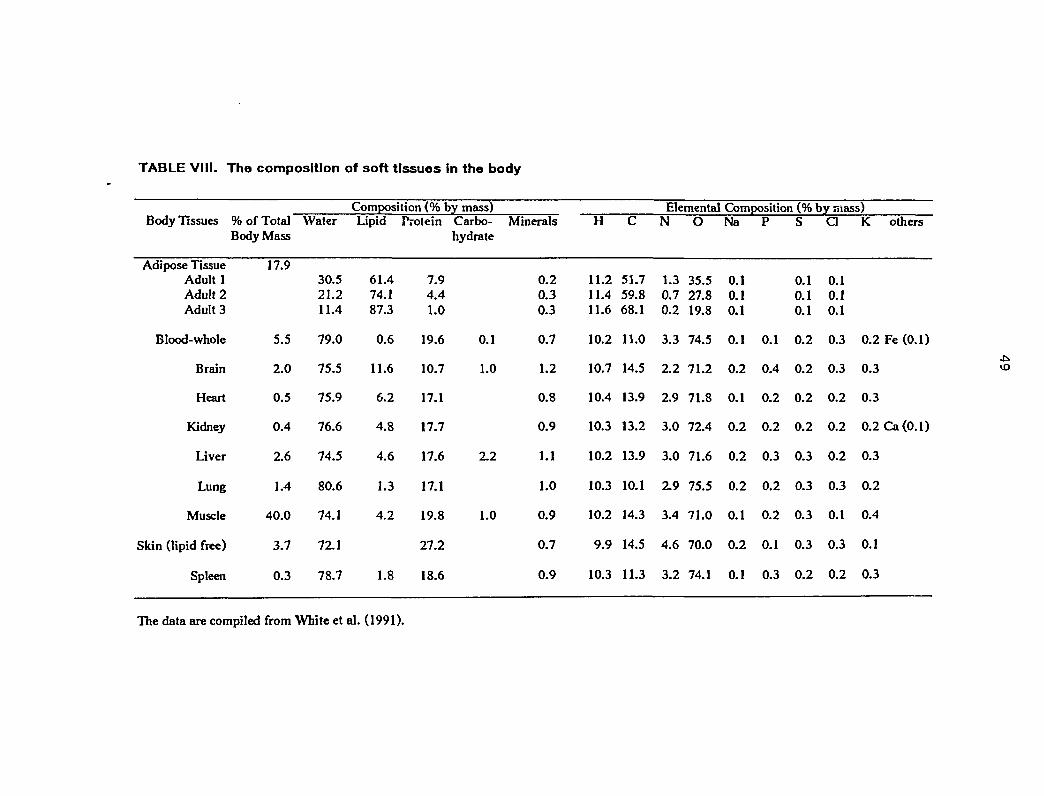
TABLE VIII. The composition of soft tissues in the body
Composition (% by mass) Elemental Composition (% by mass)H C N O N a P S C 1 K others
11.2 51.7 1.3 35.5 0.1 0.1 0.111.4 59.8 0.7 27.8 0.1 0.1 0.1
11.6 68.1 0.2 19.8 0.1 0.1 0.1
10.2 11.0 3.3 74.5 0.1 0.1 0.2 0.3 0.2 Fe (0.1)
10.7 14.5 2.2 71.2 0.2 0.4 0.2 0.3 0.3
10.4 13.9 2.9 71.8 0.1 0.2 0.2 0.2 0.3
10.3 13.2 3.0 72.4 0.2 0.2 0.2 0.2 0.2 Ca (0.1)
10.2 13.9 3.0 71.6 0.2 0.3 0.3 0.2 0.3
10.3 10.1 2.9 75.5 0.2 0.2 0.3 0.3 0.2
10.2 14.3 3.4 71.0 0.1 0.2 0.3 0.1 0.4
9.9 14.5 4.6 70.0 0.2 0.1 0.3 0.3 0.1
10.3 11.3 3.2 74.1 0.1 0.3 0.2 0.2 0.3
Body Tissues
Adipose TissueAdult 1Adult 2Adult 3
Blood-whole
Brain
Heart
Kidney
Liver
Lung
Muscle
Skin (lipid free)
Spleen
% of TotalBody Mass
17.9
5.5
2.0
0.5
0.4
2.6
1.4
40.0
3.7
0.3
Water
30.521.211.4
79.0
75.5
75.9
76.6
74.5
80.6
74.1
72.1
78.7
Lipid
61.474.187.3
0.6
11.6
6.2
4.8
4.6
1.3
4.2
1.8
Protein
7.94.41.0
19.6
10.7
17.1
17.7
17.6
17.1
19.8
27.2
18.6
Carbo-hydrate
0.1
1.0
2.2
1.0
Minerals
0.20.30.3
0.7
1.2
0.8
0.9
1.1
1.0
0.9
0.7
0.9
The data are compiled from White et al. (1991).
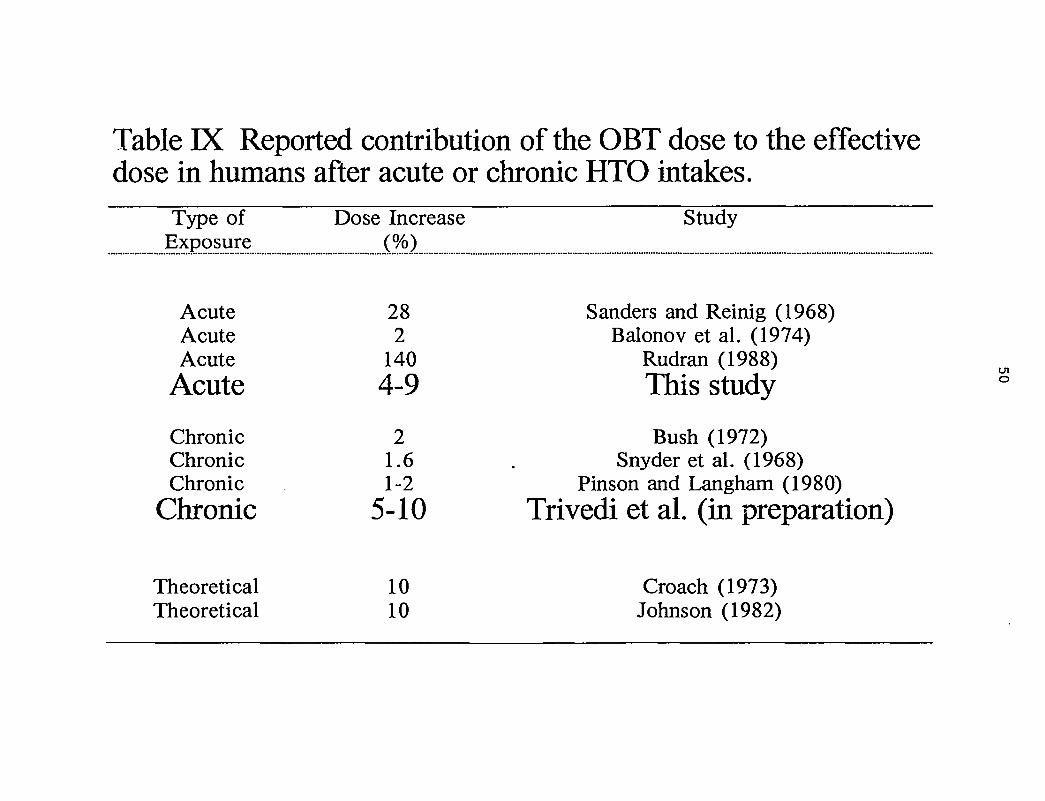
Table IX Reported contribution of the OBT dose to the effectivedose in humans after acute or chronic HTO intakes.
Type ofExposure
AcuteAcuteAcute
Acute
ChronicChronicChronic
Chronic
TheoreticalTheoretical
Dose Increase(%)
282
1404-9
21.61-2
5-10
1010
Study
Sanders and Reinig (1968)Balonov et al. (1974)
Rudran (1988)This study °
Bush (1972)Snyder et al. (1968)
Pinson and Langham (1980)Trivedi et al. (in preparation)
Croach (1973)Johnson (1982)
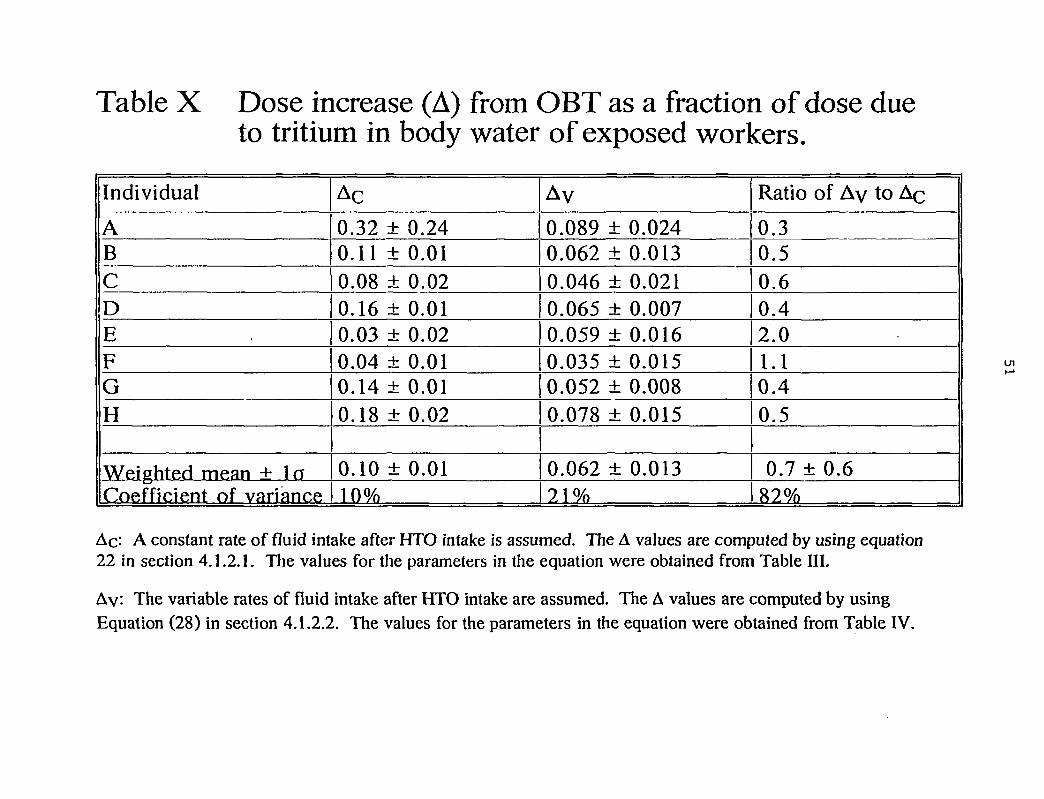
Table X Dose increase (A) from OBT as a fraction of dose dueto tritium in body water of exposed workers.
Individual
ABCDEFGH
Weighted mean + laCoefficient of variance
Ac
0.32 ± 0.240.11 ± 0.010.08 ± 0.020.16 ± 0.010.03 ± 0.020.04 ± 0.010.14 ± 0.010.18 ± 0.02
0.10 ± 0.0110%
AV
0.089 ± 0.0240.062 ± 0.0130.046 ± 0.0210.065 ± 0.0070.059 ± 0.0160.035 ± 0.0150.052 ± 0.0080.078 ± 0.015
0.062 ± 0.01371 %
Ratio of Ay to Ac
0.30.50.60.42.01.10.40.5
0.7 ± 0.682%
Ac: A constant rate of fluid intake after HTO intake is assumed. The À values are computed by using equation22 in section 4.1.2.1. The values for the parameters in the equation were obtained from Table III.
Ay: The variable rates of fluid intake after HTO intake are assumed. The A values are computed by usingEquation (28) in section 4.1.2.2. The values for the parameters in the equation were obtained from Table IV.
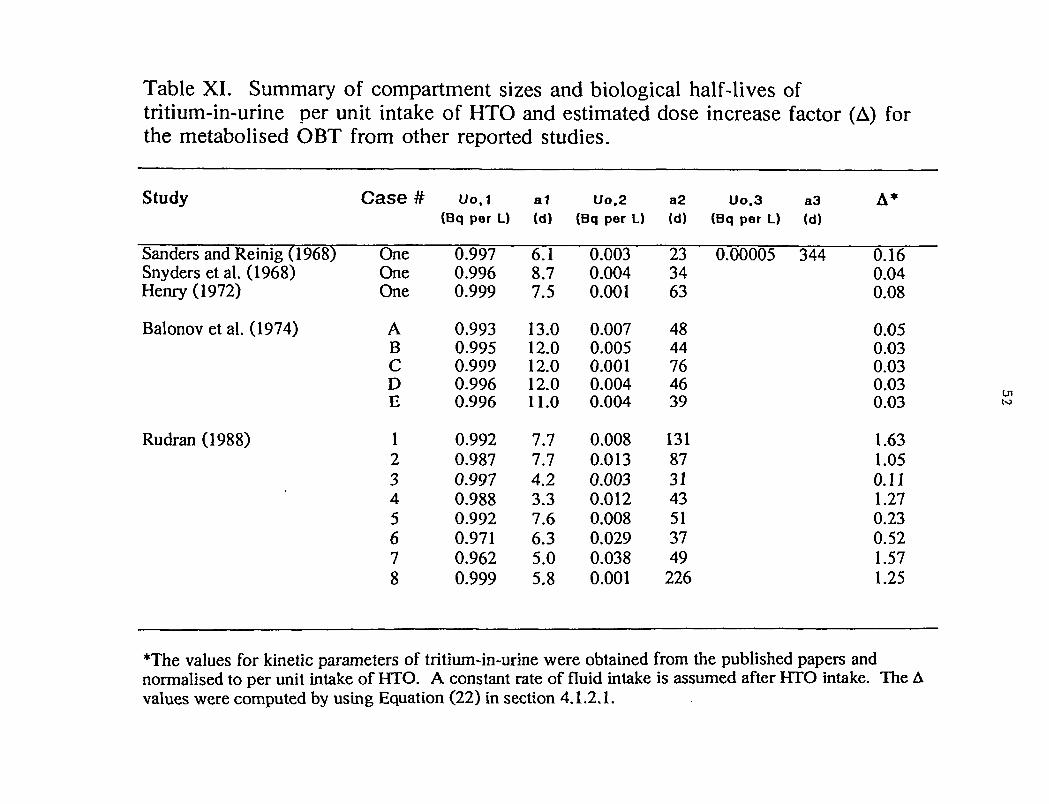
Table XI. Summary of compartment sizes and biological half-lives oftritium-in-urine per unit intake of HTO and estimated dose increase factor (A) forthe metabolised OBT from other reported studies.
Study
Sanders and Reinig (1968)Snyders et al. (1968)Henry (1972)
Balonov et al. (1974)
Rudran (1988)
Case #
OneOneOne
ABCDE
12345678
Uo.1(Bq per L)
0.9970.9960.999
0.9930.9950.9990.9960.996
0.9920.9870.9970.9880.9920.9710.9620.999
a1(d)
6.18.77.5
13.012.012.012.011.0
7.77.74.23.37.66.35.05.8
Uo.2(Bq per L)
0.0030.0040.001
0.0070.0050.0010.0040.004
0.0080.0130.0030.0120.0080.0290.0380.001
a2 Uo.3 a3(d) (Bq per L) (d)
23 0.00005 3443463
4844764639
131873143513749
226
A*
0.160.040.08
0.050.030.030.030.03
1.631.050.111.270.230.521.571.25
T h e values for kinetic parameters of tritium-in-urine were obtained from the published papers andnormalised to per unit intake of HTO. A constant rate of fluid intake is assumed after HTO intake. The Avalues were computed by using Equation (22) in section 4.1.2.1.
U l
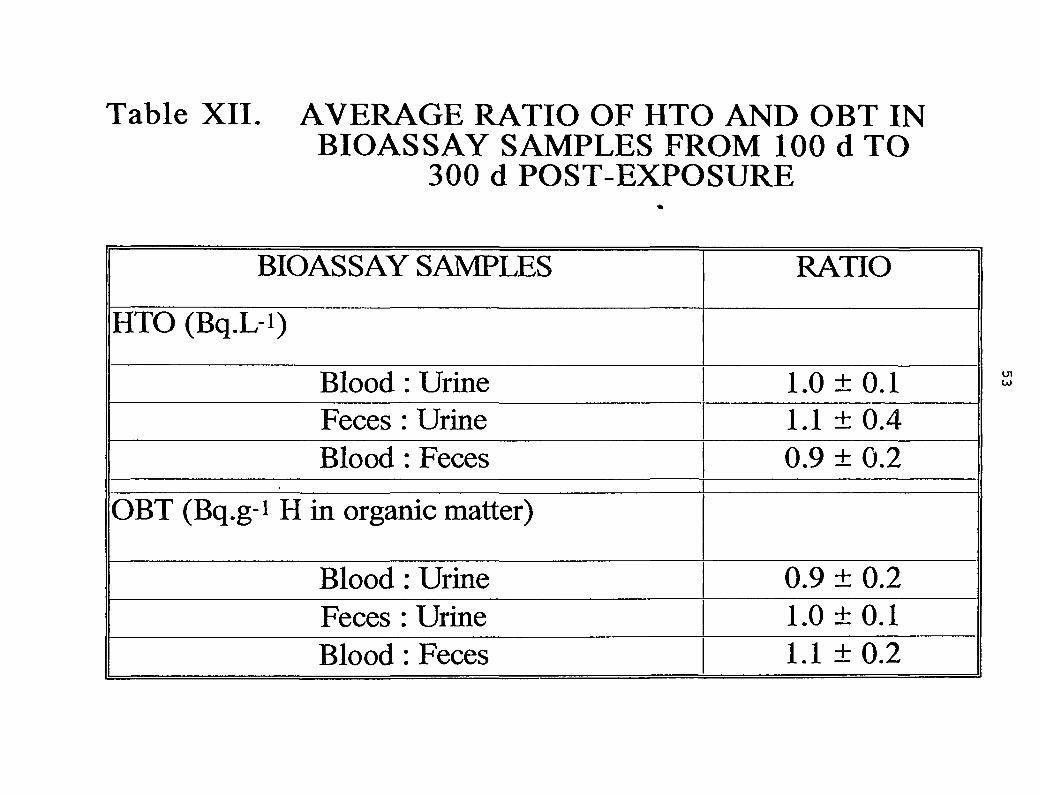
Table XII. AVERAGE RATIO OF HTO AND OBT INBIOASSAY SAMPLES FROM 100 d TO
300 d POST-EXPOSURE
BIOASSAY SAMPLES
HTO (Bq.L-i)
Blood : UrineFeces : UrineBlood : Feces
OBT (Bq.g1 H in organic matter)
Blood : UrineFeces : UrineBlood : Feces
RATIO
1.0 ±0.11.1 ± 0.40.9 ± 0.2
0.9 ± 0.21.0 ±0.11.1 ± 0.2
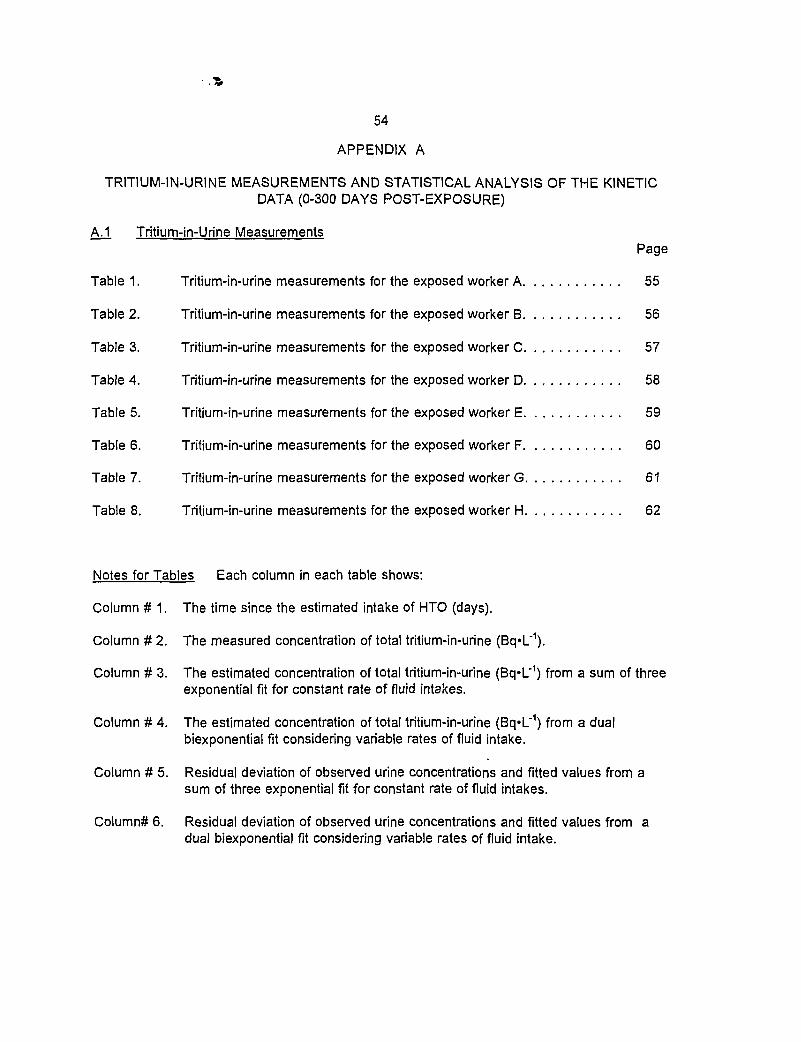
54
APPENDIX A
TRITIUM-IN-URINE MEASUREMENTS AND STATISTICAL ANALYSIS OF THE KINETICDATA (0-300 DAYS POST-EXPOSURE)
A.1 Tritium-in-Urine Measurements
Page
Table 1. Tritium-in-urine measurements for the exposed worker A 55
Table 2. Tritium-in-urine measurements for the exposed worker B 56
Table 3. Tritium-in-urine measurements for the exposed worker C 57
Table 4. Tritium-in-urine measurements for the exposed worker D 58
Table 5. Tritium-in-urine measurements for the exposed worker E 59
Table 6. Tritium-in-urine measurements for the exposed worker F 60
Table 7. Tritium-in-urine measurements for the exposed worker G 61
Table 8. Tritium-in-urine measurements for the exposed worker H 62
Notes for Tables Each column in each table shows:
Column # 1. The time since the estimated intake of HTO (days).
Column # 2. The measured concentration of total tritium-in-urine (Bq«L"1).
Column # 3. The estimated concentration of total tritium-in-urine (Bq*L'1) from a sum of threeexponential fit for constant rate of fluid intakes.
Column # 4. The estimated concentration of total tritium-in-urine (Bq«L"1) from a dualbiexponential fit considering variable rates of fluid intake.
Column # 5. Residual deviation of observed urine concentrations and fitted values from asum of three exponential fit for constant rate of fluid intakes.
Column# 6. Residual deviation of observed urine concentrations and fitted values from adual biexponential fit considering variable rates of fluid intake.
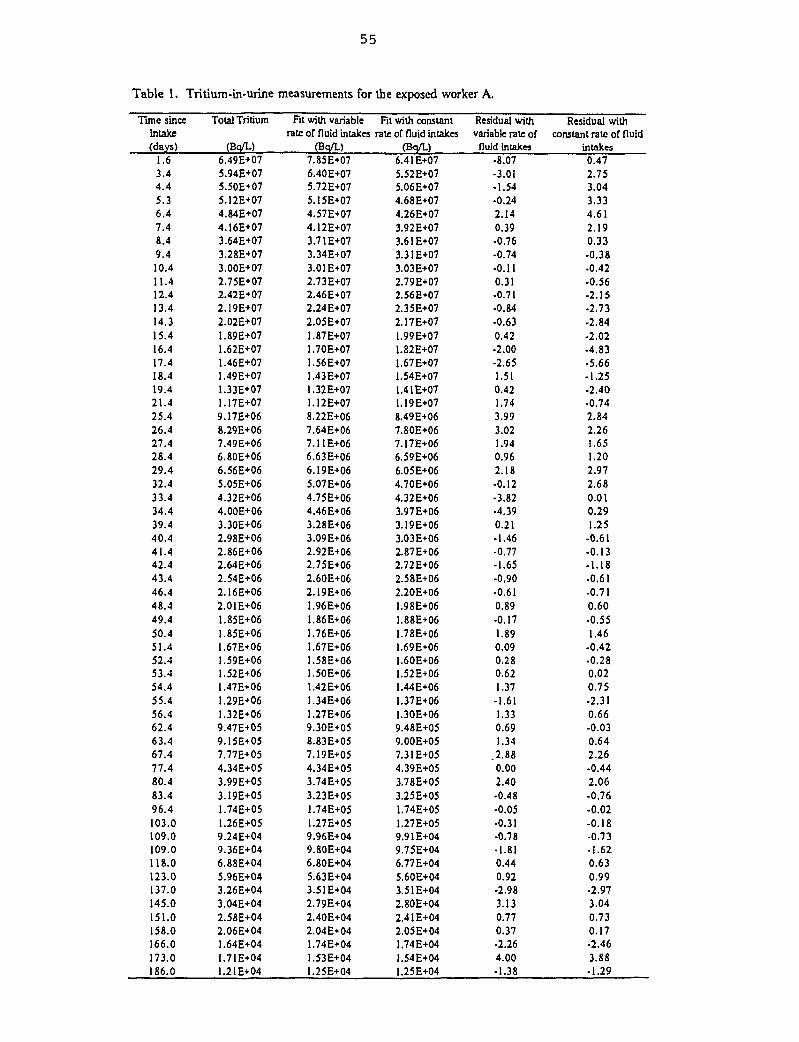
55
Table 1. Tritium-in-urine measurements for the exposed worker A.
Time sinceintake(days)
1.63.44.45.36.47.48.49.410.411.412.413.414.315.416.417.418.419.421.425.426.427.428.429.432.433.434.439.440.441.442.443.446.448.449.450.451.452.453.454.455.456.462.463.467.477.480.483.496.4103.0109.0109.0118.0123.0137.0145.0151.0158.0166.0173.0186.0
Total Tritium
(Bq/L)6.49E+075.94E+075.50E+075.12E+074.84E+074.16E+073.64E+073.28E+073.00E+072.75E+072.42E+072.19E+072.02E+071.89E+071.62E+071.46E+071.49E+071.33E+071.17E+079.17E+068.29E+067.49E+066.80E+066.56E+065.05E+064.32E+064.00E+063.3OE+O62.98E+062.86E+062.64E+062.54E+062.16E+062.01E+061.85E+061.85E+061.67E+061.59E+O61.52E+061.47E+061.29E+O61.32E+O69.47E+059.15E+057.77E+054.34E+053.99E+O53.19E+O51.74E+051.26E+O59.24E+049.36E+046.88E+045.96E+O43.26E+043.04E+042.58E+042.06E+041.64E+041.71E+041.2IE+04
Fit with variablerate of nuid intakes
(Bq/L)7.85E+076.40E+075.72E+O75.15E+074.57E+074.12E+073.71E+073.34E+O73.01E+072.73E+072.46E+072.24E+072.05E+071.87E+071.70E+071.56E+071.43E+071.32E+O71.12E+078.22E+067.64E+067.11E+O66.63E+066.19E+065.07E+064.75E+064.46E+063.28E+063.09 E+062.92E+062.75E+062.60E+062.19E+061.96E+061.86E+O6.76E+06.67E+06.58E+06.50E+06.42E+06.34E+06.27E+06
9.30E+058.83E+057.19E+054.34E+053.74E+053.23E+051.74E+051.27E+059.96E+049.80E+046.80E+045.63E+043.51E+042.79E+042.40E+042.04E+041.74E+041.53E+04I.25E+04
Fit with constantrate or fluid intakes
(B<|/L)6.41E+075.52E+075.06E+074.68E+074.26E+073.92E+073.61E+073.31E+073.O3E+O72.79E+072.56E+072.35E+072.17E+071.99E+071.82E+071.67E+071.54E+071.41E+071.19E+078.49E+067.80E+067.17E+066.59E+066.05E+064.70E+064.32E+063.97E+063.19E+063.03E+062.87E+062.72E+062.58E+062.20E+06
.98E+06
.88E+06
.78E+06
.69E+06
.60E+06
.52E+06
.44E+06
.37E+06
.3OE+069.48E+059.00E+057.3IE+054.39E+053.78E+053.25E+051.74E+051.27E+059.91E+049.75E+046.77E+045.60E+043.51E+042.80E+042.41E+042.05E+041.74E+041.54E+041.25E+04
Residual withvariable rate of
fluid intakes•8.07-3.01•1.54-0.242.140.39-0.76-0.74-0.110.31-0.71•0.84•0.630.42-2.00-2.651.510.421.743.993.021.940.962.18-0.12•3.82-4.390.21-1.46-0.77-1.65-0.90•0.610.89•0.171.890.090.280.621.37
-1.611.330.691.34
.2.880.002.40•0.48•0.05•0.31-0.78•1.810.440.92-2.983.130.770.37•2.264.00-1.38
Residual withconstant rate of fluid
intakes0.472.753.043.334.612.190.33-0.38-0.42-0.56-2.15-2.73-2.84-2.02-4.83-5.66-1.25-2.40-0.742.842.261.651.202.972.680.010.291.25
-0.61-0.13-1.18-0.61-0.710.60-0.551.46
-0.42•0.280.020.75-2.310.66-0.030.642.26-0.442.06-0.76-0.02-0.18-0.73-1.620.630.99-2.973.040.730.17-2.463.88-1.29
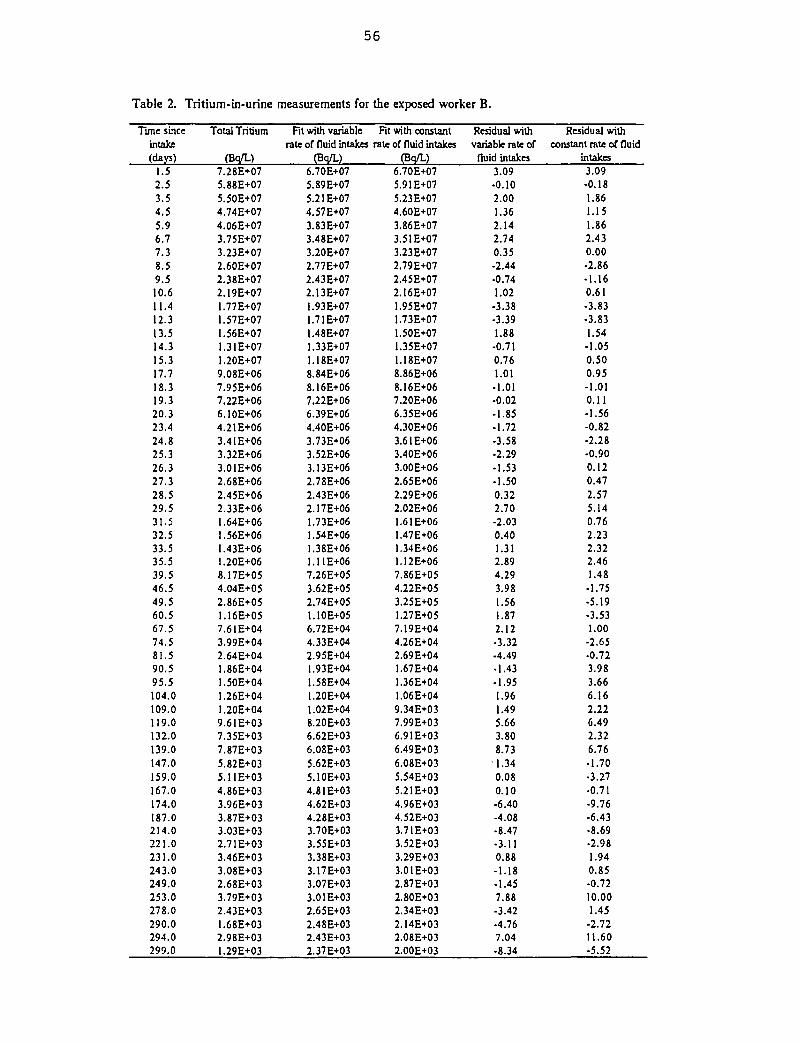
56
Table 2. Tritium-tn-urine measurements for the exposed worker B.
Time sinceintake(days)
1.52.53.54.55.96.77.38.59.510.fi11.412.313.514.315.317.718.319.320.323.424.825.326.327.328.529.531.532.533.535.539.546.549.560.567.574.581.590.595.5104.0109.0119.0132.0139.0147.0159.0167.0174.0187.0214.0221.0231.0243.0249.0253.0278.0290.0294.0299.0
Total Tritium
(Bo/L)7.28E+075.88E+075.50E+074.74E+074.06E+073.75E+073.23E+072.60E+072.38E+072.19E+071.77E+071.57E+071.56E+071.31E+071.20E+079.08E+067.95E+067.22E+066.10E+064.21 E+063.4IE+063.32E+063.01E+062.68E+062.45E+062.33E+O61.64E+061.56E+O6I.43E+061.20E+068.17E+O54.04E+052.86E+051.16E+057.61E+043.99E+042.64E+041.86E+041.50E+041.26E+041.20E+049.61E+037.35E+037.87E+035.82E+035.11E+034.86E+033.96E+033.87E+O33.O3E+O32.7IE+033.46E+033.O8E+O32.68E+033.79E+032.43E+031.68E+O32.98E+031.29E+03
Fit with variablerate of fluid intakes
(Bq/L)6.70E+075.89E+075.21E+074.57E+073.83E+073.48E+073.20E+072.77E+072.43E+072.13E+071.93E+071.71E+071.48E+071.33E+071.18E+078.84E+068.16E+067.22E+066.39E+064.40E+063.73E+063.52E+063.13E+062.78E+062.43E+062.17E+06I.73E+061.54E+061.38E+061.11E+067.26E+053.62E+052.74E+051.10E+056.72E+044.33E+042.95E+041.93E+041.58E+041.20E+041.02E+048.20E+036.62E+036.08E+035.62E+035.10E+034.81E+034.62E+034.28E+033.70E+033.55E+033.38E+033.17E+033.O7E+O33.O1E+O32.65E+032.48E+032.43E+032.37E+03
Fit with constantrate of fluid intakes
(Bq/L)6.70E+075.91E+075.23E+074.60E+073.86E+073.51E+073.23E+072.79E+O72.45E+072.16E+071.95E+071.73E+071.50E+071.35E+071.18E+078.86E+068.16E+067.20E+066.35E+064.30E+063.61 E+063.40E+063.00E+062.65E+062.29E+062.02E+061.61E+061.47E+061.34E+061.12E+067.86E+054.22E+053.25E+O51.27E+O57.19E+044.26E+042.69E+041.67E+041.36E+041.06E+049.34E+037.99E+036.91E+036.49E+036.08E+035.54E+035.21E+034.96E+034.52E+033.71E+O33.52E+O33.29E+033.01 E+032.87E+032.80E+O32.34E+O32.14E+032.08E+032.00E+03
Residual withvariable rate of
fluid intakes3.09•0.102.001.362.142.740.35•2.44•0.741.02
-3.38•3.391.88
-0.710.761.01
-1.01-0.02-1.85-1.72-3.58•2.29•1.53
-1.500.322.70-2.030.401.312.894.293.981.561.872.12•3.32-4.49-1.43-1.951.961.495.663.808.731.340.080.10-6.40-4.08-8.47•3.110.88-1.18-1.457.88-3.42-4.767.04•8.34
Residual withconstant rate of fluid
intakes3.09-0.181.861.151.862.430.00-2.86-1.160.61-3.83-3.831.54•1.050.500.95-1.010.11-1.56-0.82-2.28-0.900.120.472.575.140.762.232.322.461.48
-1.75•5.19•3.531.00-2.65-0.723.983.666.162.226.492.326.76-1.70•3.27•0.71-9.76•6.43-8.69•2.981.940.85•0.7210.001.45
-2.7211.60-5.52
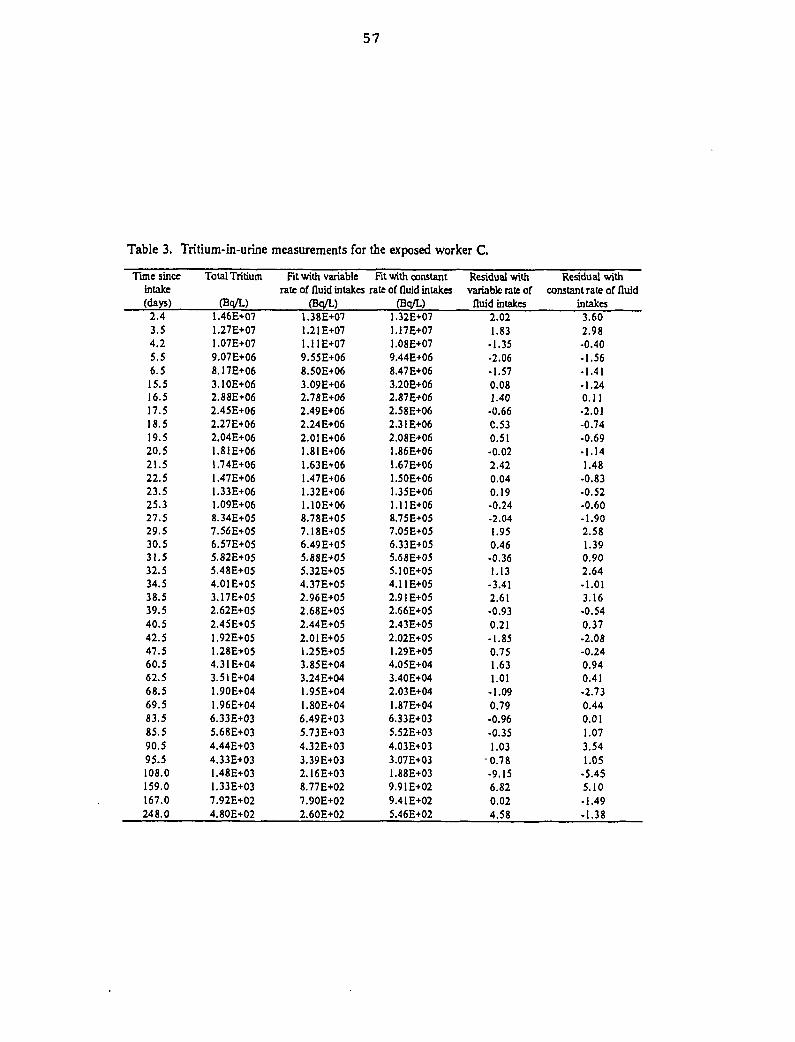
57
Table 3. Tritium-in-urine measurements for the exposed worker C.
Tune sinceintake(days)
2.43.54.25.56.515.516.517.518.519.520.521.522.523.525.327.529.530.531.532.534.538.539.540.542.547.560.562.568.569.583.585.590.595.5108.0159.0167.0248.0
Total Tritium
(Bq/L)1.46E+071.27E+071.07E+079.07E+068.17E+063.10E+062.88E+062.45E+062.27E+062.04E+061.81E+061.74E+061.47E+061.33E+061.09E+068.34E+057.56E+056.57E+055.82E+055.48E+054.01E+053.17E+052.62E+052.45E+051.92E+051.28E+054.31E+043.51E+041.90E+041.96E+046.33E+O35.68E+O34.44E+034.33E+031.48E+031.33E+O37.92E+024.80E+02
Fit with variablerate of fluid intakes
(Bq/L)1.38E+071.21E+071.11E+079.55E+068.50E+063.09E+062.78E+062.49E+062.24E+062.01 E+061.81E+061.63E+061.47E+061.32E+061.10E+068.78E+057.18E+056.49E+055.88E+055.32E+054.37E+052.96E+052.68E+052.44E+052.01 E+051.25E+053.85E+043.24E+041.95E+041.80E+046.49E+035.73E+034.32E+033.39E+O32.16E+038.77E+027.90E+022.60E+02
Fit with constantrate of fluid intakes
(Bq/L)1.32E+071.17E+071.08E+079.44E+068.47E+063.20E+062.87E+062.58E+062.31 E+062.08E+061.86E+061.67E+061.50E+061.35E+061.11E+068.75E+057.O5E+O56.33E+055.68E+055.1OE+O54.11 E+052.91 E+052.66E+052.43E+052.02E+051.29 E+054.05E+043.40E+042.03E+041.87E+046.33E+035.52E+034.03E+033.07 E+031.88E+039.91E+029.41E+025.46E+02
Residual withvariable rate of
fluid intakes2.021.83
-1.35-2.06-1.570.081.40
-0.66C.530.51-0.022.420.040.19-0.24-2.041.950.46-0.361.13
-3.412.61-0.930.21-1.850.751.631.01
-1.090.79-0.96-0.351.030.78-9.156.820.024.58
Residual withconstant rate of fluid
intakes3.602.98-0.40-1.56-1.41-1.240.11-2.01-0.74•0.69-1.141.48-0.83-0.52-0.60-1.902.581.390.902.64-1.013.16-0.540.37-2.08-0.240.940.41-2.730.440.011.073.541.05
-5.455.10-1.49-1.38
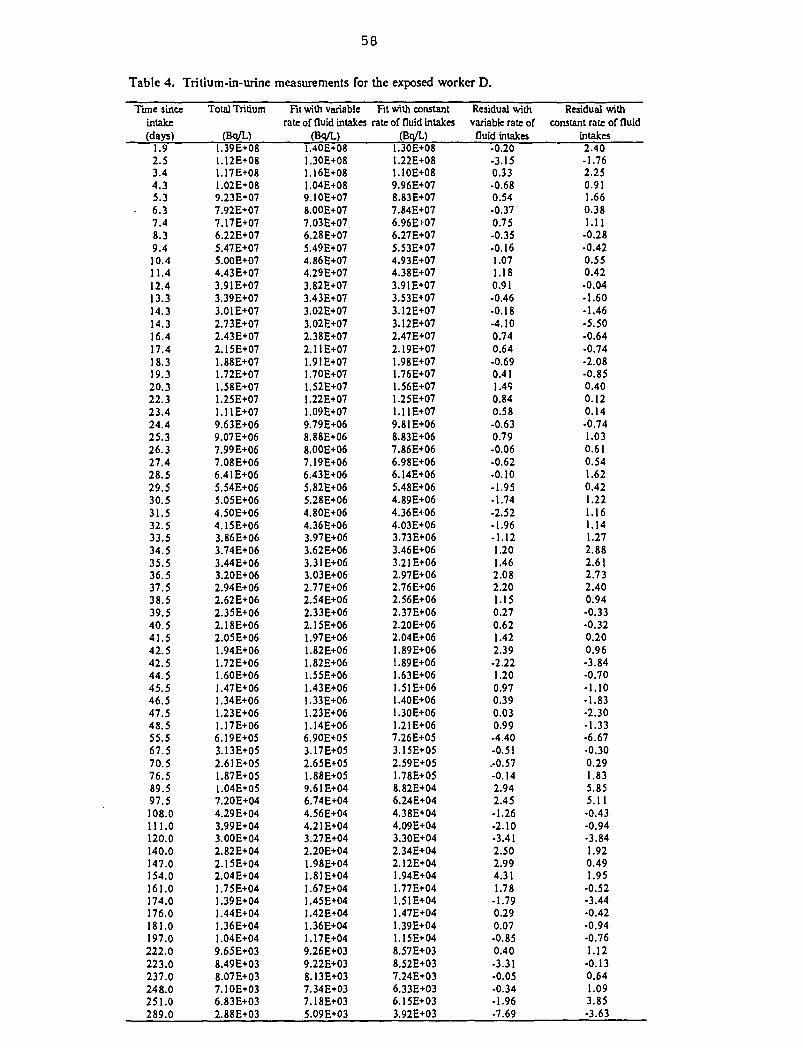
58
Table 4. Tritium-in-urine measurements for the exposed worker D.
Tune sinceintake(days)
1.92.53.44.35.36.37.48.39.410.411.412.413.314.314.316.417.418.319.320.322.323.424.425.326.327.428.529.530.531.532.533.534.535.536.537.538.539.540.541.542.542.544.545.546.547.548.555.567.570.576.589.597.5108.0111.0120.0140.0147.0154.0161.0174.0176.0181.0197.0222.0223.0237.0248.0251.0289.0
Total Tritium
(Bq/L)1.39E+O81.12E+081.17E+081.02E+089.23E+077.92E+077.17E+076.22E+075.47E+075.00E+074.43E+073.91E+073.39E+073.01E+072.73E+072.43E+072.15E+071.88E+07I.72E+071.58E+071.25E+071.11E+079.63E+069.07E+067.99E+067.08E+066.41E+065.54E+065.05E+064.50E+064.15E+063.86E+063.74E+063.44E+063.20E+062.94E+062.62E+062.35E+062.18E+062.05E+061.94E+061.72E+061.60E+061.47E+061.34E+061.23E+06.17E+06
6.19E+053.13E+O52.61E+051.87E+051.04E+057.20E+044.29E+043.99E+043.00E+042.82E+042.15E+042.04E+041.75E+041.39E+041.44E+041.36E+041.04E+049.65E+038.49E+038.07E+037.10E+036.83E+O32.88E+03
Fit with variablerate of fluid intakes
(Bq/L)1.40E+081.30E+081.16E+081.04E+089.IOE+078.00E+077.03E+076.28E+075.49E+074.86E+074.29E+073.82E+073.43E+073.O2E+073.02E+072.38E+072.11E+071.91E+071.70E+071.52E+071.22E+071.09E+079.79E+068.88E+068.00E+067.I9E+066.43E+065.82E+065.28E+064.80E+064.36E+063.97E+063.62E+063.31E+063.03E+062.77E+062.54E+062.33E+062.15E+061.97E+061.82E+061.82E+061.55E+061.43E+061.33E+061.23E+061.14E+066.90E+053.17E+O52.65E+051.88E+059.61E+046.74E+044.56E+044.21E+043.27E+042.20E+041.98E+041.81E+041.67E+041.45E+041.42E+041.36E+041.17E+049.26E+039.22E+038.13E+037.34E+037.18E+O35.O9E+O3
Fit with constantrate of fluid intakes
(Bq/L)1.30E+081.22E+081.10E+089.96E+078.83E+O77.84E+076.96E+076.27E+075.53E+074.93E+074.38E+073.91E+073.53E+073.12E+073.12E+072.47E+072.19E+071.98E+071.76E+071.56E+071.25E+071.11E+079.81E+068.83E+067.86E+066.98E+066.14E+065.48E+064.89E+064.36E+064.03E+063.73E+O63.46E+063.21E+062.97E+062.76E+062.56E+062.37E+062.20E+062.04E+061.89E+061.89E+061.63E+061.51E+061.40E+061.30E+061.21E+067.26E+053.15E+052.59E+051.78E+058.82E+046.24E+044.38E+044.09E+043.30E+042.34E+042.12E+041.94E+041.77E+041.51E+041.47E+041.39E+041.15E+048.57E+038.52E+037.24E+036.33E+O36.15E+033.92E+03
Residual withvariable rate offluid intakes
-0.20-3.150.33-0.680.54-0.370.75-0.35-0.161.071.180.91-0.46-0.18-4.100.740.64-0.690.411.490.840.58-0.630.79•0.06•0.62-0.10-1.95•1.74-2.52-1.96-1.121.201.462.082.201.150.270.621.422.39-2.221.200.970.390.030.99-4.40-0.51.-0.57-0.142.942.45-1.26-2.10-3.412.502.994.311.78
-1.790.290.07-0.850.40-3.31•0.05-0.34-1.96•7.69
Residual withconstant rate of fluid
intakes2.40-1.762.250.911.660.381.11
-0.28•0.420.550.42-0.04-1.60-1.46•5.50-0.64-0.74-2.08-0.850.400.120.14-0.741.030.610.541.620.421.221.161.141.272.882.6}2.732.400.94-0.33•0.320.200.96-3.84-0.70-1.10-1.83•2.30-1.33•6.67•0.300.291.835.855.11•0.43-0.94-3.841.920.491.95
-0.52-3.44•0.42-0.94•0.761.12-0.130.641.093.85•3.63
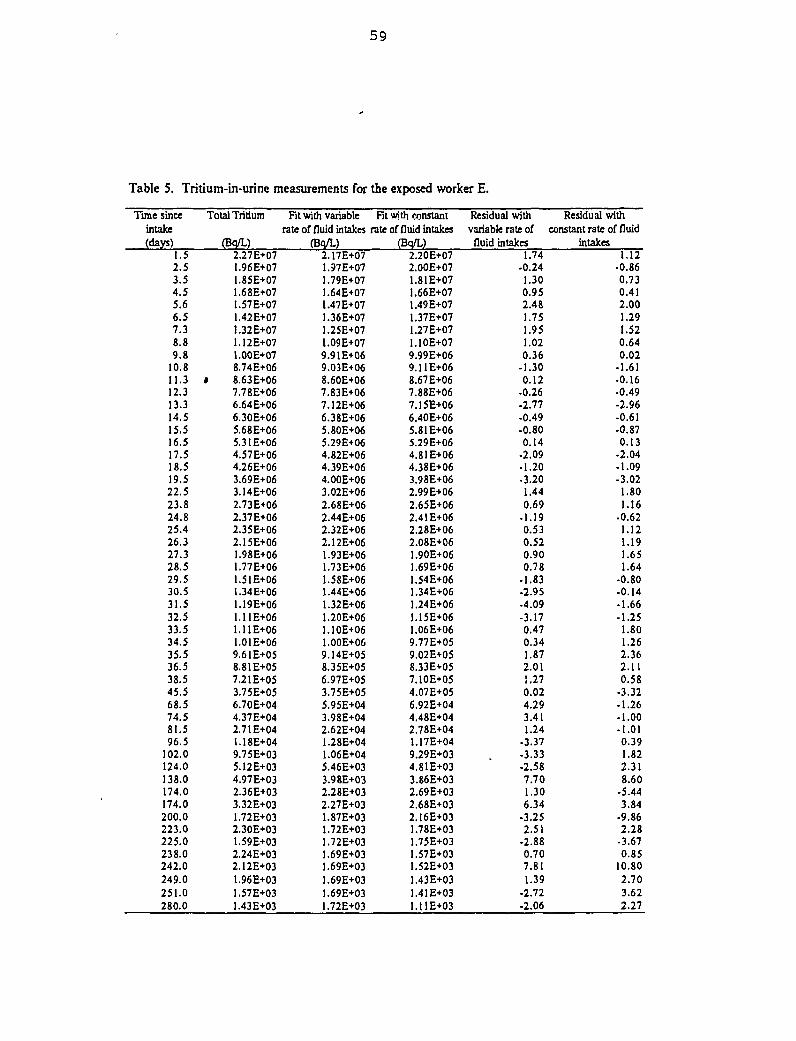
59
Table 5. Tritium-in-urine measurements for the exposed worker E.
Time sinceintake(days)
1.52.53.54.55.66.57.38.89.8
10.811.312.313.314.515.516.517.518.519.522.523.824.825.426.327.328.529.530.531.532.533.534.535.536.538.545.568.574.581.596.5
102.0124.0138.0174.0174.0200.0223.0225.0238.0242.0249.0251.0280.0
Total Tritium
(Bq/L)2.27E+07
.96E+07
.85E+07
.68E+07
.57E+07
.42E+07
.32E+071.12E+071.00E+078.74E+06
* 8.63E+067.78E+066.64E+066.30E+065.68E+065.31E+064.57E+064.26E+063.69E+063.14E+062.73E+062.37E+062.35E+062.15E+06
.98E+06
.77E+06•51E+06.34E+06.19E+06.11E+06.11E+06.01E+06
9.61E+058.81E+057.21E+053.75E+056.70E+044.37E+042.71E+041.18E+049.75E+035.12E+034.97E+032.36E+033.32E+031.72E+032.30E+031.59E+032.24E+032.12E+031.96E+031.57E+031.43E+03
Fit with variablerate of fluid intakes
(Bq/L)2.17E+07
.97E+07
.79E+07
.64E+07
.47E+07
.36E+07
.25E+O7
.09E+079.91 E+069.O3E+O68.60E+067.83E+067.12E+066.38E+065.80E+065.29E+064.82E+064.39E+064.00E+063.02E+062.68E+062.44E+062.32E+062.12E+06
.93E+06
.73E+06
.58E+06
.44E+06
.32E+061.20E+061.10E+061.00E+069.14E+058.35E+056.97E+053.75E+055.95E+043.98E+042.62E+041.28E+041.06E+045.46E+033.98E+O32.28E+032.27E+031.87E+031.72E+031.72E+031.69E+031.69E+031.69E+031.69E+031.72E+03
Fit «nth constantrate of fluid intakes
(Bq/L)2.20E+072.00E+07
.81E+07
.66E+07
.49E+07
.37E+07
.27E+07
.10E+079.99E+069.11 E+068.67E+067.88E+067.15E+066.40E+065.81E+065.29E+064.81E+064.38E+063.98E+062.99E+062.65E+062.41 E+062.28E+062.08E+061.90E+061.69E+061.54 E+061.34E+061.24E+061.15E+061.06E+069.77E+059.02E+058.33E+057.10E+054.07E+056.92E+044.48E+042.78E+041.17E+049.29E+034.81E+033.86E+032.69E+032.68E+032.16E+031.78E+03.75E+03.57E+03.52E+O3.43E+03
1.41E+03.I1E+03
Residual withvariable rate of
fluid intakes1.74
-0.241.300.952.481.751.951.020.36
-1.300.12
-0.26-2.77-0.49-0.800.14
•2.09-1.20-3.201.440.69
-1.190.530.520.900.78
-1.83-2.95-4.09-3.170.470.341.872.011.270.024.293.411.24
-3.37-3.33-2.587.701.306.34
-3.252.51
-2.880.707.811.39
•2.72-2.06
Residual withconstant rate of fluid
intakes1.12
-0.860.730.412.001.291.520.640.02
-1.61-0.16-0.49-2.96-0.61-0.870.13
-2.04-1.09-3.02
1.801.16
•0.621.121.191.651.64
-0.80-0.14-1.66-1.25
1.801.262.362.110.58
-3.32-1.26-1.00• 1.010.391.822.318.60
-5.443.84
-9.862.28
-3.670.85
10.802.703.622.27
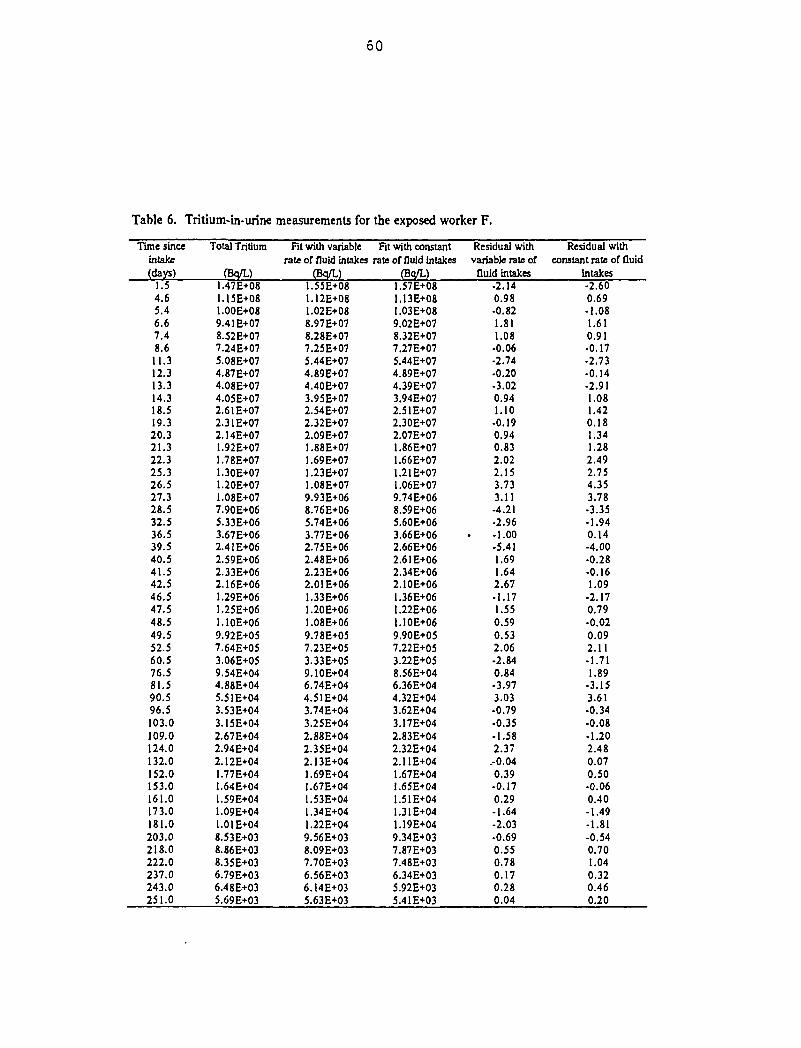
DÛ
Table 6. Tritium-in-urine measurements for the exposed worker F.
Tune sinceintake(days)
1.54.65.46.67.48.611.312.313.314.318.519.320.321.322.325.326.527.328.532.536.539.540.541.542.546.547.548.549.552.560.576.581.590.596.5103.0109.0124.0132.0152.0153.0161.0173.0181.0203.0218.0222.0237.0243.0251.0
Total Tritium
(Bq/L)1.47E+081.15E+081.00E+089.41E+078.52E+077.24E+075.08E+074.87E+074.08E+074.05E+072.61E+072.31E+072.14E+071.92E+071.78E+071.30E+071.20E+071.08E+077.90E+065.33E+063.67E+062.4IE+062.59E+062.33E+062.16E+061.29E+061.25E+061.10E+069.92E+057.64E+053.06E+059.54E+044.88E+045.51E+043.53E+043.15E+042.67E+042.94E+042.12E+041.77E+041.64E+041.59E+041.09E+041.01E+048.53E+038.86E+038.35E+036.79E+036.48E+035.69E+O3
Fit with variablerate of fluid intakes
(Bq/L)1.55E+O81.12E+08I.02E+088.97 E+078.28E+077.25E+075.44E+074.89E+074.40E+073.95E+072.54E+072.32E+072.09E+071.88E+071.69E+071.23E+071.08E+079.93E+068.76E+065.74E+063.77E+062.75E+062.48E+062.23E+062.01E+061.33E+061.20E+061.08E+069.78E+OJ7.23E+053.33E+059.10E+046.74E+044.51E+043.74E+043.25E+042.88E+042.35E+042.13E+041.69E+041.67E+041.53E+O41.34E+041.22E+049.56E+O38.09E+037.70E+036.56E+036.14E+035.63E+O3
Fit with constantrate of fluid intakes
(Bq/L)1.57E+081.13E+081.03E+089.02E+O78.32E+077.27E+075.44E+074.89E+074.39E+073.94E+O72.51 E+072.30E+072.07E+071.86E+071.66E+071.21 E+071.06E+079.74E+068.59E+065.60E+063.66E+062.66E+062.61E+062.34E+062.10E+061.36E+O6I.22E+061.I0E+069.90E+057.22E+053.22E+058.56E+046.36E+044.32E+043.62E+043.17E+042.83E+042.32E+042.11E+041.67E+041.65E+041.51 E+041.31E+041.19E+049.34E+037.87E+O37.48E+O36.34E+035.92E+035.41E+03
Residual withvariable rate of
fluid intakes-2.140.98•0.821.811.08
•0.06-2.74-0.20-3.020.941.10
-0.190.940.832.022.153.733.11-4.21-2.96-1.00-5.411.691.642.67-1.171.550.590.532.06-2.840.84•3.973.03•0.79•0.35-1.582.37
.-0.040.39-0.170.29-1.64-2.03•0.690.550.780.170.280.04
Residual withconstant rate of fluid
intakes-2.600.69-1.081.610.91-0.17-2.73-0.14-2.911.081.420.181.341.282.492.754.353.78-3.35-1.940.14-4.00-0.28-0.161.09
-2.170.79•0.020.092.11•1.711.89
-3.153.61-0.34-0.08-1.202.480.070.50•0.060.40-1.49-1.81-0.540.701.040.320.460.20
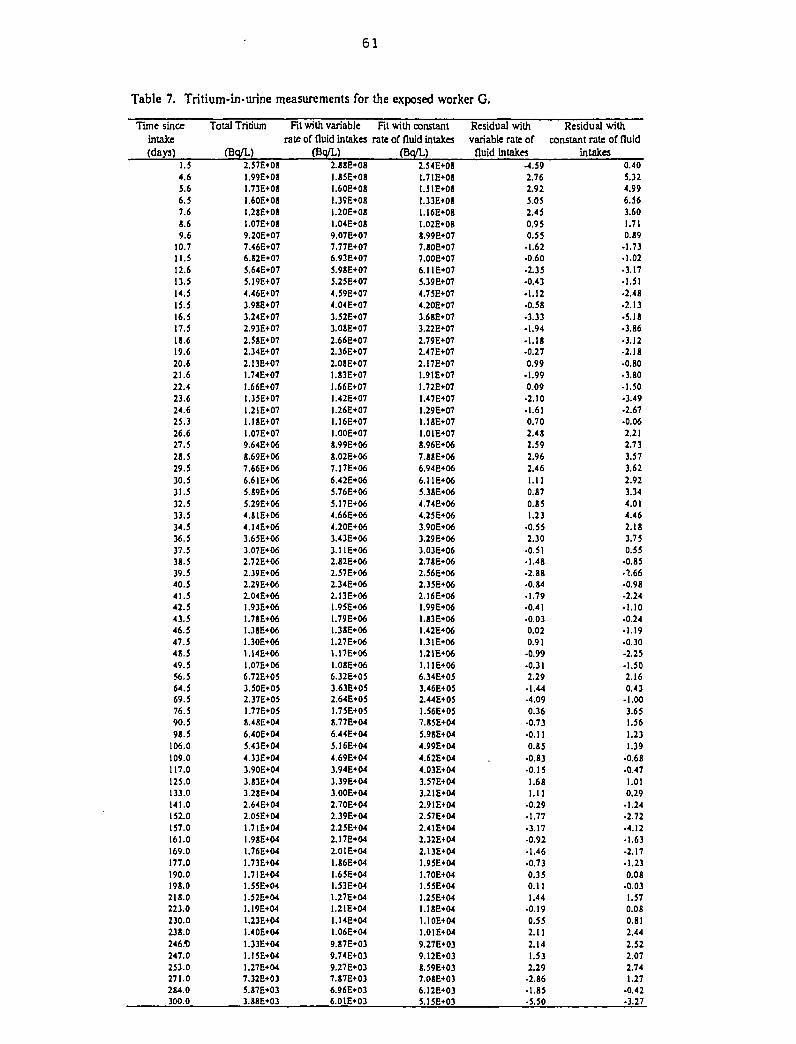
61
Table 7. Tritium-in-urine measurements for the exposed worker G.
Time sinceintake(days)
1.54.65.66.57.68.69.6
10.711.512.613.514.515.516.517.51S.619.620.621.622.423.624.625.326.627.528.529.530.531.532.533.534.536.537.538.539.540.541.542.543.546.547.548.549.556.564.569.576.590.59S.5
106.0109.0117.0125.0133.0141.0152.0157.0161.0169.0177.0190.0198.0218.0223.0230.0238.0246.13247.0253.0271.0284.0300.0
Total Tritium
(Bq/L)2.57E+081.99E+O8I.73E+O8I.60E+OSl.28E*08.07E+O8
9.20E+O77.46E+076.J2E+075.64E+O75.19E+074.46E+073.98E+073.24E+072.93E+O72.58E+O72.34E+O72.I3E+071.74E+O71.66E+O71.35E+O71.21E+071.I8E+071.07E+079.64E+06S.69E+067.66E+O66.6IE+O65.89E+O65.29E+064.S1E+064.14E*063.65E+O63.07E+O62.72E+O62.39E*O62.29E+062.04E+06
.93E+O6
.78E*06
.38E+06
.30E+06
.14E+061.07E+066.72E+O53.50E+O52.37E+O51.77E+O58.48E+046.40E+045.43E+O44.33E*043.90E*043.83E+043.28E+042.64E+042.05E+04
.71E+04
.98E+O4
.76E+O4
.73E+04
.71E+04
.55E+O4
.52E+O4
.I9E-KM
.23E+O4
.40E+04
.33E+O4
.15E+04
.27E+047.32E+035.87E+033.88E+03
Fit with variable
rate of fluid intakes(Bq/L)
2.88E«08.85E*O8.60E+08.39E*08.20E+08.04E+08
9.07E+077.77E+076.93E*075.98E+075.25E+074.59E+074.04E+O73.52E+O73.O8E+O72.66E+072.36E+072.08E+07
.83E+07
.66E+O7
.42E+07
.26E+07
.16E+O7
.OOE+078.99E+068.02E+067.17E+066.42E+065.76E+065.17E+064.66E+064.20E*063.43E+063.11E+062.82E+062.57E+O62.34E+062.13E+061.95E+061.79E+061.38E+061.27E+061.17E+061.08E+066.32E+O53.63E+052.64E+051.75E+058.77E+O46.44E+O45.16E+O44.69E+043.94E+043.39E+043.00E+042.70E+042.39E+042.25E+042.I7E+042.O1E+O4
.86E+O4
.65E+04
.53E+04
.27E*04
.21E+04
.14E+04
.06E+049.87E+039.74E+039.27E+037.87E*O36.96E+O36.01E+03
Fit with constantrate of fluid intakes
(Bo/L)2.54E+081.7IE+08I.51E+0B1.33E»081.16E+08I.02E+088.99E+O77.80E+077.OOE+O76.11E+075.39E+074.75E+074.20E+073.68E+073.22E+072.79E+O72.47E+072.17E+07
.91E+07
.72E+07
.47E+07
.29E+07
.18E+07
.01E+078.96E+067.88E+066.94E+066.11E+065.38E+064.74E+064.25E+063.90E+063.29E+063.03E+O62.78E+062.56E+O62.35E*M2.16E+06
.99E+O6
.83E*O6
.42E+06
.31E+06
.21E+06
.UE+066.34E+053.46E+O52.44E+051.56E+057.85E+045.98E+044.99E+044.62E+044.03E+043.57E+O43.21E+042.91E+042.57E+O42.41E+042.32E+042.13E+041.95E+041.70E+041.55E+O41.25E+041.1JE+CM1.10E+M.01E+04
9.27E+039.12E+038.59E+037.O8E+O36.12E+O35.15E+O3
Residual withvariable rate of
fluid intakes-4.592.762.925.052.450.950.55
• 1.62•0.60•2.35•0.43• 1.12•0.58•3.33• 1.94• 1.18•0.270.99
• 1.990.09
•2.10• 1.610.702.482.592.962.461.110.870.851.23
•0.552.30
•0.51•1.48•2.88•0.84•1.79-0.41•0.030.020.91
-0.99-0.312.29
•1.44-4.090.36
-0.73-0.110.85
-0.83•0.151.681.11
•0.29•1.77•3.17•0.92-1.46•0.730.350.111.44
-0.190.552.112.141.532.29
-2.86•1.85-5.50
Residual with
constant rate of fluidintakes
0.405.324.996.563.601.710.19
• 1.73• 1.02•3.17• 1.51•2.48•2.13•5.18•3.86•3.12•2.18•0.80-3.80-1.50• 3.49•2.67•0.062.212.733.573.622.923.344.014.462.183.750.55
•0.85• 2.66-0.98-2.24•1.10•0.24•1.19-0.30-2.25-1.502.160.43
•1.003.651.561.231.39
-0.68•0.471.010.29
-1.24•2.72•4.12•1.63-2.17• 1.230.08
•0.031.570.080.812.442.522.072.741.27
-0.42-3.27
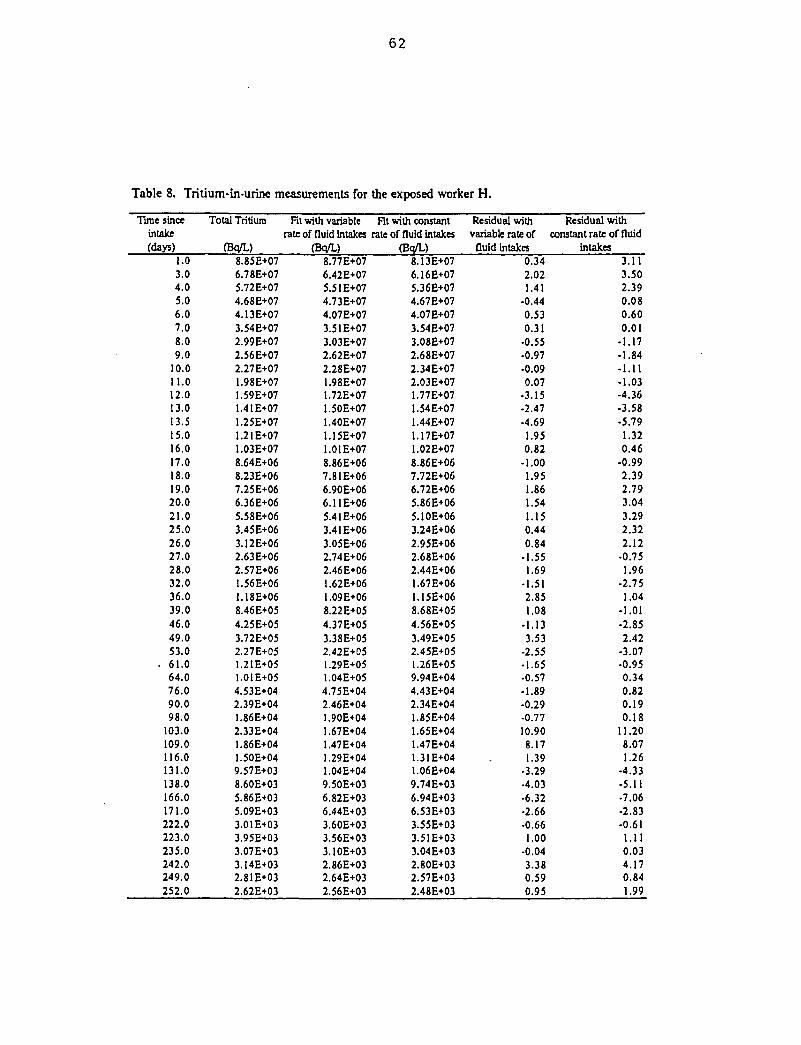
62
Table 8. Tritium-in-urine measurements for the exposed worker H.
Time sinceintake(days)
1.03.04.05.06.07.08.09.0
10.011.012.013.013.515.016.017.018.019.020.021.025.026.027.028.032.036.039.046.049.053.0
. 61.064.076.090.098.0
103.0109.0116.0131.0138.0166.0171.0222.0223.0235.0242.0249.0252.0
Total Tritium
(Bq/L)8.85E+076.78E+075.72E+074.68E+074.13E+073.54E+072.99E+072.56E+072.27E+071.98E+071.59E+071.41E+071.25E+O71.2IE+071.03E+078.64E+068.23E+067.25E+066.36E+065.58E+063.45E+063.12E+062.63E+062.57E+061.56E+061.18E+068.46E+054.25E+053.72E+052.27E+051.21E+051.01E+054.53E+042.39E+041.86E+042.33E+041.86E+041.50E+049.57E+038.60E+035.86E+035.09E+033.O1E+O33.95E+033.07E+033.14E+032.81 E+032.62E+03
Fit with variablerate of fluid intakes
(Bq/L)8.77E+076.42E+075.51E+074.73E+074.07E+073.51E+073.03E+O72.62E+072.28E+071.98E+071.72E+071.50E+071.40E+071.15E+071.01E+078.86E+067.81E+066.90E+066.11E+065.41E+063.41E+063.05E+062.74E+062.46E+061.62E+061.09E+068.22E+054.37E+053.38E+052.42E+051.29E+051.04E+054.75E+042.46E+041.90E+041.67E+041.47E+041.29E+041.04E+049.50E+036.82E+036.44E+033.60E+033.56E+033.10E+032.86E+032.64E+032.56E+03
Fit with constantrate of fluid intakes
(Bq/L)8.13E+076.16E+075.36E+074.67E+074.07E+073.54E+073.08E+072.68E+072.34E+072.03E+071.77E+071.54E+071.44E+071.17E+071.02E+078.86E+067.72E+066.72E+065.86E+065.10E+063.24E+062.95E+062.68E+062.44E+061.67E+061.15E+068.68E+054.56E+O53.49E+052.45E+051.26E+059.94E+044.43E+042.34E+041.85E+041.65E+041.47E+041.31E+041.06E+049.74E+036.94E+O36.53E+033.55E+033.51E+033.04E+032.80E+032.57E+032.48E+03
Residual withvariable rate of
fluid intakes0.342.021.41
-0.440.530.31
•0.55•0.97-0.090.07
•3.15-2.47•4.691.950.82
-1.001.951.861.541.150.440.84
-1.551.69
-1.512.851.08
-1.133.53
-2.55•1.65•0.57-1.89•0.29-0.7710.908.171.39
•3.29•4.03•6.32•2.66•0.661.00
-0.043.380.590.95
Residual withconstant rate of fluid
intakes3.113.502.390.080.600.01
-1.17-1.84-1.11-1.03-4.36-3.58-5.791.320.46
-0.992.392.793.043.292.322.12
•0.751.96
-2.751.04
-1.01-2.852.42
-3.07•0.950.340.820.190.18
11.208.071.26
•4.33-5.11•7.06-2.83-0.611.110.034.170.841.99
63
A.2 Tritium-in-Urine Measurements and Residual Plots
Page
Figure 1. Urinary excretion of total tritium for the exposed worker A 64
Figure 2. Urinary excretion of total tritium for the exposed worker B 65
Figure 3. Urinary excretion of total tritium for the exposed worker C 66
Figure 4. Urinary excretion of total tntium for the exposed worker D 67
Figure 5. Urinary excretion of total tritium for the exposed worker E 68
Figure 6. Urinary excretion of total tritium for the exposed worker F 69
Figure 7. Urinary excretion of total tritium for the exposed worker G 70
Figure 8. Urinary excretion of total tritium for the exposed worker H 71
Notes for Figures Each figure shows:
(A) A semi-logarithmic graph of observed data and the fitted function for a sum of a dualbiexponential function.
(B) A plot of residual deviation with constant and variable rates of fluid intakes.
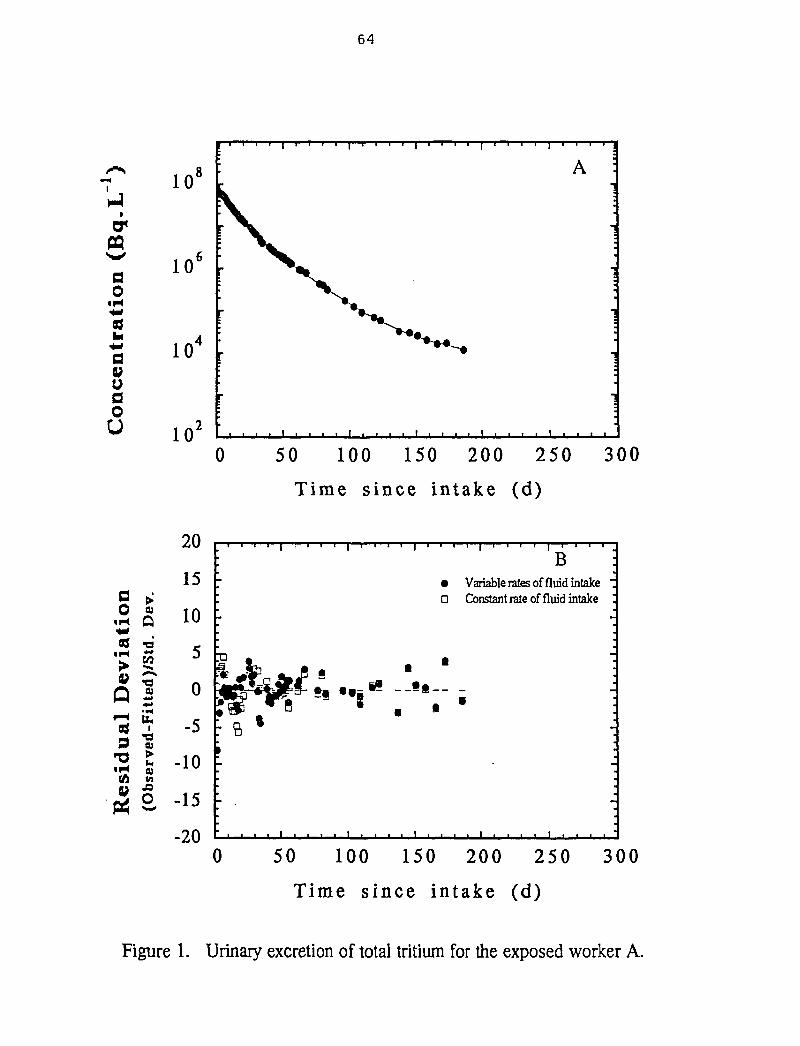
64
O0
• H
0Vuo0u
a >o «
«H O
«M C/3
a sD î
• H QJ(A m
V <°M> O
10'
10'
10
10'
20
15
10
5
0
-5
-10
-15
-20
50 100 150 200 250 300
Time since intake (d)
B• Variable rates of fluid intakeD Constant rate of fluid intake
0 50 100 150 200 250 300
Time since intake (d)
Figure 1. Urinary excretion of total tritium for the exposed worker A.
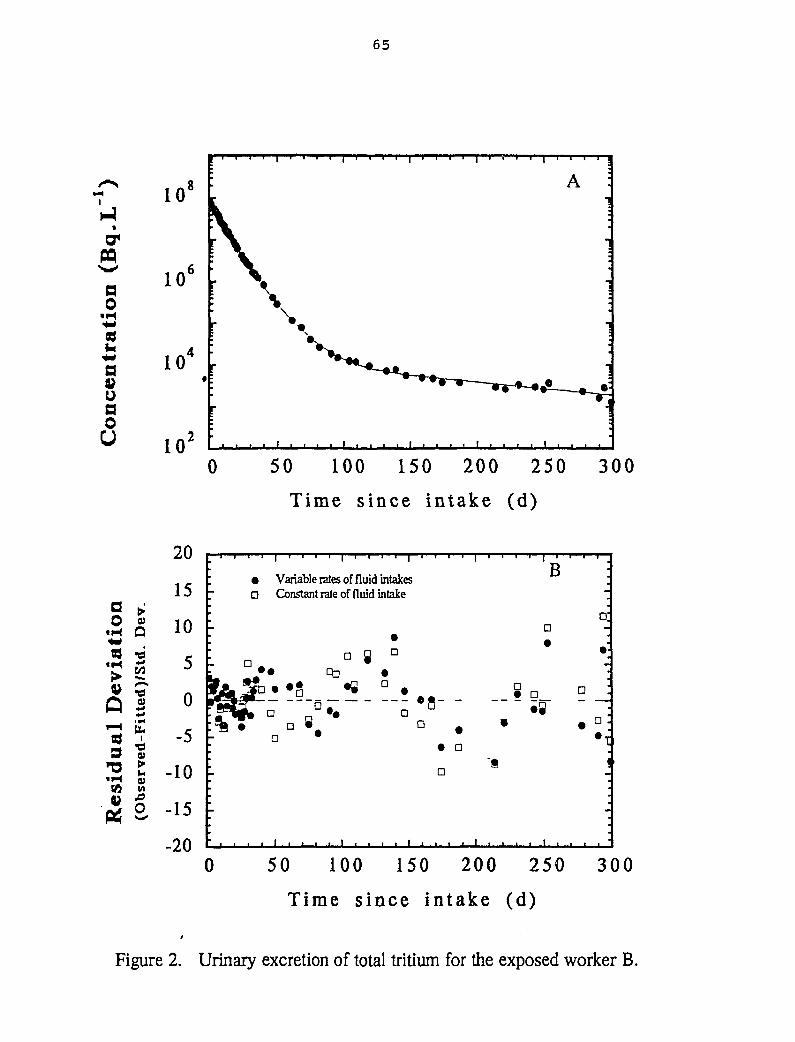
65
ao
uaoO
10'
10
a0
«M83
«M>
IS9
(0
a•d
Lte
d]-F
ii
•d
•
.o0
20
15
10
5
0
-5
-10
-15
0 50 100 150 200 250 300
Time since intake (d)
• Variable rates of fluid intakesD Constant rate of fluid intake
B
a:
•• D
«8o
• aD
' i
0 50 100 150 200 250 300
Time since intake (d)
Figure 2. Urinary excretion of total tritium for the exposed worker B.
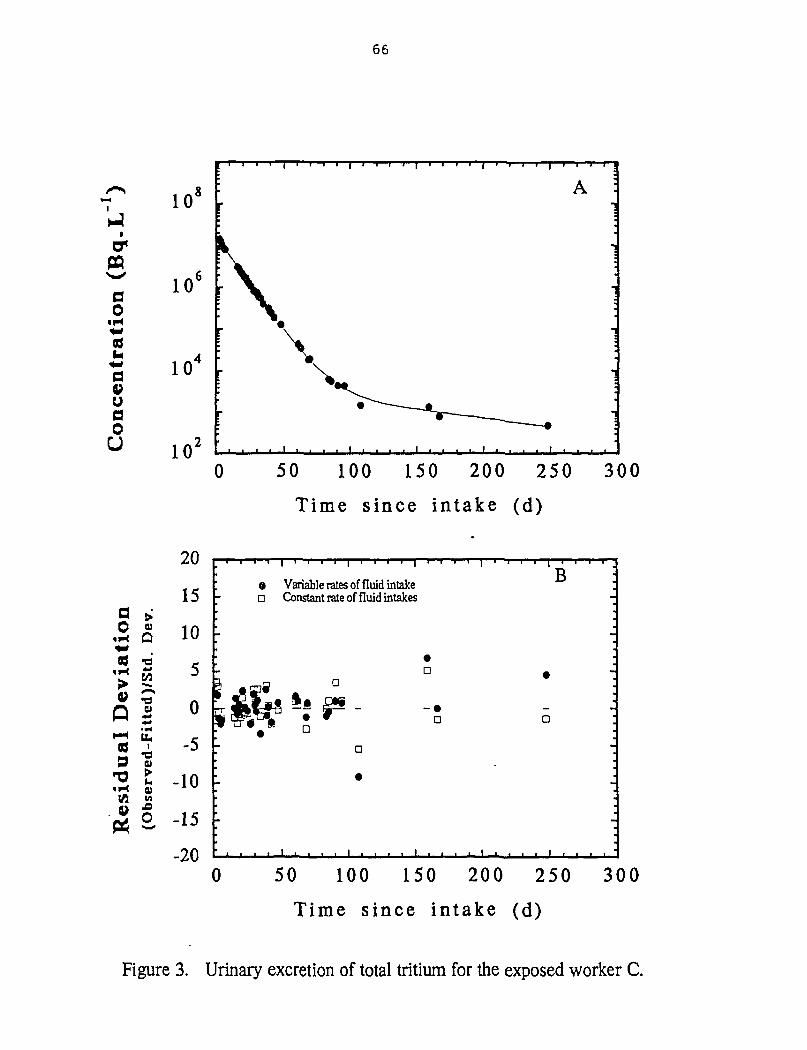
66
o0
• Hi*
aoU
10'
10'
10
0 50 100 150 200 250 300
Time since intake (d)
a0
tH
i H
«
Q
9
i H
(AV
Q)
QPIS/
Ited
),-F
il
•da>
0)M
o
20
15
10
5
0
-5
-10
-15
-20
O Variable rates of fluid intake• Constant rate of fluid intakes
B
D
*Wi ~'ïF D
a
0 50 100 150 200 250 300
Time since intake (d)
Figure 3. Urinary excretion of total tritium for the exposed worker C.
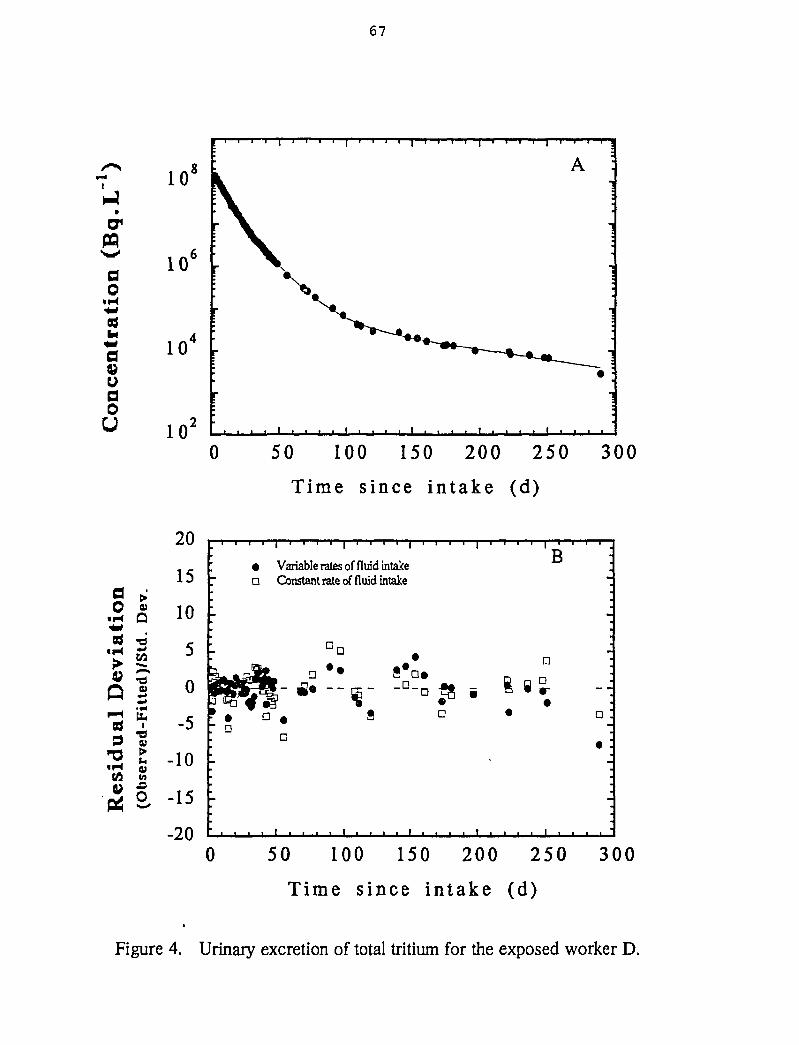
67
10'
PQ
ao
«H
10'
10
ooU 10J
0 50 100 150 200 250 300
Time since intake (d)
a0
• H
ii-l
Qi—i8j9
"O• H(A
&
Q
•d
Ued
)-F
i
•dcu
0)M
O
20
15
10
5
0
-5
-10
-15
-20
• Variable rates of fluid intakeD Constant rate of fluid intake
B
•a
a
•
0 50 100 150 200 250 300
Time since intake (d)
Figure 4. Urinary excretion of total tritium for the exposed worker D.
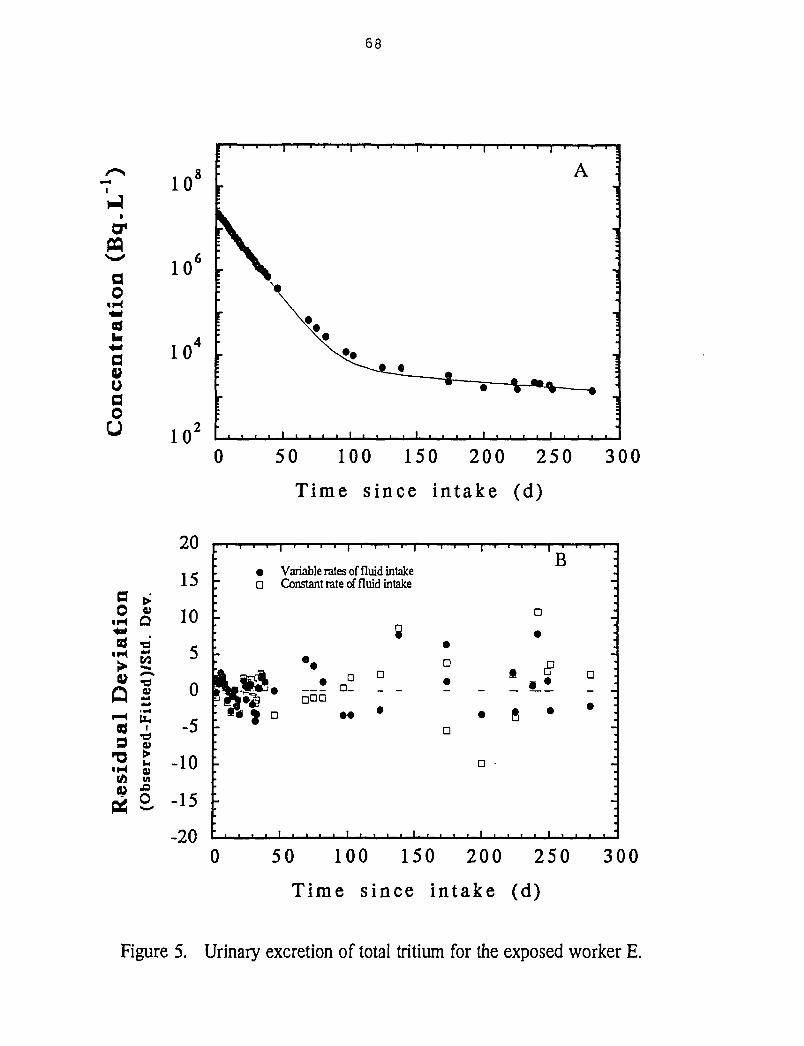
68
crMao
•H
aau00U
10'
10'
a0
«M
« H
Q'S9
'O«H(A
Q)
Q• d
lied
)
£i
•d09
09M
O
20
15
10
5
0
-5
-10
-15
-20
0 50 100 150 200 250 300
Time since intake (d)
• Variable rates of fluid intakeD Constant rate of fluid intake
B
•• §
_ ! o
0 50 100 150 200 250 300
Time since intake (d)
Figure 5. Urinary excretion of total tritium for the exposed worker E.
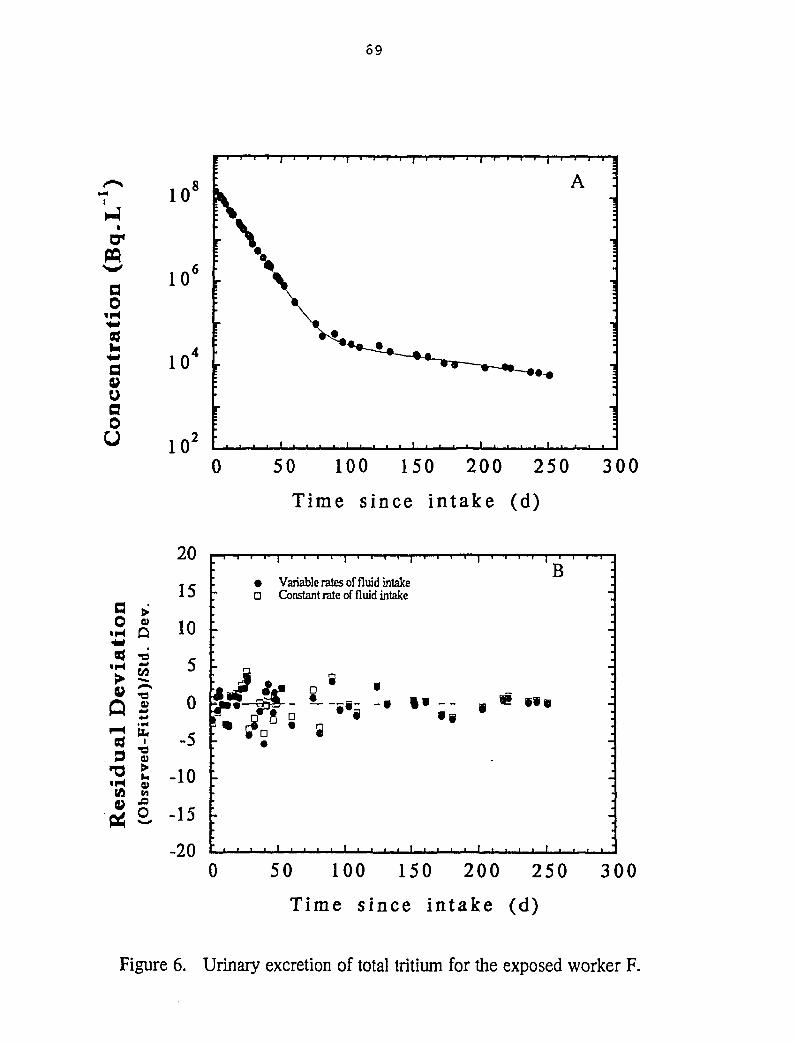
69
1-4
PQ
ao
uaoU
a0• H
• H
Q839
T3«H
0)Q
«ow•d
tte
ed-
>0)M
O
10'
10'
10
10J
0 50 100 150 200 250 300
Time since intake (d)
20
15
10
5
0
-5
-10
-15
-20
• Variable rates of fluid intakeD Constant rate of fluid intake
B
s-
0 50 100 150 200 250
Time since in take (d)
300
Figure 6. Urinary excretion of total tritium for the exposed worker F.
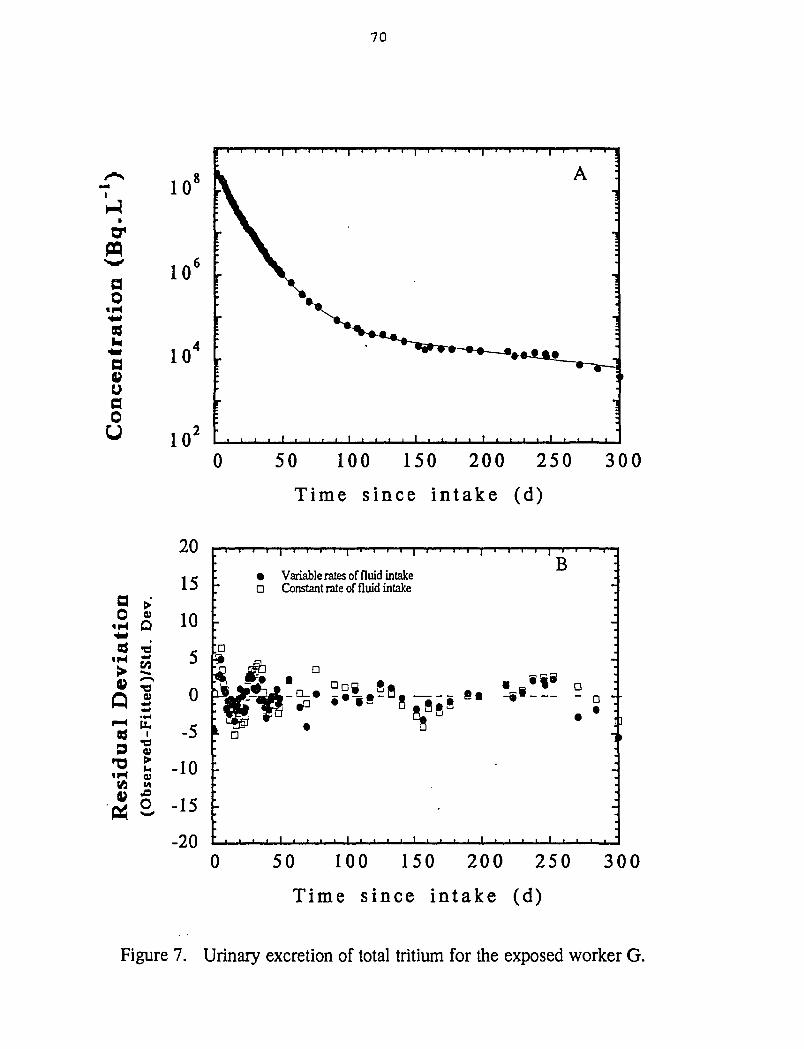
70
ao
• H
as
oao
U
10'
10"
10
0 50 100 150 200 250 300
Time since intake (d)
a0
«H
t H
V
p
ual
t H
f2
;̂0)
Q"PISi
Ltt
ed),
ed-F
i
9
VI
o
20
15
10
5
0
-5
-10
-15
-20
• Variable rates of fluid intakeD Constant rate of fluid intake
B
I ]
0 50 100 150 200 250 300
Time s ince i n t a k e (d)
Figure 7. Urinary excretion of total tritium for the exposed worker G.
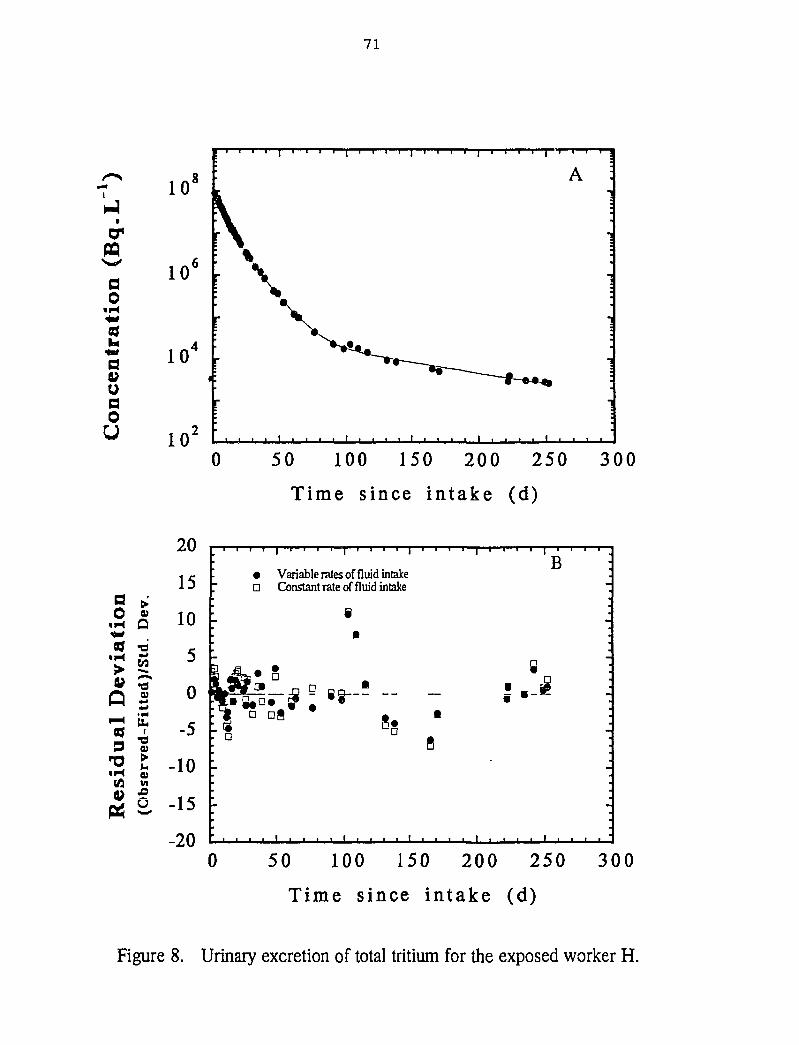
71
PQ
ao
ao
U
10'
10
io0 50 100 150 200 250 300
Time since intake (d)
a0
«H
ivia
i
V
Q159
'O• H(A
a>Q•d
tted
-Fi
•du
0)
20
15
10
5
0
-5
-10
«
-20
-
' a
Variable rates of fluid intakeConstant rate of fluid intake
e•
D
Sg •
fl
•
B I-
8 :
0 50 100 150 200 250
Time since intake (d)
300
Figure 8. Urinary excretion of total tritium for the exposed worker H.
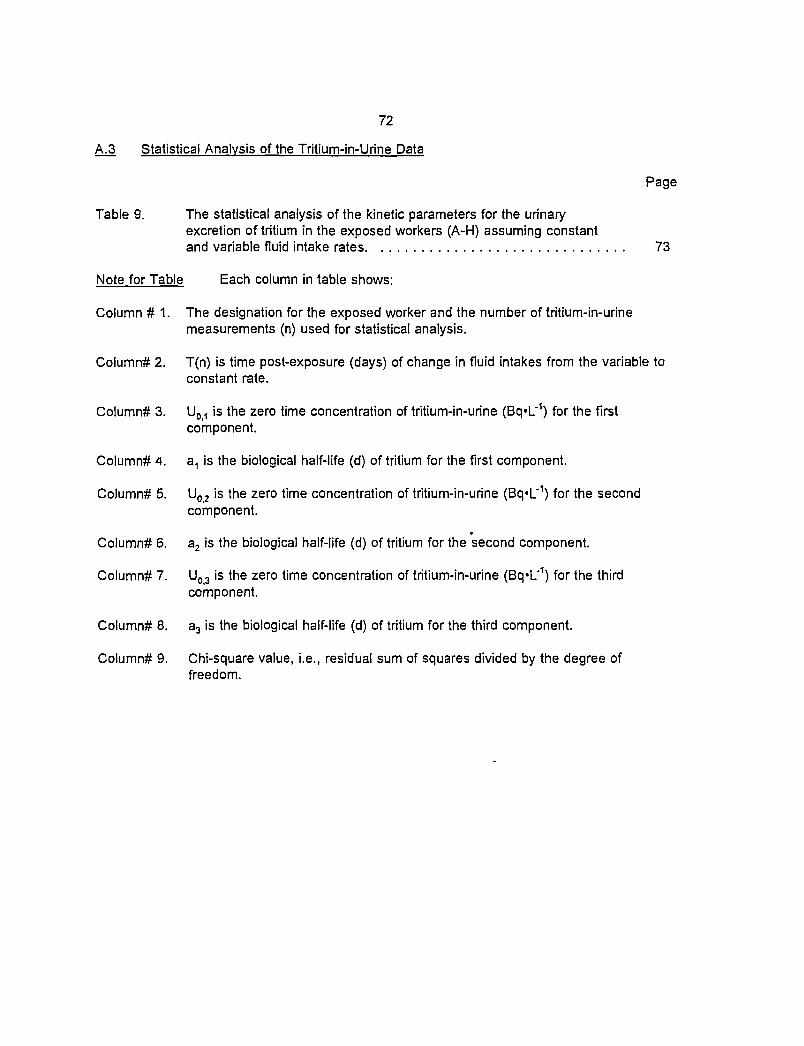
72
A.3 Statistical Analysis of the Tritium-in-Urine Data
Page
Table 9. The statistical analysis of the kinetic parameters for the urinaryexcretion of tritium in the exposed workers (A-H) assuming constantand variable fluid intake rates 73
Note for Table Each column in table shows:
Column # 1. The designation for the exposed worker and the number of tritium-in-urinemeasurements (n) used for statistical analysis.
Column# 2. T(n) is time post-exposure (days) of change in fluid intakes from the variable toconstant rate.
Column# 3. Uo , is the zero time concentration of tritium-in-urine (Bq«L'1) for the firstcomponent.
Column# 4. a: is the biological half-life (d) of tritium for the first component.
Column# 5. Uo 2 is the zero time concentration of tritium-in-urine (Bq«L'1) for the secondcomponent.
Column# 6. a2 is the biological half-life (d) of tritium for the second component.
Column# 7. U03 is the zero time concentration of tritium-in-urine (Bq*L'1) for the thirdcomponent.
Column# 8. a3 is the biological half-life (d) of tritium for the third component.
Column# 9. Chi-square value, i.e., residual sum of squares divided by the degree offreedom.
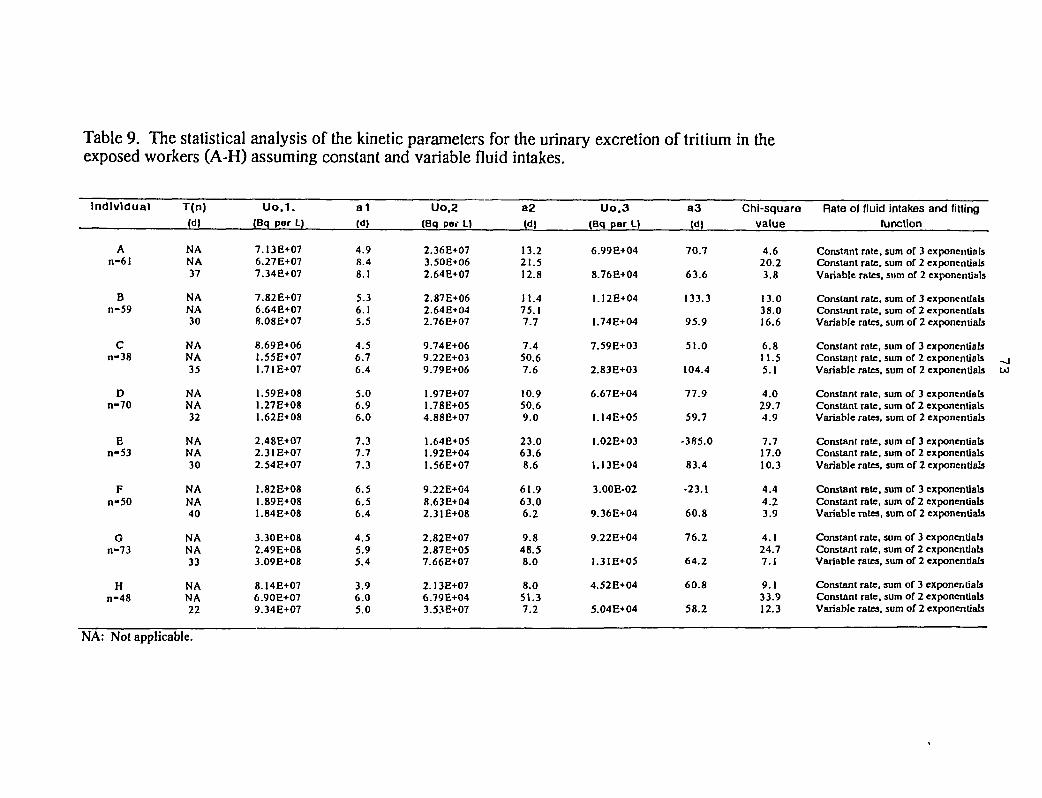
Table 9. The statistical analysis of the kinetic parameters for the urinary excretion of tritium in theexposed workers (A-H) assuming constant and variable fluid intakes.
Uo.1. a1 Uo.2 a2 Uo.3 a3 Chi-square Rate of fluid intakes and fitting(Bq per L) (d) (Bq par L) (d) (Bq per L) (d) value tu notion
Individual
An-6I
Bn-59
Cn-38
Dn-70
En-53
Fn-50
Gn-73
Hn-48
T(n)(d)
NANA37
NANA30
NANA35
NANA32
NANA30
NANA40
NANA33
NANA22
7.13E+076.27E+077.34E+07
7.82E+076.64E+078.08E+07
8.69E+06.55E+07.71E+07
.59E+08
.27E+08
.62E+08
2.48E+072.31 E+072.54E+O7
1.82E+081.89E+081.84E+08
3.30E+082.49E+083.O9E+O8
8.14E+076.9OE+O79.34E+07
4.98.48.1
5.36.15.5
4.56.76.4
5.06.96.0
7.37.77.3
6.56.56.4
4.55.95.4
3.96.05.0
2.36E+073.50E+062.64E+07
2.87E+062.64E+042.76E+07
9.74E+069.22E+039.79E+06
1.97E+071.78E+054.88E+07
1.64E+051.92E+041.56E+07
9.22E+048.63E+042.31E+08
2.82E+072.87E+057.66E+07
2.13E+076.79E+043.53E+07
13.221.512.8
11.475.17.7
7.450.67.6
10.950.69.0
23.063.68.6
61.963.06.2
9.848.58.0
8.051.37.2
6.99E+04
8.76E+04
1.12E+04
1.74E+04
7.59E+03
2.83E+O3
6.67E+04
1.I4E+05
1.02E+03
1.13E+04
3.00E-02
9.36E+04
9.22E+04
1.3IE+O5
4.52E+04
5.04E+04
70.7
63.6
133.3
95.9
51.0
104.4
77.9
59.7
-385.0
83.4
-23.1
60.8
76.2
64.2
60.8
58.2
4.620.23.8
13.038.016.6
6.811.55.1
4.029.74.9
7.717.010.3
4.44.23.9
4.124.77.1
9.133.912.3
Constant rate, sum of 3 exponentialsConstant rate, sum of 2 exponentialsVariable rates, sum of 2 exponentials
Constant rate, sum of 3 exponentialsConstant rate, sum of 2 exponentialsVariable rales, sum of 2 exponentials
Constant rate, sum of 3 exponentialsConstant rate, sum of 2 exponentials _jVariable rates, sum of 2 exponentials UJ
Constant rate, sum of 3 exponentialsConstant rate, sum of 2 exponentialsVariable rates, sum of 2 exponentials
Constant rate, sum of 3 exponentialsConstant rate, sum of 2 exponentialsVariable rates, sum of 2 exponentials
Constant rate, sum of 3 exponentialsConstant rate, sum of 2 exponentialsVariable rates, sum of 2 exponentials
Constant rate, sum of 3 exponentialsConstant rate, sum of 2 exponentialsVariable rates, sum of 2 exponentials
Constant rate, sum of 3 exponentialsConstant rate, sum of 2 exponentialsVariable rales, sum of 2 exponentials
NA: Not applicable.
74
A.4 The influence of variable rates of fluid intake on the chi-square value since HTO intake
Page
Figure 9. Chi-square plot for the exposed worker G (An example) 75
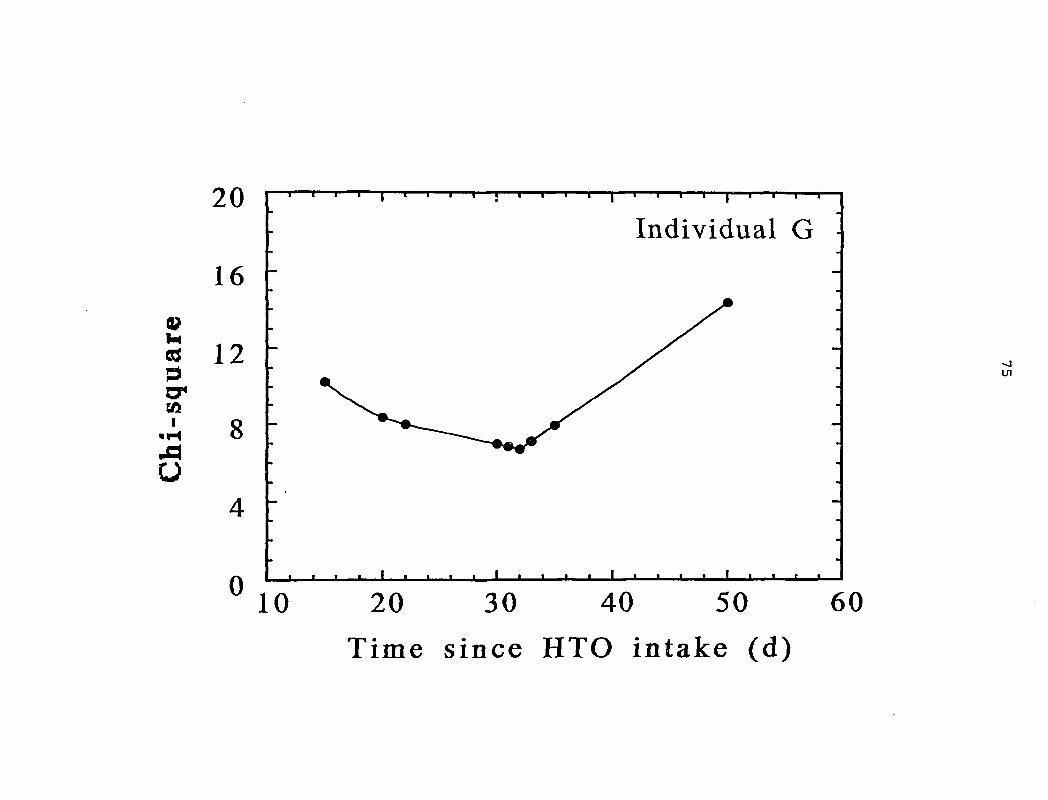
0>M830a*I
««H
Mo
20
16
12
8
0
Individual G
• et
Ul
10 20 30 40 50 60
Time since HTO intake (d)
76
APPENDIX B
BIOASSAY DATA FOR THE EXPOSED (A-H) AND CONTROL (I-L) INDIVIDUALS (>100DAYS POST-EXPOSURE)
Page
Table 1. Bioassay data for the exposed individual A 78
Table 2. Bioassay data for the exposed individual B 79
Table 3. Bioassay data for the exposed individual C 80
Table 4. Bioassay data for the exposed individual D 81
Table 5. Bioassay data for the exposed individual E 82
Table 6. Bioassay data for the exposed individual F 83
Table 7. Bioassay data for the exposed individual G 84
Table 8. Bioassay data for the exposed individual H 85
Table 9. Bioassay data for the control individual I 86
Table 10. Bioassay data for the control individual J 87
Table 11. Bioassay data for the control individual K 88
Table 12. Bioassay data for the control individual L 89
Notes for Tables
BD stands for "below the detection limit".
Each column for urine, blood and feces in a table shows:
Column # 1. The date is the sample collection date.
Column# 2. The days is the estimated time after HTO intake.
Column # 3. 3H-TOT is the measured total tritium concentration (Bq«L'1).
Column # 4. (HTO + OBT/3H-TOT) is the ratio of column 5 to column 3.
Column # 5. (HTO + OBT) is the sum of measured HTO and OBT concentrations (Bq*L'1) inthe sample.
Column* 6. OBT is the measured concentration (Bq*L'1) of organically bound tritium.
77
Column # 7. HTO is the measured HTO + exchangeable tritium concentrations (Bq-L'1).
Column# 8. (OBT/HTO) is the ratio of column 6 to column 7.
The columns for OBT in bioassay samples (Bq#g'1 organic matter) are self-explanatory.
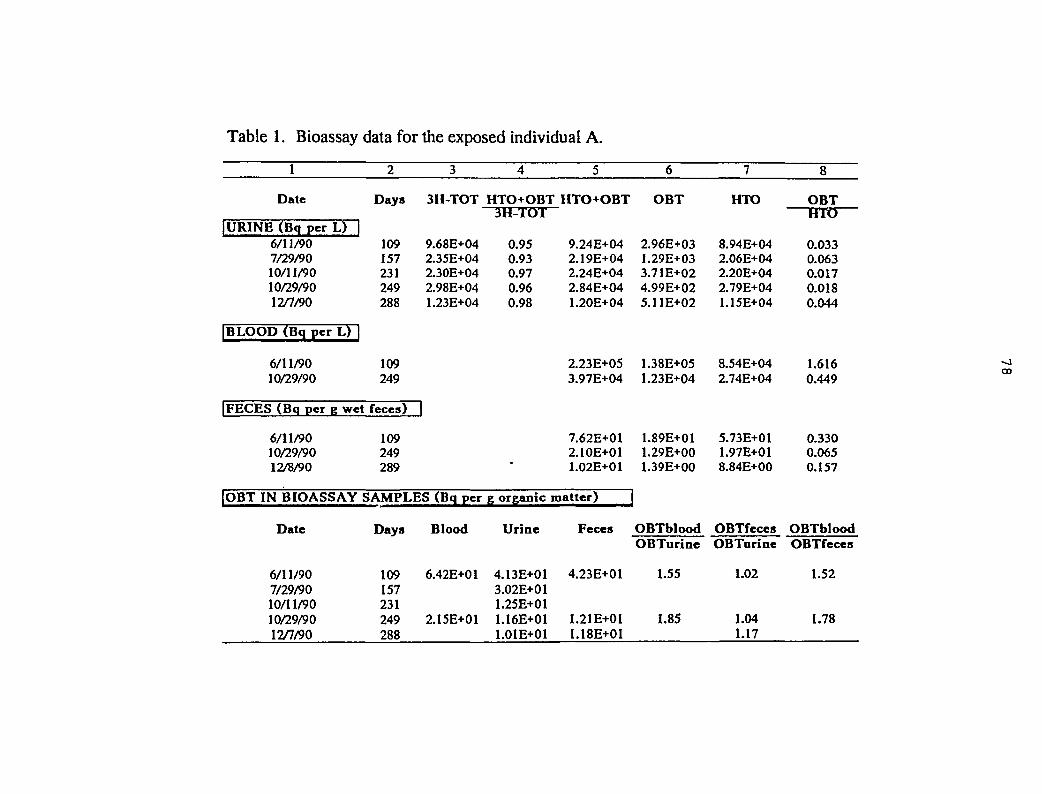
Table 1. Bioassay data for the exposed individual A.
1
Date
|URINE (Bq per L) |6/11/907/29/9010/11/9010/29/9012/7/90
|BLOOD (Bq per L) |
6/11/9010/29/90
|FECES (Bq per g wet
6/11/9010/29/9012/8/90
2
Days
109157231249288
109249
feces)
109249289
3
3H-TOT
9.68E+042.35E+042.30E+042.98E+041.23E+04
H
|OBT IN BIOASSAY SAMPLES (Bq per
Date
6/11/907/29/9010/11/9010/29/9012/7/90
Days
109157231249288
Blood
6.42E+01
2.15E+O1
4
HTO+OBT3H-TOT
0.950.930.970.960.98
5
HTO+OBT
9.24E+042.19E+042.24E+042.84E+041.20E+04
2.23E+053.97E+04
7.62E+012.10E+011.02E+01
g organic matter) |
Urine
4.13E+013.02E+011.25E+O11.16E+011.01E+01
Feces
4.23E+01
1.21E+011.18E+01
6
OBT
2.96E+031.29E+033.71E+024.99E+025.11E+02
1.38E+051.23E+04
1.89E+011.29E+001.39E+00
OBT bloodOBTurine
1.55
1.85
7
HTO
8.94E+042.06E+042.20E+042.79E+041.15E+04
8.54E+042.74E+04
5.73E+011.97E+018.84E+00
OBTfecesOBTurine
1.02
1.041.17
8
OBTHTO
0.0330.0630.0170.0180.044
1.6160.449
0.3300.0650.157
OBTbloodOBTfeces
1.52
1.78
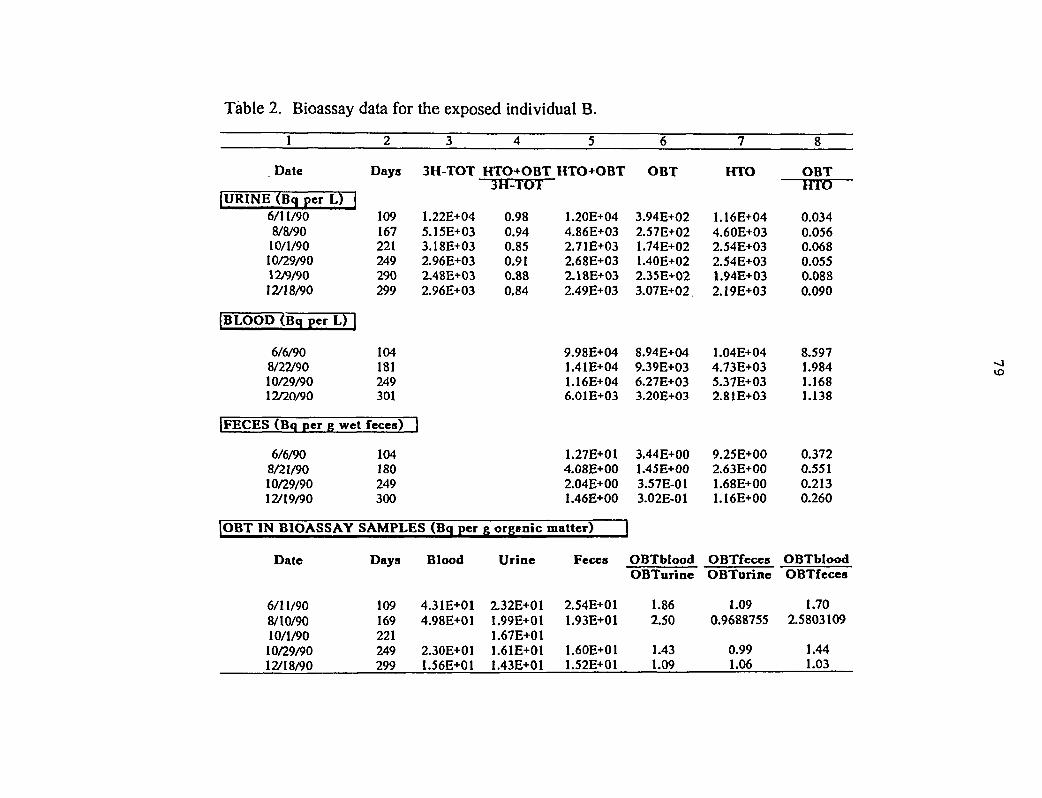
Table 2. Bioassay data for the exposed individual B.
1
Date
IURINE (Bq per L) |6/11/908/8/9010/1/9010/29/9012/9/9012/18/90
IBLOOD (Bq per L) |
6/6/908/22/9010/29/9012/20/90
IFECES (Bq per g wet
6/6/908/21/9010/29/9012/19/90
2
Days
109167221249290299
104181249301
fèces)
104180249300
3
3H-TOT
1.22E+045.15E+033.18E+032.96E+032.48E+032.96E+03
1
|OBT IN BIOASSAY SAMPLES (Bq per
Date
6/11/908/10/9010/1/9010/29/9012/18/90
Days
109169221249299
Blood
4.31E+014.98E+01
2.30E+011.56E+01
4
HTO+OBT3H-TOT
0.980.940.850.910.880.84
5
HTO+OBT
1.20E+044.86E+032.71E+032.68E+032.18E+032.49E+03
9.98E+041.41E+041.16E+046.01E+03
1.27E+014.08E+002.04E+001.46E+00
g organic matter)
Urine
2.32E+011.99E+O11.67E+011.61E+011.43E+01
Fèces
2.54E+011.93E+01
1.60E+011.52E+01
6
OBT
3.94E+022.57E+021.74E+021.40E+022.35E+023.07E+02
8.94E+049.39E+036.27E+033.20E+03
3.44E+001.45E+003.57E-013.02E-01
OBTbloodOBTurine
1.862.50
1.431.09
7
HTO
1.16E+044.60E+032.54E+032.54E+031.94E+032.19E+03
1.04E+044.73E+035.37E+032.81E+03
9.25E+002.63E+001.68E+001.16E+00
OBTfecesOBTurine
1.090.9688755
0.991.06
8
OBTHTO
0.0340.0560.0680.0550.0880.090
8.5971.9841.1681.138
0.3720.5510.2130.260
OBTbloodOBTfeces
1.702.5803109
1.441.03
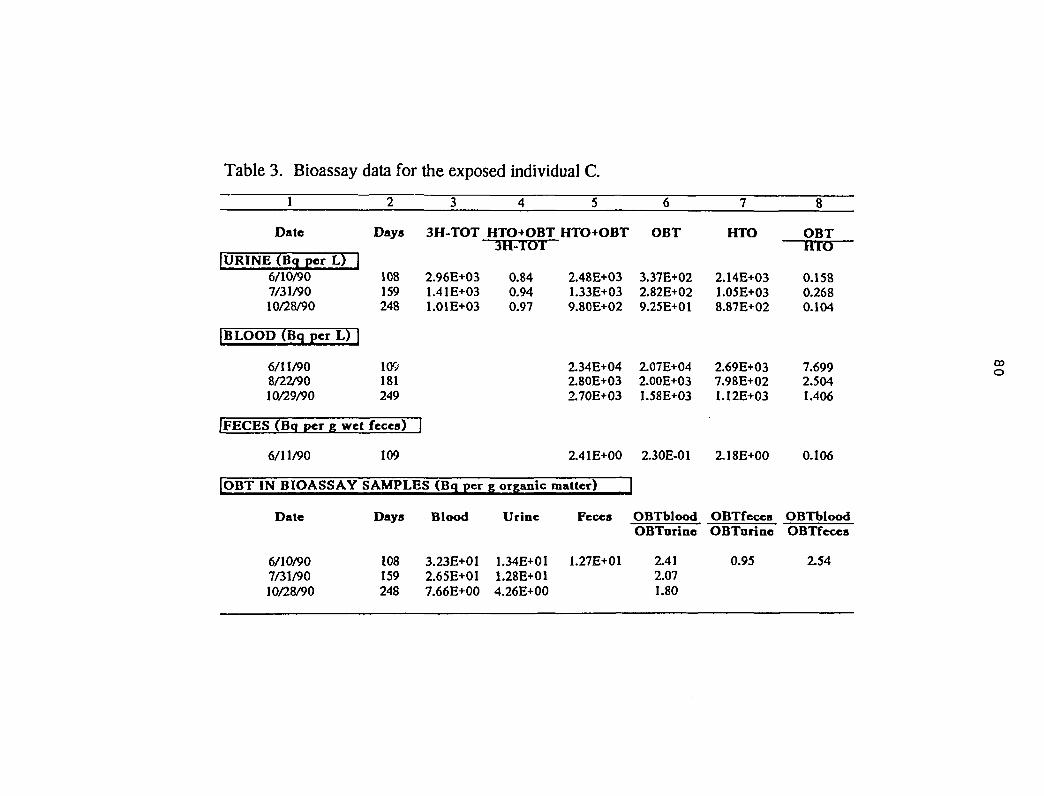
Table 3. Bioassay data for the exposed individual C.
1
Date
IURINE (Bq per L) |6/10/907/31/9010/28/90
|BLOOD (Bq per L) |
6/11/908/22/9010/29/90
IFECES (Bq per g wet
6/11/90
2
Days
108159248
109181249
fèces)
109
3
3H-TOT
2.96E+031.41E+031.01E+03
3
|OBT IN BIOASSAY SAMPLES (Bq per
Date
6/10/907/31/9010/28/90
Days
108159248
Blood
3.23E+012.65E+017.66E+00
4
HTO+OBT3H-TOT
0.840.940.97
5
HTO+OBT
2.48E+031.33E+039.80E+02
2.34E+042.80E+032.70E+03
2.41E+00
g organic matter)
Urine
1.34E+011.28E+014.26E+00
Fèces
1.27E+01
6
OBT
3.37E+022.82E+029.25E+01
2.07E+042.00E+031.58E+03
2.30E-01
IOBTbloodOBTarine
2.412.071.80
7
HTO
2.14E+031.05E+038.87E+02
2.69E+037.98E+021.12E+03
2.18E+00
OBTfecesOBTarine
0.95
8
OBTHTO
0.1580.2680.104
7.6992.5041.406
0.106
OBTbloodOBTfeces
2.54
09O
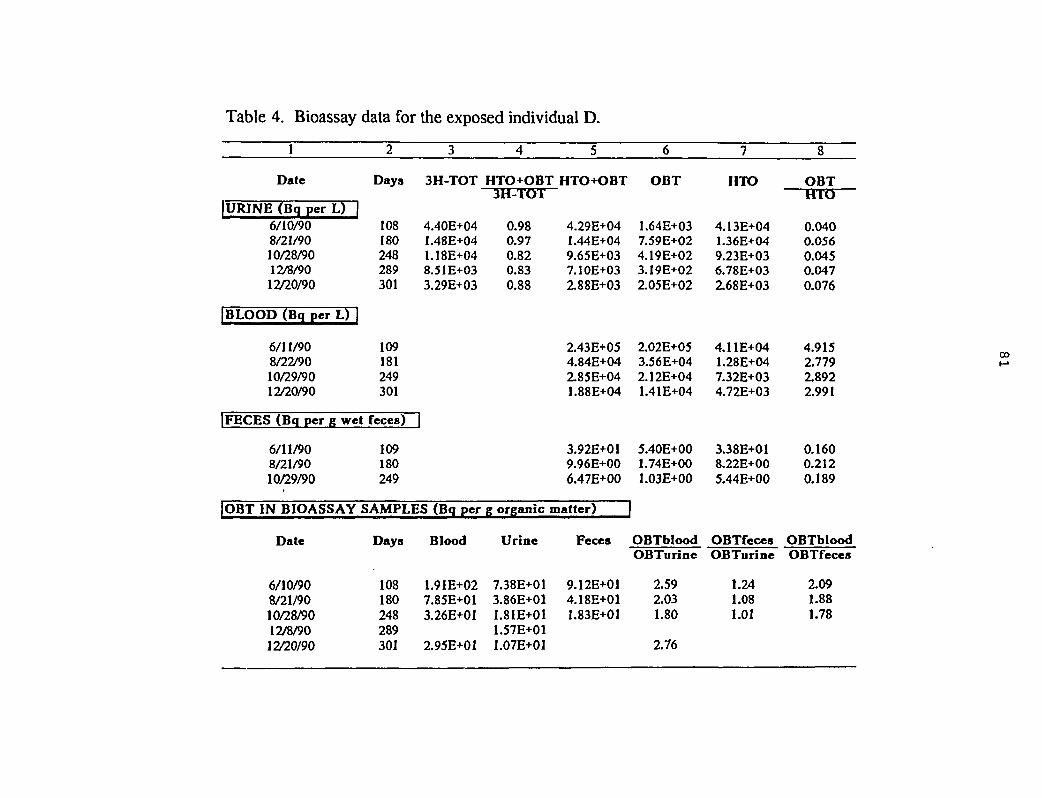
Table 4. Bioassay data for the exposed individual D.
1
Date
IURJNE (Bq per L)6/10/908/21/9010/28/9012/8/9012/20/90
BLOOD (Bq per L)
6/11/908/22/9010/29/9012/20/90
| FECES (Bq per g wet
6/11/908/21/9010/29/90
2
Days
108180248289301
109181249301
fèces)
109180249
3
3H-TOT
4.40E+041.48E+041.18E+048.51E+033.29E+03
IOBT IN BIOASSAY SAMPLES (Bq per
Date
6/10/908/21/9010/28/9012/8/9012/20/90
Days
108180248289301
Blood
1.91E+027.85E+013.26E+01
2.95E+01
4
HTO+OBT3H-TOT
0.980.970.820.830.88
5
HTO+OBT
4.29E+041.44E+049.65E+037.10E+032.88E+03
2.43E+054.84E+042.85E+041.88E+04
3.92E+019.96E+006.47E+00
g organic matter)
Urine
7.38E+013.86E+011.81E+011.57E+O11.07E+01
Fèces
9.12E+014.18E+011.83E+01
6
OBT
1.64E+037.59E+024.19E+023.19E+022.05E+02
2.02E+053.56E+042.12E+041.41E+04
5.40E+001.74E+001.03E+00
OBTbloodOBTurine
2.592.031.80
2.76
7
HTO
4.13E+041.36E+049.23E+036.78E+032.68E+03
4.11E+041.28E+047.32E+034.72E+03
3.38E+O18.22E+005.44E+00
OBTfecesOBTurine
1.241.081.01
8
OBTHTO
0.0400.0560.0450.0470.076
4.9152.7792.8922.991
0.1600.2120.189
OBTbloodOBTfeces
2.091.881.78
CO
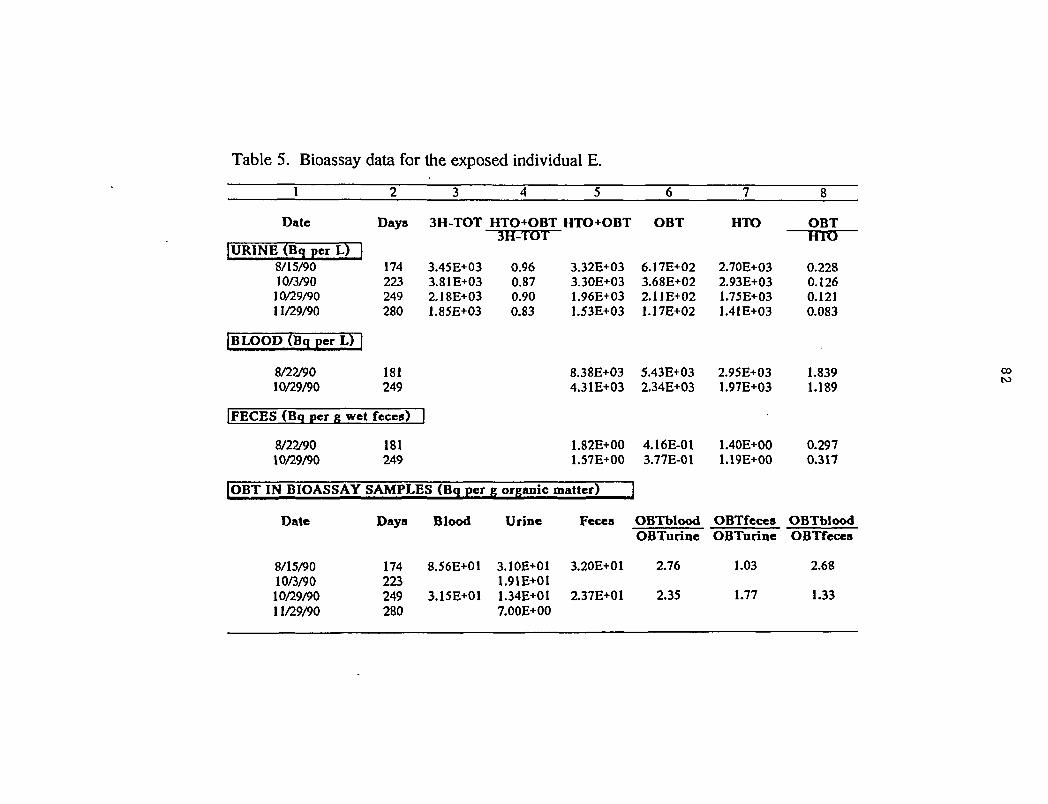
Table 5. Bioassay data for the exposed individual E.
Date Days 3H-TOT HTO+OBT HTO+OBT OBT HTO OBT
URINE (Bq per L)8/15/9010/3/9010/29/9011/29/90
BLOOD (Bq per L)
8/22/9010/29/90
FECES (Bq per g wet
8/22/9010/29/90
174223249280
181249
fèces)
181249
3.45E+033.81E+032.18E+031.85E+03
H
OBT IN BIOASSAY SAMPLES (Bq per
Date
8/15/9010/3/9010/29/9011/29/90
Days
174223249280
Blood
8.56E+01
3.15E+01
3H-TOT
0.960.870.900.83
g organic
Urine
3.10E+011.91E+011.34E+017.00E+00
3.32E+033.30E+031.96E+031.53E+O3
8.38E+034.31E+03
1.82E+001.57E+OO
matter)
Fèces
3.20E+01
2.37E+01
6.17E+023.68E+022.11E+021.17E+02
5.43E+032.34E+03
4.16E-013.77E-01
]OBTbloodOBTurine
2.76
2.35
2.70E+032.93E+031.75E+031.41E+03
2.95E+031.97E+03
1.40E+001.19E+00
OBTfecesOBTurine
1.03
1.77
HTO
0.2280.1260.1210.083
1.8391.189
0.2970.317
OBTbloodOBTfeces
2.68
1.33
00to
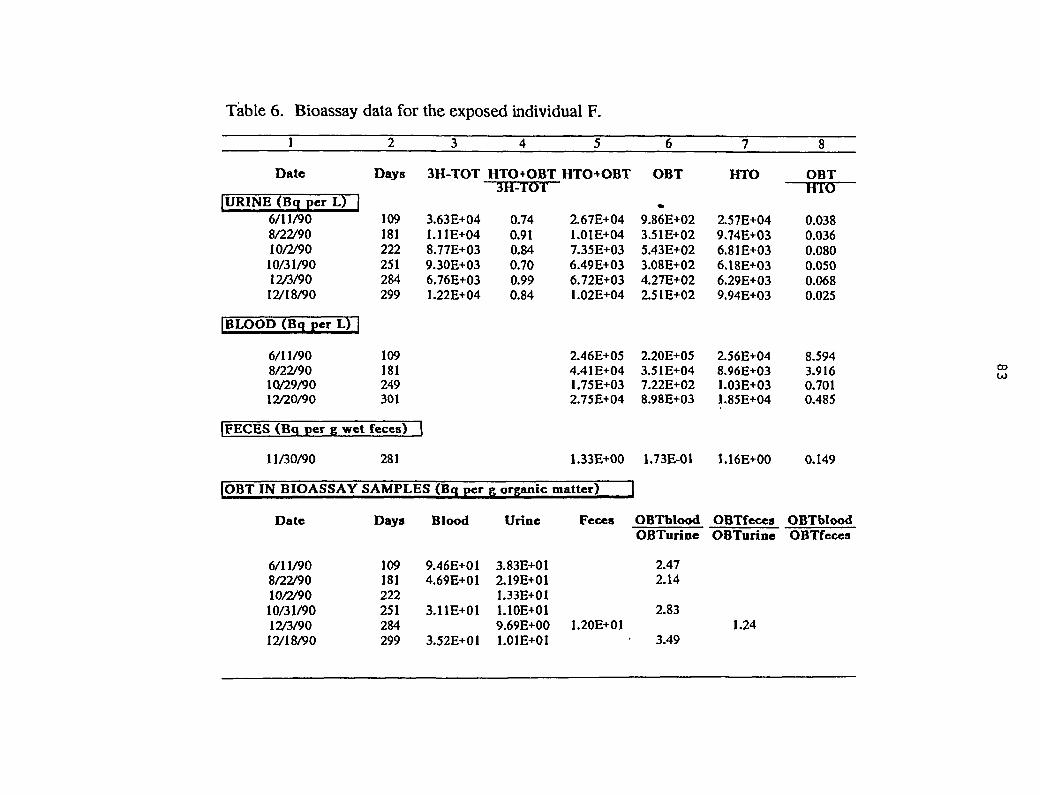
Table 6. Bioassay data for the exposed individual F.
1
Date
|URINE (Bq per L)6/11/908/22/9010/2/9010/31/9012/3/9012/18/90
BLOOD (Bq per L)
6/11/908/22/9010/29/9012/20/90
FECES (Bq per g wet
11/30/90
2
Days
109181222251284299
109181249301
feces)
281
3
3H-TOT
3.63E+041.11E+048.77E+039.30E+036.76E+031.22E+04
]
OBT IN BIOASSAY SAMPLES (Bq per
Date
6/11/908/22/9010/2/9010/31/9012/3/9012/18/90
Days
109181222251284299
Blood
9.46E+014.69E+01
3.11E+01
3.52E+01
4
HTO+OBT3H-TOT
0.740.910.840.700.990.84
5
HTO+OBT
2.67E+041.01E+047.35E+036.49E+036.72E+031.02E+04
2.46E+054.41E+041.75E+032.75E+04
1.33E+00
g organic matter)
Urine
3.83E+012.19E+011.33E+O11.10E+019.69E+001.01E+01
Feces
1.20E+01
6
OBT
«9.86E+023.51E+025.43E+023.08E+024.27E+022.51E+02
2.20E+053.51E+047.22E+028.98E+03
1.73E-01
OBTbloodOBTurine
2.472.14
2.83
3.49
7
HTO
2.57E+049.74E+036.81E+036.18E+036.29E+039.94E+03
2.56E+048.96E+031.03E+031.85E+04
1.16E+00
OBTfecesOBTurine
1.24
8
OBTHTO
0.0380.0360.0800.0500.0680.025
8.5943.9160.7010.485
0.149
OBTbloodOBTfeces
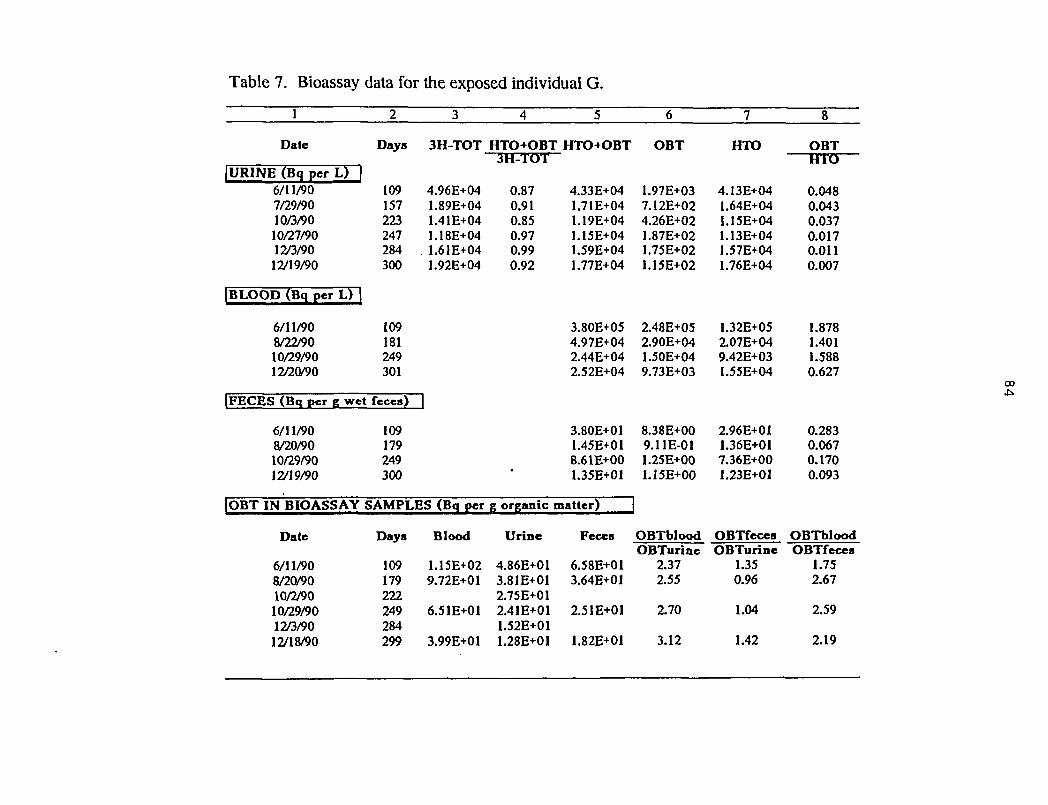
Table 7. Bioassay data for the exposed individual G.
1
Date
IURINE (Bq per L)6/11/907/29/9010/3/9010/27/9012/3/9012/19/90
BLOOD (Bq per L)
6/11/908/22/9010/29/9012/20/90
|FECES (Bq per g wet
6/11/908/20/9010/29/9012/19/90
2
Days
109157223247284300
109181249301
fèces)
109179249300
3
3H-TOT
4.96E+041.89E+041.41E+041.18E+04
. 1.61E+041.92E+04
1
OBT IN BIOASSAY SAMPLES (Bq per
Date
6/11/908/20/9010/2/9010/29/9012/3/9012/18/90
Daya
109179222249284299
Blood
1.15E+029.72E+0I
6.51E+01
3.99E+01
4 5
HTO+OBT HTO+OBT3H-TOT
0.87 *0.910.850.97 10.99 10.92 1
;
L
-
l1
L33E+04.71E+04
L19E+04.15E+04.59E+04.77E+04
Î.8OE+O51.97E+04>.44E+04L52E+04
1.80E+01I.45E+01Î.61E+001.35E+01
g organic matter)
Urine
4.86E+01 (3.81E+01 :2.75E+012.41E+01 :1.52E+011.28E+01
Fèces
S.58E+011.64E+01
Î.51E+01
1.82E+O1
6
OBT
1.97E+037.12E+024.26E+021.87E+021.75E+021.15E+02
2.48E+052.90E+041.50E+049.73E+03
8.38E+OO9.11E-011.25E+001.15E+00
OBTbloodOBTurinc
2.372.55
2.70
3.12
7
HTO
4.13E+041.64E+041.15E+041.13E+041.57E+041.76E+04
1.32E+052.07E+049.42E+031.55E+04
2.96E+011.36E+017.36E+001.23E+01
OBTfecesOBTurine
1.350.96
1.04
1.42
8
OBTHTO
0.0480.0430.0370.0170.0110.007
1.8781.4011.5880.627
0.2830.0670.1700.093
OBTbloodOBTfeces
1.752.67
2.59
2.19
CO
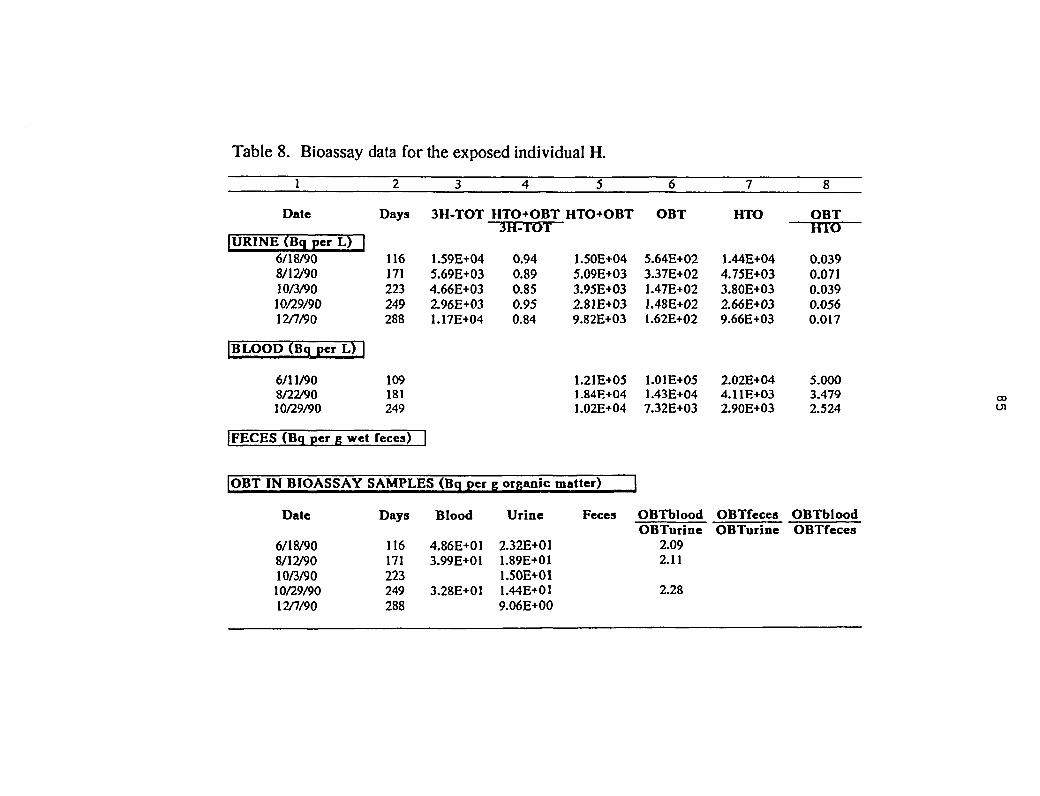
Table 8. Bioassay data for the exposed individual H.
1
Date
|URINE (Bq per L) |6/18/908/12/9010/3/9010/29/9012/7/90
|BLOOD (Bq per L) |
6/11/908/22/9010/29/90
IFECES (Bq per g wet
2
Days
116171223249288
109181249
fèces)
3
3H-TOT
1.59E+045.69E+034.66E+032.96E+031.17E+04
1
|OBT IN BIOASSAY SAMPLES (Bq per
Date
6/18/908/12/9010/3/9010/29/9012/7/90
Days
116171223249288
Blood
4.86E+013.99E+01
3.28E+01
4
HTO+OBT3H-TOT
0.940.890.850.950.84
5
HTO+OBT
1.50E+045.09E+033.95E+032.81E+039.82E+03
1.21E+051.84E+041.02E+04
g organic matter) |
Urine
2.32E+011.89E+011.50E+011.44E+019.06E+00
Fèces
6
OBT
5.64E+023.37E+021.47E+021.48E+021.62E+02
1.01E+051.43E+047.32E+03
OBTbloodOBTurine
2.092.11
2.28
7
HTO
1.44E+044.75E+033.80E+032.66E+039.66E+03
2.02E+044.11E+032.90E+03
OBTfecesOBTurine
8
OBTHTO
0.0390.0710.0390.0560.017
5.0003.4792.524
OBTbloodOBTfeces
00en
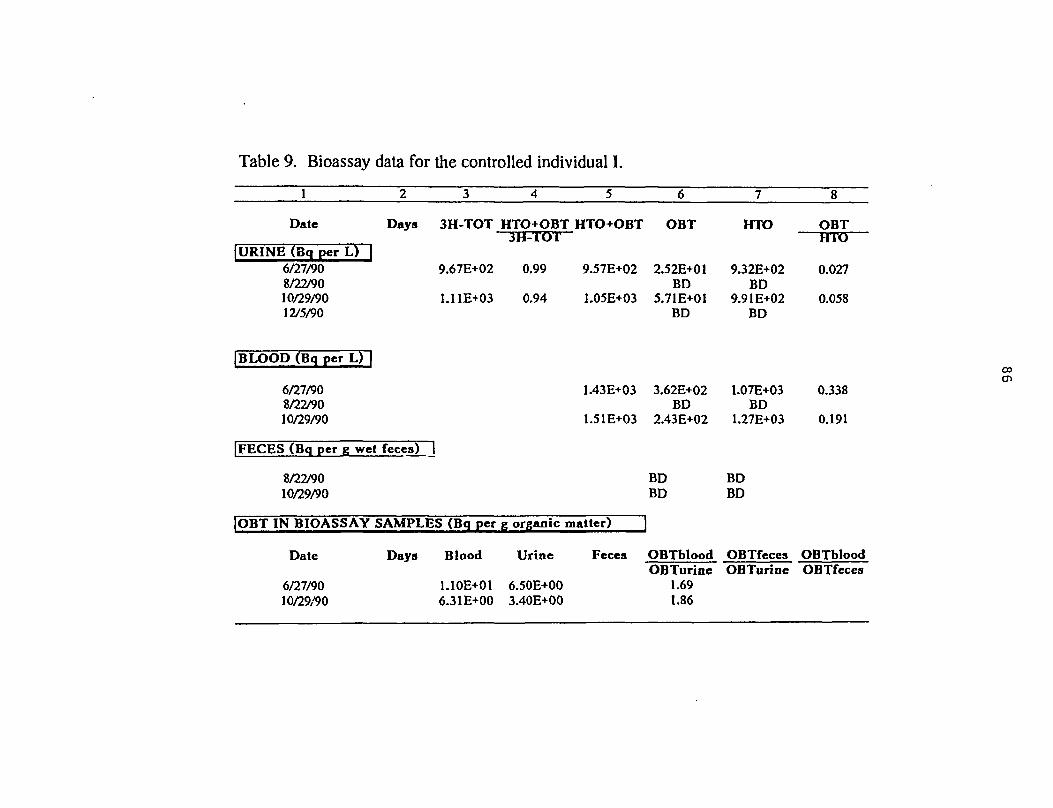
Table 9. Bioassay data for the controlled individual I.
1
Date
URINE (Bq per L)6/27/908/22/9010/29/9012/5/90
BLOOD (Bq per L)
6/27/908/22/9010/29/90
2 3
Days 3H-TOT
9.67E+02
1.11E+03
FECES (Bq per g wet feces) 1
8/22/9010/29/90
OBT IN BIOASSAY
Date
6/27/9010/29/90
SAMPLES (Bq per
Days Blood
1.10E+016.31E+00
4
HTO+OBT3H-TOT
0.99
0.94
5
HTO+OBT
9.57E+02
1.05E+03
1.43E+03
1.51E+03
g organic matter)
Urine
6.50E+003.40E+00
Feces
6
OBT
2.52E+01BD
5.71E+01BD
3.62E+02BD
2.43E+02
BDBD
OBTbloodOBTurine
1.691.86
7
HTO
9.32E+02BD
9.91E+02BD
1.07E+03BD
1.27E+03
BDBD
OBTfecesOBTurine
8
OBTHTO
0.027
0.058
0.338
0.191
OBTbloodOBTfeces
CO
en
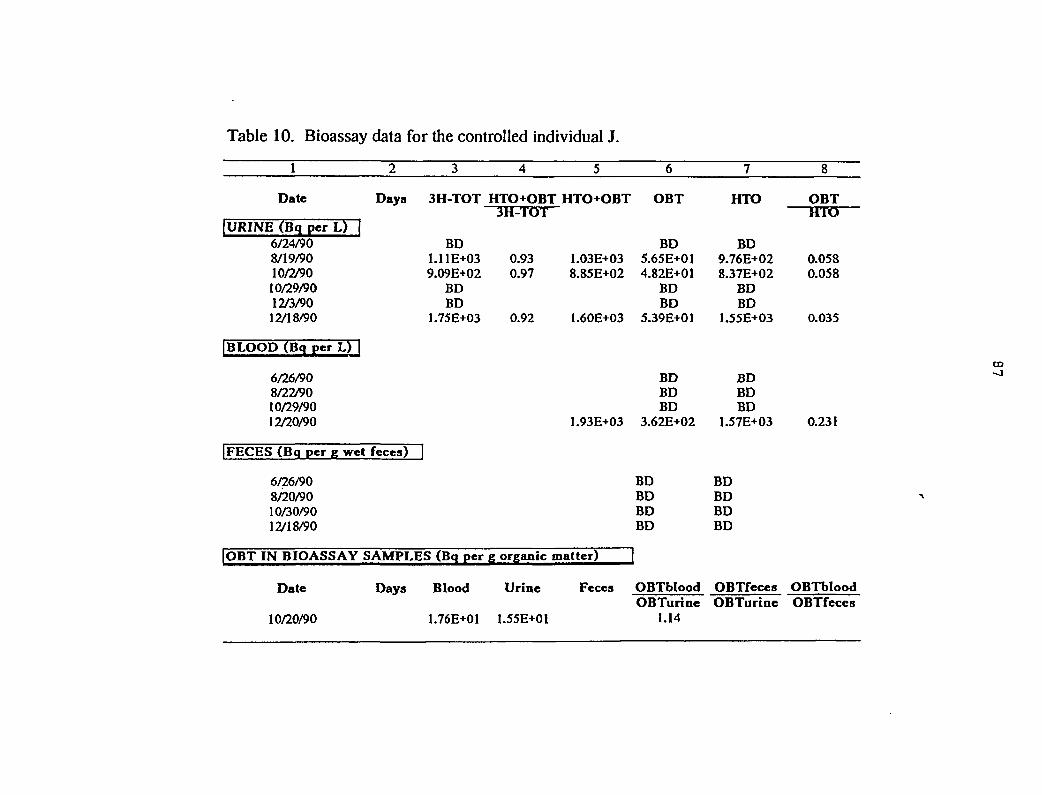
Table 10. Bioassay data for the controlled individual J.
1
Date
[URINE (Bq per L)6/24/908/19/9010/2/9010/29/9012/3/9012/18/90
BLOOD (Bq per L)
6/26/908/22/9010/29/9012/20/90
2 3
Days 3H-TOT
BD1.11E+039.09E+02
BDBD
1.75E+03
FECES (Bq per g wet fèces) |
6/26/908/20/9010/30/9012/18/90
OBT IN BIOASSAY
Date
10/20/90
SAMPLES (Bq per
Days Blood
1.76E+01
4
HTO+OBT3H-TOT
0.930.97
0.92
5
HTO+OBT
1.03E+038.85E+02
1.60E+O3
1.93E+03
g organic matter)
Urine
1.55E+01
Fèces
6
OBT
BD5.65E+014.82E+01
BDBD
5.39E+01
BDBDBD
3.62E+02
BDBDBDBD
OBTbloodOBTurine
1.14
7
HTO
BD9.76E+028.37E+02
BDBD
1.55E+03
BDBDBD
1.57E+03
BDBDBDBD
OBTfecesOBTurine
8
OBTHTQ
0.0580.058
0.035
0.231
OBTbloodOBTfeces
CO
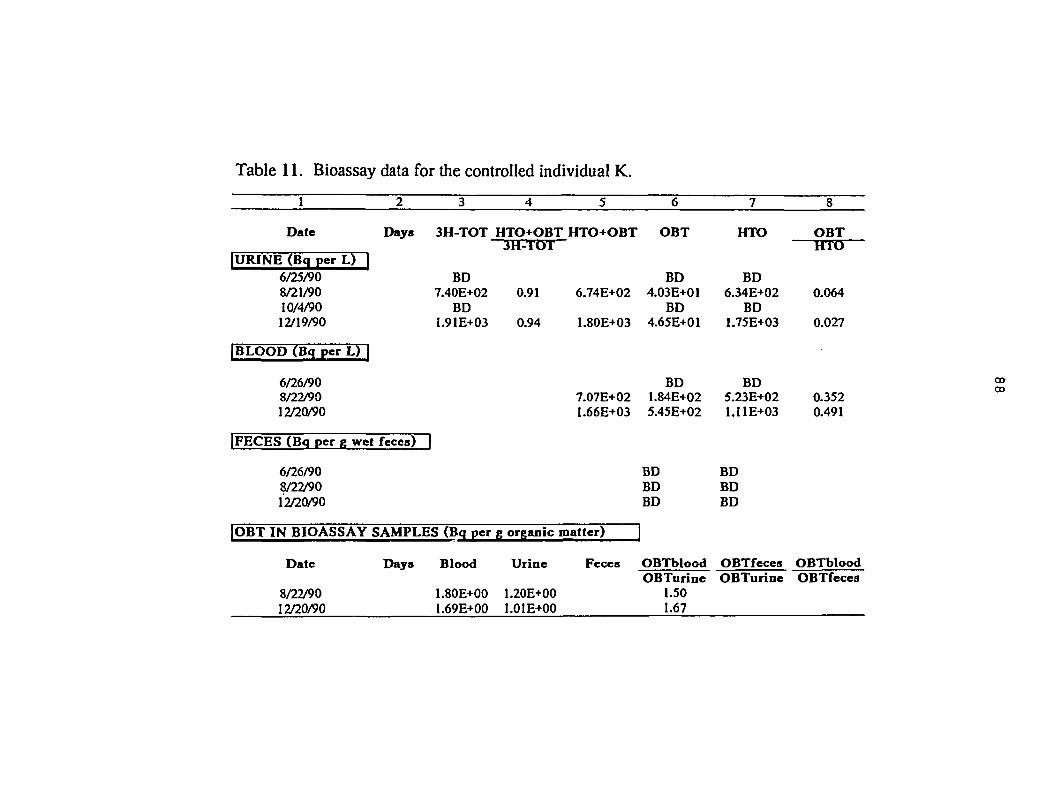
Table 11. Bioassay data for the controlled individual K.
Date Days 3H-TOT HTO+OBT HTO+OBT OBT HTO
IOBT IN BIOASSAY SAMPLES (Bq per g organic matter)
Date Days Blood Urine Fèces
OBT
IURINE (Bq per L) |6/25/908/21/9010/4/9012/19/90
|BLOOD (Bcj per L) |
6/26/908/22/9012/20/90
|FECES (Bq per g wet fèces)
6/26/908/22/9012/20/90
3H-TOT
BD7.40E+02 0.91
BD1.91E+03 0.94
3
6.74E+02
1.80E+03
7.07E+021.66E+03
BD4.03E+01
BD4.65E+01
BD1.84E+025.45E+02
BDBDBD
BD6.34E+02
BD1.75E+03
BD5.23E+021.11E+03
BDBDBD
HTO
0.064
0.027
0.3520.491
8/22/9012/20/90
1.80E+00 1.20E+001.69E+00 1.01E+00
OBTblood OBTfeces OBTbloodOBTurine OBTurine OBTfeces
1.501.67
oooo
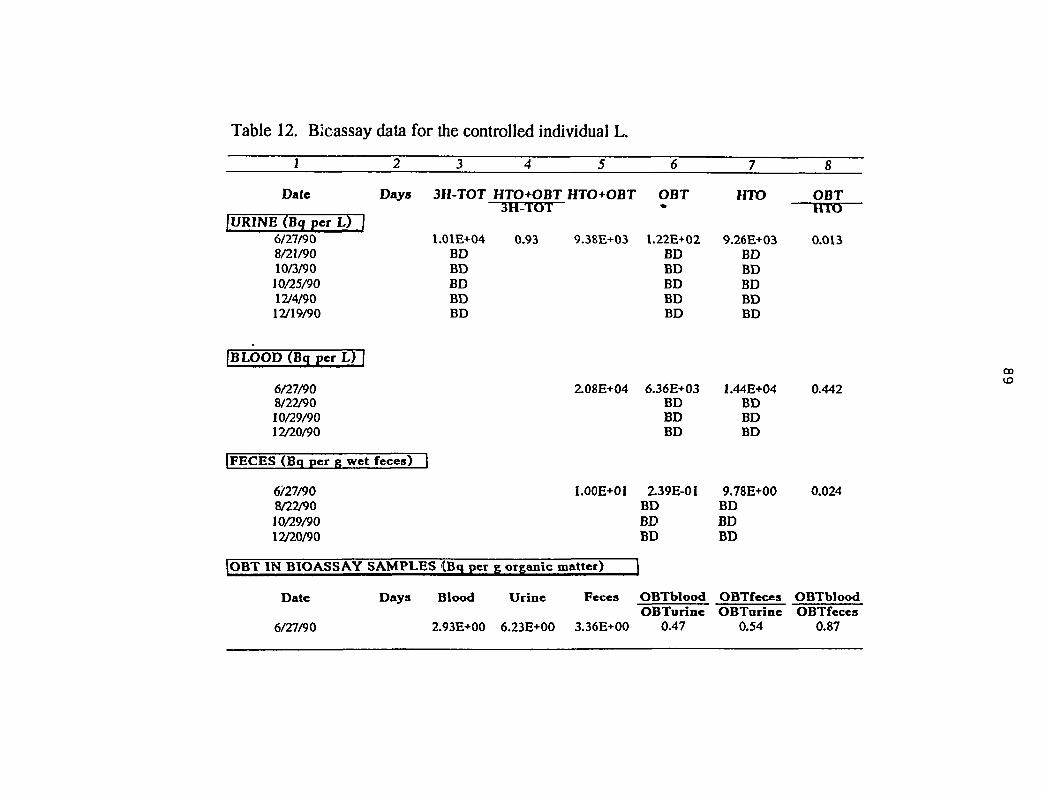
Table 12. Bicassay data for the controlled individual L.
Date Days 3H-TOT HTO+OBT HTO+OBT OBT HTO OBT
|URINE (Bq per L) |6/27/908/21/9010/3/9010/25/9012/4/9012/19/90
3H-TOT
1.01E+04 0.93BDBDBDBDBD
9.38E+03 1.22E+02BDBDBDBDBD
9.26E+03BDBDBDBDBD
HTO
0.013
[BLOOD (Bq per L) f
6/27/908/22/9010/29/9012/20/90
|FECES (Bq per g wet feceg) 1
6/27/908/22/9010/29/9012/20/90
2.08E+04 6.36E+03BDBDBD
1.00E+01 2.39E-01BDBDBD
1.44E+04BDBDBD
9.78E+00BDBDBD
0.442
0.024
IOBT IN BIOASSAY SAMPLES (Bq per g organic matter) |
Date Days Blood Urine Fèces OBTblood OBTfecea OBTblood
6/27/90 2.93E+00 6.23E+00 3.36E+00OBTurine OBTurine OBTfeces
0.47 0.54 0.87
CD
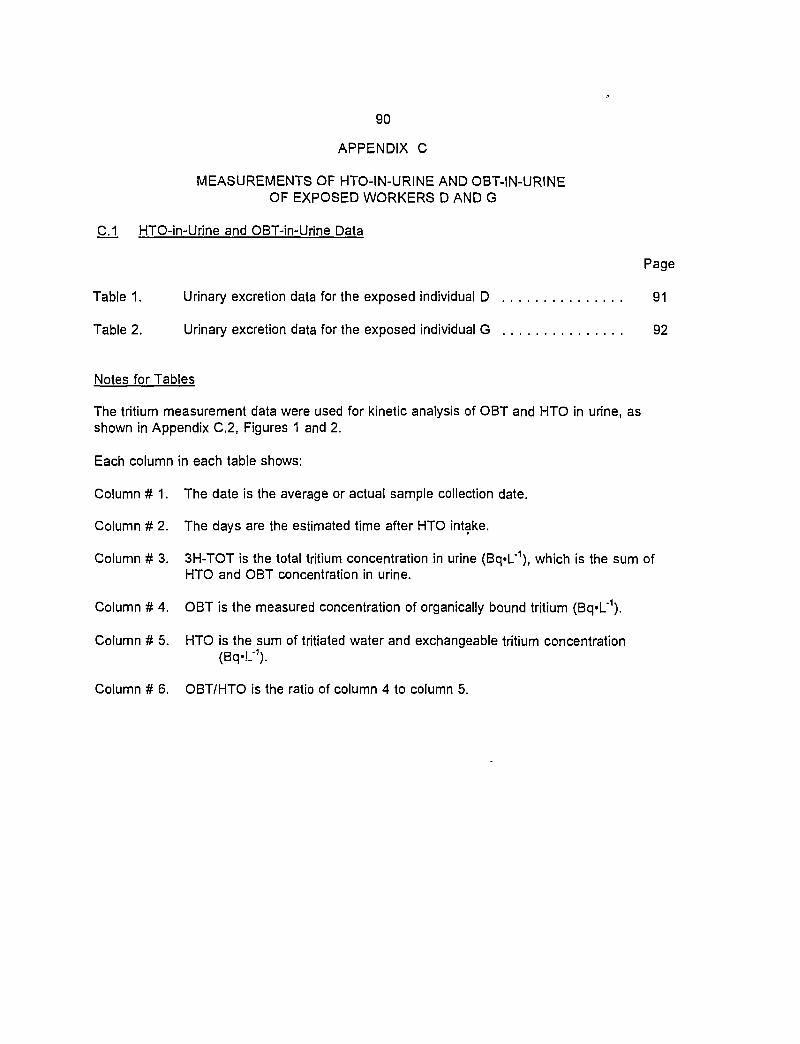
90
APPENDIX C
MEASUREMENTS OF HTO-IN-URINE AND OBT-IN-URINEOF EXPOSED WORKERS D AND G
C.1 HTO-in-Urine and OBT-in-Urine Data
Page
Table 1. Urinary excretion data for the exposed individual D 91
Table 2. Urinary excretion data for the exposed individual G 92
Notes for Tables
The tritium measurement data were used for kinetic analysis of OBT and HTO in urine, asshown in Appendix C.2, Figures 1 and 2.
Each column in each table shows:
Column # 1. The date is the average or actual sample collection date.
Column # 2. The days are the estimated time after HTO intake.
Column # 3. 3H-TOT is the total tritium concentration in urine (Bq«L"1), which is the sum ofHTO and OBT concentration in urine.
Column # 4. OBT is the measured concentration of organically bound tritium (Bq»L"1).
Column # 5. HTO is the sum of tritiated water and exchangeable tritium concentration(Bq-L1).
Column # 6. OBT/HTO is the ratio of column 4 to column 5.
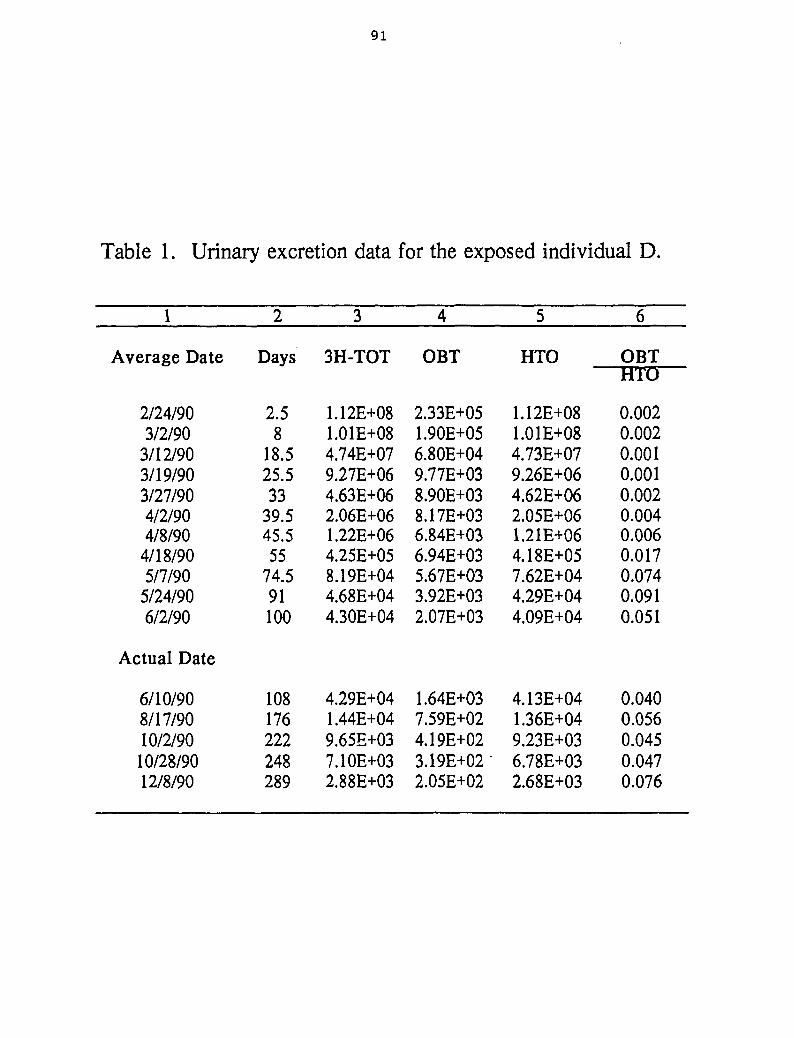
91
Table 1. Urinary excretion data for the exposed individual D.
1
Average Date
2/24/903/2/90
3/12/903/19/903/27/904/2/904/8/90
4/18/905/7/90
5/24/906/2/90
Actual Date
6/10/908/17/9010/2/9010/28/9012/8/90
2
Days
2.58
18.525.533
39.545.555
74.591100
108176222248289
3
3H-TOT
1.12E+081.01E+084.74E+079.27E+064.63E+062.06E+061.22E+064.25E+058.19E+044.68E+044.30E+04
4.29E+041.44E+049.65E+037.10E+032.88E+03
4
OBT
2.33E+051.90E+056.80E+049.77E+038.90E+038.17E+036.84E+036.94E+035.67E+033.92E+032.07E+03
1.64E+037.59E+024.19E+023.19E+022.05E+02
5
HTO
1.12E+081.01E+084.73E+079.26E+064.62E+062.05E+061.21E+064.18E+057.62E+044.29E+044.09E+04
4.13E+041.36E+049.23E+036.78E+032.68E+03
6
OBTHTO
0.0020.0020.0010.0010.0020.0040.0060.0170.0740.0910.051
0.0400.0560.0450.0470.076
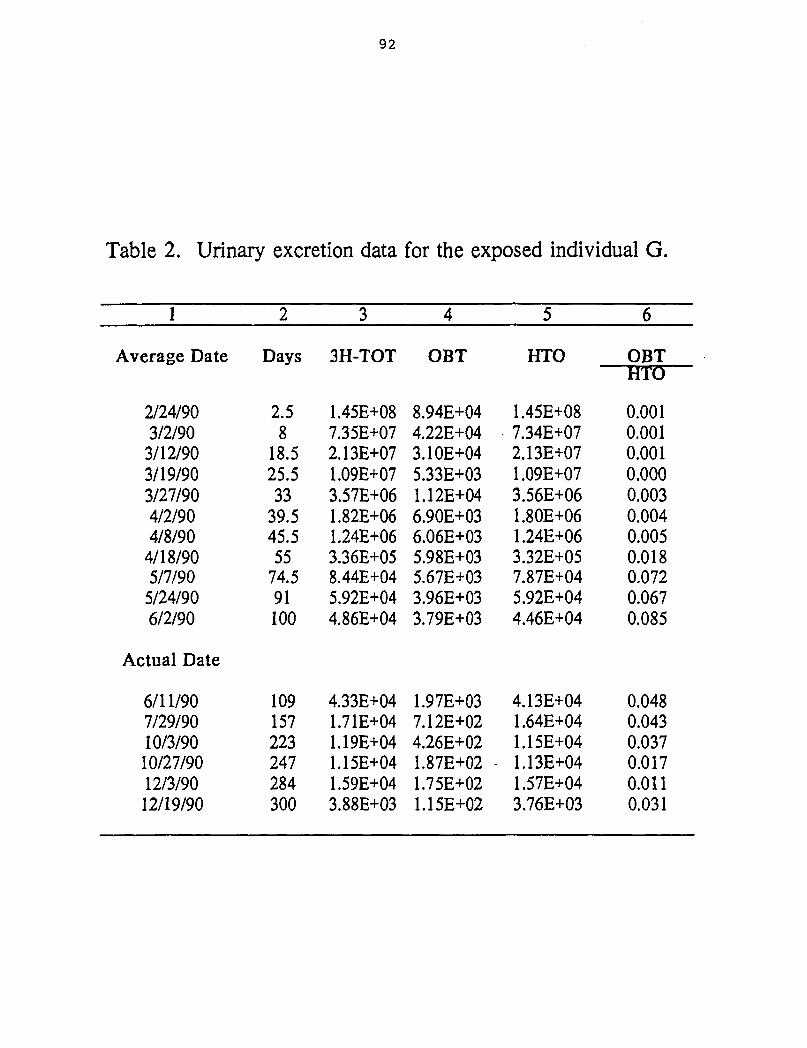
92
Table 2. Urinary excretion data for the exposed individual G.
1
Average Date
2/24/903/2/903/12/903/19/903/27/904/2/904/8/90
4/18/905/7/90
5/24/906/2/90
Actual Date
6/11/907/29/9010/3/9010/27/9012/3/9012/19/90
2
Days
2.58
18.525.533
39.545.555
74.591100
109157223247284300
3
3H-TOT
1.45E+087.35E+072.13E+071.09E+073.57E+061.82E+061.24E+063.36E+058.44E+045.92E+044.86E+04
4.33E+041.71E+041.19E+041.15E+041.59E+043.88E+03
4
OBT
8.94E+044.22E+043.10E+045.33E+031.12E+046.90E+036.06E+035.98E+035.67E+033.96E+033.79E+03
1.97E+037.12E+024.26E+021.87E+02 -1.75E+021.15E+02
5
HTO
1.45E+087.34E+072.13E+071.09E+073.56E+061.80E+061.24E+063.32E+057.87E+045.92E+044.46E+04
4.13E+041.64E+041.15E+041.13E+041.57E+043.76E+03
6
OBTHTO
0.0010.0010.0010.0000.0030.0040.0050.0180.0720.0670.085
0.0480.0430.0370.0170.0110.031
93
C.2 Urinary excretion of HTO-in-urine and OBT-in-urine
Page
Figure 1. Urinary excretion of tritium for the exposed individuals D 94
Figure 2. Urinary excretion of tritium for the exposed individuals G 95
Note for Figures
A non-linear regression fit to HTO and OBT concentration in urine (Bq«L'1) was performed byusing the data from Appendix C.1, Tables 1 and 2. The kinetics results derived from non-linear regression analysis of the data are summarized in Table VI.
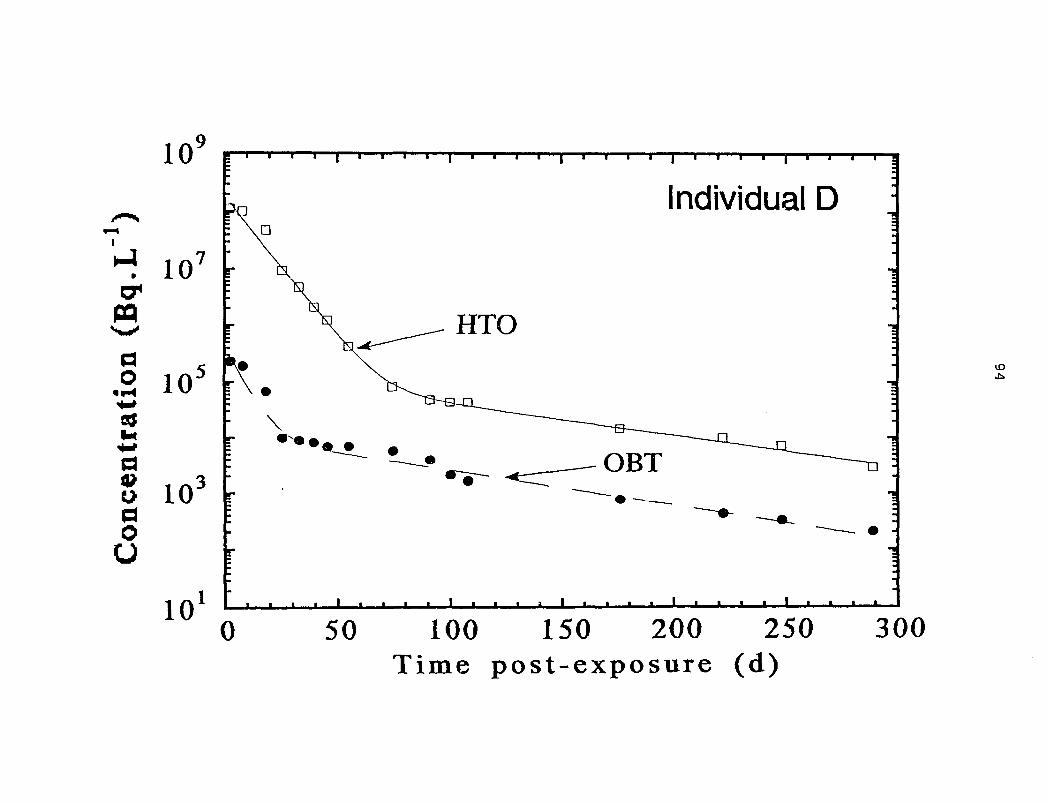
10
: îo
ao 10
doU
10
10
Individual D
ID
• m • j I i t • i l l • • I t
0 50 100 150 200 250Time post-exposure (d)
300
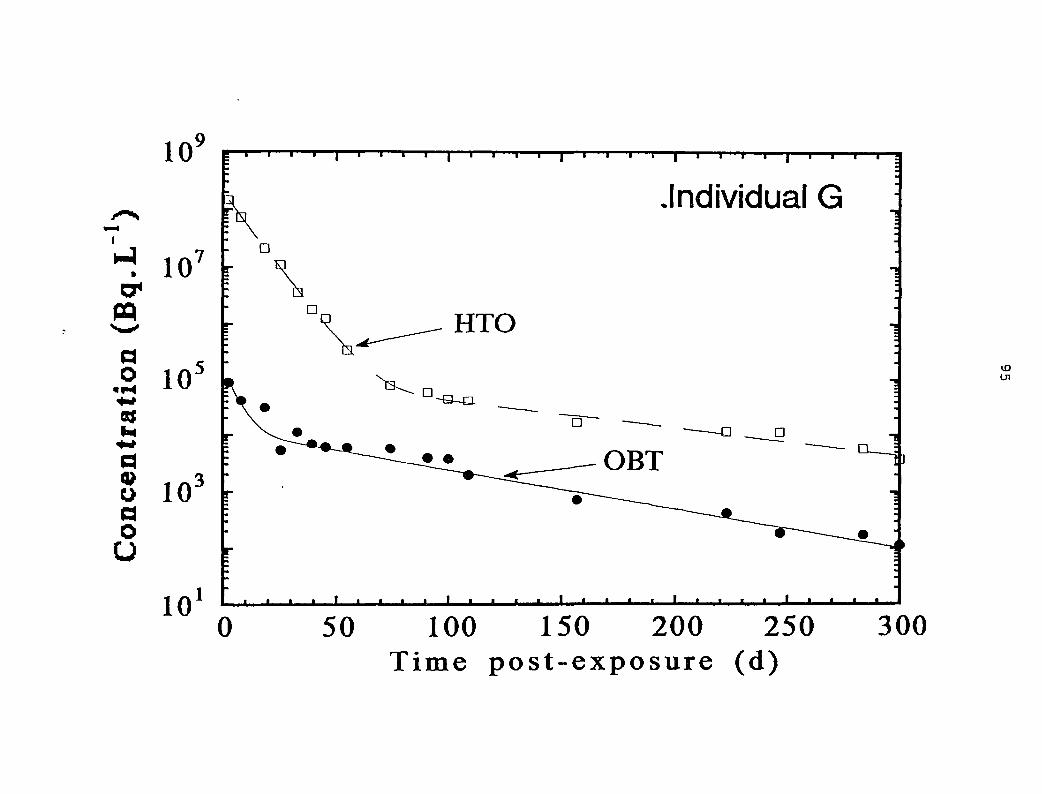
10
107
2 10203
oaoU
10
.Individual G
U l
0 50 100 150 200 250Time post-exposure (d)
300
96
APPENDIX D
OBT DOSE IN VARIOUS BIOLOGICAL SYSTEMS
The fate of OBT after an intake of HTO is dependent primarily on the hydrogen metabolism ofthe human body. Hydrogen accounts for 60% of all atoms in the human body (ICRP, 1975).Every day 2.1 x 1026 hydrogen atoms (5% of all hydrogen atoms in the body) take part inmetabolic processes. The net exchange of tritium with hydrogen always occurs towards lowerconcentrations, and is dependent on the type of chemical bond. The OBT has beenseparated into two general forms: exchangeable OBT (i.e., tritium bound to inorganic moietiesof organic compounds, for example, nitrogen, phosphorus, oxygen and sulphur) andnonexchangeable tritium (i.e., tritium bound to carbon atoms in organic compounds). Theproportion of tritium entering into each form is highly variable (Rochalska and Szot, 1977;Pietrzak-Flis et al., 1978; Kowalska, 1985). Except for essential amino acids, vitamins andfatty acids cannot be synthesized in animals and humans, tritium can be incorporated intoorganic molecules of animals by substitution of ordinary hydrogen. Smith and Taylor (1969)have shown the preferred biochemical reaction through which tritium can be exchanged withhydrogen in exchangeable and non-exchangeable positions in organic matters. According tothem, carbohydrate metabolism is one of the major pathways in mammalian cells on whichtritium from HTO can bind non-exchangeably to carbon. Smith and Taylor (1969) have alsodescribed a range of enzymatic reactions in the glycolytic cycle (anaerobic pathway) andtricarboxylic acid cycle (aerobic pathway) that are expected to incorporate tritium from HTO.Intermediate metabolites of the two cycles serve as building bjocks for proteins, lipids, nucleicacid, and other cellular constituents (Diabate and Strack, 1993).
Tritium attached to inorganic moieties in the body is generally quite labile and exchangesreadily with the hydrogen in the body water pool, and is eliminated with a 10 day biologicalhalf-life (Butler and LeRoy, 1965; Osborne, 1972). On the other hand, tritium in the softtissues as OBT is suspected to be controlled by the residence time of carbon (Smith et al.,1983). This residence time of tritium in association with carbon in the body is particularlyrelevant in tritium dosimetry, since tritium-carbon bond exists virtually in non-exchangeableform. The OBT exists in many chemical forms, and the rates at which tritium releases fromsuch biotransformed organic molecules occur almost entirely through enzyme-mediatedbreakdown of the molecules in which the carbon-tritium is situated (Smith and Taylor, 1969;Taylor et al., 1990). The rate of metabolic breakdown for OBT is known to be very fast(minutes) for many small molecules (e.g., amino acids) or very slow (months, maybe years)for carbon-bound tritium into structural proteins such as collagen .or in the phospholipids ofsome nerve cells (see reviews, Hill and Johnson, 1993; Diabate and Strack, 1993). Thus, theprolonged residency and inhomogeneous distribution of OBT in the body will contribute anincreased average soft-tissue dose over that seen for HTO alone. The increment of the OBTdose will vary, depending on the chemical nature and metabolic turnover rate of thebiomolecules containing the tritium in non-exchangeable position.
We have attempted to show what fraction of the dose could be contributed by OBT, assuminga homogeneous distribution in soft tissues, to the total body dose in section 4.1.1. Theresulting discussion has suggested that after an exposure to tritiated water, the maximumdose from OBT in the body contributes about 10% of the dose due to HTO. This increment in
97
OBT dose increase is in contrast to the reported three times of the total body dose from HTOalone, as shown recently by Rudran (1988). Consistent with our interpretation and informationare animal and human experiments where data have indicated that dose increment from OBTin the body adds about 4-30% to total radiation dose after an exposure to HTO.
Lambert (1969) showed that after the administration of HTO, initially not more than 4% of thetotal tritium activity was tissue-bound. Hatch and Mazrimas (1972) studied mice that werechronically exposed to HTO over a prolonged period of time under laboratory conditions.They observed that the specific activity of tissue-bound tritium activity ranged from 25-30% oftritium activity in tissue-free water. They also observed that an acute intake of HTO led to aninitial fixation of tritium in tissues of about 1-2% of the amount given. They estimated thatapproximately 27% of hydrogen in the bound compartments of the soft tissues is derived fromthe drinking water. Thompson and Ballou (1956) studied adult and newborn rats that hadbeen maintained on HTO for four to six months. Their conclusion was that 20-30% of thehydrogen of most tissue compounds and about 10% of fatty acid hydrogen was apparentlyderived from body water. These aforementioned studies are in fair agreement, showing thatthe specific activity of bound tritium in tissues of adult animals exposed to chronic HTOintakes was 25-30% of the activity of tritium in tissue-free water (Matasudaria, 1986).
The above argument may not hold when tritium is incorporated into growing tissue, such asthat of soft tissue in a fetus. Cahill and Yuile (1970) exposed pregnant rats to various levelsof HTO throughout the gestation period, and showed that the tritium level in the liver offetuses was about 23% of the body water level of the mother.
Commerford et al. (1983) have shown that the bound hydrogen in organic constituents of thesoft tissues is mainly derived from bound constituents of the diet, and not from the bodywater, which appears to constitute an average of 25% of all non-exchangeable hydrogen. Assuch, the relative amount of tritium incorporated into the tissue organic matter from the diet islimited, and does not reach a similar level of equilibrium, as noticed for HTO in the body waterfollowing the drinking of tritiated water. Long-term animal experiments have shown that tritiumfrom tritiated water fails to fully enter all nonexchangeable positions of hydrogen (Van denHoek, 1986). The results indicate that OBT adds about 6% to total radiation dose to the cellsafter exposure to HTO. The data of Jeanmaire and Vernois (1979) are also in reasonableagreement with the additional dose (<10%) from organic fractions of tritium recommended foroccupational HTO exposures.
Takeda (1991) measured uptake and retention of tritium in adult rats chronically exposed toHTO. The results of the dose estimation showed that the contributions of OBT to the effectivedose-rate ranged from 4.3% in testis to 10.6% in liver. The OBT contribution to the totalcumulative dose in the case of a single exposure to HTO were also similar. Thus, the dosecontribution to effective dose-rate during chronic exposure can be related to the OBTcomponent of the total cumulative dose after a single exposure. Pietrzak-Flis et al. (1978)have indicated that the radiation doses from OBT after cessation of chronic exposure totritiated water will contribute more to the total dose than they do during the exposure, becauseof a longer retention of OBT than tritium in body water.
Rodgers (1992) has reported that the steady-state specific activity of OBT in adult miceexposed to HTO alone was roughly 22% of the steady-state specific activity of tissue water, or
98
15% of the activity of their drinking water during exposure. However, when the adult micewere fed a diet with an OBT specific activity significantly higher than the specific activity ofambient water, the specific activity in the mice corresponded to the diet rather than to water.Since the dose-rates under the equilibrium condition of chronic exposure will be proportionalto the total cumulative doses, it is concluded that the differences in tissue-free water andOBT specific activities attained under each exposure regime resulted in marked differences inthe calculated cumulative doses during and following tritium exposure. For mice exposed toHTO alone, tissue-free water was responsible for greater than 95% of the cumulative radiationdose during exposure. In contrast, OBT was responsible for a significant proportion of thecumulative dose to mice during exposure to OBT in the diet (approximately 50% of thecumulative dose). Consequently, it is concluded that the cumulative post-exposure dose ofmice exposed to OBT in the diet alone was approximately an order of magnitude greater thanthe cumulative post-exposure dose of mice exposed to HTO alone.
Balanov et al. (1974) studied the transport kinetics of body fluids in humans after acuteintravenous injection, inhalation and ingestion of HTO. The excretion of tritium in urinefollowing ingestion was followed for 300 days. They proposed a four-compartment metabolicmodel for HTO metabolism. Their dose estimates showed that 2% of the whole-body dosewas due to the organic tritium pool. Except for Rudran's work (1988), other studies, assummarized in Table VIII, also showed that the contribution of tritium fixed in the tissues didnot exceed more than 30% of the total dose in humans from an acute intake of HTO.
Conclusion
It appears from the range of values reported for the total body dose contribution from OBT inanimals and humans that the OBT contribution to total dose after HTO intake is in reasonableagreement with the range of values (< 10% of total dose) derived from the hydrogenphysiological data (Section 4.1.1). Under no circumstances did the dose contribution fromOBT fraction exceed the dose to the body water. Subsequently, it seems logical to acceptthat the dosimetry of an acute HTO intake can be provided by measuring tritium concentrationin urine (body water).
99
APPENDIX E
SOURCES OF UNCERTAINTY IN A VALUES
E.1 Ratio of F*u to Fu : In the estimation of A, for variable rates of fluid intake andexcretion, it is assumed that the fraction of tritium lost through urinary excretion, relative to thetotal excretion of tritium, is independent of time after exposure (Section 4.1.2). However, itcan be expected that the urinary excretion fraction of the exposed workers will change withthe fluid intake rate, which was initially high at times <tc, and then became normal for times>tc post-exposure. In terms of the dosimetric theory, it is important to estimate the magnitudeof the ratio of the urinary fraction before and after time tc that is F*u/Fu, and its affect on thevalue calculated for A.
The rate of urinary excretion for Reference Man is 1.4 L«d'1 with the remainder of the fluid, 1.6L«d'1, lost in feces, sweat and insensible loss via the lungs and skin. This corresponds to avalue for Fu of ~0.47. There is no data available, to our knowledge, of the variation of theurinary excretion fraction with fluid intake rates and physiological parameters, such as anindividual's weight.
The average total fluid intake for workers A-F in the initial period (t < tc) was calculated fromthe tritium urinary excretion rate constant X*w, as having the value of 5.0 ±1.0 L»d'1. Theaverage value for F*y, based on the estimated value of the fluid intake by drinking, has avalue of 0.59 ± 0.07. It is assumed that urinary excretion fraction in the later part of the study,Fu corresponds to the value for Reference Man of 0.47.
Therefore, the average value of F*u/Fu is estimated as 1.26 ± 0.14 (range 0.97 - 1.41). Thecalculated value of A using this estimation of F*u/Fu is compared with the former assumption,but normal for employed in section 4.1.2 that F*u/Fu is unity. The average value of A withF*u/Fu as unity is 6.2 ± 1.3% of the HTO dose, and the value of A increases to 9.4 ± 2.9%(range 3.8 - 13.9%) for an average F*u/Fu of 1.26. This is evidence that the average increasein the A value is 34 ± 19% (range -7% to 57%). Therefore the urinary excretion ratio F*u/Fu
plays an important role in the estimation of the OBT dose by the computational methodsdescribed in this report.
Account needs to taken of the urinary excretion fraction for exposed individuals who havevariable rates of body water clearance through other excretory pathways than via the urine.For example, differences in the environmental conditions (e.g., tropical versus temperate)affecting the humidity and temperature, will also affect the ratio of body water lost in urinecompared to other pathways (Sandarangani et al., 1971; Rudran et al., 1992).
E.2 Fitted Parameters: The uncertainty in A values due to statistical errors on the fittedparameters of the bivariate bi-exponential function (a, and \.) was investigated. The averagestandard deviation for a*w and aw of the first component of the function was about 3% and9%, respectively. Similarly, for X*w and 1^, the standard deviations were about 2% and 3%,respectively. The parameters of longer-term components (a0 and Xo) had larger standarddeviation values than the first component of the bivariate bi-exponential function. The averagestandard deviation values for aoand Xo were 21% and 12%, respectively. The large
100
uncertainty in the longer-term component is attributed to the limited number of measurementdata (range, 4 to 22) from a period between 100 d and 300 d post-exposure, compared to alarger set of data (range, 34 to 53) for the initial period (< 100 d post-exposure).
The uncertainties in AV values were propagated from the covariance matrix produced by thefitting parameters for individual exposed workers. The average percentage error value foreight exposed workers was estimated to be 26 ± 12%, with a range of from 10 to 40%.
E.3 HTO Metabolic Models: In the derivation of the OBT dose fraction in section 4.1.1, it wasassumed that all tritium bound to organic fraction in the body was catabolized to HTO beforeexcretion, and that no OBT was excreted in urine. As we have measured a detectablequantity of OBT in all urine samples taken post-exposure from exposed workers, thisobservation may affect the A values. It can be expected that the simplifying assumption thatno OBT is excreted in urine is a minor uncertainty in the evaluation of A, as the time-integratedactivity of OBT-in-urine, over the investigation period, is less than 1% of the cumulative activityof HTO-in-urine (see section 3.1.3). However, the magnitude of the uncertainty thisassumption produces in A values was investigated further by comparing the values for Agenerated by two forms of a metabolic model: one form that took no account of OBT beingexcreted in urine and a second form modified with pathways for the excretion of OBT directlyto urine (unpublished results).
The metabolic model chosen for this numerical analysis is described by Saito (1992), andconsists of three compartments: one representing HTO in body water and two OBTcompartments (of the latter, one with fast turnover rate and the other with slow clearancerate). In the original form of the model, all OBT is assumed to be catabolized to HTO prior tothe excretion of tritium-in-urine. The compartmental analysis of this model was compared withthe modified form of Saito's model (designated as the HTO-OBT excretion model), whichaccounts for the excretion of OBT to urine directly from the fast and slow OBT compartments.The rate constants representing the loss of OBT-in-urine for the modified model were chosenon the basis of the pool sizes of organic matter for Reference Man (adjusted for theindividual's weight) and the amount of organic matter present in urine and feces.
The pool activities and the rate constants of the original and modified version of Saito's modelwere varied until the excretion of total tritium-in-urine, or alternatively the excretion of HTO-in-urine and OBT-in-urine, were close to the urinary kinetics observed for two of the exposedworkers, D and G: for whom the bioassay data for HTO-in-urine and OBT-in-urine wasobtained. The models were run generating tritium activity concentrations in urine for timespost-exposure (0-300 d) that matched the sample times of the exposed workers. Theinfluence of "experimental noise" on the urinary excretion data was simulated. The tritium-in-urine activity concentrations were adjusted randomly by an amount whose magnitude anddistribution approximated the uncertainty in the measurements.
It was assumed that variable rates of fluid intake and urine excretion had occurred. Abivariate bi-exponential fit was applied to the simulated tritium-in-urine data generated fromSaito's model and HTO-OBT excretion model. The dose fractions due to metabolized OBTwere computed by Equation (28) (Section A A.2.2) from the best-fit parameters for thesimulated tritium-in-urine data that are obtained from the two models. The values of A fromsimulated data obtained from two models were differed by 1-2%, indicating that the
101
mathematical analysis employed to calculate the A values was not compromised by theassumption that all the OBT is catabolized to HTO before being excreted in urine. The overalluncertainty in the OBT dose contribution was estimated to be about 50% at the 95%confidence level (Appendix E, Table 1).
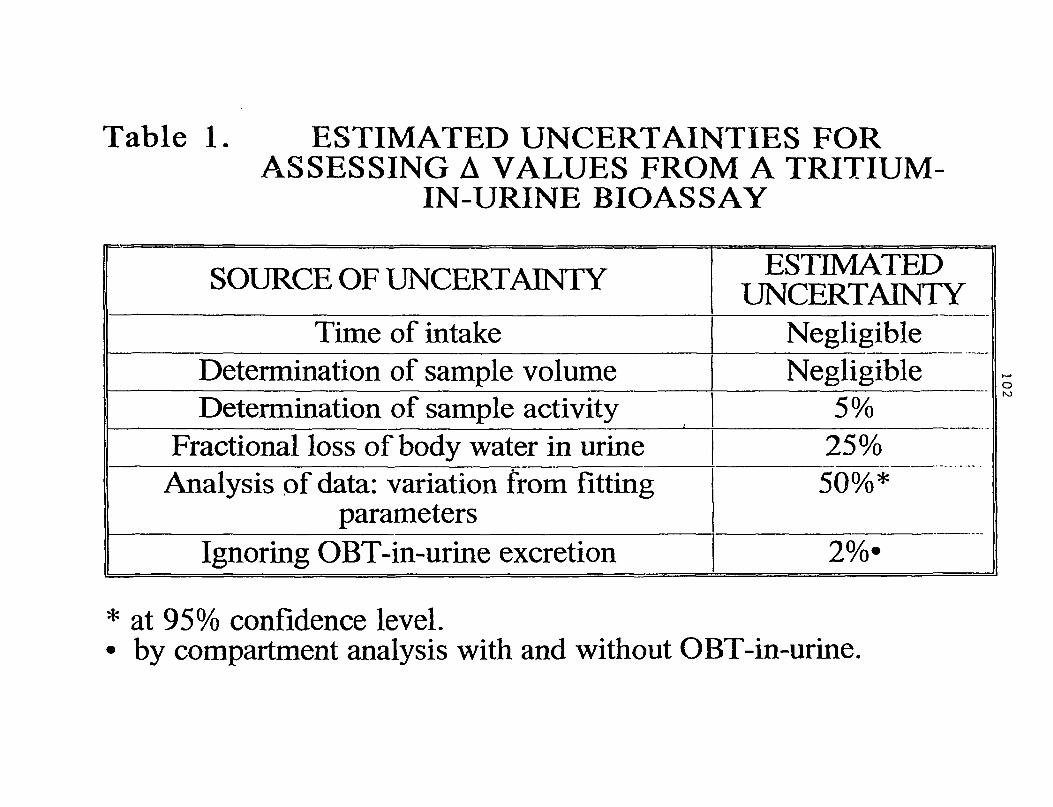
Table 1. ESTIMATED UNCERTAINTIES FORASSESSING A VALUES FROM A TRITIUM-
IN-URINE BIOASSAY
SOURCE OF UNCERTAINTY
Time of intakeDetermination of sample volumeDetermination of sample activity
Fractional loss of body water in urineAnalysis of data: variation from fitting
parametersIgnoring OBT-in-urine excretion
ESTIMATEDUNCERTAINTY
NegligibleNegligible
5%25%50%*
obo
* at 95% confidence level.• by compartment analysis with and without OBT-in-urine.