the sodium current underlying action potentials in guinea pig hippocampal ca1 neurons
TRANSCRIPT
The Sodium Current Underlying Action Potentials in Guinea Pig Hippocampal CA1 Neurons
P. SAH, A. J . G I B B , a n d P. W. GAGE
From the Depar tment of Physiology, John Curtin School of Medical Research, Austra- lian National University, Canberra 2601, Australia
A B S T R A C T Neurons were acutely dissociated f rom the CA1 region of hip- pocampal slices f rom guinea pigs. Whole-cell recording techniques were used to record and control membrane potential. When the electrode contained KF, the average resting potential was about - -40 mV and action potentials in cells at - -80 mV (current-clamped) had an amplitude > 100 mV. Cells were voltage-clamped at 22-24~ with electrodes containing CsF. Inward currents generated with depolarizing voltage pulses reversed close to the sodium equi- librium potential and could be completely blocked with tetrodotoxin (1 /zM). The amplitude of these sodium currents was maximal at about --20 mV and the amplitude of the tail currents was linear with potential, which indicates that the channels were ohmic. The sodium conductance increased with depo- larization in a range f rom --60 to 0 mV with an average half-maximum at about - -40 mV. The decay of the currents was not exponential at potentials more positive than - -20 mV. The time to peak and half-decay time of the currents varied with potential and temperature. Half of the channels were inactivated at a potential of - -75 mV and inactivation was essentially com- plete at - -40 to - -30 mV. Recovery from inactivation was not exponential and the rate varied with potential. At lower temperatures, the amplitude of sodium currents decreased, their time course became longer, and half-maxi- mal inactivation shifted to more negative potentials. In a small fraction of cells studied, sodium currents were much more rapid but the voltage depen- dence of activation and inactivation was very similar.
I N T R O D U C T I O N
Signal transmission in nervous systems depends on action potentials that are genera ted by vo l tage-dependent conductances. In squid axon and o ther per iph- eral nerves, m e m b r a n e depolar izat ion activates a vol tage-dependent sodium con- ductance and it is generally thought that a sodium conductance with similar p roper t i es underl ies action potentials in neurons in the mammal ian central ner- vous system. This assumpt ion has been difficult to test experimentally, both because it is difficult to insert two electrodes into mammal ian central neurons in o rde r to vol tage-clamp the m e m b r a n e and because it is not possible to control
Address reprint requests to Dr. P. W. Gage, Dept. of Physiology, John Curtin School of Med- ical Research, Australian National University, P.O. Box 334, Canberra 2601, Australia.
J. GEN. PHYSIOL. (~ The Rockefeller University Press �9 0022-1295/88/03/0373/26 $2.00 373
Volume 91 March 1988 373-398
374 T H E J O U R N A L O F G E N E R A L P H Y S I O L O G Y �9 V O L U M E 91 �9 1 9 8 8
the membrane potential in axonic and dendritic processes o f neurons with elec- trodes in the soma. A voltage-dependent sodium conductance has been charac- terized in cat motoneurons (Barrett and Crill, 1980), in rat nodose ganglion cells (Ikeda et al., 1986), and in cultured sympathetic ganglion neurons (Belluzzi and Sacchi, 1986), but not in cerebral neurons. We have used a single-electrode, switching voltage clamp (Brenneke and Lindermann, 1974; Finkel and Redman, 1985) to control membrane potential in CA1 neurons acutely dissociated (Numann and Wong, 1984) f rom guinea pig hippocampal slices. The dissocia- tion procedure p roduced many cells consisting of a soma with few processes that generated large sodium currents in response to membrane depolarization. Pre- liminary accounts o f some of these results have been published elsewhere (Sah et al., 1986).
M E T H O D S
Hippocampal Slices
All experiments were performed with cells dissociated from the hippocampus of 300- 500-g male or female adult guinea pigs. Animals were killed by cervical dislocation and the brain was quickly exposed. The brain was hemisected and dissected in cold (4-8"C) Krebs solution of the following composition (millimolar): 125 NaC1, 5.0 KCI, 25 NaHCO3, 2 MgSO4, 2.5 CaCI~, 1.2 NaH2PO4, 11 glucose, pH 7.3 when bubbled with 95% 02/5% CO2. The hemisected brain was then glued to the stage of a Vibraslice (model 752, Campden Instruments) with cyanoacrylic glue. Sections 600 ~m thick were then taken through the cerebral cortex and hippocampus to produce transverse hippo- campal slices, which were transferred to a dish of cold, oxygenated Krebs. The CA1 region in each slice was isolated using fine iridectomy scissors. This piece of tissue was then cut into two or three smaller pieces, each ~ 1.5 mm square. Dissociation was per- formed with a protocol very similar to that described by Numann and Wong (1984).
Dissociated Cells
Papain (24 U/ml) and cysteine (5 mM) (Sigma Chemical Co., St. Louis, MO) were dis- solved in 15 ml of oxygenated Krebs. Pieces of hippocampus were placed in this solution at room temperature and rapidly stirred. After ~90 min, the pieces were taken out of the papain solution with a Pasteur pipette and transferred to a holding beaker containing Krebs solution. Individual pieces of tissue were removed and mechanically dissociated as needed by trituration with a fire-polished Pasteur pipette in 3-4 ml of solution. The dispersed cells and debris were decanted into 5-cm plastic petri dishes where, after 5- 10 min, the cells settled to the bottom. The petri dishes were mounted on the stage of an inverted phase-contrast microscope (Olympus IM) and viewed at a magnification of 400. Cell viability was aided by blowing a stream of moistened 95% O~/5% CO2 over the surface of the dish. Although the yield of cells was extremely variable, 10-20 healthy cells could be obtained, on average, from each piece of tissue.
Electrodes Patch recording electrodes were made from hematocrit tubes (borosilicate glass) on a modified electrode puller (David Kopf Instruments, Inc., Tujunga, CA) and coated with Sylgard (Dow Corning Corp., Midland, MI) to within 100 #m of the tip to reduce elec- trode capacitance. Electrodes were held in an electrode holder with a side arm allowing
SAFI ET AL. Sodium Conductance in Mammalian Neurons 375
suction to be applied to the electrode interior. The electrode holder was plugged directly into the )< 1 headstage of an Axon 2A (Axon Instruments, Inc., Burlingame, CA) single- electrode voltage-clamp device.
Electrodes were filled with a solution containing (millimolar): 140 CsF, 10 NaCI, 10 HEPES-CsOH, 11 EGTA, pH 7.2. In some experiments, the CsF was replaced with KF and the pH was balanced with HEPES-KOH. These electrodes had resistances of 1-3 M~. High intracellular fluoride, as noted elsewhere (Fernandez et al., 1984; Kay and Wong, 1986), greatly aided recording stability.
Voltage Clamp
Under visual control, the electrode tip was pressed against the surface of the cell and gentle suction was applied to the electrode interior to form an electrode-cell membrane seal of several gigohms' resistance (Hamill et al., 1981). Further suction and hyperpolar- ization of the patch resulted in membrane breakdown, giving low-resistance access to the interior of the cell.
With a switched current or voltage clamp, series resistance is not a source of error, but it was found necessary to keep the electrode resistance low in order to achieve the rapid switching rate and high clamp gain necessary to clamp the sodium currents ade- quately. Typically, recordings were made with switching rates between 20 and 40 kHz and a gain setting of 20-50 nA/mV. The headstage of the clamp was continuously mon- itored to ensure that the voltage across the electrode had settled completdy before the membrane potential was sampled (Finkel and Redman, 1985). Under optimum condi- tions, with the clamp switching at 50 kHz and a gain of 50 nA/mV, the membrane volt- age in response to a small voltage step reached 95% of the command voltage within 500 ~s.
Data Analysis
Voltage-clamp commands and data sampling were performed on-line with a PDP 11/23 microcomputer (Digital Equipment Corp., Marlboro, MA). Voltage and current traces were filtered at 4 kHz (four-pole Bessel, --3 dB) and sampled at 10 or 20 kHz. In some experiments, data acquisition was performed with a digital oscilloscope (5211A, Tektro- nix, Inc., Beaverton, OR) at rates of up to 200 kHz and then transferred to the computer.
Currents were analyzed off-line on a PDP 11/44 computer (Digital Equipment Corp.) after subtraction of scaled leakage and capacitive currents obtained from hyperpolarizing steps (<50 mV). For each trace, the peak amplitude was measured from the peak inward current. The time to peak was measured from the onset of the voltage step.
Tetrodotoxin (T/X; Sankyo, Tokyo, Japan) and internal CsF were used to block sodium and potassium currents, respectively. In some experiments, the bath temperature was controlled with a Peltier element mounted on the microscope stage. The tempera- ture of the dish was monitored by a small thermocouple placed in the bath solution. Most experiments were done at 22-24"C except where stated otherwise.
R E S U L T S
Cells obtained by dissociation displayed a wide variation in size and morphology. Healthy cells, recognized by their "shiny" appearance under phase-contrast optics (Numann and Wong, 1984; Gray and Johnston, 1985; Kay and Wong, 1986), normally retained some short ( < 1 0 0 #m) cell processes. The soma of most o f the larger cells was bipolar, which suggests that they were probably pyr-
3 7 6 T H E J O U R N A L O F G E N E R A L P H Y S I O L O G Y �9 V O L U M E 91 �9 1 9 8 8
amidal cells (Kay and Wong, 1986). In this study, we have not discriminated between cells of different morphology but have tended to examine the larger cells, which turned out to have similar electrophysiological properties, except that a few (15 of 120) had faster sodium currents than the others. The type of sodium current more commonly seen will be described in detail, followed by a brief account of the "fast" sodium current.
Passive Electrical Properties
The average resting membrane potential, recorded from 28 cells with electrodes containing 150 mM KF, was --40 ___ 2 mV (mean + 1 SEM). This is more depo- larized than expected for a membrane much more permeable to potassium than to other ions: with 5 mM K in the extracellular solution, the potassium equilib- rium potential would have been --86 mV. The most likely explanation for the large difference between the recorded resting potential and the potassium equi- librium potential is that the stumps of fractured axons and dendrites formed a nonselective shunt across the surface membrane (see Discussion).
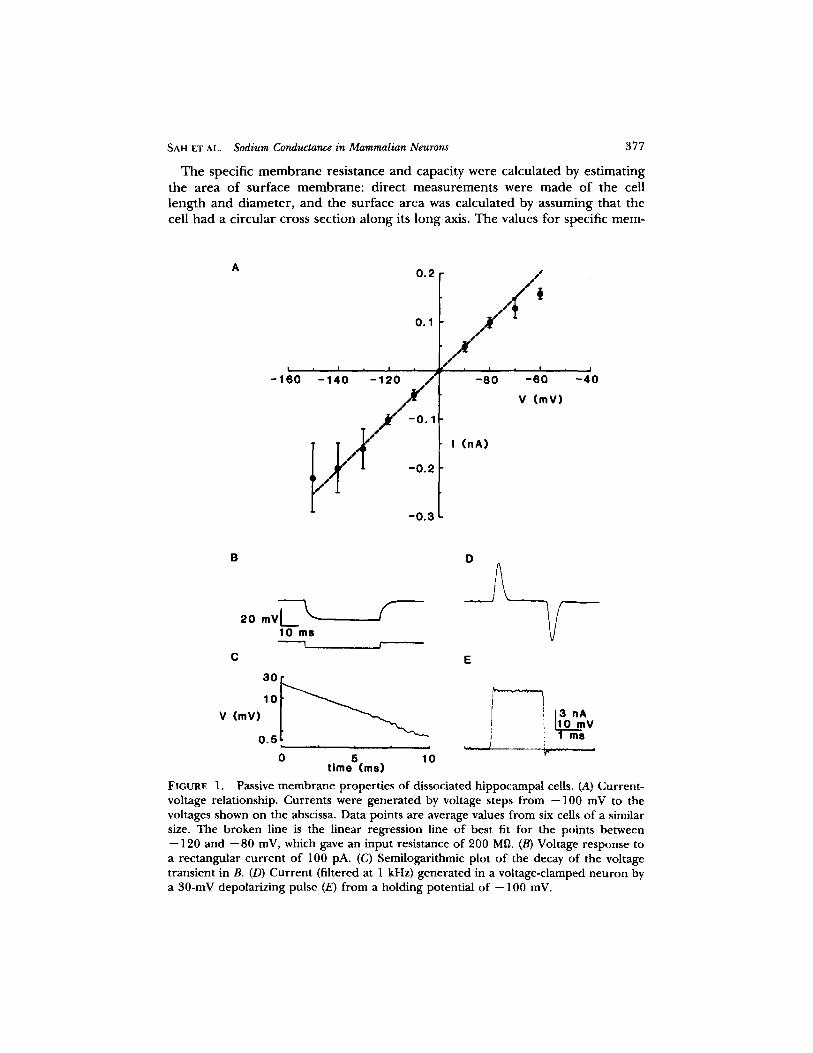
The input resistance of cells was determined either from the change in mem- brane potential produced by injection of rectangular current pulses or from the currents that flowed in response to steps in potential in voltage-clamped cells. The relationship between the clamp potential and current recorded in six cells (holding potential, --100 mV) can be seen in Fig. 1 A. The current-voltage curve was linear at membrane potentials between -- 120 and -- 80 mV and calculations of membrane resistance and capacity were therefore made from measurements in this potential range. The change in potential (upper trace) recorded in response to a hyperpolarizing current of 100 pA (lower trace) is shown in Fig. 1 B. A semilogarithmic plot of V(oo) -- V(t) vs. time [V(~) and V(t) were the changes in potential at "infini te" time and time t, respectively] is shown in Fig. 1 C. It can be seen that the potential changed exponentially with a single time constant, which indicates that the cell was isopotential (Rail, 1977). With larger current pulses, the change in potential was no longer a single exponential, prob- ably because of activation of the inward rectifier potassium channel (Adrian et al., 1970). The membrane time constant of a cell (~'m) was obtained by fitting the potential change with a single exponential using a nonlinear least-squares algo- rithm. Time constants had values of 1.2-10 ms, with a mean of 5.0 + 0.8 (n = 16). The input resistance (Ro), measured from V(oo)/I (I was the amplitude of the current pulse), ranged from 100 to 1,000 M~, depending on the size of the cell. Another method used to measure the passive electrical properties was to record currents generated by small hyperpolarizing or depolarizing voltage steps in a cell voltage-clamped at a holding potential of --100 inV. A typical current generated by a 30-mV depolarizing step (Fig. 1 E) is shown in Fig. 1 D. Values for Ro calculated f rom the slope of current-voltage relationships around -- 100 mV were similar to those obtained with the current-clamp method.
Input capacity (Co) was calculated either from ~'m = RoCo or from the ratio of the integral of the capacity current to the amplitude of the voltage step. Values for Co obtained in this way ranged from 5 to 50 pF, again depending on the size of the cell. The average value was 30.7 + 5.8 pF (n = 28).
SAH E'r AL. Sodium Conductance in Mammalian Neurons 377
T he specific m e m b r a n e res is tance and capaci ty were calcula ted by es t imat ing the a rea o f sur face m e m b r a n e : d i rec t m e a s u r e m e n t s were m a d e o f the cell l eng th a nd d iameter , a nd the sur face a rea was calcula ted by assuming that the cell ha d a c i rcu lar cross sect ion a long its long axis. The values fo r specific m e m -
A
I
- 1 6 0
0 . 2
0 .1
i I , I i
- 1 4 0 - 1 2 0 _s~sS~-0.1 ~ / - 0 . 2
- 0 . 3
, /
i i J i ,
- 8 0 - 6 0
v (mv)
I ( n A )
I
- 4 0
B D
2o m v L \ F 10 ms
C E
1 0
V (mY)
0 5 t , , , Z
0 5 10 time (ms)
3 nA 10 mV 1 ms
FIGURE 1. Passive membrane properties of dissociated hippocampal cells. (.4) Current- voltage relationship. Currents were generated by voltage steps from --100 mV to the voltages shown on the abscissa. Data points are average values from six cells of a similar size. The broken line is the linear regression line of best fit for the points between --120 and --80 mV, which gave an input resistance of 200 Mg. (B) Voltage response to a rectangular current of 100 pA. (C) Semilogarithmic plot of the decay of the voltage transient in B. (D) Current (filtered at 1 kHz) generated in a voltage-clamped neuron by a 30-mV depolarizing pulse (E) from a holding potential of -- 100 mV.
378 T H E J O U R N A L O F G E N E R A L P H Y S I O L O G Y �9 V O L U M E 91 . 1988
b rane capacity ranged f rom 0.5 to 1.5 # F . c m -2, with a mean value o f 1.0 _+ 0.2 # F . c m -2 (n = 16). The specific m e m b r a n e resistance ranged f rom 3.6 to 10.8 k f l . cm ~, with a mean value o f 5.8 + 1.4 kf l . cm z (n = 7).
Action Potentials
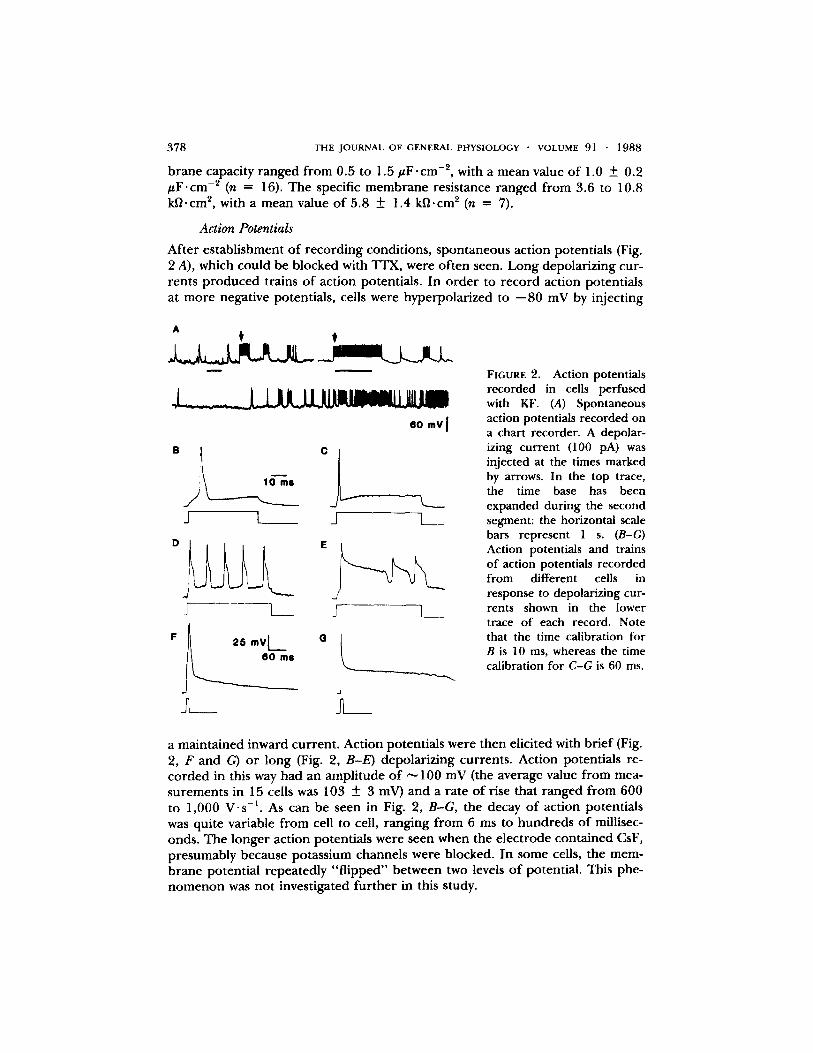
After es tabl ishment o f record ing conditions, spontaneous action potentials (Fig. 2 A), which could be blocked with TTX, were of ten seen. Long depolarizing cur- rents p roduced trains o f action potentials. In o rde r to record action potentials at more negative potentials, cells were hyperpolar ized to - -80 mV by injecting
A t
60 mV [
. t
/ L _J L
_n
[. J I
60 ms
i _
FIGURE 2. Action potentials recorded in cells perfused with KF. (A) Spontaneous action potentials recorded on a chart recorder. A depolar- izing current (100 pA) was injected at the times marked by arrows. In the top trace, the time base has been expanded during the second segment: the horizontal scale bars represent 1 s. (B-G) Action potentials and trains of action potentials recorded from different cells in response to depolarizing cur- rents shown in the lower trace of each record. Note that the time calibration for B is 10 ms, whereas the time calibration for C-G is 60 ms.
a mainta ined inward current . Action potentials were then elicited with br ief (Fig. 2, F and G) or long (Fig. 2, B-E) depolar izing currents . Action potentials re- corded in this way had an ampl i tude o f "~ 100 mV (the average value f rom mea- surements in 15 cells was 103 _+ 3 mV) and a rate o f rise that ranged f rom 600 to 1,000 V" s-~. As can be seen in Fig. 2, B-G, the decay o f action potentials was quite variable f rom cell to cell, ranging f rom 6 ms to hundreds o f millisec- onds. The longer action potentials were seen when the electrode conta ined CsF, presumably because potass ium channels were blocked. In some cells, the mem- b rane potent ial repeatedly " f l ipped" between two levels o f potential. This phe- n o m e n o n was not investigated fu r the r in this study.
S A H ET AL. Sodium Conductance in Mammalian Neurons 3 7 9
Sodium Currents
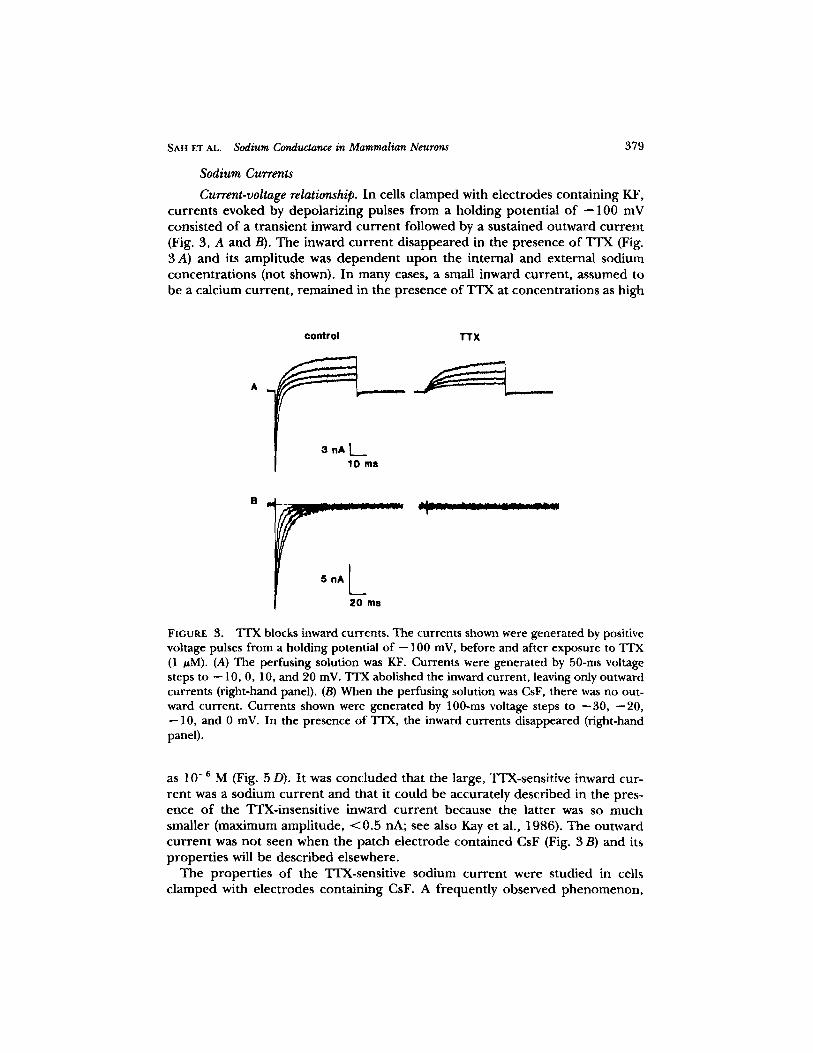
Current-voltage relationship. In cells c lamped with electrodes containing KF, currents evoked by depolar iz ing pulses f rom a holding potent ial o f - -100 mV consisted o f a t ransient inward cur ren t followed by a sustained outward cur ren t (Fig. 3, A and B). The inward cur ren t d i sappeared in the presence o f T I X (Fig. 3 A) and its ampl i tude was dependen t u p o n the internal and external sodium concent ra t ions (not shown). In many cases, a small inward current , assumed to be a calcium current , r emained in the presence of TTX at concentra t ions as high
control TTX
[ 10 ms
B ,.
5 nA ~__
20 ms
- W . . . . . . . . . . . . .
FIGURE 3. TFX blocks inward currents. The currents shown were generated by positive voltage pulses from a holding potential of --100 mV, before and after exposure to T r x (1 #M). (A) The perfusing solution was KF. Currents were generated by 50-ms voltage steps to -- 10, 0, 10, and 20 mV. T r x abolished the inward current, leaving only outward currents (right-hand panel). (B) When the perfusing solution was CsF, there was no out- ward current. Currents shown were generated by 100-ms voltage steps to --30, --20, --10, and 0 mV. In the presence of TIX, the inward currents disappeared (right-hand panel).
as 10 -6 M (Fig. 5 D). I t was concluded that the large, TTX-sensitive inward cur- ren t was a sodium cur ren t and that it could be accurately described in the pres- ence o f the TrX-insensi t ive inward cur ren t because the latter was so much smaller (max imum ampli tude, < 0 . 5 hA; see also Kay et al., 1986), The outward cur ren t was not seen when the pa tch e lect rode conta ined CsF (Fig. 3 B) and its p roper t ies will be descr ibed elsewhere.
The proper t ies o f the TTX-sensitive sodium cur ren t were studied in cells c lamped with electrodes containing CsF. A frequent ly observed p h e n o m e n o n ,
3 8 0 THE J O U R N A L OF GENERAL PHYSIOLOGY �9 VOLUME 9 1 �9 1 9 8 8
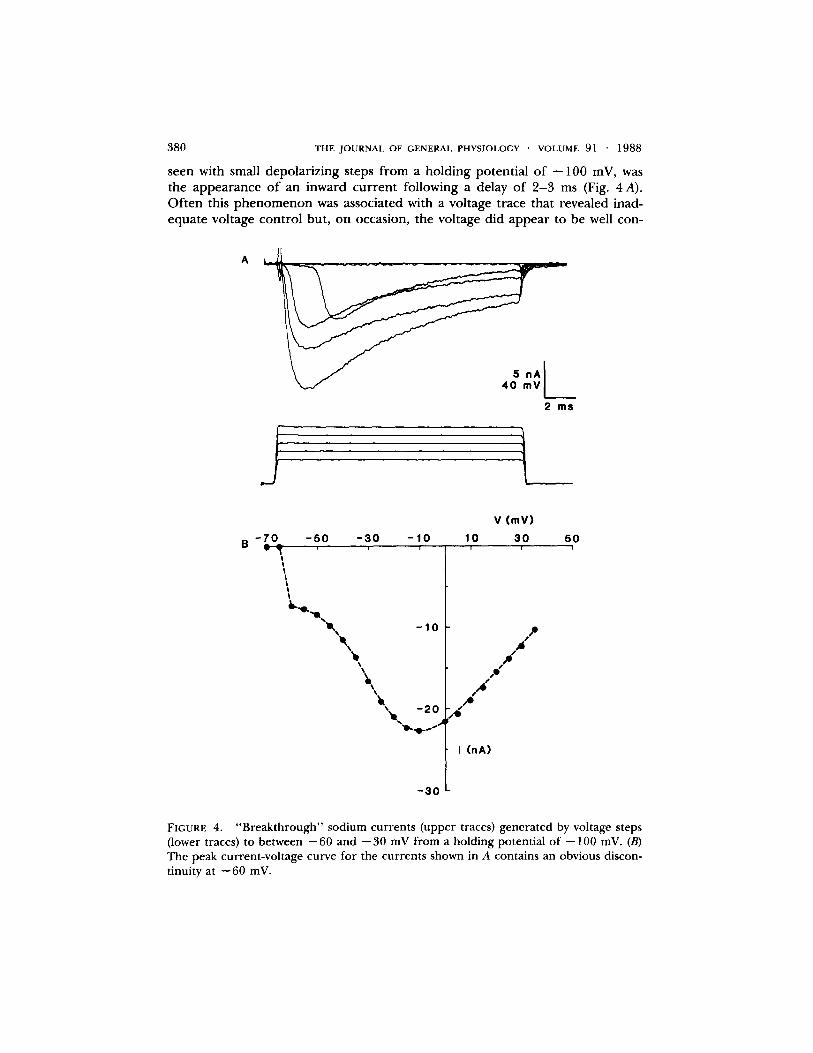
seen with small depolar izing steps f rom a holding potent ial o f - -100 mV, was the appearance o f an inward cur rent following a delay of 2 - 3 ms (Fig. 4 A). Of t en this p h e n o m e n o n was associated with a voltage trace that revealed inad- equate voltage control but, on occasion, the voltage did appea r to be well con-
A * _ ~ , T , _ v _ v - _ _ , - v - . . . . . . ,, - -
5 nA
2 ms
j ,
s - 7 0 -50 t |
t l l t I
v (my)
- 3 0 - 1 0 10 3 0 5 0 i 1 i i i
- 1 0
'~,,~ - 2 0
' ~ , l b . t p ~ , , . ' J
- 3 0
,P
I ( nA )
FIGURE 4. "Breakthrough" sodium currents (upper traces) generated by voltage steps (lower traces) to between --60 and --30 mV from a holding potential of --100 mV. (B) The peak current-voltage curve for the currents shown in A contains an obvious discon- tinuity at --60 mV.
SAH ET AL. Sodium Conductance in Mammalian Neurons 3 8 1
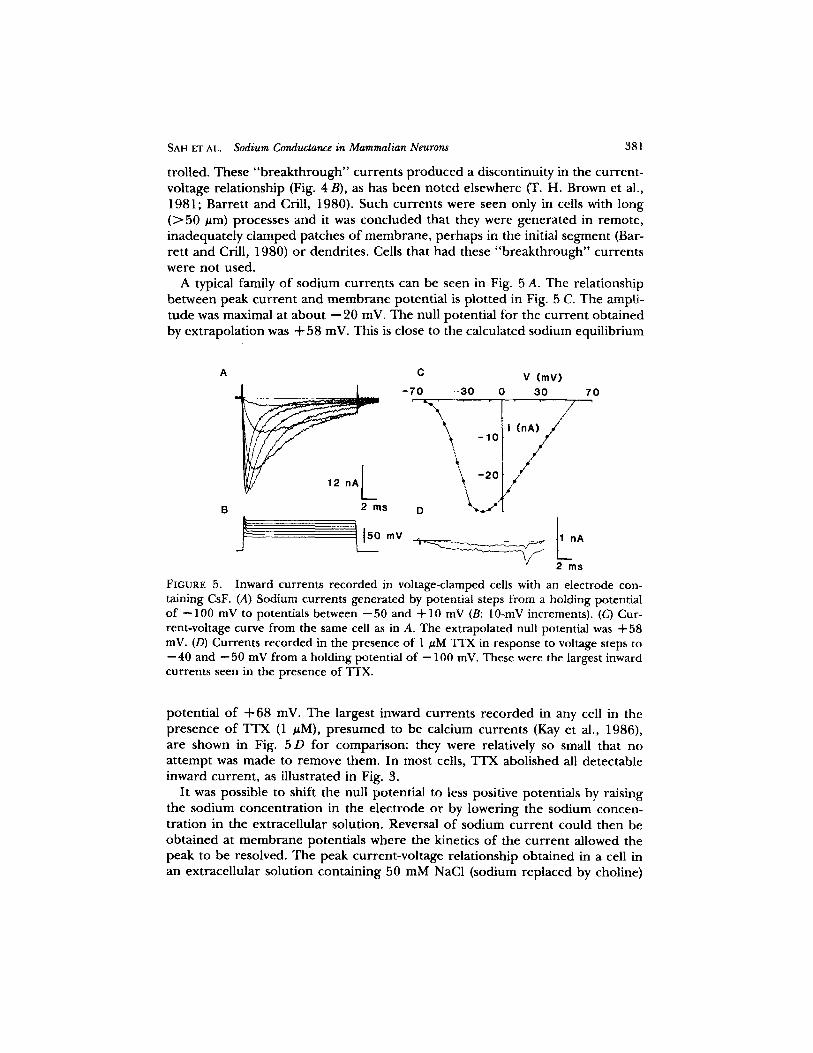
trolled. These " b r e a k t h r o u g h " currents p roduced a discontinuity in the current- voltage relat ionship (Fig. 4 B), as has been no ted elsewhere (T. H. Brown et al., 1981; Barret t and Crill, 1980). Such currents were seen only in cells with long ( > 5 0 #m) processes and it was concluded that they were genera ted in remote , inadequately c lamped patches o f m e m b r a n e , pe rhaps in the initial segment (Bar- re t t and Crill, 1980) or dendrites. Cells that had these " b r e a k t h r o u g h " currents were not used.
A typical family o f sodium currents can be seen in Fig. 5 A. The relationship be tween peak cur ren t and m e m b r a n e potential is p lot ted in Fig. 5 C. The ampli- tude was maximal at abou t - -20 inV. The null potential for the cur ren t obta ined by ext rapola t ion was + 58 inV. This is close to the calculated sodium equil ibrium
A C V (mY)
\\ 10' -20-/
/ B 2 ms D ' ~
2 m s
FIGURE 5. Inward currents recorded in voltage-clamped cells with an electrode con- taining CsF. (A) Sodium currents generated by potential steps from a holding potential of --100 mV to potentials between --50 and 4-10 mV (B: 10-mV increments). (C) Cur- rent-voltage curve from the same cell as in A. The extrapolated null potential was + 58 inV. (D) Currents recorded in the presence of 1 #M "ITX in response to voltage steps to --40 and --50 mV from a holding potential of --100 mV. These were the largest inward currents seen in the presence of TTX.
potent ial o f + 68 inV. The largest inward currents r ecorded in any cell in the presence o f TTX (1 uM), p r e sumed to be calcium currents (Kay et al., 1986), are shown in Fig. 5 D for comparison: they were relatively so small that no a t t empt was made to remove them. In most cells, TTX abolished all detectable inward current , as i l lustrated in Fig. 3.
I t was possible to shift the null potent ial to less positive potentials by raising the sodium concent ra t ion in the e lect rode or by lowering the sodium concen- t ra t ion in the extracel lular solution. Reversal o f sodium cur ren t could then be ob ta ined at m e m b r a n e potentials where the kinetics of the cur ren t allowed the peak to be resolved. The peak current-vol tage relat ionship obta ined in a cell in an extracel lular solution containing 50 mM NaC1 (sodium replaced by choline)
382 T H E J O U R N A L O F G E N E R A L P H Y S I O L O G Y ' V O L U M E 9 1 �9 1 9 8 8
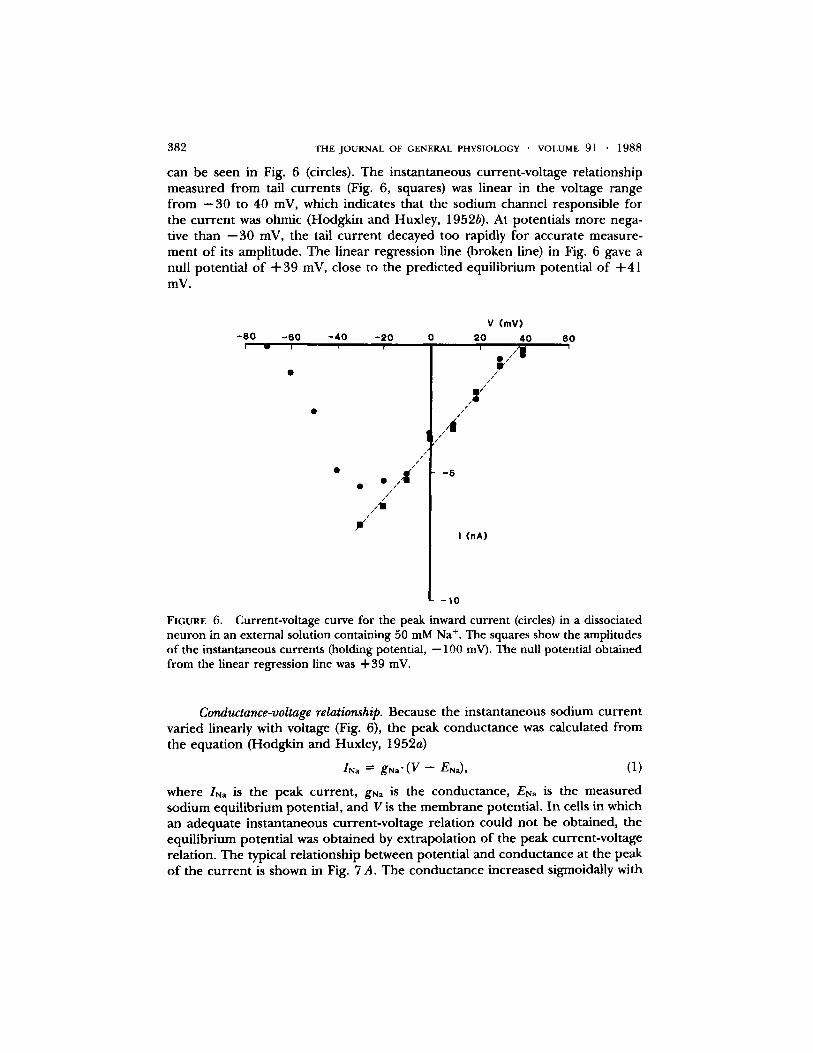
can be seen in Fig. 6 (circles). The instantaneous current-voltage relationship measured from tail currents (Fig. 6, squares) was linear in the voltage range f rom --30 to 40 mV, which indicates that the sodium channel responsible for the current was ohmic (Hodgkin and Huxley, 1952b). At potentials more nega- tive than --30 mV, the tail current decayed too rapidly for accurate measure- ment of its amplitude. The linear regression line (broken line) in Fig. 6 gave a null potential of + 3 9 mV, close to the predicted equilibrium potential of +41 mV.
V (mV)
- 8 0 - 6 0 - 4 0 - 2 0 0 20 40 60 I I I I I I l ~ i
Iv 1/"
11
/ i /
/ / i
,,J
- 5
I ( n A )
- 1 0
FIGURE 6. Current-voltage curve for the peak inward current (circles) in a dissociated neuron in an external solution containing 50 mM Na +. The squares show the amplitudes of the instantaneous currents (holding potential, --100 mV). The null potential obtained from the linear regression line was +39 mV.
Conductance-voltage relationship. Because the instantaneous sodium current varied linearly with voltage (Fig. 6), the peak conductance was calculated from the equation (Hodgkin and Huxley, 1952a)
INa = gNa ' (V- ENd), (1)
where IN~ is the peak current, gNa is the conductance, Erda is the measured sodium equilibrium potential, and V is the membrane potential. In cells in which an adequate instantaneous current-voltage relation could not be obtained, the equilibrium potential was obtained by extrapolation of the peak current-voltage relation. The typical relationship between potential and conductance at the peak of the current is shown in Fig. 7 A. The conductance increased sigmoidally with
SAH ET AL. Sodium Conductance in Mammalian Neurons
0 1
O~
1.2
1.0
0 .8
0 .6
0 .4
0.2
0.0 - 6 0
i
n
- 4 0 - 2 0 0
v (mv)
m m i
i . . * |
20 40 60
383
0 1
1.2
1.0
0.8
0.8
0.4
0.2
0.0
18 ~
j , , - -- - i n
i * * I * I ,, i I | !
6O - 6 0 - 4 0 - 2 0 0 20 40
V (mY)
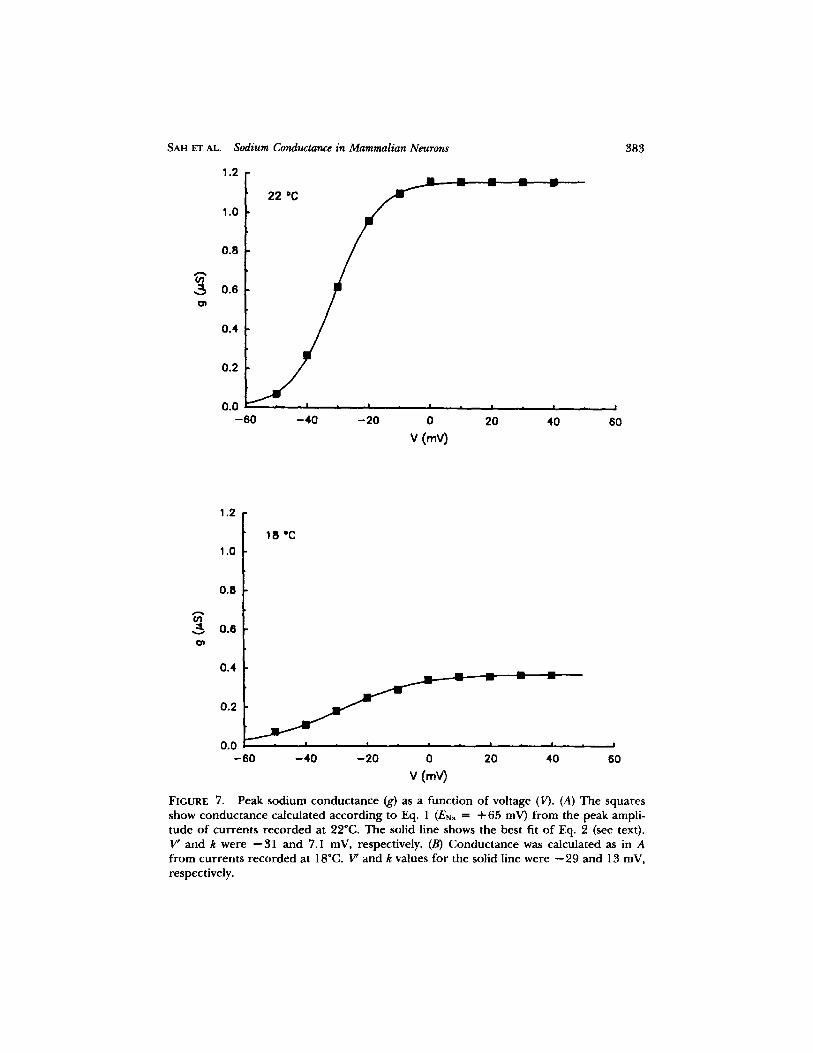
FIGURE 7. Peak sodium conductance (g) as a function of voltage (V). (A) The squares show conductance calculated according to Eq. 1 (ENa = + 65 mV) from the peak ampli- tude of currents recorded at 22~ The solid line shows the best fit of Eq. 2 (see text). V' and k were --31 and 7.1 mV, respectively. (B) Conductance was calculated as in A from currents recorded at 18~ V' and k values for the solid line were --29 and 13 mV, respectively.
384
A 2.0
1.4 E
t :
C:c
Cb
q~
E 0 .a I=
0.2 -6 t
T H E J O U R N A l . O F G E N E R A L P H Y S I O L O G Y �9 V O L U M E 91 �9 1988
\ \
\ m
\ %
\ \
\
\ %
% ~:~ ' '~' ' e ...,..,,,,,(~ ,,,.,. ~
i �9 I , i t a |
- 4 0 - 2 0 0 20 40 60
v (my)
B 10
/ \ a / \
"~ ~ l ~ \
2 ~ t ,.,,. . .4~ .... L ~ ~ . . 4 ~ ~ 4
0 , I , I , I , i I * i , i I
- 6 0 - 4 0 - 2 0 0 20 40 60
V (nnV)
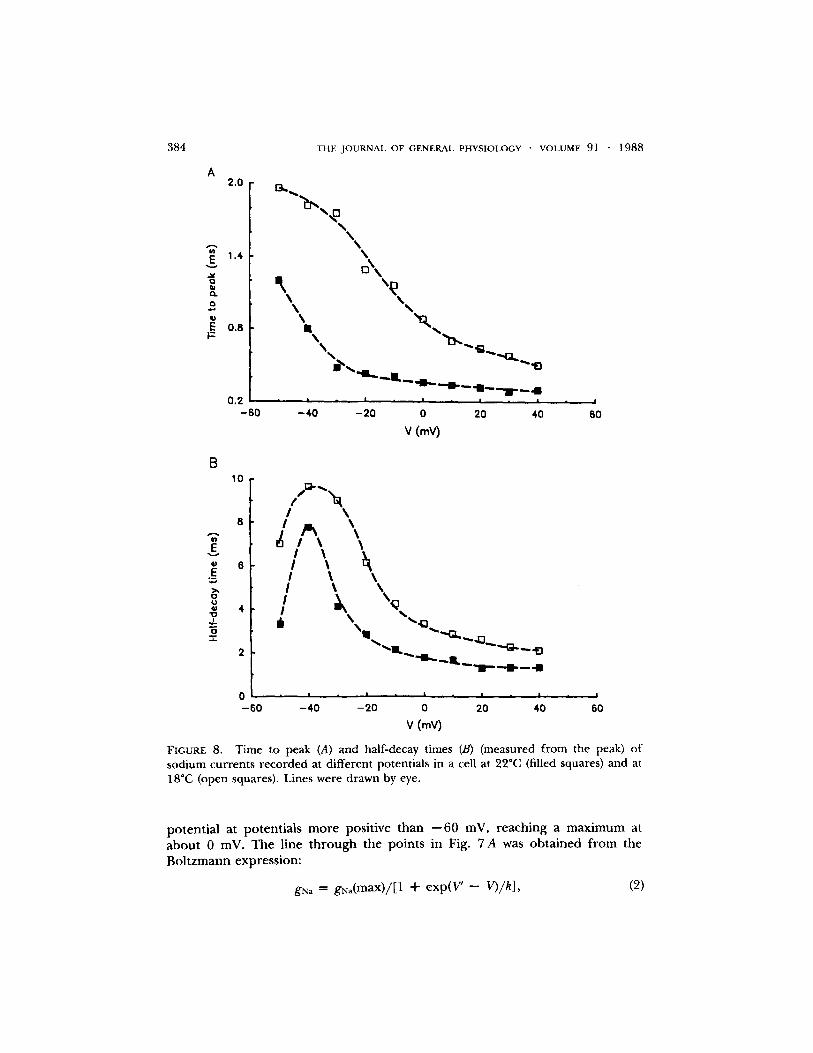
FIGURE 8. Time to peak (A) and half-decay times (B) (measured from the peak) of sodium currents recorded at different potentials in a cell at 22~ (filled squares) and at 18~ (open squares). Lines were drawn by eye.
po ten t i a l a t po ten t i a l s m o r e posi t ive t h a n - - 6 0 mV, r each ing a m a x i m u m at a b o u t 0 mV. T h e l ine t h r o u g h the po in t s in Fig. 7 A was o b t a i n e d f r o m the B o l t z m a n n express ion :
gNa = gNa(max)/[1 -I- exp(V' -- V)/k], (2)
SAH ET AL. Sodium Conductance in Mammalian Neurons 385
where gNa(max) is the maximum conductance, V' is the potential at which gNa =
gNa(max)/2, and k is a slope constant: the values for V' and k used in Fig. 7 A were --31 and 7.1 mV. The average values for V' and k obtained in this way f rom eight cells were - -38 .7 + 3.3 and 6.6 + 0.3 mV, respectively.
No at tempt was made to construct conductance-voltage curves by correct ing for " inact ivat ion" o f channels, because the decay of the currents could not always be fitted with a single exponential (see below).
Time course of activation. It can be seen in Fig. 5 A that the rate of activation of the sodium cur ren t varied with membrane potential. A plot o f the time to peak (measured f rom the onset of the voltage step to the peak of the current)
A
"'1
nA[ io m8
5O
I (hA)
5
1
0 i i i m
5 10 t ime (ms)
0 5 10 t ime (ms)
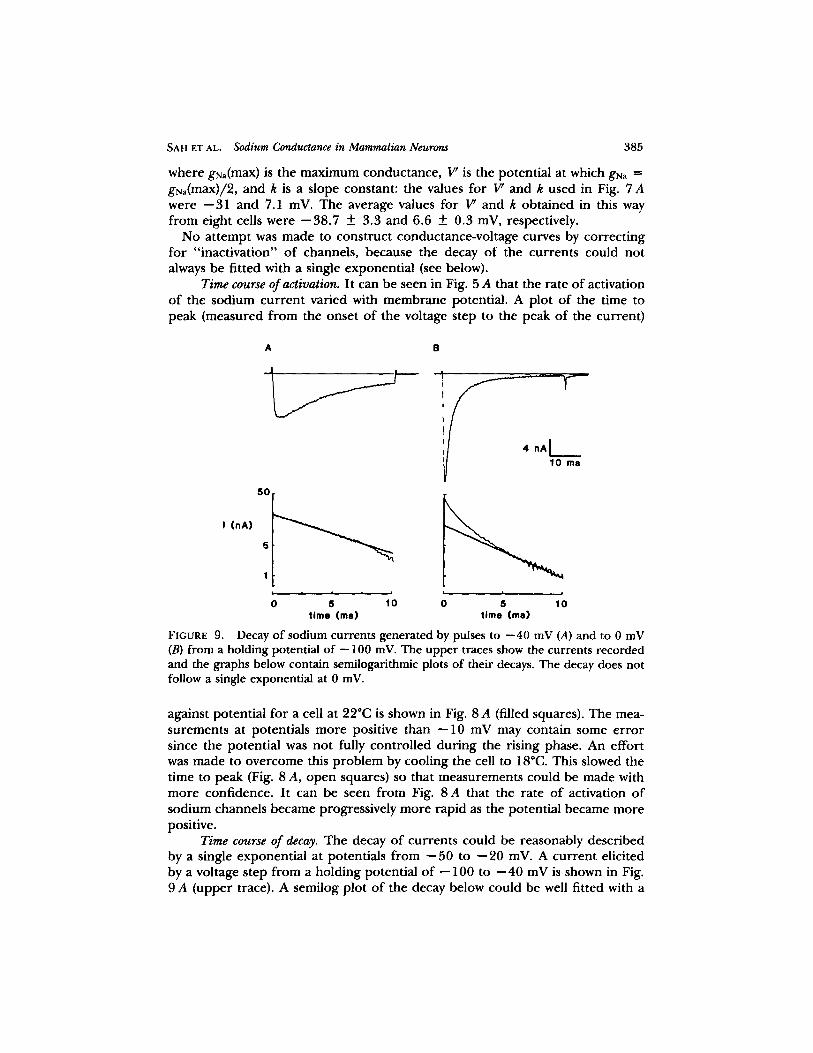
FIGURE 9. Decay of sodium currents generated by pulses to --40 mV (A) and to 0 mV (B) from a holding potential of -- 100 mV. The upper traces show the currents recorded and the graphs below contain semilogarithmic plots of their decays. The decay does not follow a single exponential at 0 mV.
against potential for a cell at 22"C is shown in Fig. 8 A (filled squares). The mea- surements at potentials more positive than - -10 mV may contain some e r ro r since the potential was not fully control led dur ing the rising phase. An effort was made to overcome this problem by cooling the cell to 18"C. This slowed the time to peak (Fig. 8 A, open squares) so that measurements could be made with more confidence. It can be seen f rom Fig. 8 A that the rate o f activation o f sodium channels became progressively more rapid as the potential became more positive.
Time course of decay. The decay o f currents could be reasonably described by a single exponential at potentials f rom - -50 to - -20 inV. A cur rent elicited by a voltage step f rom a holding potential o f -- 100 to - -40 mV is shown in Fig. 9 A (upper trace). A semilog plot o f the decay below could be well fitted with a

3 8 6 THE J O U R N A L OF GENERAL PHYSIOLOGY �9 VOLUME 9 1 �9 1 9 8 8
straight line. However , at potentials more positive than - -20 mV, the decay could not be described by a single exponential , as illustrated in Fig. 9 B. The cur ren t in the uppe r panel was genera ted by a step to 0 mV f rom the same holding potential. A semilog plot o f the decay of the cur rent could no longer be fitted with a straight line (Fig. 9 B, bottom).
Because the decay of the currents could not always be described by a single exponential , the rate o f decay o f the cur rent was characterized by the time to decay to half the maximum amplitude. A plot o f half-decay time against mem- brane potential in a cell at 22~ is shown in Fig. 8 B (filled squares). The decay was slowest at about - -40 mV and became faster at more positive potentials.
1
0 . 8
0.6
0 .4
0 .2
0 w w v w I
- 1 2 0 - 1 0 0 - 8 0 -60 - 4 0 - 2 0 0 20 40
V (mY)
FIGURE 10. Steady state inactivation of sodium current. The amplitude of the sodium current generated by a pulse to --20 mV after a 1-s conditioning step to different poten- tials (abscissa) is expressed as a fraction (h) of the sodium current generated after a con- ditioning step to --120 mV (holding potential, --100 mV). The solid line through the data points is the line of best fit (Eq. 3) and gives a V of --89.5 mV and a k of 9.9 inV. Normalized conductances (~, circles), calculated from currents generated in the same cell by voltage steps to potentials shown on the abscissa from a holding potential of --100 mV, are shown for comparison.
Steady state inactivation. Steady state inactivation (h~o) was studied by clamp- ing a cell at a condit ioning potential for 1 s before eliciting a sodium current with a 50-ms test pulse to - -20 mV (holding potential, - -100 mV). The ampli- tude o f the sodium current measured at different condit ioning potentials, expressed as a fract ion (h~) of the amplitude when the condit ioning potential was - -120 mV, is plot ted against the condit ioning potential in Fig. 10 (squares).
SAH ET AL Sodium Conductance in Mammalian Neurons 387
The line th rough the points was drawn according to (Hodgkin and Huxley, 1952b)
boo = 1/[1 + e x p ( V - V')/k], (3)
with a half-inactivation voltage (V') o f - -89.5 mV and a slope factor (k) of 9.9 inV. The normalized peak conductance in the same cell is plot ted against poten- tial for comparison (circles). The average values for 17' and k recorded in eight cells were - -74 .9 ___ 2.0 and 7.7 ___ 1.0 mV, respectively.
2 nA
B 1
0 . 8
0 .6
i
0 .4
0 .2
2 ms
A .
4 1 0 e o o ~ 1 7 6 ~ �9
~ 0 o 0 0 �9 | | e
0 20 40 60 80 100
t ime (me)
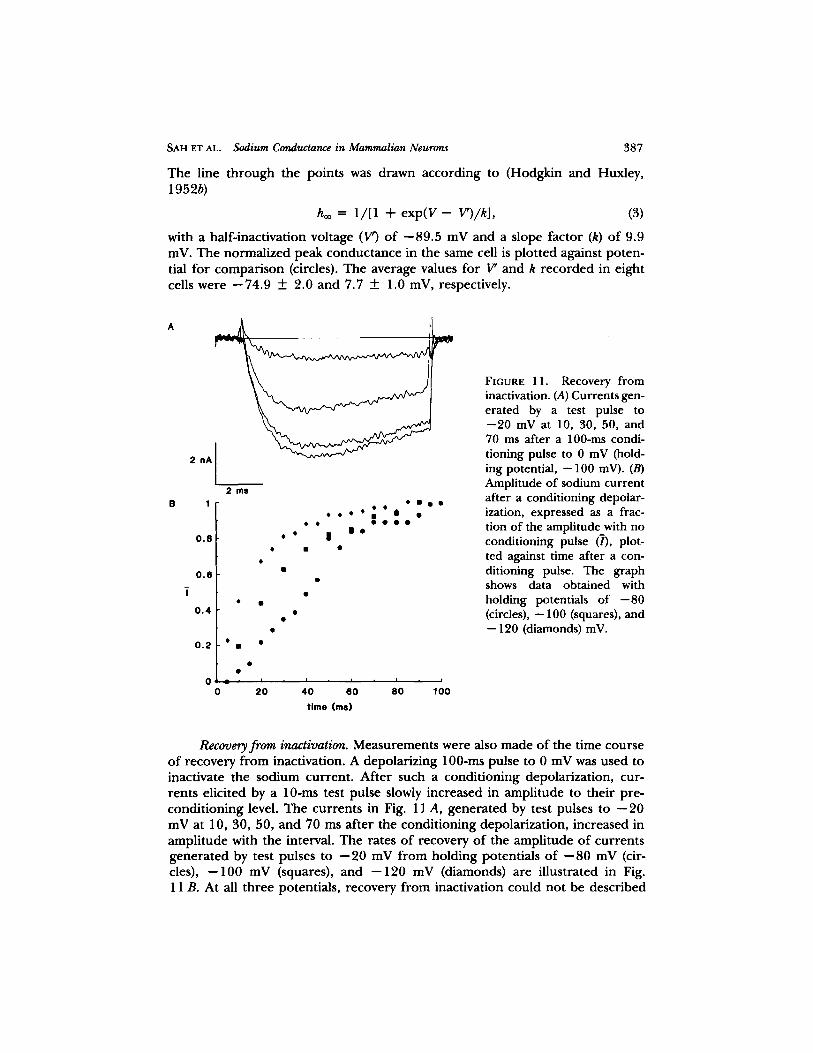
FIGURE 11. Recovery from inactivation. (A) Currents gen- erated by a test pulse to --20 mV at 10, 30, 50, and 70 ms after a 100-ms condi- tioning pulse to 0 mV (hold- ing potential, -- 100 mV). (B) Amplitude of sodium current after a conditioning depolar- ization, expressed as a frac- tion of the amplitude with no conditioning pulse (7), plot- ted against time after a con- ditioning pulse. The graph shows data obtained with holding potentials of --80 (circles), -- 100 (squares), and - - 1 2 0 (diamonds) inV.
Recovery from inactivation. Measurements were also made o f the time course o f recovery f rom inactivation. A depolarizing 100-ms pulse to 0 mV was used to inactivate the sodium current . After such a condit ioning depolarization, cur- rents elicited by a 1 0 - m s test pulse slowly increased in amplitude to their pre- condi t ioning level. The currents in Fig. 11 A, genera ted by test pulses to -- 20 mV at 10, 30, 50, and 70 ms af ter the condit ioning depolarization, increased in ampli tude with the interval. The rates o f recovery o f the amplitude o f currents genera ted by test pulses to - -20 mV f rom holding potentials o f - -80 mV (cir- cles), - -100 mV (squares), and - -120 mV (diamonds) are illustrated in Fig. 11 B. At all three potentials, recovery f rom inactivation could not be described

388 T H E J O U R N A L O F G E N E R A L P H Y S I O L O G Y " V O L U M E 91 . 1988
by a single exponential . Recovery occur red more rapidly at more negative hold- ing potentials.
Effects of temperature. Consistent effects o f changing t empera tu re on the sodium currents were r eco rded in three cells, whether the t empera tu re was low- e red or raised. As the t empe ra tu r e was lowered, the currents became smaller and slower, as il lustrated in Fig. 12. The u p p e r traces were recorded at 22~ the lower traces were r eco rded immediately af ter lowering the t empera tu re to 18~ (note the difference in vertical calibrations). The current-vol tage curves
22"C A
4 0
2 0 nA
18"C B
- 4O
FIGURE 12. Effect of temperature on sodium currents. Sodium currents were generated by pulses from a holding potential of --100 mV to the potentials shown, recorded in one cell at 22~ (A) and at 180C (B). Note the difference in the vertical calibrations in A and B.
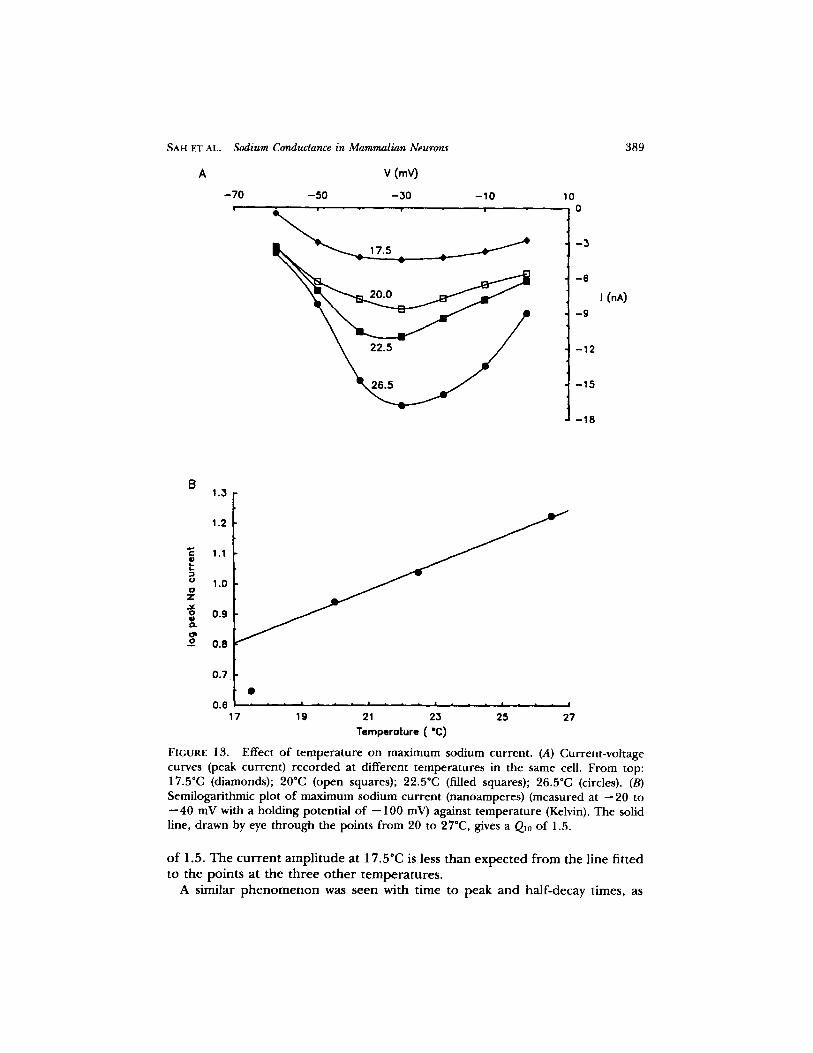
r eco rded in one exper imen t in which the t empera tu re was raised f rom 17.5 to 26.5~ (Fig. 13 A) show the dependence of cur ren t ampli tude on tempera ture . The conductance-vol tage curves for two tempera tures , 18 and 22"C, in one cell are shown in Fig. 7: it can be seen that the peak conductance fell f rom 1.16 #S at 22~ to 0.37 #S at 18~ The k value changed f rom 7.1 to 13 mV but V' was essentially unchanged. There was a larger fall in cur ren t ampli tude for the 2.5"C change in t empe ra tu r e between 20~ and 17.5~ than between 22.5~ and 20~ The m a x i m u m cur ren t ampli tude is p lot ted semilogarithmically against t empe ra tu r e in Fig. 13 B. The line th rough the points at 20-26.5~ gave a Q~0
SAH ET AL. Sodium Conductance in Mammalian Neurons
A v (mV)
-70 -50 -30 -10
~ 1 7 . 5 '
~22.5 f /
10 0
-5
- 6
- 9
-12
-15
- 1 8
389
I(nA)
B 1.3
1.2
1.1
1.0
~ .g
o O . 8
0.7
0 . 6 . . . . . . . ' . . . . . . . . . . , '
17 19 21 23 25 27 Temperoture ("C)
FIGURE 13. Effect of temperature on maximum sodium current. (A) Current-vohage curves (peak current) recorded at different temperatures in the same cell. From top: 17.5~ (diamonds); 20oc (open squares); 22.50C (filled squares); 26.50C (circles). (B) Semilogarithmic plot of maximum sodium current (nanoamperes) (measured at --20 to --40 mV with a holding potential of --100 mV) against temperature (Kelvin). The solid line, drawn by eye through the points from 20 to 270C, gives a Q10 of 1.5.
o f 1.5. The current amplitude at 17.5~ is less than expected from the line fitted to the points at the three o ther temperatures.
A similar p h e n o m e n o n was seen with time to peak and half-decay times, as
A 4
E
0
t , l
.9 ~ I p
E
0 - 6 0
�9 I A I $
, t m I m i
- 4 0 - 2 0 0 V (mV)
T H E J O U R N A L O F G E N E R A L P H Y S I O L O G Y " V O L U M E 91 390 1988
10
8
4 �9 �9
2
0 - 6 0 - 4 0 - 2 0 0
V (rnV)
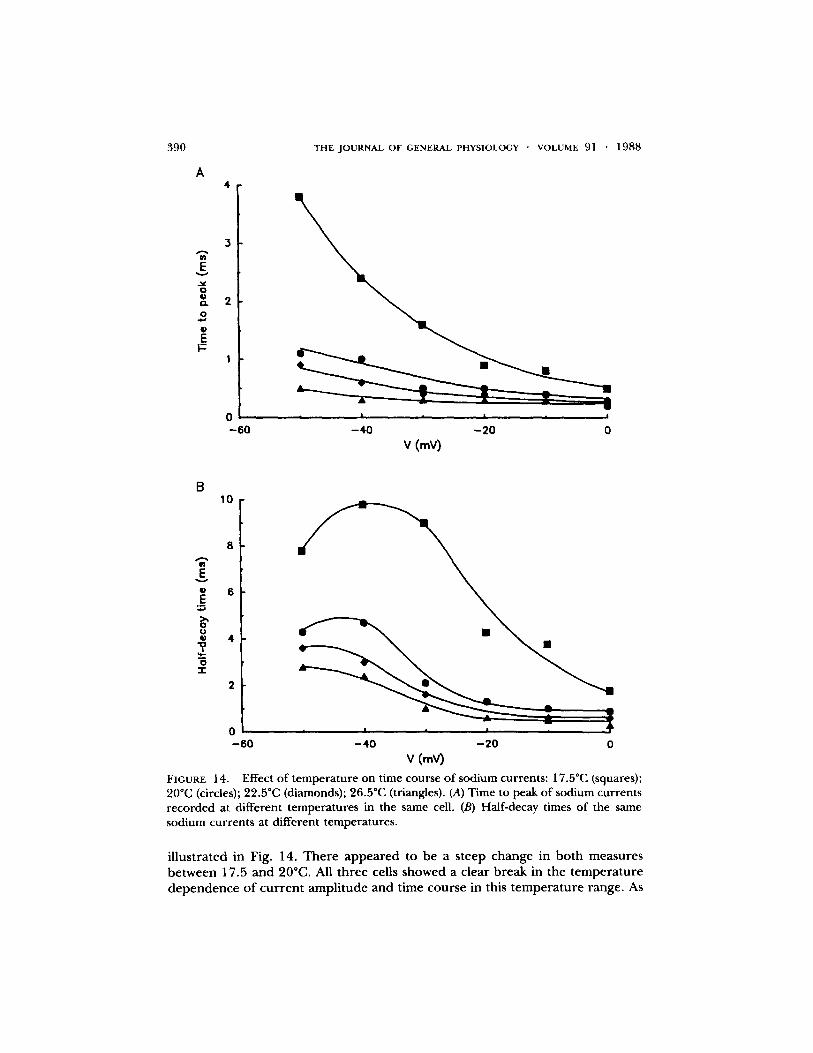
FIGURE 14. Effect of temperature on time course of sodium currents: 17.50C (squares); 20"C (circles); 22.5"C (diamonds); 26.5"C (triangles). (A) Time to peak of sodium currents recorded at different temperatures in the same cell. (B) Half-decay times of the same sodium currents at different temperatures.
i l l u s t r a t ed in Fig. 14. T h e r e a p p e a r e d to be a s t eep c h a n g e in b o t h m e a s u r e s b e t w e e n 17.5 a n d 20~ All t h r e e cells s h o w e d a c l ea r b r e a k in the t e m p e r a t u r e d e p e n d e n c e o f c u r r e n t a m p l i t u d e a n d t ime c o u r s e in this t e m p e r a t u r e r ange . As
SAH ET AL. Sodium Conductance in Mammalian Neurons 391
A
L ,.
I 1 nA
10 ms
L J i f I
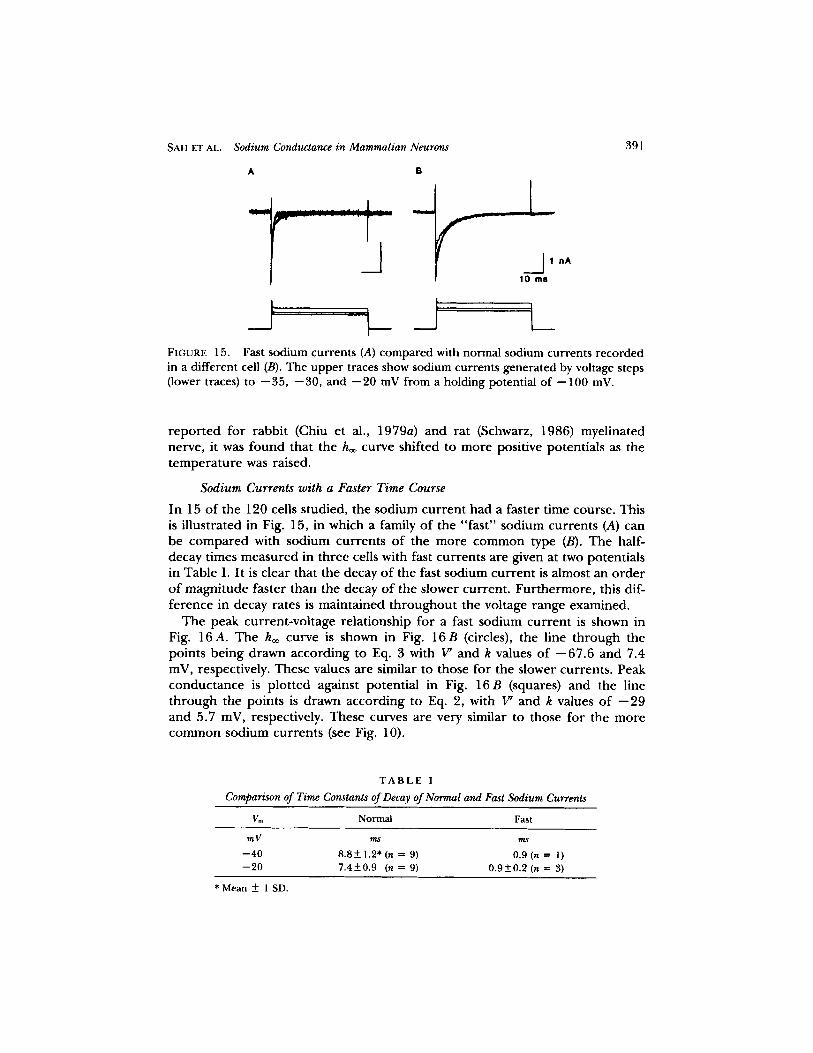
F1GURE 15. Fast sodium currents (A) compared with normal sodium currents recorded in a different cell (B). The upper traces show sodium currents generated by voltage steps (lower traces) to -- 35, -- 30, and -- 20 mV from a holding potential of -- 100 inV.
r epo r t ed for rabbi t (Chiu et al., 1979a) and rat (Schwarz, 1986) myelinated nerve, it was found that the hoo curve shifted to more positive potentials as the t e m p e r a t u r e was raised.
Sodium Currents with a Faster Time Course
In 15 o f the 120 cells studied, the sodium cur ren t had a faster t ime course. This is i l lustrated in Fig. 15, in which a family o f the " fas t" sodium currents (A) can be c o m p a r e d with sodium currents o f the more c o m m o n type (B). The half- decay times measured in three cells with fast currents are given at two potentials in Table I. I t is clear that the decay of the fast sodium cur ren t is almost an o rder o f magni tude faster than the decay o f the slower current . Fur the rmore , this dif- ference in decay rates is mainta ined th roughou t the voltage range examined.
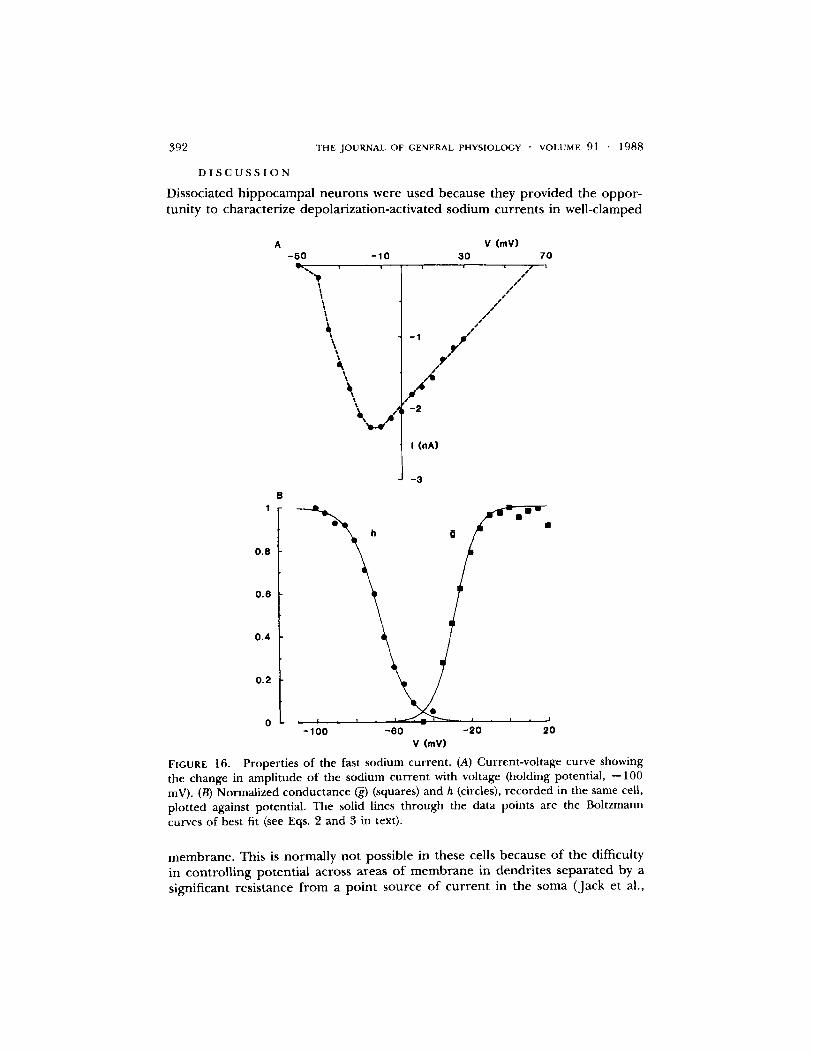
The peak current-vol tage relat ionship for a fast sodium cur ren t is shown in Fig. 16 A. The h~o curve is shown in Fig. 16 B (circles), the line th rough the points be ing drawn according to Eq. 3 with V' and k values of - -67 .6 and 7.4 mV, respectively. These values are similar to those for the slower currents . Peak conduc tance is p lo t ted against potential in Fig. 16 B (squares) and the line th rough the points is drawn according to Eq. 2, with 1," and k values o f - -29 and 5.7 mV, respectively. These curves are very similar to those for the more c o m m o n sodium currents (see Fig. 10).
T A B L E I
Comparison of Time Constants of Decay of Normal and Fast Sodium Currents
Vm N o r m a l Fast
m V ~
- - 4 0 8 . 8 + 1 . 2 " (n = 9) 0 .9 (n = 1)
- - 2 0 7 . 4 + 0 . 9 (n = 9) 0 . 9 + 0 . 2 ( n = 3)
* M e a n + 1 SD.
392 THE J O U R N A L OF GENERAL PHYSIOLOGY �9 VOLUME 91 �9 1988
D I S C U S S I O N
Dissociated h ippocampal neurons were used because they provided the oppor - tunity to character ize depolarizat ion-act ivated sodium currents in well-clamped
A V (mV) - 5 0 -10 30
, , f
I I I
i I
i I
i I
t t I lb l l l l l
I
\ J
- 1 ~ l p /
/F"
- 2
I ( n A )
-3
7 0
1
0.80.6 �9 h �9 0 �9 �9
0.4
0.2
0 J -100 - 6 0 -20 20
V (mY)
FIGURE 16. Properties of the fast sodium current. (A) Current-voltage curve showing the change in amplitude of the sodium current with voltage (holding potential, --100 mV). (B) Normalized conductance (~) (squares) and h (circles), recorded in the same cell, plotted against potential. The solid lines through the data points are the Boltzmann curves of best fit (see Eqs. 2 and 3 in text).
membrane . This is normally not possible in these cells because o f the difficulty in control l ing potential across areas of m e m b r a n e in dendri tes separa ted by a significant resistance f rom a point source of cur ren t in the soma (Jack et al.,
SAH ET AL. Sodium Conductance in Mammalian Neurons 3 9 3
1975; Johnston and Brown, 1983). The task becomes even more difficult if there are neurotransmitter-induced shunts across the membrane of the processes. Although the whole-cell patch-clamp technique, combined with a fast, single- electrode clamp, provided voltage control within 500 #s in these cells, it was necessary to work at low temperatures (20-24~ in order to control potential during the rising phase and peak of some sodium currents. At this temperature, dissociated cells from guinea pig hippocampus, although somewhat depolarized, retained the ability to generate action potentials and proved a suitable prepa- ration for studying the underlying sodium current.
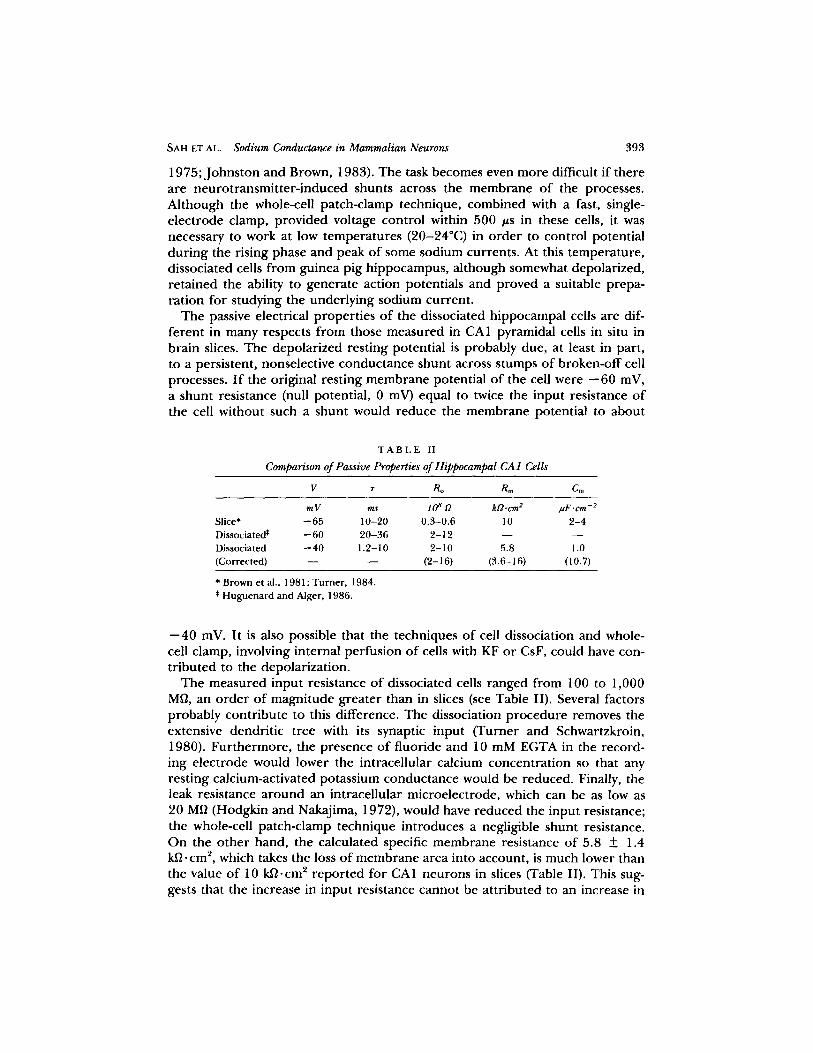
The passive electrical properties of the dissociated hippocampal cells are dif- ferent in many respects from those measured in CA1 pyramidal cells in situ in brain slices. The depolarized resting potential is probably due, at least in part, to a persistent, nonselective conductance shunt across stumps of broken-off cell processes. If the original resting membrane potential of the cell were --60 mV, a shunt resistance (null potential, 0 mV) equal to twice the input resistance of the cell without such a shunt would reduce the membrane potential to about
T A B L E II
Comparison of Passive Properties of Hippocampal CA1 Cells
V "r Ro Rm Cm
mV ms lO s ~ k .Q'cm 2 /.I.F.cm - 2
Slice* -- 65 1 0 -2 0 0 . 3 - 0 . 6 10 2 - 4
Dissociated* -- 60 2 0 - 3 6 2 - 1 2 - - - -
Dissociated -- 40 1 .2 -10 2 - 1 0 5.8 1.0
(Corrected) - - - - (2 -16) (3 .6-16) (10.7)
* Brown et al., 1981; T u r n e r , 1984.
* H u g u e n a r d and Alger, 1986.
--40 mV. It is also possible that the techniques of cell dissociation and whole- cell clamp, involving internal perfusion of cells with KF or CsF, could have con- tributed to the depolarization.
The measured input resistance of dissociated cells ranged from 100 to 1,000 Mf], an order of magnitude greater than in slices (see Table II). Several factors probably contribute to this difference. The dissociation procedure removes the extensive dendritic tree with its synaptic input (Turner and Schwartzkroin, 1980). Furthermore, the presence of fluoride and 10 mM EGTA in the record- ing electrode would lower the intracellular calcium concentration so that any resting calcium-activated potassium conductance would be reduced. Finally, the leak resistance around an intracellular microelectrode, which can be as low as 20 Mfl (Hodgkin and Nakajima, 1972), would have reduced the input resistance; the whole-cell patch-clamp technique introduces a negligible shunt resistance. On the other hand, the calculated specific membrane resistance of 5.8 _+ 1.4 kfl. cm 2, which takes the loss of membrane area into account, is much lower than the value of 10 k~.cm 2 reported for CA1 neurons in slices (Table II). This sug- gests that the increase in input resistance cannot be attributed to an increase in
3 9 4 T H E J O U R N A L O F G E N E R A L P H Y S I O L O G Y ' V O L U M E 91 �9 1 9 8 8
specific membrane resistance. Taking both the depolarization and low mem- brane resistance into account, it seems very likely that there is an electrical leak across the stumps o f the f rac tured processes in these cells. A leak resistance twice the input resistance, as assumed above, would reduce the measured mem- brane resistance to two-thirds of the t rue membrane resistance: correct ing for such a leak would increase the membrane resistance to ,~ 10 k~2.cm 2 (Table II). Another possible explanation for the lower membrane resistance in dissociated cells is that, as suggested for motoneurons (Fatt, 1957; Iansek and Redman, 1973), the specific membrane resistance in the soma may be less than in the dendrites.
The time constants o f 3 -5 ms measured here are lower than the time con- stants of 10-20 ms repor ted for CA1 cells in slices (Table II). This difference can probably be at t r ibuted to the same factors that caused the low input resis- tance. The average specific membrane capacity calculated f rom the input capac- itance and membrane area was 1 #F. cm -2, close to that expected for cell mem- branes, which suggests that the calculations of membrane area were reasonably accurate.
It was found to be possible to voltage-clamp the membrane adequately and record ionic currents in these cells. The inward current could be blocked with TTX, it decreased in ampli tude when the extracellular concentra t ion of sodium was decreased, and it had a null potential close to the sodium equilibrium poten- tial, typical characteristics o f a sodium current . A residual, small, slower, TTX- insensitive inward current , probably a calcium current (Kay et al., 1986), was sometimes seen (Fig. 5 D), but it was not examined further. I f it had been pres- ent, it would have made an insignificant contr ibut ion to the total inward current and it was not apparen t in many cells (e.g., see Fig. 3). In neurons in slice prep- arations, calcium currents r ecorded with electrodes in the soma (Johnston et al., 1980; D. A. Brown and Griffith, 1983) are much larger (1-3 nA) than repor ted here. Calcium currents have been shown to be very labile (Fenwick et al., 1982; Kostyuk, 1984) and it is possible that the calcium currents in the dissociated cells were "washed ou t" dur ing the dissociation procedure . Another possibility is that most o f the calcium channels may be located on the dendrites (Llinas and Sug- imori, 1980; Jahnsen, 1986) and are removed during dissociation. Alternatively, it is possible that the TTX-insensitive inward current was a sodium current sim- ilar to the TTX-insensitive sodium current seen in nodose ganglion cells (Ikeda et al., 1986); fu r ther experiments will be needed to define its nature.
A slow, noninactivating, TTX-sensitive sodium current found in rat hippocam- pal CA1 neurons by French and Gage (1985) (see also Stafstrom et al., 1985) could also be seen in dissociated neurons. This current , like the calcium current , was relatively very small (the maximum amplitude was always < 0 . 6 nA) and had little effect on the amplitude or time course of the larger sodium current .
The sodium currents in most of the cells were slower than repor ted for some o ther mammalian cells at the same tempera ture (Chiu et al., 1979a, b; Kostyuk et al., 1981; Neumcke and Stampfli, 1982; Fenwick et al., 1982; Matteson and Armstrong, 1984; Dubinsky and Oxford, 1984; Vandenberg and Horn , 1984; Belluzzi and Sacchi, 1986; Carbone and Lux, 1986). I f single channels had a
SAH ET AL. Sodium Conductance in Mammalian Neurons 395
conductance of 18 pS (Sigworth and Neher, 1980; Stiihmer et al., 1987), the maximum sodium conductance of 7.2-14.7 mS.cm -2 corresponds to 5-10 sodium channels per #m 2. This is similar to the sodium channel density on bovine chromattin cells (Fenwick et al., 1982) but about five times the density in GH3 cells (Matteson and Armstrong, 1984; Dubinsky and Oxford, 1984). By comparison, there are 200-300 sodium channels per #m 2 in neuroblastoma cells (Moolenaar and Spector, 1979), in frog and rat node of Ranvier, and in squid giant axon (see Hille, 1984, for review). Using a membrane capacitance of 1 #F.cm -2, a sodium channel density of 5-10 channels per #m 2, a sodium equi- librium potential of 70 mV, and a peak current of --20 mV, the rate of rise of an action potential would be 600-1,200 V.s -~. This is close to the measured rate of rise of action potentials of 600-1,000 V.s -~ and indicates that the sodium current described here is responsible for the rising phase of the action potentials recorded in these cells.
Both activation and inactivation of sodium channels occurred at more nega- tive potentials (Fig. 9) than found in other mammalian neurons (Barrett and Crill, 1980; Fenwick et al., 1982; Matteson and Armstrong, 1984; Fernandez et al., 1984; Vandenberg and Horn, 1984). However, activation of mammalian brain sodium channels expressed in oocytes (Stiihmer et al., 1987) occurred at potentials similar to those seen here. Some of the differences in the voltage dependence of activation and particularly inactivation may be associated with differences in temperature (Schwarz, 1986; this article). A further difference might be the introduction of fluoride ions into the cell interior. It has been suggested (Fernandez et al., 1984) that sodium channel activation and inactiva- tion curves slowly shift to more negative potentials when the intracellular solu- tion contains fluoride ions, but this does not seem to happen in squid axon (Adams and Oxford, 1983). The records from most cells in this study were taken at least 10-15 min after obtaining access to the interior of the cell. Although we did not systematically look for a change in voltage dependence with time, no changes in voltage dependence of activation or inactivation were seen during an experiment.
In many preparations, particularly at the node of Ranvier of both frog and rat nerve (Chiu, 1977; Neumcke and Stampfli, 1982) and rat heart (A. M. Brown et al., 1981), sodium current decay follows a biexponential time course. In hip- pocampal cells, however, only one time constant was generally observed, although in several cells and particularly at depolarized potentials, two time con- stants were evident (Fig. 9). Thus, inactivation in hippocampal cells is more sim- ilar to that seen in GH3 cells (Vandenberg and Horn, 1984) than in rat node of Ranvier (Neumcke and Stampfli, 1982; Schwarz, 1986).
Despite the variety of cell morphologies obtained after dissociation, the sodium conductance of most cells had very similar properties. A few cells had much more rapid sodium currents (Fig. 13). It has been suggested that injection of mRNA isolated from rat brain into Xen0pus oocytes yields two populations of sodium channels with different open times (Gundersen et al., 1983). In addition, there are at least two different kinds of sodium channel-specific mRNA in rat brain (Noda et al., 1986). These observations may explain the two different types
396 THE JOURNAL OF GENERAL PHYSIOLOGY " VOLUME 91 1988
of c h a n n e l kinet ics obse rved in the dissociated cells. Ac t ion poten t ia l s in in ter - n e u r o n s in the h i p p o c a m p u s a n d cor tex have a faster t ime course t han n o r m a l a n d do n o t a c c o m m o d a t e (Schwartzkroin a n d Mathers , 1978; McCormick et al., 1985). I t is possible tha t the u n d e r l y i n g sod ium channe l s also have faster kinet- ics. Fast s o d i u m c u r r e n t s can also be r e c o r d e d f r o m glial cells (Bevan et al., 1985; Gibb , A. J. , u n p u b l i s h e d observat ions) . The dissociated cells with faster s o d i u m c u r r e n t s may have b e e n i n t e r n e u r o n s or glial cells.
We thank F. Dreyer, A. Dulhunty, G. Lamb, D. McKinnon, and S. Redman for helpful com- ments, R. Taylor for assistance with software, and R. Malhon and A. Andrews for technical assistance.
Original version received 30 March 1987 and accepted version received 11 September 1987.
R E F E R E N C E S
Adams, D. J., and G. S. Oxford. 1983. Interaction of internal anions with potassium channels of the squid giant axon. Journal of General Physiology. 82:429-448.
Adrian, R. H., W. K. Chandler, and A. L. Hodgkin. 1970. Slow changes in potassium perme- ability in skeletal muscle. Journal of Physiology. 208:645-688.
Barrett, J. N., and W. E. Crill. 1980. Voltage clamp of cat motoneurone somata: properties of the fast inward current. Journal of Physiology. 304:231-249.
Belluzzi, O., and O. Sacchi. 1986. A quantitative description of the sodium current in the rat sympathetic neurone. Journal of Physiology. 380:275-291.
Bevan, S., S. Y. Chiu, P. T. A. Gray, andJ. M. Ritchie. 1985. The presence of voltage gated sodium potassium and chloride channels in rat cultured astrocytes. Proceedings of the Royal Society of London, Series B. 225:299-313.
Brenneke, R., and B. Lindermann. 1974. Theory of membrane voltage clamp with discontin- uous feedback through a pulsed current clamp. Review of Scientific Instrumentation. 45:184- 188.
Brown, A. M., K. S. Lee, and T. Powell. 1981. Sodium current in single rat heart muscle cells. Journal of Physiology. 318:479-500.
Brown, D. A., and W. H. Griffith. 1983. Persistent slow inward calcium current in voltage clamped hippocampal neurons of the guinea pig. Journal of Physiology. 337:303-320.
Brown, T. H., R. A. Fricke, and D. H. Perkel. 1981. Passive electrical constants in three classes of hippocampal neurons. Journal of Neurophysiology. 46:812-827.
Carbone, E., and H. D. Lux. 1986. Sodium currents in cultured chick dorsal root ganglion neurones. European Biophysics Journal. 13:259-271.
Chiu, S. Y. 1977. Inactivation of sodium channels: second order kinetics in myelinated nerve. Journal of Physiology. 273:573-596.
Chiu, S. Y., H. E. Mrose, and J. M. Ritchie. 1979a. Anomalous temperature dependence of the sodium conductance in rabbit nerve compared with frog nerve. Nature. 279:327-328.
Chiu, S. Y., J. M. Ritchie, R. B. Rogart, and D. Stagg. 1979b. A quantitative description of membrane currents in rabbit myelinated nerve fibres. Journal of Physiology. 292:149-166.
Dubinsky, J. M., and G. S. Oxford. 1984. Ionic currents in two strains of rat anterior pituitary tumor cells. Journal of General Physiology. 83:309-339.
Fatt, P. 1957. Sequence of events in synaptic activation of a motoneurone. Journal of Neuro- physiology. 20:61-80.
SAH ET AL. Sodium Conductance in Mammalian Neurons 397
Fenwick, E. M., A. Marty, and E. Neher. 1982. Sodium and calcium channels in bovine chro- maffin cells. Journal of Physiology. 331:599-635.
Fernandez, J., A. P. Fox, and S. Krasne. 1984. Membrane patches and whole-cell membranes: a comparison of electrical properties in rat clonal pituitary (GH3) cells. Journal of Physiology. 356:564-585.
Finkel, A. S., and S. Redman. 1985. Theory and operation of a single microelectrode voltage clamp. Journal of Neuroscience Methods. 11 : 101-127.
French, C. R., and P. W. Gage. 1985. A threshold sodium current in pyramidal cells in rat hippocampus. Neuroscience Letters. 56:289-293.
Gray, J., and D. Johnston. 1985. Rectification of single GABA-gated chloride currents in adult hippocampal neurones. Journal of Neurophysiology. 54:134-142.
Gundersen, C. B., R. Miledi, and I. Parker. 1983. Voltage operated channels induced by for~ eign messenger RNA in Xenopus oocytes. Proceedings of the Royal Society of London, Series B. 220:131-140.
Hamill, O. P., A. Mart),, E. Neher, B. Sakmann, and F. Sigworth. 1981. Improved patch clamp techniques for high-resolution current recordings from cells and cell-free membrane patches. Pfliigers Archly. 391:85-100.
HiUe, B. 1984. Ionic Channels of Excitable Membranes. Sinauer Associates, Inc., Sunderland, MA. 426 pp.
Hodgkin, A. L., and A. F. Huxley. 1952a. The components of membrane conductance in the giant axon of Loligo. Journal of Physiology. 116:473-496.
Hodgkin, A. L., and A. F. Huxley. 1952b. The dual effect of membrane potential on sodium conductance in the giant axon of Loligo. Journal of Physiology. 116:497-506.
Hodgkin, A. L., and S. Nakajima. 1972. The effect of diameter on the electrical constants of frog skeletal muscle fibres. Journal of Physiology. 221 : 105-120.
Huguenard, J. R., and B. E. Alger. 1986. Whole cell voltage clamp study of the fading of GABA-activated currents in acutely dissociated hippocampat neurons. Journal of Neurophys- iology. 56:1-17.
Iansek, R., and S. J. Redman. 1973. An analysis of the cable properties of spinal motoneu- rones using a brief intracellular current pulse. Journal of Physiology. 243:613-636.
Ikeda, S. R., G. G. Schofield, and F. F. Weight. 1986. Na + and Ca 2+ currents of acutely iso- lated adult rat nodose ganglion cells. Journal of Neurophysiology. 53:527-539.
Jack, J. j . B., D. Noble, and R. W. Tsien. 1975. Electric Current Flow in Excitable Cells. Clarendon Press, Oxford. 502 pp.
Jahnsen, H. 1986. Extracellular activation and membrane conductances of neurones in the guinea pig deep cerebellar nuclei in vitro. Journal of Physiology. 372:149-168.
Johnston, C., and T. H. Brown. 1983. Interpretation of voltage clamp measurement in hip- pocampal neurones. Journal of Neurophysiology. 50:464-486.
Johnston, D., J. L. Hablitz, and W. A. Wilson. 1980. Voltage clamp discloses slow inward current in hippocampal burst-firing neurones. Nature. 286:391-393.
Kay, A. R., R. Miles, and R. K. S. Wong. 1986. Intracellular fluoride alters the kinetic prop- erties of calcium currents facilitating the investigation of synaptic events in hippocampal neurons. Journal of Neuroscience. 6:2915-2920.
Kay, A. R., and R. K. S. Wong. 1986. Isolation of neurones suitable for patch-clamping from adult mammalian central nervous systems. Journal of Neuroscience Methods. 16:227-238.
Kostyuk, P. G. 1984. Intracellular perfusion of nerve cells and its effects on membrane cur- rents. Physiological Reviews. 64:435-454.
398 THE JOURNAL OF GENERAL PHYSIOLOGY �9 VOLUME 91 �9 1988
Kostyuk, P. G., N. S. Veselosky, and A. Y. Tsyndrenko. 1981. Ionic currents in the somatic membrane o f rat dorsal root ganglion: sodium currents. Neuroscience. 6:2423-2430.
Llinas, R., and M. Sugimori. 1980. Electrophysioioglcal properties of in vitro Purkinje cell somata in mammalian cerebellar slices. Journal of Physiology. 305:171-195.
Matteson, D. R., and C. M. Armstrong. 1984. Na and Ca channels in a transformed line of anterior pituitary cells. Journal of General Physiology. 83:371-394.
McCormick, D. A., B. W. Connors, J. Lighthall, and D. A. Prince. 1985. Comparative electro- physiology of pyramidal and sparsely spiny stellate neurons of the neocortex. Journal of Neu- rophysiology. 54:782-806.
Moolenaar, W. H., and I. Spector. 1978. Ionic currents in cultured mouse neuroblastoma
cells under voltage clamp conditions. Journal of Physiology. 278:265-286.
Neumcke, B., and R. Stampfli. 1982. Sodium currents and sodium current fluctuations in rat myelinated nerve fibres. Journal of Physiology. 329:163-184.
Noda, M., T. Ikeda, T. Kayano, H. Suzuki, H. Takeshima, M. Kurasaki, H. Takahashi, and S. Numa. 1986. Existence of distinct sodium channel messenger RNA's in rat brain. Nature. 320:188-192.
Numann, R. E., and R. K. S. Wong. 1984. Voltage-clamp study of GABA response desensiti- zation in single pyramidal cells dissociated from the hippocampus of adult guinea pigs. Neu- roscience Letters. 47:289-295.
Rail, W. 1977. Core conductor theory and cable properties of neurons. In Handbook of Phys- iology. The Nervous System. American Physiological Society, Bethesda, MD. 39-97.
Sah, P., A. J. Gibb, and P. W. Gage. 1986. Ionic currents in acutely dissociated adult hippo- campal neurones. Neuroscience Letters. 23(Suppl.):77.
Schwartzkroin, P. A., and L. H. Mathers. 1978. Physiological and morphological identification of a nonpyramidal hippocampal cell type. Brain Research. 157:1-10.
Schwarz, J. R. 1986. The effect of temperature on Na currents in rat myelinated nerve fibres.
Pfliigers Archly. 406:397-404. Sigworth, F. J., and E. Neher. 1980. Single Na + channel currents observed in cultured rat
muscle cells. Nature. 287:447-449.
Stafstrom, C. E., P. C. Schwindt, M. C. Chubb, and W. E. Crill. 1985. Repetitive firing in layer V neurons from cat neocortex in vitro. Journal of Neurophysiology. 52:264-277.
Stiihmer, W., C. Methfessel, B. Sakmann, M. Noda, and S. Numa. 1987. Patch clamp char- acterization of sodium channels expressed from rat brain cDNA. European Biophysics Jour- nal. 14:131-138.
Turner , D. A. 1984. Segmental cable evaluation of somatic transients in hippocampal neurons
(CA1, CA3 and dentate). Biophysical Journal. 46:73-84.
Turner, D. A., and P. A. Schwartzkroin. 1980. Steady-state electronic analysis of intracellu-
larly-stained hippocampai neurons. Journal of Neurophysiology. 44:184-199.
Vandenberg, C. A., and R, Horn. 1984. Inactivation viewed through single sodium channels. Journal of General Physiology. 84:535-564.