population genomics and morphological features underlying
TRANSCRIPT
RESEARCH ARTICLE Open Access
Population genomics and morphologicalfeatures underlying the adaptive evolutionof the eastern honey bee (Apis cerana)Li Yancan1†, Chao Tianle1†, Fan Yunhan1, Lou Delong2 and Wang Guizhi1*
Abstract
Background: The adaptation of organisms to changing environments is self-evident, with the adaptive evolution oforganisms to environmental changes being a fundamental problem in evolutionary biology. Bees can pollinate invarious environments and climates and play important roles in maintaining the ecological balance of the earth.
Results: We performed an analysis of 462 Apis cerana (A. cerana) specimens from 31 populations in 11 regions andobtained 39 representative morphological features. We selected 8 A. cerana samples from each population andperformed 2b-RAD simplified genome sequencing. A total of 11,506 high-quality single nucleotide polymorphism(SNP) loci were obtained. For these SNPs, the minor allele frequency (MAF) was > 1%, the average number ofunique labels for each sample was 49,055, and the average depth was 72.61x. The ratios of the unique labels of allsamples were 64.27–86.33%.
Conclusions: Using 39 morphological characteristics as the data set, we proposed a method for the rapidclassification of A. cerana. Using genomics to assess population structure and genetic diversity, we found that A.cerana has a large genetic difference at the ecotype level. A comparison of A. cerana in North China revealed thatsome physical obstacles, especially the overurbanization of the plains, have isolated the populations of this species.We identified several migration events in North China and Central China. By comparing the differences in theenvironmental changes in different regions, we found that A. cerana has strong potential for climate change andprovides a theoretical basis for investigating and protecting A. cerana.
Keywords: Apis cerana, Apis mellifera, Genomics, Population genetics, Genetic differentiation, Population structure,Standard morphometrics
BackgroundAdaptation to a changing environment is a fundamentalproblem in evolutionary biology. Understanding the im-pact of the environment on biological genetic diversitycan not only clarify the course of evolution but can alsoprovide information on how to protect the ecological en-vironment [1, 2]. Bees have unique ecological value, andone-third of human food is derived from insect pollin-ation, which is critical for maintaining the dynamics ofthe ecosystem. Bees are important mediators of
pollination, bringing ecological value of more than 200billion US dollars per year [3, 4].Apis contains 10 different species, most of which are
distributed throughout Asia [5]. A. cerana is an Asianhoneybee species with a wide geographical distribution.Previously, A. cerana was divided into five or six localcategories based on a comprehensive study of mitochon-drial DNA and microsatellite DNA, and the A. ceranaspecies in China belonged to a subspecies [6, 7]. A. cer-ana was defined as one of the most important pollina-tors in China, domesticating the region for more than2000 years [8]. The various climate types and complexterrains in China have promoted bee differentiation. Pre-vious studies on the differentiation of A. cerana in Chinahave classified A. cerana into different ecological typesonly by morphometric measurements. However, the
© The Author(s). 2019 Open Access This article is distributed under the terms of the Creative Commons Attribution 4.0International License (http://creativecommons.org/licenses/by/4.0/), which permits unrestricted use, distribution, andreproduction in any medium, provided you give appropriate credit to the original author(s) and the source, provide a link tothe Creative Commons license, and indicate if changes were made. The Creative Commons Public Domain Dedication waiver(http://creativecommons.org/publicdomain/zero/1.0/) applies to the data made available in this article, unless otherwise stated.
* Correspondence: [email protected]†Li Yancan and Chao Tianle contributed equally to this work.1Shandong Provincial Key Laboratory of Animal Biotechnology and DiseaseControl and Prevention, Shandong Agricultural University, 61 Daizong Street,Tai’an 271018, Shandong Province, People’s Republic of ChinaFull list of author information is available at the end of the article
Yancan et al. BMC Genomics (2019) 20:869 https://doi.org/10.1186/s12864-019-6246-4
results were variable due to different measurement indi-cators [9, 10]. It is generally accepted that there are nineecotypes of A. cerana in China, including Hainan, theYunnan-Guizhou Plateau, Tibet, Aba, Changbai Moun-tain, southern Yunnan, North China, South China, andCentral China [11]. However, these results were mainlybased on the classification method of A. mellifera, andthe conclusions were obtained from no more than 12traits; therefore, the unique features of A. cerana werelikely missing from the analysis [12]. A subsequent studyused the mitochondrial tRNALeu-COII region to classifyApis mellifera (A. mellifera) [6, 13–17]. As more investi-gators began to study the genome, our understanding ofA. cerana continued to improve until 2015, when thereference genome was published [18]. Recently, Chenet al. conducted a comprehensive genomics study of A.cerana in most parts of China, which paralleled the sim-ple hierarchical division and proposed that physical bar-riers (such as islands and mountains), rather thanphysical distances, lead to population differentiation. Inother words, these barriers are the main obstacles lead-ing to population exchange [19]. Other studies have re-ported that A. cerana, even in the same region in China,can be highly variable [17, 20–23], which has promptedus to study this species.A. cerana uses small-scale nectar plants effectively.
This species also has a strong harvesting ability, a longhoney-collecting period and adaptability, strong diseaseresistance, and low consumption of feed, which arehighly suitable for changing landscapes. The number ofA. cerana has fallen sharply in recent decades [24], withclimate change being one of the main threats to this spe-cies [25]. On the one hand, A. cerana has unique eco-nomic and ecological values in agriculture in China. Inrecent years, due to the continuous increase of China’spopulation, A. cerana has helped to maintain a balancebetween demand and production by contributing to highyields of grain. On the other hand, A. cerana is at thecenter of research in evolutionary biology, which at-tempts to understand how the population responds toclimate change or environmental insults, thereby provid-ing basic knowledge of the evolution and adaptation ofA. cerana.In this study, we collected samples from regions of dif-
ferent topography, environment, and climate and carriedout a comprehensive morphometric determination, withthe A. cerana genome [18] serving as the basic resource.The accuracy of the division of A. cerana can also beused to determine the genetic variation of the adaptiveand economic shape, thereby providing an in-depth un-derstanding of the genetic structure of A. cerana as awhole. We conducted a more comprehensive measure-ment of North China and analyzed the effects of topo-graphical and environmental changes, including human
activities, by combining morphological characteristicsand genomic differences. We identified genetic varia-tions, proposed a rapid classification method, exploredthe population structure and factors affecting differenti-ation, and screened the A. cerana genes that adapted tothe local environment, which provides evidence of gen-etic diversity for future research investigating A. cerana.
ResultsPopulation structureThe morphological measurements of the collected A.cerana samples included: (1) Bee right front wing: lengthof bee right forewing cubital vein a (a), length of beeright forewing cubital vein b (b), width of bee right fore-wing (FB), length of bee right forewing (FL), angle A4,B4, D7, E9, G18, J10, J16, K19, L13, N23, O26 of beeforewing (A4, B4, D7, E9, G18, J10, J16, K19, L13, N23,O26), bee index number of cubital vein (Ci); (2) Beeright hind wing: Bee branches midrib (NT), Number ofbee hindwing hamule (Nh); (3) Bee tergum: bee lengthof tergum 3,4 (T3, T4), bee width of tomentum on ter-gum 5 (T5); (4) Bee sternum: (bee length of sternum 7(L7), bee width of sternum 7 (T7), bee length of sternum4 (S4), bee distance of bee wax mirror on sternum 4(WD), bee length of bee wax mirror on sternum 4 (WL),bee width of bee wax mirror on sternum 4 (WT); (5)Bee hind leg (length of femur of bee hind leg (Fe), lengthof bee hind leg basitarsus (ML), width of bee hind legbasitarsus (MT), length of tibia of bee hind leg (Ti); (6)Color of the bee: bee pigment of scutellum B,K area (B,K), bee pigment of tergum 2,3,4 (P2, P3, P4), bee pig-ment of clypeus (Pc), bee pigment of labrum (PL), andbee pigment of scutellum Sc area (Sc) (Additional file 2:Table S1). The abbreviations corresponding to these 39traits and other names are located in Additional file 3:Table S2. The results showed significant differences be-tween the different regions (P < 0.01).We divided 462 A. cerana from 31 populations col-
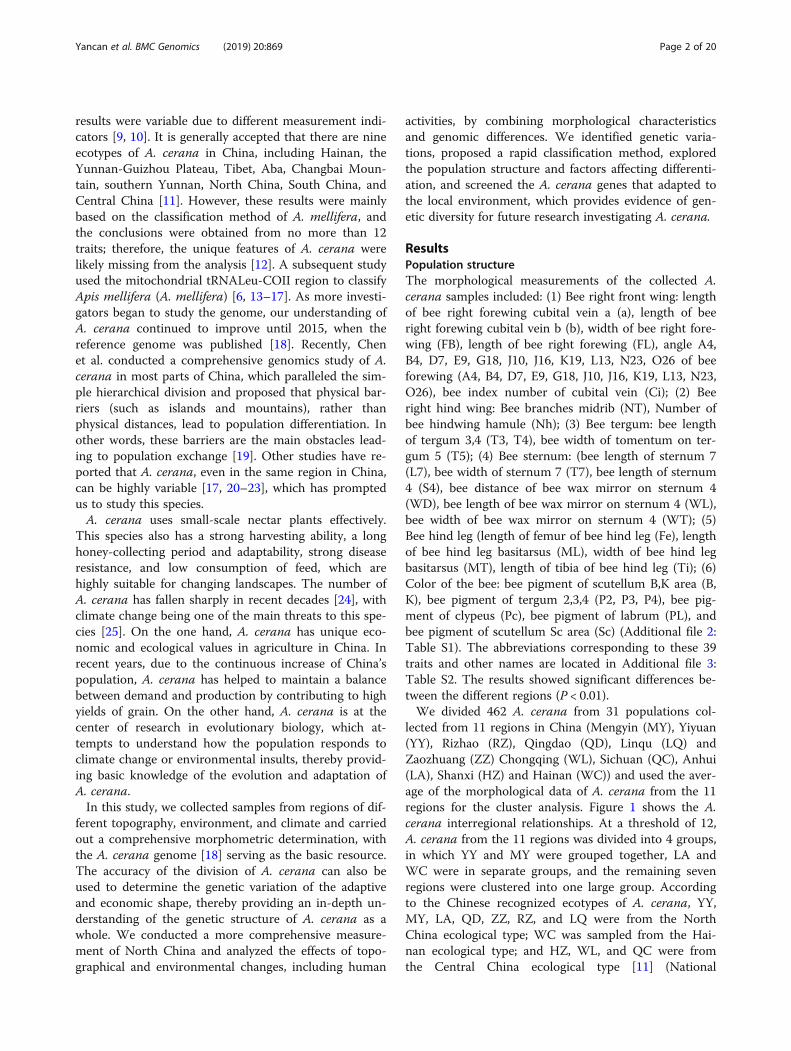
lected from 11 regions in China (Mengyin (MY), Yiyuan(YY), Rizhao (RZ), Qingdao (QD), Linqu (LQ) andZaozhuang (ZZ) Chongqing (WL), Sichuan (QC), Anhui(LA), Shanxi (HZ) and Hainan (WC)) and used the aver-age of the morphological data of A. cerana from the 11regions for the cluster analysis. Figure 1 shows the A.cerana interregional relationships. At a threshold of 12,A. cerana from the 11 regions was divided into 4 groups,in which YY and MY were grouped together, LA andWC were in separate groups, and the remaining sevenregions were clustered into one large group. Accordingto the Chinese recognized ecotypes of A. cerana, YY,MY, LA, QD, ZZ, RZ, and LQ were from the NorthChina ecological type; WC was sampled from the Hai-nan ecological type; and HZ, WL, and QC were fromthe Central China ecological type [11] (National
Yancan et al. BMC Genomics (2019) 20:869 Page 2 of 20
Commission for Animal Genetic Resources 2011). Al-though ZZ, RZ, QD, and LQ were from North China,they were clustered into a group associated with CentralChina ecological type according to our measurements.We clustered the 39 traits into three categories—body
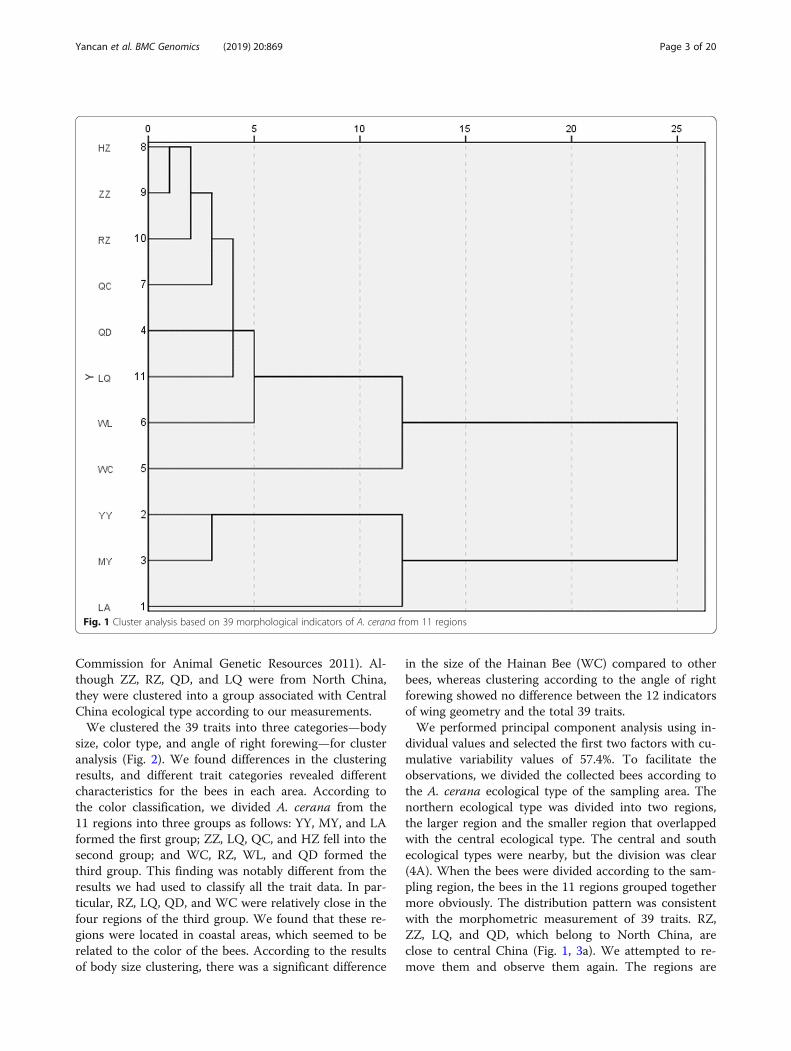
size, color type, and angle of right forewing—for clusteranalysis (Fig. 2). We found differences in the clusteringresults, and different trait categories revealed differentcharacteristics for the bees in each area. According tothe color classification, we divided A. cerana from the11 regions into three groups as follows: YY, MY, and LAformed the first group; ZZ, LQ, QC, and HZ fell into thesecond group; and WC, RZ, WL, and QD formed thethird group. This finding was notably different from theresults we had used to classify all the trait data. In par-ticular, RZ, LQ, QD, and WC were relatively close in thefour regions of the third group. We found that these re-gions were located in coastal areas, which seemed to berelated to the color of the bees. According to the resultsof body size clustering, there was a significant difference
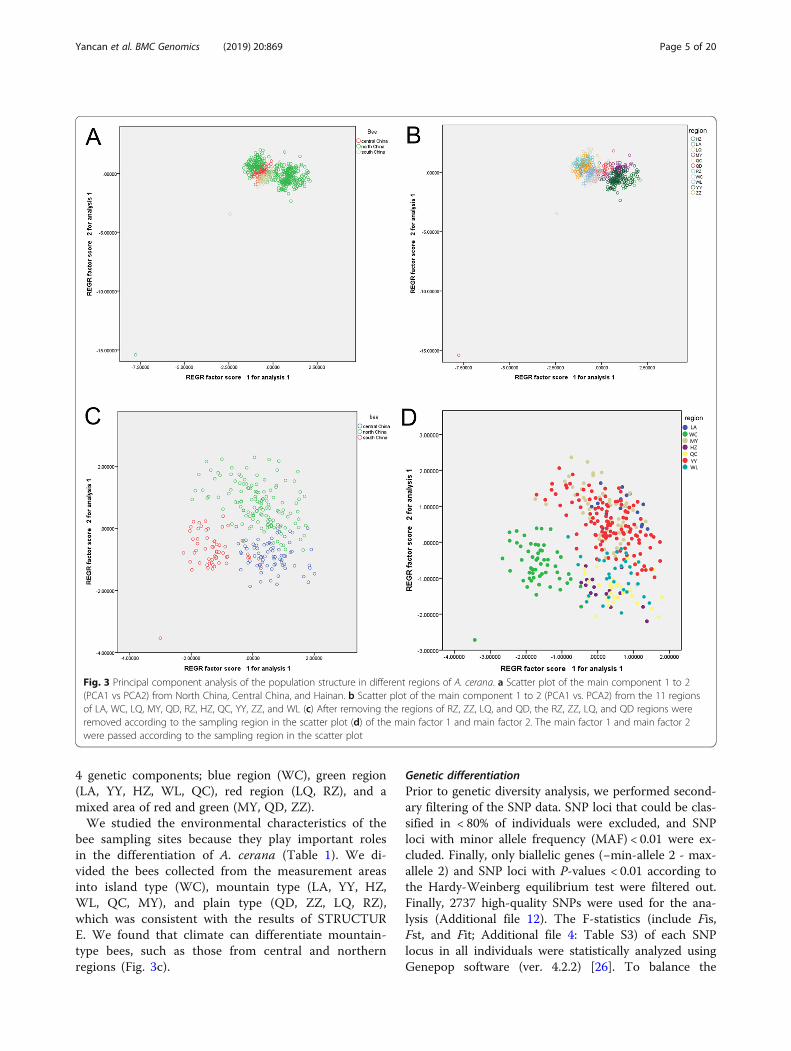
in the size of the Hainan Bee (WC) compared to otherbees, whereas clustering according to the angle of rightforewing showed no difference between the 12 indicatorsof wing geometry and the total 39 traits.We performed principal component analysis using in-
dividual values and selected the first two factors with cu-mulative variability values of 57.4%. To facilitate theobservations, we divided the collected bees according tothe A. cerana ecological type of the sampling area. Thenorthern ecological type was divided into two regions,the larger region and the smaller region that overlappedwith the central ecological type. The central and southecological types were nearby, but the division was clear(4A). When the bees were divided according to the sam-pling region, the bees in the 11 regions grouped togethermore obviously. The distribution pattern was consistentwith the morphometric measurement of 39 traits. RZ,ZZ, LQ, and QD, which belong to North China, areclose to central China (Fig. 1, 3a). We attempted to re-move them and observe them again. The regions are
Fig. 1 Cluster analysis based on 39 morphological indicators of A. cerana from 11 regions
Yancan et al. BMC Genomics (2019) 20:869 Page 3 of 20
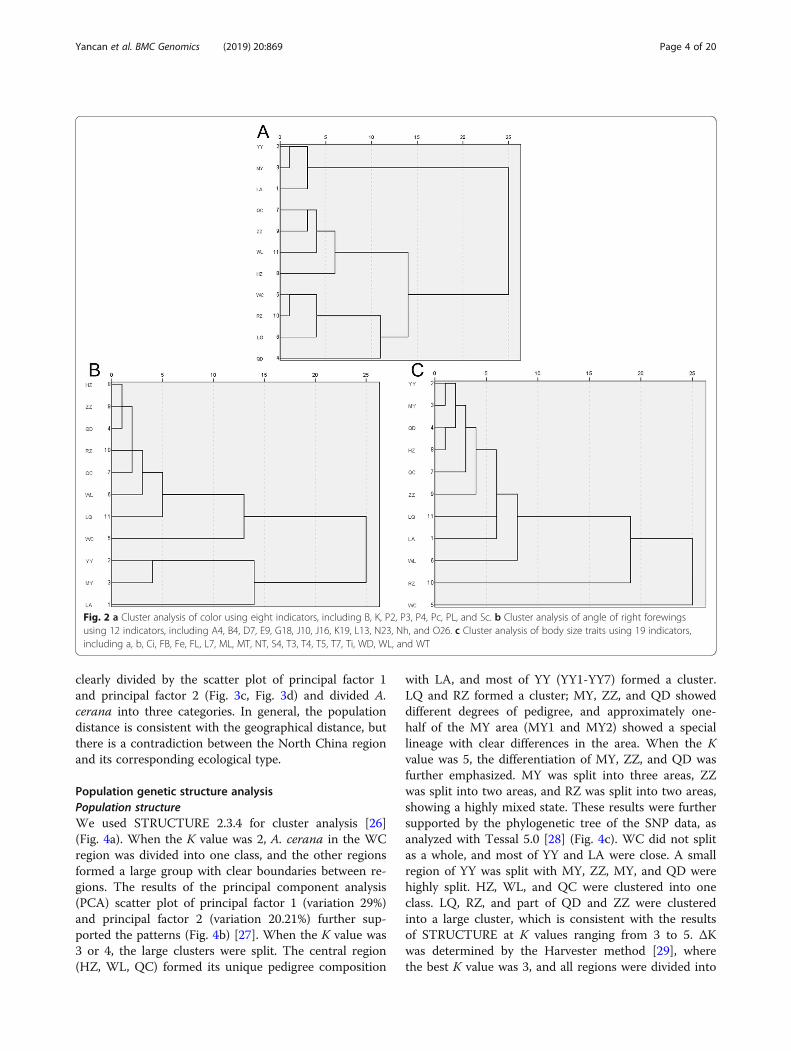
clearly divided by the scatter plot of principal factor 1and principal factor 2 (Fig. 3c, Fig. 3d) and divided A.cerana into three categories. In general, the populationdistance is consistent with the geographical distance, butthere is a contradiction between the North China regionand its corresponding ecological type.
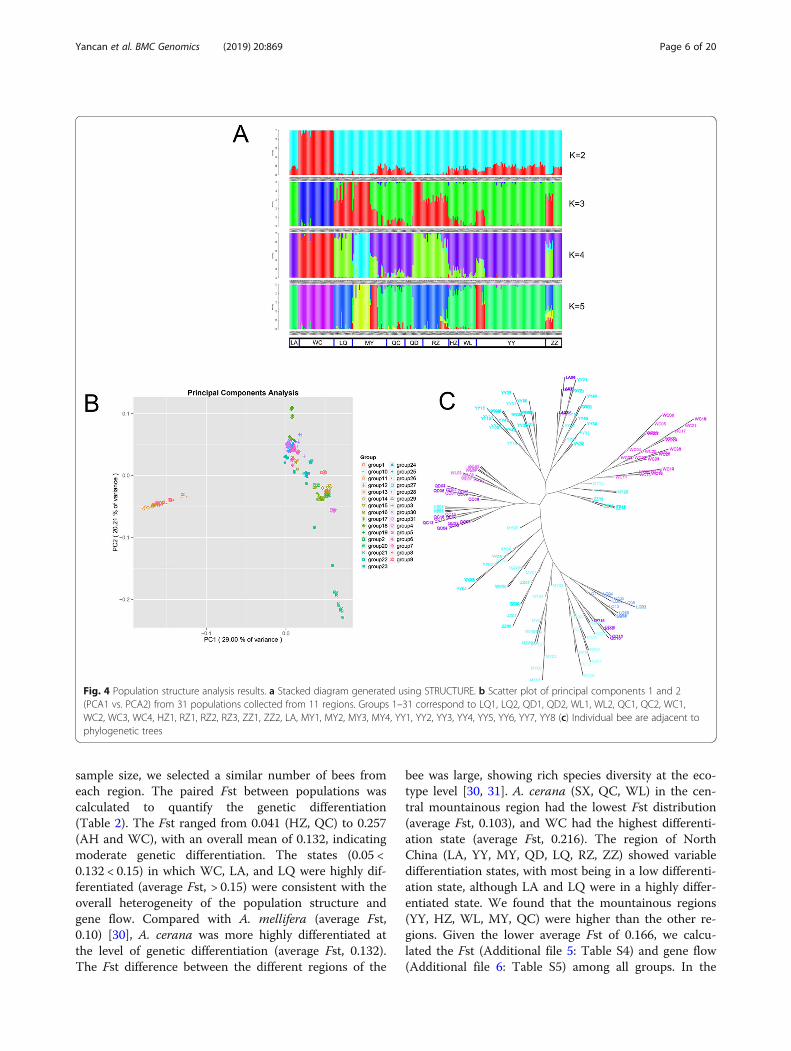
Population genetic structure analysisPopulation structureWe used STRUCTURE 2.3.4 for cluster analysis [26](Fig. 4a). When the K value was 2, A. cerana in the WCregion was divided into one class, and the other regionsformed a large group with clear boundaries between re-gions. The results of the principal component analysis(PCA) scatter plot of principal factor 1 (variation 29%)and principal factor 2 (variation 20.21%) further sup-ported the patterns (Fig. 4b) [27]. When the K value was3 or 4, the large clusters were split. The central region(HZ, WL, QC) formed its unique pedigree composition
with LA, and most of YY (YY1-YY7) formed a cluster.LQ and RZ formed a cluster; MY, ZZ, and QD showeddifferent degrees of pedigree, and approximately one-half of the MY area (MY1 and MY2) showed a speciallineage with clear differences in the area. When the Kvalue was 5, the differentiation of MY, ZZ, and QD wasfurther emphasized. MY was split into three areas, ZZwas split into two areas, and RZ was split into two areas,showing a highly mixed state. These results were furthersupported by the phylogenetic tree of the SNP data, asanalyzed with Tessal 5.0 [28] (Fig. 4c). WC did not splitas a whole, and most of YY and LA were close. A smallregion of YY was split with MY, ZZ, MY, and QD werehighly split. HZ, WL, and QC were clustered into oneclass. LQ, RZ, and part of QD and ZZ were clusteredinto a large cluster, which is consistent with the resultsof STRUCTURE at K values ranging from 3 to 5. ΔKwas determined by the Harvester method [29], wherethe best K value was 3, and all regions were divided into
Fig. 2 a Cluster analysis of color using eight indicators, including B, K, P2, P3, P4, Pc, PL, and Sc. b Cluster analysis of angle of right forewingsusing 12 indicators, including A4, B4, D7, E9, G18, J10, J16, K19, L13, N23, Nh, and O26. c Cluster analysis of body size traits using 19 indicators,including a, b, Ci, FB, Fe, FL, L7, ML, MT, NT, S4, T3, T4, T5, T7, Ti, WD, WL, and WT
Yancan et al. BMC Genomics (2019) 20:869 Page 4 of 20
4 genetic components; blue region (WC), green region(LA, YY, HZ, WL, QC), red region (LQ, RZ), and amixed area of red and green (MY, QD, ZZ).We studied the environmental characteristics of the
bee sampling sites because they play important rolesin the differentiation of A. cerana (Table 1). We di-vided the bees collected from the measurement areasinto island type (WC), mountain type (LA, YY, HZ,WL, QC, MY), and plain type (QD, ZZ, LQ, RZ),which was consistent with the results of STRUCTURE. We found that climate can differentiate mountain-type bees, such as those from central and northernregions (Fig. 3c).
Genetic differentiationPrior to genetic diversity analysis, we performed second-ary filtering of the SNP data. SNP loci that could be clas-sified in < 80% of individuals were excluded, and SNPloci with minor allele frequency (MAF) < 0.01 were ex-cluded. Finally, only biallelic genes (−min-allele 2 - max-allele 2) and SNP loci with P-values < 0.01 according tothe Hardy-Weinberg equilibrium test were filtered out.Finally, 2737 high-quality SNPs were used for the ana-lysis (Additional file 12). The F-statistics (include Fis,Fst, and Fit; Additional file 4: Table S3) of each SNPlocus in all individuals were statistically analyzed usingGenepop software (ver. 4.2.2) [26]. To balance the
Fig. 3 Principal component analysis of the population structure in different regions of A. cerana. a Scatter plot of the main component 1 to 2(PCA1 vs PCA2) from North China, Central China, and Hainan. b Scatter plot of the main component 1 to 2 (PCA1 vs. PCA2) from the 11 regionsof LA, WC, LQ, MY, QD, RZ, HZ, QC, YY, ZZ, and WL (c) After removing the regions of RZ, ZZ, LQ, and QD, the RZ, ZZ, LQ, and QD regions wereremoved according to the sampling region in the scatter plot (d) of the main factor 1 and main factor 2. The main factor 1 and main factor 2were passed according to the sampling region in the scatter plot
Yancan et al. BMC Genomics (2019) 20:869 Page 5 of 20
sample size, we selected a similar number of bees fromeach region. The paired Fst between populations wascalculated to quantify the genetic differentiation(Table 2). The Fst ranged from 0.041 (HZ, QC) to 0.257(AH and WC), with an overall mean of 0.132, indicatingmoderate genetic differentiation. The states (0.05 <0.132 < 0.15) in which WC, LA, and LQ were highly dif-ferentiated (average Fst, > 0.15) were consistent with theoverall heterogeneity of the population structure andgene flow. Compared with A. mellifera (average Fst,0.10) [30], A. cerana was more highly differentiated atthe level of genetic differentiation (average Fst, 0.132).The Fst difference between the different regions of the
bee was large, showing rich species diversity at the eco-type level [30, 31]. A. cerana (SX, QC, WL) in the cen-tral mountainous region had the lowest Fst distribution(average Fst, 0.103), and WC had the highest differenti-ation state (average Fst, 0.216). The region of NorthChina (LA, YY, MY, QD, LQ, RZ, ZZ) showed variabledifferentiation states, with most being in a low differenti-ation state, although LA and LQ were in a highly differ-entiated state. We found that the mountainous regions(YY, HZ, WL, MY, QC) were higher than the other re-gions. Given the lower average Fst of 0.166, we calcu-lated the Fst (Additional file 5: Table S4) and gene flow(Additional file 6: Table S5) among all groups. In the
Fig. 4 Population structure analysis results. a Stacked diagram generated using STRUCTURE. b Scatter plot of principal components 1 and 2(PCA1 vs. PCA2) from 31 populations collected from 11 regions. Groups 1–31 correspond to LQ1, LQ2, QD1, QD2, WL1, WL2, QC1, QC2, WC1,WC2, WC3, WC4, HZ1, RZ1, RZ2, RZ3, ZZ1, ZZ2, LA, MY1, MY2, MY3, MY4, YY1, YY2, YY3, YY4, YY5, YY6, YY7, YY8 (c) Individual bee are adjacent tophylogenetic trees
Yancan et al. BMC Genomics (2019) 20:869 Page 6 of 20
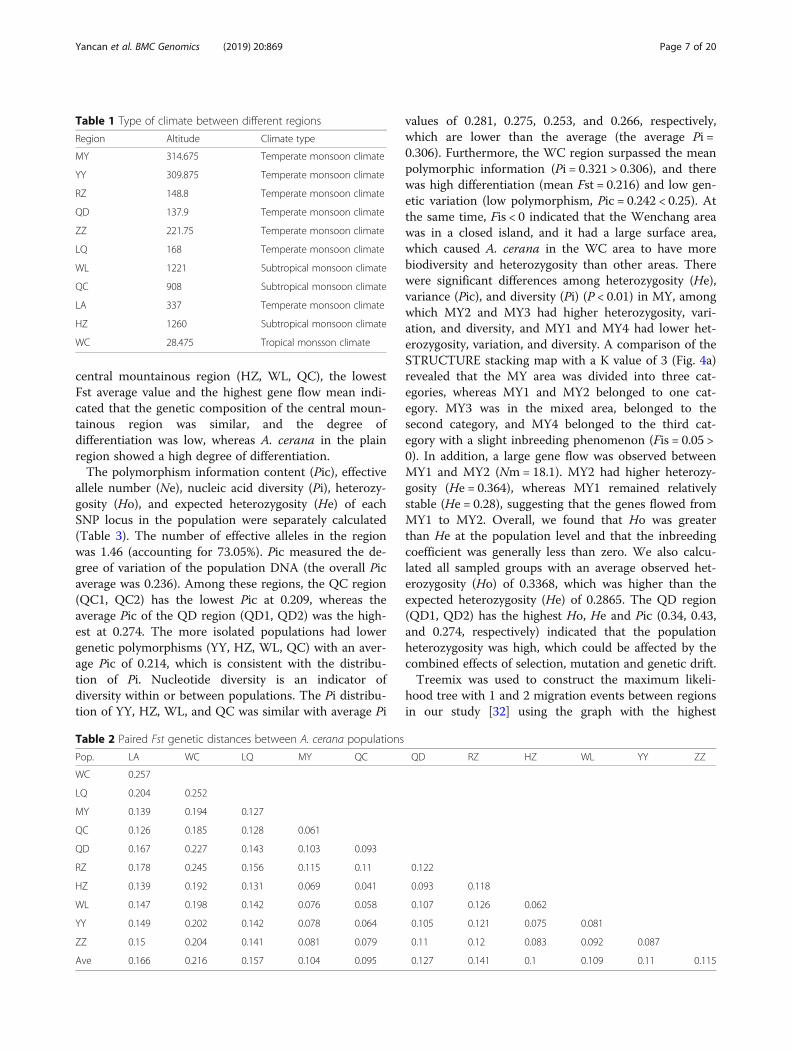
central mountainous region (HZ, WL, QC), the lowestFst average value and the highest gene flow mean indi-cated that the genetic composition of the central moun-tainous region was similar, and the degree ofdifferentiation was low, whereas A. cerana in the plainregion showed a high degree of differentiation.The polymorphism information content (Pic), effective
allele number (Ne), nucleic acid diversity (Pi), heterozy-gosity (Ho), and expected heterozygosity (He) of eachSNP locus in the population were separately calculated(Table 3). The number of effective alleles in the regionwas 1.46 (accounting for 73.05%). Pic measured the de-gree of variation of the population DNA (the overall Picaverage was 0.236). Among these regions, the QC region(QC1, QC2) has the lowest Pic at 0.209, whereas theaverage Pic of the QD region (QD1, QD2) was the high-est at 0.274. The more isolated populations had lowergenetic polymorphisms (YY, HZ, WL, QC) with an aver-age Pic of 0.214, which is consistent with the distribu-tion of Pi. Nucleotide diversity is an indicator ofdiversity within or between populations. The Pi distribu-tion of YY, HZ, WL, and QC was similar with average Pi
values of 0.281, 0.275, 0.253, and 0.266, respectively,which are lower than the average (the average Pi =0.306). Furthermore, the WC region surpassed the meanpolymorphic information (Pi = 0.321 > 0.306), and therewas high differentiation (mean Fst = 0.216) and low gen-etic variation (low polymorphism, Pic = 0.242 < 0.25). Atthe same time, Fis < 0 indicated that the Wenchang areawas in a closed island, and it had a large surface area,which caused A. cerana in the WC area to have morebiodiversity and heterozygosity than other areas. Therewere significant differences among heterozygosity (He),variance (Pic), and diversity (Pi) (P < 0.01) in MY, amongwhich MY2 and MY3 had higher heterozygosity, vari-ation, and diversity, and MY1 and MY4 had lower het-erozygosity, variation, and diversity. A comparison of theSTRUCTURE stacking map with a K value of 3 (Fig. 4a)revealed that the MY area was divided into three cat-egories, whereas MY1 and MY2 belonged to one cat-egory. MY3 was in the mixed area, belonged to thesecond category, and MY4 belonged to the third cat-egory with a slight inbreeding phenomenon (Fis = 0.05 >0). In addition, a large gene flow was observed betweenMY1 and MY2 (Nm= 18.1). MY2 had higher heterozy-gosity (He = 0.364), whereas MY1 remained relativelystable (He = 0.28), suggesting that the genes flowed fromMY1 to MY2. Overall, we found that Ho was greaterthan He at the population level and that the inbreedingcoefficient was generally less than zero. We also calcu-lated all sampled groups with an average observed het-erozygosity (Ho) of 0.3368, which was higher than theexpected heterozygosity (He) of 0.2865. The QD region(QD1, QD2) has the highest Ho, He and Pic (0.34, 0.43,and 0.274, respectively) indicated that the populationheterozygosity was high, which could be affected by thecombined effects of selection, mutation and genetic drift.Treemix was used to construct the maximum likeli-
hood tree with 1 and 2 migration events between regionsin our study [32] using the graph with the highest
Table 1 Type of climate between different regions
Region Altitude Climate type
MY 314.675 Temperate monsoon climate
YY 309.875 Temperate monsoon climate
RZ 148.8 Temperate monsoon climate
QD 137.9 Temperate monsoon climate
ZZ 221.75 Temperate monsoon climate
LQ 168 Temperate monsoon climate
WL 1221 Subtropical monsoon climate
QC 908 Subtropical monsoon climate
LA 337 Temperate monsoon climate
HZ 1260 Subtropical monsoon climate
WC 28.475 Tropical monsson climate
Table 2 Paired Fst genetic distances between A. cerana populations
Pop. LA WC LQ MY QC QD RZ HZ WL YY ZZ
WC 0.257
LQ 0.204 0.252
MY 0.139 0.194 0.127
QC 0.126 0.185 0.128 0.061
QD 0.167 0.227 0.143 0.103 0.093
RZ 0.178 0.245 0.156 0.115 0.11 0.122
HZ 0.139 0.192 0.131 0.069 0.041 0.093 0.118
WL 0.147 0.198 0.142 0.076 0.058 0.107 0.126 0.062
YY 0.149 0.202 0.142 0.078 0.064 0.105 0.121 0.075 0.081
ZZ 0.15 0.204 0.141 0.081 0.079 0.11 0.12 0.083 0.092 0.087
Ave 0.166 0.216 0.157 0.104 0.095 0.127 0.141 0.1 0.109 0.11 0.115
Yancan et al. BMC Genomics (2019) 20:869 Page 7 of 20
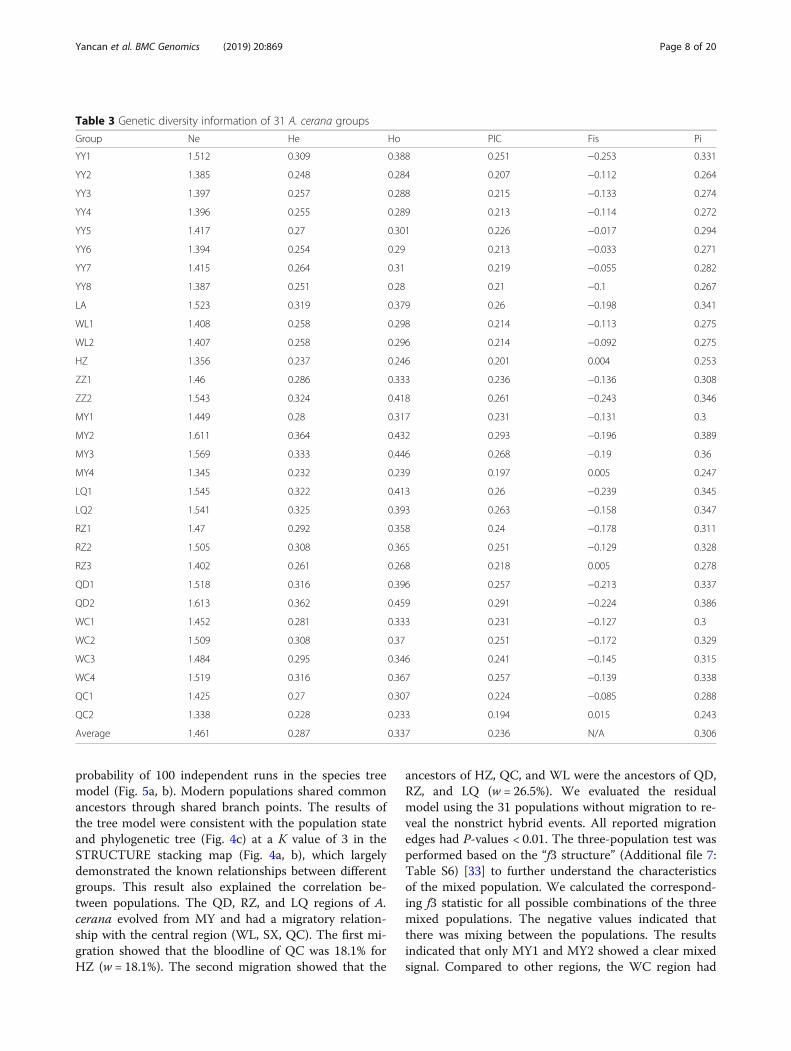
probability of 100 independent runs in the species treemodel (Fig. 5a, b). Modern populations shared commonancestors through shared branch points. The results ofthe tree model were consistent with the population stateand phylogenetic tree (Fig. 4c) at a K value of 3 in theSTRUCTURE stacking map (Fig. 4a, b), which largelydemonstrated the known relationships between differentgroups. This result also explained the correlation be-tween populations. The QD, RZ, and LQ regions of A.cerana evolved from MY and had a migratory relation-ship with the central region (WL, SX, QC). The first mi-gration showed that the bloodline of QC was 18.1% forHZ (w = 18.1%). The second migration showed that the
ancestors of HZ, QC, and WL were the ancestors of QD,RZ, and LQ (w = 26.5%). We evaluated the residualmodel using the 31 populations without migration to re-veal the nonstrict hybrid events. All reported migrationedges had P-values < 0.01. The three-population test wasperformed based on the “f3 structure” (Additional file 7:Table S6) [33] to further understand the characteristicsof the mixed population. We calculated the correspond-ing f3 statistic for all possible combinations of the threemixed populations. The negative values indicated thatthere was mixing between the populations. The resultsindicated that only MY1 and MY2 showed a clear mixedsignal. Compared to other regions, the WC region had
Table 3 Genetic diversity information of 31 A. cerana groups
Group Ne He Ho PIC Fis Pi
YY1 1.512 0.309 0.388 0.251 −0.253 0.331
YY2 1.385 0.248 0.284 0.207 −0.112 0.264
YY3 1.397 0.257 0.288 0.215 −0.133 0.274
YY4 1.396 0.255 0.289 0.213 −0.114 0.272
YY5 1.417 0.27 0.301 0.226 −0.017 0.294
YY6 1.394 0.254 0.29 0.213 −0.033 0.271
YY7 1.415 0.264 0.31 0.219 −0.055 0.282
YY8 1.387 0.251 0.28 0.21 −0.1 0.267
LA 1.523 0.319 0.379 0.26 −0.198 0.341
WL1 1.408 0.258 0.298 0.214 −0.113 0.275
WL2 1.407 0.258 0.296 0.214 −0.092 0.275
HZ 1.356 0.237 0.246 0.201 0.004 0.253
ZZ1 1.46 0.286 0.333 0.236 −0.136 0.308
ZZ2 1.543 0.324 0.418 0.261 −0.243 0.346
MY1 1.449 0.28 0.317 0.231 −0.131 0.3
MY2 1.611 0.364 0.432 0.293 −0.196 0.389
MY3 1.569 0.333 0.446 0.268 −0.19 0.36
MY4 1.345 0.232 0.239 0.197 0.005 0.247
LQ1 1.545 0.322 0.413 0.26 −0.239 0.345
LQ2 1.541 0.325 0.393 0.263 −0.158 0.347
RZ1 1.47 0.292 0.358 0.24 −0.178 0.311
RZ2 1.505 0.308 0.365 0.251 −0.129 0.328
RZ3 1.402 0.261 0.268 0.218 0.005 0.278
QD1 1.518 0.316 0.396 0.257 −0.213 0.337
QD2 1.613 0.362 0.459 0.291 −0.224 0.386
WC1 1.452 0.281 0.333 0.231 −0.127 0.3
WC2 1.509 0.308 0.37 0.251 −0.172 0.329
WC3 1.484 0.295 0.346 0.241 −0.145 0.315
WC4 1.519 0.316 0.367 0.257 −0.139 0.338
QC1 1.425 0.27 0.307 0.224 −0.085 0.288
QC2 1.338 0.228 0.233 0.194 0.015 0.243
Average 1.461 0.287 0.337 0.236 N/A 0.306
Yancan et al. BMC Genomics (2019) 20:869 Page 8 of 20
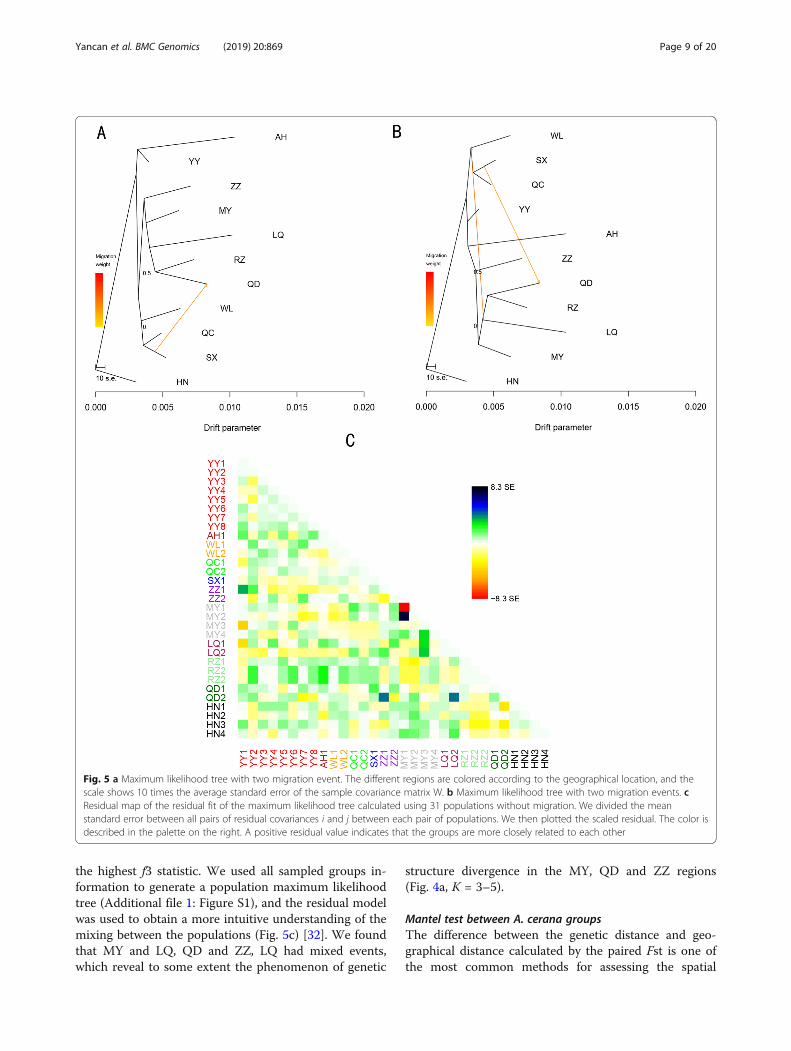
the highest f3 statistic. We used all sampled groups in-formation to generate a population maximum likelihoodtree (Additional file 1: Figure S1), and the residual modelwas used to obtain a more intuitive understanding of themixing between the populations (Fig. 5c) [32]. We foundthat MY and LQ, QD and ZZ, LQ had mixed events,which reveal to some extent the phenomenon of genetic
structure divergence in the MY, QD and ZZ regions(Fig. 4a, K = 3–5).
Mantel test between A. cerana groupsThe difference between the genetic distance and geo-graphical distance calculated by the paired Fst is one ofthe most common methods for assessing the spatial
Fig. 5 a Maximum likelihood tree with two migration event. The different regions are colored according to the geographical location, and thescale shows 10 times the average standard error of the sample covariance matrix W. b Maximum likelihood tree with two migration events. cResidual map of the residual fit of the maximum likelihood tree calculated using 31 populations without migration. We divided the meanstandard error between all pairs of residual covariances i and j between each pair of populations. We then plotted the scaled residual. The color isdescribed in the palette on the right. A positive residual value indicates that the groups are more closely related to each other
Yancan et al. BMC Genomics (2019) 20:869 Page 9 of 20
communication of the population structure [34–36]. Weused ade4 within R [37], and the physical distance andgenetic distance Fst were tested by Mantel [34, 36]. Weobserved a significant correlation between geographicaldistance and genetic distance (P = 0.008). We also usedPASSaGE for repeated tests and obtained the same re-sult (P = 0.0093). There was a significant correlation be-tween physical distance and genetic distance, and thecorrelation degree was r = 0.34493. We calculated thisvalue for A. cerana in North China. The results showedthat there was a weak correlation between geographicdistance and genetic distance (P = 0.051), and the correl-ation degree was reduced to r = 0.273. This finding maybe related to the high plains in North China and lowaltitude.North China has a rich terrain and belongs to the tem-
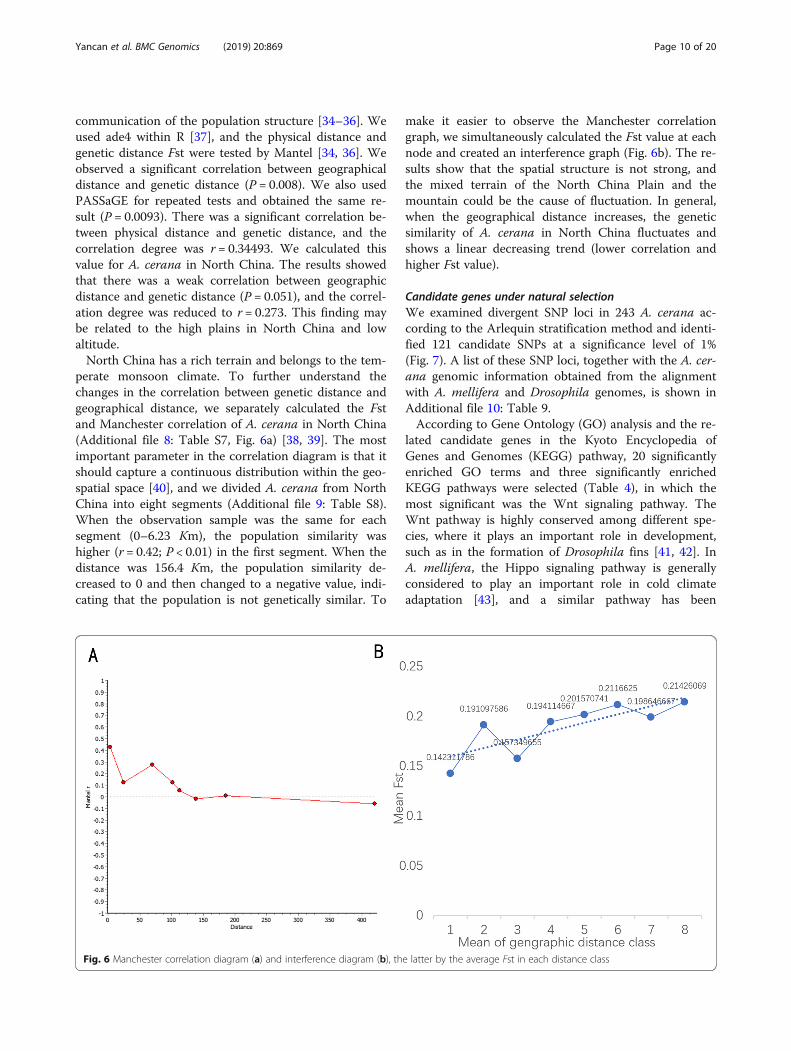
perate monsoon climate. To further understand thechanges in the correlation between genetic distance andgeographical distance, we separately calculated the Fstand Manchester correlation of A. cerana in North China(Additional file 8: Table S7, Fig. 6a) [38, 39]. The mostimportant parameter in the correlation diagram is that itshould capture a continuous distribution within the geo-spatial space [40], and we divided A. cerana from NorthChina into eight segments (Additional file 9: Table S8).When the observation sample was the same for eachsegment (0–6.23 Km), the population similarity washigher (r = 0.42; P < 0.01) in the first segment. When thedistance was 156.4 Km, the population similarity de-creased to 0 and then changed to a negative value, indi-cating that the population is not genetically similar. To
make it easier to observe the Manchester correlationgraph, we simultaneously calculated the Fst value at eachnode and created an interference graph (Fig. 6b). The re-sults show that the spatial structure is not strong, andthe mixed terrain of the North China Plain and themountain could be the cause of fluctuation. In general,when the geographical distance increases, the geneticsimilarity of A. cerana in North China fluctuates andshows a linear decreasing trend (lower correlation andhigher Fst value).
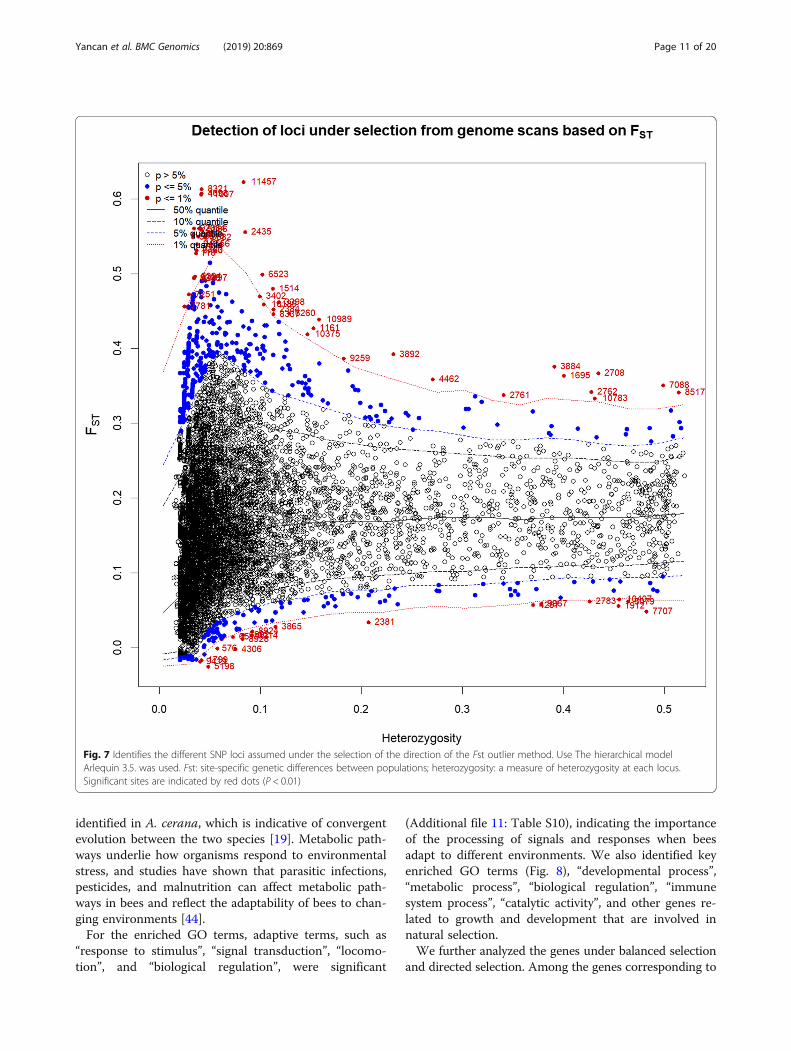
Candidate genes under natural selectionWe examined divergent SNP loci in 243 A. cerana ac-cording to the Arlequin stratification method and identi-fied 121 candidate SNPs at a significance level of 1%(Fig. 7). A list of these SNP loci, together with the A. cer-ana genomic information obtained from the alignmentwith A. mellifera and Drosophila genomes, is shown inAdditional file 10: Table 9.According to Gene Ontology (GO) analysis and the re-
lated candidate genes in the Kyoto Encyclopedia ofGenes and Genomes (KEGG) pathway, 20 significantlyenriched GO terms and three significantly enrichedKEGG pathways were selected (Table 4), in which themost significant was the Wnt signaling pathway. TheWnt pathway is highly conserved among different spe-cies, where it plays an important role in development,such as in the formation of Drosophila fins [41, 42]. InA. mellifera, the Hippo signaling pathway is generallyconsidered to play an important role in cold climateadaptation [43], and a similar pathway has been
Fig. 6 Manchester correlation diagram (a) and interference diagram (b), the latter by the average Fst in each distance class
Yancan et al. BMC Genomics (2019) 20:869 Page 10 of 20
identified in A. cerana, which is indicative of convergentevolution between the two species [19]. Metabolic path-ways underlie how organisms respond to environmentalstress, and studies have shown that parasitic infections,pesticides, and malnutrition can affect metabolic path-ways in bees and reflect the adaptability of bees to chan-ging environments [44].For the enriched GO terms, adaptive terms, such as
“response to stimulus”, “signal transduction”, “locomo-tion”, and “biological regulation”, were significant
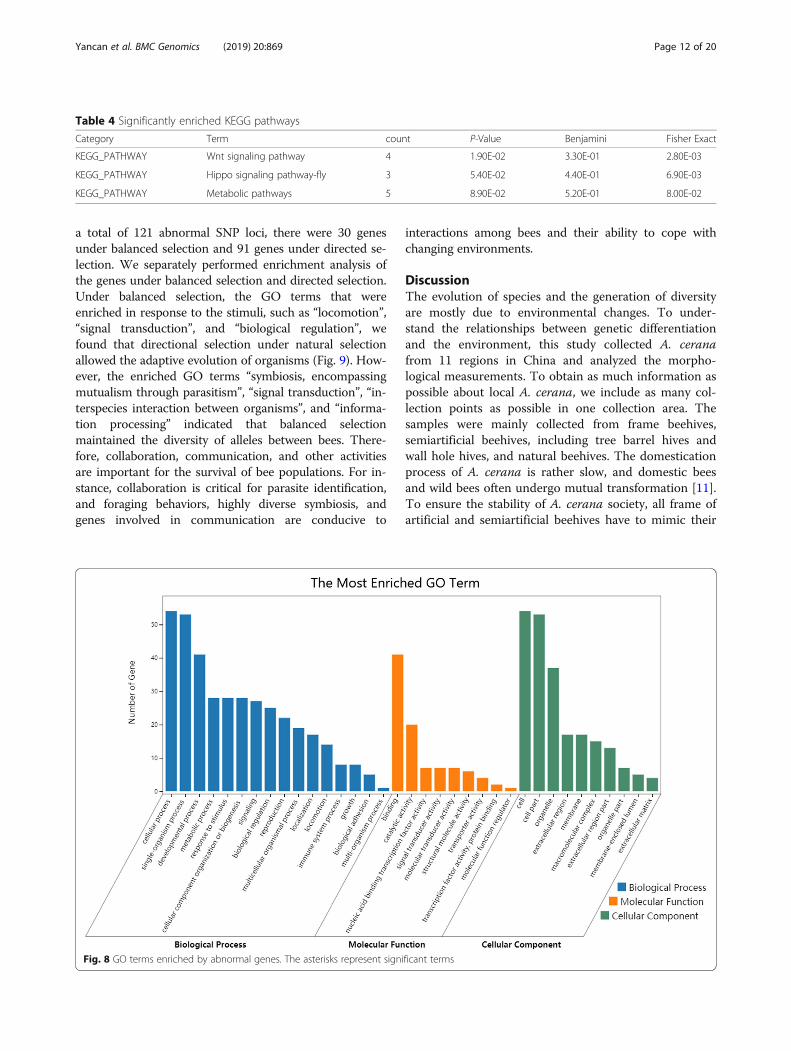
(Additional file 11: Table S10), indicating the importanceof the processing of signals and responses when beesadapt to different environments. We also identified keyenriched GO terms (Fig. 8), “developmental process”,“metabolic process”, “biological regulation”, “immunesystem process”, “catalytic activity”, and other genes re-lated to growth and development that are involved innatural selection.We further analyzed the genes under balanced selection
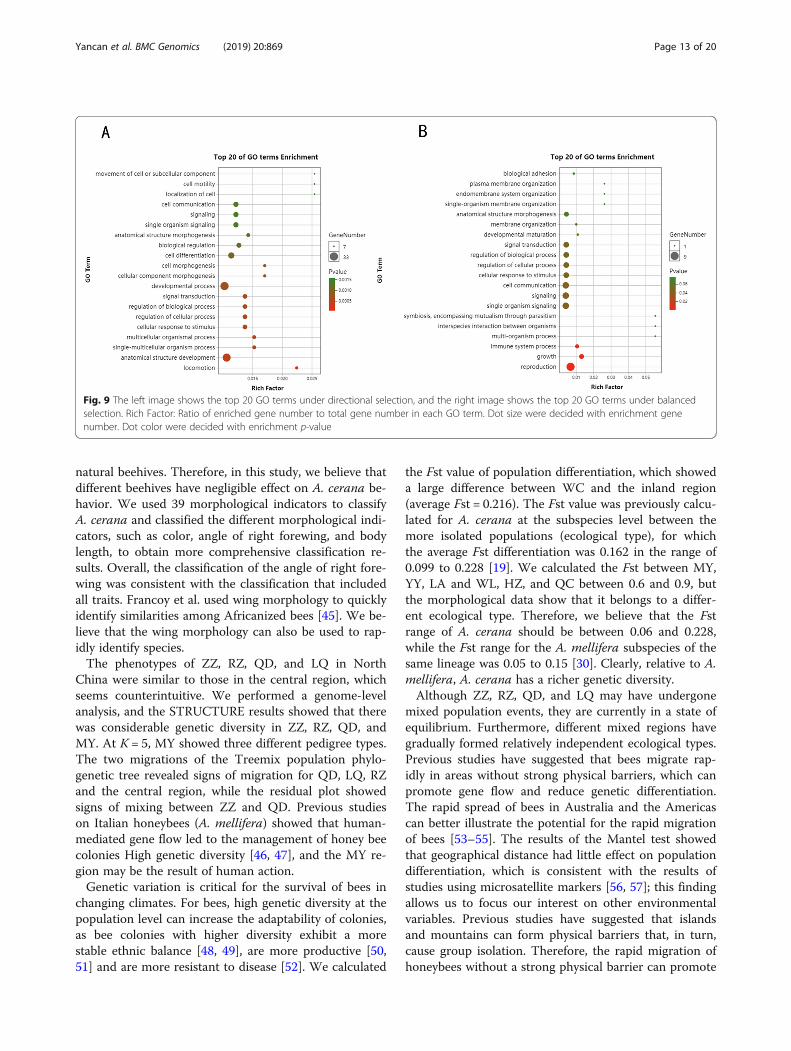
and directed selection. Among the genes corresponding to
Fig. 7 Identifies the different SNP loci assumed under the selection of the direction of the Fst outlier method. Use The hierarchical modelArlequin 3.5. was used. Fst: site-specific genetic differences between populations; heterozygosity: a measure of heterozygosity at each locus.Significant sites are indicated by red dots (P < 0.01)
Yancan et al. BMC Genomics (2019) 20:869 Page 11 of 20
a total of 121 abnormal SNP loci, there were 30 genesunder balanced selection and 91 genes under directed se-lection. We separately performed enrichment analysis ofthe genes under balanced selection and directed selection.Under balanced selection, the GO terms that wereenriched in response to the stimuli, such as “locomotion”,“signal transduction”, and “biological regulation”, wefound that directional selection under natural selectionallowed the adaptive evolution of organisms (Fig. 9). How-ever, the enriched GO terms “symbiosis, encompassingmutualism through parasitism”, “signal transduction”, “in-terspecies interaction between organisms”, and “informa-tion processing” indicated that balanced selectionmaintained the diversity of alleles between bees. There-fore, collaboration, communication, and other activitiesare important for the survival of bee populations. For in-stance, collaboration is critical for parasite identification,and foraging behaviors, highly diverse symbiosis, andgenes involved in communication are conducive to
interactions among bees and their ability to cope withchanging environments.
DiscussionThe evolution of species and the generation of diversityare mostly due to environmental changes. To under-stand the relationships between genetic differentiationand the environment, this study collected A. ceranafrom 11 regions in China and analyzed the morpho-logical measurements. To obtain as much information aspossible about local A. cerana, we include as many col-lection points as possible in one collection area. Thesamples were mainly collected from frame beehives,semiartificial beehives, including tree barrel hives andwall hole hives, and natural beehives. The domesticationprocess of A. cerana is rather slow, and domestic beesand wild bees often undergo mutual transformation [11].To ensure the stability of A. cerana society, all frame ofartificial and semiartificial beehives have to mimic their
Fig. 8 GO terms enriched by abnormal genes. The asterisks represent significant terms
Table 4 Significantly enriched KEGG pathways
Category Term count P-Value Benjamini Fisher Exact
KEGG_PATHWAY Wnt signaling pathway 4 1.90E-02 3.30E-01 2.80E-03
KEGG_PATHWAY Hippo signaling pathway-fly 3 5.40E-02 4.40E-01 6.90E-03
KEGG_PATHWAY Metabolic pathways 5 8.90E-02 5.20E-01 8.00E-02
Yancan et al. BMC Genomics (2019) 20:869 Page 12 of 20
natural beehives. Therefore, in this study, we believe thatdifferent beehives have negligible effect on A. cerana be-havior. We used 39 morphological indicators to classifyA. cerana and classified the different morphological indi-cators, such as color, angle of right forewing, and bodylength, to obtain more comprehensive classification re-sults. Overall, the classification of the angle of right fore-wing was consistent with the classification that includedall traits. Francoy et al. used wing morphology to quicklyidentify similarities among Africanized bees [45]. We be-lieve that the wing morphology can also be used to rap-idly identify species.The phenotypes of ZZ, RZ, QD, and LQ in North
China were similar to those in the central region, whichseems counterintuitive. We performed a genome-levelanalysis, and the STRUCTURE results showed that therewas considerable genetic diversity in ZZ, RZ, QD, andMY. At K = 5, MY showed three different pedigree types.The two migrations of the Treemix population phylo-genetic tree revealed signs of migration for QD, LQ, RZand the central region, while the residual plot showedsigns of mixing between ZZ and QD. Previous studieson Italian honeybees (A. mellifera) showed that human-mediated gene flow led to the management of honey beecolonies High genetic diversity [46, 47], and the MY re-gion may be the result of human action.Genetic variation is critical for the survival of bees in
changing climates. For bees, high genetic diversity at thepopulation level can increase the adaptability of colonies,as bee colonies with higher diversity exhibit a morestable ethnic balance [48, 49], are more productive [50,51] and are more resistant to disease [52]. We calculated
the Fst value of population differentiation, which showeda large difference between WC and the inland region(average Fst = 0.216). The Fst value was previously calcu-lated for A. cerana at the subspecies level between themore isolated populations (ecological type), for whichthe average Fst differentiation was 0.162 in the range of0.099 to 0.228 [19]. We calculated the Fst between MY,YY, LA and WL, HZ, and QC between 0.6 and 0.9, butthe morphological data show that it belongs to a differ-ent ecological type. Therefore, we believe that the Fstrange of A. cerana should be between 0.06 and 0.228,while the Fst range for the A. mellifera subspecies of thesame lineage was 0.05 to 0.15 [30]. Clearly, relative to A.mellifera, A. cerana has a richer genetic diversity.Although ZZ, RZ, QD, and LQ may have undergone
mixed population events, they are currently in a state ofequilibrium. Furthermore, different mixed regions havegradually formed relatively independent ecological types.Previous studies have suggested that bees migrate rap-idly in areas without strong physical barriers, which canpromote gene flow and reduce genetic differentiation.The rapid spread of bees in Australia and the Americascan better illustrate the potential for the rapid migrationof bees [53–55]. The results of the Mantel test showedthat geographical distance had little effect on populationdifferentiation, which is consistent with the results ofstudies using microsatellite markers [56, 57]; this findingallows us to focus our interest on other environmentalvariables. Previous studies have suggested that islandsand mountains can form physical barriers that, in turn,cause group isolation. Therefore, the rapid migration ofhoneybees without a strong physical barrier can promote
Fig. 9 The left image shows the top 20 GO terms under directional selection, and the right image shows the top 20 GO terms under balancedselection. Rich Factor: Ratio of enriched gene number to total gene number in each GO term. Dot size were decided with enrichment genenumber. Dot color were decided with enrichment p-value
Yancan et al. BMC Genomics (2019) 20:869 Page 13 of 20
gene flow and reduce genetic differentiation. In addition,population growth can promote gene flow between pop-ulations [19], but our research shows that gene flow inthe mountains is more pronounced than in plain areas(Additional file 6: Table S5). In China, various humanactivities, such as the loss of agricultural land andurbanization, led to the loss of habitat of A. cerana, es-pecially in the vast plains of North China, which are par-ticularly conducive to urban construction. However,complex terrains are more resistant to human activities,which could be the reason for the higher degree of dif-ferentiation of A. cerana in ZZ, RZ, QD, and LQ. Webelieve that the isolation of A. cerana by human urbanagglomerations is more stringent than the physical isola-tion caused by mountains.Researchers believe that the survival of a species
through climate change, habitat loss, and ecosystemchanges is due to their physiological tolerance limits andresilience, ecological characteristics (e.g., behavior, heattolerance), and genetic diversity [58]. A. cerana showsthe potential of using all three strategies. Research hasdescribed a method to identify the performance of beepopulations based on outliers [59, 60]. In this study, wescreened 121 SNP loci, and functional enrichment ana-lysis highlighted several processes such as “neurology”,“biological regulation”, “behavior and growth”, and “in-terspecies interactions between organisms”, suggestingthat genes associated with these loci may experience se-lective stress as the population spreads through variousunwelcome habitats. Sensory transduction refers to theconversion of input stimuli into signals received by thebrain. Specific changes in these genes may require adap-tation to different food sources or other resources in thenew environment. Bees exhibit a range of different be-haviors in a social environment, and hundreds of genesare involved in the brain function and physiological be-havior of bees [61]. The social behavior of bees helps thepopulation maintain the homeostasis of the nest andcounteract changes in the external environment [62, 63].Furthermore, chemical signals coordinate the behaviorand physiology of colony members, and changes in pro-tein coding sequences may be related to the evolution ofchemical communication systems found in bees [64].Genetic diversity is an adaptive evolution of biologicalindividuals to changing environments. The ability toadapt to changing environmental variables strongly de-pends on sufficient genetic variation, the indirect impactof population size on evolution, and the balance betweenenvironmental rates [65]. We further analyzed 91 lociunder balanced selection and directed selection. The re-sults of the enrichment analysis showed that equilibriumselection plays an important role in maintaining the di-versity of alleles and increasing the stability of the popu-lation. Directed selection leads to the unilateral adaptive
evolution of the population. Taken together, the resultsof our study indicated rich genetic diversity in A. cerana.In summary, as a wide-range species, A. cerana shows
good potential for climate change, but the effects ofstress, such as pesticides, pollutants, pathogens, para-sites, and limited flower resources caused by human ac-tivities, are posing a larger threat to A. cerana in China[66, 67]. In this study, we provided new phenotypic andgenomic insights for further climate adaptation studiesthat can enhance our understanding of bee health andbreeding management.
ConclusionsOur study utilized the wide-range A. cerana species,as well as morphological characteristics and genomicmethods, to provide insights into the differentiationand adaptation of the species in China. We proposeda method for the rapid identification of the morph-ology of the wing and found some historical migra-tion between the North and Central regions. A.cerana in China exhibits high genetic diversity, andphysical barriers, rather than distance, are the drivingfactors for the differentiation of this highly migratoryspecies. Human activities, such as urbanization, havea great impact on the differentiation of A. cerana. Wescreened for abnormal SNP loci and obtained relatedgenes, performed enrichment analysis and gene ontol-ogy categories to identify candidate genes. The resultsof this study may help to elucidate the evolution ofA. cerana in different environments and promote ourunderstanding of how bee populations will respond toincreasing climate change and how to protect beesfrom current and future challenges.
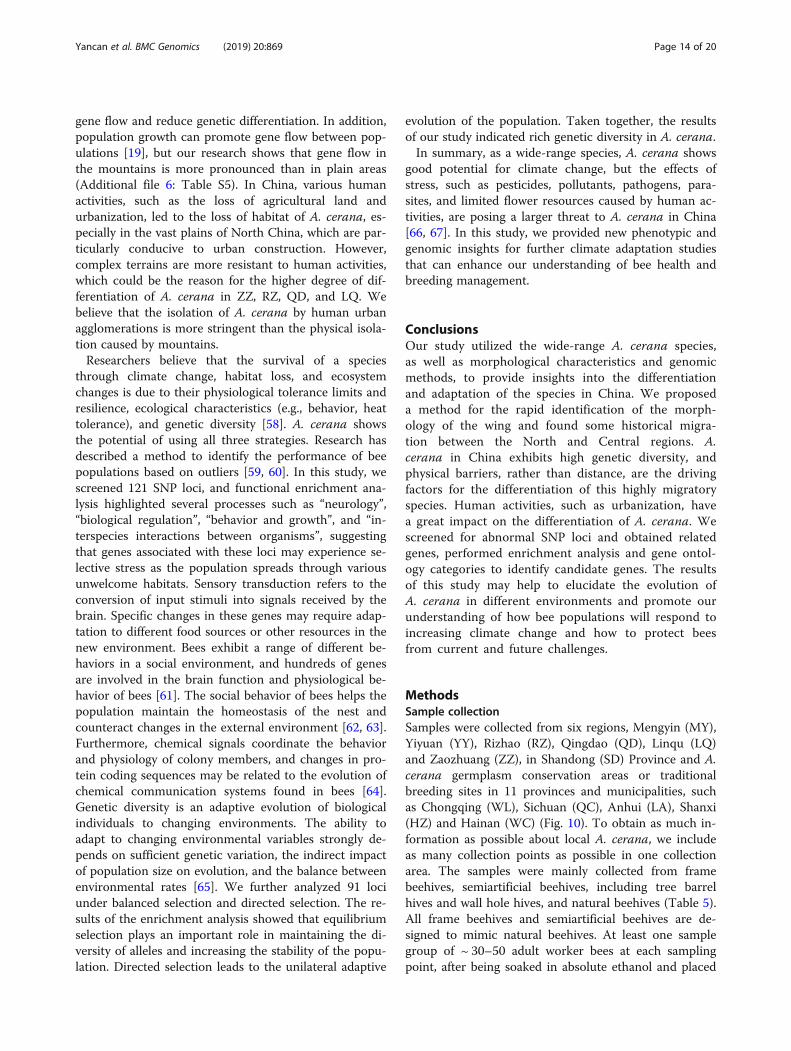
MethodsSample collectionSamples were collected from six regions, Mengyin (MY),Yiyuan (YY), Rizhao (RZ), Qingdao (QD), Linqu (LQ)and Zaozhuang (ZZ), in Shandong (SD) Province and A.cerana germplasm conservation areas or traditionalbreeding sites in 11 provinces and municipalities, suchas Chongqing (WL), Sichuan (QC), Anhui (LA), Shanxi(HZ) and Hainan (WC) (Fig. 10). To obtain as much in-formation as possible about local A. cerana, we includeas many collection points as possible in one collectionarea. The samples were mainly collected from framebeehives, semiartificial beehives, including tree barrelhives and wall hole hives, and natural beehives (Table 5).All frame beehives and semiartificial beehives are de-signed to mimic natural beehives. At least one samplegroup of ~ 30–50 adult worker bees at each samplingpoint, after being soaked in absolute ethanol and placed
Yancan et al. BMC Genomics (2019) 20:869 Page 14 of 20
in a sealed grinding bottle, were brought back and storedin a − 20 °C freezer.
Dissection and collection of morphometric dataThis test was carried out in accordance with the indica-tor project of the honeybee morphology researcher [68,69] and the color standards of A. cerana [70]. First, apicture of the entire body, which included the color pat-tern of the bee specimen, was taken, and tweezers wereused to remove the front and rear wings from the chest.
The sternal remnants were removed by tearing the con-nective tissue between the wings. The cut sternum wascleaned with a soft-bristle brush, and the residual tissuewas removed and fixed to the assay plate with scotchtape. Using a specific measuring microscope and itsmatching measurement software ImageView 3.7, mor-phological measurements were performed after adjustingthe scale. The morphological markers were as follows:front and rear wing length; angle of right forewing (A4,B4, D7, E9, K19, G18, J10, L13, J16, N23, O26); elbow
Fig. 10 The position of the sample in China, where the blue area represents the dense sampling site of the representative area of North Chinaf10:2 (Shandong). Sampling positions in Shandong Province were specially highlighted as yellow magnified area map. Base layer mapdate©OpenStreetMap contributors (page: https://www.openstreetmap.org/copyright)
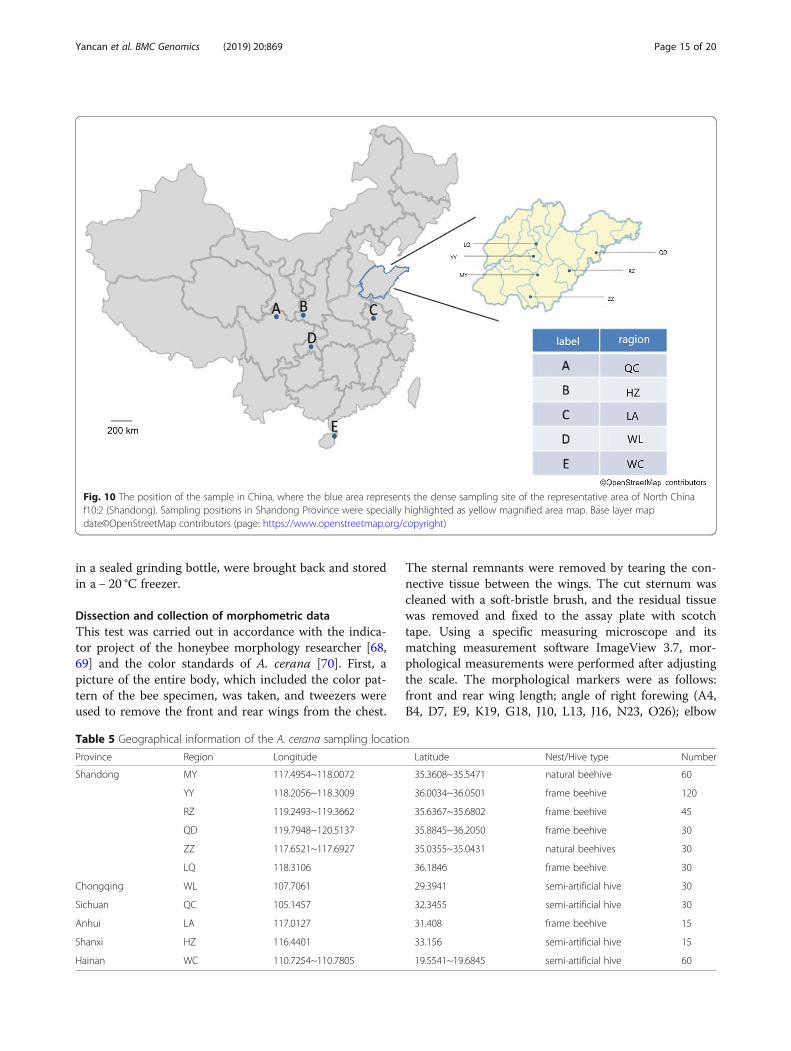
Table 5 Geographical information of the A. cerana sampling location
Province Region Longitude Latitude Nest/Hive type Number
Shandong MY 117.4954~118.0072 35.3608~35.5471 natural beehive 60
YY 118.2056~118.3009 36.0034~36.0501 frame beehive 120
RZ 119.2493~119.3662 35.6367~35.6802 frame beehive 45
QD 119.7948~120.5137 35.8845~36.2050 frame beehive 30
ZZ 117.6521~117.6927 35.0355~35.0431 natural beehives 30
LQ 118.3106 36.1846 frame beehive 30
Chongqing WL 107.7061 29.3941 semi-artificial hive 30
Sichuan QC 105.1457 32.3455 semi-artificial hive 30
Anhui LA 117.0127 31.408 frame beehive 15
Shanxi HZ 116.4401 33.156 semi-artificial hive 15
Hainan WC 110.7254~110.7805 19.5541~19.6845 semi-artificial hive 60
Yancan et al. BMC Genomics (2019) 20:869 Page 15 of 20
pulse length; and color aspect measurement of the lipbase, upper lip, small scutellum SC area, K area, B area,second back board, third back board, and fourth backboard (a total of 39 index). To avoid bias and improveaccuracy, each sample was evaluated for pigmentationby three different observers, and the highest number ofeach score was recorded and used for subsequentanalysis.
Sequencing, read mapping, and quality controlA. cerana was randomly selected from each of the sam-pled sites for sequencing, and a tag sequencing library ofA. cerana samples was constructed by the 2b-RAD tech-nique. All samples were constructed using standard 5′-NNN-3′ linkers. To obtain high quality reads, both thelibrary and quality-controlled libraries were subjected topaired-end sequencing data filtering on the HiSeq X Tenplatform, and SOAP2 was used to compare the sequen-cing data to the genome [71, 72] using maximum likeli-hood (maximum likelihood, ML) perform site typingand SNP detection, as well as VCF tools, to carry outstrict filtering to obtain the most informative SNPs [60].The detected SNPs were filtered out as follows: (1) ex-cept for sites in which less than 80% of the individualscould be typed, (2) sites with an MAF below 0.05, (3)one or four allelic sites were excluded, (4) exclude morethan one SNP locus in the tag, (5) eliminate loci with a
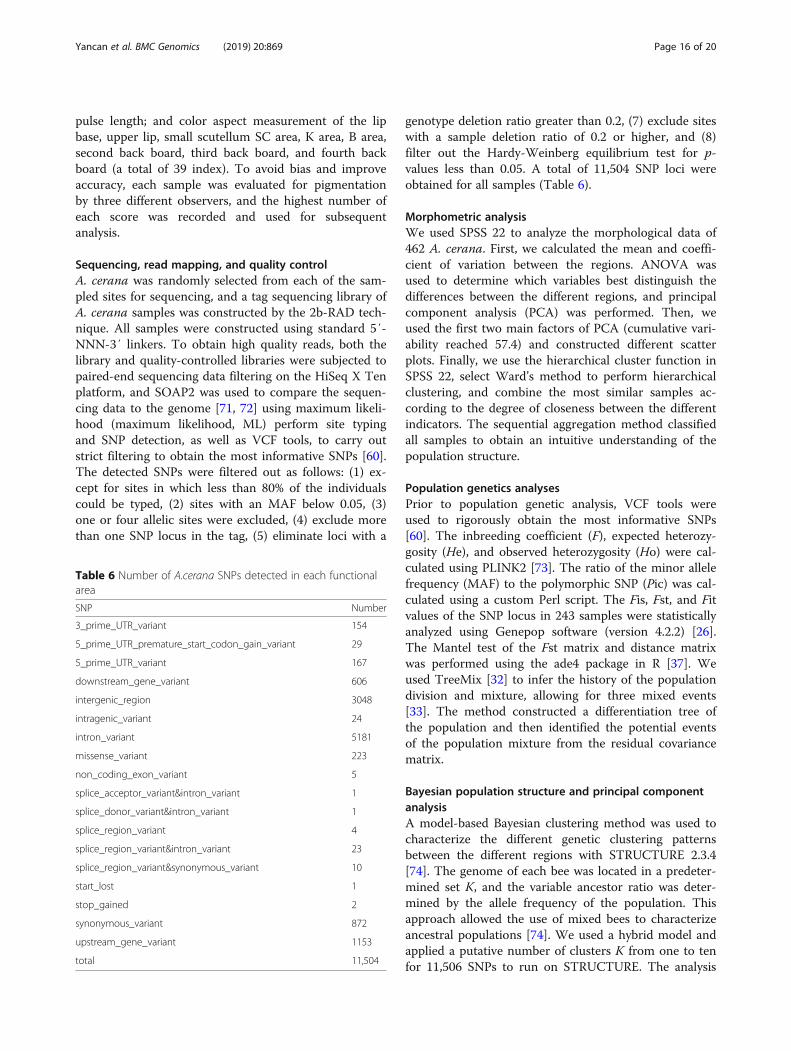
genotype deletion ratio greater than 0.2, (7) exclude siteswith a sample deletion ratio of 0.2 or higher, and (8)filter out the Hardy-Weinberg equilibrium test for p-values less than 0.05. A total of 11,504 SNP loci wereobtained for all samples (Table 6).
Morphometric analysisWe used SPSS 22 to analyze the morphological data of462 A. cerana. First, we calculated the mean and coeffi-cient of variation between the regions. ANOVA wasused to determine which variables best distinguish thedifferences between the different regions, and principalcomponent analysis (PCA) was performed. Then, weused the first two main factors of PCA (cumulative vari-ability reached 57.4) and constructed different scatterplots. Finally, we use the hierarchical cluster function inSPSS 22, select Ward’s method to perform hierarchicalclustering, and combine the most similar samples ac-cording to the degree of closeness between the differentindicators. The sequential aggregation method classifiedall samples to obtain an intuitive understanding of thepopulation structure.
Population genetics analysesPrior to population genetic analysis, VCF tools wereused to rigorously obtain the most informative SNPs[60]. The inbreeding coefficient (F), expected heterozy-gosity (He), and observed heterozygosity (Ho) were cal-culated using PLINK2 [73]. The ratio of the minor allelefrequency (MAF) to the polymorphic SNP (Pic) was cal-culated using a custom Perl script. The Fis, Fst, and Fitvalues of the SNP locus in 243 samples were statisticallyanalyzed using Genepop software (version 4.2.2) [26].The Mantel test of the Fst matrix and distance matrixwas performed using the ade4 package in R [37]. Weused TreeMix [32] to infer the history of the populationdivision and mixture, allowing for three mixed events[33]. The method constructed a differentiation tree ofthe population and then identified the potential eventsof the population mixture from the residual covariancematrix.
Bayesian population structure and principal componentanalysisA model-based Bayesian clustering method was used tocharacterize the different genetic clustering patternsbetween the different regions with STRUCTURE 2.3.4[74]. The genome of each bee was located in a predeter-mined set K, and the variable ancestor ratio was deter-mined by the allele frequency of the population. Thisapproach allowed the use of mixed bees to characterizeancestral populations [74]. We used a hybrid model andapplied a putative number of clusters K from one to tenfor 11,506 SNPs to run on STRUCTURE. The analysis
Table 6 Number of A.cerana SNPs detected in each functionalarea
SNP Number
3_prime_UTR_variant 154
5_prime_UTR_premature_start_codon_gain_variant 29
5_prime_UTR_variant 167
downstream_gene_variant 606
intergenic_region 3048
intragenic_variant 24
intron_variant 5181
missense_variant 223
non_coding_exon_variant 5
splice_acceptor_variant&intron_variant 1
splice_donor_variant&intron_variant 1
splice_region_variant 4
splice_region_variant&intron_variant 23
splice_region_variant&synonymous_variant 10
start_lost 1
stop_gained 2
synonymous_variant 872
upstream_gene_variant 1153
total 11,504
Yancan et al. BMC Genomics (2019) 20:869 Page 16 of 20
was performed without prior knowledge of the demo-graphic identity by simulating 50,000 preburning stepsand 100,000 iterations of the MCMC algorithm per run.Ten independent runs were performed for each K to es-timate the most reliable different genetic clusters usingthe probability of posterior probability (LnP(N/K)) [75]and the temporary amount DK of each K partition. Theposterior probability variation with respect to K betweenthe different runs was designated as the method for de-termining the true K value [76]. The most likely valuefor K was based on the network software STRUCTUREHARVESTER [29] and Evanno’s ΔK method [76], whichwas based on the average log likelihood, Ln P(D). UsingTASSEL v5.0 [28] and SPSS 22 to perform PCA of thegenetic and morphological traits of different individuals,respectively, enabled us to visualize the correlations be-tween individual bees in individuals/regions on a multi-dimensional scale.
Correlations between environmental variables andgenetic diversityThe Mantel test was performed using the Fst matrix anddistance matrix with the ade4 software package in R[37]. To describe the possible changes in the correlationbetween the genetic distance and geographical distance,we used PASSaGE 2.0 for Manchester correlation ana-lysis [77], according to the distance. The rank dividedthe distance matrix into submatrices. The populationswithin the boundary geographical distance described byeach submatrix corresponded to populations with differ-ent genetic distances. The average Fst of the set “dis-tance level” was calculated separately to generate apolyline “interference graph” that was combined withthe Manchester correlation map for a more intuitiveview.
Detecting SNP loci under selection based on Fst outliertestsA coalescence-based simulation was used to detect devi-ating SNP sites. With these methods, we expected to de-tect low-level differentiation sites under balancedselection (neutral loci) and high-level differentiation sitesunder directed selection (differentiation loci). The layer-ing method we used was a modification of the FDISTmethod that was performed with Arlequin ver 3.5.2.2[78, 79].. We used a hierarchical island model with 50,000 simulations to calculate the relationship between theFst and heterozygosity. A locus with an Fst value higherthan the 0.99 limit of the neutral distribution was con-sidered to be a putative outlier under divergent selection[59]. The remaining loci with nonsignificant Fst valueswere considered to be neutral SNPs. All procedures re-duced bias and maintained highly differentiated loci
between ecotypes individuals. We chose Fst values thatwere higher than the expected neutral distribution as thedirectional selection sites and Fst values that were lowerthan the expected neutral distribution as the balancedselection sites [60].
Gene ontology analysisSNP loci were screened using high-quality SNP loci [59, 80],and the reference sequence was obtained from NCBI(https://www.ncbi.nlm.nih.gov/assembly/GCF_001442555.1).A 50-base sequence upstream and downstream of the ex-traction site was sequenced and aligned with the A. melliferasequence to obtain the most recent genes. Enrichment ana-lysis was based on their orthologs in Drosophila melanoga-ster. The genes were assigned to GO and KEGG pathways.The functional enrichment of gene IDs was performed usingGeneMania and g: Profiler [81, 82] with the online analysissite DAVID for KEGG pathway exploration [83] and Benja-mini to correct the P-values to identify clusters of signifi-cantly enriched terms.
Supplementary informationSupplementary information accompanies this paper at https://doi.org/10.1186/s12864-019-6246-4.
Additional file 1: Figure S1. Maximum likelihood tree with onemigration event.
Additional file 2: Table S1. The 39 morphological measurements of A.cerana.
Additional file 3: Table S2. Abbreviation table.
Additional file 4: Table S3. The Fis, Fst, and Fit of each SNP locus.
Additional file 5: Table S4. The Fst table between all groups.
Additional file 6: Table S5. The gene flow table between all group.
Additional file 7: Table S6. Three population tests for admixture.
Additional file 8: Table S7. The Fst value table and distance table inNorth China.
Additional file 9: Table S8. Mantel test table.
Additional file 10: Table S9. Details of 121 candidate SNP loci.
Additional file 11: Table S10. GO term enrichment result.
Additional file 12. SNP data after filtering.
Abbreviationsa: Length of bee right forewing cubital vein a; A. cerana: Apis cerana; A.mellifera: Apis mellifera; A4: Angle A4 of bee forwing; B: Bee pigment ofscutellum B area; b: Length of bee right forewing cubita lvein b; B4: AngleB4 of bee forwing; Ci: Bee index number of cubital veins; D7: Angle D7 ofbee forwing; E9: Angle E9 of bee forwing; FB: Width of bee right forewing;Fe: Length of femur of bee hindleg; FL: Length of bee right forewing; Fst: F-statistics, Genetic differences among population.; G18: Angle G18 of beeforwing; GO: Gene ontology; He: Expected heterozygosity;Ho: Heterozygosity; HZ: Shanxi; J10: Angle J10 of bee forwing; J16: Angle J16of bee forwing; K: Bee pigment of scutellum Karea; K19: Angle K19 of beeforwing; KEGG: Kyoto Encyclopedia of Genes and Genomes; L13: Angle L13of bee forwing; L7: Bee length of sternum 7; LA: Anhui; LQ: Linqu;MAF: Minor allele frequency.; ML: Length of bee hind leg metabasitarsus;MT: Width of bee hind leg metabasitarsus; MY: Mingyin; N23: Angle N23 ofbee forwing; Ne: Effective allele number; Nh: Number of bee hindwinghamuli; NT: Bee branches midrib; O26: Angle O26 of bee forwing; P2: Beepigment of tergum 2; P3: Bee pigment of tergum 3; P4: Bee pigment of
Yancan et al. BMC Genomics (2019) 20:869 Page 17 of 20
tergum 4; Pc: Bee pigment of clypeus; PCA: Principal component analysis;Pi: Nucleic acid diversity; PIC: Polymorphism information content; PL: Beepigment of labrum; QC: Sichuan; QD: Qingdao; RZ: Rizhao; S4: Bee lengthofsternum 4; Sc: Bee pigment of scutellum Sc area; SNP: Single nucleotidepolymorphism.; T3: Bee length of tergum 3; T4: Bee length of tergum 4;T5: Bee width of tomentum 1 ontergum 5; T7: Bee width of sternum 7;Ti: Length of tibia of bee hind leg; WC: Hainan; WD: Bee distance of bee waxmirror on sternum 4; WL: Bee length of bee wax mirror on sternum 4;WL: Chongqing; WT: Bee width of bee wax mirror on sternum 4; YY: Yiyuan;ZZ: Zaozhuang
AcknowledgmentsThe author would like to thank all the members of the Animal ProtectionLaboratory, School of Animal Science and Technology, ShandongAgricultural University, who collected the whole sample of our experiment.We are grateful to the livestock department and friends of apiculture in thesampling area for their help in sample collection on site/for providingsamples. We would also thank Qingdao OE Biotechnology Company Limitedfor their help.
Authors’ contributionsWG, LD and LY designed and coordinated the research. LY and FY collectedthe samples. LY and FY conducted library construction and sequencing. WG,LY and CT analyzed the data. WG, LY and CT drafted the paper. All authorsread and approved the final manuscript.
FundingThis work was financially supported by Funds of Shandong Province ModernAgricultural Industry Technology System Bee Industry Innovation TeamBreeding and Resource Protection Post Expert Project (No. SDAIT-24-02),Shandong Province Agricultural Variety Project (No. 2016LZGC039), Shan-dong “Double Tops” Program (No. SYL2017YSTD12). The funders had no rolein study design, data collection and analysis, decision to publish, or prepar-ation of the manuscript.
Availability of data and materialsThe raw genome 2b-RAD tag-sequencing datasets generated during thecurrent study are publicly available under NCBI Bioproject: PRJNA579872. Allother data analysed in the present study are included in this published art-icle (and its Supplementary Information files).
Ethics approval and consent to participateAll animal experiments were performed in accordance with the “Guidelinesfor Experimental Animals” of the Ministry of Science and Technology (Beijing,China), and approved by the Institutional Animal Care and Use EthicsCommittee of Shandong Agricultural University.
Consent for publicationNot applicable.
Competing interestsThe authors declare that they have no competing interests.
Author details1Shandong Provincial Key Laboratory of Animal Biotechnology and DiseaseControl and Prevention, Shandong Agricultural University, 61 Daizong Street,Tai’an 271018, Shandong Province, People’s Republic of China. 2ShandongApiculture Breeding of Improved Varieties and Extension Center, 186 WumaStreet, Tai’an 271000, Shandong Province, People’s Republic of China.
Received: 20 July 2019 Accepted: 30 October 2019
References1. Skelly DK, Joseph LN, Possingham HP, Freidenburg LK, Farrugia TJ, Kinnison
MT, et al. Evolutionary Responses to Climate Change. Conserv Biol. 2007;21:1353–5. https://doi.org/10.1111/j.1523-1739.2007.00764.x.
2. Balanyà J, Huey RB, Gilchrist GW, Serra L. The chromosomal polymorphismof Drosophila subobscura: a microevolutionary weapon to monitor globalchange. Heredity. 2009;103:364. https://doi.org/10.1038/hdy.2009.86.
3. Wallberg A, Han F, Wellhagen G, Dahle B, Kawata M, Haddad N, et al. Aworldwide survey of genome sequence variation provides insight into theevolutionary history of the honeybee Apis mellifera. Nat Genet. 2014;46:1081.https://doi.org/10.1038/ng.3077.
4. Gallai N, Salles J-M, Settele J, Vaissière BE. Economic valuation of thevulnerability of world agriculture confronted with pollinator decline. EcolEcon. 2009;68:810–21. https://doi.org/10.1016/j.ecolecon.2008.06.014.
5. Arias MC, Sheppard WS. Phylogenetic relationships of honey bees(Hymenoptera:Apinae:Apini) inferred from nuclear and mitochondrial DNAsequence data. Mol Phylogenet Evol. 2005;37:25–35. https://doi.org/10.1016/j.ympev.2005.02.017.
6. Smith DR, Villafuerte L, Otis G, Palmer MR. Biogeography of Apis cerana F. andA. nigrocincta Smith: insights from mtDNA studies. Apidologie. 2000;31:265–79.
7. Radloff SE, Hepburn C, Hepburn HR, Fuchs S, Hadisoesilo S, Tan K, et al.Population structure and classification of Apis cerana. Apidologie. 2010;41:589–601. https://doi.org/10.1051/apido/2010008.
8. Hou C, Li B, Luo Y, Deng S, Diao Q. First detection of Apis melliferafilamentous virus in Apis cerana cerana in China. J Invertebr Pathol. 2016;138:112–5. https://doi.org/10.1016/j.jip.2016.06.011.
9. Gong Y. Taxonomy and evolution of honeybees (in Chinese). Fuzhou: FujianScience and Technology Press; 2000.
10. Yang G. Chinese honeybee (in Chinese). Beijing: China Agricultural Scienceand Technology Press; 2001.
11. The National Animal Genetic Resources Committee. Animal geneticresources in China bees. Beijing: China Agriculture Press; 2011.
12. Meixner MD, Pinto MA, Bouga M, Kryger P, Ivanova E, Fuchs S. Standardmethods for characterising subspecies and ecotypes of Apis mellifera. J ApicRes. 2013;52:1–28. https://doi.org/10.3896/IBRA.1.52.4.05.
13. de La Rúa P, Simon UE, Tilde AC, Moritz RFA, Fuchs S. MtDNA variation inApis cerana populations from the Philippines. Heredity. 2000;84:124–30.https://doi.org/10.1046/j.1365-2540.2000.00646.x.
14. Tan K, Meixner MD, Fuchs S, Zhang X, He S, Kandemir I, et al. Geographicdistribution of the eastern honeybee, Apis cerana (Hymenoptera: Apidae),across ecological zones in China: morphological and molecular analyses.Syst Biodivers. 2006;4:473–82. https://doi.org/10.1017/S1477200006002015.
15. Tan K, Warrit N, Smith DR. Mitochondrial DNA diversity of Chinese Apiscerana. Apidologie. 2007;38:238–46. https://doi.org/10.1051/apido:2007008.
16. Tan K, Qu Y, Wang Z, Liu Z, Engel MS. Haplotype diversity and geneticsimilarity among populations of the eastern honey bee from Himalaya-Southwest China and Nepal (Hymenoptera: Apidae). Apidologie. 2016;47:197–205. https://doi.org/10.1007/s13592-015-0390-x.
17. Zhao W, Tan K, Zhou D, Wang M, Cheng C, Yu Z, et al.Phylogeographic analysis of Apis cerana populations on HainanIsland and southern mainland China, based on mitochondrial DNAsequences. Apidologie. 2014;45:21–33. https://doi.org/10.1007/s13592-013-0223-8.
18. Park D, Jung JW, Choi B-S, Jayakodi M, Lee J, Lim J, et al. Uncovering the novelcharacteristics of Asian honey bee, Apis cerana, by whole genome sequencing.BMC Genomics. 2015;16:1. https://doi.org/10.1186/1471-2164-16-1.
19. Chen C, Wang H, Liu Z, Chen X, Tang J, Meng F, et al. Population genomicsprovide insights into the evolution and adaptation of the eastern honeybee (Apis cerana). Mol Biol Evol. 2018;35:2260–71. https://doi.org/10.1093/molbev/msy130.
20. Xu X, Zhu X, Zhou S, Wu X, Zhou B. Genetic differentiation betweenApis cerana cerana populations from Damen Island and adjacentmainland in China. Acta Ecol Sin. 2013;33:122–6. https://doi.org/10.1016/j.chnaes.2013.02.001.
21. Yin L, Ji T. Genetic diversity of the honeybee Apis cerana in Yunnan, China,based on mitochondrial DNA. Genet Mol Res. 2013;12:2002–9.
22. Liu F, Shi T, Huang S, Yu L, Bi S. Genetic structure of mount Huang honeybee (Apis cerana) populations: evidence from microsatellite polymorphism.Hereditas. 2016;153:8. https://doi.org/10.1186/s41065-016-0010-4.
23. Cao L, Gu P, Lin Y. Genetic diversity of Apis cerana cerana based onmitochondrial DNA in Lishui, Zhejiang, China. J Zhejiang Univ Agric Life Sci.2017;43:425–30.
24. Theisen-Jones H, Bienefeld K. The Asian honey bee (Apis cerana) issignificantly in decline. Bee World. 2016;93:90–7. https://doi.org/10.1080/0005772X.2017.1284973.
25. Thomann M, Imbert E, Devaux C, Cheptou P-O. Flowering plants underglobal pollinator decline. Trends Plant Sci. 2013;18:353–9. https://doi.org/10.1016/j.tplants.2013.04.002.
Yancan et al. BMC Genomics (2019) 20:869 Page 18 of 20
26. Rousset F. genepop’007: a complete re-implementation of the genepopsoftware for windows and Linux. Mol Ecol Resour. 2008;8:103–6. https://doi.org/10.1111/j.1471-8286.2007.01931.x.
27. Patterson N, Price AL, Reich D. Population structure and Eigenanalysis. PLoSGenet. 2006;2:e190. https://doi.org/10.1371/journal.pgen.0020190.
28. Bradbury PJ, Zhang Z, Kroon DE, Casstevens TM, Ramdoss Y, Buckler ES.TASSEL: software for association mapping of complex traits in diversesamples. Bioinformatics. 2007;23:2633–5. https://doi.org/10.1093/bioinformatics/btm308.
29. Earl DA. vonHoldt BM. STRUCTURE HARVESTER: a website and program forvisualizing STRUCTURE output and implementing the Evanno method. ConservGenet Resour. 2012;4:359–61. https://doi.org/10.1007/s12686-011-9548-7.
30. Harpur BA, Kent CF, Molodtsova D, Lebon JMD, Alqarni AS, Owayss AA,et al. Population genomics of the honey bee reveals strong signatures ofpositive selection on worker traits. Proc Natl Acad Sci. 2014;111:2614 LP–2619. https://doi.org/10.1073/pnas.1315506111.
31. Cridland JM, Tsutsui ND, Ramírez SR. The complex demographic history andevolutionary origin of the Western honey bee, Apis Mellifera. Genome BiolEvol. 2017;9:457–72. https://doi.org/10.1093/gbe/evx009.
32. Pickrell JK, Pritchard JK. Inference of population splits and mixtures fromgenome-wide allele frequency data. PLoS Genet. 2012;8:e1002967. https://doi.org/10.1371/journal.pgen.1002967.
33. Reich D, Thangaraj K, Patterson N, Price AL, Singh L. Reconstructing Indianpopulation history. Nature. 2009;461:489. https://doi.org/10.1038/nature08365.
34. Diniz-Filho JAF, Soares TN, Lima JS, Dobrovolski R, Landeiro VL, de CamposTelles MP, et al. Mantel test in population genetics. Genet Mol Biol. 2013;36:475–85. https://doi.org/10.1590/S1415-47572013000400002.
35. Mantel N. The Detection of Disease Clustering and a Generalized RegressionApproach. Cancer Res. 1967;27(2 Part 1):209 LP–220 http://cancerres.aacrjournals.org/content/27/2_Part_1/209.abstract.
36. Holsinger KE, Weir BS. Genetics in geographically structured populations:defining, estimating and interpreting F (ST). Nat Rev Genet. 2009;10:639–50.https://doi.org/10.1038/nrg2611.
37. Dray S, Dufour A-B. The ade4 package: implementing the duality diagramfor ecologists. J Stat Softw. 2015;22:4.
38. Oden NL, Sokal RR. Directional autocorrelation: an extension of spatialCorrelograms to two dimensions. Syst Zool. 2006;35:608.
39. Legendre P, Legendre L. Numerical Ecology. 3rd ed. Amsterdam: Elsevier;2012. p. 990.
40. Robert RS, Neal LO. Spatial autocorrelation in biology: 1. Methodology. Biol JLinn Soc. 1978. https://doi.org/10.1111/j.1095-8312.1978.tb00013.x.
41. Mlodzik M. Planar polarity in the Drosophila eye: a multifaceted view ofsignaling specificity and cross-talk. EMBO J. 1999;18:6873–9. https://doi.org/10.1093/emboj/18.24.6873.
42. Adler PN, Lee H. Frizzled signaling and cell–cell interactions in planarpolarity. Curr Opin Cell Biol. 2001;13:635–40. https://doi.org/10.1016/S0955-0674(00)00263-5.
43. Chen C, Liu Z, Pan Q, Chen X, Wang H, Guo H, et al. Genomicanalyses reveal demographic history and temperate adaptation ofthe newly discovered honey bee subspecies Apis melliferasinisxinyuan n. ssp. Mol Biol Evol. 2016;33:1337–48. https://doi.org/10.1093/molbev/msw017.
44. Broadrup RL, Mayack C, Schick SJ, Eppley EJ, White HK, Macherone A. Honeybee (Apis mellifera) exposomes and dysregulated metabolic pathwaysassociated with Nosema ceranae infection. PLoS One. 2019;14:e0213249.https://doi.org/10.1371/journal.pone.0213249.
45. Francoy TM, Wittmann D, Drauschke M, Müller S, Steinhage V, Bezerra-LaureMAF, et al. Identification of Africanized honey bees through wingmorphometrics: two fast and efficient procedures. Apidologie. 2008;39:488–94. https://doi.org/10.1051/apido:2008028.
46. HARPUR BA, MINAEI S, KENT CF, ZAYED A. Management increases geneticdiversity of honey bees via admixture. Mol Ecol. 2012;21:4414–21. https://doi.org/10.1111/j.1365-294X.2012.05614.x.
47. Harpur BA, Minaei S, Kent CF, Zayed A. Admixture increases diversity inmanaged honey bees: reply to De la Rúa et al. (2013). Mol Ecol. 2013;22:3211–5. https://doi.org/10.1111/mec.12332.
48. Jones JC, Myerscough MR, Graham S, Oldroyd BP. Honey Bee NestThermoregulation: Diversity Promotes Stability. Science (80-). 2004;305:402LP–404. https://doi.org/10.1126/science.1096340.
49. Oldroyd BP, Fewell JH. Genetic diversity promotes homeostasis in insect colonies.Trends Ecol Evol. 2007;22:408–13. https://doi.org/10.1016/j.tree.2007.06.001.
50. Oldroyd BP, Rinderer TE, Harbo JR, Buco SM. Effects of Intracolonial geneticdiversity on honey bee (Hymenoptera: Apidae) Colony performance. AnnEntomol Soc Am. 1992;85:335–43. https://doi.org/10.1093/aesa/85.3.335.
51. Mattila HR, Seeley TD. Genetic Diversity in Honey Bee Colonies EnhancesProductivity and Fitness. Science (80- ). 2007;317:362 LP–364. https://doi.org/10.1126/science.1143046.
52. R. TD. Genetic diversity within honeybee colonies prevents severe infectionsand promotes colony growth. Proc R Soc Lond Ser B Biol Sci. 2003;270:99–103. https://doi.org/10.1098/rspb.2002.2199.
53. Gloag R, Ding G, Christie JR, Buchmann G, Beekman M, Oldroyd BP. Aninvasive social insect overcomes genetic load at the sex locus. Nat EcolAmp Evol 2016;1:11. doi: https://doi.org/10.1038/s41559-016-0011.
54. Winston ML. The biology and Management of Africanized Honey Bees.Annu Rev Entomol. 1992;37:173–93. https://doi.org/10.1146/annurev.en.37.010192.001133.
55. Scott Schneider S, DeGrandi-Hoffman G, Smith DR. THE AFRICAN HONEYBEE: Factors contributing to a successful biological invasion. Annu RevEntomol 2003;49:351–376. doi: https://doi.org/10.1146/annurev.ento.49.061802.123359.
56. Yin L, Ji T, Liu M, Bao W, Chen G. Genetic diversity and relationship betweengenetic distance and geographical distance of 6 Apis cerana ceranapopulations in China. Res J Anim Sci. 2008;2:183–7.
57. Ji T, Yin L, Liu M, Chen G. Genetic diversity and genetic differentiation of sixgeographic populations of Apis cerana cerana (Hymenoptera: Apidae) in EastChina. Acta Entomol Sin. 2009;52:413–9.
58. Williams SE, Shoo LP, Isaac JL, Hoffmann AA, Langham G. Towards anintegrated framework for assessing the vulnerability of species to climatechange. PLoS Biol. 2008;6:e325. https://doi.org/10.1371/journal.pbio.0060325.
59. Achere V, Favre JM, Besnard G, Jeandroz S. Genomic organization ofmolecular differentiation in Norway spruce (Picea abies). Mol Ecol. 2005;14:3191–201. https://doi.org/10.1111/j.1365-294X.2005.02646.x.
60. Eimanifar A, Brooks SA, Bustamante T, Ellis JD. Population genomics andmorphometric assignment of western honey bees (Apis mellifera L.) in theRepublic of South Africa. BMC Genomics. 2018;19:615. https://doi.org/10.1186/s12864-018-4998-x.
61. Ben-Shahar Y, Leung H-T, Pak WL, Sokolowski MB, Robinson GE. cGMP-dependent changes in phototaxis: a possible role for the foraging gene inhoney bee division of labor. J Exp Biol. 2003;206(Pt 14):2507–15 http://www.ncbi.nlm.nih.gov/pubmed/12796464.
62. Seeley TD. Honeybee ecology: a study of adaptation in social life. Princeton:Princeton University Press; 1985.
63. Schmickl T, Crailsheim K. Inner nest homeostasis in a changing environmentwith special emphasis on honey bee brood nursing and pollen supply.Apidologie. 2004;35:249–63.
64. Woodard SH, Fischman BJ, Venkat A, Hudson ME, Varala K, Cameron SA, et al.Genes involved in convergent evolution of eusociality in bees. Proc Natl AcadSci. 2011;108:7472 LP–7477. https://doi.org/10.1073/pnas.1103457108.
65. Burger R, Lynch M. Evolution and Extinction in a Changing Environment: AQuantitative-Genetic Analysis. Evolution (N Y). 2006;49:151.
66. Goulson D, Nicholls E, Botías C, Rotheray EL. Bee declines driven bycombined stress from parasites, pesticides, and lack of flowers. Science (80-). 2015;347:1255957. https://doi.org/10.1126/science.1255957.
67. Klein S, Cabirol A, Devaud JM, Barron AB, Lihoreau M. Why bees are sovulnerable to environmental stressors. Trends Ecol Evol. 2017;32:268–78.
68. Liu X. Honey bee morphological identification index. Apiculture China. 1978;4(9):15–7.
69. Tan K, Zhang X, He SY, Zhou DY. Morphology and biogeography researchof Chinese Apis cerana. J Yunnan Agric Univ. 2005;20(3):410–4.
70. Wang GZ, Shi W, Zhang XL, Lv LP, Ding GL. Criterion about tergumpigmentation of Apis cerana. Apiculture China. 2006;57(5):7–8.
71. Li R, Yu C, Li Y, Lam TW, Yiu SM, Kristiansen K, et al. SOAP2: an improvedultrafast tool for short read alignment. Bioinformatics. 2009;25:1966–7.
72. Fu X, Dou J, Mao J, Su H, Jiao W, Zhang L, et al. RADtyping: an integratedpackage for accurate de novo codominant and dominant RAD genotypingin mapping populations. PLoS One. 2013;8(11):e79960.
73. Purcell S, Neale B, Todd-Brown K, Thomas L, Ferreira MAR, Bender D, et al.PLINK: a tool set for whole-genome association and population-based linkageanalyses. Am J Hum Genet. 2007;81:559–75. https://doi.org/10.1086/519795.
74. Pritchard JK, Stephens M, Donnelly P. Inference of population structureusing multilocus genotype data. Genetics. 2000;155:945–59 https://www.ncbi.nlm.nih.gov/pubmed/10835412.
Yancan et al. BMC Genomics (2019) 20:869 Page 19 of 20
75. Falush D, Stephens M, Pritchard JK. Inference of population structure usingmultilocus genotype data: dominant markers and null alleles. Mol EcolNotes. 2007;7:574–8. https://doi.org/10.1111/j.1471-8286.2007.01758.x.
76. Evanno G, Regnaut S, Goudet J. Detecting the number of clusters ofindividuals using the software structure: a simulation study. Mol Ecol. 2005;14:2611–20. https://doi.org/10.1111/j.1365-294X.2005.02553.x.
77. Rosenberg MS, Anderson CD. PASSaGE: pattern analysis, spatial statistics andgeographic exegesis. Version 2. Methods Ecol Evol. 2011;2:229–32.
78. Beaumont MA, Nichols RA. Evaluating loci for use in the genetic analysis ofpopulation structure. Proc R Soc Lond Ser B Biol Sci. 1996;263:1619–26.https://doi.org/10.1098/rspb.1996.0237.
79. Excoffier L, Lischer HE. Arlequin suite ver 3.5: a new series of programs toperform population genetics analyses under Linux and windows. Mol EcolResour. 2010;10:564–7. https://doi.org/10.1111/j.1755-0998.2010.02847.x.
80. Danecek P, Auton A, Abecasis G, Albers CA, Banks E, DePristo MA, et al. Thevariant call format and VCFtools. Bioinformatics. 2011;27:2156–8. https://doi.org/10.1093/bioinformatics/btr330.
81. Warde-Farley D, Donaldson SL, Comes O, Zuberi K, Badrawi R, Chao P, et al.The GeneMANIA prediction server: biological network integration for geneprioritization and predicting gene function. Nucleic Acids Res. 2010;38(suppl_2):W214–20. https://doi.org/10.1093/nar/gkq537.
82. Reimand J, Arak T, Adler P, Kolberg L, Reisberg S, Peterson H, et al. G:profiler—a web server for functional interpretation of gene lists (2016update). Nucleic Acids Res. 2016;44:W83–9. https://doi.org/10.1093/nar/gkw199.
83. Huang DW, Sherman BT, Lempicki RA. Systematic and integrative analysis oflarge gene lists using DAVID bioinformatics resources. Nat Protoc. 2008;4:44.https://doi.org/10.1038/nprot.2008.211.
Publisher’s NoteSpringer Nature remains neutral with regard to jurisdictional claims inpublished maps and institutional affiliations.
Yancan et al. BMC Genomics (2019) 20:869 Page 20 of 20