genomics toolbox for farmed fish
TRANSCRIPT
PLEASE SCROLL DOWN FOR ARTICLE
This article was downloaded by: [Canario, Adelino]On: 15 September 2008Access details: Access Details: [subscription number 902474497]Publisher Taylor & FrancisInforma Ltd Registered in England and Wales Registered Number: 1072954 Registered office: Mortimer House,37-41 Mortimer Street, London W1T 3JH, UK
Reviews in Fisheries SciencePublication details, including instructions for authors and subscription information:http://www.informaworld.com/smpp/title~content=t713610918
Genomics Toolbox for Farmed FishAdelino V. M. Canario a; Luca Bargelloni b; Filip Volckaert c; R. D. Houston d; C. Massault d; Yann Guiguen e
a CCMAR-CIMAR, Associated Laboratory, University of Algarve, Faro, Portugal b Department of PublicHealth, Comparative Pathology and Veterinary Hygiene, University of Padova, Viale dell'Universitá, Legnaro,Italy c Laboratory of Aquatic Ecology, Katholieke Universiteit Leuven, Leuven, Belgium d Roslin Institute,Roslin, Midlothian, United Kingdom e INRA-SCRIBE, Département PHASE, Rennes Cedex, France
First Published on: 01 January 2008
To cite this Article Canario, Adelino V. M., Bargelloni, Luca, Volckaert, Filip, Houston, R. D., Massault, C. and Guiguen,Yann(2008)'Genomics Toolbox for Farmed Fish',Reviews in Fisheries Science,16:1,1 — 13
To link to this Article: DOI: 10.1080/10641260802319479
URL: http://dx.doi.org/10.1080/10641260802319479
Full terms and conditions of use: http://www.informaworld.com/terms-and-conditions-of-access.pdf
This article may be used for research, teaching and private study purposes. Any substantial orsystematic reproduction, re-distribution, re-selling, loan or sub-licensing, systematic supply ordistribution in any form to anyone is expressly forbidden.
The publisher does not give any warranty express or implied or make any representation that the contentswill be complete or accurate or up to date. The accuracy of any instructions, formulae and drug dosesshould be independently verified with primary sources. The publisher shall not be liable for any loss,actions, claims, proceedings, demand or costs or damages whatsoever or howsoever caused arising directlyor indirectly in connection with or arising out of the use of this material.
Reviews in Fisheries Science, 16(S1):1–13, 2008Copyright C©© Taylor and Francis Group, LLCISSN: 1064-1262 printDOI: 10.1080/10641260802319479
Genomics Toolbox for Farmed Fish
ADELINO V. M. CANARIO,1 LUCA BARGELLONI,2 FILIP VOLCKAERT,3
R. D. HOUSTON,4 C. MASSAULT,4 and YANN GUIGUEN5
1CCMAR-CIMAR, Associated Laboratory, University of Algarve, Faro, Portugal2Department of Public Health, Comparative Pathology and Veterinary Hygiene, University of Padova, Viale dell’Universita,Legnaro, Italy3Katholieke Universiteit Leuven, Laboratory of Aquatic Ecology, Leuven, Belgium4Roslin Institute, Roslin, Midlothian, United Kingdom5INRA-SCRIBE, Departement PHASE, Campus de Beaulieu, Rennes Cedex, France
The last decade has seen dramatic technological developments which have resulted in massive production of genome andtranscriptome sequence information from a variety of organisms, at all levels of complexity, including several fish species.While hitherto most applications of genomic data have been in biomedicine, biotechnology, and agriculture, there is a growinginterest in applying genomic approaches to animal production. This review will describe the basic tools and resources thatare currently available and how they are being used for advancing aquaculture. Finally, it will discuss current trends thatare likely to have some impact for the benefit of aquaculture.
Keywords expressed sequence tags, microarray, quantitative trai loci, genetic markers, genetic maps
INTRODUCTION
Fish cultivation has consistently grown over the last decades,and currently 40% of the fish consumed by humans comesfrom farming (FAO, 2006). With over 60% of the marine fishstocks either fully exploited or overexploited, aquaculture, inparticular fish culture, has positioned itself as an importantalternative source for human consumption. The positive growthtrend of the industry is expected to continue as needs for proteinand demand for healthy products in different areas of the worldcontinue to rise. The industry has followed this demand with in-tensification of operations, diversification to new more palatableand faster-growing species, and the use of highly productive andoften sensitive ecosystems. This growth entails an increased re-quirement for marine oils and protein for feeds and subsequentoverfishing, increased pollution, invasive species, pathogen andgenetic contamination, and environmental degradation (Naylorand Burke, 2005; Naylor et al., 2000; Naylor et al., 2001;McGinnity et al., 2003). Thus, development of methodologiesand strains that can improve productivity, digestibility of alter-native feed sources from plant material, biological containment
Address correspondence to Adelino V. M. Canario, CCMAR-CIMAR, As-sociated Laboratory, University of Algarve, 8005-139 Faro, Portugal. E-mail:[email protected]
through sterility, improved welfare and fitness, stress toleranceand resistance to disease will help to minimize or eliminatesome of these problems and so contribute to the industry’shealth.
Genomics, the study of genomes and their interacting el-ementary structures, and “omics” technologies in general areproducing major contributions to medicine, agriculture, andthe pharmaceutical industry, and are starting to make signif-icant inroads to farm animal production (Fadiel et al., 2005;Sellner et al., 2007; de Koning et al., 2007). This is made pos-sible through large-scale development of genomic tools, includ-ing genetic maps and whole genome sequencing of several farmspecies (de Koning et al., 2007; Sellner et al., 2007). And, al-though genomic resources available for farmed fish are rela-tively small compared to terrestrial farm animals, farmed-fishgenomics will benefit from the large investments in genomicmodels such as the medaka and zebrafish, for which a wealthof resources is available (Dahm and Geisler, 2006). Further-more, with the fast development of new sequencing technologies(which has significantly reduced the cost of genomics projects),the genomes of several fish species are being targeted or cur-rently being sequenced. Consequently, it is expected that someof the solutions for the bottlenecks and problems of aquaculturedescribed above will come from the power of “omics” tech-nologies starting with genomics. Much is promised by genetic
1
Downloaded By: [Canario, Adelino] At: 21:13 15 September 2008
2 A. V. M. CANARIO ET AL.
improvement and improvement of animal management throughmarker-based selection (Sonesson, 2007).
The purpose of this review is to present an update of the maingenomic tools available, which can be more directly valuableand, in the short-term, applicable to farmed fish. It will start bypresenting recent status of availability of expressed sequencetags (EST). These provide a basic resource for microarray de-sign, functional studies, and genetic marker development—thenext subjects to be examined. The status of genetic maps, thereference material for genetic approaches in aquaculture, comenext and feed on the current status of quantitative treat loci(QTL) mapping in fishes. Altogether, these resources suggestthe means for the desirable and fruitful applications of marker-assisted selection to fish culture. These methodologies providethe basis to tailor the development of particular disease-resistantstrains of fish, or strains more suited to specific environmentalconditions or with more adapted digestive systems, which mayhelp to minimize some of the current negative impacts of fishculture.
EXPRESSED SEQUENCE TAGS (ESTS)
The availability of ESTs from fishes has grown significantlysince the late 1990s (Bettini et al., 1994; Hirono and Aoki,1997; Inoue et al., 1997; Karsi et al., 1998; Gong, 1999);less than 100,000 ESTs were published before 2000. Nownearly 3.5 million ESTs are available in roughly 50 differ-ent species. However, more than 40% of this resource comesfrom the model species zebrafish (Danio rerio), with 1.3 millionESTs (Table 1) produced from more than 100 different cDNAlibraries covering more than 15 different tissues. This quiteunique resource makes zebrafish the fifth species with the high-est number of entries in the dbEST database (release 032108,April 2008) after the human (8.1 M), mouse (4.8 M), cattle(1.5 M), and pig (1.5 M). Apart from this important resource,ESTs have also been produced in large numbers in two othermodel fish species, i.e., the medaka, Oryzias latipes (340,000ESTs) and the stickleback, Gasterosteus aculeatus (277,000ESTs) (see Table 1). But with 430,000 ESTs available, the At-lantic salmon (Salmo salar) is the second fish with regards toEST number and the 18th among all organisms in dbEST (re-lease 032108, April 2008). Along with the rainbow trout, On-corhynchus mykiss (260,000 ESTs), rainbow smelt, Osmerusmordax (35,000 ESTs) and chinook salmon, Oncorhynchustshawytscha (14,000 ESTs), salmonid ESTs represent more than75% of the resource available for commercially important fish(Table 1). Other aquaculture species with important publishedEST resources (around 5%) are the cod, Gadus morhua (126,000ESTs), the channel catfish, Ictalurus punctatus (44,000 ESTs),and recently the European sea bass, Dicentrarchus labrax, andthe gilthead seabream, Sparus aurata (30,000 EST each). Otherfish species, including the bluefin tuna, Thunnus thynnus, cur-rently total 10,000 published ESTs. However, these figuresare changing quickly, and available resources not yet formally
Table 1 Number of expressed sequence tags (ESTs) in dbEST database forteleost fish of aquaculture or fisheries interest. The number (N) of fish publicEST entries has been extracted from the dbEST summary by organism, release032108, April 2008. Species with less than 99 entries have not been included.The relative percentage according to the total number of ESTs in all fish speciesis given in the “% T” column, and the relative percentage according to the totalnumber of ESTs in fish of commercial (aquaculture + fisheries) interest isgiven in the “% (A+F)” column
Species N % T % (A+F)
Danio rerio (zebrafish)∗ 1,379,829 39.6 —Salmo salar (Atlantic salmon) 433,145 12.4 39.5Oryzias latipes (Japanese medaka)∗ 343,846 9.9 —Gasterosteus aculeatus (three-spined stickleback)∗ 276,992 7.9 —Oncorhynchus mykiss (rainbow trout) 260,887 7.5 23.8Pimephales promelas (fathead minnow) 249,941 7.2 —Gadus morhua (Atlantic cod) 126,325 3.6 11.5Fundulus heteroclitus (killifish) 74,755 2.1 —Ictalurus punctatus (channel catfish) 44,767 1.3 4.1Osmerus mordax (rainbow smelt) 36,028 1.0 3.3Cyprinus carpio (common carp) 32,043 0.9 2.9Takifugu rubripes (Japanese pufferfish)∗ 26,069 0.7 —Eptatretus burgeri (hagfish) 23,884 0.7 2.2Rutilus rutilus (roach) 18,470 0.5 1.7Hippoglossus hippoglossus (Atlantic halibut) 18,495 0.5 1.7Poecilia reticulata (guppy) 16,206 0.5 —Oncorhynchus tshawytscha (chinook salmon) 13,965 0.4 1.3Oncorhynchus nerka (sockeye salmon) 11,389 0.3 1.0Ictalurus furcatus (catfish) 10,764 0.3 1.0Astatotilapia burtoni (Burton’s haplo) 10,312 0.3 —Coregonus clupeaformis (lake whitefish) 10,312 0.3 0.9Thunnus thynnus (Atlantic bluefin tuna) 10,163 0.3 0.9Paralichthys olivaceus (Japanese flounder) 8,822 0.3 0.8Lithognathus mormyrus (striped seabream) 8,109 0.2 0.7Gobiocypris rarus (rare minnow) 8,102 0.2 —Platichthys flesus (flounder) 7,977 0.2 0.7Gillichthys mirabilis (long-jawed mudsucker) 4,775 0.1 0.4Acipenser sinensis (Chinese sturgeon) 3,384 0.1 0.3Acipenser transmontanus (white sturgeon) 2,704 0.1 0.2Dicentrarchus labrax (European sea bass) 2,356 0.1 0.2Sparus aurata (gilthead seabream) 2,282 0.1 0.2Perca fluviatilis (European perch) 2,226 0.1 0.2Seriola quinqueradiata (five-ray yellowtail) 1,381 <0.1 0.1Epinephelus coioides (orange-spotted grouper) 1,115 <0.1 0.1Xiphophorus maculatus (Southern platyfish) 847 <0.1 —Ctenopharyngodon idella (grass carp) 640 <0.1 0.1Paralichthys lethostigma (Southern flounder) 596 <0.1 0.1Carassius auratus (goldfish) 551 <0.1 —Oreochromis niloticus (Nile tilapia) 294 <0.1 <0.1Anguilla japonica (Japanese eel) 196 <0.1 <0.1Hippocampus comes (tiger tail seahorse) 139 <0.1 —Tetraodon fluviatilis (round-spotted pufferfish)* 99 <0.1 —TOTAL 3,485,182
Note: Model fish species are underlined and fish species with fully sequencedgenome are marked with an asterisk (∗).
published in databases include the Nile tilapia, Oreochromisniloticus (>20,000 ESTS; see http://hcgs.unh.edu/cichlid/)and Senegalese sole, Solea senegalensis (>10,000 ESTs; seehttp://pleurogene.ca/contents/user/db info.php).
This global increase in fish ESTs may well reach over8 million ESTs by 2010. This is probably an underestima-tion as new sequencing technologies, i.e., pyrosequencing
reviews in fisheries science vol. 16 S1 2008
Downloaded By: [Canario, Adelino] At: 21:13 15 September 2008
GENOMICS TOOLBOX FOR FARMED FISH 3
(Margulies et al., 2005), which enable much higher throughputand lower cost than conventional Sanger sequencing, come intoplay. Pyrosequencing has been applied, for example, to produce541,852 Arabidopsis (Arabidopsis thaliana) ESTs (60 Mb ofDNA sequence) in less than one week (from tissue harvestingto DNA sequencing) at a substantially lower cost than conven-tional methods (Weber et al., 2007). This strategy is startingto be transferred to the fish field, thus enabling the massiveproduction of ESTs in new important aquaculture fish species.
MICROARRAYS
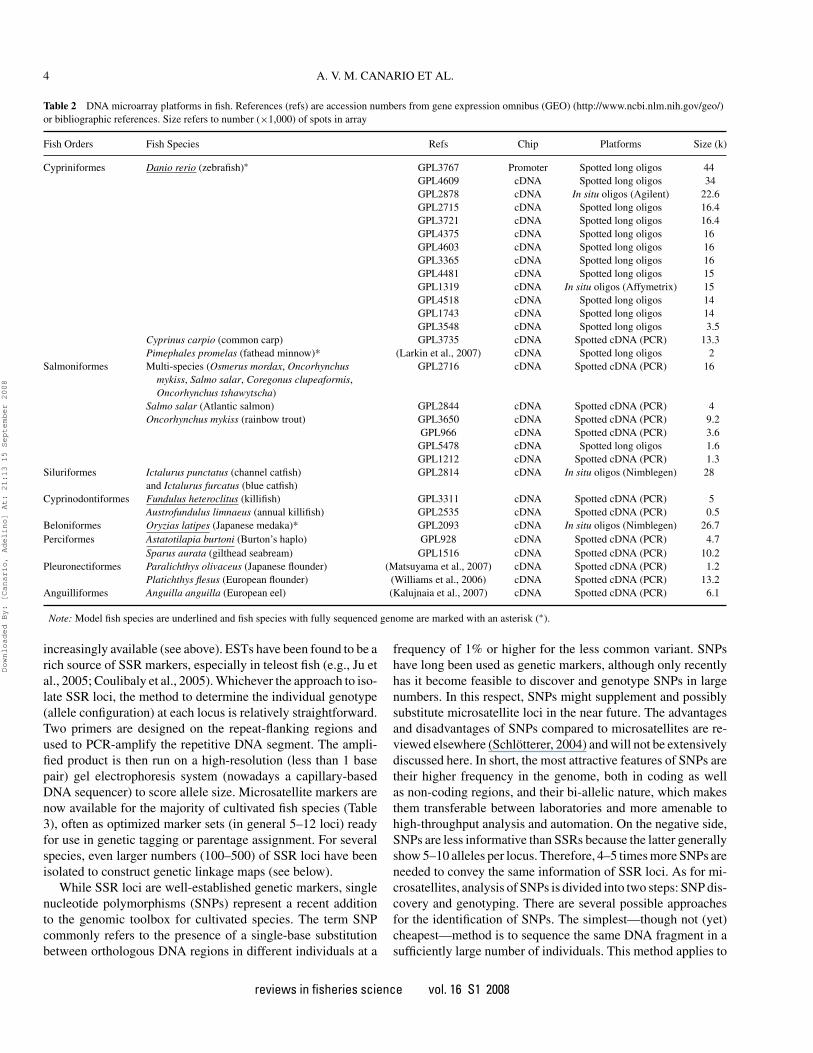
The availability of these numerous ESTs and the correspond-ing cDNA libraries have enabled the production of DNA mi-croarray in many fish species (Table 2). Again, the most impor-tant resources have been produced in zebrafish, with more than20 different DNA microarray platforms published in the GeneExpression Omnibus (GEO) public repository archive website(Table 2). The zebrafish is also the only fish species with agenome wide ChIP-chip DNA microarray that allows the charac-terization of DNA-protein interactions in the proximal promoterregions of over 11,000 genes (Wardle et al., 2006). Two in situsynthesized oligonucleotide array platforms (Affymetrix andAgilent) and many long oligonucleotide large collections (upto 34,000 oligonucleotides) are also commercially available forzebrafish. An in situ synthesized oligonucleotide array platform(Nimblegen) is also commercially available for the medaka. Inother species, including many aquaculture species, the DNA mi-croarray resource is mainly represented by spotted cDNA plat-forms with some array density up to 16 k, i.e., the GRASP multisalmonid chip (von Schalburg et al., 2005), but also some longoligonucleotides platforms and an in situ oligonucleotide chip inthe channel catfish (28 k, Nimblegen). These DNA microarrayresources are growing rapidly, and many new projects in aqua-culture species are planned, such as the cod (http://www.intl-pag.org/15/abstracts/PAG15 Late 642.html) and the Senegalesesole (http://www.pleurogene.ca/). Some of these new projectsare even currently being launched (e.g., in the rainbow trout)with the recent availability of a 37 k commercial plat-form (http://arsserv0.tamu.edu/research/publications/publica-tions.htm?seq no 115 = 214318). A new oligonucleotide mi-croarray (20 k, Agilent) has recently been made available forSparus aurata (Ferraresso et al., 2008), and one for Dicentrar-chus labrax is under development. However, the high numberof potentially interesting aquaculture fish species will proba-bly prevent the development of specific DNA microarrays forall target species. As an alternative heterologous hybridizationhas been shown to be effective (Ji et al., 2004; Nieto-Diazet al., 2007), including in some examples on fishes (Renn etal., 2004; Kassahn et al., 2007; Cohen et al., 2007). Further-more, the phylogenetic proximity of many aquaculture speciesmakes the use of “group” microarrays a practical and economi-cal choice. This cross-species approach has initially been carriedout on spotted cDNA platforms (Renn et al., 2004) with reliable
results within the order taxon. With the recent development oflong oligonucleotide-based microarray platforms, this heterol-ogous approach is now revisited, as these long oligonucleotidesmay be more suitable for cross-species gene expression stud-ies than a short oligonucleotide-based system (Walker et al.,2006). The “oligos” heterologous approach has even been suc-cessfully used to characterize gene expression profiling in a per-ciform species (family: Pomacentridae) using a zebrafish (order:Cypriniformes, family: Cyprinidae) long oligonucleotide array(Kassahn et al., 2007).
GENETIC MARKERS
Genetic markers have the potential to distinguish betweenindividuals of the same species by revealing genetic polymor-phisms, i.e., different alleles at the same genetic locus. The morepolymorphic a marker is, the more useful and informative it is.Therefore, a long-standing goal in genetics has been to discoverand score highly variable genetic markers. In the last 30 years,different types of markers have been used, e.g., allozymes, min-isatellites, RAPDs, AFLPs, SSRs, SNPs (Schlotterer, 2004). Atpresent, the most popular types of marker are microsatellite orsimple sequence repeat (SSR) loci. SSR loci consist of a variablenumber of short repeats (2–6 nucleotides). SSRs are uniformlydistributed in animal genomes at a relatively high frequency(1 every 1.5–6 kilo bases) (Zane et al., 2002; Chistiakov et al.,2006). The repetitive nature of the SSR core sequence causes thefrequent gain or loss of one or more repeat units, creating allelesof different length (Ellegren, 2004). In aquaculture, microsatel-lite markers are efficiently used for individual identification, pa-ternity analysis, and relatedness estimation in the managementof hatchery broodstocks. For instance, parentage assignment bymeans of genetic markers is the only way to define family struc-ture and in-breeding levels in species that reproduce by massspawning. Because of their high polymorphism, less than 10SSR loci are usually needed to assign an individual to its puta-tive parents. Another potential application is the construction ofgenetic linkage maps, which are preparatory for genome-widescans for QTL, through linkage or association mapping (see be-low). Whichever their use, SSR markers need to be developedspecifically for each fish species of interest, although some locican be used across closely related species, e.g., gilthead seabream markers in other sparid species (Franch et al., 2006) andmarkers shared between East African cichlids (Markert et al.,2001). Traditionally, microsatellite loci have been isolated fromgenomic DNA libraries. Of these, ad-hoc libraries that are highlyenriched in repeat-containing DNA fragments have proven tobe an efficient tool to develop microsatellite markers (Zaneet al., 2002). More recently, SSR discovery has become possiblethrough in silico data mining due to the increasing number ofDNA sequences that are available even for non-model species.While genomic sequences (BAC-ends or whole-genome shot-guns) remain relatively scarce in aquaculture species, ESTs are
reviews in fisheries science vol. 16 S1 2008
Downloaded By: [Canario, Adelino] At: 21:13 15 September 2008
4 A. V. M. CANARIO ET AL.
Table 2 DNA microarray platforms in fish. References (refs) are accession numbers from gene expression omnibus (GEO) (http://www.ncbi.nlm.nih.gov/geo/)or bibliographic references. Size refers to number (×1,000) of spots in array
Fish Orders Fish Species Refs Chip Platforms Size (k)
Cypriniformes Danio rerio (zebrafish)∗ GPL3767 Promoter Spotted long oligos 44GPL4609 cDNA Spotted long oligos 34GPL2878 cDNA In situ oligos (Agilent) 22.6GPL2715 cDNA Spotted long oligos 16.4GPL3721 cDNA Spotted long oligos 16.4GPL4375 cDNA Spotted long oligos 16GPL4603 cDNA Spotted long oligos 16GPL3365 cDNA Spotted long oligos 16GPL4481 cDNA Spotted long oligos 15GPL1319 cDNA In situ oligos (Affymetrix) 15GPL4518 cDNA Spotted long oligos 14GPL1743 cDNA Spotted long oligos 14GPL3548 cDNA Spotted long oligos 3.5
Cyprinus carpio (common carp) GPL3735 cDNA Spotted cDNA (PCR) 13.3Pimephales promelas (fathead minnow)* (Larkin et al., 2007) cDNA Spotted long oligos 2
Salmoniformes Multi-species (Osmerus mordax, Oncorhynchusmykiss, Salmo salar, Coregonus clupeaformis,Oncorhynchus tshawytscha)
GPL2716 cDNA Spotted cDNA (PCR) 16
Salmo salar (Atlantic salmon) GPL2844 cDNA Spotted cDNA (PCR) 4Oncorhynchus mykiss (rainbow trout) GPL3650 cDNA Spotted cDNA (PCR) 9.2
GPL966 cDNA Spotted cDNA (PCR) 3.6GPL5478 cDNA Spotted long oligos 1.6GPL1212 cDNA Spotted cDNA (PCR) 1.3
Siluriformes Ictalurus punctatus (channel catfish) GPL2814 cDNA In situ oligos (Nimblegen) 28and Ictalurus furcatus (blue catfish)
Cyprinodontiformes Fundulus heteroclitus (killifish) GPL3311 cDNA Spotted cDNA (PCR) 5Austrofundulus limnaeus (annual killifish) GPL2535 cDNA Spotted cDNA (PCR) 0.5
Beloniformes Oryzias latipes (Japanese medaka)* GPL2093 cDNA In situ oligos (Nimblegen) 26.7Perciformes Astatotilapia burtoni (Burton’s haplo) GPL928 cDNA Spotted cDNA (PCR) 4.7
Sparus aurata (gilthead seabream) GPL1516 cDNA Spotted cDNA (PCR) 10.2Pleuronectiformes Paralichthys olivaceus (Japanese flounder) (Matsuyama et al., 2007) cDNA Spotted cDNA (PCR) 1.2
Platichthys flesus (European flounder) (Williams et al., 2006) cDNA Spotted cDNA (PCR) 13.2Anguilliformes Anguilla anguilla (European eel) (Kalujnaia et al., 2007) cDNA Spotted cDNA (PCR) 6.1
Note: Model fish species are underlined and fish species with fully sequenced genome are marked with an asterisk (∗).
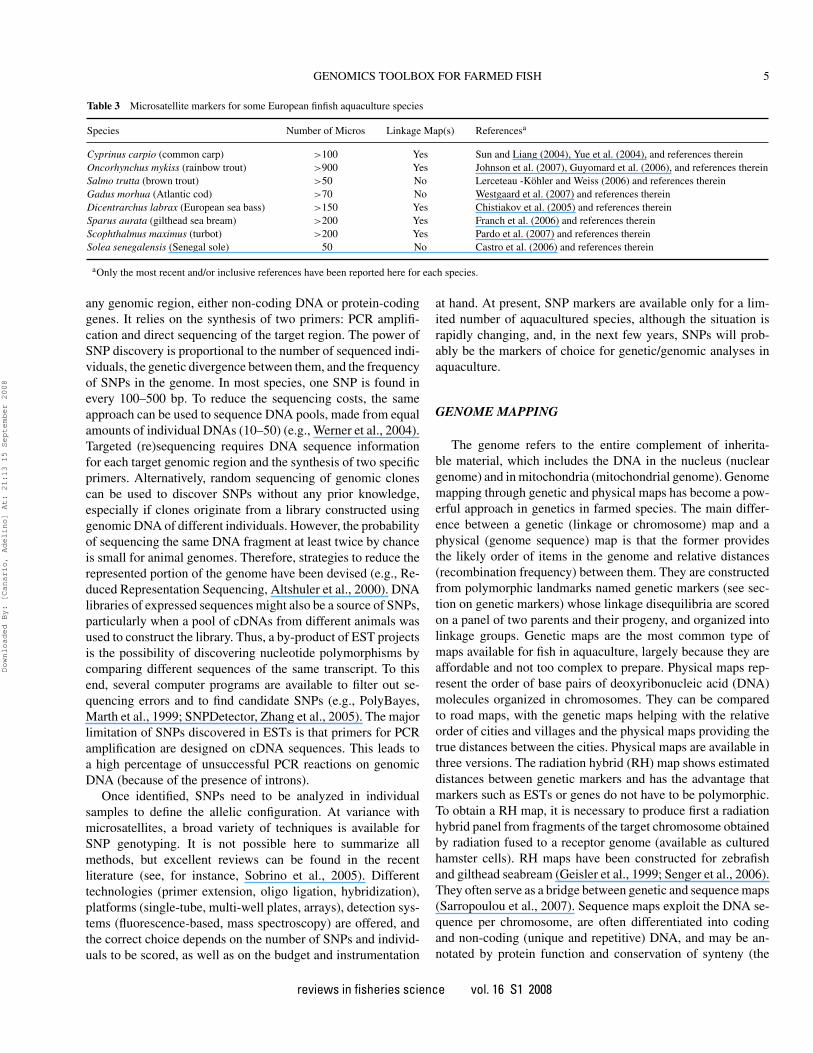
increasingly available (see above). ESTs have been found to be arich source of SSR markers, especially in teleost fish (e.g., Ju etal., 2005; Coulibaly et al., 2005). Whichever the approach to iso-late SSR loci, the method to determine the individual genotype(allele configuration) at each locus is relatively straightforward.Two primers are designed on the repeat-flanking regions andused to PCR-amplify the repetitive DNA segment. The ampli-fied product is then run on a high-resolution (less than 1 basepair) gel electrophoresis system (nowadays a capillary-basedDNA sequencer) to score allele size. Microsatellite markers arenow available for the majority of cultivated fish species (Table3), often as optimized marker sets (in general 5–12 loci) readyfor use in genetic tagging or parentage assignment. For severalspecies, even larger numbers (100–500) of SSR loci have beenisolated to construct genetic linkage maps (see below).
While SSR loci are well-established genetic markers, singlenucleotide polymorphisms (SNPs) represent a recent additionto the genomic toolbox for cultivated species. The term SNPcommonly refers to the presence of a single-base substitutionbetween orthologous DNA regions in different individuals at a
frequency of 1% or higher for the less common variant. SNPshave long been used as genetic markers, although only recentlyhas it become feasible to discover and genotype SNPs in largenumbers. In this respect, SNPs might supplement and possiblysubstitute microsatellite loci in the near future. The advantagesand disadvantages of SNPs compared to microsatellites are re-viewed elsewhere (Schlotterer, 2004) and will not be extensivelydiscussed here. In short, the most attractive features of SNPs aretheir higher frequency in the genome, both in coding as wellas non-coding regions, and their bi-allelic nature, which makesthem transferable between laboratories and more amenable tohigh-throughput analysis and automation. On the negative side,SNPs are less informative than SSRs because the latter generallyshow 5–10 alleles per locus. Therefore, 4–5 times more SNPs areneeded to convey the same information of SSR loci. As for mi-crosatellites, analysis of SNPs is divided into two steps: SNP dis-covery and genotyping. There are several possible approachesfor the identification of SNPs. The simplest—though not (yet)cheapest—method is to sequence the same DNA fragment in asufficiently large number of individuals. This method applies to
reviews in fisheries science vol. 16 S1 2008
Downloaded By: [Canario, Adelino] At: 21:13 15 September 2008
GENOMICS TOOLBOX FOR FARMED FISH 5
Table 3 Microsatellite markers for some European finfish aquaculture species
Species Number of Micros Linkage Map(s) Referencesa
Cyprinus carpio (common carp) >100 Yes Sun and Liang (2004), Yue et al. (2004), and references thereinOncorhynchus mykiss (rainbow trout) >900 Yes Johnson et al. (2007), Guyomard et al. (2006), and references thereinSalmo trutta (brown trout) >50 No Lerceteau -Kohler and Weiss (2006) and references thereinGadus morhua (Atlantic cod) >70 No Westgaard et al. (2007) and references thereinDicentrarchus labrax (European sea bass) >150 Yes Chistiakov et al. (2005) and references thereinSparus aurata (gilthead sea bream) >200 Yes Franch et al. (2006) and references thereinScophthalmus maximus (turbot) >200 Yes Pardo et al. (2007) and references thereinSolea senegalensis (Senegal sole) 50 No Castro et al. (2006) and references therein
aOnly the most recent and/or inclusive references have been reported here for each species.
any genomic region, either non-coding DNA or protein-codinggenes. It relies on the synthesis of two primers: PCR amplifi-cation and direct sequencing of the target region. The power ofSNP discovery is proportional to the number of sequenced indi-viduals, the genetic divergence between them, and the frequencyof SNPs in the genome. In most species, one SNP is found inevery 100–500 bp. To reduce the sequencing costs, the sameapproach can be used to sequence DNA pools, made from equalamounts of individual DNAs (10–50) (e.g., Werner et al., 2004).Targeted (re)sequencing requires DNA sequence informationfor each target genomic region and the synthesis of two specificprimers. Alternatively, random sequencing of genomic clonescan be used to discover SNPs without any prior knowledge,especially if clones originate from a library constructed usinggenomic DNA of different individuals. However, the probabilityof sequencing the same DNA fragment at least twice by chanceis small for animal genomes. Therefore, strategies to reduce therepresented portion of the genome have been devised (e.g., Re-duced Representation Sequencing, Altshuler et al., 2000). DNAlibraries of expressed sequences might also be a source of SNPs,particularly when a pool of cDNAs from different animals wasused to construct the library. Thus, a by-product of EST projectsis the possibility of discovering nucleotide polymorphisms bycomparing different sequences of the same transcript. To thisend, several computer programs are available to filter out se-quencing errors and to find candidate SNPs (e.g., PolyBayes,Marth et al., 1999; SNPDetector, Zhang et al., 2005). The majorlimitation of SNPs discovered in ESTs is that primers for PCRamplification are designed on cDNA sequences. This leads toa high percentage of unsuccessful PCR reactions on genomicDNA (because of the presence of introns).
Once identified, SNPs need to be analyzed in individualsamples to define the allelic configuration. At variance withmicrosatellites, a broad variety of techniques is available forSNP genotyping. It is not possible here to summarize allmethods, but excellent reviews can be found in the recentliterature (see, for instance, Sobrino et al., 2005). Differenttechnologies (primer extension, oligo ligation, hybridization),platforms (single-tube, multi-well plates, arrays), detection sys-tems (fluorescence-based, mass spectroscopy) are offered, andthe correct choice depends on the number of SNPs and individ-uals to be scored, as well as on the budget and instrumentation
at hand. At present, SNP markers are available only for a lim-ited number of aquacultured species, although the situation israpidly changing, and, in the next few years, SNPs will prob-ably be the markers of choice for genetic/genomic analyses inaquaculture.
GENOME MAPPING
The genome refers to the entire complement of inherita-ble material, which includes the DNA in the nucleus (nucleargenome) and in mitochondria (mitochondrial genome). Genomemapping through genetic and physical maps has become a pow-erful approach in genetics in farmed species. The main differ-ence between a genetic (linkage or chromosome) map and aphysical (genome sequence) map is that the former providesthe likely order of items in the genome and relative distances(recombination frequency) between them. They are constructedfrom polymorphic landmarks named genetic markers (see sec-tion on genetic markers) whose linkage disequilibria are scoredon a panel of two parents and their progeny, and organized intolinkage groups. Genetic maps are the most common type ofmaps available for fish in aquaculture, largely because they areaffordable and not too complex to prepare. Physical maps rep-resent the order of base pairs of deoxyribonucleic acid (DNA)molecules organized in chromosomes. They can be comparedto road maps, with the genetic maps helping with the relativeorder of cities and villages and the physical maps providing thetrue distances between the cities. Physical maps are available inthree versions. The radiation hybrid (RH) map shows estimateddistances between genetic markers and has the advantage thatmarkers such as ESTs or genes do not have to be polymorphic.To obtain a RH map, it is necessary to produce first a radiationhybrid panel from fragments of the target chromosome obtainedby radiation fused to a receptor genome (available as culturedhamster cells). RH maps have been constructed for zebrafishand gilthead seabream (Geisler et al., 1999; Senger et al., 2006).They often serve as a bridge between genetic and sequence maps(Sarropoulou et al., 2007). Sequence maps exploit the DNA se-quence per chromosome, are often differentiated into codingand non-coding (unique and repetitive) DNA, and may be an-notated by protein function and conservation of synteny (the
reviews in fisheries science vol. 16 S1 2008
Downloaded By: [Canario, Adelino] At: 21:13 15 September 2008
6 A. V. M. CANARIO ET AL.
preserved order of genes on chromosome segments). Varioustypes of sequence maps exist: restriction fragment length poly-morphism (RFLP) maps, where restriction enzymes recognizeparticular base-pair polymorphisms, which are used as markers.The map itself is built from the recombination rates betweenthese markers in a mapping panel (usually an out-bred breedingpair and their F1 or back-crossed F2 progeny). Maps based onlarge insert libraries such as bacterial artificial chromosomes(BACs) are usually produced from a single or a few individ-uals. The great advantage is that the position of these largeinserts has been identified; relatively small but positioned chro-mosome fragments are readily available for the further study.Such maps are available for model species such as zebrafish(Amemiya and Zon, 1999; Miyake and Amemiya, 2004) andmedaka (Kasahara et al., 2007), and have been constructed forthe aquaculture species Atlantic salmon (Ng et al., 2005) andchannel catfish (Quiniou et al., 2007). When the genome is fullysequenced, a complete sequence map is available with the high-est level of detail available at the base-pair level. The genomesof several model species (fugu, medaka, green spotted puffer-fish, stickleback and zebrafish) have been sequenced, while thefirst sequenced genomes of aquaculture species are expected inthe near future. Finally, the chromosomal or cytogenetic mapvisualizes markers in chromosomes through banding patterns(staining and in situ hybridization—also known as chromosomepainting). Resolution is rather low but there is the advantage thata chromosome can be linked to a genetic or sequence map. Well-made genetic maps and physical maps should match, as they usethe same base material: the chromosome (Breen et al., 2004).
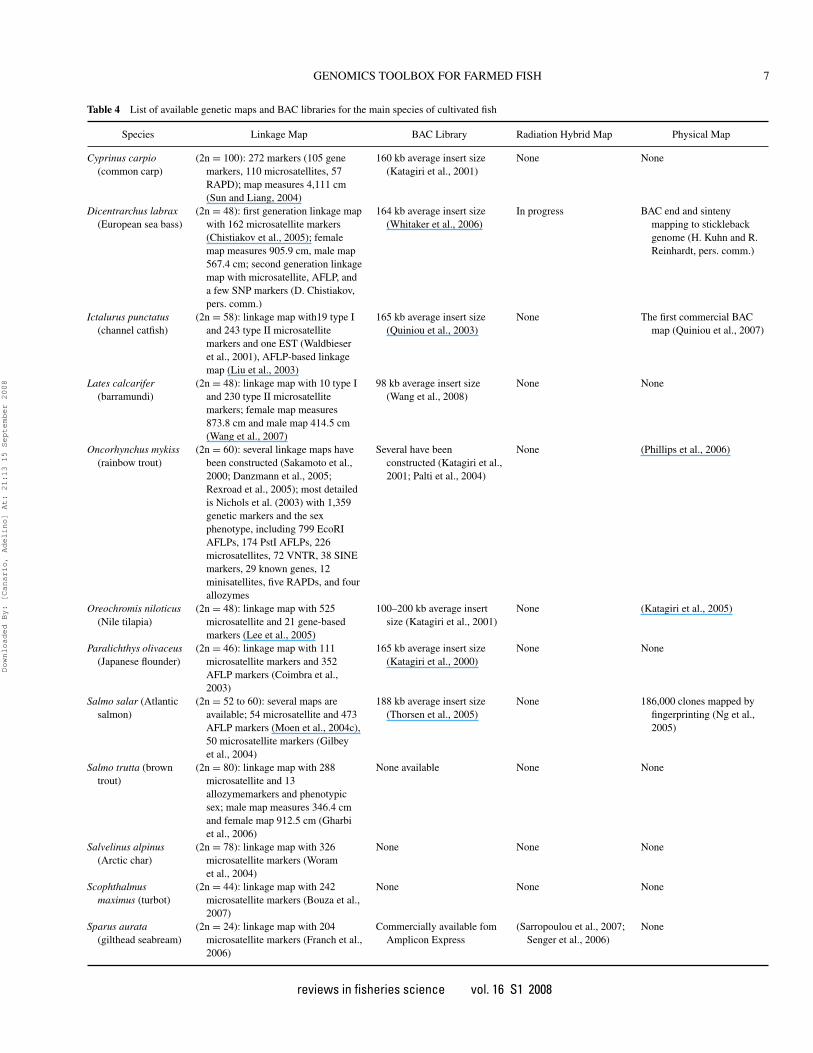
The first linkage map ever dates from 1912 (on the fruitfly Drosophila, which has a generation time of a few weeks,by Sturtevant) and the first cytogenic map from 1935 (also onDrosophila, by Bridges). The first fish maps were producedfrom model species such as swordtail (Morizot et al., 1991) andzebrafish (Streisinger et al., 1986). The introduction of mappingin aquaculture genetics was relatively slow because of the longgeneration times of commercial fishes. The first maps wereproduced from 1985 foremost in salmonids (Johnson et al.,1987) and later in catfishes, cichlids, cyprinids, perciforms, andothers. A list with the latest information on fish genome maps iscompiled in Table 4. Over the past 20 years, maps have becomean integral part of fish genetics and their (potential) applicationin aquaculture has grown. A completely sequenced genomeprovides the ideal map, but in the medium term, there willbe few sequenced fish genomes and even fewer of cultivatedspecies. Atlantic salmon, Nile tilapia, and European sea bassare expected to be among the first aquaculture fish to have theirgenome sequenced.
The main reason for preparing maps is to identify and un-derstand the function of genes, gene clusters, chromosomal re-gions, and chromosomes to link the genome with the phenotypeand to make intraspecific genome comparisons. The conser-vation of synteny makes comparative genomics an option toanalyze genes in less well-studied species. This approach hasallowed inference of the basic structure of the ancestral bony
vertebrate genome from the green spotted pufferfish Tetradodonnigroviridis (Jaillon et al., 2004). Furthermore, a comparisonbetween the maps of rainbow trout and zebrafish (Guyomardet al., 2006) and between gilthead sea bream and pufferfish(Sarropoulou et al., 2007) broadened immensely the pool ofgenes of interest. Evolutionary knowledge embedded in thegenomes finds applications in aquaculture for the identifica-tion of species, lineages or populations (stocks), hybridizationand introgression, and the consequences of ploidy status.
Genome maps contribute to aquaculture by interpreting clas-sical knowledge of fish metabolic physiology, nutrition, im-munology, and endocrinology in a molecular perspective, re-alizing that many biological functions are derived from genesorganized in clusters on the chromosomes. Strategies are used tofully understand the function and heritability of genes throughbreeding studies, micro-arrays expression analysis, and frommapping up to full genome sequence analysis. Roberge et al.(2006) showed that five to seven generations of selection onAtlantic salmon had measurable effects on the transcriptome.
QUANTITATIVE TRAIT LOCI MAPPING IN CULTUREDFISH SPECIES
Phenotypic variation of economically important traits infish—such as growth, disease resistance, and fillet quality—istypically controlled by several genes in combination with envi-ronmental influences. The regions of the genome that contributeto variation in these traits are known as quantitative trait loci(QTL). Facilitated by the availability of a large number of molec-ular genetic markers, QTL detection methods have been widelyused in agricultural and—more recently—aquaculture species.The identification of QTL can be seen as the first step in locat-ing the specific genes and polymorphisms within those genesthat underlie variation in these economically important traits.Furthermore, molecular genetic markers flanking the QTL canbe used in conjunction with traditional selective breeding pro-grams to improve the selection response and accuracy, knownas marker-assisted selection (MAS). MAS is particularly valu-able for traits that are difficult or expensive to measure directly,such as disease resistance or fillet quality in fish, in selectioncandidates, where current selection is based on the performanceof relatives (Sonesson, 2007).
The general principle on which QTL mapping is based is theassociation between allelic variation at marker loci and pheno-typic variation in the trait of interest. Therefore, the availabilityof abundant molecular genetic markers has been the precursorfor QTL mapping studies in fish. Linkage maps facilitate theuse of more advanced statistical techniques, such as intervalmapping to track the segregation and effects of chromosomalregions between flanking markers from parents to offspring.
In within-family linkage QTL studies, the average differ-ence in the trait of interest between full- or half-sib offspringinheriting alternative parental marker allele is calculated (Knott
reviews in fisheries science vol. 16 S1 2008
Downloaded By: [Canario, Adelino] At: 21:13 15 September 2008
GENOMICS TOOLBOX FOR FARMED FISH 7
Table 4 List of available genetic maps and BAC libraries for the main species of cultivated fish
Species Linkage Map BAC Library Radiation Hybrid Map Physical Map
Cyprinus carpio(common carp)
(2n = 100): 272 markers (105 genemarkers, 110 microsatellites, 57RAPD); map measures 4,111 cm(Sun and Liang, 2004)
160 kb average insert size(Katagiri et al., 2001)
None None
Dicentrarchus labrax(European sea bass)
(2n = 48): first generation linkage mapwith 162 microsatellite markers(Chistiakov et al., 2005); femalemap measures 905.9 cm, male map567.4 cm; second generation linkagemap with microsatellite, AFLP, anda few SNP markers (D. Chistiakov,pers. comm.)
164 kb average insert size(Whitaker et al., 2006)
In progress BAC end and sintenymapping to sticklebackgenome (H. Kuhn and R.Reinhardt, pers. comm.)
Ictalurus punctatus(channel catfish)
(2n = 58): linkage map with19 type Iand 243 type II microsatellitemarkers and one EST (Waldbieseret al., 2001), AFLP-based linkagemap (Liu et al., 2003)
165 kb average insert size(Quiniou et al., 2003)
None The first commercial BACmap (Quiniou et al., 2007)
Lates calcarifer(barramundi)
(2n = 48): linkage map with 10 type Iand 230 type II microsatellitemarkers; female map measures873.8 cm and male map 414.5 cm(Wang et al., 2007)
98 kb average insert size(Wang et al., 2008)
None None
Oncorhynchus mykiss(rainbow trout)
(2n = 60): several linkage maps havebeen constructed (Sakamoto et al.,2000; Danzmann et al., 2005;Rexroad et al., 2005); most detailedis Nichols et al. (2003) with 1,359genetic markers and the sexphenotype, including 799 EcoRIAFLPs, 174 PstI AFLPs, 226microsatellites, 72 VNTR, 38 SINEmarkers, 29 known genes, 12minisatellites, five RAPDs, and fourallozymes
Several have beenconstructed (Katagiri et al.,2001; Palti et al., 2004)
None (Phillips et al., 2006)
Oreochromis niloticus(Nile tilapia)
(2n = 48): linkage map with 525microsatellite and 21 gene-basedmarkers (Lee et al., 2005)
100–200 kb average insertsize (Katagiri et al., 2001)
None (Katagiri et al., 2005)
Paralichthys olivaceus(Japanese flounder)
(2n = 46): linkage map with 111microsatellite markers and 352AFLP markers (Coimbra et al.,2003)
165 kb average insert size(Katagiri et al., 2000)
None None
Salmo salar (Atlanticsalmon)
(2n = 52 to 60): several maps areavailable; 54 microsatellite and 473AFLP markers (Moen et al., 2004c),50 microsatellite markers (Gilbeyet al., 2004)
188 kb average insert size(Thorsen et al., 2005)
None 186,000 clones mapped byfingerprinting (Ng et al.,2005)
Salmo trutta (browntrout)
(2n = 80): linkage map with 288microsatellite and 13allozymemarkers and phenotypicsex; male map measures 346.4 cmand female map 912.5 cm (Gharbiet al., 2006)
None available None None
Salvelinus alpinus(Arctic char)
(2n = 78): linkage map with 326microsatellite markers (Woramet al., 2004)
None None None
Scophthalmusmaximus (turbot)
(2n = 44): linkage map with 242microsatellite markers (Bouza et al.,2007)
None None None
Sparus aurata(gilthead seabream)
(2n = 24): linkage map with 204microsatellite markers (Franch et al.,2006)
Commercially available fomAmplicon Express
(Sarropoulou et al., 2007;Senger et al., 2006)
None
reviews in fisheries science vol. 16 S1 2008
Downloaded By: [Canario, Adelino] At: 21:13 15 September 2008
8 A. V. M. CANARIO ET AL.
et al., 1996). In this case, relatively large regions of the genomeaffecting traits of interest can be isolated within families; thesetraits generally need to be further refined by fine-mapping to ap-ply MAS, or to move toward the underlying genes. Where moredetailed genetic maps are available (usually employing SNPmarkers), linkage and linkage disequilibrium mapping (LDLA)can be employed simultaneously, whereby association betweenmarker genotypes and the trait of interest can effectively be cal-culated across families in the overall population (Meuwissenet al., 2002). Due to the lack of sufficient SNP markers, theLDLA approach has yet to be applied to map QTL in culturedfish, and most studies have focused on linkage-based approachesusing relatively sparse genetic maps (Hayes et al., 2006).
The power of these QTL mapping experiments is mainly in-fluenced by three parameters: family structure, heritability of thetrait under study, and size of the effect of the QTL. The latter pa-rameters cannot be controlled, as QTL size depends on the allelicfrequency of the favorable QTL allele, and the QTL effect on thephenotypic variation of the trait is generally unknown when de-signing a study. Power to detect QTL generally increases whenthe heritability of the trait and/or the size of QTL effect is/areincreased. Family structure is the factor in QTL mapping exper-imental design that can be modified and which has a great influ-ence on the power of the study. For a given number of animals,it has been shown that using fewer families with a larger numberof progeny is more powerful than using a lot of small families(Kolbehdari et al., 2005). Using full-sib families is usually morepowerful than half-sib families, but, depending on the species, itis not always simple to obtain this specific structure. The high fe-cundity and reproductive characteristics of certain species doesallow a mix of full-sib and half-sib families, which can be usedin naturally mass-spawning species for improved power of QTLdetection.
However, certain species currently used in aquaculture showpractical and biological characteristics that complicate the iden-tification or creation of suitable QTL mapping populations. Mostobviously, selective breeding programs are relatively new for themajority of aquaculture species, with varying degrees of massselection and family-based selection currently used. Thus, thenumber of suitable mapping populations with the high-qualitytrait data required for QTL mapping is currently limited. In ad-dition, the biology of certain fish and shellfish species presentsunique challenges to implementing QTL mapping and selectivebreeding in general. For example, self-fertilization can occur inhermaphroditic species such as scallop, and it is impossible todistinguish self- and out-crossed individuals without the use ofmolecular markers (Martinez, 2007). Furthermore, it is difficultto tag newly hatched individuals in the majority of aquaculturespecies; the determination of pedigrees will then also rely onthe use of molecular markers.
Reproductive manipulations can be applied to create pow-erful QTL mapping populations in certain fish species, such asdouble haploid lines, whereby inactivation of one of the parent’schromosomes and subsequent restoration of diploidy resultsin offspring that are essentially fully homozygous (Chourrout,
1984). From there, clonal lines can be developed and crosses setup to provide powerful resource populations for the mappingof QTL (Martinez et al., 2005). Such double haploid lines havebeen successfully used to detect QTL in fish species, particu-larly in rainbow trout e.g., (Robison et al., 2001; Zimmermanet al., 2004; Martinez et al., 2005).
Experimental populations created from crosses betweenout-bred lines, typically with divergent phenotypes for thetrait of interest, have also been successfully used to identifyQTL in cultured fish species. For example, QTL have beenidentified in back-cross rainbow trout populations affectingeconomically important traits such as disease resistance(e.g., Ozaki et al., 2001; Rodriguez et al., 2004), uppertemperature tolerance (e.g., Jackson et al., 1998; Danzmannet al., 1999), and spawning time (e.g., Sakamoto et al., 1999;O’Malley et al., 2003). A major QTL affecting viral diseaseresistance has also been detected in Japanese flounder in aback-cross from resistant and susceptible strains (Fuji et al.,2006). Furthermore, in F2 populations of tilapia, QTL havebeen identified that affect size, cold tolerance, stress, andimmune response traits (Cnaani et al., 2003, 2004; Moen et al.,2004a).
The typically large family sizes found in fish populationsmeans that tracking the inheritance of marker alleles from par-ents to offspring in simple out-bred full- or half-sib families hasalso been successfully applied in several species. For example,QTL affecting performance traits such as body weight and con-dition factor have been identified in experimental designs involv-ing large full-sib families of salmonid species (Reid et al., 2005;e.g., Moghadam et al., 2007). Furthermore, families taken di-rectly from experimental or field disease-challenge experimentsused in selective breeding programs have been effectively usedto detect QTL affecting disease resistance in Atlantic salmon(Moen et al., 2004b; Houston et al., 2006). Typical families infish breeding programs can yield significant power for mappingQTL, although the use of the LDLA approach in these familiesis advantageous over linkage QTL mapping alone (Hayes et al.,2006).
The power to detect QTL and the ability to accurately po-sition QTL on the genome are dependent on the amount of re-combination between the marker loci and the underlying causalvariant. An unusual aspect of QTL mapping in certain cul-tured species is the large recombination rate differences be-tween the sexes. For example, in salmonid species, the malehas remarkably suppressed recombination, which is thoughtto reflect the partial tetraploidy following the relatively re-cent genome duplication in these species (Sakamoto et al.,2000; Gharbi et al., 2006), whereas in the Japanese flounderthe male has overall increased recombination compared to thefemale (Coimbra et al., 2003). These differences mean thattracking the inheritance of marker alleles through the map-ping parent with suppressed recombination can be effectivelyused to detect QTL with greater power, whereas the positioningof the QTL requires the increased recombination of the otherparent.
reviews in fisheries science vol. 16 S1 2008
Downloaded By: [Canario, Adelino] At: 21:13 15 September 2008
GENOMICS TOOLBOX FOR FARMED FISH 9
CONCLUSIONS AND PERSPECTIVES
An increasing variety and quantity of genomics tools areavailable to facilitate QTL mapping of the main farmed fishspecies. However, fish farming, unlike that of land animals, ischaracterized by diversification and relatively rapid domesti-cation (Duarte et al., 2007). Although it is not feasible in themedium term to develop specific tools for all species, the useof synteny mapping with a related species with a sequencedgenome may allow identification of candidate genes in the regionof the QTL. Furthermore, although the fragmentary nature ofsynteny between more distant species could limit the approach(de Koning et al., 2007), QTL conservation may make the trans-fer of discoveries made in model species (such as zebrafish,medaka, or stickleback) to aquaculture species feasible. Com-bining QTL mapping with microarray analysis, or other high-throughput methods, to analyze gene expression can be verypowerful to restrict the number of candidate genes of the QTL,which often encompass several thousand genes (Wayne andMcIntyre, 2002). Customized oligonucleotide arrays designedfrom EST can also be used to hybridize genomic DNA fromparental lines to identify polymorphisms, which can be quicklymapped by oligonucleotide array to the mapping panel to pro-duce high-density maps (Borevitz and Chory, 2004). In this way,QTL regions may become smaller and the probability of findingthe gene responsible for the QTL higher.
In summary, advances in faster and cheaper sequencing tech-nologies are driving the development of novel approaches thatput genomes and transcriptomes of non-model species, includ-ing some farmed fish species, within reach. As genomics re-sources for cultured fish species grow, increased attention willbe devoted to the detection of QTL affecting economically im-portant traits. The unique characteristics of cultured fish popu-lations present novel challenges and exciting opportunities forthe mapping of these QTL and their application in selectivebreeding schemes.
ACKNOWLEDGEMENTS
The present invited review was prepared in the context of theEuropean Specific Support Action, AQUAFUNC ((EU-SSA-022685) and through the Network of Excellence Marine Ge-nomics Europe (contract GOCE-CT-2004-505403) with finan-cial support from the Commission of the European Communi-ties.
REFERENCES
Altshuler, D., V. J. Pollara, C. R. Cowles, W. J. Van Etten, J. Baldwin,L. Linton, and E. S. Lander. An SNP map of the human genomegenerated by reduced representation shotgun sequencing. Nature,407: 513–516 (2000).
Amemiya, C. T., and L. I. Zon. Generation of a zebrafish P1 artificialchromosome library. Genomics, 58: 211–213 (1999).
Bettini, E., A. R. Porta, N. Dahmen, H. Wang, and F. L. Margolis.Expressed sequence tags (EST) identify genes preferentially ex-pressed in catfish chemosensory tissues. Mol. Brain. Res., 23: 285–291 (1994).
Borevitz, J. O., and J. Chory. Genomics tools for QTL analysis andgene discovery. Curr. Opin. Plant Biol., 7: 132–136 (2004).
Bouza, C., M. Hermida, B. G. Pardo, C. Fernandez, G. G. Fortes, J.Castro, L. Sanchez, P. Presa, M. Perez, A. Sanjuan, A. De Carlos, J.A. Alvarez-Dios, S. Ezcurra, R. M. Cal, F. Piferrer, and P. Martinez.A microsatellite genetic map of the turbot (Scophthalmus maximus).Genetics, 177: 2457–2467 (2007).
Breen, M., C. Hitte, T. D. Lorentzen, R. Thomas, E. Cadieu, L. Sabacan,A. Scott, G. Evanno, H. G. Parker, E. F. Kirkness, R. Hudson, R.Guyon, G. G. Mahairas, B. Gelfenbeyn, C. M. Fraser, C. Andre, F.Galibert, and E. A. Ostrander. An integrated 4249 marker FISH/RHmap of the canine genome. BMC Genomics, 5: 65 (2004).
Castro, J., A. Pino, M. Hermida, C. Bouza, A. Riaza, I. Ferreiro, L.Sanchez, and P. A. Martinez. Microsatellite marker tool for parent-age analysis in Senegal sole (Solea senegalensis): Genotyping errors,null alleles, and conformance to theoretical assumptions. Aquacul-ture, 261: 1194–1203 (2006).
Chistiakov, D. A., B. Hellemans, C. S. Haley, A. S. Law, C. S.Tsigenopoulos, G. Kotoulas, D. Bertotto, A. Libertini, and F. A.M. Volckaert. A microsatellite linkage map of the European seabass Dicentrarchus labrax L. Genetics, 170: 1821–1826 (2005).
Chistiakov, D. A., B. Hellemans, and F. A. M. Volckaert. Microsatellitesand their genomic distribution, evolution, function, and applications:A review with special reference to fish genetics. Aquaculture, 255:1–29 (2006).
Chourrout, D. Pressure-induced retention of second polar body andsuppression of 1st cleavage in rainbow trout: Production of all-triploids, all-tetraploids, and heterozygous and homozygous diploidgynogenetics. Aquaculture, 36: 111–126 (1984).
Cnaani, A., E. M. Hallerman, M. Ron, J. I. Weller, M. Indelman, Y.Kashi, G. A. E. Gall, and G. Hulata. Detection of a chromosomalregion with two quantitative trait loci, affecting cold tolerance andfish size, in an F-2 tilapia hybrid. Aquaculture, 223: 117–128 (2003).
Cnaani, A., N. Zilberman, S. Tinman, G. Hulata, and M. Ron. Genome-scan analysis for quantitative trait loci in an F-2 tilapia hybrid. Mol.Genet. Genom., 272: 162–172 (2004).
Cohen, R., V. Chalifa-Caspi, T. Williams, M. Auslander, S. George,J. Chipman, and M. Tom. Estimating the efficiency of fish cross-species cDNA microarray hybridization. Mar. Biotechnol., 9: 491–499 (2007).
Coimbra, M. R. M., K. Kobayashi, S. Koretsugu, O. Hasegawa, E.Ohara, A. Ozaki, T. Sakamoto, K. Naruse, and N. Okamoto. A ge-netic linkage map of the Japanese flounder, Paralichthys olivaceus.Aquaculture, 220: 203–218 (2003).
Coulibaly, I., K. Gharbi, R. G. Danzmann, J. Yao, and C. E. Rexroad.Characterization and comparison of microsatellites derived fromrepeat-enriched libraries and expressed sequence tags. Anim. Genet.,36: 309–315 (2005).
Dahm, R., and R. Geisler. Learning from small fry: The zebrafish as agenetic model organism for aquaculture fish species. Mar. Biotech-nol., 8: 329–345 (2006).
Danzmann, R. G., M. Cairney, W. S. Davidson, M. M. Ferguson,K. Gharbi, R. Guyomard, L. E. Holm, E. Leder, N. Okamoto, A.Ozaki, C. E. Rexroad, T. Sakamoto, J. B. Taggart, and R. A. A.
reviews in fisheries science vol. 16 S1 2008
Downloaded By: [Canario, Adelino] At: 21:13 15 September 2008
10 A. V. M. CANARIO ET AL.
Woram. Comparative analysis of the rainbow trout genome with 2other species of fish (Arctic charr and Atlantic salmon) within thetetraploid derivative Salmonidae family (subfamily: Salmoninae).Genome, 48: 1037–1051 (2005).
Danzmann, R. G., T. R. Jackson, and M. M. Ferguson. Epistasis inallelic expression at upper temperature tolerance QTL in rainbowtrout. Aquaculture, 173: 45–58 (1999).
De Koning, D.-J., A. Archibald and C. S. Haley. Livestock genomics:Bridging the gap between mice and men. Trends Biotechnol., 25:483–489 (2007).
Duarte, C. M., N. Marba, and M. Holmer. Rapid domestication ofmarine species. Science, 316: 382–383 (2007).
Ellegren, H. Microsatellites: Simple sequences with complex evolution.Nat. Rev. Genet., 5: 435–445 (2004).
Fadiel, A., I. Anidi, and K. D. Eichenbaum. Farm animal genomics andinformatics: An update. Nucl. Acids Res., 33: 6308–6318 (2005).
FAO. The State of the World Fisheries and Aquaculture. Rome: Foodand Agriculture Organization of the United Nations (2006).
Ferraresso, S., N. Vitulo, A. N. Mininni, C. Romualdi, B. Cardazzo,E. M. Negrisolo, R. Reinhardt, A. Canario, T. Patarnello, and L.Bargelloni. An integrated platform for mRNA expression profiling inthe marine teleost fish Sparus aurata L. BMC Genomics, submitted(2008).
Franch, R., B. Louro, M. Tsalavouta, D. Chatziplis, C. S. Tsigenopou-los, E. Sarropoulou, J. Antonello, A. Magoulas, C. C. Mylonas, M.Babbucci, T. Patarnello, D. M. Power, G. Kotoulas, and L. Bargel-loni. A genetic linkage map of the hermaphrodite teleost fish Sparusaurata L. Genetics, 174: 851–861 (2006).
Fuji, K., K. Kobayashi, O. Hasegawa, M. R. M. Coimbra, T. Sakamoto,and N. Okamoto. Identification of a single major genetic locus con-trolling the resistance to lymphocystis disease in Japanese flounder(Paralichthys olivaceus). Aquaculture, 254: 203–210 (2006).
Geisler, R., G. J. Rauch, H. Baier, F. Van Bebber, L. Bross, M. P. S.Dekens, K. Finger, C. Fricke, M. A. Gates, H. Geiger, S. Geiger-Rudolph, D. Gilmour, S. Glaser, L. Gnugge, H. Habeck, K. Hingst, S.Holley, J. Keenan, A. Kirn, H. Knaut, D. Lashkari, F. Maderspacher,U. Martyn, S. Neuhauss, C. Neumann, T. Nicolson, F. Pelegri, R.Ray, J. M. Rick, H. Roehl, T. Roeser, H. E. Schauerte, A. F. Schier,U. Schonberger, H. B. Schonthaler, S. Schulte-Merker, C. Seydler,W. S. Talbot, C. Weiler, C. Nusslein-Volhard, and P. Haffter. Aradiation hybrid map of the zebrafish genome. Nat. Genet., 23: 86–89(1999).
Gharbi, K., A. Gautier, R. G. Danzmann, S. Gharbi, T. Sakamoto,B. Hoyheim, J. B. Taggart, M. Cairney, R. Powell, F. Krieg, N.Okamoto, M. M. Ferguson, L. E. Holm, and R. Guyomard. A link-age map for brown trout (Salmo trutta): Chromosome homeologiesand comparative genome organization with other salmonid fish. Ge-netics, 172: 2405–2419 (2006).
Gilbey, J., E. Verspoor, A. Mclay, and D. Houlihan. A microsatellitelinkage map for Atlantic salmon (Salmo salar). Anim. Genet., 35:98–105 (2004).
Gong, Z. Y. Zebrafish expressed sequence tags and their applications.Methods Cell Biol., 60: 213–233 (1999).
Guyomard, R., S. Mauger, K. Tabet-Canale, S. Martineau, C. Genet, F.Krieg, and E. Quillet. A type I and type II microsatellite linkage mapof Rainbow trout (Oncorhynchus mykiss) with presumptive coverageof all chromosome arms. BMC Genomics, 7: 302 (2006).
Hayes, B. J., A. Gjuvsland, and S. Omholt. Power of QTL mappingexperiments in commercial Atlantic salmon populations, exploiting
linkage and linkage disequilibrium and effect of limited recombina-tion in males. Heredity, 97: 19–26 (2006).
Hirono, I., and T. Aoki. Expressed sequence tags of medaka (Oryziaslatipes) liver mRNA. Mol. Mar. Biol. Biotechnol., 6: 345–350(1997).
Houston, R. D., D. R. Guy, A. Hamilton, J. Ralph, N. Spreckley, J. B.Taggart, B. J. Mcandrew, C. S. Haley, and S. C. Bishop. Detectionof major QTL affecting resistance to infectious pancreatic necro-sis (IPN) in a commercial Atlantic salmon population. 8th WorldCongress on Genetics Applied to Livestock Production. Belo Hori-zonte, MG, Brazil (2006).
Inoue, S., B. H. Nam, I. Hirono, and T. Aoki. A survey of expressedgenes in Japanese flounder (Paralichthys olivaceus) liver and spleen.Mol. Mar. Biol. Biotechnol., 6: 376–380 (1997).
Jackson, T. R., M. M. Ferguson, R. G. Danzmann, A. G. Fishback, P.E. Ihssen, M. O’Connell, and T. J. Crease. Identification of two QTLinfluencing upper temperature tolerance in three rainbow trout (On-corhynchus mykiss) half-sib families. Heredity, 80: 143–151 (1998).
Jaillon, O., J. M. Aury, F. Brunet, J. L. Petit, N. Stange-Thomann, E.Mauceli, L. Bouneau, C. Fischer, C. Ozouf-Costaz, A. Bernot, S.Nicaud, D. Jaffe, S. Fisher, G. Lutfalla, C. Dossat, B. Segurens, C.Dasilva, M. Salanoubat, M. Levy, N. Boudet, S. Castellano, R. An-thouard, C. Jubin, V. Castelli, M. Katinka, B. Vacherie, C. Biemont,Z. Skalli, L. Cattolico, J. Poulain, V. De Berardinis, C. Cruaud, S.Duprat, P. Brottier, J. P. Coutanceau, J. Gouzy, G. Parra, G. Lardier,C. Chapple, K. J. Mckernan, P. McEwan, S. Bosak, M. Kellis, J.N. Volff, R. Guigo, M. C. Zody, J. Mesirov, K. Lindblad-Toh, B.Birren, C. Nusbaum, D. Kahn, M. Robinson-Rechavi, V. Laudet,V. Schachter, F. Quetier, W. Saurin, C. Scarpelli, P. Wincker, E. S.Lander, J. Weissenbach, and H. R. Crollius. Genome duplication inthe teleost fish Tetraodon nigroviridis reveals the early vertebrateproto-karyotype. Nature, 431: 946–957 (2004).
Ji, W., W. L. Zhou, K. Gregg, N. Yu, S. Davis, and S. Davis. Amethod for cross-species gene expression analysis with high-densityoligonucleotide arrays. Nucleic Acids Res., 32: e93 (2004).
Johnson, K. R., J. E. Wright, and B. May. Linkage relationships reflect-ing ancestral tetraploidy in salmonid fish. Genetics, 116: 579–591(1987).
Johnson, N. A., C. E. Rexroad, E. M. Hallerman, R. L. Vallejo, andY. Palti. Development and evaluation of a new microsatellite mul-tiplex system for parental allocation and management of rainbowtrout (Oncorhynchus mykiss) broodstocks. Aquaculture, 266: 53–62(2007).
Ju, Z., M. Wells, A. Martinez, L. Hazlewood, and R. Walter. An insilico mining for simple sequence repeats from expressed sequencetags of zebrafish, medaka, Fundulus, and Xiphophorus. Silico Biol.,5: 439–463 (2005).
Kalujnaia, S., I. S. Mcwilliam, V. A. Zaguinaiko, A. L. Feilen, J.Nicholson, N. Hazon, C. P. Cutler, R. J. Balment, A. R. Cossins,M. Hughes, and G. Cramb. Salinity adaptation and gene profilinganalysis in the European eel (Anguilla anguilla) using microarraytechnology. Gen. Comp. Endocrinol., 152: 274–280 (2007).
Karsi, A., P. Li, R. A. Dunham and Z. J. Liu. Transcriptional activitiesin the pituitaries of channel catfish before and after induced ovula-tion by injection of carp pituitary extract as revealed by expressedsequence tag analysis. J. Mol. Endocrinol., 21: 121–129 (1998).
Kasahara, M., K. Naruse, S. Sasaki, Y. Nakatani, W. Qu, B. Ahsan,T. Yamada, Y. Nagayasu, K. Doi, Y. Kasai, T. Jindo, D. Kobayashi,A. Shimada, A. Toyoda, Y. Kuroki, A. Fujiyama, T. Sasaki, A.
reviews in fisheries science vol. 16 S1 2008
Downloaded By: [Canario, Adelino] At: 21:13 15 September 2008

GENOMICS TOOLBOX FOR FARMED FISH 11
Shimizu, S. Asakawa, N. Shimizu, S. I. Hashimoto, J. Yang, Y. Lee,K. Matsushima, S. Sugano, M. Sakaizumi, T. Narita, K. Ohishi, S.Haga, F. Ohta, H. Nomoto, K. Nogata, T. Morishita, T. Endo, T.Shin-I, H. Takeda, S. Morishita, and Y. Kohara. The medaka draftgenome and insights into vertebrate genome evolution. Nature, 447:714–719 (2007).
Kassahn, K. S., M. J. Caley, A. C. Ward, A. R. Connolly, G. Stone, andR. H. Crozier. Heterologous microarray experiments used to identifythe early gene response to heat stress in a coral reef fish. Mol. Ecol.,16: 1749–1763 (2007).
Katagiri, T., S. Asakawa, I. Hirono, T. Aoki, and N. Shimizu. Genomicbacterial artificial chromosome library of the Japanese flounder Par-alichthys olivaceus. Mar. Biotechnol., 2: 571–576 (2000).
Katagiri, T., S. Asakawa, S. Minagawa, N. Shimizu, I. Hirono, and T.Aoki. Construction and characterization of BAC libraries for threefish species: rainbow trout, carp, and tilapia. Anim. Genet., 32: 200–204 (2001).
Katagiri, T., C. Kidd, E. Tomasino, J. Davis, C. Wishon, J. Stern, K.Carleton, A. Howe, and T. Kocher. A BAC-based physical map ofthe Nile tilapia genome. BMC Genomics, 6: 89 (2005).
Knott, S. A., J. M. Elsen, and C. S. Haley. Methods for multiple-marker mapping of quantitative trait loci in half-sib populations.Theor. Appl. Genet., 93: 71–80 (1996).
Kolbehdari, D., G. B. Jansen, L. R. Schaeffer, and B. O. Allen. Power ofQTL detection by either fixed or random models in half-sib designs.Genet. Sel. Evol., 37: 601–614 (2005).
Larkin, P., D. L. Villeneuve, I. Knoebl, A. L. Miracle, B. J. Carter, L.Liu, N. D. Denslow, and G. T. Ankley. Development and validationof a 2,000-gene microarray for the fathead minnow (Pimephalespromelas). Environ. Toxicol. Chem., 26: 1497–1506 (2007).
Lee, B. Y., W. J. Lee, J. T. Streelman, K. L. Carleton, A. E. Howe, G.Hulata, A. Slettan, Y. Terai, and T. D. Kocher. A second generationgenetic linkage map of tilapia (Oreochromis spp.). Genetics, 170:237–244 (2005).
Lerceteau-Kohler, E., and S. Weiss. Development of a multiplex PCRmicrosatellite assay in brown trout Salmo trutta and its potentialapplication for the genus. Aquaculture, 258: 641–645 (2006).
Liu, Z., A. Karsi, P. Li, D. Cao, and R. Dunham. An AFLP-based geneticlinkage map of channel catfish (Ictalurus punctatus) constructed byusing an interspecific hybrid resource family. Genetics, 165: 687–694 (2003).
Margulies, M., M. Egholm, W. E. Altman, S. Attiya, J. S. Bader,L. A. Bemben, J. Berka, M. S. Braverman, Y.-J. Chen, Z. Chen,S. B. Dewell, L. Du, J. M. Fierro, X. V. Gomes, B. C. Godwin,W. He, S. Helgesen, C. H. Ho, G. P. Irzyk, S. C. Jando, M. L.I. Alenquer, T. P. Jarvie, K. B. Jirage, J.-B. Kim, J. R. Knight, J.R. Lanza, J. H. Leamon, S. M. Lefkowitz, M. Lei, J. Li, K. L.Lohman, H. Lu, V. B. Makhijani, K. E. Mcdade, M. P. Mckenna,E. W. Myers, E. Nickerson, J. R. Nobile, R. Plant, B. P. Puc, M. T.Ronan, G. T. Roth, G. J. Sarkis, J. F. Simons, J. W. Simpson, M.Srinivasan, K. R. Tartaro, A. Tomasz, K. A. Vogt, G. A. Volkmer,S. H. Wang, Y. Wang, M. P. Weiner, P. Yu, R. F. Begley, and J.M. Rothberg. Genome sequencing in microfabricated high-densitypicolitre reactors. Nature, 437: 376–380 (2005).
Markert, J. A., P. D. Danley, and M. E. Arnegard. New markers for newspecies: Microsatellite loci and the East African cichlids. TrendsEcol, Evol., 16: 100–107 (2001).
Marth, G. T., I. Korf, M. D. Yandell, R. T. Yeh, Z. J. Gu, H. Zakeri, N. O.Stitziel, L. Hillier, P. Y. Kwok, and W. R. Gish. A general approach
to single-nucleotide polymorphism discovery. Nat. Genet., 23: 452–456 (1999).
Martinez, V. Marker-assisted selection in fish and shellfish breedingschemes. In: Marker-Assisted Selection: Current Status and FutureApplication in Crops, Livestock, Forestry and Fish. (E. Guimaraes,J. Ruane, B. Scherf, A. Sonnino, and J. Dargie, Eds.). Rome: FAO(2007).
Martinez, V., G. Thorgaard, B. Robison, and M. J. Sillanpaa. Posteriorevidence of multiple QTL influencing early development in doublehaploid lines of rainbow trout, Oncorhynchus mykiss. Aquaculture,247: 25 (2005).
Matsuyama, T., A. Fujiwara, C. Nakayasu, T. Kamaishi, N. Oseko,N. Tsutsumi, I. Hirono, and T. Aoki. Microarray analyses of geneexpression in Japanese flounder Paralichthys olivaceus leucocytesduring monogenean parasite Neoheterobothrium hirame infection.Dis. Aquat. Organ., 75: 79–83 (2007).
Mcginnity, P., P. Prodohl, A. Ferguson, R. Hynes, N. O. Maoileidigh, N.Baker, D. Cotter, B. O’Hea, D. Cooke, G. Rogan, J. Taggart, and T.Cross. Fitness reduction and potential extinction of wild populationsof Atlantic salmon, Salmo salar, as a result of interactions withescaped farm salmon. Proc. Biol. Sci., 270: 2443–2450 (2003).
Meuwissen, T. H. E., A. Karlsen, S. Lien, I. Olsaker, and M. E. Goddard.Fine mapping of a quantitative trait locus for twinning rate usingcombined linkage and linkage disequilibrium mapping. Genetics,161: 373–379 (2002).
Miyake, T., and C. T. Amemiya. BAC libraries and comparative ge-nomics of aquatic chordate species. Comp. Biochem. Physiol. C.Comp. Pharmacol., 138: 233–244 (2004).
Moen, T., J. J. Agresti, A. Cnaani, H. Moses, T. R. Famula, G. Hulata,G. A. E. Gall, and B. May. A genome scan of a four-way tilapia crosssupports the existence of a quantitative trait locus for cold toleranceon linkage group 23. Aquac. Res., 35: 893–904 (2004a).
Moen, T., K. T. Fjalestad, H. Munck, and L. Gomez-Raya. A multistagetesting strategy for detection of quantitative trait loci affecting dis-ease resistance in Atlantic salmon. Genetics, 167: 851–858 (2004b).
Moen, T., B. Hoyheim, H. Munck, and L. Gomez-Raya. A linkagemap of Atlantic salmon (Salmo salar) reveals an uncommonly largedifference in recombination rate between the sexes. Anim. Genet.,35: 81–92 (2004c).
Moghadam, H. K., J. Poissant, H. Fotherby, L. Haidle, M. M. Ferguson,and R. G. Danzmann. Quantitative trait loci for body weight, condi-tion factor, and age at sexual maturation in Arctic charr (Salvelinusalpinus): Comparative analysis with rainbow trout (Oncorhynchusmykiss) and Atlantic salmon (Salmo salar). Mol. Genet. Genom.,277: 647–661 (2007).
Morizot, D. C., S. A. Slaugenhaupt, K. D. Kallman, and A. Chakravarti.Genetic linkage map of fishes of the genus Xiphophorus (Teleostei:Poeciliidae). Genetics, 127: 399–410 (1991).
Naylor, R. L., and M. Burke. Aquaculture and ocean resources: Raisingtigers of the sea. Annu. Rev. Environ. Resour., 30: 185–218 (2005).
Naylor, R. L., R. J. Goldburg, J. H. Primavera, N. Kautsky, M. C.Beveridge, J. Clay, C. Folke, J. Lubchenco, H. Mooney, and M.Troell. Effect of aquaculture on world fish supplies. Nature, 405:1017–1024 (2000).
Naylor, R. L., S. L. Williams, and D. R. Strong. Aquaculture—A gate-way for exotic species. Science, 294: 1655–1656 (2001).
Ng, S. H. S., C. G. Artieri, I. E. Bosdet, R. Chiu, R. G. Danzmann,W. S. Davidson, M. M. Ferguson, C. D. Fjell, B. Hoyheim, S. J. M.Jones, P. J. De Jong, B. F. Koop, M. I. Krzywinski, K. Lubieniecki,
reviews in fisheries science vol. 16 S1 2008
Downloaded By: [Canario, Adelino] At: 21:13 15 September 2008
12 A. V. M. CANARIO ET AL.
M. A. Marra, L. A. Mitchell, C. Mathewson, K. Osoegawa, S. E.Parisotto, R. B. Phillips, M. L. Rise, K. R. Von Schalburg, J. E.Schein, H. S. Shin, A. Siddiqui, J. Thorsen, N. Wye, G. Yang, andB. L. Zhu. A physical map of the genome of Atlantic salmon, Salmosalar. Genomics, 86: 396–404 (2005).
Nichols, K. M., W. P. Young, R. G. Danzmann, B. D. Robison, C.Rexroad, M. Noakes, R. B. Phillips, P. Bentzen, I. Spies, K. Knudsen,F. W. Allendorf, B. M. Cunningham, J. Brunelli, H. Zhang, S. Ristow,R. Drew, K. H. Brown, P. A. Wheeler, and G. H. Thorgaard. Aconsolidated linkage map for rainbow trout (Oncorhynchus mykiss).Anim. Genet., 34: 102–115 (2003).
Nieto-Diaz, M., W. Pita-Thomas, and M. Nieto-Sampedro. Cross-species analysis of gene expression in non-model mammals: Re-producibility of hybridization on high density oligonucleotide mi-croarrays. BMC Genom., 8: 89 (2007).
O’Malley, K. G., T. Sakamoto, R. G. Danzmann, and M. M. Ferguson.Quantitative trait loci for spawning date and body weight in rainbowtrout: Testing for conserved effects across ancestrally duplicatedchromosomes. J. Hered., 94: 273–284 (2003).
Ozaki, A., T. Sakamoto, S. Khoo, K. Nakamura, M. R. M. Coimbra,T. Akutsu, and N. Okamoto. Quantitative trait loci (QTLs) associ-ated with resistance/susceptibility to infectious pancreatic necrosisvirus (IPNV) in rainbow trout (Oncorhynchus mykiss). Mol. Genet.Genom., 265: 23–31 (2001).
Palti, Y., S. A. Gahr, J. D. Hansen, and C. E. Rexroad. Characterizationof a new BAC library for rainbow trout: Evidence for multi-locusduplication. Anim. Genet., 35: 130–133 (2004).
Pardo, B. G., C. Fernandez, M. Hermida, A. Vazquez-Lopez, M. Perez,P. Presa, M. Calaza, J. A. Alvarez-Dios, A. S. Comesana, J. Raposo-Guillan, C. Bouza, and P. Martinez. Development and characteri-zation of 248 novel microsatellite markers in turbot (Scophthalmusmaximus). Genome, 50: 329–332 (2007).
Phillips, R. B., K. M. Nichols, J. J. Dekoning, M. R. Morasch, K. A.Keatley, C. Rexroad III, S. A. Gahr, R. G. Danzmann, R. E. Drew,and G. H. Thorgaard. Assignment of rainbow trout linkage groupsto specific chromosomes. Genetics, 174: 1661–1670 (2006).
Quiniou, S. M., G. C. Waldbieser, and M. V. Duke. A first-generationBAC-based physical map of the channel catfish genome. BMCGenom., 8: 40 (2007).
Quiniou, S. M. A., T. Katagiri, N. W. Miller, M. Wilson, W. R. Wolters,and G. C. Waldbieser. Construction and characterization of a BAClibrary from a gynogenetic channel catfish, Ictalurus punctatus.Genet. Sel. Evol., 35: 1–11 (2003).
Reid, D. P., A. Szanto, B. Glebe, R. G. Danzmann, and M. M. Ferguson.QTL for body weight and condition factor in Atlantic salmon (Salmosalar): Comparative analysis with rainbow trout (Oncorhynchusmykiss) and Arctic charr (Salvelinus alpinus). Heredity, 94: 166–172 (2005).
Renn, S. C. P., N. Aubin-Horth, and H. A. Hofmann. Biologicallymeaningful expression profiling across species using heterologoushybridization to a cDNA microarray. BMC Genomics, 5: 42 (2004).
Rexroad, C. E., M. F. Rodriguez, I. Coulibaly, K. Gharbi, R. G.Danzmann, J. De Koning, R. Phillips, and Y. Palti. Compara-tive mapping of expressed sequence tags containing microsatel-lites in rainbow trout (Oncorhynchus mykiss). BMC Genom., 6: 54(2005).
Roberge, C., S. Einum, H. Guderley, and L. Bernatchez. Rapid par-allel evolutionary changes of gene transcription profiles in farmedAtlantic salmon. Mol. Ecol., 15: 9–20 (2006).
Robison, B. D., P. A. Wheeler, K. Sundin, P. Sikka, and G. H. Thorgaard.Composite interval mapping reveals a major locus influencing em-bryonic development rate in rainbow trout (Oncorhynchus mykiss).J. Hered., 92: 16–22 (2001).
Rodriguez, M. F., S. Lapatra, S. Williams, T. Famula, and B. May.Genetic markers associated with resistance to infectious hematopoi-etic necrosis in rainbow and steelhead trout (Oncorhynchus mykiss)backcrosses. Aquaculture, 241: 93–115 (2004).
Sakamoto, T., R. G. Danzmann, K. Gharbi, P. Howard, A. Ozaki, S.K. Khoo, R. A. Woram, N. Okamoto, M. M. Ferguson, L. E. Holm,R. Guyomard, and B. Hoyheim. A microsatellite linkage map ofrainbow trout (Oncorhynchus mykiss) characterized by large sex-specific differences in recombination rates. Genetics, 155: 1331–1345 (2000).
Sakamoto, T., R. G. Danzmann, N. Okamoto, M. M. Ferguson, and P.E. Ihssen. Linkage analysis of quantitative trait loci associated withspawning time in rainbow trout (Oncorhynchus mykiss). Aquacul-ture, 173: 33–43 (1999).
Sarropoulou, E., R. Franch, B. Louro, D. M. Power, L. Bargelloni, A.Magoulas, F. Senger, M. Tsalavouta, T. Patarnello, F. Galibert, G.Kotoulas, and R. Geisler. A gene-based radiation hybrid map of thegilthead sea bream Sparus aurata refines and exploits conservedsynteny with Tetraodon nigroviridis. BMC Genom., 8: 44 (2007).
Schlotterer, C. The evolution of molecular markers–just a matter offashion? Nat. Rev. Genet., 5: 63–69 (2004).
Sellner, E. M., J. W. Kim, M. C. Mcclure, K. H. Taylor, R. D. Schnabel,and J. F. Taylor. Applications of genomic information in livestock.J. Anim. Sci., 85: 3148–3158 (2007).
Senger, F., C. Priat, C. Hitte, E. Sarropoulou, R. Franch, R. Geisler,L. Bargelloni, D. Power, and F. Galibert. The first radiation hybridmap of a perch-like fish: The gilthead seabream (Sparus aurata L).Genomics, 87: 793–800 (2006).
Sobrino, B., M. Brion, and A. Carracedo. SNPs in forensic genetics:A review on SNP typing methodologies. Forensic Sci. Int., 154:181–194 (2005).
Sonesson, A. K. Possibilities for marker-assisted selection in aqua-culture breeding schemes. In: Marker-Assisted Selection: CurrentStatus and Future Application in Crops, Livestock, Forestry, andFish (E. Guimaraes, J. Ruane, B. Scherf, A. Sonnino, and J. Dargie,Eds.). Rome: FAO (2007).
Streisinger, G., F. Singer, C. Walker, D. Knauber, and N. Dower. Seg-regation analyses and gene-centromere distances in zebrafish. Ge-netics, 112: 311–319 (1986).
Sun, X. W., and L. Liang. Q. A genetic linkage map of common carp(Cyprinus carpio L.) and mapping of a locus associated with coldtolerance. Aquaculture, 238: 165–172 (2004).
Thorsen, J., B. L. Zhu, E. Frengen, K. Osoegawa, P. J. De Jong, B.F. Koop, W. S. Davidson, and B. Hoyheim. A highly redundantBAC library of Atlantic salmon (Salmo salar): An important toolfor salmon projects. BMC Genom., 6: 50 (2005).
Von Schalburg, K. R., M. L. Rise, G. A. Cooper, G. D. Brown, A.R. Gibbs, C. C. Nelson, W. S. Davidson, and B. F. Koop. Fish andchips: Various methodologies demonstrate utility of a 16,006-genesalmonid microarray. BMC Genom., 6: 126 (2005).
Waldbieser, G. C., B. G. Bosworth, D. J. Nonneman, and W. R. Wolters.A microsatellite-based genetic linkage map for channel catfish, Ic-talurus punctatus. Genetics, 158: 727–734 (2001).
Walker, S. J., Y. L. Wang, K. A. Grant, F. Chan, and G. M. Hellmann.Long versus short oligonucleotide microarrays for the study of gene
reviews in fisheries science vol. 16 S1 2008
Downloaded By: [Canario, Adelino] At: 21:13 15 September 2008
GENOMICS TOOLBOX FOR FARMED FISH 13
expression in nonhuman primates. J. Neurosci. Methods, 152: 179–189 (2006).
Wang, C. M., L. Lo, F. Feng, P. Gong, J. Li, Z. Zhu, G. Lin, and G.Yue. Construction of a BAC library and mapping BAC clones to thelinkage map of Barramundi, Lates calcarifer. BMC Genom., 9: 139(2008).
Wang, C. M., Z. Y. Zhu, L. C. Lo, F. Feng, G. Lin, W. T. Yang, J. Li,and G. H. Yue. A microsatellite linkage map of Barramundi, Latescalcarifer. Genetics, 175: 907–915 (2007).
Wardle, F. C., D. T. Odom, G. W. Bell, B. B. Yuan, T. W. Danford, E.L. Wiellette, E. Herbolsheimer, H. L. Sive, R. A. Young, and J. C.Smith. Zebrafish promoter microarrays identify actively transcribedembryonic genes. Genome Biol., 7: R71 (2006).
Wayne, M. L., and L. M. Mcintyre. Combining mapping and arraying:An approach to candidate gene identification. Proc. Natl. Acad. Sci.USA, 99: 14903–14906 (2002).
Weber, A. P. M., K. L. Weber, K. Carr, C. Wilkerson, and J. B. Ohlrogge.Sampling the arabidopsis transcriptome with massively parallel py-rosequencing. Plant Physiol., 144: 32–42 (2007).
Werner, F. A. O., G. Durstewitz, F. A. Habermann, G. Thaller, W.Kramer, S. Kollers, J. Buitkamp, M. Georges, G. Brem, J. Mosner,and R. Fries. Detection and characterization of SNPs useful for iden-tity control and parentage testing in major European dairy breeds.Anim. Genet., 35: 44–49 (2004).
Westgaard, J. I., T. Tafese, M. A. Wesmajervi, J. Stenvik, K. T. Fjalestad,B. Damsgard, and M. Delghandi. Identification and characterisationof thirteen new microsatellites for Atlantic cod (Gadus morhua L.)from a repeat-enriched library. Conserv. Genet., 8: 749–751 (2007).
Whitaker, H. A., B. J. Mcandrew, and J. B. Taggart. Constructionand characterization of a BAC library for the European sea bassDicentrarchus labrax. Anim. Genet., 37: 526–526 (2006).
Williams, T. D., A. M. Diab, S. G. George, R. E. Godfrey, V. Sabine,A. Conesa, S. D. Minchin, P. C. Watts, and J. K. Chipman. De-velopment of the GENIPOL European flounder (Platichthys flesus)microarray and determination of temporal transcriptional responsesto cadmium at low dose. Environ. Sci. Technol., 40: 6479–6488(2006).
Woram, R. A., C. Mcgowan, J. A. Stout, K. Gharbi, M. M. Ferguson,B. Hoyheim, E. A. Davidson, W. S. Davidson, C. Rexroad, and R.G. Danzmann. A genetic linkage map for Arctic char (Salvelinusalpinus): Evidence for higher recombination rates and segregationdistortion in hybrid versus pure strain mapping parents.Genome, 47:304–315 (2004).
Yue, G. H., M. Y. Ho, L. Orban, and J. Komen. Microsatellites withingenes and ESTs of common carp and their applicability in silvercrucian carp. Aquaculture, 234: 85–98 (2004).
Zane, L., L. Bargelloni, and T. Patarnello. Strategies for microsatelliteisolation: A review. Mol. Ecol., 11: 1–16 (2002).
Zhang, J. H., D. A. Wheeler, I. Yakub, S. Wei, R. Sood, W. Rowe, P. P.Liu, R. A. Gibbs, and K. H. Buetow. SNPdetector: A software toolfor sensitive and accurate SNP detection. PLoS Comput. Biol., 1:395–404 (2005).
Zimmerman, A. M., J. P. Evenhuis, G. H. Thorgaard, and S. S. Ris-tow. A single major chromosomal region controls natural killercell-like activity in rainbow trout. Immunogenetics, 55: 825–835(2004).
reviews in fisheries science vol. 16 S1 2008
Downloaded By: [Canario, Adelino] At: 21:13 15 September 2008