the role of growth hormone in growth, lipid homeostasis, energy utilization and partitioning in...
TRANSCRIPT

General and Comparative Endocrinology 175 (2012) 153–162
Contents lists available at SciVerse ScienceDirect
General and Comparative Endocrinology
journal homepage: www.elsevier .com/locate /ygcen
The role of growth hormone in growth, lipid homeostasis, energy utilizationand partitioning in rainbow trout: Interactions with leptin, ghrelinand insulin-like growth factor I
Peter Kling a, Elisabeth Jönsson a, Tom Ole Nilsen b, Ingibjörg Eir Einarsdottir a, Ivar Rønnestad b,Sigurd O. Stefansson b, Björn Thrandur Björnsson a,⇑a Department of Zoology/Zoophysiology, University of Gothenburg, Box 463, SE-405 30 Gothenburg, Swedenb Department of Biology, University of Bergen, N-5020 Bergen, Norway
a r t i c l e i n f o a b s t r a c t
Article history:Received 14 June 2011Revised 27 September 2011Accepted 31 October 2011Available online 10 November 2011
Keywords:AdiposityEnergy balanceGrowthLeptinGrowth hormoneRainbow trout
0016-6480/$ - see front matter � 2011 Elsevier Inc. Adoi:10.1016/j.ygcen.2011.10.014
Abbreviations: GH, growth hormone; IGF-I, insulleptin; LSI, liver somatic index; MSI, mesenteric somatFCE, feed conversion efficiency; SGR, specific growpolymerase chain reaction; RIA, radioimmunoassayweight.⇑ Corresponding author. Fax: +46 31 41 67 29.
E-mail address: [email protected] (B.
The growth-promoting effects of in vivo growth hormone (GH) treatment were studied in relation to sizeand lipid content of energy stores including liver, mesentery, white muscle and belly flap in rainbowtrout. In order to elucidate endocrine interactions and links to regulation of growth, adiposity and energymetabolism, plasma levels of GH, insulin-like growth factor I (IGF-I), leptin (Lep) and ghrelin, wereassessed and correlated to growth and energy status. In addition tissue-specific expression of lepa1 mRNAwas examined. Juvenile rainbow trout were implanted with sustained-release bovine GH implants andterminally sub-sampled at 1, 3 and 6 weeks. GH increased specific growth rate, reduced condition factor(CF) and increased feed conversion efficiency resulting in a redistribution of energy stores. Thus, GHdecreased mesenteric (MSI) and liver somatic index (LSI). Lipid content of the belly flap increased follow-ing GH-treatment while liver and muscle lipid content decreased. Independent of GH substantial growthwas accompanied by an increase in muscle lipids and a decrease in belly flap lipids. The data suggest thatthe belly flap may function as an energy buffering tissue during episodes of feeding and lean growth.Liver and muscle lipids were positively correlated to body weight, indicating a size-dependent changein adiposity. Hepatic lepa1 mRNA positively correlated to MSI and CF and its expression decreased follow-ing GH treatment, coinciding with decreased hepatic lipid content. Plasma Lep was positively correlatedto MSI and belly flap lipid content, suggesting that Lep may communicate energy status. In summary, theobserved GH tissue-specific effects on lipid metabolism in rainbow trout highlight the complex physiol-ogy of the energy reserves and their endocrine control.
� 2011 Elsevier Inc. All rights reserved.
1. Introduction large amounts of high-energy diets [68]. For anadromous salmo-
In fish as in other vertebrates, ingested and accumulated energyis the key to survival, growth and reproduction, with body fat nor-mally being the most important energy reserve. Such reservesallow fish, especially temperate and cold-water species to surviveprolonged (seasonal and episodic) periods of limited feed availabil-ity. The size of the body fat reserve is also thought to be a keyparameter for initiation of puberty in fish [31,72] well illustratedby the increased incidence of early maturation of farmed fish fed
ll rights reserved.
in-like growth factor I; Lep,ic index; CF, condition factor;th rate; QPCR, quantitative
; FL, fork length; BW, body
T. Björnsson).
nids, sufficient energy reserves are also essential for the long andstrenuous upstream migration they undertake to the spawninggrounds without active foraging. Concomitant to the migration,the female salmonid sexual maturation demands significantamounts of lipids to be mobilized and incorporated into theoocytes.
While energy storage is an important function of adipose tissue,it is becoming increasingly evident through mammalian researchthat adipose tissue has multiple and probably often, tissue-specificroles. Thus, the complex endocrine function of adipose tissue isbecoming increasingly evident [14], and in humans, the tissue-spe-cific distribution of fat has important health-related implications[17]. Teleost fish have various strategies to accumulate lipid re-serves, but broadly, fish are categorized as ‘‘lean’’ and ‘‘fatty’’, refer-ring to their muscle fat content. ‘‘Lean’’ fish such as e.g., theAtlantic cod, have a low muscle fat content of 1–2% [25], whilethe liver somatic index (LSI) is 7–9%, representing the major energy

154 P. Kling et al. / General and Comparative Endocrinology 175 (2012) 153–162
and lipid source [32]. In contrast, as other ‘‘fatty’’ fish, includingsalmonids have a relatively small liver (LSI around 1%), more mes-enteric fat than ‘‘lean’’ fish, and muscle fat content in the order of10–20% [1]. In particular, the ventral part of the body musculature,the belly flap, has especially high lipid content. In these fish adi-pose tissue in muscle and belly flap represent the major reservoirof fat and energy [50].
Feed intake in mammals as well as in fish has been suggested tobe under lipostatic control, a mechanism by which increased bodyadiposity results in decreased feed intake [28,63]. However, theendocrine components of such lipostatic control have not beencomprehensively elucidated. Growth hormone (GH) displays pluri-potency that includes a wide range of effects apart from the well-known growth stimulatory actions both in mammals and fish[5,21]. However, many of the actions of GH are thought to act viahepatic production and stimulation of insulin-like growth factor1 (IGF-I) release [20]. In fish as in other vertebrates, GH stimulateprotein synthesis evidenced as increased muscle synthesis in rain-bow trout [15] and increased availability of amino acids in tilapia,Oreochromis niloticus [41]. In vitro studies in rainbow trout hepato-cytes and sea bream adipose tissue show that GH induces liverlipid breakdown [3,54] and enhances circulating free fatty acid lev-els in vivo [39]. Such GH-induced protein accretion concomitantwith lipid mobilization causes GH-treated salmonids to adopt along and lean body shape [5].
Several endocrine factors are known to interact with lipidhomeostasis. Leptin (Lep) is a peptide hormone discovered inmouse [74], and in mammals found to be mainly released from adi-pose tissue acting as an adiposity signal to the brain, promotinganorexia [62,76]. In fish, data on Lep obtained by homologous toolsis still scarce. Lep treatment has short-term anorexic effects[42,49], but the long-term effects of Lep do not support an anorexicrole in fish, although long-term Lep treatment decreased growth inAtlantic salmon [48]. The role of Lep as a nutritional signal is notclear as plasma Lep levels increase during fasting of rainbow trout[36].
The peptide hormone ghrelin, which was originally described asa GH-secretagouge, promotes weight gain and adiposity in mam-mals [69]. Ghrelin treatment stimulates GH secretion in rainbowtrout [35], has an orexic effect in goldfish [45,71], but decreasesfood intake in rainbow trout [34], where ghrelin is positively cor-related to condition factor, growth rate, liver and muscle lipid con-tent, while negatively correlated to GH [33].
The aim of the present study was to elucidate how GH is linkedto tissue-specific energy metabolism and how GH-induced changesin growth, adiposity and energy balance may interact with otherpotential endocrine regulators of these processes; IGF-I, Lep andghrelin. Juvenile rainbow trout were treated with sustained-releasing bovine GH (bGH) implants and studied for 6 weeks. Theeffects of GH on growth, tissue-specific adiposity and lipid contentwere investigated and correlated to plasma IGF-I, ghrelin and Leplevels as well as tissue-specific Lep mRNA expression.
2. Materials and methods
2.1. Fish, holding conditions, experimental design, GH treatment andsampling
Juvenile rainbow trout were purchased from a local hatchery,Antens Laxodling AB, Sweden, and transported to the experimentalfacilities at the Department of Zoology, University of Gothenburg,Sweden. The fish were distributed into 12 0.5 m3 fiberglass tanks(14 fish per tank) supplied with recirculating, aerated fresh waterat 12 �C and exposed to a 12:12 LD photoperiod. During the accli-mation period, fish received commercial dry pellets containing 23%
lipids (Skretting, Norway) at 2% body weight (BW) day�1. At thestart of the experiment, this was adjusted to 1.5% BW day�1, aration which was fully consumed by the sham-treated group. Fromweek 3, with rapidly increasing fish size, the ration was furtheradjusted to 1.2% BW day�1. After a 1-week acclimation period,the experiment was initiated by randomly designating six tanksto be GH-treated and six tanks to be sham-treated. Animals weretreated in agreement with the European regulations of animal wel-fare (ETS No. 123, 01/01/91) and according to Swedish legislations(1988:534).
At the start of the experiment the fish were anaesthetized(2-phenoxyethanol using 0.3 ml L�1) and, a passive integratedtransponder (a PIT-tag) was inserted through the opening intothe body cavity using a PIT-tag injector to allow for individualidentification. Then a small incision was made in the body wall.Long-term, sustained-releasing implants of recombinant bovineGH (bGH) (Posilac�; Monsanto Co., St. Louis, MO, USA) or vehicle(sesame seed oil) was injected using a 250 ll positive displace-ment pipette (Microman, Eppendorf). GH-treated fish received0.6 mg bGH g�1 (1.4 ll g�1), while sham-treated fish received1.4 ll g�1 of vehicle. Similar GH-implant (1 mg bGH g�1) has beenfound to release bGH into the circulation of juvenile Atlantic sal-mon and stimulate growth for at least 3 months [52].
At each of the three samplings (after 1, 3 and 6 weeks), dupli-cate tanks of GH-treated and sham-treated fish were sampled, 12fish from each tank. During treatment (week 0) as well at eachsampling, fish were weighted (BW) to the nearest g and fork length(FL) to the nearest 0.1 cm. At each sampling, the fish were sacri-ficed with a blow to the head, measured and blood collected fromthe caudal vein using heparinised syringes and centrifuged at3000g and 4 �C for 5 min in order to obtain plasma. Plasma wasaliquoted for different assays, with one aliquot being acidized withHCl to a final concentration of 0.1 M for analyses of active (octa-noylated) plasma ghrelin [26]. All mesenteric fat, the liver, as wellas samples from white muscle (mid ventral part) and belly flap(ventral part) were dissected out and weighed. Plasma and tissues(for lipid analysis) were quickly frozen on dry ice, while tissues forLep mRNA analysis were snap frozen in liquid nitrogen. Sampleswere stored at �80 �C until analyzed.
2.2. RNA extraction, cDNA synthesis and qPCR analysis of lepa1 geneexpression
Total RNA was isolated from liver, muscle and belly flap by phe-nol–chloroform extraction using TRI Reagent� (Sigma, St. Louis,MO, USA) as outlined by Chomczynski [10]. The RNA quantityand integrity was determined using a ND-1000 spectrophotometer(NanoDrop Technologies, NC, USA) and the Agilent 2100 expertbioanalyzer (Agilent Technologies, USA), respectively. Total RNAwas treated with TURBO DNA-free™ kit (Ambion, Austin, TX,USA) and cDNA synthesized using 1.2 lg total RNA and oligod(T15) in conjunction the SuperScript III First-Strand SynthesisSystem for RT-PCR (Invitrogen, USA) as outlined by themanufacturers.
Leptin A1 (lepa1) and elongation factor 1 alpha (ef1a) mRNAlevels were measured using the Chromo4 Continuous FluorescenceDetector (Bio-Rad) and MJ Opticon Monitor Analysis Software plat-form (version 3.1, Bio-Rad). The following lepa1 and ef1a forwardand reverse primers were designed based on known sequencesfor lepa1 (GI: 225543246) in rainbow trout and ef1a (GI:185132715): lepa1 forward TTGCTCAAACCATGGTGATTAGGA andreverse GTCCATGCCCTCGATCAGGTTA and ef1a forward CCCCTCCA-GGATGTCTACAAAA and reverse CACACGGCCCACGGGTACT. Bothq-PCR assays were performed using 5 ll cDNA (300 ng RNA),300 nM of each primer and SYBR Green Universal Master mix(Applied Biosystems) in a total reaction volume of 25 ll. The

P. Kling et al. / General and Comparative Endocrinology 175 (2012) 153–162 155
thermal cycling protocol consisted of 2 min at 50 �C, 10 min at95 �C followed by 45 cycles at 95 �C for 15 s and 60 �C for 1 min.Melt curve analysis verified that the primer sets for each q-PCRassay generated one single product and no primer–dimer artifacts.In addition, representative PCR products were analyzed by gel elec-trophoresis, cloned and sequenced to verify specificity. Omission ofreverse transcriptase in the RT reaction resulted in no signal inboth assays, which demonstrated that interference from residualDNA in RNA samples after DNase treatment were not significant.Non-template controls were included on all plates. For both assays,twofold cDNA dilution series made from total RNA from liver, mus-cle and belly flap were used to determine amplification efficiencies(E) calculated as the slope from the plot of log RNA concentrationversus threshold cycle (Ct) values using the following formula:E = 10(�1/slope). This efficiency was used to correct for differencein amplification efficiency when calculating mRNA levels accordingto Pfaffl [57]. Lepa1 mRNA levels are presented as relative to theendogenous reference gene, ef1a, according to Olsvik and co-workers [55]. Expression of ef1a did not change over time or differbetween treatments. Trout lepa2 mRNA (Angotzi et al., unpub-lished) levels could not be quantified in a reliable and reproduciblemanner due to very low abundance of this transcript in the presentstudy.
2.3. Plasma hormone radioimmunoassay (RIA) analyses
Plasma GH levels were measured in a salmon GH RIA [8], mod-ified by Björnsson and co-workers [6]. Plasma IGF-I were measuredin extracted plasma [65] prior to RIA assay procedure establishedfor coho salmon [47]. Lep analyses were performed according toa homologous salmonid RIA protocol [36]. Plasma ghrelin wasanalyzed according to the N-ghrelin-RIA (active ghrelin) protocolas previously described [26,33].
2.4. Lipid analyses
Lipid content of liver, white muscle and belly flap was deter-mined gravimetrically according to Bligh and Dyer [7]. Briefly,homogenization of approximately 1 g tissue was followed bymethanol/chloroform extraction. The chloroform phase was thentransferred to preweighed tubes. The chloroform was allowed toevaporate under N2 (g) at 42 �C and the tubes were reweighed.Lipid content was calculated as % weight of the tissue analyzed.
2.5. Calculations and statistical analysis
Condition factor (CF) was calculated as (BW � FL�3)100. Specificgrowth rates for body weight (SGRW) and fork length (SGRL) weredetermined as (ln(BW2 � BW1)D�1)100 or as (ln(FL2 � FL1)D�1)100,where BW2 and FL2 represents final body weight and fork length,respectively, and BW1 and FL1 are initial body weight and forklength. D is the number of days between measurements [60]. Feedconversion efficiency (FCE) was assessed at the tank level (twotanks per treatment group) over three periods; 0–1 week,1–3 weeks and 3–6 weeks, respectively. FCE was calculated as ((to-tal tank BW2 � total tank BW1) � (total feed given to tank)�1)D�1.Liver somatic index (LSI) and mesenteric somatic index (MSI) werecalculated as % of BW. Differences in dependent variables were ana-lyzed in a two-way ANOVA according to general linear modelingusing treatment and time as fixed factors. Equal variances wereconfirmed by Levene’s test. When necessary, data were log-trans-formed to obtain homogenous variances. The effect of time wasanalyzed using one-way ANOVA. Linear correlation analyses ofendocrine and biometric data were carried out at the individuallevel using Pearson correlation analysis. Numerical values were
expressed as the mean ± SE. In all statistical tests, differences wereaccepted as statistically different at the level of p < 0.05.
3. Results
3.1. Size, growth, feed conversion and condition factor
At the start of experiment, the average BW (306 ± 5 g), FL(285 ± 1 mm) and CF (1.31 ± 0.01) did not differ among tanks. Bothsham- and GH-treated fish increased in BW and FL during thestudy, and CF of the GH-treated fish decreased (Fig. 1). GH-treatedfish had higher BW (Fig. 1A) and FL (Fig. 1B) than sham-treated fishfrom 1 week onwards, and the difference in BW and FL betweengroups increased throughout the experimental period. Thus, theBW of GH-treated fish increased from 311 ± 5 to 581 ± 14 g (87%increase) during the experimental period, while sham-treated fishincreased from 300 ± 5 to 440 ± 13 g (47% increase). The FL ofGH-treated fish increased from 286 ± 2 to 366 ± 4 mm during theexperimental period (28% increase), while sham-treated fishincreased from 284 ± 1 to 318 ± 4 mm (12% increase).
Specific growth rates for BW (SGRW) and FL (SGRL) were signif-icantly elevated for GH-treated fish (Table 1) over all three measur-ing periods. For SGRW, the increase compared with sham-treatedfish was 70% (0–1 week), 84% (1–3 weeks) and 29% (3–6 weeks),and corresponding values for SGRL were 103%, 130% and 80%.
Feed conversion efficiency (FCE) was calculated only at the tanklevel, and while the feeding regime (fed by hand twice daily) andration was designed to result in little or no uneaten pellets, therewere no pellet traps in place to verify this. Thus, caution is neededin the interpretation of the data, as any uneaten feed would resultin an underestimation of FCE. The GH-treated fish had higher FCEthan sham-treated fish throughout the study (Table 1), this being58.1% higher over week 0–1, 90.8% higher over weeks 1–3 and33.7% higher over weeks 3–6. CF did not differ significantlybetween the groups after 1 week, but after 3 and 6 weeks, CFwas lower for GH-treated fish than sham-treated fish (Fig. 1C).
3.2. Size and lipid content of energy-storing tissues
3.2.1. Mesenteric fatThere was a main effect of GH-treatment on the relative amount
of mesenteric fat expressed as mesenteric somatic index, MSI(Fig. 2A), being lower in GH-treated fish throughout the study.
3.2.2. LiverThere was a trend (p = 0.09) towards a decreased relative liver
size (LSI) following GH treatment (Fig. 2B). There was a main effectof time on LSI. In both sham- and GH-treated fish, there was atime-dependent decrease in LSI at 6 weeks compared with LSI at1 and 3 weeks. There was no overall effect of treatment on liverlipid content, although a tendency (p = 0.11) of GH to decrease liverlipid content. GH significantly decreased liver lipid content at3 weeks. There was a time-dependent increase in liver lipidcontent in both experimental groups peaking at 6 weeks.
3.2.3. MuscleMuscle lipid content was analyzed in white muscle as well as
the ventral belly flap (Fig. 2B). Although there was no main effectof GH treatment on white muscle lipid content (p = 0.059), therewas a tendency of decreased muscle lipid content followingGH-treatment at all time points. There was a main effect of timeon muscle lipid content, with muscle lipid content increasingtime-dependently in both sham- and GH-treated fish, peaking at6 weeks.

Fig. 1. (A) Body weight, (B) fork length and (C) condition factor of sham-treated (d)and GH-treated (s) rainbow trout over a 6-week study. Data were obtained from 24fish from each treatment and sampling point and presented as means ± SE.⁄⁄Indicate statistical differences between groups at the level of p < 0.01.
156 P. Kling et al. / General and Comparative Endocrinology 175 (2012) 153–162
3.2.4. Belly flapThe belly flap lipid content increased in both groups at 3 weeks
while it was reduced to initial levels after 6 weeks. In addition, GH
initially promoted enhanced lipid deposition in the belly flap. At1 week, there was a 39% higher belly flap lipid content in GH-trea-ted fish (23.7 ± 1.2%) compared with sham-treated fish (17.1 ±1.4%). The difference in belly flap lipid content decreased thereafterto 10.6% (GH treated 37.4 ± 3.3% versus control 33.8 ± 2.7%) at3 weeks, and at 6 weeks, the treatment-dependent difference wasabolished.
3.3. Plasma hormone levels
3.3.1. Plasma growth hormone levelsEndogenous plasma GH levels were strongly suppressed by
GH-treatment already after 1 week of treatment, and the suppres-sion persisted throughout the study (Fig. 1A).
3.3.2. Plasma insulin-like growth factor I levelsGH treatment significantly elevated IGF-I throughout the study
(Fig. 1B). There was a time-dependent decrease in IGF-I levels inGH-treated fish from 1 to 6 weeks, suggesting a gradual decreasein exogenous GH release during the experiment. Plasma IGF-Ilevels in sham-treated fish remained unchanged during theexperiment.
3.3.3. Plasma leptin levelsPlasma Lep levels were not affected by GH treatment (Fig. 3C).
However, there was a time-dependent increase in plasma Lep lev-els in sham-treated fish after 3 weeks, with and increase from910 ± 84 pM (1 week) to 1331 ± 175 pM (3 weeks).
3.3.4. Plasma ghrelin levelsPlasma ghrelin levels were not affected by GH treatment and
did not change during the course of the experiment (Fig. 3D).
3.4. QPCR analysis of lepa1 mRNA expression in energy storing tissue
There was a main effect of GH treatment on hepatic lepa1 mRNAexpression (Fig. 4A). Lepa1 levels in GH-treated fish were decreasedto 50%, 63% and 29% of that of hepatic lepa1 expression in sham-treated fish, at 1, 3 and 6 weeks, respectively. In addition to the ob-served GH-induced decrease in hepatic lepa1 expression, GH alsocaused a decrease in liver lipid content and LSI (Fig. 2). There wereno effects of time on hepatic lepa1 levels. Although no effect of GHtreatment on lepa1 expression in white muscle was observed, therewas a time-dependent decrease in lepa1 expression in bothGH- and sham-treated groups (Fig. 4B), concomitant with a time-dependent increase in muscle total lipid levels (Fig. 2B). Therewas no significant effect of time or treatment on lepa1 expressionin the belly flap (Fig. 4C).
3.5. Correlations between hormone levels, growth and tissue-specificlipids
Correlation analysis was carried out on endocrine parameters(IGF-I, Lep, ghrelin), growth (BW, FL, SGRW/L) and factors relatedto energy and nutritional status (CF, MSI, LSI, tissue-specific lipidcontent). In total, 38 significant correlations were identified (Table2). Plasma Lep levels correlated positively to both MSI and bellyflap lipid content. In addition there was a trend towards a positivecorrelation between plasma Lep levels and endogenous GH (datanot shown). Correlation of tissue-specific lepa1 expression revealedthat hepatic levels was positively correlated to energy-related fac-tors (CF and MSI), while negatively correlated to growth-relatedfactors (IGF-I, SGRL and FL). In contrast, lepa1 expression in whitemuscle was positively correlated to growth (SGRW/L and IGF-I),while negatively correlated to white muscle lipid content.

Table 1Specific growth rate (SGR) for body weight (BW) and fork length (FL), and feed conversion efficiency (FCE) of sham- and GH-treated rainbow trout over a 6-week study.
Time (weeks) Sham GH
SGRBW (%/day) SGRFL (%/day) FCE SGRBW (%/day) SGRFL (%/day) FCE
0–1 0.99 ± 0.07 0.25 ± 0.02 0.74 ± 0.06 1.72 ± 0.07* 0.52 ± 0.02* 1.17 ± 0.061–3 0.84 ± 0.07 0.29 ± 0.02 0.76 ± 0.08 1.55 ± 0.07* 0.66 ± 0.02* 1.45 ± 0.163–6 0.96 ± 0.06 0.30 ± 0.02 0.89 ± 0.10 1.24 ± 0.07* 0.54 ± 0.02* 1.19 ± 0.06
Data were obtained from 24 fish from each treatment and sampling point and presented as means ± SE.* Denotes statistical difference (p < 0.05) from corresponding sham-treated group.
Fig. 2. (A) Liver somatic index and mesenteric somatic index, and (B) lipid contentof liver, muscle and belly flap of sham-treated (d) and GH-treated (s) rainbowtrout over a 6-week study. Data were obtained from 12 fish from each treatmentand sampling point and presented as means ± SE. ⁄ and ⁄⁄Indicate statisticaldifferences between groups at the level of p < 0.05 and p < 0.01 respectively. Two-way ANOVA main effects and interaction of treatment and time are indicated bytext within each graph.
P. Kling et al. / General and Comparative Endocrinology 175 (2012) 153–162 157
Belly flap lipid content was positively correlated to both IGF-Iand SGRL, while negatively related to white muscle lipid content.White muscle lipid content was positively correlated to growth(BW, FL) and hepatic lipid content, while negatively correlated toIGF-I, LSI and belly flap lipids. In addition, there was a positive cor-relation between liver lipid content and BW. In addition, several
other parameters correlated to growth (BW, FL, SGRW/L) were iden-tified, as seen in Table 2.
4. Discussion
4.1. Effectiveness of the GH-treatment protocol
The significant growth-promoting effects of the sustained-releasing bGH treatment seen throughout the present study arein line with previous studies on several salmonid species includingAtlantic salmon [23,43,52], coho salmon [46] and brown trout[30,51]. In addition, the sustained suppression of endogenous GHplasma levels by the exogenous GH treatment confirms feed-backinhibition of GH on GH secretion, seen previously both in vivo[30,67] and in vitro [2]. Furthermore, the GH-treatment resultedin significant elevation of plasma IGF-I levels, in line with the reg-ulatory mechanism of GH-induced stimulation of hepatic IGF-Isecretion, as demonstrated earlier in shorter-term experimentson rainbow trout by Moriyama et al. [47]. Taken together, the sus-tained-release bGH implants appear to have been functionalthroughout the 6-week study.
4.2. Adiposity and tissue-specific GH effects
The study reveals complex dynamics among the energy/lipid-storing tissues. In the course of the 6-week feeding trial, thesham-treated rainbow trout gained 47% in weight, the belly flaplipid content increased transiently at 3 weeks, there was a steadyincrease in muscle lipid content, and a decrease in LSI. To someextent, it is likely that these changes are size-related, as musclelipid content may increase in salmonids with size/age as seen forAtlantic salmon in aquaculture [22]. GH appears to rapidly mobi-lize lipids from mesentery and to lesser extent from white muscleand liver, suggesting increased lipolysis and reallocation of energy,most likely for skeletal and muscle growth. It is notable, however,that some of the GH-induced mobilized lipids appear to be reallo-cated to the belly flap. The belly flap is the major lipid-depositingtissue in Atlantic salmon [75] and is therefore likely to serve asan important energy reserve, although the energy dynamics of thistissue have not received much attention. The lipid content profileof the belly flap in the present study, with increased lipid contentduring the first 3 weeks, and a decrease over the subsequent3 weeks, suggests that the belly flap may function as an energy-buffering tissue. During good feeding conditions, as during the firstpart of this study (ration of 1.5% BW day�1), energy is rapidly accu-mulated in the belly flap, most of which is then mobilized duringthe latter half of the study. This may be due to the slightly lowerration (1.2% BW day�1) during the last 3 weeks, but it also appearsplausible that the belly flap functions as an energy buffer in orderto sustain long-term growth during and after natural feeding epi-sodes, when energy intake can initially increase faster than leangrowth. In mammals, fat metabolic effects of GH preferentiallyinclude lipolysis in visceral adipose tissue [4], with a simultaneousincrease in triglyceride uptake in liver and skeletal muscle, through

Fig. 3. (A) Plasma growth hormone, (B) insulin-like growth factor I, (C) leptin and (D) ghrelin levels in sham-treated and GH-treated rainbow trout over a 6-week study. Datawere obtained from 24 fish from each treatment and sampling point and presented as means ± SE. ⁄⁄Indicate statistical differences between groups at the level of p < 0.01.
158 P. Kling et al. / General and Comparative Endocrinology 175 (2012) 153–162
the stimulation of lipoprotein lipase and hepatic lipase [56]. Thelipolytic action of GH in fish was first demonstrated in adipose tis-sue and liver in juvenile coho salmon in vivo activating lipolytic tri-acylglycerol lipase [64]. GH-induced lipolysis in isolated giltheadsea bream (Sparus aurata) adipocytes suggesting that GH can real-locate energy through direct action at the cellular level [3], butsome of the growth-promoting actions of GH are considered tobe indirect via IGF-I production [20]. The observed GH-dependentdecrease in adipose stores in the present study is in agreementwith the lipolytic action of GH in fish. In addition, the present studyprovides the first demonstration of an apparent GH-induced shiftof lipid allocation strategy among energy-storing tissues, withsite-specific lipolysis in visceral adipose tissue, liver and whitemuscle, coinciding with lipogenesis in belly flap. Although somedata exist, the mechanisms underlying such differentiated GH reg-ulation of different lipid stores remain largely unclear. Fasting isknown to elevate plasma GH levels in salmonids as other verte-brate species, and this is thought to be due to hepatic GH resistanceand the subsequent lack of negative feed-back by circulating IGF-I.This has been observed in chinook salmon and rainbow trout, andtaken to explain growth retardation during fasting [5,19,53,59]. Ithas been proposed that differential tissue-specific GH receptor
(GHR) gene expression may lead to differences in GH sensitivity,such that lowered hepatic expression may underlie impairedgrowth, while increased expression in visceral adipose tissuemay explain GH sensitivity and the lipolytic effects of fasting[53]. Hence, the differential effects of GH on energy-storing tissuesin the present study may be due to differences in GH sensitivity.Further studies are needed to quantify and characterize GHR andIGF-I receptor expression as well as elucidating tissue-specificactivities of lipolytic and lipogenic enzymes.
4.3. Growth and feed conversion efficiency
In spite of a large body of research demonstrating the growth-promoting effects of GH in salmonids, as in other vertebratespecies, there is a surprising lack of data explaining the mecha-nisms through which GH induces growth in salmonid fish [5].Two principal mechanisms are, however, likely to interact;increased appetite and feed intake, and improved food conversionefficiency. FCE represents in itself a complex suite of physiologicalprocesses in which ingested food is converted into tissue growth.In the present study, visual made observations during the twice-daily hand-feeding can characterize the much more active foraging
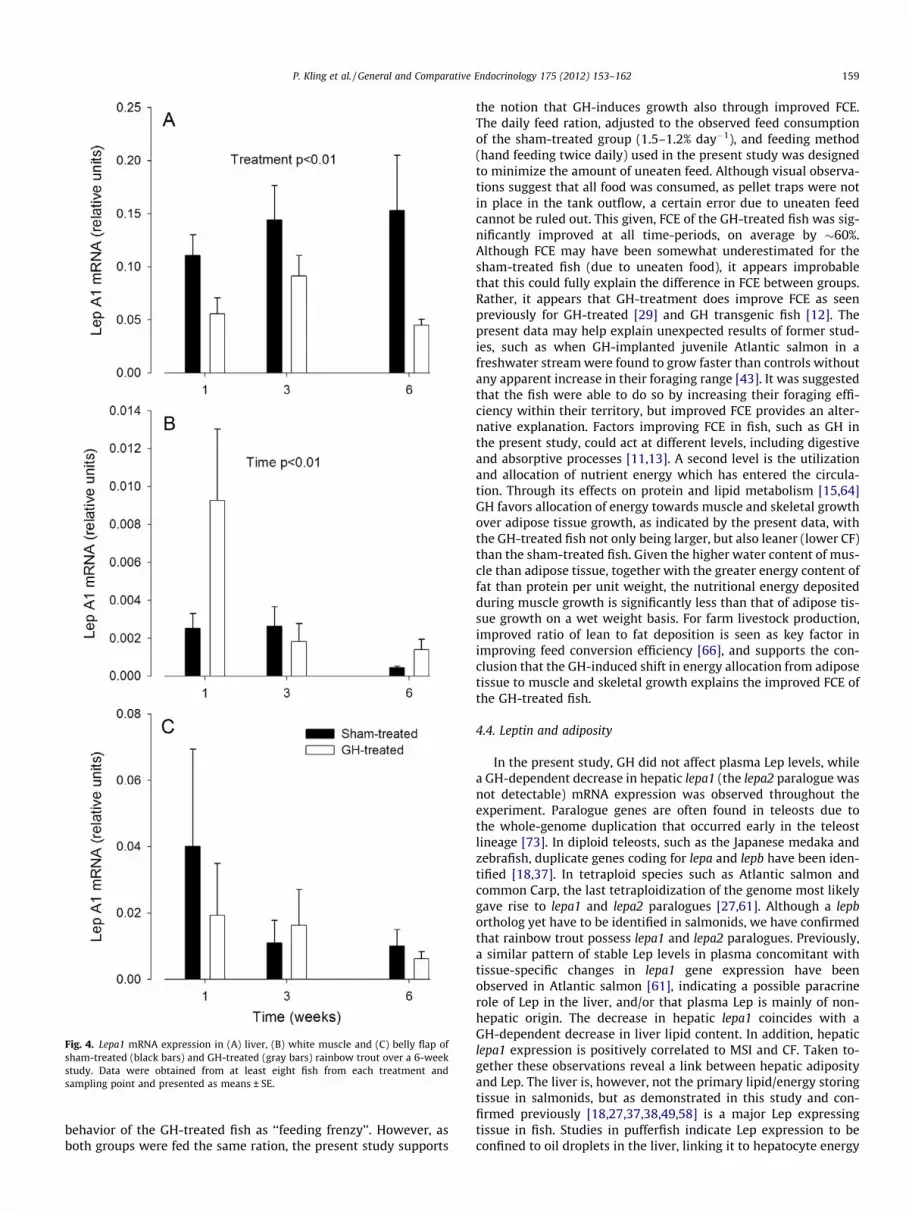
Fig. 4. Lepa1 mRNA expression in (A) liver, (B) white muscle and (C) belly flap ofsham-treated (black bars) and GH-treated (gray bars) rainbow trout over a 6-weekstudy. Data were obtained from at least eight fish from each treatment andsampling point and presented as means ± SE.
P. Kling et al. / General and Comparative Endocrinology 175 (2012) 153–162 159
behavior of the GH-treated fish as ‘‘feeding frenzy’’. However, asboth groups were fed the same ration, the present study supports
the notion that GH-induces growth also through improved FCE.The daily feed ration, adjusted to the observed feed consumptionof the sham-treated group (1.5–1.2% day�1), and feeding method(hand feeding twice daily) used in the present study was designedto minimize the amount of uneaten feed. Although visual observa-tions suggest that all food was consumed, as pellet traps were notin place in the tank outflow, a certain error due to uneaten feedcannot be ruled out. This given, FCE of the GH-treated fish was sig-nificantly improved at all time-periods, on average by �60%.Although FCE may have been somewhat underestimated for thesham-treated fish (due to uneaten food), it appears improbablethat this could fully explain the difference in FCE between groups.Rather, it appears that GH-treatment does improve FCE as seenpreviously for GH-treated [29] and GH transgenic fish [12]. Thepresent data may help explain unexpected results of former stud-ies, such as when GH-implanted juvenile Atlantic salmon in afreshwater stream were found to grow faster than controls withoutany apparent increase in their foraging range [43]. It was suggestedthat the fish were able to do so by increasing their foraging effi-ciency within their territory, but improved FCE provides an alter-native explanation. Factors improving FCE in fish, such as GH inthe present study, could act at different levels, including digestiveand absorptive processes [11,13]. A second level is the utilizationand allocation of nutrient energy which has entered the circula-tion. Through its effects on protein and lipid metabolism [15,64]GH favors allocation of energy towards muscle and skeletal growthover adipose tissue growth, as indicated by the present data, withthe GH-treated fish not only being larger, but also leaner (lower CF)than the sham-treated fish. Given the higher water content of mus-cle than adipose tissue, together with the greater energy content offat than protein per unit weight, the nutritional energy depositedduring muscle growth is significantly less than that of adipose tis-sue growth on a wet weight basis. For farm livestock production,improved ratio of lean to fat deposition is seen as key factor inimproving feed conversion efficiency [66], and supports the con-clusion that the GH-induced shift in energy allocation from adiposetissue to muscle and skeletal growth explains the improved FCE ofthe GH-treated fish.
4.4. Leptin and adiposity
In the present study, GH did not affect plasma Lep levels, whilea GH-dependent decrease in hepatic lepa1 (the lepa2 paralogue wasnot detectable) mRNA expression was observed throughout theexperiment. Paralogue genes are often found in teleosts due tothe whole-genome duplication that occurred early in the teleostlineage [73]. In diploid teleosts, such as the Japanese medaka andzebrafish, duplicate genes coding for lepa and lepb have been iden-tified [18,37]. In tetraploid species such as Atlantic salmon andcommon Carp, the last tetraploidization of the genome most likelygave rise to lepa1 and lepa2 paralogues [27,61]. Although a lepbortholog yet have to be identified in salmonids, we have confirmedthat rainbow trout possess lepa1 and lepa2 paralogues. Previously,a similar pattern of stable Lep levels in plasma concomitant withtissue-specific changes in lepa1 gene expression have beenobserved in Atlantic salmon [61], indicating a possible paracrinerole of Lep in the liver, and/or that plasma Lep is mainly of non-hepatic origin. The decrease in hepatic lepa1 coincides with aGH-dependent decrease in liver lipid content. In addition, hepaticlepa1 expression is positively correlated to MSI and CF. Taken to-gether these observations reveal a link between hepatic adiposityand Lep. The liver is, however, not the primary lipid/energy storingtissue in salmonids, but as demonstrated in this study and con-firmed previously [18,27,37,38,49,58] is a major Lep expressingtissue in fish. Studies in pufferfish indicate Lep expression to beconfined to oil droplets in the liver, linking it to hepatocyte energy

Table 2Over-all correlation analysis of leptin (Lep), insulin-like growth factor I (IGF), ghrelin, Lep A1 mRNA in liver (L), ventral muscle (VM) and belly flap (BF), body weight (BW), forklength (FL), mesenteric somatic index (MSI), liver somatic index (LSI), tissue lipids and specific growth rates (SGR) of sham- and GH-treated rainbow trout over the 6-week study.
Leptin IGF-I Ghrelin Lep 1mRNA(L)
Lep 1mRNA(VM)
Lep 1mRNA(BF)
BW FL CF MSI LSI Lipids(BF)
LipidsVM
Lipids(L)
SGRBW
IGF-I �0.057N 142
Ghrelin �0.009 0.149N 96 96
Lep 1 mRNA (L) �0.017 �0.279⁄ �0.231N 57 57 38
Lep 1 mRNA(VM)
�0.080 0.410⁄⁄ 0.124 �0.111
N 57 57 40 48
Lep 1 mRNA(BF)
�0.126 �0.70 0.190 0.088 �0.101
N 63 63 47 50 49
BW �0.009 0.080 0.109 �0.190 �0.088 �0.154N 142 142 96 57 57 63
FL �0.015 0.082 0.100 �0.242 �0.120 0.147 0.952⁄⁄
N 142 142 96 57 57 63 142
CF 0.010 0.023 �0.023 0.302⁄ 0.210 0.020 �0.120 �0.401⁄⁄
N 142 142 96 57 57 63 142 142
MSI 0.261⁄ �0.245⁄ �0.132 0.262⁄ �0.079 �0.060 �0.362⁄⁄ �0.444⁄⁄ 0.347⁄⁄
N 68 68 49 55 54 59 68 68 68
LSI 0.045 0.089 �0.087 �0.074 0.183 �0.051 �0.395⁄⁄ �0.373⁄⁄ 0.060 0.051N 69 69 50 55 55 60 69 69 69 66
Lipids (BF) 0.227⁄ 0.298⁄ 0.039 �0.001 0.030 �0.062 �0.121 �0.080 �0.047 0.067 0.176N 71 71 51 56 56 62 71 71 71 67 68
Lipids (VM) �0.080 �0.333⁄⁄ �0.059 0.062 �0.272⁄ 0.032 0.379⁄⁄ 0.321⁄⁄ 0.031 �0.037 �0.306⁄ �0.271⁄
N 72 72 52 57 57 63 72 72 72 68 69 71
Lipids (L) 0.021 �0.128 0.003 0.083 �0.017 �0.099 0.299⁄ 0.253⁄ 0.116 0.194 �0.262⁄ 0.037 0.251⁄
N 71 71 51 57 56 62 71 71 71 68 68 70 71
SGRBW �0.118 0.620⁄⁄ �0.027 �0.208 0.435⁄⁄ �0.008 0.246⁄⁄ 0.187⁄ 0.204 �0.219 0.082 0.103 �0.166 0.047N 142 142 96 57 57 63 142 142 142 68 69 71 72 71
SGRFL 0.013 0.717⁄⁄ 0.059 �0.308⁄ 0.360⁄⁄ �0.085 0.322⁄⁄ 0.351⁄⁄ �0.127 �0.293⁄ �0.031 0.347⁄⁄ �0.188 0.057 0.749⁄⁄
N 142 142 96 57 57 63 142 142 142 68 69 71 72 71 142
The Pearson correlation analysis was performed on merged data from both treatments and all sampling dates (1, 3 and 6 weeks). Statistically significant correlationcoefficients are shown in bold at the ⁄p < 0.05 and ⁄⁄p < 0.01 levels. N indicates the number of fish and varies with the total number of samples analyzed for each parameter.
160 P. Kling et al. / General and Comparative Endocrinology 175 (2012) 153–162
metabolism [38], but in Atlantic salmon, hepatic lepa1 expressionis not dependent on nutritional status [61]. Food restriction causesincreased hepatic lepa2 gene expression in Atlantic salmon [61],but in the present study, hepatic lepa2 mRNA expression wasbelow detection limits and can therefore not be correlated to nutri-tional status.
In the present study, white muscle exhibited the lowest lepa1expression, together with having the lowest lipid content of the tis-sues studied. Notably, there was a steady increase in muscle lipidcontent of both groups during the study, leading to a positive cor-relation between white muscle lipid content and BW. This is in linewith previous studies on farmed Atlantic salmon [22]. In addition,the observed positive correlation between white muscle lepa1mRNA expression and plasma IGF-I and SGRW/L suggest that Lepmay be linked to cell proliferation and growth rate. This is in sup-port with the findings by Rønnestad and co-workers [61] wherefull rationed feeding in Atlantic salmon revealed enhanced growthand higher lepa1 expression in the major lipid storing tissues (vis-cera and white muscle). In the present study, GH treatment did notaffect plasma Lep levels in the rainbow trout, but in mice, Lep con-trols somatotroph number and pituitary GH release, thereby indi-rectly controlling tissue-specific lipolysis and adiposity [9]. Inhumans, GH-deficiency leads to adiposity and elevated Lep levels[44]. Thus, despite the present data, functional GH–Lep interac-tions in fish need further attention.
In the present study, there is a positive correlation betweenenergy status and plasma Lep levels. Thus, lipid content of visceraladipose tissue (MSI) as well as of belly flap is positively correlatedto Lep levels. This indicates that Lep may have a role in communi-cating energy reserves in rainbow trout, in line with increasedlepa1 mRNA expression in major lipid-storing tissues of fully fedAtlantic salmon [61], and mammalian data, where Lep acts as ashort-term nutritional as well as a long-term adiposity signal[40,62]. On the other hand, no correlation between hepatic lepmRNA expression and nutritional status has been found in carp[27] and Arctic charr [16].
The apparent lack of correlation between tissue expression ofthe lep gene and plasma Lep levels observed in the present studyand in Atlantic salmon [61] underlines the fact that it is currentlynot known which tissues contribute and to which extent to the cir-culating peptide levels in fish. Such lack of correlation may suggestthat Lep can have paracrine functions, i.e. that the lep gene isexpressed in some tissues without this affecting plasma Lep levels.
GH treatment did not affect plasma ghrelin levels in the presentstudy, despite the fact that GH treated fish were leaner and hadless fat stores. This suggests that neither GH nor alterations inenergy stores influence ghrelin, at least not in the long term. Itcan be speculated that ghrelin has a more acute action in responseto energy balance changes, and that plasma levels of ghrelin arethen adjusted to their set-point. These results are in contrast to a

P. Kling et al. / General and Comparative Endocrinology 175 (2012) 153–162 161
previous study on fasting of rainbow trout where plasma ghrelinlevels decreased with fasting, correlated positively to CF, liverand muscle lipid content, and negatively with endogenous GH lev-els [33]. However, in that study, the fasting-induced changes inenergy stores were much more severe than in this study. Otherstudies in goldfish [70] and Atlantic salmon [24] showed that ghre-lin plasma levels vary with time of fasting so that an initial rapidresponse (days) is followed by a normalization and stabilizationof plasma ghrelin levels. This support that ghrelin has a moreshort- than long-term role in the regulation of energy metabolismduring fasting in fish. But further studies are needed to test thishypothesis, and to elucidate the functional relationships betweenghrelin, GH, adiposity and energy balance in fish.
5. Conclusions
The GH-induced changes in plasma GH and IGF-I levels recon-firm the established endocrine interaction of these hormones.The observed tissue-specific effects on lipid stores suggest thatGH affects lipid allocation with a shift from mesentery, liver andwhite muscle, to the belly flap. The functional significance of thisis not clear, but suggests that the belly flap may be of particularimportance for energy buffering during episodes of feed intakeand lean growth. The discrepant GH-effects on plasma Lep levelsand hepatic lepa1 mRNA expression may suggest a paracrine actionof hepatic Lep, and/or that circulating Lep is not of hepatic origin,but rather secreted from other (adipose?) tissues. Plasma Lep lev-els correlate positively with adipose stores indicating a role for Lepin energy signaling, but further studies are needed to investigatetissue-specific regulation of Lep secretion and LepR regulation inboth brain and periphery. GH treatment or GH-induced changesin energy stores do not seem to influence plasma ghrelin levelsin the long term, but further studies are needed to clarify the func-tional relationship between GH and ghrelin, and the role of ghrelinin growth and energy balance.
Acknowledgments
The authors thank Barbro Egnér for technical assistance with theGH and IGF-I RIAs and Lena Neregård for technical assistance withthe ghrelin-RIA and Rita Karlsen for assistance with the analysis oflepa1 mRNA. The authors also thank Andreas Kullgren, Lars Niklas-son, Fredrik Jutfelt and Henrik Sundh with help during tissue andplasma sampling. This study received funding from the SwedishResearch Council for Environment, Agricultural Sciences and SpatialPlanning (Formas Grant No. 223-2005-607) and the European Com-munity’s Seventh Framework Programme (FP7/2007-2013) underGrant agreement No. 222719 – LIFECYCLE.
References
[1] R.G. Ackman, Nutritional composition of fats in seafoods, Prog. Food Nutr. Sci.13 (1989) 161–289.
[2] T. Ágústsson, B.Th. Björnsson, Growth hormone inhibits growth hormonesecretion from the rainbow trout pituitary in vitro, Comp. Biochem. Physiol. C126 (2000) 299–303.
[3] A. Albalat, P. Gomez-Requeni, P. Rojas, F. Medale, S. Kaushik, G.J. Vianen, G. Vanden Thillart, J. Gutierrez, J. Perez-Sanchez, I. Navarro, Nutritional and hormonalcontrol of lipolysis in isolated gilthead seabream (Sparus aurata) adipocytes,Am. J. Physiol. 289 (2005) 259–265.
[4] D.E. Berryman, E.O. List, K.T. Coschigano, K. Behar, J.K. Kim, J.J. Kopchick,Comparing adiposity profiles in three mouse models with altered GH signaling,Growth Horm. IGF Res. 14 (2004) 309–318.
[5] B.Th. Björnsson, The biology of salmon growth hormone: from daylight todominance, Fish Physiol. Biochem. 17 (1997) 9–24.
[6] B.Th. Björnsson, G.L. Taranger, T. Hansen, S.O. Stefansson, C. Haux, Theinterrelation between photoperiod, growth hormone, and sexual maturationof adult Atlantic salmon (Salmo salar), Gen. Comp. Endocrinol. 93 (1994) 70–81.
[7] E.G. Bligh, W.J. Dyer, A rapid method of total lipid extraction and purification,Can. J. Biochem. Physiol. 37 (1959) 911–917.
[8] J.P. Bolton, A. Takahashi, H. Kawauchi, J. Kubota, T. Hirano, Development andvalidation of a salmon growth hormone radioimmunoassay, Gen. Comp.Endocrinol. 62 (1986) 230–238.
[9] G.V. Childs, N. Akhter, A. Haney, M. Syed, A. Odle, M. Cozart, Z. Brodrick, D.Gaddy, L.J. Suva, N. Akel, C. Crane, H. Benes, A. Charlesworth, R. Luque, S. Chua,R.D. Kineman, The somatotroph as a metabolic sensor: deletion of leptinreceptors causes obesity, Endocrinology 152 (2011) 69–81.
[10] P. Chomczynski, A reagent for the single-step simultaneous isolation of RNA,DNA and proteins from cell and tissue samples, Biotechniques 15 (1993) 532–537.
[11] N.L. Collie, J.J. Stevens, Hormonal effects on L-proline transport in coho salmon(Oncohynchus kisutch) intestine, Gen. Comp. Endocrinol. 59 (1985)399–409.
[12] J.T. Cook, M.A. McNiven, G.F. Richardson, A.M. Sutterlin, Growth rate, bodycomposition and feed digestibility/conversion of growth-enhanced transgenicAtlantic salmon (Salmo salar), Aquaculture 188 (2000) 15–32.
[13] A. Farmanfarmaian, L.Z. Sun, Growth hormone effects on essential amino acidabsorption, muscle amino acids profile, N-retention and nutritionalrequirements of striped bass hybrids, Genet. Anal. 15 (1999) 107–113.
[14] P. Fischer-Posovszky, M. Wabitsch, Z. Hochberg, Endocrinology of adiposetissue – an update, Horm. Metab. Res. 39 (2007) 314–321.
[15] A.R. Foster, D.F. Houlihan, C. Gray, F. Medale, B. Fauconneau, S.J. Kaushik, P.Y.Le Bail, The effects of ovine growth hormone on protein turnover rates inrainbow trout, Gen. Comp. Endocrinol. 82 (1991) 111–120.
[16] E. Froiland, K. Murashita, E.H. Jorgensen, T. Kurokawa, Leptin and ghrelin inanadromous Arctic charr: cloning and change in expressions during a seasonalfeeding cycle, Gen. Comp. Endocrinol. 165 (2010) 136–143.
[17] B.H. Goodpaster, Measuring body fat distribution and content in humans, Curr.Opin. Clin. Nutr. Metab. Care 5 (2002) 481–487.
[18] M. Gorissen, N.J. Bernier, S.B. Nabuurs, G. Flik, M.O. Huising, Two divergentleptin paralogues in zebrafish (Danio rerio) that originate early in teleosteanevolution, J. Endocrinol. 201 (2009) 329–339.
[19] E.S. Gray, K.M. Kelley, S. Law, R. Tsai, G. Young, H.A. Bern, Regulation of hepaticgrowth hormone receptors in coho salmon (Oncorhynchus kisutch), Gen. Comp.Endocrinol. 88 (1992) 243–252.
[20] H. Green, M. Morikawa, T. Nixon, A dual Effector theory of growth-hormoneaction, Differentiation 29 (1985) 195–198.
[21] S. Harvey, C.G. Scanes, W.H. Daughaday, Growth Hormone: Basic, Clinical andApplied Aspects, Boca CRC Press, Boca Raton, 1995.
[22] G.I. Hemre, K. Sandnes, Effect of dietary lipid level on muscle composition inAtlantic salmon, Salmo salar, Aquacult. Nutr. 5 (1999) 9–16.
[23] N.A. Herbert, J.D. Armstrong, B.Th. Björnsson, Evidence that growth hormone-induced elevation in routine metabolism of juvenile Atlantic salmon as a resultof increased spontaneous activity, J. Fish Biol. 59 (2001) 754–757.
[24] E.M. Hevroy, C. Azpeleta, M. Shimizu, A. Lanzen, H. Kaiya, M. Espe, P.A. Olsvik,Effects of short-term starvation on ghrelin, GH-IGF system, and IGF-bindingproteins in Atlantic salmon, Fish Physiol. Biochem. 37 (2011)217–232.
[25] D.A. Holdway, F.W.H. Beamish, Specific growth rate and proximate bodycomposition of Atlantic cod (Gadus morhua L.), J. Exp. Mar. Biol. Ecol. 81 (1984)147–170.
[26] H. Hosoda, M. Kojima, H. Matsuo, K. Kangawa, Ghrelin and des-acyl ghrelin:two major forms of rat ghrelin peptide in gastrointestinal tissue, Biochem.Biophys. Res. Commun. 279 (2000) 909–913.
[27] M.O. Huising, E.J.W. Geven, C.P. Kruiswijk, S.B. Nabuurs, E.H. Stolte, F.A.T.Spanings, B.M.L. Verburg-van Kemenade, G. Flik, Increased leptin expression incommon carp (Cyprinus carpio) after food intake but not after fasting orfeeding to satiation, Endocrinology 147 (2006) 5786–5797.
[28] S.J.S. Johansen, M. Ekli, M. Jobling, Is there lipostatic regulation of feed intakein Atlantic salmon (Salmo salar)?, Aquacult Res. 33 (2002) 515–524.
[29] J.I. Johnsson, B.Th. Björnsson, Growth hormone increases growth rate, appetiteand dominance in juvenile rainbow trout, Oncorhynchus mykiss, Anim. Behav.48 (1994) 177–186.
[30] J.I. Johnsson, E. Pettersson, E. Jönsson, T. Järvi, B.Th. Björnsson, Growthhormone-induced effects on mortality, energy status and growth: a field studyon brown trout (Salmo trutta), Funct. Ecol. 13 (1999) 514–522.
[31] B. Jonsson, N. Jonsson, Lipid energy reserves influence life-history decision ofAtlantic salmon (Salmo salar) and brown trout (Salmo trutta) in fresh water,Ecol. Freshwater Fish. 14 (2005) 296–301.
[32] C. Jørgensen, B. Ernande, Ø. Fiksen, U. Dieckmann, The logic of skippedspawning in fish, Can. J. Fish. Aquat. Sci. 63 (2006) 200–211.
[33] E. Jönsson, A. Forsman, I.E. Einarsdottir, H. Kaiya, K. Ruohonen, B.Th. Björnsson,Plasma ghrelin levels in rainbow trout in response to fasting, feeding and foodcomposition, and effects of ghrelin on voluntary food intake, Comp. Biochem.Physiol. A 147 (2007) 1116–1124.
[34] E. Jönsson, H. Kaiya, B.Th. Björnsson, Ghrelin decreases food intake in juvenilerainbow trout (Oncorhynchus mykiss) through the central anorexigeniccorticotropin-releasing factor system, Gen. Comp. Endocrinol. 166 (2010) 39–46.
[35] H. Kaiya, M. Kojima, H. Hosoda, S. Moriyama, A. Takahashi, H. Kawauchi, K.Kangawa, Peptide purification, complementary deoxyribonucleic acid (DNA)and genomic DNA cloning, and functional characterization of ghrelin inrainbow trout, Endocrinology 144 (2003) 5215–5226.
[36] P. Kling, I. Rønnestad, S.O. Stefansson, K. Murashita, T. Kurokawa, B.Th.Björnsson, A homologous salmonid leptin radioimmunoassay indicates

162 P. Kling et al. / General and Comparative Endocrinology 175 (2012) 153–162
elevated plasma leptin levels during fasting of rainbow trout, Gen. Comp.Endocrinol. 162 (2009) 307–312.
[37] T. Kurokawa, K. Murashita, Genomic characterization of multiple leptin genesand a leptin receptor gene in the Japanese medaka, Oryzias latipes, Gen. Comp.Endocrinol. 161 (2009) 229–237.
[38] T. Kurokawa, S. Uji, T. Suzuki, Identification of cDNA coding for a homologue tomammalian leptin from pufferfish, Takifugu rubripes, Peptides 26 (2005) 745–750.
[39] J.F. Leatherland, R.N. Nuti, Effects of bovine growth hormone on plasma freefatty-acid concentrations and liver and muscle carcass lipid content inrainbow trout Salmo gairdneri, J. Fish Biol. 19 (1981) 487–498.
[40] M.J. Lee, S.K. Fried, Integration of hormonal and nutrient signals that regulateleptin synthesis and secretion, Am. J. Physiol. Endocrinol. Metab. 296 (2009)E1230–E1238.
[41] T.C. Leung, T.B. Ng, N.Y.S. Woo, Metabolic effects of bovine growth hormone inthe tilapia Oreochromis mossambicus, Comp. Biochem. Physiol. A 99 (1991)633–636.
[42] G.-G. Li, X.-F. Liang, Q. Xie, G. Li, Y. Yu, K. Lai, Gene structure, recombinantexpression and functional characterisation of grass carp leptin, Gen. Comp.Endocrinol. 166 (2010) 117–127.
[43] K.M. Martin-Smith, J.D. Armstrong, J.I. Johnsson, B.Th. Björnsson, Growthhormone increases growth and dominance of wild juvenile Atlantic salmonwithout affecting space use, J. Fish Biol. 65 (2004) 156–172.
[44] P. Marzullo, C. Buckway, K.L. Pratt, A. Colao, J. Guevara-Aguirre, R.G. Rosenfeld,Leptin concentrations in GH deficiency: the effect of GH insensitivity, J. Clin.Endocrinol. Metab. 87 (2002) 540–545.
[45] K. Matsuda, T. Miura, H. Kaiya, K. Maruyama, S. Shimakura, M. Uchiyama, K.Kangawa, S. Shioda, Regulation of food intake by acyl and des-acyl ghrelins inthe goldfish, Peptides 27 (2006) 2321–2325.
[46] E. McLean, R.H. Devlin, J.C. Byatt, W.C. Clarke, E.M. Donaldson, Impact of acontrolled release formulation of recombinant bovine growth hormone upongrowth and seawater adaptation in coho (Oncorhynchus kisutch) and chinooksalmon (Oncorhynchus tshawytscha), Aquaculture 156 (1997) 113–128.
[47] S. Moriyama, P. Swanson, M. Nishii, A. Takahashi, H. Kawauchi, W.W. Dickhoff,E.M. Plisetskaya, Development of a homologous radioimmunoassay for cohosalmon insulin-like growth factor-I, Gen. Comp. Endocrinol. 96 (1994) 149–161.
[48] K. Murashita, A.E. Jordal, T.O. Nilsen, S.O. Stefansson, T. Kurokawa, B.Th.Björnsson, A.G. Moen, I. Rønnestad, Leptin reduces Atlantic salmon growththrough the central pro-opiomelanocortin pathway, Comp. Biochem. Physiol.A 158 (2011) 79–86.
[49] K. Murashita, S. Uji, T. Yamamoto, I. Rønnestad, T. Kurokawa, Production ofrecombinant leptin and its effects on food intake in rainbow trout(Oncorhynchus mykiss), Comp. Biochem. Physiol. B 150 (2008) 377–384.
[50] D.A. Nanton, A. Vegusdal, A.M.B. Rørå, B. Ruyter, G. Baeverfjord, B.E.Torstensen, Muscle lipid storage pattern, composition, and adipocytedistribution in different parts of Atlantic salmon (Salmo Salar) fed fish oiland vegetable oil, Aquaculture 265 (2007) 230–243.
[51] L. Neregård, L. Sundt-Hansen, B.Th. Björnsson, J.L. Johnsson, Growth hormoneaffects behaviour of wild brown trout Salmo trutta in territorial owner–intruder conflicts, J. Fish Biol. 73 (2008) 2341–2351.
[52] L. Neregård, L. Sundt-Hansen, K. Hindar, S. Einum, J.I. Johnsson, R.H. Devlin, I.A.Fleming, B.Th.B. Björnsson, Wild Atlantic salmon Salmo salar L. strains havegreater growth potential than a domesticated strain selected for fast growth, J.Fish Biol. 73 (2008) 79–95.
[53] L.A. Norbeck, J.D. Kittilson, M.A. Sheridan, Resolving the growth-promotingand metabolic effects of growth hormone: differential regulation of GH-IGF-Isystem components, Gen. Comp. Endocrinol. 151 (2007) 332–341.
[54] P.K. O’Connor, B. Reich, M.A. Sheridan, Growth hormone stimulates hepaticlipid mobilisation in rainbow trout, Oncorhyncus mykiss, Comp. Biochem.Physiol. B 163 (1993) 427–431.
[55] P.A. Olsvik, K.K. Lie, A.E. Jordal, T.O. Nilsen, I. Hordvik, Evaluation of potentialreference genes in real-time RT-PCR studies of Atlantic salmon, BMC Mol. Biol.6 (2005) 21.
[56] J. Oscarsson, M. Ottosson, S. Eden, Effects of growth hormone on lipoproteinlipase and hepatic lipase, J. Endocrinol. Invest. 22 (1999) 2–9.
[57] M. Pfaffl, Quantification strategies in real-time PCR, in: S.A. Bustin (Ed.), A–Z ofQuantitative PCR, International University Line, La Jolla, 2004, pp. 87–112.
[58] B. Pfundt, H. Sauerwein, M. Mielenz, Leptin mRNA and proteinimmunoreactivity in adipose tissue and liver of rainbow trout (Oncorhynchusmykiss) and immunohistochemical localization in liver, Anat. Hist. Embryol. 38(2009) 406–410.
[59] A.L. Pierce, M. Shimizu, B.R. Beckman, D.M. Baker, W.W. Dickhoff, Time courseof the GH/IGF axis response to fasting and increased ration in chinook salmon(Oncorhynchus tshawytscha), Gen. Comp. Endocrinol. 140 (2005) 192–202.
[60] W.E. Ricker, Growth rates and models, in: W.S. Hoar, D.J. Randall, J.R. Brett(Eds.), Fish Physiology, vol. VIII, Academic Press, New York, 1979, pp. 677–742.
[61] I. Rønnestad, T.O. Nilsen, K. Murashita, A.R. Angotzi, A.G. Gamst Moen, S.O.Stefansson, P. Kling, B.Th. Björnsson, T. Kurokawa, Leptin and leptin receptorgenes in Atlantic salmon: cloning, phylogeny, tissue distribution andexpression correlated to long-term feeding status, Gen. Comp. Endocrinol.168 (2010) 55–70.
[62] R. Saladin, P. De Vos, M. Guerre-Millo, A. Leturque, J. Girard, B. Staels, J.Auwerx, Transient increase in obese gene expression after food intake orinsulin administration, Nature 377 (1995) 527–529.
[63] K.D. Shearer, J.T. Silverstein, E.M. Plisetskaya, Role of adiposity in food intakecontrol of juvenile chinook salmon (Oncorhyncus tsawytscha), Comp. Biochem.Physiol. A 118 (1997) (1997) 1209–1215.
[64] M.A. Sheridan, Effects of thyroxin, cortisol, growth hormone, and prolactin onlipid metabolism of coho salmon, Oncorhynchus kisutch, during smoltification,Gen. Comp. Endocrinol. 64 (1986) 220–238.
[65] M.P. Shimizu, P. Swanson, H. Fukada, A. Hara, W.W. Dickhoff, Comparison ofextraction methods and assay validation for salmon insulin-like growth factor-I using commercially available components, Gen. Comp. Endocrinol. 119(2000) 26–36.
[66] M.N. Sillence, Technologies for the control of fat and lean deposition inlivestock, Vet. J. 167 (2004) 242–257.
[67] L. Sundt-Hansen, L. Neregård, S. Einum, J. Höjesjö, B.Th. Björnsson, K. Hindar, F.Økland, J.I. Johnsson, Growth enhanced brown trout show increasedmovement activity in the wild, Funct. Ecol. 23 (2009) 551–558.
[68] G.L. Taranger, M. Carrillo, R.W. Schulz, P. Fontaine, S. Zanuy, A. Felip, F.A.Weltzien, S. Dufour, O. Karlsen, B. Norberg, E. Andersson, T. Hansen, Control ofpuberty in farmed fish, Gen. Comp. Endocrinol. 165 (2010) 483–515.
[69] M. Tschop, D.L. Smiley, M.L. Heiman, Ghrelin induces adiposity in rodents,Nature 407 (2000) 908–913.
[70] S. Unniappan, L.F. Canosa, R.E. Peter, Orexigenic actions of ghrelin in goldfish:feeding-induced changes in brain and gut mRNA expression and serum levels,and responses to central and peripheral injections, Neuroendocrinology 79(2004) 100–108.
[71] S. Unniappan, X. Lin, L. Cervini, J. Rivier, H. Kaiya, K. Kangawa, R.E. Peter,Goldfish ghrelin: molecular characterization of the complementarydeoxyribonucleic acid, partial gene structure and evidence for itsstimulatory role in food intake, Endocrinology 143 (2002) 4143–4146.
[72] G. van den Thillart, G. Vianen, J. Zaagsma, Adrenergic regulation of lipidmobilization in fishes; a possible role in hypoxia survival, Fish Physiol.Biochem. 27 (2002) 189–204.
[73] J.N. Volff, Genome evolution and biodiversity in teleost fish, Heredity 94(2005) 280–294.
[74] Y. Zhang, R. Proenca, M. Maffei, M. Barone, L. Leopold, J.M. Friedman, Positionalcloning of the mouse obese gene and its human homologue, Nature 372 (1994)425–432.
[75] S. Zhou, R.G. Ackman, C. Morrison, Adipocytes and lipid distribution in themuscle tissue of Atlantic salmon (Salmo salar), Can. J. Fish. Aquat. Sci. 53 (1996)326–332.
[76] J.M. Zigman, J.K. Elmquist, Minireview: from anorexia to obesity – the yin andyang of body weight control, Endocrinology 144 (2003) 3749–3756.