the molecular organization of nerve membranes
TRANSCRIPT
J. Membrane Biol. 9, 209--228 (1972) �9 by Springer-Verlag New York Inc. 1972
The Molecular Organization of Nerve Membranes
VI. T h e S e p a r a t i o n of A x o l e m m a f r o m S c h w a n n Cel l M e m b r a n e s
of G i a n t a n d R e t i n a l S q u i d A x o n s b y D e n s i t y G r a d i e n t
C e n t r i f u g a t i o n
D i t a M a r c u s , M i t z y C a n e s s a - F i s c h e r ,
G u i d o Z a m p i g h i , a n d S i e g m u n d F i s c h e r
Department of Physiology and Biophysics, Faculty of Medicine, and Department of Biology, Faculty of Sciences, University of Chile,
Casilla 6635, Santiago 4, Chile
Received 13 December 1971
Summary. Plasma membranes were isolated from two types of squid nerves which have morphologically, different ratios of axolemma/Schwannlemma (A/S). These mem- branes were studied by means of differential and density gradient centrifugation.
Thoroughly dissected giant axons were used as membrane source having low A/S ratio. Retinal fibers were used as membrane source with high A/S ratio. A similar pro- cedure for the isolation of the plasma membranes was used for both types of squid axons.
Differential centrifugation showed that at 1,500 x g, the yield of membrane enzymes (Na, K-ATPase and NADH-ferricyanide oxidoreductase) from giant axon homogenates was 2 to 5 times greater than from retinal nerve homogenates, but at 105,000 x g the opposite was the case, the yield from retinal axons being about two times greater. Thus, the major part of the membrane material from the retinal nerve seems to be less dense than the membrane material from giant axons.
The behavior of the 105,000 x g fraction from both types of fibers was studied by determining protein, Na, K-ATPase, and NADH-oxidoreductase along a lineal sucrose gradient (10 to 40 % ; centrifuged at 40,600 • g for 90 min). By any of the three measure- ments, retinal axons yielded a greater amount (2:1) of plasma membranes sedimenting at low sucrose concentration (16 to 25 %) as compared to that observed at high sucrose concentration (35 to 38 %). Giant axons, on the contrary, yielded a higher proport ion of membranes (2.5:1) sedimenting at high sucrose concentrations (over 40 %).
The experimental data indicate that a different cellular origin can account for the behavior of nerve membranes along lineal gradient centrifugation. The membranes Floating at low sucrose concentration ("l ight membranes") can be tentatively ascribed to the axolemma; the membranes found at high sucrose concentration ("heavy mem- branes") to the Schwannlemma and basement membranes.
In accord with their high A/S morphological ratio, squid retinal axons yielded 5 times more light membranes (axolemma) than dissected giant axons.
15 J. Membrane Biol. 9
210 D. Marcus et al. :
We have recently reported that squid retinal nerves can be used to isolate an axolemma-rich preparation owing to their high ratio of axonal to Schwann cell surface membranes [3, 4]. Since it is well known that unmyelinated fibers are enveloped by a Schwann cell and fibrous tissue, a plasma membrane fraction is likely to contain a mixture of "axolemma" and" Schwannlemma" and internal membranes. The term "axolemma" (A) is used here for the surface cell membrane of an axon; the term "Schwann- lemma" (S) is used for the surface membrane of the Schwann cell.
Fischer, Cellino, Zambrano, Zampighi, T611ez-Nagel, Marcus, and Canessa-Fischer [4] reported that sucrose gradient contrifugation of the plasma membrane fraction permitted the separation of two chemically different types of plasma membranes. To explain these findings it was postulated that their cellular origin were different; by several chemical, enzymic and ultrastructural criteria it was concluded that endoplasmic reticulum could not contribute significantly to the heterogeneity of the plasma membrane fraction.
It was considered necessary to study the fate of both types of surface membranes when nerve homogenate are submitted to differential and den- sity gradient centrifugation. The problem was approached by comparing the profile of membrane obtained from nerve fibers which exhibited dif- ferent "axolemma/Schwannlemma" (A/S) morphological ratio.
A great deal of electron-microscopic studies have been made on the giant nerve fibers from several species of squid [1, 5, 10]. Investigation of the ultrastructure of axons from Dosidicus gigas carried out by Villegas [8] stated that the Schwann layer is formed by a single row of Schwann cells
crossed by channels. The tortuosity of these channels greatly increase the surface of the Schwann cell plasma membrane, as shown in that report. Therefore, the morphological features of giant axons are very unfavorable for axolemma and the A/S ratio should be below one.
In the retinal nerves of the squid, the relation between the Schwann cells and the axons is different. Each bundle contains approximately 10 unmyelinated axons enclosed by one layer of Schwann cell membrane. The amount of excitable membrane turns out to be 5 times higher than mem- branes from the enveloping cells. Hence, based only on morphological grounds, it can be stated that the A/S ratio in retinal nerves must be inverted in the giant axons.
The present communication reports experiments designed to compare the distribution of cell membranes from giant and retinal Dosidicus axons on density gradient centrifugation.
Separation of Squid Nerve Membranes 211
The d a t a s u p p o r t the s t a r t i ng hypo thes i s t ha t f r o m these d i f fe ren t types
of nerves , two chemica l ly d i f fe ren t types of m e m b r a n e s c ou l d be separa ted
in inverse p r o p o r t i o n s .
The e x p e r i m e n t a l d a t a ind ica te t ha t the m e m b r a n e s i so la ted f r o m re t ina l
a x o n s f l oa t i ng at low sucrose dens i t i es are f o r m e d m a i n l y by the a x o l e m m a .
Materials and Methods
The squid, Dosidieus gigas, were caught and killed a few miles offshore from Monte- mar, Chile. Fishing and laboratory facilities of the Laboratorio de Fisiologia Celular were used. Within 2 hr of capture of the animal the eyes and nerve trunks containing the first stellar nerves were removed and placed in ice-cold artificial seawater. The retinal axons were dissected out in 0.75 M sucrose as described elsewhere [4] and stored in this solution at --20 ~ up to 10 days. Under appropriate illumination, the giant axons were carefully dissected from the nerve trunk in cold artificial seawater and thoroughly cleaned of connective tissue and small nerve fibers. They were tied at both ends and the excitability was measured by recording action potential with external electrodes. This precaution was important to detect and to discard biological material collected in bad conditions. Such material usually yielded very low specific activities for membrane- bound enzymes. Afterwards, the axons were washed in 0.75 M sucrose and used immedi- ately or kept at --20 ~ not more than 10 days.
Isolation and Purification of Plasma Membranes
Plasma membranes were prepared from 10-g wet weight of retinal nerve as described by Fischer et al. [4].
A similar procedure was used to isolate membranes from giant axons. Cleaned axons were rinsed in 0.25 M sucrose, 10 mM Tris-EDTA, pH 7.5 (SE) and finely cut with scissors. Between 50 and 100 giant axons were homogenized in 10 ml of 0.25 M sucrose, 5 mM Tris-EDTA, and 30 mM histidine, pH 7.4 (SEH) using a motor driven glass-glass homogenizer in the presence of acid-washed glass beads (150- to 200-/a diameter). Soni- cation was performed at 20-kc output for 20 sec (Bronwill Biosonic B sonicator). The suspension was spun for 10 rain at 1,500 • in a Sorvall refrigerated centrifuge, and the supernatant was spun twice at 10,000 • for 20 rain. To obtain the finaI membrane fraction, the last supernatant was centrifuged for 90 min at 105,000 x g in a rotor 40 in a Spinco L ultracentrifuge. The pellet was resuspended twice by gentle homogenization with a Teflon homogenizer in 0.25 M sucrose, 30 mM Tris-chloride, 1 mM EDTA, pH 7.4 (SET) and centrifuged for 60 min at 105,000 • g. The final pellets were resuspended in 1.5 ml of 30 mM Tris-chloride, 1 mM EDTA, pH 7.4 (F-100). The whole procedure was performed at 2 ~
Linear gradients were established between 10 and 40% sucrose containing 30 mM Tris-chloride, 1 mM EDTA, pH 7.4. A fraction of 0.5 ml of 50% sucrose was added as a cushion; 0.6 ml of F-100 from giant axons containing about 0.5 to 0.9 nag of protein was placed on the pre-equilibrated gradient and centrifuged for 90 rain at 22,500 rpm in an SW-39 rotor at a temperature setting of 22 ~ in the Spinco L ultracentrifuge. Fractions of 0.3 to 0.5 ml were collected in pre-cooled tubes by a Sigma motor pump, and the optical density was measured at 280 nm in a Unicam spectrophotometer. The linearity of the gradient was checked routinely by measurements of the refractive index.
15"
212 D. Marcus et al. :
Samples of 0.6 ml of F-100 from retinal axons containing about 2 to 5 mg of protein were placed in identical gradients in the SW-25 rotor and centrifuged for 90 rain at 20,000 rpm.
Enzymic Assays
The Na, K-ATPase was assayed at 37 ~ in duplicates and in a final volume of 1 ml containing: (ms) Tris-chloride 160 (pH 8.5), Tris-ATP 2; MgCI 2 4; NaC1 160; KC1 40; ouabain 0.2. The membrane fractions were pre-incubated 10 rain with the ion mixture at 37 ~ before addition of ATP. The reaction was stopped after 10 to 30 rain of in- cubation with acid ammonium molybdate used for the analysis of inorganic phosphate.
The amount of protein used was such that no more than 25 % of the substrate was hydrolyzed during the incubation period. 60 to 100 lag of F-100 protein from giant axons and 20 gg from retinal axons were used, suspended in 0.05 ml of 30 mM Tris-chloride, 1 mM EDTA (pH 7.4). The nonenzymic hydrolysis of ATP was measured in each experi- ment. Care was taken not to denature the membrane enzymes by dilution.
When F-100 from giant axons was resolved by gradient centrifugation, aliquots of 0.05 ml were used to measure the phosphate released in the presence of (Mg + Na + K) and (Mg + Na + K + ouabain), as described above. The reaction was stopped by 1 ml of cold 5 % ammonium molybdate, 5 N HzSO 4. Later, 5 ml of isobutanol/benzene (1 : 1 v/v) was used to extract the phosphomolybdic complex in glass-stoppered tubes; 2 ml of the organic phase were analyzed by Ernster's method [2] with a final volume of 5 ml.
NADH- (acceptor) oxidoreductase (NADHDase) was assayed at 37 ~ in a Unicam SP 800 recording spectrophotometer in 0.2ml aliquots of the F-100 suspension as follows: (mM) NADH 0.2; K ferricyanide 0.66; Tris-chloride 86 (pH 8.5). The reaction was started with the addition of NADH and absorbances at 420 nm were recorded differentially as a function of time against the nonenzymic reaction. NADHDase activity was analyzed in the sucrose gradient fraction in 0.2 ml aliquots from each tube and incubating them in a similar media ; the absorbance was recorded at 340 rim.
The millimolar extinction coefficients used were: NADH, 622 (340 nm) and K ferricyanide, 0.96 (420 nm).
Proteins were determined in F-100 fractions by the Lowry method [7].
Reagents
NADH, ATP, histidine, TRIS-121 and ouabain were from the Sigma Chemical Co. Inorganic salts, sucrose and organic solvent (p. a.) were from Merck, Darmstadt, W. Ger- many.
UltrastrueturalStudies
To carry out electron-microscopic studies on the retinal nerves, squids were per- fused through the aorta upon being caught while still in the boat. The perfusion solution contained 6.25 % glutaraldehyde 0.2 ~a collidine buffer, pH 7.45 in artificial seawater. Later, the eyes were removed and the nerve bundles dissected out carefully and immersed for 2 hr in the same fixing solution.
They were rinsed afterwards in collidine buffer 0.2 M, pH 7.45. Post-fixation was carried out in 2 % osmium tetroxide in collidine buffer followed by dehydration in a series of 1:1 acetone and araldite mixtures for 6 hr. Thin sections were obtained in a Porter Blum MT 2 ultramicrotome equipped with a diamond knife and placed on
Separation of Squid Nerve Membranes 213
collodium carbon-coated grids of 100 mesh. After double staining with uranyl acetate and lead citrate they were observed in a Siemens Elmiskop 1A and a Phillips EM 300 electron-microscope.
To study the ultrastructure of plasma membranes, F-100 from giant axons was suspended by homogenization in 0.25 u sucrose buffered with 30mN Tris-chloride. Drops of this preparation and the pellet separated by density gradient centrifugation were deposited on the grid, stained with 1% Na phosphotungstate (pH 4.2) and observed with a Phillips EM 300 electron-microscope centered at 60 kV and provided with an anticontamination device.
Results
Ultrastructural Studies
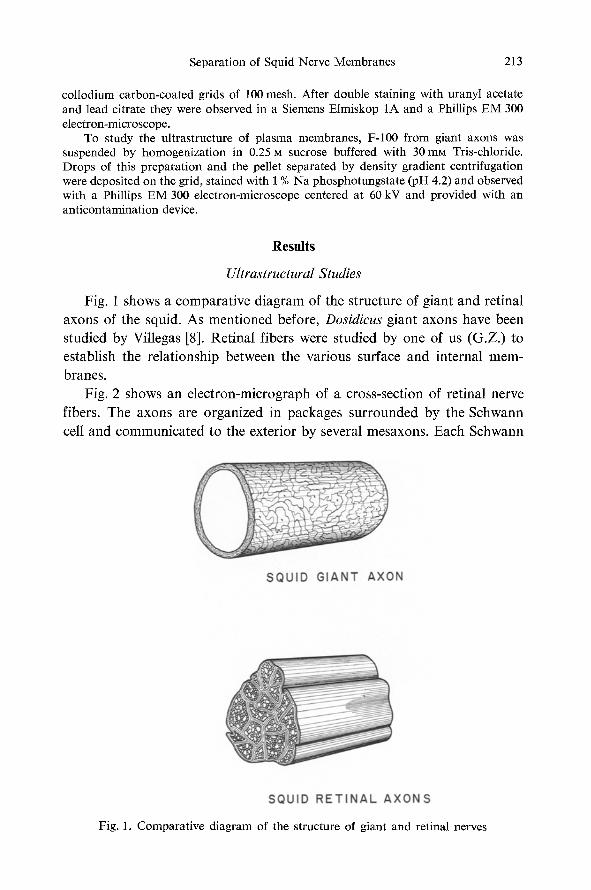
Fig. ! shows a compara t ive diagram of the structure of giant and retinal
axons of the squid. As ment ioned before, Dosidicus giant axons have been
studied by Villegas [8]. Retinal fibers were studied by one of us (G.Z.) to
establish the relat ionship between the various surface and internal mem-
branes.
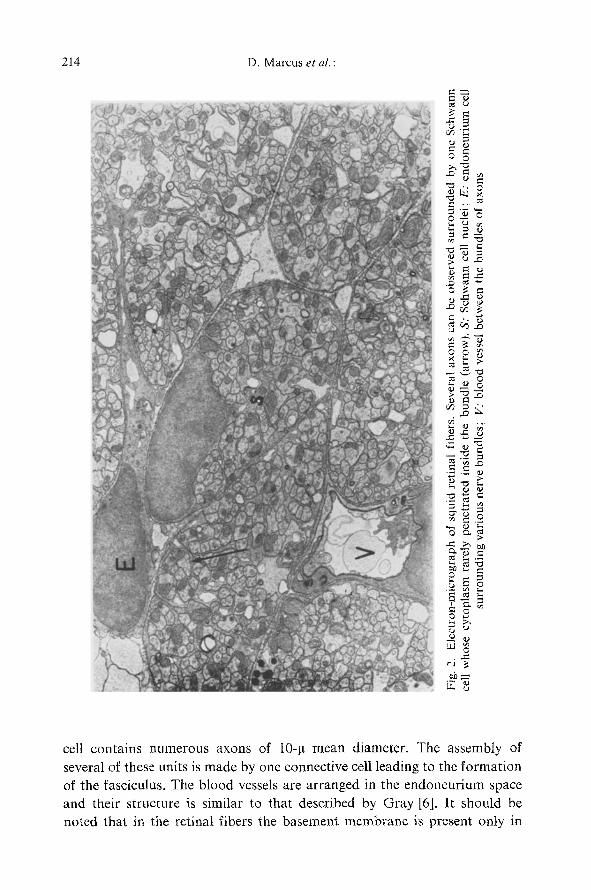
Fig. 2 shows an e lec t ron-micrograph of a cross-section of retinal nerve
fibers. The axons are organized in packages sur rounded by the Schwann
cell and communica ted to the exterior by several mesaxons. Each Schwann
Fig. 1. Comparative diagram of the structure of giant and retinal nerves
214 D. Marcus e t a l . :
r - e~
ra'3
-~=~
~_~
m
r
O
~4
2 N =
q3
u
�9 . ~ 2
cell contains numerous axons of 10-p mean diameter. The assembly of several of these units is made by one connective cell leading to the formation of the fasciculus. The blood vessels are arranged in the endoneurium space and their structure is similar to that described by Gray [6]. It should be noted that in the retinal fibers the basement membrane is present oniy in
Separation of Squid Nerve Membranes 215
the blood vessels. This is another marked difference as compared with giant axons which have a thick basement membrane [8].
The A/S ratio was measured to be in the order of 5:1. However, this value might be altered by the presence of membranes from other cells such as connective cells and blood vessels. The electron-micrograph also shows many mitochondria contained in the axon cytoplasm. Rough endoplasmic reticulum is present in a small proportion in the connective cell cytoplasma close to the nuclei; it was not found in the elongation which separates the Schwann cells.
The A/S ratio was measured also in an electron-micrograph published by Villegas [8] which gave values in the order of 1 : 5.
It should be pointed out that both types of fibers contain scarce endo- plasmic reticulum.
Differential Centrifugation of Squid Axon Homogenates
Fischer, Cellino, Gariglio, and T611ez-Nagel [3] selected the 10O,000 x g pellet from retinal axon homogenate as a plasma membrane-enriched fraction. The experimental criteria were: (a) The distribution of two mem- brane enzymes as the Na, K-ATPase and NADHDase. (b) The chemical composition which showed protein/lipid ratio, cholesterol, phospholipid, and RNA content typical of plasma membranes. (c) The ultrastructural studies which determined the purity of plasma membrane by negative staining and fixation techniques.
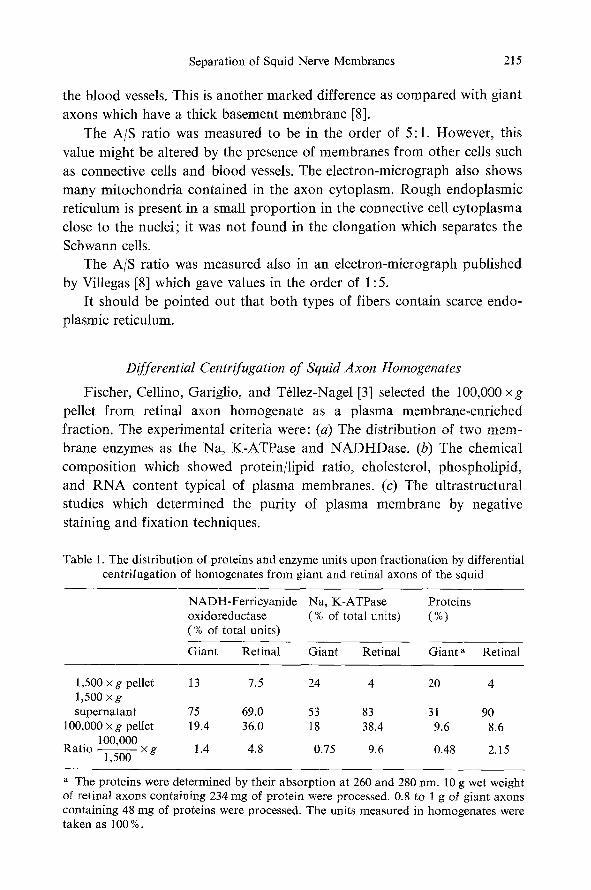
Table 1. The distribution of proteins and enzyme units upon fractionation by differential centrifugation of homogenates from giant and retinal axons of the squid
NADH-Ferricyanide Na, K-ATPase Proteins oxidoreductase (% of total units) (%) (% of total units)
Giant Retinal Giant Retinal Giant a Retinal
1,500 x g pellet 13 7.5 24 4 20 4 1,500 • supernatant 75 69.0 53 83 31 90
100,000 x g pellet 19.4 36.0 18 38.4 9.6 8.6 100,000
Ratio - - • 1.4 4.8 0.75 9.6 0.48 2.15 1,500
a The proteins were determined by their absorption at 260 and 280 nm. 10 g wet weight of retinal axons containing 234 nag of protein were processed. 0.8 to 1 g of giant axons containing 48 mg of proteins were processed. The units measured in homogenates were taken as 100%.
216 D. Marcus e t a l . :
Table 1 shows a comparison of the enzyme units and proteins obtained from giant and retinal axons. Since the yields of giant axons were low in a single preparation, the axons were collected for several days in different batches. For this reason, the data are presented as per cent of the starting material to allow comparison with retinal fibers, as well as between dif- ferent batches.
It can be seen that both types of nerves yielded similar per cent of pro- tein in the 100,000 x g pellet. However, retinal axons contained twice the amount of ATPase and NADHDase activity as compared to giant axons.
It should also be noted that only 4 % of the proteins from retinal axons
sedimented at 1,500 x g whereas 20% sedimented from giant axons. The latter fibers also have 6 times more ATPase activity in the low-speed cen- trifugation pellet. Moreover, when giant axon homogenate was not son- icated for 15 sec, 50% of the ATPase units remained in the 1,500 xg pellet. These data suggest that a great deal of giant axon membranes was probably trapped by the thick endoneurial connective tissue and basement mem- brane present in these fibers.
It would be important to clarify the sedimentation behavior of internal membranes from the axons which might be present in a higher proportion in giant than in retinal axons.
From dissected giant axons, the axoplasm can be extruded from the remaining sheath. The axoplasm will contain the axonal internal membranes; the sheath will contain the "axolemma", the basement membrane and the surface and internal membranes of the Schwann cell.
Table 2 shows the Na, K-ATPase activity determined in homogenates of both structures. It can be seen that even though axoplasm accounted for 60% of the nerve proteins, its enzyme specific activity is 8.5 times lower than the sheath. This would indicate that the ATPase activity of internal membranes belonging to the axon can not contribute significantly to the enzyme units collected on the 100,000 x g pellet from intact giant axons or retinal axons. This explains also why the sheath and intact giant axons yielded a similar per cent of ATPase activity in the high-speed pellet. Since the per cent of proteins recovered was also similar using either intact nerves or sheaths, it can be concluded that internal membranes from the axon cytoplasm are a minor component of the 100,000 x g pellet.
Table 3 shows that F-100 isolated from giant axons of the squid (GAS) and retinal axons (RAS) oxidized only N A D H with ferricyanide, but not succinate, NADPH or lactate as electron acceptors. The properties of this enzyme are similar to erythrocyte membranes [11-13]; this datum excludes
Separation of Squid Nerve Membranes 217
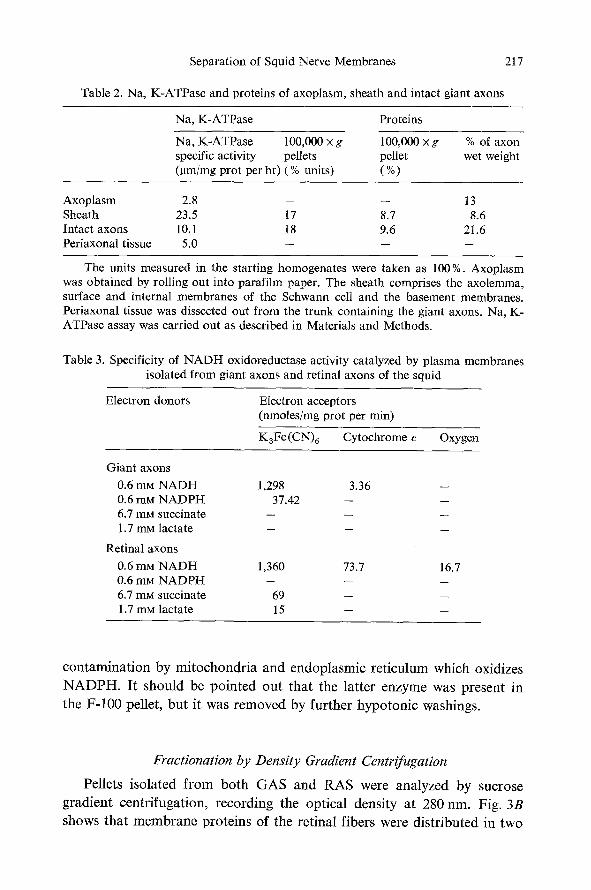
Table 2. Na, K-ATPase and proteins of axoplasm, sheath and intact giant axons
Na, K-ATPase Proteins
Na, K-ATPase 100,000 x g 100,000 x g % of axon specific activity pellets pellet wet weight (lam/mg prot per hr) (% units) (%)
Axoplasm 2.8 - -- 13 Sheath 23.5 17 8.7 8.6 Intact axons 10.1 18 9.6 21.6 Periaxonal tissue 5.0 - -- --
The units measured in the starting homogenates were taken as 100%. Axoplasm was obtained by rolling out into parafilm paper. The sheath comprises the axolemma, surface and internal membranes of the Schwann cell and the basement membranes. Periaxonal tissue was dissected out from the trunk containing the giant axons. Na, K- ATPase assay was carried out as described in Materials and Methods.
Table 3. Specificity of N A D H oxidoreductase activity catalyzed by plasma membranes isolated from giant axons and retinal axons of the squid
Electron donors Electron acceptors (nmoles/mg prot per min)
K3Fe (CN)~ Cytochrome e Oxygen
Giant axons
0.6 mM N A D H 1,298 3.36 0.6 mM N A D P H 37.42 -- 6.7 m~a succinate -- -- 1.7 mM lactate -- --
Retinal axons
0.6 mM N A D H 1,360 73.7 0.6 mM N A D P H - -- 6.7 m ~ succinate 69 -- 1.7 mM lactate 15 --
h
m
16.7
c o n t a m i n a t i o n b y m i t o c h o n d r i a a n d e n d o p l a s m i c r e t i c u l u m w h i c h ox id i ze s
N A D P H . I t s h o u l d be p o i n t e d o u t t h a t t he l a t t e r e n z y m e was p r e s e n t in
t he F - 1 0 0 pe l le t , b u t i t was r e m o v e d b y f u r t h e r h y p o t o n i c wash ings .
Fractionation by Density Gradient Centrifugation
Pel le t s i s o l a t e d f r o m b o t h G A S a n d R A S were a n a l y z e d b y s u c r o s e
g r a d i e n t c e n t r i f u g a t i o n , r e c o r d i n g the o p t i c a l d e n s i t y a t 280 rim. F ig . 3B
s h o w s t h a t m e m b r a n e p r o t e i n s of t he r e t i n a l f ibe r s we re d i s t r i b u t e d in t w o
218 D. Marcus e t a l . :
0.8
0.4
E
o
I---
Z W " 3,2
o 2 .4
n
o 1.6.
0.8-
A
;, 6 8 1'o i2 1),
2 6 10 14 18 22
F R A C T I O N N U M B E R
4O
20
(./1 C O
0
O1
40
2 0
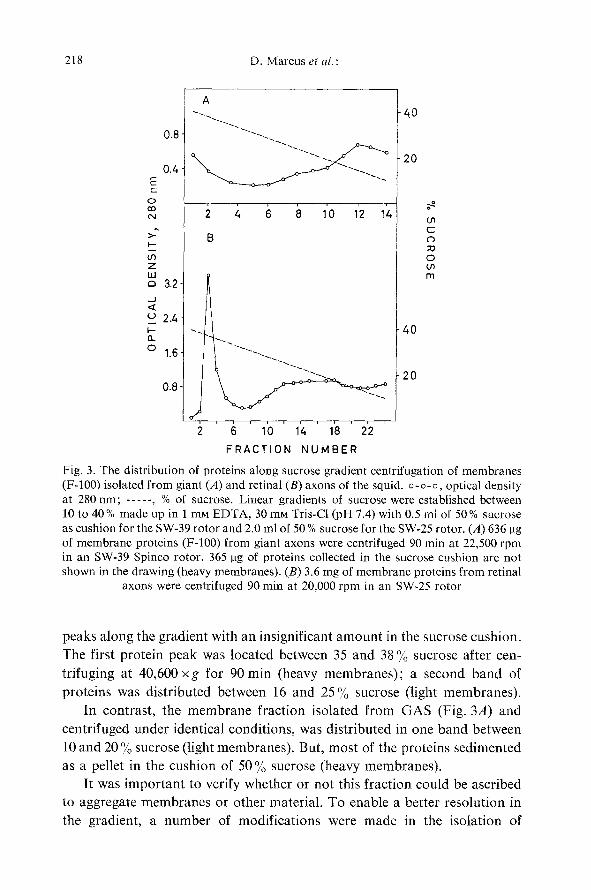
Fig. 3. The distribution of proteins along sucrose gradient centrifugation of membranes (F-100) isolated from giant (A) and retinal (B) axons of the squid, o-o-o, optical density at 280 rim; . . . . . , % of sucrose. Linear gradients of sucrose were established between 10 to 40% made up in 1 mM EDTA, 30 mM Tris-Cl (pH 7.4) with 0.5 ml of 50% sucrose as cushion for the SW-39 rotor and 2.0 ml of 50 % sucrose for the SW-25 rotor. (A) 636 gg of membrane proteins (F-100) from giant axons were centrifuged 90 min at 22,500 rpm in an SW-39 Spinco rotor. 365 pg of proteins collected in the sucrose cushion are not shown in the drawing (heavy membranes). (B) 3.6 mg of membrane proteins from retinal
axons were centrifuged 90 min at 20,000 rpm in an SW-25 rotor
peaks along the gradient with an insignificant amoun t in the sucrose cushion.
The first protein peak was located between 35 and 38 % sucrose after cen-
trifuging at 40,600 x g for 90 min (heavy membranes) ; a second band of
proteins was distributed between 16 and 25% sucrose (light membranes) .
In contrast, the membrane fract ion isolated f rom GAS (Fig. 3A) and
centrifuged under identical conditions, was distributed in one band between
10 and 20 % sucrose (light membranes) . But, most of the proteins sedimented
as a pellet in the cushion of 50 % sucrose (heavy membranes) .
It was impor tan t to verify whether or not this fraction could be ascribed
to aggregate membranes or other material. To enable a better resolution in
the gradient, a number of modificat ions were made in the isolation of
Separation of Squid Nerve Membranes 219
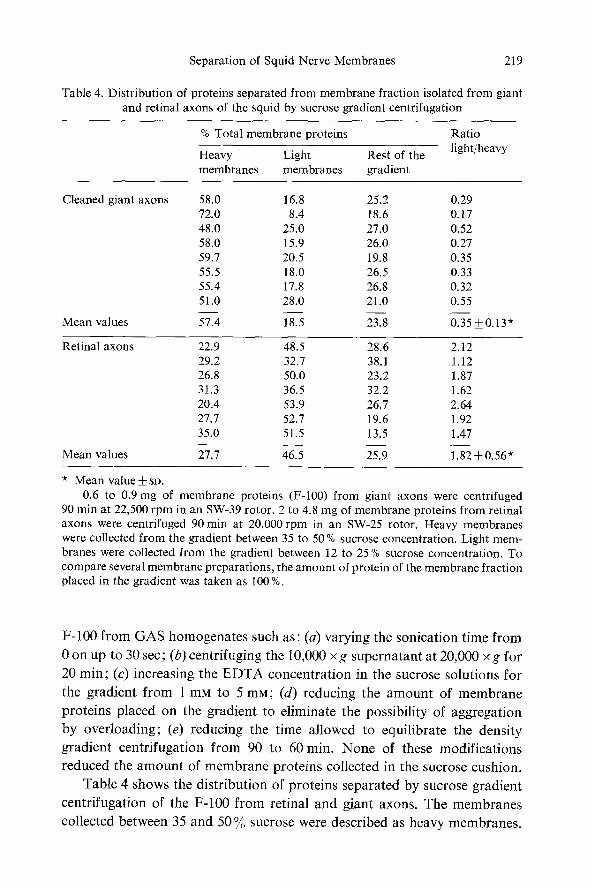
Table 4. Distribution of proteins separated from membrane fraction isolated from giant and retinal axons of the squid by sucrose gradient centrifugation
% Total membrane proteins
Heavy Light Rest of the �9 membranes membranes gradient
Ratio light/heavy
Cleaned giant axons 58.0 16.8 25.2 0.29 72.0 8.4 18.6 0.17 48.0 25.0 27.0 0.52 58.0 15.9 26.0 0.27 59.7 20.5 19.8 0.35 55.5 18.0 26.5 0.33 55.4 17.8 26.8 0.32 51.0 28.0 21.0 0.55
Mean values 57.4 18.5 23.8 0.35 +_0.13 '~
Retinal axons 22.9 48.5 28.6 2.12 29.2 32.7 38.1 1.12 26.8 50.0 23.2 1.87 31.3 36.5 32.2 1.62 20.4 53.9 26.7 2.64 27.7 52.7 19.6 1.92 35.0 51.5 13.5 1.47
Mean values 27.7 46.5 25.9 1.82 +0.56 ~
Mean value_--t- so. 0.6 to 0.9 mg of membrane proteins (F-100) from giant axons were centrifuged
90 rain at 22,500 rpm in an SW-39 rotor. 2 to 4.8 mg of membrane proteins from retinal axons were centrifuged 90 min at 20,000 rpm in an SW-25 rotor. Heavy membranes were collected from the gradient between 35 to 50 % sucrose concentration. Light mem- branes were collected from the gradient between 12 to 25 % sucrose concentration. To compare several membrane preparations, the amount of protein of the membrane fraction placed in the gradient was taken as 100 %.
F-100 f rom GAS homogenates such as: (a) varying the sonication time f rom
0 on up to 30 sec; (b) centrifuging the l 0,000 x g supernatant at 20,000 x g for
20 rain; (c) increasing the E D T A concentra t ion in the sucrose solutions for
the gradient f rom 1 mM to 5 raM; (d) reducing the amoun t of membrane
proteins placed on the gradient to eliminate the possibility of aggregation
by over loading; (e) reducing the time allowed to equilibrate the density
gradient centrifugation f rom 90 to 60 rain. None of these modificat ions
reduced the a m o u n t of membrane proteins collected in the sucrose cushion.
Table 4 shows the distribution of proteins separated by sucrose gradient
centrifugation of the F-100 f rom retinal and giant axons. The membranes
collected between 35 and 50 % sucrose were described as heavy membranes.
220 D. Marcus et al. : Separation of Squid Nerve Membranes
The light membranes were those collected at low densities between 12 and 25 % sucrose.
It was found that in retinal axons, 1.8 more membrane proteins floated at low densities than at high densities. Only 26 % of the proteins was found to be outside of the optical density peaks.
The F-100 from giant axons, however, was found to have an inversely proportional distribution. The amount of membrane protein collected in the high density sucrose area (heavy membranes) was 2.8 times the amount of light membranes; 23.9% of the protein was found to be distributed in the rest of the gradient. These data indicate that retinal fiber F-100 contains 5 times more light membranes than do giant fibers. That is, the ratio light/ heavy membranes is 1.8:1 in RAS and 1:2.8 in GAS.
Both types of membranes were centrifuged at 100,000 x g for 1 hr to
obtain pellets adequate for ultrastructural studies. Electron-micrographs of glutaraldehyde-fixed pellets from the two types
of membranes isolated by density gradient were reported previously by
Fischer et al. [3]. An alternative method was used to study the ultrastructure of both
membranes isolated from giant and retinal axons. Fig. 4A shows an electron- micrograph of heavy membranes from RAS obtained by negative staining. The main structures observed are also vesicles formed by membranes with a diameter between 0.08 to 0.5 la. The formation of vesicles inside of other vesicles was often seen. In Fig. 4B an electron-micrograph of light mem- branes material, negatively stained, can be seen. Again, the membranes are associated forming vesicles of slightly less diameter between 0.04 to 0.2 g. Loose membranes, which did not associate in vesicles, were frequently seen. In both types of membranes, separated by density gradient centrifu- gation, mitochondrial or ribosomal contamination was not observed.
Negative staining of membranes separated from giant axons showed that heavy membranes were so packed that it was difficult to obtain a good photograph. Light membranes were not different from retinal axons.
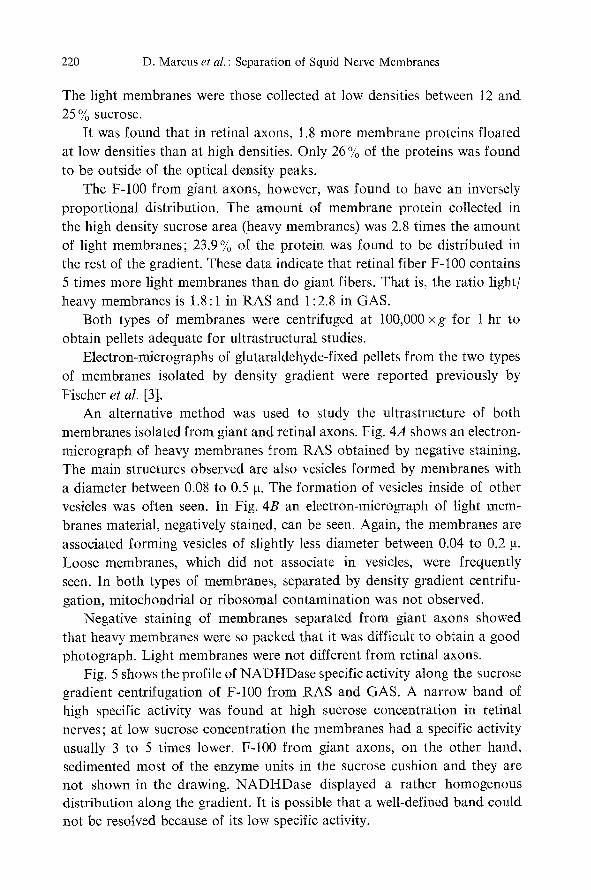
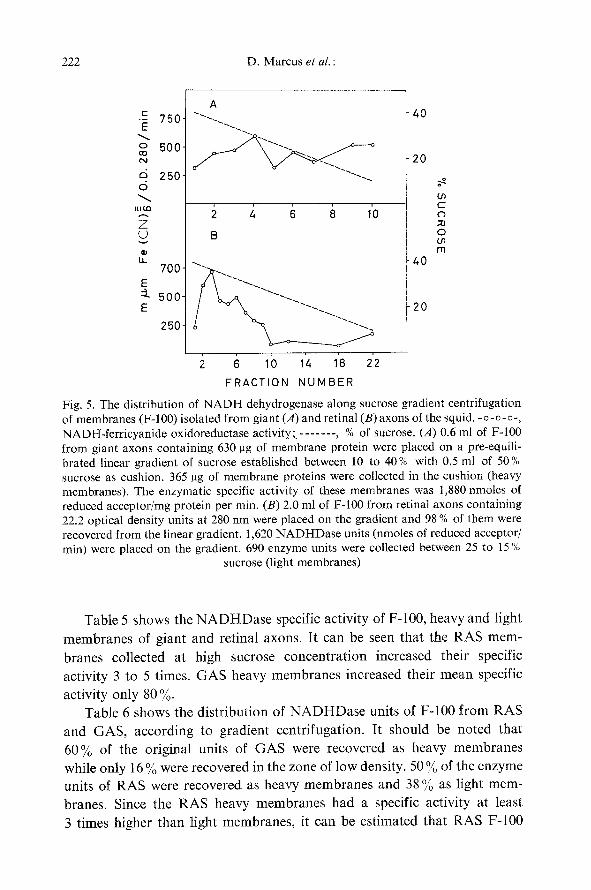
Fig. 5 shows the profile of NADHDase specific activity along the sucrose gradient centrifugation of F-100 from RAS and GAS. A narrow band of high specific activity was found at high sucrose concentration in retinal nerves; at low sucrose concentration the membranes had a specific activity usually 3 to 5 times lower. F-100 from giant axons, on the other hand, sedimented most of the enzyme units in the sucrose cushion and they are not shown in the drawing. NADHDase displayed a rather homogenous distribution along the gradient. It is possible that a well-defined band could not be resolved because of its low specific activity.
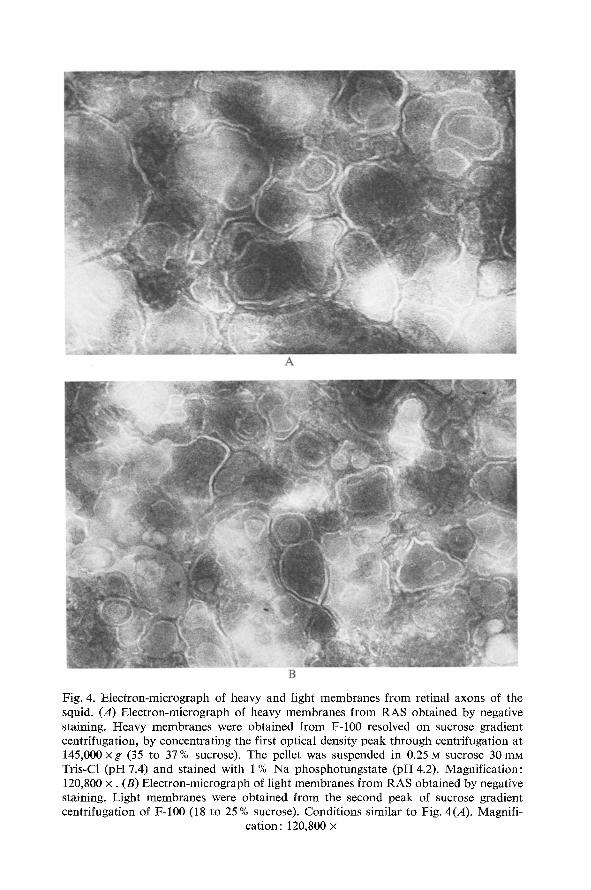
Fig. 4. Electron-micrograph of heavy and light membranes from retinal axons of the squid. (A) Electron-micrograph of heavy membranes from RAS obtained by negative staining. Heavy membranes were obtained from F-100 resolved on sucrose gradient centrifugation, by concentrating the first optical density peak through centrifugation at 145,000 x g (35 to 37% sucrose). The pellet was suspended in 0.25 ~ sucrose 30 mM Tris-Cl (pH 7.4) and stained with 1% Na phosphotungstate (pH 4.2). Magnification: 120,800 x . (B) Electron-micrograph of light membranes from RAS obtained by negative staining. Light membranes were obtained from the second peak of sucrose gradient centrifugation of F-100 (18 to 25 % sucrose). Conditions similar to Fig. 4(A). Magnifi-
cation: 120,800 x
222 D. Marcus e t a l . :
A �9 750.
o 5 0 0 co
2 0 ci 2 5 0 " - - . d
tn C
"'.-." 6 /3 1'0 Z U B o �9 rr l
u_ 700- "- .40
:1. 500- E 20
250-
�89 6 1'0 1'4 I'8 2'2
FRACTION NUMBER
Fig. 5. The distribution of NADH dehydrogenase along sucrose gradient centrifugation of membranes (F-100) isolated from giant (A) and retinal (B) axons of the squid. -o-o-o-, NADH-ferricyanide oxidoreductase activity;- . . . . . . , % of sucrose. (A) 0.6 ml of F-100 from giant axons containing 630 pg of membrane protein were placed on a pre-equili- brated linear gradient of sucrose established between 10 to 40% with 0.5 ml of 50% sucrose as cushion. 365 ~tg of membrane proteins were collected in the cushion (heavy membranes). The enzymatic specific activity of these membranes was 1,880 nmoles of reduced acceptor/mg protein per min. (B) 2.0 ml of F-100 from retinal axons containing 22.2 optical density units at 280 nm were placed on the gradient and 98 % of them were recovered from the linear gradient. 1,620 NADHDase units (nmoles of reduced acceptor/ rain) were placed on the gradient. 690 enzyme units were collected between 25 to 15 %
sucrose (light membranes)
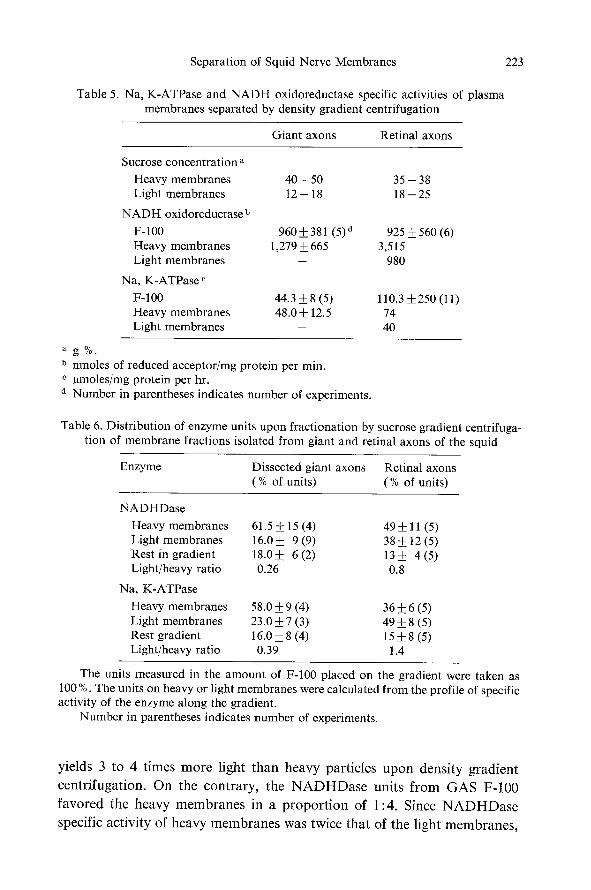
Table 5 shows the N A D H D a s e specific activity of F-100, heavy and light membranes of giant and retinal axons. It can be seen that the RAS mem- branes collected at high sucrose concentration increased their specific activity 3 to 5 times. GAS heavy membranes increased their mean specific
activity only 80 %. Table 6 shows the distribution of N A D H D a s e units of F-100 from RAS
and GAS, according to gradient centrifugation. It should be noted that 60% of the original units of GAS were recovered as heavy membranes while only 16 % were recovered in the zone of low density. 50 % of the enzyme units of RAS were recovered as heavy membranes and 38 % as light mem- branes. Since the RAS heavy membranes had a specific activity at least 3 times higher than light membranes, it can be estimated that RAS F-100
Separation of Squid Nerve Membranes 223
Table 5. Na, K-ATPase and N A D H oxidoreductase specific activities of plasma membranes separated by density gradient centrifugation
Giant axons Retinal axons
Sucrose concentration a Heavy membranes Light membranes
NADHoxidoreductase b
F-100 Heavy membranes Light membranes
Na, K-ATPase e
F-100 Heavy membranes Light membranes
40-- 50 35 - - 38 12 -- 18 18 --25
960-t-381 (5) d 925___560(6) 1,279 q- 665 3,515
- - 980
44.3-t-8(5) 110.3 +250 (11) 48.0 q- 12.5 74
- - 40
a g % .
b nmoles of reduced acceptor/mg protein per min. e gmoles/mg protein per hr. a Number in parentheses indicates number of experiments.
Table 6. Distribution of enzyme units upon fractionation by sucrose gradient centrifuga- tion of membrane fractions isolated from giant and retinal axons of the squid
Enzyme Dissected giant axons Retinal axons (% of units) (% of units)
NADHDase
Heavy membranes 61.5 -I- 15 (4) 49 __ 11 (5) Light membranes 16.0 -t- 9 (9) 38 __ 12 (5) Rest in gradient 18.0 -I- 6 (2) 13 -t- 4 (5) Light/heavy ratio 0.26 0.8
Na, K-ATPase
Heavy membranes 58.0 -t- 9 (4) 36 + 6 (5) Light membranes 23.0 -t- 7 (3) 49 +__ 8 (5) Rest gradient 16.0 __ 8 (4) 15 q- 8 (5) Light/heavy ratio 0.39 1.4
The units measured in the amount of F-100 placed on the gradient were taken as 100 %. The units on heavy or light membranes were calculated from the profile of specific activity of the enzyme along the gradient.
Number in parentheses indicates number of experiments.
yields 3 to 4 t imes m o r e light t h a n h e a v y par t ic les u p o n dens i ty g rad ien t
cen t r i fuga t ion . O n the con t r a ry , the N A D H D a s e uni ts f r o m G A S F-100
f a v o r e d the h e a v y m e m b r a n e s in a p r o p o r t i o n of 1:4. Since N A D H D a s e
specific act ivi ty of h e a v y m e m b r a n e s was twice tha t of the l ight m e m b r a n e s ,
224 D. Marcus e t a l . :
o t.-,
o ao
,4
d
E_
E :L
2O
10
20-
A
i , , l , i i , E l , ,
2 4 6 8 10 12
B
40
20
c
o cn
m
- , ~ 40
10- 20
2 6 10 14 18 22 26
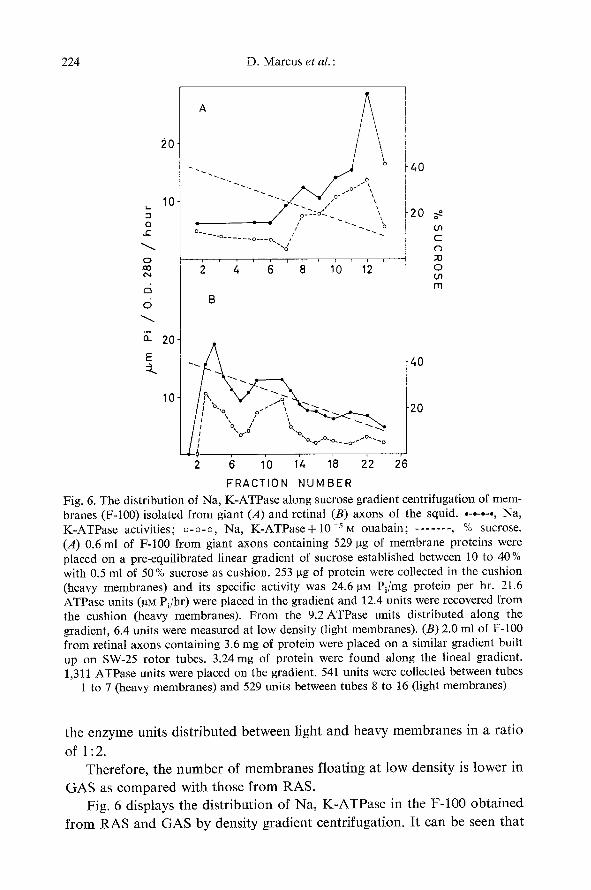
FRACTION NUMBER Fig. 6. The distribution of Na, K-ATPase along sucrose gradient centrifugation of mem- branes (F-100) isolated from giant (A) and retinal (B) axons of the squid . . . . . . . . , Na, K-ATPase activities; o-o-o, Na, K-ATPase+10-sM ouabain; . . . . . . . , % sucrose. (A) 0.6 ml of F-100 from giant axons containing 529 gg of membrane proteins were placed on a pre-equilibrated linear gradient of sucrose established between 10 to 40% with 0.5 ml of 50% sucrose as cushion. 253 ~tg of protein were collected in the cushion (heavy membranes) and its specific activity was 24.6 gN Pi/mg protein per hr. 21.6 ATPase units (~tM Pi/hr) were placed in the gradient and 12.4 units were recovered from the cushion (heavy membranes). From the 9.2 ATPase units distributed along the gradient, 6.4 units were measured at low density (light membranes). (B) 2.0 ml of F-100 from retinal axons containing 3.6 mg of protein were placed on a similar gradient built up on SW-25 rotor tubes. 3.24 mg of protein were found along the lineal gradient. 1,311 ATPase units were placed on the gradient. 541 units were collected between tubes
1 to 7 (heavy membranes) and 529 units between tubes 8 to 16 (light membranes)
the enzyme units dis t r ibuted between light and heavy m e m b r a n e s in a ra t io
of 1:2. Therefore , the n u m b e r of m e m b r a n e s f loat ing at low density is lower in
G A S as c o m p a r e d with those f r o m RAS. Fig. 6 displays the dis t r ibut ion of Na, K - A T P a s e in the F-100 ob ta ined
f r o m RAS and G A S by density gradient centr ifugation. I t can be seen tha t
Separation of Squid Nerve Membranes 225
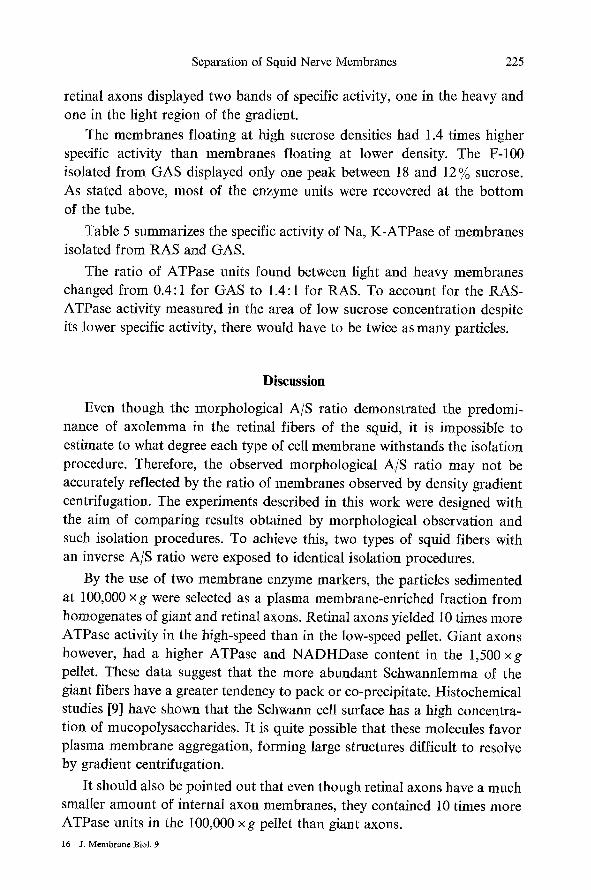
retinal axons displayed two bands of specific activity, one in the heavy and one in the light region of the gradient.
The membranes floating at high sucrose densities had 1.4 times higher specific activity than membranes floating at lower density. The F-100 isolated from GAS displayed only one peak between 18 and 12% sucrose. As stated above, most of the enzyme units were recovered at the bottom of the tube.
Table 5 summarizes the specific activity of Na, K-ATPase of membranes isolated from RAS and GAS.
The ratio of ATPase units found between light and heavy membranes changed from 0.4:1 for GAS to 1.4:1 for RAS. To account for the RAS- ATPase activity measured in the area of low sucrose concentration despite its lower specific activity, there would have to be twice as many particles.
Discussion
Even though the morphological A/S ratio demonstrated the predomi- nance of axolemma in the retinal fibers of the squid, it is impossible to estimate to what degree each type of cell membrane withstands the isolation procedure. Therefore, the observed morphological A/S ratio may not be accurately reflected by the ratio of membranes observed by density gradient centrifugation. The experiments described in this work were designed with the aim of comparing results obtained by morphological observation and such isolation procedures. To achieve this, two types of squid fibers with an inverse A/S ratio were exposed to identical isolation procedures.
By the use of two membrane enzyme markers, the particles sedimented at 100,000 x g were selected as a plasma membrane-enriched fraction from homogenates of giant and retinal axons. Retinal axons yielded 10 times more ATPase activity in the high-speed than in the low-speed pellet. Giant axons however, had a higher ATPase and NADHDase content in the 1,500 xg pellet. These data suggest that the more abundant Schwannlemma of the giant fibers have a greater tendency to pack or co-precipitate. Histochemical studies [9] have shown that the Schwann cell surface has a high concentra- tion of mucopolysaccharides. It is quite possible that these molecules favor plasma membrane aggregation, forming large structures difficult to resolve by gradient centrifugation.
It should also be pointed out that even though retinal axons have a much smaller amount of internal axon membranes, they contained 10 times more ATPase units in the 100,000 x g pellet than giant axons. 16 J. Membrane Biol. 9
226 D. Marcus e t a l . :
When the axoplasm was removed from giant axons, a similar amount of ATPase units was also recovered in the high-speed pellet from sheath homogenates. These results demonstrated that the axonal endoplasmic reti- culum does not contribute significantly to the heterogeneity of the plasma membrane-enriched fraction.
Further analysis of F-100 by density gradient centrifugation indicated that both types of fibers render an inverse proportion of light to heavy mem- branes. The light/heavy membrane ratio determined by the distribution of proteins on the gradient, changed from 1.8:1 in RAS to 1:2.8 in GAS. Since only a small fraction of the heavy membranes from GAS entered the high sucrose zone, the exactness of the terms heavy and light membranes may be questioned. This is especially true if the fractionation by the sucrose gradient centrifugation involves size as well as density of the particles.
However, we reported previously [4] that glutaraldehyde-fixed membranes did not show significant differences in size in the electron-micrograph.
Some probable explanation for the fact that the F-100 fraction is heter- ogeneous and contains two types of chemically different membranes are
considered below. (1) The heterogeneity of this fraction might be caused by a difference in
the amount of axon internal membranes. Since, in giant fibers, axoplasm accounts for 60 % of the proteins, axonal endoplasmic reticulum will prevail over surface membranes in the plasma membrane-enriched fraction of these
fibers. It was shown that the axoplasm extruded from giant axons has an
ATPase specific activity 8 times lower than the remaining membranes. Since the per cent of proteins and enzyme units collected from intact axons and sheath were similar, it is difficult to ascribe the higher amount of heavy membranes sedimented from giant axons to their difference in axonal internal membranes. However, it can not be excluded that the membranes collected between 38 to 26% sucrose from F-100 RAS may belong to the scarce endoplasmic reticulum from these fibers.
(2) The heterogeneity of this fraction might be caused by contamination with the outer mitochondrial membranes. These large particulate structures could be broken by sonication and sedimented as small vesicles with endo- plasmic reticulum. In our experiments, sonication was applied only in con- centrated homogenates for 10 to 20 sec. This is a mild treatment compared with the hypotonic solutions used for homogenization which also disrupt mitochondria.
The ultrastructure of retinal fibers shows that they are richer in mito- chondria per unit area than giant axons. It would be expected, therefore,
Separation of Squid Nerve Membranes 227
that the heavy membranes which oxidize N A D H would be found in greater
proportion in retinal axons. On the contrary, it was found that giant axons
yielded a higher amount of these membranes.
On the other hand, the specificity of the electron transport reaction
catalyzed by F-100 from both nerves demonstrated clearly that the external
mitochondrial membrane is not likely to contribute to its heterogeneity.
(3) The heterogeneity might be caused by a different contribution of
axonal and enveloping cell surface membranes.
It was shown by NADHDase and ATPase analysis throughout the
gradient that in RAS, the quantity of light membranes prevailed 2:1 over
the heavy membranes; in GAS, the ratio of light/heavy membranes de-
creased to 1:2. These ratios are more similar to those observed by morpho-
logical studies.
These findings support the conclusion that the membrane profile of each
fiber as observed by density gradient centrifugation reflects their cellular
origins.
It was clear from the results that light membranes were more abundant
when isolated from retinal axons, the axolemma-rich structure. The amount
of these light membranes decreased markedly in the Schwannlemma-rich
fibers of giant axons. The experimental data support the hypothesis that
the axolemma can be related to the light membrane fraction which was
isolated in substantial amounts from the retinal axon fibers.
The technical assistance of Mr. R. Allan and Mr. J. Soto is gratefully acknowledged. Thanks are due to Drs. D. Tosteson, T. Shaw, and B. Fleischer for valuable discussion of these results.
This research was supported by the University of Chile, C. I. C.
References
1. Baker, P. F., Hodgkin, A. L., Shaw, T. I. 1962. Replacement of the axoplasm of giant nerve fibers with artificial solutions. J. Physiol. 164:330.
2. Ernster, L., Zetterstr6m, R., Lindberg, O. 1950. A method for the determination of tracer phosphate in biological material. Acta Chem. Scand. 4: 942.
3. Fischer, S., Cellino, M., Gariglio, P., T611ez-Nagel, I. 1968. Proteins and RNA metabolism of squid axons (Dosidicus gigas). J. Gen. Physiol. 51:72s.
4. Fischer, S., Cellino, M., Zambrano, F., Zampighi, G., T~llez-Nagel, I., Marcus, D., Canessa-Fischer, M. 1970. The molecular organization of nerve membranes. I. Isola- tion and characterization of plasma membranes from the retinal axons of the squid: an axolemma-rieh preparation. Arch. Biochem. Biophys. 138: 1.
5. Geren, B. B., Schmitt, F. O. 1954. The structure of the Schwann cell and its relation to the axon in certain invertebrate nerve fibers. Proc. Nat. Acad. Sci. 40:863.
6. Gray, E. J. 1969. Electron microscopy of the glio-vascular organization of the brain of Octopus. Phil. Trans. B255:1.
16.
228 D. Marcus et al. : Separation of Squid Nerve Membranes
7. Lowry, O. H., Rosebrough, N. J., Farr, A. L., Randall, R. J. 1951. Protein measure- ment with the folin phenol reagent. J. Biol. Chem. 193:265.
8. Villegas, G. M. 1969. Electron microscopy of the giant nerve fiber of the giant squid Dosidicus gigas. J. Ultrastruct. Res. 26: 501.
9. Villegas, G. M., Villegas, R. 1968. Ultrastructural studies of squid nerve fibers. or. Gen. Physiol. 51:(5), 44.
10. Villegas, R., Villegas, L., Gim6nez, M., Villegas, G. M. 1963. Schwann cell and axon electrical potential differences. Squid nerve structure and excitable membrane loca- tion. J. Gen. Physiol. 46:1047.
11. Zamudio, I., Canessa, M. 1966. Nicotinamide-adenine dinucleotide dehydrogenase activity of human erythrocyte membranes. Biochim. Biophys. Acta 120:165.
12. Zamudio, I., Cellino, M., Canessa-Fischer, M. 1969. The relation between mem- brane structure and N A D H : (Acceptor) Oxidoreductase activity of erythrocyte ghosts. Arch. Biochern. Biophys. 129:336.
13. Zamudio, I., Cellino, M., Canessa-Fischer, M. 1969. A N A D H oxidizing system of the cell membrane of human erythrocytes. In: The Molecular Basis of Membrane Function. D. C. Tosteson, editor, p. 545. Prentice-Hall Inc., Englewood Cliffs, N.J.