the golden section as optical limitation
TRANSCRIPT

RESEARCH ARTICLE
The Golden Section as Optical LimitationMark A. Elliott1☯*, Joy Kelly1☯‡, Jonas Friedel2‡, Jennifer Brodsky3‡, Paul Mulcahy1☯
1 School of Psychology, National University of Ireland Galway, Galway, Republic of Ireland, 2 Department ofPsychology, University of Salzburg, Salzburg, Austria, 3 Department of Psychology, Union College,Schenectady, New York, United States of America
☯ These authors contributed equally to the conception, design and analysis of the work.‡ These authors also contributed equally to this work in running the experimental studies.* [email protected]
AbstractThe golden section, ϕ = (1 +
p5)/2 = 1.618. . . and its companion ϕ = 1/ϕ = ϕ -1 = 0.618. . .,
are irrational numbers which for centuries were believed to confer aesthetic appeal. In linewith the presence of golden sectioning in natural growth patterns, recent EEG recordingsshow an absence of coherence between brain frequencies related by the golden ratio, sug-gesting the potential relevance of the golden section to brain dynamics. Using Mondrian-type patterns comprising a number of paired sections in a range of five section-section arealratios (including golden-sectioned pairs), participants were asked to indicate as rapidlyand accurately as possible the polarity (light or dark) of the smallest section in the patterns.They were also asked to independently assess the aesthetic appeal of the patterns. Nopreference was found for golden-sectioned patterns, while reaction times (RTs) tended todecrease overall with increasing ratio independently of each pattern’s fractal dimensionality.(Fractal dimensionality was unrelated to ratio and measured in terms of the Minkowski-Bou-ligand box-counting dimension). The ease of detecting the smallest section also decreasedwith increasing ratio, although RTs were found to be substantially slower for golden-sec-tioned patterns under 8-paired sectioned conditions. This was confirmed by a significant lin-ear relationship between RT and ratio (p <.001) only when the golden-sectioned RTs wereexcluded [the relationship was non-significant for the full complement of ratios (p = .217)].Image analysis revealed an absence of spatial frequencies between 4 and 8 cycles-per-degree that was exclusive to the 8-paired (golden)-sectioned patterns. The significance ofthis was demonstrated in a subsequent experiment by addition of uniformly distributed ran-dom noise to the patterns. This provided a uniform spatial-frequency profile for all patterns,which did not influence the decrease in RT with increasing ratio but abolished the elevatedRTs to golden-sectioned patterns. This suggests that optical limitation in the form ofreduced inter-neural synchronization during spatial-frequency coding may be the founda-tion for the perceptual effects of golden sectioning.
PLOS ONE | DOI:10.1371/journal.pone.0131045 July 8, 2015 1 / 15
OPEN ACCESS
Citation: Elliott MA, Kelly J, Friedel J, Brodsky J,Mulcahy P (2015) The Golden Section as OpticalLimitation. PLoS ONE 10(7): e0131045. doi:10.1371/journal.pone.0131045
Editor: Helmut Ahammer, Medical University of Graz,AUSTRIA
Received: December 4, 2014
Accepted: May 29, 2015
Published: July 8, 2015
Copyright: © 2015 Elliott et al. This is an openaccess article distributed under the terms of theCreative Commons Attribution License, which permitsunrestricted use, distribution, and reproduction in anymedium, provided the original author and source arecredited.
Data Availability Statement: All relevant data arewithin the paper and its Supporting Information files.
Funding: The authors have no support or funding toreport.
Competing Interests: The authors have declaredthat no competing interests exist.

IntroductionThe golden section or ϕ (phi) is an irrational number, which in conjunction with π and e aredetermined to be one of the most significant constants in mathematics. Amongst other proper-ties ϕ describes the relationship of numbers in the Fibonacci sequence as well as the geometryof pentagrams, in which each intersection of edges sections other edges in the golden section.While the term ‘Golden Section’ (goldener Schnitt) is ascribed to a text written by Martin Ohmin 1835 [1], knowledge of its mathematical significance is much older. The number was origi-nally defined by early Greek mathematicians including Pythagoras, for whom it may have beeninstrumental in the discovery of irrational numbers by virtue of its application to geometricalstructure [2]. Expressed formally, the relation r = a/b = b/(a + b) permit only two possibilitiesfor r: ϕ = (
p5–1)/2 = 0.618. . . and -ϕ = -(1 +
p5)/2 = -1.618. . ., which is the geometric defini-
tion of the golden section.The golden section is commonly believed to be present in ancient architecture, for example
the Parthenon [3] and Egyptian religious buildings [4]. In antiquity, design employing goldensectioning is believed to generalize to other structures: 2,500 year-old Greek kantheroi havebeen argued to incorporate the golden section in their design [5]. There is also evidence fordesign employing golden sectioning in which the mean length/width ratios of 7,000-year oldprojectile points were found to vary in very close agreement with the ϕ (upper and lower 95%confidence intervals 1.59–1.64) [6].
While compelling, there are convincing arguments that claims of golden sectioning inalmost all cases involve seemingly arbitrary calculations of the actual dimensions of the struc-tures concerned [2]. In contemporary thinking the golden section is associated with aesthetics:in the 16th century, De Divina Poportione [7] proposed ϕ to be the fundamental unit in artisticperspective with application to architectural design. In the mid-19th century it was suggestedthat many works of art include golden sectioning in their composition [8,9]. These claims leadthe founder of modern psychophysics, Gustav-Theodor Fechner, to examine the aestheticproperties of simple rectangular figures, and to report a clear preference for golden-sectionedrectangles [10]. However, in the 150 years since Fechner’s work there are an almost equal num-ber of studies claiming support for Fechner’s finding as there are studies finding no preference.This lack of agreement may be based upon misunderstandings or misreading of the earlyexperimental protocols, as well as imprecise replications of experimental conditions [11]. How-ever, the lack of consensus has lead to claims that there is no evidence to support the idea thatgolden sectioning is an important principle in art and structural design [2].
Phi does appear in natural growth patterns, such as flower and leaf arrangements thatdevelop pentagonal symmetry. The morphologies of a variety of sea creatures adapt to goldensectioning, for instance, the logarithmic spiral that is constructed from golden rectangles char-acterizes the shells of Nautilus, Abalone and Triton [4,11]. Another example is the “golden-angled” (137.5°) spiral configurations of pineapples, sunflowers, pinecones, cauliflowers, etc.Neither of these examples are numerological coincidences, but rather adaptations following ϕas a physical constraint. Seashells that follow this growth pattern are able to maintain theirshape while growing in size, and petal growth sequences can maximize their individual expo-sure to the environment by having this arrangement, in both cases producing a visual appear-ance that is self-similar across spatial scales [11].
It has recently been argued that in the human EEG, different neural oscillation frequencieswill never synchronize (in a mathematical sense) if the frequency relationship is close to ϕ:mathematical modeling indicates that frequencies separated by close to ϕ exhibit the mostirregular pattern of interaction possible between the excitatory phases of two or more indepen-dent sources of neuronal activity [12].
The Golden Section as Optical Limitation
PLOS ONE | DOI:10.1371/journal.pone.0131045 July 8, 2015 2 / 15

Neural oscillation frequency is believed to be important because it is associated with therhythmic synchronization of neuronal firing, which in turn is believed to facilitate the forma-tion of functional neuronal assemblies [13–15]. In the EEG literature, neural oscillations aredivided into different frequency bands according to associated cognitive function: for instance,frequencies in the EEG beta (4–7 Hz) and alpha (8–12 Hz) bands are associated with workingmemory and attention while those in the EEG gamma band (30–70 Hz) are associated withfunctions that include long-term memory storage and retrieval, as well as perceptual processing[16–18]. It is also believed that cross-frequency phase synchronization is necessary for thefunctional integration of assemblies undertaking different cognitive tasks [19–21]. Assumingthe model offered in [12] is of significance to functional integration, it would entail that forneural assembles oscillating at frequencies separated by ϕ, for example two assemblies oscillat-ing at 50 and 31 Hz (1:0.613), there would be little or no functional interaction between thetwo assemblies and therefore no cognitive function associated with their co-activation.
This may come about as a property of ϕ as the “most irrational” of all the irrational numbers[6, 12]. This description arises because ϕ possesses an infinitely recursive continued fractionwhere none of the integer values are above 1. This is extremely slow to converge in comparisonwith other irrational approximations as it has the smallest possible sequence of denominators,simply adding 1 to each recursive iteration [2]. As such, the numerator and denominator repre-senting the golden ratio are more incommensurable than other irrationals. In terms of oscil-latory activity in the brain, this translates to phase sequences of two neural frequencies that are,in combination, least able to produce an integer value relationship that allows for phase locking[12]. By this account, a ratio at or close to ϕ would entail the two frequencies will rarely syn-chronize, with the consequence that cognition will either not occur or its function will beimpaired. This is consistent with the idea that an irregular patterning in cross-frequency phasemeetings conferred by ϕ characterize the resting state of the brain, in which no selective infor-mation processing is argued to take place [12].
The idea that cognition and particularly visual cognition related to aesthetic preference maybe influenced by ϕ at the level of neural dynamics provided the idea from which the researchpresented here developed. More specifically, we believed size relations in golden ratio mightinfluence judgments concerning areal relations. This seems plausible given conclusion thatgeometrical illusions, which illustrate size contrast [22,23] and size assimilation [24], are bestdescribed as contour interaction illusions, which, are in turn explicable in terms of the mutualadaptation (likely mediated by the synchronization) of spatial-frequency detectors in the visualsystem [25–27]. Related to the frequency of synchronization, it is generally held that variationsin the amplitude of the EEG response relates to the number of synchronized neurons. In turn,we assumed that amplitude and therefore synchronization frequency also differs between neu-ral assemblies of different size. This assumption was based upon EEG evidence, which hasfound amplitude to be proportional to the number of synchronously active neural elements[28], with slowly oscillating cell assemblies comprising more neurons than assemblies of higherfrequencies [29]. Related to synchronization a simulation study [30] has shown that amplitudeincreases and frequency decreases with an increasing number of interconnecting neurons andtherewith the need to synchronize neurons across different patterns of spike timing or mem-brane potential fluctuations as well as different patterns of synaptic delay.
In addition, much of the evidence for the way that ratio proportions are represented psycho-logically deals with their symbolic or numerical notation (i.e. fractions). Experiments usuallyinvolve comparison of a pair of fractions; with participants deciding which of two values islarger. Results show a numerical distance effect; that is, the distance between the absolute mag-nitudes of the individual fractions predicts performance in both accuracy and speed [31,32].For symbolic comparisons, this suggests that the representations of the integrated fractions are
The Golden Section as Optical Limitation
PLOS ONE | DOI:10.1371/journal.pone.0131045 July 8, 2015 3 / 15

implemented according to an analogical labeled line code (i.e. a holistic processing strategy)rather than being due to cross-comparison of the rational components in an online computa-tion. The integration of fraction components into a holistic representation is shown to exhibittheta and gamma band synchrony over frontal and central-parietal areas in the EEG [33],implying the binding of the individual numerator and denominator representations into acommon neural code. A holistic processing strategy is also shown to produce less alpha-banddesynchronization, implying that this process does not actively down regulate cortical net-works concerned with attention and executive control; i.e. it relies on more intensive neuralresources than strategies using online computation [33]. In this case, irrationals may slow orimpair responding by making the process of holistic integration more difficult than the analog-ical code would otherwise account for. In other words, the magnitude estimation of a singleratio relationship might be especially difficult according to the irrationality of the numeratorand denominator. Evidence from an fMRI study shows that when a proportion magnitude waspresented as an adapting stimulus, followed by a test proportion, BOLD signal adaptation andrecovery was similar to that for numerical fractions [34]. In this case, regions surrounding theintraparietal sulcus showed stronger recovery for test proportions that deviated further fromthe adapting stimulus. On this basis it is argued that proportion coding is closely comparableto symbolic fractional representation as it also subject to the numeric distance effect, is imple-mented automatically, and independent of presentation format [34].
Golden sectioning may therefore influence the efficiency of visual scene coding, in whichcontext it would seem likely to impair or at least slow processing of holistic structure. Accord-ingly, the purpose of this study was to investigate the proposal that fast and efficient areal com-parisons would be impaired when the relevant areas are in golden-ratio proportions to eachother relative to areas in other ratios.
Materials and MethodsParticipantsTwelve naïve participants (5 male, mean age of 25.27 years +/- 3.41 years) took part inExperiments 1 and 4. Eight participants (4 male, mean age 26.125 +/- 4.2 years) took part inExperiment 2 and 10 participants (6 male, mean age 22.625 +/- 2.5 years) in Experiment 3. Par-ticipants had normal or corrected to normal vision. All participants provided written consentto participate in this study. The complete protocol, including provision of written consent, wasapproved by the institutional Research Ethics Committee at the National University of IrelandGalway.
Apparatus and StimuliStimuli were generated using E-prime 2.0 PRO (Psychology Software tools Inc.) on a Pentium4 PC running Windows XP. Stimulus control and presentation were programmed using nativeE-prime macro scripts with system integrity checked by means of an E-prime refresh clocktest which gave a diagnostic classification of ‘good’ (measurement error +/- 1 ms). Stimuliwere presented on a 19”Magic Displays monitor, model CPD-4402 Trinitron with resolution1024x768 and refresh rate 75 Hz. Responses were recorded using a two key Ergodex DX1 InputSystem. To approximate a relationship between golden sectioning in composition with brainactivity we constructed patterns sectioned with various ratios between their larger and smallersections that included the golden section (Fig 1). We reasoned that areal ratios in golden sec-tion would promote neural responses corresponding approximately in terms of the number ofcontributive neurons to the ratios of larger to smaller areas. This seemed a plausible assump-tion given there are non-integer as well as harmonic relations between neural oscillation
The Golden Section as Optical Limitation
PLOS ONE | DOI:10.1371/journal.pone.0131045 July 8, 2015 4 / 15

frequencies in the gamma band, which is the band most closely associated with coding sensorystructure [35]. If the number of neurons responding to a given stimulus relates to the frequencyat which those neurons synchronize, then the frequency-response adopted by neurons acrosstwo areas in golden ratio should also be, approximately, in golden ratio. Stimuli were rectangu-lar, horizontally (Experiments 1, 3 and 4) or vertically (Experiment 2) oriented Mondrian-likepatterns with 4-, 8- or 16-paired sections (Fig 1). Each pattern contained a set of differentlysized, paired sections with self-similar dimensions. The ratios of the paired sections examinedwere 1:0.468, 1:0.518, 1:0.568, 1:0.618!, 1:0.668 (!0.618 is the golden ratio, or more precisely it’sreciprocal, but in this case the two are interchangeable) [36]. The set of ratio intervals and sizeswere chosen because they allowed equal increments that would not cause large discontinuitiesin the appearance of the stimuli across ratios. They also avoid the possibility of patterns pro-ducing overly small targets when sectioned beyond a certain point. The position of the goldenratio as 4th largest within the range of 5 ratios used sought to avoid any biased responding that
Fig 1. Example grids used in all experiments, from top to bottom, left to right a 4-paired sectioned pattern with sections in area ratio 1|0.568, an8-paired sectioned pattern with sections in area ratio 1|0.618 (the golden section), an 8-paired sectioned pattern with sections in area ratio 1|0.568and a 16-paired sectioned pattern with sections in area ratio 1|0.668. The participants’ task was to respond by button press as rapidly and accurately aspossible to the luminance of the smallest section. Patterns varied in size with 4, 8 or 16 paired sections and the ratio in area of the sections with ratios of (1|0.468, 1|0.518, 1|0.568, 1|0.618, 1|0.668), where 1|0.618 is the golden section.
doi:10.1371/journal.pone.0131045.g001
The Golden Section as Optical Limitation
PLOS ONE | DOI:10.1371/journal.pone.0131045 July 8, 2015 5 / 15

may arise from a central position in the range of ratios [37,38]. The sectioning procedure gen-erates the stimuli in each case by first drawing the rectangular boundary of the whole patternirrespective of ratio, the dimensions of the pattern match those of the screen to avoid biasingresponses towards ratios that more closely match the screen dimensions (in other words wedid not rule out the possibility that self-similarity or the effects of fractal complexity couldextend beyond the stimulus). The pattern was overall 0.5 times the area of the screen and cen-trally placed. The color of the pattern’s interior was randomly assigned to one of either of thepotential target colors “light gray” and “dark gray” in VBA/E-Basic designations. The first sec-tioning was then achieved by multiplying the length along the x-axis to achieve the subdivi-sions of the relevant ratios. After establishing the first section, the sectioning algorithm thenperformed the same operation on the smaller area, with the section matching the target ratiobeing assigned to the smaller of the two areas. The larger sectioned area then underwent thesame operation recursively and with the number of sectioning operations determined by setsize. The two subsections of each paired section were shaded light and dark gray with equalprobability across the overall set of patterns with this procedure the same for all ratios in orderto establish a consistent layout, and to make sure that the target appears in approximately thesame location. Larger set sizes follow the same procedure as longer series of repetitions. Overallpattern size did vary slightly leading to 4 different grid sizes of between 1 and 2° of visual angleat 55 cm viewing distance. All patterns were presented at the center of the monitor screen. InExperiment 3, randomly distributed pixels accounting for 20% of each pattern employed inExperiment 1 were transformed from light or dark grey to either white or black with the resultof pixelating the pattern displays.
Design and ProcedureExperiments 1, 2 and 3 used a within subjects design and a speeded-response task in which par-ticipants were asked to determine the shading (e.g. dark–right key, light–left key) of the overallsmallest pattern section and respond by button press as rapidly and accurately as possible.Some previous studies have linked golden-section preference with visual field morphology orto the velocity of visual scan which exhibits a 3/2 horizontal/vertical ratio [39–41]. Accordingly,in Experiment 2 we examined the hypothesis that if an egocentric, horizontal reference framedefined by the visual field influenced participants’ performance, presentation of vertical insteadof horizontally oriented patterns would exclude any influence of the golden section. Experi-ment 3 added uniform visual noise to the golden-section patterns to convolve with patternstructure and to assess whether or not this influenced the effects of golden sectioning on RTs.Experiment 4 employed a paired comparison task in which participants were asked to rate therelative pleasantness or aesthetic value of one pattern against another.
Each trial started with the presentation of a central fixation cross for 500 milliseconds (ms).The fixation cross was then immediately replaced by the search pattern, to which observersresponded. Patterns remained on screen until a response was recorded. In case of an erroneousresponse or a time-out (i.e., after a period of 2,500 ms without response), feedback was givenby a computer-generated tone and an alert was presented for 500 ms at the center of the screen.Each trial was separated from the next by variable intervals of 500–1,000 ms. Following a20-trial practice session participants completed 600 trials in one 15-block session ensuring 40trials per experimental condition. Pattern presentation was fully randomized across all condi-tions, across blocks and randomized separately for each participant. The experiment was car-ried out in a sound proof booth with low ambient lighting with a chin rest used to ensuredistance between participant’s eyes and the monitor was kept constant at 55 cm.
The Golden Section as Optical Limitation
PLOS ONE | DOI:10.1371/journal.pone.0131045 July 8, 2015 6 / 15

Experiment 4 used a paired comparisons procedure to investigate whether or not there wasa significantly higher preference for the golden ratio relative to the other ratios used in Experi-ment 1. Experiment 4 used the same stimulus patterns with presentation order fully random-ized for 40 trials per condition and 600 trials overall. Participants were asked to report whichpattern of the two they thought was the most ‘pleasing’. The stimuli, stimulus presentation andexperimental conditions were identical to those employed in Experiment 1. Pattern-pair pre-sentation was fully randomized across 25, 40-trial blocks and separately for each participant.The running order of Experiments 1 and 4 were varied such that Experiment 1 was conductedfirst for 50% of participants.
ResultsAnalysis of Aesthetic JudgmentsThe multiple pairwise-comparison data obtained in Experiment 4 (S1 Table) were analyzedaccording to the law of comparative judgment [42], but failed to identify any patterning asranking significantly differently to the median ranking [χ2 (4, N = 60) = 0.52, p = .97]. Theresults of Experiments 1 and 2 are illustrated in Fig 2(A)–2(D). For Experiments 1–3, repeated-measures analyses were carried out using SPSS 21.0 (SPSS, IBM, Inc.), which returns observedor post-hoc power, and partial eta squared (η2) statistics. Trials with error responses wereremoved from the data prior to subsequent analyses. Error RTs tended to be slower overallthan correct RTs, and analysis of the probability correct by RT revealed no significant correla-tion between RT and accuracy. This argues against the correct data being contaminated byaccuracy-speed trade-offs. Examination of the correct RTs revealed non-normal distributionwith pronounced positive skew. A Kolmogorov ‘D’ test showed RT distributions to be approxi-mately lognormal and on this basis subsequent analyses were conducted on the exponents ofthe means of log-transformed RT distributions [43,44]. Huynh-Feldt, Greenhouse Geisser orLower bound epsilon adjustments were applied where sphericity assumptions are not met [45].
Reaction-Time Analyses (Experiments 1 and 2)In Experiment 1, examination of the log-transformed correct RTs (85%) (S1 Dataset) bymeans of a repeated-measures ANOVA revealed significant main effects for ratio [F(2.1, 23.8)= 41.24, p< .001, η2 = .79, power = 1], and pattern [F(2, 22) = 16.9, p< .001, η2 = .61, power =.91] as well as a significant interaction [F(3, 33.46) = 13.25, p< .001, η2 = .55, power = 1].
Fig 2(A) shows that RTs did not increase linearly as a function of an increase in the patternsections as might be expected if participants engaged in serial search for the target section. Fig2(A) also indicates the interaction to be complex: RTs decreased overall with increasing ratioalthough this effect was compromised for both 4 and 8-paired sectioned patterns, which arecharacterized by notably slower RTs to the golden-sectioned patterns. As illustrated in Fig 2(A), the different pattern x ratio RTs were likely to be explained by different models and as aresult, subsequent analyses sought to establish the model that best described the decrease in RTwith ratio for each pattern separately. RTs decreased nonlinearly with increasing ratio for the4- and 16-paired-sectioned patterns [logarithmic r2 = .752, F(1,3) = 9.072, p = 0.057 and qua-dratic r2 = .964, F(2,2) = 26.4, p< .036, respectively]. The 8-paired sectioned pattern wasexplained by a near perfect linear function, but only following removal of the golden ratio RTs[r2 = .996, F(1,3) = 454.8, p< .001], and was not linear if analysis included these RTs [r2 =.448, F(1,3) = 2.43, p = .217, see Fig 2(B)]. Note that the logarithmic fit of RT over ratio alsoimproved slightly for the 4-paired sectioned patterns following removal of the golden ratioRTs, but the fit failed to achieve significance (logarithmic r2 = 0.862). Because RTs did not
The Golden Section as Optical Limitation
PLOS ONE | DOI:10.1371/journal.pone.0131045 July 8, 2015 7 / 15
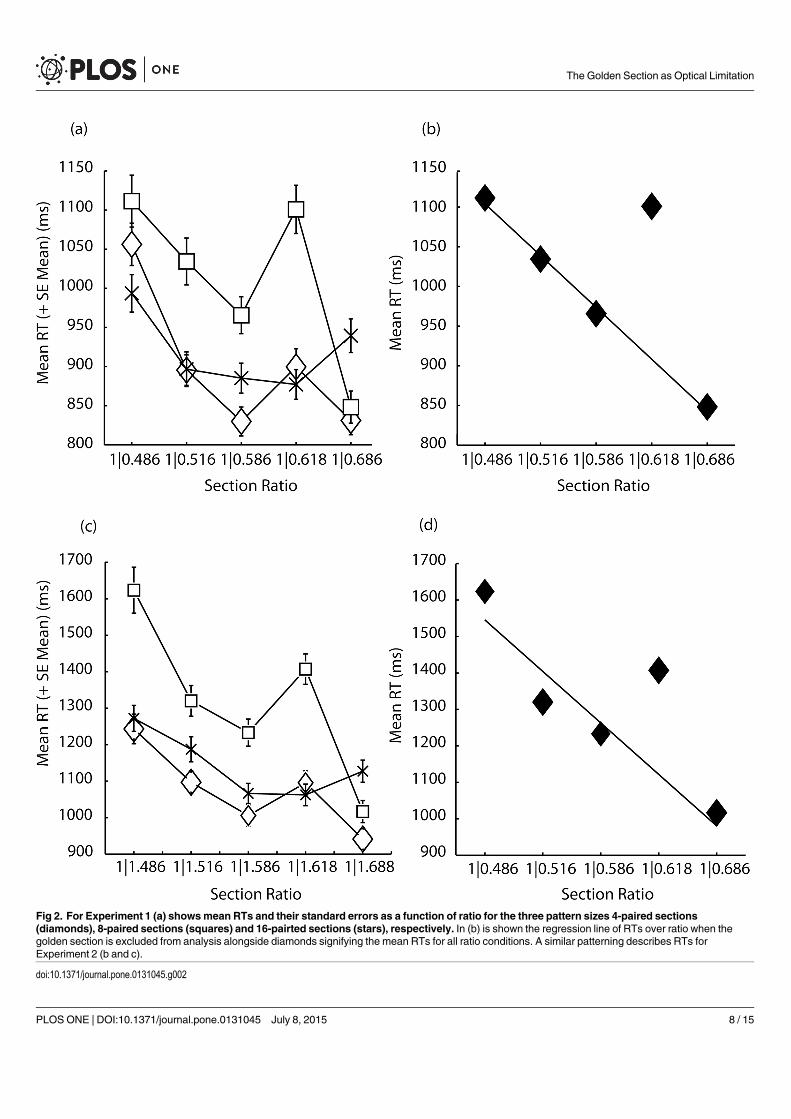
Fig 2. For Experiment 1 (a) showsmean RTs and their standard errors as a function of ratio for the three pattern sizes 4-paired sections(diamonds), 8-paired sections (squares) and 16-pairted sections (stars), respectively. In (b) is shown the regression line of RTs over ratio when thegolden section is excluded from analysis alongside diamonds signifying the mean RTs for all ratio conditions. A similar patterning describes RTs forExperiment 2 (b and c).
doi:10.1371/journal.pone.0131045.g002
The Golden Section as Optical Limitation
PLOS ONE | DOI:10.1371/journal.pone.0131045 July 8, 2015 8 / 15

decrease linearly with an increase in the number of sections we might conclude that RT vari-ability relates more to discrimination at the target location than it does to search.
Fig 2(C) shows that the pattern of correct RTs (92%) in Experiment 2 (S2 Dataset) veryclosely matched those in Experiment 1: there were significant main effects for ratio, [F(1.6,11.4) = 24.06, p< .001, η2 = .78, power = .99], and pattern [F(1.11, 7.8) = 25, p = .001, η2 = .78,power = .99] while the interaction was also significant [F(1.82, 12.73) = 7.39, p = .008, η2 = .51,power = .85]. As with Experiment 1, RTs decreased nonlinearly with increasing ratio for the 4-and 16-paired-sectioned patterns [logarithmic r2 = .776, F(1,3) = 10.4, p = 0.048 and quadraticr2 = .946, F(2,2) = 17.57, p = .054, respectively]. Again consistent with Experiment 1, examina-tion of RTs to the 8-paired sectioned patterns revealed a linear function only following removalof the golden section RTs [r2 = .919, F(1,3) = 22.72, p = .018], and not on the basis of analysisof the full range of RTs over ratio [linear r2 = .637, F(1,3) = 5.27, p = .105, see Fig 2(D)]. Similaragain to Experiment 1, there was a logarithmic fit of RT over ratio following removal of thegolden section RTs in the 4-paired sectioned patterns [r2 = .987, F(2,2) = 154.72, p = .006],which was not found for the 16-paired sectioned patterns.
Response-Error Analyses (Experiments 1 and 2)Analysis of response error (15% and 7.9% of trials overall in Experiments 1 and 2 S2 Table andS3 Table) were carried out using the same ANOVA as for the RTs but on the arcsined square-root error proportions. These analyses revealed significant main effects for ratio in both experi-ments [F(2.1, 23.4) = 39.9, p< .001, η2 = .78, power = 1 and [F(4, 28) = 39.5, p< .001, η2 = .85,power = 1, for Experiments 1 and 2, respectively], which is consistent with the correspondingRT effects, i.e. improved task performance is associated with faster RTs. In Experiment 1 sim-ple-effects analysis of the ratio x pattern interaction [F(7.2, 78.8) = 24, p< .001, η2 = .69,power = 1] showed 8-paired (golden)-sectioned patterns produced significantly higher errorsthan were produced for the 1:0.518 (p< .001), 1:0.568 (p = .013) and 1:0.668 (p< .001) ratios.However and unlike the RT analyses, this pattern was not replicated for Experiment 2 in whicha corresponding simple-effects analysis showed no differences in error production between the8-paired (golden)-section and other patterns. These patterns in error production tend to sug-gest that the task becomes overall easier with increasing ratio, and the increasing conspicuity ofthe smallest sections. However, the pattern of RT performance to the 8-paired section condi-tions is not consistently matched by variations in task difficulty.
Fractal Patterning (Experiments 1 and 2)Because self-similarity characterizes both natural scenes and art, including abstract composi-tions [46,47] it was decided to examine any effects of the fractal dimensionality of the stimulusgrids on the RTs from Experiment 1. Analysis of these RT data suggests that golden sectioninginfluences processing at the level of the local section and not mechanisms involved in patternsearch. However the specificity of this effect to the 8-paired sectioned patterns suggests thatpattern composition plays a critical role. All of the patterns were fractal in that smaller sectionswere reduced copies of larger sections and golden sectioning may be a mathematical fractalwhen the ratio refers to a formula that is based upon recursive iteration. Accordingly, it seemedsensible to assess whether or not RTs to golden-section patterns were influenced by fractaldimensionality. If RTs were found to correspond to the fractal dimension (d) between goldenratio and other ratios, it might be conjectured that slowed RTs to the golden-sectioned gridscame about due to an inability to successfully separate the target from the background as afunction of fractal dimensionality.
The Golden Section as Optical Limitation
PLOS ONE | DOI:10.1371/journal.pone.0131045 July 8, 2015 9 / 15

Fig 3(A) illustrates the Minkowski–Bouligand or box-counting dimension of the differentratio conditions. Box counting characterizes a fractal set by determining the number (N) ofboxes of size R required to cover the fractal set, following the power law N = N0!R-df withdf< = d. Estimating the log-log fit for each distribution of N for different box sizes revealedthe following, near identical exponents for each ratio condition (Table 1):
Fig 3. (a) The Minkowski–Bouligand or box-counting dimension for the 5 ratios (1|0.468, 1|0.518 and 1|0.568 circles, squares and diamond,respectively) as well as (1|0.618, and 1|0.668, large open diamond and star). Box counting characterizes a fractal set by determining the number (N) ofboxes of size R required to cover the fractal set, following the power law N = N0*R-df with df < = d (or fractal dimension). In (b) the spatial frequency structureof the golden-16-sectioned patterns, determined by application of a bank of log-Gabor filters is illustrated by the black continuous line, with golden-4- and16-paired sectioned patterns presented for comparison purposes as gray discontinuous lines. Unlike any other pattern the 8-paired (golden) sectionedpattern exhibits an absence in spatial frequency information in the middle of the range of spatial frequencies possessed by the pattern, at around 3–7 cyclesper degree of visual angle. Addition of uniformly distributed random noise (white or black pixels) to 20% of the 8-paired sectioned patterns convolved with thenatural pattern amplitude spectra of the patterns to raise all lower values in the amplitude spectrum, particularly, raising zero values above zero. The blackdashed line illustrates the resulting amplitude spectrum. An example pattern is given in (c); (d) shows that following this modification, in Experiment the 3,golden-section RTs were not elevated as had been found in Experiments 1 and 2 but corresponded to the approximately linear negative function describingRT over ratio.
doi:10.1371/journal.pone.0131045.g003
The Golden Section as Optical Limitation
PLOS ONE | DOI:10.1371/journal.pone.0131045 July 8, 2015 10 / 15

It can be observed from Fig 3(A) that as the number of boxes increases the degrees of free-dom or number of dimensions decrease in this case over the range 2–1. Within this range, anal-ysis of all sample points (dimensions) using logistic regression analysis showed mean RTscorrelated reasonably well (although non-significantly) with the number of boxes. While by nomeans conclusive this analysis is suggestive of a relationship between fractal dimensionalityand RTs, with the best correlation for d = 1 where McFadden’s pseudo r2 = .418, χ2(4, N = 5) =6.73, p = .151. However and related to our question, explanatory power was only slightlyreduced following the removal of the golden-section RTs (r2 = .406) suggesting that thegolden-section RTs are unlikely to deviate substantially from any more general relationshipbetween RTs and fractal dimensionality [48].
Spatial-Frequency Structure (Experiments 1 and 2)We believed a second possibility was that the spatial-frequency structure of the patterns them-selves related to the slowed RTs. In a first step all patterns were subject to analysis using a bankof log-Gabor filters [49] to better approximate the 1/f amplitude spectra present in naturalimages than Gabor filters while also being analogous with measures of human visual-systemfunction, which indicate we have neuronal responses that are symmetric on the log frequencyscale. The results of this analysis are given in Fig 3(B) [50] Here it can be seen that unlike anyother patterns tested, the 8-paired (golden)-sectioned patterns exhibit an absence of informa-tion in the amplitude spectrum across a bandwidth of over 3 cycles-per-degree within therange 4–7 cycles-per-degree. One corollary with this might be in the number of light or darksections that sit adjacent but are of different polarity to the target section, however RTs werefound not to correlate (r2 = .04) with the number of adjacent sections of opposing polarity.
Experiment 3: Reaction-Time and Response-Error AnalysisIn Experiment 3 the spatial frequency structure of the 16-sectioned patterns was masked byaddition of uniformly distributed random noise (white or black pixels). Twenty-percent ofeach pattern was masked by noise allowing target sections to remain discriminable while at thesame time influencing the amplitude spectra of the patterns: analysis of the resulting patternsusing log-Gabor filters had the effect, illustrated in Fig 3(B), of convolving spatial frequencyinformation in the noise with the existing spatial-frequency structure, thus augmenting lowervalues in the amplitude spectrum and raising all zero values above zero. If the unusual spatial-frequency structure of golden-sectioned patterns were responsible for the RT outliers in Exper-iments 1 and 2, the addition of uniformly distributed noise in the current experiment shouldreduce the golden-section RTs, which should then not be found to deviate significantly fromthe function describing decreasing RT over ratio. In Experiment 3 the ratio main effect was thesame as that found in Experiments 1 and 2 [F(1, 9) = 51, p< .001, η2 = .85, power = 1]. How-ever and consistent with expectations, RTs decreased linearly with increasing ratio ([r2 = .9,
Table 1. Exponents describing the fractal dimensionality for each of the ratios employed in Experi-ments 1, 2 and 3.
Ratio Exponent
1:0.468 -0.5822
1:0.518 -0.5699
1:0.568 -0.5341
1:0.618 -0.5424
1:0.668 -0.5405
doi:10.1371/journal.pone.0131045.t001
The Golden Section as Optical Limitation
PLOS ONE | DOI:10.1371/journal.pone.0131045 July 8, 2015 11 / 15

F(1,3) = 26.97, p = .014 Fig 3(D) S3 Dataset] and did not show the increase in RTs to thegolden-section patterns that was found in Experiments 1 and 2.
Analysis of response error (5.5% of trials overall in Experiment 3 S4 Table) was carried outusing the same ANOVA as for the RTs but on the arcsined square-root error proportions.These analyses revealed significant main effects for ratio [F(1, 9) = 32.8, p< .001, η2 = .79,power = 1], which is consistent with the corresponding RT effects, i.e. improved task perfor-mance is associated with faster RTs. No other effects were found.
DiscussionExperiments 1–3 show that golden-sectioned patterns yield less efficient visual target discrimi-nation as a function of unusual spatial-frequency distributions within the patterns. In this con-text the golden section serves as a limit to the efficient functioning of perceptual processing.Fig 2 panels (a) and (c) show RTs be approximately distributed such that discrimination perfor-mance is fastest for 4, then 16 and slower for the 8-paired sectioned patterns. This suggests thatit is not target-section search (which, if serial would favor a 4-8-16-section order in RT magni-tude) but time taken to process at the target location that is influenced by golden sectioning.This is consistent with the idea that inefficient and/or absent synchronization between neuronsparticipating in spatial frequency analysis requires additional processing resources (for exampletop-down driven synchronization) and therefore more time to successfully process the pattern.Linkage with previously discussed ideas [12] derives from the assumption that within-patternsegmentation is achieved by virtue of frequency or phase differences between neural responsesto the larger and smaller sections. On this assumption, inefficient or absent synchronizationbetween neural responses might result in inefficient, and as a consequence slowed processingbecause neurons coding the different sections would operate in different temporal codes thatwould not easily combine to facilitate their processing within a common framework.
Concerning the relationship of the golden section to aesthetic preference, the contributionof Experiment 4 to the mixture of findings for and against, weighs in against the idea of goldensectioning as a major principle underlying aesthetic preference [2]. However, this conclusionmay be premature and the relationship between golden sectioning and aesthetic appeal morecomplex than is often taken into account. To illustrate this: in difficult visual-search displays, itmay happen that a participant exercises an “optimal stopping rule”, application of the ruleequivalent to responding because “it never usually takes this long to make a response”, andunder such circumstances, the rule might explain a peak in errors at slow response latencies. Inthe present context, and given an understanding that there may a basis for aesthetic appeal insome of the presented patterns, a participant might judge patterns that are more difficult toprocess as aesthetic simply because they are taking unusually long to view. In spite of the factthat this judgment would likely occur without introspection on the fact that it is made basedupon noticeably prolonged viewing, if it were the case, golden-section preference might be con-sidered a demand characteristic in an experimental procedure. However and equally, contem-porary art forms similar to the stimuli employed in this study can be considered to possessaesthetic value. In theses cases, prolonged viewing might be sufficient to encourage an aestheticdialog, proceeding from the observation that “I have been viewing this work for slightly longerthan usual”. Of course this does not account for why, in Experiment 4, participants did notprefer the golden-sectioned patterns over other patterns. Perhaps in this case initiation of theaesthetic dialog relies upon prior, relevant knowledge of the potential for the patterns to pos-sess aesthetic appeal. If so, and if participant samples were not deliberately biased towards non-naive participants, measuring aesthetic preference may end up being a matter of chance ratherthan based upon systematic variation of the experimental conditions.
The Golden Section as Optical Limitation
PLOS ONE | DOI:10.1371/journal.pone.0131045 July 8, 2015 12 / 15

Two future research agendas emerge from this: agenda (a) recommends using neurosciencemethods to investigate the functional dynamics of mechanisms engaging, via synchronizedactivity, two or more neural assemblies either in golden ratio or in response to a stimulus char-acterized by the golden ratio; agenda (b) rests on the assumption that, under some circum-stances, an aesthetic response could evolve as a consequence of the viewer respondingimplicitly (and in the same sense as governs operation of an optimal stopping rule in visualsearch) to viewing a particular pattern for unusually longer than other patterns. In an artisticcontext this may encourage more explicit introspection and the development of an aestheticdialog, in this instance with golden-sectioned images.
In conclusion, golden sectioning influences the efficiency of visual processing. This appearsto be a function of the absent spatial-frequencies within the 8-paired sectioned patterns but it isnot related to the fractal dimensionality of the golden-sectioned patterns. It is interesting tonote that 4–7 cycles-per-degree is found within the human contrast sensitivity function, whichshows a band-pass filter shape peaking at around 4 cycles-per-degree [51]. This suggests thatthe optical limit possessed by golden-sectioned patterns lies in the absence of spatial frequen-cies to which the visual system is maximally sensitive. The resultant slowing in processing mayarise due to the need to engage spatial frequency analyzers by means of top-down activation.This leads to the tentative hypothesis that, slowed processing to a particular pattern within aset of similarly structured patterns, may be sensed by the observer and under particular circum-stances (e.g. given art-like pattern structure and when the observer is aware of the possibilityfor aesthetic dialog) may initiate an aesthetic response. While not a general theory of aesthetics,this account might describe why under some circumstances, the golden section appears to beof aesthetic value and on other occasions does not. This conclusion requires further scientificstudy.
Supporting InformationS1 Dataset. Experiment 1, raw and tabulated RT data.(DOCX)
S2 Dataset. Experiment 2, raw and tabulated RT data.(DOCX)
S3 Dataset. Experiment 3, raw and tabulated RT data.(DOCX)
S1 Table. Tabulated data for Experiment 4.(DOCX)
S2 Table. Experiment 1, tabulated error data.(DOCX)
S3 Table. Experiment 2, tabulated error data.(DOCX)
S4 Table. Experiment 3, tabulated error data.(DOCX)
Author ContributionsConceived and designed the experiments: MAE PM. Performed the experiments: JK JF JB.Analyzed the data: JK PMMAE. Contributed reagents/materials/analysis tools: MAE. Wrotethe paper: MAE PM.
The Golden Section as Optical Limitation
PLOS ONE | DOI:10.1371/journal.pone.0131045 July 8, 2015 13 / 15

References1. Fowler HD. (1982) A generalization of the golden section. Fibonacci Quart 20: 146–158.
2. Livio M (2008) The golden ratio: The story of phi, the world's most astonishing number. RandomHouse: LLC.7. 304 p.
3. Ogden RM (1937) Naive geometry in the psychology of art. Am J Psychol 49: 198–216.
4. Ghyka M (1977) The geometry of art and life. New York: Dover. 174 p.
5. Hambridge J (1920) Dynamic Symmetry: The Greek Vase. New Haven CT: Yale University Press. 161p.
6. Lynch JW, Hathaway RJ (1993) Projectile Point Morphology: A Note on the Golden Section. J QuantAnthropol 4: 211–220.
7. Pacioli di Borgo L (1509) De Divina Proportione [On Divine Proportion]
8. Zeising A (1854)Neue Lehre von den Proportionen des menschlischen Körpers [New Theory of theProportions of Human Bodies]. Leipzig: Weigel.
9. Zeising A (1855) Äesthetische Forschungen [Aesthetic Research]. Frankfurt: Medinger.
10. Fechner GT (1865) Über die frage des golden Schnitts [On the question of the golden section]. ArchZeich Künste 11: 100–112.
11. Green CD (1995) All that glitters: A review of psychological research on the aesthetics of the goldensection. Perception 24: 937–968. PMID: 8848362
12. Pletzer B, Kerschbaum H, KlimeschW (2010) When frequencies never synchronize: The golden meanand the resting EEG. Brain Res 1335: 91–102. doi: 10.1016/j.brainres.2010.03.074 PMID: 20350536
13. Başar E (1998) Brain Function and Oscillations. II. Integrative Brain Function. Neurophysiology andCognitive Processes. Berlin, Heidelberg, New York: Springer. 476 p.
14. Salinas E, Sejnowski TJ (2001) Correlated neuronal activity and the flow of neural information. Nat RevNeurosci 2: 539–550. PMID: 11483997
15. Varela F, Lachaux JP, Rodrigeuz E, Martinerie J (2001) The brainweb: phase synchronization andlarge-scale integration. Nat Rev Neurosci 2: 229–239. PMID: 11283746
16. Başar-Eroğlu C, Başar E, Demiralp T, Schürmann M (1992) P300-response: possible psychophysio-logical correlates in delta and theta frequency channels. A review. Int J Psychophysiol 13: 161–179.PMID: 1399755
17. Başar E, Başar-Eroğlu C, Karakaş S, Schürmann M (1999) Are cognitive processes manifested inevent-related gamma, alpha, theta and delta oscillations in the EEG? Neurosci Lett 259: 165–168.PMID: 10025584
18. Başar E, Başar-Eroğlu C, Karakaş S, Schürmann M (2001) Gamma, alpha, delta, and theta oscillationsgovern cognitive processes. Int J Psychophysiol 39: 241–248. PMID: 11163901
19. Fries P (2005) A mechanism for cognitive dynamics: neuronal communication through neuronal coher-ence. Trends Cogn Sci 9: 474–480. PMID: 16150631
20. Schroder CE, Lakatos P (2008) Low-frequency neuronal oscillations as instruments of sensory selec-tion. Trends Neurosci 32: 9–18. doi: 10.1016/j.tins.2008.09.012 PMID: 19012975
21. Canolty R, Knight RT (2010) The functional role of cross-frequency coupling. Trends Cogn Sci 14:506–515. doi: 10.1016/j.tics.2010.09.001 PMID: 20932795
22. Restle F. Visual illusions. In: Appley MH, editor. Adaptation level theory. New York: Academic Press;1971. pp. 55–69.
23. Restle F. Relativity and organization individual size judgments. In: Leeuwenberg ELJ, Buffart HFJM,editors. Formal theories of visual perception. New York: Wiley; 1978. pp. 247–263.
24. Pressey AW (1972) The assimilation theory of geometric illusions: An additional postulate. PerceptPsychophys 11: 28–30.
25. Anstis SM (1974) Size adaptation to visual texture and print: Evidence for spatial frequency analysis.Am J Psychol 87: 261–267. PMID: 4451210
26. Blakemore CB, Sutton P (1969) Size adaptation: a new after-effect. Science 166: 245–247. PMID:5809598
27. Blakemore C, Nachmias J, Sutton P (1970) The perceived spatial frequency shift: Evidence for fre-quency selective neurones in the human brain. J Physiol 210: 727–750. PMID: 5499822
28. Elul R (1972) The genesis of the EEG. Int Rev Neurobiol 15: 227–272.
29. Pfurtscheller G, Lopes da Silva FH (1999) Event-related EEG/MEG synchronization and desynchroni-zation: basic principles. Clin Neurophysiol 110: 1842–1857 PMID: 10576479
The Golden Section as Optical Limitation
PLOS ONE | DOI:10.1371/journal.pone.0131045 July 8, 2015 14 / 15

30. Lopes da Silva FH, van Rotterdam A, Barts P, van Heusden E, Burr W. Models of neuronal populations:the basic mechanisms of rhythmicity. In: Corner MA, Swaab DF, editors. Perspectives of brainresearch, Prog Brain Res, vol. 45, 1976. pp. 281–308.
31. Ganor-Stern D, Karasik-Rivkin I, Tzelgov J (2011) Holistic representation of unit fractions. Exp psychol58: 201–206. doi: 10.1027/1618-3169/a000086 PMID: 21106472
32. Schneider M, Siegler RS (2010) Representations of the magnitudes of fractions. J Exp Psychol HumPercept Perform 36: 1227–1238. doi: 10.1037/a0018170 PMID: 20873937
33. Barraza P, Gómez DM, Oyarzún F, Dartnell P (2014) Long-distance neural synchrony correlates withprocessing strategies to compare fractions. Neurosci Lett 567: 40–44. doi: 10.1016/j.neulet.2014.03.021 PMID: 24680853
34. Jacob SN, Vallentin D, Nieder A (2012) Relating magnitudes: the brain's code for proportions. TrendsCogn Sci 16: 157–166. doi: 10.1016/j.tics.2012.02.002 PMID: 22377692
35. Cohen MX (2008) Assessing transient cross-frequency coupling in EEG data. J Neurosci Meth 168:494–499.
36. These ratios relate to a comparison of the area being sectioned to its subsequent largest section.Another way is to define the subdivisions in the extreme:mean format rather than whole:extreme. Thiswould give ratios of 0.88:1, 1.08:1, 1.32:1, 1.618:1 (golden section), and 2.01:1. This spread mightallow us to provide easier discriminability between stimuli, as well as coming closer to a 1:1 or maxi-mally stable ratio for the second ratio.
37. Godkewitsch M (1974) The 'golden section': an artifact of stimulus range and measure of preference.Am J Psychol 87: 269–277. PMID: 4451211
38. McManus IC (1980) The aesthetics of simple figures. Brit J Psychol 71: 505–524. PMID: 7437674
39. Hintz JM, Nelson TM (1970) Golden section: Reassessment of the perimetric hypothesis. Am J Psychol83: 126–129. PMID: 5449389
40. LeRoy A, Stone LA, Collins LG (1965) The golden section revisited: A perimetric explanation. Am JPsychol 78: 503–506. PMID: 14344099
41. Bejan A (2009) The golden ratio predicted: Vision, cognition and locomotion as a single design innature. Int J Design Nature Ecodynamics 4: 97–104.
42. Thurstone LL (1927) A law of comparative judgment. Psychol Rev 34: 273–286.
43. Box GEP, Cox DR (1964) An analysis of transformations. J R Stat Soc: 211–252.
44. Box GEP, Cox DR (1982) An analysis of transformations revisited, rebutted. J Am Stat Assoc 77: 209–210.
45. Huynh H, Feldt LS (1976) Estimation of the Box correction for degrees of freedom from sample data inthe randomized block and split plot designs. J Educ Stat 1: 69–82.
46. Spehar B, Clifford CW, Newell BR, Taylor RP (2003) Universal aesthetic of fractals. Comput Graph 27:813–820.
47. Redies C (2007) A universal model of esthetic perception based on the sensory coding of natural sti-muli. Spatial Vision 21: 97–117. PMID: 18073053
48. Fractal dimensionality was calculated using the Matlab package authored by F. Moisy and is availableunder http://www.fast.u-psud.fr/~moisy/ml/boxcount/html/demo.html
49. Field DJ (1987) Relations between the statistics of natural Images and the response properties of corti-cal cells. J Opt Soc Am A 4: 2379–2394. PMID: 3430225
50. Patterns were analyzed using the gaborconvolve Matlab function for convolving image with log-Gaborfilters. This function is authored by P. Kovesi and available under http://www.csse.uwa.edu.au/~pk/Research/MatlabFns/PhaseCongruency/gaborconvolve.m
51. Campbell FW, Robson JG (1968) Application of Fourier analysis to the visibility of gratings. J Physiol197: 551–566. PMID: 5666169
The Golden Section as Optical Limitation
PLOS ONE | DOI:10.1371/journal.pone.0131045 July 8, 2015 15 / 15