the fundamental aspects of carbon nanotube metrology
TRANSCRIPT

p s sbasic solid state physics
b
statu
s
soli
di
www.pss-b.comph
ysi
ca
REPRINT
The fundamental aspects of carbon nanotube metrology
Ado Jorio, Indhira O. Maciel, Paulo T. Araujo, Pedro B. C. Pesce,
and Marcos A. Pimenta
Dept. de Física, Univ. Federal de Minas Gerais, Belo Horizonte, MG, 30123-970, Brazil
Received 22 May 2007, revised 15 June 2007, accepted 21 September 2007
Published online 8 November 2007
PACS 71.35.–y, 73.22.–f, 78.30.Na, 78.55.–m, 78.67.Ch
The accurate and reproducible measurement of the properties and performance characteristics of nano-
scale materials, devices and systems are essential for quality and process control, commercial transactions
and effective regulations. Scientists, manufacturers, governments, regulators and health and environ-
mental protection agencies, will need measurement systems and evaluation protocols supported by well
founded and robust standards, both physical and documentary. In this paper we discuss some fundamental
aspects of the use of the resonance Raman spectroscopy of the radial breathing mode (RBM) of single
wall carbon nanotubes (SWNTs) for metrological purposes. The achievements and problems are pointed,
hoping for the development of procedures capable of making the promised nanotechnology revolution to
become a reality.
phys. stat. sol. (b) 244, No. 11, 4011–4015 (2007) / DOI 10.1002/pssb.200776179
phys. stat. sol. (b) 244, No. 11, 4011–4015 (2007) / DOI 10.1002/pssb.200776179
© 2007 WILEY-VCH Verlag GmbH & Co. KGaA, Weinheim
Original
Paper
The fundamental aspects of carbon nanotube metrology
Ado Jorio*, Indhira O. Maciel, Paulo T. Araujo, Pedro B. C. Pesce,
and Marcos A. Pimenta
Dept. de Física, Univ. Federal de Minas Gerais, Belo Horizonte, MG, 30123-970, Brazil
Received 22 May 2007, revised 15 June 2007, accepted 21 September 2007
Published online 8 November 2007
PACS 71.35.–y, 73.22.–f, 78.30.Na, 78.55.–m, 78.67.Ch
The accurate and reproducible measurement of the properties and performance characteristics of nano-
scale materials, devices and systems are essential for quality and process control, commercial transactions
and effective regulations. Scientists, manufacturers, governments, regulators and health and environ-
mental protection agencies, will need measurement systems and evaluation protocols supported by well
founded and robust standards, both physical and documentary. In this paper we discuss some fundamental
aspects of the use of the resonance Raman spectroscopy of the radial breathing mode (RBM) of single
wall carbon nanotubes (SWNTs) for metrological purposes. The achievements and problems are pointed,
hoping for the development of procedures capable of making the promised nanotechnology revolution to
become a reality.
© 2007 WILEY-VCH Verlag GmbH & Co. KGaA, Weinheim
1 Introduction
Historically, the diffusion of a coherent measurement system, based on invariant physical properties, was
the consequence of a radical transformation in the world [1]. In 1889, as a result of the work of many
scientists over many decades, a standardization document was approved at the Weights and Length Gen-
eral Conference in Paris [2]. The equations relating national and international standards for the meter and
kilogram were within the limits of ±0.01 mm and ±1 mg. Even though technology has improved sub-
stantially and the international system of units is well established, nanoscience promises a revolution in
technology. The development of nanotechnology is now bringing us back to the very basic problem of
defining metrics and measurement systems, back to the basics of metrology [3–5]. The fast development
of carbon nanotube science and applications urged studies on metrology, standardization and industrial
quality control.
Development of protocols for the definition of sample parameters like structural metrics, physical
properties and stability are important for both research and applications of carbon nanotubes. This paper
focuses on the use of the radial breathing mode (RBM) resonance Raman spectroscopy as a characteriza-
tion tool, discussing the achievements, limitations and directions where further research is needed for the
development of standards and protocols for metrology. Although development of standards has a clear
applied aspects, it has to be carefully based on fundamental aspects. The importance of the excitonic
nature of the optical transitions in carbon nanotubes for the correct description of the diameter depend-
ence and environmental effects on the resonance Raman signal is now evident. Any optically based di-
ameter characterization of a carbon nanotube sample has to take this fundamental aspect into account for
an accurate description. This property becomes more important in the low diameter limit (dt below
* Corresponding author: e-mail: [email protected]

4012 A. Jorio et al.: The fundamental aspects of carbon nanotube metrology
© 2007 WILEY-VCH Verlag GmbH & Co. KGaA, Weinheim www.pss-b.com
2 nm), where spatial confinement enhances substantially the electron–electron and electron–hole
Columbic interactions. These issues will be discussed here.
2 Experimental details
A triple-monochromator Raman spectrometer can be used for resonance Raman spectroscopy studies,
since it uses no notch filter, so that the excitation laser line can be tuned continuously. Equipped with a
coupled charge device (CCD) detector, a Dilor XY has been used for the experiments. Back-scattering
configuration through a microscope is used. The different excitations come from an ArKr laser, a
Ti :Sapphire laser and a Dye laser pumped by a 6 W Ar laser. The single-wall carbon nanotube (SWNT)
samples used here are carpet-like CVD grown.
3 Basic principles
Optical techniques have been largely used to characterize carbon nanotubes. The advantages of optics
rely on both experimental and fundamental aspects. Experimentally, the techniques are readily available,
relatively simple to perform, quick, and can be performed at room temperature and under ambient pres-
sure. Fundamentally, the optical techniques are non-destructive and non-invasive because they use the
photon, a massless and chargeless particle, as a probe. Furthermore, optical experiments can be carried
out at the single nanotube level [6–8] due to the unusually high optical response of nanotubes, which is a
consequence of the one-dimensional confinement of their electronic structure [9].
Despite the specificity of each optical technique, the basis for the understanding of the optical
responses from carbon nanotubes is common to all optical spectroscopies and can be represented by
the so-called Kataura plot, proposed by Kataura et al. in 1999 [10], plotting the optical transition ener-
gies Eii as a function of tube diameter dt. An enormous number of experimental and theoretical works
have been done in order to establish this plot [11], i.e. to establish the (n, m) dependence for Eii. The first
and second optical levels for semiconducting tubes, ES11 and ES
22, respectively, are related to strongly
bound excitons, while for the higher lying levels ESii, i > 3, the electronic continuum might screen the
exciton binding energies [12]. EM11 is the lowest set of transition energies for metallic SWNTs. Good
agreement between experimental and theoretical values for Eii has been obtained by using an extended
(non-orthogonal, symmetry adapted) tight binding model [13, 14] plus diameter dependent many-body
corrections [15]. A simple expression for Eii, that can be used to build a Kataura plot, has been intro-
duced recently [12]:
Eii( p, dt, θ) = {a( p/dt) [1 + b · log (c · p/dt)] + βp cos (3θ)/dt
2} + γp/dt , (1)
with a = 1.049 eV nm, b = 0.456 and c = 0.812 nm–1 and p = 1, 2, 3, 4, 5 for ES11, E
S22, E
M11, E
S33, E
S44, respec-
tively, for vertically aligned single-wall carbon nanotubes grown by the chemical vapour deposition
method from alcohol [16]. The experimental βp values for the lower (upper) Eii branches are
–0.07(0.05), –0.19(0.14), –0.19 (not observed), –0.42(0.42) and –0.4(0.4) for p = 1, 2, 3, 4 and 5, re-
spectively. Each term has its physical origin, as discussed in Ref. [12], and the last term (outside the
curly brackets) applies only for the Eii levels with p > 3, with γ = (0.305 ± 0.004) eV nm.
This functional is consistent with experimental results on CoMoCAT and HiPco tubes in SDS aqueous
solution, alcohol assisted and water assisted CVD grown aligned SWNT samples, and isolated SWNTs
suspended on Si trenches, measured by resonance Raman spectroscopy, photoluminescence-excitation
and Rayleigh scattering, as discussed in Refs. [12, 17–19]. In the water assisted CVD grown SWNT
samples, Eq. (1) was shown to apply up to the sixth optical level in semiconducting SWNTs, and up to
the fourth optical level in metallic SWNTs. However, the Eii values are expected to change with changes
in environment (within 1–10% for bundling, temperature and pressure dependent effects [17–19]).
Environmental effects is a big challenge for metrology, and advances are obtained by taking the same
tube and putting it in different environments. Controlled and systematic experiments are needed.
phys. stat. sol. (b) 244, No. 11 (2007) 4013
www.pss-b.com © 2007 WILEY-VCH Verlag GmbH & Co. KGaA, Weinheim
Original
Paper
4 Resonance Raman spectroscopy of the RBMs in SWNTs
The RBM is unique to carbon nanotubes and it is not observed in other carbon materials. It has the very
important property of being proportional to the inverse tube diameter. By considering that common Ra-
man instruments have a spectral accuracy of about 1 cm–1, and that the RBM frequencies (ωRBM) from
typical samples (diameters dt around 0.5–5.0 nm) range from 500–50 cm–1, Raman spectra can deter-
mine the tube diameter with 1 angstrom accuracy for a dt = 5.0 nm tube, the accuracy increasing with
decreasing diameter, reaching 1pm accuracy for a dt = 0.5 nm tube. The use of a triple-monochromator in
additive mode can get this resolution to 0.1 cm–1 in frequency, i.e. up to 0.1 pm resolution in the diameter
determination.
The big problem is the determination of the precise relation between ωRBM and dt [9, 15, 17–19]. Al-
though the RBM frequency has been shown to be weakly dependent on doping (charge transfer) or laser
heating (temperature-dependent effects), there are many different ωRBM vs. dt relations in the literature,
probably due to the different environmental conditions on each particular measurement. While very small
diameter tube may exhibit a chiral angle dependent curvature effects, ideally the intrinsic relation should
converge to ωRBM = 227/dt for larger diameter tubes, consistent with the elastic properties of graphite [15].
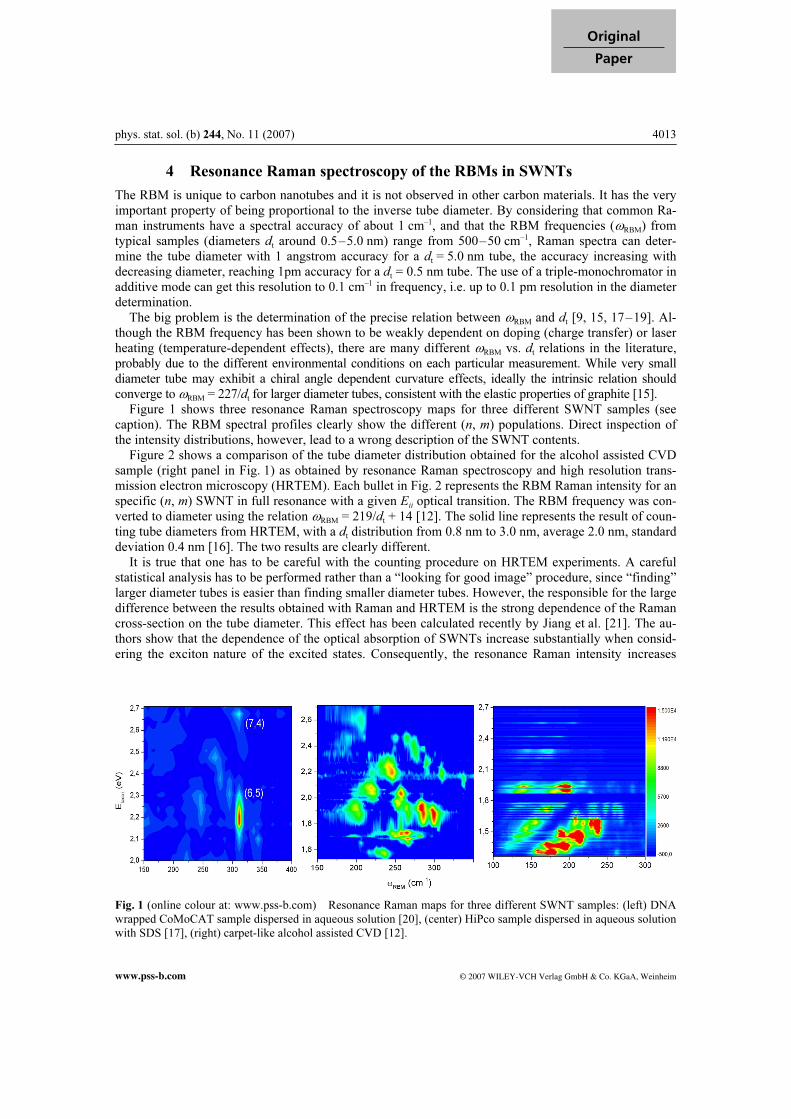
Figure 1 shows three resonance Raman spectroscopy maps for three different SWNT samples (see
caption). The RBM spectral profiles clearly show the different (n, m) populations. Direct inspection of
the intensity distributions, however, lead to a wrong description of the SWNT contents.
Figure 2 shows a comparison of the tube diameter distribution obtained for the alcohol assisted CVD
sample (right panel in Fig. 1) as obtained by resonance Raman spectroscopy and high resolution trans-
mission electron microscopy (HRTEM). Each bullet in Fig. 2 represents the RBM Raman intensity for an
specific (n, m) SWNT in full resonance with a given Eii optical transition. The RBM frequency was con-
verted to diameter using the relation ωRBM = 219/dt + 14 [12]. The solid line represents the result of coun-
ting tube diameters from HRTEM, with a dt distribution from 0.8 nm to 3.0 nm, average 2.0 nm, standard
deviation 0.4 nm [16]. The two results are clearly different.
It is true that one has to be careful with the counting procedure on HRTEM experiments. A careful
statistical analysis has to be performed rather than a “looking for good image” procedure, since “finding”
larger diameter tubes is easier than finding smaller diameter tubes. However, the responsible for the large
difference between the results obtained with Raman and HRTEM is the strong dependence of the Raman
cross-section on the tube diameter. This effect has been calculated recently by Jiang et al. [21]. The au-
thors show that the dependence of the optical absorption of SWNTs increase substantially when consid-
ering the exciton nature of the excited states. Consequently, the resonance Raman intensity increases
Fig. 1 (online colour at: www.pss-b.com) Resonance Raman maps for three different SWNT samples: (left) DNA
wrapped CoMoCAT sample dispersed in aqueous solution [20], (center) HiPco sample dispersed in aqueous solution
with SDS [17], (right) carpet-like alcohol assisted CVD [12].

4014 A. Jorio et al.: The fundamental aspects of carbon nanotube metrology
© 2007 WILEY-VCH Verlag GmbH & Co. KGaA, Weinheim www.pss-b.com
strongly when decreasing the tube diameter, changing by one order of magnitude when going from a
SWNT with dt = 1.6 nm to a tube with dt = 0.6 nm.
The use of optics to determine SWNT population is also perturbed by tube-environmental interactions.
A clear effect has been observed when the resonance profiles are obtained for the RBMs in the bundled
sample and compared with the SWNTs dispersed in solution [22]. While as-grown samples show a broad
profile of RBM frequencies (i.e. large diameter distribution), when the sample is dispersed in SDS
aqueous solution, a narrower frequency (diameter) distribution is observed, shifting towards higher fre-
quencies (lower diameters). However, when the sample is dried and measured again, the low frequency
RBMs are observed again, showing that there was no real change in tube diameter distribution, but rather
a change in the diameter dependence of the Raman cross-section. This result is probably related to the
excitonic nature of the optical transitions, since the Culomb interactions and the presence of trap states
should depend strongly on the environmental conditions.
A different example is shown in Fig. 3, that plots the RBM (diameter) distribution of three SWNT
samples grown by laser ablation, with and without the presence of boron in the graphite target [23]. The
RBM frequency distribution clearly shifts toward higher frequencies (lower tube diameters) when adding
boron. However, it is not yet clear if the influence of boron happens in the diameter of the tubes during
formation, or in their optical properties, or in both. More work is needed to understand the effect of
boron in the RBM results.
Fig. 2 (online colour at: www.pss-b.com) Diameter
distribution of the alcohol assistet CVD SWNT sample
obtained by RBM resonance Raman spectroscopy
(dots). Each symbol represents RBM information
obtained from a specific Eii resonance (see legend).
The solid curve shows the diameter distribution that is
obtained by directly measuring the diameter distribu-
tion in the sample using high resolution transmission
electron microscopy [16].
Fig. 3 (online colour at: www.pss-b.com) Diameter
distribution of SWNTs grown by laser ablation of a
graphite target, with and without boron in the target.
The profiles are obtained by summing up 66 Raman
spectra obtained with different excitation laser lines
from 1.6 eV to 2.7 eV, thus representing well the diam-
eter ditribution in the sample [23].
phys. stat. sol. (b) 244, No. 11 (2007) 4015
www.pss-b.com © 2007 WILEY-VCH Verlag GmbH & Co. KGaA, Weinheim
Original
Paper
5 Summary
The resonance Raman spectroscopy is a powerful tool for carbon nanotube metrology. However, the
development of fundamental understanding of the optical phenomena in SWNTs, mainly with respect
to environmental effects, relaxation and light emission processes, are required for an accurate description
of carbon nanotube samples by using optics.
Acknowledgements The IWEPNM organizing committee for the invitation and financial support to attend the
IWEPNM in 2006. Financial support from CNPq. Inmetro for support on metrology studies.
References
[1] J. L. M. Dias, Medidas, normalização e qualidade: aspectos da história da metrologia do Brasil (Ilustrações,
Rio de Janeiro, 1998).
[2] Conférence Générale des Poids et Measures. Comptes Rendus des Séances (Gauthier-Villars, Paris, 1889).
[3] S. Arepalli et al., Carbon 42, 1783 (2004).
[4] 2nd Joint Workshop on Measurement Issues in Single Wall Carbon Nanotubes: Purity and Dispersion Part II,
NIST, Gaithersburg, Maryland, 26–28 January 2005;
http://www.msel.nist.gov/Nanotube2/Carbon_Nanotubes.htm.
[5] First International Forum on Metrology, Standardization and Industrial Quality of Carbon Nanotubes
(Inmetro), Rio de Janeiro, RJ, Brazil, 22nd June 2007; http://www.inmetro.gov.br/msin07.
[6] A. Jorio et al., Phys. Rev. Lett. 86, 1118 (2001).
[7] Y. Matthew et al., Science 312, 554 (2006).
[8] J. Lefebvre, J. M. Fraser, P. Finnie, and Y. Homma, Phys. Rev. B 69, 075403 (2004).
[9] A. Jorio et al., MRS Bull. 29, 276 (2004).
[10] H. Kataura et al., Synth. Met. 103, 2555 (1999).
[11] M. S. Dresselhaus, G. Dresselhaus, R. Saito, and A. Jorio, Ann. Rev. Phys. Chem. 58, 719 (2007).
[12] P. T. Araujo et al., Phys. Rev. Lett. 98, 067401 (2007).
[13] Ge. G. Samsonidze et al., Appl. Phys. Lett. 85, 5703 (2004).
[14] V. N. Popov and L. Henrard, Phys. Rev. B 70, 115407 (2004).
[15] A. Jorio et al., Phys. Rev. B 71, 075401 (2005).
[16] Y. Murakami et al., Carbon 43, 2664 (2005).
[17] C. Fantini et al., Phys. Rev. Lett. 93, 147406 (2004).
[18] H. Telg et al., Phys. Rev. Lett. 93, 177401 (2004).
[19] S. K. Doorn et al., Appl. Phys. A 78, 1147 (2004).
[20] C. Fantini et al., Chem. Phys. Lett. 439, 138 (2007).
[21] J. Jiang et al., Phys. Rev. B 75, 035405 (2007).
[22] A. Jorio, et al., Phys. Rev. B 72, 075207 (2005).
[23] I. O. Maciel et al., unpublished.