the electronic payment system as an e-commerce enabler: the macedonian perspective
TRANSCRIPT
The Electronic Payment System (EPS) as an e-commerce enabler: The
Macedonian perspective (Working paper)
By Mr. sc. Besim Verdi Abdullai, [email protected]
Assistant Lecturer, State University of Tetova
JEL codes: M15, G20
Key Words: e-commerce, Electronic Payment Systems, Electronic Payment Instruments
Abstract The payment system represents a sum of instruments, procedures and infrastructure for money transfer. It is of
great importance for all economic agents since it enables fast and efficient payments in the national economy as well as internationally.
Electronic payment system functionality is measured through analysis of the transactions committed, structure of the electronic instruments available within a country, and payment instruments used during payment of purchased or ordered products or services.
The use of Electronic Payment Instruments in Macedonia is growing steadily, which shows that the EPS system in this country is continually growing and is in some extend well organized, people are friendly to ICT and conduct electronic transactions easily. E-banking activities in Macedonia started, but remain in low levels; which is a fact for e-commerce activities in general. (131 words)
I. Introduction The Balkan countries classify among these countries in Europe, with the lowest readiness to
conduct e-commerce, partly because of the weak ICT infrastructure, and partly because of the weak ICT development policies of Governments. Last few years, just few research projects have been successfully finished, and very few research publications, have been published concerning ICT and e-commerce problems within our region in general, and Macedonia in particular. Based on this reasoning, this research paper is focused on EPS of SEE countries, through cross country analysis between Macedonia and others.
The payment system represents a sum of instruments, procedures and infrastructure for money transfer. It is of great importance for all economic agents since it enables fast and efficient payments in the national economy. Measuring the functionality of the EPS, it is of great importance, although this was not the case with most of the countries in this region. Electronic payment system functionality is measured through analysis of the transactions committed, structure of the electronic instruments available within a country, and payment instruments used during payment of purchased or ordered products or services.
Electronic payment system without electronic payment instruments would be unpremeditated. EPI as modern mean of payment are enabled from the state of the art Information and Communication Technology (ICT). Worldwide the following electronic payment instruments are mostly accepted as
EPS as an e-commerce enabler: The Macedonian perspective, Mr. sc. Besim Abdullai
2
means of payment: electronic checks, electronic credit cards, purchasing cards, electronic cash, stored-value smart cards, p2p payments, electronic fund transfer (EFT), wireless payments, e-wallets, etc.
Available domestic Card Brands in Macedonia actually are: CASYS, MAKKARD, Private, Pro Credit, SILEKS card, STBB card, TKK card, and the following international payment Cards: VISA, Master Card, American Express, NPK, and Diners, issued and managed from local banks.1 Cards based on electronic cash do not exist in EPS of Macedonia. Credit cards are widely used to pay on-line. Initially there was relatively little adaptation of credit cards to online payments apart from additional security codes. However, after adding new, more secure features to protect transactions, credit card use grew.
Emerging way of e-payment in Macedonia�s payment system is e-banking or PC-banking, independently implemented from few commercial banks operating in Macedonia (�Pro Credit bank�, �Stopanska banka�, etc.).
II. EPS Statistics and empirical findings Electronic way of handling payments and financial transactions, enabled from the state of the art
information and communication technology (ICT), is a new and emerging way of doing payments, and as such, it is the main promoter in the development of Financial and Economic processes in general. Electronic transactions through specific Electronic Payment Instruments (EPI) offered new opportunities for businesses, and are the main promoter of new emerging business models. In order to study the influence of such instruments and systems, we need data, based on which we can draw conclusions, and calculate the impact of the before mentioned instruments in the economy. The use of electronic payment systems and electronic payment instruments in general is emerging globally, and especially in the South East Europe. Because of the fact that these instruments and its supporting technology are new, the lack of data is evident. Records about electronic transactions in different countries are not standardized; therefore, a researcher should do a very hard work and efforts in order to use these data for analysis and research purposes, especially the data from the South East European Countries. In this paper, most of the data came from different sources of NBRM2. The cross-country analysis done in this paper, it is based on the data from the National Bank of Slovenia. Slovenia is chosen, because, it is a country with similar number of inhabitants, located at the same region, and the only country close to Macedonia with good records on its own payment system.
II.1. Figures of the Macedonian Electronic Payment System Comparing to other European countries, Macedonia�s electronic payment system (EPS) is very new,
and the main reforms started from y.2000 until y.2002. At that time, the National Bank, and the Government invested in the ICT infrastructure, and a new state of the art electronic fond transfer system (KIBS and MIPS3), was introduced4 (whereas SWIFT was functioning for at least 15 years). From that time and onwards many foreign investors came and invested in the financial sector of Macedonia. After the privatization of the financial sector, Banks introduced new modern ways of payments management, and introduced different electronic payment instruments, electronic payment machines, such as: ATMs, imprinters and POS terminals.
1 www.nbrm.gov.mk 2 Republic of Macedonia National Bank 3 Macedonian Interbank Payment System (MIPS) for gross-based transaction settlement, and the Clearing Interbank Systems (KIBS) for net-based transaction settlement. Macedonia has also its own RTGS system. 4 Source: Financial Stability Report for 2006, July 2007, NBRM
EPS as an e-commerce enabler: The Macedonian perspective, Mr. sc. Besim Abdullai
3
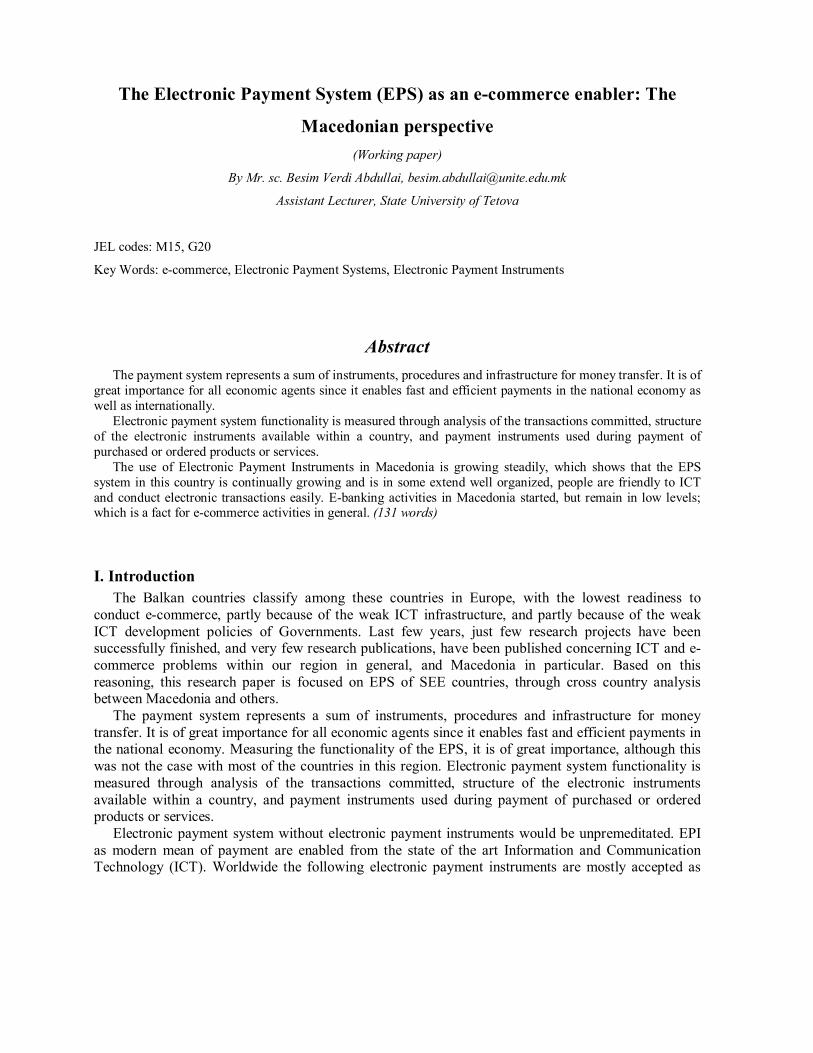
Three years after full implementation of the new EPS system in Macedonia (i.e. y. 2005), 147.453 thousands of electronic payment cards were issued. Comparing to the total number of inhabitants (2.035 million) and the total number of bank accounts (around 2 million), this volume is very low.
Based on the data for the monthly volume of transactions realized through Debit and Credit cards, one can find a very interesting interrelation, between the number of transactions realized and the number of cards in circulation (Figure 1.)
From the graph we can draw conclusions about the purchasing behavior of Macedonian citizens. As we know people spend more money during holidays, which can be clearly seen in this figure. As one can see, the number of transaction is falling after the summer vacations, more exactly from September 2008 until November 2008, and it is growing again in December 2008. This is explained with the fact that people after vacations spend less and try to save, and they start spending or using their cards just before Christmas holydays to purchase gifts.
Figure 1 Comparison of the total number of cards and transactions realized with5
Using the statistic formula for the average growth rate6, can be found that the total number of cards is growing with 5% for the whole period of three years (2006-2008), whereas, the number of transactions with 22.48%. Which means that, with the same number of cards are realized more and more transactions, i.e. the use of cards for everyday payments among people, is growing faster than the number of cards. The meaning of this is, that the use of electronic payment instruments among people in Macedonia is growing qualitatively and not just quantitatively. From these figures we can indicate
5 Courtesy of STATA 10 6 100
11n ⋅= −
NNiAVGR , where N1- first value of the data series, Ni � last value of the data series, n � total number
of values in the series
EPS as an e-commerce enabler: The Macedonian perspective, Mr. sc. Besim Abdullai
4
that people after they got their credit and debit cards, they were waiting for a few months until they were enough aware to use them. This, because, at the end of y.2006 and beginning of y.2007, more than 100.000 cards were issued in circulation, especially in November 2006, when the growth rate was more than 24%, and 120.000 cards were issued, which is the highest growth rate on monthly basis for the last three years. From the table, furthermore one can notice that, although number of cards in circulation through years is growing in absolute terms, in real terms the growth rate is decreasing, which is not a good indication, this supported from the Table 2.
Growth rate annually and for the three year period
Period 2006 2007 2008 2006-2008 Percentages of change in the number of cards 7.7% 4.3% 2.6% 5.0%
Percentages of change in the number of transactions 6.4% 11.0% 3.7% 22.48%
Table 1. Changes in the number of cards and card transactions through years
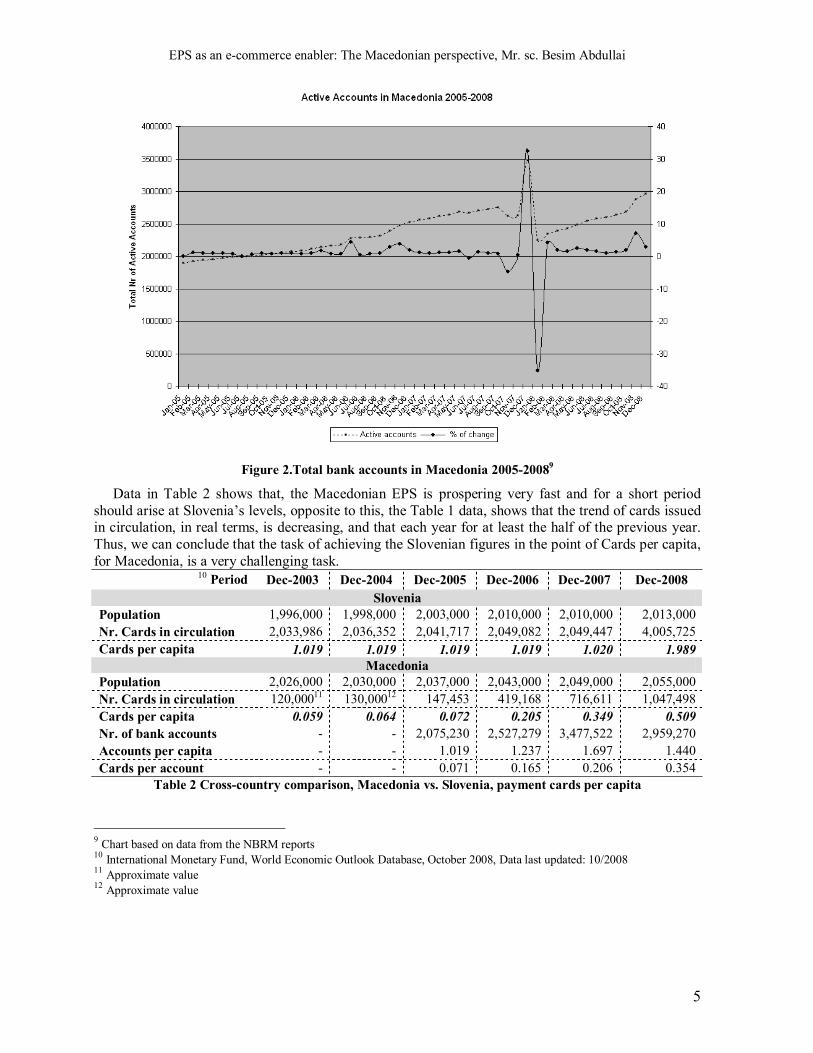
From Figure 2, one can see that Bank Accounts existing in Macedonia are equal to the number of population of the country (until y.2005), i.e. 1(one) account per person, which is relatively high percent of active accounts, despite the fact that in Macedonia existed only 147.4537 Credit/Debit Cards in circulation, which was around 7% of the number of active bank accounts. This figure is changed nowadays, and until December 2008, in Macedonia there were around 1 million cards in circulation, or more exactly 1,047,498 cards8, and 2,959,270 active payment accounts i.e. for each bank account in Macedonia there are 0.35 payment cards in circulation, which is a very low amount compare to EU countries.
Figure 2 shows that, despite the sharp decrease of active accounts in Dec. 2007 until Jan. 2008, the trend of active payment accounts in Macedonia is growing continually, and the calculated monthly growth rate is in average 1.2%, whereas annually for last four years it is 0.9%. From year 2007 till 2008, there is a huge decrease in the number of active accounts, which can be explained with the fact that at that period of time the Government of Macedonia did huge reforms in different sectors, such as the health insurance sector, social policies and evidence of the unemployed persons, economy and finance. The decrease in number of accounts is not necessarily a negative sign, because, in the same period thanks to reforms realized, the way of doing business in Macedonia will change in qualitative direction. Detailed explanation of this change expressed at the next point of this text.
First efforts toward payment system improvement and modernization started earlier in Slovenia than in Macedonia. Therefore, one should expect that the number of cards in circulation in Macedonia is going to grow with a higher growth rate, so the level of maturity of the EPS to arise at Slovenia�s levels. Based on the data from Table1, the number of cards in circulation in Slovenia is growing with 14.5% annually, whereas in Macedonia with 54.2%. The trend of growth in the number of cards per capita is evident in both countries. As expected, cards per capita in Slovenian EPS are quadruple of those of Macedonia, whereas the average growth rate is higher for Macedonian figures.
Slovenia�s payment system can be considered as mature, whereas Macedonia�s payment system it is still developing, which conclusion is more than true for the readiness of the population to use electronic payment instruments in the everyday life.
7 Number of Credit and Debit cards in Macedonia at the end of y. 2005 8 According to NBRM (The National Bank of Republic of Macedonia), www.nbrm.gov.mk
EPS as an e-commerce enabler: The Macedonian perspective, Mr. sc. Besim Abdullai
5
Figure 2.Total bank accounts in Macedonia 2005-20089
Data in Table 2 shows that, the Macedonian EPS is prospering very fast and for a short period should arise at Slovenia�s levels, opposite to this, the Table 1 data, shows that the trend of cards issued in circulation, in real terms, is decreasing, and that each year for at least the half of the previous year. Thus, we can conclude that the task of achieving the Slovenian figures in the point of Cards per capita, for Macedonia, is a very challenging task.
10 Period Dec-2003 Dec-2004 Dec-2005 Dec-2006 Dec-2007 Dec-2008 Slovenia
Population 1,996,000 1,998,000 2,003,000 2,010,000 2,010,000 2,013,000 Nr. Cards in circulation 2,033,986 2,036,352 2,041,717 2,049,082 2,049,447 4,005,725 Cards per capita 1.019 1.019 1.019 1.019 1.020 1.989
Macedonia Population 2,026,000 2,030,000 2,037,000 2,043,000 2,049,000 2,055,000 Nr. Cards in circulation 120,00011 130,00012 147,453 419,168 716,611 1,047,498 Cards per capita 0.059 0.064 0.072 0.205 0.349 0.509 Nr. of bank accounts - - 2,075,230 2,527,279 3,477,522 2,959,270 Accounts per capita - - 1.019 1.237 1.697 1.440 Cards per account - - 0.071 0.165 0.206 0.354
Table 2 Cross-country comparison, Macedonia vs. Slovenia, payment cards per capita
9 Chart based on data from the NBRM reports 10 International Monetary Fund, World Economic Outlook Database, October 2008, Data last updated: 10/2008 11 Approximate value 12 Approximate value
EPS as an e-commerce enabler: The Macedonian perspective, Mr. sc. Besim Abdullai
6
Based on simple statistics, cards per capita in Slovenia as EU country in 2008 are 4 times the Macedonian figures, whereas growth rate of Macedonian figures (2003-2008) on cards per capita is 54%, which is far better than Slovenian growth rate with 14%. This trend is positive but not impressive, this looking at Slovenian changes of year 2008.
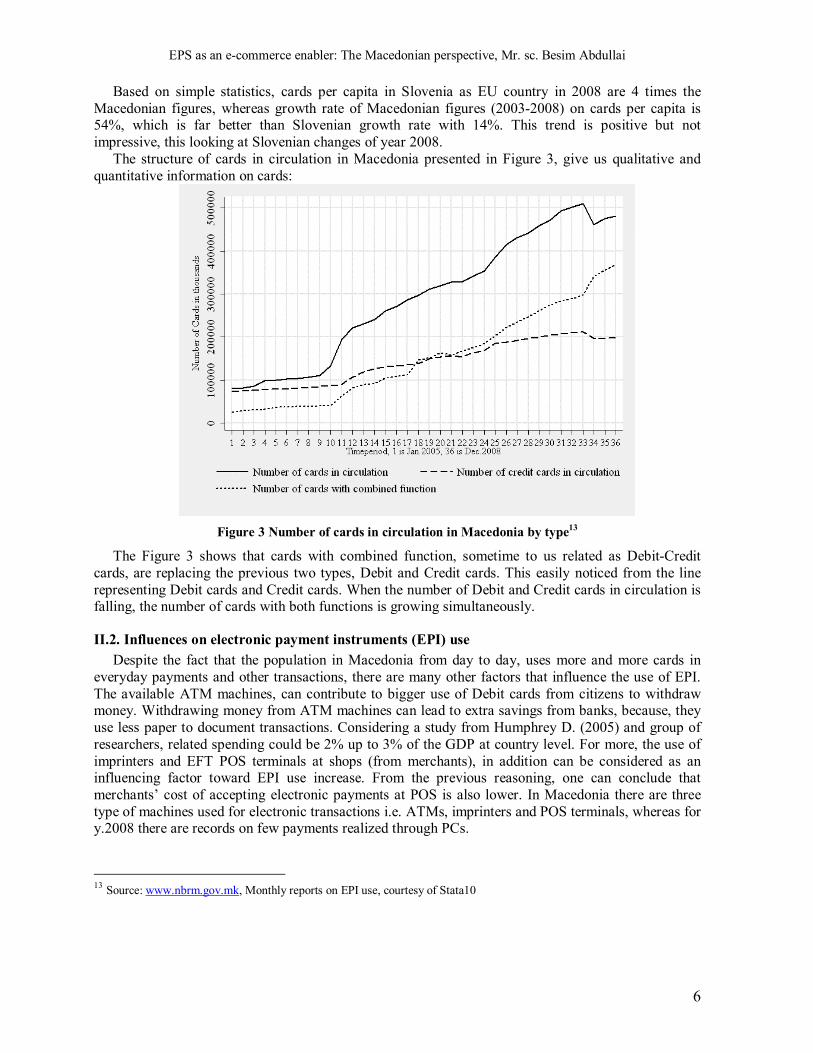
The structure of cards in circulation in Macedonia presented in Figure 3, give us qualitative and quantitative information on cards:
Figure 3 Number of cards in circulation in Macedonia by type13
The Figure 3 shows that cards with combined function, sometime to us related as Debit-Credit cards, are replacing the previous two types, Debit and Credit cards. This easily noticed from the line representing Debit cards and Credit cards. When the number of Debit and Credit cards in circulation is falling, the number of cards with both functions is growing simultaneously.
II.2. Influences on electronic payment instruments (EPI) use Despite the fact that the population in Macedonia from day to day, uses more and more cards in
everyday payments and other transactions, there are many other factors that influence the use of EPI. The available ATM machines, can contribute to bigger use of Debit cards from citizens to withdraw money. Withdrawing money from ATM machines can lead to extra savings from banks, because, they use less paper to document transactions. Considering a study from Humphrey D. (2005) and group of researchers, related spending could be 2% up to 3% of the GDP at country level. For more, the use of imprinters and EFT POS terminals at shops (from merchants), in addition can be considered as an influencing factor toward EPI use increase. From the previous reasoning, one can conclude that merchants� cost of accepting electronic payments at POS is also lower. In Macedonia there are three type of machines used for electronic transactions i.e. ATMs, imprinters and POS terminals, whereas for y.2008 there are records on few payments realized through PCs.
13 Source: www.nbrm.gov.mk, Monthly reports on EPI use, courtesy of Stata10
EPS as an e-commerce enabler: The Macedonian perspective, Mr. sc. Besim Abdullai
7
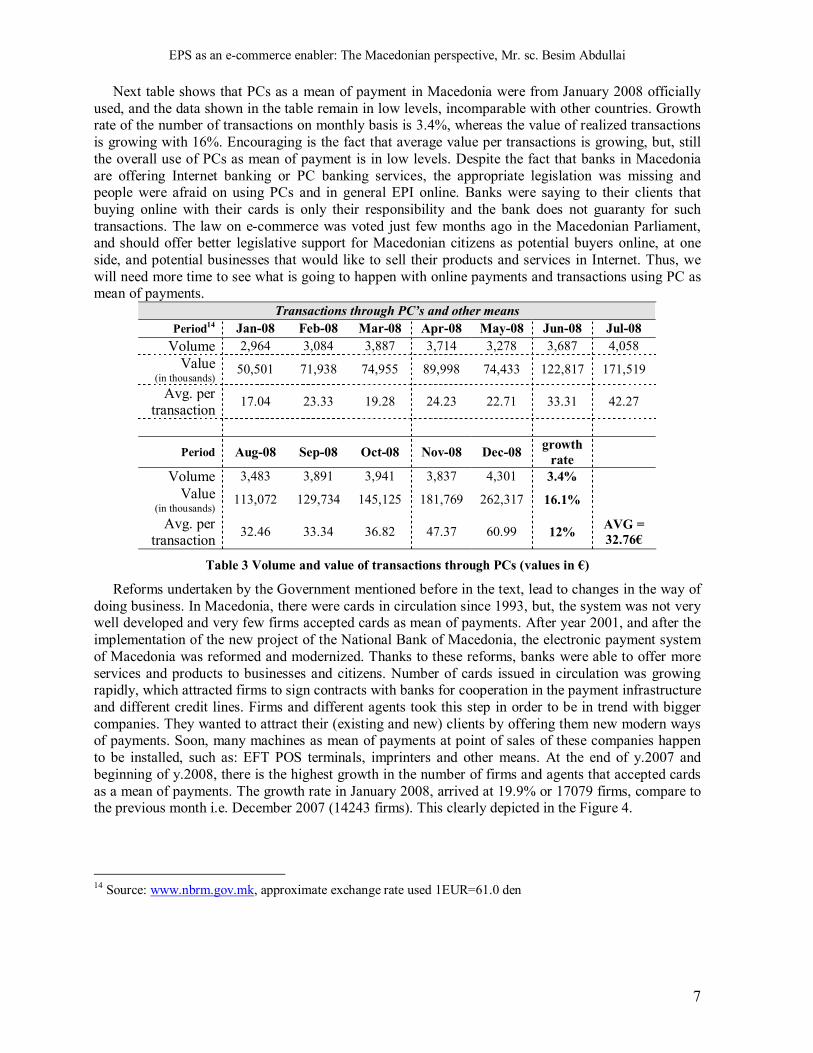
Next table shows that PCs as a mean of payment in Macedonia were from January 2008 officially used, and the data shown in the table remain in low levels, incomparable with other countries. Growth rate of the number of transactions on monthly basis is 3.4%, whereas the value of realized transactions is growing with 16%. Encouraging is the fact that average value per transactions is growing, but, still the overall use of PCs as mean of payment is in low levels. Despite the fact that banks in Macedonia are offering Internet banking or PC banking services, the appropriate legislation was missing and people were afraid on using PCs and in general EPI online. Banks were saying to their clients that buying online with their cards is only their responsibility and the bank does not guaranty for such transactions. The law on e-commerce was voted just few months ago in the Macedonian Parliament, and should offer better legislative support for Macedonian citizens as potential buyers online, at one side, and potential businesses that would like to sell their products and services in Internet. Thus, we will need more time to see what is going to happen with online payments and transactions using PC as mean of payments.
Transactions through PC�s and other means Period14 Jan-08 Feb-08 Mar-08 Apr-08 May-08 Jun-08 Jul-08
Volume 2,964 3,084 3,887 3,714 3,278 3,687 4,058 Value
(in thousands) 50,501 71,938 74,955 89,998 74,433 122,817 171,519
Avg. per transaction 17.04 23.33 19.28 24.23 22.71 33.31 42.27
Period Aug-08 Sep-08 Oct-08 Nov-08 Dec-08 growth rate
Volume 3,483 3,891 3,941 3,837 4,301 3.4% Value
(in thousands) 113,072 129,734 145,125 181,769 262,317 16.1%
Avg. per transaction 32.46 33.34 36.82 47.37 60.99 12% AVG =
32.76�
Table 3 Volume and value of transactions through PCs (values in �)
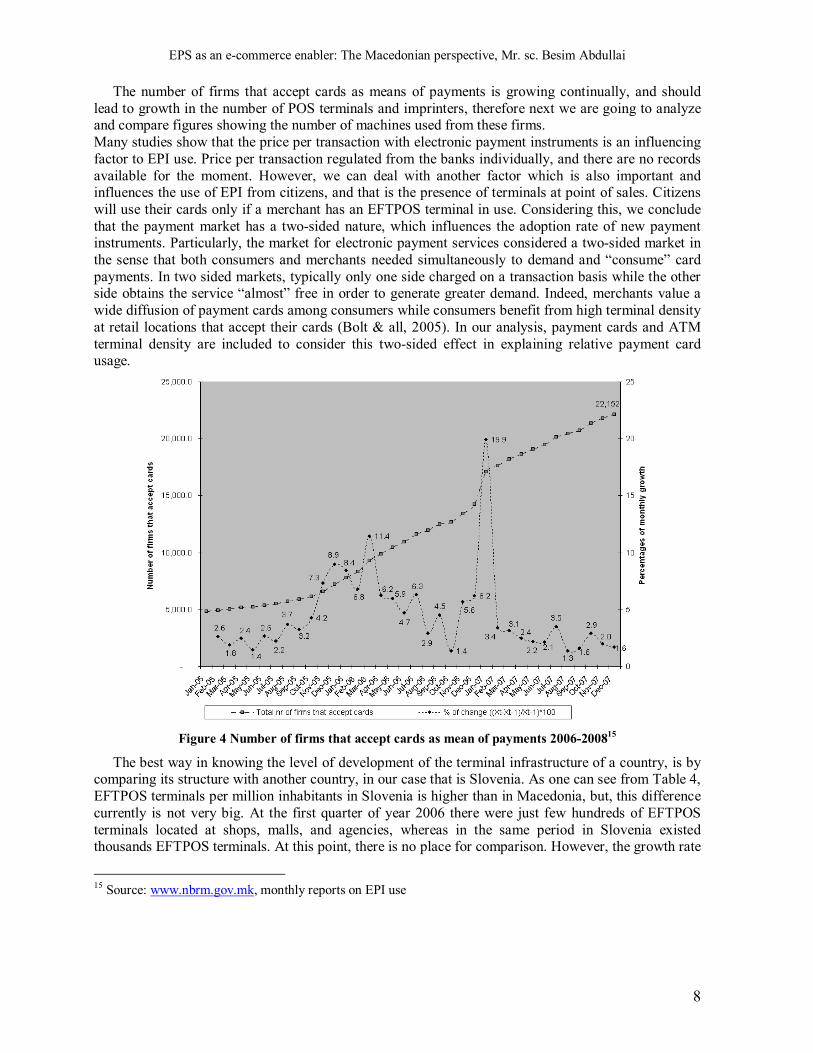
Reforms undertaken by the Government mentioned before in the text, lead to changes in the way of doing business. In Macedonia, there were cards in circulation since 1993, but, the system was not very well developed and very few firms accepted cards as mean of payments. After year 2001, and after the implementation of the new project of the National Bank of Macedonia, the electronic payment system of Macedonia was reformed and modernized. Thanks to these reforms, banks were able to offer more services and products to businesses and citizens. Number of cards issued in circulation was growing rapidly, which attracted firms to sign contracts with banks for cooperation in the payment infrastructure and different credit lines. Firms and different agents took this step in order to be in trend with bigger companies. They wanted to attract their (existing and new) clients by offering them new modern ways of payments. Soon, many machines as mean of payments at point of sales of these companies happen to be installed, such as: EFT POS terminals, imprinters and other means. At the end of y.2007 and beginning of y.2008, there is the highest growth in the number of firms and agents that accepted cards as a mean of payments. The growth rate in January 2008, arrived at 19.9% or 17079 firms, compare to the previous month i.e. December 2007 (14243 firms). This clearly depicted in the Figure 4.
14 Source: www.nbrm.gov.mk, approximate exchange rate used 1EUR=61.0 den
EPS as an e-commerce enabler: The Macedonian perspective, Mr. sc. Besim Abdullai
8
The number of firms that accept cards as means of payments is growing continually, and should lead to growth in the number of POS terminals and imprinters, therefore next we are going to analyze and compare figures showing the number of machines used from these firms. Many studies show that the price per transaction with electronic payment instruments is an influencing factor to EPI use. Price per transaction regulated from the banks individually, and there are no records available for the moment. However, we can deal with another factor which is also important and influences the use of EPI from citizens, and that is the presence of terminals at point of sales. Citizens will use their cards only if a merchant has an EFTPOS terminal in use. Considering this, we conclude that the payment market has a two-sided nature, which influences the adoption rate of new payment instruments. Particularly, the market for electronic payment services considered a two-sided market in the sense that both consumers and merchants needed simultaneously to demand and �consume� card payments. In two sided markets, typically only one side charged on a transaction basis while the other side obtains the service �almost� free in order to generate greater demand. Indeed, merchants value a wide diffusion of payment cards among consumers while consumers benefit from high terminal density at retail locations that accept their cards (Bolt & all, 2005). In our analysis, payment cards and ATM terminal density are included to consider this two-sided effect in explaining relative payment card usage.
Figure 4 Number of firms that accept cards as mean of payments 2006-200815
The best way in knowing the level of development of the terminal infrastructure of a country, is by comparing its structure with another country, in our case that is Slovenia. As one can see from Table 4, EFTPOS terminals per million inhabitants in Slovenia is higher than in Macedonia, but, this difference currently is not very big. At the first quarter of year 2006 there were just few hundreds of EFTPOS terminals located at shops, malls, and agencies, whereas in the same period in Slovenia existed thousands EFTPOS terminals. At this point, there is no place for comparison. However, the growth rate
15 Source: www.nbrm.gov.mk, monthly reports on EPI use
EPS as an e-commerce enabler: The Macedonian perspective, Mr. sc. Besim Abdullai
9
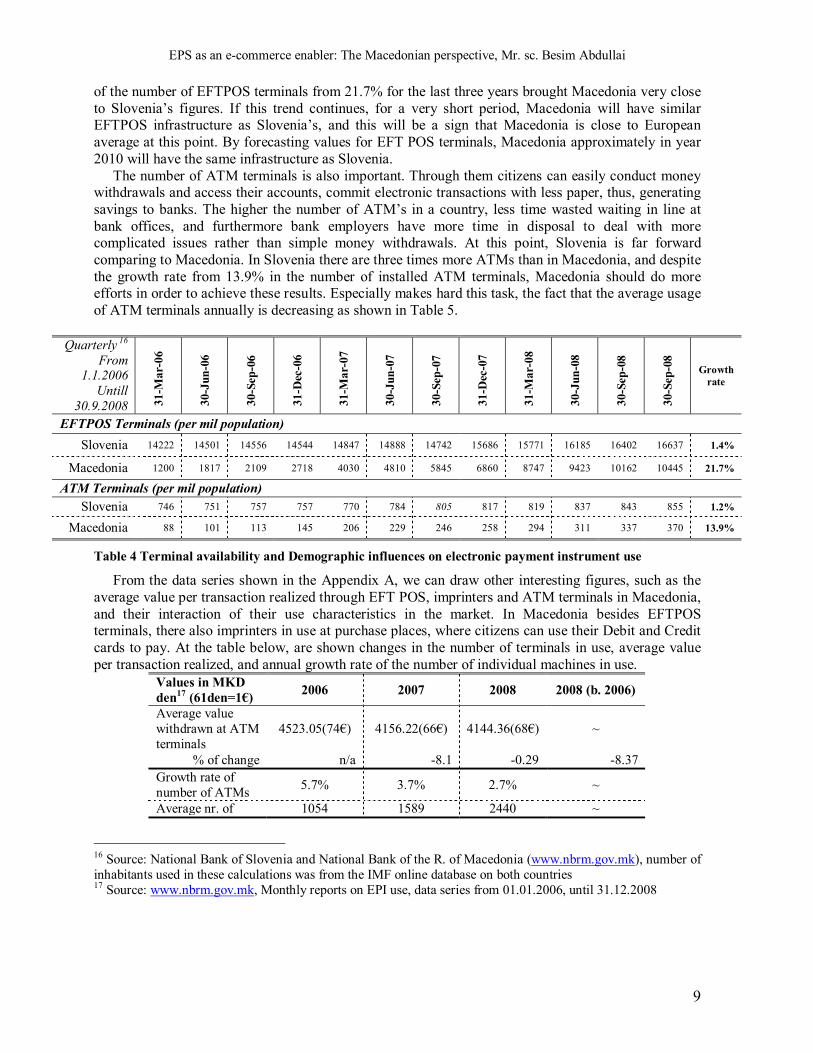
of the number of EFTPOS terminals from 21.7% for the last three years brought Macedonia very close to Slovenia�s figures. If this trend continues, for a very short period, Macedonia will have similar EFTPOS infrastructure as Slovenia�s, and this will be a sign that Macedonia is close to European average at this point. By forecasting values for EFT POS terminals, Macedonia approximately in year 2010 will have the same infrastructure as Slovenia.
The number of ATM terminals is also important. Through them citizens can easily conduct money withdrawals and access their accounts, commit electronic transactions with less paper, thus, generating savings to banks. The higher the number of ATM�s in a country, less time wasted waiting in line at bank offices, and furthermore bank employers have more time in disposal to deal with more complicated issues rather than simple money withdrawals. At this point, Slovenia is far forward comparing to Macedonia. In Slovenia there are three times more ATMs than in Macedonia, and despite the growth rate from 13.9% in the number of installed ATM terminals, Macedonia should do more efforts in order to achieve these results. Especially makes hard this task, the fact that the average usage of ATM terminals annually is decreasing as shown in Table 5.
Quarterly 16
From 1.1.2006
Untill 30.9.2008 31
-Mar
-06
30-J
un-0
6
30-S
ep-0
6
31-D
ec-0
6
31-M
ar-0
7
30-J
un-0
7
30-S
ep-0
7
31-D
ec-0
7
31-M
ar-0
8
30-J
un-0
8
30-S
ep-0
8
30-S
ep-0
8
Growth rate
EFTPOS Terminals (per mil population) Slovenia 14222 14501 14556 14544 14847 14888 14742 15686 15771 16185 16402 16637 1.4%
Macedonia 1200 1817 2109 2718 4030 4810 5845 6860 8747 9423 10162 10445 21.7%
ATM Terminals (per mil population) Slovenia 746 751 757 757 770 784 805 817 819 837 843 855 1.2%
Macedonia 88 101 113 145 206 229 246 258 294 311 337 370 13.9%
Table 4 Terminal availability and Demographic influences on electronic payment instrument use
From the data series shown in the Appendix A, we can draw other interesting figures, such as the average value per transaction realized through EFT POS, imprinters and ATM terminals in Macedonia, and their interaction of their use characteristics in the market. In Macedonia besides EFTPOS terminals, there also imprinters in use at purchase places, where citizens can use their Debit and Credit cards to pay. At the table below, are shown changes in the number of terminals in use, average value per transaction realized, and annual growth rate of the number of individual machines in use.
Values in MKD den17 (61den=1�) 2006 2007 2008 2008 (b. 2006)
Average value withdrawn at ATM terminals
4523.05(74�) 4156.22(66�) 4144.36(68�) ~
% of change n/a -8.1 -0.29 -8.37 Growth rate of number of ATMs 5.7% 3.7% 2.7% ~
Average nr. of 1054 1589 2440 ~
16 Source: National Bank of Slovenia and National Bank of the R. of Macedonia (www.nbrm.gov.mk), number of inhabitants used in these calculations was from the IMF online database on both countries 17 Source: www.nbrm.gov.mk, Monthly reports on EPI use, data series from 01.01.2006, until 31.12.2008
EPS as an e-commerce enabler: The Macedonian perspective, Mr. sc. Besim Abdullai
10
transactions per ATM (monthly) Average value paid on POS 2149.58(35.2�) 2059.98(33.7�) 2204(30�) ~
% of change n/a -4.2 6.8 2.3 Growth rate of number of POS 8.52% 7.65% 2.64% ~
Average nr. of transactions per POS (monthly)
39.6 34.6 36.7 ~
Average value paid through imprinters 8094(132.7�) 3895(63.8�) 3181(52�) ~
% of change n/a -51.87 -18.33 -60.7 Growth rate of nr. of imprinters 0.5% -0.46% 0.63% ~
Average nr. of transactions per imprinter (monthly)
1.0 0.7 4.5 ~
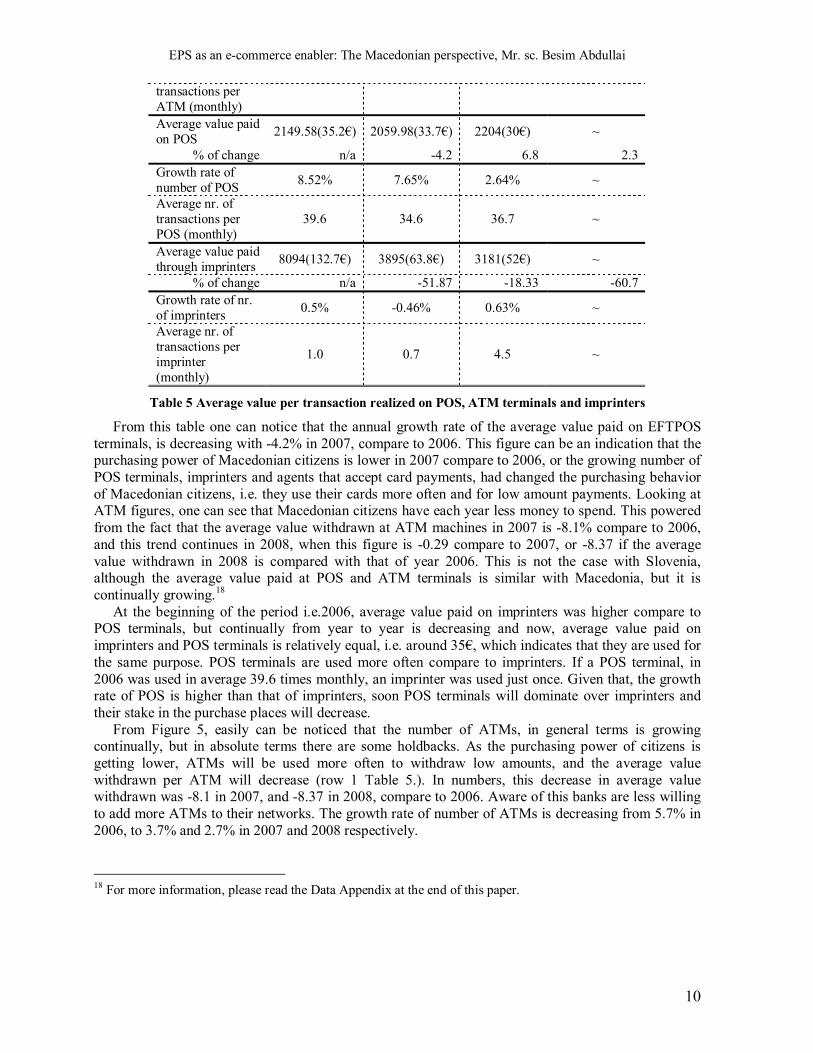
Table 5 Average value per transaction realized on POS, ATM terminals and imprinters
From this table one can notice that the annual growth rate of the average value paid on EFTPOS terminals, is decreasing with -4.2% in 2007, compare to 2006. This figure can be an indication that the purchasing power of Macedonian citizens is lower in 2007 compare to 2006, or the growing number of POS terminals, imprinters and agents that accept card payments, had changed the purchasing behavior of Macedonian citizens, i.e. they use their cards more often and for low amount payments. Looking at ATM figures, one can see that Macedonian citizens have each year less money to spend. This powered from the fact that the average value withdrawn at ATM machines in 2007 is -8.1% compare to 2006, and this trend continues in 2008, when this figure is -0.29 compare to 2007, or -8.37 if the average value withdrawn in 2008 is compared with that of year 2006. This is not the case with Slovenia, although the average value paid at POS and ATM terminals is similar with Macedonia, but it is continually growing.18
At the beginning of the period i.e.2006, average value paid on imprinters was higher compare to POS terminals, but continually from year to year is decreasing and now, average value paid on imprinters and POS terminals is relatively equal, i.e. around 35�, which indicates that they are used for the same purpose. POS terminals are used more often compare to imprinters. If a POS terminal, in 2006 was used in average 39.6 times monthly, an imprinter was used just once. Given that, the growth rate of POS is higher than that of imprinters, soon POS terminals will dominate over imprinters and their stake in the purchase places will decrease.
From Figure 5, easily can be noticed that the number of ATMs, in general terms is growing continually, but in absolute terms there are some holdbacks. As the purchasing power of citizens is getting lower, ATMs will be used more often to withdraw low amounts, and the average value withdrawn per ATM will decrease (row 1 Table 5.). In numbers, this decrease in average value withdrawn was -8.1 in 2007, and -8.37 in 2008, compare to 2006. Aware of this banks are less willing to add more ATMs to their networks. The growth rate of number of ATMs is decreasing from 5.7% in 2006, to 3.7% and 2.7% in 2007 and 2008 respectively. 18 For more information, please read the Data Appendix at the end of this paper.
EPS as an e-commerce enabler: The Macedonian perspective, Mr. sc. Besim Abdullai
11
050
0010
000
1500
020
000
Uni
ts
1 2 3 4 5 6 7 8 910111213141516171819202122232425262728293031323334Time period, 01.2006-10.2008
number of imprinters number of POS terminalsNumber of ATM terminals
4060
8010
012
014
016
0V
alue
in E
UR
1 2 3 4 5 6 7 8 9 10111213141516171819202122232425262728293031323334Time period, 01.2006-10.2008
Average value paid on imprinter Average value paid on POSAverage value w ithdraw n on ATM
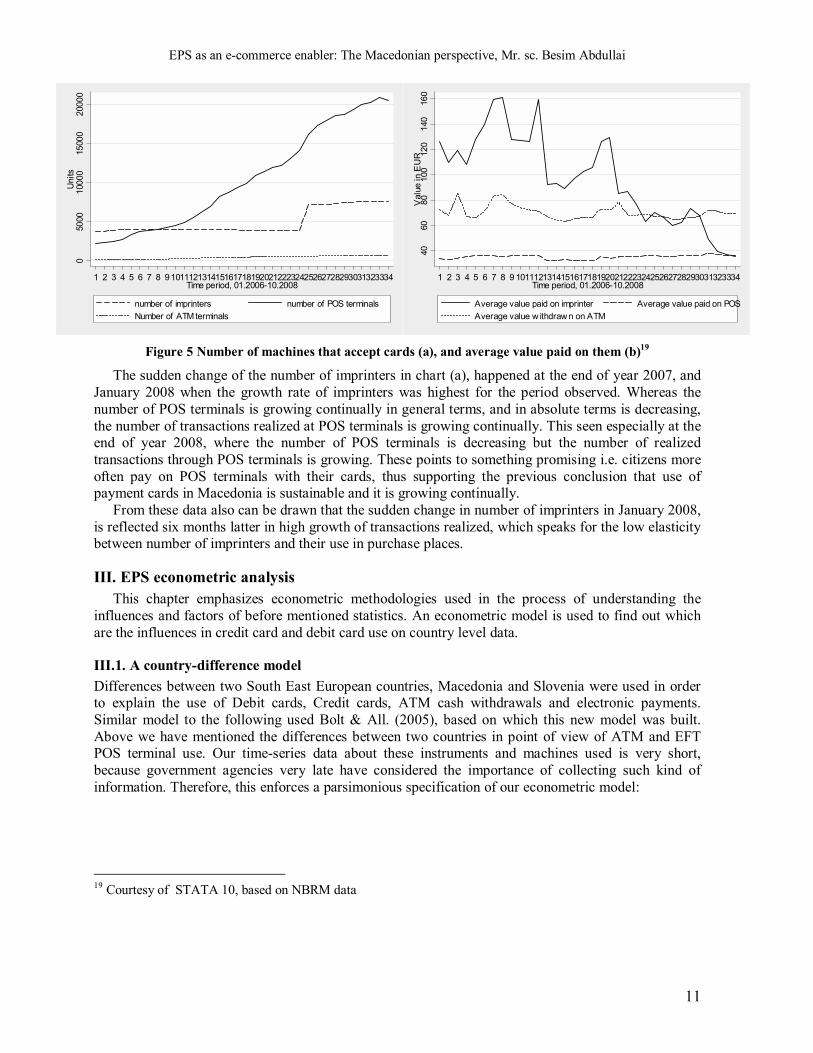
Figure 5 Number of machines that accept cards (a), and average value paid on them (b)19
The sudden change of the number of imprinters in chart (a), happened at the end of year 2007, and January 2008 when the growth rate of imprinters was highest for the period observed. Whereas the number of POS terminals is growing continually in general terms, and in absolute terms is decreasing, the number of transactions realized at POS terminals is growing continually. This seen especially at the end of year 2008, where the number of POS terminals is decreasing but the number of realized transactions through POS terminals is growing. These points to something promising i.e. citizens more often pay on POS terminals with their cards, thus supporting the previous conclusion that use of payment cards in Macedonia is sustainable and it is growing continually.
From these data also can be drawn that the sudden change in number of imprinters in January 2008, is reflected six months latter in high growth of transactions realized, which speaks for the low elasticity between number of imprinters and their use in purchase places.
III. EPS econometric analysis This chapter emphasizes econometric methodologies used in the process of understanding the
influences and factors of before mentioned statistics. An econometric model is used to find out which are the influences in credit card and debit card use on country level data.
III.1. A country-difference model Differences between two South East European countries, Macedonia and Slovenia were used in order to explain the use of Debit cards, Credit cards, ATM cash withdrawals and electronic payments. Similar model to the following used Bolt & All. (2005), based on which this new model was built. Above we have mentioned the differences between two countries in point of view of ATM and EFT POS terminal use. Our time-series data about these instruments and machines used is very short, because government agencies very late have considered the importance of collecting such kind of information. Therefore, this enforces a parsimonious specification of our econometric model:
19 Courtesy of STATA 10, based on NBRM data
EPS as an e-commerce enabler: The Macedonian perspective, Mr. sc. Besim Abdullai
12
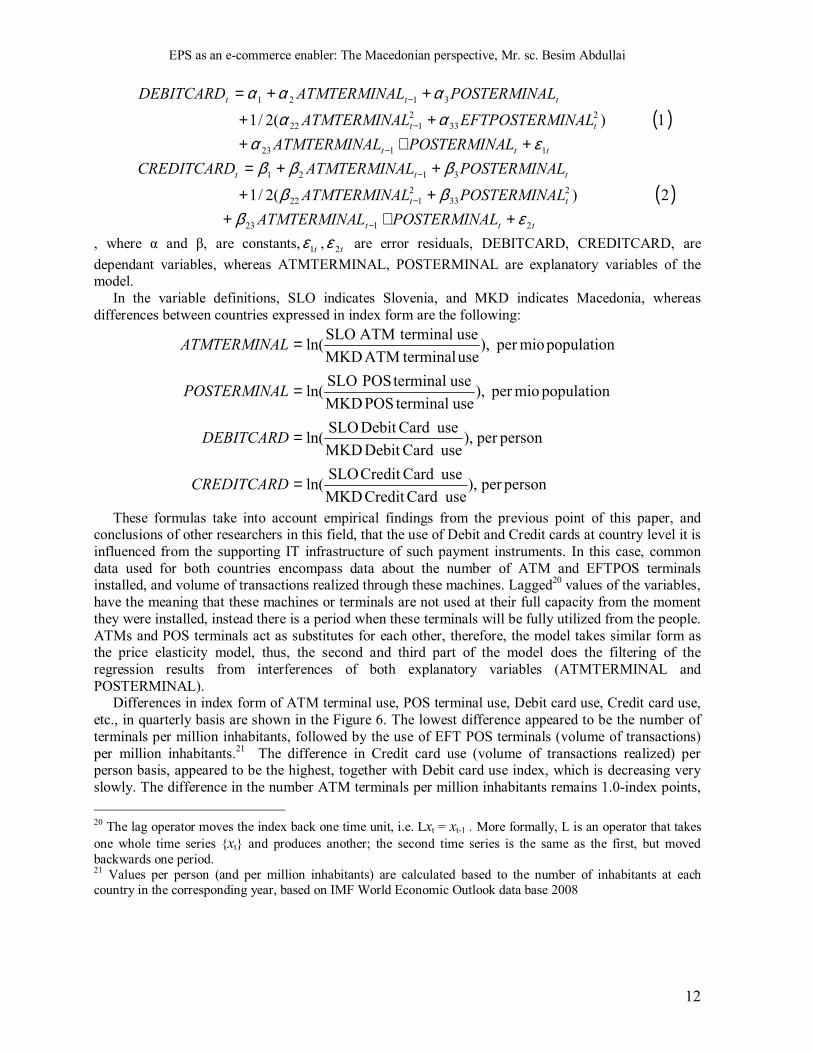
( )
( )ttt
tt
ttt
ttt
tt
ttt
LPOSTERMINALATMTERMINALPOSTERMINALATMTERMINA
LPOSTERMINALATMTERMINACREDITCARDLPOSTERMINALATMTERMINA
INALEFTPOSTERMLATMTERMINA
LPOSTERMINALATMTERMINADEBITCARD
2123
233
2122
3121
1123
233
2122
3121
2)(2/1
1)(2/1
εββββββ
εααα
ααα
+∗+++
++=+∗+
++
++=
−
−
−
−
−
−
, where α and β, are constants, t1ε , t2ε are error residuals, DEBITCARD, CREDITCARD, are dependant variables, whereas ATMTERMINAL, POSTERMINAL are explanatory variables of the model.
In the variable definitions, SLO indicates Slovenia, and MKD indicates Macedonia, whereas differences between countries expressed in index form are the following:
personper),useCardCreditMKD
useCardCreditSLOln(
personper),useCardDebitMKDuseCardDebitSLOln(
populationmioper),useterminalPOSMKDuseterminalPOSSLOln(
populationmioper),useterminalATMMKDuseterminalATMSLOln(
=
=
=
=
CREDITCARD
DEBITCARD
LPOSTERMINA
LATMTERMINA
These formulas take into account empirical findings from the previous point of this paper, and conclusions of other researchers in this field, that the use of Debit and Credit cards at country level it is influenced from the supporting IT infrastructure of such payment instruments. In this case, common data used for both countries encompass data about the number of ATM and EFTPOS terminals installed, and volume of transactions realized through these machines. Lagged20 values of the variables, have the meaning that these machines or terminals are not used at their full capacity from the moment they were installed, instead there is a period when these terminals will be fully utilized from the people. ATMs and POS terminals act as substitutes for each other, therefore, the model takes similar form as the price elasticity model, thus, the second and third part of the model does the filtering of the regression results from interferences of both explanatory variables (ATMTERMINAL and POSTERMINAL).
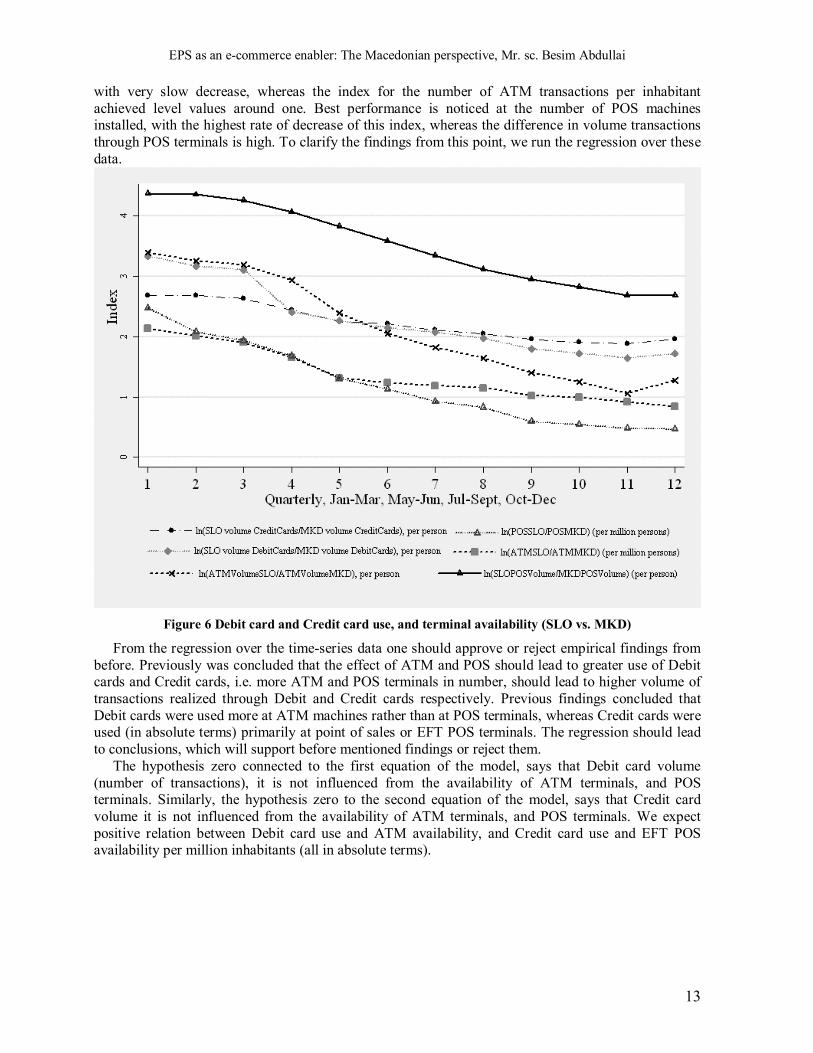
Differences in index form of ATM terminal use, POS terminal use, Debit card use, Credit card use, etc., in quarterly basis are shown in the Figure 6. The lowest difference appeared to be the number of terminals per million inhabitants, followed by the use of EFT POS terminals (volume of transactions) per million inhabitants.21 The difference in Credit card use (volume of transactions realized) per person basis, appeared to be the highest, together with Debit card use index, which is decreasing very slowly. The difference in the number ATM terminals per million inhabitants remains 1.0-index points, 20 The lag operator moves the index back one time unit, i.e. Lxt = xt-1 . More formally, L is an operator that takes one whole time series {xt} and produces another; the second time series is the same as the first, but moved backwards one period. 21 Values per person (and per million inhabitants) are calculated based to the number of inhabitants at each country in the corresponding year, based on IMF World Economic Outlook data base 2008
EPS as an e-commerce enabler: The Macedonian perspective, Mr. sc. Besim Abdullai
13
with very slow decrease, whereas the index for the number of ATM transactions per inhabitant achieved level values around one. Best performance is noticed at the number of POS machines installed, with the highest rate of decrease of this index, whereas the difference in volume transactions through POS terminals is high. To clarify the findings from this point, we run the regression over these data.
Figure 6 Debit card and Credit card use, and terminal availability (SLO vs. MKD)
From the regression over the time-series data one should approve or reject empirical findings from before. Previously was concluded that the effect of ATM and POS should lead to greater use of Debit cards and Credit cards, i.e. more ATM and POS terminals in number, should lead to higher volume of transactions realized through Debit and Credit cards respectively. Previous findings concluded that Debit cards were used more at ATM machines rather than at POS terminals, whereas Credit cards were used (in absolute terms) primarily at point of sales or EFT POS terminals. The regression should lead to conclusions, which will support before mentioned findings or reject them.
The hypothesis zero connected to the first equation of the model, says that Debit card volume (number of transactions), it is not influenced from the availability of ATM terminals, and POS terminals. Similarly, the hypothesis zero to the second equation of the model, says that Credit card volume it is not influenced from the availability of ATM terminals, and POS terminals. We expect positive relation between Debit card use and ATM availability, and Credit card use and EFT POS availability per million inhabitants (all in absolute terms).
EPS as an e-commerce enabler: The Macedonian perspective, Mr. sc. Besim Abdullai
14
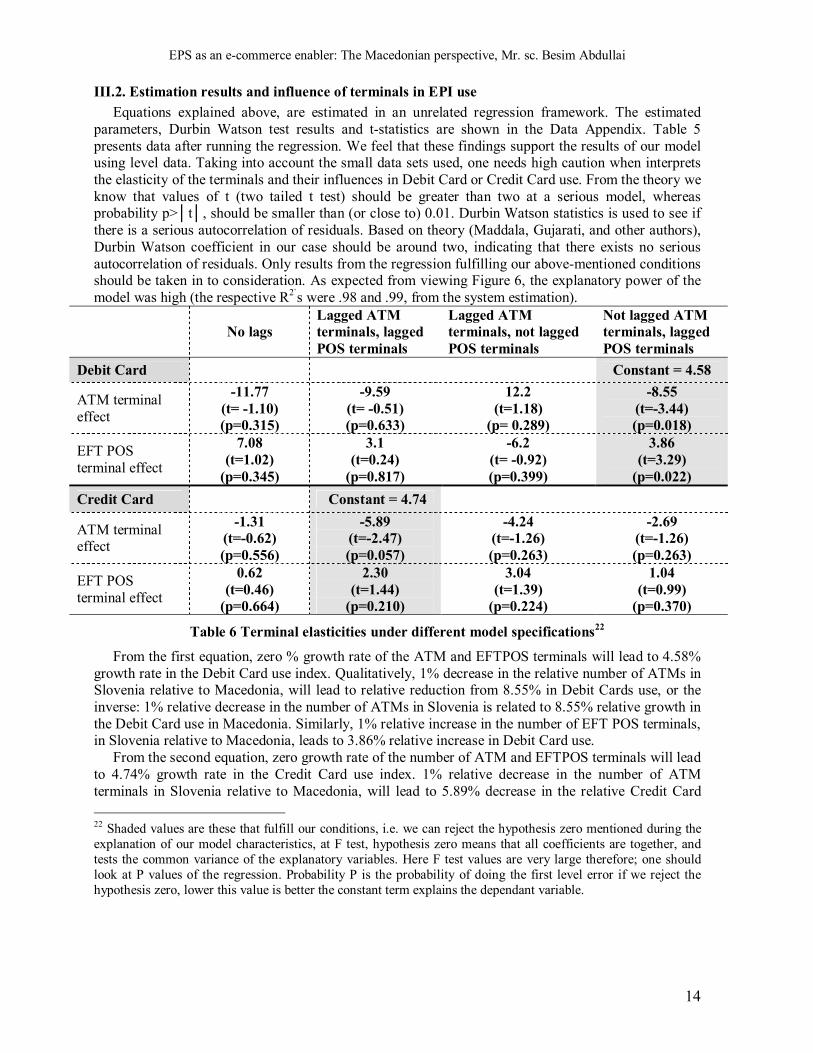
III.2. Estimation results and influence of terminals in EPI use Equations explained above, are estimated in an unrelated regression framework. The estimated
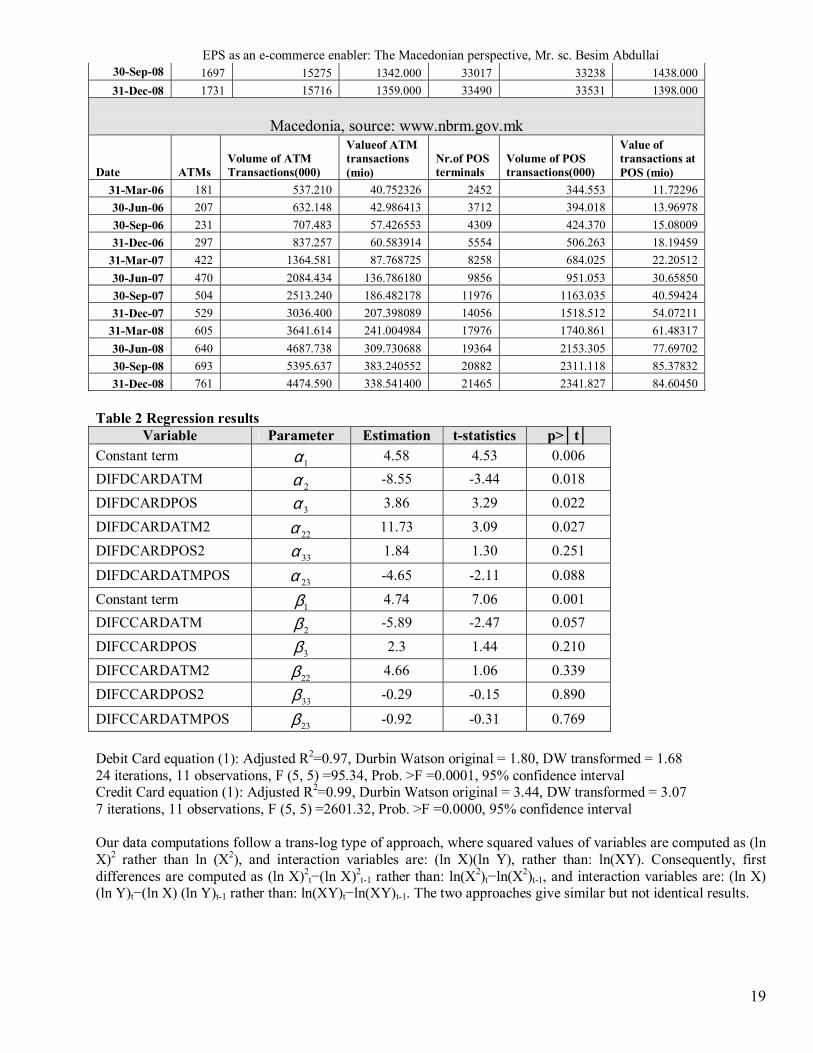
parameters, Durbin Watson test results and t-statistics are shown in the Data Appendix. Table 5 presents data after running the regression. We feel that these findings support the results of our model using level data. Taking into account the small data sets used, one needs high caution when interprets the elasticity of the terminals and their influences in Debit Card or Credit Card use. From the theory we know that values of t (two tailed t test) should be greater than two at a serious model, whereas probability p>│t│, should be smaller than (or close to) 0.01. Durbin Watson statistics is used to see if there is a serious autocorrelation of residuals. Based on theory (Maddala, Gujarati, and other authors), Durbin Watson coefficient in our case should be around two, indicating that there exists no serious autocorrelation of residuals. Only results from the regression fulfilling our above-mentioned conditions should be taken in to consideration. As expected from viewing Figure 6, the explanatory power of the model was high (the respective R2`s were .98 and .99, from the system estimation).
No lags Lagged ATM terminals, lagged POS terminals
Lagged ATM terminals, not lagged POS terminals
Not lagged ATM terminals, lagged POS terminals
Debit Card Constant = 4.58
ATM terminal effect
-11.77 (t= -1.10) (p=0.315)
-9.59 (t= -0.51) (p=0.633)
12.2 (t=1.18)
(p= 0.289)
-8.55 (t=-3.44) (p=0.018)
EFT POS terminal effect
7.08 (t=1.02)
(p=0.345)
3.1 (t=0.24)
(p=0.817)
-6.2 (t= -0.92) (p=0.399)
3.86 (t=3.29)
(p=0.022) Credit Card Constant = 4.74
ATM terminal effect
-1.31 (t=-0.62) (p=0.556)
-5.89 (t=-2.47) (p=0.057)
-4.24 (t=-1.26) (p=0.263)
-2.69 (t=-1.26) (p=0.263)
EFT POS terminal effect
0.62 (t=0.46)
(p=0.664)
2.30 (t=1.44)
(p=0.210)
3.04 (t=1.39)
(p=0.224)
1.04 (t=0.99)
(p=0.370)
Table 6 Terminal elasticities under different model specifications22
From the first equation, zero % growth rate of the ATM and EFTPOS terminals will lead to 4.58% growth rate in the Debit Card use index. Qualitatively, 1% decrease in the relative number of ATMs in Slovenia relative to Macedonia, will lead to relative reduction from 8.55% in Debit Cards use, or the inverse: 1% relative decrease in the number of ATMs in Slovenia is related to 8.55% relative growth in the Debit Card use in Macedonia. Similarly, 1% relative increase in the number of EFT POS terminals, in Slovenia relative to Macedonia, leads to 3.86% relative increase in Debit Card use.
From the second equation, zero growth rate of the number of ATM and EFTPOS terminals will lead to 4.74% growth rate in the Credit Card use index. 1% relative decrease in the number of ATM terminals in Slovenia relative to Macedonia, will lead to 5.89% decrease in the relative Credit Card 22 Shaded values are these that fulfill our conditions, i.e. we can reject the hypothesis zero mentioned during the explanation of our model characteristics, at F test, hypothesis zero means that all coefficients are together, and tests the common variance of the explanatory variables. Here F test values are very large therefore; one should look at P values of the regression. Probability P is the probability of doing the first level error if we reject the hypothesis zero, lower this value is better the constant term explains the dependant variable.
EPS as an e-commerce enabler: The Macedonian perspective, Mr. sc. Besim Abdullai
15
use, i.e. 1% relative decrease in the number of ATMs in Slovenia is related to 5.89% relative growth in the Credit Card use in Macedonia. Similarly, 1% relative increase in the number of EFT POS terminals, in Slovenia relative to Macedonia, leads to 2.3% relative increase in Credit Card use.
As one can notice lagging of terminals have positive effect in both cases, either ATM terminals or POS terminals (although our best choice was the smaller value because of t-test results). Best performance of the model were achieved when for the first equation, POS terminals were lagged, whereas at the second equation when both terminals were lagged. Explanation on this phenomenon is the fact that Debit cards and Credit cards are used mostly in ATM terminals, and people need time to get noticed that a new ATM has been added to the network, whereas based on these data the same is true for POS terminals.
Summa samarium, ATM terminal growth effect in Debit Card and Credit Card use is more significant in Macedonia rather than in Slovenia, whereas the opposite is true for the EFT POS terminal growth in Slovenia, i.e. more EFT POS in Slovenia greater the use of Debit and Credit cards, compared to Macedonia. This can strengthen more our presumption that the purchasing power of Slovenian citizens is greater compared to Macedonia�s.
IV. Summary and conclusions Electronic payment system and the use of EPI in Macedonia, shows positive trends looking at our
overall findings in this paper. The ICT infrastructure supporting this system continually grows i.e. the network of machines allowing EPI usage grows, although not fast enough in some segments. We expected that the use of PCs in electronic payments would grow very fast after the approval of the law on e-commerce, but this segment in y.2008 remains in low levels, with small growth from 3.4% in volume of transactions, and 16.1% growth rate in value paid through PCs. By knowing this, chances that soon in Macedonia e-business activities will boom remain very low, and our conclusion that PCs as machines participating in the EPS development of Macedonia remain negative. Online banking activities offered from few banks remain used in low levels.
Despite previous findings, other e-commerce positive trends and impressive results were noticed in other segments of Macedonian EPS. The number of POS terminals and imprinters at shops, agencies, malls, etc. is steadily growing and soon will be in EU levels. This proves that the quality of services in the banking sector, and other agents in the economy offers commodity for customers, adding value to the well structured market economy at microeconomic levels. This enables change of the purchasing behavior of Macedonian citizens, similar to EU citizens. By forecasting values for POS terminals, Macedonia approximately in year 2010 will have the same infrastructure as Slovenia.
Opposite to POS terminals, there is lot to desire at ATM terminal infrastructure of Macedonia. Number of terminals is growing with 13.9% quarterly last three years, but comparing to Slovenia this number is just 43% of the number of ATM terminals there. Macedonian banks, through this contribute very little to the comfort of their customers, adding here the fact that most of the terminals are placed in the capital Skopje, Macedonian banks remain far behind their partners in Slovenia, in this element. They stand good just in the variety of payment cards issued i.e. around 16 card brands, and 3 card types. We can�t expect fast recovery of these figures, especially after conclusions that the average value withdrawn from ATM terminals is annually decreasing approximately -8%, which will lead to recessive policies of banks in this direction. Confusing is the fact that the use of ATM terminals is falling, whereas the use of POS is growing despite the financial crisis and decrease in the purchasing power of Macedonian citizens. This drives conclusions that the dept of Macedonian citizens in bank institutions is steadily growing.
Payment instruments infrastructure in Macedonia is well developed although remain far behind Slovenia i.e. EU countries. Debit/Credit card usage over-passed Debit card and Credit card usage growth (by volume and value). Slovenian figures can be reachable if the growth rate in cards per capita
EPS as an e-commerce enabler: The Macedonian perspective, Mr. sc. Besim Abdullai
16
continues and grows. Based on actual trends and problems this seems to be very challenging if not unreachable for Macedonia.
The cross-country analysis done through econometric analysis, show very interesting interrelation between Macedonia as EU candidate country and Slovenia as EU member. Debit card and Credit card usage is very influenced from availability of ATM terminals and POS terminals. ATM terminal growth effect in Debit Card and Credit Card use is more significant in Macedonia rather than in Slovenia, whereas the opposite is true for the EFT POS terminal growth in Slovenia, i.e. more EFT POS in Slovenia greater the use of Debit and Credit cards, compared to Macedonia. This can strengthen more our presumption that the purchasing power of Slovenian citizens is greater compared to Macedonians.
Finally, from the overall analysis of the Macedonian EPS, one can conclude that Macedonia has a very heterogeneous structure of influences in its EPS. EPS of Macedonia is more developed than it is used i.e. the problem of its use is not to the system, but to the behavior of other actors in economy, purchasing behavior of citizens and the readiness of the financial sector to offer more services to citizens, especially to spread their offers evenly around the country, not only in the capital Skopje.
References & Bibliography Books:
[1] L.M. Applegate, F. W. McFarlan, dhe J.L. McKenney, (1999), �Electronic Commerce: Trends and Opportunities,� in Corporate Information Systems Management (New York: McGraw-Hill Irwin)
[2] L.M. Applegate, R.D. Austin, F.W. McFarlan, (2003), �Corporate Information Strategy and Management� 6th Edition, p.p. 45-79
[3] Turban, E., (2005) �Electronic Commerce�, 5th ed., Prentice Hall, [4] Turban, E., Aronson, Liang, �Decision Support Systems and Intelligent Systems�, 7th Ed.,
Prentice Hall, 2004, [5] Turban E., et all,(2008) �Electronic Commerce: A Managerial Perspective�, Pearson Int. Ed. [6] Marcus Schmidt, Svend Hollensen, (2006), �Marketing Research: An International Approach� [7] Rowley Jennifer, (2002). �E-business: principles & practice�, Pelgrave [8] Applegate L., Austin R. D., McFarlan F. W., All of the Harward Business School, (2003),
�Corporate Information Strategy and Management�, McGrawHill Irwin, 6th Ed. [9] J. Rayport, B. Jaworski, (2001), �e-commerce�, McGrawHill Irwin [10] M. Davydov, (2001), �Corporate portals and e-business integration�, McGrawHill
[11] Haag, Cummings, McCubbrey, (2002), �MIS for the Information age� [12] Chaffey D., FionaEllis-Ch., K. Johnston, R.Mayer, (2006), �Internet Marketing: Strategy,
implementation and practice�, Prentice Hall [13] Nuhiu R., Shala A.(1995), �Introduction to Statistics�, Prishtina University Publications [14] Gujarati Damodar (1990), �Basic Econometrics�, McGrawHill [15] MaddalaG.S. (1992), �Introduction toEconometrics�, Macmillan Publishing Co. [16] Cochrane H. John (2005), �Time series for Macroeconomics and Finance�, University of
Chicago, USA [17] Vaart, van der A.W. (2001), �Time series�, Vrije Universiteit Amsterdam
Journals and other research materials:
(1) Vesna G., (2004). �General data about the situation of the ICT in Macedonia 2003-2004�, S. Vesna, Metamorphosis, FOSIM, �Skenpoint�-Skopje
EPS as an e-commerce enabler: The Macedonian perspective, Mr. sc. Besim Abdullai
17
(2) Amrit T., B. Ramesh, J.M. Robinson, (1999). �Toward a composite metric for electronic commerce ROI: an extension of the balanced scorecard�, College of Nusiness, Dep. Of Computer Information Systems, Georgia State University, Atlanta, USA
(3) Colecchia A. (2000). �Defining and measuring electronic commerce�, OECD (4) Wilko Bolt, David Humphrey, Roland Uittenbogaard (2005), �The effect of transaction pricing
on the adoption of electronic payments: A cross country comparison�, Working paper, www.philadelfiafed.org
(5) Shapiro J. (1999). �Small and Medium Enterprise Electronic Commerce Study� p.p.t., PriceWaterhouseCoopers
(6) Group of Authors (2002). �Internet and E-commerce Sector Study for the Balkan Region�, IFC project
(7) Tsiakis Th., George S., (2005). �The concept of Security and Trust in electronic payments�, Elsevier Ltd.
(8) Leinonen H., (2000). �Re-engineering payment systems for the e-world�, Bank of Finland discussion paper 17/2000, (www.bof.fi)
(9) Group of Authors (2003). �Cost savings from electronic payments and ATMs in Europe�, Working Paper No. 03-16, (www.phil.frb.org)
(10) Zwass Vladimir (1996). �Electronic Commerce: Structures and Issues�, International Journal of Electronic Commerce, Volume 1, Number 1, pp. 3 - 23.
(11) Group of Authors (2000). �Internet and e-commerce in Macedonia�, IFC study (12) Humphrey, D., M. Willesson, G. Bergendahl, and T. Lindblom, (2005). �Benefits from a
Changing Payment Technology in European Banking�, Journal of Banking and Finance (13) Jonker Nicole (2005), �Payment instruments as perceived by consumers � a public survey�,
Working paper, DNB. Internet resources:
a) The European Committee for Banking Standards, http://www.ecbs.org/ b) S.W.I.F.T. www.swift.com c) The European Central Bank, www.ecb.int d) World bank, www.worldbank.org e) The Worldwide Automated Transaction Clearing House (WATCH),www.globalach.org f) Identrus, www.identrus.com g) Open Financial Exchange, www.ofx.net h) The Clearing House Interbank Payment System (CHIPS), www.chips.org i) The European Central Bank, www.ecb.int j) The European Union's server, http://europa.eu.int/ k) The Euro Banking Association (EBA), www.abe.org l) The Bank for International Settlements, www.bis.org m) National Bank of the Republic of Macedonia, www.nbrm.com.mk n) Electronic Markets-The International Journal, www.electronicmarkets.org o) International Journal of e-commerce, www.gvsu.edu/business/ijec p) OECD, www.oecd.org q) The National Bank of Slovenia, www.bsi.si
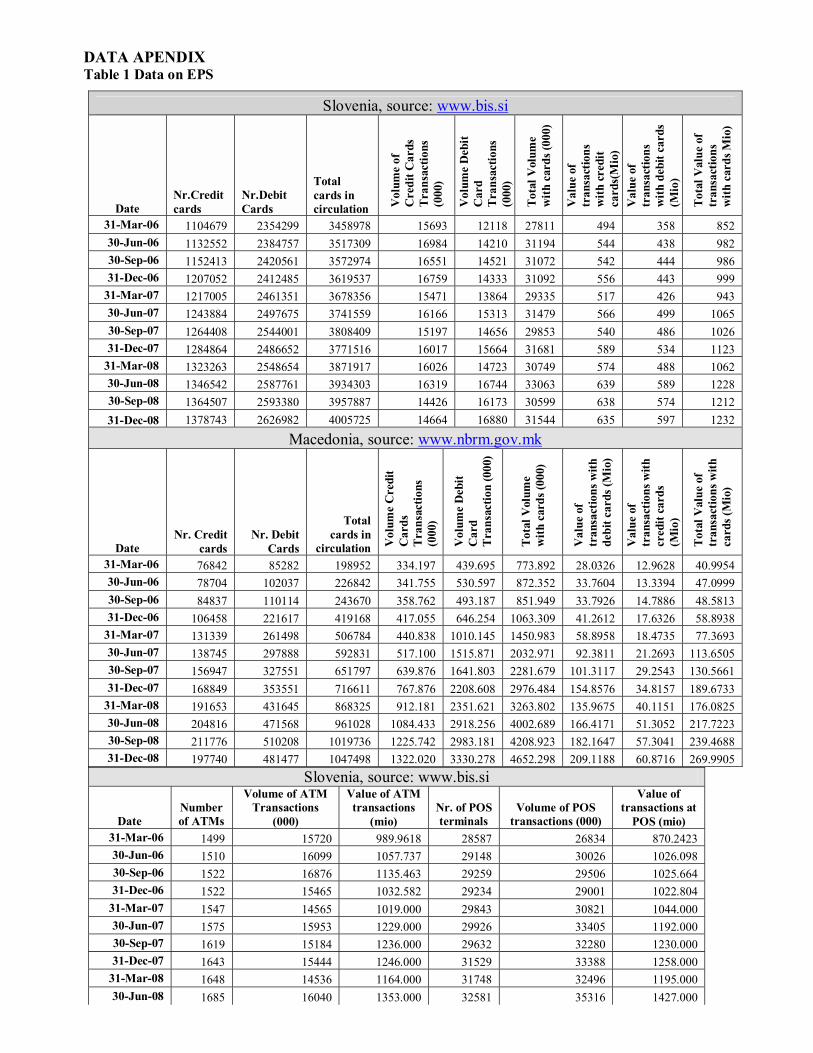
DATA APENDIX Table 1 Data on EPS
Slovenia, source: www.bis.si
Date Number of ATMs
Volume of ATM Transactions
(000)
Value of ATM transactions
(mio) Nr. of POS terminals
Volume of POS transactions (000)
Value of transactions at
POS (mio) 31-Mar-06 1499 15720 989.9618 28587 26834 870.2423 30-Jun-06 1510 16099 1057.737 29148 30026 1026.098 30-Sep-06 1522 16876 1135.463 29259 29506 1025.664 31-Dec-06 1522 15465 1032.582 29234 29001 1022.804
31-Mar-07 1547 14565 1019.000 29843 30821 1044.000 30-Jun-07 1575 15953 1229.000 29926 33405 1192.000 30-Sep-07 1619 15184 1236.000 29632 32280 1230.000 31-Dec-07 1643 15444 1246.000 31529 33388 1258.000
31-Mar-08 1648 14536 1164.000 31748 32496 1195.000 30-Jun-08 1685 16040 1353.000 32581 35316 1427.000
Slovenia, source: www.bis.si
Date Nr.Credit cards
Nr.Debit Cards
Total cards in circulation V
olum
e of
C
redi
t Car
ds
Tra
nsac
tions
(0
00)
Vol
ume
Deb
it C
ard
Tra
nsac
tions
(0
00)
Tot
al V
olum
e w
ith c
ards
(000
)
Val
ue o
f tr
ansa
ctio
ns
with
cre
dit
card
s(M
io)
Val
ue o
f tr
ansa
ctio
ns
with
deb
it ca
rds
(Mio
)
Tot
al V
alue
of
tran
sact
ions
w
ith c
ards
Mio
)
31-Mar-06 1104679 2354299 3458978 15693 12118 27811 494 358 852 30-Jun-06 1132552 2384757 3517309 16984 14210 31194 544 438 982 30-Sep-06 1152413 2420561 3572974 16551 14521 31072 542 444 986 31-Dec-06 1207052 2412485 3619537 16759 14333 31092 556 443 999
31-Mar-07 1217005 2461351 3678356 15471 13864 29335 517 426 943 30-Jun-07 1243884 2497675 3741559 16166 15313 31479 566 499 1065 30-Sep-07 1264408 2544001 3808409 15197 14656 29853 540 486 1026 31-Dec-07 1284864 2486652 3771516 16017 15664 31681 589 534 1123
31-Mar-08 1323263 2548654 3871917 16026 14723 30749 574 488 1062 30-Jun-08 1346542 2587761 3934303 16319 16744 33063 639 589 1228 30-Sep-08 1364507 2593380 3957887 14426 16173 30599 638 574 1212 31-Dec-08 1378743 2626982 4005725 14664 16880 31544 635 597 1232
Macedonia, source: www.nbrm.gov.mk
Date Nr. Credit
cards Nr. Debit
Cards
Total cards in
circulation Vol
ume
Cre
dit
Car
ds
Tra
nsac
tions
(0
00)
Vol
ume
Deb
it C
ard
Tra
nsac
tion
(000
)
Tot
al V
olum
e w
ith c
ards
(000
)
Val
ue o
f tr
ansa
ctio
ns w
ith
debi
t car
ds (M
io)
Val
ue o
f tr
ansa
ctio
ns w
ith
cred
it ca
rds
(Mio
)
Tot
al V
alue
of
tran
sact
ions
with
ca
rds (
Mio
)
31-Mar-06 76842 85282 198952 334.197 439.695 773.892 28.0326 12.9628 40.9954 30-Jun-06 78704 102037 226842 341.755 530.597 872.352 33.7604 13.3394 47.0999 30-Sep-06 84837 110114 243670 358.762 493.187 851.949 33.7926 14.7886 48.5813 31-Dec-06 106458 221617 419168 417.055 646.254 1063.309 41.2612 17.6326 58.8938
31-Mar-07 131339 261498 506784 440.838 1010.145 1450.983 58.8958 18.4735 77.3693 30-Jun-07 138745 297888 592831 517.100 1515.871 2032.971 92.3811 21.2693 113.6505 30-Sep-07 156947 327551 651797 639.876 1641.803 2281.679 101.3117 29.2543 130.5661 31-Dec-07 168849 353551 716611 767.876 2208.608 2976.484 154.8576 34.8157 189.6733
31-Mar-08 191653 431645 868325 912.181 2351.621 3263.802 135.9675 40.1151 176.0825 30-Jun-08 204816 471568 961028 1084.433 2918.256 4002.689 166.4171 51.3052 217.7223 30-Sep-08 211776 510208 1019736 1225.742 2983.181 4208.923 182.1647 57.3041 239.4688 31-Dec-08 197740 481477 1047498 1322.020 3330.278 4652.298 209.1188 60.8716 269.9905
EPS as an e-commerce enabler: The Macedonian perspective, Mr. sc. Besim Abdullai
19
30-Sep-08 1697 15275 1342.000 33017 33238 1438.000 31-Dec-08 1731 15716 1359.000 33490 33531 1398.000
Macedonia, source: www.nbrm.gov.mk
Date ATMs Volume of ATM Transactions(000)
Valueof ATM transactions (mio)
Nr.of POS terminals
Volume of POS transactions(000)
Value of transactions at POS (mio)
31-Mar-06 181 537.210 40.752326 2452 344.553 11.72296 30-Jun-06 207 632.148 42.986413 3712 394.018 13.96978 30-Sep-06 231 707.483 57.426553 4309 424.370 15.08009 31-Dec-06 297 837.257 60.583914 5554 506.263 18.19459
31-Mar-07 422 1364.581 87.768725 8258 684.025 22.20512 30-Jun-07 470 2084.434 136.786180 9856 951.053 30.65850 30-Sep-07 504 2513.240 186.482178 11976 1163.035 40.59424 31-Dec-07 529 3036.400 207.398089 14056 1518.512 54.07211
31-Mar-08 605 3641.614 241.004984 17976 1740.861 61.48317 30-Jun-08 640 4687.738 309.730688 19364 2153.305 77.69702 30-Sep-08 693 5395.637 383.240552 20882 2311.118 85.37832 31-Dec-08 761 4474.590 338.541400 21465 2341.827 84.60450
Table 2 Regression results
Variable Parameter Estimation t-statistics p>│t│ Constant term 1α 4.58 4.53 0.006 DIFDCARDATM 2α -8.55 -3.44 0.018 DIFDCARDPOS 3α 3.86 3.29 0.022 DIFDCARDATM2 22α 11.73 3.09 0.027 DIFDCARDPOS2 33α 1.84 1.30 0.251
DIFDCARDATMPOS 23α -4.65 -2.11 0.088 Constant term 1β 4.74 7.06 0.001 DIFCCARDATM 2β -5.89 -2.47 0.057 DIFCCARDPOS 3β 2.3 1.44 0.210 DIFCCARDATM2 22β 4.66 1.06 0.339 DIFCCARDPOS2 33β -0.29 -0.15 0.890
DIFCCARDATMPOS 23β -0.92 -0.31 0.769 Debit Card equation (1): Adjusted R2=0.97, Durbin Watson original = 1.80, DW transformed = 1.68 24 iterations, 11 observations, F (5, 5) =95.34, Prob. >F =0.0001, 95% confidence interval Credit Card equation (1): Adjusted R2=0.99, Durbin Watson original = 3.44, DW transformed = 3.07 7 iterations, 11 observations, F (5, 5) =2601.32, Prob. >F =0.0000, 95% confidence interval Our data computations follow a trans-log type of approach, where squared values of variables are computed as (ln X)2 rather than ln (X2), and interaction variables are: (ln X)(ln Y), rather than: ln(XY). Consequently, first differences are computed as (ln X)2
t−(ln X)2t-1 rather than: ln(X2)t−ln(X2)t-1, and interaction variables are: (ln X)
(ln Y)t−(ln X) (ln Y)t-1 rather than: ln(XY)t−ln(XY)t-1. The two approaches give similar but not identical results.