incentives for electronic payment acceptance
TRANSCRIPT

Incentives for Electronic
Payment Acceptance ELECTRONIC PAYMENT ACCEPTANCE PACKAGE
Pub
lic D
iscl
osur
e A
utho
rized
Pub
lic D
iscl
osur
e A
utho
rized
Pub
lic D
iscl
osur
e A
utho
rized
Pub
lic D
iscl
osur
e A
utho
rized
ACKNOWLEDGEMENTSThis report is a result of a collaborative effort across the World Bank Group’s Finance, Competitiveness, and Innovation Global Practice and the Financial Inclusion Global Initiative’s (FIGI) Electronic Payment Acceptance (EPA) Working Group, funded by the Bill and Melinda Gates Foundation.
This report was prepared by a team from the World Bank led by Oya Ardic (EPA Working Group Co-Chair) including Jeffrey Allen, Santiago Carbo-Valverde, Sujit Chakravorti, and Francisco Rodriguez-Fernandez, with inputs from Balakrishnan Mahadevan and Georgina Marin.
Additional contributions were provided by Ahmed Faragallah, Dorothee Delort and Gynedi Srinivas, who kindly reviewed this report in its various stages, by Hemant Baijal, Asmaa Bennani, Ilka Funke and Peter Jensen who used the approaches described in this report in the field for piloting, and by the Payment Systems Development Group (PSDG) of the World Bank during seminars. Debra Naylor designed and provided graphics for the report.
The core team thanks Harish Natarajan (Lead Financial Sector Specialist) for his technical guidance and comments during development of the report and Mahesh Uttamchandani (Practice Manager) for provid-ing the overall guidance to the working group.
Comprehensive EPA Market Research and Incentives Workstream consultations were undertaken while preparing and finalizing the report. The workstream comprised Daniel Gersten Reiss (Banco Central do Brasil), Jouali Fadwa (Bank Al-Maghrib), Ayse Zoodsma-Sungur (De Nederlandsche Bank), Ashraf Sabry (Fawry), Marwan El Aasar (Network International), Amina Tirana (Visa), Wameek Noor (Visa), Jesse McWaters (MasterCard), Heba Shams (Mastercard), Youssouf Sy (Universal Postal Union), Sergey Dukelskty (Universal Postal Union), Gabriela Jaramillo Gabino (CNBV Mexico), Matthew Saal (IFC), Mohamed Helmy (Central Bank of Egypt), Ma Haoyu (PBoC), Rundong Jiang (PBoC), Xi Sun (Ant Group), Amitabh Saxena (Digital Disruptions), Camilo Tellez (Better than Cash Alliance), and Jeff Allen, Oya Ardic, Hemant Baijal, Ahmed Faragallah and Georgina Marin (World Bank).
FINANCE, COMPETITIVENESS & INNOVATION GLOBAL PRACTICEPayment Systems Development Group
©2022 International Bank for Reconstruction and Development / The World Bank1818 H Street NW, Washington, DC 20433Telephone: 202-473-1000; Internet: www.worldbank.org
DISCLAIMERThe Financial Inclusion Global Initiative led in partnership by the World Bank Group (WBG), International Telecommunication Union (ITU), and the Committee on Payments and Market Infrastructures (CPMI), with the support of Bill & Melinda Gates Foundation (BMGF). The FIGI program funds national implementations in three countries (China, Egypt, and Mexico), supporting topical working groups to tackle 3 sets of out-standing challenges in closing the global financial inclusion gap, and hosting 3 annual symposia to gather the engaged public on topics relevant to the grant and share intermediary learnings from its efforts.
This work is a product of the World Bank with external contributions prepared for the Financial Inclusion Global Initiative (FIGI) Electronic Payments Acceptance (EPA) Working Group. The findings, interpreta-tions, and conclusions expressed in this work do not necessarily reflect the views of the Financial Inclusion Global Initiative partners including The World Bank, its Board of Executive Directors, or the governments they represent, or the views of the Committee for Payments and Market Infrastructure, International Tele-communications Union, or the Bill & Melinda Gates Foundation.
The World Bank does not guarantee the accuracy of the data included in this work. The boundaries, col-ors, denominations, and other information shown on any map in this work do not imply any judgment on the part of The World Bank concerning the legal status of any territory or the endorsement or acceptance of such boundaries.
RIGHTS AND PERMISSIONS The material in this work is subject to copyright. Because the World Bank encourages dissemination of its knowledge, this work may be reproduced, in whole or in part, for noncommercial purposes as long as full attribution to this work is given. Any queries on rights and licenses, including subsidiary rights, should be addressed to the Office of the Publisher, The World Bank, 1818 H Street NW, Washington, DC 20433, USA; fax: 202-522-2422; e-mail: [email protected].
INCENTIVES FOR ELECTRONIC PAYMENT ACCEPTANCE • i
Acknowledgements inside cover
Acronyms ii
Executive Summary 1
1 Introduction 3
2 Transaction Accounts, Infrastructure, and Digital Payments 7
3 Competition among Digital Payment Instruments 10
4 Case Studies of Strategies to Improve EPA and Usage 14
5 POS Terminal Subsidies 29
6 Fiscal and Financial Incentives to Encourage Electronic Payments 34
7 Cash Disincentives, Mandatory Electronic Payments, and Reporting Requirements 38
8 Value Added Services 42
9 Quantifying the Impact of Incentives on Payment Acceptance and Usage 46
10 Policy Recommendations 52
References 55
ANNEX 1: Types of Payment Cards 59
ANNEX 2: Fees in a Four-Party Payment Card Transaction 60
Notes 61
Currency Conversions 64
Table of Contents

ii • FINANCIAL INCLUSION GLOBAL INITIATIVE
ACH Automated clearing house
ATM Automated teller machine
B2B Business-to-business
B2G Business-to-government
B2P Business-to-person
BKM Interbank Card Center in Turkey
CPMI Committee on Payments and Market Infrastructure
ECB European Central Bank
EFT Electronic funds transfer
EPA Electronic payment acceptance
FIGI Financial Inclusion Global Initiative
FMCG Fast moving consumer goods
GPSS Global Payment Systems Survey
ICT Information and Communication Technology
IFC International Finance Corporation
ITU International Telecommunication Union
MDR Merchant discount rate
MSME Micro, small and medium enterprises
MSMR Micro, small and medium retailers
NFC Near-field communication
P2B Person-to-business
POS Point-of-sale
PSP Payment service provider
QR Quick response
USSD Unstructured supplementary service data
VAT Value-Added Tax
WB World Bank
WBG World Bank Group
WEF World Economic Forum
Acronyms and Abbreviations

INCENTIVES FOR ELECTRONIC PAYMENT ACCEPTANCE • 1
Executive Summary
Electronic payments hold benefits for a wide range of economic stakeholders. At the micro level, merchants, consumers, and governments all stand to gain through a variety of channels from increased use of electronic payments. At a more macro level, electronic payments have been linked to stronger economic growth and more efficient monetary transfers. Moreover, electronic pay-ments have been crucial in supporting economic activity throughout the COVID-19 pandemic, as more shopping has taken place online and preferences have shifted toward reducing contact in the payment process.
Despite the benefits of electronic payments, electronic payment acceptance (EPA) has historically been sluggish in developing economies, particularly among micro, small, and medium retailers (MSMRs). For example, World Bank Group (2016) reports that USD 19 trillion out of a total of USD 34 trillion worth of payments received and made by MSMRs is made in cash. At the same time, according to the Global Findex database, around 52 percent of adults globally used digital payments in 2017. In low-income and lower middle-income countries, this figure is down to 26 and 29 percent, respectively. While this can partly be due to low levels of transaction account ownership by adults in developing countries—reported at 63 percent in compar-ison to high-income economies at 96 percent—account
ownership by small merchants also play an important role. At the same time, an enabling environment conducive to the provision of payment services for merchants and cus-tomers is key.
The adoption of digital payments and their frequent use is thought of as a first step for broader financial inclusion for traditionally unbanked individuals and merchants. For example, electronic payments made daily at small every-day merchants can lead to habit formation by consum-ers and merchants, can encourage them to seek access to other relevant and suitable financial products, and can encourage the providers to serve these segments with a suite of financial products. At the same time, the adop-tion and frequent use of digital payments, especially for everyday needs, is considered as one prerequisite for par-ticipating in the digital economy.
As such, digital payments—facilitating further financial inclusion and participation in the digital economy—has been of high importance in the payment systems reform agenda of many countries and institutions such as the World Bank. World Bank projects developed recently include digitalization of payments whenever feasible and relevant, making digital economy at the forefront for devel-opment. For example, real sector development projects

2 • FINANCIAL INCLUSION GLOBAL INITIATIVE
such as in the agriculture or energy sectors include making agriculture payments or utility bill payments digitally. Digi-talization of government payments, including social safety net payments, has been underway for years.1 In addition, in recent years, EPA stakeholders in a range of global econo-mies have implemented incentive programs to help accel-erate the transition toward greater electronic payment acceptance and usage by merchants and consumers.
The purpose of this report is to analyze the design, imple-mentation, and efficacy of many of these incentives implemented by different types of stakeholders around the world, with the aim of improving the adoption and usage of electronic payments by small merchants. The report is part of the broader EPA Package.2 Together with the other components of the EPA Package, this report is intended to assist national authorities, international orga-nizations and electronic payment ecosystem stakehold-ers in the design and implementation of incentives to increase EPA.3
The report examines incentives in a broad sense, including traditional economic incentives that seek to change spe-cific behaviors among targeted agents, as well as policy and infrastructure improvements that better enable EPA. Additionally, the report considers both direct incentives geared toward merchants and indirect incentives that target other payment system participants, such as con-sumers and PSPs. Consistent with the World Bank’s finan-cial inclusion mandate, the report focuses on MSMRs, but many of the incentives discussed herein are applicable for large retailers as well. In studying incentive implementa-tions, the report uses a mixed method research approach involving qualitative case study analysis and quantita-tive machine learning analysis. The findings in this report leads to nine policy recommendations, which are further detailed in the report:
RECOMMENDATION 1: Public authorities could encourage greater adoption of transaction accounts by consumers and merchants by increasing the diversity of product offerings with particular attention given to increasing the participation of individuals in the lower income tiers.
RECOMMENDATION 2: Public authorities could encourage private sector payment solutions that may not be bank centric especially where ownership of bank accounts is
low while maintaining adequate safeguards to protect the resilience of the payment system broadly, provide ade-quate protections to end-users and the safety and integ-rity of the financial system as a whole.
RECOMMENDATION 3: Public authorities could mandate the use of electronic payments for disbursement of gov-ernment benefits and wages and encourage electronic payment of private-sector wages. The selection of PSPs should be open and competitive to qualified entities sub-ject to proper risk controls, and end-user protections.
RECOMMENDATION 4: Public authorities could encourage the development of alternative merchant infrastructures that leverage new technologies to increase acceptance.
RECOMMENDATION 5: Public authorities could foster upgrade or replacement of components of the NPS rel-evant for development of fast payment systems that provide faster, more efficient, and safer retail payment mechanisms that can operate 24 hours a day/seven days a week. Due consideration should be given to allowing access to the relevant NPS components to nonbanks while maintaining sufficient risk mitigating controls.
RECOMMENDATION 6: Pricing regulations aimed at increas-ing acceptance and usage of electronic payments, if needed, should be based on the degree of market matu-rity of the payment instrument being considered, com-petition among established and emerging payment instruments, economic analysis of the impact of the price regulations on PSPs and end-users and extensive stake-holder considerations.
RECOMMENDATION 7: Public authorities could consider lowering taxes when electronic payments are used by consumers and merchants.
RECOMMENDATION 8: When considering cash disincentives to decrease illicit and other untaxed transactions, public authorities could consider the positive impact of these policies on EPA and usage of electronic transactions.
RECOMMENDATION 9: Public authorities should support a level playing field between banks and non-banks in the provision of value-added services that improve business intelligence and MSMRs access to financial products.
INCENTIVES FOR ELECTRONIC PAYMENT ACCEPTANCE • 3
1. Introduction
The shift from paper-based to electronic payment instru-ments has been taking place for decades, but the level of acceptance and usage of electronic payments varies considerably across countries and payment segments. In many countries, micro, small, and medium retailers (MSMRs) have been particularly reluctant to convert from cash to digital payments.4 In 2016, the World Bank Group (WBG) (2016) estimated that MSMRs globally made and accepted USD 34 trillion worth of payments annually, of which only 44 percent were made electronically. The pro-portion of electronic payments is substantially lower for developing countries. This report investigates different incentives implemented by public sector authorities and private sector participants—along with infrastructure and general economic conditions—to encourage acceptance and usage of electronic payments by MSMRs.5
Economic incentives are often thought of as financial rewards or penalties that are meant to change behaviors of economic agents. This report evaluates a range of mea-sures to improve EPA taken by public authorities and pri-vate sector participants that are intended to aid MSMRs by reducing costs, increasing revenue, or improving overall business flows. These types of incentives will be referred to as direct incentives. This report also considers incentives given to other payment ecosystem participants
that are able to influence MSMRs’ acceptance decisions. These types of incentives are indirect incentives that work through consumers, payment service providers (PSPs), and other payment ecosystem participants.
A key assumption underlying this report is that electronic payments are beneficial for relevant stakeholders. Though the report does not focus on these benefits, a few are worth highlighting up front. Perhaps most importantly, MSMRs benefit from increased revenue, efficiency gains, lower cash handling cost, real-time access to revenue and expense histories, the ability to sell remotely, and, often, access to other financial and value-added services. Fur-ther, consumers benefit from increased safety, decreased transaction time, the ability to purchase remotely, bet-ter financial management, and access to other financial services. PSPs gain increased revenue and the opportu-nity to cross-sell other products and services. Electronic payments also help governments reduce the size of the shadow economy, collect taxes, and disburse funds. More broadly, electronic payments are associated with eco-nomic growth and enhance the efficiency of monetary transfers by increasing digital liquidity. Finally, electronic payments have played a vital role in supporting eco-nomic activity throughout the COVID-19 pandemic, due to increased reliance on e-commerce, preferences for
4 • FINANCIAL INCLUSION GLOBAL INITIATIVE
reducing contact in the payment process, and reduced availability of cash access points.
Targeted incentives can help alleviate many barriers to EPA identified in the EPA Assessment Guide.6 This report focuses on incentives that can be implemented by gov-ernments, private sector stakeholders, or both. This report takes a deep dive on how specific types of EPA incentives have been implemented in select countries. Policymakers and others can leverage the analysis presented herein to tailor incentive programs to their local economies.
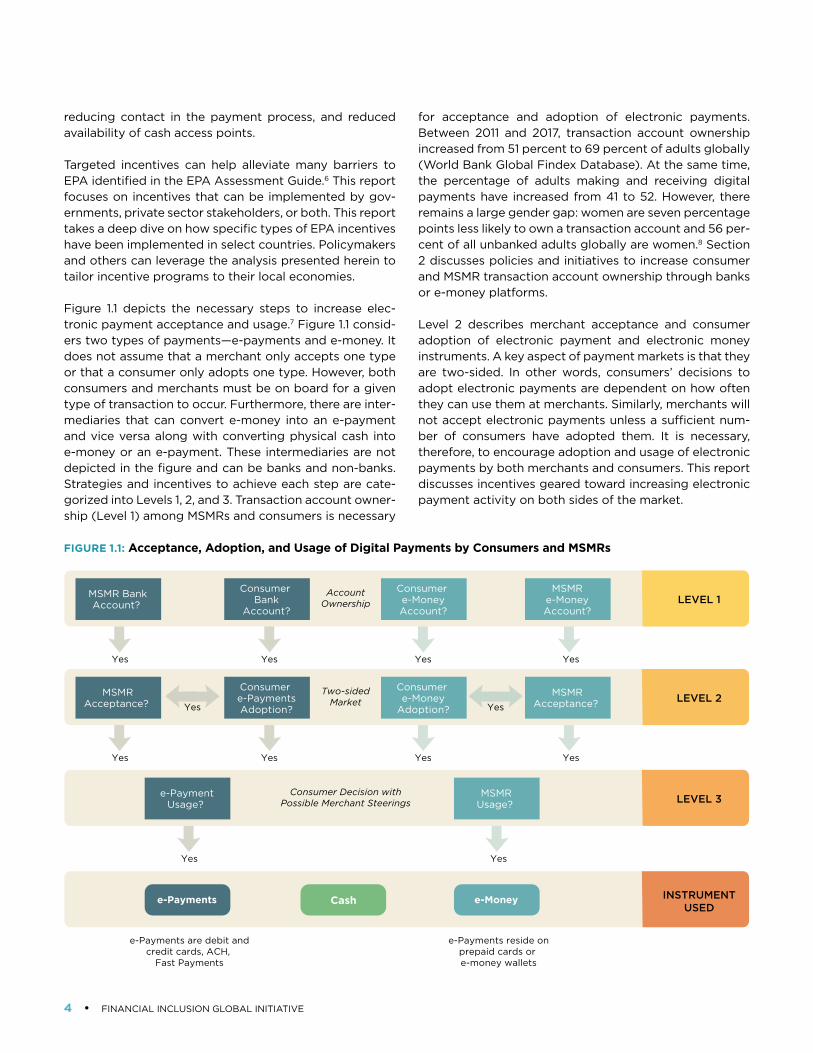
Figure 1.1 depicts the necessary steps to increase elec-tronic payment acceptance and usage.7 Figure 1.1 consid-ers two types of payments—e-payments and e-money. It does not assume that a merchant only accepts one type or that a consumer only adopts one type. However, both consumers and merchants must be on board for a given type of transaction to occur. Furthermore, there are inter-mediaries that can convert e-money into an e-payment and vice versa along with converting physical cash into e-money or an e-payment. These intermediaries are not depicted in the figure and can be banks and non-banks. Strategies and incentives to achieve each step are cate-gorized into Levels 1, 2, and 3. Transaction account owner-ship (Level 1) among MSMRs and consumers is necessary
for acceptance and adoption of electronic payments. Between 2011 and 2017, transaction account ownership increased from 51 percent to 69 percent of adults globally (World Bank Global Findex Database). At the same time, the percentage of adults making and receiving digital payments have increased from 41 to 52. However, there remains a large gender gap: women are seven percentage points less likely to own a transaction account and 56 per-cent of all unbanked adults globally are women.8 Section 2 discusses policies and initiatives to increase consumer and MSMR transaction account ownership through banks or e-money platforms.
Level 2 describes merchant acceptance and consumer adoption of electronic payment and electronic money instruments. A key aspect of payment markets is that they are two-sided. In other words, consumers’ decisions to adopt electronic payments are dependent on how often they can use them at merchants. Similarly, merchants will not accept electronic payments unless a sufficient num-ber of consumers have adopted them. It is necessary, therefore, to encourage adoption and usage of electronic payments by both merchants and consumers. This report discusses incentives geared toward increasing electronic payment activity on both sides of the market.
FIGURE 1.1: Acceptance, Adoption, and Usage of Digital Payments by Consumers and MSMRs
MSMR BankAccount?
ConsumerBank
Account?
Consumere-MoneyAccount?
MSMRe-MoneyAccount?
AccountOwnership
Yes YesYesYes
LEVEL 1
MSMRAcceptance?
Consumere-PaymentsAdoption?
Consumere-Money
Adoption?
MSMRAcceptance?
Two-sidedMarket
Yes YesYesYes
LEVEL 2YesYes
e-PaymentUsage?
MSMRUsage?
Consumer Decision withPossible Merchant Steerings
YesYes
LEVEL 3
e-Payments e-Money
e-Payments reside onprepaid cards or e-money wallets
e-Payments are debit andcredit cards, ACH,
Fast Payments
INSTRUMENTUSED
Cash
INCENTIVES FOR ELECTRONIC PAYMENT ACCEPTANCE • 5
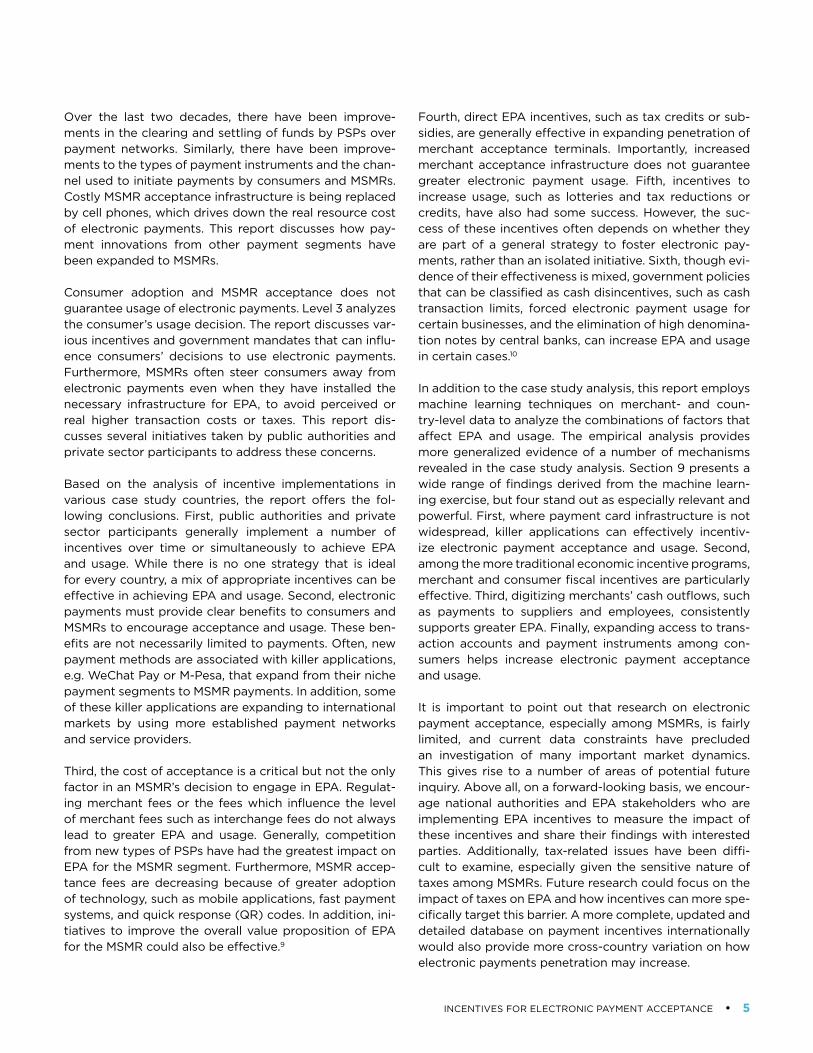
Over the last two decades, there have been improve-ments in the clearing and settling of funds by PSPs over payment networks. Similarly, there have been improve-ments to the types of payment instruments and the chan-nel used to initiate payments by consumers and MSMRs. Costly MSMR acceptance infrastructure is being replaced by cell phones, which drives down the real resource cost of electronic payments. This report discusses how pay-ment innovations from other payment segments have been expanded to MSMRs.
Consumer adoption and MSMR acceptance does not guarantee usage of electronic payments. Level 3 analyzes the consumer’s usage decision. The report discusses var-ious incentives and government mandates that can influ-ence consumers’ decisions to use electronic payments. Furthermore, MSMRs often steer consumers away from electronic payments even when they have installed the necessary infrastructure for EPA, to avoid perceived or real higher transaction costs or taxes. This report dis-cusses several initiatives taken by public authorities and private sector participants to address these concerns.
Based on the analysis of incentive implementations in various case study countries, the report offers the fol-lowing conclusions. First, public authorities and private sector participants generally implement a number of incentives over time or simultaneously to achieve EPA and usage. While there is no one strategy that is ideal for every country, a mix of appropriate incentives can be effective in achieving EPA and usage. Second, electronic payments must provide clear benefits to consumers and MSMRs to encourage acceptance and usage. These ben-efits are not necessarily limited to payments. Often, new payment methods are associated with killer applications, e.g. WeChat Pay or M-Pesa, that expand from their niche payment segments to MSMR payments. In addition, some of these killer applications are expanding to international markets by using more established payment networks and service providers.
Third, the cost of acceptance is a critical but not the only factor in an MSMR’s decision to engage in EPA. Regulat-ing merchant fees or the fees which influence the level of merchant fees such as interchange fees do not always lead to greater EPA and usage. Generally, competition from new types of PSPs have had the greatest impact on EPA for the MSMR segment. Furthermore, MSMR accep-tance fees are decreasing because of greater adoption of technology, such as mobile applications, fast payment systems, and quick response (QR) codes. In addition, ini-tiatives to improve the overall value proposition of EPA for the MSMR could also be effective.9
Fourth, direct EPA incentives, such as tax credits or sub-sidies, are generally effective in expanding penetration of merchant acceptance terminals. Importantly, increased merchant acceptance infrastructure does not guarantee greater electronic payment usage. Fifth, incentives to increase usage, such as lotteries and tax reductions or credits, have also had some success. However, the suc-cess of these incentives often depends on whether they are part of a general strategy to foster electronic pay-ments, rather than an isolated initiative. Sixth, though evi-dence of their effectiveness is mixed, government policies that can be classified as cash disincentives, such as cash transaction limits, forced electronic payment usage for certain businesses, and the elimination of high denomina-tion notes by central banks, can increase EPA and usage in certain cases.10
In addition to the case study analysis, this report employs machine learning techniques on merchant- and coun-try-level data to analyze the combinations of factors that affect EPA and usage. The empirical analysis provides more generalized evidence of a number of mechanisms revealed in the case study analysis. Section 9 presents a wide range of findings derived from the machine learn-ing exercise, but four stand out as especially relevant and powerful. First, where payment card infrastructure is not widespread, killer applications can effectively incentiv-ize electronic payment acceptance and usage. Second, among the more traditional economic incentive programs, merchant and consumer fiscal incentives are particularly effective. Third, digitizing merchants’ cash outflows, such as payments to suppliers and employees, consistently supports greater EPA. Finally, expanding access to trans-action accounts and payment instruments among con-sumers helps increase electronic payment acceptance and usage.
It is important to point out that research on electronic payment acceptance, especially among MSMRs, is fairly limited, and current data constraints have precluded an investigation of many important market dynamics. This gives rise to a number of areas of potential future inquiry. Above all, on a forward-looking basis, we encour-age national authorities and EPA stakeholders who are implementing EPA incentives to measure the impact of these incentives and share their findings with interested parties. Additionally, tax-related issues have been diffi-cult to examine, especially given the sensitive nature of taxes among MSMRs. Future research could focus on the impact of taxes on EPA and how incentives can more spe-cifically target this barrier. A more complete, updated and detailed database on payment incentives internationally would also provide more cross-country variation on how electronic payments penetration may increase.
6 • FINANCIAL INCLUSION GLOBAL INITIATIVE
This report is structured as follows. Section 2 discusses the importance of greater transaction account ownership and payment and non-payment infrastructure improve-ments to increase the adoption and usage of electronic payments by MSMRs and consumers. Section 3 dis-cusses competition between the payment card issuers and acquirers, and from providers of newer electronic payment instruments. Section 4 discusses specific case studies of effective strategies to increase EPA and usage. Countries represented in these case studies are: China, India, Kenya, Malaysia, Spain, and Turkey.
Sections 5-7 turn to more traditional incentives geared toward directly changing the behavior of merchants and consumers. Historically, subsidies for point-of-sale ter-minals have been a common EPA incentive. Section 5 discusses acceptance infrastructure subsidies provided by governments or payment networks. The cases of Argentina, Uruguay, Mexico, Poland, Indonesia, Malaysia, and India are discussed in this section. Section 6 focuses on the impact of fiscal incentives and lottery programs, such as reductions in value-added taxes for consumers and tax credits for merchants. Drawing on experiences in South Korea, Uruguay, Colombia, and Mexico, the report concludes that these incentive programs can be very effective, but sound design and implementation, marked by transparency and efficiency, matter greatly. Though sometimes difficult to enforce, certain mandates and dis-incentives have also been employed globally to reduce the shadow economy and incentivize electronic payments. To this end, Section 7 analyzes the role of cash disincentives and mandates of using electronic payments in increasing electronic payments.
Section 8 explores value added services offered by PSPs to merchants, such as credit facilities, improved inventory management, and customized marketing efforts. Focus-ing on value-added services offered by PSPs in the United States, Kenya, Peru, Mexico, and Sweden the report con-cludes that these services can be powerful incentives for increasing merchants’ stickiness as EPA users. Comple-menting the qualitative case study analysis, Section 9 quantifies the impact of a wide range of incentives on elec-tronic payment acceptance and usage utilizing machine learning approaches that are well-suited for navigating the complex and potentially large set of factors affect-ing electronic payments. Section 9 presents a significant number of findings related to incentive effectiveness, but those dealing with killer applications, fiscal incentives, digitization of the merchant payment chain, and financial access seem especially relevant and powerful.
The findings presented in Sections 2-9 lead to several policy recommendations, which are discussed in Section 10. The nine recommendations focus on improving finan-cial access, balancing a neutral and enabling regulatory framework with payment system safety and efficiency, payment infrastructure improvements, and tax-related incentives, among other key issues. The policy recom-mendations and supporting analysis are intended to pro-vide insights to national authorities and other electronic payment stakeholders seeking to develop locally tailored EPA incentive programs.

INCENTIVES FOR ELECTRONIC PAYMENT ACCEPTANCE • 7
2. Transaction Accounts, Infrastructure, and Digital Payments
Financial institutions, payment networks, and non-bank PSPs rely on banking, payment, and communication infrastructures to offer payment services to consumers, businesses, and governments. This section examines the importance of improvements to transaction account own-ership and both non-payment and payment infrastruc-tures for the adoption and usage of digital payments. Although necessary, these improvements may not be sufficient by themselves to enable greater adoption and usage of digital payments.11
Figure 2.1 depicts different precursors that enable the adoption of electronic payments. The left column indi-cates that individuals and businesses may have trans-action accounts at banks, non-banks, or both. Many countries have made advances in bank account owner-ship over the last ten years. However, in some countries where such advancements have been sluggish, non-bank account ownership has begun to substitute for bank account ownership.
The middle column of Figure 2.1 highlights the role of non-payment infrastructures that are often necessary to support transaction account penetration. These include national identifications and reliable communication sys-tems, including high mobile phone penetration and wide-spread internet connectivity, which allow for access to
accounts, authentication, and transfer of funds. In some important cases, improvements in these areas have allowed new, more cost effective, and convenient payment alternatives to leapfrog traditional payment instruments.
The right column of Figure 2.1 denotes the importance of traditional and new payment rails. Improving the accep-tance and delivery of established payment instruments, such as cards, through advancements in underlying technology, cost reduction, and competition from new
Account Ownership
Bank
Non-Bank
Mobile Phones
Precursors to Digital Payment Adoption
National ID
Connectivity
Cards
Fast Payments
ACH
e-Money
Non-Payment Infrastructure
Payment Infrastructure
FIGURE 2.1: Precursors to Digital Payment Adoption

8 • FINANCIAL INCLUSION GLOBAL INITIATIVE
entrants can help lessen barriers to electronic payment adoption and usage. Some countries, however, have had more success introducing new payment instruments (e.g. fast payments or e-money). This section discusses these new payment solutions, which are built on key infrastruc-ture improvements. In addition, regulators and the public sector, more broadly, often foster the adoption of some precursors.
2.1 TRANSACTION ACCOUNTS
The adoption and usage of digital payment instruments are critically dependent on end users owning transac-tion accounts. As defined in CPMI and WBG (2016, p. 2), transaction accounts are “accounts (including e-money/prepaid accounts) held with banks or other authorized and/or regulated PSPs, which can be used to make and receive payments and to store value.”12 Ownership of transaction accounts continues to increase globally. The World Bank (WB) Global Findex Database reports that 69 percent of adults owned transaction accounts in 2017, which is up from 62 percent and 51 percent in 2014 and 2011, respectively.
Despite aggregate improvements in transaction account ownership, various segments remain underserved. More-over, usage is uneven across jurisdictions. Programs and initiatives by the public and private sectors geared toward expanding transaction account ownership and usage are, therefore, helpful in many contexts for electronic pay-ment adoption and usage
2.2 IDENTIFICATION
Unique identifications (IDs) are critical for individuals to receive basic services such as healthcare, pensions, and other government services. According to the World Bank Identification for Development (ID4D) initiative, over one billion people globally do not have basic ID credentials.13 The lack of trusted IDs continues to be one of the chief obstacles to financial inclusion. Further-more, women are significantly less likely to have an ID than men in low-income countries according to the 2017 Global Findex survey.
GPFI (2018) stresses the importance of IDs being digital. Digital IDs lower barriers to financial inclusion by: allowing for greater ease for unbanked to open accounts; enabling more cost-effective onboarding especially remotely, and contributing to financial sector embedding by supporting the delivery of additional services to individuals (GPFI, 2018). Furthermore, digital IDs have enabled financial
institutions to be more compliant with anti-money laun-dering and other “know your customer” requirements (WBG, 2020). In addition, digital IDs enable greater effi-ciency for customer due diligence especially at lower income tiers.
2.3 INFRASTRUCTURE
This report discusses two types of infrastructure improve-ments—non-payment and payment—that provide the foundation to increase adoption and usage of digital payments. Improvements to non-payment infrastructures may enable lower costs and more attractive payment options for MSMRs and consumers. Increasing access to and greater reach of communication networks improve the exchange of information between buyers and sellers to initiate, process, and settle payments.14 Merchant EPA infrastructure generally requires stable Internet or phone connectivity. Public authorities should be concerned if lack of connectivity impedes critical digital payment functions, such as authorization, clearing, settlement, and receipt of funds.
The single biggest driver to EPA in many developing coun-tries is the widespread ownership of mobile phones that can be used to access payment platforms. According to the World Bank Group (2020), there are over 850 million registered mobile money accounts spanning 90 coun-tries with USD 1.3 billion daily transaction volume. Mobile phone payments can reduce the cost of acceptance and increase connectivity to PSPs in real time. For example, retailers are often able to attach relatively inexpensive dongles to mobile phones to accept payment cards. Retailers can also display QR codes that are scanned by customers using their smart phones to make electronic payments. In many emerging market and developing economies, mobile money is based on SMS text messages and USSD services because access to smart phones and data services (3G and above) are not readily available. WBG (2020) discusses National Payments Corporation of India’s National Unified USSD Platform that offers USSD-based mobile payments services. However, some coun-tries are introducing QR codes with USSD codes that can be dialed in by non-smart phone users, e.g. Ghana (Hinch-liffe, 2020).
Improvements to payment infrastructures can entice con-sumers and merchants to substitute electronic payments for cash. These can be done in three ways. The first is to upgrade the existing payment infrastructure in terms of cost, convenience, and technical specifications. The second involves non-bank closed loop e-money solu-tions offering convenient payment alternatives via mobile
INCENTIVES FOR ELECTRONIC PAYMENT ACCEPTANCE • 9
devices, either by leveraging the banking system or cash-based agent services. The third revolves around devel-oping new generation payments infrastructure such as fast payment systems that use new payment rails to offer convenient, inexpensive, credit-based transfers between transaction accounts, which may be initiated by mobile phones.15 It is important to note that as part of the third approach, more and more fast payment systems are being designed in a way that support multiple payment instru-ments (including e-money) and as such, provide direct clearing access to both, banks and non-banks. The use of open APIs in fast payment systems has also enabled different types of institutions to connect to the infrastruc-ture and build/offer overlay services (such as request-to-pay) to end users.
The accessibility, cost, and functionality of payment instruments continues to improve. CPMI and WBG (2016) categorize payment instruments into three broad cate-gories—electronic funds transfer (EFT)-based, payment card-based, and electronic money (e-money)-based. Improvements to payment infrastructure can occur in the front- or back-ends (Bech and Hancock, 2020).16 The front end consists of the source of funds (e.g., transaction account or cash agent), the type of payment instrument (e.g., credit transfer or payment card), and the service channel used to initiate the payment (e.g., mobile appli-cation or card). The back-end involves the PSPs of payors and payees clearing and settling transactions over pay-ment systems, such as automated clearing house (ACH) or fast payments, a new retail payment rail.
Traditional electronic retail payment instruments are bank-based and include payment cards and ACH, an EFT-based
instrument.17 Payment cards are ideally suited for per-son-to-retailer POS or remote payments. ACH payments have been traditionally used for remote repeat payments, such as payroll, bill payment, and for many B2B payments. Today, they are also used to fund e-money accounts.
More recently, e-money has become popular and is often issued by non-banks. E-money instruments are prefunded and include online money (initiated via the Internet), mobile money (initiated via mobile phone), and prepaid cards. These instruments are funded via transac-tion accounts, cash using agent networks, or payments received from previous transactions. Depending on the level of acceptance, e-money may be converted to cash or a bank deposit quickly or may remain on e-money plat-forms for long periods of time.
Fast payments, a new type of payment rail allow clear-ing and settlement of non-bank and bank-initiated pay-ments, “generally allow payees to receive funds within seconds of the payer initiating the payment, anytime and anywhere” (Bech, Shimizu, and Wong 2017, p. 57). Fast payment systems facilitate payments between account holders across multiple payment platforms, as opposed to closed-loop payment mechanisms that may provide immediacy of funds within their platform (CPMI and WB, 2020). Benefits of fast payments include lower cost, faster transaction speed, elimination of settlement risk, and integration with PSPs using application programming interfaces (APIs). These systems are being implemented often more successfully in developing countries before advanced countries and are becoming more popular than traditional retail electronic payments in some countries (Bech, Shimizu and Wong, 2017).
10 • FINANCIAL INCLUSION GLOBAL INITIATIVE
3. Competition among Digital Payment Instruments
At the point of sale, payment cards continue to be the preferred digital payment instrument in most countries for making purchases. According to World Bank Fin-dex data, among those who made a digital payment in 2017, 72 percent used a debit or credit card to make a purchase. However, economic and infrastructure barriers may pose challenges to expanding the physical payment card infrastructure access to underserved segments, such as MSMRs, in many economies. Greater use of mobile devices have made digital payments more accessible for consumers and merchants. Han and Wang (2021) argue that mobile payments may complement or substitute card payments depending on payment card usage prior to the introduction of mobile payments. Furthermore, the payment card networks are expanding into other types of payments. Michael Miebach, CEO of Mastercard, stated that while cards have been the backbone of Mastercard’s business and remain critical today, the company would like the ability to connect any payor to any payee, regardless of the form of payment, e.g. cards, bank accounts, mobile wallets, or any other form of payment (Bary, 2020). As a result of greater access to mobile payments, merchant acceptance and usage of new digital payment instru-ments are increasing. This section discusses how provid-ers of different types of payment instruments compete to increase merchant acceptance and consumer usage of digital payments.
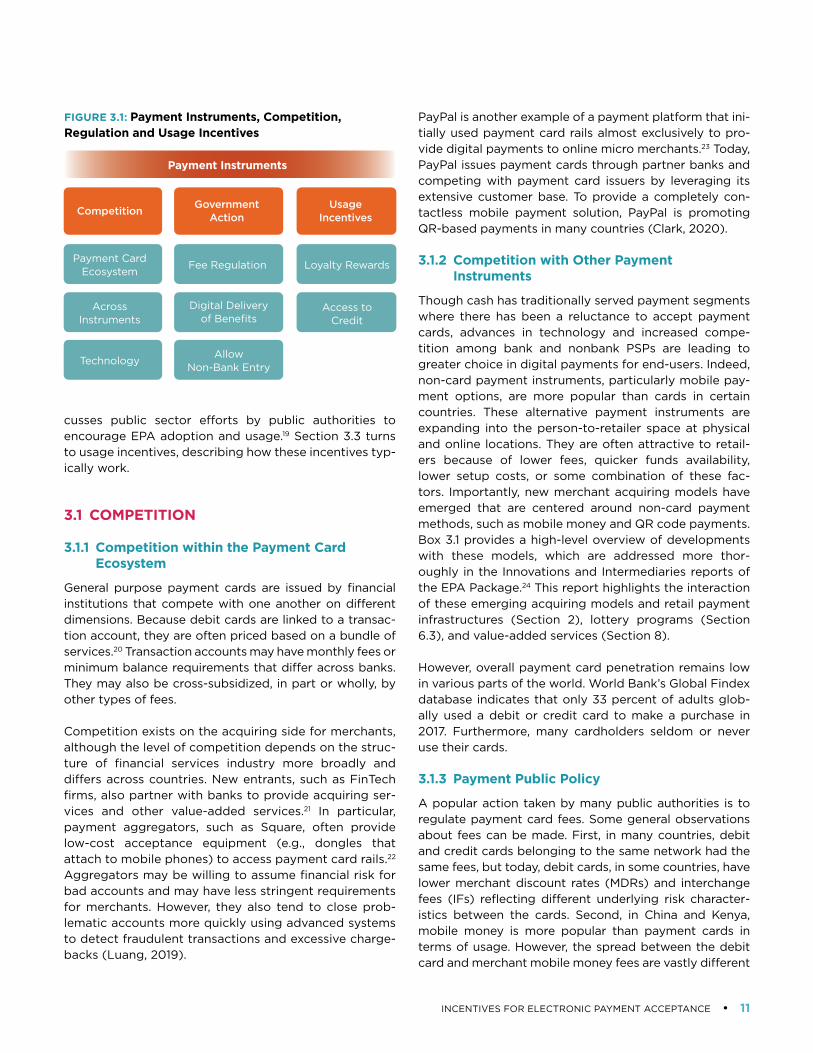
Figure 3.1 depicts this section’s framework. The left col-umn captures competition in the digital payment mar-ket. Traditionally, there has been competition among card acquirers, issuers, and networks. More recently, other forms of digital payments have started to compete with cards. In addition, greater use of technology such as mobile phones have allowed greater adoption of new payment instruments and new form factors of existing instruments. The middle column diagrams the potential roles for government including fee regulation, digital delivery of government benefit payments, and allowing greater entry of non-bank payment providers in payments markets.18 The right column depicts usage incentives for consumers to adopt payment instruments. Specifically, this report investigates successful consumer incentives to adopt and use payment cards. Over time, such incen-tives may be adopted by other payment instruments. In Section 6, we discuss other incentives such as tax incen-tives and lotteries. To encourage greater card usage, card issuers often offer frequent use rewards to increase con-sumer usage. In addition, some payment instruments are attached to lines of credit that are valued by consumers as well as merchants.
This section begins with a discussion of competition between electronic payment providers. Section 3.2 dis-
INCENTIVES FOR ELECTRONIC PAYMENT ACCEPTANCE • 11
cusses public sector efforts by public authorities to encourage EPA adoption and usage.19 Section 3.3 turns to usage incentives, describing how these incentives typ-ically work.
3.1 COMPETITION
3.1.1 Competition within the Payment Card Ecosystem
General purpose payment cards are issued by financial institutions that compete with one another on different dimensions. Because debit cards are linked to a transac-tion account, they are often priced based on a bundle of services.20 Transaction accounts may have monthly fees or minimum balance requirements that differ across banks. They may also be cross-subsidized, in part or wholly, by other types of fees.
Competition exists on the acquiring side for merchants, although the level of competition depends on the struc-ture of financial services industry more broadly and differs across countries. New entrants, such as FinTech firms, also partner with banks to provide acquiring ser-vices and other value-added services.21 In particular, payment aggregators, such as Square, often provide low-cost acceptance equipment (e.g., dongles that attach to mobile phones) to access payment card rails.22 Aggregators may be willing to assume financial risk for bad accounts and may have less stringent requirements for merchants. However, they also tend to close prob-lematic accounts more quickly using advanced systems to detect fraudulent transactions and excessive charge-backs (Luang, 2019).
PayPal is another example of a payment platform that ini-tially used payment card rails almost exclusively to pro-vide digital payments to online micro merchants.23 Today, PayPal issues payment cards through partner banks and competing with payment card issuers by leveraging its extensive customer base. To provide a completely con-tactless mobile payment solution, PayPal is promoting QR-based payments in many countries (Clark, 2020).
3.1.2 Competition with Other Payment Instruments
Though cash has traditionally served payment segments where there has been a reluctance to accept payment cards, advances in technology and increased compe-tition among bank and nonbank PSPs are leading to greater choice in digital payments for end-users. Indeed, non-card payment instruments, particularly mobile pay-ment options, are more popular than cards in certain countries. These alternative payment instruments are expanding into the person-to-retailer space at physical and online locations. They are often attractive to retail-ers because of lower fees, quicker funds availability, lower setup costs, or some combination of these fac-tors. Importantly, new merchant acquiring models have emerged that are centered around non-card payment methods, such as mobile money and QR code payments. Box 3.1 provides a high-level overview of developments with these models, which are addressed more thor-oughly in the Innovations and Intermediaries reports of the EPA Package.24 This report highlights the interaction of these emerging acquiring models and retail payment infrastructures (Section 2), lottery programs (Section 6.3), and value-added services (Section 8).
However, overall payment card penetration remains low in various parts of the world. World Bank’s Global Findex database indicates that only 33 percent of adults glob-ally used a debit or credit card to make a purchase in 2017. Furthermore, many cardholders seldom or never use their cards.
3.1.3 Payment Public Policy
A popular action taken by many public authorities is to regulate payment card fees. Some general observations about fees can be made. First, in many countries, debit and credit cards belonging to the same network had the same fees, but today, debit cards, in some countries, have lower merchant discount rates (MDRs) and interchange fees (IFs) reflecting different underlying risk character-istics between the cards. Second, in China and Kenya, mobile money is more popular than payment cards in terms of usage. However, the spread between the debit card and merchant mobile money fees are vastly different
Competition
Payment Card Ecosystem
Across Instruments
Technology
Fee Regulation
Allow Non-Bank Entry
Digital Delivery of Benefits
Payment Instruments
Loyalty Rewards
Access to Credit
Government Action
Usage Incentives
FIGURE 3.1: Payment Instruments, Competition, Regulation and Usage Incentives
12 • FINANCIAL INCLUSION GLOBAL INITIATIVE
in the two countries. When policymakers consider regu-lating the costs of payment instruments, they should also consider the differences in benefits between payment instruments to end-users. In Kenya, the cost to accept debit cards is 2.5 times more than to accept M-Pesa payments.25 In China, the fees between debit cards and mobile payments can be relatively close depending on the type of transaction. Third, higher MDRs may pro-vide additional incentives for new types of instruments to enter the payments landscape. Fourth, there are some technologies such as QR codes that can reduce costs for payment cards and other forms of payments such as fast payments and e-money. Fifth, market forces instead of regulatory intervention or moral suasion may also reduce IFs and MDRs.
There are other public policies that have been effective to encourage greater acceptance and usage of electronic payments. Governments can be proactive and mandate the payment of social benefits and public sector wages be made electronically. Government benefit recipients receive payments faster and more efficiently than cash distribution especially in remote and rural areas. In addi-tion, such policies increase awareness and comfort with digital payments.26
As mentioned, new entrants to the payments markets often increase accessibility of payments to those that have not used digital payments before. However, these new entrants may face stringent regulatory hurdles. In the next section, the introduction of digital payments by nonbanks in China and Kenya where regulators used a different regulatory framework to initially allow the devel-opment of digital payments is discussed. The approach used in China is described by WBG (2020) as a “wait and see” approach to developing a regulatory framework for new entrants, new products, and other innovations. The Chinese mobile payments landscape was largely unreg-ulated but small step changes, such as tightening access to payment licenses and establishing customer due dil-igence requirements, were frequently introduced over time according to WBG (2020). The approach used in Kenya is described as “test and learn” approach by WBG (2020). The Central Bank of Kenya invoked Trust Law imposing certain conditions on mobile network operators and using letters of no objection if the conditions were adhered to (WBG, 2020). WBG (2020) also discusses another regulatory approach being implemented in some countries which it calls the “innovation facilitators” approach which includes innovation hubs and regulatory sandboxes.27
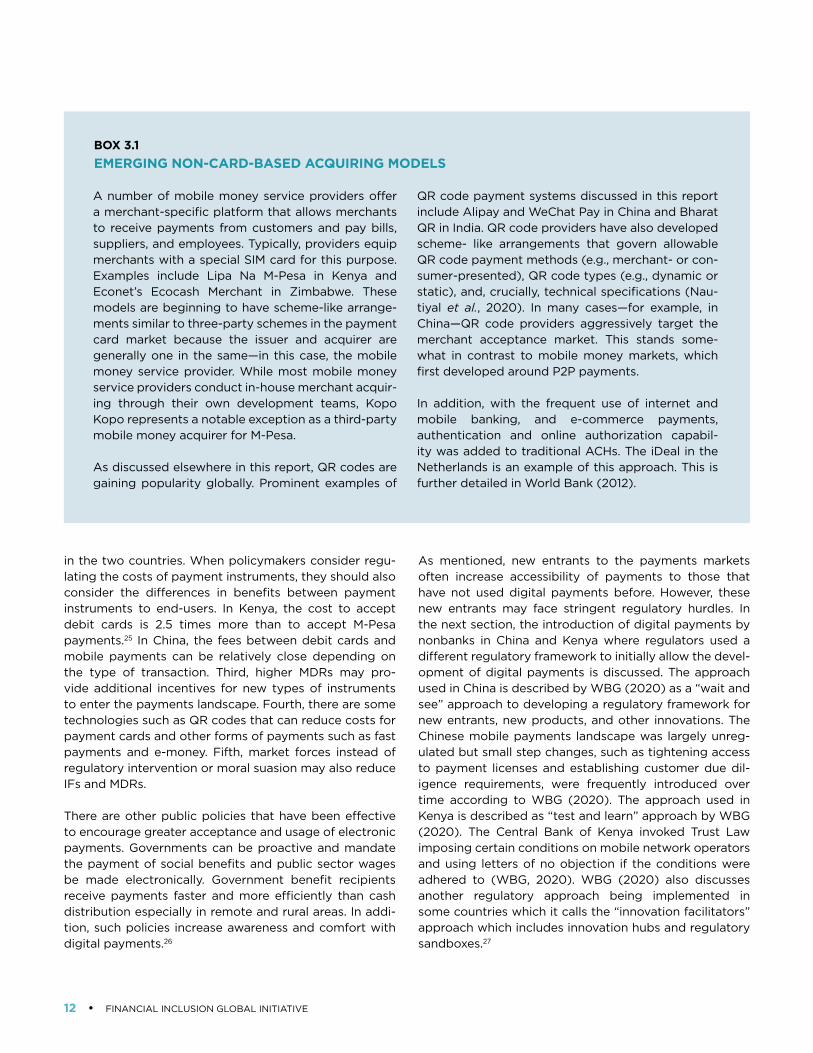
A number of mobile money service providers offer a merchant-specific platform that allows merchants to receive payments from customers and pay bills, suppliers, and employees. Typically, providers equip merchants with a special SIM card for this purpose. Examples include Lipa Na M-Pesa in Kenya and Econet’s Ecocash Merchant in Zimbabwe. These models are beginning to have scheme-like arrange-ments similar to three-party schemes in the payment card market because the issuer and acquirer are generally one in the same—in this case, the mobile money service provider. While most mobile money service providers conduct in-house merchant acquir-ing through their own development teams, Kopo Kopo represents a notable exception as a third-party mobile money acquirer for M-Pesa.
As discussed elsewhere in this report, QR codes are gaining popularity globally. Prominent examples of
BOX 3.1EMERGING NON-CARD-BASED ACQUIRING MODELS
QR code payment systems discussed in this report include Alipay and WeChat Pay in China and Bharat QR in India. QR code providers have also developed scheme- like arrangements that govern allowable QR code payment methods (e.g., merchant- or con-sumer-presented), QR code types (e.g., dynamic or static), and, crucially, technical specifications (Nau-tiyal et al., 2020). In many cases—for example, in China—QR code providers aggressively target the merchant acceptance market. This stands some-what in contrast to mobile money markets, which first developed around P2P payments.
In addition, with the frequent use of internet and mobile banking, and e-commerce payments, authentication and online authorization capabil-ity was added to traditional ACHs. The iDeal in the Netherlands is an example of this approach. This is further detailed in World Bank (2012).
INCENTIVES FOR ELECTRONIC PAYMENT ACCEPTANCE • 13
3.3 USAGE INCENTIVES
PSPs often deploy incentives to increase payment card usage such as loyalty rewards and access to credit. Loyalty rewards, such as cash-back programs and airline miles, are often, but not always, linked to credit card usage. In markets with nascent card adoption, these rewards may increase adoption and usage. In mature markets, these incentives can also be competitive tools to attract users from other card issuers. Regarding access to credit, con-sumers may be incentivized to use credit cards because they provide payment timing flexibility and enable con-sumption smoothing. PSPs also incentivize credit card borrowing by lowering the cost of credit and enhancing flexibility—for example, through interest free repayment periods and installment plans.
Several studies (Agarwal, Chakravorti, and Lunn, 2010; Carbo-Valverde and Linares-Zegarra, 2011; Ching and Hayashi, 2010) have found that loyalty rewards and credit incentives increase payment card usage, either overall or for a given issuer. However, these incentives are not without risks, as they can lead to over-indebtedness or over-consumption. Further, some have argued that credit card incentives drive greater convenience use of credit cards to the detriment of lower cost but functionally sim-ilar payment instruments, such as debit cards (Reserve Bank of Australia 2016). The Turkish case study (Section 4.6) best illustrates the dynamics of payment card usage incentives, including the benefits and some of the pitfalls of these programs.
14 • FINANCIAL INCLUSION GLOBAL INITIATIVE
4. Case Studies of Strategies to Improve EPA and Usage
This section focuses on specific case studies of payment instrument competition. First, the case studies of China and Kenya discuss the rapid adoption of mobile payment systems that have gained critical mass over a short period of time. Second, the Indian case study discusses many gov-ernment initiatives that have been introduced to increase electronic payment acceptance and usage including new payment instruments but India remains behind its peers in the adoption of electronic payments. Third, the Span-ish and Malaysian case studies provide examples of the effectiveness of fee regulation. Lastly, the Turkish case study provides an example of market-based incentives to increase payment card acceptance and usage.
4.1 CHINA
China provides a compelling example of the benefits of non-bank mobile payment platforms for POS and remote digital payments in large cities.28 Several factors have allowed for the rapid adoption and usage of mobile pay-ments in large cities including high transaction account penetration, interoperability between banks and non-bank mobile payment platforms, leapfrogging of tra-
ditional payment cards for certain payment segments, such as POS and online retailers, a regulatory strategy that has enabled innovation, and lower cost acceptance technology.
4.1.1 Transaction Accounts
Over the last ten years, China has been successful in improving bank account ownership. Overall, 80 percent of Chinese adults owned a bank account in 2017 compared to 64 percent in 2011 (World Bank Global Findex Data-base). However, bank account ownership is significantly lower in rural areas. World Bank Global Findex data indi-cate that 200 million rural adults still remained outside of the regulated financial system in 2017.
From 2011 to 2014, bank account ownership increased, in part, due to the government mandate for state-owned banks to open more accounts for rural households. The opening of these accounts enabled electronic delivery of government transfers for healthcare and agriculture (Shrader and Duflos, 2014). The government also requires commercial banks to provide no-fee transaction accounts with debit cards if they are used to access government benefit transfers (WBG and PBOC, 2018).
INCENTIVES FOR ELECTRONIC PAYMENT ACCEPTANCE • 15
4.1.2 Retail Payments Infrastructure
Over the last few decades, China has taken measures to advance its retail payments infrastructure and migrate away from cash payments (WBG and PBOC, 2018). Debit card issuance, for example, increased from 1.1 billion in 2006 to 8.4 billion in 2019 (WBG and PBOC, 2018; China Banking News, 2020).29 From 2012 to 2016, the volume and value of noncash payment transactions processed by traditional financial service providers grew by 304 percent and 287 percent, respectively (WBG and PBOC, 2018).
Established in 2002, UnionPay International provides an interbank clearing system for payment cards.30 The pay-ment card network has more than 100 commercial banks as the main shareholders, along with 400 domestic and foreign associate members serving rural and urban areas (WBG and PBOC, 2018). Its payment cards can be used in various traditional (e.g., ATMs and POS terminals) and emerging (e.g., Internet, mobile phones and smart TV terminals) channels. UnionPay International issued more than 7.5 billion cards that are accepted in 176 countries in 2019, with over 120 million cardholders outside of China (Smith, 2019; UnionPay, 2020).
While banks process large numbers of noncash transac-tions, non-bank payment entities process twice as many transactions (720 billion versus 331 billion). In particular, non-bank mobile payments have been a major catalyst of electronic payments in China. With high smartphone pen-etration and widespread adoption of QR codes among merchants, non-bank mobile payment adoption and usage has grown rapidly in large cities.31 Mobile payments’ market share rose dramatically from about 3.5 percent in 2011 to 83 percent in 2018.
World Bank Global Findex data reports that the percent-age of adults that have used digital payments jumped from 45 percent to 68 percent between 2014 and 2017. Chinese banks processed 101.4 billion mobile transac-tions valued at RMB 347 trillion (USD 53.2 trillion) in 2019. The average value of bank mobile payments was around USD 525, suggesting relatively large payments. During the same period, non-bank payment entities pro-cessed 720 billion online payment transactions worth RMB 249 trillion (USD 38.2 trillion) (China Banking News, 2020). The average value of these payments was USD 53, suggesting that these systems are more likely to be used at MSMRs.
Initially, Chinese regulatory authorities allowed emerg-ing non-bank mobile payment platforms to grow with relatively few restrictions by adopting a ‘wait and see
approach’ (WBG and PBOC, 2018, p. 44). Today, the regu-lation has tightened. For example, the total value of funds on the platform must be held as non-interest-bearing reserve accounts at PBOC.
The two major non-bank mobile payment platforms are Alipay and WeChat Pay. Alipay is part of Ant Financial, which originated from Alibaba.32 Tencent introduced Ten-Pay in 2005 and integrated it into WeChat in 2013. Today, TenPay is called WeChat Pay.33 In the fourth quarter of 2019, WeChat Pay exceeded 1 billion in average daily transactions for commercial payments, with over 800 million monthly active users and over 50 million monthly active retailers (Tencent, 2020).
In these closed-loop mobile payment platforms, custom-ers load their accounts with bank transfers before making purchases without fees. Mobile platform users generally pay fees to transfer funds from their e-money accounts to their bank accounts. The existence of such fees provides an incentive to keep funds on the platform. In addition, these platforms are able to offer other financial products such as loans, insurance, and investment products to a large customer base.
From the merchant perspective, acceptance infrastruc-ture costs for mobile acceptance are significantly lower than the traditional payment card infrastructure. The traditional POS terminal is not required for mobile pay-ments. Rather, retailers typically display QR codes, and an in-app message confirms the transaction for both the merchant and customer (Aveni and Roest, 2017). Mer-chants who are unwilling to register typically conduct P2P mobile transfers. Originally, retailers were given gen-erous promotional incentives to accept mobile payments. However, many retailers adopted mobile payments with-out incentives because of high consumer demand (Aveni and Roest, 2017). In 2017, the merchant fee for Alipay was .6 percent and ranged from .1-2.0 percent for WeChat Pay (Aveni and Roest, 2017).
From the payment provider’s perspective, cross-subsidies exist with other services associated with e-commerce or social media that offset the operating cost of the pay-ment platforms. Similarly, large non-bank digital payment platforms have leveraged sizeable user networks from their e-commerce and social media platforms to capture extensive network reach. According to CGAP (2019a), there are 890 million unique mobile payment users in China. Blazyte (2019) reports that around 92 percent of population in the largest cities use WeChat Pay or Alipay as their primary means of payment.
16 • FINANCIAL INCLUSION GLOBAL INITIATIVE
4.1.3 Key Takeaways
Residents living in large cities have embraced digital pay-ments for POS and online purchases. A combination of government policies and private sector initiatives have been instrumental for the adoption and usage of digital payments. First, bank transaction account ownership is high, which allows funding of e-money accounts. Second, high smart phone ownership and usage allows for mobile applications to be used at POS. Third, the mobile pay-ment applications offer other financial and non-financial services to increase stickiness of funds to remain on the app. Fourth, the merchant value proposition is compel-ling. Fifth, the lack of well-functioning interoperable pay-ment networks when mobile payments were introduced, such as payment cards, allowed non-bank mobile pay-ment platforms to become more popular for online and POS payments at merchants. Sixth, the ‘wait and see’ reg-ulatory approach initially allowed Alipay and WeChat Pay to gain market share. Finally, the merchant acceptance infrastructure was inexpensive because of QR codes that took advantage of high levels of smartphone penetration.
4.2 KENYA
Kenya provides an example of an enabling regulatory environment and non-bank entities delivering innovative digital finance solutions, particularly mobile payments. While the killer mobile payments application, M-Pesa, was initially developed for the domestic remittance payments, today M-Pesa is used for P2B and B2B payments, along with other payment segments.34 Unlike China, the mobile payment experience in Kenya is not driven by account holders having transaction accounts at banks.35 Similar to China, the public authorities allowed the development of a regulatory framework alongside the development of M-Pesa itself. This regulatory approach, often referred to as ‘test and learn’, included simplified due diligence standards and lower regulatory hurdles for transaction account ownership.
4.2.1 Transaction Accounts
Before 2007, few Kenyans had access to a transaction account. Cash was the predominant mode for payments. M-Pesa changed how Kenyans stored and transferred funds between one another and paid for goods and ser-vices. As of 2017, 73 percent of adults owned a mobile money account compared to 59 percent in 2011 (World Bank Global Findex Database). In 2017, 56 percent of adults had a transaction account at a bank.
4.2.2 Identification
According to the World Bank ID4D project, about 18 per-cent of Kenyans are not registered for a national ID, which compares favorably to the 31 percent rate in Sub-Saharan Africa. Although Kenya has a digital ID program, the pro-gram has historically faced some impediments.36 Despite this challenge, the adoption of a simplified customer due diligence program has enabled banks to more easily open virtual and remote basic bank accounts. These basic accounts can maintain balances up to USD 2,500 and are subject to additional verification when this threshold is exceeded.
4.2.3 Retail payment infrastructure
Prior to 2007, there was no well-established, widely acces-sible, trusted, and robust network for making domestic remittances. The most popular methods for such trans-actions were ‘sending with friends and family’ (55.8 per-cent), ‘thru a bus or a matatu company’ (21.6 percent), and ‘using specialist money transfer services, such as Western Union and MoneyGram (18.2 percent) (Financial Access Survey, 2007). Other available options, such as cheques, directly depositing in a bank account, and post office money orders were not widely used.
The advent of M-Pesa transformed Kenya’s retail pay-ment landscape. The mobile money service leveraged the large penetration of mobile phones along with the use of mobile airtime to transfer funds. M-Pesa is a Simple Mes-saging Service (SMS)-based system that enables users to deposit, send, and withdraw funds using their mobile phone. Customers do not need to have a bank account and can transact at agent outlets. Other mobile money service providers followed M-Pesa and introduced similar services in the market afterwards.
The evolution of financial services digitization was crit-ically dependent on a ‘test and learn’ approach applied by three public authorities, the Central Bank of Kenya (CBK), the Communications Authority and the Compe-tition Authority (Ndung’u 2019). This approach allowed telecommunication companies to collaborate with com-mercial banks to innovate and roll out various financial products. The CBK’s comfort with the ‘test and learn’ approach owed, in part, to the requirement that the funds backing e-money were held in trust accounts at the part-ner commercial banks.
M-Pesa registration and deposits are free, and pricing for most other transactions is based on a tiered structure to allow even the lowest-income users to use the system.
INCENTIVES FOR ELECTRONIC PAYMENT ACCEPTANCE • 17
Transaction values typically range from USD 5 to USD 30. By 2010, M-Pesa surpassed all other payment systems in Kenya in terms of number of transactions. M-Pesa’s agent structure has been crucial. According to the IMF’s Finan-cial Access Survey (FAS), there were 668 mobile money agents per 100,000 adults in Kenya in 2018, compared to 5 bank branches and 9 ATMs, per 100,000 adults.
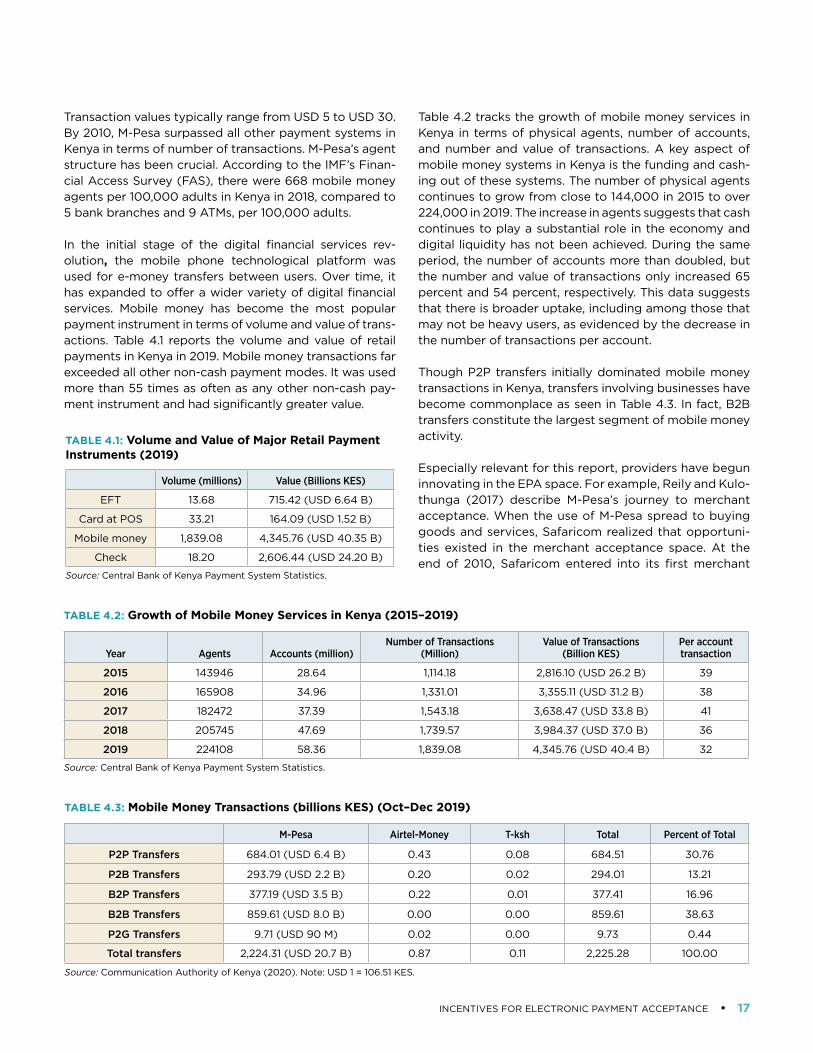
In the initial stage of the digital financial services rev-olution, the mobile phone technological platform was used for e-money transfers between users. Over time, it has expanded to offer a wider variety of digital financial services. Mobile money has become the most popular payment instrument in terms of volume and value of trans-actions. Table 4.1 reports the volume and value of retail payments in Kenya in 2019. Mobile money transactions far exceeded all other non-cash payment modes. It was used more than 55 times as often as any other non-cash pay-ment instrument and had significantly greater value.
Table 4.2 tracks the growth of mobile money services in Kenya in terms of physical agents, number of accounts, and number and value of transactions. A key aspect of mobile money systems in Kenya is the funding and cash-ing out of these systems. The number of physical agents continues to grow from close to 144,000 in 2015 to over 224,000 in 2019. The increase in agents suggests that cash continues to play a substantial role in the economy and digital liquidity has not been achieved. During the same period, the number of accounts more than doubled, but the number and value of transactions only increased 65 percent and 54 percent, respectively. This data suggests that there is broader uptake, including among those that may not be heavy users, as evidenced by the decrease in the number of transactions per account.
Though P2P transfers initially dominated mobile money transactions in Kenya, transfers involving businesses have become commonplace as seen in Table 4.3. In fact, B2B transfers constitute the largest segment of mobile money activity.
Especially relevant for this report, providers have begun innovating in the EPA space. For example, Reily and Kulo-thunga (2017) describe M-Pesa’s journey to merchant acceptance. When the use of M-Pesa spread to buying goods and services, Safaricom realized that opportuni-ties existed in the merchant acceptance space. At the end of 2010, Safaricom entered into its first merchant
TABLE 4.1: Volume and Value of Major Retail Payment Instruments (2019)
Volume (millions) Value (Billions KES)
EFT 13.68 715.42 (USD 6.64 B)
Card at POS 33.21 164.09 (USD 1.52 B)
Mobile money 1,839.08 4,345.76 (USD 40.35 B)
Check 18.20 2,606.44 (USD 24.20 B)
Source: Central Bank of Kenya Payment System Statistics.
TABLE 4.2: Growth of Mobile Money Services in Kenya (2015–2019)
Year Agents Accounts (million)Number of Transactions
(Million)Value of Transactions
(Billion KES)Per account transaction
2015 143946 28.64 1,114.18 2,816.10 (USD 26.2 B) 39
2016 165908 34.96 1,331.01 3,355.11 (USD 31.2 B) 38
2017 182472 37.39 1,543.18 3,638.47 (USD 33.8 B) 41
2018 205745 47.69 1,739.57 3,984.37 (USD 37.0 B) 36
2019 224108 58.36 1,839.08 4,345.76 (USD 40.4 B) 32
Source: Central Bank of Kenya Payment System Statistics.
TABLE 4.3: Mobile Money Transactions (billions KES) (Oct–Dec 2019)
M-Pesa Airtel-Money T-ksh Total Percent of Total
P2P Transfers 684.01 (USD 6.4 B) 0.43 0.08 684.51 30.76
P2B Transfers 293.79 (USD 2.2 B) 0.20 0.02 294.01 13.21
B2P Transfers 377.19 (USD 3.5 B) 0.22 0.01 377.41 16.96
B2B Transfers 859.61 (USD 8.0 B) 0.00 0.00 859.61 38.63
P2G Transfers 9.71 (USD 90 M) 0.02 0.00 9.73 0.44
Total transfers 2,224.31 (USD 20.7 B) 0.87 0.11 2,225.28 100.00
Source: Communication Authority of Kenya (2020). Note: USD 1 = 106.51 KES.

18 • FINANCIAL INCLUSION GLOBAL INITIATIVE
agreement, which would allow customers to pay with M-Pesa at the supermarket chains Naivas and Uchumi. By 2011, however, only 100 individual stores signed up for this service.
An innovative merchant acquirer, Kopo Kopo, convinced Safaricom to change its fee structure to launch a new ser-vice. Instead of customers paying tiered fees for trans-actions, merchants were charged 1.5 percent fee on the value of the transaction. Safaricom signed a merchant aggregator agreement with Kopo Kopo in March 2012. Ultimately, though, Safaricom was not satisfied with an arrangement in which only Kopo Kopo acquired mer-chants on their behalf.
Safaricom began to compete directly with Kopo Kopo in the merchant acceptance space, launching Lipa na M-Pesa in June 2013. Subsequently, Safaricom dropped the merchant fee to 1 percent, which Kopo Kopo matched. This fee is well below typical payment card fees. To bet-ter compete, Kopo Kopo has also responded by initiating innovating value-added services for merchants which are discussed in detail in Section 8.
4.2.4 Key Takeaways
Kenya’s digital financial services success provides an example of the private sector creating successful new payment instrument with support from public authorities. The CBK’s embrace of a ‘test and learn’ approach was instrumental in enabling Safaricom to develop M-Pesa. In many ways, the approach allowed CBK to monitor M-Pe-sa’s developments more efficiently. This framework cre-ated the basis for proactive dialogue between regulators and digital financial service providers, allowing for closer monitoring of new and hybrid business models, some of which have direct implications for EPA.37
M-Pesa’s success provides some key lessons. First, M-Pesa demonstrates how mobile phone penetration can be lev-eraged to extend payment services to a large number of unbanked consumers. Second, the M-Pesa experience highlights that the transition to a fully digital end-to-end payment experience is still progressing as evidenced by the growing number of agents in Kenya. As consumer comfort increases and more merchants accept mobile money, greater digital liquidity will be achieved. Third, it shows the importance of building a low-cost transactional platform to provide customers wider payment choices. Finally, banks continue to play a role in mobile payments. Although they do not provide direct customer services for mobile money, bank accounts may be a source of funding as bank transaction account ownership increases replacing cash agents.
4.3 INDIA
As discussed in Section 2, transaction account ownership is necessary for electronic payment usage by consumers and India has improved account ownership dramatically from 35 percent in 2011 to 80 percent in 2017 (World Bank Global Findex Database). In addition, new payment infrastructure has been built. However, India remains sig-nificantly behind its BRICS (Brazil, Russia, India, China, and South Africa) peers in terms of per capita electronic transactions and adoption of POS terminals. In 2018, there were 18 per capita electronic payment transactions annu-ally in India, compared to 166 for Brazil, 237 for Russia, 142 for China, and 85 for South Africa (CPMI, 2020). In terms of the number of POS terminals, India had 2,750 per mil-lion inhabitants in December 2018, compared to 40,583 in Brazil, 18,090 in Russia, 24,154 in China, and 7,233 in South Africa. More incentives for consumers and merchants may be necessary to achieve greater EPA and electronic payment usage in India. This section analyzes various Indian public and private initiatives that have improved the payment and no-payment infrastructures. However, MSMRs and consumers may still lack sufficient incentives to increase electronic payment acceptance and usage for India to catch up to its peers.
4.3.1 Increasing Transaction Account Ownership
The public authorities of the Government of India (GOI) and RBI took several steps to increase transaction own-ership. First, around 2005-2006, the Reserve Bank of India (RBI) asked banks to provide basic banking ser-vices, such as savings, credit, and remittances. Second, in 2014, GOI introduced the Pradhan Mantri Jan Dhan Yojana (PMJDY) program, which provided a transaction account and a RuPay debit card to all unbanked individ-uals. Third, near universal adult ID coverage allowed for greater ease to open transaction accounts for individ-uals. Fourth, GOI transferred various government ben-efits directly into bank accounts via the Direct Benefit Transfer (DBT) Program.38 Fifth, the expanding number of banking service access points increased households’ confidence to participate in the formal financial sector especially in rural areas.39
4.3.2 Identification
In 2009, the Unique Identification Authority of India (UIDAI) launched the AADHAAR initiative with the goal of providing biometric national identifications to all Indian residents. At the end of 2019, the UIDAI had issued 1.25 billion AADHAAR numbers (India Today, 2019). Raman (2018) indicates that 84 percent of people used AAD-HAAR as proof of identity to open their most recent bank

INCENTIVES FOR ELECTRONIC PAYMENT ACCEPTANCE • 19
account. On the MSMR side, those without formal busi-ness registration documentation may encounter prob-lems opening bank accounts and gaining access to EPA services. AADHAAR is now being used to facilitate busi-ness formalization through the Udyog AADHAAR regis-tration process for MSMEs.
4.3.3 Retail Payments Infrastructure
India’s digital retail payment infrastructure has signifi-cantly evolved. By 2016, National Payments Corporation of India (NPCI) created multiple electronic retail payment systems including the immediate payment system (IMPS) for instant credit transfers; a national automated clear-ing house system (NACH); the Unified Payment Interface (UPI) system for instant credit transfers (fast payments); and the national card scheme RuPay.
Two important electronic retail payment instruments for MSMRs are UPI and debit cards. UPI allows merchants to accept electronic payments via QR code (Bharath QR code) or a virtual payment address instead of a tradi-tional POS terminal. UPI reduces the cost of EPA substan-tially. In addition, UPI provides instant credit to merchant accounts. Low acceptance cost and instant credit pro-vide incentives for many merchants, especially MSMRs, to accept electronic payment instruments.
India’s National Card Scheme (NCS) was launched in 2012 with the introduction of the RuPay debit card. Visa and Mastercard payment cards are also popular in India. Most Indian banks are able to issue RuPay cards. However, while these cards account for about 50 percent of cards in circulation, they only account for 20 percent of card usage. The lack of usage of RuPay cards may be partly attributed to the lack of adequate acceptance infrastruc-ture in rural areas.
Table 4.4 reports the growth of the different digital payment instruments in India. Overall, the number of electronic payment transactions grew rapidly over the ten-year period. Three types of instruments—IMPS, UPI, and prepaid/digital wallets/e-money—started from zero transactions. The strong growth of UPI during 2015 to 2020 suggests that modern payment systems, coupled with new technology, such as fast payments, QR codes, open banking, APIs, and ‘killer’ applications can help accelerate EPA.
FinTech firms also played a significant role in expanding access to electronic payment mechanisms. These firms provided over 1.82 billion wallet-based financial accounts, which accounted for 5.1 billion transactions in 2019-2020. In addition, FinTech firms, both independently and in col-laboration with banks, helped deploy a significant number of new POS terminals and Bharath QR-code to increase
TABLE 4.4: Retail Digital Payments in India (2009–2019) (millions)
Sources: RBI (2020) and NPCI (2020) payment system statistics.
Note: India’s financial year is April to March.
Financial Year
EFT/NEFT Credit
Transfers
Immediate Payment Service
(IMPS) Credit Transfers
Unified Payment Interface
(UPI) instant credit transfer &
Merchant payments
National Automatic Clearing House (NACH) + Electronic Clearing —
Credit Transfer & D irect Debits
Credit Cards usage at POS
& E-commerce
Debit Cards usage at POS &
E-commerce
Prepaid Payment Instruments/
Wallets/ e-money
instruments
Total Retail Digital
Solutions
2009–10 66.34 0.00 0.00 247.43 234.25 170.17 0.00 718.19
2010–11 132.33 0.00 0.00 274.05 265.16 237.06 0.00 908.60
2011–12 226.10 0.09 0.00 286.24 319.96 327.52 30.60 1,190.51
2012–13 394.13 1.23 0.00 298.71 396.72 466.86 66.94 1,624.59
2013–14 661.01 15.36 0.00 431.95 509.08 619.08 133.63 2,370.11
2014–15 927.55 78.37 0.00 681.53 615.12 808.09 314.46 3,425.13
2015–16 1,252.88 220.81 0.00 1,667.84 785.67 1,173.63 748.02 5,848.83
2016–17 1,622.10 506.73 17.86 2,032.96 1,085.75 2,399.30 1,963.66 9,610.49
2017–18 1,946.36 1,009.83 915.23 2,511.14 1,405316 3,343.39 3,459.05 14,590.16
2018–19 2,318.88 1,752.90 5,353.40 3,041.47 1,762.59 4,414.28 4,607.23 23,250.75
2019–20 2,744.47 2,579.06 12,518.62 3,699.80 2,177.28 5,123.93 5,331.81 34,174.97
20 • FINANCIAL INCLUSION GLOBAL INITIATIVE
merchant acceptance. Furthermore, payment gateway services for merchants were deployed to facilitate e-com-merce and m-commerce transactions.
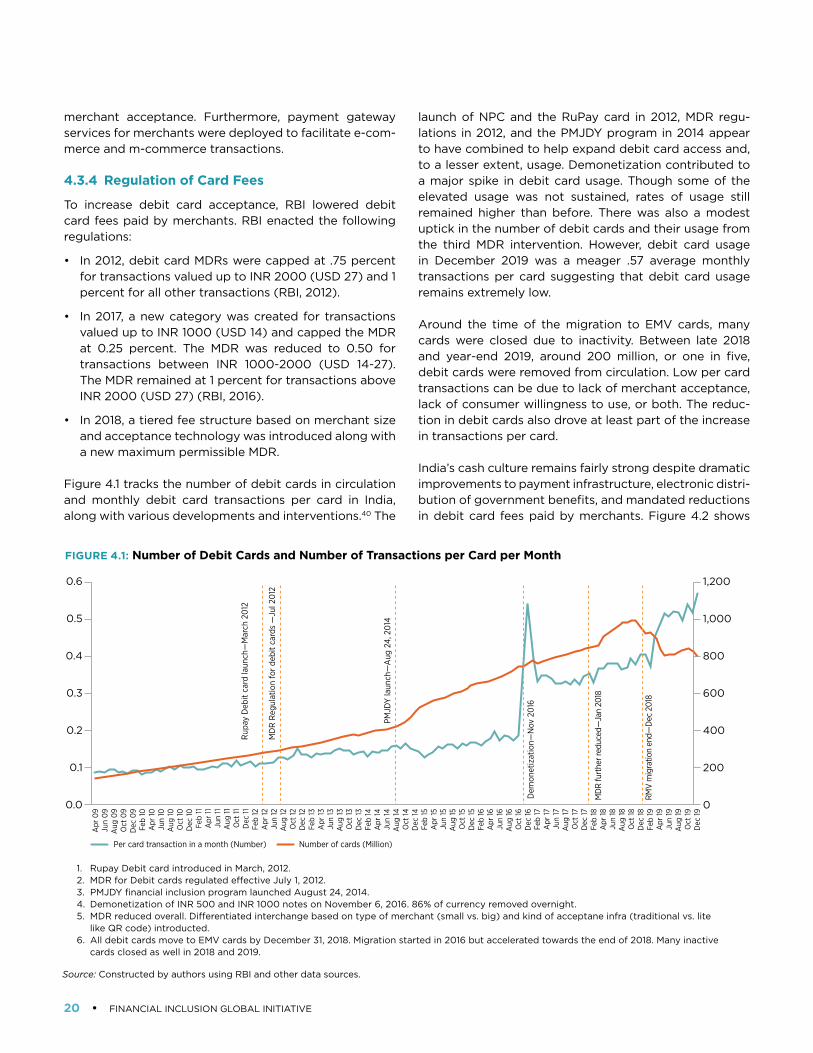
4.3.4 Regulation of Card Fees
To increase debit card acceptance, RBI lowered debit card fees paid by merchants. RBI enacted the following regulations:
• In 2012, debit card MDRs were capped at .75 percent for transactions valued up to INR 2000 (USD 27) and 1 percent for all other transactions (RBI, 2012).
• In 2017, a new category was created for transactions valued up to INR 1000 (USD 14) and capped the MDR at 0.25 percent. The MDR was reduced to 0.50 for transactions between INR 1000-2000 (USD 14-27). The MDR remained at 1 percent for transactions above INR 2000 (USD 27) (RBI, 2016).
• In 2018, a tiered fee structure based on merchant size and acceptance technology was introduced along with a new maximum permissible MDR.
Figure 4.1 tracks the number of debit cards in circulation and monthly debit card transactions per card in India, along with various developments and interventions.40 The
launch of NPC and the RuPay card in 2012, MDR regu-lations in 2012, and the PMJDY program in 2014 appear to have combined to help expand debit card access and, to a lesser extent, usage. Demonetization contributed to a major spike in debit card usage. Though some of the elevated usage was not sustained, rates of usage still remained higher than before. There was also a modest uptick in the number of debit cards and their usage from the third MDR intervention. However, debit card usage in December 2019 was a meager .57 average monthly transactions per card suggesting that debit card usage remains extremely low.
Around the time of the migration to EMV cards, many cards were closed due to inactivity. Between late 2018 and year-end 2019, around 200 million, or one in five, debit cards were removed from circulation. Low per card transactions can be due to lack of merchant acceptance, lack of consumer willingness to use, or both. The reduc-tion in debit cards also drove at least part of the increase in transactions per card.
India’s cash culture remains fairly strong despite dramatic improvements to payment infrastructure, electronic distri-bution of government benefits, and mandated reductions in debit card fees paid by merchants. Figure 4.2 shows
0.6
0.5
0.4
0.3
0.2
0.1
0.0
1,200
1,000
800
600
400
200
0
Rup
ay D
ebit
card
laun
ch—
Mar
ch 2
012
Apr
09
Jun
09
Aug
09
Oct
09
Dec
09
Feb
10A
pr 10
Jun
10A
ug 10
Oct
10D
ec 10
Feb
11A
pr 11
Jun
11A
ug 11
Oct
11D
ec 11
Feb
12A
pr 12
Jun
12A
ug 12
Oct
12D
ec 12
Feb
13A
pr 13
Jun
13A
ug 13
Oct
13D
ec 13
Feb
14A
pr 14
Jun
14A
ug 14
Oct
14D
ec 14
Feb
15A
pr 15
Jun
15A
ug 15
Oct
15D
ec 15
Feb
16A
pr 16
Jun
16A
ug 16
Oct
16D
ec 16
Feb
17A
pr 17
Jun
17A
ug 17
Oct
17D
ec 17
Feb
18A
pr 18
Jun
18A
ug 18
Oct
18D
ec 18
Feb
19A
pr 19
Jun
19A
ug 19
Oct
19D
ec 19
MD
R R
egul
atio
n fo
r deb
it ca
rds
—Ju
l 20
12
Dem
onet
izat
ion—
Nov
20
16
PMJD
Y la
unch
—A
ug 2
4, 2
014
MD
R fu
rthe
r red
uced
—Ja
n 20
18
RMV
mig
ratio
n en
d—D
ec 2
018
1. Rupay Debit card introduced in March, 2012.2. MDR for Debit cards regulated e�ective July 1, 2012.3. PMJDY financial inclusion program launched August 24, 2014.4. Demonetization of INR 500 and INR 1000 notes on November 6, 2016. 86% of currency removed overnight.5. MDR reduced overall. Di�erentiated interchange based on type of merchant (small vs. big) and kind of acceptane infra (traditional vs. lite like QR code) introducted.6. All debit cards move to EMV cards by December 31, 2018. Migration started in 2016 but accelerated towards the end of 2018. Many inactive cards closed as well in 2018 and 2019.
Per card transaction in a month (Number) Number of cards (Million)
Number of debit cards and number of transactions per card per monthFIGURE 4.1: Number of Debit Cards and Number of Transactions per Card per Month
Source: Constructed by authors using RBI and other data sources.
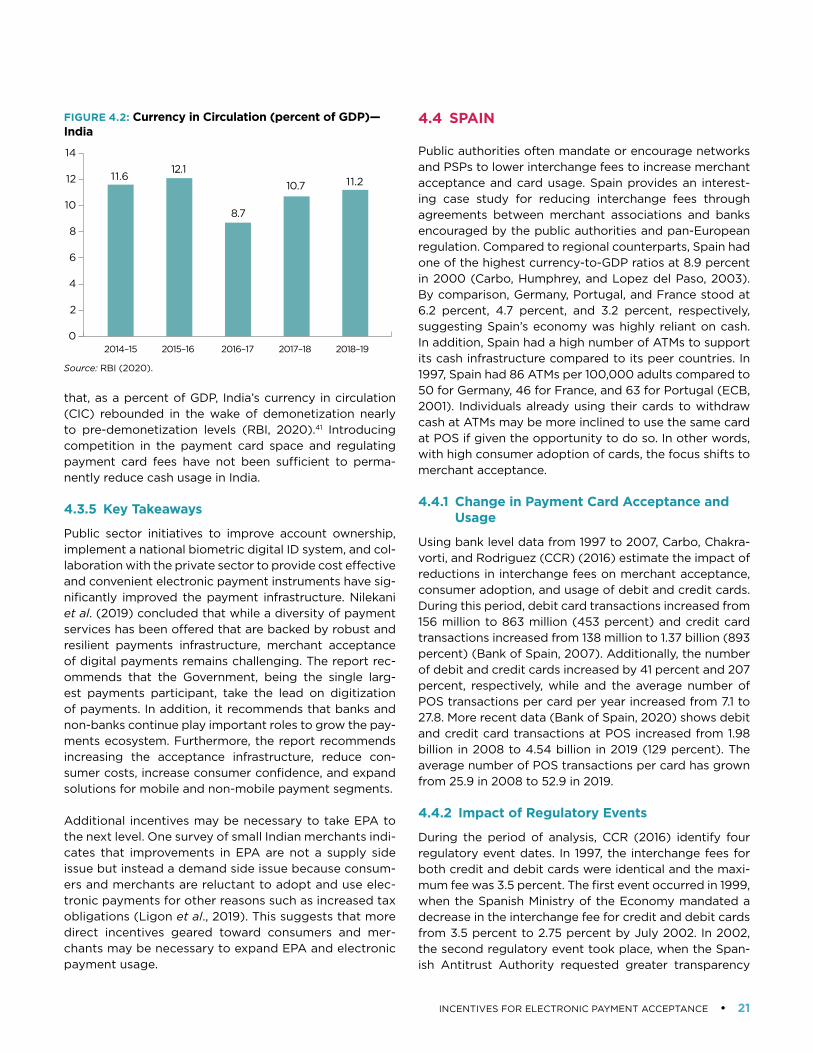
INCENTIVES FOR ELECTRONIC PAYMENT ACCEPTANCE • 21
that, as a percent of GDP, India’s currency in circulation (CIC) rebounded in the wake of demonetization nearly to pre-demonetization levels (RBI, 2020).41 Introducing competition in the payment card space and regulating payment card fees have not been sufficient to perma-nently reduce cash usage in India.
4.3.5 Key Takeaways
Public sector initiatives to improve account ownership, implement a national biometric digital ID system, and col-laboration with the private sector to provide cost effective and convenient electronic payment instruments have sig-nificantly improved the payment infrastructure. Nilekani et al. (2019) concluded that while a diversity of payment services has been offered that are backed by robust and resilient payments infrastructure, merchant acceptance of digital payments remains challenging. The report rec-ommends that the Government, being the single larg-est payments participant, take the lead on digitization of payments. In addition, it recommends that banks and non-banks continue play important roles to grow the pay-ments ecosystem. Furthermore, the report recommends increasing the acceptance infrastructure, reduce con-sumer costs, increase consumer confidence, and expand solutions for mobile and non-mobile payment segments.
Additional incentives may be necessary to take EPA to the next level. One survey of small Indian merchants indi-cates that improvements in EPA are not a supply side issue but instead a demand side issue because consum-ers and merchants are reluctant to adopt and use elec-tronic payments for other reasons such as increased tax obligations (Ligon et al., 2019). This suggests that more direct incentives geared toward consumers and mer-chants may be necessary to expand EPA and electronic payment usage.
4.4 SPAIN
Public authorities often mandate or encourage networks and PSPs to lower interchange fees to increase merchant acceptance and card usage. Spain provides an interest-ing case study for reducing interchange fees through agreements between merchant associations and banks encouraged by the public authorities and pan-European regulation. Compared to regional counterparts, Spain had one of the highest currency-to-GDP ratios at 8.9 percent in 2000 (Carbo, Humphrey, and Lopez del Paso, 2003). By comparison, Germany, Portugal, and France stood at 6.2 percent, 4.7 percent, and 3.2 percent, respectively, suggesting Spain’s economy was highly reliant on cash. In addition, Spain had a high number of ATMs to support its cash infrastructure compared to its peer countries. In 1997, Spain had 86 ATMs per 100,000 adults compared to 50 for Germany, 46 for France, and 63 for Portugal (ECB, 2001). Individuals already using their cards to withdraw cash at ATMs may be more inclined to use the same card at POS if given the opportunity to do so. In other words, with high consumer adoption of cards, the focus shifts to merchant acceptance.
4.4.1 Change in Payment Card Acceptance and Usage
Using bank level data from 1997 to 2007, Carbo, Chakra- vorti, and Rodriguez (CCR) (2016) estimate the impact of reductions in interchange fees on merchant acceptance, consumer adoption, and usage of debit and credit cards. During this period, debit card transactions increased from 156 million to 863 million (453 percent) and credit card transactions increased from 138 million to 1.37 billion (893 percent) (Bank of Spain, 2007). Additionally, the number of debit and credit cards increased by 41 percent and 207 percent, respectively, while and the average number of POS transactions per card per year increased from 7.1 to 27.8. More recent data (Bank of Spain, 2020) shows debit and credit card transactions at POS increased from 1.98 billion in 2008 to 4.54 billion in 2019 (129 percent). The average number of POS transactions per card has grown from 25.9 in 2008 to 52.9 in 2019.
4.4.2 Impact of Regulatory Events
During the period of analysis, CCR (2016) identify four regulatory event dates. In 1997, the interchange fees for both credit and debit cards were identical and the maxi-mum fee was 3.5 percent. The first event occurred in 1999, when the Spanish Ministry of the Economy mandated a decrease in the interchange fee for credit and debit cards from 3.5 percent to 2.75 percent by July 2002. In 2002, the second regulatory event took place, when the Span-ish Antitrust Authority requested greater transparency
0
2
4
6
8
10
12
14
2014–15 2015–16 2016–17 2018–192017–18
11.612.1
11.210.7
8.7
FIGURE 4.2: Currency in Circulation (percent of GDP)— India
Source: RBI (2020).
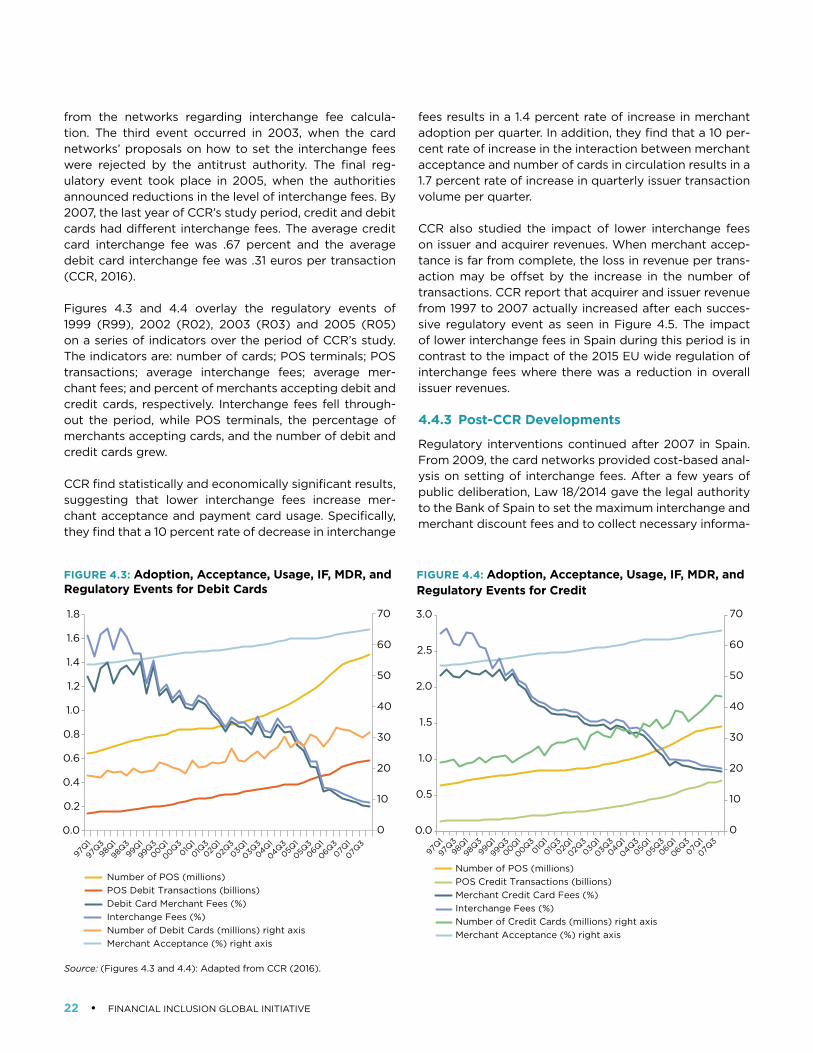
22 • FINANCIAL INCLUSION GLOBAL INITIATIVE
Number of POS (millions)POS Debit Transactions (billions)Debit Card Merchant Fees (%)Interchange Fees (%)Number of Debit Cards (millions) right axisMerchant Acceptance (%) right axis
0.0
0.2
0.4
0.6
0.8
1.0
1.2
1.4
1.6
1.8
0
10
20
30
40
50
60
70
97Q1
97Q398Q
1
98Q399Q1
99Q300Q1
00Q301Q
101Q
302Q
1
02Q303Q
1
03Q304Q1
04Q305Q
1
05Q306Q1
06Q307Q
1
07Q3
Number of POS (millions)POS Credit Transactions (billions)Merchant Credit Card Fees (%)Interchange Fees (%)Number of Credit Cards (millions) right axisMerchant Acceptance (%) right axis
0.0
0.5
1.0
1.5
2.0
2.5
3.0
0
10
20
30
40
50
60
70
97Q1
97Q398Q
1
98Q399Q1
99Q300Q1
00Q301Q
101Q
302Q
1
02Q303Q
1
03Q304Q1
04Q305Q
1
05Q306Q1
06Q307Q
1
07Q3
from the networks regarding interchange fee calcula-tion. The third event occurred in 2003, when the card networks’ proposals on how to set the interchange fees were rejected by the antitrust authority. The final reg-ulatory event took place in 2005, when the authorities announced reductions in the level of interchange fees. By 2007, the last year of CCR’s study period, credit and debit cards had different interchange fees. The average credit card interchange fee was .67 percent and the average debit card interchange fee was .31 euros per transaction (CCR, 2016).
Figures 4.3 and 4.4 overlay the regulatory events of 1999 (R99), 2002 (R02), 2003 (R03) and 2005 (R05) on a series of indicators over the period of CCR’s study. The indicators are: number of cards; POS terminals; POS transactions; average interchange fees; average mer-chant fees; and percent of merchants accepting debit and credit cards, respectively. Interchange fees fell through-out the period, while POS terminals, the percentage of merchants accepting cards, and the number of debit and credit cards grew.
CCR find statistically and economically significant results, suggesting that lower interchange fees increase mer-chant acceptance and payment card usage. Specifically, they find that a 10 percent rate of decrease in interchange
fees results in a 1.4 percent rate of increase in merchant adoption per quarter. In addition, they find that a 10 per-cent rate of increase in the interaction between merchant acceptance and number of cards in circulation results in a 1.7 percent rate of increase in quarterly issuer transaction volume per quarter.
CCR also studied the impact of lower interchange fees on issuer and acquirer revenues. When merchant accep-tance is far from complete, the loss in revenue per trans-action may be offset by the increase in the number of transactions. CCR report that acquirer and issuer revenue from 1997 to 2007 actually increased after each succes-sive regulatory event as seen in Figure 4.5. The impact of lower interchange fees in Spain during this period is in contrast to the impact of the 2015 EU wide regulation of interchange fees where there was a reduction in overall issuer revenues.
4.4.3 Post-CCR Developments
Regulatory interventions continued after 2007 in Spain. From 2009, the card networks provided cost-based anal-ysis on setting of interchange fees. After a few years of public deliberation, Law 18/2014 gave the legal authority to the Bank of Spain to set the maximum interchange and merchant discount fees and to collect necessary informa-
FIGURE 4.3: Adoption, Acceptance, Usage, IF, MDR, and Regulatory Events for Debit Cards
FIGURE 4.4: Adoption, Acceptance, Usage, IF, MDR, and Regulatory Events for Credit
Source: (Figures 4.3 and 4.4): Adapted from CCR (2016).
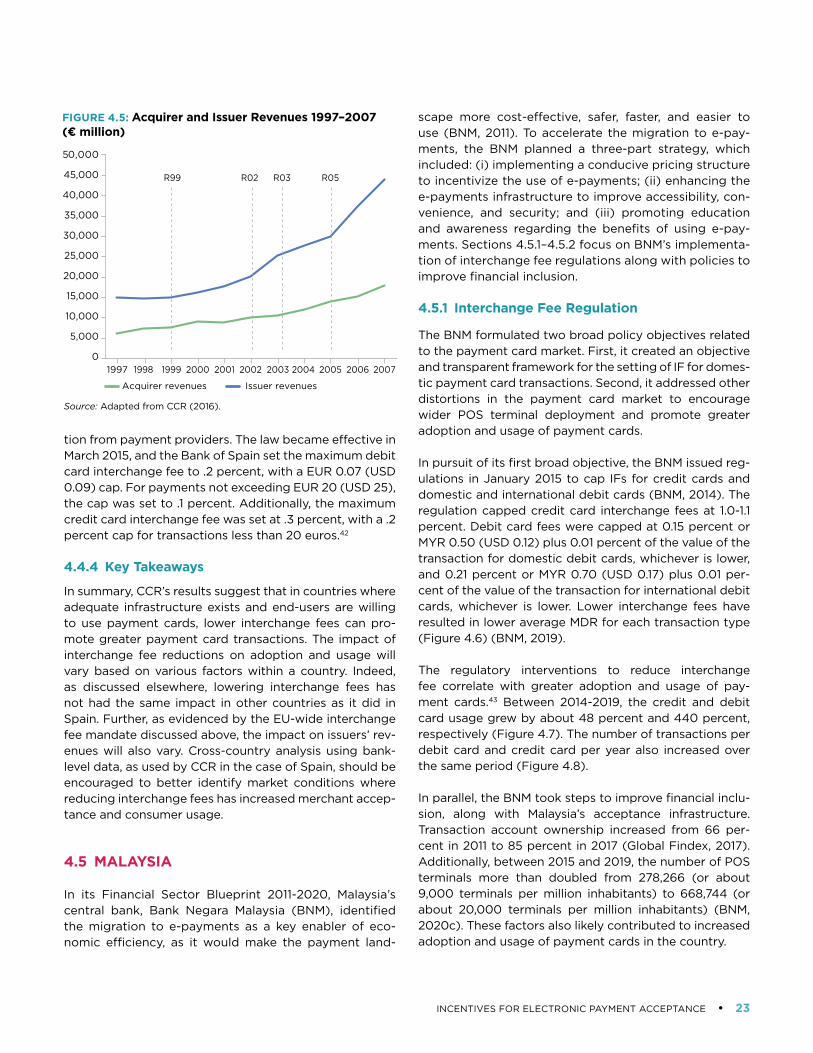
INCENTIVES FOR ELECTRONIC PAYMENT ACCEPTANCE • 23
tion from payment providers. The law became effective in March 2015, and the Bank of Spain set the maximum debit card interchange fee to .2 percent, with a EUR 0.07 (USD 0.09) cap. For payments not exceeding EUR 20 (USD 25), the cap was set to .1 percent. Additionally, the maximum credit card interchange fee was set at .3 percent, with a .2 percent cap for transactions less than 20 euros.42
4.4.4 Key Takeaways
In summary, CCR’s results suggest that in countries where adequate infrastructure exists and end-users are willing to use payment cards, lower interchange fees can pro-mote greater payment card transactions. The impact of interchange fee reductions on adoption and usage will vary based on various factors within a country. Indeed, as discussed elsewhere, lowering interchange fees has not had the same impact in other countries as it did in Spain. Further, as evidenced by the EU-wide interchange fee mandate discussed above, the impact on issuers’ rev-enues will also vary. Cross-country analysis using bank-level data, as used by CCR in the case of Spain, should be encouraged to better identify market conditions where reducing interchange fees has increased merchant accep-tance and consumer usage.
4.5 MALAYSIA
In its Financial Sector Blueprint 2011-2020, Malaysia’s central bank, Bank Negara Malaysia (BNM), identified the migration to e-payments as a key enabler of eco-nomic efficiency, as it would make the payment land-
scape more cost-effective, safer, faster, and easier to use (BNM, 2011). To accelerate the migration to e-pay-ments, the BNM planned a three-part strategy, which included: (i) implementing a conducive pricing structure to incentivize the use of e-payments; (ii) enhancing the e-payments infrastructure to improve accessibility, con-venience, and security; and (iii) promoting education and awareness regarding the benefits of using e-pay-ments. Sections 4.5.1–4.5.2 focus on BNM’s implementa-tion of interchange fee regulations along with policies to improve financial inclusion.
4.5.1 Interchange Fee Regulation
The BNM formulated two broad policy objectives related to the payment card market. First, it created an objective and transparent framework for the setting of IF for domes-tic payment card transactions. Second, it addressed other distortions in the payment card market to encourage wider POS terminal deployment and promote greater adoption and usage of payment cards.
In pursuit of its first broad objective, the BNM issued reg-ulations in January 2015 to cap IFs for credit cards and domestic and international debit cards (BNM, 2014). The regulation capped credit card interchange fees at 1.0-1.1 percent. Debit card fees were capped at 0.15 percent or MYR 0.50 (USD 0.12) plus 0.01 percent of the value of the transaction for domestic debit cards, whichever is lower, and 0.21 percent or MYR 0.70 (USD 0.17) plus 0.01 per-cent of the value of the transaction for international debit cards, whichever is lower. Lower interchange fees have resulted in lower average MDR for each transaction type (Figure 4.6) (BNM, 2019).
The regulatory interventions to reduce interchange fee correlate with greater adoption and usage of pay-ment cards.43 Between 2014-2019, the credit and debit card usage grew by about 48 percent and 440 percent, respectively (Figure 4.7). The number of transactions per debit card and credit card per year also increased over the same period (Figure 4.8).
In parallel, the BNM took steps to improve financial inclu-sion, along with Malaysia’s acceptance infrastructure. Transaction account ownership increased from 66 per-cent in 2011 to 85 percent in 2017 (Global Findex, 2017). Additionally, between 2015 and 2019, the number of POS terminals more than doubled from 278,266 (or about 9,000 terminals per million inhabitants) to 668,744 (or about 20,000 terminals per million inhabitants) (BNM, 2020c). These factors also likely contributed to increased adoption and usage of payment cards in the country.
Source: Adapted from CCR (2016).
FIGURE 4.5: Acquirer and Issuer Revenues 1997–2007 (€ million)
Acquirer revenues
50,000
45,000
40,000
35,000
30,000
25,000
20,000
15,000
10,000
5,000
0
Issuer revenues
1997 1998 1999 2000 2001 2002
R02 R05R03R99
2003 2004 2005 2006 2007
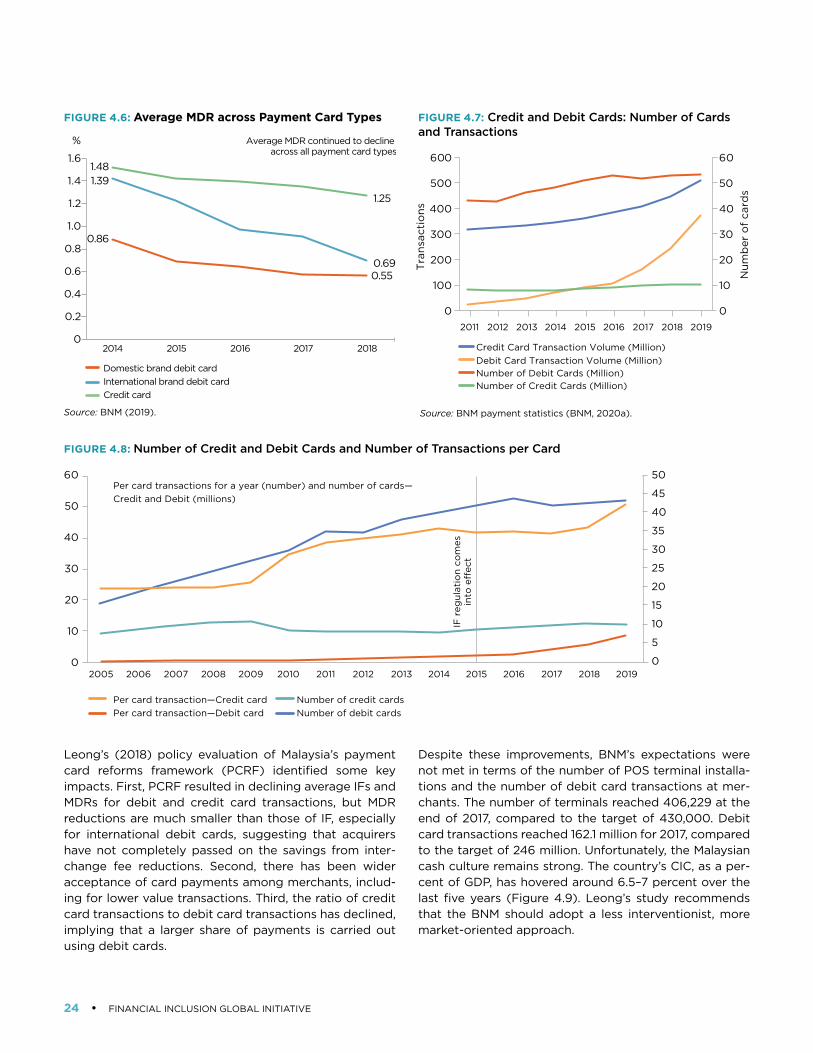
24 • FINANCIAL INCLUSION GLOBAL INITIATIVE
Leong’s (2018) policy evaluation of Malaysia’s payment card reforms framework (PCRF) identified some key impacts. First, PCRF resulted in declining average IFs and MDRs for debit and credit card transactions, but MDR reductions are much smaller than those of IF, especially for international debit cards, suggesting that acquirers have not completely passed on the savings from inter-change fee reductions. Second, there has been wider acceptance of card payments among merchants, includ-ing for lower value transactions. Third, the ratio of credit card transactions to debit card transactions has declined, implying that a larger share of payments is carried out using debit cards.
Despite these improvements, BNM’s expectations were not met in terms of the number of POS terminal installa-tions and the number of debit card transactions at mer-chants. The number of terminals reached 406,229 at the end of 2017, compared to the target of 430,000. Debit card transactions reached 162.1 million for 2017, compared to the target of 246 million. Unfortunately, the Malaysian cash culture remains strong. The country’s CIC, as a per-cent of GDP, has hovered around 6.5–7 percent over the last five years (Figure 4.9). Leong’s study recommends that the BNM should adopt a less interventionist, more market-oriented approach.
1.6
1.4
1.2
1.0
0.8
0.6
0.4
0.2
02014
Domestic brand debit cardInternational brand debit cardCredit card
Average MDR continued to decline across all payment card types
2015 2016 2017 2018
1.48
%
1.25
0.69
1.39
0.86
0.55
600
500
400
300
200
100
0
60
50
40
30
20
10
02011 2012 2013 2014 2015 2016 2017 2018 2019
Num
ber
of
card
s
Tra
nsac
tio
ns
Credit Card Transaction Volume (Million)Debit Card Transaction Volume (Million)Number of Debit Cards (Million)Number of Credit Cards (Million)
FIGURE 4.6: Average MDR across Payment Card Types FIGURE 4.7: Credit and Debit Cards: Number of Cards and Transactions
Source: BNM (2019). Source: BNM payment statistics (BNM, 2020a).
FIGURE 4.8: Number of Credit and Debit Cards and Number of Transactions per Card
2005 2006
Per card transaction—Credit cardPer card transaction—Debit card
Per card transactions for a year (number) and number of cards—Credit and Debit (millions)
Number of credit cardsNumber of debit cards
2007 2008 2009 2010 2011 2012 2013 2014 2015
IF r
egul
atio
n co
mes
into
e�
ect
2016 2017 2018 2019
60
50
40
30
20
10
0
50
45
40
35
30
25
20
15
10
5
0
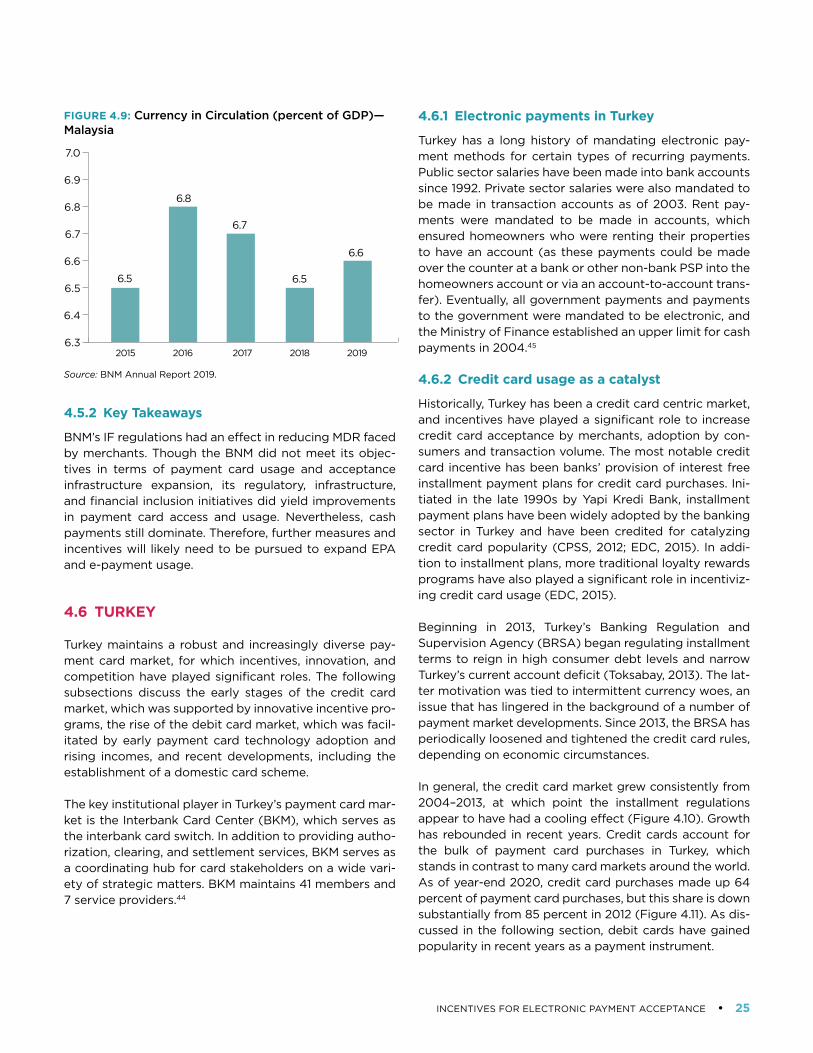
INCENTIVES FOR ELECTRONIC PAYMENT ACCEPTANCE • 25
4.5.2 Key Takeaways
BNM’s IF regulations had an effect in reducing MDR faced by merchants. Though the BNM did not meet its objec-tives in terms of payment card usage and acceptance infrastructure expansion, its regulatory, infrastructure, and financial inclusion initiatives did yield improvements in payment card access and usage. Nevertheless, cash payments still dominate. Therefore, further measures and incentives will likely need to be pursued to expand EPA and e-payment usage.
4.6 TURKEY
Turkey maintains a robust and increasingly diverse pay-ment card market, for which incentives, innovation, and competition have played significant roles. The following subsections discuss the early stages of the credit card market, which was supported by innovative incentive pro-grams, the rise of the debit card market, which was facil-itated by early payment card technology adoption and rising incomes, and recent developments, including the establishment of a domestic card scheme.
The key institutional player in Turkey’s payment card mar-ket is the Interbank Card Center (BKM), which serves as the interbank card switch. In addition to providing autho-rization, clearing, and settlement services, BKM serves as a coordinating hub for card stakeholders on a wide vari-ety of strategic matters. BKM maintains 41 members and 7 service providers.44
4.6.1 Electronic payments in Turkey
Turkey has a long history of mandating electronic pay-ment methods for certain types of recurring payments. Public sector salaries have been made into bank accounts since 1992. Private sector salaries were also mandated to be made in transaction accounts as of 2003. Rent pay-ments were mandated to be made in accounts, which ensured homeowners who were renting their properties to have an account (as these payments could be made over the counter at a bank or other non-bank PSP into the homeowners account or via an account-to-account trans-fer). Eventually, all government payments and payments to the government were mandated to be electronic, and the Ministry of Finance established an upper limit for cash payments in 2004.45
4.6.2 Credit card usage as a catalyst
Historically, Turkey has been a credit card centric market, and incentives have played a significant role to increase credit card acceptance by merchants, adoption by con-sumers and transaction volume. The most notable credit card incentive has been banks’ provision of interest free installment payment plans for credit card purchases. Ini-tiated in the late 1990s by Yapi Kredi Bank, installment payment plans have been widely adopted by the banking sector in Turkey and have been credited for catalyzing credit card popularity (CPSS, 2012; EDC, 2015). In addi-tion to installment plans, more traditional loyalty rewards programs have also played a significant role in incentiviz-ing credit card usage (EDC, 2015).
Beginning in 2013, Turkey’s Banking Regulation and Supervision Agency (BRSA) began regulating installment terms to reign in high consumer debt levels and narrow Turkey’s current account deficit (Toksabay, 2013). The lat-ter motivation was tied to intermittent currency woes, an issue that has lingered in the background of a number of payment market developments. Since 2013, the BRSA has periodically loosened and tightened the credit card rules, depending on economic circumstances.
In general, the credit card market grew consistently from 2004–2013, at which point the installment regulations appear to have had a cooling effect (Figure 4.10). Growth has rebounded in recent years. Credit cards account for the bulk of payment card purchases in Turkey, which stands in contrast to many card markets around the world. As of year-end 2020, credit card purchases made up 64 percent of payment card purchases, but this share is down substantially from 85 percent in 2012 (Figure 4.11). As dis-cussed in the following section, debit cards have gained popularity in recent years as a payment instrument.
FIGURE 4.9: Currency in Circulation (percent of GDP)— Malaysia
6.5
6.8
6.7
2015 2016 2017 201920186.3
6.4
6.5
6.6
6.7
6.8
6.9
7.0
6.6
6.5
Source: BNM Annual Report 2019.
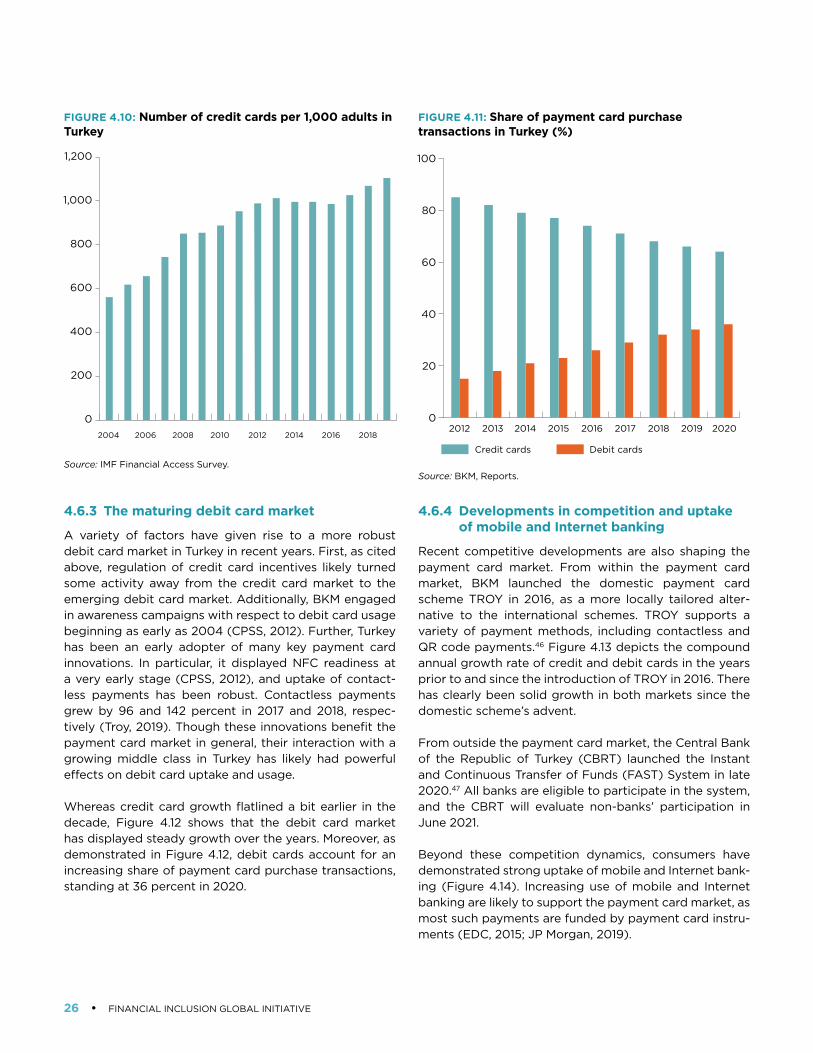
26 • FINANCIAL INCLUSION GLOBAL INITIATIVE
4.6.3 The maturing debit card market
A variety of factors have given rise to a more robust debit card market in Turkey in recent years. First, as cited above, regulation of credit card incentives likely turned some activity away from the credit card market to the emerging debit card market. Additionally, BKM engaged in awareness campaigns with respect to debit card usage beginning as early as 2004 (CPSS, 2012). Further, Turkey has been an early adopter of many key payment card innovations. In particular, it displayed NFC readiness at a very early stage (CPSS, 2012), and uptake of contact-less payments has been robust. Contactless payments grew by 96 and 142 percent in 2017 and 2018, respec-tively (Troy, 2019). Though these innovations benefit the payment card market in general, their interaction with a growing middle class in Turkey has likely had powerful effects on debit card uptake and usage.
Whereas credit card growth flatlined a bit earlier in the decade, Figure 4.12 shows that the debit card market has displayed steady growth over the years. Moreover, as demonstrated in Figure 4.12, debit cards account for an increasing share of payment card purchase transactions, standing at 36 percent in 2020.
4.6.4 Developments in competition and uptake of mobile and Internet banking
Recent competitive developments are also shaping the payment card market. From within the payment card market, BKM launched the domestic payment card scheme TROY in 2016, as a more locally tailored alter-native to the international schemes. TROY supports a variety of payment methods, including contactless and QR code payments.46 Figure 4.13 depicts the compound annual growth rate of credit and debit cards in the years prior to and since the introduction of TROY in 2016. There has clearly been solid growth in both markets since the domestic scheme’s advent.
From outside the payment card market, the Central Bank of the Republic of Turkey (CBRT) launched the Instant and Continuous Transfer of Funds (FAST) System in late 2020.47 All banks are eligible to participate in the system, and the CBRT will evaluate non-banks’ participation in June 2021.
Beyond these competition dynamics, consumers have demonstrated strong uptake of mobile and Internet bank-ing (Figure 4.14). Increasing use of mobile and Internet banking are likely to support the payment card market, as most such payments are funded by payment card instru-ments (EDC, 2015; JP Morgan, 2019).
0
200
400
600
800
1,000
1,200
2004 2006 2008 2010 2012 2014 2016 2018
0
20
40
60
80
100
2012
Credit cards Debit cards
2013 2014 2015 2016 2017 2018 2019 2020
FIGURE 4.10: Number of credit cards per 1,000 adults in Turkey
FIGURE 4.11: Share of payment card purchase transactions in Turkey (%)
Source: IMF Financial Access Survey.Source: BKM, Reports.
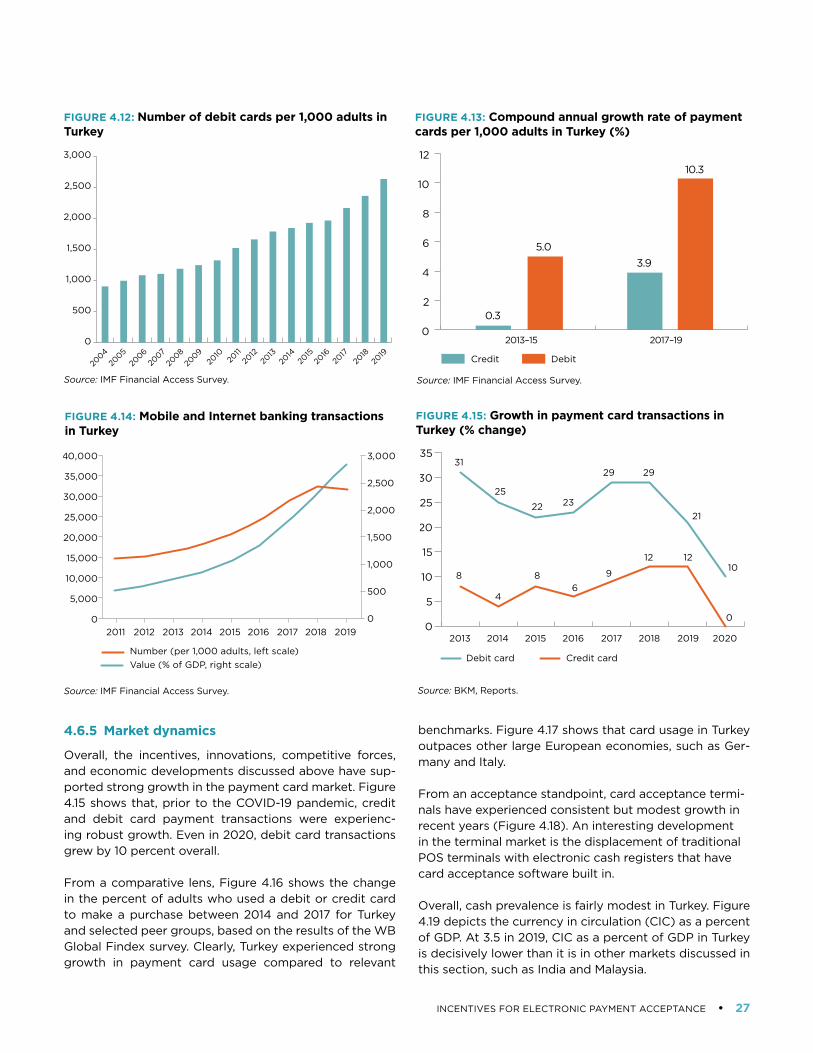
INCENTIVES FOR ELECTRONIC PAYMENT ACCEPTANCE • 27
4.6.5 Market dynamics
Overall, the incentives, innovations, competitive forces, and economic developments discussed above have sup-ported strong growth in the payment card market. Figure 4.15 shows that, prior to the COVID-19 pandemic, credit and debit card payment transactions were experienc-ing robust growth. Even in 2020, debit card transactions grew by 10 percent overall.
From a comparative lens, Figure 4.16 shows the change in the percent of adults who used a debit or credit card to make a purchase between 2014 and 2017 for Turkey and selected peer groups, based on the results of the WB Global Findex survey. Clearly, Turkey experienced strong growth in payment card usage compared to relevant
benchmarks. Figure 4.17 shows that card usage in Turkey outpaces other large European economies, such as Ger-many and Italy.
From an acceptance standpoint, card acceptance termi-nals have experienced consistent but modest growth in recent years (Figure 4.18). An interesting development in the terminal market is the displacement of traditional POS terminals with electronic cash registers that have card acceptance software built in.
Overall, cash prevalence is fairly modest in Turkey. Figure 4.19 depicts the currency in circulation (CIC) as a percent of GDP. At 3.5 in 2019, CIC as a percent of GDP in Turkey is decisively lower than it is in other markets discussed in this section, such as India and Malaysia.
0
500
1,000
1,500
2,000
2,500
3,000
2004
2005
2006
2007
2008
2009
2010
2011
2012
2013
2014
2015
2016
2017
2018
2019
FIGURE 4.12: Number of debit cards per 1,000 adults in Turkey
Source: IMF Financial Access Survey.
2013–15
0.3
5.03.9
10.3
2017–190
2
4
6
8
10
12
Credit Debit
FIGURE 4.13: Compound annual growth rate of payment cards per 1,000 adults in Turkey (%)
Source: IMF Financial Access Survey.
2011 2012 2013 2014 2015 2016 2017 2018 2019
40,000
35,000
30,000
25,000
20,000
15,000
10,000
5,000
0
3,000
2,500
2,000
1,500
1,000
500
0
Number (per 1,000 adults, left scale)Value (% of GDP, right scale)
FIGURE 4.14: Mobile and Internet banking transactions in Turkey
Source: IMF Financial Access Survey.
2013 2014 2015 2016 2017 2018 2019 2020
Debit card Credit card
0
5
10
15
20
25
30
3531
25
22 23
29
9
64
88
12 12
29
21
0
10
FIGURE 4.15: Growth in payment card transactions in Turkey (% change)
Source: BKM, Reports.
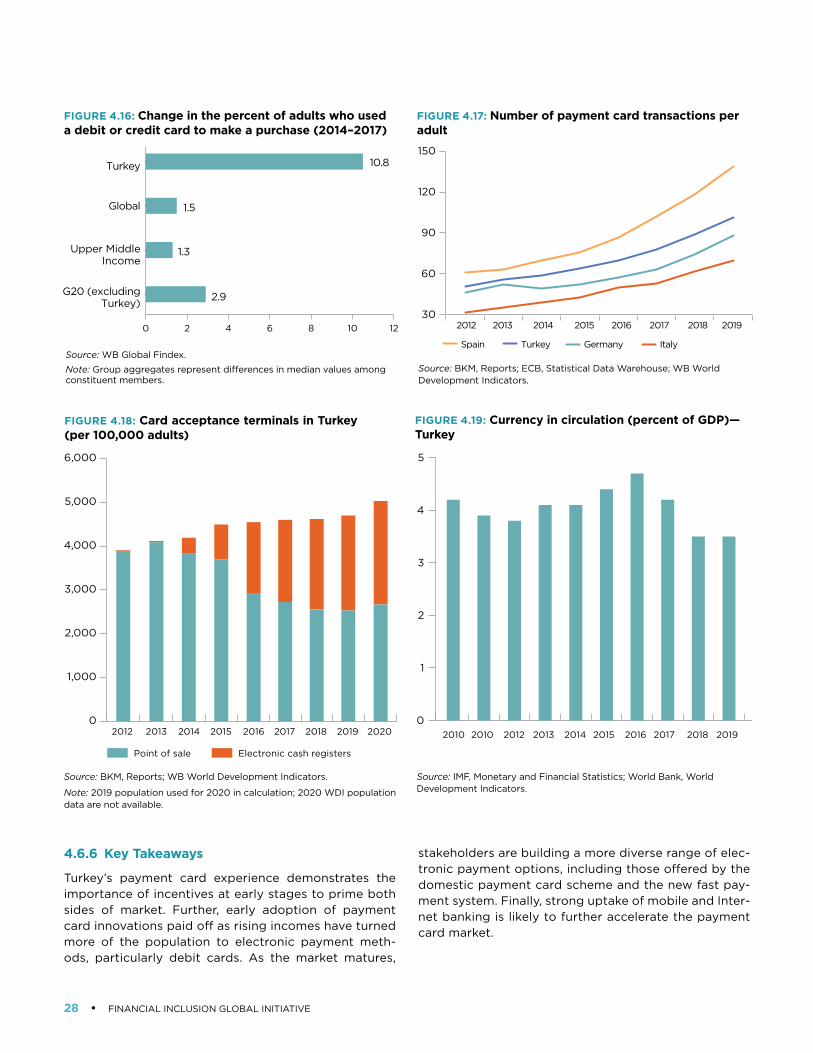
28 • FINANCIAL INCLUSION GLOBAL INITIATIVE
4.6.6 Key Takeaways
Turkey’s payment card experience demonstrates the importance of incentives at early stages to prime both sides of market. Further, early adoption of payment card innovations paid off as rising incomes have turned more of the population to electronic payment meth-ods, particularly debit cards. As the market matures,
stakeholders are building a more diverse range of elec-tronic payment options, including those offered by the domestic payment card scheme and the new fast pay-ment system. Finally, strong uptake of mobile and Inter-net banking is likely to further accelerate the payment card market.
0 2 4 6 8 10 12
Turkey
Global
Upper MiddleIncome
G20 (excludingTurkey)
10.8
1.5
1.3
2.9
FIGURE 4.16: Change in the percent of adults who used a debit or credit card to make a purchase (2014–2017)
Source: WB Global Findex.
Note: Group aggregates represent differences in median values among constituent members.
201420132012 2015 2016 2017 2018 2019
Spain Turkey Germany Italy
30
60
90
120
150
0
1,000
2,000
3,000
4,000
5,000
6,000
2012 2013
Point of sale
2014 2015 2016 2017 2018 2019 2020
Electronic cash registers
0
1
2
3
4
5
2010 2010 2012 2013 2014 2015 2016 2017 2018 2019
FIGURE 4.17: Number of payment card transactions per adult
FIGURE 4.18: Card acceptance terminals in Turkey (per 100,000 adults)
Source: BKM, Reports; WB World Development Indicators.
Note: 2019 population used for 2020 in calculation; 2020 WDI population data are not available.
Source: IMF, Monetary and Financial Statistics; World Bank, World Development Indicators.
Source: BKM, Reports; ECB, Statistical Data Warehouse; WB World Development Indicators.
FIGURE 4.19: Currency in circulation (percent of GDP)—Turkey
INCENTIVES FOR ELECTRONIC PAYMENT ACCEPTANCE • 29
5. POS Terminal Subsidies
Sections 2–4 stressed that increasing consumer transac-tion account ownership and adoption of electronic pay-ment instruments, improving payment and non-payment infrastructure, and reducing card acceptance fees may not be sufficient to increase EPA and usage. Additional incentives may be necessary. Sections 5, 6, and 7 discuss incentives to encourage MSMRs and consumers to accept and adopt electronic payments, respectively, along with government mandates on eliminating cash for certain types of transactions.
This section will expand upon incentives for MSMRs to accept payment cards by focusing on subsidizing POS terminals. Terminal subsidies are likely to increase accep-tance by merchants that find terminals too costly. Such policies are most effective when consumers own cards and would like to use them to pay for purchases. Many of these policies are targeted toward certain merchant cat-egories or geographic areas where card acceptance has been low.
As discussed below, terminal subsidies are provided by governments, PSPs, or both. The motivation for PSPs to expand terminal access is clear. Governments, too, stand to gain increased tax revenue and economic formality from the deployment of POS terminals, and, ultimately,
greater electronic payments. As Figure 5.1A shows, paper-based P2B payments and the size of shadow economies are positively correlated. In any event, a key motivation for many governments to encourage the adoption of electronic payments is to reduce the size of the shadow economy. Figure 5.1 shows a negative correlation between country income group (using the World Bank classifica-tion) and the shadow economy over GDP.
5.1 SUBSIDIZATION STRATEGIES
A major goal of terminal subsidization is to increase the acceptance of payment cards by merchants, thereby enabling consumers to use their payment cards to make purchases. There are generally two types of strategies to subsidize merchant POS terminals. First, governments may subsidize terminals (e.g., Argentina and Uruguay). Second, acceptance development funds (ADFs), which are generally funded by card issuers and networks (e.g., Mexico, Poland, Indonesia, Malaysia, and India), provide terminal subsidies to certain types of merchants. The line between these two strategies is often blurred because ADFs may coexist with government fiscal incentives, or governments may also fund ADFs.
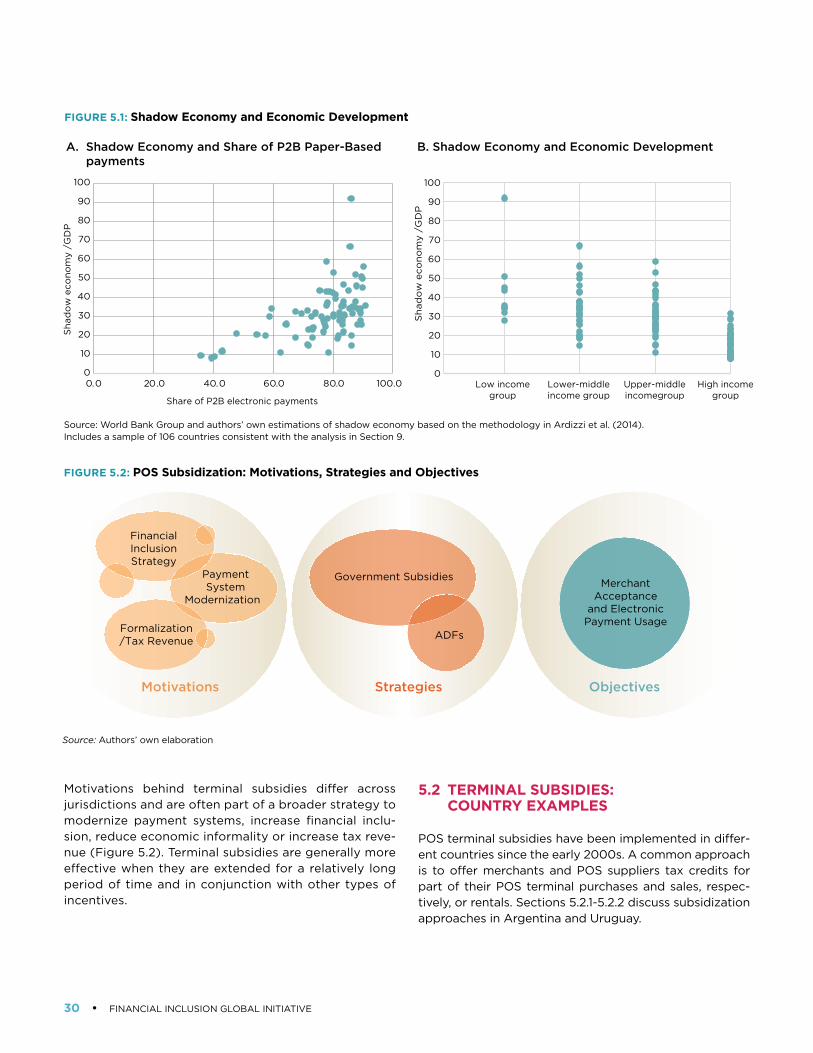
30 • FINANCIAL INCLUSION GLOBAL INITIATIVE
FIGURE 5.1: Shadow Economy and Economic Development
100
90
80
70
60
50
40
30
20
10
0
100
90
80
70
60
50
40
30
20
10
00.0 20.0 40.0 60.0 80.0 100.0
Sha
do
w e
cono
my
/GD
P
Low incomegroup
Lower-middleincome groupShare of P2B electronic payments
Upper-middleincomegroup
High incomegroup
Sh
ado
w e
con
om
y /G
DP
A. Shadow Economy and Share of P2B Paper-Based payments
B. Shadow Economy and Economic Development
Source: World Bank Group and authors’ own estimations of shadow economy based on the methodology in Ardizzi et al. (2014). Includes a sample of 106 countries consistent with the analysis in Section 9.
Strategies Objectives
Government Subsidies
ADFs
PaymentSystem
Modernization
MerchantAcceptance
and ElectronicPayment Usage
Motivations
FinancialInclusionStrategy
Formalization/Tax Revenue
FIGURE 5.2: POS Subsidization: Motivations, Strategies and Objectives
Source: Authors’ own elaboration
Motivations behind terminal subsidies differ across jurisdictions and are often part of a broader strategy to modernize payment systems, increase financial inclu-sion, reduce economic informality or increase tax reve-nue (Figure 5.2). Terminal subsidies are generally more effective when they are extended for a relatively long period of time and in conjunction with other types of incentives.
5.2 TERMINAL SUBSIDIES: COUNTRY EXAMPLES
POS terminal subsidies have been implemented in differ-ent countries since the early 2000s. A common approach is to offer merchants and POS suppliers tax credits for part of their POS terminal purchases and sales, respec-tively, or rentals. Sections 5.2.1-5.2.2 discuss subsidization approaches in Argentina and Uruguay.
INCENTIVES FOR ELECTRONIC PAYMENT ACCEPTANCE • 31
5.2.1 Argentina
In 2001, the Argentine government approved Decree 1387, which made the acceptance of debit and credit cards via POS terminals mandatory for merchants and imple-mented a tax credit for the cost of installing terminals for merchants. The suppliers of terminals also benefited from a maximum of USD 30 monthly VAT credit per installed terminal.
While different resolutions from the Ministry of Finance reiterated that POS adoption and card acceptance were compulsory, many merchants were reluctant to com-ply. Merchants argued that even if POS adoption costs were reduced, the bank-based POS system set high card acceptance fees. Merchants remained unwilling to adopt payment cards over two decades.48 The tax administra-tion did not impose penalties for non-compliant mer-chants despite having the authority to do so.
In 2016, the Federal Administration of Public Revenues (AFIP) set a two-year timeline for POS adoption for differ-ent sectors. The VAT deduction for merchant POS rentals increased to 50 percent, and the maximum deduction was raised to USD 300 per terminal and per month. Retailers located in municipalities with fewer than 1,000 inhabi-tants were excluded from mandatory adoption. AFIP set penalties from USD 30 to USD 30,000 (depending on merchant size) and business closures from 3 to 10 days for non-compliance. While terminal adoption increased after 2018, new measures were instituted in 2020 because many merchants still did not accept electronic payments. Since January 1, 2020, merchants were also required to accept instant debit card payments and electronic wal-lets, or payments initiated with QR codes.
5.2.2 Uruguay
POS terminal subsidies also occurred in Uruguay. After various attempts to provide incentives to accept elec-tronic payments in the mid-2000s, the Uruguayan Min-istry of Finance took a more ambitious approach in 2011. A fiscal credit that could be applied on future tax pay-ments was provided for any POS investment. Unlike in most countries, specialized firms separate from acquirers rent POS terminals to merchants. These specialized firms received VAT credits if they reduced their terminal rental fees. Additionally, the government subsidized the rental cost for some merchants. The subsidy was close to 100 percent for microbusiness and relatively high for medium businesses.
POS subsidies were part of a wider institutional approach to increase financial inclusion in Uruguay. The Ministry of Finance progressively implemented measures to increase
the opening of bank-based transaction accounts, such as mandatory electronic payment of wages in most sectors and no-fee transaction accounts, to improve economic formalization. Between 2001 and 2014 the percentage of adults with a bank-based transaction account increased from 23 percent to 46 percent. During the same period, POS terminals grew from 13,160 to 38,491. By the first quarter of 2020, the number of POS almost doubled to 73,171 from 2014. From 2014 to the first quarter of 2020, debit and credit card transactions grew by 89 percent.
5.3 ACCEPTANCE DEVELOPMENT FUNDS: COUNTRY EXAMPLES
ADFs contribute funds to projects and infrastructure that directly support payment acceptance. While they are mainly private-sector initiatives, ADFs sometimes bene-fit from financial support, and recognition and coordina-tion from public authorities. In a typical structure, a pool of issuers contributes to common initiatives to expand acceptance infrastructure within a country. Issuers nor-mally set a management structure that determines how funds are used including subsidies for installation of ter-minals, development of new technologies, marketing, and education.
Before creating their own ADF, the Reserve Bank of India (RBI) (2016a) reviewed some of the ADF experiences around the world. It concluded that most ADFs subsi-dized acceptance infrastructure to increase merchant acceptance. While issuers may have higher costs initially, in the long run, these initial costs are mostly recovered. As more merchants accept cards (extensive margin), more card transactions (intensive margin) tend to occur. ADFs have been implemented in various countries including Mexico, Poland, Indonesia, Malaysia, and India. Sections 5.3.1–5.3.5 review ADF approaches in these countries.49
5.3.1 Mexico
In Mexico, the government established the Electronic Pay-ment Methods Infrastructure Fund (FIMPE), one of the earlier ADF programs. Card issuers promoted FIMPE with the support of the government. FIMPE became a private trust set up by financial intermediaries. The POS instal-lation cost was subsidized by the federal government. It incorporated a tax rebate on the full cost of installation for merchants that had not previously adopted POS ter-minals. The budget of the private trust was $156 million, and it was mainly devoted to advertisement campaigns to illustrate the advantages of using bank cards for both merchants and consumers. The program was active from 2004 to 2009. The number of terminals more than tripled

32 • FINANCIAL INCLUSION GLOBAL INITIATIVE
during that period and stalled when the subsidies ended (Prior and Santomá, 2010). Negrin (2005) also suggests that the terminal program contributed to a more bal-anced adoption of cards by consumers and merchants resulting in debit cards being accepted by a broader set of merchants.
Using data provided by the Bank of Mexico, Figure 5.3 shows that the average growth of quarterly card expen-diture at POS terminals was 3.3 percent in the year prior to the terminal subsidization program (2002-2003) and 7.2 percent from 2004 to 2009. As discussed later, there were other relevant initiatives in Mexico over this period.
5.3.2 Poland
Other similar efforts followed internationally. The Polish ADF was created in 2009. The program was aimed at POS deployment in rural areas and cities where mer-chant EPA was low. The program funded 200,000 ter-minals, which increased total terminals in the country by 80 percent. The value of consumer payment card trans-actions doubled from 2009 to 2014, while cash pay-ments grew by only 5 percent during the same period (RBI, 2016a). Given the relative advance of electronic
payments over cash transactions, the program also con-tributed to increasing tax revenue in retail sectors such as hospitality services.
5.3.3 Indonesia
Indonesia launched an ADF in 2011. At that time, it was estimated that only 4 percent of the country’s busi-nesses had a POS terminal (Govil, 2016). The ADF was set for five years as a multifaceted program with more than twenty different initiatives, but there were four main pillars. The first pillar involved subsidies for POS terminal investment by acquirers in Tier 2 cities, where terminal deployment was the lowest. A second pillar involved promoting electronic channels, such as e-commerce, mobile commerce, and contactless payments. A third pillar was targeting particularly sensitive sectors, such as gas stations, public transport, convenience stores, and healthcare. The final pillar involved training campaigns to improve technology skills and business information systems.
5.3.4 Malaysia
In 2014, Malaysia created the Market Development Fund (MDF), wherein issuers committed to invest 0.10 percent of credit card transaction value to the deployment of POS terminals, with the aim of reaching 800,000 POS terminals by 2020. Participants channeled approximately MYR 455 million (USD 112.6 million) to expand the net-work of payment card terminals from 240,000 in 2014 to 800,000 by 2020 (25 terminals per 1,000 inhabitants). The Malaysian government supervised the program and gave its approval to strategic development, though the program is managed by a third party (Bokhari, 2016).
5.3.5 India
In India, the RBI created the Payments Infrastructure Development Fund (PIDF) in 2020 to increase the acceptance of POS physical and electronic infrastruc-ture. Contributions to the fund were made by the RBI, card issuers, and card networks. The RBI manages the PIDF. The program is mostly aimed at Tier-3 to Tier-6 cities and northeastern states, where EPA remains very low. The total budget is estimated at INR 5 billion (USD 68 million). The RBI made an initial contribution of INR 2.5 billion (USD 34 million), and the card issuers and net-works will contribute the remaining amount. Operating expenses will be fully covered by card issuers and net-works. The program also considers merchant onboarding training as key, particularly in smaller towns and cities.
0
20,000
40,000
60,000
80,000
100,000
120,000
140,000
160,000
180,000
20
02
q1
20
03
q1
20
04
q1
20
05
q1
20
06
q1
20
07
q1
20
08
q1
20
09
q1
20
10q
1
20
11q
1
20
12q
1
20
13q
1
20
14q
1
20
15q
1
20
16q
1
20
17q
1
20
18q
1
20
19q
1
FIGURE 5.3: Value of Debit and Credit Card Transactions in Mexico (Peso million)
Source: Authors’ own elaboration from Bank of Mexico data.

INCENTIVES FOR ELECTRONIC PAYMENT ACCEPTANCE • 33
5.4 KEY TAKEAWAYS
Some general lessons can be learned from these cases of government POS subsidies and ADF programs. A com-mon feature is that merchants are initially reluctant to adopt POS terminals as they first see them as instruments for tax collection purposes. However, once the benefits of POS terminals are experienced (e.g., higher sales and broader customer base) and the demand correspond-ingly increases (i.e., through increased debit and credit card consumer adoption), a POS ‘culture’ is established. As discussed, terminal subsidies are often part of a bun-dle of incentives. Using statistical techniques, Section 8 finds a positive relationship between POS adoption on P2B payment usage.
A general conclusion for ADF experiences is that they are mostly focused on creating the necessary infrastruc-ture, especially in smaller cities and rural areas where the traditional financial institutions have a more limited pres-ence. In most cases, the initiatives are part of a wider national financial inclusion strategy, for which promot-ing electronic payments (especially mobile payments recently) and improving tax reporting are important goals. However, economic informality and limited finan-cial literacy remain as major obstacles to increased usage of payment cards.
34 • FINANCIAL INCLUSION GLOBAL INITIATIVE
6. Fiscal and Financial Incentives to Encourage Electronic Payments
Fiscal incentives that are tied to electronic payments have been deployed in various economies to reduce cash usage and improve total tax revenue. The effective-ness of fiscal incentives depends on the level of access to electronic payments and comfort in using them. This section investigates reductions in business and personal income taxes and value added taxes (VAT) as incentives to increase acceptance and usage of electronic payments. It also explores lotteries, which some governments have used to encourage greater adoption and usage of elec-tronic payments.
6.1 FISCAL INCENTIVES: TYPES AND BARRIERS TO IMPLEMENTATION
Fiscal incentives target both merchants and consumers. Merchant-focused fiscal incentives include business tax deductions and VAT credits tied to transactions con-ducted with electronic payment instruments. Consumers also receive tax incentives, including income tax deduc-tions and VAT rebates. Lottery promotions are another form of fiscal incentive.
Fiscal measures geared toward incentivizing acceptance and usage of electronic payments can be complementary. By addressing both the merchant and consumer sides of the market, complementary incentives can foster indirect network effects (as more merchants accept cards, more cardholders are likely to use them). Sections 6.2 and 6.3 focus on income tax deductions, VAT deductions, and lot-teries, which are the most common fiscal measures for incentivizing electronic payments.
Fiscal incentives may reduce the costs transactors face in changing their payment preferences. If, for example, some taxes are removed or reduced for merchants, mer-chant acceptance may increase. However, merchants may also perceive that moving from a cash-based system to an electronic payment system would make it more diffi-cult to evade taxes. Similarly, for consumers, receiving tax rebates for paying with electronic instruments may not be a sufficient incentive if consumers do not want their transactions tracked by fiscal authorities. These opposing forces have been found to be particularly significant in countries where informal activities represent a consider-able share of the economy and there is a limited traceabil-ity of cash.
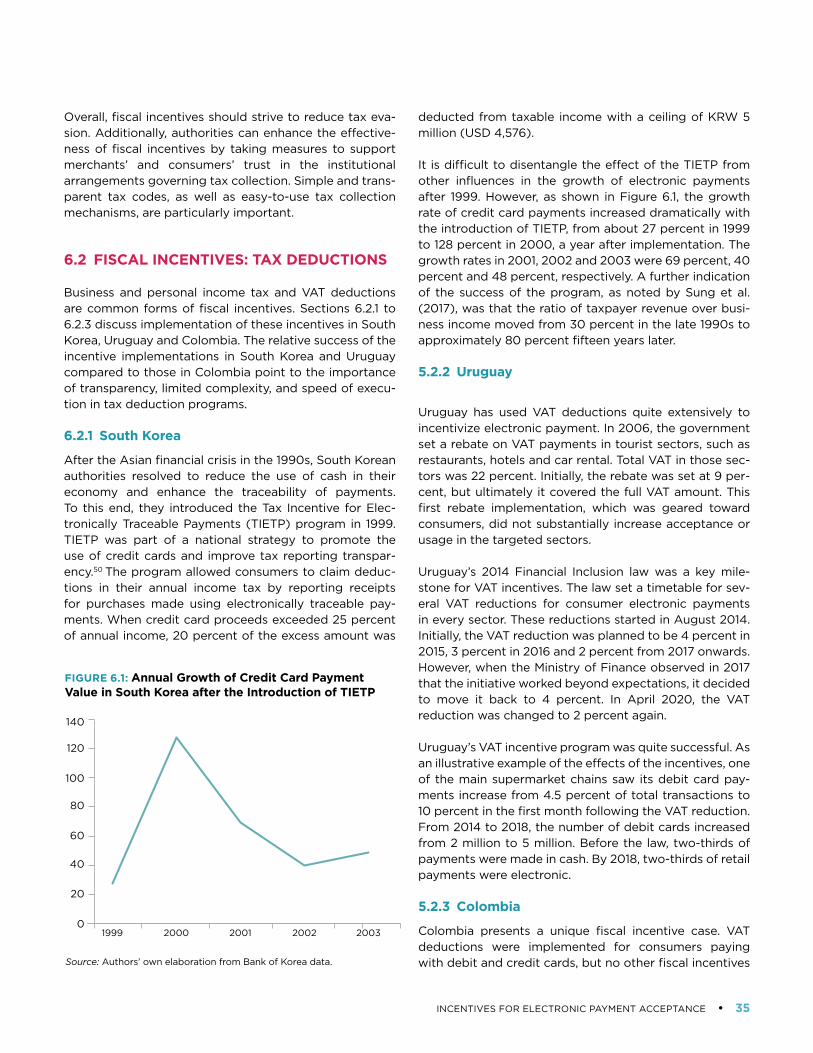
INCENTIVES FOR ELECTRONIC PAYMENT ACCEPTANCE • 35
Overall, fiscal incentives should strive to reduce tax eva-sion. Additionally, authorities can enhance the effective-ness of fiscal incentives by taking measures to support merchants’ and consumers’ trust in the institutional arrangements governing tax collection. Simple and trans-parent tax codes, as well as easy-to-use tax collection mechanisms, are particularly important.
6.2 FISCAL INCENTIVES: TAX DEDUCTIONS
Business and personal income tax and VAT deductions are common forms of fiscal incentives. Sections 6.2.1 to 6.2.3 discuss implementation of these incentives in South Korea, Uruguay and Colombia. The relative success of the incentive implementations in South Korea and Uruguay compared to those in Colombia point to the importance of transparency, limited complexity, and speed of execu-tion in tax deduction programs.
6.2.1 South Korea
After the Asian financial crisis in the 1990s, South Korean authorities resolved to reduce the use of cash in their economy and enhance the traceability of payments. To this end, they introduced the Tax Incentive for Elec-tronically Traceable Payments (TIETP) program in 1999. TIETP was part of a national strategy to promote the use of credit cards and improve tax reporting transpar-ency.50 The program allowed consumers to claim deduc-tions in their annual income tax by reporting receipts for purchases made using electronically traceable pay-ments. When credit card proceeds exceeded 25 percent of annual income, 20 percent of the excess amount was
deducted from taxable income with a ceiling of KRW 5 million (USD 4,576).
It is difficult to disentangle the effect of the TIETP from other influences in the growth of electronic payments after 1999. However, as shown in Figure 6.1, the growth rate of credit card payments increased dramatically with the introduction of TIETP, from about 27 percent in 1999 to 128 percent in 2000, a year after implementation. The growth rates in 2001, 2002 and 2003 were 69 percent, 40 percent and 48 percent, respectively. A further indication of the success of the program, as noted by Sung et al. (2017), was that the ratio of taxpayer revenue over busi-ness income moved from 30 percent in the late 1990s to approximately 80 percent fifteen years later.
5.2.2 Uruguay
Uruguay has used VAT deductions quite extensively to incentivize electronic payment. In 2006, the government set a rebate on VAT payments in tourist sectors, such as restaurants, hotels and car rental. Total VAT in those sec-tors was 22 percent. Initially, the rebate was set at 9 per-cent, but ultimately it covered the full VAT amount. This first rebate implementation, which was geared toward consumers, did not substantially increase acceptance or usage in the targeted sectors.
Uruguay’s 2014 Financial Inclusion law was a key mile-stone for VAT incentives. The law set a timetable for sev-eral VAT reductions for consumer electronic payments in every sector. These reductions started in August 2014. Initially, the VAT reduction was planned to be 4 percent in 2015, 3 percent in 2016 and 2 percent from 2017 onwards. However, when the Ministry of Finance observed in 2017 that the initiative worked beyond expectations, it decided to move it back to 4 percent. In April 2020, the VAT reduction was changed to 2 percent again.
Uruguay’s VAT incentive program was quite successful. As an illustrative example of the effects of the incentives, one of the main supermarket chains saw its debit card pay-ments increase from 4.5 percent of total transactions to 10 percent in the first month following the VAT reduction. From 2014 to 2018, the number of debit cards increased from 2 million to 5 million. Before the law, two-thirds of payments were made in cash. By 2018, two-thirds of retail payments were electronic.
5.2.3 Colombia
Colombia presents a unique fiscal incentive case. VAT deductions were implemented for consumers paying with debit and credit cards, but no other fiscal incentives
0
40
20
60
80
120
100
140
1999 2000 2001 2002 2003
FIGURE 6.1: Annual Growth of Credit Card Payment Value in South Korea after the Introduction of TIETP
Source: Authors’ own elaboration from Bank of Korea data.
36 • FINANCIAL INCLUSION GLOBAL INITIATIVE
or subsidies were adopted. In 2004, the government of Colombia introduced a 2 percent VAT rebate for pur-chases made with cards. As for the evidence regarding the impact of the program, around 3 million citizens (15 percent of banked customers) benefitted annually from the rebates. Additionally, the VAT reported from POS terminals more than tripled from 2004 to 2013 (Asoban-caria, 2015).
Nevertheless, there is evidence that the rebate system was too complex, and the VAT system, more generally, was burdensome for merchants. Regarding the rebate system, it frequently took the tax administration one to three months to identify the deductible transactions and make refunds for electronic purchases via bank accounts. With respect to the VAT system, when a card transaction was made, the acquiring bank had to retain 10 percent of the VAT. As noted by Better than Cash Alliance (2015), VAT was 16 percent on average, resulting in a retention of about 1.6 percent of the purchase value. Additionally, 1.5 percent of each transaction was retained for income tax, and another 0.414 percent for local tax. All the tax retention combined reduce merchant revenue by 3 per-cent, apart from the MDR.51
There was an initiative to extend the 2 percent VAT rebate to mobile transactions in 2013, but the measure was not implemented. In 2014, a tax reform package introduced a tax on consumption in restaurants, bars and other retail establishments, which was different from the VAT. These measures introduced further complexity, and the VAT rebate was eventually eliminated in 2014.
6.3 IMPLEMENTATION OF FISCAL INCENTIVES: LOTTERIES
Mexico offers an example of a lottery program implemen-tation. Launched in 2004, the El Boletazo campaign was a joint effort of the Ministry of Finance and the Mexican Banking Association, with the support of Visa and Mas-tercard. Card purchases were automatically registered in the El Boletazo system, and raffles were aired on televi-sion. Initially, the drawings were weekly, but as the lottery became more successful, drawings were broadcasted on television daily. Some of the prizes ranged from cars to washing machines.
The lotteries benefited from their correspondence with other electronic payment initiatives. For example, the Financial Services Transparency Law was enacted in 2004. This law provided a framework for the pricing of several payment instruments, for card reward programs,
and also included information requirements that payment providers had to provide to consumers. Further, FIMPE (see Section 4 on ADFs) was also established in 2004.
The Mexican Banking Association supported the El Bole-tazo campaign with a series of television advertisements (The Economist, 2005). According to Castellanos and Garrido (2010), even if promotional programs, such as El Boletazo, became quite popular, POS terminal subsidies were more effective to increase card payments. Their empirical model suggests that credit card expenditure was positively and significantly related to POS instal-lation and concentration, while the consumer incentive programs such as el Boletazo did not significantly alter cash usage.
The Korean government also introduced a lottery scheme for credit card purchases in 1999 to encourage credit card usage and obtain the exact sales records of merchants for taxation purposes. The lottery used the numbers from credit card invoice stubs on the last Saturday of each month. Each credit card invoice had one opportunity to win the lottery. There was a prize of KRW 100 million (USD 91,523) for cardholders and KRW 20 million (USD 18,304) for merchants (Wang et al., 2017). After the lot-tery scheme, credit card purchases increased from KRW 28,469 billion (USD 26 billion) to KRW 48,967 billion (USD 44.8 billion), a 72.1 percent increase.52
In Kenya, Safaricom implemented a lottery program in 2020 for usage of Lipa Na M-Pesa, the mobile money provider’s merchant acceptance product, that targeted both merchants and consumers in eight regions of Kenya (Safaricom n.d.a, n.d.b). Merchants and consumers were awarded 1 point for every KES 100 (~USD 1) transac-tion collected and made, respectively. The points were entered into regular lotteries. Five tuk tuks (motorized rickshaws) per region were awarded to merchants on a bi-weekly basis. One cantor (nine-ton truck) was awarded to a merchant as the grand prize. All merchants were also rewarded with 25 percent cash back on all Lipa Na M-Pesa purchases throughout the promotion period. Consumers were entered into lotteries for random cash back rewards every minute, three-bedroom houses on a weekly basis, and one tractor per region as a grand prize. Only in the first two months of the implementation of the program, the equivalent to USD 3.3 million was redeemed in points from the program and there were four times more points to be yet redeemed by lottery participants. The Lipa Na M-Pesa promotion represents an example of a private sector-led lottery implementation geared specifically toward an emerging, non-card-based merchant accep-tance model.

INCENTIVES FOR ELECTRONIC PAYMENT ACCEPTANCE • 37
More recently, there have been initiatives to launch lottery schemes in Italy. In particular a national lottery promoted by the government for cashless payments amounting EUR 45 million (USD 56 million) per year.
6.4 KEY TAKEAWAYS
A frequently identified feature in most of these tax incen-tive experiences is that it takes significant time to change the tax culture and to internalize the benefits of adopting electronic payments. Successful incentive implementa-tions are often preceded by less fruitful attempts. It also seems clear that tax incentives, such as VAT rebates, need to be consistent and persistent over time to produce structural and cultural changes. Overall, the most efficient schemes are those that are accompanied by other mea-sures, such as financial inclusion, infrastructure and edu-
cation strategies. Further, the design and implementation of tax incentive programs matter. The comparison of the South Korea, Uruguay and Colombia experiences suggest that programs that are transparent and reward partici-pants quickly are likely to be more successful. Section 8 provides empirical analysis that isolates the impact of tax incentives on POS adoption and P2B payments.
While estimating the impact of lottery programs on debit and credit card adoption has been elusive, these initia-tives have been quite popular amongst citizens. They likely contributed, to some extent, to changing the pay-ment culture toward a higher preference for electronic payments. Additionally, compared to more extensive tax incentive programs, lotteries can be quite affordable for governments. Therefore, lotteries may be a cost-effective mechanism for reducing the psychological barrier of elec-tronic payment usage.
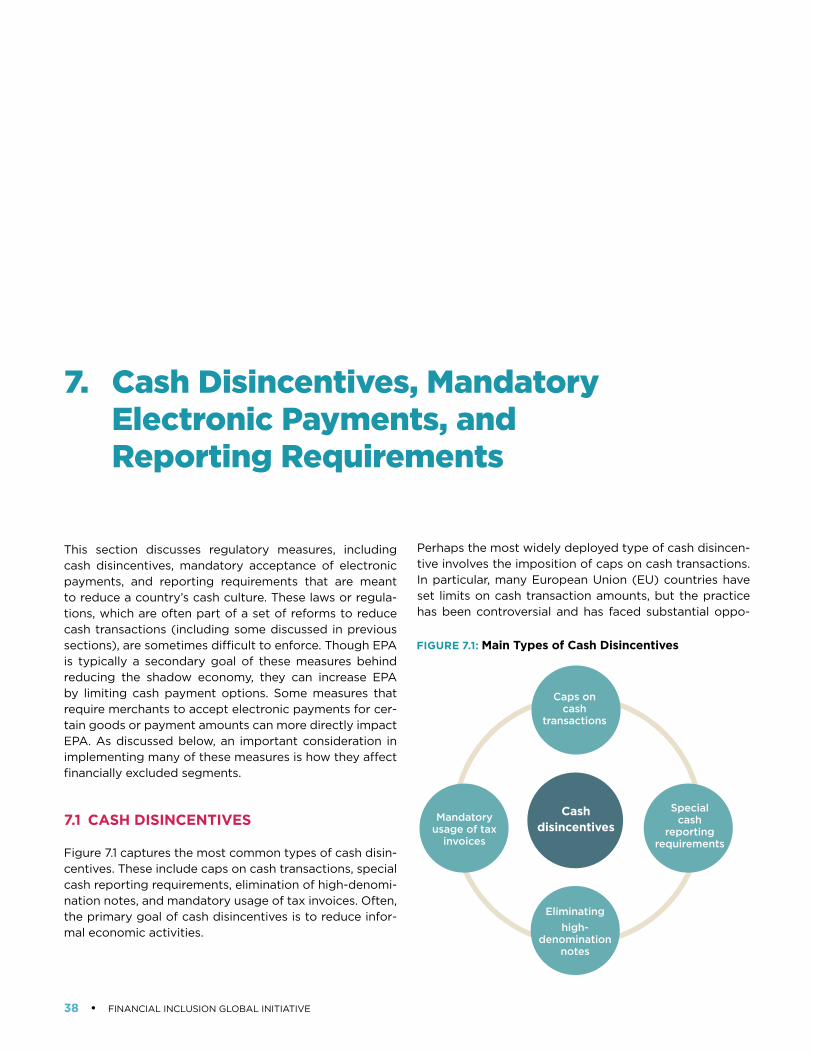
38 • FINANCIAL INCLUSION GLOBAL INITIATIVE
7. Cash Disincentives, Mandatory Electronic Payments, and Reporting Requirements
This section discusses regulatory measures, including cash disincentives, mandatory acceptance of electronic payments, and reporting requirements that are meant to reduce a country’s cash culture. These laws or regula-tions, which are often part of a set of reforms to reduce cash transactions (including some discussed in previous sections), are sometimes difficult to enforce. Though EPA is typically a secondary goal of these measures behind reducing the shadow economy, they can increase EPA by limiting cash payment options. Some measures that require merchants to accept electronic payments for cer-tain goods or payment amounts can more directly impact EPA. As discussed below, an important consideration in implementing many of these measures is how they affect financially excluded segments.
7.1 CASH DISINCENTIVES
Figure 7.1 captures the most common types of cash disin-centives. These include caps on cash transactions, special cash reporting requirements, elimination of high-denomi-nation notes, and mandatory usage of tax invoices. Often, the primary goal of cash disincentives is to reduce infor-mal economic activities.
Perhaps the most widely deployed type of cash disincen-tive involves the imposition of caps on cash transactions. In particular, many European Union (EU) countries have set limits on cash transaction amounts, but the practice has been controversial and has faced substantial oppo-
FIGURE 7.1: Main Types of Cash Disincentives
Caps on cash
transactions
Cash disincentives
Eliminatinghigh-
denomination notes
Mandatory usage of tax
invoices
Special cash
reporting requirements
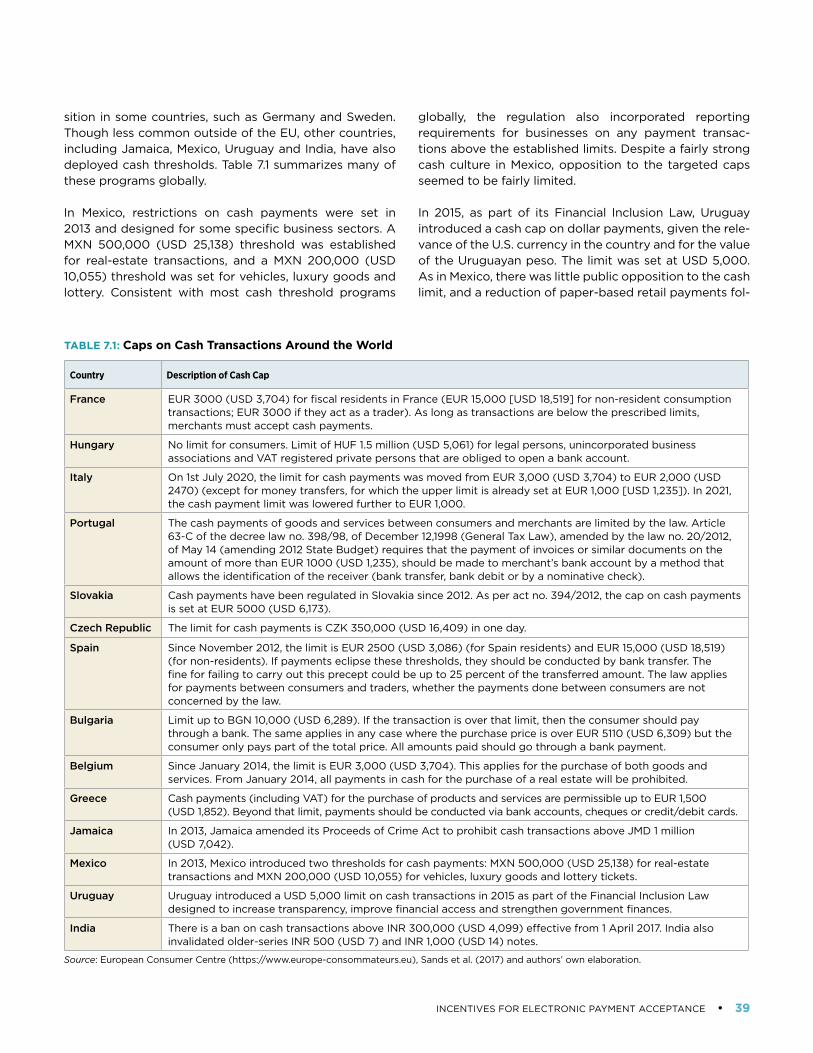
INCENTIVES FOR ELECTRONIC PAYMENT ACCEPTANCE • 39
sition in some countries, such as Germany and Sweden. Though less common outside of the EU, other countries, including Jamaica, Mexico, Uruguay and India, have also deployed cash thresholds. Table 7.1 summarizes many of these programs globally.
In Mexico, restrictions on cash payments were set in 2013 and designed for some specific business sectors. A MXN 500,000 (USD 25,138) threshold was established for real-estate transactions, and a MXN 200,000 (USD 10,055) threshold was set for vehicles, luxury goods and lottery. Consistent with most cash threshold programs
globally, the regulation also incorporated reporting requirements for businesses on any payment transac-tions above the established limits. Despite a fairly strong cash culture in Mexico, opposition to the targeted caps seemed to be fairly limited.
In 2015, as part of its Financial Inclusion Law, Uruguay introduced a cash cap on dollar payments, given the rele-vance of the U.S. currency in the country and for the value of the Uruguayan peso. The limit was set at USD 5,000. As in Mexico, there was little public opposition to the cash limit, and a reduction of paper-based retail payments fol-
TABLE 7.1: Caps on Cash Transactions Around the World
Country Description of Cash Cap
France EUR 3000 (USD 3,704) for fiscal residents in France (EUR 15,000 [USD 18,519] for non-resident consumption transactions; EUR 3000 if they act as a trader). As long as transactions are below the prescribed limits, merchants must accept cash payments.
Hungary No limit for consumers. Limit of HUF 1.5 million (USD 5,061) for legal persons, unincorporated business associations and VAT registered private persons that are obliged to open a bank account.
Italy On 1st July 2020, the limit for cash payments was moved from EUR 3,000 (USD 3,704) to EUR 2,000 (USD 2470) (except for money transfers, for which the upper limit is already set at EUR 1,000 [USD 1,235]). In 2021, the cash payment limit was lowered further to EUR 1,000.
Portugal The cash payments of goods and services between consumers and merchants are limited by the law. Article 63-C of the decree law no. 398/98, of December 12,1998 (General Tax Law), amended by the law no. 20/2012, of May 14 (amending 2012 State Budget) requires that the payment of invoices or similar documents on the amount of more than EUR 1000 (USD 1,235), should be made to merchant’s bank account by a method that allows the identification of the receiver (bank transfer, bank debit or by a nominative check).
Slovakia Cash payments have been regulated in Slovakia since 2012. As per act no. 394/2012, the cap on cash payments is set at EUR 5000 (USD 6,173).
Czech Republic The limit for cash payments is CZK 350,000 (USD 16,409) in one day.
Spain Since November 2012, the limit is EUR 2500 (USD 3,086) (for Spain residents) and EUR 15,000 (USD 18,519) (for non-residents). If payments eclipse these thresholds, they should be conducted by bank transfer. The fine for failing to carry out this precept could be up to 25 percent of the transferred amount. The law applies for payments between consumers and traders, whether the payments done between consumers are not concerned by the law.
Bulgaria Limit up to BGN 10,000 (USD 6,289). If the transaction is over that limit, then the consumer should pay through a bank. The same applies in any case where the purchase price is over EUR 5110 (USD 6,309) but the consumer only pays part of the total price. All amounts paid should go through a bank payment.
Belgium Since January 2014, the limit is EUR 3,000 (USD 3,704). This applies for the purchase of both goods and services. From January 2014, all payments in cash for the purchase of a real estate will be prohibited.
Greece Cash payments (including VAT) for the purchase of products and services are permissible up to EUR 1,500 (USD 1,852). Beyond that limit, payments should be conducted via bank accounts, cheques or credit/debit cards.
Jamaica In 2013, Jamaica amended its Proceeds of Crime Act to prohibit cash transactions above JMD 1 million (USD 7,042).
Mexico In 2013, Mexico introduced two thresholds for cash payments: MXN 500,000 (USD 25,138) for real-estate transactions and MXN 200,000 (USD 10,055) for vehicles, luxury goods and lottery tickets.
Uruguay Uruguay introduced a USD 5,000 limit on cash transactions in 2015 as part of the Financial Inclusion Law designed to increase transparency, improve financial access and strengthen government finances.
India There is a ban on cash transactions above INR 300,000 (USD 4,099) effective from 1 April 2017. India also invalidated older-series INR 500 (USD 7) and INR 1,000 (USD 14) notes.
Source: European Consumer Centre (https://www.europe-consommateurs.eu), Sands et al. (2017) and authors’ own elaboration.

40 • FINANCIAL INCLUSION GLOBAL INITIATIVE
lowed. However, the threshold was not effective in reduc-ing money laundering.
There are other interventions to discourage the use of cash that are frequently developed in concert with cash caps. For example, South Korean merchants with sales above a specified threshold (currently USD 20,000) were required to accept payment cards as of 2014. Similarly, in 2014, Italy mandated that merchants and other busi-nesses accept debit cards for transactions above EUR 30 (USD 37). More recently, the Italian government issued a decree (124/2919) that will decrease this threshold from EUR 3,000 (USD 3,704) to EUR 2,000 (USD 2,469) by July 2020 and to EUR 1,000 (USD 1,235) from January 2021.
Electronic payment processors have also recommended further action beyond cash limits, particularly in coun-tries where the shadow economy is large. Proposals have generally excluded taxes or bans—as they are difficult to enforce—but have included restrictions on ATM or other cash transactions (Visa, 2016).
Another policy measure that is meant to curb the use of cash is eliminating high denomination notes. One of the most relevant cases was the decision of the European Central Bank to progressively eliminate the EUR 500 (USD 617) currency note beginning in May 2016. Sands et al. (2016) show that the primary motivation for this action was hindering illicit activities, rather than increas-ing the preference for electronic-based payments in retail transactions. Importantly, the ECB adopted a grad-ual approach, which likely reduced the effectiveness of the action.
Primarily used as a tool to decrease the shadow econ-omy and increase tax receipts, India’s 2016 demonetiza-tion program, discussed before, removed the INR 500 (USD 7) and INR 1,000 (USD 14) notes from circulation. Importantly, the program also introduced cash report-ing limits. Early assessment of demonetization suggests that it fostered electronic payment acceptance and usage. However, implementation of cash reporting has been difficult, and the action may have generated dis-tortions for deprived segments of population tied to the informal economy.53
Despite widespread use of cash disincentives, financial exclusion is a significant concern. According to the World Bank 2017 Global Findex database, 1.7 billion adults globally do not have access to a financial institution or mobile money account; cash is the sole payment instru-ment for their transactions. For this reason, the Financial
Action Task Force (FATF)—the global money laundering and terrorist financing watchdog—does not include cash limits in its recommendations. A FATF (2015) report on money laundering states:
“. . . cash is still the preferred method of settlement for goods and services for billions of people in the world today. There are many reasons for this. Not the least of these is the fact that there are still 2 billion adults in the world today who do not have access to banking services. For these people, cash is still the only thing that they can use to procure the goods and services that they need to live their lives day to day. It is no coincidence that many of the poorest and least developed countries of the world have economies that are predominantly cash based.”54
7.2 REPORTING REQUIREMENTS
Similar to cash disincentives, reporting requirements are another regulatory measure that can indirectly incentiv-ize EPA. Although not directly targeted to any specific payment instrument, the obligation for merchants to issue and report receipts reduces incentives to use cash for tax evasion purposes.
In South Korea, with the introduction of VAT in 1977, cash registers became mandatory. However, the reporting requirements along with other tax incentives through the mid-1990s failed to reduce the shadow economy linked to cash usage, despite being accompanied by financial education measures from industry associations and the government. As noted by Sung et al. (2017), there were various reasons for the lack of success of the reporting requirements and incentives. First, merchants were reluc-tant to issue receipts through cash registers. In particu-lar, they rarely issued receipts unless consumers asked for them, and these transactions were mostly untaxed. Additionally, during the 1980s, there was increasing dis-content from the retail sector as tax authorities denied some of the tax benefits based on estimations of sales underreporting. Frequent inspections and penalties did not foster trust.
Consumers’ distrust of fiscal authorities also increased as they considered the measures to be a tax liability. Further, the process for obtaining incentives for cash transaction reporting was too long and burdensome. Only three years after cash registers were implemented, investigations and penalties were suspended and, in 1988, the mandate to use cash registers was effectively abolished. In 1993, the VAT law was changed, making cash registers voluntary. Tax credit incentives for issuing receipts were also elimi-nated in 1996. The failed experience of transaction report-

INCENTIVES FOR ELECTRONIC PAYMENT ACCEPTANCE • 41
ing requirements seems to suggest that other factors were needed to encourage reporting and gain trust from taxpayers. Several administrative problems and budget constraints also made the implementation of the incen-tives even more difficult. The program experience also drove South Korea in the direction of the more successful TIETP program discussed in Section 5.2.
In Mexico, tax receipts have been an important tool within the context of efforts to reduce cash usage and the shadow economy. They were launched in the 1990s but formalized beginning in 2005. Prior to this, taxpayers typically used printed invoices, and there was a high vol-ume of false transactions using fake invoices to claim tax deductions (OECD, 2017). In 2005, Mexico formalized the e-invoice by internet, the only official invoice currently in Mexico. The use of e-invoicing has expanded for use in payroll. The standardized e-invoice contains the folio number which was controlled by the tax authority as well as the taxpayer’s digital seal. As noted by Sung et al. (2017), since January 2011, tax deductions of corpo-rate expenditures must be backed by a digital tax receipt issued by CFDI (Comprobante Fiscal Digital por Internet), and payments exceeding MXN 2,000 (USD 101) must be made through electronic transfer of funds, personal check, credit, debit, or service cards, or using an elec-tronic pocketbook.
7.3 KEY TAKEAWAYS
Though typically more targeted to reducing economic informality than increasing electronic payments, cash disincentives, such as cash caps and the elimination of certain high-denomination notes, can indirectly increase EPA. Additionally, mandatory acceptance of electronic payments can more directly affect EPA. Empirical analy-sis in Section 8 suggests that cash limits positively impact adoption of POS terminals and usage of electronic pay-ments when considering a bundle of incentives. However, such regulations can be difficult to enforce and cre-ate market distortions. Moreover, authorities seeking to implement cash disincentives need to carefully consider how such measures would affect financially excluded population segments.
Reporting requirements can be effective, but enforce-ment has been difficult and costly in practice. Experience from earlier studies and case studies dictates a few key takeaways. First, invoice issuance is easier to implement for B2B transactions rather than B2P transactions. How-ever, there may be spillovers from adoption of invoices for B2B and payroll transactions that increase receipts for B2P transactions. Second, robust official enforcement and surveillance of supply chains (e.g., VAT registered supplier-acquirer relationships) provides a better envi-ronment for compulsory e-invoicing. Finally, implemen-tation should be gradual, as it requires the necessary IT capacity and processing.
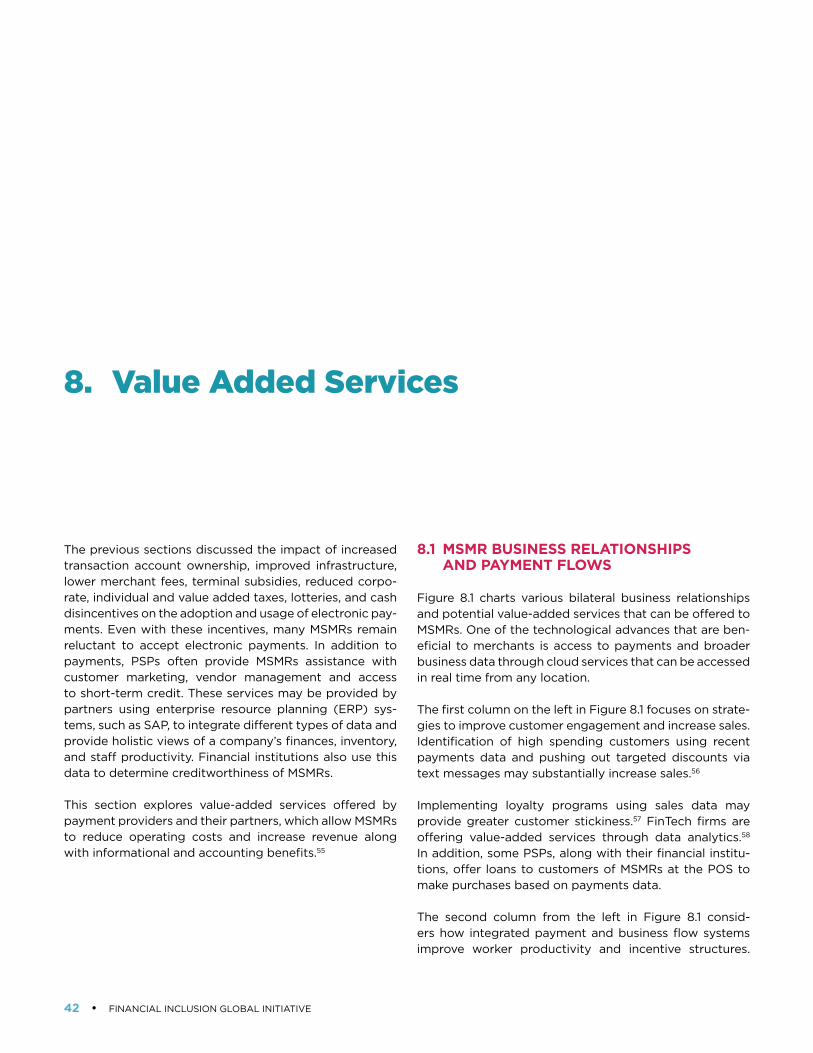
42 • FINANCIAL INCLUSION GLOBAL INITIATIVE
8. Value Added Services
The previous sections discussed the impact of increased transaction account ownership, improved infrastructure, lower merchant fees, terminal subsidies, reduced corpo-rate, individual and value added taxes, lotteries, and cash disincentives on the adoption and usage of electronic pay-ments. Even with these incentives, many MSMRs remain reluctant to accept electronic payments. In addition to payments, PSPs often provide MSMRs assistance with customer marketing, vendor management and access to short-term credit. These services may be provided by partners using enterprise resource planning (ERP) sys-tems, such as SAP, to integrate different types of data and provide holistic views of a company’s finances, inventory, and staff productivity. Financial institutions also use this data to determine creditworthiness of MSMRs.
This section explores value-added services offered by payment providers and their partners, which allow MSMRs to reduce operating costs and increase revenue along with informational and accounting benefits.55
8.1 MSMR BUSINESS RELATIONSHIPS AND PAYMENT FLOWS
Figure 8.1 charts various bilateral business relationships and potential value-added services that can be offered to MSMRs. One of the technological advances that are ben-eficial to merchants is access to payments and broader business data through cloud services that can be accessed in real time from any location.
The first column on the left in Figure 8.1 focuses on strate-gies to improve customer engagement and increase sales. Identification of high spending customers using recent payments data and pushing out targeted discounts via text messages may substantially increase sales.56
Implementing loyalty programs using sales data may provide greater customer stickiness.57 FinTech firms are offering value-added services through data analytics.58 In addition, some PSPs, along with their financial institu-tions, offer loans to customers of MSMRs at the POS to make purchases based on payments data.
The second column from the left in Figure 8.1 consid-ers how integrated payment and business flow systems improve worker productivity and incentive structures.
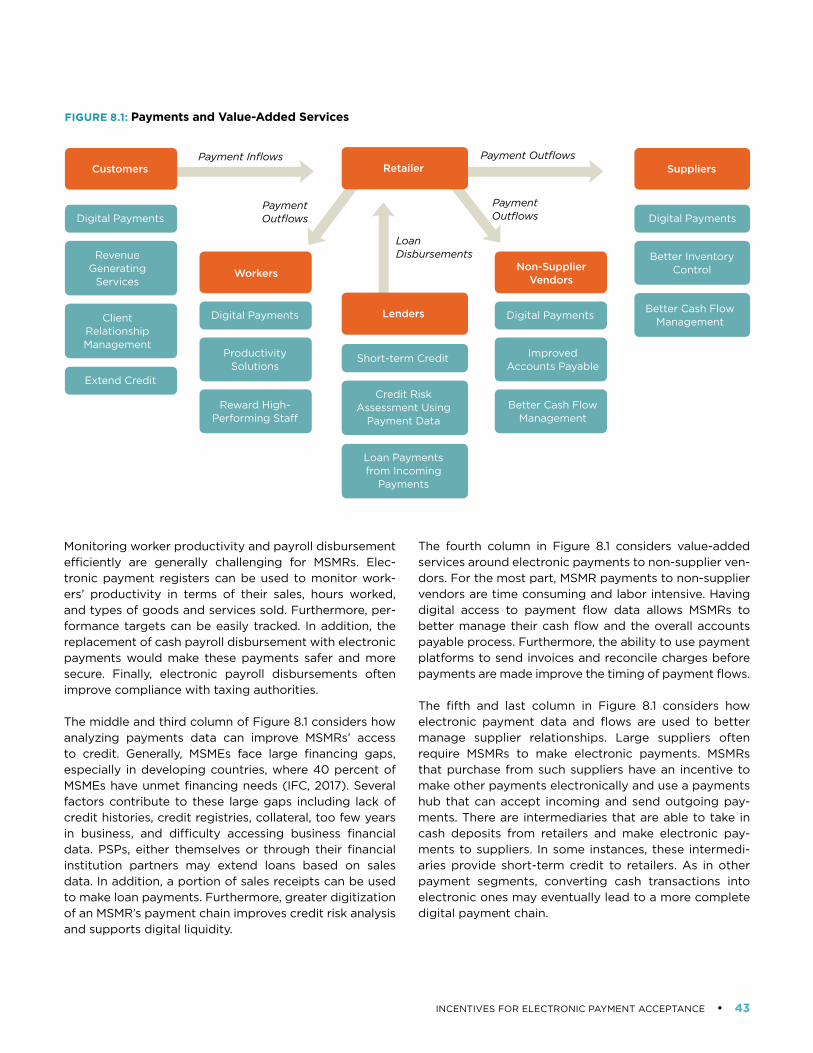
INCENTIVES FOR ELECTRONIC PAYMENT ACCEPTANCE • 43
Monitoring worker productivity and payroll disbursement efficiently are generally challenging for MSMRs. Elec-tronic payment registers can be used to monitor work-ers’ productivity in terms of their sales, hours worked, and types of goods and services sold. Furthermore, per-formance targets can be easily tracked. In addition, the replacement of cash payroll disbursement with electronic payments would make these payments safer and more secure. Finally, electronic payroll disbursements often improve compliance with taxing authorities.
The middle and third column of Figure 8.1 considers how analyzing payments data can improve MSMRs’ access to credit. Generally, MSMEs face large financing gaps, especially in developing countries, where 40 percent of MSMEs have unmet financing needs (IFC, 2017). Several factors contribute to these large gaps including lack of credit histories, credit registries, collateral, too few years in business, and difficulty accessing business financial data. PSPs, either themselves or through their financial institution partners may extend loans based on sales data. In addition, a portion of sales receipts can be used to make loan payments. Furthermore, greater digitization of an MSMR’s payment chain improves credit risk analysis and supports digital liquidity.
The fourth column in Figure 8.1 considers value-added services around electronic payments to non-supplier ven-dors. For the most part, MSMR payments to non-supplier vendors are time consuming and labor intensive. Having digital access to payment flow data allows MSMRs to better manage their cash flow and the overall accounts payable process. Furthermore, the ability to use payment platforms to send invoices and reconcile charges before payments are made improve the timing of payment flows.
The fifth and last column in Figure 8.1 considers how electronic payment data and flows are used to better manage supplier relationships. Large suppliers often require MSMRs to make electronic payments. MSMRs that purchase from such suppliers have an incentive to make other payments electronically and use a payments hub that can accept incoming and send outgoing pay-ments. There are intermediaries that are able to take in cash deposits from retailers and make electronic pay-ments to suppliers. In some instances, these intermedi-aries provide short-term credit to retailers. As in other payment segments, converting cash transactions into electronic ones may eventually lead to a more complete digital payment chain.
FIGURE 8.1: Payments and Value-Added Services
Customers
Workers Non-Supplier Vendors
Retailer
Lenders
Suppliers
Digital Payments
Digital Payments
Productivity Solutions
Reward High- Performing Staff
Improved Accounts Payable
Better Cash Flow Management
Digital Payments
Extend Credit
Digital Payments
Revenue Generating
Services
Client Relationship Management
Short-term Credit
Credit Risk Assessment Using
Payment Data
Loan Payments from Incoming
Payments
Better Inventory Control
Better Cash Flow Management
Payment Inflows
Payment Outflows
Payment Outflows
LoanDisbursements
Payment Outflows
44 • FINANCIAL INCLUSION GLOBAL INITIATIVE
8.2 SQUARE
Square, a U.S. based PSP, provides dongles that attach to cell phones enabling card acceptance by MSMRs. Square charges a flat per transaction fee with no set up or monthly fees along with several value-added services. Value-added services focused on increasing sales include creating an online presence and improving customer engagement through marketing software and loyalty pro-grams. Square also provides additional merchant services to monitor employee hours and track inventory across multiple registers and stores. In addition, merchants can make purchases using a business debit card that accesses their inbound customer payments (Luang, 2019).
Square also offers loans to its merchant clients based on certain characteristics, such as processing volume, ratio of new and returning customers, number of chargebacks, growth of the business and its history. Square charges a fixed fee for the loans. In effect, the loans can be viewed as cash advances on future sales. The fee and the loan amount are paid with a predetermined percentage of debit and credit card receipts daily. Businesses have 18 months to pay off their loans (Goodshore, 2020).
8.3 KOPO KOPO
As noted earlier, M-Pesa and other mobile money pro-viders are served by a growing number of cash agents where users convert e-money into cash and vice versa frequently. By providing greater opportunities to spend e-money, mobile money providers benefit from greater digital liquidity and fee income from additional trans-actions. Kopo Kopo, a Kenyan PSP established in 2011, tackled the lack of merchant acceptance of M-Pesa by merchants. In 2011, Kopo Kopo estimated that fewer than .01% percent of Kenyan merchants had M-Pesa accounts (Wills, 2014). Working with Safaricom, Kopo Kopo initially targeted MSMRs and provided training and value-added services in addition to payment processing. Observing the success of Kopo Kopo, Safaricom now directly com-petes with Kopo Kopo for merchant payment acceptance (Lacy, 2013). Safaricom sets its merchant fee at 1.0 per-cent of the transaction, compared to Kopo Kopo’s 1.5 per-cent initial fee.59
The key to convincing MSMRs to accept mobile money is the bundling of value-added services with payment ser-vices. As discussed above, an important value-added ser-vice is access to loans. Kopo Kopo’s GROW service, using over 200 variables to calculate credit risk, offers short-term unsecured credit that are repaid over time (Zetterli and Lyan, 2015). As merchants build credit histories, the
amount of credit extended increases and the associated fee decreases. Other value-added services provided by Kopo Kopo include customer targeted marketing through SMS and paying workers and suppliers through Kopo Kopo accounts to further improve digital liquidity throughout the payment chain.60
8.4 TIENDA PAGO
Tienda Pago, a FinTech firm, was launched in 2013. It started operating in Peru in 2014 and in Mexico in 2016. Tienda Pago provides credit to small store owners (primar-ily mom-and-pop grocery stores) to buy products from approved major fast-moving consumer goods (FMCGs) distributors, such as Coca Cola, ABInBev, Pepsico, Gloria and Movistar (Accion, 2018). Traditional lenders do not generally lend to these types of businesses to finance inventory. These types of loans, averaging around $450, are generally repaid in a week and allow these stores to maintain their inventory and offer a greater diversity of goods to better serve their communities (Accion, 2018). The firm provides over USD 100 million in credit annually. Using mobile phone-based applications, the small shops pay approved FMCGs with short-term credit. Initially, the shop owners contacted Tienda Pago through WhatsApp and bot replies requiring a selfie and some basic ID infor-mation. Transactions take place with tokens provided by the Tienda Pago app. The tokens’ outstanding balances can be paid in any of the 11,000 and 33,000 token liq-uidation locations (mostly financial institutions or other shops) in Peru and Mexico, respectively. The suppliers get paid electronically while the shops generally get paid in cash. Suppliers benefit from increased sales and payment upon delivery. Not only does Tienda Pago extend short-term credit, but it also provides efficient payments to suppliers. The Tienda Pago model is similar to others that extend microcredit for working capital and it manages credit risk by using data analytics.
8.5 KLARNA
Klarna, a Sweden-based PSP with a global footprint, offers a set of services to merchants and consumers. From a financial point of view, Klarna’s most known proposition, “buy now pay later,” allows consumers to purchase goods and pay for them in three installments or 30 days, free of interest. Klarna offers buyers several repayment programs. Its consumers’ offering appears as a payment option on its checkout page. Klarna’s original business model foresees a fee from the merchants for the items sold and paid via Klarna. Moreover, buyers incur late payment fees if they do not pay their debt on time.
INCENTIVES FOR ELECTRONIC PAYMENT ACCEPTANCE • 45
Klarna’s consumer offerings continues to expand. Today, the company offers card issuing services, savings accounts, and term deposits. On the merchant’s side, Klarna’s offering encompasses a payment gateway of different payment instruments, payment acquiring ser-vices, and it acts as a checkout service provider, including insurance and delivery services. One of the core elements of Klarna’s value proposition is its ability to create online buyers leads, thus increasing the traffic on the merchant website. The conversion occurs through Klarna’s app, a portal of merchants’ deals to consumers, redirecting cli-ents to the merchants’ websites where they can shop paying with Klarna. Finally, Klarna also offers physical POS handling, recurring purchases/subscription man-agement, acquiring post-purchase support, and a set of partner providers to support the retailer to build its online presence, like making a web shop.
Klarna also offers to financial institutions a platform to manage open banking in line with the Second EU Pay-ment Systems Directive, embedding account informa-tion services and payment initiation services. In addition, leveraging open banking information, Klarna built an account insight engine potentially used for credit scoring purposes.
8.6 TAKEAWAYS
Value-added services generally provided by non-bank PSPs encourage MSMRs to adopt electronic payments. As mentioned before, payment services are a gate-way to credit access, which is vital to many MSMRs to maintain inventory and smooth out payment flows. In addition to credit, payments data is valuable for busi-ness intelligence which can be used to increase revenue and reduce costs. From a broader economy perspec-tive, these incentives improve digital liquidity leading to greater economic efficiency.

46 • FINANCIAL INCLUSION GLOBAL INITIATIVE
9. Quantifying the Impact of Incentives on Payment Acceptance and Usage61
This section presents the results of a quantitative empir-ical analysis of the effects of various incentives on elec-tronic payment acceptance and usage from Allen et al. (2021) (hereinafter “ACCRA”). The analysis leverages machine learning techniques that allow for the identifi-cation of the key predictors of electronic payments from a potentially large set of determinants, as well as unique merchant-level and cross-country datasets. In addition to identifying the key factors—and their combinations and sequences—that are most predictive of electronic pay-ment acceptance and usage, we quantify the economic impact of incentives on acceptance and usage. The quan-titative analysis presented herein complements the more qualitative approach in sections 2-8. While the preced-ing case studies allow for a more detailed investigation of implementation approaches, the machine learning approach enables a structured analysis of various incen-tives’ relative effectiveness.
Sections 9.1 and 9.2 describe the data and methods underlying the analysis. Section 9.3 presents the results of three complementary machine learning analyses. Finally, Section 9.4 summarizes the key takeaways.
9.1 DATA
The machine learning analysis focuses on two response variables—POS terminal adoption and MSMRs’ share of electronic P2B payments. The former is a direct measure of EPA, while the latter reflects both EPA and consumer usage. A clear limitation of POS terminal adoption as a response variable is that it primarily captures payment card acceptance and largely neglects emerging payment methods, such as those leveraging mobile phones and QR codes, which are addressed throughout this report. This limitation is one motivation for modeling MSMRs’ share of electronic P2B payments as well, which captures a wide range of electronic payment methods. In general, given data availability, these are the two best response variables that are available to us at the country and merchant level for examining the topic at hand.62
ACCRA models POS adoption and P2B electronic pay-ments at two levels—the merchant level and the country level. Table 9.1 captures the indicators used to measure the response variables. The merchant-level response vari-ables were collected for the World Bank’s 2016 report entitled, “Cash vs. Electronic Payments in Small Retailing: Estimating the Global Size” (“the Sizing Study”). The Siz-ing Study conducted pulse surveys with MSMRs in 2015

INCENTIVES FOR ELECTRONIC PAYMENT ACCEPTANCE • 47
in seven countries: Colombia, France, Kenya, Lithuania, Morocco, Pakistan, and Turkey. At the country level, POS adoption comes from the WB Global Payment System Survey (GPSS). MSMRs’ share of electronic P2B payments at the country level also comes from the Sizing Study, which used the data from the seven countries to estimate the global size of electronic P2B, business-to-business (B2B), and business-to-person (B2P) payments in MSMR settings.63
As predictor variables, ACCRA explores a wide range of potential drivers of POS adoption and electronic payment usage. The variables address access points, economic for-mality, infrastructure, institutional actions, instruments, and the merchant payment chain, among other factors. Most of the data come from cross-country databases maintained by international organizations. Key databases in this regard include the WB’s Global Findex Database, the WB GPSS, the WB Global Financial Inclusion and Consumer Protection Survey (Global FICP), and the IMF’s
Financial Access Survey (FAS). For the merchant-level sample, ACCRA leverages merchant-level variables cap-tured in the Sizing Study as well, such as retailer size, customer income profiles, and other similar factors. Importantly, in the merchant-level analysis, we further develop more specific EPA-related incentive variables, which are described in Table 9.2.
In total, ACCRA’s merchant-level sample consists of 576 merchants and 111 predictor variables. The country-level sample contains 106 countries and 81 predictor vari-ables.64 In terms of timing, most of the data are from around 2014-2015 to correspond to the timing of the Siz-ing Study.65 While a number of variables are binary (e.g., the incentives identified in Table 9.2), it is important to note that ACCRA converts all continuous variables to four-level variables as follows: low (0-25 percentile), lower- mid (26-50 percentile), upper-mid (51–75 percentile), and high (76-100 percentile). This allows for an easier inter-pretation of the results.
TABLE 9.1: Response variable descriptions
Level Response variable Indicator Dataset
Merchant POS adoption Merchant POS terminal (0/1) Sizing study
P2B electronic payments MSMRs’ share of electronic P2B payments (%) Sizing study
Country POS adoption POS terminals per 100,000 adults GPSS
P2B electronic payments Percent of P2B payments made electronically to MSMRs (%) Sizing study
Source: Adapted from ACCRA (2021).
TABLE 9.2: Incentive Variables Analyzed in the Merchant-Level Data
Incentive Description
Merchant fiscal incentives: Subsidies for POS and tax reductions for merchants using POS
Takes the value 1 if merchant fiscal incentives are implemented and 0 otherwise.
Consumer fiscal incentives: VAT and income tax reductions for consumers using electronic payments, and lottery promotions on card usage
Takes the value 1 if consumer fiscal incentives (VAT reductions, income tax reductions) are implemented and 0 otherwise.
Mandated EPA: this includes mandated acceptance of electronic payments for some MSMRs or mandated disbursement of wages and salaries by electronic payments
Takes the value 1 if mandated acceptance of electronic payments is implemented and 0 otherwise.
Cash limits (long-term): a threshold imposed on transactions that can be paid in cash
Takes the value 1 if cash transaction limits (or significant cash disincentives) are implemented more than five years ago and 0 otherwise.
Cash limits (short-term): a threshold imposed on transactions that can be paid in cash
Takes the value 1 if cash transaction limits (or significant cash disincentives) are implemented less than five years ago and 0 otherwise.
Killer app: a mobile application concentrating a significant share of payment transactions
Takes the value 1 if a “killer app” exists for mobile payment adoption and 0 otherwise.
Source: Adapted from ACCRA (2021).
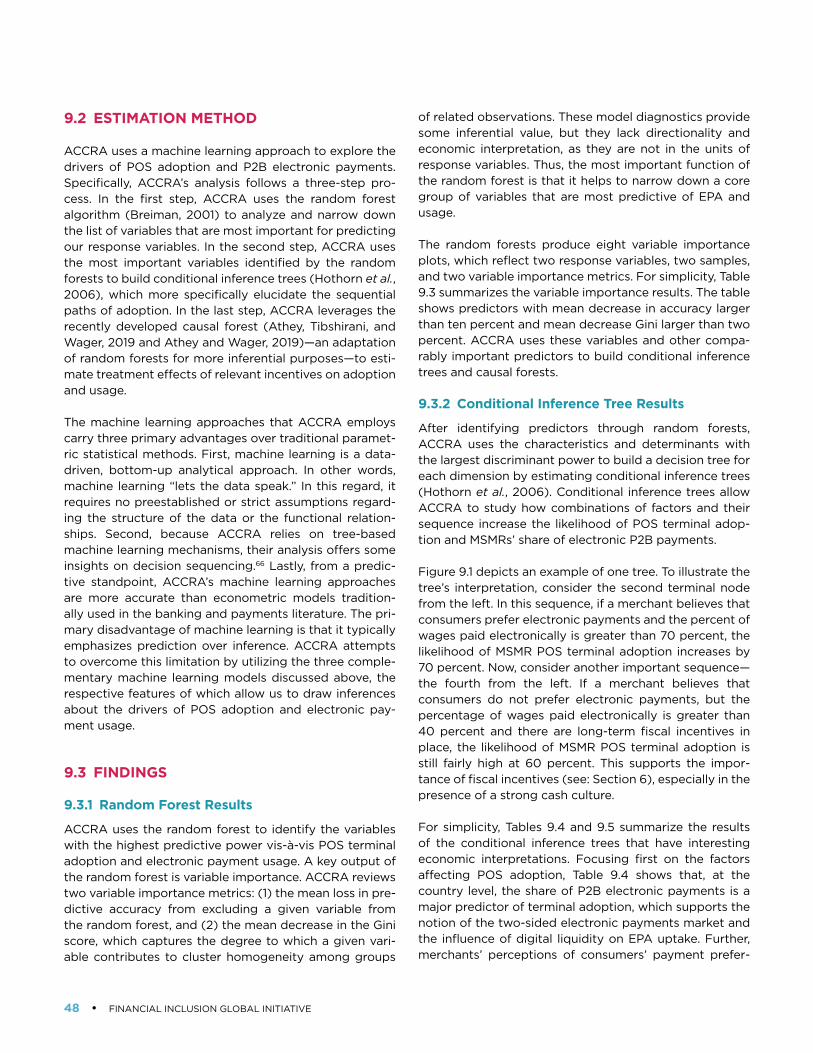
48 • FINANCIAL INCLUSION GLOBAL INITIATIVE
9.2 ESTIMATION METHOD
ACCRA uses a machine learning approach to explore the drivers of POS adoption and P2B electronic payments. Specifically, ACCRA’s analysis follows a three-step pro-cess. In the first step, ACCRA uses the random forest algorithm (Breiman, 2001) to analyze and narrow down the list of variables that are most important for predicting our response variables. In the second step, ACCRA uses the most important variables identified by the random forests to build conditional inference trees (Hothorn et al., 2006), which more specifically elucidate the sequential paths of adoption. In the last step, ACCRA leverages the recently developed causal forest (Athey, Tibshirani, and Wager, 2019 and Athey and Wager, 2019)—an adaptation of random forests for more inferential purposes—to esti-mate treatment effects of relevant incentives on adoption and usage.
The machine learning approaches that ACCRA employs carry three primary advantages over traditional paramet-ric statistical methods. First, machine learning is a data-driven, bottom-up analytical approach. In other words, machine learning “lets the data speak.” In this regard, it requires no preestablished or strict assumptions regard-ing the structure of the data or the functional relation-ships. Second, because ACCRA relies on tree-based machine learning mechanisms, their analysis offers some insights on decision sequencing.66 Lastly, from a predic-tive standpoint, ACCRA’s machine learning approaches are more accurate than econometric models tradition-ally used in the banking and payments literature. The pri-mary disadvantage of machine learning is that it typically emphasizes prediction over inference. ACCRA attempts to overcome this limitation by utilizing the three comple-mentary machine learning models discussed above, the respective features of which allow us to draw inferences about the drivers of POS adoption and electronic pay-ment usage.
9.3 FINDINGS
9.3.1 Random Forest Results
ACCRA uses the random forest to identify the variables with the highest predictive power vis-à-vis POS terminal adoption and electronic payment usage. A key output of the random forest is variable importance. ACCRA reviews two variable importance metrics: (1) the mean loss in pre-dictive accuracy from excluding a given variable from the random forest, and (2) the mean decrease in the Gini score, which captures the degree to which a given vari-able contributes to cluster homogeneity among groups
of related observations. These model diagnostics provide some inferential value, but they lack directionality and economic interpretation, as they are not in the units of response variables. Thus, the most important function of the random forest is that it helps to narrow down a core group of variables that are most predictive of EPA and usage.
The random forests produce eight variable importance plots, which reflect two response variables, two samples, and two variable importance metrics. For simplicity, Table 9.3 summarizes the variable importance results. The table shows predictors with mean decrease in accuracy larger than ten percent and mean decrease Gini larger than two percent. ACCRA uses these variables and other compa-rably important predictors to build conditional inference trees and causal forests.
9.3.2 Conditional Inference Tree Results
After identifying predictors through random forests, ACCRA uses the characteristics and determinants with the largest discriminant power to build a decision tree for each dimension by estimating conditional inference trees (Hothorn et al., 2006). Conditional inference trees allow ACCRA to study how combinations of factors and their sequence increase the likelihood of POS terminal adop-tion and MSMRs’ share of electronic P2B payments.
Figure 9.1 depicts an example of one tree. To illustrate the tree’s interpretation, consider the second terminal node from the left. In this sequence, if a merchant believes that consumers prefer electronic payments and the percent of wages paid electronically is greater than 70 percent, the likelihood of MSMR POS terminal adoption increases by 70 percent. Now, consider another important sequence—the fourth from the left. If a merchant believes that consumers do not prefer electronic payments, but the percentage of wages paid electronically is greater than 40 percent and there are long-term fiscal incentives in place, the likelihood of MSMR POS terminal adoption is still fairly high at 60 percent. This supports the impor-tance of fiscal incentives (see: Section 6), especially in the presence of a strong cash culture.
For simplicity, Tables 9.4 and 9.5 summarize the results of the conditional inference trees that have interesting economic interpretations. Focusing first on the factors affecting POS adoption, Table 9.4 shows that, at the country level, the share of P2B electronic payments is a major predictor of terminal adoption, which supports the notion of the two-sided electronic payments market and the influence of digital liquidity on EPA uptake. Further, merchants’ perceptions of consumers’ payment prefer-
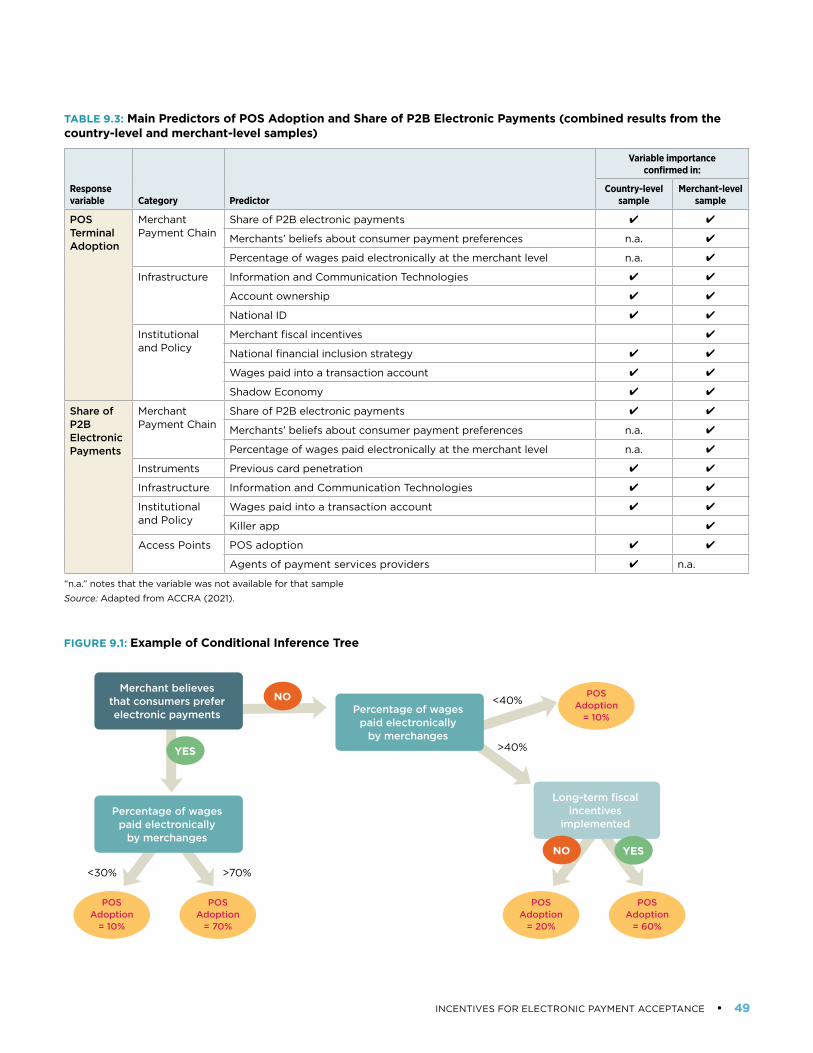
INCENTIVES FOR ELECTRONIC PAYMENT ACCEPTANCE • 49
TABLE 9.3: Main Predictors of POS Adoption and Share of P2B Electronic Payments (combined results from the country-level and merchant-level samples)
Response variable Category Predictor
Variable importance confirmed in:
Country-level sample
Merchant-level sample
POS Terminal Adoption
Merchant Payment Chain
Share of P2B electronic payments ✔ ✔
Merchants’ beliefs about consumer payment preferences n.a. ✔
Percentage of wages paid electronically at the merchant level n.a. ✔
Infrastructure Information and Communication Technologies ✔ ✔
Account ownership ✔ ✔
National ID ✔ ✔
Institutional and Policy
Merchant fiscal incentives ✔
National financial inclusion strategy ✔ ✔
Wages paid into a transaction account ✔ ✔
Shadow Economy ✔ ✔
Share of P2B Electronic Payments
Merchant Payment Chain
Share of P2B electronic payments ✔ ✔
Merchants’ beliefs about consumer payment preferences n.a. ✔
Percentage of wages paid electronically at the merchant level n.a. ✔
Instruments Previous card penetration ✔ ✔
Infrastructure Information and Communication Technologies ✔ ✔
Institutional and Policy
Wages paid into a transaction account ✔ ✔
Killer app ✔
Access Points POS adoption ✔ ✔
Agents of payment services providers ✔ n.a.
“n.a.” notes that the variable was not available for that sample
Source: Adapted from ACCRA (2021).
FIGURE 9.1: Example of Conditional Inference Tree
Merchant believes that consumers prefer electronic payments
Percentage of wages paid electronically
by merchanges
Percentage of wages paid electronically
by merchanges
Long-term fiscal incentives
implemented
NO
NO
YES
YES
>70%<30%
<40%
>40%
POS Adoption
= 10%
POS Adoption
= 20%
POS Adoption
= 70%
POS Adoption
= 60%
POS Adoption
= 10%

50 • FINANCIAL INCLUSION GLOBAL INITIATIVE
ences, electronic wage payments, transaction account ownership, and the quality of ICT infrastructures are also major predictors of POS terminal uptake. The latter three findings are consistent with many of the transaction account, infrastructure, and digital payments consider-ations addressed in Section 2.
Turning to the factors affecting the share of electronic P2B payments (Table 9.5), payment card penetration and POS terminal adoption are key predictors of electronic P2B payments. Sections 3 and 4 address measures for enhancing these elements. Non-P2B electronic payments, such as wages and supplier payments are also important predictors of electronic P2B payments, which supports the merchant payment chain considerations addressed throughout this report. ACCRA also see the importance of killer apps in predicting electronic P2B payments.
9.3.3 Causal Forest Results
Finally, ACCRA leverage the causal forest algorithm to estimate treatment effects for the top thirty predictor variables on POS terminal adoption and P2B electronic payments. Estimating treatment effects via the causal forest enables us to more specifically pinpoint the eco-nomic impact and relative effectiveness of the factors under investigation. For binary predictors (e.g., National
Financial Inclusion Strategy [0/1]), estimates represent the average treatment effect (ATE), which is given by the difference in the average outcomes between the treated (i.e., 1) and the untreated (i.e., 0) observations. For numeric predictors that have been converted to four-level variables (e.g., percent of adults with a debit card), as described in sub-Section 9.1, estimates represent the average partial effect (APE), which captures the average change in the response variable that results from moving from one level to the next in the explanatory variable.
Focusing first on the country-level sample, ACCRA groups the explanatory variables into six categories: access points, economic formality, infrastructure, institu-tional actions, instruments, and merchant payment chain. Though a wide range of variables exhibit a statistically significant impact on the response variables, six import-ant factors are generally consistent in their effect on both POS adoption and P2B electronic payments. The factors and explanations are as follows:67
• Digital banking (impact: positive): Using mobile phones or the internet to access accounts likely increases comfort with digital financial services (DFS), including electronic payments, and generally contrib-ute to the DFS ecosystem.
TABLE 9.4: Factors Influencing POS Terminal Adoption
Factors for POS Terminal Adoption Increase in Likelihood of POS Adoption
Share of P2B electronic payments and bank account ownership is above the median country (country level)
200 percent
Merchants believe consumers prefer electronic payments and wages are paid electronically (mid-high or high preference) (merchant level)
100 percent
Wages are paid electronically and combined with account ownership or with ICT infrastructures above median (country level)
100 percent
ICT or national ID implementation are over the median value and shadow economy below 15% (country level)
50 percent
Shadow economy below 25% is combined with implementing a national financial inclusion strategy or with merchant fiscal incentives (country level)
20 percent
Source: Adapted from ACCRA (2021).
TABLE 9.5: Factors Influencing Share of Electronic P2B Payments
Factor Impact on P2B Electronic Share
Wages paid electronically and card penetration in pervious 5 years are over median value (country level)
100 percent
POS terminal adoption is mid high or high (country level) 60 percent
ICT above median is combined with killer apps or with a significant use of agents of payment services providers (country level)
50-60 percent
Merchants believe consumers prefer electronic payments and electronic payments to suppliers above median value (merchant level)
30 percent
Source: Adapted from ACCRA (2021).
INCENTIVES FOR ELECTRONIC PAYMENT ACCEPTANCE • 51
• Shadow economy (impact: negative): A larger shadow economy68 increases the likelihood that MSMRs will refrain from accepting electronic payments to facilitate tax evasion. This negative effect is estimated for both POS adoption and usage.
• Transaction account ownership (impact: positive): As discussed in Section 2, in addition to serving as pay-ment instruments themselves, transaction accounts are a gateway to the most common payment instru-ments. They are estimated to increase adoption and usage.
• Wages paid electronically (impact: positive): Paying wages electronically can enhance digital liquidity, raise the cost of accessing cash, and incentivize the use of electronic payment methods. This policy is estimated to increase POS adoption and the share of P2B elec-tronic payments.
• Payment card ownership (impact: positive): Access to payment cards indirectly incentivizes POS adoption through the electronic payments market’s two-sided properties and clearly enables greater electronic pay-ment usage (see: report Section 3).
• Merchant payment chain (impact: positive): The pos-itive impact of electronic payments in the merchant payment chain supports the importance of the two-sided market and the powerful effects of digitizing merchants’ cash outflows, which likely create a virtu-ous cycle of electronic payments in MSMRs’ business models.
With the merchant-level sample, the effects of several incentive programs are tested. A few programs are esti-mated to have notable effects, for example, imposing lim-its to cash transaction (both short term and long term), fiscal incentives to consumers, a killer app, mandated acceptance of electronic payments, and merchant fis-cal incentives. All these incentive programs are statisti-cally significant in both contexts (POS terminal adoption and share of MSMR P2B electronic transactions), but the strongest and most consistent findings relate to fiscal incentives and killer applications. Specifically, consumer
and fiscal incentives are estimated to have strong positive effects on both POS terminal adoption and P2B electronic payments. This is consistent with the cases analyzed in Section 6 of the report, which suggest that well-designed fiscal incentive programs can be effective in directly and indirectly incentivizing EPA. Meanwhile, killer applications are estimated to be negatively associated with POS ter-minal adoption. This finding is consistent with the cases discussed in Section 4 of the report, which illustrates a path for leapfrogging traditional payment card methods in economies where payment card infrastructure is lack-ing but there is strong penetration of alternative tech-nologies, such as mobile phones. Regarding the share of electronic P2B payments, killer applications are estimated to display a strong positive impact as well as merchant and consumer fiscal incentives and mandated electronic payment acceptance.
9.4 KEY TAKEAWAYS
The machine learning approach presented in this section identifies the key predictors of POS terminal adoption and MSMRs’ share of electronic P2B payments, as well as the combinations of factors most associated with these outcomes. Further, the analysis estimates the economic impact and relative effectiveness of various incentives on acceptance and usage. Though there are a significant number of relevant findings, four stand out in their con-sistency and potential to incentivize EPA among MSMRs. First, in countries with low POS terminal adoption, killer applications that leverage mobile technology are found to increase electronic payment usage. Second, merchant and consumer fiscal incentives can be particularly effec-tive in enhancing EPA adoption and electronic payment usage. Third, digitizing the merchant payment chain, especially cash outflows, such as supplier and wage payments, represents a unique opportunity to create a virtuous cycle of electronic payments in the merchant payment ecosystem. Finally, advancing financial inclu-sion, in terms of greater access to transaction accounts and electronic payment instrument ownership, can drive adoption and usage of electronic payments.
52 • FINANCIAL INCLUSION GLOBAL INITIATIVE
10. Policy Recommendations
In earlier sections of this report, the impact of various public and private sector incentives on EPA and usage was analyzed. Most policymakers agree that a public-pri-vate partnership is the best path forward to increase EPA and usage. This report stresses that no single incentive alone would achieve the highest attainable EPA and elec-tronic payment usage but a combination of incentives is required. Furthermore, the maturity of the payment eco-system in terms of acceptance and usage of electronic payments within a country determines which combina-tion of incentives are likely to be the most effective. This section provides nine policy recommendations to enable greater EPA and usage.
RECOMMENDATION 1: Public authorities could encour-age greater adoption of bank and non-bank transaction accounts by consumers and merchants by increasing the diversity of product offerings with particular attention given to increasing the participation of individuals in the lower income tiers.
Traditionally, banks have offered consumers and mer-chants transaction accounts that allowed them to trans-fer funds electronically using various types of payment
instruments. Increasingly, non-bank transaction accounts are becoming popular especially in developing countries as a complement and substitute for transaction accounts at banks. Financial inclusion initiatives to increase bank and non-bank transaction account ownership have been extremely successful and are critical to increase access to and usage of electronic payment instruments.
RECOMMENDATION 2: Public authorities could encourage private sector payment solutions that may not be bank centric especially where ownership of bank accounts are low while maintaining adequate safeguards to protect the resilience of the payment system broadly, provide adequate protections to end-users and the safety and integrity of the financial system as a whole.
The provision of payment services has traditionally involved two tiers. In the first tier, central banks gener-ally provide interbank clearing and settlement services. In the second tier, banks provide payment services to consumers and businesses. Recently, a third tier has emerged where non-banks, often FinTech and big tech firms, provide payment services to consumers and busi-nesses directly. In most cases, non-banks have partnered with banks suggesting that banks remain vital to the provision of payment services. Section 4 discussed how
INCENTIVES FOR ELECTRONIC PAYMENT ACCEPTANCE • 53
mobile money systems operate where funds are either transferred between bank accounts and accounts on closed loop systems, e.g. WeChat Pay, or cash is used to load and unload value using agent networks, e.g. M-Pesa in Kenya.69
RECOMMENDATION 3: Public authorities could mandate the use of electronic payments for disbursement of gov-ernment benefits and wages and encourage electronic payment of private-sector wages. The selection of PSPs should be open and competitive to qualified entities sub-ject to proper risk controls, and end-user protections.
An incentive used by many public authorities to encour-age transaction account ownership and usage of elec-tronic payments is the mandated disbursement of government benefit payments and wages electronically. Governments may be in a better position to avail the necessary resources as payors to create the infrastruc-ture required to promote electronic payments such as implementing national IDs, encouraging the provision of low-cost transaction accounts, and improvements to their ICT infrastructures. In some cases, public author-ities have gone further and required the electronic disbursement of private sector wages. These types of government mandates increase transaction account ownership, consumer and MSMR familiarity electronic payments, and usage of electronic payments as demon-strated in Section 9.
RECOMMENDATION 4: Public authorities could encourage the development of alternative merchant infrastructures that leverage new technologies to increase acceptance.
With technological advancements and greater adop-tion of mobile phones, payment instruments that use applications on smart phones may be able to leapfrog more established payment acceptance infrastructures such as standalone POS terminals. With greater access to mobile payments, merchant acceptance technology has become less expensive, e.g. dongles that attach to mobile phones to authorize and initiate payments, and QR codes that can be used to pay with various payment instruments.
RECOMMENDATION 5: Public authorities could foster upgrade or replacement of components of the NPS rel-evant for development of fast payment systems that provide faster, more efficient, and safer retail payment mechanisms that can operate 24 hours a day/seven days a week. Due consideration should be given to allowing access to the relevant NPS components to nonbanks while maintaining sufficient risk mitigating controls.
In addition to front end payment infrastructure improve-ments, back-end improvements are also taking place to improve the speed, reliability and security of retail pay-ments, e.g. fast payment networks, discussed in Section 2. While in many cases, central banks have introduced or fostered these systems, in many cases, consumer and MSMR access to these systems has been provided by banks and new types of PSPs, such as FinTech and big tech firms.
RECOMMENDATION 6: Pricing regulations aimed at increas-ing acceptance and usage of electronic payments, if needed, should be based on the degree of market matu-rity of the payment instrument being considered, com-petition among established and emerging payment instruments, economic analysis of the impact of the price regulations on PSPs and end-users and extensive stake-holder considerations.
Given the popularity of payment cards globally, pub-lic authorities have considered many ways to increase payment card acceptance that include regulating fees, subsidizing terminals, and creating national payment card networks as discussed in sections 3-5. Many pub-lic authorities have regulated or are considering payment card fee regulation, e.g. interchange fees and merchant discount rates, as a means to increase payment card acceptance. However, regulating fees does not necessar-ily increase usage in all contexts.
RECOMMENDATION 7: Public authorities could consider lowering taxes when electronic payments are used by consumers and merchants.
One of the barriers identified throughout the broader EPA Package is the lack of formalization of businesses. However, if taxes are too high, businesses may be reluc-tant to formalize resulting in low acceptance of electronic payments. As discussed in Section 6, some public author-ities have implemented policies that lower taxes for mer-chants and consumers along with other incentives such as lotteries to increase EPA and usage. However, lowering taxes to encourage electronic payments may turn out to increase overall government tax revenue while provid-ing consumers and merchants a safer and more efficient payment instrument than cash. On the other hand, public authorities may have to find other types of taxes to offset potential revenue shortfalls of such policies.
RECOMMENDATION 8: When considering cash disincentives to decrease illicit and other untaxed transactions, public authorities could consider the positive impact of these policies on EPA and usage of electronic transactions.
54 • FINANCIAL INCLUSION GLOBAL INITIATIVE
Many public authorities have implemented cash disin-centive policies as discussed in Section 7. These policies include placing cash thresholds on transactions, man-dating electronic payment acceptance, and eliminating large denomination notes permanently or temporarily. The empirical analysis suggests that these policies are generally effective to increase EPA and usage. However, enforcement of some of these measures may be difficult.70
RECOMMENDATION 9: Public authorities should support a level playing field between banks and non-banks in the provision of value-added services that improve business intelligence and MSMRs access to financial products.
Section 8 discussed value-added service that are gener-ally provided by non-bank PSPs although some of these entities have considered acquiring bank charters. The provision of value-added services is generally centered around payments data that provides valuable insights to various functions of the merchant enterprise including marketing, human resources, finance, information tech-nology, and sales. These value-added services provide additional competition and complementarities between banks and non-banks regarding the sharing of data, provision of financial services broadly, and the regula-tory treatment of similar products offered by banks and non-banks.
INCENTIVES FOR ELECTRONIC PAYMENT ACCEPTANCE • 55
References
Accion, “Tienda Pago Closes Series A to Boost Access to Financing for Small Merchants in Latin America,” Press Release, April 3, 2018.
Agarwal, Sumit, Sujit Chakravorti, and Anna Lunn (2010), “Why Do Banks Reward Their Customers to Usage Their Credit Cards?” Federal Reserve Bank of Chicago Working Paper No. 2010-19.
Allen, Jeff, Santiago Carbó-Valverde, Sujit Chakravorti, Francisco Rodriguez Fernandez, Oya Pinar Ardic (2021), “Assessing Incentives to Increase Digital Payment Acceptance and Usage: A Machine Learning Approach,” Mimeo.
Amromin, Gene and Sujit Chakravorti (2009), “Whither Loose Change?: The Diminishing Demand for Small Denomination Currency,” Journal of Money, Credit, and Banking, 41 (2-3), 315-335.
Ardizzi, Guerino, Carmelo Petraglia, Massimiliano Piacenza, and Gilberto Turati (2014), “Measuring the Underground Economy with the Currency Demand Approach: A Reinterpretation of the Methodology, with an Application to Italy,” Review of Income and Wealth, 60 (1), 747–772.
Athey, Susan, Julie Tibshirani, and Stefan Wager (2019), “Generalized Random Forests,” Annals of Statistics, 47 (2), 1148–1178.
Athey, Susan, and Stefan Wager (2019), “Estimating Treatment Effects with Causal Forests : An Application,” Working Paper No. 3786.
Aveni, Tyler and Joep Roest (2018), “What Can Mobile Money Make Possible? China Has Many Answers,” Consultative Group to Assist the Poor Blog, January 11, can be viewed -https://www.cgap.org/blog/what-can-mobile-money-make-possible-china-has-many-answers, accessed on April 26, 2020.
Bank Negara Malaysia (BNM) (2020), “Payment Statistics - Electronic Payments: Volume and Value of Transactions & Number of Cards and Users of Payment Instruments, Number of Cards and Users of Payment Instruments, Basic Payments Indicator,” available at https://www.bnm.gov.my/index.php?ch=ps&pg=ps_stats&lang=en, accessed on June 24, 2020.
Bank Negara Malaysia (BNM) (2020a), “Payment Statistics - Number of Electronic Fund Transfer at Point-of-Sale (EFTPOS) Terminals,” available at: https://www.bnm.gov.my/index.php?ch=ps&pg=ps_stats&lang=en, accessed on June 24, 2020.
Bank Negara Malaysia (BNM) (2020b), “BNM Annual Report 19,” available at https://www.bnm.gov.my/ar2019/files/ar2019_en_full.pdf, accessed on June 25, 2020.
Bank Negara Malaysia (BNM) (2019), “The Financial Stability and Payment Systems Report 2018,” available at https://www.bnm.gov.my/files/publication/fsps/en/2018/fs2018_book.pdf, accessed on June 18, 2020.
Bank Negara Malaysia (BNM) (2014), “Payment Card Reform Framework,” available at https://www.bnm.gov.my/guidelines/50_others/Payment_Card_Reform_Framework.pdf, last accessed June 18, 2020.
Bank Negara Malaysia (2011), “Financial Sector Blueprint 2011-2020,” available at https://www.bnm.gov.my/files/publication/fsbp/en/BNM_FSBP_FULL_en.pdf, accessed on June 23, 2020.
Bank of Spain, Interchange Fees and Merchant Service Charges, https://www.bde.es/bde/en/areas/supervision/informacion-publ/tasas-de-descuen/Tasas_de_interc_9fb1a1fec58d051.html#:~:text=The%20limits%20of%20the%20interchange,%25%20and%200.2%20%25%2C%20respectively, visited 10/27/2020.
56 • FINANCIAL INCLUSION GLOBAL INITIATIVE
Bary, Emily (2020), “Mastercard’s Next CEO Sees Big World Beyond Cards After Latest Real-Time Payments Deal,” Marketwatch, November 12.
Bech, Morten and Jenny Hancock (2020), “Innovations in Payments,” BIS Quarterly Review, March, 21-36.
Bech, Morten, Yuuki Shimizu, and Paul Wong (2017), “The Quest for Speed in Payments,” BIS Quarterly Review, March, 57-68.
Blazyte, Agne (2019), Mobile Payment Market Share in China 2011-2019, available at https://www.statista.com/statistics/1050151/china-market-share-of-mobile-payments/, accessed on July 7, 2020.
Bokhari, Nurul A. M. (2016), “Strategy to Accelerate Migration to e-Payments in Malaysia,” Payment System Policy Department, Bank Negara Malaysia, Global Payments Week, 20 September, Malaysia.
Breiman, Leo (2001), “Random Forests,” Machine Learning, 45 (1), 5–32.
Carbó-Valverde, Santiago, Sujit Chakravorti, and Francisco Rodriguez Fernandez (2016), “The Effects of Interchange Fees on Adoption and Usage in Two-Sided Markets: An Empirical Investigation on Payment Cards,” Review of Economics of Statistics, 98 (2), 367-381.
Carbó-Valverde, Santiago, David Humphrey, and Rafael Lopez del Paso (2003), “The Falling Share of Cash Payments in Spain,” Moneda y Credito, 217, 167-190.
Carbó-Valverde, Santiago and Jose M. Linares-Zegarra (2011), “How Effective Are Rewards Programs in Promoting Payment Card Usage? Empirical Evidence,” Journal of Banking and Finance, 35, 3275-3291.
Castellanos, S. G. and D. Garrido (2010), “Tenencia y uso de tarjetas de credito en Mexico. Un análisis de los datos de la encuesta nacional de ingresos y gastos de los hogares 2006,” El Trimestre Económico, 305, 69-103
Central Bank of Kenya (2020), Statistics, National Payment Systems, available at https://www.centralbank.go.ke/, accessed on May 18, 2020.
Central Bank of Kenya (2018), “Mobile money inter-operability,” Press release, available at https://www.centralbank.go.ke/uploads/press_releases/1648360391_Press%20Release%20-%20Mobile%20Money%20Interoperability.pdf, accessed on May 21, 2020.
Central Bank of the Republic of Turkey (CBRT) (2020), Regulation on the Generation and Use of TR QR Code in Payment Services, August. https://www.resmigazete.gov.tr/eskiler/2020/08/20200821-4.htm.
Central Bank Republic of Turkey, Electronic Fund Transfer System-Electronic Securities Transfer System-The Instant and Continuous Transfer of Funds (FAST) System, accessed at: https://www.tcmb.gov.tr/wps/wcm/connect/EN/TCMB+EN/Main+Menu/Core+Functions/Payment+Systems/Payment+Systems+in+Turkey/Electronic+Fund+Transfer+System+and+Electronic+ Securities+Transfer+System.
Chakravorti, Sujit and Victor Lubasi (2006), “Payment Instrument Choice: The Case of Prepaid Cards,” Federal Reserve Bank of Chicago Economic Perspectives, 2nd Qtr, 29-43.
Chien, Jennifer and Luan Zhao (2017), Financial Sector Assessment Program: People’s Republic of China, Financial Inclusion, Technical Note, The World Bank Group, Finance and Markets Global Practice, December.
China Banking News (2020), “Online Payments Transactions Processed by Chinese Banks Rise 37.14% YoY in 2019, Mobile Payments Up 67.57%, China Banking News, March, available at: http://www.chinabankingnews.com/2020/03/19/chinas-online-payments-transactions-rise-37-14-yoy-in-2019-mobile-payments-up-67-57/, accessed on June 23, 2020.
Ching, Andrew T. and Fumiko Hayashi (2010), “Payment card rewards programs and consumer payment choice,” Journal of Banking & Finance, 34, 1773-1787.
Chorzempa, Martin (2018a), “How China Got a Head Start in Fintech, and Why the West Won’t Catch Up,” MIT Technology Review, December 19, available at https://www.technologyreview.com/2018/12/19/138354/how-china-got-a-head-start-in-fintech-and-why-the-west-wont-catch-up/
Chorzempa, Martin (2018b), “How China Leapfrogged Ahead of the United States in the Fintech Race,” China Economic Watch, Peterson Institute for International Economics Blog, April 26 available at: https://www.piie.com/blogs/china-economic-watch/how-china-leapfrogged-ahead-united-states-fintech-race
Clark, Sarah (2020), “PayPal Rolls Out QR Payments to 28 Countries around the World,” NFCW, available at https://www.nfcw.com/2020/05/19/366591/paypal-rolls-out-qr-payments-to-28-countries-around-the-world/, accessed on June 10, 2020.
Committee on Payments and Market Infrastructures (CPMI) (2020), “Payments and Financial Market Infrastructures,” (Comparative Tables, Retail payment services and instruments), BIS statistics explorer.
Committee on Payments and Market Infrastructures (CPMI) (2016), Fast Payments, Bank for International Settlements, November.
Committee on Payments and Market Infrastructures (CPMI) and World Bank (WB) (2020), Payment Aspects of Financial Inclusion in the Fintech Era, Bank for International Settlements and World Bank Group, April.
Committee on Payments and Market Infrastructures (CPMI) and World Bank Group (WBG) (2016), Payment Aspects of Financial Inclusion, Bank for International Settlements and World Bank Group, April.
Committee on Payment and Settlement Systems (CPSS) (2012), Payment, Clearing, and Settlement Systems in Turkey, CPSS Red Book.
Communication Authority Kenya (2020), “Second quarter sector statistics report for the financial year (October-December 2019),” available at https://ca.go.ke/wp-content/uploads/2020/03/Sector-Statistics-Report-Q2-2019-2020-1.pdf, accessed on May 21, 2020.
Consultative Group to Assist the Poor (CGAP) (2019a), “China: A Digital Payments Revolution,” CGAP Research & Analysis Publication, September, available at: https://www.cgap.org/research/publication/china-digital-payments-revolution, accessed on May 12, 2020.
Consultative Group to Assist the Poor (CGAP) (2019b), “Elements of a Successful Loyalty Model in Merchant Payments,” CGAP Research & Analysis Publication, October.
Consultative Group to Assist the Poor (CGAP) and Dalberg (2017), Merchant Payments: VAS Playbook, available at: https://www.cgap.org/research/slide-deck/merchant-payments-vas-playbook, accessed on August 27, 2020.
Cook, William and Claudia McKay (2017), Banking in the M-Pesa Age, CGAP Working Paper. September.

INCENTIVES FOR ELECTRONIC PAYMENT ACCEPTANCE • 57
Edgar, Dunn & Company (EDC). 2015. Turkey – Advanced Payments Report: A Vision for the Future.
European Central Bank (ECB) (2001), Blue Book, https://www.ecb.europa.eu/paym/pdf/market/blue/bluebook2001.pdf?a11d890e9934188f9ebf54083c16f4d5.
FinAccess House-Hold Survey Report (2019), National Bureau of Statistics & Financial Sector Deepening, Central Bank of Kenya, Kenya – April.
Financial Access in Kenya – Results of 2006 National Survey (2007) – by Financial Sector Deepening, Kenya – October.
Financial Action Task Force (2015), “Money Laundering Through the Physical Transportation of Cash,” Financial Action Task Force (FATF) Report, October. https://www.fatf-gafi.org/media/fatf/documents/reports/money-laundering-through-transportation-cash.pdf
Global Partnership for Financial Inclusion (GPFI) (2018), G20 Digital Identity Onboarding, Washington, DC: World Bank.
Goodshore, Chloe (2020), “Square Capital Review 2021: Merchant Cash Advances by Another Name,” business.org, December 18.
Government of India, Pradhan Mantri Jan Dhan Yojana, available at: https://www.pmjdy.gov.in/scheme#:~:text=One%20basic%20savings%20bank%20account,provided%20to%20PMJDY%20account%20holder, accessed on April 29, 2021.
Government of India Direct Benefit Transfer (2020), available at https://dbtbharat.gov.in/, accessed on May 18, 2020.
Govil, Sameer (2016), Perspectives on Accelerating Global Payment Acceptance, Visa.
Han, Pengfei and Zhu Wang (2021), “Technology Adoption and Leapfrogging: Racing for Mobile Payments,” SSRN Working Paper.
Hayashi, Fumiko and Jesse Leigh Maniff (2019), Public Authority Involvement in Payment Card Markets: Various Countries, Kansas City, MO: Federal Reserve Bank of Kansas City, August.
Hinchliffe, Ruby (2020), “Ghana Becomes First African Country to Introduce Universal QR Code,” Fintech Futures, May 15.
Hothorn, T., Hornik, K., Van DeWiel, M. A., and Zeileis, A. (2006), “A Lego System for Conditional Inference,” The American Statistician, 60(3), 257–263.
India Today (2019), “Over 125 Crore People now Have AADHAAR Cards: Government,” India Today, December 27, available at: https://www.indiatoday.in/india/story/over-125-crore-people-now-have-AADHAAR-cards-government-1631952-2019-12-27, accessed on May 18, 2020.
International Finance Corporation (IFC) (2017), “MSME Finance Gap: Assessment of the Shortfalls and Opportunities in Financing Micro, Small and Medium Enterprises in Emerging Markets.” https://www.smefinanceforum.org/sites/default/files/Data%20Sites%20downloads/MSME%20Report.pdf
JP Morgan (2019), 2019 Global Payments Trends Report - Turkey Country Insights, https://www.jpmorgan.com/merchant-services/insights/reports/turkey.
Kaffenberger, Michelle (2014), Digital Pathways to Financial Inclusion: Findings from the First FII Track Survey in Kenya, Intermedia: Financial Inclusion Insights, July.
Lacy, Sarah (2013), “Kopo Kopo: Building the “Square of Africa” Amid Terrorism, Monopolists, and Huge Opportunity,” Pando, November 11, can be accessed at https://pando.com/2013/11/11/kopo-kopo-building-the-square-of-africa-amid-terrorism-monopolists-and-huge-opportunity/.
Leong, Teo Wing (2018), “Payment Card Reform Framework (PCRF): A Policy Evaluation Study,” Institute for Democracy and Economic Affairs, available at http://www.ideas.org.my/wp-content/uploads/2018/06/PI48-Payment-Card-Reform-Framework.pdf, accessed June 30, 2020.
Ligon, Ethen, Badal Malick, Ketki Sheth, and Carley Trachtman (2019), “What Explains Low Adoption of Digital Payment Technologies? Evidence from Small Scale Merchants in Jaipur, India,” PLoS ONE, 14 (7):e0219450.
Luang, Hsin-Wei (2019), “What Is Square & How Does It Work?” Merchant Maverick Blog, December 16, available at: https://www.merchantmaverick.com/what-is-square/#:~:text=Square’s%20Value%2DAdded%20Services,manage%20your%20employees%20from%20anywhere., accessed July 2, 2020.
Lubasi, Victor (2005), “Debit Card Competition: Signature versus PIN,” Federal Reserve Bank of Chicago Fed Letter, no. 221, December.
Muthiora, Brian (2015), Enabling Mobile Money Policies in Kenya: Fostering a Digital Financial Revolution, GSMA, January.
National Payments Corporation of India (NPCI) (2020), Retail Payment System Statistics on NPCI Platforms, available at www.npci.org.in/statistics, accessed on May 18, 2020.
National Payments Corporation of India (NPCI) (2019a), Rationalisation of BHIM UPI MDR, available at: https://www.npci.org.in/sites/default/files/Press%20release%20Rationalisation%20of%20BHIM%20UPI%20MDR.pdf, accessed on June 18, 2020.
National Payments Corporation of India (NPCI) (2019b), Introduction of P2PM Category in UPI for Unorganized or Small Merchants, available at: https://www.npci.org.in/sites/default/files/circular/Circular%2070%20-%20Introduction%20of%20P2PM%20category%20in%20UPI%20for%20unorganised%20or%20small%20merchants.pdf, accessed on June 18, 2020.
Nautiyal, Anant, Bart-Jan Pors, Bruno Martins, Vaughan Collie, Akihiro Ishizuka, and Jannen Vamadeva. 2020. QR Code Merchant Payments: A Growth Opportunity for Mobile Money Providers. GSMA, Accourt, and NTT Data. https://www.gsma.com/mobilefordevelopment/wp-content/uploads/2020/08/QR-Code-Merchant-Payments-A-growth-opportunity-for-mobile-money-providers-incl-full-appendices.pdf.
Ndung’u, Njuguna (2019), “Digital Technology and State Capacity in Kenya,” Centre for Global Development Policy Paper 154, August.
Negrin, J. L. (2005), “The Regulation of Payment Cards: The Mexican Experience,” Review of Network Economics, 4 (4), 1-13.
Nilekani, Nandan, Harun Khan, Kishore Sansi, Aruna Sharma, and Sanjay Jain (2019), Report of the High Level Committee on Deepening of Digital Payments, May. https://rbidocs. rbi.org.in/rdocs/PublicationReport/Pdfs/CDDP0306201963 4B0EEF3F7144C3B65360B280E420AC.PDF
Ohnsorge, F. and S. Yu (2021), The Long Shadow of Informality: Challenges and Policies, The World Bank.
Prior, F. and J. Santomá (2010), “Improving Access to Financial Services through Mobile Financial Services,” IESE Study 2017-130.
Raman, Anand (2018), “India Moves Toward Universal Financial Inclusion,” CGAP August 2018 Blog, available at https://www.cgap.org/blog/india-moves-toward-universal-financial-inclusion, accessed on May 18, 2020.
58 • FINANCIAL INCLUSION GLOBAL INITIATIVE
Reserve Bank of Australia (RBA) (2016), “Review of Payments Card Regulation: Conclusions Paper,” May, https://www.rba.gov.au/payments-and-infrastructure/review-of-card-payments-regulation/pdf/review-of-card-payments-regulation-conclusions-paper-2016-05.pdf, accessed May 25, 2021.
Reserve Bank of India (RBI) (2020a), Assessment of the Progress of Digitisation from Cash to Electronic, available at https://rbidocs.rbi.org.in/rdocs/Publications/PDFs/CASHB74203395BD64E2ABC1BD5F68D8AEF13.PDF, accessed June 25, 2020.
Reserve Bank of India (RBI) (2020b), Database on India Economy, Payment System Indicators, available at https://dbie.rbi.org.in/DBIE/dbie.rbi?site=home, accessed, May 18, 2020.
Reserve Bank of India (RBI) (2019), RBI Annual Report for 2018-19, available at https://rbidocs.rbi.org.in/rdocs/AnnualReport/PDFs/0ANNUALREPORT2018193CB8CB2D3DEE4EFA 8D6F0F6BD624CEDE.PDF, accessed on May 18, 2020.
Reserve Bank of India (RBI) (2016a), Concept Paper on Card Acceptance Infrastructure, Department of Payment and Settlement Systems, Central Office, Mumbai.
Reserve Bank of India (RBI) (2016b), “Special Measures up to March 31, 2017: Rationalisation of Merchant Discount Rate (MDR) for Transactions up to ₹ 2000/-,” available at: https://www.rbi.org.in/Scripts/NotificationUser.aspx?Id=10780&Mode=0, accessed on June 18, 2020.
Reserve Bank of India (RBI) (2012), “Merchant Discount Rates Structure for Debit Card Transactions,” available at: https://www.rbi.org.in/Scripts/NotificationUser.aspx?Id=7304&Mode=0, accessed on June 18, 2020.
Safaricom, n.d.a. Lipa Na M-Pesa Do More Consumer Promotion, https://www.safaricom.co.ke/faqs/faq/699, accessed May 13, 2021.
Safaricom, n.d.b. Lipa Na M-Pesa Do More Merchant Promotion, https://www.safaricom.co.ke/faqs/faq/701, accessed May 13, 2021.
Sands, Peter, Haylea Campbell, Tom Keatinge, and Ben Weisman (2017), “Limiting the Use of Cash for Big Purchases Assessing the Case for Uniform Cash Thresholds,” M-RCBG Associate Working Paper Series, No. 80, Harvard Kennedy School.
Sands, Peter, Ben Weisman, Maja Sostaric, Alex Smith, Joel Smoot, Ofir Zigelman and Joel Mathur (2016), “Making it Harder for the Bad Guys: The Case for Eliminating High Denomination Notes,” Mossavar-Rahmani Center for Business and Government M-RCGB Associate Working Paper Series (No. 52), February.
Shapshak, Toby (2017), “Fintech Startup Yoco Is Making Payments in South Africa Go Mobile,” Forbes, October 4, 2017.
Smith, George (2019), “Everything You Need to Know about UnionPay,” Payscout Blog, July 31, available at: https://blog.payscout.com/everything-you-need-to-know-about-unionpay/, visited on June 22, 2020.
Statista (2020), Digital Market Outlook, available at: https://www.statista.com/outlook/digital-markets, accessed on April 30, 2021.
Sung, Myung Jae, Rajul Awasthi, and Hyung Chul Lee (2017), “Can Tax Incentives for Electronic Payments Reduce the Shadow Economy?” World Bank Policy Research Paper 7936, January.
Tencent Holdings Limited (2020), 2019 Annual Report, <need to complete citation>.
The Economist (2005), Assessing Payments Systems in Latin America, The Economist Intelligence Unit.
Toksabay, Ece. 2013. “Turkey Targets Credit Cards in Battle to Cut Current Account Gap.” Reuters. October 9. https://www.reuters.com/article/turkey-banks/turkey-targets-credit-cards-in-battle-to-cut-current-account-gap-idUSL6N0HZ09B20131009.
TROY, Products and Technologies, https://troyodeme.com/en/product-and-technologies.
TROY (2019), “Turkish Card Payment Market Report: 2018 Yearly Assessment. February,” accessed at https://image.troyodeme.com//File/turkish-card-payment-market-report_issue-3_final-k6Z5Tfz2.pdf.
UnionPay International (visited date, 2020), “UnionPay Service Now Covers 176 Countries and Regions, Creating a Global Payment Network,” on company website, available at: http://www.unionpayintl.com/en/mediaCenter/newsCenter/companyNews/5682.shtml, accessed June 22, 2020.
Villasenor, John D., Darrell M. West, and Robin J. Lewis (2015), The 2015 Brookings Financial and Digital Inclusion Project Report: Measuring Progress on Financial Access and Usage, Center for Technology Innovation at Brookings. August.
Wang, G., Zeng, G. and X. Xiaoying (2017), Development of Consumer Finance in East Asia, Palgrave McMillan.
Wills, Adam (2014), Case Study: Kopo Kopo, GSMA Intelligence, April.
World Bank, Global Findex Database, available at: https://globalfindex.worldbank.org/.
World Bank (2012). Developing a Comprehensive National Retail Payments Strategy. Washington, D.C.: World Bank.
World Bank (2022a). Guidance for the Implementation of Electronic Payment Acceptance Reforms. Washington, D.C.: World Bank. Forthcoming.
World Bank (2022b). Electronic Payments Acceptance: Assessment Guide. Washington, D.C.: World Bank. Forthcoming.
World Bank (2022c). Innovations in Electronic Payment Acceptance. Washington, D.C.: World Bank. Forthcoming.
World Bank (2022d). Regulatory Aspects of Intermediaries in Electronic Payment Acceptance. Washington, DC: World Bank. Forthcoming.
World Bank Group (WBG) (2020), Digital Financial Services, April.
World Bank Group (WBG) (2016), Cash vs. Electronic Payments in Small Retailing: Estimating the Global Size, Washington DC: International Bank for Reconstruction and Development/The World Bank.
World Bank Group (WBG) and The People’s Bank of China (PBOC) (2018), Toward Universal Financial Inclusion in China: Models, Challenges, and Global Lessons, International Bank for Reconstruction and Development/The World Bank and the People’s Bank of China, February.
Yoco (2019), Unlocking Digital Merchant Payments in Africa: How to Accelerate the Development of a Cashless Society, available at https://robust-move.flywheelsites.com/wp-content/uploads/2019/12/Unlocking-Digital-Merchant-Payments-in-Africa.pdf, accessed June 12, 2020.
Zetterli, Peter and Ben Lyon (2015), “How to Drive Merchant Payments? Build Solutions Merchants Want,” CGAP Blog, August 3.
INCENTIVES FOR ELECTRONIC PAYMENT ACCEPTANCE • 59
There are three main types of payment cards—credit, debit, and prepaid. Credit cards are payment cards directly linked to a line of credit possessed by the cardholder. Set-tling credit card balances is fairly flexible, in the sense that, within the boundaries of a prearranged credit limit, card-holders have the option of settling the full balance at the end of the period, part of the balance at the end of the period, or other amounts throughout the billing period.71 While credit cards are popular in many advanced econo-mies, e.g. Australia and the United States, the number of credit cardholders is generally small and limited to rela-tively wealthy individuals in many developing countries.
Debit cards are linked to cardholders’ transaction accounts, and the full amount of each purchase is typi-cally deducted from the account at the time of the trans-action.72 Developed primarily for consumers to access cash, ATM networks leveraged their infrastructure to provide customers access to their transaction accounts
ANNEX 1
Types of Payment Cards
at the point of sale.73 In addition, popular credit card net-works, such as Mastercard and Visa, also process debit card transactions across their networks.74 Many govern-ments view debit cards as an essential product for finan-cial inclusion.
Prepaid cards are preloaded with funds that can be used at merchant locations. As mentioned in Section 2, prepaid cards can be classified as e-money instruments because funds are preloaded onto a card not linked to a bank account. Prepaid cards can also be described as pay-ment cards because of the card form factor and the use of payment card rails. Prepaid cards can be branded by a payment network or issued by one or a set of merchants. Branded prepaid cards are accepted where the payment brand is accepted, e.g. American Express, MasterCard, or Visa. In many cases, prepaid cards are funded by govern-ments, employers, or gift givers instead of the cardhold-ers themselves.75
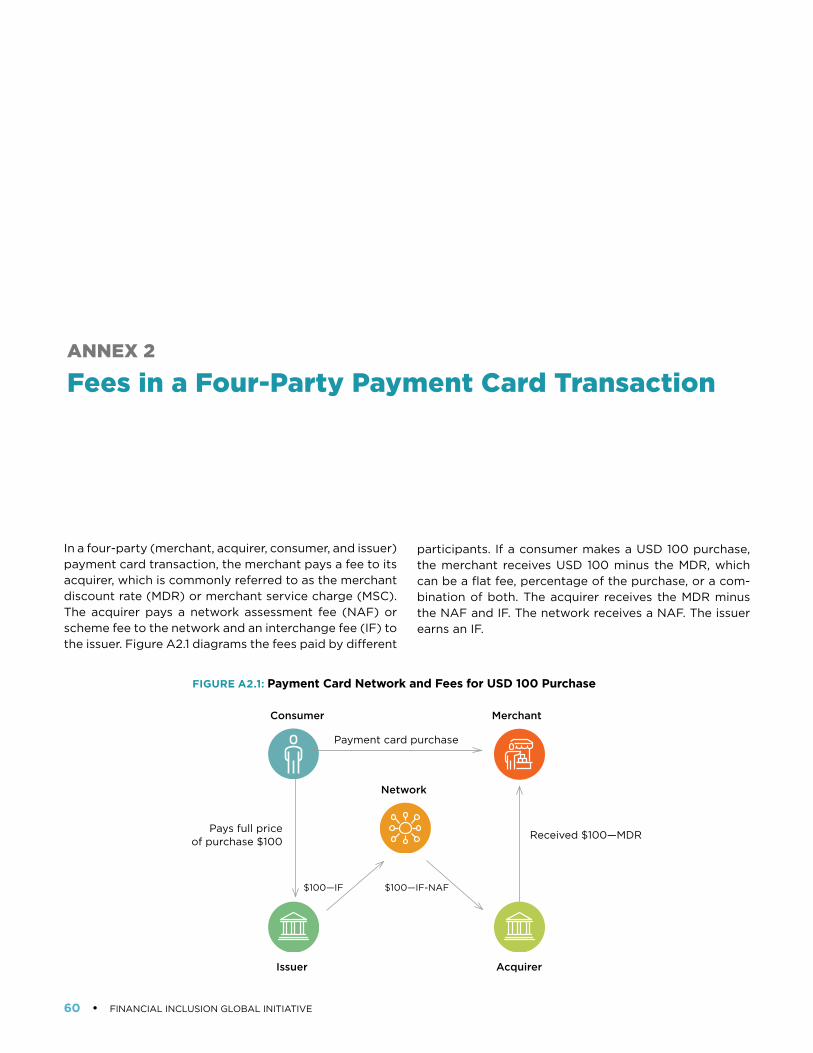
60 • FINANCIAL INCLUSION GLOBAL INITIATIVE
ANNEX 2
Fees in a Four-Party Payment Card Transaction
In a four-party (merchant, acquirer, consumer, and issuer) payment card transaction, the merchant pays a fee to its acquirer, which is commonly referred to as the merchant discount rate (MDR) or merchant service charge (MSC). The acquirer pays a network assessment fee (NAF) or scheme fee to the network and an interchange fee (IF) to the issuer. Figure A2.1 diagrams the fees paid by different
participants. If a consumer makes a USD 100 purchase, the merchant receives USD 100 minus the MDR, which can be a flat fee, percentage of the purchase, or a com-bination of both. The acquirer receives the MDR minus the NAF and IF. The network receives a NAF. The issuer earns an IF.
FIGURE A2.1: Payment Card Network and Fees for USD 100 Purchase
Consumer
Issuer Acquirer
Merchant
Network
Pays full priceof purchase $100
Payment card purchase
$100—IF-NAF$100—IF
Received $100—MDR
INCENTIVES FOR ELECTRONIC PAYMENT ACCEPTANCE • 61
Notes
1. World Bank’s Universal Financial Access (UFA) initiative emphasizes the importance of digitalization of all these types of payments for purposes of financial inclusion. World Bank’s ID4D initiative stresses having a unique ID as a key to participation in economic activities, and in particular in the digital economy, and the regulated financial sector. World Bank’s G2Px initiative focuses on digitalization of social safety net payments for purposes of financial inclusion and women’s empowerment. The We-Fi initiative focuses on women-owned enterprises and among others, digitalization of their processes, including use of financial services.
2. The EPA Package is drafted by the World Bank as part of its activities under the Financial Inclusion Global Initiative (FIGI) program, for the FIGI Electronic Payments Acceptance (EPA) Working Group.
3. The EPA Package consists of Guidance for the Implementation of Electronic Payment Acceptance Reforms; Electronic Payments Acceptance Assessment Guide; Incentives for Electronic Payments Acceptance (this report); Innovations in Electronic Payments Acceptance; and Regulatory Aspects of Intermediaries in Electronic Payments Acceptance (World Bank 2022a-d).
4. In this report, micro retailers employ between 1 and 5 people. Small retailers employ between 6 to 25 people. Medium retailers employ between 26 and 100 people. These definitions are consistent with WBG (2016).
5. This report should be read in conjunction with three other components of the EPA Package: the Guidance Report, the Assessment Guide, the Innovations Report, and the Intermediaries Report (World Bank, 2022a-d).
6. World Bank (2022b).7. Figure 1.1 can also be adapted to diagram payments from
MSMRs to workers and suppliers. 8. Demirguc-Kunt et al. (2018).9. Please see World Economic Forum (WEF) and World Bank
Group (2016) for an earlier assessment of this.10. One of the main goals driving cash disincentives is to reduce
the shadow economy and increase government tax revenue.11. For discussion of transaction account ownership and
financial inclusion more broadly, see CPMI and WBG (2020 and 2016). For discussion of infrastructure, see World Bank (2022b).
12. This section generally refers to regulated deposit-taking institutions as banking institutions or banks. This broadly also includes other financial institutions, which engage in banking activities, such as credit unions, savings and loans associations, and cooperatives (CPMI and WBG, 2016).
13. The World Bank, ID4D, http://id4d.worldbank.org/global-dataset/visualization.
14. Big technology companies with large communication networks such as Apple, Facebook, Google, and WeChat have leveraged their messaging systems to provide payment services. Telecommunications companies also operate payment platforms, e.g. Safaricom in Kenya.
15. This report does not discuss digital currencies issued by central banks or non-government issued cryptocurrencies because their use at MSMRs remains negligible.
16. Bech and Hancock (2020) describe the front end as where payments are initiated and the bank end as where the payments are cleared and settled.
62 • FINANCIAL INCLUSION GLOBAL INITIATIVE
17. Retail payments are generally purchases made by consumers and businesses and wholesale payments occur among financial institutions (Bech and Hancock, 2020).
18. Later sections also discuss other initiatives such as terminal subsidies, tax incentives, and lotteries to increase payment card acceptance and usage.
19. See Hayashi and Maniff (2019) for a summary of payment card regulations in different jurisdictions.
20. Governments may subsidize transactions accounts that offer debit cards to promote greater financial inclusion. While such policies are effective in increasing adoption, cardholders may be reluctant to use their debit cards to make purchases and merchants may be reluctant to accept them.
21. Section 8 discusses value-added services as an incentive to EPA.
22. For more discussion on payment aggregators and their role in improving electronic payments acceptance, please see the “EPA Intermediaries Report.”
23. PayPal also acquired Braintree and Venmo that continue to operate under their own branding although identified as PayPal companies. Braintree serves as a merchant acquirer that is generally preferred by larger merchants than PayPal. Venmo is primarily a P2P network that is primarily used among trusted parties and only operates in the United States.
24. World Bank 2022c and 2022d.25. Yoco (2019) reports that the merchant discount rate for
payment cards is 2.5 percent.26. In Section 9, we provide empirical evidence that such
government programs are effective in increasing MSMR adoption and digital payment usage.
27. WBG (2020) discusses the success of the first Bank of Thailand’s regulatory sandbox innovations where the industry created the PromptPay interoperable QR code. By mid-2019, there were 3.7 million merchants accepting PromptPay QR payments compared to 140,000 merchants accepting cards.
28. There are other initiatives to improve financial inclusion and payment infrastructure of the 40 percent of the population that live in rural areas. See WBG and PBOC (2018) for more details.
29. Credit cards are not as popular in China comprising less than 10 percent of payment card issuance (China Banking News, 2020).
30. Formerly known as China UnionPay.31. For smartphone penetration data, see Statista (2020).32. Founded in 1999, Alibaba a multinational technology
conglomerate specializing in eCommerce, retail, internet and technology, built their own payment networks. Jack Ma manages both Alibaba and Ant Financial.
33. Founded in 1998, Tencent is a large conglomerate of interrelated products including one of the most popular social media platforms in the world, WeChat.
34. A full account of M-Pesa’s development and success is covered extensively elsewhere (e.g., Kaffenberger, 2014; Muthiora, 2015; Villasenor, West, and Lewis 2015; and Cook and McKay, 2017) and is beyond the scope of this analysis.
35. However, banks play an important role because Kenyan mobile payment platforms are required to hold the value of their mobile money in circulation in banks.
36. A digital ID program, Huduma Namba (“service number”) was started. However, this program ran into many issues. In early 2020, the High Court of Kenya provided the permission for the Government of Kenya to proceed.
37. It is important to note, however, that the near-monopoly of M-Pesa in Kenya also creates challenges, for example, in the form of systemic risks. The availability of M-Pesa transactions depends on the availability of Safaricom network. For example, in December 2018, the network suffered an outage and commerce in Kenya came to a halt.
38. During 2019-2020, a sum of INR 2,230 trillion (USD 30.5 billion) was disbursed for DBT to bank accounts for about 700 million beneficiaries by GOI schemes (GOI Direct Benefit Transfer 2020).
39. The RBI’s 2019 Annual Report indicates that banking outlets in villages increased from 33,378 in March 2010 to 52,489 in March 2019 (an increase of 57 percent), while the number of agents increased from 67,694 to 597,155 over the same period (an increase of 780 percent).
40. Though credit cards have been used for some time in India generally by the more affluent, they are not as common as debit cards. As of December 2019, there were 55 million credit cards in circulation.
41. Amromin and Chakravorti (2009) stress that currency has multiple roles including savings and payments. Therefore, CIC may not always accurately predict the impact of the adoption and usage of non-cash alternatives on cash transactions.
42. Bank of Spain, Interchange Fees and Merchant Service Charges.
43. Without proper econometric analysis controlling for various factors, quantifying the causal effect is not possible.
44. BKM, Members, https://bkm.com.tr/en/about-bkm/member-and-partners/members/.
45. Law No. 657 (of 1965) was modified in 1992 to mandate all public sector salaries to be paid into bank accounts. Law No. 4857 (of 2003) mandated all payments to employees including salaries, bonuses, etc. by firms with 5+ employees to be made into the employee’s bank account (later on modified as accounts at banks and non-bank PSPs, and post office). Ministry of Finance Notification No. 268 (of 2008) mandates all rent payments for real estate to be made via bank account transfers or post office money orders (threshold: for rents of TRL 500 and above – in 2008 – approx. USD 330 at that time). Ministry of Finance Notification No. 332 (of 2004) of the Tax Law (Law No. 323 of 2003) sets the maximum level of any commercial payment that can be made in cash as TRL 8,000 (at that time approx. USD 12,500; currently this amount corresponds to less than USD 1,000).
46. TROY, Products and Technologies. In 2020, Turkey also established a national QR code standard (CBRT, 2020).
47. CBRT, Electronic Fund Transfer System-Electronic Securities Transfer System-The Instant and Continuous Transfer of Funds (FAST) System.
48. Anecdotally, the province of Buenos Aires’ tax revenue service found that 80 percent of merchants did not have a POS terminal available for card acceptance.
49. Visa (2021) also refers to successful ADF programs in Bolivia and Slovakia that increased digital payments.
INCENTIVES FOR ELECTRONIC PAYMENT ACCEPTANCE • 63
50. Credit cards were introduced in South Korea in 1969. Debit cards were introduced in 1996 but are marginally used as most consumers have access to credit cards.
51. As noted by the Better than Cash Alliance (2015, p.10) “even though merchants can deduct these payments at the end of the year, it reduces their working capital at the time of the sale; for merchants who do not pay taxes, it reduces their income. A measure pushed by banks to eliminate the tax retentions and hence to promote merchant acquiring, was analyzed as part of the tax reform effort in 2012 but not approved.”
52. Adult is defined as 18 years and older.53. See Sands et al. (2017) for further discussion on this matter. 54. FATF (2015), p. 8.55. CGAP and Dalberg (2017) cite improved customer
relationships and business intelligence along with greater access to financial services as three broad areas of value-added services.
56. For more discussion on customer service as differentiator between merchant competitors, see CGAP and Dalberg (2017).
57. For more details on loyalty programs and merchant payments, see CGAP (2019b).
58. Paystack, a Nigerian FinTech firm, and Yoco, a South African FinTech firm, are examples of PSPs that also offer value-added services. For more discussion on Paystack and Yoco, see https://paystack.com/ and Shapshak (2017), respectively.
59. Today, the fee structure depends on the transaction value. For more details, see https://kopokopo.co.ke/faqs/.
60. For more details on product offerings, see Kopo Kopo’s product offerings at https://kopokopo.co.ke/.
61. Section 9 is adapted from Allen, Carbó-Valverde, Chakravorti, Rodriguez-Fernandez, Ardic (ACCRA) (2021). For more detail about the data, methods, and results discussed in Section 9, as well as several robustness tests, see ACCRA.
62. The GPSS began asking about QR code payment acceptance in its last iteration. However, the timing of the latest GPSS does not match our primary response variables. Additionally, the data coverage for the QR code variable is currently limited.
63. For B2B payments, only MSMR payments to direct suppliers are considered.
64. In each one of the exercises (country-level and merchant-level), ACCRA uses variables from the other one. In the country-level exercise, for example, ACCRA uses the share of digital payments made to MSMRs by individuals as a dependent variable but also as an explanatory variable when POS is the dependent variable. Similarly, ACCRA uses the share of B2B and BTP digital payments and ACCRA also uses a breakdown of these variables for grocery and non-
grocery establishments (as estimated by Euromonitor from merchant data and then extrapolated to a country-level database).
65. There are some exceptions to this, such as the Global FICP Survey data, which were collected in 2017.
66. Given the treatment of data in our machine learning approach, it would not make much statistical sense to conduct specific sub-sample analyses for a set of homogenous countries (e.g., low-income countries) as variability within a single group would not provide much information on benchmarking and potential routes for merchant acceptance development.
67. These results should be interpreted as directional. The actual magnitude of the estimate will differ based on an individual country. Furthermore, casual inference is difficult to estimate given that countries vary on multiple dimensions.
68. All the empirical results involving shadow economy in our study are robust to the use of some alternative measures. In particular, ACCRA’s results in all sections remain very similar when they use alternative indicators of informality as the informality measures based on dynamic general equilibrium models and on the combination of multiple indicators, as provided by Ohnsorge and Yu (2021). Correlation across the 106 countries in our sample between our shadow economy metric and these informality indicators ranges 87-89 percent.
69. As discussed in Section 4, banks also play a key role for M-Pesa as well on the back end.
70. On the other hand, in some jurisdictions, public authorities are concerned that physical cash may disappear and are introducing digital fiat currencies or commonly referred to as central bank digital currencies (CBDCs), e.g. China and Sweden.
71. Another type of payment card, called charge cards, allow cardholders access to short-term credit that have to be paid in full when billed by the issuer. In other words, there is no revolving credit.
72. There are also deferred debit cards where funds are deducted from the transaction account at later time similar to a charge card where cardholders are unable to revolve balances.
73. ATM and debit cards compete while residing on the same piece of plastic. Consumers have a choice to withdraw cash at ATMs or use the card’s debit functionality to pay at the point of sale. However, merchants may force consumers to acquire cash from ATMs sometimes located in or around their stores to avoid paying debit card fees or taxes.
74. For a discussion of competing debit card networks, see Lubasi (2005).
75. For more discussion about use cases of prepaid cards, see Chakravorti and Lubasi (2006).
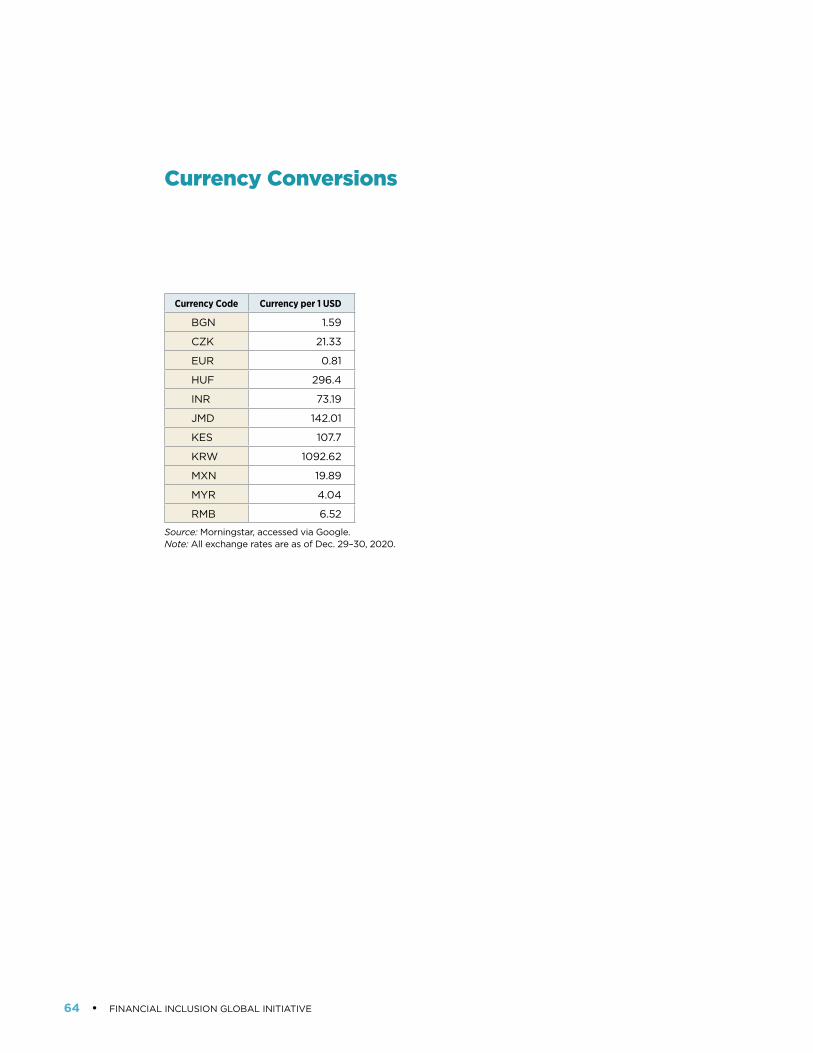
64 • FINANCIAL INCLUSION GLOBAL INITIATIVE
Currency Code Currency per 1 USD
BGN 1.59
CZK 21.33
EUR 0.81
HUF 296.4
INR 73.19
JMD 142.01
KES 107.7
KRW 1092.62
MXN 19.89
MYR 4.04
RMB 6.52
Source: Morningstar, accessed via Google.Note: All exchange rates are as of Dec. 29–30, 2020.
Currency Conversions