incentives for non-price discrimination
TRANSCRIPT

Information Economics and Policy 15 (2003) 147–171www.elsevier.com/ locate/econbase
I ncentives for non-price discrimination
*Irina Kondaurova, Dennis L. WeismanDepartment of Economics, Kansas State University, Waters Hall, Manhattan, KS 66506-4001,USA
Abstract
A regulated upstream monopolist supplies an essential input to firms in a downstreammarket. Non-price discrimination or sabotage becomes a concern when the upstreammonopolist vertically integrates downstream. This article develops a simulation algorithm todetermine the likelihood that discrimination will arise in equilibrium using data from the USlong-distance market. Based on 1000 random draws of own and cross-price elasticities, thesimulations reveal that discrimination arises in 934 cases at current access charges. Thisanalysis has implications for regulatory policy, including access charge reform and entry bythe Regional Bell Operating Companies into the interLATA long distance market. 2002 Elsevier Science B.V. All rights reserved.
Keywords: Access pricing; Vertical integration; Discrimination; Regulation
JEL Classification: L51; L96
1 . Introduction
In network industries such as telecommunications, electric power, and naturalgas it is common for an upstream monopolist to supply an input essential to theproduction of the downstream service. This essential input is commonly referred toas access. For example, in the long-distance market, carriers such as AT&T, MCIand Sprint rely upon the access services supplied by local telephone companies for
1the origination and termination of long-distance messages. In similar fashion,
*Corresponding author. Tel.:11-785-532-4588; fax:11-785-539-7225.E-mail address: [email protected](D.L. Weisman).
1 These long-distance carriers along with other prospective entrants in the market for local telephoneservices also depend on the incumbent local telephone companies for unbundled network elements—the inputs required to assemble competing local telephone service offerings. See Sidak and Spulber(1997).
0167-6245/02/$ – see front matter 2002 Elsevier Science B.V. All rights reserved.doi:10.1016/S0167-6245(02)00092-6

148 I. Kondaurova, D.L. Weisman / Information Economics and Policy 15 (2003) 147–171
stand-alone Internet service providers may be dependent in certain regions on thehigh-speed access lines of a combined AOL–Time Warner. In the electric powerindustry, entrants are dependent on the distribution facilities of incumbentproviders to serve retail customers. Hence, while the focus of this analysis is onthe US telecommunications market, the basic problem we examine is moregeneral.
A commonly voiced concern is that a vertically integrated provider (VIP) willhave the incentive to degrade the quality of access provided to independent rivals
2in order to favor its downstream operations. In fact, allegations that AT&T hadengaged in discriminatory practices against its rivals in the long distance marketresulted in the Regional Bell Operating Companies (RBOCs) being prohibitedfrom participating in the interLATA long-distance under the terms of the 1984
3Bell System Divestiture. Section 271 of the 1996 Telecommunications Act allowsthe RBOCs to petition for entry into the (in-region) InterLATA long-distancemarket once they have opened their local telephone markets to competition and
4have satisfied a 14-point competitive checklist. The purpose of this checklist is, inpart, to ensure that the RBOCs do not have the opportunity to discriminate againsttheir rivals in the downstream long-distance market as a result of their control overan essential input to production (access). Discrimination occurs when the RBOCintentionally degrades the quality of the access service provided to downstream
5competitors with the effect of raising rivals’ costs.The incentives for non-price discrimination in a Cournot framework have been
examined in a number of recent studies including Sibley and Weisman (1998),Economides (1998), Mandy (2000), Weisman and Kang (2001) and Weisman andWilliams (2001). This research is concerned primarily with identifying theconditions under which the incentive to discriminate arises (respectively, does notarise) in equilibrium. The main finding of this research is that the independentrivals must be significantly more efficient that the VIP in the downstream marketin order for the incentive to discriminate not to arise in equilibrium.
The analysis of the incentive to discriminate in a Bertrand framework has beenexamined in Weisman (1995, 1998), Reiffen (1998) and Beard et al. (2001).
2 In the electric power industry, concerns along these lines have forced some companies to spin-offtheir generating assets if they are also involved in local distribution.
3 In order to facilitate the divestiture and allow for the financial viability of the RBOCs, the countrywas divided into 161 local access transport areas, or LATAs. The RBOCs are allowed to carrylong-distance traffic within LATAs, but not between LATAs in their own territories.
4 In addition, the RBOCs must have the concurrence of the individual state public servicecommissions and the Federal Communications Commission, with significant weight given to the viewsof the Department of Justice, before interLATA entry can be authorized. At the time of this writing, 20states have been granted interLATA relief.
5 See Bernheim and Willig (1994), Krattenmaker and Salop (1986) and Salop and Scheffman(1983).

I. Kondaurova, D.L. Weisman / Information Economics and Policy 15 (2003) 147–171 149
Whereas, the Cournot analyses of discrimination focus on relative efficiencydifferences between independent rivals and the VIP, the incentive to discriminatein a Bertrand framework turns on the firm-specific own and cross-price elasticities.The main finding of this research is that the incentive to discriminate will typicallyarise in equilibrium when the cross-price elasticities are sufficiently large, ceterisparibus.
Mandy and Sappington (2001) examine the incentives for both cost-increasingsabotage and demand-reducing sabotage. They find that cost-increasing sabotage istypically profitable under both Bertrand and Cournot competition. In contrast,demand-reducing sabotage is often profitable under a Cournot competition, butunprofitable under Bertrand competition.
Finally, empirical analysis of the incidence of non-price discrimination islimited. Reiffen and Ward (2002) find some evidence of non-price discriminationin cellular telephony, though it does not necessarily rise to a level that wouldjustify a prohibition on vertically integrated supply given the prospective loss ofscope economies. Crandall (2001, p. 33) finds that formal complaints concerningviolation of interconnection rules under the 1996 Telecommunications Act occurin only about 1% of the sample of agreements between incumbent providers andcompetitive local exchange carriers.
The primary objective of this research is to develop a methodology to estimatethe likelihood that the incentive to discriminate will arise in equilibrium based on agiven distribution of firm-specific own and cross-price elasticities. The incentive todiscriminate exists when the VIP earns higher profits when the rival is foreclosedfrom the downstream market relative to the non-discrimination outcome. Thismethodology is then applied to the long-distance market in the United States inorder to assess the risk of discriminatory behavior posed by allowing the RBOCsinto the interLATA long distance market and how this risk varies with key marketparameters (e.g. initial market shares and prices) as well as key regulatoryparameters (e.g. access charges).
We find that the number of cases in which discrimination arises is very sensitiveto initial market shares and downstream prices. For instance, when the independentrival’s initial market share is 50% and the initial downstream price is 15 cents, thenumber of discrimination cases is 934 of 1000; for a market share of 60% and thesame initial price, the number of discrimination cases falls to 319. The simulationanalysis reveals that the number of discrimination cases in equilibrium increaseswhen the initial prices increase and/or the independent rival’s initial market sharedecreases. The number of discrimination outcomes decreases when the accesscharge increases. We find that the number of discrimination cases is small whenthe cross-price elasticity is small or the own-price elasticity of the rival firm islarge (in absolute value). The simulations also reveal that when the access price isclose to marginal cost, the number of the discrimination cases remains very largeeven if all other parameter values are conducive to non-discrimination outcomes.
150 I. Kondaurova, D.L. Weisman / Information Economics and Policy 15 (2003) 147–171
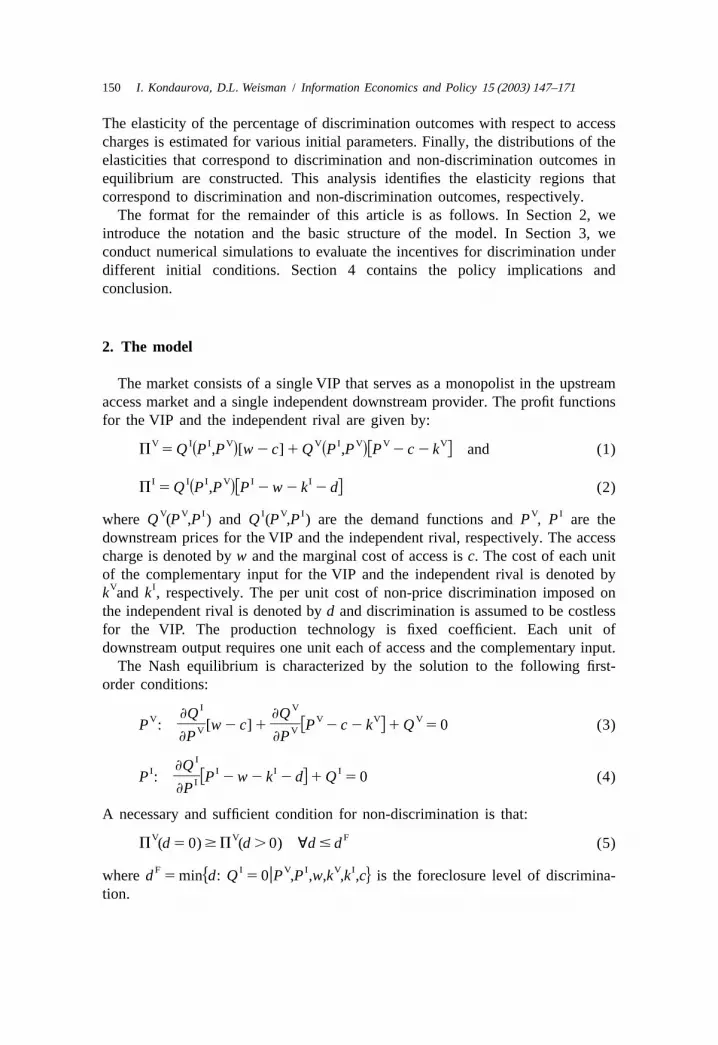
The elasticity of the percentage of discrimination outcomes with respect to accesscharges is estimated for various initial parameters. Finally, the distributions of theelasticities that correspond to discrimination and non-discrimination outcomes inequilibrium are constructed. This analysis identifies the elasticity regions thatcorrespond to discrimination and non-discrimination outcomes, respectively.
The format for the remainder of this article is as follows. In Section 2, weintroduce the notation and the basic structure of the model. In Section 3, weconduct numerical simulations to evaluate the incentives for discrimination underdifferent initial conditions. Section 4 contains the policy implications andconclusion.
2 . The model
The market consists of a single VIP that serves as a monopolist in the upstreamaccess market and a single independent downstream provider. The profit functionsfor the VIP and the independent rival are given by:
V I I V V I V V VP 5Q sP ,P d[w 2 c] 1Q sP ,P dfP 2 c 2 k g and (1)
I I I V I IP 5Q sP ,P dfP 2w 2 k 2 dg (2)
V V I I V I V Iwhere Q (P ,P ) and Q (P ,P ) are the demand functions andP , P are thedownstream prices for the VIP and the independent rival, respectively. The accesscharge is denoted byw and the marginal cost of access isc. The cost of each unitof the complementary input for the VIP and the independent rival is denoted by
V Ik and k , respectively. The per unit cost of non-price discrimination imposed onthe independent rival is denoted byd and discrimination is assumed to be costlessfor the VIP. The production technology is fixed coefficient. Each unit ofdownstream output requires one unit each of access and the complementary input.
The Nash equilibrium is characterized by the solution to the following first-order conditions:
I V≠Q ≠QV V V V]] ]]P : [w 2 c] 1 fP 2 c 2 k g1Q 50 (3)V V≠P ≠P
I≠QI I I I]]P : fP 2w 2 k 2 dg1Q 50 (4)I≠P
A necessary and sufficient condition for non-discrimination is that:
V V FP (d 5 0)$P (d .0) ;d # d (5)
F I V I V Iuwhered 5minhd: Q 5 0 P ,P ,w,k ,k ,cj is the foreclosure level of discrimina-tion.

I. Kondaurova, D.L. Weisman / Information Economics and Policy 15 (2003) 147–171 151
In this section, linear demand functions are employed to obtain closed-formsolutions for the equilibrium prices, quantities and the profit of the VIP in aBertrand framework. These solutions are characterized entirely in terms ofparameters, including the linear demand coefficients, the access charge (w), the
V Imarginal cost of access (c), the cost of the complementary inputs (k ) and (k ), andthe level of discrimination (d). These expressions are then used in the numericalsimulations to determine whether the VIP has an incentive to discriminate againstthe independent rival in equilibrium under different initial conditions.
The linear demand functions for the VIP and the independent rival are given,respectively, by:
V V IQ 5 A2 bP 1 gP and (6)
I I VQ 5B 2 fP 1 hP (7)
where A, B, b, f, g, and h are positive constants.The Nash equilibrium is characterized by the solution to the first-order
conditions in (3) and (4). The equilibrium prices are given, respectively, by:
V I2fhw 2 2fhc 1 2fbc 1 2fbk 1 2fA1 fwg 1 fk g 1 fdg 1Bgs dV ]]]]]]]]]]]]]]]]]P 5 (8)(4bf 2 gh)
and2 2 I Vh w 2 h c 1 2bfw 1 2bfk 1 2bfd 1 2bB 1 bch 1 bk h 1 Ahs dI ]]]]]]]]]]]]]]]]]P 5 , (9)
(4bf 2 gh)
where 4bf 2 gh .0 is required for a maximum. The explicit expressions for theequilibrium quantities and the profit of the VIP are readily obtained by substituting(8) and (9) into (1), (6) and (7).
VProposition 1. P (d) is convex when the demand functions are linear.
Proof. The equilibrium prices and quantities can be expressed in the followingform:
fgV V ]]]P (d)5P (0)1 d (10)(4bf 2 gh)
2bfI I ]]]P (d)5P (0)1 d (11)(4bf 2 gh)
bfgV V ]]]Q (d)5Q (0)1 d (12)(4bf 2 gh)
f(2bf 2 hg)I I ]]]]Q (d)5Q (0)2 d (13)(4bf 2 hg)
152 I. Kondaurova, D.L. Weisman / Information Economics and Policy 15 (2003) 147–171
V I V Iwhere P (0),P (0),Q (0), and Q (0)are the equilibrium prices and quantities atd 5 0. Substituting (10), (12) and (13) into (1), the expression for the VIP’s profitbecomes:
V V V V VP (d) 5 P (0)1 Q (0)g 1 P (0)2 c 2 k bgf gF
2 2 2fd bf g d (14)]]] ]]]]2 [2bf 2 hg][w 2 c]] 1F G 2(4bf 2 hg) (4bf 2 hg)
VwhereP (0) is the VIP’s profit atd 50. The result follows from:
2 V 2 2≠ P 2f g b]] ]]]]5 .0 (15)2 2≠d (4bf 2 gh)
VHence,P (d) is convex when the demand functions are linear.h
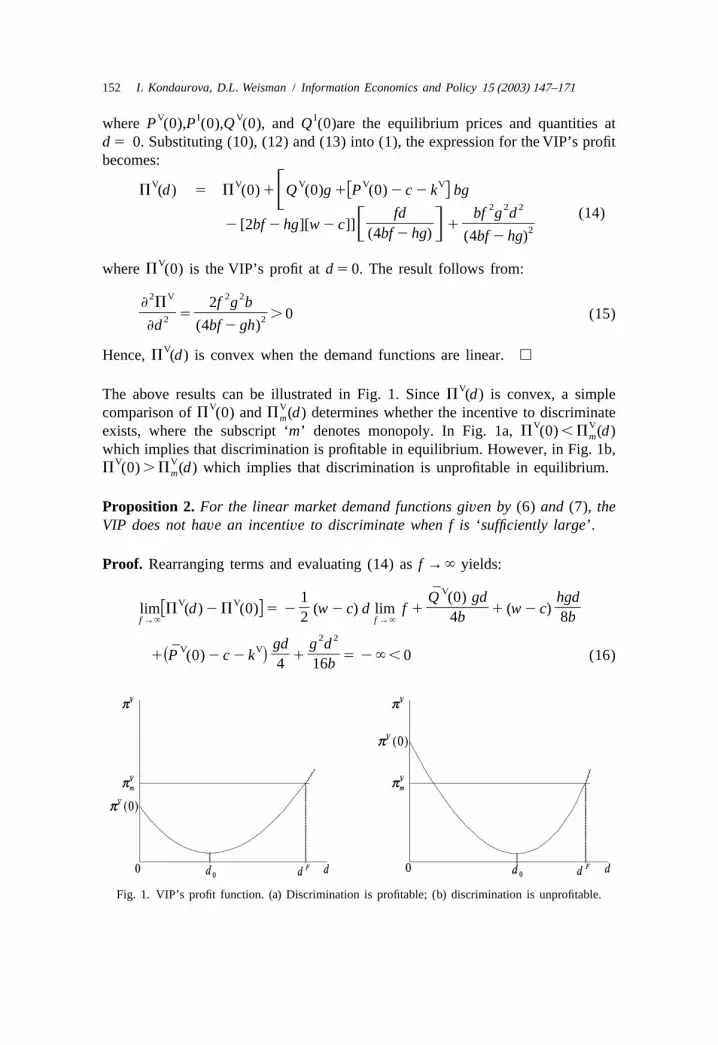
VThe above results can be illustrated in Fig. 1. SinceP (d) is convex, a simpleV Vcomparison ofP (0) andP (d) determines whether the incentive to discriminatem
V Vexists, where the subscript ‘m’ denotes monopoly. In Fig. 1a,P (0),P (d)m
which implies that discrimination is profitable in equilibrium. However, in Fig. 1b,V V
P (0).P (d) which implies that discrimination is unprofitable in equilibrium.m
Proposition 2. For the linear market demand functions given by (6) and (7), theVIP does not have an incentive to discriminate when f is ‘sufficiently large’.
Proof. Rearranging terms and evaluating (14) asf →` yields:
V¯1 Q (0) gd hgdV V ] ]]] ]lim P (d)2P (0) 5 2 (w 2 c) d lim f 1 1 (w 2 c)f g 2 4b 8bf →` f →`
2 2gd g dV V¯ ] ]]1 P (0)2 c 2 k 1 5 2`, 0 (16)s d 4 16b
Fig. 1. VIP’s profit function. (a) Discrimination is profitable; (b) discrimination is unprofitable.

I. Kondaurova, D.L. Weisman / Information Economics and Policy 15 (2003) 147–171 153
V V¯ ¯where P (0) and Q (0) are constants obtained by taking the limit of theexpressions (8), (9) and (12) asf goes to infinity. Hence, whenf is ‘sufficientlylarge’, the VIP has no incentive to discriminate in equilibrium.h
Proposition 3. For the linear market demand functions given by (6) and (7), theVIP does not have an incentive to discriminate when g is ‘sufficiently small’.
Proof. The profit of the VIP in equilibrium is given by the expression in (14).Rearranging terms and evaluating (14) atg 5 0 yields:
f(w 2 c) dV V ]]]P (d)2P (0) 5 2 ,0 ;d . 0 (17)f g g50 2
Hence, the incentive to discriminate does not arise in equilibrium for ‘sufficientlysmall’ g. h
VFor linear demand functions, the coefficientsg andf can be written asg 5´ (Q /VII I IP ) and f 5´ (Q /P ), where´ and´ are the cross and own price elasticities,II VI II
respectively. These results suggest that for linear demand functions, the incentiveto discriminate is reduced if either is small or´ is relatively large, ceterisVI II
paribus. The economic intuition is as follows. Discrimination induces theindependent rival to set a higher downstream price. The higher downstream pricehas two effects on the VIP’s profits: (1) decreased demand for the VIP’s upstreamaccess; and (2) increased demand for the VIP’s downstream output. Withf‘sufficiently large’ or g ‘sufficiently small,’ the first effect dominates the secondwhich explains why the VIP does not have an incentive to discriminate inequilibrium.
Proposition 4. When the market demand functions are linear, the VIP always hasan incentive to discriminate when w 5 c.
V VProof. It is sufficient to show that whenw 5 c, P (d 5 0),P (d) ;d.0:
V V V VP (d 5 0)5Q (0) P (0)2 c 2 k (18)s d
V V V VP (d)5Q (d) P (d)2 c 2 k (19)s d
V V V V FSince P (d).P (0) and Q (d).Q (0) ;d , d , the incentive to discriminatealways exists in equilibrium. h
154 I. Kondaurova, D.L. Weisman / Information Economics and Policy 15 (2003) 147–171
The economic intuition for Proposition 4 is straightforward. Under marginal costaccess pricing,w 5 c, there is no opportunity cost of discrimination in terms offoregone upstream profits, but the VIP realizes greater downstream demand due tothe higher price charged by its rivals. Hence, the VIP’s incentive to discriminate isunequivocal.
3 . Simulation analysis
The purpose of the simulation analysis is to investigate the incentive for anRBOC to discriminate against independent long-distance carriers in equilibriumunder different initial conditions in the US Long-distance market. The essentialelements of the algorithm used in the simulation exercise are outlined below.
3 .1. Overview of simulation algorithm
61. The elasticities are randomly chosen from independent normal distributions.The mean for the own price elasticities is27 and the standard deviation is 1.The mean for the cross price elasticities is 3 and the standard deviation is 0.8.These ranges are obtained from Ward (1999), Kahai et al. (1996) anddiscussions with telecommunication industry econometricians.
2. Linear demand functions are calibrated for the specific own and cross price7elasticities. This calibration exercise requires data on the total quantity of
conversation minutes, the initial downstream prices and market shares of theVIP and it’s rival. The total quantity of conversation minutes is 344.5 billions
I(FCC, 1999, Table 2.6). The independent rival’s initial market share,S , rangesfrom 50 to 80%. The initial downstream prices for both the VIP and theindependent rival range from 5 to 15¢ (FCC, 1998, Table 10).
3. The Nash equilibrium prices, quantities and profits of the VIP are computed atd 5 0. The values of the input parameters are as follows:c51¢ (FCC, 2000,
6 Another possible approach is to specify the joint distributions of the elasticities rather than assumetheir independence. The relevant covariance can be obtained and the nondiscrimination probabilitiescan be empirically estimated. Unfortunately, there is not sufficient information in the currenteconometric literature (see Ward, 1999; Kahai et al., 1996) to facilitate such an approach. Hence, wemaintain the independence assumption and estimate the non-discrimination probabilities conditional onthe different parameters of the model, including the independent normal distributions for the own andcross-price elasticities.
7 Preliminary analysis suggests that our general findings concerning the likelihood of discriminationwould continue to hold under non-linear demand specifications.

I. Kondaurova, D.L. Weisman / Information Economics and Policy 15 (2003) 147–171 155
V ITable 1.2),w ranges from 1.5 to 8¢ (FCC, 2000, Table 1.2) andk , k rangefrom 1 to 5¢ (Kahn and Tardiff, 1998; Hubbard and Lehr, 1998).
F4. Identify the discrimination values that correspond tod 5 d . Since the rival’sdemand is a linear function of all parameters, the foreclosure level of thediscrimination is a linear function of initial prices, market shares and otherparameters.
F5. Estimate the profit function for the VIP atd 5 d . The equilibrium prices atFd 5 d are then calculated and substituted into the VIP’s profit function. The
loop is repeated for 1000 different demand functions.F6. Compare the profits of the VIP atd 50 andd 5 d . If the condition in (5) is
satisfied then there is no incentive to discriminate. Otherwise, the incentive todiscriminate exists in equilibrium.
7. Compute the number of cases in which the incentive for discrimination arises inequilibrium.
8. Extract the elasticities that correspond to discrimination and non-discriminationoutcomes, respectively. The distribution plots of the corresponding elasticitiesare then constructed.
3 .2. Simulation results: comparative statics
Result 1: The number of discrimination outcomes is increasing in the initialdownstream prices, ceteris paribus.
Table 1 summarizes the percentage of discrimination outcomes forw53¢ andfor various initial market shares and prices. For example, when the initial price is
I7¢ and the initial value ofS is 50%, the percentage of discrimination cases is12.6%. However, when the initial price increases to 15¢, the number ofdiscrimination cases rises to 908 of 1000, or over 90%.
Table 1Percentage of discrimination outcomes as a function of initial prices and market shares (w 5$0.03)
I V IP 5P 5 S
0.5 0.55 0.6 0.65 0.7 0.75 0.8
$0.05 0.009 0.003 0.001 0.000 0.000 0.000 0.000$0.06 0.039 0.012 0.003 0.001 0.000 0.000 0.000$0.07 0.126 0.037 0.006 0.003 0.000 0.000 0.000$0.08 0.278 0.091 0.025 0.005 0.002 0.000 0.000$0.09 0.444 0.202 0.062 0.017 0.003 0.000 0.000$0.10 0.582 0.348 0.128 0.035 0.005 0.002 0.000$0.11 0.695 0.476 0.233 0.064 0.017 0.003 0.000$0.12 0.786 0.589 0.347 0.116 0.026 0.004 0.000$0.13 0.837 0.687 0.450 0.188 0.047 0.006 0.002$0.14 0.883 0.761 0.541 0.284 0.081 0.017 0.003$0.15 0.908 0.824 0.637 0.392 0.128 0.023 0.003

156 I. Kondaurova, D.L. Weisman / Information Economics and Policy 15 (2003) 147–171
Table 2Percentage of discrimination outcomes as a function of initial prices and market shares (w 5$0.04)
I V IP 5P 5 S
0.5 0.55 0.6 0.65 0.7 0.75 0.8
$0.05 0.000 0.000 0.000 0.000 0.000 0.000 0.000$0.06 0.003 0.002 0.000 0.000 0.000 0.000 0.000$0.07 0.012 0.003 0.002 0.000 0.000 0.000 0.000$0.08 0.032 0.006 0.003 0.000 0.000 0.000 0.000$0.09 0.071 0.019 0.004 0.002 0.000 0.000 0.000$0.10 0.138 0.039 0.009 0.003 0.000 0.000 0.000$0.11 0.245 0.078 0.020 0.004 0.002 0.000 0.000$0.12 0.336 0.138 0.038 0.006 0.003 0.000 0.000$0.13 0.466 0.229 0.065 0.017 0.003 0.000 0.002$0.14 0.552 0.319 0.104 0.026 0.005 0.002 0.000$0.15 0.646 0.414 0.168 0.042 0.007 0.003 0.000
IResult 2: The number of the discrimination outcomes is decreasing inS , ceterisparibus.
This result can be seen by examining Table 1. At the initial price of 12¢ andI IS 550%, discrimination arises in 78.6% of the cases. However, whenS is
increased to 75%, ceteris paribus, the percentage of discrimination outcomes fallsdramatically to 0.4%. Tables 2 and 3 report simulation results for various levels ofthe access charge (w). The findings are consistent with those reported above.
The results of these simulations are plotted in Figs. 2–4. These figures illustrateIthe percentage of discrimination outcomes as a function ofS for various initial
downstream prices and access charges. For example, in Fig. 2 andw53¢, theIinitial prices range from 5 to 15¢, andS ranges from 50 to 80%. The highest
Table 3Percentage of discrimination outcomes as a function of initial prices and market shares (w 5$0.05)
I V IP 5P 5 S
0.5 0.55 0.6 0.65 0.7 0.75 0.8
$0.05 0.000 0.000 0.000 0.000 0.000 0.000 0.000$0.06 0.000 0.00 0.000 0.000 0.000 0.000 0.000$0.07 0.003 0.001 0.000 0.000 0.000 0.000 0.000$0.08 0.005 0.002 0.000 0.000 0.000 0.000 0.000$0.09 0.013 0.003 0.002 0.000 0.000 0.000 0.000$0.10 0.025 0.005 0.003 0.00 0.000 0.000 0.000$0.11 0.051 0.014 0.003 0.002 0.000 0.000 0.000$0.12 0.084 0.023 0.005 0.002 0.000 0.000 0.000$0.13 0.148 0.040 0.010 0.003 0.000 0.000 0.000$0.14 0.233 0.073 0.019 0.004 0.002 0.000 0.000$0.15 0.312 0.105 0.028 0.005 0.002 0.000 0.000

I. Kondaurova, D.L. Weisman / Information Economics and Policy 15 (2003) 147–171 157
Fig. 2. Percentage of discrimination outcomes a function of initial prices and market shares (w50.03).
curve corresponds to the initial price of 15¢ and the lowest curve corresponds tothe initial price of 5¢. All of the other curves correspond to the specified initialprice levels. As can be readily observed from this figure, the percentage ofdiscrimination outcomes decreases rapidly as the initial price decreases or as the
Iinitial value of S increases.Result 3: The number of discrimination outcomes is decreasing in the access
charge,w, ceteris paribus.A large number of simulations were conducted for a range of access charges,
Iholding the initial prices constant but changingS . Three different initial prices
Fig. 3. Percentage of discrimination outcomes a function of initial prices and market shares (w50.04).
158 I. Kondaurova, D.L. Weisman / Information Economics and Policy 15 (2003) 147–171
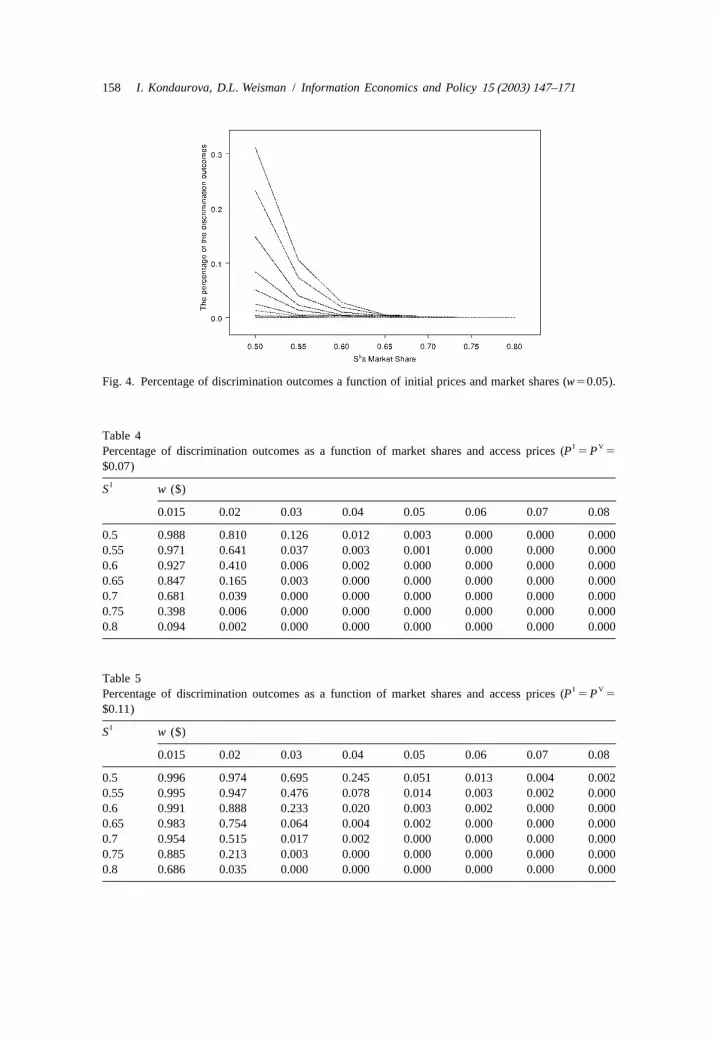
Fig. 4. Percentage of discrimination outcomes a function of initial prices and market shares (w50.05).
Table 4I VPercentage of discrimination outcomes as a function of market shares and access prices (P 5P 5
$0.07)IS w ($)
0.015 0.02 0.03 0.04 0.05 0.06 0.07 0.08
0.5 0.988 0.810 0.126 0.012 0.003 0.000 0.000 0.0000.55 0.971 0.641 0.037 0.003 0.001 0.000 0.000 0.0000.6 0.927 0.410 0.006 0.002 0.000 0.000 0.000 0.0000.65 0.847 0.165 0.003 0.000 0.000 0.000 0.000 0.0000.7 0.681 0.039 0.000 0.000 0.000 0.000 0.000 0.0000.75 0.398 0.006 0.000 0.000 0.000 0.000 0.000 0.0000.8 0.094 0.002 0.000 0.000 0.000 0.000 0.000 0.000
Table 5I VPercentage of discrimination outcomes as a function of market shares and access prices (P 5P 5
$0.11)IS w ($)
0.015 0.02 0.03 0.04 0.05 0.06 0.07 0.08
0.5 0.996 0.974 0.695 0.245 0.051 0.013 0.004 0.0020.55 0.995 0.947 0.476 0.078 0.014 0.003 0.002 0.0000.6 0.991 0.888 0.233 0.020 0.003 0.002 0.000 0.0000.65 0.983 0.754 0.064 0.004 0.002 0.000 0.000 0.0000.7 0.954 0.515 0.017 0.002 0.000 0.000 0.000 0.0000.75 0.885 0.213 0.003 0.000 0.000 0.000 0.000 0.0000.8 0.686 0.035 0.000 0.000 0.000 0.000 0.000 0.000
I. Kondaurova, D.L. Weisman / Information Economics and Policy 15 (2003) 147–171 159
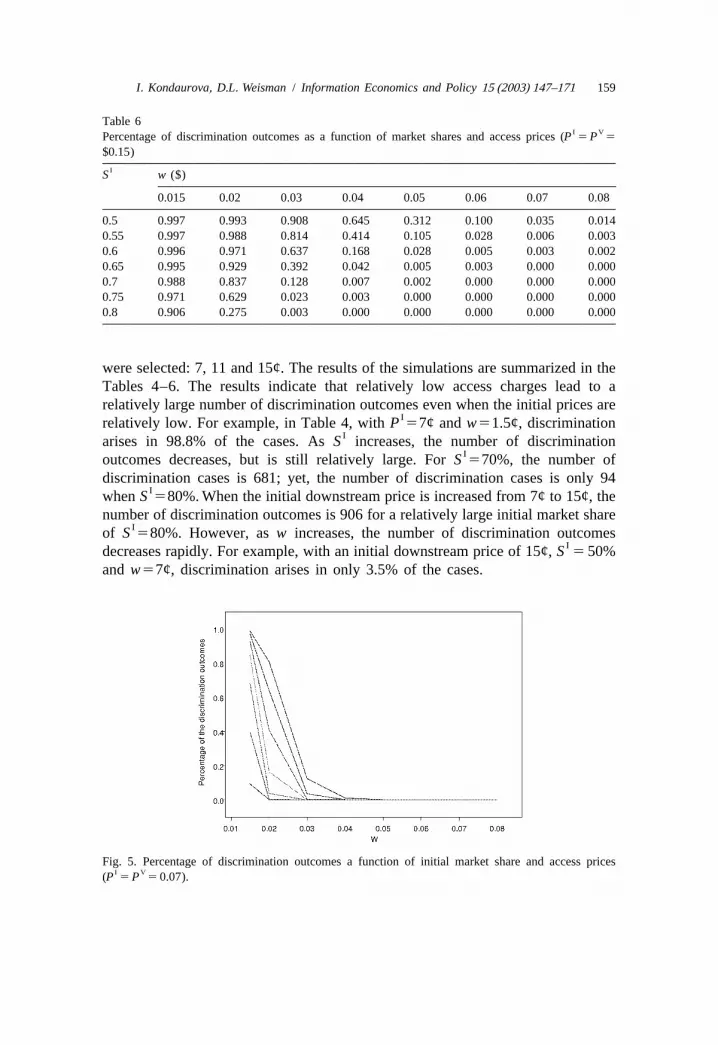
Table 6I VPercentage of discrimination outcomes as a function of market shares and access prices (P 5P 5
$0.15)IS w ($)
0.015 0.02 0.03 0.04 0.05 0.06 0.07 0.08
0.5 0.997 0.993 0.908 0.645 0.312 0.100 0.035 0.0140.55 0.997 0.988 0.814 0.414 0.105 0.028 0.006 0.0030.6 0.996 0.971 0.637 0.168 0.028 0.005 0.003 0.0020.65 0.995 0.929 0.392 0.042 0.005 0.003 0.000 0.0000.7 0.988 0.837 0.128 0.007 0.002 0.000 0.000 0.0000.75 0.971 0.629 0.023 0.003 0.000 0.000 0.000 0.0000.8 0.906 0.275 0.003 0.000 0.000 0.000 0.000 0.000
were selected: 7, 11 and 15¢. The results of the simulations are summarized in theTables 4–6. The results indicate that relatively low access charges lead to arelatively large number of discrimination outcomes even when the initial prices are
Irelatively low. For example, in Table 4, withP 57¢ andw51.5¢, discriminationIarises in 98.8% of the cases. AsS increases, the number of discrimination
Ioutcomes decreases, but is still relatively large. ForS 570%, the number ofdiscrimination cases is 681; yet, the number of discrimination cases is only 94
IwhenS 580%. When the initial downstream price is increased from 7¢ to 15¢, thenumber of discrimination outcomes is 906 for a relatively large initial market share
Iof S 580%. However, asw increases, the number of discrimination outcomesIdecreases rapidly. For example, with an initial downstream price of 15¢,S 5 50%
and w57¢, discrimination arises in only 3.5% of the cases.
Fig. 5. Percentage of discrimination outcomes a function of initial market share and access pricesI V(P 5P 5 0.07).

160 I. Kondaurova, D.L. Weisman / Information Economics and Policy 15 (2003) 147–171
Fig. 6. Percentage of discrimination outcomes a function of initial market share and access pricesI V(P 5P 5 0.11).
These results are plotted in Figs. 5–7 where the number of discriminationoutcomes is plotted as a function of the access charge (w) and various market
Ishares(S ). The highest curve corresponds to the smallest initial market share ofIS 550% and the lowest curve corresponds to the highest initial market share ofIS 580%.Result 4: The number of discrimination outcomes is decreasing in the VIP’s cost
Vof the complementary input,k , and increasing in the rival’s cost of theIcomplementary input,k , ceteris paribus.
Fig. 7. Percentage of discrimination outcomes a function of initial market share and access pricesI V(P 5P 5 0.15).

I. Kondaurova, D.L. Weisman / Information Economics and Policy 15 (2003) 147–171 161
Table 7Percentage of discrimination outcomes as a function of the VIP’s cost of complementary input and
I Iinitial prices (k 5 $0.02,w 5 $0.03,S 5 50%)I V VP 5P 5 k ($)
0.01 0.015 0.02 0.025 0.03
$0.07 0.126 0.079 0.043 0.026 0.014$0.12 0.786 0.746 0.704 0.660 0.612$0.15 0.908 0.901 0.888 0.867 0.844
Table 8Percentage of discrimination outcomes as a function of the VIP’s cost of complementary input and
V Iinitial prices (k 5 $0.01,w 5 $0.03,S 5 50%)I V VP 5P 5 k ($)
0.02 0.025 0.03 0.035 0.04
$0.07 0.126 0.131 0.146 0.155 0.170$0.12 0.786 0.791 0.793 0.796 0.798$0.15 0.908 0.909 0.909 0.910 0.911
These results can be seen by examining Tables 7 and 8. At the initial price ofI12¢, an initial market share ofS 5 50% and the VIP’s cost of the complementary
V Vinput of k 51¢, discrimination arises in 78.6% of the cases. However, whenk isincreased to 2.5¢, the number of discrimination outcomes falls to 66%, ceteris
Iparibus. Similarly, for the rival’s cost of the complementary input ofk 52¢, theIpercentage of discrimination outcomes is 78.6%. However, whenk is increased to
3.5¢, the percentage of discrimination outcomes increases to 79.8%, ceterisparibus.
We now simulate current data from the InterLATA long-distance market in the
Table 9Percentage of discrimination outcomes as a function of initial prices and market shares (w 5 $0.028,c 5$0.01)
I V IP 5P 5 S
0.5 0.6 0.7 0.8
$0.11 0.764 0.319 0.021 0.000$0.12 0.828 0.440 0.042 0.002$0.13 0.879 0.539 0.078 0.003$0.14 0.909 0.638 0.128 0.003$0.15 0.934 0.714 0.195 0.005

162 I. Kondaurova, D.L. Weisman / Information Economics and Policy 15 (2003) 147–171
8US to compute the expected percentage of discrimination outcomes. The resultsprovided in Table 9 confirm that the number of discrimination outcomes issensitive to the initial market share of the independent rival. For example, for
IS 550% and the initial prices of 11, 12, 13, 14, 15¢, the number of discriminationIcases are 764, 828, 879, 909 and 934, respectively. ForS 560% and the same
initial prices, the number of the discrimination cases are 319, 440, 539, 638, 714and 778, respectively.
Using the results in Tables 4–6, we estimate the elasticity of the percentage ofdiscrimination outcomes with respect to the access charge,w. For a relatively lowaccess charge of 2¢, the percentage of discrimination outcomes is relatively
Iinelastic. For the initial downstream prices of 7, 11 and 15¢,S 550% andw52¢,the estimated elasticity is20.692,20.078 and20.014, respectively. This impliesthat the absolute value of the elasticity of the percentage of discriminationoutcomes with respect to the access charge is decreasing in initial downstreamprices. Moreover, the absolute value of the elasticity of discrimination outcomes
Iwith respect to the access charge is increasing inS . For example, using Tables4–6, we calculate the elasticities of22.707,20.384 and20.089, respectively,for the initial downstream prices of 7, 11 and 15¢, the initial market share
I IS 560% and w52¢. This suggests that for higher values ofS the samepercentage increase inw leads to a proportionately larger decrease in the numberof discrimination outcomes, ceteris paribus.
These comparative statics results are summarized in Table 10. The tableindicates whether the percentage of discrimination outcomes in equilibriumincreases (1) or decreases (2) when the given parameter increases.
The economic intuition for these comparative static results is as follows. TheVIP has two sources of profit: upstream access sales and downstream long-distance sales. Any parameter change that increases the relative profitability of
`upstream sales vis-a-vis downstream sales reduces the VIP’s incentives todiscriminate, ceteris paribus.
Table 10Comparative statics overview
Parameter % Discriminationoutcomes
IS 2
w 2VP 1IP 1
ue u 2II
ue u 1VIVk 2Ik 1
8 The access price isw52.8¢ and the marginal cost isc51¢. (See FCC (2000), March, Table 1.2).

I. Kondaurova, D.L. Weisman / Information Economics and Policy 15 (2003) 147–171 163
Finally, we plot the distributions of the elasticities that correspond to differentpercentages of discrimination outcomes. The objective of this exercise is toidentify the elasticity regions that correspond to discrimination (respectively,non-discrimination) outcomes. Three sets of initial parameters were chosen thatgenerated 450, 589 and 786 discrimination outcomes, respectively. These resultswere obtained using randomly chosen values of the own and cross priceelasticities. The density plots for these elasticities were then constructed. As can beseen from Figs. 8–13, the values of the own and cross price elasticities (e andII
e ) that correspond to discrimination outcomes generally lie to the right of thoseVI
that correspond to non-discrimination outcomes. For example, with respect to Figs.8–10, observe that if the values of the own-price elasticities of the VIP arebetween23 and25, then the VIP is more likely to discriminate. However, whenthe values of the own price elasticities are between29 and211, there are a largernumber of cases in which discrimination does not arise in equilibrium. Thesefindings are consistent with Proposition 2.
The analysis reveals that there are large ‘gray’ areas for these elasticity valueswithin which it is not possible to differentiate between discrimination and non-discrimination outcomes. For example, with respect to Figs. 8–10, the own-priceelasticities for the independent rival that lie between25 and29 may generateboth discrimination and non-discrimination outcomes. In this case, it is necessaryto check all cases individually to determine if the VIP’s incentive to discriminatearises in equilibrium.
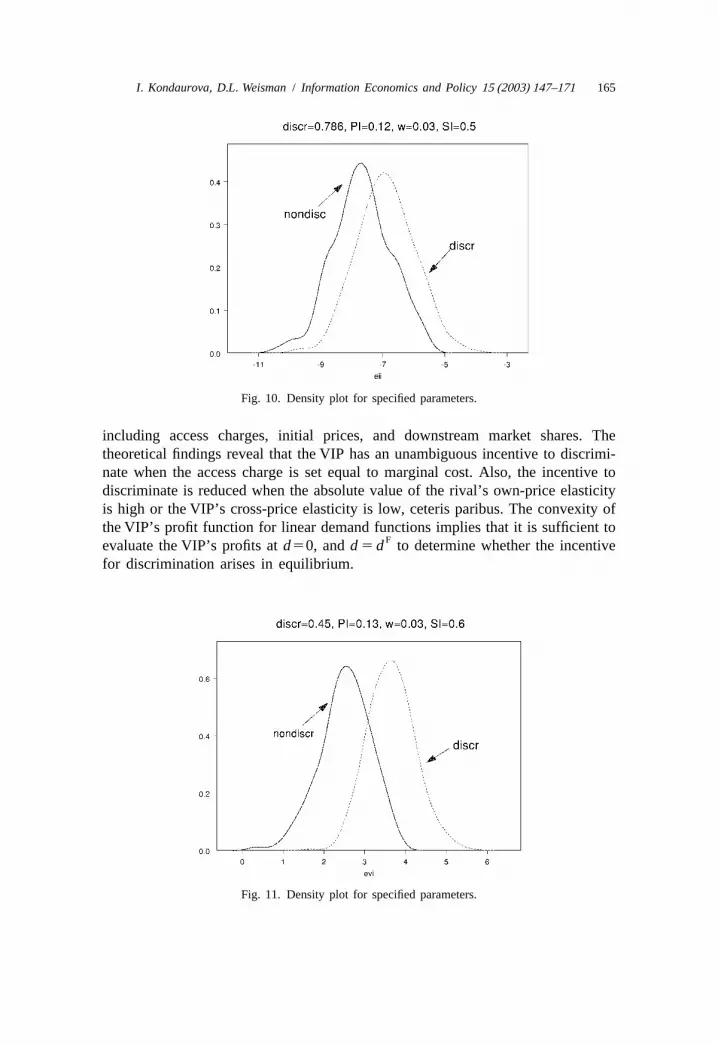
Similar results were generated for the cross price elasticity of the VIP’s outputwith respect to the price of the independent rival,e . These results are presentedVI
in Figs. 11–13. These figures reveal that the percentage of discriminationoutcomes is relatively high when the cross-elasticities are between 4 and 6. Ahigher percentage of non-discrimination outcomes corresponds to cross-priceelasticities values that are between 0 and 2. The ‘gray’ area for the crosselasticities is in the range between 2 and 4. As can be seen from Figs. 11–13, thedistribution of the cross-price elasticities that generate non-discrimination out-comes generally lies to the left of the distribution of those cross-price elasticitiesthat correspond to discrimination outcomes (i.e. the cross-elasticities are relativelysmall). These findings are consistent with Proposition 3.
Figs. 14–19 display the density plots for the own,e , and cross,e , priceVV IV
elasticities. These figures indicate that the ‘gray’ areas are quite large. Conse-quently, it is not possible to draw any definitive conclusions as to the specificintervals in which these elasticities must lie for discrimination or non-discrimina-tion outcomes to arise. Hence, it is necessary to check these cases individually.
The simulation algorithm can be used to check all possible elasticities andcorresponding profit levels for the VIP and evaluate the incentive for discrimina-tion in each individual case. The number of cases in which the percentage ofdiscrimination outcomes is relatively large can be analyzed in similar fashion bybuilding the density plots for specific values of the elasticities. When the
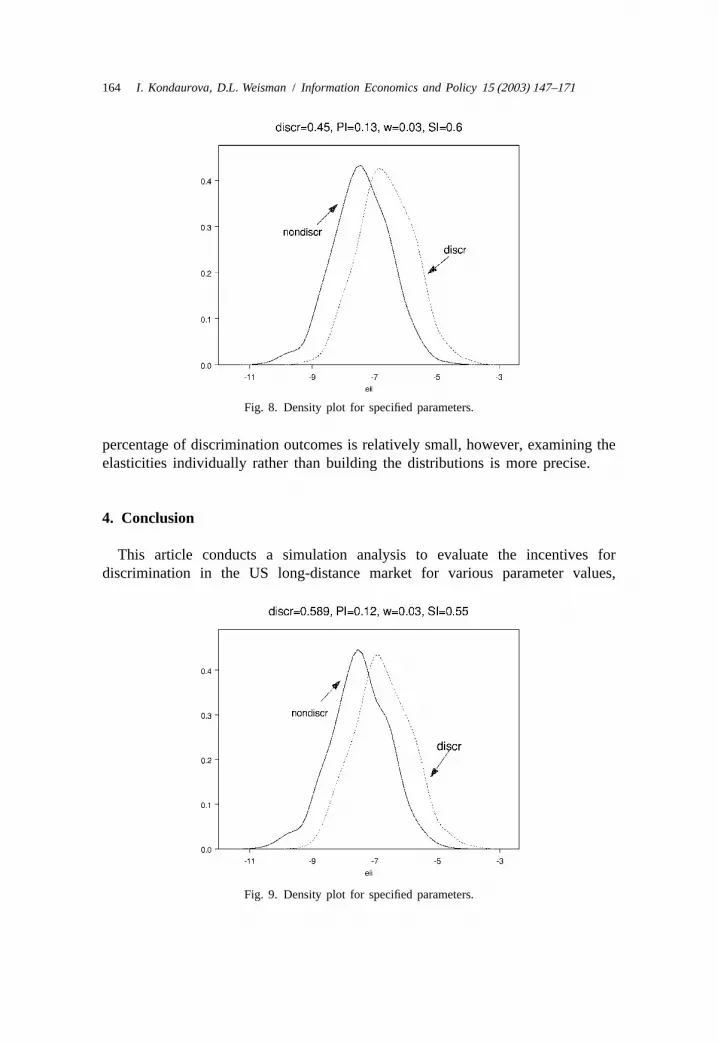
164 I. Kondaurova, D.L. Weisman / Information Economics and Policy 15 (2003) 147–171
Fig. 8. Density plot for specified parameters.
percentage of discrimination outcomes is relatively small, however, examining theelasticities individually rather than building the distributions is more precise.
4 . Conclusion
This article conducts a simulation analysis to evaluate the incentives fordiscrimination in the US long-distance market for various parameter values,
Fig. 9. Density plot for specified parameters.
I. Kondaurova, D.L. Weisman / Information Economics and Policy 15 (2003) 147–171 165
Fig. 10. Density plot for specified parameters.
including access charges, initial prices, and downstream market shares. Thetheoretical findings reveal that the VIP has an unambiguous incentive to discrimi-nate when the access charge is set equal to marginal cost. Also, the incentive todiscriminate is reduced when the absolute value of the rival’s own-price elasticityis high or the VIP’s cross-price elasticity is low, ceteris paribus. The convexity ofthe VIP’s profit function for linear demand functions implies that it is sufficient to
Fevaluate the VIP’s profits atd50, andd 5 d to determine whether the incentivefor discrimination arises in equilibrium.
Fig. 11. Density plot for specified parameters.

166 I. Kondaurova, D.L. Weisman / Information Economics and Policy 15 (2003) 147–171
Fig. 12. Density plot for specified parameters.
The simulation algorithm is used to estimate the number of discriminationoutcomes that arise in equilibrium for a large sample of demand functionparameters that were calibrated using randomly chosen elasticities from normaldistributions. The simulations reveal that the percentage of discrimination out-comes is very large when the access charge is relatively low. Conversely, thenumber of discrimination outcomes is relatively small when the independentrival’s initial market share increases or the initial downstream price decreases,ceteris paribus. The number of discrimination outcomes decreases if the VIP’s costof the complementary input increases. Conversely, the number of discrimination
Fig. 13. Density plot for specified parameters.

I. Kondaurova, D.L. Weisman / Information Economics and Policy 15 (2003) 147–171 167
Fig. 14. Density plot for specified parameters.
outcomes increases if the independent rival’s cost of the complementary inputincreases.
The elasticity of the percentage of discrimination outcomes with respect toaccess charges was estimated for different initial parameters. The percentage ofdiscrimination outcomes becomes more elastic when the initial downstream priceincreases and/or the independent rival’s market share increases. More generally,the simulation algorithm enables us to determine whether the VIP has an incentiveto discriminate in equilibrium for any given set of initial conditions. Finally, using
Fig. 15. Density plot for specified parametrs.

168 I. Kondaurova, D.L. Weisman / Information Economics and Policy 15 (2003) 147–171
Fig. 16. Density plot for specified parameters.
a large sample of elasticities, we were able to identify the various own/crosselasticity values that correspond to discrimination and non-discrimination out-comes, respectively.
These results should serve to inform various regulatory policies in thetelecommunications industry. These findings suggest that access charge reductionsare likely to exacerbate the incentive for discrimination in an environment inwhich the regulator’s ability to monitor discrimination is imperfect. Furthermore,
Fig. 17. Density plot for specified parameters.

I. Kondaurova, D.L. Weisman / Information Economics and Policy 15 (2003) 147–171 169
Fig. 18. Density plot for specified parameters.
while the VIP’s incentive to discriminate is not unequivocal, it does arise in arelatively large number of cases at prevailing access charge levels. While the‘competitive checklist’ provisions in the 1996 Telecommunications Act incombination with service quality penalties can be expected to temper theseincentives for discrimination, the degree to which they can be expected to do so isuncertain and is in any case beyond the scope of this paper.
Fig. 19. Density plot for specified parameters.

170 I. Kondaurova, D.L. Weisman / Information Economics and Policy 15 (2003) 147–171
A cknowledgements
The authors thank Jaesung Kang, David Mandy, David Sappington and LesterTaylor for helpful discussions and an anonymous referee for constructivesuggestions. The usual caveat applies.
R eferences
Beard, T., Kaserman, D., Mayo, J., 2001. Regulation, vertical integration and sabotage. Journal ofIndustrial Economics 49, 319–334.
Bernheim, B., Willig, R., 1994. Appropriate preconditions for removal of the InterLATA restrictions onthe RBOCs. Affidavit filed with the United States Department of Justice in Support of AT&T’sOpposition to Ameritech’s Motions for ‘Permanent’ and ‘Temporary’ Waivers from the Inter-exchange Restriction of the Decree (D.D.C.), Case No. 82-0192, February 15.
Crandall, R.W., 2001. An assessment of the competitive local exchange carriers five years after thepassage of the 1996 Telecommunications Act. Criterion Economics June.
Economides, N., 1998. The incentive for non-price discrimination by an input monopolist. InternationalJournal of Industrial Organization 16, 271–284.
Hubbard, R., Lehr, W., 1998. Affidavit on Behalf of AT&T Communications of California, Inc., Noticeof Intent to File Section 271 Application of SBC Communications Inc., Pacific Bell, and Pacific BellCommunications Inc., for Provision of In-Region, Inter-LATA Services In California. Before thePublic Utilities Commission of the State of California.
Kahai, S., Kaserman, D., Mayo, J., 1996. Is the ‘dominant firm’ dominant? An empirical analysis ofAT&T’s market power. Journal of Law and Economics 39, 499–517.
Kahn, A., Tardiff, T., 1998. Testimony Filed with the Missouri Public Service Commission, in Supportof the Applications of SBC Communications, Inc., Southwestern Bell Telephone Company, andSouthwestern Bell Communications Services, Inc., for Provision of In-Region InterLATA Servicesin Missouri, Docket No. TO 99-227, November 20.
Krattenmaker, T., Salop, S., 1986. Anti-competitive exclusion: Raising rivals’ costs to achieve powerover price. Yale Law Journal 96, 209–293.
Mandy, D., 2000. Killing the goose that may have laid the golden egg: Only the data knows whethersabotage pays. Journal of Regulatory Economics 17, 157–172.
Mandy, D., Sappington, D., 2001. Incentives for sabotage in vertically-related industries. Working paper(September).
Reiffen, D., 1998. A regulated firm’s incentive to discriminate: A reevaluation and extension ofWeisman’s results. Journal of Regulatory Economics 14, 79–86.
Reiffen, D., Ward, M., 2002. Recent empirical evidence on discrimination by regulated firms. Reviewof Network Economics 1, 39–53.
Salop, S., Scheffman, D., 1983. Raising rivals’ costs. American Economic Review 73, 267–271.Sibley, D., Weisman, D., 1998. ‘Raising rivals’ costs: Entry of an upstream monopolist into downstream
markets. Information Economics and Policy 10, 551–570.Sidak, J., Spulber, D., 1997. The tragedy of the telecommons: Government pricing of unbundled
network elements under the Telecommunications Act of 1996. Columbia Law Review 7, 1081–1161.
Ward, M., 1999. Product substitutability and competition in long-distance telecommunications.Economic Inquiry 37 (October), 657–677.
Weisman, D., 1995. Regulation and the vertically-integrated firm: The case of RBOC entry intoInterLATA long distance. Journal of Regulatory Economics 8, 249–266.
I. Kondaurova, D.L. Weisman / Information Economics and Policy 15 (2003) 147–171 171
Weisman, D., 1998. The incentive to discriminate by a vertically-integrated regulated firm: A reply.Journal of Regulatory Economics 14, 87–91.
Weisman, D., Kang, J., 2001. Incentives For non-price discrimination when upstream monopolistsparticipate in downstream markets. Journal of Regulatory Economics 20, 125–139.
Weisman, D., Williams, M., 2001. The costs and benefits of long-distance entry: Regulation andnon-price discrimination. Review of Industrial Organization 3, 275–282.
Federal Communications Commission, 1998. Telecommunication Industry Review, Washington, DC,Table 10.
Federal Communications Commission, 1999. Preliminary Statistics of Communications CommonCarriers, Federal Communications Commission, Washington, DC, Table 2.6.
Federal Communications Commission, 2000. Trends in Telephone Services, FCC, Washington, DC,Table 1.2.