sbi cards and payment services
TRANSCRIPT

Company name
Research Analyst: Nitin Aggarwal ([email protected]) | Himanshu Taluja ([email protected]) Alpesh Mehta ([email protected]); Yash Agarwal ([email protected])
Investors are advised to refer through important disclosures made at the last page of the Research Report. Motilal Oswal research is available on www.motilaloswal.com/Institutional-Equities, Bloomberg, Thomson Reuters, Factset and S&P Capital.
Business growth recovering well; Return ratios robust Upgrade to Buy on recent correction with an unchanged TP
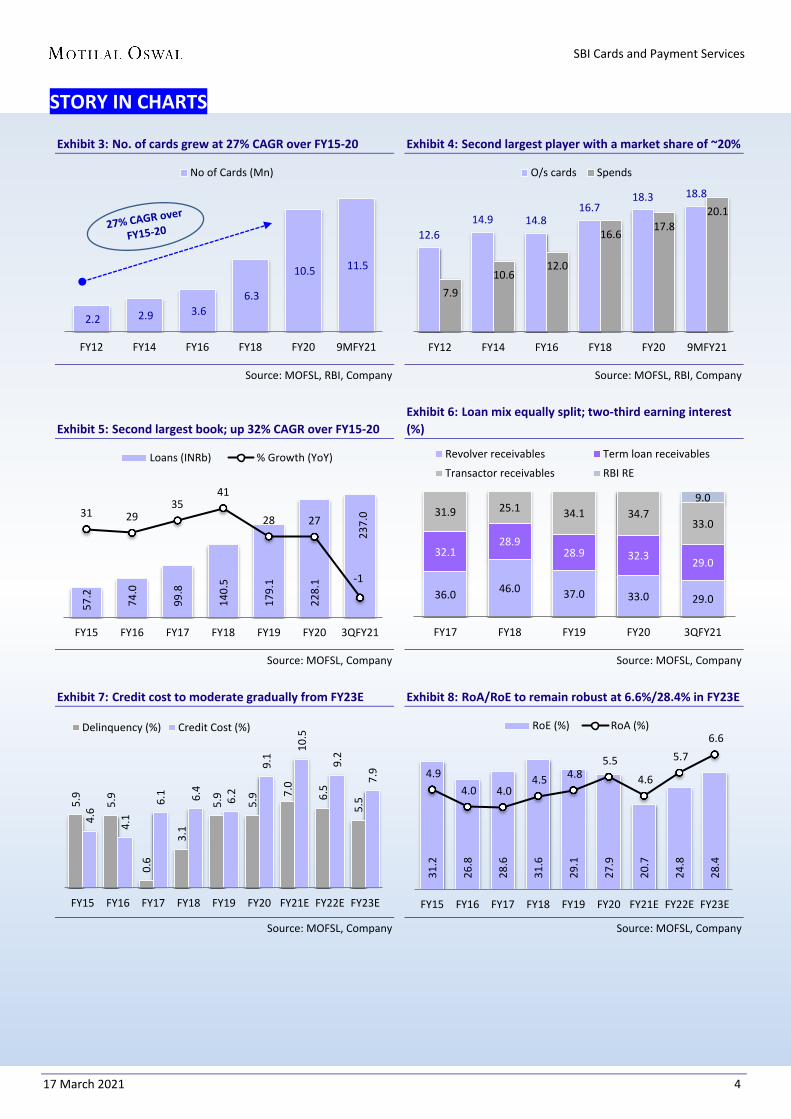
We recently initiated coverage on SBI Cards and Payments Services (SBICARD),highlighting the structural growth story and the unique play on rising retail creditthat has been offered by the company. It has strengthened its position as thesecond largest card player in India, with a market share of ~19% in outstandingcards and ~20% in overall spends. It has an outstanding card base of ~11.5m andhas doubled its card base over the past three years at an average incrementalmarket share of 23%.
We estimated loan book/earnings CAGR of 27%/47% over FY21–23E (RoA/RoE at6.6%/28.4% in FY23E), however we initiated coverage with a Neutral rating owingto expensive valuations and limited upside to our TP of INR1,200.
The stock has corrected ~11% since our initiation and is trading at 35x FY23Eearnings, which is attractive given its strong fundamentals, earnings growth, andlong-term structural story. At the CMP, the stock offers ~23% upside to ourunchanged TP of INR1,200 (43x FY23E EPS). Consequently, we are upgrading ourrating to Buy. Our earnings estimates stands unchanged.
Lower penetration augurs well for the long-term structural story While the credit card base/spends has increased at 22%/31% CAGR over the past five years, credit card penetration levels remain much lower at 3.8% v/s most other countries. Credit card penetration to internal customers for the industry stands ~7% (much lower for SBICARD at 3.8%), providing ample cross-sell opportunities. A highly underpenetrated market, coupled with a higher thrust on digital payments, rising e-commerce, and efforts towards making the economy a cashless one provides long-term structural growth opportunities.
Growth momentum to accelerate; offers a unique play on rising retail mix The Credit Card industry has demonstrated strong resilience as both card spends and new customer acquisitions have reached close to pre-COVID levels. SBICARD’s spend rate has touched pre-COVID levels (over 100% in retail spends), while it has gained ~50bp market share in outstanding cards. A continued uptick in the economy, along with a higher mix of online/retail spends, would accelerate the growth momentum. SBICARD is the only listed company within its domain that offers a direct play on the Credit Card industry. We expect outstanding credit card/spends CAGR of 22%/27% over FY21-23E for the industry. The same for SBICARD would be higher at 27%/32% CAGR.
17 March 2021
Company Update | Sector: Financials
SBI Cards and Payment Services CMP: INR977 TP: INR1,200 (+23%) Upgrade to Buy BSE Sensex S&P CNX
49,802 14,721
Stock Info Bloomberg SBICARD IN Equity Shares (m) 941 M.Cap.(INRb)/(USDb) 918.7 / 12.7 52-Week Range (INR) 1149 / 495 1, 6, 12 Rel. Per (%) -1/-13/-2912M Avg Val (INR M) 1882 Free float (%) 30.6
Financial Snapshot (INR b) Y/E March FY20 FY21E FY22E FY23E NII 35.4 42.8 49.5 63.8 OP 36.7 43.1 52.0 65.8 NP 12.4 12.2 18.0 26.4 NIM (%) 16.6 16.7 16.3 16.5 EPS (INR) 14.0 13.0 19.2 28.1 EPS Gr. (%) 31.4 (7.5) 47.7 46.6 BV/Sh. (INR) 56.9 68.6 86.0 111.7 ABV/Sh. (INR) 55.7 65.3 82.0 107.9 Ratios RoE (%) 27.9 20.7 24.8 28.4 RoA (%) 5.5 4.6 5.7 6.6 Valuations P/E(X) 69.7 75.3 51.0 34.8 P/BV (X) 17.2 14.2 11.4 8.7 P/ABV (X) 17.5 15.0 11.9 9.1
Shareholding pattern (%) As On Dec-20 Sep-20 Promoter 69.4 69.5 DII 3.9 3.2 FII 5.8 5.9 Others 20.9 21.4 FII Includes depository receipts
Stock Performance (1-year)
SBI Cards and Payment Services
17 March 2021 2
Strong core profitability to absorb credit cost; PCR to remain healthy at 72% Core profitability for the business remains strong, which allows absorption of asset quality shocks. Despite the elevated credit cost of ~9% over FY20, RoA/RoE came in strong at 5.5%/28%. Even for 9MFY21, credit cost remains elevated at 10.5%, yet return ratios were steady at 4.3%/18.5%. While we expect delinquencies to remain high, given the unsecured nature of the book – which would keep credit cost elevated, return ratios are likely to remain healthy and improve gradually as credit cost moderates. We expect NNPA to moderate to 1.2% by FY23E, while PCR would sustain ~72%.
Return ratios superior; RoE to revive to ~28% in FY23E Robust NII and a superior margin profile, along with healthy fee income, have resulted in a strong operating performance by SBICARD. Over FY15-20, SBICARD reported a PPoP/PAT CAGR of 49%/36% and an average RoA/RoE of ~5%/29%. A higher proportion of the interest earning book, coupled with an increase in fee income, would remain the key earnings driver – even as credit cost may remain elevated, especially up to FY22E. We expect SBICARD to report 47% earnings CAGR over FY21-23E, with a superior RoA/RoE of 6.6%/28.4% by FY23E.
Upgrade to Buy on recent correction with unchanged TP SBICARD has demonstrated a strong track record of growing its card book/earnings. This has enabled it to strengthen its lead as the second largest card player in terms of both outstanding cards and spends. While COIVD-19 has disrupted its growth trajectory, recovery has been fairly sharp and retail spends have exceeded pre-COVID levels. We estimate a loan book/earnings CAGR of 27%/47% over FY21-23E, even as credit cost is likely to remain under pressure in the near term given the higher mix of restructuring book. We estimate RoA/RoE to improve to 6.6%/28.4% in FY23E. The stock has corrected ~11% since our initiation and is trading at 35x FY23E earnings, which is attractive given its strong fundamentals, earnings growth, and long-term structural story. At the CMP, the stock offers ~23% upside to our unchanged TP of INR1,200 (43x FY23E EPS). Consequently, we are upgrading our rating to Buy.
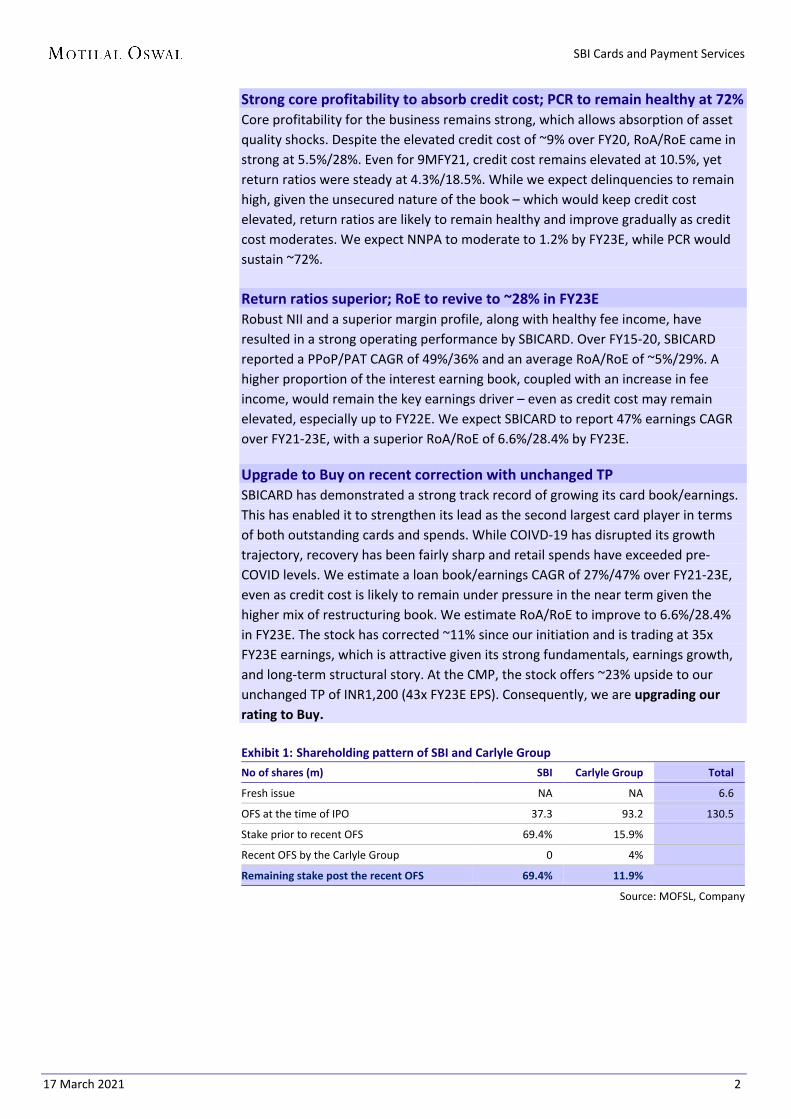
Exhibit 1: Shareholding pattern of SBI and Carlyle Group No of shares (m) SBI Carlyle Group Total
Fresh issue NA NA 6.6
OFS at the time of IPO 37.3 93.2 130.5
Stake prior to recent OFS 69.4% 15.9%
Recent OFS by the Carlyle Group 0 4%
Remaining stake post the recent OFS 69.4% 11.9%
Source: MOFSL, Company
SBI Cards and Payment Services
17 March 2021 3
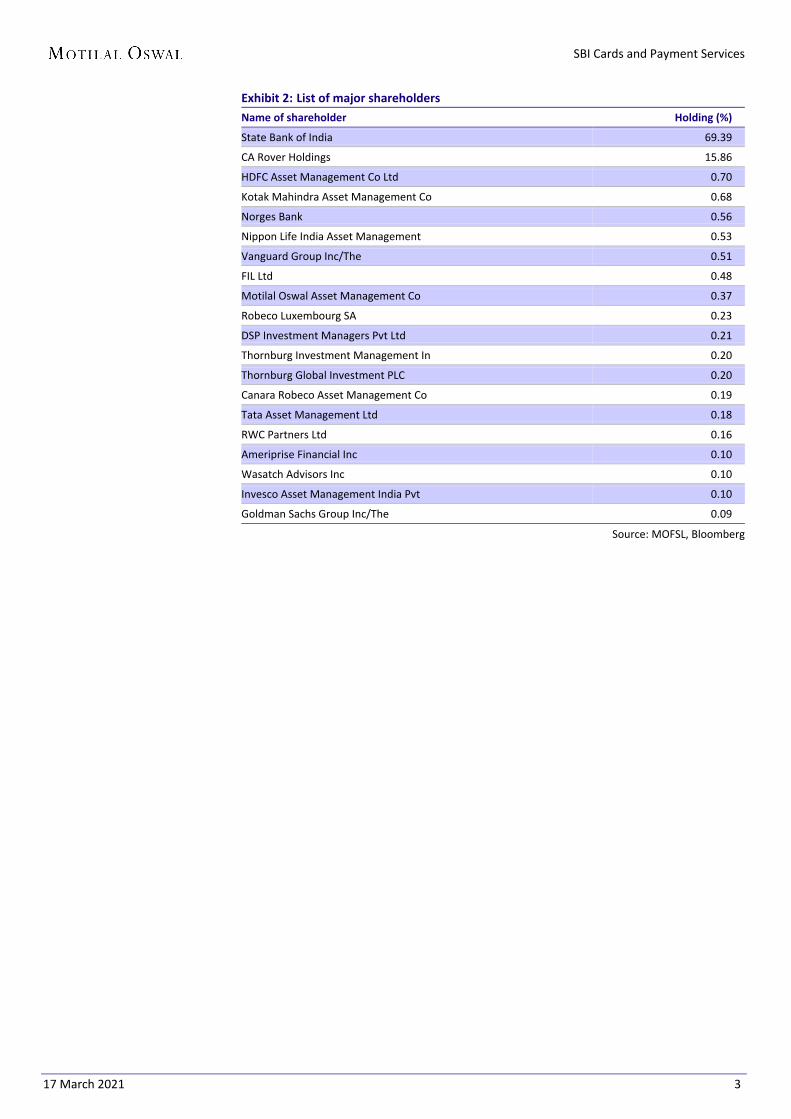
Exhibit 2: List of major shareholders Name of shareholder Holding (%)
State Bank of India 69.39
CA Rover Holdings 15.86
HDFC Asset Management Co Ltd 0.70
Kotak Mahindra Asset Management Co 0.68
Norges Bank 0.56
Nippon Life India Asset Management 0.53
Vanguard Group Inc/The 0.51
FIL Ltd 0.48
Motilal Oswal Asset Management Co 0.37
Robeco Luxembourg SA 0.23
DSP Investment Managers Pvt Ltd 0.21
Thornburg Investment Management In 0.20
Thornburg Global Investment PLC 0.20
Canara Robeco Asset Management Co 0.19
Tata Asset Management Ltd 0.18
RWC Partners Ltd 0.16
Ameriprise Financial Inc 0.10
Wasatch Advisors Inc 0.10
Invesco Asset Management India Pvt 0.10
Goldman Sachs Group Inc/The 0.09
Source: MOFSL, Bloomberg
SBI Cards and Payment Services
17 March 2021 4
STORY IN CHARTS
Exhibit 3: No. of cards grew at 27% CAGR over FY15-20
Source: MOFSL, RBI, Company
Exhibit 4: Second largest player with a market share of ~20%
Source: MOFSL, RBI, Company
Exhibit 5: Second largest book; up 32% CAGR over FY15-20
Source: MOFSL, Company
Exhibit 6: Loan mix equally split; two-third earning interest (%)
Source: MOFSL, Company
Exhibit 7: Credit cost to moderate gradually from FY23E
Source: MOFSL, Company
Exhibit 8: RoA/RoE to remain robust at 6.6%/28.4% in FY23E
Source: MOFSL, Company
2.2 2.9 3.6 6.3
10.5 11.5
FY12 FY14 FY16 FY18 FY20 9MFY21
No of Cards (Mn)
12.6 14.9 14.8
16.7 18.3 18.8
7.9 10.6
12.0
16.6 17.8
20.1
FY12 FY14 FY16 FY18 FY20 9MFY21
O/s cards Spends
57.
2
74.
0
99.
8
140
.5
179
.1
228
.1
237
.0 31 29
35 41
28 27
-1
FY15 FY16 FY17 FY18 FY19 FY20 3QFY21
Loans (INRb) % Growth (YoY)
36.0 46.0 37.0 33.0 29.0
32.1 28.9
28.9 32.3 29.0
31.9 25.1 34.1 34.7 33.0
9.0
FY17 FY18 FY19 FY20 3QFY21
Revolver receivables Term loan receivables
Transactor receivables RBI RE
5.9
5.9
0.6
3.1
5.9
5.9 7.
0
6.5
5.5
4.6
4.1
6.1 6.4
6.2
9.1
10.5
9.2
7.9
FY15 FY16 FY17 FY18 FY19 FY20 FY21E FY22E FY23E
Delinquency (%) Credit Cost (%)
31.
2
26.
8
28.
6
31.
6
29.
1
27.
9
20.
7
24.
8
28.
4
4.9 4.0 4.0
4.5 4.8 5.5
4.6
5.7 6.6
FY15 FY16 FY17 FY18 FY19 FY20 FY21E FY22E FY23E
RoE (%) RoA (%)
SBI Cards and Payment Services
17 March 2021 5
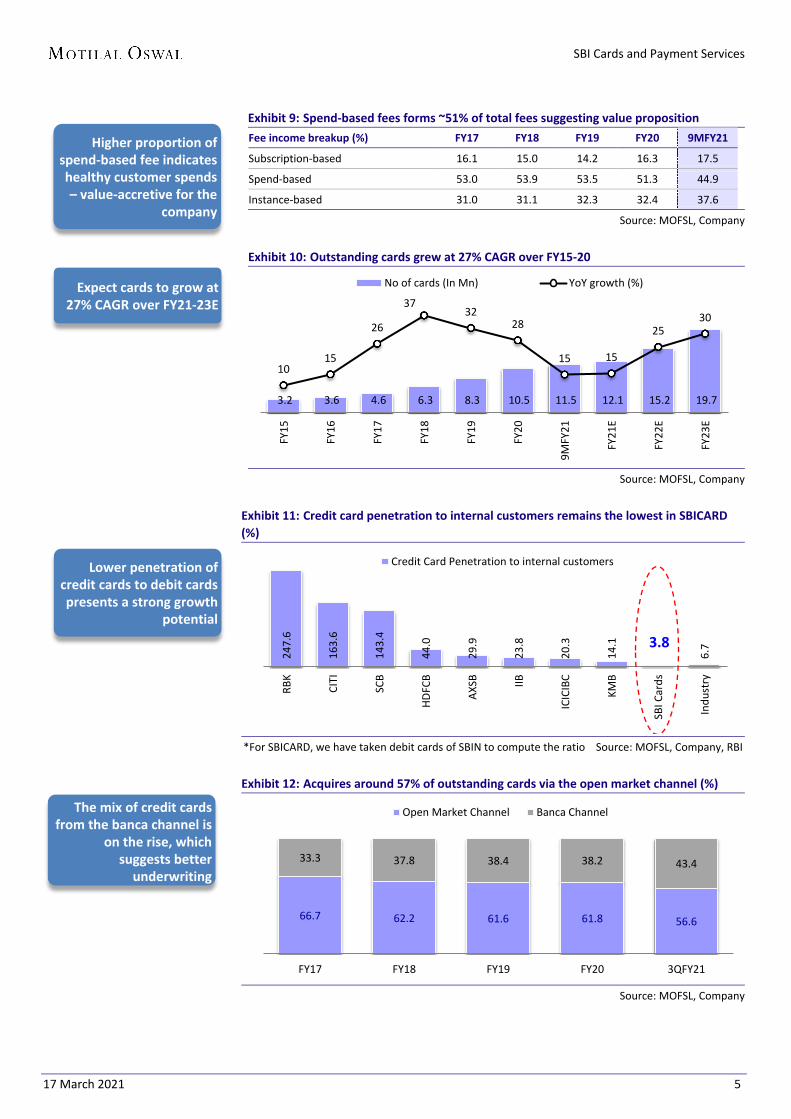
Exhibit 9: Spend-based fees forms ~51% of total fees suggesting value proposition Fee income breakup (%) FY17 FY18 FY19 FY20 9MFY21
Subscription-based 16.1 15.0 14.2 16.3 17.5
Spend-based 53.0 53.9 53.5 51.3 44.9
Instance-based 31.0 31.1 32.3 32.4 37.6
Source: MOFSL, Company
Exhibit 10: Outstanding cards grew at 27% CAGR over FY15-20
Source: MOFSL, Company
Exhibit 11: Credit card penetration to internal customers remains the lowest in SBICARD (%)
*For SBICARD, we have taken debit cards of SBIN to compute the ratio Source: MOFSL, Company, RBI
Exhibit 12: Acquires around 57% of outstanding cards via the open market channel (%)
Source: MOFSL, Company
3.2 3.6 4.6 6.3 8.3 10.5 11.5 12.1 15.2 19.7
10 15
26
37 32
28
15 15
25 30
FY15
FY16
FY17
FY18
FY19
FY20
9MFY
21
FY21
E
FY22
E
FY23
E
No of cards (In Mn) YoY growth (%)24
7.6
163.
6
143.
4
44.0
29.9
23.8
20.3
14.1
3.8
6.7
RBK
CITI
SCB
HDFC
B
AXSB IIB
ICIC
IBC
KMB
SBI C
ards
Indu
stry
Credit Card Penetration to internal customers
66.7 62.2 61.6 61.8 56.6
33.3 37.8 38.4 38.2 43.4
FY17 FY18 FY19 FY20 3QFY21
Open Market Channel Banca Channel
Higher proportion of spend-based fee indicates healthy customer spends – value-accretive for the
company
Lower penetration of credit cards to debit cards presents a strong growth
potential
The mix of credit cards from the banca channel is
on the rise, which suggests better
underwriting
Expect cards to grow at 27% CAGR over FY21-23E
SBI Cards and Payment Services
17 March 2021 6
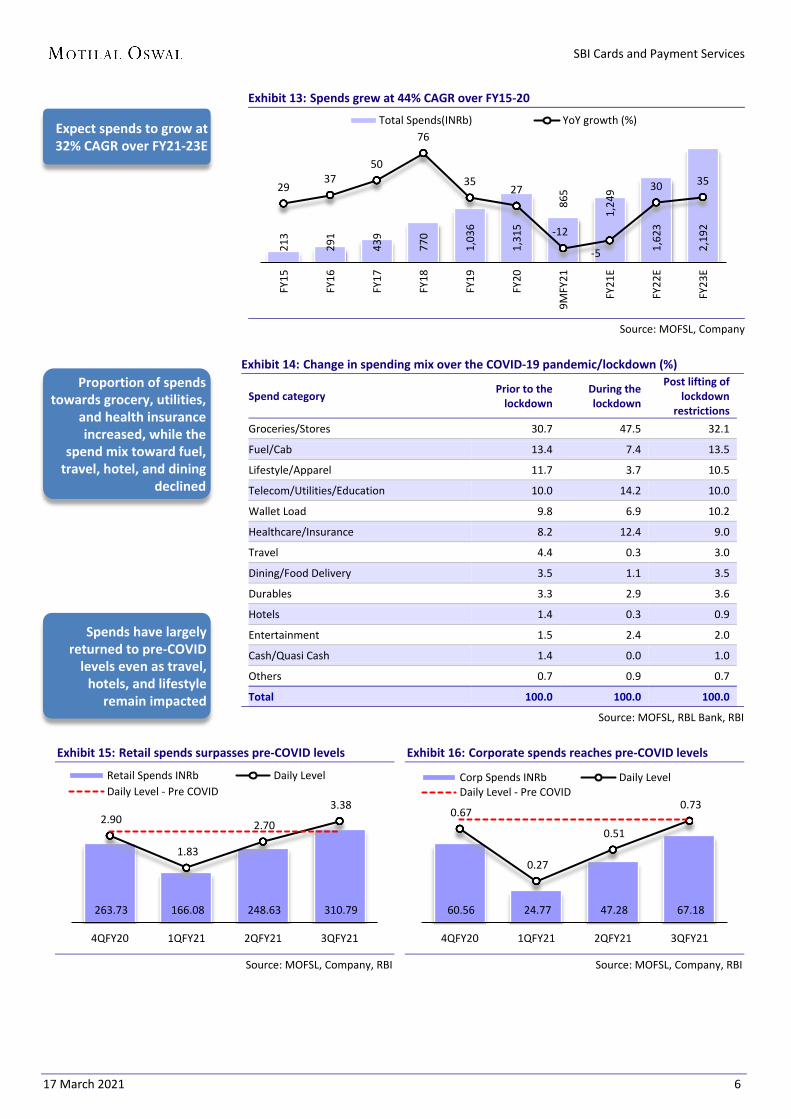
Exhibit 13: Spends grew at 44% CAGR over FY15-20
Source: MOFSL, Company
Exhibit 14: Change in spending mix over the COVID-19 pandemic/lockdown (%)
Spend category Prior to the lockdown
During the lockdown
Post lifting of lockdown
restrictions Groceries/Stores 30.7 47.5 32.1
Fuel/Cab 13.4 7.4 13.5
Lifestyle/Apparel 11.7 3.7 10.5
Telecom/Utilities/Education 10.0 14.2 10.0
Wallet Load 9.8 6.9 10.2
Healthcare/Insurance 8.2 12.4 9.0
Travel 4.4 0.3 3.0
Dining/Food Delivery 3.5 1.1 3.5
Durables 3.3 2.9 3.6
Hotels 1.4 0.3 0.9
Entertainment 1.5 2.4 2.0
Cash/Quasi Cash 1.4 0.0 1.0
Others 0.7 0.9 0.7
Total 100.0 100.0 100.0
Source: MOFSL, RBL Bank, RBI
Exhibit 15: Retail spends surpasses pre-COVID levels
Source: MOFSL, Company, RBI
Exhibit 16: Corporate spends reaches pre-COVID levels
Source: MOFSL, Company, RBI
213
291
439
770
1,0
36
1,3
15
865
1,2
49
1,6
23
2,1
92
29 37
50
76
35 27
-12
-5
30 35
FY15
FY16
FY17
FY18
FY19
FY20
9MFY
21
FY21
E
FY22
E
FY23
E
Total Spends(INRb) YoY growth (%)
263.73 166.08 248.63 310.79
2.90
1.83
2.70
3.38
4QFY20 1QFY21 2QFY21 3QFY21
Retail Spends INRb Daily LevelDaily Level - Pre COVID
60.56 24.77 47.28 67.18
0.67
0.27
0.51
0.73
4QFY20 1QFY21 2QFY21 3QFY21
Corp Spends INRb Daily LevelDaily Level - Pre COVID
Spends have largely returned to pre-COVID
levels even as travel, hotels, and lifestyle
remain impacted
Proportion of spends towards grocery, utilities,
and health insurance increased, while the
spend mix toward fuel, travel, hotel, and dining
declined
Expect spends to grow at 32% CAGR over FY21-23E
SBI Cards and Payment Services
17 March 2021 7
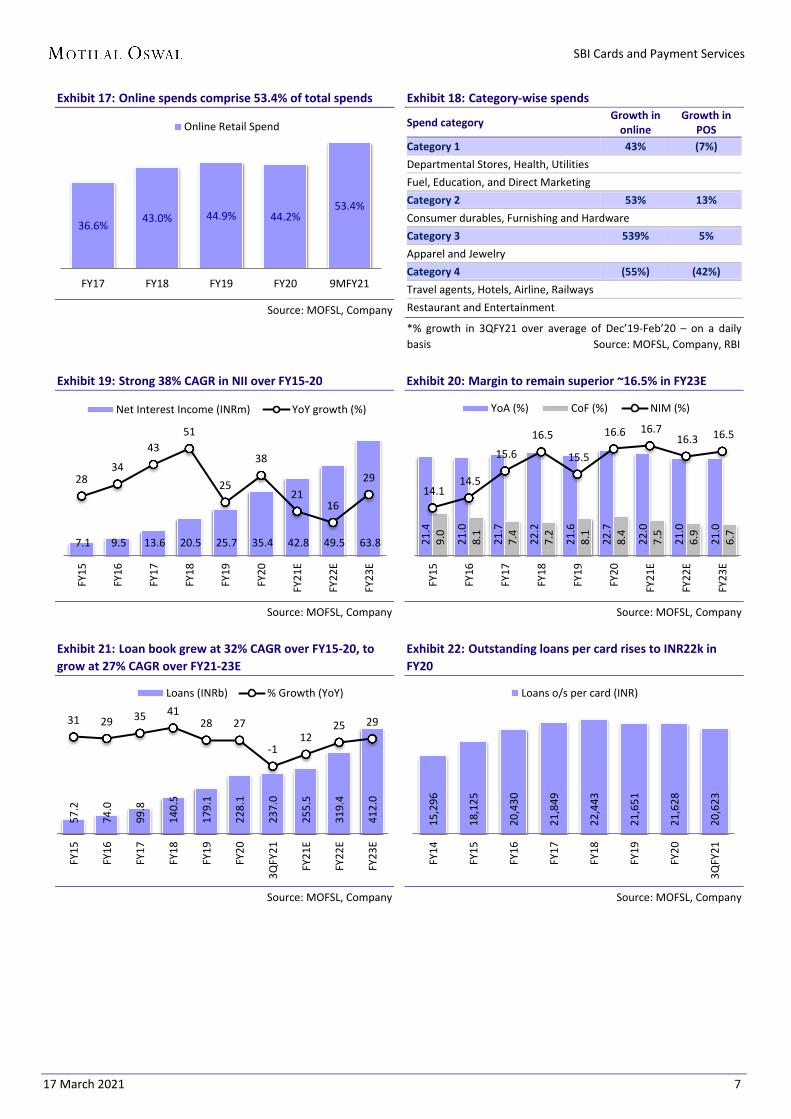
Exhibit 17: Online spends comprise 53.4% of total spends
Source: MOFSL, Company
Exhibit 18: Category-wise spends
Spend category Growth in online
Growth in POS
Category 1 43% (7%) Departmental Stores, Health, Utilities Fuel, Education, and Direct Marketing Category 2 53% 13% Consumer durables, Furnishing and Hardware Category 3 539% 5% Apparel and Jewelry Category 4 (55%) (42%) Travel agents, Hotels, Airline, Railways Restaurant and Entertainment
*% growth in 3QFY21 over average of Dec’19-Feb’20 – on a daily basis Source: MOFSL, Company, RBI
Exhibit 19: Strong 38% CAGR in NII over FY15-20
Source: MOFSL, Company
Exhibit 20: Margin to remain superior ~16.5% in FY23E
Source: MOFSL, Company
Exhibit 21: Loan book grew at 32% CAGR over FY15-20, to grow at 27% CAGR over FY21-23E
Source: MOFSL, Company
Exhibit 22: Outstanding loans per card rises to INR22k in FY20
Source: MOFSL, Company
36.6% 43.0% 44.9% 44.2% 53.4%
FY17 FY18 FY19 FY20 9MFY21
Online Retail Spend
7.1 9.5 13.6 20.5 25.7 35.4 42.8 49.5 63.8
28 34
43 51
25
38
21 16
29
FY15
FY16
FY17
FY18
FY19
FY20
FY21
E
FY22
E
FY23
E
Net Interest Income (INRm) YoY growth (%) 2
1.4
21.
0
21.
7
22.
2
21.
6
22.
7
22.
0
21.
0
21.
0
9.0
8.1
7.4
7.2
8.1
8.4
7.5
6.9
6.7
14.1 14.5
15.6
16.5
15.5
16.6 16.7 16.3 16.5
FY15
FY16
FY17
FY18
FY19
FY20
FY21
E
FY22
E
FY23
E
YoA (%) CoF (%) NIM (%)
57.
2
74.
0
99.
8
140
.5
179
.1
228
.1
237
.0
255
.5
319
.4
412
.0
31 29 35 41 28 27
-112
25 29
FY15
FY16
FY17
FY18
FY19
FY20
3QFY
21
FY21
E
FY22
E
FY23
E
Loans (INRb) % Growth (YoY)
15,2
96
18,1
25
20,4
30
21,8
49
22,4
43
21,6
51
21,6
28
20,6
23
FY14
FY15
FY16
FY17
FY18
FY19
FY20
3QFY
21
Loans o/s per card (INR)
SBI Cards and Payment Services
17 March 2021 8
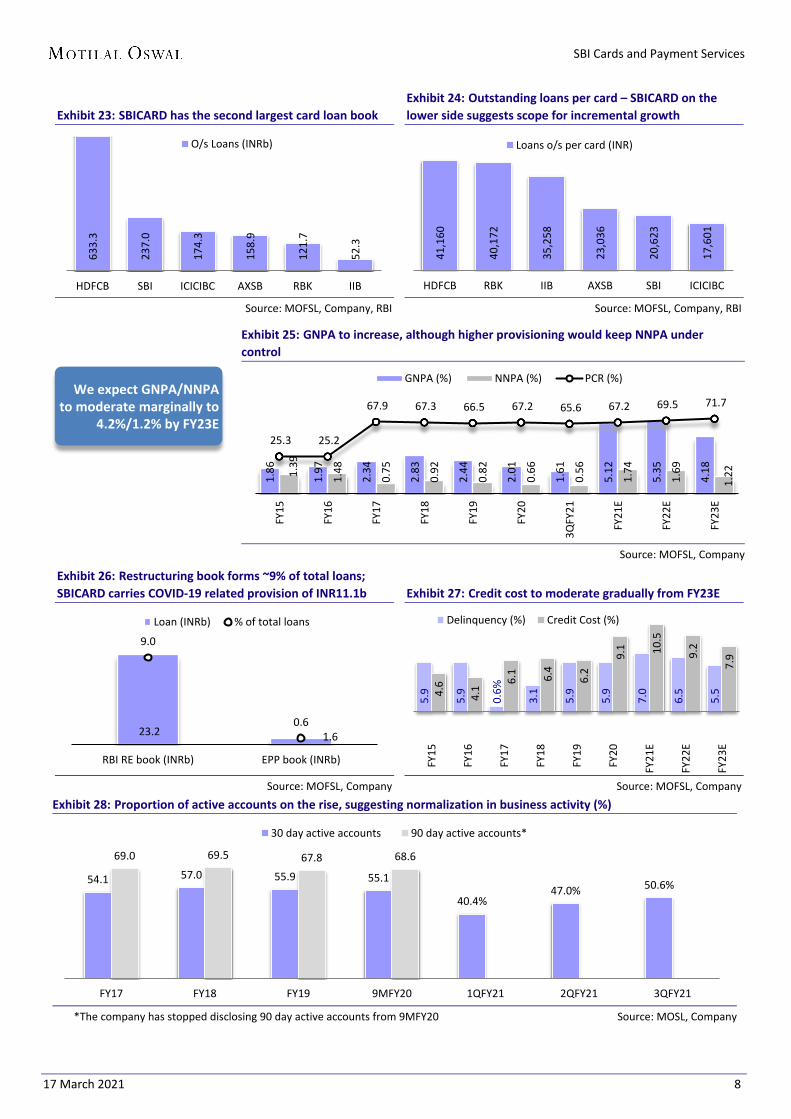
Exhibit 23: SBICARD has the second largest card loan book
Source: MOFSL, Company, RBI
Exhibit 24: Outstanding loans per card – SBICARD on the lower side suggests scope for incremental growth
Source: MOFSL, Company, RBI
Exhibit 25: GNPA to increase, although higher provisioning would keep NNPA under control
Source: MOFSL, Company
Exhibit 26: Restructuring book forms ~9% of total loans; SBICARD carries COVID-19 related provision of INR11.1b
Source: MOFSL, Company
Exhibit 27: Credit cost to moderate gradually from FY23E
Source: MOFSL, Company Exhibit 28: Proportion of active accounts on the rise, suggesting normalization in business activity (%)
*The company has stopped disclosing 90 day active accounts from 9MFY20 Source: MOSL, Company
633
.3
237
.0
174
.3
158
.9
121
.7
52.
3
HDFCB SBI ICICIBC AXSB RBK IIB
O/s Loans (INRb)
41,
160
40,
172
35,
258
23,
036
20,
623
17,
601
HDFCB RBK IIB AXSB SBI ICICIBC
Loans o/s per card (INR)
1.8
6
1.9
7
2.3
4
2.8
3
2.4
4
2.0
1
1.6
1
5.1
2
5.3
5
4.1
8
1.3
9
1.4
8
0.7
5
0.9
2
0.8
2
0.6
6
0.5
6
1.7
4
1.6
9
1.2
2
25.3 25.2
67.9 67.3 66.5 67.2 65.6 67.2 69.5 71.7
FY15
FY16
FY17
FY18
FY19
FY20
3QFY
21
FY21
E
FY22
E
FY23
E
GNPA (%) NNPA (%) PCR (%)
23.2 1.6
9.0
0.6
RBI RE book (INRb) EPP book (INRb)
Loan (INRb) % of total loans
5.9
5.9
0.6%
3.1
5.9
5.9
7.0
6.5
5.5 4.
6
4.1
6.1 6.4
6.2
9.1 10
.5
9.2
7.9
FY15
FY16
FY17
FY18
FY19
FY20
FY21
E
FY22
E
FY23
E
Delinquency (%) Credit Cost (%)
54.1 57.0 55.9 55.1
40.4% 47.0% 50.6%
69.0 69.5 67.8 68.6
FY17 FY18 FY19 9MFY20 1QFY21 2QFY21 3QFY21
30 day active accounts 90 day active accounts*
We expect GNPA/NNPA to moderate marginally to
4.2%/1.2% by FY23E
SBI Cards and Payment Services
17 March 2021 9
Exhibit 29: SBICARD maintains robust return ratios
Source: MOFSL, Company
Exhibit 30: Expect earnings to grow at 47% CAGR over FY21-23E
Source: MOFSL, Company
31.
2
26.
8
28.
6
31.
6
29.
1
27.
9
20.
7
24.
8
28.
4
4.9 4.0 4.0 4.5 4.8
5.5 4.6
5.7 6.6
FY15
FY16
FY17
FY18
FY19
FY20
FY21
E
FY22
E
FY23
E
RoE (%) RoA (%)
3.4 3.6 4.7 7.7 10.7 14.0 13.0
19.2 28.1
-9.06.5
31.3
61.2
39.3 31.4
-7.5
47.7 46.6
FY15 FY16 FY17 FY18 FY19 FY20 FY21E FY22E FY23E
EPS (INR) % Growth (YoY)
Expect SBICARD to report RoA/RoE of 6.6%/28.4%
by FY23E
SBI Cards and Payment Services
17 March 2021 10
Valuation and view: Upgrade to Buy SBICARD has strengthened its position as the second largest card player in the
country, with a market share of ~19% in outstanding cards and ~20% in overallspends. It has an outstanding card base of ~11.5m and has doubled its card baseover the past three years at an average incremental market share of 23%. Thecompany is also the market leader in terms of open market sourcing and is thelargest co-branded card issuer in India.
It has access to parent SBIN's vast network of ~22k branches and customer baseof ~450m, along with strong open market sourcing capabilities. The customeracquisition rate has reversed to normal levels as the impact of COVID-19 haswaned. On account of a robust distribution and co-branded channels, SBICARDis well-placed to capitalize on growth opportunities, as the market remainssignificantly underpenetrated. The management highlighted that incrementalsourcing is likely to be higher from the banca channel, which provides better riskunderwriting and enables lower opex.
Following a sharp deterioration in asset quality in 2QFY21, the GNPA ratioimproved to 1.61% in 3Q v/s 4.29% in 2Q (pro forma GNPA improved to 4.51%v/s 7.5% in 2Q), with the restructuring book stable ~9%. While collections haveimproved, we expect delinquencies to remain high, given the unsecured natureof the book. We expect credit cost to remain elevated in the near term andmoderate gradually from FY23E. We expect GNPA/NNPA of 4.2%/1.2% byFY23E, while PCR would sustain ~72%.
Over FY15-20, SBICARD reported a PPoP/PAT CAGR of 49%/36% and averageRoA/RoE of ~5%/29%. Robust NII (38% CAGR), a superior margin profile(~16.6%), and healthy fee income resulted in a strong operating performance. Ahigher proportion of the interest earning book, coupled with an increase in feeincome, would remain the key earnings driver – even as credit cost may remainelevated, especially up to FY22E. We expect SBICARD to report 47% earningsCAGR over FY21-23E.
The company has a strong track record of growing its card book/earnings. Thishas enabled it to strengthen its lead as the second largest card player in terms ofboth outstanding cards and spends. While COIVD-19 has disrupted its growthtrajectory, recovery has been fairly sharp and retail spends have exceeded pre-COVID levels. We estimate a loan book/earnings CAGR of 27%/47% over FY21-23E and expect margins to remain broadly stable. Asset quality would remainunder pressure in the near term, with a higher proportion of the book underrestructuring, and moderate from FY23E. We estimate SBICARD to reporthealthy return ratios, with RoA/RoE of 6.6%/28.4% in FY23E. The stock hascorrected ~11% since our initiation and is trading at 35x FY23E earnings, which isattractive given its strong fundamentals, earnings growth, and long-termstructural story. At the CMP, the stock offers ~23% upside to our unchanged TPof INR1,200 (43x FY23E EPS). Consequently, we are upgrading our rating to Buy.Our earnings estimates stands unchanged.
SBI Cards and Payment Services
17 March 2021 11
Exhibit 31: Trend in one-year forward P/E
Source: MOFSL, Company
Exhibit 32: Trend in one-year forward P/BV
Source: MOFSL, Company
Exhibit 33: DuPont Analysis – Expect return ratios to pick up from FY22E after moderating in FY21 Y/E March FY16 FY17 FY18 FY19 FY20 FY21E FY22E FY23E
Interest Income 19.53 20.25 20.87 19.96 21.30 21.07 20.18 20.28 Interest Expense 6.09 5.67 5.38 5.63 5.72 5.04 4.54 4.35
Net Interest Income 13.44 14.59 15.49 14.32 15.58 16.02 15.64 15.93
Fee Income 13.21 14.07 16.46 17.15 17.51 15.73 16.98 17.08 Trading and others 2.51 2.91 3.27 3.57 4.10 2.81 3.07 3.13
Non-Interest income 15.72 16.98 19.74 20.71 21.61 18.54 20.05 20.21
Total Income 29.16 31.56 35.23 35.04 37.19 34.56 35.70 36.13
Operating Expenses 19.17 19.73 22.22 21.18 21.04 18.42 19.26 19.71 Employee cost 1.12 1.02 1.46 2.12 2.06 1.89 1.92 1.85 Others 18.05 18.70 20.76 19.07 18.98 16.53 17.34 17.86
Operating Profit 9.99 11.84 13.00 13.86 16.15 16.14 16.44 16.42
Provisions 3.79 5.71 6.05 6.41 8.54 10.05 8.84 7.63 NPA 0.00 4.73 4.52 5.21 5.40 6.22 6.25 5.41 Others 3.79 0.98 1.53 1.19 3.14 3.83 2.59 2.22
PBT 6.20 6.13 6.95 7.45 7.61 6.09 7.60 8.79
Tax 2.18 2.13 2.41 2.62 2.13 1.53 1.91 2.22
RoA 4.02 4.00 4.55 4.83 5.48 4.55 5.68 6.58
Leverage (x) 6.7 7.2 7.0 6.0 5.1 4.5 4.4 4.3
RoE 26.8 28.6 31.6 29.1 27.9 20.7 24.8 28.4
Source: MOFSL, Company
51.0
48.5
57.3
38.5
53.7
43.4
30
38
46
54
62
Mar
-20
Apr-
20
May
-20
Jun-
20
Jul-2
0
Aug-
20
Sep-
20
Oct
-20
Nov
-20
Dec-
20
Jan-
21
Feb-
21
Mar
-21
P/E (x) Avg (x)Max (x) Min (x)+1SD -1SD
12.6
11.4
10.0
7.5
11.5
8.6
6.0
7.8
9.5
11.3
13.0
Mar
-20
Apr-
20
May
-20
Jun-
20
Jul-2
0
Aug-
20
Sep-
20
Oct
-20
Nov
-20
Dec-
20
Jan-
21
Feb-
21
Mar
-21
P/B (x) Avg (x) Max (x)Min (x) +1SD -1SD

SBI Cards and Payment Services
17 March 2021 12
Financials and valuations
Income Statement (INR m) Y/E March FY17 FY18 FY19 FY20 FY21E FY22E FY23E Interest Income 18,882 27,600 35,757 48,413 56,296 63,876 81,265 Interest Expense 5,284 7,115 10,094 13,009 13,480 14,359 17,443 Net Interest Income 13,597 20,485 25,664 35,404 42,816 49,517 63,821 Growth (%) 43.1 50.7 25.3 38.0 20.9 15.6 28.9 Non-Interest Income 15,829 26,102 37,111 49,110 49,543 63,477 80,970 Total Income 29,426 46,587 62,775 84,514 92,359 112,994 144,791 Growth (%) 42.7 58.3 34.7 34.6 9.3 22.3 28.1 Operating Expenses 18,390 29,393 37,947 47,815 49,218 60,967 78,975 Pre Provision Profits 11,036 17,194 24,828 36,699 43,141 52,027 65,815 Growth (%) 56.3 55.8 44.4 47.8 17.6 20.6 26.5 Provisions (excluding tax) 5,320 8,001 11,477 19,402 26,868 27,984 30,571 PBT 5,716 9,193 13,351 17,296 16,273 24,043 35,245 Tax 1,988 3,182 4,701 4,848 4,101 6,059 8,882 Tax Rate (%) 34.8 34.6 35.2 28.0 25.2 25.2 25.2 PAT 3,729 6,011 8,650 12,448 12,172 17,984 26,363 Growth (%) 31.3 61.2 43.9 43.9 -2.2 47.7 46.6 OCI (14) (18) (31) (31) - - - Total Comprehensive Income 3,714 5,993 8,618 12,417 12,172 17,984 26,363 Growth (%) 30.8 61.4 43.8 44.1 -2.0 47.7 46.6
Balance Sheet Y/E March FY17 FY18 FY19 FY20 FY21E FY22E FY23E
Share Capital 7,850 7,850 8,372 9,390 9,390 9,390 9,390 Reserves and Surplus 6,638 15,681 27,506 44,023 55,063 71,349 95,448
Net Worth 14,488 23,531 35,878 53,412 64,452 80,738 104,837
Borrowings 82,684 114,128 135,494 173,649 185,805 230,398 290,301 Other Liabilities and Prov. 10,478 19,201 30,090 25,966 31,160 40,508 54,685
Total Liabilities 107,650 156,860 201,462 253,028 281,417 351,644 449,824 Current Assets 2,829 4,727 7,768 6,760 7,098 7,453 7,826
Investments 0 0 15 15 15 15 15 Growth (%) NA NA NA 0.0 0.0 0.0 0.0 Loans 99,829 140,455 179,087 228,116 255,490 319,363 411,978 Growth (%) 35.0 40.7 27.5 27.4 12.0 25.0 29.0 Fixed Assets 238 2,768 2,164 3,346 3,680 4,048 4,453 Other Assets 4,753 8,910 12,428 14,791 15,133 20,765 25,552
Total Assets 107,650 156,860 201,462 253,028 281,417 351,644 449,824
Asset Quality Y/E March FY17 FY18 FY19 FY20 FY21E FY22E FY23E GNPA (INR m) 2,409 4,125 4,529 4,844 13,553 17,738 17,736 NNPA (INR m) 773 1,348 1,518 1,589 4,443 5,410 5,013 GNPA Ratio 2.3 2.8 2.4 2.0 5.1 5.3 4.2 NNPA Ratio 0.8 0.9 0.8 0.7 1.7 1.7 1.2 Slippage Ratio 0.58 3.13 5.89 5.89 7.00 6.50 5.50 Credit Cost 6.11 6.43 6.21 9.08 10.50 9.20 7.90 PCR (excluding tech. write-off) 67.9 67.3 66.5 67.2 67.2 69.5 71.7
SBI Cards and Payment Services
17 March 2021 13
Financials and valuations
Business Metrics Y/E March FY17 FY18 FY19 FY20 FY21E FY22E FY23E Total no. of cards (in m) 4.6 6.3 8.3 10.5 12.1 15.2 19.7 Total spends (INR b) 438.5 770.2 1,036.0 1,314.5 1,248.8 1,623.4 2,191.6 Spends per card (INR’000) 96.0 123.1 125.3 124.6 103.0 107.1 111.2 Loans per card (INR) 21,849 22,443 21,651 21,628 21,063 21,063 20,901 Loans as a percentage of spends 22.8 18.2 17.3 17.4 20.5 19.7 18.8 Fee income earned per card 2,871 3,479 3,714 3,772 3,465 3,545 3,472
Ratios Y/E March FY17 FY18 FY19 FY20 FY21E FY22E FY23E Yield and cost ratios (%) Average yield on loans 21.7 22.2 21.6 22.7 22.0 21.0 21.0 Average cost of borrowings 7.4 7.2 8.1 8.4 7.5 6.9 6.7 Interest Spread 14.3 15.0 13.5 14.3 14.5 14.1 14.3 Net Interest Margin 15.6 16.5 15.5 16.6 16.7 16.3 16.5
Capitalization Ratios (%) CAR 11.3 12.4 14.9 17.7 19.9 20.2 20.5 Tier I 4.4 5.9 5.3 4.7 4.2 3.3 2.5 Tier II 15.7 18.3 20.1 22.4 24.1 23.4 23.0
Asset-Liability Profile (%) Cost/Assets 19.7 22.2 21.2 21.0 18.4 19.3 19.7 Cost/Total Income 62.5 63.1 60.4 56.6 53.3 54.0 54.5 Int. Expense/Int. Income 28.0 25.8 28.2 26.9 23.9 22.5 21.5 Fee Income/Total Income 44.6 46.7 48.9 47.1 45.5 47.6 47.3 Non Int. Inc./Total Income 53.8 56.0 59.1 58.1 53.6 56.2 55.9 Empl. Cost/Total Expense 5.2 6.6 10.0 9.8 10.3 10.0 9.4
Valuation RoE 28.6 31.6 29.1 27.9 20.7 24.8 28.4 RoA 4.0 4.5 4.8 5.5 4.6 5.7 6.6 RoRWA 3.7 4.8 5.2 5.9 4.8 5.9 6.6
Book Value (INR) 18.5 30.0 42.9 56.9 68.6 86.0 111.7 Growth (%) 25.4 62.4 43.0 32.7 20.7 25.3 29.8 Price-to-BV (x) 52.9 32.6 22.8 17.2 14.2 11.4 8.7
Adjusted BV (INR) 17.8 28.8 41.6 55.7 65.3 82.0 107.9 Price-to-ABV (x) 55.0 33.9 23.5 17.5 15.0 11.9 9.1
EPS (INR) 4.7 7.7 10.7 14.0 13.0 19.2 28.1 Growth (%) 31.3 61.2 39.3 31.4 -7.5 47.7 46.6 Price-to-Earnings (x) 205.6 127.5 91.6 69.7 75.3 51.0 34.8
Dividend Per Share (INR) 1.2 - 1.2 0.0 1.2 1.8 2.4 Dividend Yield (%) 0.1 0.0 0.1 0.0 0.1 0.2 0.2

SBI Cards and Payment Services
17 March 2021 14
N O T E S

SBI Cards and Payment Services
17 March 2021 15
Explanation of Investment Rating Investment Rating Expected return (over 12-month) BUY >=15% SELL < - 10% NEUTRAL < - 10 % to 15% UNDER REVIEW Rating may undergo a change NOT RATED We have forward looking estimates for the stock but we refrain from assigning recommendation *In case the recommendation given by the Research Analyst is inconsistent with the investment rating legend for a continuous period of 30 days, the Research Analyst shall within following 30 days take appropriate measures to make the recommendation consistent with the investment rating legend. Disclosures The following Disclosures are being made in compliance with the SEBI Research Analyst Regulations 2014 (herein after referred to as the Regulations). Motilal Oswal Financial Services Ltd. (MOFSL) is a SEBI Registered Research Analyst having registration no. INH000000412. MOFSL, the Research Entity (RE) as defined in the Regulations, is engaged in the business of providing Stock broking services, Investment Advisory Services, Depository participant services & distribution of various financial products. MOFSL is a subsidiary company of Passionate Investment Management Pvt. Ltd.. (PIMPL). MOFSL is a listed public company, the details in respect of which are available on www.motilaloswal.com. MOFSL(erstwhile Motilal Oswal Securities Limited - MOSL) is registered with the Securities & Exchange Board of India (SEBI) and is a registered Trading Member with National Stock Exchange ofIndia Ltd. (NSE) and Bombay Stock Exchange Limited (BSE), Multi Commodity Exchange of India Limited (MCX) and National Commodity & Derivatives Exchange Limited (NCDEX) for itsstock broking activities & is Depository participant with Central Depository Services Limited (CDSL) National Securities Depository Limited (NSDL),NERL, COMRIS and CCRL and is memberof Association of Mutual Funds of India (AMFI) for distribution of financial products and Insurance Regulatory & Development Authority of India (IRDA) as Corporate Agent for insurance products. Details of associate entities of Motilal Oswal Financial Services Limited are available on the website athttp://onlinereports.motilaloswal.com/Dormant/documents/List%20of%20Associate%20companies.pdf MOFSL and its associate company(ies), their directors and Research Analyst and their relatives may; (a) from time to time, have a long or short position in, act as principal in, and buy or sell the securities or derivatives thereof of companies mentioned herein. (b) be engaged in any other transaction involving such securities and earn brokerage or other compensation or act as amarket maker in the financial instruments of the company(ies) discussed herein or act as an advisor or lender/borrower to such company(ies) or may have any other potential conflict of interests with respect to any recommendation and other related information and opinions.; however the same shall have no bearing whatsoever on the specific recommendations made by the analyst(s), as the recommendations made by the analyst(s) are completely independent of the views of the associates of MOFSL even though there might exist an inherent conflict of interest in some of the stocks mentioned in the research report MOFSL and / or its affiliates do and seek to do business including investment banking with companies covered in its research reports. As a result, the recipients of this report should be aware that MOFSL may have a potential conflict of interest that may affect the objectivity of this report. Compensation of Research Analysts is not based on any specific merchant banking, investment banking or brokerage service transactions. Details of pending Enquiry Proceedings of Motilal Oswal Financial Services Limited are available on the website athttps://galaxy.motilaloswal.com/ResearchAnalyst/PublishViewLitigation.aspx A graph of daily closing prices of securities is available at www.nseindia.com, www.bseindia.com. Research Analyst views on Subject Company may vary based on Fundamental research and Technical Research. Proprietary trading desk of MOFSL or its associates maintains arm’s length distance with Research Team as all the activities are segregated from MOFSL research activity and therefore it can have an independent view with regards to Subject Company for which Research Team have expressed their views. Regional Disclosures (outside India) This report is not directed or intended for distribution to or use by any person or entity resident in a state, country or any jurisdiction, where such distribution, publication, availability or usewould be contrary to law, regulation or which would subject MOFSL & its group companies to registration or licensing requirements within such jurisdictions. For Hong Kong: This report is distributed in Hong Kong by Motilal Oswal capital Markets (Hong Kong) Private Limited, a licensed corporation (CE AYY-301) licensed and regulated by the Hong Kong Securities and Futures Commission (SFC) pursuant to the Securities and Futures Ordinance (Chapter 571 of the Laws of Hong Kong) “SFO”. As per SEBI (Research Analyst Regulations) 2014 MotilalOswal Securities (SEBI Reg No. INH000000412) has an agreement with Motilal Oswal capital Markets (Hong Kong) Private Limited for distribution of research report in Hong Kong. This report is intended for distribution only to “Professional Investors” as defined in Part I of Schedule 1 to SFO. Any investment or investment activity to which this document relates is only available toprofessional investor and will be engaged only with professional investors.” Nothing here is an offer or solicitation of these securities, products and services in any jurisdiction where their offer or sale is not qualified or exempt from registration. The Indian Analyst(s) who compile this report is/are not located in Hong Kong & are not conducting Research Analysis in Hong Kong. For U.S. Motilal Oswal Financial Services Limited (MOFSL) is not a registered broker - dealer under the U.S. Securities Exchange Act of 1934, as amended (the"1934 act") and under applicable state laws in the United States. In addition MOFSL is not a registered investment adviser under the U.S. Investment Advisers Act of 1940, as amended (the "Advisers Act" and together with the 1934 Act, the "Acts), and under applicable state laws in the United States. Accordingly, in the absence of specific exemption under the Acts, any brokerage and investment services provided byMOFSL , including the products and services described herein are not available to or intended for U.S. persons. This report is intended for distribution only to "Major Institutional Investors" as defined by Rule 15a-6(b)(4) of the Exchange Act and interpretations thereof by SEC (henceforth referred to as "major institutional investors"). This document must not be acted on or relied on by persons who are not major institutional investors. Any investment or investment activity to which this document relates is only available to major institutional investors and will be engaged in only with major institutional investors. In reliance on the exemption from registration provided by Rule 15a-6 of the U.S. Securities Exchange Act of 1934, as amended (the "Exchange Act") and interpretations thereof by the U.S. Securities and Exchange Commission ("SEC") in order to conduct business with Institutional Investors based in the U.S., MOFSL has entered into achaperoning agreement with a U.S. registered broker-dealer, Motilal Oswal Securities International Private Limited. ("MOSIPL"). Any business interaction pursuant to this report will have to be executed within the provisions of this chaperoning agreement. The Research Analysts contributing to the report may not be registered /qualified as research analyst with FINRA. Such research analyst may not be associated persons of the U.S. registered broker-dealer, MOSIPL, and therefore, may not be subject to NASD rule 2711 and NYSE Rule 472 restrictions on communication with a subject company, public appearances and tradingsecurities held by a research analyst account. For Singapore In Singapore, this report is being distributed by Motilal Oswal Capital Markets Singapore Pte Ltd (“MOCMSPL”) (Co.Reg. NO. 201129401Z) which is a holder of a capital markets serviceslicense and an exempt financial adviser in Singapore.As per the approved agreement under Paragraph 9 of Third Schedule of Securities and Futures Act (CAP 289) and Paragraph 11 of First Schedule of Financial Advisors Act (CAP 110) provided to MOCMSPL by Monetary Authority of Singapore. Persons in Singapore should contact MOCMSPL in respect of any matter arisingfrom, or in connection with this report/publication/communication. This report is distributed solely to persons who qualify as “Institutional Investors”, of which some of whom may consist of"accredited" institutional investors as defined in section 4A(1) of the Securities and Futures Act, Chapter 289 of Singapore (“the SFA”). Accordingly, if a Singapore person is not or ceases to be such an institutional investor, such Singapore Person must immediately discontinue any use of this Report and inform MOCMSPL. Specific Disclosures 1 MOFSL, Research Analyst and/or his relatives does not have financial interest in the subject company, as they do not have equity holdings in the subject company. 2 MOFSL, Research Analyst and/or his relatives do not have actual/beneficial ownership of 1% or more securities in the subject company 3 MOFSL, Research Analyst and/or his relatives have not received compensation/other benefits from the subject company in the past 12 months 4 MOFSL, Research Analyst and/or his relatives do not have material conflict of interest in the subject company at the time of publication of research report 5 Research Analyst has not served as director/officer/employee in the subject company 6 MOFSL has not acted as a manager or co-manager of public offering of securities of the subject company in past 12 months 7 MOFSL has not received compensation for investment banking/ merchant banking/brokerage services from the subject company in the past 12 months 8 MOFSL has not received compensation for other than investment banking/merchant banking/brokerage services from the subject company in the past 12 months 9 MOFSL has not received any compensation or other benefits from third party in connection with the research report 10 MOFSL has not engaged in market making activity for the subject company ******************************************************************************************************************************** The associates of MOFSL may have: - financial interest in the subject company - actual/beneficial ownership of 1% or more securities in the subject company - received compensation/other benefits from the subject company in the past 12 months
SBI Cards and Payment Services
17 March 2021 16
- other potential conflict of interests with respect to any recommendation and other related information and opinions.; however the same shall have no bearing whatsoever on the specific recommendations made by the analyst(s), as the recommendations made by the analyst(s) are completely independent of the views of the associates of MOFSL even though there might exist an inherent conflict of interest in some of the stocks mentioned in the research report.
- acted as a manager or co-manager of public offering of securities of the subject company in past 12 months - be engaged in any other transaction involving such securities and earn brokerage or other compensation or act as a market maker in the financial instruments of the company(ies)
discussed herein or act as an advisor or lender/borrower to such company(ies) - received compensation from the subject company in the past 12 months for investment banking / merchant banking / brokerage services or from other than said services. The associates of MOFSL has not received any compensation or other benefits from third party in connection with the research report Above disclosures include beneficial holdings lying in demat account of MOFSL which are opened for proprietary investments only. While calculating beneficial holdings, It does not consider demat accounts which are opened in name of MOFSL for other purposes (i.e holding client securities, collaterals, error trades etc.). MOFSL also earns DP income from clients which are not considered in above disclosures. Analyst Certification The views expressed in this research report accurately reflect the personal views of the analyst(s) about the subject securities or issues, and no part of the compensation of the research analyst(s) was, is, or will be directly or indirectly related to the specific recommendations and views expressed by research analyst(s) in this report. Terms & Conditions: This report has been prepared by MOFSL and is meant for sole use by the recipient and not for circulation. The report and information contained herein is strictly confidential and may not be altered in any way, transmitted to, copied or distributed, in part or in whole, to any other person or to the media or reproduced in any form, without prior written consent of MOFSL. The report is based on the facts, figures and information that are considered true, correct, reliable and accurate. The intent of this report is not recommendatory in nature. The information is obtained from publicly available media or other sources believed to be reliable. Such information has not been independently verified and no guaranty, representation of warranty, express or implied, is made as to its accuracy, completeness or correctness. All such information and opinions are subject to change without notice. The report is prepared solely for informational purpose and does not constitute an offer document or solicitation of offer to buy or sell or subscribe for securities or other financial instruments for the clients. Though disseminated to all the customers simultaneously, not all customers may receive this report at the same time. MOFSL will not treat recipients as customers by virtue of their receiving this report. Disclaimer: The report and information contained herein is strictly confidential and meant solely for the selected recipient and may not be altered in any way, transmitted to, copied or distributed, in part or in whole, to any other person or to the media or reproduced in any form, without prior written consent. This report and information herein is solely for informational purpose and may not be used or considered as an offer document or solicitation of offer to buy or sell or subscribe for securities or other financial instruments. Nothing in this report constitutes investment, legal, accounting and tax advice or a representation that any investment or strategy is suitable or appropriate to your specific circumstances. The securities discussed and opinions expressed in this report may not be suitable for all investors, who must make their own investment decisions, based on their own investment objectives, financial positions and needs of specific recipient. This may not be taken in substitution for the exercise of independent judgment by any recipient. Each recipient of this document should make such investigations as it deems necessary to arrive at an independent evaluation of an investment in the securities of companies referred to in this document (including the merits and risks involved), and should consult its own advisors to determine the merits and risks of such an investment. The investment discussed or views expressed may not be suitable for all investors. Certain transactions -including those involving futures, options, another derivative products as well as non-investment grade securities - involve substantial risk and are not suitable for all investors. No representation or warranty, express or implied, is made as to the accuracy, completeness or fairness of the information and opinions contained in this document. The Disclosures of Interest Statement incorporated in this document is provided solely to enhance the transparency and should not be treated as endorsement of the views expressed in the report. This information is subject to change without any prior notice. The Company reserves the right to make modifications and alternations to this statement as may be required from time to time without any prior approval. MOFSL, its associates, their directors and the employees may from time to time, effect or have effected an own account transaction in, or deal as principal or agent in or for the securities mentioned in this document. They may perform or seek to perform investment banking or other services for, or solicit investment banking or other business from, any company referred to in this report. Each of these entities functions as a separate, distinct and independent of each other. The recipient should take this into account before interpreting the document. This report has been prepared on the basis of information that is already available in publicly accessible media or developed through analysis of MOFSL. The views expressed are those of the analyst, and the Company may or may not subscribe to all the views expressed therein. This document is being supplied to you solely for your information and may not be reproduced, redistributed or passed on, directly or indirectly, to any other person or published, copied, in whole or in part, for any purpose. This report is not directed or intended for distribution to, or use by, any person or entity who is a citizen or resident of or located in any locality, state, country or other jurisdiction, where such distribution, publication, availability or use would be contrary to law, regulation or which would subject MOFSL to any registration or licensing requirement within such jurisdiction. The securities described herein may or may not be eligible for sale in all jurisdictions or to certain category of investors. Persons in whose possession this document may come are required to inform themselves of and to observe such restriction. Neither the Firm, not its directors, employees, agents or representatives shall be liable for any damages whether direct or indirect, incidental, special or consequential including lost revenue or lost profits that may arise from or in connection with the use of the information. The person accessing this information specifically agrees to exempt MOFSL or any of its affiliates or employees from, any and all responsibility/liability arising from such misuse and agrees not to hold MOFSL or any of its affiliates or employees responsible for any such misuse and further agrees to hold MOFSL or any of its affiliates or employees free and harmless from all losses, costs, damages, expenses that may be suffered by the person accessing this information due to any errors and delays. Registered Office Address: Motilal Oswal Tower, Rahimtullah Sayani Road, Opposite Parel ST Depot, Prabhadevi, Mumbai-400025; Tel No.: 022 71934200/ 022-71934263; Website www.motilaloswal.com.CIN no.: L67190MH2005PLC153397.Correspondence Office Address: Palm Spring Centre, 2nd Floor, Palm Court Complex, New Link Road, Malad(West), Mumbai- 400 064. Tel No: 022 7188 1000. Registration Nos.: Motilal Oswal Financial Services Limited (MOFSL)*: INZ000158836(BSE/NSE/MCX/NCDEX); CDSL and NSDL: IN-DP-16-2015; Research Analyst: INH000000412. AMFI: ARN - 146822; Investment Adviser: INA000007100; Insurance Corporate Agent: CA0579;PMS:INP000006712. Motilal Oswal Asset Management Company Ltd. (MOAMC): PMS (Registration No.: INP000000670); PMS and Mutual Funds are offered through MOAMC which is group company of MOFSL. Motilal Oswal Wealth Management Ltd. (MOWML): PMS (Registration No.: INP000004409) is offered through MOWML, which is a group company of MOFSL. Motilal Oswal Financial Services Limited is a distributor of Mutual Funds, PMS, Fixed Deposit, Bond, NCDs,Insurance Products and IPOs.Real Estate is offered through Motilal Oswal Real Estate Investment Advisors II Pvt. Ltd. which is a group company of MOFSL. Private Equity is offered through Motilal Oswal Private Equity Investment Advisors Pvt. Ltd which is a group company of MOFSL. Research & Advisory services is backed by proper research. Please read the Risk Disclosure Document prescribed by the Stock Exchanges carefully before investing. There is no assurance or guarantee of the returns. Investment in securities market is subject to market risk, read all the related documents carefully before investing. Details of Compliance Officer: Name: Neeraj Agarwal, Email ID: [email protected], Contact No.:022-71881085. * MOSL has been amalgamated with Motilal Oswal Financial Services Limited (MOFSL) w.e.f August 21, 2018 pursuant to order dated July 30, 2018 issued by Hon'ble National Company Law Tribunal, Mumbai Bench.