macedonian youth study 2013
TRANSCRIPT

YOUTH STUDY MACEDONIA 2013
ИН С ТИ Т У Т З АСОЦИОЛОШКИ ИП О Л И Т И Ч К ОП Р А В Н ИИС ТР АЖУ В АЊ А
Уни
верзи
тет
„Св.
Кирил
иМ
ето
диј“
Published by:Friedrich-Ebert-Stiftung, Skopje Office www.fes.org.mk
Authors:Doc. Dr. Marija Topuzovska LatkovicProf. Dr. Mirjana Borota PopovskaDoc. Dr. Eleonora SerafimovskaDoc. Dr. Aneta Cekic
Translated by:Blerina Starova Zlatku
Designed and printed by:Kontura
Copies: 500
CIP - Каталогизација во публикација
Национална и универзитетска библиотека „Св. Климент Охридски“, Скопје
303.43-053.6(497.7)(043.7)
СТУДИЈА за младите во Република Македонија / [автори... Марија Топузовска Латковиќ... и др.]. - Скопје : Фондација „Фридрих Еберт“, Канцеларија во Македонија, 2013. - 132 стр. : табели, граф. прикази ; 24 см
Автори: Марија Топузовска Латковиќ, Мирјана Борота Поповска, Елеонора Серафимовска, Анета Цекиќ
ISBN 978-9989-109-73-71.Топузовска Латковиќ, Марија [автор] 2. Борота Поповска, Мирјана [автор] 3. Серафимовска, Елеонора [автор] 4. Цекиќ, Анета [автор] а) Млади - Социолошки истражувања - МакедонијаCOBISS.MK-ID 95316234
A commercial use of the media published by the Friedrich-Ebert-Stiftung is not allowed without written approval by the Friedrich-Ebert-Stiftung.
CONTENT
FOREWORD 5
INTRODUCTION 7
USED METHODOLOGY 9
DEMOGRAPHIC DATA 12
LIFESTYLE AND LEISURE 14
BELIEFS AND AFFILIATIONS 27
FAMILY AND SOCIETY 40
CONCERNS AND ASPIRATIONS 54
EDUCATION AND EMPLOYMENT 68
DEMOCRACY AND POLITICS 95
MANAGEMENT AND DEVELOPMENT 115
NATION AND WORLD 123


5
FOREWORD
After the breakup of Yugoslavia, the countries in the region faced major political, social and economic changes and turmoil. In the transition period and the formation of independent nation-states, in building their own identity and democratic values, these countries have been striving towards integration into the European Union. Since 17.12.2005, Macedonia is a candidate country, similar to Serbia (1.3.2012) and Montenegro (17.12.2010), while this year in 2013, Croatia, became member of the EU.
Following all these developments and changes, and in order to measure the attitudes, desires and expectations of young people in countries of the former Yugoslavia, the Friedrich Ebert Foundation initiated the implementation of a study on youth in the region. The idea derives from the famous Shell Youth Study, which is conducted regularly every three to four years in Germany since 1953, which shows that young people can be an indicator of future trends in society and the long-term prospects of the country. Klaus Hurrelmann, professor at Hertie School of Governance and the head of Shell Youth Studies in Germany coordinated also the FES Youth studies in the countries of Southeast Europe. With his assistance, youth studies were already conducted in Croatia, Albania and Kosovo, and recently in Macedonia. National Youth Studies are expected to be implemented in other countries in the region in 2014. All surveys are implemented according to the same methodology, enabling further comparative analysis of the results.
In Macedonia, the study was conducted during 2013 by the Institute for Sociological, Political and Legal Studies at the University of Ss. Cyril and Methodius in Skopje. The study shows that young people in Macedonia have the most trust in close family members, relatives and friends, and the least trust in political and religious leaders. Most of young people live with their family, mostly for practical reasons or simply because it is considered “normal”. In the future, they wish to get married, at the age of 25-28 years and have only two children. The influence of the family is evident even in the decision making process, where the father still has the greatest impact, although there is a certain percentage of young people who can make decisions independently. There is a low participation in volunteer activities and a high degree of homophobia as far as homosexuality and different ethnicities are concerned, suggesting a low degree of transparency to diversity.
Young people show dissatisfaction with the financial situation which grows proportionally with age. Almost 71% rate the economic situation in Macedonia as bad or very bad and provide pessimistic forecasts for the coming years. Hence the fact, which is particularly worrying, is that half of young people consider leaving
6 YOUTH STUDY MACEDONIA 2013
the country, mostly due to financial reasons, whereas a third of them would even never plan to return. The most preferred job for a young person is employment within the public administration and they consider that this employment is gained through friends and political ties. The strong affinity towards the family is also expressed in terms of political beliefs, which in large parts are similar to those of the parents. There is a great interest in the political developments in the country, but not for the developments in the region, Europe and the world.
However, despite the mistrust, there is a degree of optimism regarding the EU integration of Macedonia, where they see hope for economic and political prosperity of the country.
Nita StarovaProject Coordinator Youth ProgramsFriedrich Ebert Stiftung - Macedonia
7
INTRODUCTION
The main objective of this study is to measure, describe and explain the main attitudes, beliefs and values of the young Macedonian population in terms of: society, economy, education, employment, integration into the European Union, religion, family, social life and lifestyle preferences. The studies on youth have always been, and still are the subject of great interest, but the idea and initiative for this research which comes from FEF comes at the right time because the young Macedonian population, and the young population worldwide belong to the generation known as the world’s Millennium generation, or generation Y (born between 1981 to 1999). It is believed that the young generation of this group have a very specific and unique set of values, characteristics and preferences, because these young people have witnessed many social and economic transformations in their recent past and is a generation that grew up in a pinnacle period of technological innovation.
In particular the young from the Balkans, or more specifically, the countries of the former Yugoslavia, have witnessed more dramatic and striking events: civil wars, the collapse of the federal country and separation into smaller independent states, transition from communism to capitalism, the long process of transition, privatization of social ownership, visa bans and visa liberalization, changes in domestic and foreign currencies, high rates of unemployment and poverty - as opposed to instant enrichment, a variety of political and governmental change. On the other hand, they witnessed the era of innovation in computers, mobile phones and the Internet, which was a kind of revolution and the beginning of a new, contemporary way of life, features of the 21st century.
We recognize that the future is in the hands of young people, who have the potential to be agents of change and improvement of economy and democracy, while, similarly they represent the next generation of: leaders, politicians, educators, employers and employees, citizens of the European Union and the world. Therefore, this research study is exceptionally essential because its primary purpose is to explain and describe the: mindset, trends, value systems and behaviour of young people.
This study is perhaps even more important owing to the utilization of modern and advanced methodological approach and identical research instruments such as in other studies (Albania, Kosovo, Croatia), offering opportunities for future comparative analyzes of the data and that can be used to design and develop strategies and policies, both at national and regional level.
Also, the results can facilitate and accelerate the process of EU integration, by identifying the points of concurrence and divergence between Macedonia (Balkan/Southeast) and the European identity of the young population and expectations for the future.

8 YOUTH STUDY MACEDONIA 2013
I would like to thank colleagues from the expert team of ISPPI for the enthusiasm, professionalism and dedication in the preparation of the study, the representatives of FEF for their trust and cooperation, and professor Klaus Hurrelmann PhD for the contribution in the process of defining the research procedures and setting clear expectations from research.
Docent Marija Topuzovska Latkovich PhDProject Coordinator for ISPPI
9
USED METHODOLOGY
The research methodology for the study is provided in the agreement between responsible persons of FEF, the members of the expert team of ISPPI and the consultant Klaus Hurelman PhD, identifiable by Shell studies for youth in Germany.
Timeframe
The activities related to all phases of the development of the “Youth Study Macedonia 2013 “ took place in: September, October and November 2013.
Methodological Approach
For the purpose of the research, a combined approach of quantitative and qualitative techniques and procedures is used. A survey research is conducted (face to face) of a representative sample of youth and thorough semi-structured interviews with typical and atypical representatives of youth population.
Design of the Sample
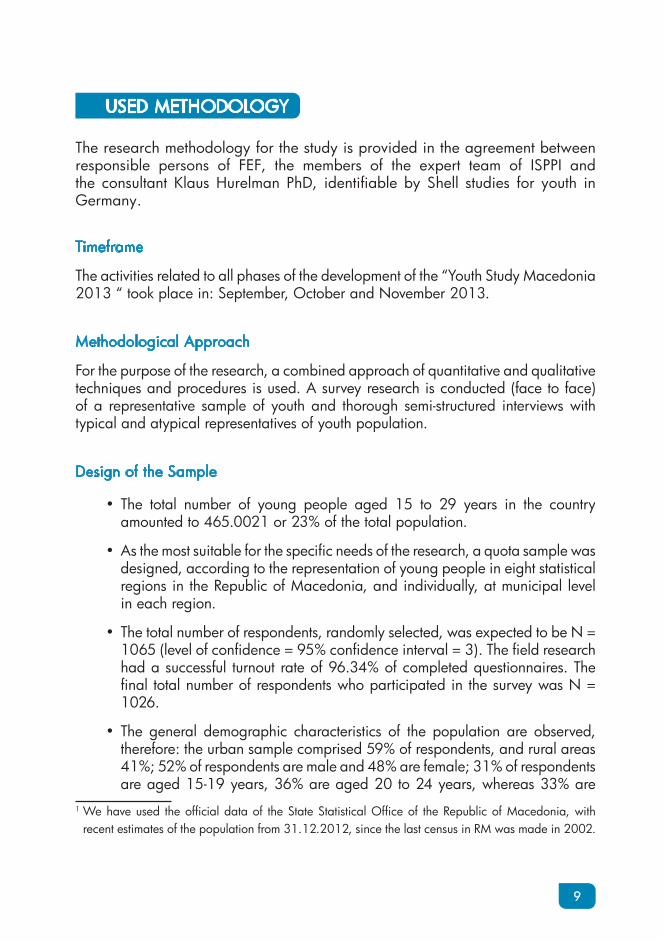
•• The total number of young people aged 15 to 29 years in the country amounted to 465.0021 or 23% of the total population.
•• As the most suitable for the specific needs of the research, a quota sample was designed, according to the representation of young people in eight statistical regions in the Republic of Macedonia, and individually, at municipal level in each region.
•• The total number of respondents, randomly selected, was expected to be N = 1065 (level of confidence = 95% confidence interval = 3). The field research had a successful turnout rate of 96.34% of completed questionnaires. The final total number of respondents who participated in the survey was N = 1026.
•• The general demographic characteristics of the population are observed, therefore: the urban sample comprised 59% of respondents, and rural areas 41%; 52% of respondents are male and 48% are female; 31% of respondents are aged 15-19 years, 36% are aged 20 to 24 years, whereas 33% are
1 We have used the official data of the State Statistical Office of the Republic of Macedonia, with recent estimates of the population from 31.12.2012, since the last census in RM was made in 2002.
10 YOUTH STUDY MACEDONIA 2013
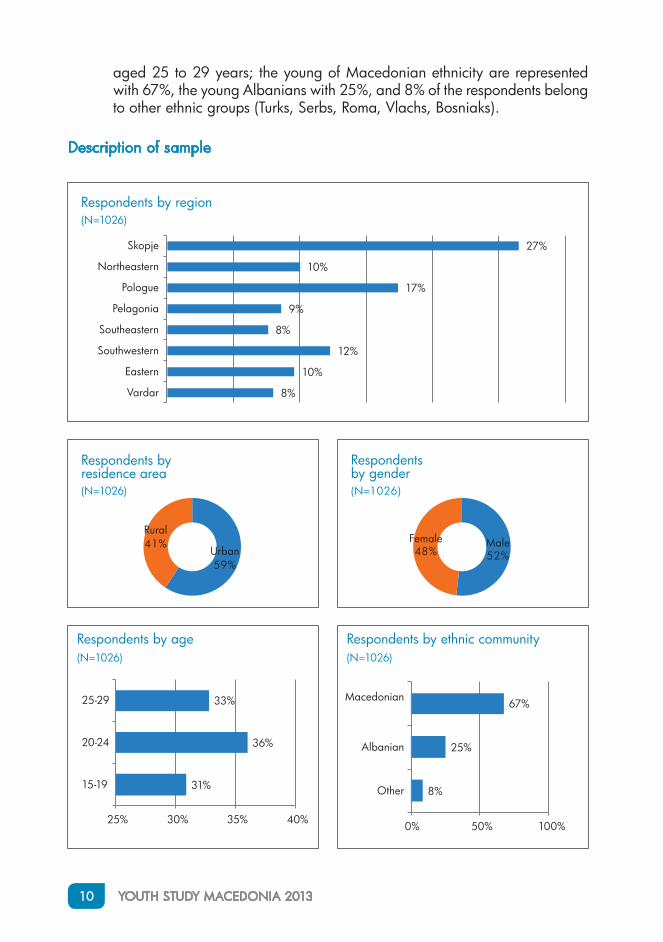
aged 25 to 29 years; the young of Macedonian ethnicity are represented with 67%, the young Albanians with 25%, and 8% of the respondents belong to other ethnic groups (Turks, Serbs, Roma, Vlachs, Bosniaks).
Description of sample
8%
10%
12%
8%
9%
17%
10%
27%
Vardar
Eastern
Southwestern
Southeastern
Pelagonia
Pologue
Northeastern
Skopje
Respondents by region(N=1026)
Urban59%
Rural41%
Respondents byresidence area(N=1026)
Male52%
Female48%
Respondentsby gender(N=1026)
31%
36%
33%
25% 30% 35% 40%
15-19
20-24
25-29
Respondents by age(N=1026)
8%
25%
67%
0% 50% 100%
Other
Albanian
Macedonian
Respondents by ethnic community(N=1026)
11USED METHODOLOGY
Research instrument
The survey questionnaire was 90% identical to the questionnaire used in the study on youth, supported by KAS, in Kosovo, Croatia and Albania, which provides additional opportunity for comparative analysis of the results to other countries.
The questionnaire, in addition to demographic data, is composed of questions divided into eight thematic sections:
•• lifestyle and leisure
•• beliefs and affiliations
•• family and society
•• concerns and aspirations
•• education and employment
•• democracy and politics
•• management and development
•• nation and world
Data Analysis
The obtained data were analysed in:•• Univariate level (through general rate and average values);
•• Bivariate level (through cross-tabulation, comparison of average values , correlation);
•• Multivariate level (ANOVA).
Testing of the statistically significant differences among different categories is made mainly by checking the HI-square, and through the Independent T Test and Duncan’s Post Hoc Test.
Presentation and interpretation of results
•• Quantitative componentThe paper presents the results obtained with the general distribution of responses and cases in which a statistically significant difference is confirmed, and it applies to 95% of young people (significance level p<0.05).
•• Qualitative componentSpecially marked sections in the text gives quotes from conducted verbal interviews, appropriate to the analysed topic. It is necessary to bear in mind that it is not possible to extract generalized conclusions for young people from the qualitative data.
12 YOUTH STUDY MACEDONIA 2013
DEMOGRAPHIC DATA
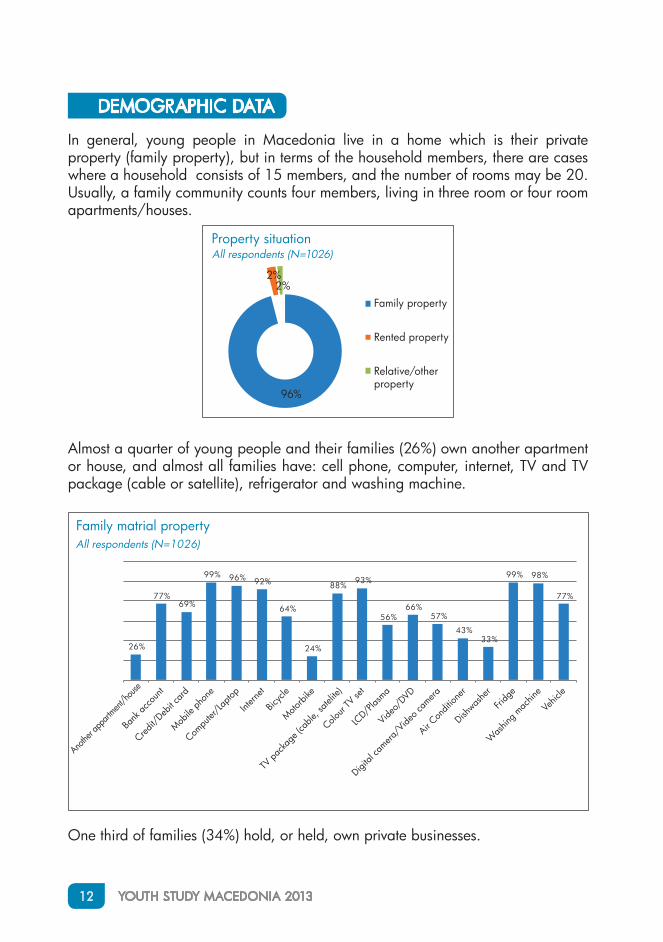
In general, young people in Macedonia live in a home which is their private property (family property), but in terms of the household members, there are cases where a household consists of 15 members, and the number of rooms may be 20. Usually, a family community counts four members, living in three room or four room apartments/houses.
96%
2%2%
Property situationAll respondents (N=1026)
Family property
Rented property
Relative/otherproperty
Almost a quarter of young people and their families (26%) own another apartment or house, and almost all families have: cell phone, computer, internet, TV and TV package (cable or satellite), refrigerator and washing machine.
26%
77%69%
99% 96% 92%
64%
24%
88% 93%
56%66%
57%
43%33%
99% 98%
77%
Family matrial property All respondents (N=1026)
Anothe
r app
artmen
t/hou
se
Bank
acco
unt
Credit/
Debit c
ard
Mobile
phon
e
Compu
ter/L
aptop
Intern
et
Bicyc
le
Motorb
ike
TV pa
ckag
e (ca
ble, s
atelite
)
Colour
TV se
t
LCD/
Plasm
a
Video
/DVD
Digital
camera
/Vide
o cam
era
Air Con
dition
er
Dishwas
her
Fridg
e
Was
hing m
achin
e
Vehic
le
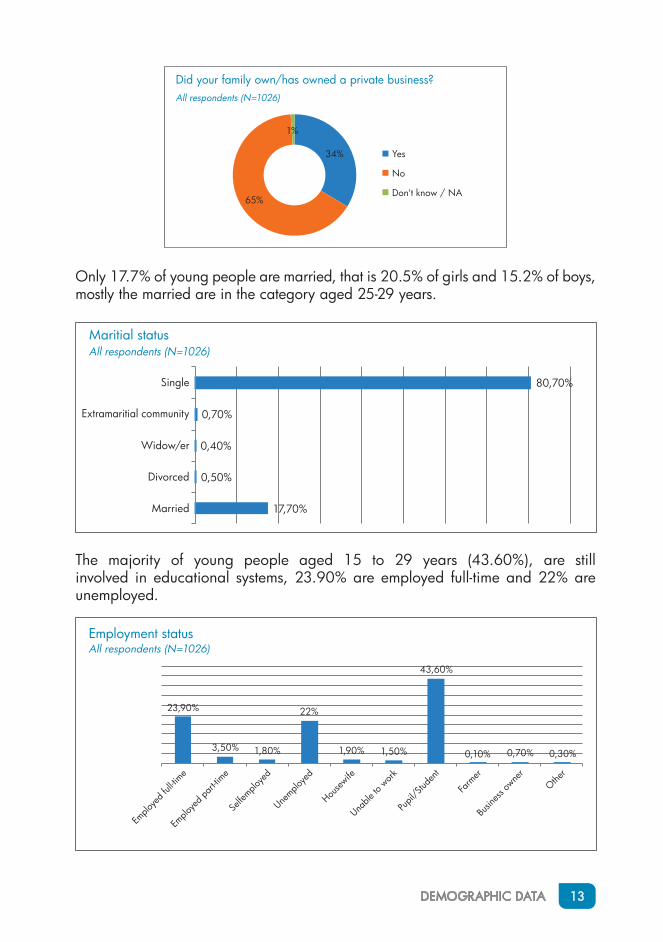
One third of families (34%) hold, or held, own private businesses.
DEMOGRAPHIC DATA 13
34%
65%
1%
Yes
No
Don't know / NA
Did your family own/has owned a private business?All respondents (N=1026)
Only 17.7% of young people are married, that is 20.5% of girls and 15.2% of boys, mostly the married are in the category aged 25-29 years.
17,70%
0,50%
0,40%
0,70%
80,70%
Married
Divorced
Widow/er
Extramaritial community
Single
Maritial statusAll respondents (N=1026)
The majority of young people aged 15 to 29 years (43.60%), are still involved in educational systems, 23.90% are employed full-time and 22% are unemployed.
23,90%
3,50% 1,80%
22%
1,90% 1,50%
43,60%
0,10% 0,70% 0,30%
Employment statusAll respondents (N=1026)
Emplo
yed f
ull-tim
e
Emplo
yed p
art-ti
me
Selfe
mploye
d
Unemplo
yed
House
wife
Unable
to w
ork
Pupil
/Stud
ent
Farm
er
Busin
ess o
wner
Other
14 YOUTH STUDY MACEDONIA 2013
LIFESTYLE AND LEISURE
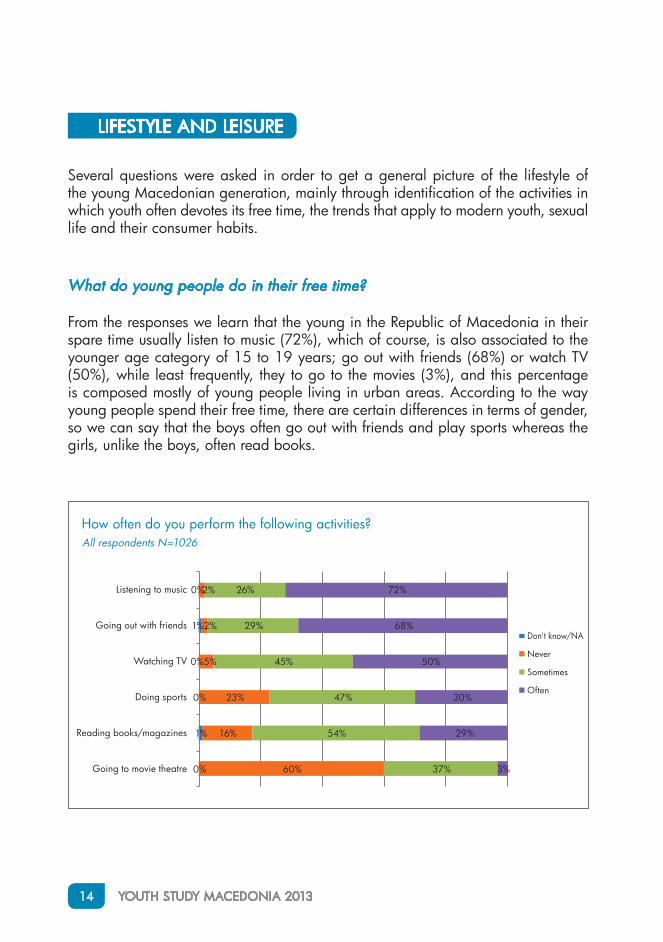
Several questions were asked in order to get a general picture of the lifestyle of the young Macedonian generation, mainly through identification of the activities in which youth often devotes its free time, the trends that apply to modern youth, sexual life and their consumer habits.
What do young people do in their free time?
From the responses we learn that the young in the Republic of Macedonia in their spare time usually listen to music (72%), which of course, is also associated to the younger age category of 15 to 19 years; go out with friends (68%) or watch TV (50%), while least frequently, they to go to the movies (3%), and this percentage is composed mostly of young people living in urban areas. According to the way young people spend their free time, there are certain differences in terms of gender, so we can say that the boys often go out with friends and play sports whereas the girls, unlike the boys, often read books.
0%
1%
0%
0%
1%
0%
60%
16%
23%
5%
2%
2%
37%
54%
47%
45%
29%
26%
3%
29%
30%
50%
68%
72%
Going to movie theatre
Reading books/magazines
Doing sports
Watching TV
Going out with friends
Listening to music
Don't know/NA
Never
Sometimes
Often
How often do you perform the following activities? All respondents N=1026
LIFESTYLE AND LEISURE 15
“In my free time I always keep myself busy by reading a book, I try to be informed about my favourite team Manchester United, be updated with events, listen to music, make a schedule with friends to get out and spend some time together.” (Ermira , 24, Tetovo)“We are the generation of macchiato and “cafeterias”, uncertain about what will happen with the boss tomorrow and if we get fired. During this poverty, we are all sitting in betting houses and chat about the win of thousands Euros.” (Atanas, 28, Delcevo )“When I’m not moody, I want to be alone and read a book, and when I’m in the mood, I want to be with my loved ones, go “shopping” and have fun.” (Violeta, 29, Kumanovo)“Teenagers in our country just want to enjoy while they are young, go out, do things that will not be able to do when they finish university, when they get employment. As for entertainment, we usually prefer the nightlife, outings, parties.... “. (Mile, 23, Kavadarci)“The Roma people do not have a lot of fun, except during weddings.” (Sarita, 24, Suto Orizari)
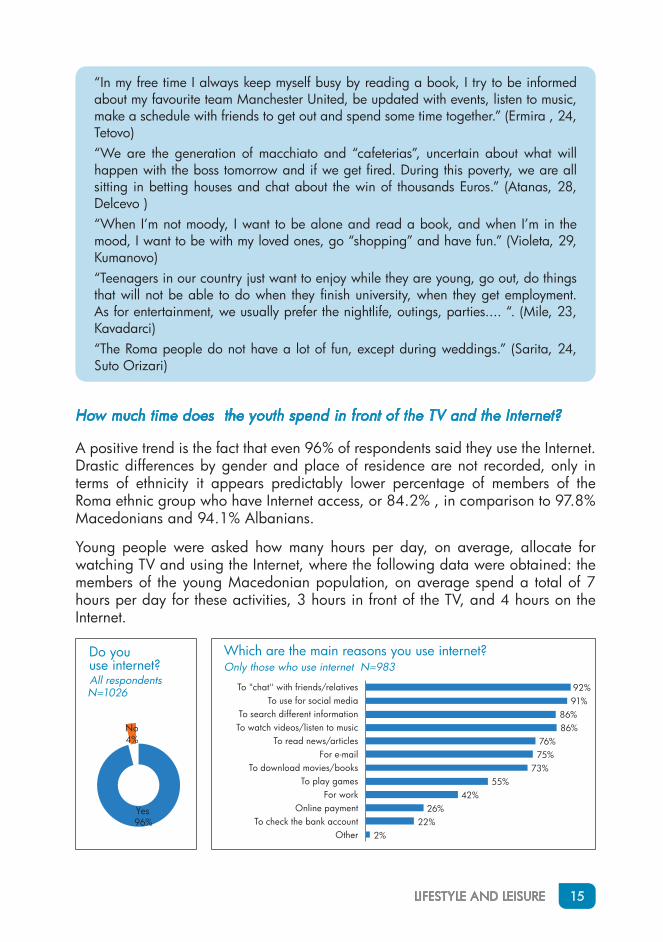
How much time does the youth spend in front of the TV and the Internet?
A positive trend is the fact that even 96% of respondents said they use the Internet. Drastic differences by gender and place of residence are not recorded, only in terms of ethnicity it appears predictably lower percentage of members of the Roma ethnic group who have Internet access, or 84.2% , in comparison to 97.8% Macedonians and 94.1% Albanians.
Young people were asked how many hours per day, on average, allocate for watching TV and using the Internet, where the following data were obtained: the members of the young Macedonian population, on average spend a total of 7 hours per day for these activities, 3 hours in front of the TV, and 4 hours on the Internet.
Yes96%
No4%
Do youuse internet?All respondents N=1026
2%22%
26%42%
55%73%
75%76%
86%86%
91%92%
OtherTo check the bank account
Online paymentFor work
To play gamesTo download movies/books
For e-mailTo read news/articles
To watch videos/listen to musicTo search different information
To use for social mediaTo "chat" with friends/relatives
Which are the main reasons you use internet? Only those who use internet N=983

16 YOUTH STUDY MACEDONIA 2013
From the graph we can see that young people frequently use the Internet for informal online communication, i.e. “chatting” with friends/relatives (92%) and using social networks like Facebook and Twitter (91%), or for searching different types of information (86%) and watching videos/listening to music (86%). The top five activities include reading online news/news (76%). The data suggest that men often use the Internet to play games and the younger they are, the more they do so.
“The only positive thing in our time is that we have more opportunities to be in touch with the world, especially through the Internet and social networks. “ (Elena, 19, Skopje, atypical representative)
“The entertainment here is generally limited to night outs on weekends, and then, mostly maintaining contacts with acquaintances. We do not usually play sports, almost all our free time is used for the Internet. We are more confined in our homes.” (Zulem, 28, Strumica)
“When I was studying, my roommate was 10 hours a day on Facebook”. (Darko, 26, Prilep)
What is fashionable for young people in Macedonia?
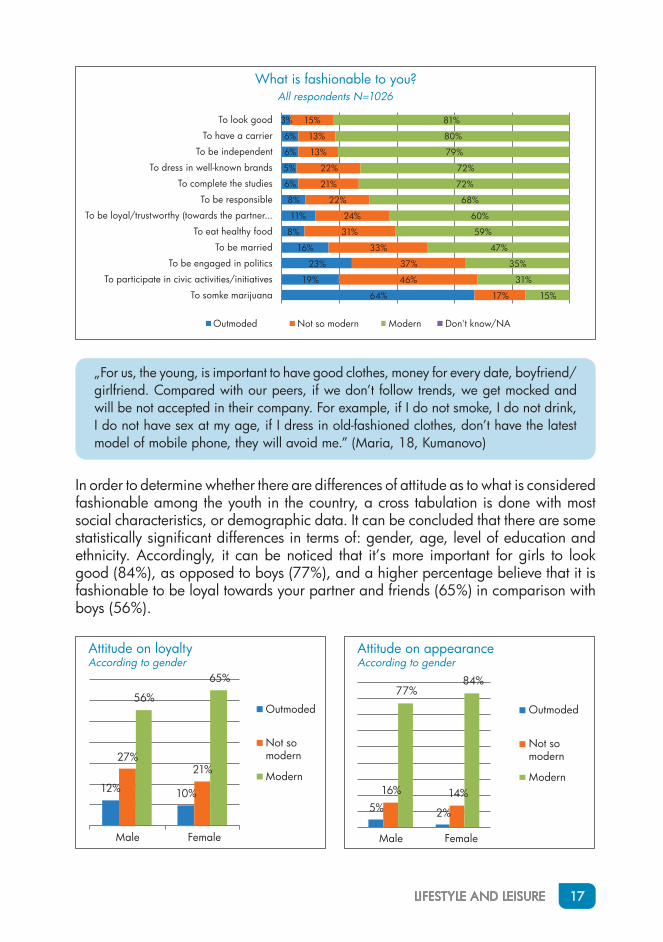
In the questionnaire, young people were offered several alternatives that they should indicate whether they consider them fashionable or old-fashioned, personally for them, regardless of the general popularity that certain values possess among the younger generation as a whole. The obtained data are particularly interesting and largely typical for the youth. The main priority is given to their appearance, where 81% of respondents said that it is fashionable to “look good”. Nevertheless, among the youth there is a need and a tendency to reach maturity through personal contribution and independence, the data confirm that the second value is indicated as “having a career” (80%), and following, the third value chosen is “to be independent” (79%). It is interesting to know that it’s very fashionable for the young to dress in well-known brands, which is expected and typical for their age, identical is the percentage of 78% who consider a fashionable trend the “completion of university studies.” The loyalty (towards the partner, employer, friends) as a fashionable feature was reported by 60%, while only half of young people, or more precisely 49%, consider “to be married/married” outmoded or not so fashionable. Every third respondent, or 35% of the respondents consider “to be included/in politics” as fashionable and the same applies to “participation in civic initiatives” (31%). Something that is not so fashionable or is outdated, is smoking marijuana, where only 15% consider it to be fashionable.
LIFESTYLE AND LEISURE 17
„For us, the young, is important to have good clothes, money for every date, boyfriend/girlfriend. Compared with our peers, if we don’t follow trends, we get mocked and will be not accepted in their company. For example, if I do not smoke, I do not drink, I do not have sex at my age, if I dress in old-fashioned clothes, don’t have the latest model of mobile phone, they will avoid me.” (Maria, 18, Kumanovo)
In order to determine whether there are differences of attitude as to what is considered fashionable among the youth in the country, a cross tabulation is done with most social characteristics, or demographic data. It can be concluded that there are some statistically significant differences in terms of: gender, age, level of education and ethnicity. Accordingly, it can be noticed that it’s more important for girls to look good (84%), as opposed to boys (77%), and a higher percentage believe that it is fashionable to be loyal towards your partner and friends (65%) in comparison with boys (56%).
64%
19%
23%
16%
8%
11%
8%
6%
5%
6%
6%
3%
17%
46%
37%
33%
31%
24%
22%
21%
22%
13%
13%
15%
15%
31%
35%
47%
59%
60%
68%
72%
72%
79%
80%
81%
To somke marijuana
To participate in civic activities/initiatives
To be engaged in politics
To be married
To eat healthy food
To be loyal/trustworthy (towards the partner...
To be responsible
To complete the studies
To dress in well-known brands
To be independent
To have a carrier
To look good
Outmoded Not so modern Modern Don't know/NA
What is fashionable to you?All respondents N=1026
12% 10%
27%21%
56%
65%
Male Female
Outmoded
Not somodern
Modern
Attitude on loyaltyAccording to gender
5% 2%
16% 14%
77%84%
Male Female
Outmoded
Not somodern
Modern
Attitude on appearance According to gender

18 YOUTH STUDY MACEDONIA 2013
In terms of age, it can be noted that responsibility is regarded as less fashionable in the youngest age group of 15 to 19 years, and the same applies to independence, which, in turn, is considered the most fashionable in the age group of 20 to 24 years, which is expected, considering that it is a population that has either completed high school and hasn’t continued to study, or studies and is approaching graduation, trying to find a place in the business world or recently has entered into it, and the next step is the process of separation from the current coexistence in the home of the immediate family. Young people from the age group 20 to 24 years show the greatest interest in politics (39%) and least interest observed in the age group of 15 to 19 years, with 30% of respondents.
11% 8%5%
24%19%
23%
62%
72% 71%
4% 1% 1%
15-19 20-24 25-29 15-19 20-24 25-2915-19 20-24 25-29
Attitude on responsibilityAccording to age
7% 6% 4%
15%10%
16%
74%
83%79%
3% 1% 2%
Outmoded
Not somodern
Modern
Don'tknow/NA
Attitude on independenceAccording to age
26%21%
24%
37% 37% 38%
30%
39%35%
7%3%
4%
Outmoded
Not somodern
Modern
Don'tknow/NA
Attitude on engagementin politicsAccording to age
Outmoded
Not somodern
Modern
Don'tknow/NA
Significant differences were obtained by crossing ethnic background, and yields findings that young Macedonians in 75% consider “being responsible” as fashionable, while the young Albanian population percentage is at 56%, while that of other ethnic groups, 68%. The young Macedonian population in 85% of responses considered “being independent” as fashionable, while young Albanians with 68%, and other ethnic groups with 69%.
6% 11% 17%18%30%
22%
75%
56%68%
1% 3% 2%
Outmoded
Not somodern
Modern
Don'tknow/NA
Attitude on responsibilityAccording to ethnicity
4%11%
5%10%20% 21%
85%
68% 69%
2% 1% 6%
Outmoded
Not somodern
Modern
Don'tknow/NA
Attitude on independence According to ethnicity
Maced
onian
Albania
nOthe
r
Maced
onian
Albania
nOthe
r

LIFESTYLE AND LEISURE 19
Young Macedonians in 76% of responses considered “completing the studies,” to be fashionable, opposed to young Albanians with only 64%, and the percentage in other ethnic groups is 72%. 83% of Macedonians think that it is fashionable “to have a career”, compared to 72% of Albanians and 82% from other ethnic groups.
4%9% 6%
18%26%
21%
76%
64%72%
2% 1% 1%
Outmoded
Not somodern
Modern
Don'tknow/NA
Attitude on completing studiesAccording to ethnicity
4%10% 6%
11%18% 13%
83%72%
82%
2% 1% 2%
Outmoded
Not somodern
Modern
Don'tknow/NA
Attitude on career According to ethnicity
Maced
onian
Albania
nOthe
r
Maced
onian
Albania
nOthe
r
The least esteem for active citizenship is registered within young Macedonians, i.e. 28% of respondents believe that it is fashionable “to join in civil initiatives”, compared with 34% of the Albanian population and 31% of other ethnic groups. Differences by ethnicity were observed in terms of attitude to marriage, or more specifically 55% of young Albanians believe that it is fashionable “to be married”, unlike the young Macedonians (45%) and other ethnic groups (40%).
19% 17% 19%
50%
43%46%
28%
34%31%
4% 6% 5%
Outmoded
Not somodern
Modern
Don'tknow/NA
Attitude on egagement in civil initiativesAccording to ethnicity
15% 15%21%
35%
27%30%
45%
55%
40%
4% 3%10%
Outmoded
Not somodern
Modern
Don'tknow/NA
Attitude on marriage According to ethnicity
Maced
onian
Albania
nOthe
r
Maced
onian
Albania
nOthe
r
20 YOUTH STUDY MACEDONIA 2013
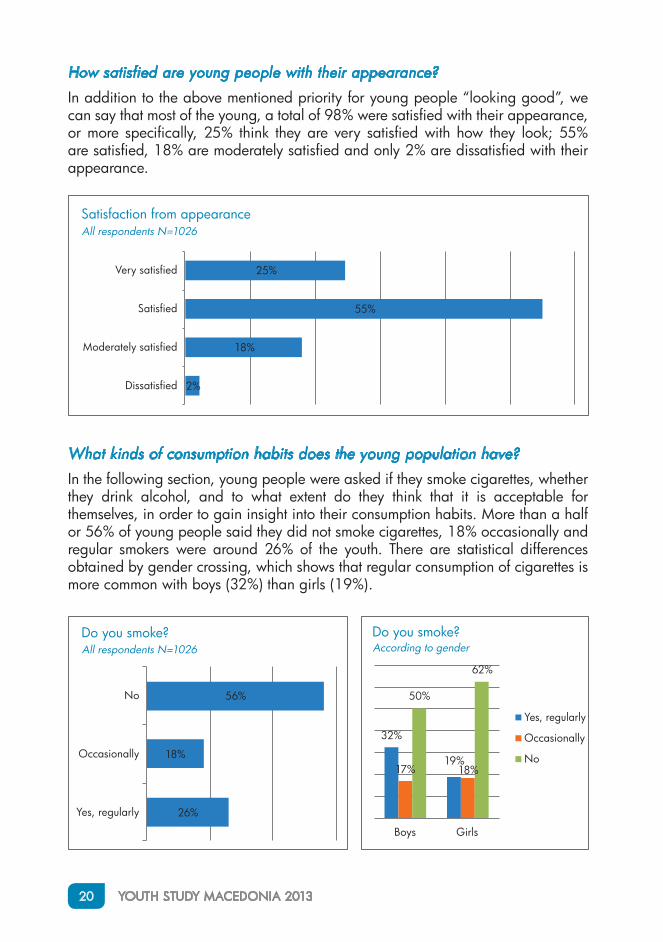
How satisfied are young people with their appearance?
In addition to the above mentioned priority for young people “looking good”, we can say that most of the young, a total of 98% were satisfied with their appearance, or more specifically, 25% think they are very satisfied with how they look; 55% are satisfied, 18% are moderately satisfied and only 2% are dissatisfied with their appearance.
2%
18%
55%
25%
Dissatisfied
Moderately satisfied
Satisfied
Very satisfied
Satisfaction from appearanceAll respondents N=1026
What kinds of consumption habits does the young population have?
In the following section, young people were asked if they smoke cigarettes, whether they drink alcohol, and to what extent do they think that it is acceptable for themselves, in order to gain insight into their consumption habits. More than a half or 56% of young people said they did not smoke cigarettes, 18% occasionally and regular smokers were around 26% of the youth. There are statistical differences obtained by gender crossing, which shows that regular consumption of cigarettes is more common with boys (32%) than girls (19%).
26%
18%
56%
Yes, regularly
Occasionally
No
Do you smoke?All respondents N=1026
32%
19%17% 18%
50%
62%
Boys Girls
Yes, regularly
Occasionally
No
Do you smoke?According to gender
LIFESTYLE AND LEISURE 21
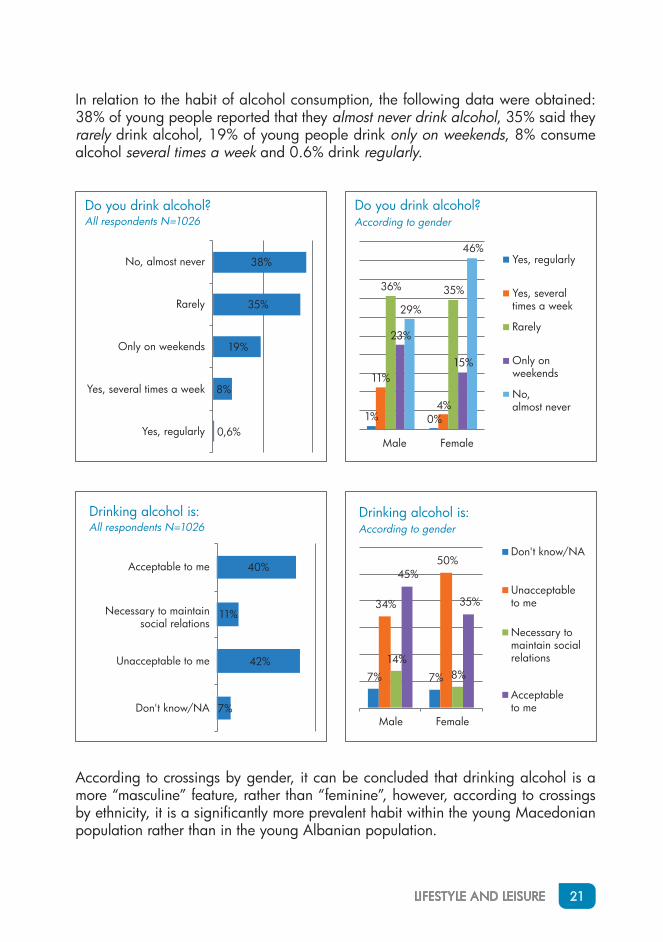
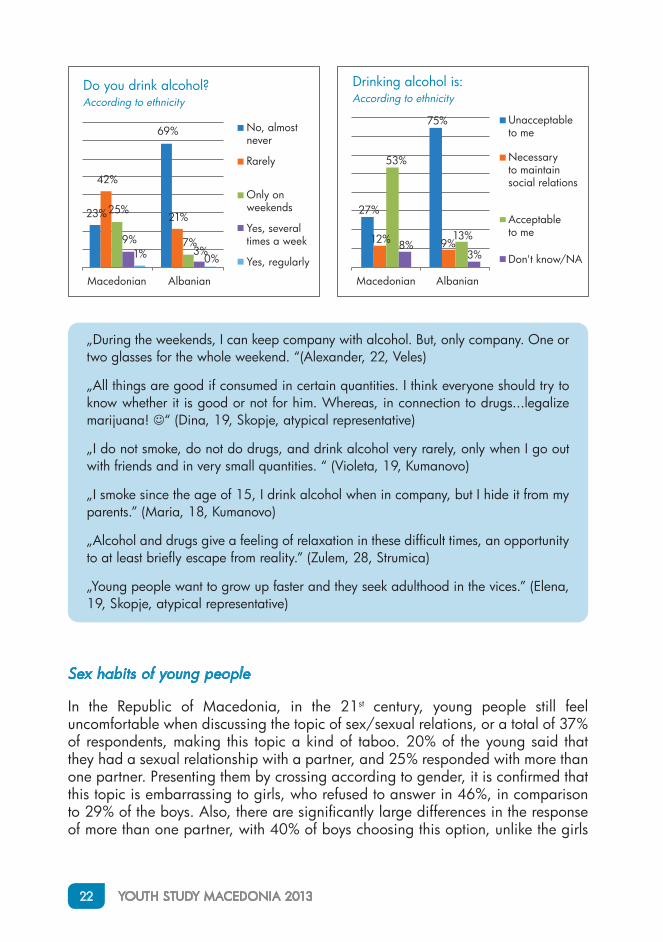
In relation to the habit of alcohol consumption, the following data were obtained: 38% of young people reported that they almost never drink alcohol, 35% said they rarely drink alcohol, 19% of young people drink only on weekends, 8% consume alcohol several times a week and 0.6% drink regularly.
0,6%
8%
19%
35%
38%
Yes, regularly
Yes, several times a week
Only on weekends
Rarely
No, almost never
Do you drink alcohol?All respondents N=1026
1% 0%
11%
4%
36% 35%
23%
15%
29%
46%
Male Female
Yes, regularly
Yes, severaltimes a week
Rarely
Only onweekends
No,almost never
Do you drink alcohol?According to gender
7%
42%
11%
40%
Don't know/NA
Unacceptable to me
Necessary to maintainsocial relations
Acceptable to me
Drinking alcohol is:All respondents N=1026
7% 7%
34%
50%
14%8%
45%
35%
Male Female
Don't know/NA
Unacceptableto me
Necessary tomaintain socialrelations
Acceptableto me
Drinking alcohol is:According to gender
According to crossings by gender, it can be concluded that drinking alcohol is a more “masculine” feature, rather than “feminine”, however, according to crossings by ethnicity, it is a significantly more prevalent habit within the young Macedonian population rather than in the young Albanian population.
22 YOUTH STUDY MACEDONIA 2013
„During the weekends, I can keep company with alcohol. But, only company. One or two glasses for the whole weekend. “(Alexander, 22, Veles)
„All things are good if consumed in certain quantities. I think everyone should try to know whether it is good or not for him. Whereas, in connection to drugs...legalize marijuana! “ (Dina, 19, Skopje, atypical representative)
„I do not smoke, do not do drugs, and drink alcohol very rarely, only when I go out with friends and in very small quantities. “ (Violeta, 19, Kumanovo)
„I smoke since the age of 15, I drink alcohol when in company, but I hide it from my parents.” (Maria, 18, Kumanovo)
„Alcohol and drugs give a feeling of relaxation in these difficult times, an opportunity to at least briefly escape from reality.” (Zulem, 28, Strumica)
„Young people want to grow up faster and they seek adulthood in the vices.” (Elena, 19, Skopje, atypical representative)
Sex habits of young people
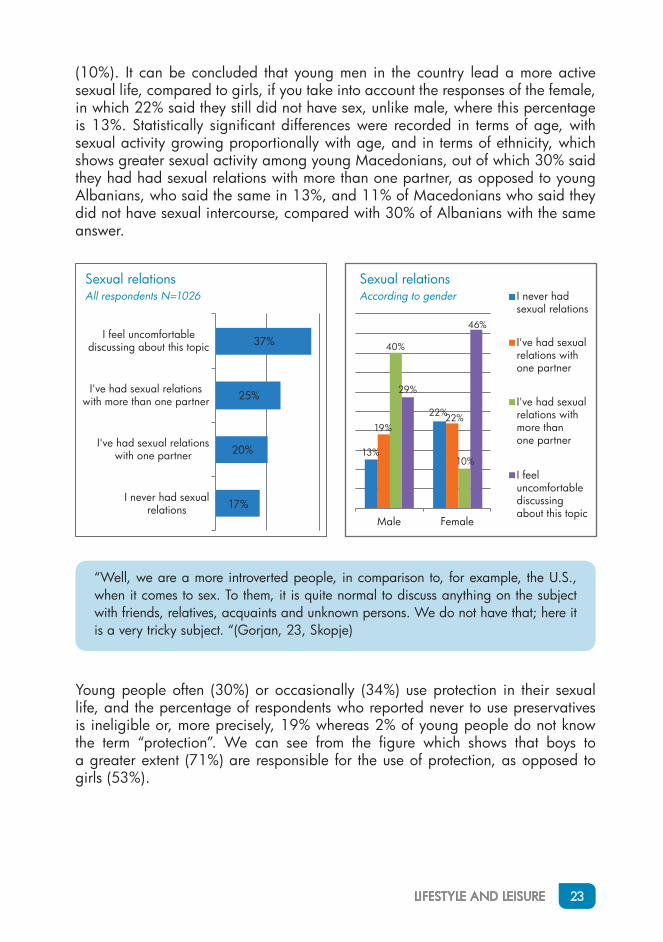
In the Republic of Macedonia, in the 21st century, young people still feel uncomfortable when discussing the topic of sex/sexual relations, or a total of 37% of respondents, making this topic a kind of taboo. 20% of the young said that they had a sexual relationship with a partner, and 25% responded with more than one partner. Presenting them by crossing according to gender, it is confirmed that this topic is embarrassing to girls, who refused to answer in 46%, in comparison to 29% of the boys. Also, there are significantly large differences in the response of more than one partner, with 40% of boys choosing this option, unlike the girls
23%
69%
42%
21%25%
7%9%3%1% 0%
Macedonian Albanian
No, almostnever
Rarely
Only onweekends
Yes, severaltimes a week
Yes, regularly
Do you drink alcohol?According to ethnicity
27%
75%
12% 9%
53%
13%8%
3%
Macedonian Albanian
Unacceptableto me
Necessaryto maintainsocial relations
Acceptableto me
Don't know/NA
Drinking alcohol is:According to ethnicity
LIFESTYLE AND LEISURE 23
(10%). It can be concluded that young men in the country lead a more active sexual life, compared to girls, if you take into account the responses of the female, in which 22% said they still did not have sex, unlike male, where this percentage is 13%. Statistically significant differences were recorded in terms of age, with sexual activity growing proportionally with age, and in terms of ethnicity, which shows greater sexual activity among young Macedonians, out of which 30% said they had had sexual relations with more than one partner, as opposed to young Albanians, who said the same in 13%, and 11% of Macedonians who said they did not have sexual intercourse, compared with 30% of Albanians with the same answer.
17%
20%
25%
37%
I never had sexualrelations
I've had sexual relationswith one partner
I've had sexual relationswith more than one partner
I feel uncomfortablediscussing about this topic
Sexual relationsAll respondents N=1026
Male Female
I never hadsexual relations
I've had sexualrelations withone partner
I've had sexualrelations withmore thanone partner
Sexual relationsAccording to gender
I feeluncomfortablediscussingabout this topic
22%22%
10%
46%
13%
19%
40%
29%
“Well, we are a more introverted people, in comparison to, for example, the U.S., when it comes to sex. To them, it is quite normal to discuss anything on the subject with friends, relatives, acquaints and unknown persons. We do not have that; here it is a very tricky subject. “(Gorjan, 23, Skopje)
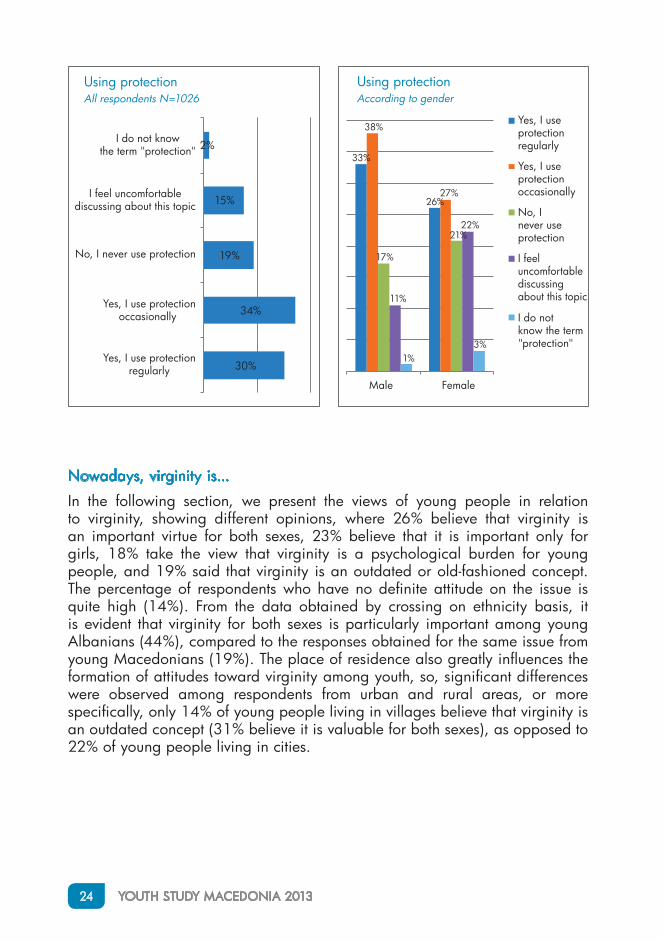
Young people often (30%) or occasionally (34%) use protection in their sexual life, and the percentage of respondents who reported never to use preservatives is ineligible or, more precisely, 19% whereas 2% of young people do not know the term “protection”. We can see from the figure which shows that boys to a greater extent (71%) are responsible for the use of protection, as opposed to girls (53%).
24 YOUTH STUDY MACEDONIA 2013
Nowadays, virginity is...
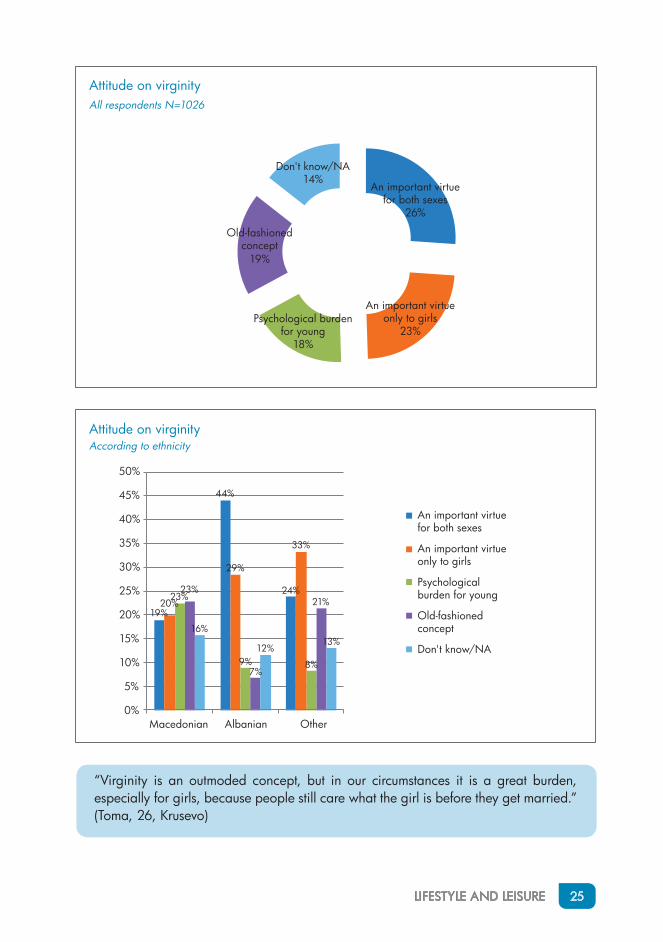
In the following section, we present the views of young people in relation to virginity, showing different opinions, where 26% believe that virginity is an important virtue for both sexes, 23% believe that it is important only for girls, 18% take the view that virginity is a psychological burden for young people, and 19% said that virginity is an outdated or old-fashioned concept. The percentage of respondents who have no definite attitude on the issue is quite high (14%). From the data obtained by crossing on ethnicity basis, it is evident that virginity for both sexes is particularly important among young Albanians (44%), compared to the responses obtained for the same issue from young Macedonians (19%). The place of residence also greatly influences the formation of attitudes toward virginity among youth, so, significant differences were observed among respondents from urban and rural areas, or more specifically, only 14% of young people living in villages believe that virginity is an outdated concept (31% believe it is valuable for both sexes), as opposed to 22% of young people living in cities.
30%
34%
19%
15%
2%
Yes, I use protectionregularly
Yes, I use protectionoccasionally
No, I never use protection
I feel uncomfortablediscussing about this topic
I do not knowthe term "protection"
Using protectionAll respondents N=1026
33%
26%
38%
27%
17%
21%
11%
22%
1%3%
Male Female
Yes, I useprotectionregularly
Yes, I useprotectionoccasionally
No, Inever useprotection
I feeluncomfortablediscussingabout this topic
I do notknow the term"protection"
Using protectionAccording to gender
LIFESTYLE AND LEISURE 25
“Virginity is an outmoded concept, but in our circumstances it is a great burden, especially for girls, because people still care what the girl is before they get married.” (Toma, 26, Krusevo)
An important virtuefor both sexes
26%
An important virtueonly to girls
23%Psychological burden
for young18%
Old-fashionedconcept
19%
Don't know/NA14%
Attitude on virginityAll respondents N=1026
19%
44%
24%20%
29%
33%
23%
9% 8%
23%
7%
21%
16%
12%13%
0%
5%
10%
15%
20%
25%
30%
35%
40%
45%
50%
Macedonian Albanian Other
An important virtuefor both sexes
An important virtueonly to girls
Psychologicalburden for young
Old-fashionedconcept
Don't know/NA
Attitude on virginityAccording to ethnicity
26 YOUTH STUDY MACEDONIA 2013
CONCLUSIONS
•• In their free time, the young population usually listens to music or goes out with friends. Boys often go out with friends and play sports unlike the girls, who, in turn, often read books, unlike boys.
•• In Macedonia, young people don’t have the habit of going to the movies. Only 3% of young people from urban areas said they go to the movies.
•• The places where the young people normally gather and entertain are cafes and discos.
•• The young population spends 4 hours a day on the Internet, and 3 hours in front of the TV.
•• The Internet is mainly used for Facebook and “chatting “ but also for “surfing”, watching/listening videos/music and reading online news.
•• The most important thing for young people is to look good, but just as important is having a career and being independent. The main trends are wearing branded clothes and completing studies.
•• The young Macedonians have a more positive attitude towards responsibility and independence, unlike the young Albanians.
•• Only half of young people think marriage is “outmoded“.
•• We cannot expect extreme loyalty from young people (towards their partner, relatives, employer), whereas, for girls loyalty is a more important value than to boys.
•• Responsibility is regarded as less fashionable in the youngest age group of 15 to 19 years, and the same applies for independence, which, in turn, is considered the most fashionable in the age group of 20 to 24 years.
•• Every third young man would be engaged in politics, or civic initiatives.
•• Almost all young people are satisfied with their appearance.
•• A quarter of young people consume cigarettes and alcohol.
•• Smoking and drinking alcohol are more characteristic for boys than girls, and according to ethnicity, they are more fashionable among Macedonians rather than Albanians.
•• To youth, “sex” is a taboo, but practiced from an early age and activity grows proportionally to age. The responsibility for the use of protection is greater among boys, while 20% of young people do not use preservatives during sexual relations.
•• Virginity to someone is very important, whilst for someone else it is an outdated concept and a psychological burden. It is particularly important for young Albanians and for young people in small/rural areas.
27
BELIEFS AND AFFILIATIONS
This part of the questionnaire addressed several important segments of young people’s lives, such as: trust they have in other youth (who they believe), how open are they to individuals with: different ethnic, geographical, sexual, social background, and later the reasons for discrimination on various grounds, their social values, their involvement in volunteer activities, and the main reasons for this involvement, and at the end of this section, their religious affiliation and level of practicing religion.
Who do young people trust the most?
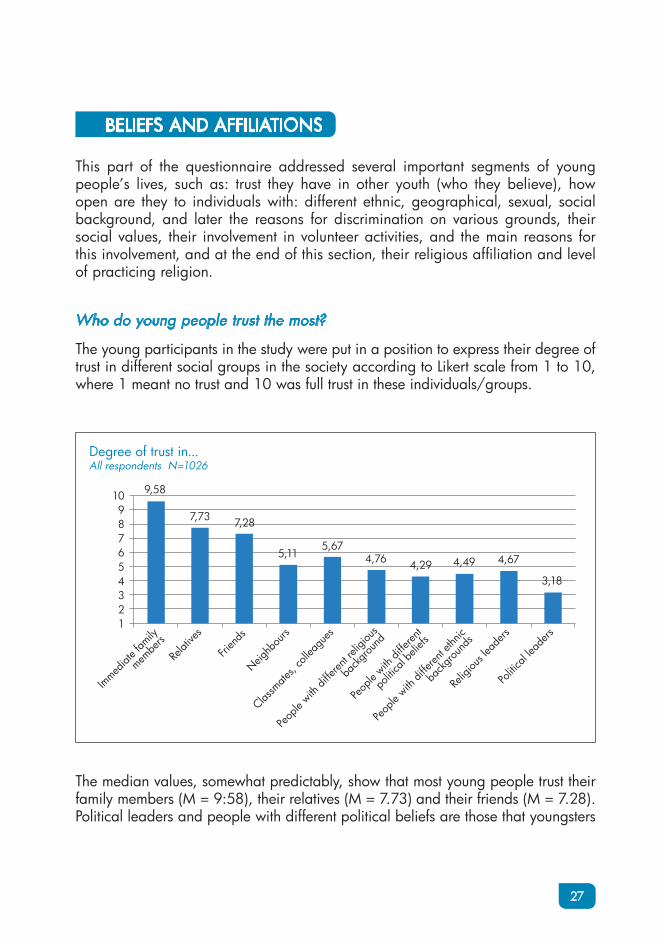
The young participants in the study were put in a position to express their degree of trust in different social groups in the society according to Likert scale from 1 to 10, where 1 meant no trust and 10 was full trust in these individuals/groups.
9,5810987654321
7,73 7,28
5,115,67
4,76 4,29 4,49 4,67
3,18
Immed
iate f
amily
membe
rs
Relat
ives
Frien
ds
Neighb
ours
Classm
ates,
colle
ague
s
Peop
le with
diffe
rent re
ligiou
s
back
groun
d
Peop
le with
diffe
rent
politi
cal b
eliefs
Peop
le with
diffe
rent e
thnic
back
groun
ds
Relig
ious l
eade
rs
Politi
cal le
aders
Degree of trust in...All respondents N=1026
The median values, somewhat predictably, show that most young people trust their family members (M = 9:58), their relatives (M = 7.73) and their friends (M = 7.28). Political leaders and people with different political beliefs are those that youngsters
28 YOUTH STUDY MACEDONIA 2013
in the Republic of Macedonia trust the least. The group that is not trusted “included” people with different ethnic backgrounds.
There are differences in the degree of trust among young people living in different regions in Macedonia, and the largest are among the young from the Pollog region and the young of the North-eastern region. Young people from the Pollog region, without exception, are in the group that shows the greatest degree of trust in all of the following social groups/individuals, and youth from the North-eastern region, also without exception, are those that show the lowest level of trust in all social groups/individuals, institutions.
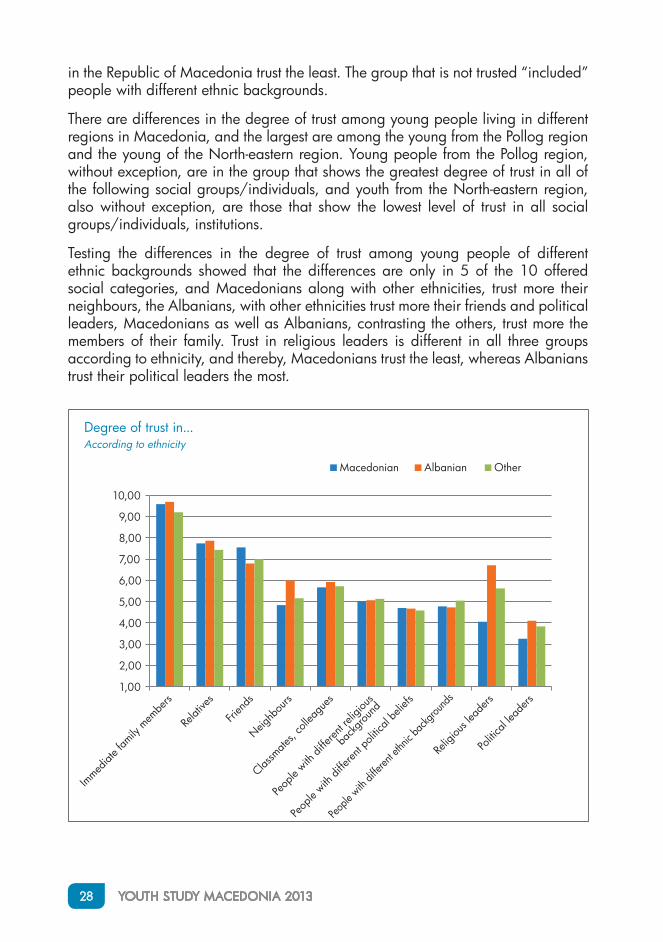
Testing the differences in the degree of trust among young people of different ethnic backgrounds showed that the differences are only in 5 of the 10 offered social categories, and Macedonians along with other ethnicities, trust more their neighbours, the Albanians, with other ethnicities trust more their friends and political leaders, Macedonians as well as Albanians, contrasting the others, trust more the members of their family. Trust in religious leaders is different in all three groups according to ethnicity, and thereby, Macedonians trust the least, whereas Albanians trust their political leaders the most.
Immed
iate f
amily
mem
bers
Relat
ives
Frien
ds
Neighb
ours
Classm
ates,
colle
ague
s
Peop
le with
diffe
rent re
ligiou
s
back
groun
d
Peop
le with
diffe
rent p
olitic
al be
liefs
People
with
diffe
rent e
thnic
backg
round
s
Relig
ious l
eade
rs
Politi
cal le
aders
1,00
2,00
3,00
4,00
5,00
6,00
7,00
8,00
9,00
10,00
Macedonian Albanian Other
Degree of trust in...According to ethnicity
BELIEFS AND AFFILIATIONS 29
„We in Macedonia believe only in God and family, in no other.” (Anna, Bitola, 24)
„I trust completely in my immediate family, I have no close contacts with my parents, but I will always respect them, whatever they are. “ (Dina, 19, Skopje, atypical representative)
„Of course, people have the utmost confidence in their family, relatives, close friends ... because they know that when there isn’t anyone to help, you have your family. Knowing the level of unemployment in Macedonia (recently reducing), people somehow are afraid of the unknown, they do not want to turn to everyone, to be friends. “ (Mile, 23 Kavadarci)
„Family means a lot to me and I love my family and trust them, and also relatives, neighbours and I respect them because it’s not good without them, you have no one to talk to when you need help.” (Maja, 18, Kumanovo)
How do young people accept the “others”?
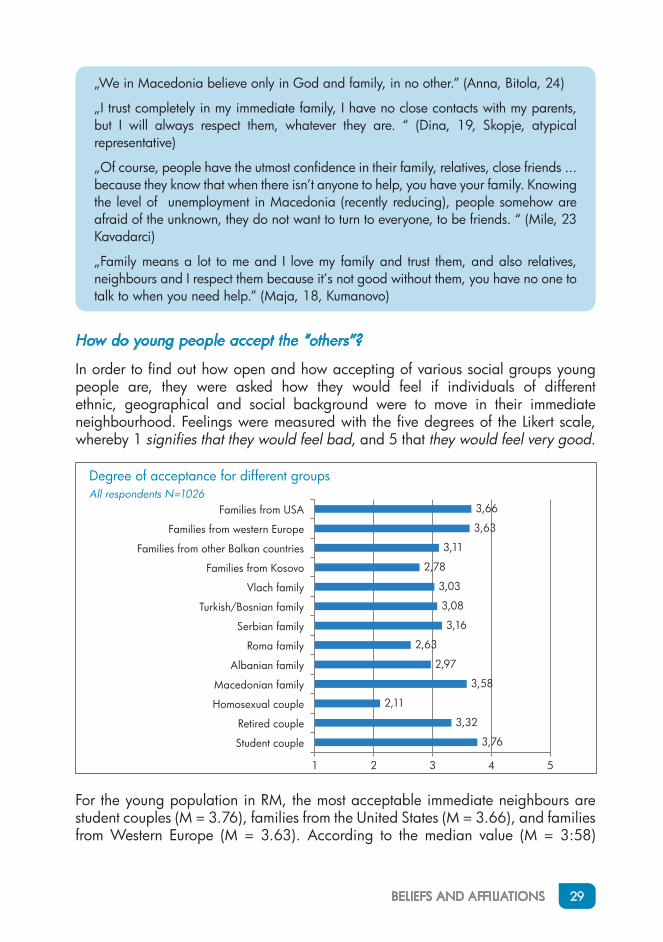
In order to find out how open and how accepting of various social groups young people are, they were asked how they would feel if individuals of different ethnic, geographical and social background were to move in their immediate neighbourhood. Feelings were measured with the five degrees of the Likert scale, whereby 1 signifies that they would feel bad, and 5 that they would feel very good.
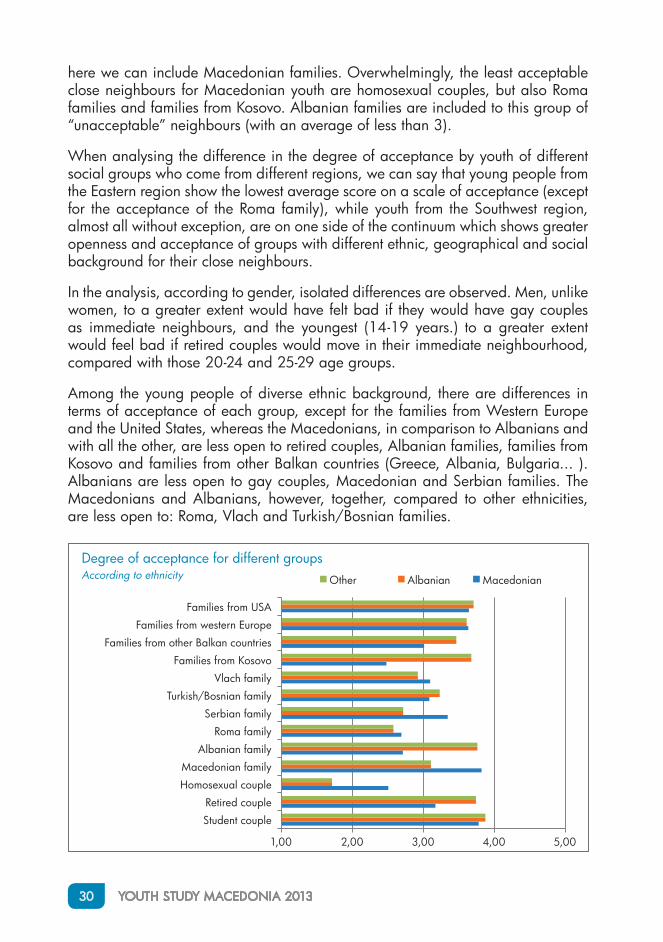
3,76
3,32
2,11
3,58
2,97
2,63
3,16
3,08
3,03
2,78
3,11
3,63
3,66
1 2 3 4 5
Student couple
Retired couple
Homosexual couple
Macedonian family
Albanian family
Roma family
Serbian family
Turkish/Bosnian family
Vlach family
Families from Kosovo
Families from other Balkan countries
Families from western Europe
Families from USA
Degree of acceptance for different groupsAll respondents N=1026
For the young population in RM, the most acceptable immediate neighbours are student couples (M = 3.76), families from the United States (M = 3.66), and families from Western Europe (M = 3.63). According to the median value (M = 3:58)
30 YOUTH STUDY MACEDONIA 2013
here we can include Macedonian families. Overwhelmingly, the least acceptable close neighbours for Macedonian youth are homosexual couples, but also Roma families and families from Kosovo. Albanian families are included to this group of “unacceptable” neighbours (with an average of less than 3).
When analysing the difference in the degree of acceptance by youth of different social groups who come from different regions, we can say that young people from the Eastern region show the lowest average score on a scale of acceptance (except for the acceptance of the Roma family), while youth from the Southwest region, almost all without exception, are on one side of the continuum which shows greater openness and acceptance of groups with different ethnic, geographical and social background for their close neighbours.
In the analysis, according to gender, isolated differences are observed. Men, unlike women, to a greater extent would have felt bad if they would have gay couples as immediate neighbours, and the youngest (14-19 years.) to a greater extent would feel bad if retired couples would move in their immediate neighbourhood, compared with those 20-24 and 25-29 age groups.
Among the young people of diverse ethnic background, there are differences in terms of acceptance of each group, except for the families from Western Europe and the United States, whereas the Macedonians, in comparison to Albanians and with all the other, are less open to retired couples, Albanian families, families from Kosovo and families from other Balkan countries (Greece, Albania, Bulgaria... ). Albanians are less open to gay couples, Macedonian and Serbian families. The Macedonians and Albanians, however, together, compared to other ethnicities, are less open to: Roma, Vlach and Turkish/Bosnian families.
1,00 2,00 3,00 4,00 5,00
Other Albanian Macedonian
Degree of acceptance for different groupsAccording to ethnicity
Families from USA
Families from western Europe
Families from other Balkan countries
Families from Kosovo
Vlach family
Turkish/Bosnian family
Serbian family
Roma family
Albanian family
Macedonian family
Homosexual couple
Retired couple
Student couple
BELIEFS AND AFFILIATIONS 31
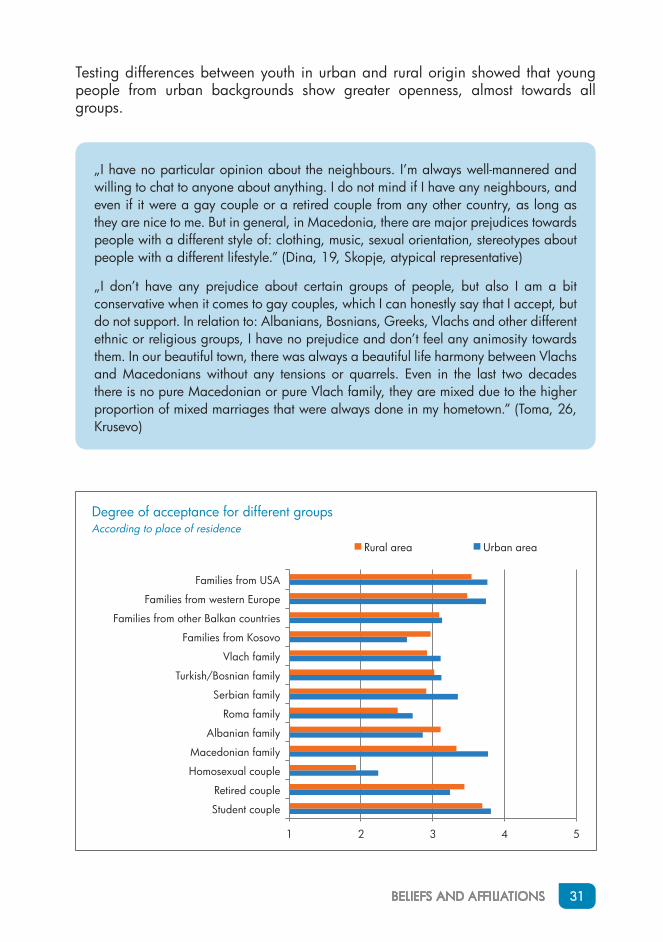
Testing differences between youth in urban and rural origin showed that young people from urban backgrounds show greater openness, almost towards all groups.
„I have no particular opinion about the neighbours. I’m always well-mannered and willing to chat to anyone about anything. I do not mind if I have any neighbours, and even if it were a gay couple or a retired couple from any other country, as long as they are nice to me. But in general, in Macedonia, there are major prejudices towards people with a different style of: clothing, music, sexual orientation, stereotypes about people with a different lifestyle.” (Dina, 19, Skopje, atypical representative)
„I don’t have any prejudice about certain groups of people, but also I am a bit conservative when it comes to gay couples, which I can honestly say that I accept, but do not support. In relation to: Albanians, Bosnians, Greeks, Vlachs and other different ethnic or religious groups, I have no prejudice and don’t feel any animosity towards them. In our beautiful town, there was always a beautiful life harmony between Vlachs and Macedonians without any tensions or quarrels. Even in the last two decades there is no pure Macedonian or pure Vlach family, they are mixed due to the higher proportion of mixed marriages that were always done in my hometown.” (Toma, 26, Krusevo)
1 2 3 4 5
Rural area Urban area
Degree of acceptance for different groupsAccording to place of residence
Families from USA
Families from western Europe
Families from other Balkan countries
Families from Kosovo
Vlach family
Turkish/Bosnian family
Serbian family
Roma family
Albanian family
Macedonian family
Homosexual couple
Retired couple
Student couple
32 YOUTH STUDY MACEDONIA 2013
Are young people feeling discriminated against and what for?
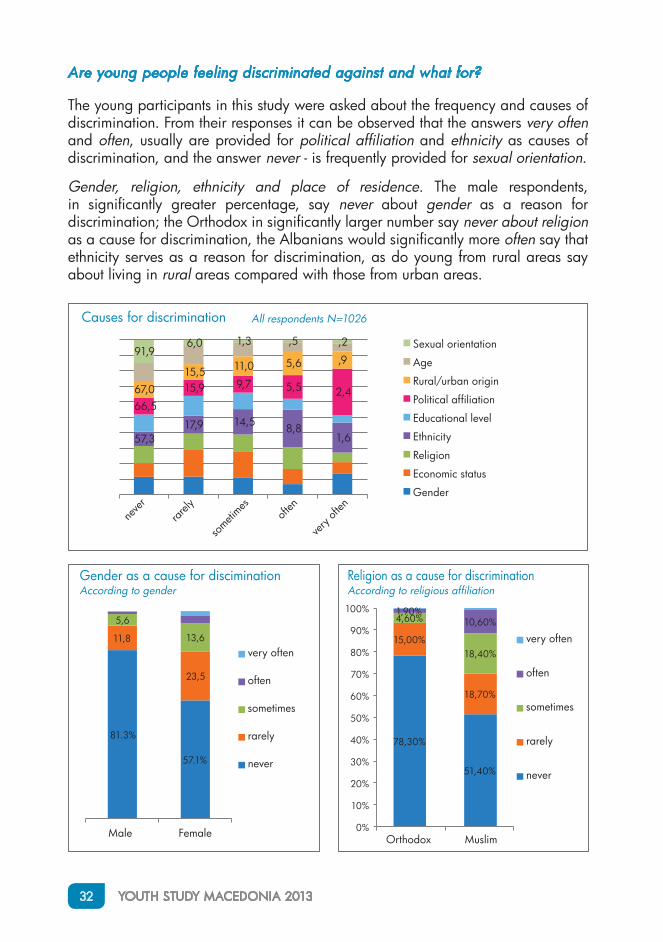
The young participants in this study were asked about the frequency and causes of discrimination. From their responses it can be observed that the answers very often and often, usually are provided for political affiliation and ethnicity as causes of discrimination, and the answer never - is frequently provided for sexual orientation.
Gender, religion, ethnicity and place of residence. The male respondents, in significantly greater percentage, say never about gender as a reason for discrimination; the Orthodox in significantly larger number say never about religion as a cause for discrimination, the Albanians would significantly more often say that ethnicity serves as a reason for discrimination, as do young from rural areas say about living in rural areas compared with those from urban areas.
57,317,9 14,5 8,8
1,6
66,5
15,9 9,7 5,5 2,467,015,5 11,0 5,6 ,9
91,96,0 1,3 ,5 ,2 Sexual orientation
Age
Rural/urban origin
Political affiliation
Educational level
Ethnicity
Religion
Economic status
Gender
Causes for discrimination
neve
rrar
ely
someti
mesoft
en
very
often
All respondents N=1026
81.3%
57.1%
11,8
23,5
5,6
13,6
Male Female
very often
often
sometimes
rarely
never
Gender as a cause for disciminationAccording to gender
78,30%
51,40%
15,00%
18,70%
4,60%
18,40%
1,90%10,60%
0%
10%
20%
30%
40%
50%
60%
70%
80%
90%
100%
Orthodox Muslim
very often
often
sometimes
rarely
never
Religion as a cause for discriminationAccording to religious affiliation

BELIEFS AND AFFILIATIONS 33
„There is much discrimination in Macedonia, especially discrimination against people with a different economic status.” (Elena, 19, Skopje , atypical representative)
„When Roma people go to an elite restaurant they will not be served, although rare are those who can afford it. If you go to a disco, pool, etc. they will not be allowed entry. Not that they are not decently dressed, as some Macedonians like to say, but just as soon as they notice by the colour of the skin that they are Roma. And when you speak in Macedonian and they will understand that you are not foreign, again they will not allow entry. “ (Sarita, 24, Suto Orizari)
„There is discrimination over ethnicity and provincial origin. I’m a Vlach and people often tell me things like: ‘you Vlachs are stingy, you Vlachs are a special category of people’, etc. But, a few times I have felt discriminated against because of provincial origin, as people have told me: ‘you’re from the province, what are you doing in our great city’, etc.” (Toma, 26, Krusevo)
68,30%
39,90%
16,60%
18,20%
11,30%
21,30%
3,00%18,50%
0%
10%
20%
30%
40%
50%
60%
70%
80%
90%
100%
Macedonian Albanian
Ethnicity as a causefor discriminationAccording to ethnicity
73,80%57,50%
14,00%
17,80%
7,70%15,30%
3,70% 8,50%
0%
10%
20%
30%
40%
50%
60%
70%
80%
90%
100%
Urbanorigin
Ruralorigin
very often
often
sometimes
rarely
never
The place of residence as acause for discriminationAccording to place of residence
34 YOUTH STUDY MACEDONIA 2013
Which are the main values that guide young people through life?
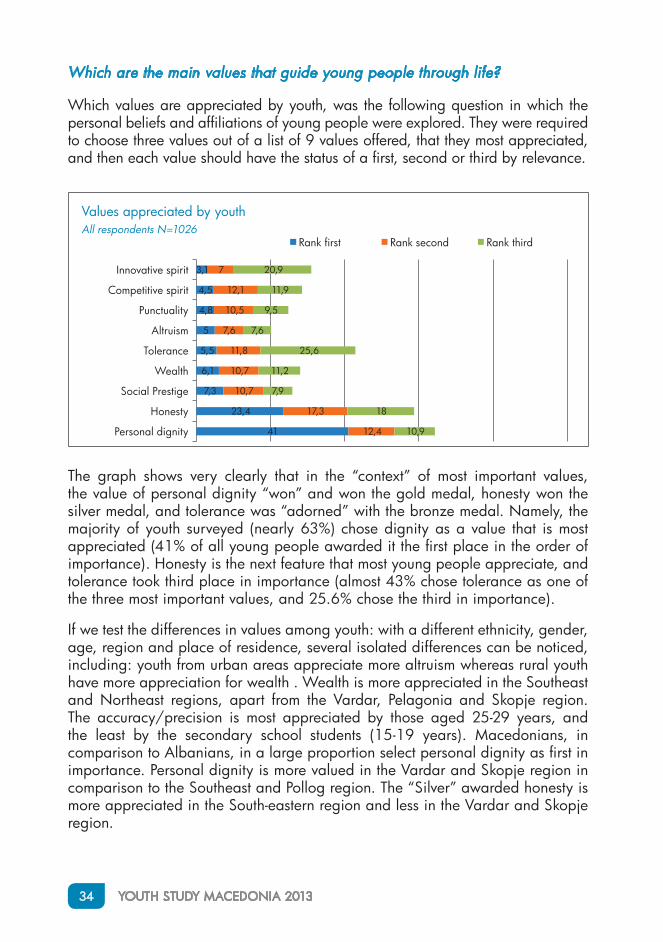
Which values are appreciated by youth, was the following question in which the personal beliefs and affiliations of young people were explored. They were required to choose three values out of a list of 9 values offered, that they most appreciated, and then each value should have the status of a first, second or third by relevance.
41
23,4
7,3
6,1
5,5
5
4,8
4,5
3,1
12,4
17,3
10,7
10,7
11,8
7,6
10,5
12,1
7
10,9
18
7,9
11,2
25,6
7,6
9,5
11,9
20,9
Personal dignity
Honesty
Social Prestige
Wealth
Tolerance
Altruism
Punctuality
Competitive spirit
Innovative spirit
Rank first Rank second Rank third
Values appreciated by youthAll respondents N=1026
The graph shows very clearly that in the “context” of most important values, the value of personal dignity “won” and won the gold medal, honesty won the silver medal, and tolerance was “adorned” with the bronze medal. Namely, the majority of youth surveyed (nearly 63%) chose dignity as a value that is most appreciated (41% of all young people awarded it the first place in the order of importance). Honesty is the next feature that most young people appreciate, and tolerance took third place in importance (almost 43% chose tolerance as one of the three most important values , and 25.6% chose the third in importance).
If we test the differences in values among youth: with a different ethnicity, gender, age, region and place of residence, several isolated differences can be noticed, including: youth from urban areas appreciate more altruism whereas rural youth have more appreciation for wealth . Wealth is more appreciated in the Southeast and Northeast regions, apart from the Vardar, Pelagonia and Skopje region. The accuracy/precision is most appreciated by those aged 25-29 years, and the least by the secondary school students (15-19 years). Macedonians, in comparison to Albanians, in a large proportion select personal dignity as first in importance. Personal dignity is more valued in the Vardar and Skopje region in comparison to the Southeast and Pollog region. The “Silver” awarded honesty is more appreciated in the South-eastern region and less in the Vardar and Skopje region.
BELIEFS AND AFFILIATIONS 35
„We, young people appreciate honesty, fairness, but we do not appreciate it when someone doesn’t keep their word.” (Alexander, 22, Veles)
“I appreciate the honesty, unselfishness and sociability. And we appreciate the money and the outer appearance, and we do not appreciate people by for they are and what they have to teach or what kind of energy they have available. Too bad.” (Dina, 19, Skopje, atypical representative)
“For me, the values which need to be appreciated are persistence (exactly to know what anyone thinks about me and in general, and may not be difficult to apply), respect (I think there should be more respect, I see more and more this lack of a value, in large proportion, also a distorted image of respect), unselfishly helping (I want to help and it’s not a problem to be there for someone, but often this good virtue is misused). “ (Elena, 19, Skopje)
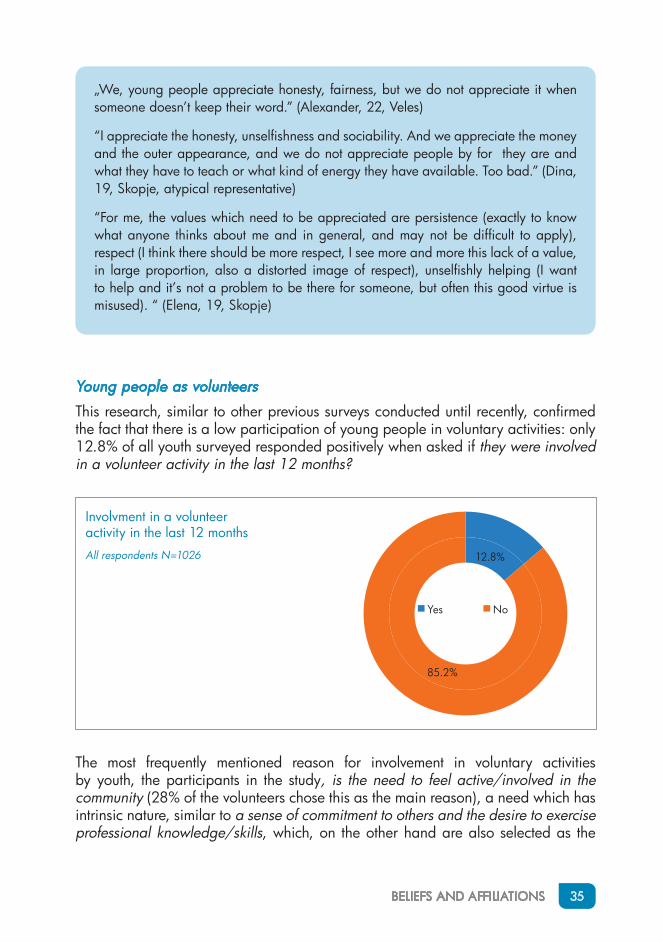
Young people as volunteers
This research, similar to other previous surveys conducted until recently, confirmed the fact that there is a low participation of young people in voluntary activities: only 12.8% of all youth surveyed responded positively when asked if they were involved in a volunteer activity in the last 12 months?
12.8%
85.2%
Yes No
Involvment in a volunteeractivity in the last 12 monthsAll respondents N=1026
The most frequently mentioned reason for involvement in voluntary activities by youth, the participants in the study, is the need to feel active/involved in the community (28% of the volunteers chose this as the main reason), a need which has intrinsic nature, similar to a sense of commitment to others and the desire to exercise professional knowledge/skills, which, on the other hand are also selected as the

36 YOUTH STUDY MACEDONIA 2013
main reasons. The desire to meet employers from the public sphere who in the future will be able to employ them is again of intrinsic nature and rarely is chosen as a reason for involvement in volunteer activities
,0 5,0 10,0 15,0 20,0 25,0 30,0
Need to feel active/involvedSense of commitment to others
Desire to exercise professional knowledge/skillsDesire to create new friendships
Family traditionDesire to meet private employers
Religious believesOther reasons
Desire to meet political party leadersDesire to meet employers from the public sphere
The main reasons for involvment in volunteer activitiesOonly those resondetns who are involved in volunteer activity N=131
The type of volunteer activity that usually involves the Macedonian youth includes help and support for some of the vulnerable/marginalized groups, such as the poor, the elderly and the frail, the disabled, children without parental care, single parents... (over 45% of volunteers are active in this part). Afterward, according to frequency, come building and maintenance of green areas, as well as support and training for foreign languages.
45.5%
36.6%
30.1%
28%
25.4%
25%
23%
21.3%
17.9%
10.4%
Help and support for some of the vulnerable groupsBuilding and maintenance of green areas
Support and training in scienceSupport and training for foreign languages
Cleaning public areasAlleviating conflicts among...
Alleviating inter-ethnic conflictsSupport and training in the area of art
Building and maintenance of public facilitiesOther activities
Types of volunteer activities involving youngOnly those who are volunteers N=131
“Volunteering means to play for free of charge and my work will not be evaluated. My attitude is my personal breakthrough in musical art. In addition, volunteering also means exploitation. The whole situation about volunteering is completely inverted. “ (Alexander, 22, Veles)
BELIEFS AND AFFILIATIONS 37
“Those who have the time, should volunteer, I don’t have any time.” (Atanas, 28, Delcevo)
“I’ve never volunteered, I’m out of these happenings, and as far as I know neither one of my friends is involved in it. In some circles, you might face mockery in relation to that topic.” (Zulem, 28, Strumica)
“Until now, I have volunteered several times in the Red Cross but also in other NGOs. I have several friends who volunteer. It’s a nice feeling, to really help someone, you get some pleasure that you are worth and you can make someone else’s life better. But still, I could only do that for two hours a week. That much I can help. Where are my remaining hours which should be paid to me, I mean, be employed somewhere, so I can survive. Otherwise, I would become the person looking for help like the people that are seeking aid in the Red Cross.” (Sarita, 24, Suto Orizari)
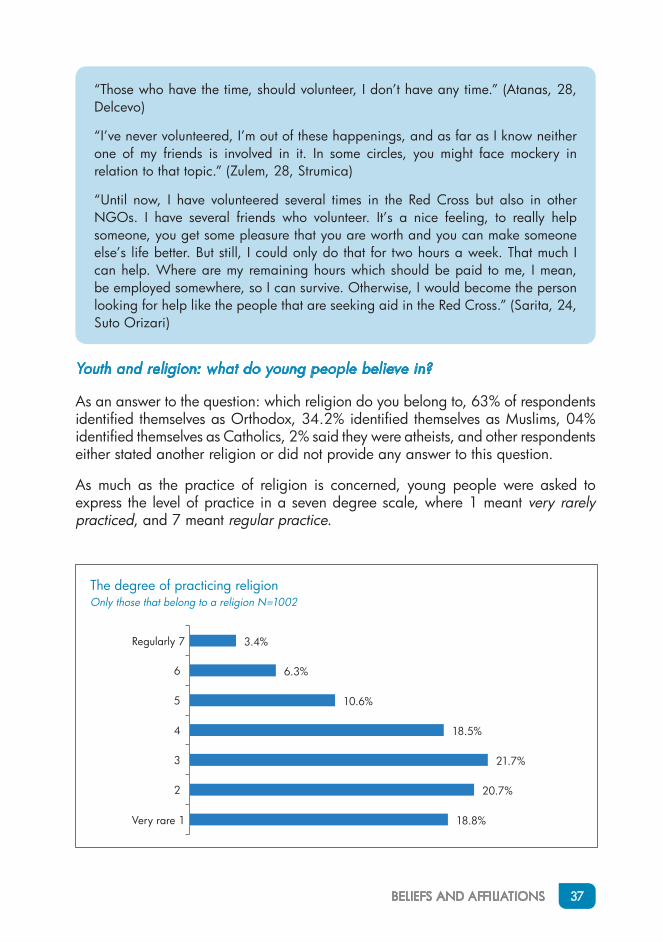
Youth and religion: what do young people believe in?
As an answer to the question: which religion do you belong to, 63% of respondents identified themselves as Orthodox, 34.2% identified themselves as Muslims, 04% identified themselves as Catholics, 2% said they were atheists, and other respondents either stated another religion or did not provide any answer to this question.
As much as the practice of religion is concerned, young people were asked to express the level of practice in a seven degree scale, where 1 meant very rarely practiced, and 7 meant regular practice.
18.8%
20.7%
21.7%
18.5%
10.6%
6.3%
3.4%
Very rare 1
2
3
4
5
6
Regularly 7
The degree of practicing religionOnly those that belong to a religion N=1002
38 YOUTH STUDY MACEDONIA 2013
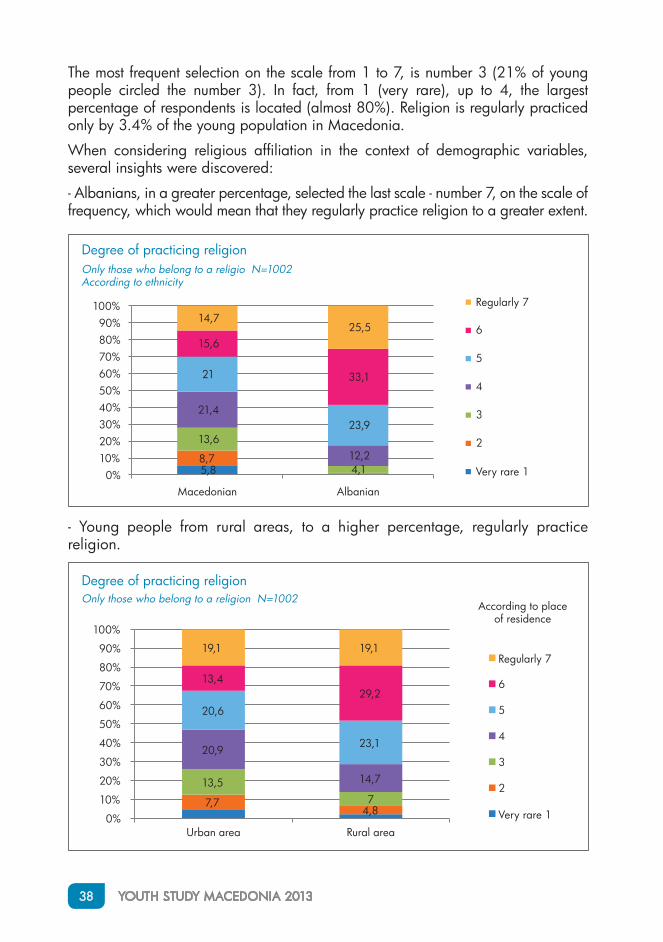
The most frequent selection on the scale from 1 to 7, is number 3 (21% of young people circled the number 3). In fact, from 1 (very rare), up to 4, the largest percentage of respondents is located (almost 80%). Religion is regularly practiced only by 3.4% of the young population in Macedonia.
When considering religious affiliation in the context of demographic variables, several insights were discovered:
- Albanians, in a greater percentage, selected the last scale - number 7, on the scale of frequency, which would mean that they regularly practice religion to a greater extent.
5,88,7
13,6
4,1
21,4
12,2
21
23,9
15,6
33,1
14,725,5
0%10%20%30%40%50%60%70%80%90%
100%
Macedonian Albanian
Regularly 7
6
5
4
3
2
Very rare 1
Degree of practicing religionOnly those who belong to a religio N=1002According to ethnicity
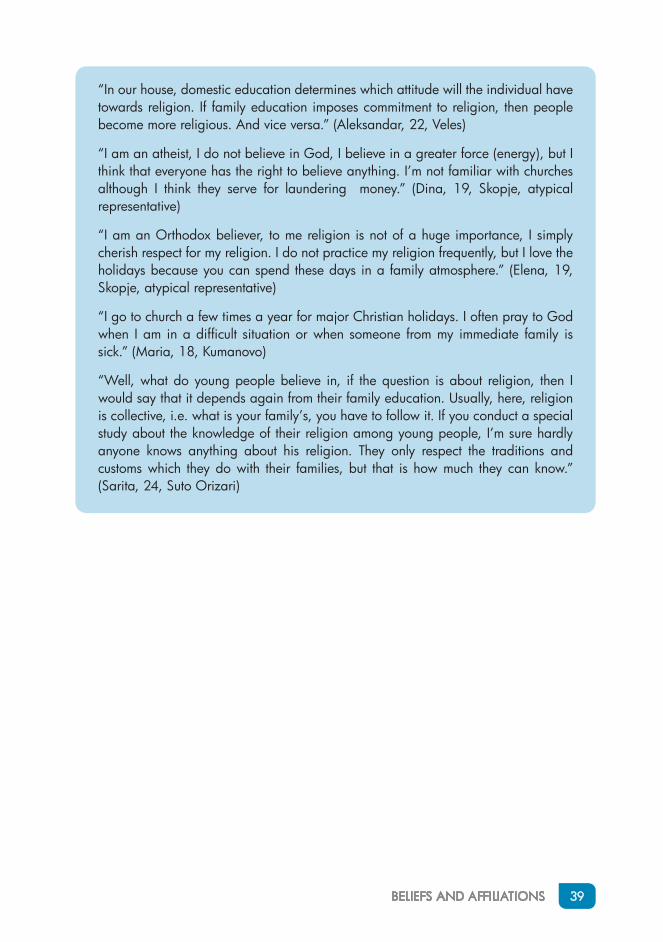
- Young people from rural areas, to a higher percentage, regularly practice religion.
7,74,8
13,57
20,9
14,7
20,6
23,1
13,429,2
19,1 19,1
0%
10%
20%
30%
40%
50%
60%
70%
80%
90%
100%
Urban area Rural area
Regularly 7
6
5
4
3
2
Very rare 1
Degree of practicing religionOnly those who belong to a religion N=1002
According to placeof residence
BELIEFS AND AFFILIATIONS 39
“In our house, domestic education determines which attitude will the individual have towards religion. If family education imposes commitment to religion, then people become more religious. And vice versa.” (Aleksandar, 22, Veles)
“I am an atheist, I do not believe in God, I believe in a greater force (energy), but I think that everyone has the right to believe anything. I’m not familiar with churches although I think they serve for laundering money.” (Dina, 19, Skopje, atypical representative)
“I am an Orthodox believer, to me religion is not of a huge importance, I simply cherish respect for my religion. I do not practice my religion frequently, but I love the holidays because you can spend these days in a family atmosphere.” (Elena, 19, Skopje, atypical representative)
“I go to church a few times a year for major Christian holidays. I often pray to God when I am in a difficult situation or when someone from my immediate family is sick.” (Maria, 18, Kumanovo)
“Well, what do young people believe in, if the question is about religion, then I would say that it depends again from their family education. Usually, here, religion is collective, i.e. what is your family’s, you have to follow it. If you conduct a special study about the knowledge of their religion among young people, I’m sure hardly anyone knows anything about his religion. They only respect the traditions and customs which they do with their families, but that is how much they can know.” (Sarita, 24, Suto Orizari)
40 YOUTH STUDY MACEDONIA 2013
FAMILY AND SOCIETY
In this part of the questionnaire there are questions aimed to investigate the relationship of youth with their families (parents, siblings), the influence of the family on their important life decisions, their projections for the future in terms of marriage, spouses, family and children.
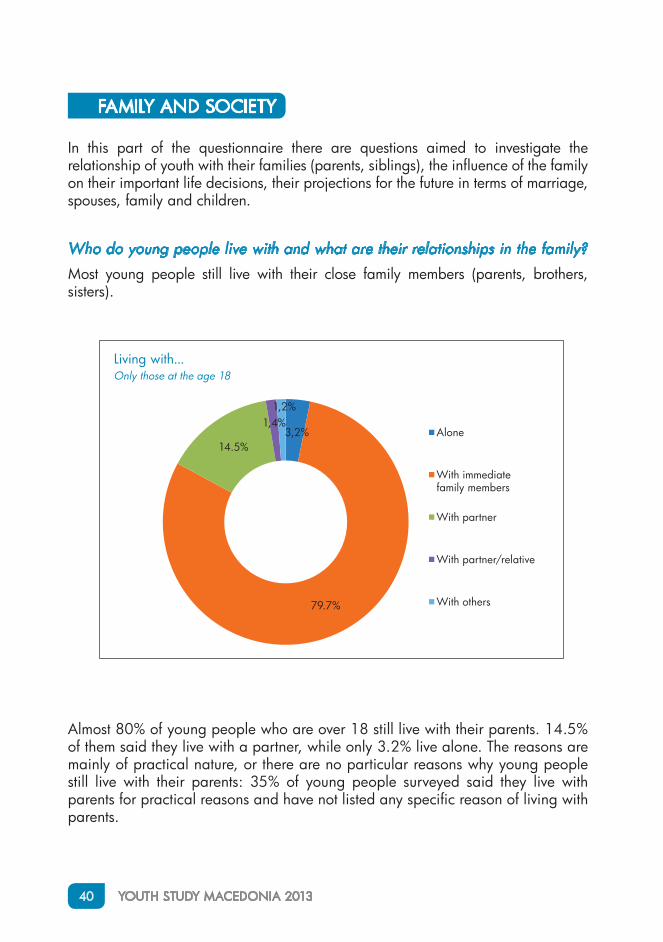
Who do young people live with and what are their relationships in the family?
Most young people still live with their close family members (parents, brothers, sisters).
3,2%
79.7%
14.5%
1,4%1,2%
Alone
With immediate family members
With partner
With partner/relative
With others
Living with...Only those at the age 18
Almost 80% of young people who are over 18 still live with their parents. 14.5% of them said they live with a partner, while only 3.2% live alone. The reasons are mainly of practical nature, or there are no particular reasons why young people still live with their parents: 35% of young people surveyed said they live with parents for practical reasons and have not listed any specific reason of living with parents.
FAMILY AND SOCIETY 41
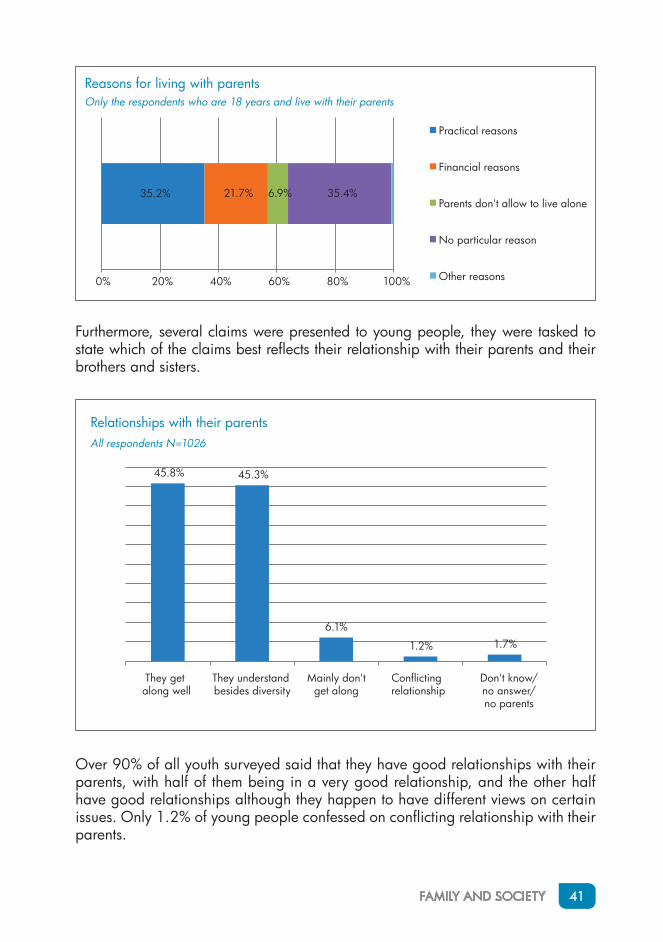
Furthermore, several claims were presented to young people, they were tasked to state which of the claims best reflects their relationship with their parents and their brothers and sisters.
35.2% 21.7% 6.9% 35.4%
0% 20% 40% 60% 80% 100%
Practical reasons
Financial reasons
Parents don't allow to live alone
No particular reason
Other reasons
Reasons for living with parentsOnly the respondents who are 18 years and live with their parents
45.8% 45.3%
6.1%
1.2% 1.7%
They get along well
They understand besides diversity
Mainly don'tget along
Conflicting relationship
Don't know/no answer/no parents
Relationships with their parentsAll respondents N=1026
Over 90% of all youth surveyed said that they have good relationships with their parents, with half of them being in a very good relationship, and the other half have good relationships although they happen to have different views on certain issues. Only 1.2% of young people confessed on conflicting relationship with their parents.
42 YOUTH STUDY MACEDONIA 2013
“I get along with my family, but we have different views on things. But, as my choice for a partner is different, I’m glad that is accepted by my family. In the future, I hope to be married to a partner and will have the right to establish a family, because I think I could raise my child with no efforts, no matter that I’m a lesbian.” (Elena, 19, Skopje, atypical representative)
“I’m in a very good relationship with my parents. I always tell them who do I go out with, where I go, as well as what has happened throughout the day. I try to communicate as often as possible in order for them not to lose confidence in me.” (Martina, 18, Skopje)
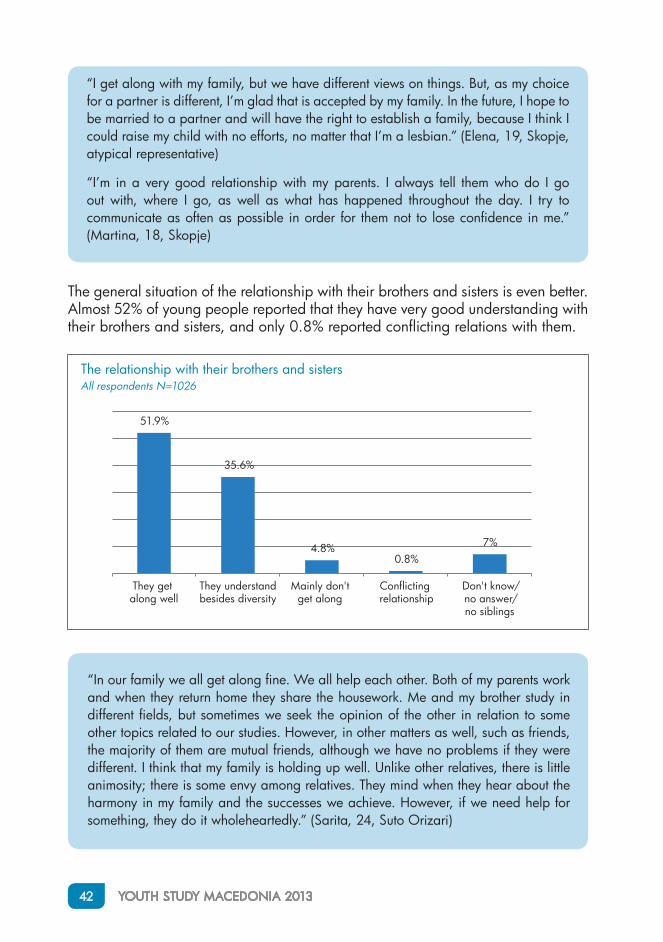
The general situation of the relationship with their brothers and sisters is even better. Almost 52% of young people reported that they have very good understanding with their brothers and sisters, and only 0.8% reported conflicting relations with them.
51.9%
35.6%
4.8%0.8%
7%
They get along well
They understandbesides diversity
Mainly don'tget along
Conflicting relationship
Don't know/no answer/no siblings
The relationship with their brothers and sistersAll respondents N=1026
“In our family we all get along fine. We all help each other. Both of my parents work and when they return home they share the housework. Me and my brother study in different fields, but sometimes we seek the opinion of the other in relation to some other topics related to our studies. However, in other matters as well, such as friends, the majority of them are mutual friends, although we have no problems if they were different. I think that my family is holding up well. Unlike other relatives, there is little animosity; there is some envy among relatives. They mind when they hear about the harmony in my family and the successes we achieve. However, if we need help for something, they do it wholeheartedly.” (Sarita, 24, Suto Orizari)
FAMILY AND SOCIETY 43
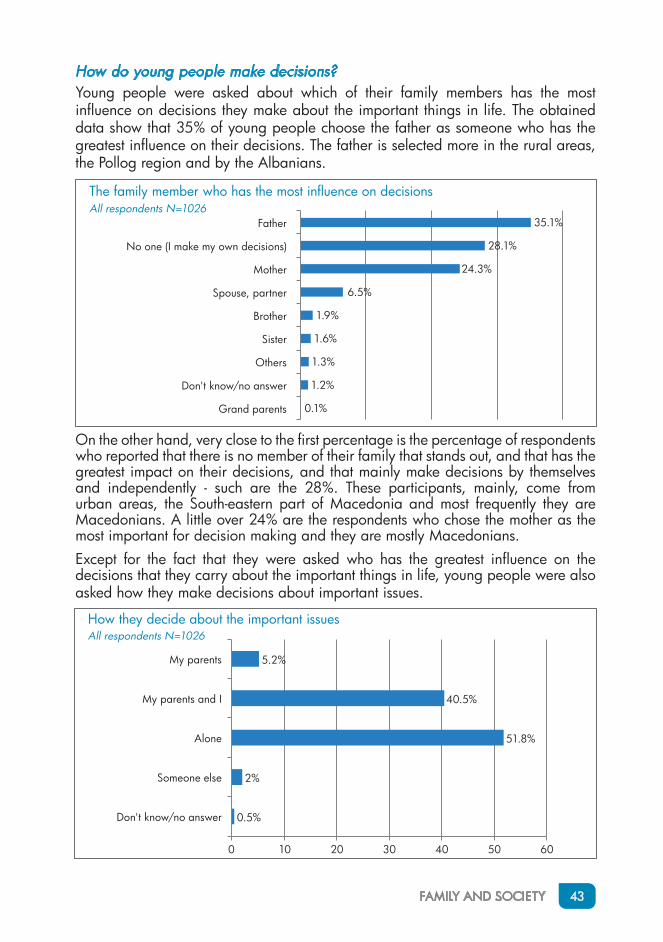
How do young people make decisions?Young people were asked about which of their family members has the most influence on decisions they make about the important things in life. The obtained data show that 35% of young people choose the father as someone who has the greatest influence on their decisions. The father is selected more in the rural areas, the Pollog region and by the Albanians.
0.1%
1.2%
1.3%
1.6%
1.9%
6.5%
24.3%
28.1%
35.1%
Grand parents
Don't know/no answer
Others
Sister
Brother
Spouse, partner
Mother
No one (I make my own decisions)
Father
The family member who has the most influence on decisionsAll respondents N=1026
On the other hand, very close to the first percentage is the percentage of respondents who reported that there is no member of their family that stands out, and that has the greatest impact on their decisions, and that mainly make decisions by themselves and independently - such are the 28%. These participants, mainly, come from urban areas, the South-eastern part of Macedonia and most frequently they are Macedonians. A little over 24% are the respondents who chose the mother as the most important for decision making and they are mostly Macedonians.Except for the fact that they were asked who has the greatest influence on the decisions that they carry about the important things in life, young people were also asked how they make decisions about important issues.
0.5%
2%
51.8%
40.5%
5.2%
0 10 20 30 40 50 60
Don't know/no answer
Someone else
Alone
My parents and I
My parents
How they decide about the important issuesAll respondents N=1026

44 YOUTH STUDY MACEDONIA 2013
More than half of young people said that they have the freedom to make their own decisions (these are mostly Macedonians, aged 20-24, and particularly those of 25-29 age groups, and young people from the South-eastern region), whereas 40% said that they carry decisions on major issues along with their parents (these are more Albanians, as well as the young from Pollog and the Eastern region). Only 7% of young people don’t participate in the decision-making process and their parents or someone else decides for them (usually the husband/partner).
“When making the important decisions of my life, I do this together with my parents who always support me and stand by my side. Here, for example, when choosing to enrol in secondary medical school, the decision was mine, and in that, my parents supported me.” (Martina, 18, Skopje)
Projections for the future: family, marriage, children...
The research has shown that young people have a unified projection about the future, and over 90% see themselves as married/married with their own family. Being without a partner or a child, or to be out of wedlock, is the least desirable alternatives for the future of young people in the RM.
5%
0.6%
2.7%
0.9%
90.8%
0 50 100
Don't know/no answer
No partner but with a child
No partner or family duties
Out of wedlock
Married with family
Projections for the futureAll respondents N=1026
Given that most young people, in the future see themselves in a marriage, it is interesting to see why, what are the main advantages of marriage in comparison to out of wedlock life that the youth emphasize.
FAMILY AND SOCIETY 45
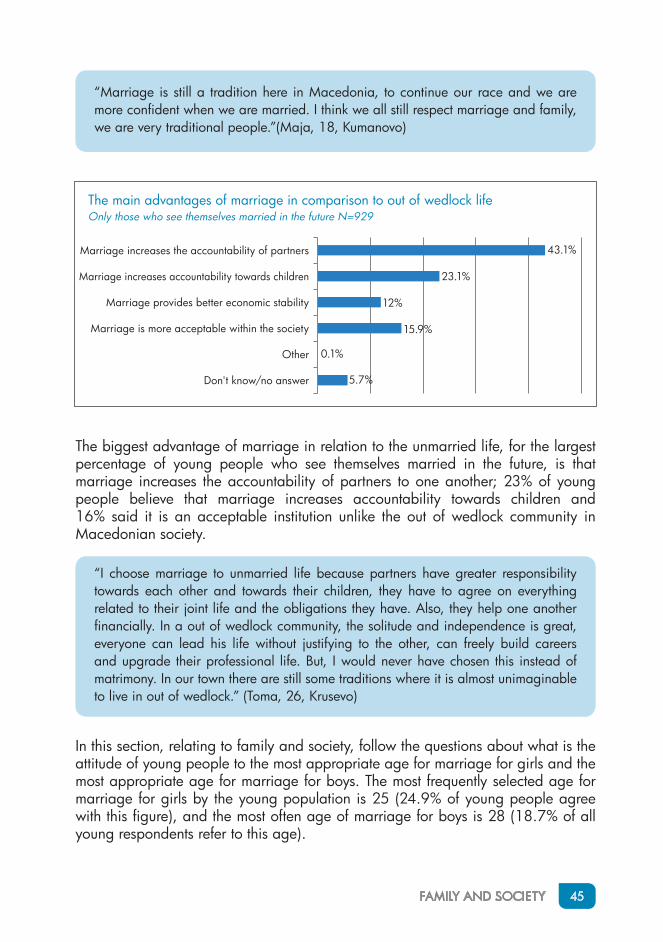
“Marriage is still a tradition here in Macedonia, to continue our race and we are more confident when we are married. I think we all still respect marriage and family, we are very traditional people.”(Maja, 18, Kumanovo)
5.7%
0.1%
15.9%
12%
23.1%
43.1%
Don't know/no answer
Other
Marriage is more acceptable within the society
Marriage provides better economic stability
Marriage increases accountability towards children
Marriage increases the accountability of partners
The main advantages of marriage in comparison to out of wedlock lifeOnly those who see themselves married in the future N=929
The biggest advantage of marriage in relation to the unmarried life, for the largest percentage of young people who see themselves married in the future, is that marriage increases the accountability of partners to one another; 23% of young people believe that marriage increases accountability towards children and 16% said it is an acceptable institution unlike the out of wedlock community in Macedonian society.
“I choose marriage to unmarried life because partners have greater responsibility towards each other and towards their children, they have to agree on everything related to their joint life and the obligations they have. Also, they help one another financially. In a out of wedlock community, the solitude and independence is great, everyone can lead his life without justifying to the other, can freely build careers and upgrade their professional life. But, I would never have chosen this instead of matrimony. In our town there are still some traditions where it is almost unimaginable to live in out of wedlock.” (Toma, 26, Krusevo)
In this section, relating to family and society, follow the questions about what is the attitude of young people to the most appropriate age for marriage for girls and the most appropriate age for marriage for boys. The most frequently selected age for marriage for girls by the young population is 25 (24.9% of young people agree with this figure), and the most often age of marriage for boys is 28 (18.7% of all young respondents refer to this age).
46 YOUTH STUDY MACEDONIA 2013
The appropriate age for marriage according to gender, ethnicity, place of residence
The appropriate
age for marriage, girls
The average age for
marriage, girls
The appropriate
age for marriage, boys
The average age for
marriage, boys
Gender Boys 25 24.75 28 27.47
Girls 25 25.26 28 27.87
Place of residence
Urban area 25 25.34 28 27.94
Rural area 25 24.50 28 27.30
EthnicityMacedonian 25 25.64 28 28.33
Albanian 25 23.97 28 26.66
The table highlights the fact that most often mentioned age for marriage by young people of different ethnicity, gender and place of residence is always the same: 25 years for marriage for girls and 28 for boys.
However, the analysis of the median values showed significant differences between males and females, between young people from urban and rural areas and between Macedonians and Albanians. The female respondents, Macedonians and young people from urban areas, without exception, believe that boys and girls should marry later, compared with the male respondents, rural youth and Albanians.
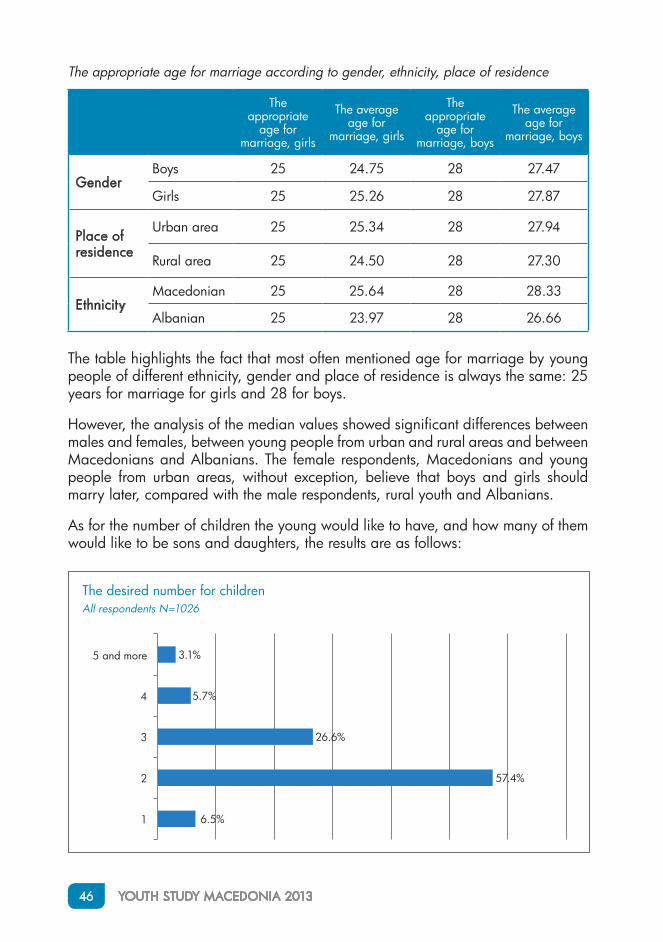
As for the number of children the young would like to have, and how many of them would like to be sons and daughters, the results are as follows:
6.5%
57.4%
26.6%
5.7%
3.1%
1
2
3
4
5 and more
The desired number for childrenAll respondents N=1026
FAMILY AND SOCIETY 47
Little over half (57%) of young participants in the study said they would like to have 2 children and 26.6% opted for 3 children as a desired number, which confirmed the multi-annual Macedonian standard for family of four. To the 30.5% of young adults the gender of their children is not important, so they would not emphasize how many sons and daughters they would like, but to 69.5% the gender will be important, and then they specify how many sons and how many daughters would wish to have. The table shows the average numbers of children, daughters and sons, to those who give importance to the gender of children.
The desired number of children, daughters and sons by gender, place of residence and ethnicity
The desired number of children
(average)
The desired number of daughters (average)
The desired number of sons
(average)
All sample 2.45 1.1 1.22
Gender Boys 2.54 1.02 1.32
Girls 2.36 1.18 1.12
Place of residence
Urban area 2.36 1.18 1.12
Rural area 2.56 1.24 1.35
EthnicityMacedonian 2.28 1.04 1.16
Albanian 2.75 1.24 1.31
The data show that men desire more children on average, and more male than female. The women, compared to men, want fewer children and more female than male. Young people in rural areas, compared with those from urban areas, on average desire more children (male and female). Same is the situation with the Albanians. Compared with the Macedonians, on average, Albanians want more children (male and female).
How do young people choose their love partner?
At the end of this section, young people were asked on the significance of certain factors when choosing a love partner/spouse. In addition, the significance was measured with five degrees from the Likert scale, where 1 meant at all insignificant, and 5 - very significant.
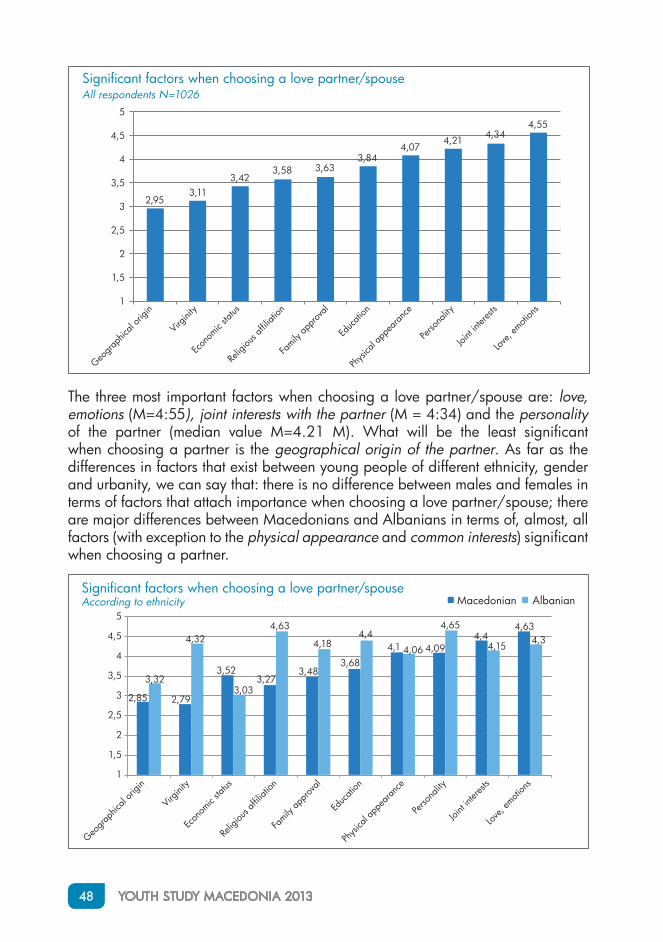
48 YOUTH STUDY MACEDONIA 2013
The three most important factors when choosing a love partner/spouse are: love, emotions (M=4:55), joint interests with the partner (M = 4:34) and the personality of the partner (median value M=4.21 M). What will be the least significant when choosing a partner is the geographical origin of the partner. As far as the differences in factors that exist between young people of different ethnicity, gender and urbanity, we can say that: there is no difference between males and females in terms of factors that attach importance when choosing a love partner/spouse; there are major differences between Macedonians and Albanians in terms of, almost, all factors (with exception to the physical appearance and common interests) significant when choosing a partner.
2,953,11
3,423,58 3,63
3,844,07
4,214,34
4,55
1
1,5
2
2,5
3
3,5
4
4,5
5
Significant factors when choosing a love partner/spouseAll respondents N=1026
Geogra
phica
l orig
in
Virgin
ity
Econ
omic
status
Relig
ious a
ffiliat
ion
Family
appr
oval
Educ
ation
Physi
cal a
ppea
rance
Perso
nality
Joint
intere
sts
Love
, emoti
ons
1
1,5
2
2,5
3
3,5
4
4,5
5
Macedonian AlbanianSignificant factors when choosing a love partner/spouseAccording to ethnicity
Geogra
phica
l orig
in
Virgin
ity
Econ
omic
status
Relig
ious a
ffiliat
ion
Family
appr
oval
Educ
ation
Physi
cal a
ppea
rance
Perso
nality
Joint
intere
sts
Love
, emoti
ons
2,85 2,79
3,523,27
3,483,68
4,1 4,094,4
4,63
3,32
4,32
3,03
4,63
4,184,4
4,06
4,65
4,154,3
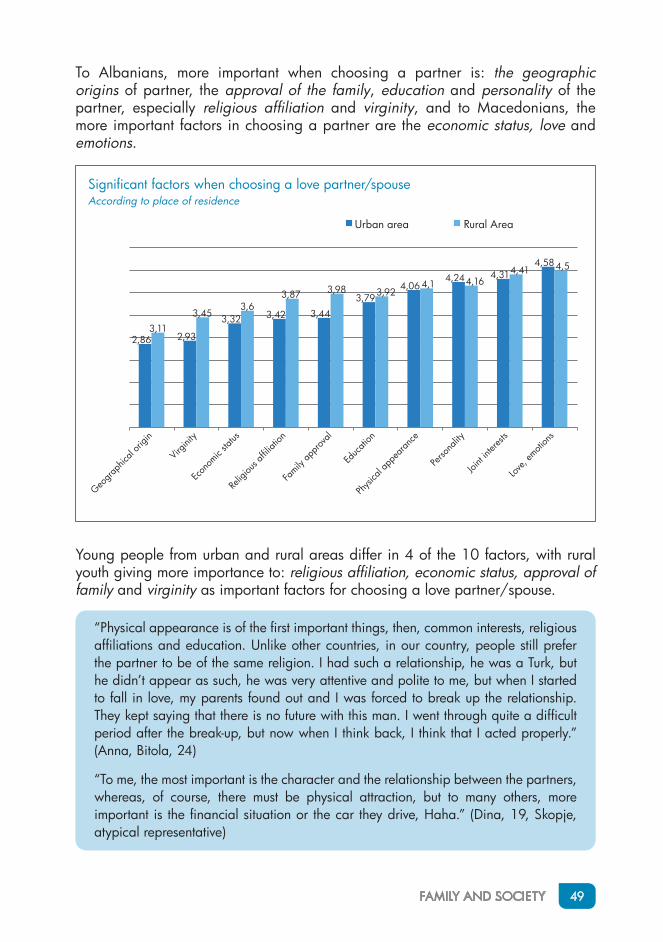
FAMILY AND SOCIETY 49
To Albanians, more important when choosing a partner is: the geographic origins of partner, the approval of the family, education and personality of the partner, especially religious affiliation and virginity, and to Macedonians, the more important factors in choosing a partner are the economic status, love and emotions.
Significant factors when choosing a love partner/spouseAccording to place of residence
Urban area Rural Area
Geogra
phica
l orig
in
Virgin
ity
Econ
omic
status
Relig
ious a
ffiliat
ion
Family
appr
oval
Educ
ation
Physi
cal a
ppea
rance
Perso
nality
Joint
intere
sts
Love
, emoti
ons
4,13,92
2,86 2,93
3,32 3,42 3,44
3,794,06
4,24 4,314,58
3,113,45
3,6 3,87 3,98
4,164,41 4,5
Young people from urban and rural areas differ in 4 of the 10 factors, with rural youth giving more importance to: religious affiliation, economic status, approval of family and virginity as important factors for choosing a love partner/spouse.
“Physical appearance is of the first important things, then, common interests, religious affiliations and education. Unlike other countries, in our country, people still prefer the partner to be of the same religion. I had such a relationship, he was a Turk, but he didn’t appear as such, he was very attentive and polite to me, but when I started to fall in love, my parents found out and I was forced to break up the relationship. They kept saying that there is no future with this man. I went through quite a difficult period after the break-up, but now when I think back, I think that I acted properly.” (Anna, Bitola, 24)
“To me, the most important is the character and the relationship between the partners, whereas, of course, there must be physical attraction, but to many others, more important is the financial situation or the car they drive, Haha.” (Dina, 19, Skopje, atypical representative)
50 YOUTH STUDY MACEDONIA 2013
“Well, as we found each other ... we are dating for very a long time and I know her kind. If you take a flute, poorer than me, why would I need such a person, we should have similar economic status.” (Atanas, 28, Delcevo)
“When choosing my life partner, like everyone else, I have my own principles - naturally, the most important thing within youth of Albanian origin is nationality and religion, it applies to everyone, but that depends on how he sees things and what visions he has for the future. Normally, above all, I have my nationality and religion, and would prefer for him to be Albanian and Muslim, to have no problems in the future and not to have turbulences within the family, then, of course: his character, education, family origin, not to deal with bad things... . I would like to know these things before I start a new life. It’s evident that the economic status is observed, but it is not very important to me, whether he’s rich or poor. First of all, I would like him to be a decent human being.” (Ermira, 24, Tetovo)
“When deciding on a life partner, certain factors cannot be taken according to specific parameters which we make selections. But, mostly it is the chemistry between the people and their understanding. The differences should not lead to rejection, they should complement each other, therefore, religious, national and statutory differences should not be considered as deciding factors.” (Maja, 24, Ohrid)
“When selecting a love partner, we, the young people mostly see whether there is a concrete economical situation (property), the nationality, whether our parents will approve, whereas physical appearance, character, passion and love are in the background, it lasts very shortly and later they only focus on further existence. They say, you cannot live out of love.” (Maria, 18, Kumanovo)
“When choosing a spouse, it is important to get along, to have love, honesty and trust among us, as well as having common interests. The physical appearance is important to me, but not my priority, it would be good if my parents approve my choice, but if they do not approve, I will certainly oppose to them. Certainly, religion is important, I want my spouse and I to be part of the same religion.” (Martina, 18, Skopje)
“In my opinion, the most important factor in choosing a love partner is physical appearance, personality, common interests... . The economic status of her parents, for example, is not important, but it is important to study or have completed university studies, since, on the other hand, you need to support the family, to contribute similarly.” (Mile, 23, Kavadarci)

FAMILY AND SOCIETY 51
How safe do young people feel?
The last question of this section applies to the sense of security in the place where young people live.
6
4,2
43,5
45,8
0,5
0 10 20 30 40 50
Highly unsafe
Relatively unsafe
Partially safe
Very safe
Don't know/no answer
The sense of security in the place where young people liveAll respondents N=1026
Almost 90% of youth, participants in the study, said they feel safe in the place where they live, and there is no difference between young people with: a different ethnicity, gender, age, residence and region.
“To be honest, I live in Bitola and feel safe in the city, I haven’t done anything bad to anyone, in order to be afraid of physical attacks, kidnappings, however I’m concerned about robberies, there are many robberies happening in our city. Every day we hear about it from friends, neighbours, relatives, but also on television. It never happened to me, but it did happen to my friends.” (Anna, Bitola, 24)
“I never feel safe, not when I’m alone, or when in company, nor on the streets, and neither at home. Several times I’ve had situations where an incident will break out in the cafeteria and then everyone gets out however they can, to save themselves, and in schools there are more frequent fights with serious consequences. Our house was attacked several times and valuables were stolen. I have bad experiences on this topic, it is not safe anywhere, but still, it’s good - we are still alive and healthy.” (Maria, 18, Kumanovo)
52 YOUTH STUDY MACEDONIA 2013
CONCLUSIONS
•• The young population trust most the members of their family, their relatives and their friends. They trust least the political leaders and people with different political affiliations than theirs. This group “includes” people with different ethnic background. Trust is related to the ethnicity and the region where young people live.
•• The most acceptable for close neighbours for the young in RM are student couples, families from the United States, as well as the families from Western Europe. Macedonian families are included as well in this group. The least acceptable immediate neighbours for the Macedonian youth are convincingly homosexual couples, but also Roma families and families from Kosovo. This group of “unacceptable” neighbours also includes Albanian families.
•• Young people, respondents in this study, believe that political affiliation and ethnicity are reasons for discrimination. In terms of discrimination, the female respondents in significantly higher percentage attribute gender as a reason for discrimination; the Orthodox respondents in significantly higher numbers state religion as a reason for discrimination; Albanians were significantly more likely to say that ethnicity is a cause for discrimination, as do the young living in rural areas who attribute it to the rural environment.
•• The majority of young people surveyed chose personal dignity as a value that is most appreciated, honesty is the next feature that most young people appreciate and tolerance took the third place in importance.
•• There is a low involvement of young people in volunteer activities. The main reasons for involvement in voluntary activities are: the urge to feel active/involved in the community, a sense of commitment to others and the desire to practice professional knowledge/skills. The desire to meet employers from the public sphere that in the future might employ them, is the least frequent reason for involvement in volunteer activities. The type of volunteer activity that the Macedonian youth is usually involved is helping and supporting some of the vulnerable/marginalized groups such as the poor, elderly and frail, disabled, children without parental care, single parents.
•• Religion is regularly practiced by only 3.4% of the young population of RM.
•• A large proportion of young people over 18 still live with their close family members, particularly parents, and the reasons are mainly of a practical nature, or perhaps because it is “normal” to live with parents in this part of the world.
•• The relationships that young population have with their families (parents, siblings) are very good, and conflicting relationships are rare. The father is still the figure that has the greatest impact on the decisions of young people, although there are
FAMILY AND SOCIETY 53
more often young people from the urban areas who make their decisions mainly alone and independently.
•• The young see themselves in the future as married, with their family. Being without a partner and a child, or out of wedlock, is the least desirable alternatives for the future of young people in the country. The biggest advantage of marriage in relation to the out of wedlock community, to the largest percentage of young people who see themselves in the future married, is that marriage increases the accountability of partners towards one another;
•• The most appropriate age for marriage is 28 for boys, and 25 old for girls. They prefer mainly 2 children, the youth is concerned about the gender of the children, and they will state that they would prefer sons to daughters.
•• The three most important factors when choosing a love partner/spouse are: love, emotions, interests shared with the partner and the partner’s personality. What youth will be least concerned about when choosing a partner is the geographical origin of the partner. There is no difference between males and females in terms of factors that attach importance when choosing a love partner/spouse. To Albanians, when choosing a partner, important are the geographical origin of the partner, approval of family, education and the personality of the partner, especially the religious affiliation and virginity, whereas to Macedonians the important factors in choosing a partner are the economic status and love, emotions. The rural youth attribute greater importance to religious affiliation, economic status, approval of family and virginity as important factors for choosing a love partner/spouse.
•• Almost 90% of youth, participants in the study, said they feel safe in the place where they live, and there is no difference among young people with: a different ethnicity, gender, age, residence or region.
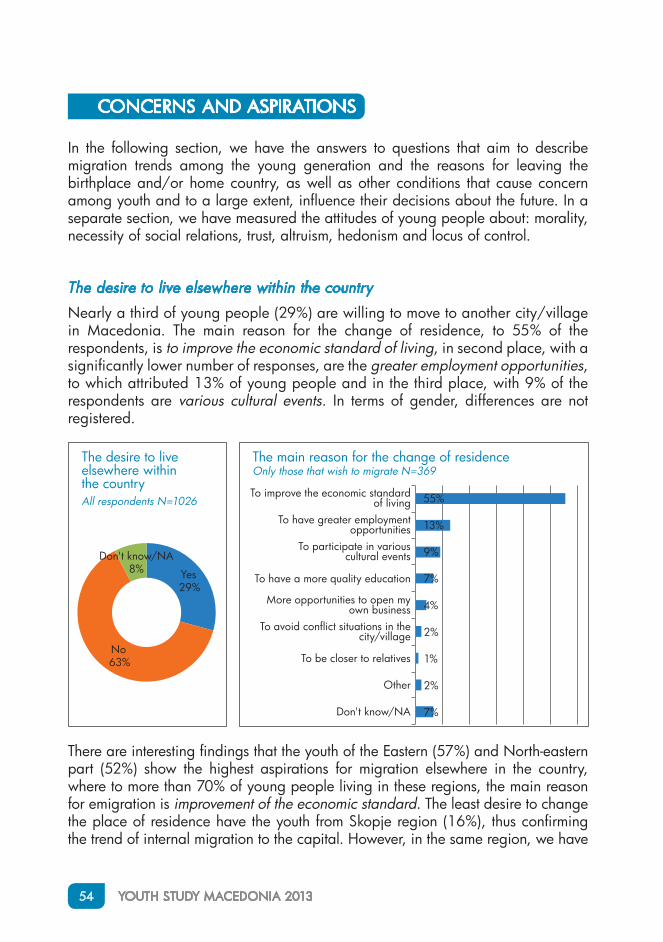
54 YOUTH STUDY MACEDONIA 2013
CONCERNS AND ASPIRATIONS
In the following section, we have the answers to questions that aim to describe migration trends among the young generation and the reasons for leaving the birthplace and/or home country, as well as other conditions that cause concern among youth and to a large extent, influence their decisions about the future. In a separate section, we have measured the attitudes of young people about: morality, necessity of social relations, trust, altruism, hedonism and locus of control.
The desire to live elsewhere within the country
Nearly a third of young people (29%) are willing to move to another city/village in Macedonia. The main reason for the change of residence, to 55% of the respondents, is to improve the economic standard of living, in second place, with a significantly lower number of responses, are the greater employment opportunities, to which attributed 13% of young people and in the third place, with 9% of the respondents are various cultural events. In terms of gender, differences are not registered.
Yes 29%
No63%
Don't know/NA8%
The desire to live elsewhere within the country All respondents N=1026
7%
2%
1%
2%
4%
7%
9%
13%
55%
Don't know/NA
Other
To be closer to relatives
To avoid conflict situations in the city/village
More opportunities to open my own business
To have a more quality education
To participate in various cultural events
To have greater employment opportunities
To improve the economic standard of living
The main reason for the change of residenceOnly those that wish to migrate N=369
There are interesting findings that the youth of the Eastern (57%) and North-eastern part (52%) show the highest aspirations for migration elsewhere in the country, where to more than 70% of young people living in these regions, the main reason for emigration is improvement of the economic standard. The least desire to change the place of residence have the youth from Skopje region (16%), thus confirming the trend of internal migration to the capital. However, in the same region, we have
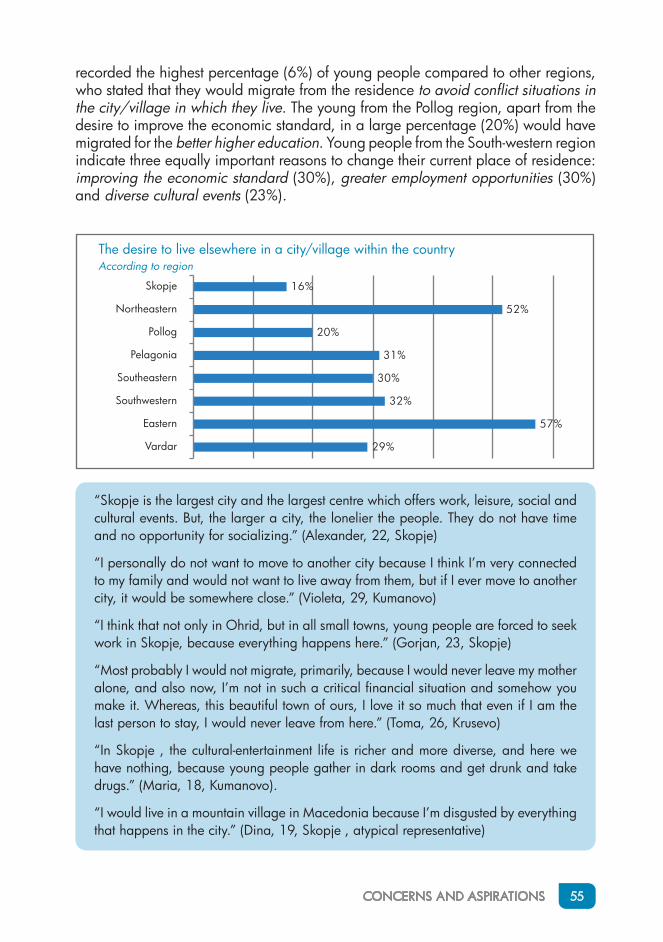
CONCERNS AND ASPIRATIONS 55
recorded the highest percentage (6%) of young people compared to other regions, who stated that they would migrate from the residence to avoid conflict situations in the city/village in which they live. The young from the Pollog region, apart from the desire to improve the economic standard, in a large percentage (20%) would have migrated for the better higher education. Young people from the South-western region indicate three equally important reasons to change their current place of residence: improving the economic standard (30%), greater employment opportunities (30%) and diverse cultural events (23%).
29%
57%
32%
30%
31%
20%
52%
16%
Vardar
Eastern
Southwestern
Southeastern
Pelagonia
Pollog
Northeastern
Skopje
The desire to live elsewhere in a city/village within the countryAccording to region
“Skopje is the largest city and the largest centre which offers work, leisure, social and cultural events. But, the larger a city, the lonelier the people. They do not have time and no opportunity for socializing.” (Alexander, 22, Skopje)
“I personally do not want to move to another city because I think I’m very connected to my family and would not want to live away from them, but if I ever move to another city, it would be somewhere close.” (Violeta, 29, Kumanovo)
“I think that not only in Ohrid, but in all small towns, young people are forced to seek work in Skopje, because everything happens here.” (Gorjan, 23, Skopje)
“Most probably I would not migrate, primarily, because I would never leave my mother alone, and also now, I’m not in such a critical financial situation and somehow you make it. Whereas, this beautiful town of ours, I love it so much that even if I am the last person to stay, I would never leave from here.” (Toma, 26, Krusevo)
“In Skopje , the cultural-entertainment life is richer and more diverse, and here we have nothing, because young people gather in dark rooms and get drunk and take drugs.” (Maria, 18, Kumanovo).
“I would live in a mountain village in Macedonia because I’m disgusted by everything that happens in the city.” (Dina, 19, Skopje , atypical representative)
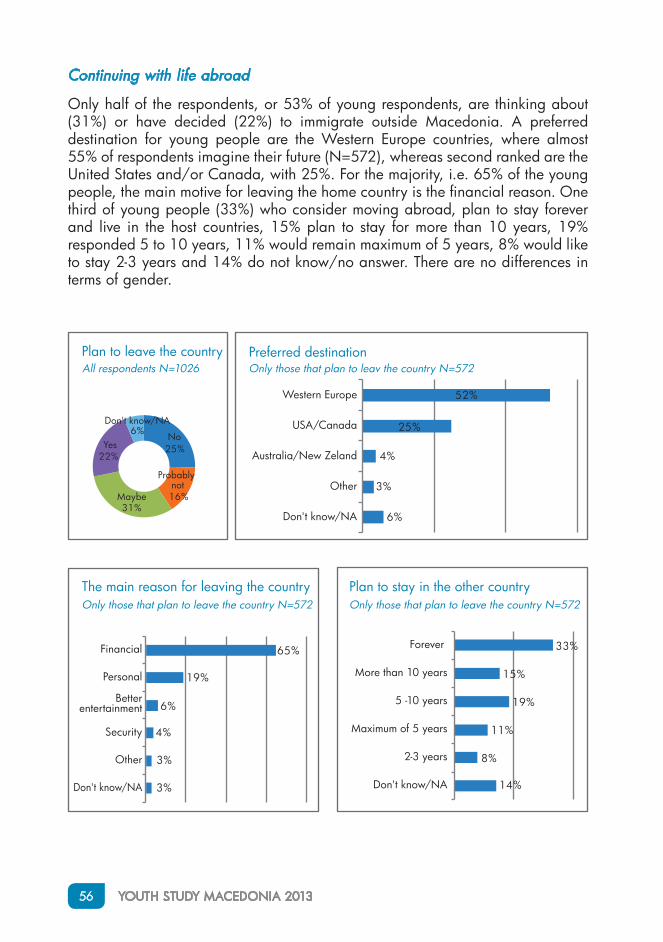
56 YOUTH STUDY MACEDONIA 2013
Continuing with life abroad
Only half of the respondents, or 53% of young respondents, are thinking about (31%) or have decided (22%) to immigrate outside Macedonia. A preferred destination for young people are the Western Europe countries, where almost 55% of respondents imagine their future (N=572), whereas second ranked are the United States and/or Canada, with 25%. For the majority, i.e. 65% of the young people, the main motive for leaving the home country is the financial reason. One third of young people (33%) who consider moving abroad, plan to stay forever and live in the host countries, 15% plan to stay for more than 10 years, 19% responded 5 to 10 years, 11% would remain maximum of 5 years, 8% would like to stay 2-3 years and 14% do not know/no answer. There are no differences in terms of gender.
No25%
Probably not16%Maybe
31%
Yes22%
Don't know/NA6%
Plan to leave the countryAll respondents N=1026
6%
3%
4%
25%
52%
Don't know/NA
Other
Australia/New Zeland
USA/Canada
Western Europe
Preferred destination Only those that plan to leav the country N=572
3%
3%
4%
6%
19%
65%
Don't know/NA
Other
Security
Better entertainment
Personal
Financial
The main reason for leaving the countryOnly those that plan to leave the country N=572
14%
8%
11%
19%
15%
33%
Don't know/NA
2-3 years
Maximum of 5 years
5 -10 years
More than 10 years
Forever
Plan to stay in the other countryOnly those that plan to leave the country N=572
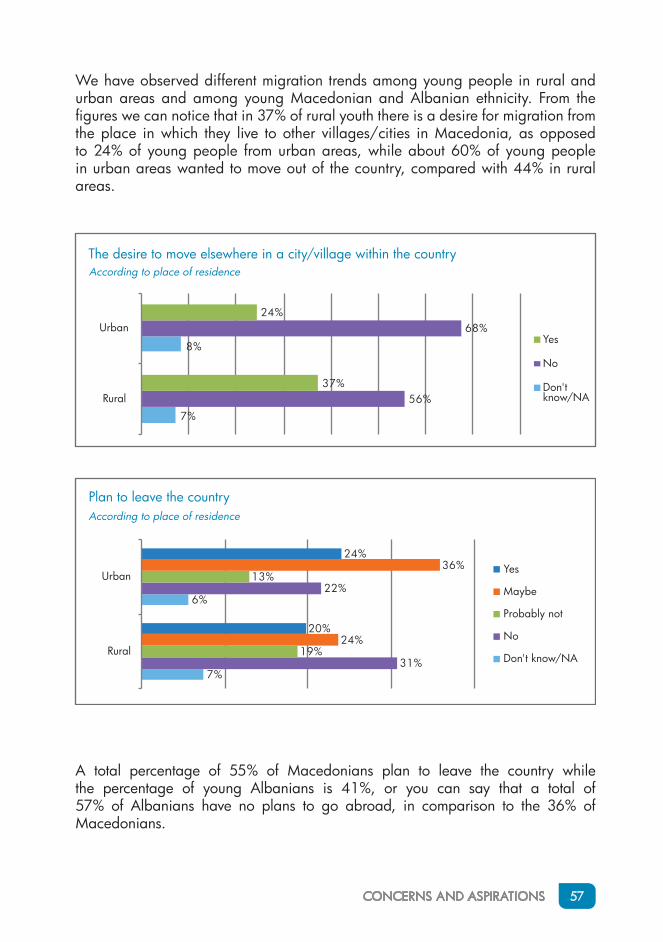
CONCERNS AND ASPIRATIONS 57
We have observed different migration trends among young people in rural and urban areas and among young Macedonian and Albanian ethnicity. From the figures we can notice that in 37% of rural youth there is a desire for migration from the place in which they live to other villages/cities in Macedonia, as opposed to 24% of young people from urban areas, while about 60% of young people in urban areas wanted to move out of the country, compared with 44% in rural areas.
7%
8%
56%
68%
37%
24%
Rural
UrbanYes
No
Don't know/NA
The desire to move elsewhere in a city/village within the countryAccording to place of residence
A total percentage of 55% of Macedonians plan to leave the country while the percentage of young Albanians is 41%, or you can say that a total of 57% of Albanians have no plans to go abroad, in comparison to the 36% of Macedonians.
7%
6%
31%
22%
19%
13%
24%
36%
20%
24%
Rural
UrbanYes
Maybe
Probably not
No
Don't know/NA
Plan to leave the countryAccording to place of residence
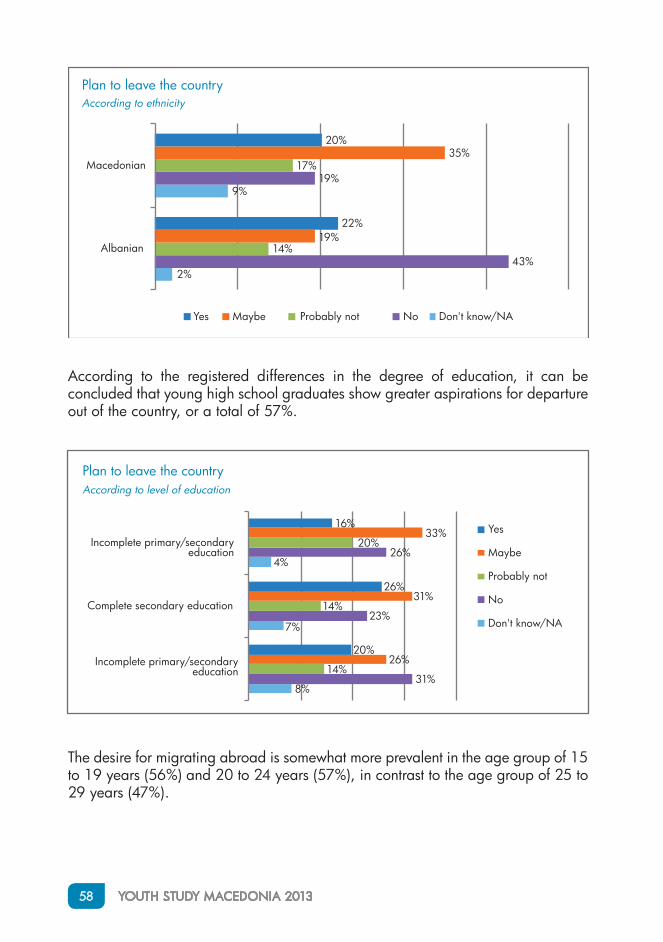
58 YOUTH STUDY MACEDONIA 2013
According to the registered differences in the degree of education, it can be concluded that young high school graduates show greater aspirations for departure out of the country, or a total of 57%.
2%
9%
43%
19%
14%
17%
19%
35%
22%
20%
Albanian
Macedonian
Yes Maybe Probably not No Don't know/NA
Plan to leave the countryAccording to ethnicity
8%
7%
4%
31%
23%
26%
14%
14%
20%
26%
31%
33%
20%
26%
16%
Incomplete primary/secondary education
Complete secondary education
Incomplete primary/secondary education
Yes
Maybe
Probably not
No
Don't know/NA
Plan to leave the countryAccording to level of education
The desire for migrating abroad is somewhat more prevalent in the age group of 15 to 19 years (56%) and 20 to 24 years (57%), in contrast to the age group of 25 to 29 years (47%).
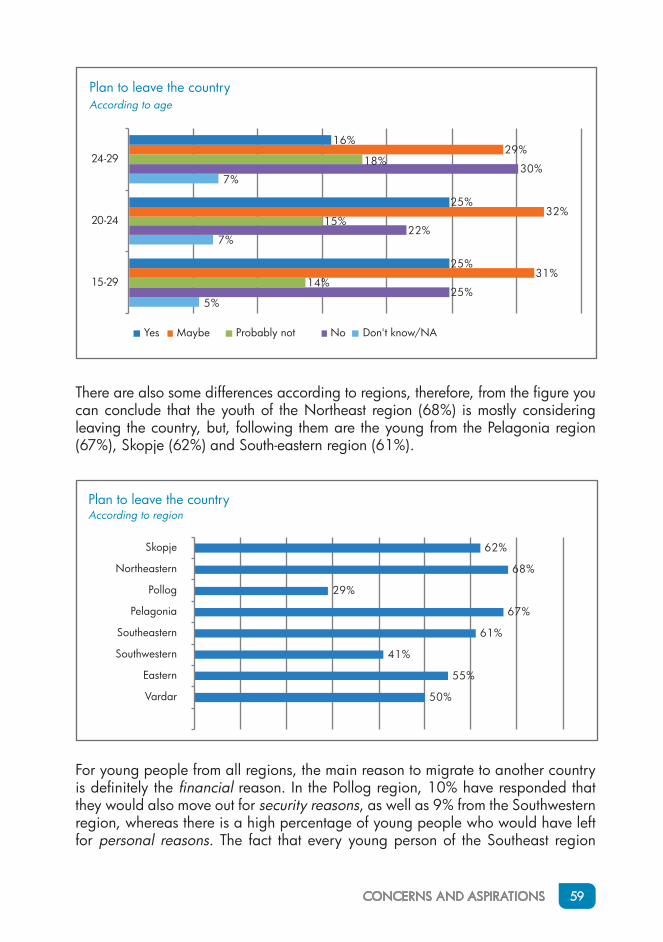
CONCERNS AND ASPIRATIONS 59
There are also some differences according to regions, therefore, from the figure you can conclude that the youth of the Northeast region (68%) is mostly considering leaving the country, but, following them are the young from the Pelagonia region (67%), Skopje (62%) and South-eastern region (61%).
5%
7%
7%
25%
22%
30%
14%
15%
18%
31%
32%
29%
25%
25%
16%
15-29
20-24
24-29
Yes Maybe Probably not No Don't know/NA
Plan to leave the countryAccording to age
50%
55%
41%
61%
67%
29%
68%
62%
Vardar
Eastern
Southwestern
Southeastern
Pelagonia
Pollog
Northeastern
Skopje
Plan to leave the countryAccording to region
For young people from all regions, the main reason to migrate to another country is definitely the financial reason. In the Pollog region, 10% have responded that they would also move out for security reasons, as well as 9% from the Southwestern region, whereas there is a high percentage of young people who would have left for personal reasons. The fact that every young person of the Southeast region
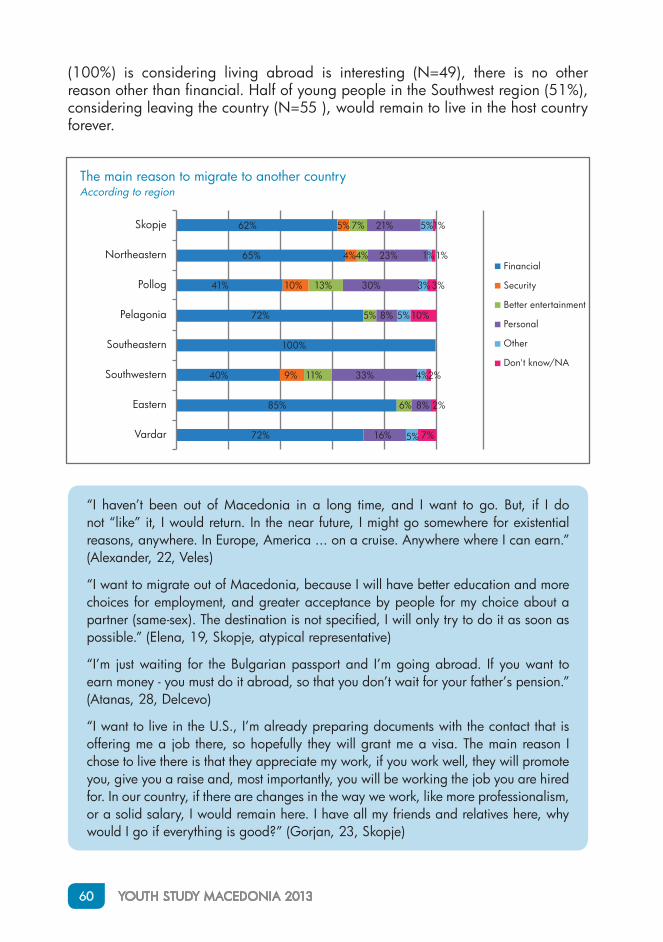
60 YOUTH STUDY MACEDONIA 2013
(100%) is considering living abroad is interesting (N=49), there is no other reason other than financial. Half of young people in the Southwest region (51%), considering leaving the country (N=55 ), would remain to live in the host country forever.
72%
85%
40%
100%
72%
41%
65%
62%
9%
10%
4%
5%
6%
11%
5%
13%
4%
7%
16%
8%
33%
8%
30%
23%
21%
5%
4%
5%
3%
1%
5%
7%
2%
2%
10%
3%
1%
1%
Vardar
Eastern
Southwestern
Southeastern
Pelagonia
Pollog
Northeastern
Skopje
Financial
Security
Better entertainment
Personal
Other
Don't know/NA
The main reason to migrate to another countryAccording to region
“I haven’t been out of Macedonia in a long time, and I want to go. But, if I do not “like” it, I would return. In the near future, I might go somewhere for existential reasons, anywhere. In Europe, America ... on a cruise. Anywhere where I can earn.” (Alexander, 22, Veles)
“I want to migrate out of Macedonia, because I will have better education and more choices for employment, and greater acceptance by people for my choice about a partner (same-sex). The destination is not specified, I will only try to do it as soon as possible.” (Elena, 19, Skopje, atypical representative)
“I’m just waiting for the Bulgarian passport and I’m going abroad. If you want to earn money - you must do it abroad, so that you don’t wait for your father’s pension.” (Atanas, 28, Delcevo)
“I want to live in the U.S., I’m already preparing documents with the contact that is offering me a job there, so hopefully they will grant me a visa. The main reason I chose to live there is that they appreciate my work, if you work well, they will promote you, give you a raise and, most importantly, you will be working the job you are hired for. In our country, if there are changes in the way we work, like more professionalism, or a solid salary, I would remain here. I have all my friends and relatives here, why would I go if everything is good?” (Gorjan, 23, Skopje)
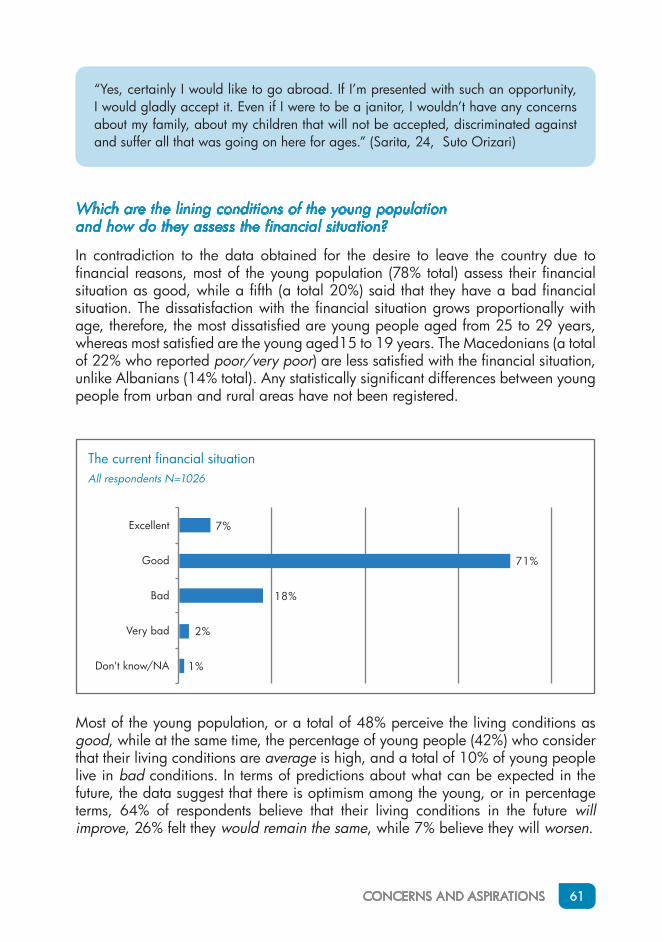
CONCERNS AND ASPIRATIONS 61
“Yes, certainly I would like to go abroad. If I’m presented with such an opportunity, I would gladly accept it. Even if I were to be a janitor, I wouldn’t have any concerns about my family, about my children that will not be accepted, discriminated against and suffer all that was going on here for ages.” (Sarita, 24, Suto Orizari)
Which are the lining conditions of the young population and how do they assess the financial situation?
In contradiction to the data obtained for the desire to leave the country due to financial reasons, most of the young population (78% total) assess their financial situation as good, while a fifth (a total 20%) said that they have a bad financial situation. The dissatisfaction with the financial situation grows proportionally with age, therefore, the most dissatisfied are young people aged from 25 to 29 years, whereas most satisfied are the young aged15 to 19 years. The Macedonians (a total of 22% who reported poor/very poor) are less satisfied with the financial situation, unlike Albanians (14% total). Any statistically significant differences between young people from urban and rural areas have not been registered.
1%
2%
18%
71%
7%
Don't know/NA
Very bad
Bad
Good
Excellent
The current financial situationAll respondents N=1026
Most of the young population, or a total of 48% perceive the living conditions as good, while at the same time, the percentage of young people (42%) who consider that their living conditions are average is high, and a total of 10% of young people live in bad conditions. In terms of predictions about what can be expected in the future, the data suggest that there is optimism among the young, or in percentage terms, 64% of respondents believe that their living conditions in the future will improve, 26% felt they would remain the same, while 7% believe they will worsen.
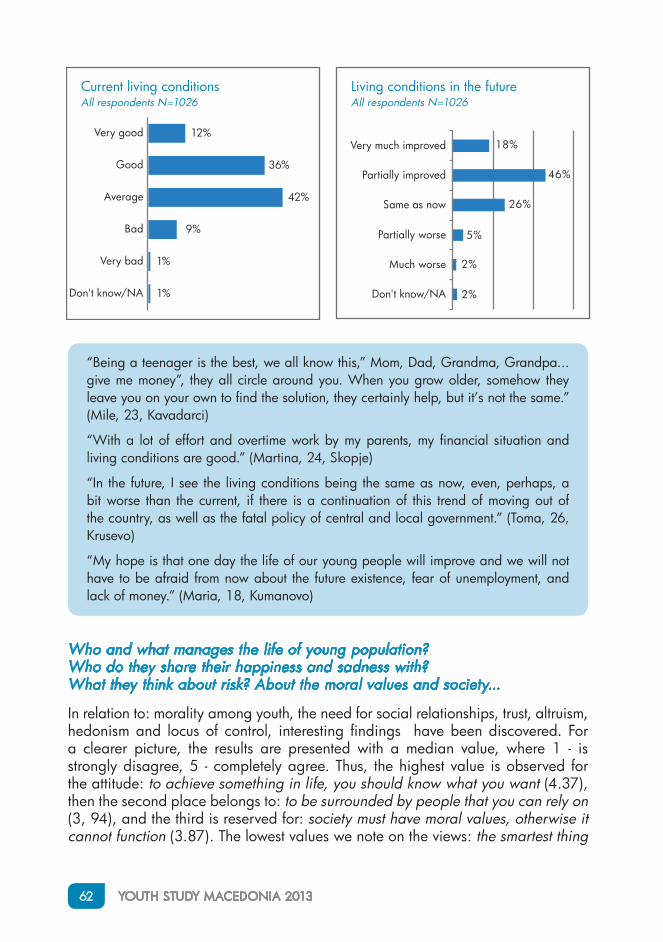
62 YOUTH STUDY MACEDONIA 2013
“Being a teenager is the best, we all know this,” Mom, Dad, Grandma, Grandpa... give me money”, they all circle around you. When you grow older, somehow they leave you on your own to find the solution, they certainly help, but it’s not the same.” (Mile, 23, Kavadarci)
“With a lot of effort and overtime work by my parents, my financial situation and living conditions are good.” (Martina, 24, Skopje)
“In the future, I see the living conditions being the same as now, even, perhaps, a bit worse than the current, if there is a continuation of this trend of moving out of the country, as well as the fatal policy of central and local government.” (Toma, 26, Krusevo)
“My hope is that one day the life of our young people will improve and we will not have to be afraid from now about the future existence, fear of unemployment, and lack of money.” (Maria, 18, Kumanovo)
1%
1%
9%
42%
36%
12%
Don't know/NA
Very bad
Bad
Average
Good
Very good
Current living conditionsAll respondents N=1026
2%
2%
5%
26%
46%
18%
Don't know/NA
Much worse
Partially worse
Same as now
Partially improved
Very much improved
Living conditions in the future All respondents N=1026
Who and what manages the life of young population? Who do they share their happiness and sadness with? What they think about risk? About the moral values and society...
In relation to: morality among youth, the need for social relationships, trust, altruism, hedonism and locus of control, interesting findings have been discovered. For a clearer picture, the results are presented with a median value, where 1 - is strongly disagree, 5 - completely agree. Thus, the highest value is observed for the attitude: to achieve something in life, you should know what you want (4.37), then the second place belongs to: to be surrounded by people that you can rely on (3, 94), and the third is reserved for: society must have moral values , otherwise it cannot function (3.87). The lowest values we note on the views: the smartest thing
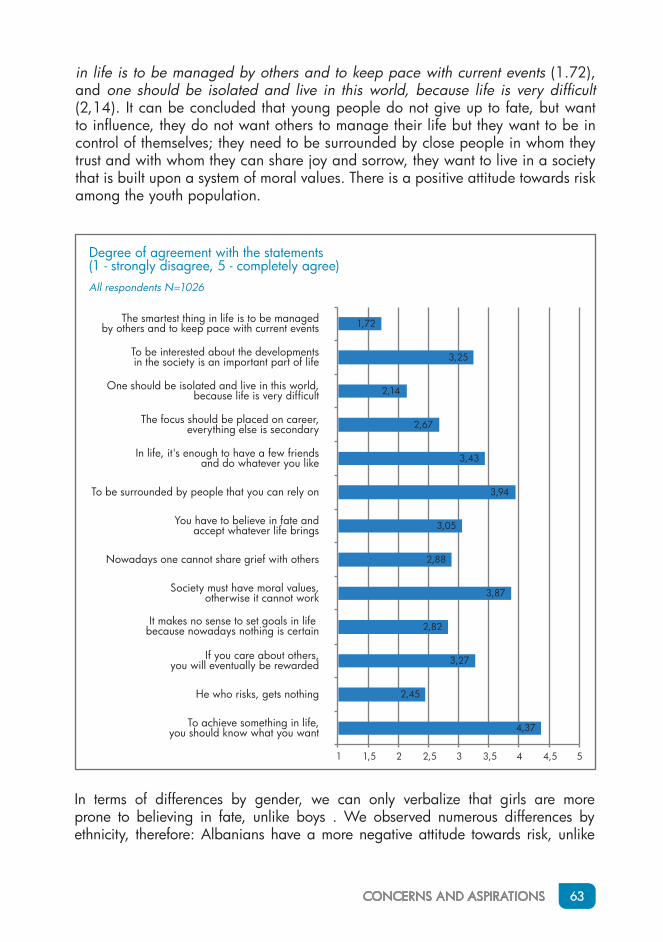
CONCERNS AND ASPIRATIONS 63
in life is to be managed by others and to keep pace with current events (1.72), and one should be isolated and live in this world, because life is very difficult (2,14). It can be concluded that young people do not give up to fate, but want to influence, they do not want others to manage their life but they want to be in control of themselves; they need to be surrounded by close people in whom they trust and with whom they can share joy and sorrow, they want to live in a society that is built upon a system of moral values . There is a positive attitude towards risk among the youth population.
4,37
2,45
3,27
2,82
3,87
2,88
3,05
3,94
3,43
2,67
2,14
3,25
1,72
1 1,5 2 2,5 3 3,5 4 4,5 5
Degree of agreement with the statements(1 - strongly disagree, 5 - completely agree)All respondents N=1026
To achieve something in life, you should know what you want
He who risks, gets nothing
If you care about others, you will eventually be rewarded
It makes no sense to set goals in life because nowadays nothing is certain
Society must have moral values, otherwise it cannot work
Nowadays one cannot share grief with others
You have to believe in fate and accept whatever life brings
To be surrounded by people that you can rely on
In life, it's enough to have a few friends and do whatever you like
The focus should be placed on career, everything else is secondary
One should be isolated and live in this world,because life is very difficult
To be interested about the developments in the society is an important part of life
The smartest thing in life is to be managedby others and to keep pace with current events
In terms of differences by gender, we can only verbalize that girls are more prone to believing in fate, unlike boys . We observed numerous differences by ethnicity, therefore: Albanians have a more negative attitude towards risk, unlike
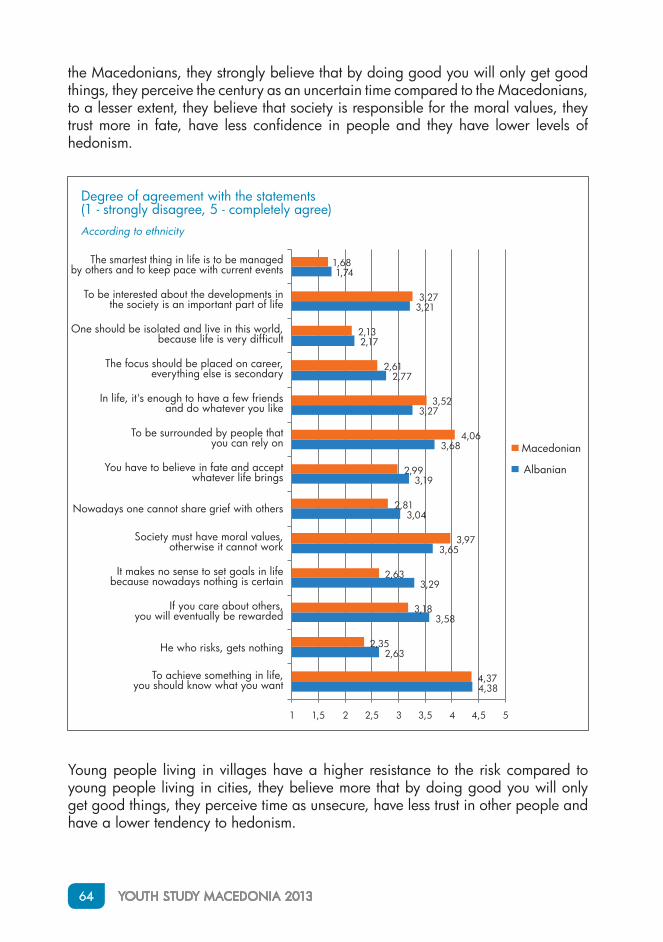
64 YOUTH STUDY MACEDONIA 2013
the Macedonians, they strongly believe that by doing good you will only get good things, they perceive the century as an uncertain time compared to the Macedonians, to a lesser extent, they believe that society is responsible for the moral values , they trust more in fate, have less confidence in people and they have lower levels of hedonism.
4,38
2,63
3,58
3,29
3,65
3,04
3,19
3,68
3,27
2,77
2,17
3,21
1,74
4,37
2,35
3,18
2,63
3,97
2,81
2,99
4,06
3,52
2,61
2,13
3,27
1,68
1 2 2,5 3 3,5 4 4,5 5
To achieve something in life, you should know what you want
He who risks, gets nothing
If you care about others, you will eventually be rewarded
It makes no sense to set goals in life because nowadays nothing is certain
Society must have moral values, otherwise it cannot work
Nowadays one cannot share grief with others
You have to believe in fate and accept whatever life brings
To be surrounded by people that you can rely on
In life, it's enough to have a few friends and do whatever you like
The focus should be placed on career, everything else is secondary
One should be isolated and live in this world, because life is very difficult
To be interested about the developments in the society is an important part of life
The smartest thing in life is to be managed by others and to keep pace with current events
Macedonian
Albanian
Degree of agreement with the statements(1 - strongly disagree, 5 - completely agree)According to ethnicity
1,5
Young people living in villages have a higher resistance to the risk compared to young people living in cities, they believe more that by doing good you will only get good things, they perceive time as unsecure, have less trust in other people and have a lower tendency to hedonism.
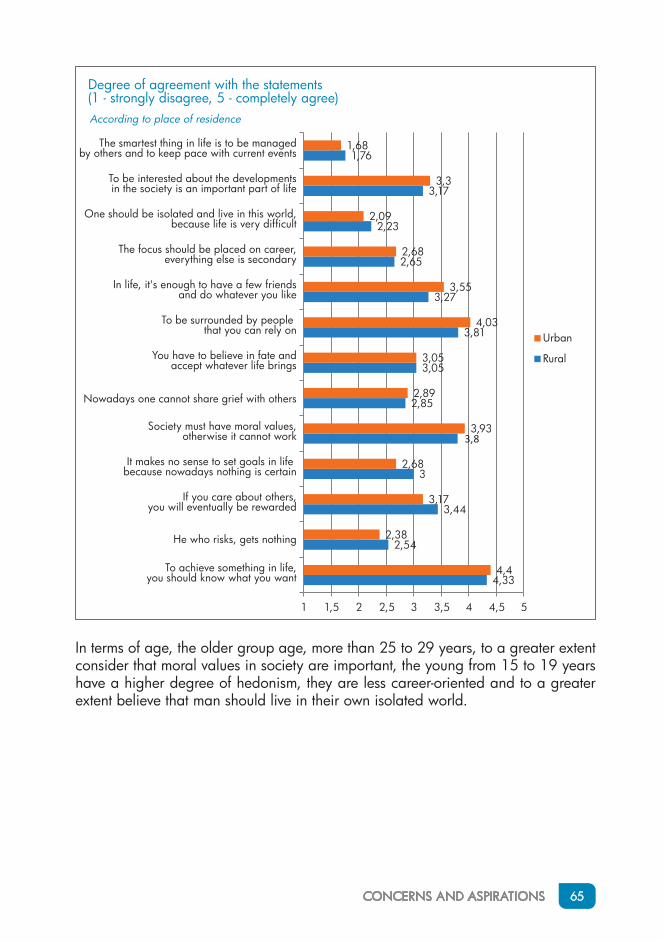
CONCERNS AND ASPIRATIONS 65
In terms of age, the older group age, more than 25 to 29 years, to a greater extent consider that moral values in society are important, the young from 15 to 19 years have a higher degree of hedonism, they are less career-oriented and to a greater extent believe that man should live in their own isolated world.
4,33
2,54
3,44
3
3,8
2,85
3,05
3,81
3,27
2,65
2,23
3,17
1,76
4,4
2,38
3,17
2,68
3,93
2,89
3,05
4,03
3,55
2,68
2,09
3,3
1,68
1 1,5 2 2,5 3 3,5 4 4,5 5
To achieve something in life, you should know what you want
He who risks, gets nothing
If you care about others, you will eventually be rewarded
It makes no sense to set goals in life because nowadays nothing is certain
Society must have moral values, otherwise it cannot work
Nowadays one cannot share grief with others
You have to believe in fate and accept whatever life brings
To be surrounded by people that you can rely on
In life, it's enough to have a few friends and do whatever you like
The focus should be placed on career, everything else is secondary
One should be isolated and live in this world, because life is very difficult
To be interested about the developments in the society is an important part of life
The smartest thing in life is to be managedby others and to keep pace with current events
Urban
Rural
According to place of residence
Degree of agreement with the statements (1 - strongly disagree, 5 - completely agree)

66 YOUTH STUDY MACEDONIA 2013
CONCLUSIONS:
•• Nearly a third of young people want to move to another city/village in the country for better living standards and employment.
•• The youth of Eastern and North-eastern regions show the greatest aspirations for emigration to other places within the country.
•• The young population from the Pollog region, despite the desire to improve the economic standard, would also migrate for a better higher education.
•• The youth of the Southwest region indicate three equally important reasons to change the current place of residence: improving economic standards, greater employment opportunities and diverse cultural events.
•• Each young man from the South-eastern region who considers living abroad, has no other reason than financial.
•• The internal migration is directed towards Skopje, as the place with the greatest employment opportunities, entertainment and cultural events.
•• Half of young people continue to consider a life in another country, mostly due to financial reasons.
•• Young high school graduates, express greatest aspirations for migration from the country.
•• The desire for migration abroad is somewhat more prevalent in the age group of 15 to 19 years and 20 to 24 years, unlike the group of 25 to 29 years.
•• Young Macedonians have a greater desire to emigrate, in comparison to young Albanians.
•• The most preferred destination for living is Western Europe whereas the second is the United States and/or Canada.
•• The rural youth prefers to migrate to other places within the country, whereas young people from urban areas - outside the country.
•• A third of the young people who are considering leaving the country, would never return to live in the birthplace.
•• Most of the young people assess the current financial situation as good, but every fifth young person is considered to have poor financial condition.
•• The dissatisfaction with the financial situation grows proportionally with age, therefore, the most dissatisfied are the young people from 25 to 29 years, whereas most satisfied are from 15 to 19 years.
CONCERNS AND ASPIRATIONS 67
•• The young population is optimistic about the future, and most of them believe that living conditions would improve.
•• Young people do not want others to manage their life, nor let it to fate, they want to have control and influence over their own life.
•• The youth needs to be surrounded by close people in whom they have trust and who can share joy and sorrow.
•• The young population expects society to be the main carrier of moral values.
•• The young have no resistance, i.e. they don’t see anything negative towards risk-taking.
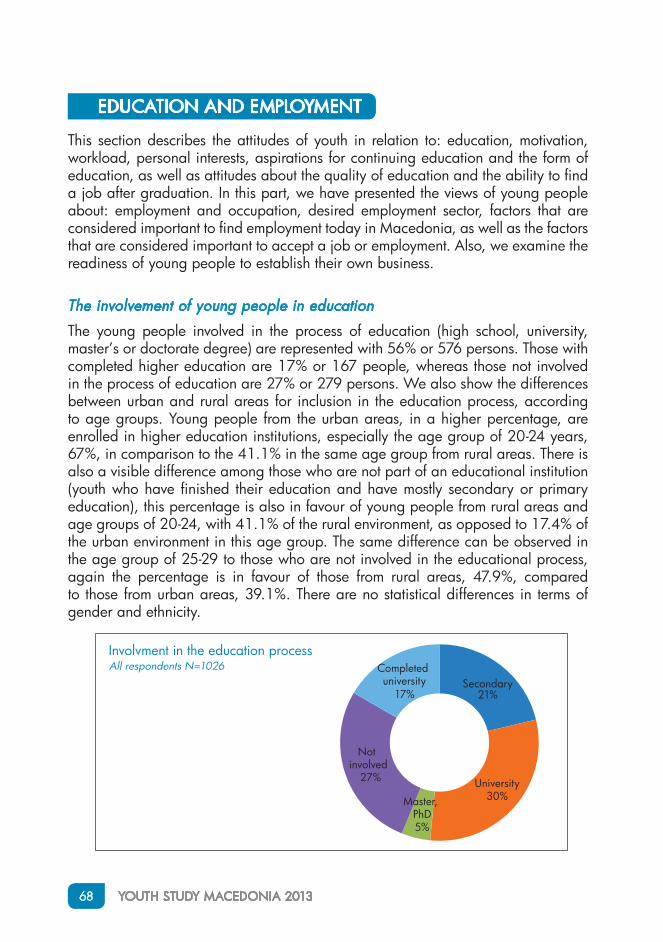
68 YOUTH STUDY MACEDONIA 2013
EDUCATION AND EMPLOYMENT
This section describes the attitudes of youth in relation to: education, motivation, workload, personal interests, aspirations for continuing education and the form of education, as well as attitudes about the quality of education and the ability to find a job after graduation. In this part, we have presented the views of young people about: employment and occupation, desired employment sector, factors that are considered important to find employment today in Macedonia, as well as the factors that are considered important to accept a job or employment. Also, we examine the readiness of young people to establish their own business.
The involvement of young people in education
The young people involved in the process of education (high school, university, master’s or doctorate degree) are represented with 56% or 576 persons. Those with completed higher education are 17% or 167 people, whereas those not involved in the process of education are 27% or 279 persons. We also show the differences between urban and rural areas for inclusion in the education process, according to age groups. Young people from the urban areas, in a higher percentage, are enrolled in higher education institutions, especially the age group of 20-24 years, 67%, in comparison to the 41.1% in the same age group from rural areas. There is also a visible difference among those who are not part of an educational institution (youth who have finished their education and have mostly secondary or primary education), this percentage is also in favour of young people from rural areas and age groups of 20-24, with 41.1% of the rural environment, as opposed to 17.4% of the urban environment in this age group. The same difference can be observed in the age group of 25-29 to those who are not involved in the educational process, again the percentage is in favour of those from rural areas, 47.9%, compared to those from urban areas, 39.1%. There are no statistical differences in terms of gender and ethnicity.
Secondary21%
University30%Master,
PhD5%
Not involved
Completed university
27%
17%
Involvment in the education processAll respondents N=1026
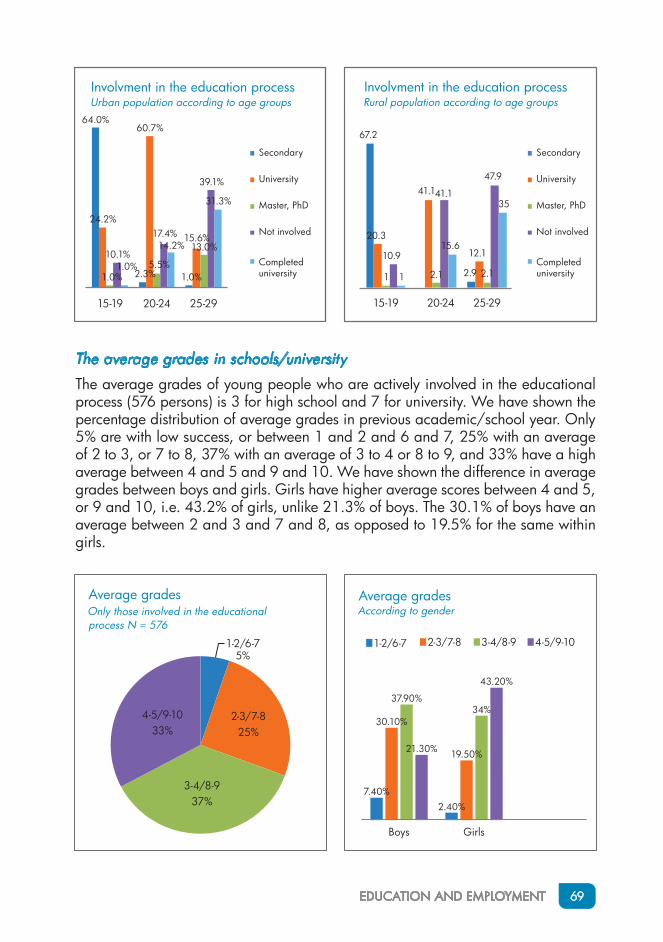
EDUCATION AND EMPLOYMENT 69
The average grades in schools/university
The average grades of young people who are actively involved in the educational process (576 persons) is 3 for high school and 7 for university. We have shown the percentage distribution of average grades in previous academic/school year. Only 5% are with low success, or between 1 and 2 and 6 and 7, 25% with an average of 2 to 3, or 7 to 8, 37% with an average of 3 to 4 or 8 to 9, and 33% have a high average between 4 and 5 and 9 and 10. We have shown the difference in average grades between boys and girls. Girls have higher average scores between 4 and 5, or 9 and 10, i.e. 43.2% of girls, unlike 21.3% of boys. The 30.1% of boys have an average between 2 and 3 and 7 and 8, as opposed to 19.5% for the same within girls.
64.0%
2.3% 1.0%
60.7%
15.6%
1.0%5.5%
13.0%10.1%
17.4%
39.1%
1.0%
14.2%
31.3%
15-19 20-24 25-29
Involvment in the education processUrban population according to age groups
Secondary
University
Master, PhD
Not involved
Completed university
24.2%
Secondary
University
Master, PhD
Not involved
Completed university
15-19 20-24 25-29
67.2
2.9
20.3
41.1
12.1
1 2.1 2.1
10.9
41.1
47.9
1
15.6
35
Involvment in the education processRural population according to age groups
1-2/6-75%
2-3/7-825%
3-4/8-937%
4-5/9-1033%
Average gradesOnly those involved in the educational process N = 576
2.40%
30.10%
19.50%
37.90%34%
21.30%
43.20%
Boys Girls
1-2/6-7 2-3/7-8 3-4/8-9 4-5/9-10
Average gradesAccording to gender
7.40%
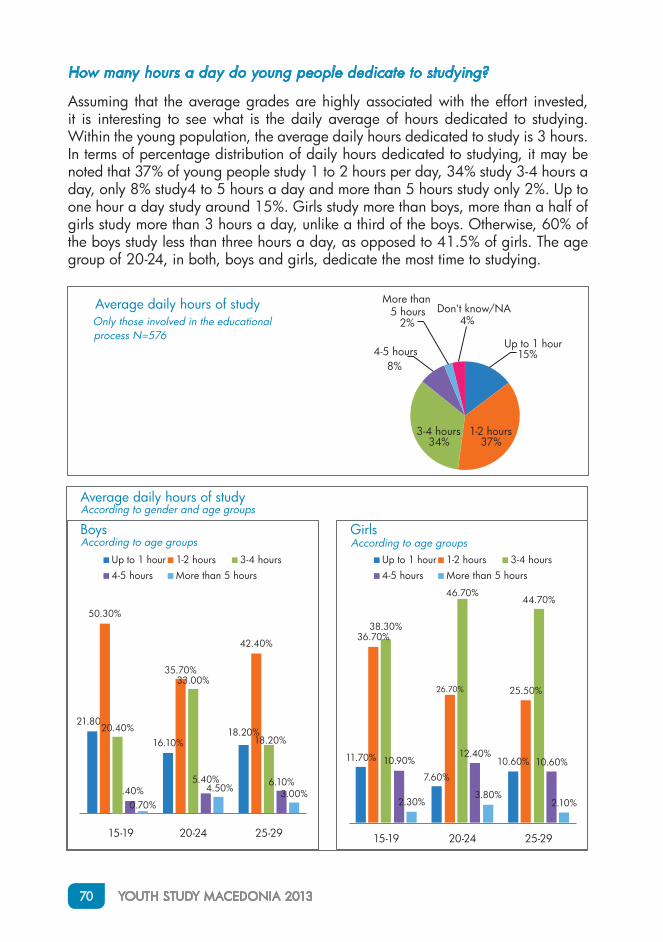
70 YOUTH STUDY MACEDONIA 2013
How many hours a day do young people dedicate to studying?
Assuming that the average grades are highly associated with the effort invested, it is interesting to see what is the daily average of hours dedicated to studying. Within the young population, the average daily hours dedicated to study is 3 hours. In terms of percentage distribution of daily hours dedicated to studying, it may be noted that 37% of young people study 1 to 2 hours per day, 34% study 3-4 hours a day, only 8% study4 to 5 hours a day and more than 5 hours study only 2%. Up to one hour a day study around 15%. Girls study more than boys, more than a half of girls study more than 3 hours a day, unlike a third of the boys. Otherwise, 60% of the boys study less than three hours a day, as opposed to 41.5% of girls. The age group of 20-24, in both, boys and girls, dedicate the most time to studying.
15%Up to 1 hour
1-2 hours37%
3-4 hours34%
4-5 hours8%
More than 5 hours
2%Don't know/NA
4%Average daily hours of studyOnly those involved in the educational process N=576
21.80%
Average daily hours of studyAccording to gender and age groups
16.10%18.20%
50.30%
35.70%
42.40%
33.00%
18.20%
3.40%5.40% 6.10%
0.70%
4.50% 3.00%
BoysAccording to age groups
Up to 1 hour 1-2 hours 3-4 hours4-5 hours More than 5 hours
Up to 1 hour 1-2 hours 3-4 hours4-5 hours More than 5 hours
15-19 20-24 25-29 15-19 20-24 25-29
11.70%
7.60%
10.60%
36.70%
26.70% 25.50%
38.30%
46.70%44.70%
10.90%12.40%
10.60%
2.30%3.80%
2.10%
GirlsAccording to age groups
20.40%
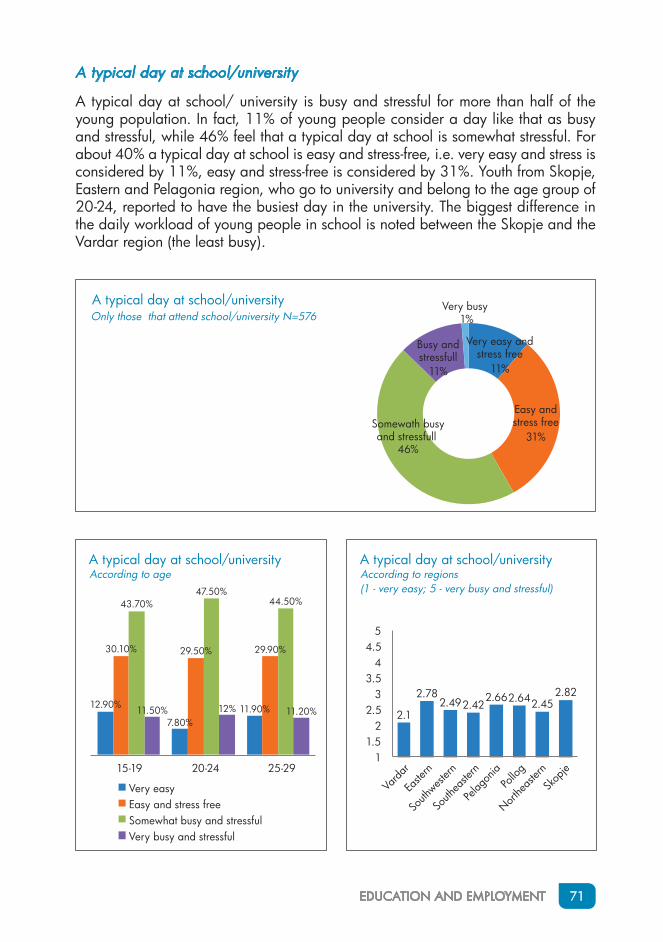
EDUCATION AND EMPLOYMENT 71
A typical day at school/university
A typical day at school/ university is busy and stressful for more than half of the young population. In fact, 11% of young people consider a day like that as busy and stressful, while 46% feel that a typical day at school is somewhat stressful. For about 40% a typical day at school is easy and stress-free, i.e. very easy and stress is considered by 11%, easy and stress-free is considered by 31%. Youth from Skopje, Eastern and Pelagonia region, who go to university and belong to the age group of 20-24, reported to have the busiest day in the university. The biggest difference in the daily workload of young people in school is noted between the Skopje and the Vardar region (the least busy).
Very easy andstress free
11%
Easy andstress free
31%Somewath busyand stressfull
46%
Busy andstressfull
11%
Very busy 1%
A typical day at school/universityOnly those that attend school/university N=576
15-19 20-24 25-29
12.90%
7.80%11.90%
30.10% 29.50% 29.90%
43.70%47.50%
44.50%
11.50% 12% 11.20%
Very easy Easy and stress freeSomewhat busy and stressful Very busy and stressful
A typical day at school/universityAccording to age
2.1
2.782.492.42
2.662.642.452.82
11.5
22.5
33.5
44.5
5
Varda
r
Easte
rn
South
wester
n
South
easte
rn
Pelag
onia
Pollo
g
Northe
aster
n
Skop
je
A typical day at school/university According to regions(1 - very easy; 5 - very busy and stressful)
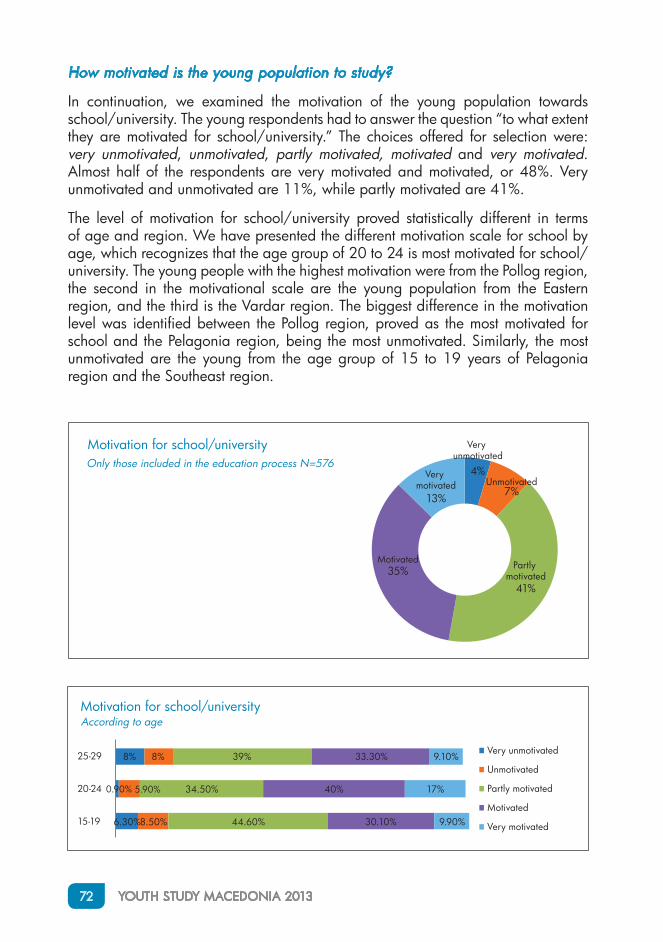
72 YOUTH STUDY MACEDONIA 2013
How motivated is the young population to study?
In continuation, we examined the motivation of the young population towards school/university. The young respondents had to answer the question “to what extent they are motivated for school/university.” The choices offered for selection were: very unmotivated, unmotivated, partly motivated, motivated and very motivated. Almost half of the respondents are very motivated and motivated, or 48%. Very unmotivated and unmotivated are 11%, while partly motivated are 41%.
The level of motivation for school/university proved statistically different in terms of age and region. We have presented the different motivation scale for school by age, which recognizes that the age group of 20 to 24 is most motivated for school/university. The young people with the highest motivation were from the Pollog region, the second in the motivational scale are the young population from the Eastern region, and the third is the Vardar region. The biggest difference in the motivation level was identified between the Pollog region, proved as the most motivated for school and the Pelagonia region, being the most unmotivated. Similarly, the most unmotivated are the young from the age group of 15 to 19 years of Pelagonia region and the Southeast region.
Very unmotivated
4%Unmotivated
7%
Partly motivated
41%
Motivated35%
Very motivated
13%
Motivation for school/universityOnly those included in the education process N=576
Motivation for school/university According to age
6.30%
0.90%
8%
8.50%
5.90%
8%
44.60%
34.50%
39%
30.10%
40%
33.30%
9.90%
17%
9.10%
15-19
20-24
25-29 Very unmotivated
Unmotivated
Partly motivated
Motivated
Very motivated
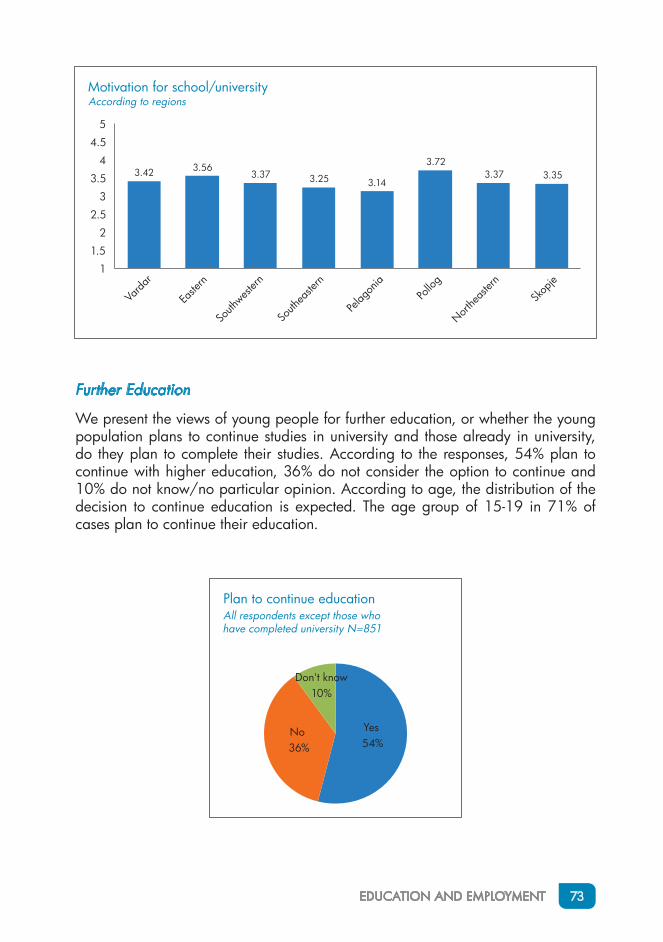
EDUCATION AND EMPLOYMENT 73
Further Education
We present the views of young people for further education, or whether the young population plans to continue studies in university and those already in university, do they plan to complete their studies. According to the responses, 54% plan to continue with higher education, 36% do not consider the option to continue and 10% do not know/no particular opinion. According to age, the distribution of the decision to continue education is expected. The age group of 15-19 in 71% of cases plan to continue their education.
3.42 3.563.37 3.25 3.14
3.723.37 3.35
1
1.5
2
2.5
3
3.5
4
4.5
5
Motivation for school/universityAccording to regions
Varda
r
Easte
rn
South
wester
n
South
easte
rn
Pelag
onia
Pollo
g
Northe
aster
n
Skop
je
Yes54%
No36%
Don't know10%
Plan to continue educationAll respondents except those who
have completed university N=851
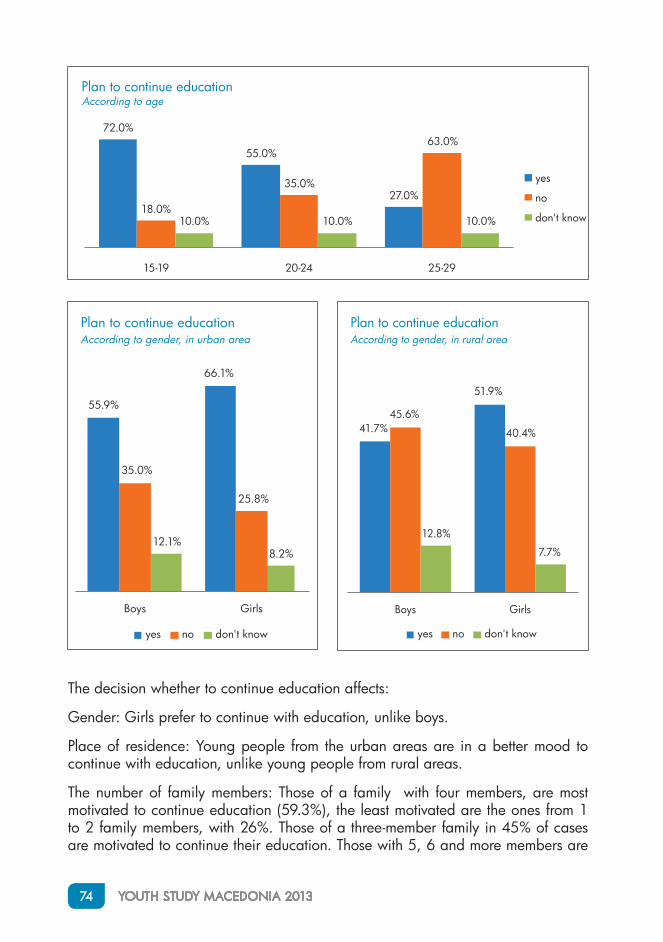
74 YOUTH STUDY MACEDONIA 2013
The decision whether to continue education affects:
Gender: Girls prefer to continue with education, unlike boys.
Place of residence: Young people from the urban areas are in a better mood to continue with education, unlike young people from rural areas.
The number of family members: Those of a family with four members, are most motivated to continue education (59.3%), the least motivated are the ones from 1 to 2 family members, with 26%. Those of a three-member family in 45% of cases are motivated to continue their education. Those with 5, 6 and more members are
72.0%
55.0%
27.0%18.0%
35.0%
63.0%
10.0% 10.0% 10.0%
15-19 20-24 25-29
yes
no
don't know
Plan to continue educationAccording to age
8.2%
66.1%
55.9%
35.0%
25.8%
12.1%
Boys Girls
yes no don't know
Plan to continue educationAccording to gender, in urban area
Plan to continue educationAccording to gender, in rural area
Boys Girls
yes no don't know
41.7%
51.9%
45.6%
40.4%
12.8%
7.7%
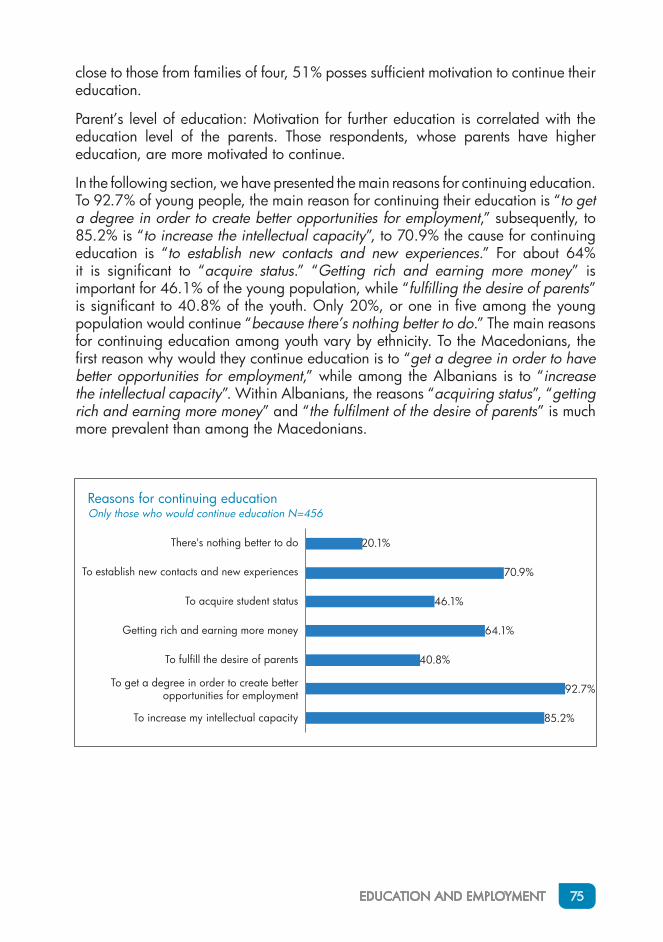
EDUCATION AND EMPLOYMENT 75
close to those from families of four, 51% posses sufficient motivation to continue their education.
Parent’s level of education: Motivation for further education is correlated with the education level of the parents. Those respondents, whose parents have higher education, are more motivated to continue.
In the following section, we have presented the main reasons for continuing education. To 92.7% of young people, the main reason for continuing their education is “to get a degree in order to create better opportunities for employment,” subsequently, to 85.2% is “to increase the intellectual capacity”, to 70.9% the cause for continuing education is “to establish new contacts and new experiences.” For about 64% it is significant to “acquire status.” “Getting rich and earning more money” is important for 46.1% of the young population, while “fulfilling the desire of parents” is significant to 40.8% of the youth. Only 20%, or one in five among the young population would continue “because there’s nothing better to do.” The main reasons for continuing education among youth vary by ethnicity. To the Macedonians, the first reason why would they continue education is to “get a degree in order to have better opportunities for employment,” while among the Albanians is to “increase the intellectual capacity”. Within Albanians, the reasons “acquiring status”, “getting rich and earning more money” and “the fulfilment of the desire of parents” is much more prevalent than among the Macedonians.
92.7%
85.2%
40.8%
64.1%
46.1%
70.9%
20.1%
To increase my intellectual capacity
To get a degree in order to create better opportunities for employment
To fulfill the desire of parents
Getting rich and earning more money
To acquire student status
To establish new contacts and new experiences
There's nothing better to do
Reasons for continuing educationOnly those who would continue education N=456
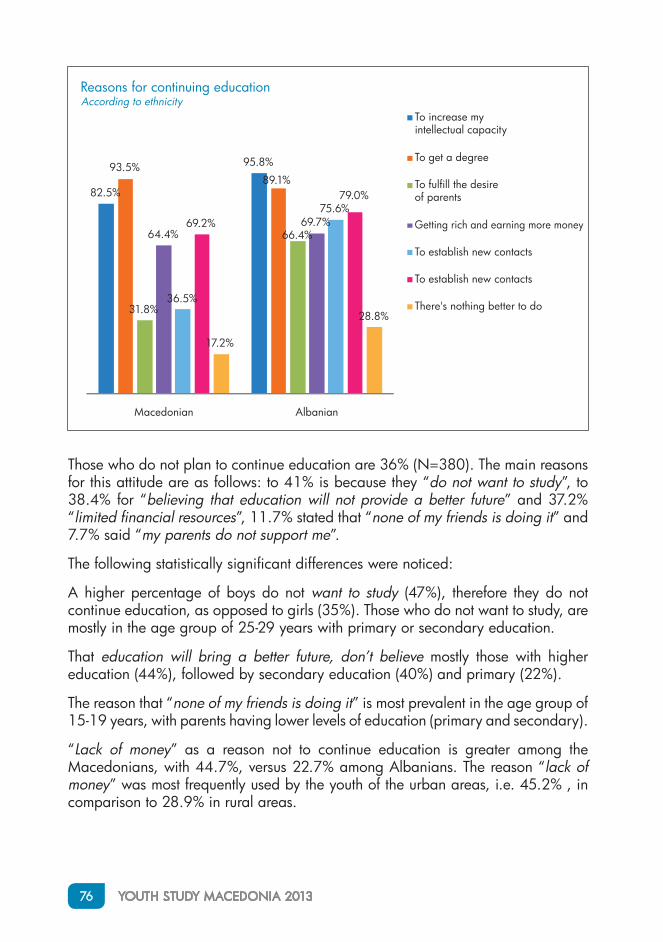
76 YOUTH STUDY MACEDONIA 2013
Those who do not plan to continue education are 36% (N=380). The main reasons for this attitude are as follows: to 41% is because they “do not want to study”, to 38.4% for “believing that education will not provide a better future” and 37.2% “limited financial resources”, 11.7% stated that “none of my friends is doing it” and 7.7% said “my parents do not support me”.
The following statistically significant differences were noticed:
A higher percentage of boys do not want to study (47%), therefore they do not continue education, as opposed to girls (35%). Those who do not want to study, are mostly in the age group of 25-29 years with primary or secondary education.
That education will bring a better future, don’t believe mostly those with higher education (44%), followed by secondary education (40%) and primary (22%).
The reason that “none of my friends is doing it” is most prevalent in the age group of 15-19 years, with parents having lower levels of education (primary and secondary).
“Lack of money” as a reason not to continue education is greater among the Macedonians, with 44.7%, versus 22.7% among Albanians. The reason “lack of money” was most frequently used by the youth of the urban areas, i.e. 45.2% , in comparison to 28.9% in rural areas.
82.5%
95.8%93.5%89.1%
31.8%
66.4%64.4%69.7%
36.5%
75.6%69.2%
79.0%
17.2%
28.8%
Macedonian Albanian
Reasons for continuing education According to ethnicity
To increase my intellectual capacity
To get a degree
To fulfill the desire of parents
Getting rich and earning more money
To establish new contacts
To establish new contacts
There's nothing better to do

EDUCATION AND EMPLOYMENT 77
How do young people assess the quality of education in the country?
In the next section, we have examined the level of satisfaction with the quality of education in the country. Every tenth respondent believes that primary and secondary education is with excellent quality. To 14% of the respondents, the higher and post-graduate education are with excellent quality.
More than a half believe that the primary, secondary and higher education have good quality. In fact, 64.4% of respondents think that there is a good quality primary education, the same percentage is recorded for the quality in secondary education. 52% of respondents agree that there is a good quality among the universities. Every fifth respondent or 20% perceive the quality of education in the country as poor and very poor.
41.0%38.4%
7.7%11.7%
37.5%
I do not want to study
Education will not provide a better future
My parents do not support me
None of my friends is doing it
Limited financial resources
Reasons not to continue educationOnly those who would not continue education N=380
9.9% 10.7%14.8% 14.5%
64.4% 64.4%
52.0%
41.4%
19.9% 18.8%15.0%
12.0%
3.5% 4.3% 3.6% 2.9%
9.9%
2.2%
14.4%
29.2%
Primary Secondary University Post-graduate, PhD
The perception of young population about the quality of education in MacedoniaAll respondents N=1026
Excellent
Good
Poor
Very poor
Don't know
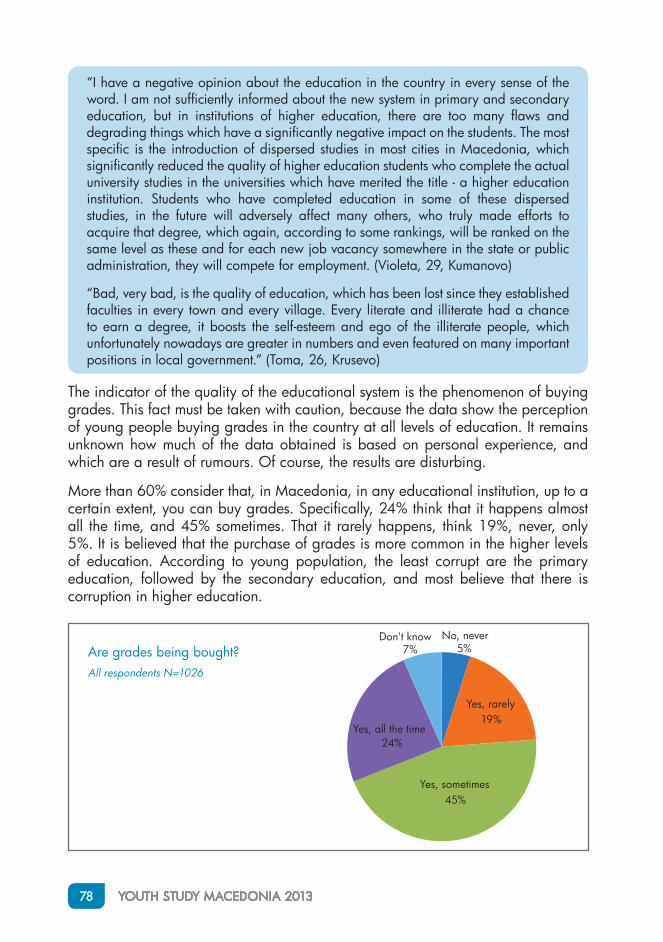
78 YOUTH STUDY MACEDONIA 2013
“I have a negative opinion about the education in the country in every sense of the word. I am not sufficiently informed about the new system in primary and secondary education, but in institutions of higher education, there are too many flaws and degrading things which have a significantly negative impact on the students. The most specific is the introduction of dispersed studies in most cities in Macedonia, which significantly reduced the quality of higher education students who complete the actual university studies in the universities which have merited the title - a higher education institution. Students who have completed education in some of these dispersed studies, in the future will adversely affect many others, who truly made efforts to acquire that degree, which again, according to some rankings, will be ranked on the same level as these and for each new job vacancy somewhere in the state or public administration, they will compete for employment. (Violeta, 29, Kumanovo)
“Bad, very bad, is the quality of education, which has been lost since they established faculties in every town and every village. Every literate and illiterate had a chance to earn a degree, it boosts the self-esteem and ego of the illiterate people, which unfortunately nowadays are greater in numbers and even featured on many important positions in local government.” (Toma, 26, Krusevo)
The indicator of the quality of the educational system is the phenomenon of buying grades. This fact must be taken with caution, because the data show the perception of young people buying grades in the country at all levels of education. It remains unknown how much of the data obtained is based on personal experience, and which are a result of rumours. Of course, the results are disturbing.
More than 60% consider that, in Macedonia, in any educational institution, up to a certain extent, you can buy grades. Specifically, 24% think that it happens almost all the time, and 45% sometimes. That it rarely happens, think 19%, never, only 5%. It is believed that the purchase of grades is more common in the higher levels of education. According to young population, the least corrupt are the primary education, followed by the secondary education, and most believe that there is corruption in higher education.
No, never5%
Yes, rarely19%
Yes, sometimes45%
Yes, all the time24%
Don't know7%Are grades being bought?
All respondents N=1026
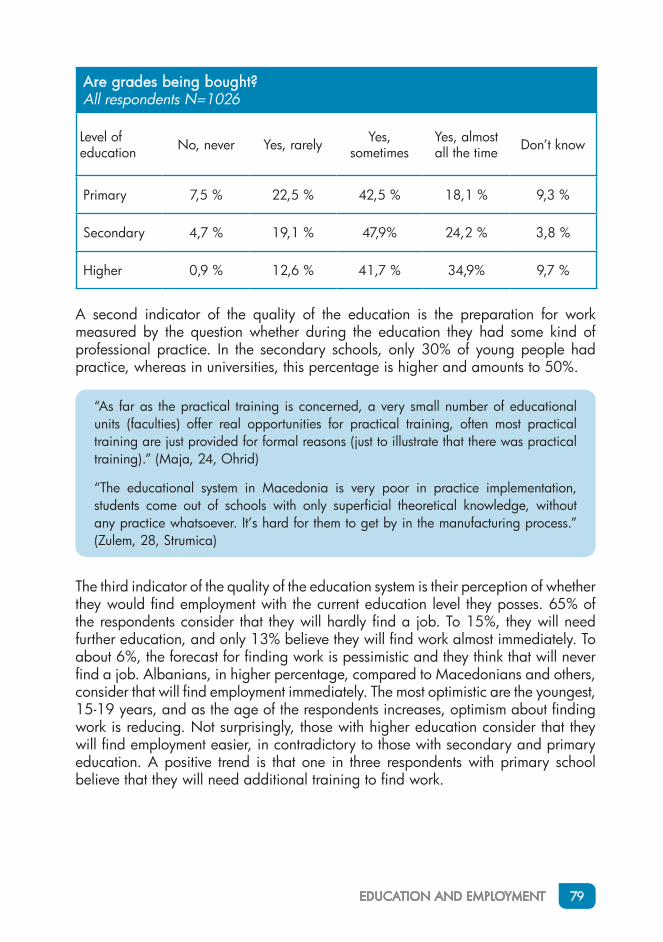
EDUCATION AND EMPLOYMENT 79
Are grades being bought?All respondents N=1026
Level of education No, never Yes, rarely Yes,
sometimes Yes, almost all the time Don’t know
Primary 7,5 % 22,5 % 42,5 % 18,1 % 9,3 %
Secondary 4,7 % 19,1 % 47,9% 24,2 % 3,8 %
Higher 0,9 % 12,6 % 41,7 % 34,9% 9,7 %
A second indicator of the quality of the education is the preparation for work measured by the question whether during the education they had some kind of professional practice. In the secondary schools, only 30% of young people had practice, whereas in universities, this percentage is higher and amounts to 50%.
“As far as the practical training is concerned, a very small number of educational units (faculties) offer real opportunities for practical training, often most practical training are just provided for formal reasons (just to illustrate that there was practical training).” (Maja, 24, Ohrid)
“The educational system in Macedonia is very poor in practice implementation, students come out of schools with only superficial theoretical knowledge, without any practice whatsoever. It’s hard for them to get by in the manufacturing process.” (Zulem, 28, Strumica)
The third indicator of the quality of the education system is their perception of whether they would find employment with the current education level they posses. 65% of the respondents consider that they will hardly find a job. To 15%, they will need further education, and only 13% believe they will find work almost immediately. To about 6%, the forecast for finding work is pessimistic and they think that will never find a job. Albanians, in higher percentage, compared to Macedonians and others, consider that will find employment immediately. The most optimistic are the youngest, 15-19 years, and as the age of the respondents increases, optimism about finding work is reducing. Not surprisingly, those with higher education consider that they will find employment easier, in contradictory to those with secondary and primary education. A positive trend is that one in three respondents with primary school believe that they will need additional training to find work.
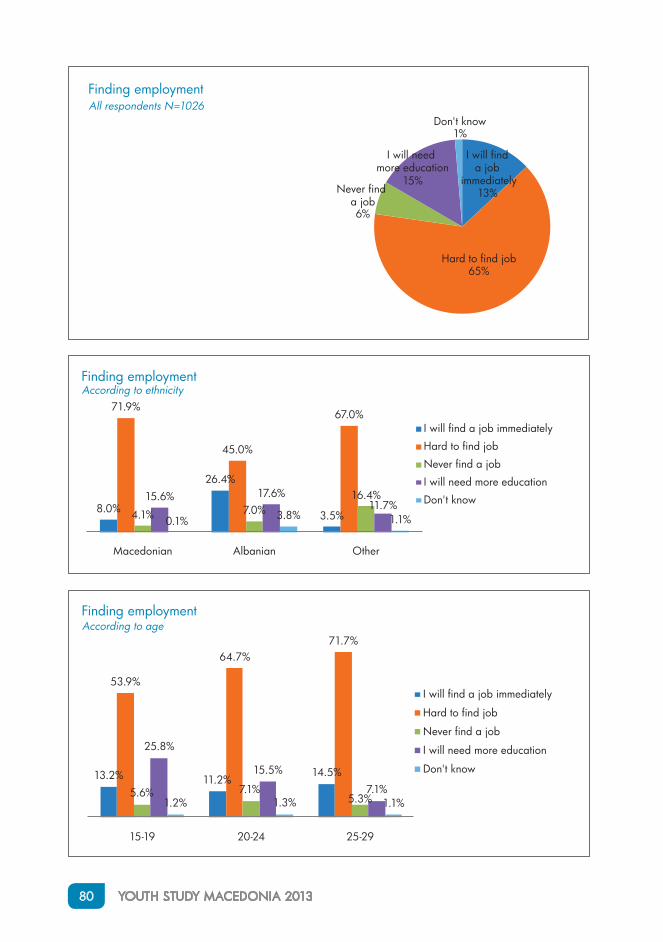
80 YOUTH STUDY MACEDONIA 2013
I will find a job
immediately13%
Hard to find job65%
Never find a job6%
I will need more education
15%
Don't know1%
Finding employmentAll respondents N=1026
8.0%
26.4%
3.5%
71.9%
45.0%
67.0%
4.1% 7.0%16.4%15.6% 17.6%
11.7%0.1% 3.8% 1.1%
Macedonian Albanian Other
Finding employment According to ethnicity
I will find a job immediately
Hard to find job
Never find a job
I will need more education
Don't know
13.2% 11.2%14.5%
53.9%
64.7%71.7%
5.6% 7.1%5.3%
25.8%
15.5%
7.1%1.2% 1.3% 1.1%
15-19 20-24 25-29
Finding employmentAccording to age
I will find a job immediately
Hard to find job
Never find a job
I will need more education
Don't know
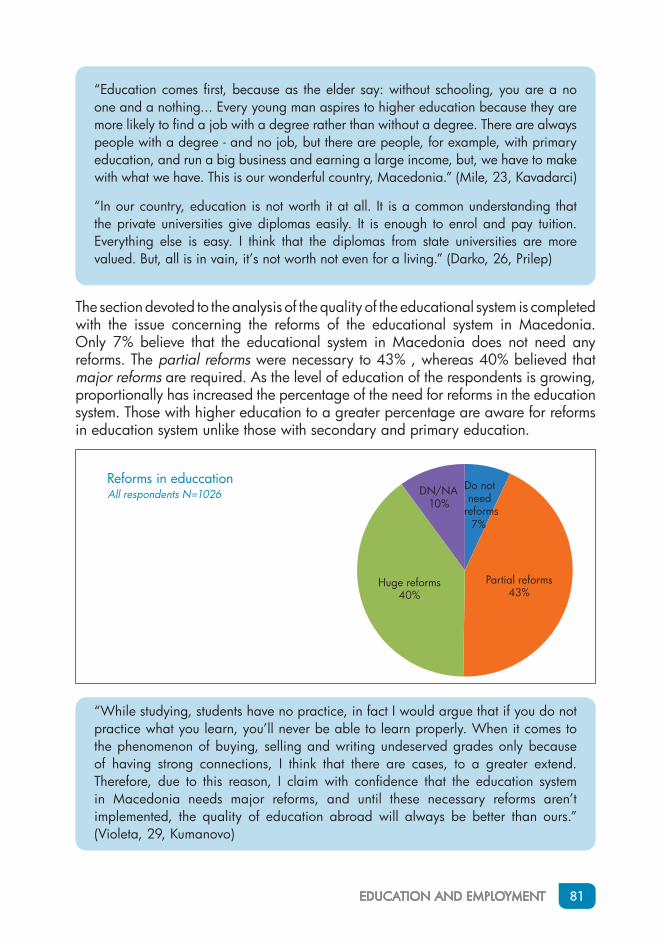
EDUCATION AND EMPLOYMENT 81
“Education comes first, because as the elder say: without schooling, you are a no one and a nothing... Every young man aspires to higher education because they are more likely to find a job with a degree rather than without a degree. There are always people with a degree - and no job, but there are people, for example, with primary education, and run a big business and earning a large income, but, we have to make with what we have. This is our wonderful country, Macedonia.” (Mile, 23, Kavadarci)
“In our country, education is not worth it at all. It is a common understanding that the private universities give diplomas easily. It is enough to enrol and pay tuition. Everything else is easy. I think that the diplomas from state universities are more valued. But, all is in vain, it’s not worth not even for a living.” (Darko, 26, Prilep)
The section devoted to the analysis of the quality of the educational system is completed with the issue concerning the reforms of the educational system in Macedonia. Only 7% believe that the educational system in Macedonia does not need any reforms. The partial reforms were necessary to 43% , whereas 40% believed that major reforms are required. As the level of education of the respondents is growing, proportionally has increased the percentage of the need for reforms in the education system. Those with higher education to a greater percentage are aware for reforms in education system unlike those with secondary and primary education.
Do not need
reforms7%
Partial reforms43%
Huge reforms40%
DN/NA10%
Reforms in educcationAll respondents N=1026
“While studying, students have no practice, in fact I would argue that if you do not practice what you learn, you’ll never be able to learn properly. When it comes to the phenomenon of buying, selling and writing undeserved grades only because of having strong connections, I think that there are cases, to a greater extend. Therefore, due to this reason, I claim with confidence that the education system in Macedonia needs major reforms, and until these necessary reforms aren’t implemented, the quality of education abroad will always be better than ours.” (Violeta, 29, Kumanovo)
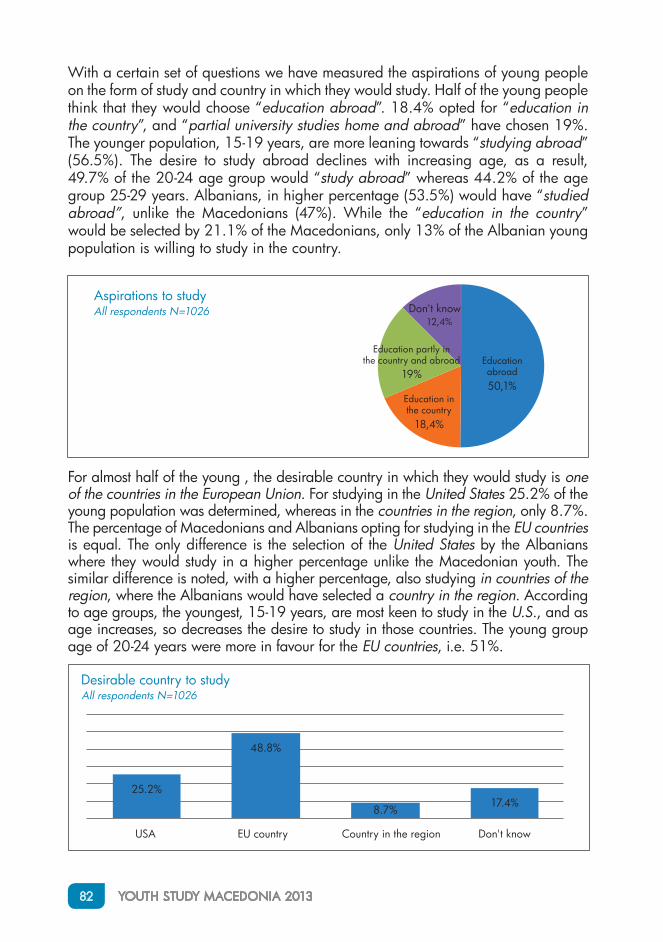
82 YOUTH STUDY MACEDONIA 2013
With a certain set of questions we have measured the aspirations of young people on the form of study and country in which they would study. Half of the young people think that they would choose “education abroad”. 18.4% opted for “education in the country”, and “partial university studies home and abroad” have chosen 19%. The younger population, 15-19 years, are more leaning towards “studying abroad” (56.5%). The desire to study abroad declines with increasing age, as a result, 49.7% of the 20-24 age group would “study abroad” whereas 44.2% of the age group 25-29 years. Albanians, in higher percentage (53.5%) would have “studied abroad”, unlike the Macedonians (47%). While the “education in the country” would be selected by 21.1% of the Macedonians, only 13% of the Albanian young population is willing to study in the country.
Educationabroad50,1%
Education inthe country
18,4%
Education partly inthe country and abroad
19%
Don't know 12,4%
Aspirations to studyAll respondents N=1026
For almost half of the young , the desirable country in which they would study is one of the countries in the European Union. For studying in the United States 25.2% of the young population was determined, whereas in the countries in the region, only 8.7%. The percentage of Macedonians and Albanians opting for studying in the EU countries is equal. The only difference is the selection of the United States by the Albanians where they would study in a higher percentage unlike the Macedonian youth. The similar difference is noted, with a higher percentage, also studying in countries of the region, where the Albanians would have selected a country in the region. According to age groups, the youngest, 15-19 years, are most keen to study in the U.S., and as age increases, so decreases the desire to study in those countries. The young group age of 20-24 years were more in favour for the EU countries, i.e. 51%.
25.2%
48.8%
8.7%17.4%
USA EU country Country in the region Don't know
Desirable country to studyAll respondents N=1026
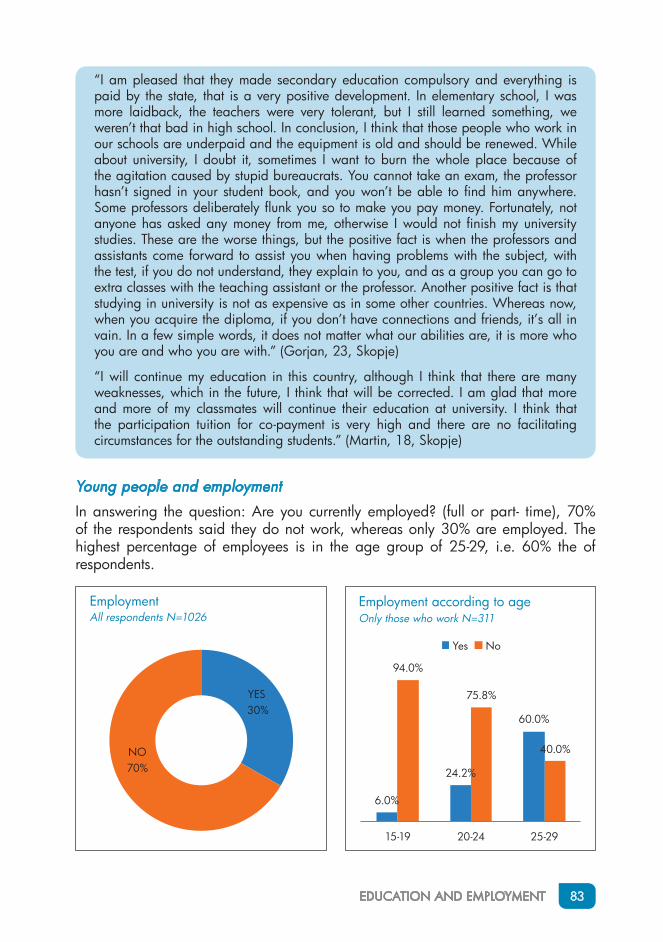
EDUCATION AND EMPLOYMENT 83
“I am pleased that they made secondary education compulsory and everything is paid by the state, that is a very positive development. In elementary school, I was more laidback, the teachers were very tolerant, but I still learned something, we weren’t that bad in high school. In conclusion, I think that those people who work in our schools are underpaid and the equipment is old and should be renewed. While about university, I doubt it, sometimes I want to burn the whole place because of the agitation caused by stupid bureaucrats. You cannot take an exam, the professor hasn’t signed in your student book, and you won’t be able to find him anywhere. Some professors deliberately flunk you so to make you pay money. Fortunately, not anyone has asked any money from me, otherwise I would not finish my university studies. These are the worse things, but the positive fact is when the professors and assistants come forward to assist you when having problems with the subject, with the test, if you do not understand, they explain to you, and as a group you can go to extra classes with the teaching assistant or the professor. Another positive fact is that studying in university is not as expensive as in some other countries. Whereas now, when you acquire the diploma, if you don’t have connections and friends, it’s all in vain. In a few simple words, it does not matter what our abilities are, it is more who you are and who you are with.” (Gorjan, 23, Skopje)
“I will continue my education in this country, although I think that there are many weaknesses, which in the future, I think that will be corrected. I am glad that more and more of my classmates will continue their education at university. I think that the participation tuition for co-payment is very high and there are no facilitating circumstances for the outstanding students.” (Martin, 18, Skopje)
Young people and employment
In answering the question: Are you currently employed? (full or part- time), 70% of the respondents said they do not work, whereas only 30% are employed. The highest percentage of employees is in the age group of 25-29, i.e. 60% the of respondents.
YES30%
NO70%
EmploymentAll respondents N=1026
6.0%
24.2%
60.0%
94.0%
75.8%
40.0%
15-19 20-24 25-29
Employment according to ageOnly those who work N=311
Yes No
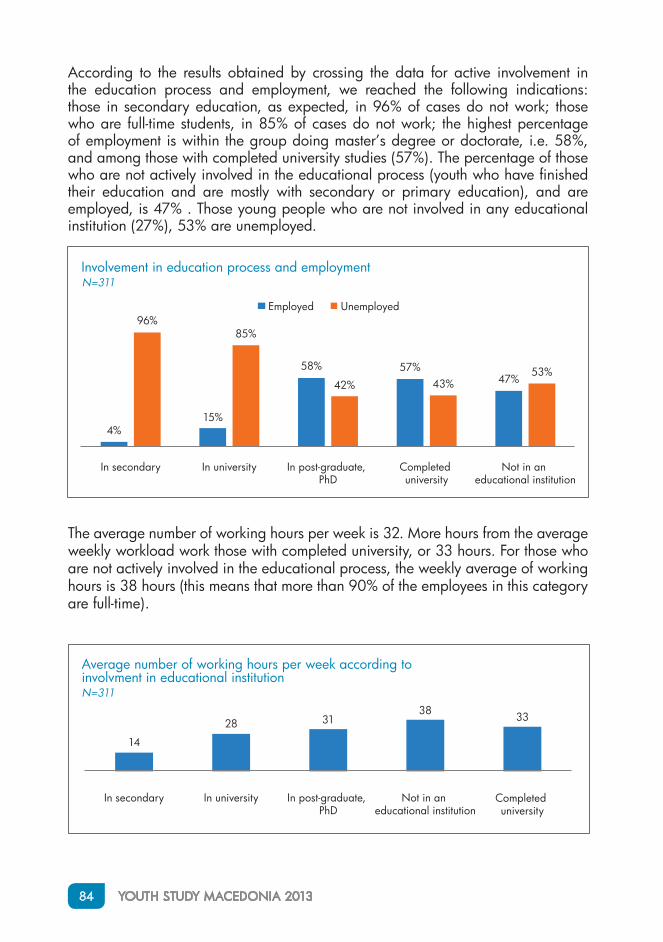
84 YOUTH STUDY MACEDONIA 2013
According to the results obtained by crossing the data for active involvement in the education process and employment, we reached the following indications: those in secondary education, as expected, in 96% of cases do not work; those who are full-time students, in 85% of cases do not work; the highest percentage of employment is within the group doing master’s degree or doctorate, i.e. 58%, and among those with completed university studies (57%). The percentage of those who are not actively involved in the educational process (youth who have finished their education and are mostly with secondary or primary education), and are employed, is 47% . Those young people who are not involved in any educational institution (27%), 53% are unemployed.
4%15%
58% 57%47%
96%85%
42% 43%53%
In secondary In university In post-graduate, PhD
Completed university
Not in an educational institution
Involvement in education process and employmentN=311
Employed Unemployed
The average number of working hours per week is 32. More hours from the average weekly workload work those with completed university, or 33 hours. For those who are not actively involved in the educational process, the weekly average of working hours is 38 hours (this means that more than 90% of the employees in this category are full-time).
14
28 3138 33
In secondary In university Completed university
Not in an educational institution
Average number of working hours per week according to involvment in educational institution N=311
In post-graduate, PhD
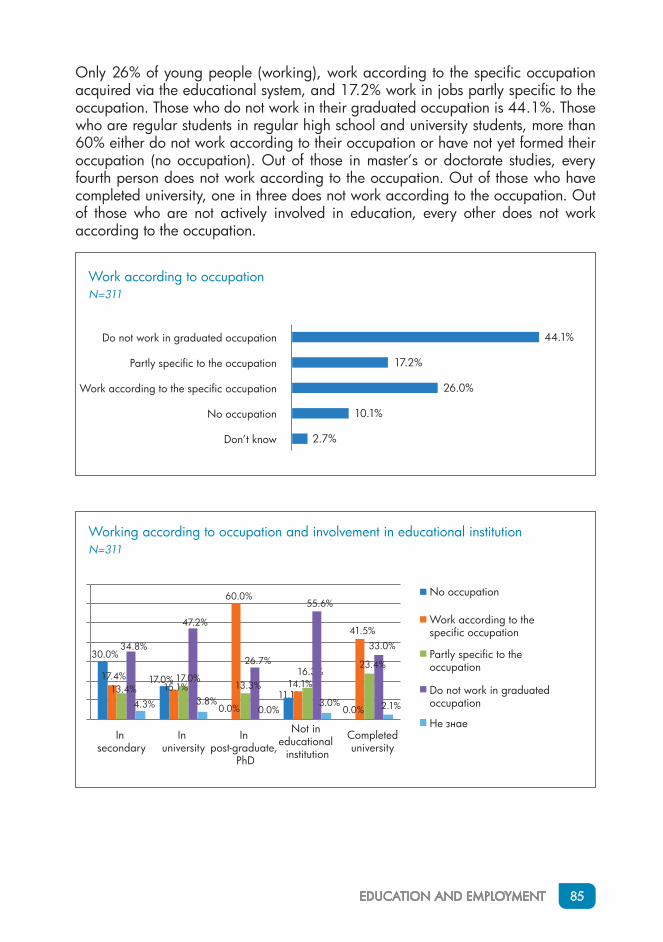
EDUCATION AND EMPLOYMENT 85
Only 26% of young people (working), work according to the specific occupation acquired via the educational system, and 17.2% work in jobs partly specific to the occupation. Those who do not work in their graduated occupation is 44.1%. Those who are regular students in regular high school and university students, more than 60% either do not work according to their occupation or have not yet formed their occupation (no occupation). Out of those in master’s or doctorate studies, every fourth person does not work according to the occupation. Out of those who have completed university, one in three does not work according to the occupation. Out of those who are not actively involved in education, every other does not work according to the occupation.
2.7%
10.1%
26.0%
17.2%
44.1%
Don’t know
No occupation
Work according to the specific occupation
Partly specific to the occupation
Do not work in graduated occupation
Work according to occupation N=311
30.0%
17.0%
0.0%11.1%
0.0%
17.4%15.1%
60.0%
14.1%
41.5%
13.4%17.0%
13.3%16.3%
23.4%
34.8%
47.2%
26.7%
55.6%
33.0%
4.3% 3.8%0.0%
3.0% 2.1%
In secondary
In university
Working according to occupation and involvement in educational institutionN=311
Not in educational
institution
Completed university
In post-graduate,
PhD
No occupation
Work according to the specific occupation
Partly specific to the occupation
Do not work in graduated occupation
Не знае
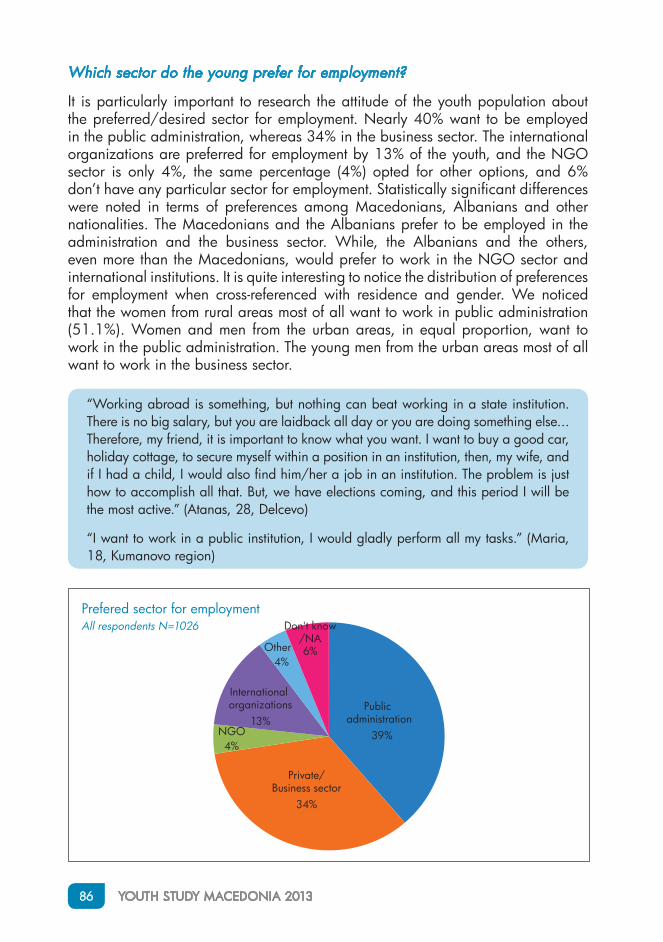
86 YOUTH STUDY MACEDONIA 2013
Which sector do the young prefer for employment?
It is particularly important to research the attitude of the youth population about the preferred/desired sector for employment. Nearly 40% want to be employed in the public administration, whereas 34% in the business sector. The international organizations are preferred for employment by 13% of the youth, and the NGO sector is only 4%, the same percentage (4%) opted for other options, and 6% don’t have any particular sector for employment. Statistically significant differences were noted in terms of preferences among Macedonians, Albanians and other nationalities. The Macedonians and the Albanians prefer to be employed in the administration and the business sector. While, the Albanians and the others, even more than the Macedonians, would prefer to work in the NGO sector and international institutions. It is quite interesting to notice the distribution of preferences for employment when cross-referenced with residence and gender. We noticed that the women from rural areas most of all want to work in public administration (51.1%). Women and men from the urban areas, in equal proportion, want to work in the public administration. The young men from the urban areas most of all want to work in the business sector.
“Working abroad is something, but nothing can beat working in a state institution. There is no big salary, but you are laidback all day or you are doing something else... Therefore, my friend, it is important to know what you want. I want to buy a good car, holiday cottage, to secure myself within a position in an institution, then, my wife, and if I had a child, I would also find him/her a job in an institution. The problem is just how to accomplish all that. But, we have elections coming, and this period I will be the most active.” (Atanas, 28, Delcevo)
“I want to work in a public institution, I would gladly perform all my tasks.” (Maria, 18, Kumanovo region)
Public administration
39%
Private/Business sector
34%
NGO4%
International organizations
13%
Other4%
Don't know/NA6%
Prefered sector for employmentAll respondents N=1026
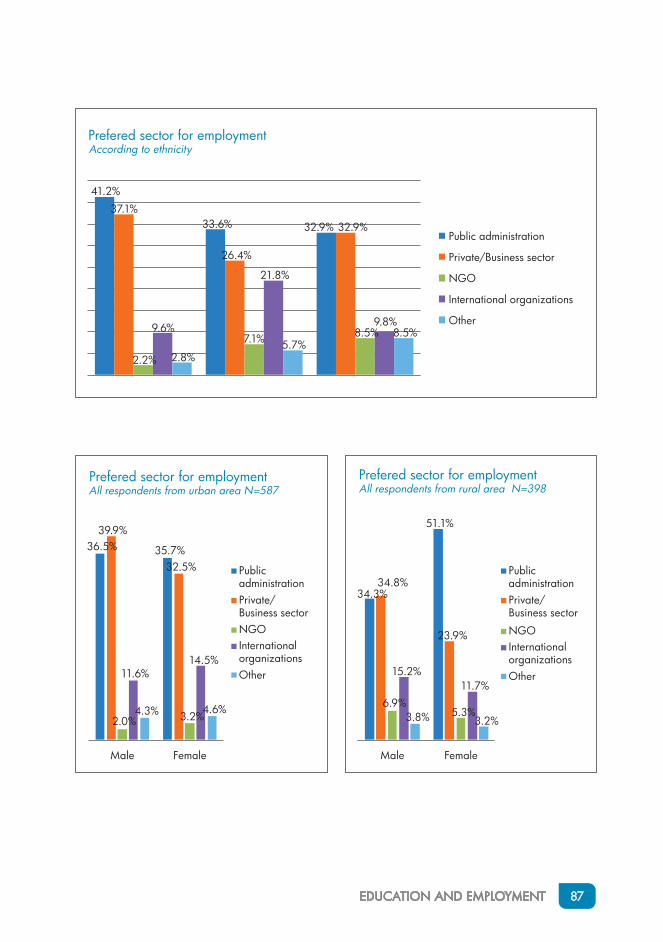
EDUCATION AND EMPLOYMENT 87
41.2%
33.6% 32.9%
37.1%
26.4%
32.9%
2.2%
7.1% 8.5%9.6%
21.8%
9.8%
2.8%5.7%
8.5%
Prefered sector for employment According to ethnicity
Public administration
Private/Business sector
NGO
International organizations
Other
36.5% 35.7%
39.9%
32.5%
2.0% 3.2%
11.6%14.5%
4.3% 4.6%
Male Female
Prefered sector for employment All respondents from urban area N=587
34.3%
51.1%
34.8%
23.9%
6.9%5.3%
15.2%11.7%
3.8% 3.2%
Male Female
Prefered sector for employmentAll respondents from rural area N=398
Public administrationPrivate/Business sector NGOInternational organizations Other
Public administrationPrivate/Business sector
NGOInternational organizations Other

88 YOUTH STUDY MACEDONIA 2013
What is needed to find a job?
In the following section, we have presented the factors which the young people rated as important nowadays to find a job. The most important factor young people consider the “friends and connections” (43.9%). The second factor in importance is deemed the “political connections”, the third factor which is considered is the “level of education”, the fourth is “professional skills” and the fifth and final factor, the youth consider “luck”.
According to the data obtained by crossing in terms of ethnicity, the young Macedonians and those of other nationalities, in the first rank of importance to find a job nowadays consider “friends and connections”, in contrast to young Albanians who believe that “political connections” are in the first place. The factors of the third, fourth and fifth rank are the same as in the general ranking.
According to regions, there are also differences in the ranking of factors by importance. The most different is the Pollog region where the most important ranking factor is considered the “level of education”, second rank is “political connections”, third “professional skills”, ranked fourth is “connections and friends” and the fifth factor is “luck”. Young people from Skopje region, are on the same level (third in significance) with the Pollog region and they consider “professional skills” as the most important. All other “professional skills” are considered to be the fourth or fifth rank. Interestingly, “luck” as a significant factor (third rank), is mostly believed by the Eastern, South-eastern and Pelagonia region, in comparison to other regions.
“In order to find a job, it is very important to have connections, primarily connections. No matter where you’ve finished your studies, or what was your average, that does not apply to the connections, regardless if they are political or friends. I’m doing three months of internship in Stopanska Banka through the Employment Bureau. I notice that another intern like me, has more friends in the bank, they will give her more of an opportunity to stay rather than to hire me. They just told me that I could get an extension for the internship, working for free, the cost of travel and food are covered by the Bureau. But, if I’d have connections, they would employ me immediately.” (Sarita, 24, Suto Orizari)
“Unemployment is high, it is difficult for young people to gain access to decent employment. Everything is politicized, corrupt. To find a job, primarily, it is required to be a party activist, or at least one of your parents. And, even that it’s not a guarantee, but you have to start from something. They play with people, supposedly a lottery, for them to come to work. It destroys people’s dignity.” (Zulem, 28, Strumica)
“You can get a job through the party. No matter if you have a degree or not, and what kind of degree. It is very difficult to find work.” (Martina, 18, Skopje)

EDUCATION AND EMPLOYMENT 89
FRIENDS AND CONNECTIONS
POLITICAL CONNECTIONS
LEVEL OF EDUCATION
PROFESSIONAL SKILLS LUCK
According to ethnicity Macedonian 1 2 3 4 5Albanian 2 1 3 4 5Other 1 2 3 4 5According to region Vardar 1 2 3 4 5Eastern 1 2 4 5 3Southwestern 1 2 3 4 5South-eastern 1 2 5 4 3Pelagonia 1 2 5 4 3Pollog 4 2 1 3 5Northeastern 1 2 3 4 5Skopje 1 2 4 3 5
General ranking 1 2 3 4 5
What do young people expect from their employment?
In a similar manner, factors that are most important for young people to accept a certain employment (to work) were also analyzed. The most important factor for youth is the “salary”, the second by significance is a “safe workplace”, third is “job satisfaction” and the fourth was “working with people you like”.
43.9%
10.0%
13.2%
26.0%
7.3%
22.7%
15.3%
19.3%
34.2%
9.6%
13.2%
25.7%
22.0%
15.1%
23.3%
14.1%
30.0%
28.9%
14.4%
12.8%
6.1%
18.9%
17.2%
10.3%
46.7%
Friends and connections
Professional skills
Level of education
Political connections
Rank of factors considered important to find a jobAll respondents N=1026
Luck
First rank Second rank Third rank Fourth rank Fifth rank
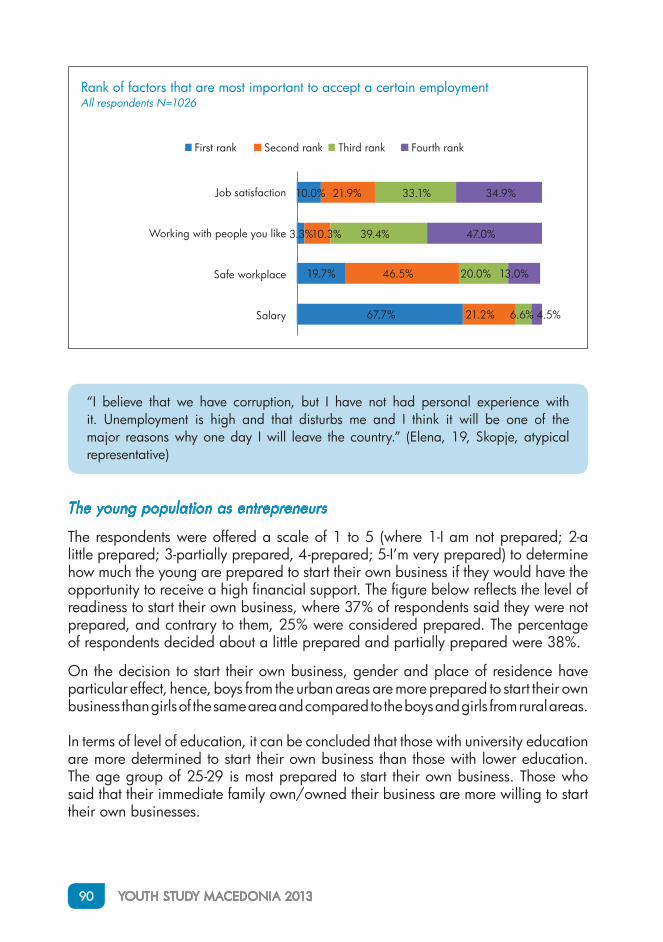
90 YOUTH STUDY MACEDONIA 2013
“I believe that we have corruption, but I have not had personal experience with it. Unemployment is high and that disturbs me and I think it will be one of the major reasons why one day I will leave the country.” (Elena, 19, Skopje, atypical representative)
The young population as entrepreneurs
The respondents were offered a scale of 1 to 5 (where 1-I am not prepared; 2-a little prepared; 3-partially prepared, 4-prepared; 5-I’m very prepared) to determine how much the young are prepared to start their own business if they would have the opportunity to receive a high financial support. The figure below reflects the level of readiness to start their own business, where 37% of respondents said they were not prepared, and contrary to them, 25% were considered prepared. The percentage of respondents decided about a little prepared and partially prepared were 38%.
On the decision to start their own business, gender and place of residence have particular effect, hence, boys from the urban areas are more prepared to start their own business than girls of the same area and compared to the boys and girls from rural areas. In terms of level of education, it can be concluded that those with university education are more determined to start their own business than those with lower education. The age group of 25-29 is most prepared to start their own business. Those who said that their immediate family own/owned their business are more willing to start their own businesses.
67.7%
19.7%
3.3%
10.0%
21.2%
46.5%
10.3%
21.9%
6.6%
20.0%
39.4%
33.1%
4.5%
13.0%
47.0%
34.9%
Salary
Safe workplace
Working with people you like
Job satisfaction
Rank of factors that are most important to accept a certain employmentAll respondents N=1026
First rank Second rank Third rank Fourth rank
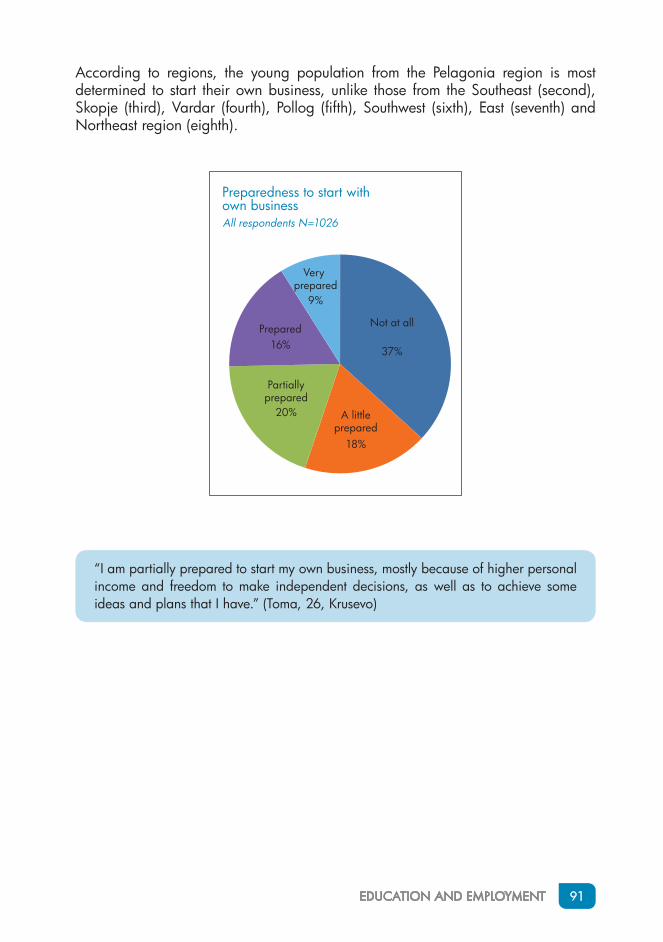
EDUCATION AND EMPLOYMENT 91
According to regions, the young population from the Pelagonia region is most determined to start their own business, unlike those from the Southeast (second), Skopje (third), Vardar (fourth), Pollog (fifth), Southwest (sixth), East (seventh) and Northeast region (eighth).
Not at all
37%
A littleprepared
18%
Partiallyprepared
20%
Prepared16%
Very prepared
9%
Preparedness to start with own business All respondents N=1026
“I am partially prepared to start my own business, mostly because of higher personal income and freedom to make independent decisions, as well as to achieve some ideas and plans that I have.” (Toma, 26, Krusevo)
92 YOUTH STUDY MACEDONIA 2013
CONCLUSIONS
•• The youth from the urban areas, to a greater percentage, participate in higher education institutions, especially the age group of 20-24 years. The difference appears to those who are not part of an educational institution (young people who have finished their education and are mostly with secondary or primary education), this percentage is higher among young people from rural areas and those aged 20-29.
•• For youth, the average grade is 3 in secondary education and 7 in universities. Girls have higher average grades than boys.
•• The daily average time of studying is 3 hours. Girls study more than boys, more than a half of girls study even more than 3 hours a day, unlike a third of the boys.
•• More than half of the young, consider a typical day at school/university very busy and stressful. The young population of Skopje, Pelagonia and the Eastern region, who go to university and belong to the age group of 20-24, are reported to have the busiest day in the university.
•• Almost half of the respondents are very motivated and motivated for school/university, and very unmotivated and unmotivated is every tenth respondent. The age group 20 to 24 is the most motivated for university studies and they mainly come from the Pollog region. The least motivated are the young people from the age group of 15 to 19 years, from the Pelagonia region and the Southeast region.
•• When it comes to continuing with a higher education plan, 54% of the respondents do plan to continue, 36% do not and 10% did not know. The decision of continuing education is also influenced by: gender, place of residence, number of family members, parent’s level of education. The profile of the person that is to continue education, in more than 70% of cases, is a girl of a four member urban family where at least one parent is with higher education.
•• To the Macedonians, the main reason why would they continue education is “to get a degree in order to have better opportunities for employment,” while to the Albanians is to “increase their intellectual capacity”.
•• For those who do not plan to continue their education , the main reason is because “they do not want to study.” The decision not to continue with education also influences: gender, age, place of residence, ethnicity, the parent’s level of education. The profile of the person that will not continue education is the following: in more than 50% of cases will be (male) aged 25-29 years with secondary and/or primary education, just like his parents, where the main reason will be because he “did not want to study”, but also, to a large extent, boys from the Macedonian nationality living in the urban area, affected by the factor “lack of money”.
EDUCATION AND EMPLOYMENT 93
•• More than 60% believe that within the educational institutions in Macedonia, to a certain extent, grades are bought “.
•• In secondary schools, every third student attended practice, while every other in university studies.
•• 65% of the respondents believe that it will be hard to find a job with the current education they have. Albanians have a higher percentage, compared to the Macedonians and other nationalities, assuming that they will be able to find a job immediately.
•• Only 7% believe that the educational system in Macedonia does not need any reforms.
•• A half of young people think that if they had the chance, they would select “education abroad” in the “European Union countries“.
•• 30% of the young people are employed (whether full or part- time), or 311 respondents. As expected, those in regular secondary education and university studies are the least employed. The age group from 25 to 29 years, are employed by 60%, and it includes those with completed university studies and those who are not in an education institution (youth who have finished their education and are mostly with secondary or primary education) and young people who are following master’s or doctoral studies.
•• The average number of weekly working hours is 32 hours. Over the average there are young people who have graduated from university and work (33 hours) and those who are not in an educational institution (youth who have finished their education and are mostly with secondary or primary education) and work (38 hours).
•• Of those working , only 28% are employed according to the occupation they acquired during their education, and partly work according to their occupation, i.e. 17%. Those who are regular students, and are employed, work at least according to occupation (which is expected, given that they have the lowest average working hours per week - part time work means any kind of work, to increase their pocket money). As education increases, so does the percentage of employment according to occupation and partially working according to occupation acquired. Thus, most working according to their occupation are those in master’s and doctoral studies (70%), followed by those with completed university (60%) and those not in educational institutions (youth who have finished their education and are mostly with secondary or primary education) (30%).
•• The most favoured sector for employment, among youth in Macedonia, is the public administration, with 39%, but the percentage is similar for working in the private/business sector (34%). The smallest percentage is those that want to work in the NGO sector (4%). The percentage of youth wanting to work in international
94 YOUTH STUDY MACEDONIA 2013
organizations, is also low, only 13% . Those that don’t know where they want to work is 6%, and for something else were designated 4% of youth. Albanians, far more than Macedonians and everyone else, want to work in international organizations and the NGO sector. Women from rural areas, more than any other category (rural men and men and women of the urban areas) want to work in public administration (51.1%).
•• The factors which the young people rated as important in finding a job nowadays are: “friends and connections” (first ranked), “political connections” (second ranked), “level of education” (third ranked), “professional skills” (fourth ranked) and the fifth ranked is “luck”. According to ethnicity, the young Macedonians and those of other nationalities, as first rank of importance in finding a job nowadays consider “friends and connections”, as opposed to young Albanians who consider the “political connections” to be the first ranked in importance. The factors of the third, fourth and fifth ranked are the same as in the general ranking. According to regions, the most different is the Pollog region where the most important ranking factor is considered the “level of education”. Young people from Skopje region are at the same level (third in significance) with the Pollog region and they consider “professional skills” as the most important. Interestingly, “luck” as a significant factor (third ranked), is mostly believed by the Eastern , South-eastern and the Pelagonia region, in comparison to other regions.
•• The factors which are most important for young people in accepting a particular employment (work) are: “salary”, the second is “safe workplace”, third is “job satisfaction” and the fourth “working with people you like”.
•• 37% of the respondents stated that are not prepared to start their own business, unlike them, 25% felt they were ready. The percentage of respondents that declared to be partially prepared was 38%.
•• As for the level of readiness in starting their own business, this was affected by gender, place of residence, region, the level of education, age group, those who had or owned their own business in the family. Thus, the profile of the young entrepreneur in Macedonia could be the following: a young man, aged 25-29 years, with completed higher education; originating from a family that owns/owned their own business, living in an urban area, and in one of these regions: Pelagonia, South-eastern or Skopje region.
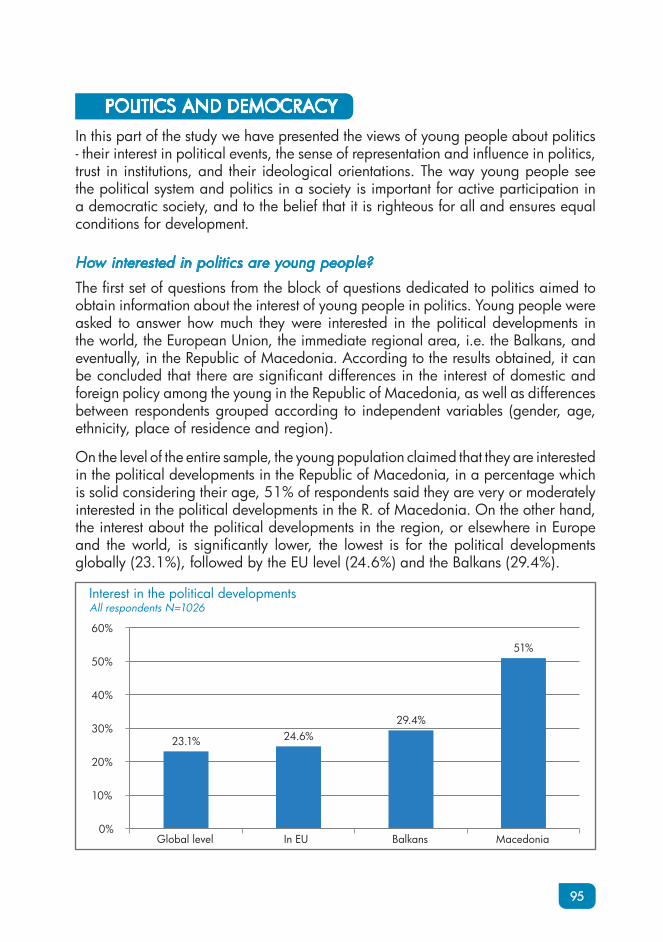
95
POLITICS AND DEMOCRACY
In this part of the study we have presented the views of young people about politics - their interest in political events, the sense of representation and influence in politics, trust in institutions, and their ideological orientations. The way young people see the political system and politics in a society is important for active participation in a democratic society, and to the belief that it is righteous for all and ensures equal conditions for development.
How interested in politics are young people?
The first set of questions from the block of questions dedicated to politics aimed to obtain information about the interest of young people in politics. Young people were asked to answer how much they were interested in the political developments in the world, the European Union, the immediate regional area, i.e. the Balkans, and eventually, in the Republic of Macedonia. According to the results obtained, it can be concluded that there are significant differences in the interest of domestic and foreign policy among the young in the Republic of Macedonia, as well as differences between respondents grouped according to independent variables (gender, age, ethnicity, place of residence and region).
On the level of the entire sample, the young population claimed that they are interested in the political developments in the Republic of Macedonia, in a percentage which is solid considering their age, 51% of respondents said they are very or moderately interested in the political developments in the R. of Macedonia. On the other hand, the interest about the political developments in the region, or elsewhere in Europe and the world, is significantly lower, the lowest is for the political developments globally (23.1%), followed by the EU level (24.6%) and the Balkans (29.4%).
23.1% 24.6%29.4%
51%
0%
10%
20%
30%
40%
50%
60%
Global level In EU Balkans Macedonia
Interest in the political developmentsAll respondents N=1026
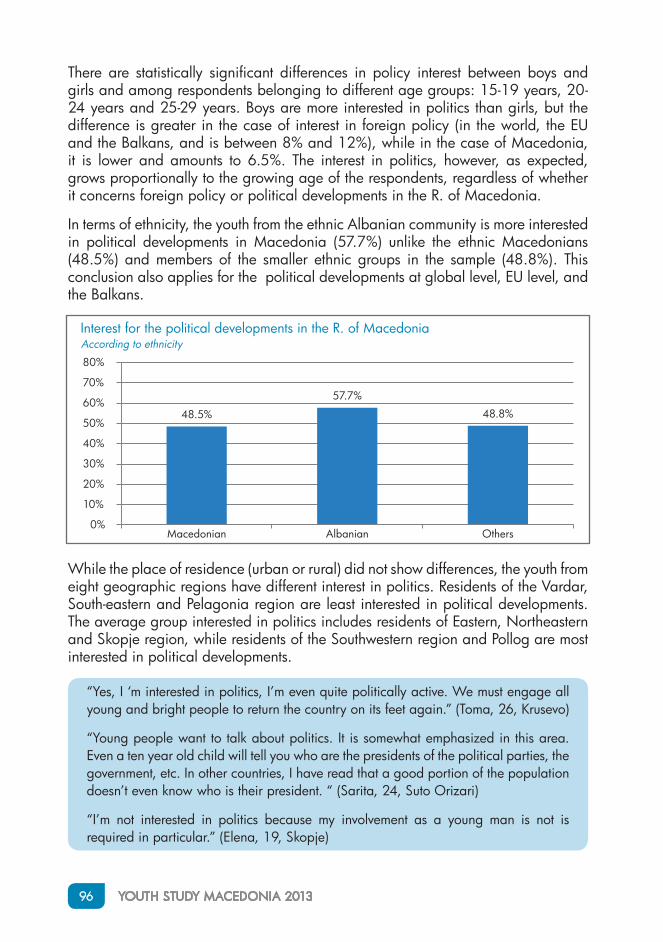
96 YOUTH STUDY MACEDONIA 2013
There are statistically significant differences in policy interest between boys and girls and among respondents belonging to different age groups: 15-19 years, 20-24 years and 25-29 years. Boys are more interested in politics than girls, but the difference is greater in the case of interest in foreign policy (in the world, the EU and the Balkans, and is between 8% and 12%), while in the case of Macedonia, it is lower and amounts to 6.5%. The interest in politics, however, as expected, grows proportionally to the growing age of the respondents, regardless of whether it concerns foreign policy or political developments in the R. of Macedonia.
In terms of ethnicity, the youth from the ethnic Albanian community is more interested in political developments in Macedonia (57.7%) unlike the ethnic Macedonians (48.5%) and members of the smaller ethnic groups in the sample (48.8%). This conclusion also applies for the political developments at global level, EU level, and the Balkans.
While the place of residence (urban or rural) did not show differences, the youth from eight geographic regions have different interest in politics. Residents of the Vardar, South-eastern and Pelagonia region are least interested in political developments. The average group interested in politics includes residents of Eastern, Northeastern and Skopje region, while residents of the Southwestern region and Pollog are most interested in political developments.
“Yes, I ‘m interested in politics, I’m even quite politically active. We must engage all young and bright people to return the country on its feet again.” (Toma, 26, Krusevo)
“Young people want to talk about politics. It is somewhat emphasized in this area. Even a ten year old child will tell you who are the presidents of the political parties, the government, etc. In other countries, I have read that a good portion of the population doesn’t even know who is their president. “ (Sarita, 24, Suto Orizari)
“I’m not interested in politics because my involvement as a young man is not is required in particular.” (Elena, 19, Skopje)
48.5%
57.7%
48.8%
0%
10%
20%
30%
40%
50%
60%
70%
80%
Macedonian Albanian Others
Interest for the political developments in the R. of Macedonia According to ethnicity
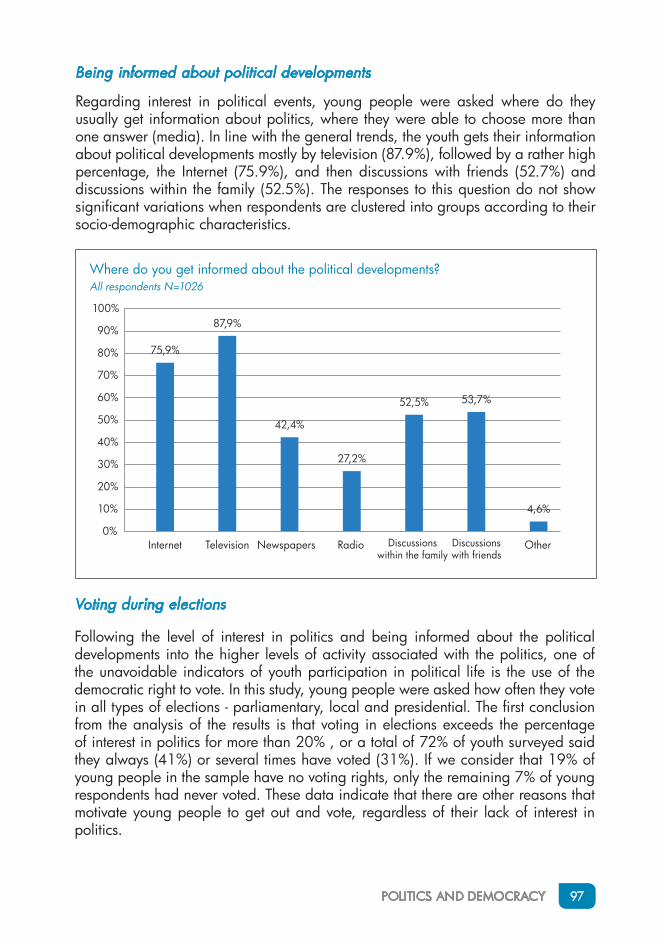
POLITICS AND DEMOCRACY 97
Being informed about political developments
Regarding interest in political events, young people were asked where do they usually get information about politics, where they were able to choose more than one answer (media). In line with the general trends, the youth gets their information about political developments mostly by television (87.9%), followed by a rather high percentage, the Internet (75.9%), and then discussions with friends (52.7%) and discussions within the family (52.5%). The responses to this question do not show significant variations when respondents are clustered into groups according to their socio-demographic characteristics.
75,9%
87,9%
42,4%
27,2%
52,5% 53,7%
4,6%
0%
10%
20%
30%
40%
50%
60%
70%
80%
90%
100%
Internet Television Newspapers Radio Discussions within the family
Discussions with friends
Other
Where do you get informed about the political developments?All respondents N=1026
Voting during elections
Following the level of interest in politics and being informed about the political developments into the higher levels of activity associated with the politics, one of the unavoidable indicators of youth participation in political life is the use of the democratic right to vote. In this study, young people were asked how often they vote in all types of elections - parliamentary, local and presidential. The first conclusion from the analysis of the results is that voting in elections exceeds the percentage of interest in politics for more than 20% , or a total of 72% of youth surveyed said they always (41%) or several times have voted (31%). If we consider that 19% of young people in the sample have no voting rights, only the remaining 7% of young respondents had never voted. These data indicate that there are other reasons that motivate young people to get out and vote, regardless of their lack of interest in politics.
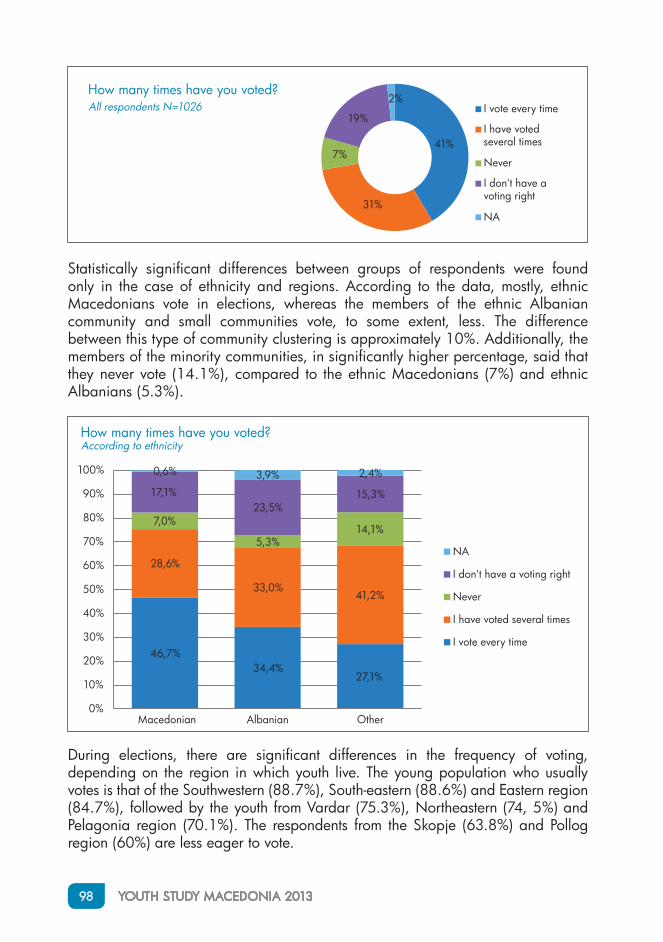
98 YOUTH STUDY MACEDONIA 2013
Statistically significant differences between groups of respondents were found only in the case of ethnicity and regions. According to the data, mostly, ethnic Macedonians vote in elections, whereas the members of the ethnic Albanian community and small communities vote, to some extent, less. The difference between this type of community clustering is approximately 10%. Additionally, the members of the minority communities, in significantly higher percentage, said that they never vote (14.1%), compared to the ethnic Macedonians (7%) and ethnic Albanians (5.3%).
41%
31%
7%
19%
2%How many times have you voted? All respondents N=1026 I vote every time
I have voted several times
Never
I don't have a voting right
NA
46,7%34,4%
27,1%
28,6%
33,0%41,2%
7,0%
5,3%14,1%
17,1%23,5%
15,3%
0,6% 3,9% 2,4%
0%
10%
20%
30%
40%
50%
60%
70%
80%
90%
100%
Macedonian Albanian Other
How many times have you voted?According to ethnicity
NA
I don't have a voting right
Never
I have voted several times
I vote every time
During elections, there are significant differences in the frequency of voting, depending on the region in which youth live. The young population who usually votes is that of the Southwestern (88.7%), South-eastern (88.6%) and Eastern region (84.7%), followed by the youth from Vardar (75.3%), Northeastern (74, 5%) and Pelagonia region (70.1%). The respondents from the Skopje (63.8%) and Pollog region (60%) are less eager to vote.
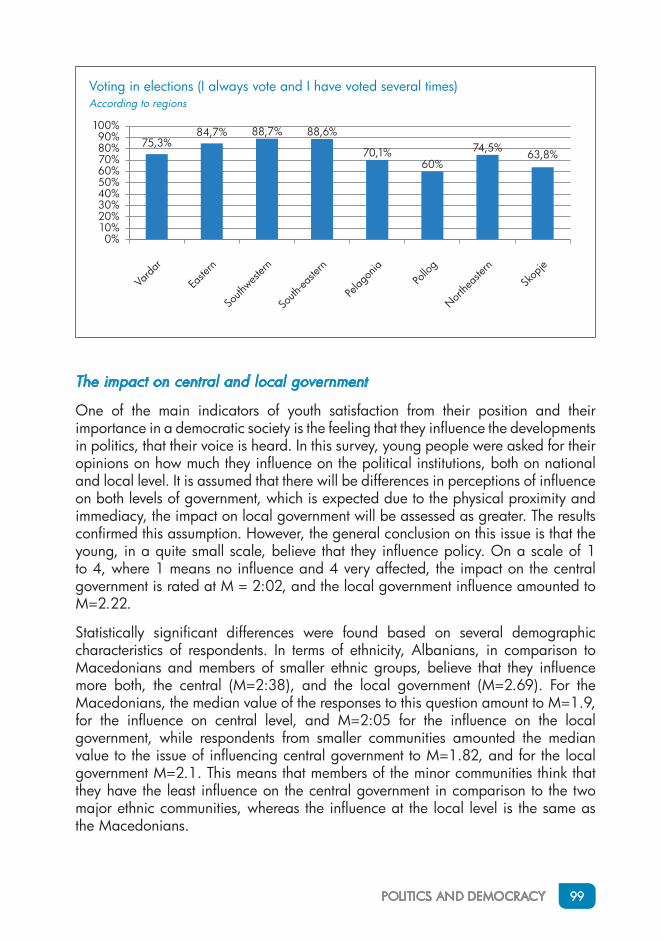
POLITICS AND DEMOCRACY 99
The impact on central and local government
One of the main indicators of youth satisfaction from their position and their importance in a democratic society is the feeling that they influence the developments in politics, that their voice is heard. In this survey, young people were asked for their opinions on how much they influence on the political institutions, both on national and local level. It is assumed that there will be differences in perceptions of influence on both levels of government, which is expected due to the physical proximity and immediacy, the impact on local government will be assessed as greater. The results confirmed this assumption. However, the general conclusion on this issue is that the young, in a quite small scale, believe that they influence policy. On a scale of 1 to 4, where 1 means no influence and 4 very affected, the impact on the central government is rated at M = 2:02, and the local government influence amounted to M=2.22.
Statistically significant differences were found based on several demographic characteristics of respondents. In terms of ethnicity, Albanians, in comparison to Macedonians and members of smaller ethnic groups, believe that they influence more both, the central (M=2:38), and the local government (M=2.69). For the Macedonians, the median value of the responses to this question amount to M=1.9, for the influence on central level, and M=2:05 for the influence on the local government, while respondents from smaller communities amounted the median value to the issue of influencing central government to M=1.82, and for the local government M=2.1. This means that members of the minor communities think that they have the least influence on the central government in comparison to the two major ethnic communities, whereas the influence at the local level is the same as the Macedonians.
75,3%84,7% 88,7% 88,6%
70,1%60%
74,5% 63,8%
0%10%20%30%40%50%60%70%80%90%
100%
Voting in elections (I always vote and I have voted several times)According to regions
Varda
r
Easte
rn
South
wester
n
South
-easte
rn
Pelag
onia
Pollo
g
Northe
aster
n
Skop
je
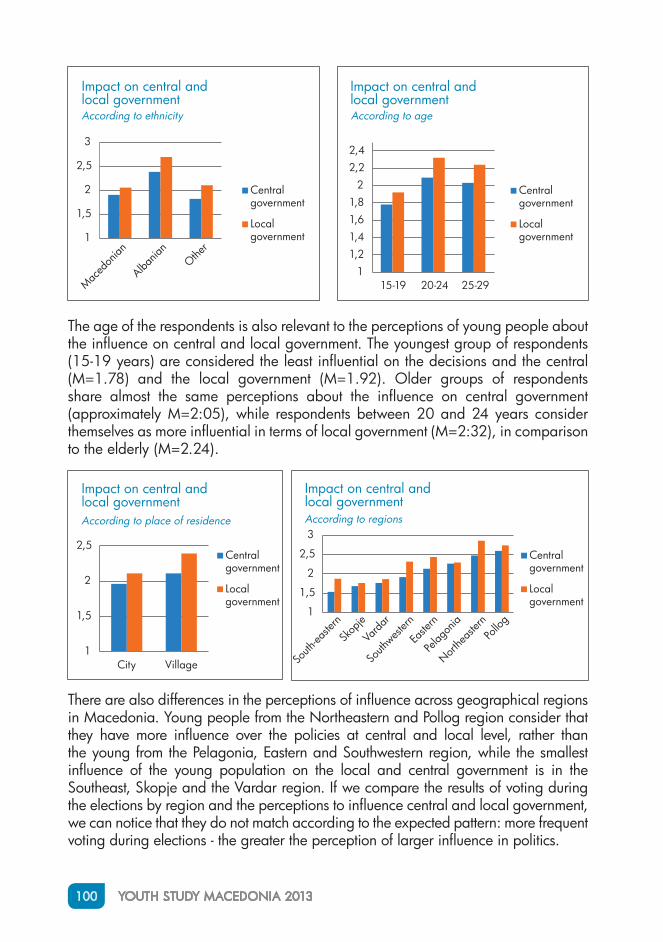
100 YOUTH STUDY MACEDONIA 2013
The age of the respondents is also relevant to the perceptions of young people about the influence on central and local government. The youngest group of respondents (15-19 years) are considered the least influential on the decisions and the central (M=1.78) and the local government (M=1.92). Older groups of respondents share almost the same perceptions about the influence on central government (approximately M=2:05), while respondents between 20 and 24 years consider themselves as more influential in terms of local government (M=2:32), in comparison to the elderly (M=2.24).
1
1,5
2
2,5
3
Impact on central and local government According to ethnicity
Central government
Local government
11,21,41,61,8
22,22,4
15-19 20-24 25-29
Impact on central and local government According to age
Central government
Local government
Maced
onian
Albania
nOthe
r
1
1,5
2
2,5
City Village
Impact on central and local government According to place of residence
Central government
Local government
Central government
Local government
Impact on central and local government According to regions
1
1,5
2
2,5
3
South
-easte
rn
Skop
je
Varda
r
South
wester
n
Easte
rn
Pelag
onia
Northe
aster
nPo
llog
There are also differences in the perceptions of influence across geographical regions in Macedonia. Young people from the Northeastern and Pollog region consider that they have more influence over the policies at central and local level, rather than the young from the Pelagonia, Eastern and Southwestern region, while the smallest influence of the young population on the local and central government is in the Southeast, Skopje and the Vardar region. If we compare the results of voting during the elections by region and the perceptions to influence central and local government, we can notice that they do not match according to the expected pattern: more frequent voting during elections - the greater the perception of larger influence in politics.
POLITICS AND DEMOCRACY 101
“My parents must be politically engaged, mainly because their jobs and life depend on that. I find it hard when there are elections, during this period we feel the most anxiety in our home.” (Maria, 18, Kumanovo)
“Unfortunately, politics has entered in all layers of the society. In my own experience, as well as from discussions with some friends, the political affiliation is so strong that separates people. At work, especially if working in public institution, if you’re of a political party which is not in coalition with other political parties, they will not even communicate with you. You will be avoided, even you’ll get pressured.” (Sarita, 24, Suto Orizari)
“I do not bother with politics! But, I constantly hear these topics around me and I get angry when I hear that because a party affiliation, one got this or that.” (Martina, 18, Skopje)
The answers of the detailed interviews are illustrative for the negative attitude of young people towards politics in the country, which stems from a feeling of helplessness, frustration and disappointment from the political figures. Young people believe that politics and the influence of political parties is omnipresent and that access to employment and other opportunities largely depend on the established relationships with the political forces.
The feeling of youth representation in politics
Yet another question which analyses the quality in which the interests of young people in society are represented, how much is the young population satisfied with their peers that represent them in politics. On a scale of 1 to 4, where 1 means feel not at all represented, and 4 feel very represented, young people responded with a median value of M=1.9, i.e. a bias towards the negative part of the scale.
“The role of the youth in society is almost minimal. They are neglected and are used only for minor daily political interests. They are left on the sidelines of the action. They recruit you even when in school desks, to join a party, allegedly that will help you with placement in a student dorm, employment. Everything is reduced to little things, only certain individuals have a greater role, and they quickly forget the rest when they are promoted into higher circles.” (Zulem, 28, Strumica)
“We, the young, do not really have a role in Macedonian society. We feel uncertain when facing with of our place in the society, disappointed and hopeless.” (Maja, 24, Ohrid)
“Given that I’m professionally focused on art and culture, as a young man, I think my role is to raise the cultural level. But, today in this society, it does not matter whether you’re worth or not, it is important to be part of a political party. I really want to raise the level, but maybe someone else who has a great impact on society does not want to change the level of culture from the lower level to higher. And, on top of that, I am powerless over it.” (Alexander, 22, Veles)
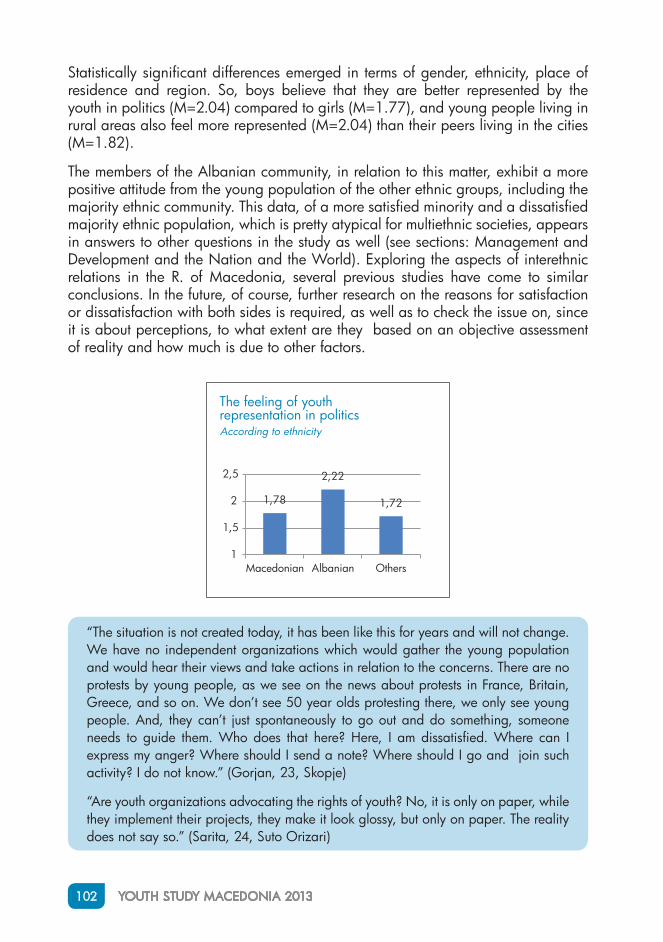
102 YOUTH STUDY MACEDONIA 2013
Statistically significant differences emerged in terms of gender, ethnicity, place of residence and region. So, boys believe that they are better represented by the youth in politics (M=2.04) compared to girls (M=1.77), and young people living in rural areas also feel more represented (M=2.04) than their peers living in the cities (M=1.82).
The members of the Albanian community, in relation to this matter, exhibit a more positive attitude from the young population of the other ethnic groups, including the majority ethnic community. This data, of a more satisfied minority and a dissatisfied majority ethnic population, which is pretty atypical for multiethnic societies, appears in answers to other questions in the study as well (see sections: Management and Development and the Nation and the World). Exploring the aspects of interethnic relations in the R. of Macedonia, several previous studies have come to similar conclusions. In the future, of course, further research on the reasons for satisfaction or dissatisfaction with both sides is required, as well as to check the issue on, since it is about perceptions, to what extent are they based on an objective assessment of reality and how much is due to other factors.
The feeling of youth representation in politicsAccording to ethnicity
1,78
2,22
1,72
1
1,5
2
2,5
Macedonian Albanian Others
“The situation is not created today, it has been like this for years and will not change. We have no independent organizations which would gather the young population and would hear their views and take actions in relation to the concerns. There are no protests by young people, as we see on the news about protests in France, Britain, Greece, and so on. We don’t see 50 year olds protesting there, we only see young people. And, they can’t just spontaneously to go out and do something, someone needs to guide them. Who does that here? Here, I am dissatisfied. Where can I express my anger? Where should I send a note? Where should I go and join such activity? I do not know.” (Gorjan, 23, Skopje)
“Are youth organizations advocating the rights of youth? No, it is only on paper, while they implement their projects, they make it look glossy, but only on paper. The reality does not say so.” (Sarita, 24, Suto Orizari)
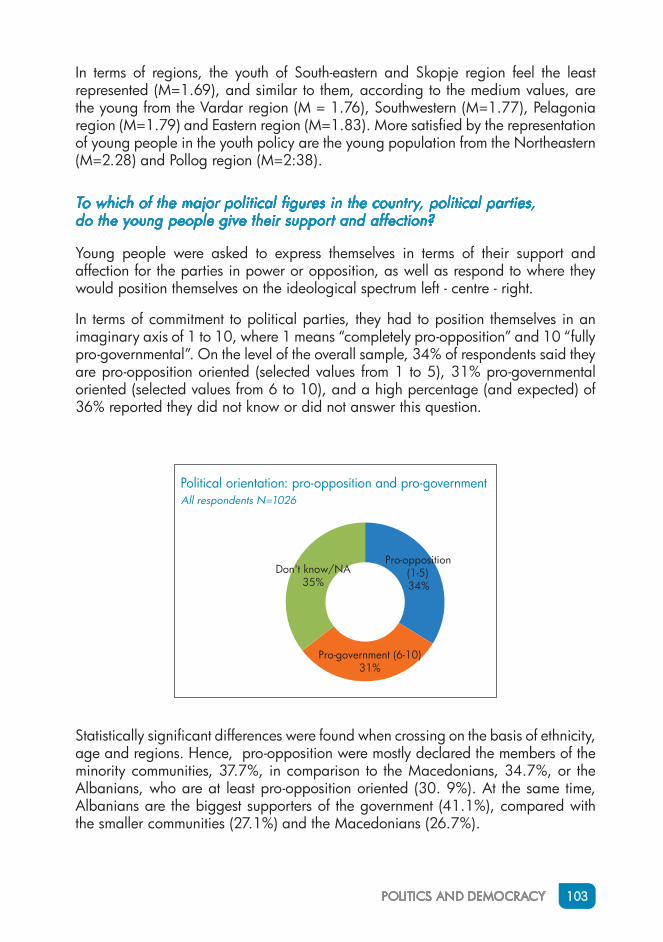
POLITICS AND DEMOCRACY 103
In terms of regions, the youth of South-eastern and Skopje region feel the least represented (M=1.69), and similar to them, according to the medium values, are the young from the Vardar region (M = 1.76), Southwestern (M=1.77), Pelagonia region (M=1.79) and Eastern region (M=1.83). More satisfied by the representation of young people in the youth policy are the young population from the Northeastern (M=2.28) and Pollog region (M=2:38).
To which of the major political figures in the country, political parties, do the young people give their support and affection?
Young people were asked to express themselves in terms of their support and affection for the parties in power or opposition, as well as respond to where they would position themselves on the ideological spectrum left - centre - right.
In terms of commitment to political parties, they had to position themselves in an imaginary axis of 1 to 10, where 1 means “completely pro-opposition” and 10 “fully pro-governmental”. On the level of the overall sample, 34% of respondents said they are pro-opposition oriented (selected values from 1 to 5), 31% pro-governmental oriented (selected values from 6 to 10), and a high percentage (and expected) of 36% reported they did not know or did not answer this question.
Political orientation: pro-opposition and pro-government All respondents N=1026
Pro-opposition(1-5)34%
Pro-government (6-10)31%
Don't know/NA35%
Statistically significant differences were found when crossing on the basis of ethnicity, age and regions. Hence, pro-opposition were mostly declared the members of the minority communities, 37.7%, in comparison to the Macedonians, 34.7%, or the Albanians, who are at least pro-opposition oriented (30. 9%). At the same time, Albanians are the biggest supporters of the government (41.1%), compared with the smaller communities (27.1%) and the Macedonians (26.7%).
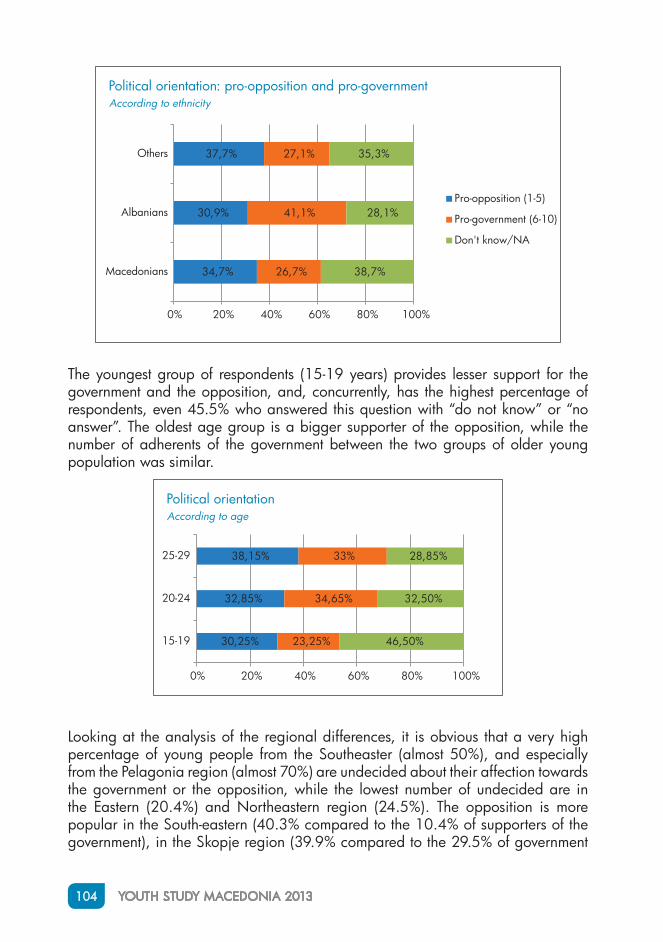
104 YOUTH STUDY MACEDONIA 2013
The youngest group of respondents (15-19 years) provides lesser support for the government and the opposition, and, concurrently, has the highest percentage of respondents, even 45.5% who answered this question with “do not know” or “no answer”. The oldest age group is a bigger supporter of the opposition, while the number of adherents of the government between the two groups of older young population was similar.
Political orientation: pro-opposition and pro-governmentAccording to ethnicity
34,7%
30,9%
37,7%
26,7%
41,1%
27,1%
38,7%
28,1%
35,3%
0% 20% 40% 60% 80% 100%
Macedonians
Albanians
Others
Pro-opposition (1-5)
Pro-government (6-10)
Don't know/NA
Political orientationAccording to age
30,25%
32,85%
38,15%
23,25%
34,65%
33%
46,50%
32,50%
28,85%
0% 20% 40% 60% 80% 100%
15-19
20-24
25-29
Looking at the analysis of the regional differences, it is obvious that a very high percentage of young people from the Southeaster (almost 50%), and especially from the Pelagonia region (almost 70%) are undecided about their affection towards the government or the opposition, while the lowest number of undecided are in the Eastern (20.4%) and Northeastern region (24.5%). The opposition is more popular in the South-eastern (40.3% compared to the 10.4% of supporters of the government), in the Skopje region (39.9% compared to the 29.5% of government
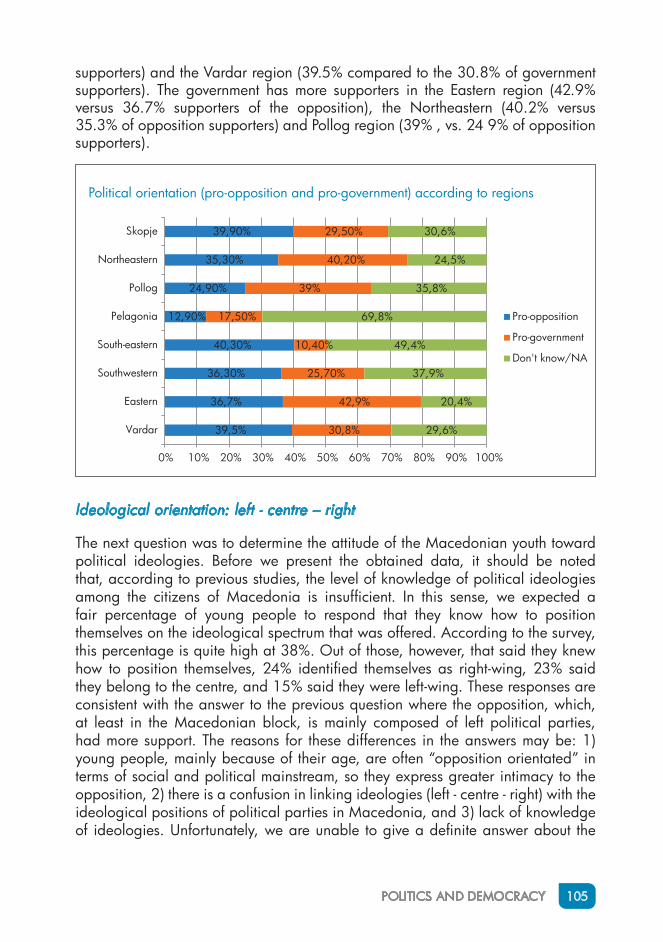
POLITICS AND DEMOCRACY 105
supporters) and the Vardar region (39.5% compared to the 30.8% of government supporters). The government has more supporters in the Eastern region (42.9% versus 36.7% supporters of the opposition), the Northeastern (40.2% versus 35.3% of opposition supporters) and Pollog region (39% , vs. 24 9% of opposition supporters).
Political orientation (pro-opposition and pro-government) according to regions
39,5%
36,7%
36,30%
40,30%
12,90%
24,90%
35,30%
39,90%
30,8%
42,9%
25,70%
10,40%
17,50%
39%
40,20%
29,50%
29,6%
20,4%
37,9%
49,4%
69,8%
35,8%
24,5%
30,6%
0% 10% 20% 30% 40% 50% 60% 70% 80% 90% 100%
Vardar
Eastern
Southwestern
South-eastern
Pelagonia
Pollog
Northeastern
Skopje
Pro-opposition
Pro-government
Don't know/NA
Ideological orientation: left - centre – right
The next question was to determine the attitude of the Macedonian youth toward political ideologies. Before we present the obtained data, it should be noted that, according to previous studies, the level of knowledge of political ideologies among the citizens of Macedonia is insufficient. In this sense, we expected a fair percentage of young people to respond that they know how to position themselves on the ideological spectrum that was offered. According to the survey, this percentage is quite high at 38%. Out of those, however, that said they knew how to position themselves, 24% identified themselves as right-wing, 23% said they belong to the centre, and 15% said they were left-wing. These responses are consistent with the answer to the previous question where the opposition, which, at least in the Macedonian block, is mainly composed of left political parties, had more support. The reasons for these differences in the answers may be: 1) young people, mainly because of their age, are often “opposition orientated” in terms of social and political mainstream, so they express greater intimacy to the opposition, 2) there is a confusion in linking ideologies (left - centre - right) with the ideological positions of political parties in Macedonia, and 3) lack of knowledge of ideologies. Unfortunately, we are unable to give a definite answer about the

106 YOUTH STUDY MACEDONIA 2013
reasons for this inconsistency, based solely on the questions asked in the survey for this study.
Political ideology: left - centre - rightAll respondents N=1026
Left15%
Centre23%
Right24%
Don't know/NA
38%
According to the survey results, there are significant differences in the ideological positioning of the different ethnic communities in Macedonia. Thus, out of those who reported belonging to an ideology, half of the Albanian ethnic community identify with the right (50.7%), 31.4% with the centre and the least with left political options (17.9%). One half , however, of the members of the minority communities position in the centre (51.1%), followed by the percentage of those who identify with the right (26.5%) and the smallest with the left (22,4%). When it comes to Macedonians, the distribution of public responses is somewhat smoother , with most (39.3%) of the youth opting for the centre, and the right has more than 8% lead over the left, with 34.6% of respondents said that they are right-wing, versus 26.1% of respondents who said they were left-wing.
Political ideologyAccording to ethnicity
26,1%
17,9%
22,4%
39,3%
31,4%
51,1%
34,6%
50,7%
26,5%
0% 20% 40% 60% 80% 100%
Macedonians
Albanians
Others
Left
Centre
Right
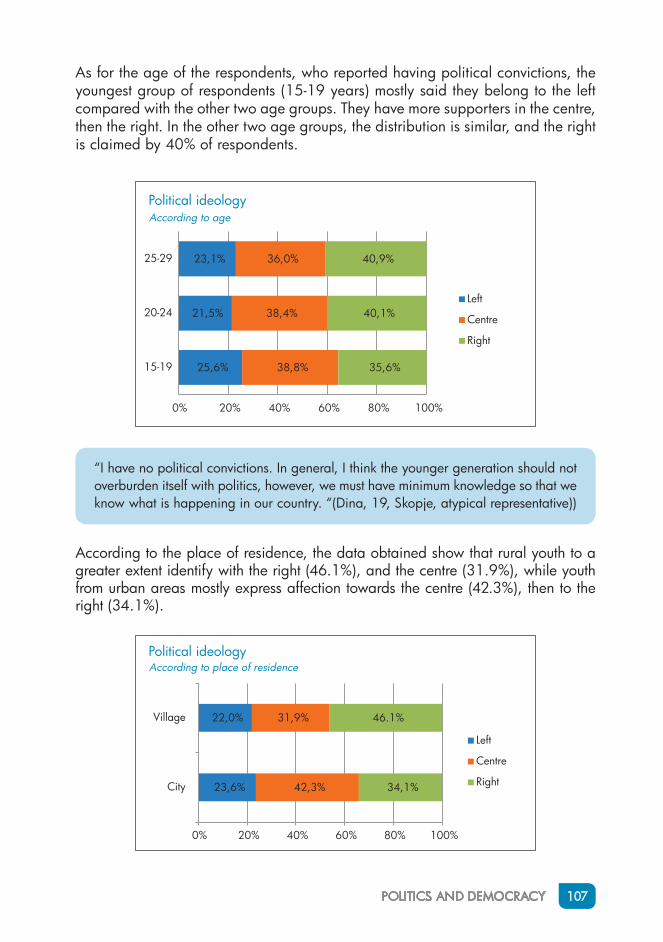
POLITICS AND DEMOCRACY 107
As for the age of the respondents, who reported having political convictions, the youngest group of respondents (15-19 years) mostly said they belong to the left compared with the other two age groups. They have more supporters in the centre, then the right. In the other two age groups, the distribution is similar, and the right is claimed by 40% of respondents.
Political ideology According to age
25,6%
21,5%
23,1%
38,8%
38,4%
36,0%
35,6%
40,1%
40,9%
0% 20% 40% 60% 80% 100%
15-19
20-24
25-29
Left
Centre
Right
“I have no political convictions. In general, I think the younger generation should not overburden itself with politics, however, we must have minimum knowledge so that we know what is happening in our country. “(Dina, 19, Skopje, atypical representative))
According to the place of residence, the data obtained show that rural youth to a greater extent identify with the right (46.1%), and the centre (31.9%), while youth from urban areas mostly express affection towards the centre (42.3%), then to the right (34.1%).
Political ideology According to place of residence
23,6%
22,0%
42,3%
31,9%
34,1%
46.1%
0% 20% 40% 60% 80% 100%
City
Village
Left
Centre
Right
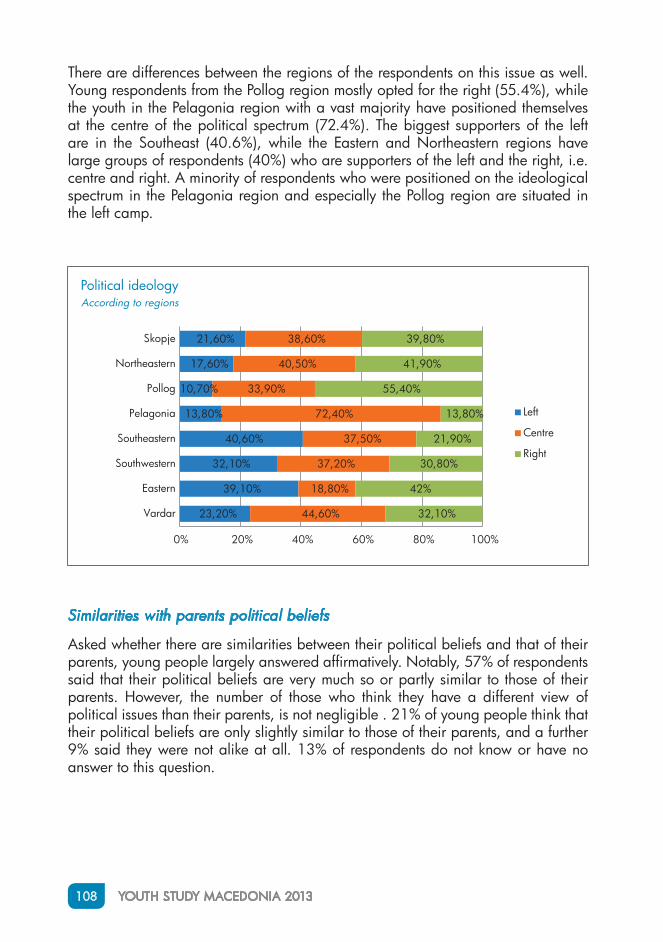
108 YOUTH STUDY MACEDONIA 2013
There are differences between the regions of the respondents on this issue as well. Young respondents from the Pollog region mostly opted for the right (55.4%), while the youth in the Pelagonia region with a vast majority have positioned themselves at the centre of the political spectrum (72.4%). The biggest supporters of the left are in the Southeast (40.6%), while the Eastern and Northeastern regions have large groups of respondents (40%) who are supporters of the left and the right, i.e. centre and right. A minority of respondents who were positioned on the ideological spectrum in the Pelagonia region and especially the Pollog region are situated in the left camp.
Political ideology According to regions
23,20%
39,10%
32,10%
40,60%
13,80%
10,70%
17,60%
21,60%
44,60%
18,80%
37,20%
37,50%
72,40%
33,90%
40,50%
38,60%
32,10%
42%
30,80%
21,90%
13,80%
55,40%
41,90%
39,80%
0% 20% 40% 60% 80% 100%
Vardar
Eastern
Southwestern
Southeastern
Pelagonia
Pollog
Northeastern
Skopje
Left
Centre
Right
Similarities with parents political beliefs
Asked whether there are similarities between their political beliefs and that of their parents, young people largely answered affirmatively. Notably, 57% of respondents said that their political beliefs are very much so or partly similar to those of their parents. However, the number of those who think they have a different view of political issues than their parents, is not negligible . 21% of young people think that their political beliefs are only slightly similar to those of their parents, and a further 9% said they were not alike at all. 13% of respondents do not know or have no answer to this question.
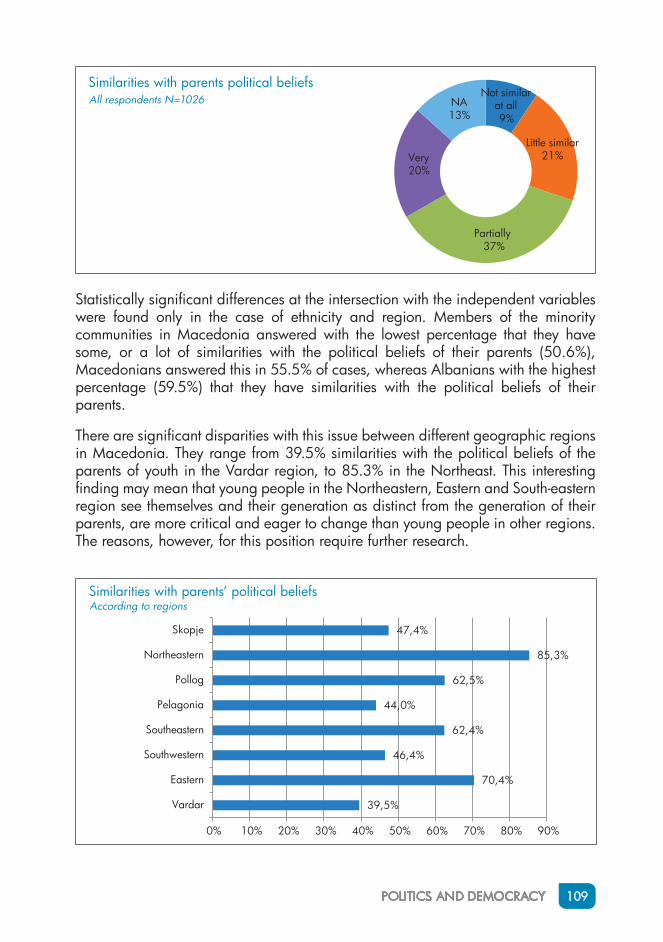
POLITICS AND DEMOCRACY 109
Statistically significant differences at the intersection with the independent variables were found only in the case of ethnicity and region. Members of the minority communities in Macedonia answered with the lowest percentage that they have some, or a lot of similarities with the political beliefs of their parents (50.6%), Macedonians answered this in 55.5% of cases, whereas Albanians with the highest percentage (59.5%) that they have similarities with the political beliefs of their parents.
There are significant disparities with this issue between different geographic regions in Macedonia. They range from 39.5% similarities with the political beliefs of the parents of youth in the Vardar region, to 85.3% in the Northeast. This interesting finding may mean that young people in the Northeastern, Eastern and South-eastern region see themselves and their generation as distinct from the generation of their parents, are more critical and eager to change than young people in other regions. The reasons, however, for this position require further research.
Similarities with parents political beliefsAll respondents N=1026
Not similar at all 9%
Little similar21%
Partially 37%
Very20%
NA13%
Similarities with parents’ political beliefsAccording to regions
39,5%
70,4%
46,4%
62,4%
44,0%
62,5%
85,3%
47,4%
0% 10% 20% 30% 40% 50% 60% 70% 80% 90%
Vardar
Eastern
Southwestern
Southeastern
Pelagonia
Pollog
Northeastern
Skopje
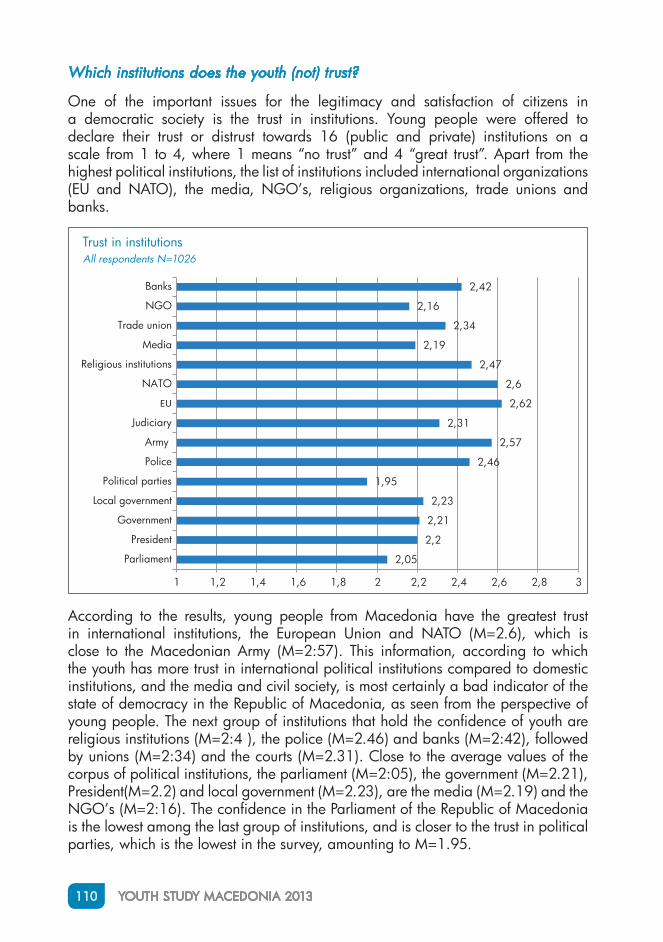
110 YOUTH STUDY MACEDONIA 2013
Which institutions does the youth (not) trust?
One of the important issues for the legitimacy and satisfaction of citizens in a democratic society is the trust in institutions. Young people were offered to declare their trust or distrust towards 16 (public and private) institutions on a scale from 1 to 4, where 1 means “no trust” and 4 “great trust”. Apart from the highest political institutions, the list of institutions included international organizations (EU and NATO), the media, NGO’s, religious organizations, trade unions and banks.
Trust in institutionsAll respondents N=1026
2,05
2,2
2,21
2,23
1,95
2,46
2,57
2,31
2,62
2,6
2,47
2,19
2,34
2,16
2,42
1 1,2 1,4 1,6 1,8 2 2,2 2,4 2,6 2,8 3
Parliament
President
Government
Local government
Political parties
Police
Army
Judiciary
EU
NATO
Religious institutions
Media
Trade union
NGO
Banks
According to the results, young people from Macedonia have the greatest trust in international institutions, the European Union and NATO (M=2.6), which is close to the Macedonian Army (M=2:57). This information, according to which the youth has more trust in international political institutions compared to domestic institutions, and the media and civil society, is most certainly a bad indicator of the state of democracy in the Republic of Macedonia, as seen from the perspective of young people. The next group of institutions that hold the confidence of youth are religious institutions (M=2:4 ), the police (M=2.46) and banks (M=2:42), followed by unions (M=2:34) and the courts (M=2.31 ). Close to the average values of the corpus of political institutions, the parliament (M=2:05), the government (M=2.21), President(M=2.2) and local government (M=2.23), are the media (M=2.19) and the NGO’s (M=2:16). The confidence in the Parliament of the Republic of Macedonia is the lowest among the last group of institutions, and is closer to the trust in political parties, which is the lowest in the survey, amounting to M=1.95.
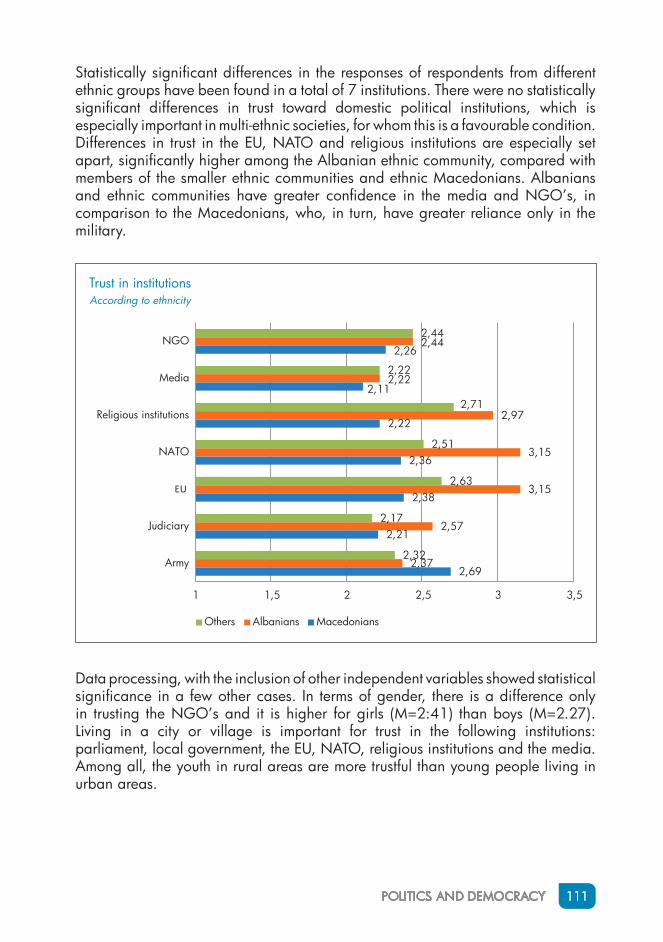
POLITICS AND DEMOCRACY 111
Statistically significant differences in the responses of respondents from different ethnic groups have been found in a total of 7 institutions. There were no statistically significant differences in trust toward domestic political institutions, which is especially important in multi-ethnic societies, for whom this is a favourable condition. Differences in trust in the EU, NATO and religious institutions are especially set apart, significantly higher among the Albanian ethnic community, compared with members of the smaller ethnic communities and ethnic Macedonians. Albanians and ethnic communities have greater confidence in the media and NGO’s, in comparison to the Macedonians, who, in turn, have greater reliance only in the military.
Trust in institutionsAccording to ethnicity
2,69
2,21
2,38
2,36
2,22
2,11
2,26
2,37
2,57
3,15
3,15
2,97
2,22
2,44
2,32
2,17
2,63
2,51
2,71
2,22
2,44
1 1,5 2 2,5 3 3,5
Army
Judiciary
EU
NATO
Religious institutions
Media
NGO
Others Albanians Macedonians
Data processing, with the inclusion of other independent variables showed statistical significance in a few other cases. In terms of gender, there is a difference only in trusting the NGO’s and it is higher for girls (M=2:41) than boys (M=2.27). Living in a city or village is important for trust in the following institutions: parliament, local government, the EU, NATO, religious institutions and the media. Among all, the youth in rural areas are more trustful than young people living in urban areas.
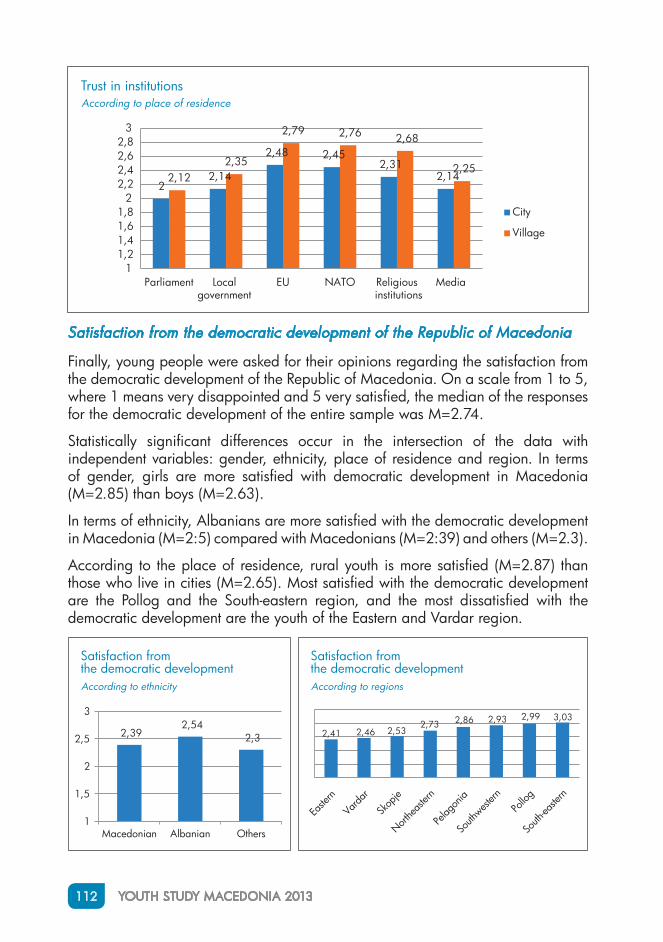
112 YOUTH STUDY MACEDONIA 2013
Satisfaction from the democratic development of the Republic of Macedonia
Finally, young people were asked for their opinions regarding the satisfaction from the democratic development of the Republic of Macedonia. On a scale from 1 to 5, where 1 means very disappointed and 5 very satisfied, the median of the responses for the democratic development of the entire sample was M=2.74.
Statistically significant differences occur in the intersection of the data with independent variables: gender, ethnicity, place of residence and region. In terms of gender, girls are more satisfied with democratic development in Macedonia (M=2.85) than boys (M=2.63).
In terms of ethnicity, Albanians are more satisfied with the democratic development in Macedonia (M=2:5) compared with Macedonians (M=2:39) and others (M=2.3).
According to the place of residence, rural youth is more satisfied (M=2.87) than those who live in cities (M=2.65). Most satisfied with the democratic development are the Pollog and the South-eastern region, and the most dissatisfied with the democratic development are the youth of the Eastern and Vardar region.
Trust in institutionsAccording to place of residence
22,14
2,48 2,452,31
2,142,122,35
2,79 2,76 2,68
2,25
11,21,41,61,8
22,22,42,62,8
3
Parliament Local government
EU NATO Religious institutions
Media
City
Village
Satisfaction from the democratic developmentAccording to ethnicity
Satisfaction from the democratic developmentAccording to regions
2,392,54
2,3
1
1,5
2
2,5
3
Macedonian Albanian Others
Easte
rn
Varda
r
Skop
je
Northe
aster
n
Pelag
onia
South
western
Pollo
g
South
-easte
rn
2,41 2,46 2,532,73 2,86 2,93 2,99 3,03
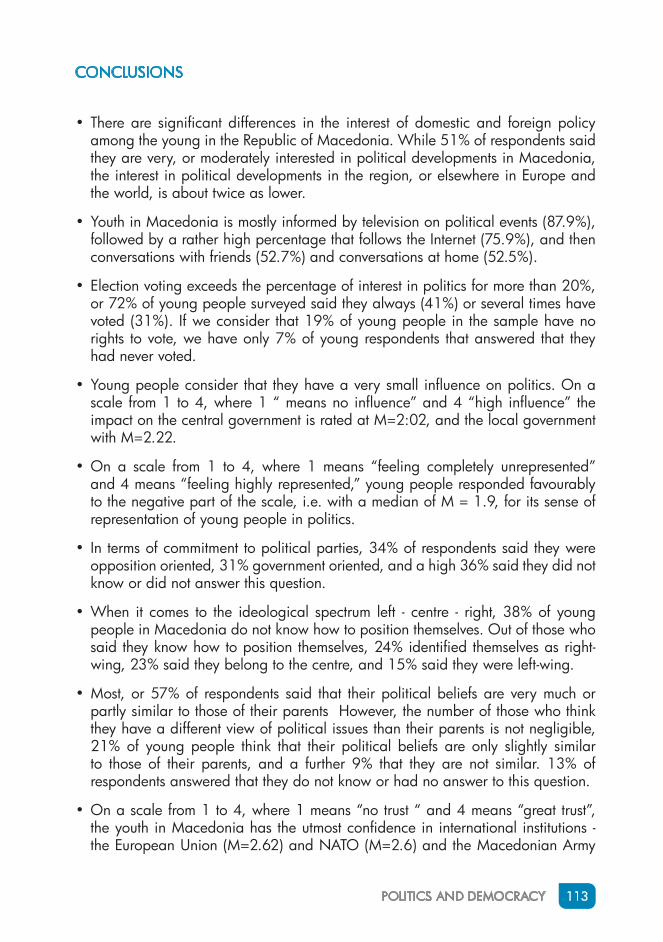
POLITICS AND DEMOCRACY 113
CONCLUSIONS
•• There are significant differences in the interest of domestic and foreign policy among the young in the Republic of Macedonia. While 51% of respondents said they are very, or moderately interested in political developments in Macedonia, the interest in political developments in the region, or elsewhere in Europe and the world, is about twice as lower.
•• Youth in Macedonia is mostly informed by television on political events (87.9%), followed by a rather high percentage that follows the Internet (75.9%), and then conversations with friends (52.7%) and conversations at home (52.5%).
•• Election voting exceeds the percentage of interest in politics for more than 20%, or 72% of young people surveyed said they always (41%) or several times have voted (31%). If we consider that 19% of young people in the sample have no rights to vote, we have only 7% of young respondents that answered that they had never voted.
•• Young people consider that they have a very small influence on politics. On a scale from 1 to 4, where 1 “ means no influence” and 4 “high influence” the impact on the central government is rated at M=2:02, and the local government with M=2.22.
•• On a scale from 1 to 4, where 1 means “feeling completely unrepresented” and 4 means “feeling highly represented,” young people responded favourably to the negative part of the scale, i.e. with a median of M = 1.9, for its sense of representation of young people in politics.
•• In terms of commitment to political parties, 34% of respondents said they were opposition oriented, 31% government oriented, and a high 36% said they did not know or did not answer this question.
•• When it comes to the ideological spectrum left - centre - right, 38% of young people in Macedonia do not know how to position themselves. Out of those who said they know how to position themselves, 24% identified themselves as right-wing, 23% said they belong to the centre, and 15% said they were left-wing.
•• Most, or 57% of respondents said that their political beliefs are very much or partly similar to those of their parents However, the number of those who think they have a different view of political issues than their parents is not negligible, 21% of young people think that their political beliefs are only slightly similar to those of their parents, and a further 9% that they are not similar. 13% of respondents answered that they do not know or had no answer to this question.
•• On a scale from 1 to 4, where 1 means “no trust “ and 4 means “great trust”, the youth in Macedonia has the utmost confidence in international institutions - the European Union (M=2.62) and NATO (M=2.6) and the Macedonian Army
114 YOUTH STUDY MACEDONIA 2013
(M=2:57). The next group of institutions that holds the confidence of the youth are religious institutions (M=2:47), the police (M=2.46) and banks (M=2:42), followed by unions (M=2:34) and the courts (M=2.31 ). Close to the average values of the corpus political institutions, the Parliament (M=2:05) ,the government (M=2.21) ,the President (M=2.2) and the local government (M=2.23), are the media (M=2.19) and NGO’s (M=2:16). The confidence in the Parliament of Macedonia is the lowest among the central institutions of the state and is closer to the trust in political parties, which is the lowest in the survey, amounting to M=1.95.
•• On a scale from 1 to 5, where 1 means “very disappointed “ and 5 “very pleased,” the median response for democratic development is close to the average grade and equals M=2.74.
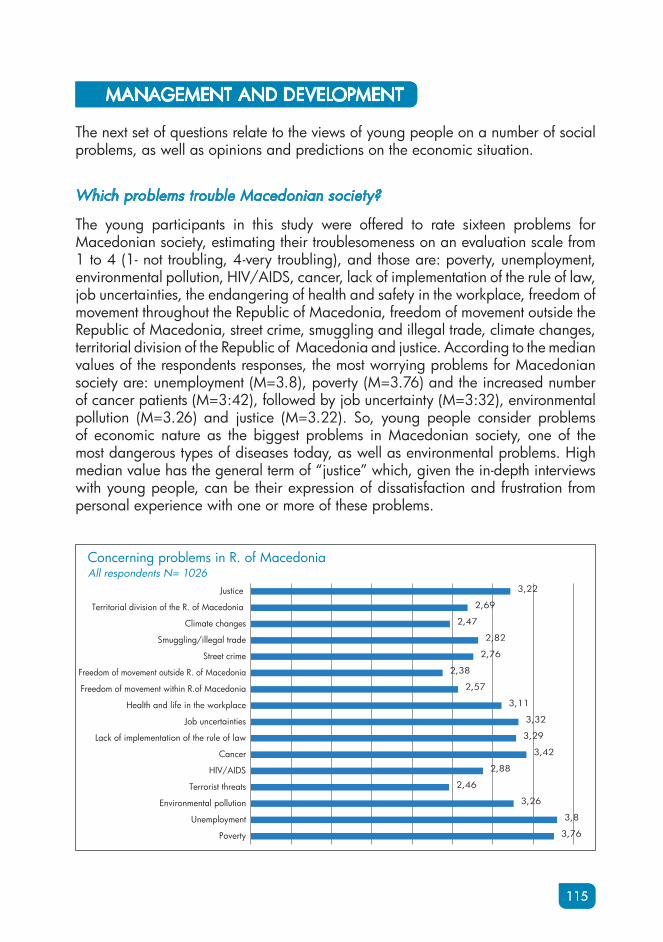
115
MANAGEMENT AND DEVELOPMENT
The next set of questions relate to the views of young people on a number of social problems, as well as opinions and predictions on the economic situation.
Which problems trouble Macedonian society?
The young participants in this study were offered to rate sixteen problems for Macedonian society, estimating their troublesomeness on an evaluation scale from 1 to 4 (1- not troubling, 4-very troubling), and those are: poverty, unemployment, environmental pollution, HIV/AIDS, cancer, lack of implementation of the rule of law, job uncertainties, the endangering of health and safety in the workplace, freedom of movement throughout the Republic of Macedonia, freedom of movement outside the Republic of Macedonia, street crime, smuggling and illegal trade, climate changes, territorial division of the Republic of Macedonia and justice. According to the median values of the respondents responses, the most worrying problems for Macedonian society are: unemployment (M=3.8), poverty (M=3.76) and the increased number of cancer patients (M=3:42), followed by job uncertainty (M=3:32), environmental pollution (M=3.26) and justice (M=3.22). So, young people consider problems of economic nature as the biggest problems in Macedonian society, one of the most dangerous types of diseases today, as well as environmental problems. High median value has the general term of “justice” which, given the in-depth interviews with young people, can be their expression of dissatisfaction and frustration from personal experience with one or more of these problems.
All respondents N= 1026Concerning problems in R. of Macedonia
3,76
3,8
3,26
2,46
2,88
3,42
3,29
3,32
3,11
2,57
2,38
2,76
2,82
2,47
2,69
3,22
Poverty
Unemployment
Environmental pollution
Terrorist threats
HIV/AIDS
Cancer
Lack of implementation of the rule of law
Job uncertainties
Health and life in the workplace
Freedom of movement within R.of Macedonia
Freedom of movement outside R. of Macedonia
Street crime
Smuggling/illegal trade
Climate changes
Territorial division of the R. of Macedonia
Justice
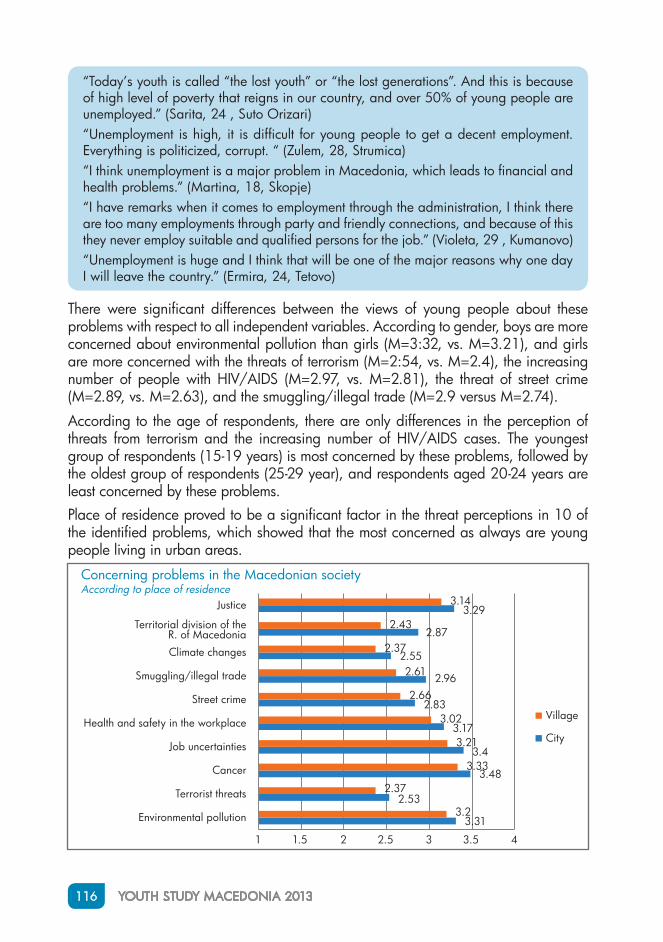
116 YOUTH STUDY MACEDONIA 2013
“Today’s youth is called “the lost youth” or “the lost generations”. And this is because of high level of poverty that reigns in our country, and over 50% of young people are unemployed.” (Sarita, 24 , Suto Orizari)“Unemployment is high, it is difficult for young people to get a decent employment. Everything is politicized, corrupt. “ (Zulem, 28, Strumica)“I think unemployment is a major problem in Macedonia, which leads to financial and health problems.” (Martina, 18, Skopje)“I have remarks when it comes to employment through the administration, I think there are too many employments through party and friendly connections, and because of this they never employ suitable and qualified persons for the job.” (Violeta, 29 , Kumanovo)“Unemployment is huge and I think that will be one of the major reasons why one day I will leave the country.” (Ermira, 24, Tetovo)
There were significant differences between the views of young people about these problems with respect to all independent variables. According to gender, boys are more concerned about environmental pollution than girls (M=3:32, vs. M=3.21), and girls are more concerned with the threats of terrorism (M=2:54, vs. M=2.4), the increasing number of people with HIV/AIDS (M=2.97, vs. M=2.81), the threat of street crime (M=2.89, vs. M=2.63), and the smuggling/illegal trade (M=2.9 versus M=2.74).
According to the age of respondents, there are only differences in the perception of threats from terrorism and the increasing number of HIV/AIDS cases. The youngest group of respondents (15-19 years) is most concerned by these problems, followed by the oldest group of respondents (25-29 year), and respondents aged 20-24 years are least concerned by these problems.Place of residence proved to be a significant factor in the threat perceptions in 10 of the identified problems, which showed that the most concerned as always are young people living in urban areas.
3.31
2.53
3.48
3.4
3.17
2.83
2.96
2.55
2.87
3.29
3.2
2.37
3.33
3.21
3.02
2.66
2.61
2.37
2.43
3.14
1 1.5 2 2.5 3 3.5 4
Environmental pollution
Terrorist threats
Cancer
Job uncertainties
Health and safety in the workplace
Street crime
Smuggling/illegal trade
Climate changes
Territorial division of the R. of Macedonia
Justice
Concerning problems in the Macedonian societyAccording to place of residence
Village
City
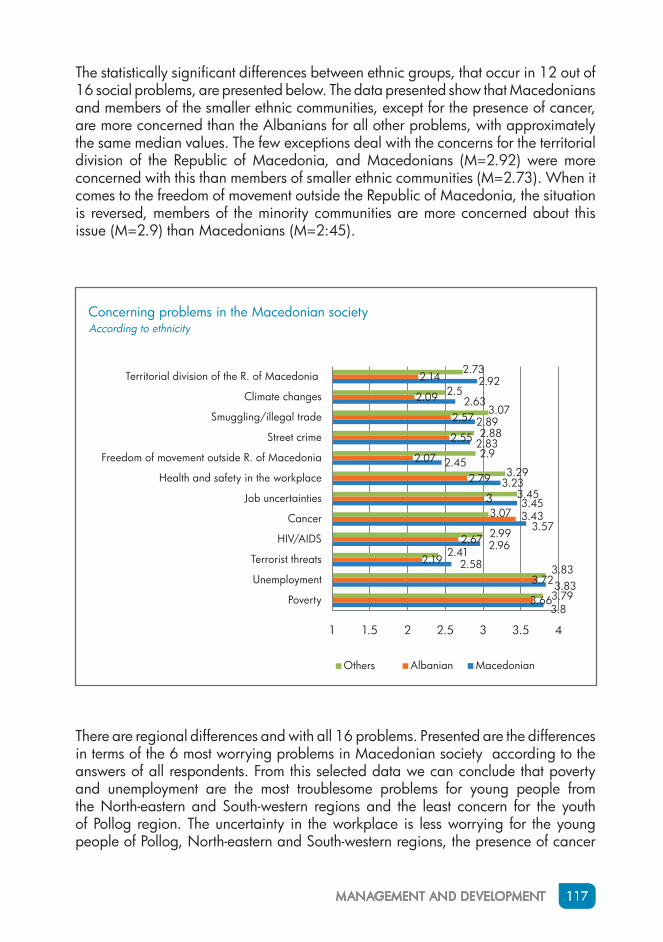
MANAGEMENT AND DEVELOPMENT 117
The statistically significant differences between ethnic groups, that occur in 12 out of 16 social problems, are presented below. The data presented show that Macedonians and members of the smaller ethnic communities, except for the presence of cancer, are more concerned than the Albanians for all other problems, with approximately the same median values . The few exceptions deal with the concerns for the territorial division of the Republic of Macedonia, and Macedonians (M=2.92) were more concerned with this than members of smaller ethnic communities (M=2.73). When it comes to the freedom of movement outside the Republic of Macedonia, the situation is reversed, members of the minority communities are more concerned about this issue (M=2.9) than Macedonians (M=2:45).
There are regional differences and with all 16 problems. Presented are the differences in terms of the 6 most worrying problems in Macedonian society according to the answers of all respondents. From this selected data we can conclude that poverty and unemployment are the most troublesome problems for young people from the North-eastern and South-western regions and the least concern for the youth of Pollog region. The uncertainty in the workplace is less worrying for the young people of Pollog, North-eastern and South-western regions, the presence of cancer
Others Albanian Macedonian
3.8
3.83
2.58
2.96
3.57
3.45
3.23
2.45
2.83
2.89
2.63
2.92
3.66
3.72
2.19
2.67
3.433
2.79
2.07
2.55
2.57
2.09
2.14
3.79
3.832.41
2.99
3.07
3.45
3.29
2.9
2.88
3.07
2.5
2.73
1 1.5 2 2.5 3 3.5 4
Poverty
Unemployment
Terrorist threats
HIV/AIDS
Cancer
Job uncertainties
Health and safety in the workplace
Freedom of movement outside R. of Macedonia
Street crime
Smuggling/illegal trade
Climate changes
Territorial division of the R. of Macedonia
Concerning problems in the Macedonian societyAccording to ethnicity
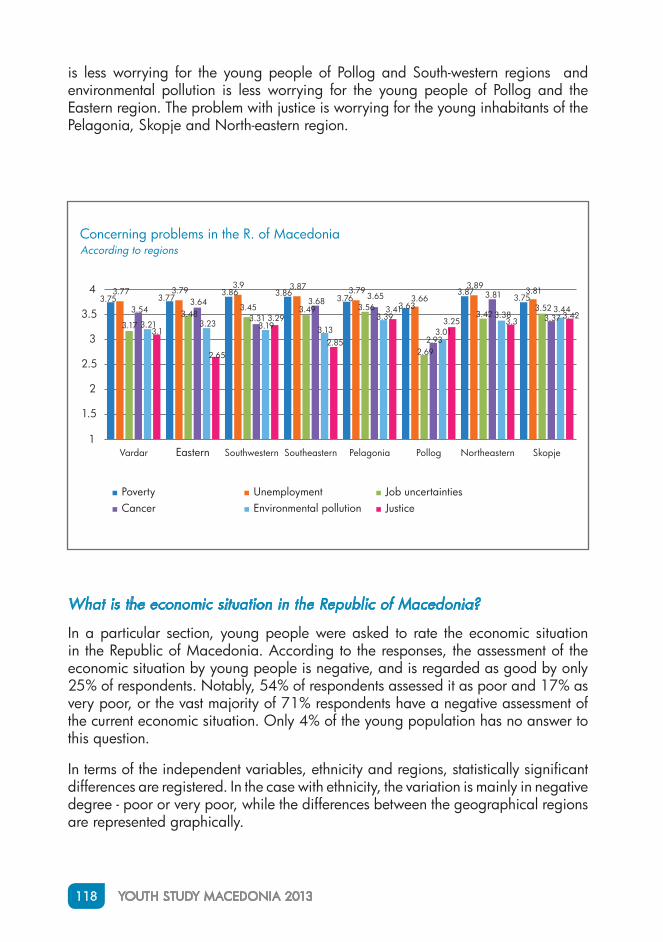
118 YOUTH STUDY MACEDONIA 2013
is less worrying for the young people of Pollog and South-western regions and environmental pollution is less worrying for the young people of Pollog and the Eastern region. The problem with justice is worrying for the young inhabitants of the Pelagonia, Skopje and North-eastern region.
What is the economic situation in the Republic of Macedonia?
In a particular section, young people were asked to rate the economic situation in the Republic of Macedonia. According to the responses, the assessment of the economic situation by young people is negative, and is regarded as good by only 25% of respondents. Notably, 54% of respondents assessed it as poor and 17% as very poor, or the vast majority of 71% respondents have a negative assessment of the current economic situation. Only 4% of the young population has no answer to this question.
In terms of the independent variables, ethnicity and regions, statistically significant differences are registered. In the case with ethnicity, the variation is mainly in negative degree - poor or very poor, while the differences between the geographical regions are represented graphically.
3.75 3.773.86 3.86
3.763.63
3.873.75
3.77 3.793.9 3.87 3.79
3.663.89
3.81
3.173.48
3.45 3.49 3.56
2.69
3.423.523.54
3.64
3.31
3.68 3.65
2.93
3.81
3.373.21 3.23 3.19 3.13
3.39
3.01
3.383.44
3.1
2.65
3.29
2.85
3.413.25 3.3
3.42
1
1.5
2
2.5
3
3.5
4
Vardar Eastern Southwestern Southeastern Pelagonia Pollog Northeastern Skopje
Concerning problems in the R. of MacedoniaAccording to regions
Poverty Unemployment Job uncertaintiesCancer Environmental pollution Justice
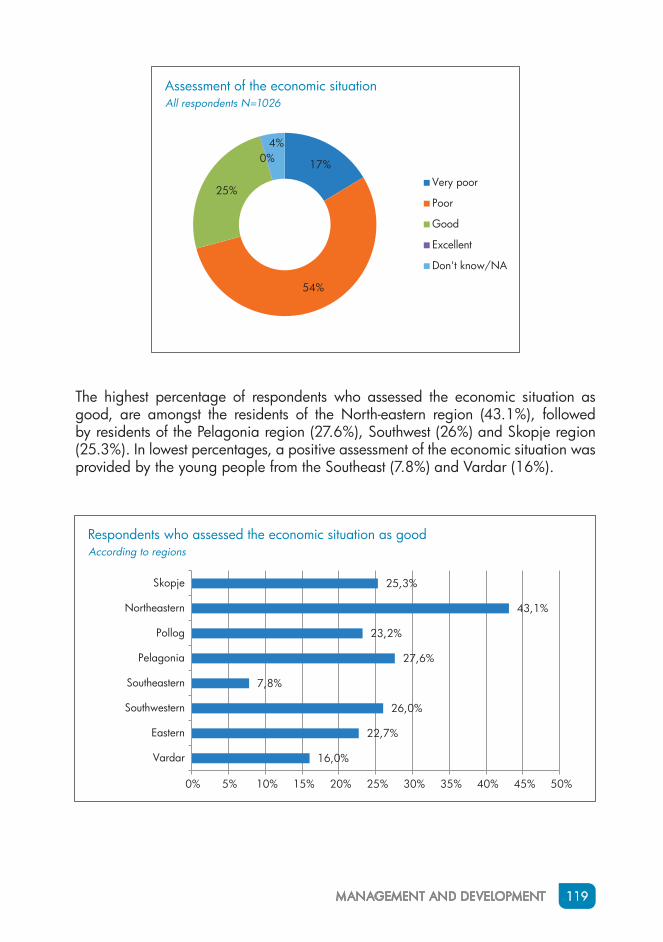
MANAGEMENT AND DEVELOPMENT 119
The highest percentage of respondents who assessed the economic situation as good, are amongst the residents of the North-eastern region (43.1%), followed by residents of the Pelagonia region (27.6%), Southwest (26%) and Skopje region (25.3%). In lowest percentages, a positive assessment of the economic situation was provided by the young people from the Southeast (7.8%) and Vardar (16%).
Assessment of the economic situationAll respondents N=1026
17%
54%
25%
0%4%
Very poor
Poor
Good
Excellent
Don't know/NA
Respondents who assessed the economic situation as goodAccording to regions
16,0%
22,7%
26,0%
7,8%
27,6%
23,2%
43,1%
25,3%
0% 5% 10% 15% 20% 25% 30% 35% 40% 45% 50%
Vardar
Eastern
Southwestern
Southeastern
Pelagonia
Pollog
Northeastern
Skopje
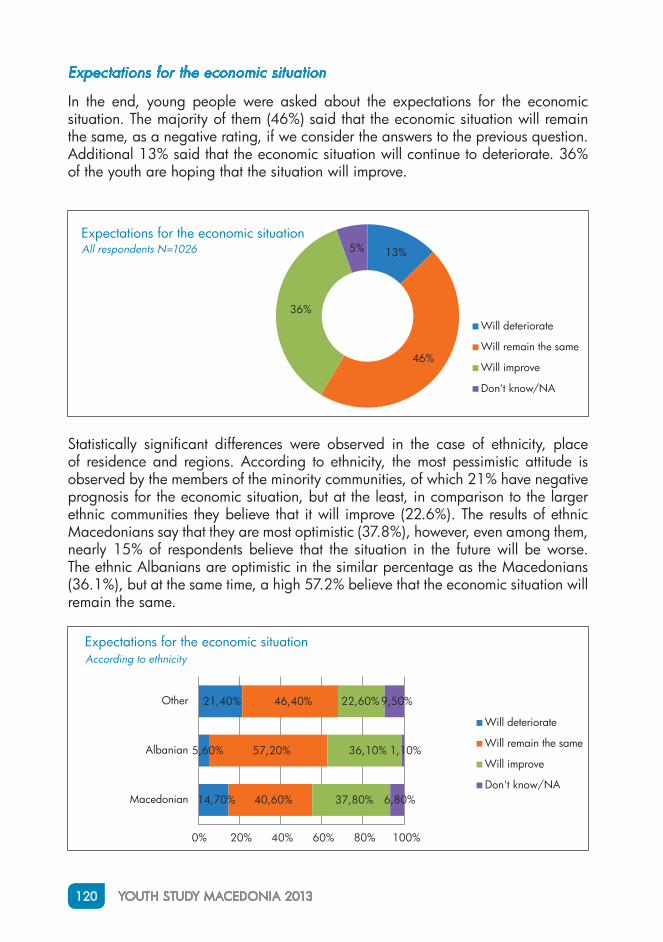
120 YOUTH STUDY MACEDONIA 2013
Expectations for the economic situation
In the end, young people were asked about the expectations for the economic situation. The majority of them (46%) said that the economic situation will remain the same, as a negative rating, if we consider the answers to the previous question. Additional 13% said that the economic situation will continue to deteriorate. 36% of the youth are hoping that the situation will improve.
Expectations for the economic situationAll respondents N=1026 13%
46%
36%
5%
Will deteriorate
Will remain the same
Will improve
Don't know/NA
Statistically significant differences were observed in the case of ethnicity, place of residence and regions. According to ethnicity, the most pessimistic attitude is observed by the members of the minority communities, of which 21% have negative prognosis for the economic situation, but at the least, in comparison to the larger ethnic communities they believe that it will improve (22.6%). The results of ethnic Macedonians say that they are most optimistic (37.8%), however, even among them, nearly 15% of respondents believe that the situation in the future will be worse. The ethnic Albanians are optimistic in the similar percentage as the Macedonians (36.1%), but at the same time, a high 57.2% believe that the economic situation will remain the same.
Expectations for the economic situationAccording to ethnicity
14,70%
5,60%
21,40%
40,60%
57,20%
46,40%
37,80%
36,10%
22,60%
6,80%
1,10%
9,50%
0% 20% 40% 60% 80% 100%
Macedonian
Albanian
Other
Will deteriorate
Will remain the same
Will improve
Don't know/NA
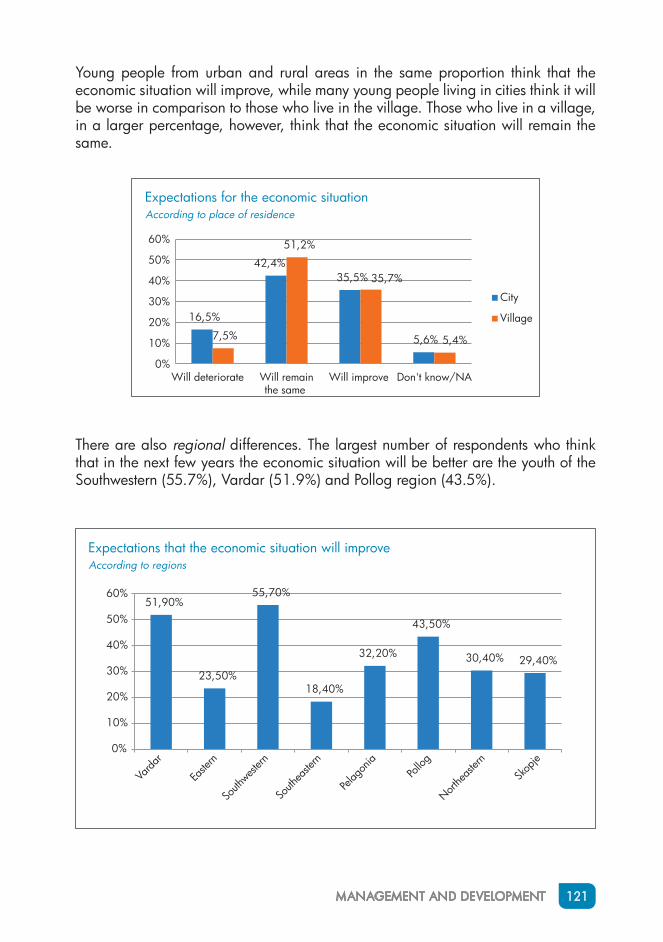
MANAGEMENT AND DEVELOPMENT 121
Young people from urban and rural areas in the same proportion think that the economic situation will improve, while many young people living in cities think it will be worse in comparison to those who live in the village. Those who live in a village, in a larger percentage, however, think that the economic situation will remain the same.
Expectations for the economic situationAccording to place of residence
16,5%
42,4%35,5%
5,6%7,5%
51,2%
35,7%
5,4%
0%
10%
20%
30%
40%
50%
60%
Will deteriorate Will remainthe same
Will improve Don't know/NA
City
Village
There are also regional differences. The largest number of respondents who think that in the next few years the economic situation will be better are the youth of the Southwestern (55.7%), Vardar (51.9%) and Pollog region (43.5%).
51,90%
23,50%
55,70%
18,40%
32,20%
43,50%
30,40% 29,40%
0%
10%
20%
30%
40%
50%
60%
Expectations that the economic situation will improveAccording to regions
Varda
r
Easte
rn
South
western
South
easte
rn
Pelag
onia
Pollo
g
Northe
aster
n
Skop
je
122 YOUTH STUDY MACEDONIA 2013
CONCLUSIONS
•• The biggest problems which the Macedonian society is facing are the problems of economic nature - unemployment, poverty and insecurity in the workplace, one of the most dangerous diseases of the day - cancer, as well as environmental pollution. Young people are concerned, but on a smaller scale, and only to several types of safety threats.
•• The vast majority of 71% respondents have a negative assessment of the current economic situation, i.e. that they assessed the situation as bad or very bad.
•• The young population, have mainly negative forecasts for the development of the economic situation in the country for the next few years. 46% of respondents emphasized that the economic situation will remain the same, whereas another 13% said that it would deteriorate further.
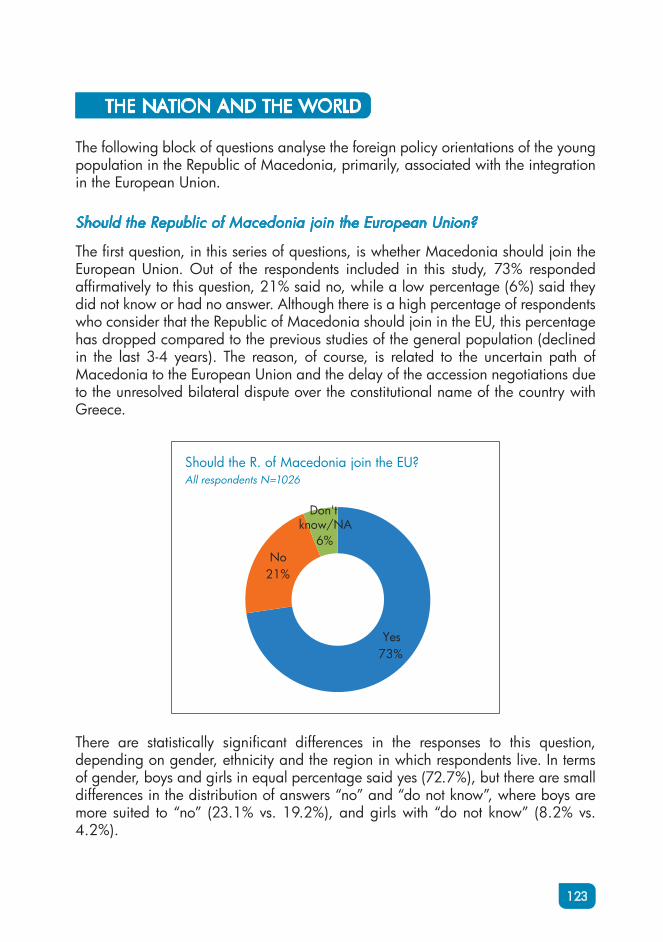
123
THE NATION AND THE WORLD
The following block of questions analyse the foreign policy orientations of the young population in the Republic of Macedonia, primarily, associated with the integration in the European Union.
Should the Republic of Macedonia join the European Union?
The first question, in this series of questions, is whether Macedonia should join the European Union. Out of the respondents included in this study, 73% responded affirmatively to this question, 21% said no, while a low percentage (6%) said they did not know or had no answer. Although there is a high percentage of respondents who consider that the Republic of Macedonia should join in the EU, this percentage has dropped compared to the previous studies of the general population (declined in the last 3-4 years). The reason, of course, is related to the uncertain path of Macedonia to the European Union and the delay of the accession negotiations due to the unresolved bilateral dispute over the constitutional name of the country with Greece.
Yes73%
No21%
Don't know/NA
6%
Should the R. of Macedonia join the EU?All respondents N=1026
There are statistically significant differences in the responses to this question, depending on gender, ethnicity and the region in which respondents live. In terms of gender, boys and girls in equal percentage said yes (72.7%), but there are small differences in the distribution of answers “no” and “do not know”, where boys are more suited to “no” (23.1% vs. 19.2%), and girls with “do not know” (8.2% vs. 4.2%).
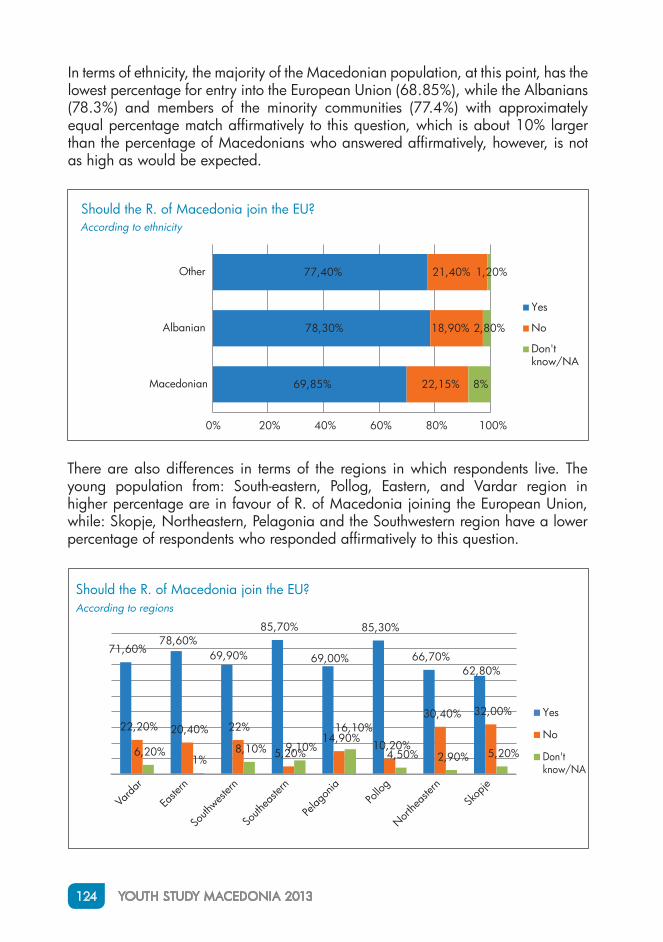
124 YOUTH STUDY MACEDONIA 2013
In terms of ethnicity, the majority of the Macedonian population, at this point, has the lowest percentage for entry into the European Union (68.85%), while the Albanians (78.3%) and members of the minority communities (77.4%) with approximately equal percentage match affirmatively to this question, which is about 10% larger than the percentage of Macedonians who answered affirmatively, however, is not as high as would be expected.
Should the R. of Macedonia join the EU?According to ethnicity
69,85%
78,30%
77,40%
22,15%
18,90%
21,40%
8%
2,80%
1,20%
0% 20% 40% 60% 80% 100%
Macedonian
Albanian
Other
Yes
No
Don't know/NA
There are also differences in terms of the regions in which respondents live. The young population from: South-eastern, Pollog, Eastern, and Vardar region in higher percentage are in favour of R. of Macedonia joining the European Union, while: Skopje, Northeastern, Pelagonia and the Southwestern region have a lower percentage of respondents who responded affirmatively to this question.
71,60%78,60%
69,90%
85,70%
69,00%
85,30%
66,70%62,80%
22,20% 20,40% 22%
5,20%14,90%
10,20%
30,40% 32,00%
6,20%1%
8,10% 9,10%
16,10%
4,50% 2,90% 5,20%
Yes
No
Don't know/NA
According to regions
Should the R. of Macedonia join the EU?
Pollo
g
South
easte
rn
Easte
rn
South
wester
n
Varda
r
Pelag
onia
Skop
je
Northe
aster
n
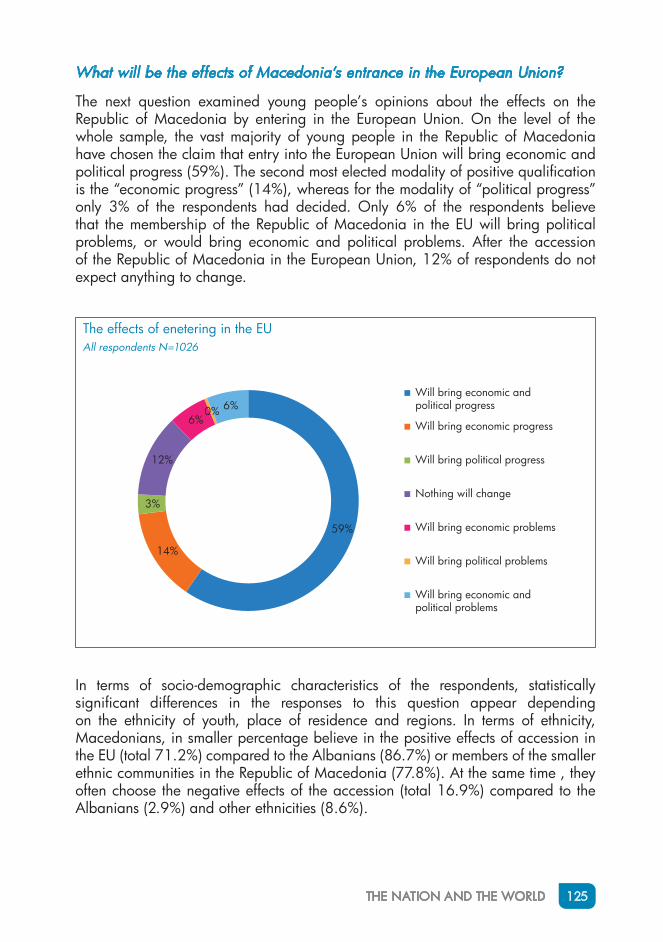
THE NATION AND THE WORLD 125
What will be the effects of Macedonia’s entrance in the European Union?
The next question examined young people’s opinions about the effects on the Republic of Macedonia by entering in the European Union. On the level of the whole sample, the vast majority of young people in the Republic of Macedonia have chosen the claim that entry into the European Union will bring economic and political progress (59%). The second most elected modality of positive qualification is the “economic progress” (14%), whereas for the modality of “political progress” only 3% of the respondents had decided. Only 6% of the respondents believe that the membership of the Republic of Macedonia in the EU will bring political problems, or would bring economic and political problems. After the accession of the Republic of Macedonia in the European Union, 12% of respondents do not expect anything to change.
59%
14%
3%
12%
6%0% 6%
Will bring economic and political progress
Will bring economic progress
Will bring political progress
Nothing will change
Will bring economic problems
Will bring political problems
Will bring economic and political problems
All respondents N=1026
The effects of enetering in the EU
In terms of socio-demographic characteristics of the respondents, statistically significant differences in the responses to this question appear depending on the ethnicity of youth, place of residence and regions. In terms of ethnicity, Macedonians, in smaller percentage believe in the positive effects of accession in the EU (total 71.2%) compared to the Albanians (86.7%) or members of the smaller ethnic communities in the Republic of Macedonia (77.8%). At the same time , they often choose the negative effects of the accession (total 16.9%) compared to the Albanians (2.9%) and other ethnicities (8.6%).
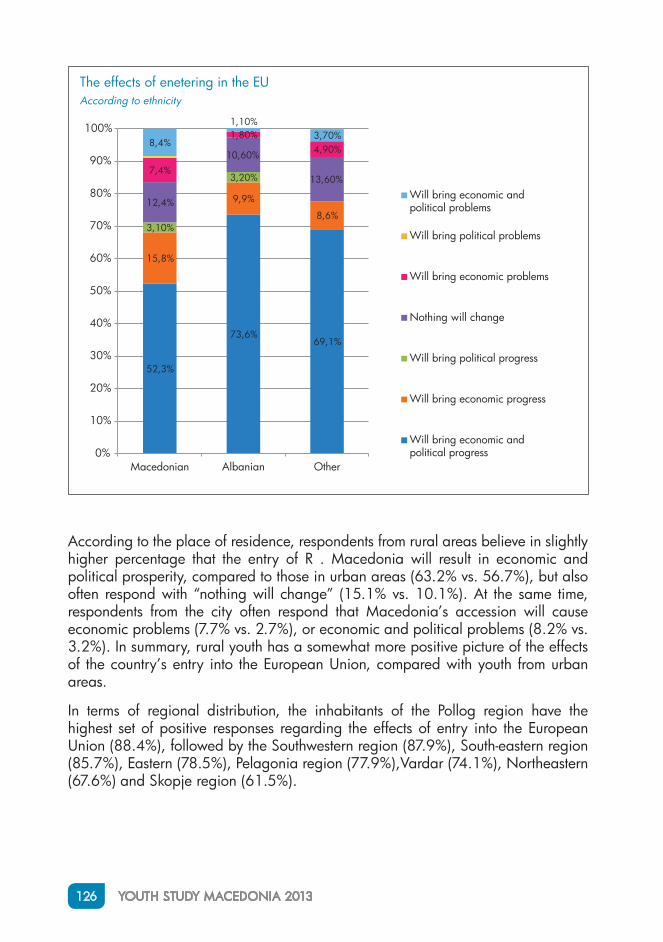
126 YOUTH STUDY MACEDONIA 2013
According to the place of residence, respondents from rural areas believe in slightly higher percentage that the entry of R . Macedonia will result in economic and political prosperity, compared to those in urban areas (63.2% vs. 56.7%), but also often respond with “nothing will change” (15.1% vs. 10.1%). At the same time, respondents from the city often respond that Macedonia’s accession will cause economic problems (7.7% vs. 2.7%), or economic and political problems (8.2% vs. 3.2%). In summary, rural youth has a somewhat more positive picture of the effects of the country’s entry into the European Union, compared with youth from urban areas.
In terms of regional distribution, the inhabitants of the Pollog region have the highest set of positive responses regarding the effects of entry into the European Union (88.4%), followed by the Southwestern region (87.9%), South-eastern region (85.7%), Eastern (78.5%), Pelagonia region (77.9%),Vardar (74.1%), Northeastern (67.6%) and Skopje region (61.5%).
52,3%
73,6%69,1%
15,8%
9,9%
8,6%3,10%
3,20%
12,4%
10,60%
13,60%7,4%
1,80%4,90%
8,4%
1,10%3,70%
0%
10%
20%
30%
40%
50%
60%
70%
80%
90%
100%
Macedonian Albanian Other
Will bring economic and political problems
Will bring political problems
Will bring economic problems
Nothing will change
Will bring political progress
Will bring economic progress
Will bring economic and political progress
According to ethnicity
The effects of enetering in the EU
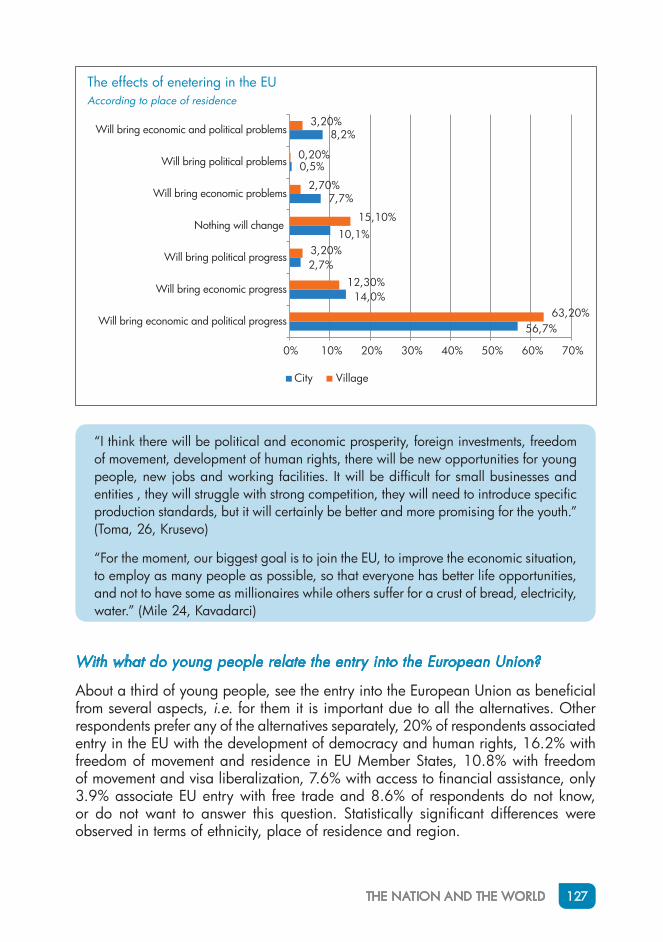
THE NATION AND THE WORLD 127
“I think there will be political and economic prosperity, foreign investments, freedom of movement, development of human rights, there will be new opportunities for young people, new jobs and working facilities. It will be difficult for small businesses and entities , they will struggle with strong competition, they will need to introduce specific production standards, but it will certainly be better and more promising for the youth.” (Toma, 26, Krusevo)
“For the moment, our biggest goal is to join the EU, to improve the economic situation, to employ as many people as possible, so that everyone has better life opportunities, and not to have some as millionaires while others suffer for a crust of bread, electricity, water.” (Mile 24, Kavadarci)
With what do young people relate the entry into the European Union?
About a third of young people, see the entry into the European Union as beneficial from several aspects, i.e. for them it is important due to all the alternatives. Other respondents prefer any of the alternatives separately, 20% of respondents associated entry in the EU with the development of democracy and human rights, 16.2% with freedom of movement and residence in EU Member States, 10.8% with freedom of movement and visa liberalization, 7.6% with access to financial assistance, only 3.9% associate EU entry with free trade and 8.6% of respondents do not know, or do not want to answer this question. Statistically significant differences were observed in terms of ethnicity, place of residence and region.
56,7%
14,0%
2,7%
10,1%
7,7%
0,5%
8,2%
63,20%
12,30%
3,20%
15,10%
2,70%
0,20%
3,20%
0% 10% 20% 30% 40% 50% 60% 70%
Will bring economic and political progress
Will bring economic progress
Will bring political progress
Nothing will change
Will bring economic problems
Will bring political problems
Will bring economic and political problems
City Village
According to place of residence
The effects of enetering in the EU
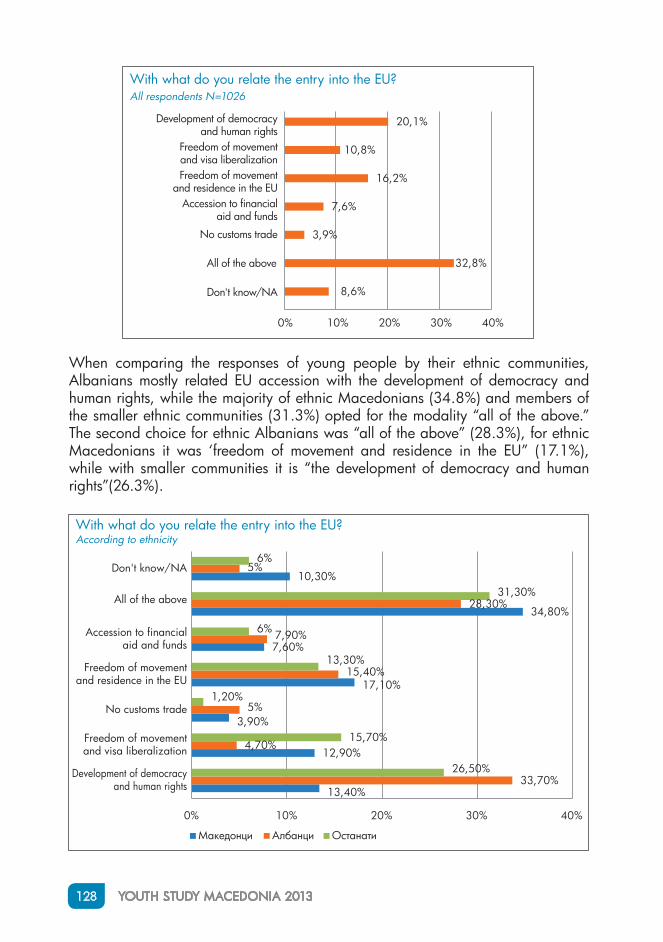
128 YOUTH STUDY MACEDONIA 2013
When comparing the responses of young people by their ethnic communities, Albanians mostly related EU accession with the development of democracy and human rights, while the majority of ethnic Macedonians (34.8%) and members of the smaller ethnic communities (31.3%) opted for the modality “all of the above.” The second choice for ethnic Albanians was “all of the above” (28.3%), for ethnic Macedonians it was ‘freedom of movement and residence in the EU” (17.1%), while with smaller communities it is “the development of democracy and human rights”(26.3%).
8,6%
32,8%
3,9%
7,6%
16,2%
10,8%
20,1%
0% 10% 20% 30% 40%
Don't know/NA
All of the above
No customs trade
Accession to financial aid and funds
Freedom of movement and residence in the EU
Freedom of movement and visa liberalization
Development of democracy and human rights
All respondents N=1026With what do you relate the entry into the EU?
13,40%
12,90%
3,90%
17,10%
7,60%
34,80%
10,30%
33,70%
4,70%
5%
15,40%
7,90%
28,30%
5%
26,50%
15,70%
1,20%
13,30%
6%
31,30%
6%
0% 10% 20% 30% 40%
Development of democracy and human rights
Freedom of movement and visa liberalization
No customs trade
Freedom of movement and residence in the EU
Accession to financial aid and funds
Don't know/NA
ОстанатиАлбанци Македонци
With what do you relate the entry into the EU?According to ethnicity
All of the above
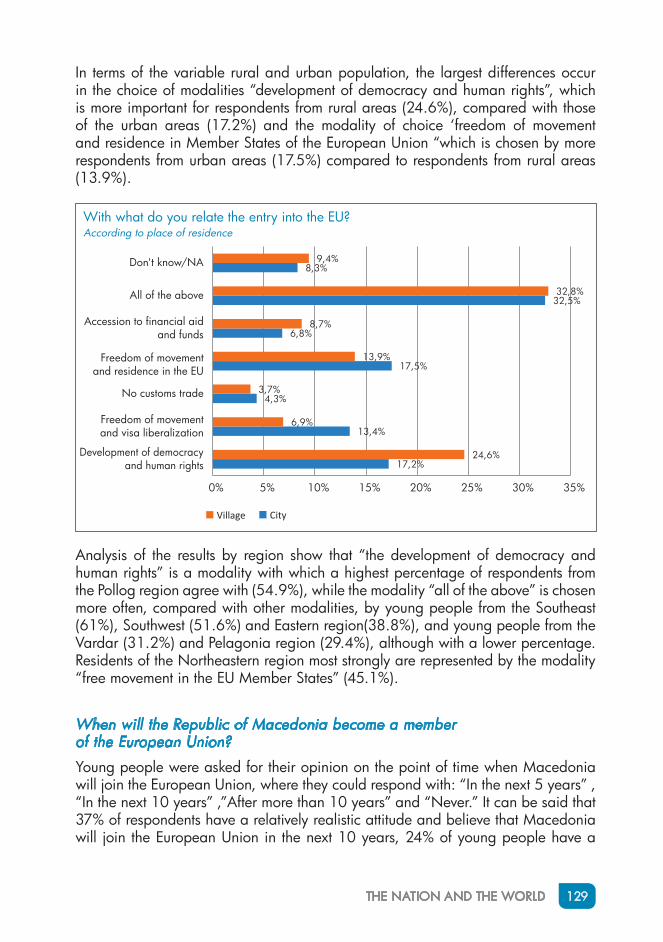
THE NATION AND THE WORLD 129
In terms of the variable rural and urban population, the largest differences occur in the choice of modalities “development of democracy and human rights”, which is more important for respondents from rural areas (24.6%), compared with those of the urban areas (17.2%) and the modality of choice ‘freedom of movement and residence in Member States of the European Union “which is chosen by more respondents from urban areas (17.5%) compared to respondents from rural areas (13.9%).
17,2%
13,4%
4,3%
17,5%
6,8%
32,5%
8,3%
24,6%
6,9%
3,7%
13,9%
8,7%
32,8%
9,4%
0% 5% 10% 15% 20% 25% 30% 35%
Development of democracy and human rights
Freedom of movement and visa liberalization
No customs trade
Freedom of movement and residence in the EU
Accession to financial aid and funds
All of the above
Don't know/NA
Village City
With what do you relate the entry into the EU?According to place of residence
Analysis of the results by region show that “the development of democracy and human rights” is a modality with which a highest percentage of respondents from the Pollog region agree with (54.9%), while the modality “all of the above” is chosen more often, compared with other modalities, by young people from the Southeast (61%), Southwest (51.6%) and Eastern region(38.8%), and young people from the Vardar (31.2%) and Pelagonia region (29.4%), although with a lower percentage. Residents of the Northeastern region most strongly are represented by the modality “free movement in the EU Member States” (45.1%).
When will the Republic of Macedonia become a member of the European Union?
Young people were asked for their opinion on the point of time when Macedonia will join the European Union, where they could respond with: “In the next 5 years” , “In the next 10 years” ,”After more than 10 years” and “Never.” It can be said that 37% of respondents have a relatively realistic attitude and believe that Macedonia will join the European Union in the next 10 years, 24% of young people have a

130 YOUTH STUDY MACEDONIA 2013
pessimistic attitude and believe that it will take more than 10 years, while 12% think it will never happen. On this question, 17% of respondents are optimistic and believe that Macedonia will become a EU member in the next 5 years.
17%
37%24%
12%
10%
In the next 5 years
In the next 10 years
More than 10 years
Never
When will the Republic of Macedonia become a member of the EU?All respondents N=1026
Statistically significant differences were observed in the case of ethnicity, place of residence and regions. Surprisingly, ethnic Macedonians are more optimistic and in a higher percentage compared with other ethnic communities in the Republic of Macedonia, and 18.8% said it would happen in the next 5 years. The majority of respondents of the Albanian ethnic community said it would happen in the next 10 years (40.4%) or more than 10 years (34.3%). About 15% of the ethnic Macedonians respondents and respondents from smaller communities, however, said it would never happen, compared with only 2.9% of Albanians.
18,8%
15,2%
13,8%
36,7%
40,4%
36,2%
19,4%
34,3%
20,0%
14,9%
2,9%
15,0%
10,2%
7,2%
15,0%
0% 20% 40% 60% 80% 100%
Macedonian
Albanian
Other
In the next 5 years
In the next 10 years
More than 10 years
Never
Don't know/NA
When will the Republic of Macedonia become a member of the EU?According to ethnicity
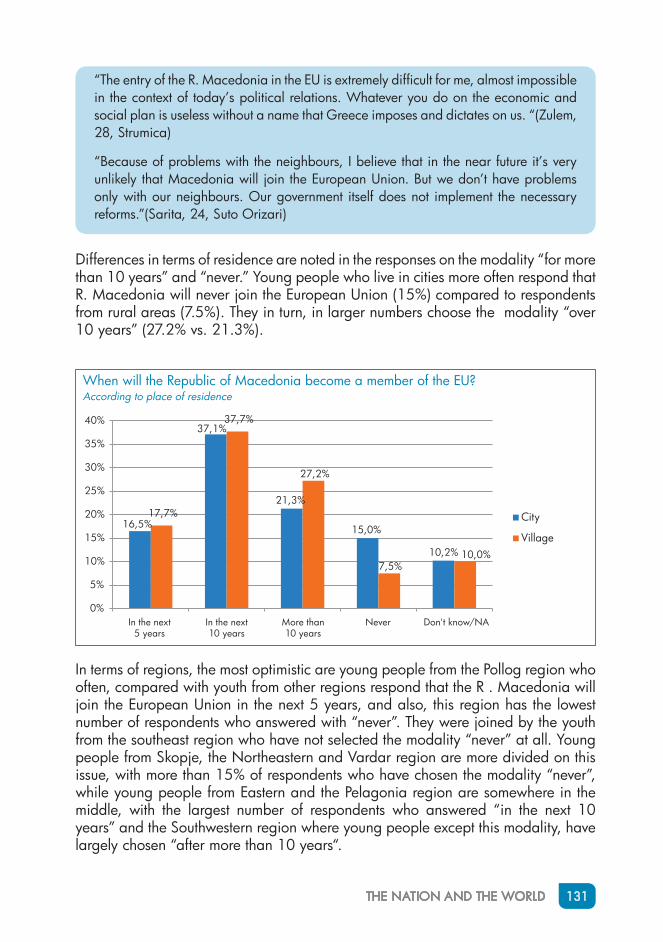
THE NATION AND THE WORLD 131
“The entry of the R. Macedonia in the EU is extremely difficult for me, almost impossible in the context of today’s political relations. Whatever you do on the economic and social plan is useless without a name that Greece imposes and dictates on us. “(Zulem, 28, Strumica)
“Because of problems with the neighbours, I believe that in the near future it’s very unlikely that Macedonia will join the European Union. But we don’t have problems only with our neighbours. Our government itself does not implement the necessary reforms.”(Sarita, 24, Suto Orizari)
Differences in terms of residence are noted in the responses on the modality “for more than 10 years” and “never.” Young people who live in cities more often respond that R. Macedonia will never join the European Union (15%) compared to respondents from rural areas (7.5%). They in turn, in larger numbers choose the modality “over 10 years” (27.2% vs. 21.3%).
16,5%
37,1%
21,3%
15,0%
10,2%
17,7%
37,7%
27,2%
7,5%10,0%
0%
5%
10%
15%
20%
25%
30%
35%
40%
In the next5 years
In the next10 years
More than10 years
Never Don't know/NA
City
Village
When will the Republic of Macedonia become a member of the EU?According to place of residence
In terms of regions, the most optimistic are young people from the Pollog region who often, compared with youth from other regions respond that the R . Macedonia will join the European Union in the next 5 years, and also, this region has the lowest number of respondents who answered with “never”. They were joined by the youth from the southeast region who have not selected the modality “never” at all. Young people from Skopje, the Northeastern and Vardar region are more divided on this issue, with more than 15% of respondents who have chosen the modality “never”, while young people from Eastern and the Pelagonia region are somewhere in the middle, with the largest number of respondents who answered “in the next 10 years” and the Southwestern region where young people except this modality, have largely chosen “after more than 10 years“.
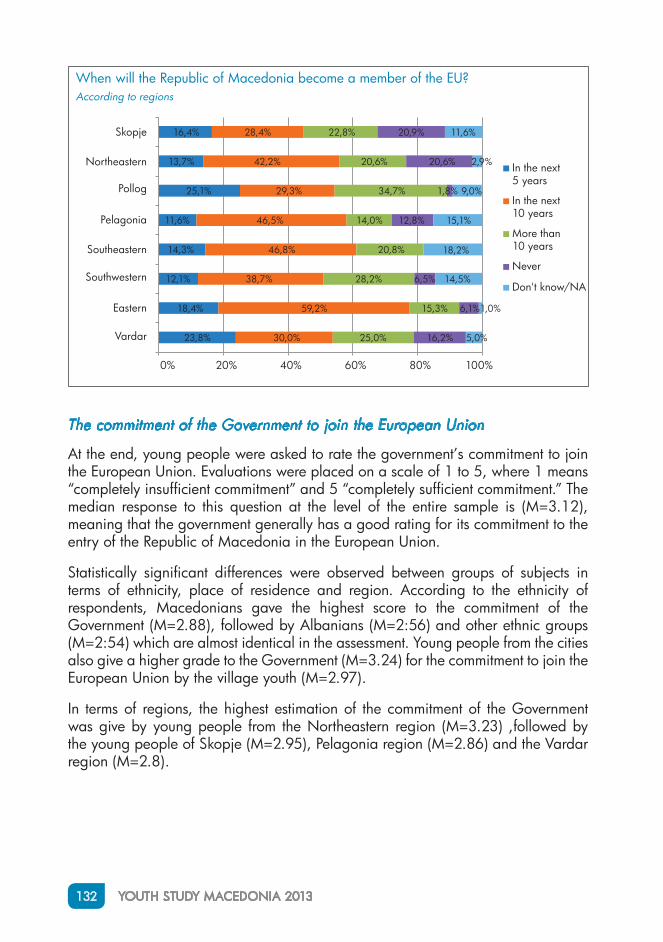
132 YOUTH STUDY MACEDONIA 2013
The commitment of the Government to join the European Union
At the end, young people were asked to rate the government’s commitment to join the European Union. Evaluations were placed on a scale of 1 to 5, where 1 means “completely insufficient commitment” and 5 “completely sufficient commitment.” The median response to this question at the level of the entire sample is (M=3.12), meaning that the government generally has a good rating for its commitment to the entry of the Republic of Macedonia in the European Union.
Statistically significant differences were observed between groups of subjects in terms of ethnicity, place of residence and region. According to the ethnicity of respondents, Macedonians gave the highest score to the commitment of the Government (M=2.88), followed by Albanians (M=2:56) and other ethnic groups (M=2:54) which are almost identical in the assessment. Young people from the cities also give a higher grade to the Government (M=3.24) for the commitment to join the European Union by the village youth (M=2.97).
In terms of regions, the highest estimation of the commitment of the Government was give by young people from the Northeastern region (M=3.23) ,followed by the young people of Skopje (M=2.95), Pelagonia region (M=2.86) and the Vardar region (M=2.8).
When will the Republic of Macedonia become a member of the EU?According to regions
23,8%
18,4%
12,1%
14,3%
11,6%
25,1%
13,7%
16,4%
30,0%
59,2%
38,7%
46,8%
46,5%
29,3%
42,2%
28,4%
25,0%
15,3%
28,2%
20,8%
14,0%
34,7%
20,6%
22,8%
16,2%
6,1%
6,5%
12,8%
1,8%
20,6%
20,9%
5,0%
1,0%
14,5%
18,2%
15,1%
9,0%
2,9%
11,6%
0% 20% 40% 60% 80% 100%
Pelagonia
Southeastern
Southwestern
Eastern
Vardar
Pollog
Skopje
Northeastern In the next5 years
In the next10 years
More than10 years
Never
Don't know/NA
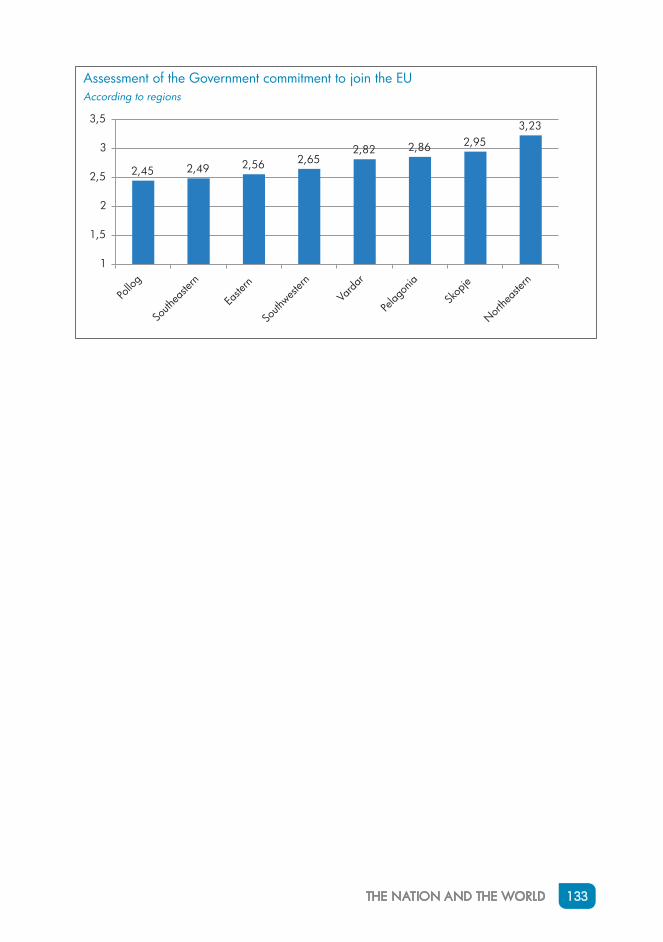
THE NATION AND THE WORLD 133
2,45 2,49 2,56 2,652,82 2,86 2,95
3,23
1
1,5
2
2,5
3
3,5
Assessment of the Government commitment to join the EUAccording to regions
Pollo
g
South
easte
rn
Easte
rn
South
wester
n
Varda
r
Pelag
onia
Skop
je
Northe
aster
n
134 YOUTH STUDY MACEDONIA 2013
CONCLUSIONS
•• The question “Should Macedonia join the European Union,” had a positive response by 73% of young people in the Republic of Macedonia, 21% said no, while a low percentage (6%) said they did not know or had no answer.
•• The vast majority of young people in the Republic of Macedonia give positive qualifications to the effects of eventual entry into the European Union: 59% believe that joining the EU would bring economic and political prosperity, 14% it would bring economic prosperity, and 3% think that EU accession will bring political prosperity. 6% of respondents believe that the membership of the Republic of Macedonia will bring political problems, or it would bring economic and political problems. 12% of respondents do not expect anything to change with the accession of the Macedonia in the European Union.
•• Entry in the EU, is connected with the development of democracy and human rights by 20% of the respondents in the study, 16.2% with freedom of movement and residence in Member States of the EU, 10.8% with freedom of movement and visa liberalization 7.6% with access to financial assistance, only 3.9% associate EU entry with free trade. About a third of young people see the accession to the European Union as beneficial in several aspects, i.e. for them it is important for all of the modalities. 8.6% of respondents responded that they do not know, or do not want to answer this question.
•• 37% of respondents have a somewhat realistic attitude and believe that Macedonia will join the European Union in the next 10 years, 24% of young people have a pessimistic attitude and believe that it will take more than 10 years, while 12% believe it will never happen. While 17% of the respondents are optimistic on this issue and believe that Macedonia will become an EU member in the next 5 years.