qfd integrated value stream mapping: an enabler of lean manufacturing
TRANSCRIPT
Int. J. Productivity and Quality Management, Vol. 7, No. 4, 2011 501
Copyright © 2011 Inderscience Enterprises Ltd.
QFD integrated value stream mapping: an enabler of lean manufacturing
R. Mohanraj* and M. Sakthivel Department of Mechanical Engineering, Anna University of Technology, Coimbatore 641047, Tamil Nadu, India E-mail: [email protected] E-mail: [email protected] *Corresponding author
S. Vinodh Department of Production Engineering, National Institute of Technology, Tiruchirappalli 620015, Tamil Nadu, India E-mail: [email protected]
Abstract: Lean manufacturing is a manufacturing philosophy which focuses on elimination of wastes and enables process streamlining. Value stream mapping (VSM) is a lean manufacturing technique that is capable of tracking wastes, thereby streamlining the processes. However, the framework of VSM does not enable the systematic identification of wastes as well as the techniques to eliminate them. In this context, this paper presents a study in which quality function deployment (QFD) technique has been used for scientific prioritisation of wastes and techniques for waste elimination. This paper is exemplified with a case study conducted in an Indian pump manufacturing organisation.
Keywords: lean manufacturing; value stream mapping; quality function deployment; waste elimination.
Reference to this paper should be made as follows: Mohanraj, R., Sakthivel, M. and Vinodh, S. (2011) ‘QFD integrated value stream mapping: an enabler of lean manufacturing’, Int. J. Productivity and Quality Management,Vol. 7, No. 4, pp.501–522.
Biographical notes: R. Mohanraj is a Research Scholar in Mechanical Engineering Department at Anna University of Technology, Coimbatore, Tamil Nadu. He holds Master’s degree in Production Engineering and Bachelor’s degree in Mechanical Engineering. His research interests include lean manufacturing and total quality management.
M. Sakthivel is an Assistant Professor in Mechanical Engineering Department at Anna University of Technology, Coimbatore, Tamil Nadu. He holds PhD in Mechanical Engineering, Master’s degree in Industrial Engineering and
502 R. Mohanraj, M. Sakthivel and S. Vinodh
Bachelor’s degree in Mechanical Engineering. He has published ten papers in international journals and 20 papers in the proceedings of the leading national and international conferences. His research interests include quality information systems and total quality management.
S. Vinodh is an Assistant Professor in Production Engineering Department at National Institute of Technology, Tiruchirappalli, Tamil Nadu. He holds PhD in Mechanical Engineering, Master’s degree in Production Engineering and Bachelor’s degree in Mechanical Engineering. He was a gold medallist in his undergraduate study. He has been awarded National Doctoral Fellowship for pursuing research by AICTE, New Delhi. He has published 25 papers in international journals and 40 papers in the proceedings of the leading national and international conferences. His research interests include agile manufacturing, sustainable manufacturing, lean production systems, CAD/CAM/CAE, rapid prototyping and total quality management.
1 Introduction
Increasing competition has been forcing the manufacturing organisations to transform their pattern of manufacturing. Manufacturing system transformation becomes a necessity to overcome increased competition (Gadalla, 2010). Lean manufacturing is one such system which is focused on the elimination of wastes, thereby streamlining the processes (Abdulmalek and Rajagopal, 2007). In this ever-competitive business environment, the company that can deliver a product that can thoroughly satisfy the manufacturing outputs will attain the most market share (Zakuan and Saman, 2009). Lean manufacturing system is defined as integrated manufacturing system focused to maximise capacity and minimise buffer inventories through the minimisation of system variability. Lean manufacturing is a plethora of principles that focus on cost reduction by identifying and eliminating non-value added activities. Industries are still struggling to implement lean principles and philosophies (Singh et al., 2010). Seven wastes considered in lean system include over production, over processing, waiting, defects transportation, inventory and storage. The tools/techniques of lean manufacturing include 5S, value stream mapping (VSM), kanban, kaizen, total productive maintenance, cellular manufacturing, pull production and visual controls.
VSM emerged as the preferred way to support and implement the lean approach. VSM is a helpful tool to identify the waste and improvement areas. VSM enables a company to see the entire process in both its current and its desired future state and develop the roadmap that prioritises the projects or tasks to bridge the gap between the current state and the future lean state (Grewal, 2008). VSM is one of the powerful lean tools which are focused on reorganising the manufacturing system from the lean perspective. VSM is a vital technique for achieving streamlined production in manufacturing organisations (Lummus et al., 2006). Although VSM streamlines the manufacturing process, it does not contain scientific framework for identification of tools/techniques enabling waste elimination. In this context, this paper presents a study in which quality function deployment (QFD) technique has been used for scientific prioritisation of wastes and the identification of techniques to eliminate them. The results of the study indicate that the integration of QFD in VSM framework enables the achievement of leanness in an Indian pump manufacturing organisation.

QFD integrated value stream mapping: an enabler of lean manufacturing 503
2 Literature review
2.1 Literature review on VSM
Hines and Rich (1997) have applied the seven VSM tools for waste elimination in Toyota Production System. They have also used Value Stream Analysis Tool for enabling the selection of effective VSM tools. Hines et al. (1999) have applied VSM for the development of a supplier network around a prominent distributor of electronic, electrical and mechanical components. Sullivan et al. (2002) have provided a roadmap as to how VSM can provide necessary information for the analysis of equipment replacement decision problems encountered in lean manufacturing implementation. McDonald et al.(2002) have presented an application of VSM enhanced by simulation to a dedicated production line of a manufacturing industry. Huang and Liu (2005) have presented a novel approach using VSM to lean control for Taiwan-funded enterprise in mainland China. Kocakulah and Upson (2005) have presented the implementation aspects of a computerised physician order entry system of a healthcare industry which has been evaluated using VSM techniques. Lummus et al. (2006) have reported a VSM project in a small medical clinic that has resulted in lower patient wait time and increased patient throughput, thereby improving quality. Abdulmalek and Rajagopal (2007) have described a case where VSM and other lean principles are adopted for the process sector for application at a large integrated steel mill. Esain (2000) has used VSM benchmarking technique across a supply chain in the automotive sector. Bandarian (2008) has described about exploiting value chain process concepts in research organisations to present a framework for the sequence of work in a chain manner at research organisations. This new approach is an idea-to-market process, which is considered more in strategic literature when studying research organisations. The work clarified the goals of the value chain, and it identifies the managerial actions that improve the value chain performance in terms of the desired goals. Lasa et al. (2008) have proved that VSM is a suitable tool for redesigning the production system based on the conduct of the case study. Gibbons (2008) has presented the introduction of a lean resource mapping framework. The work details the extant lean theoretical framework can be further developed, overcoming the flexibility, responsiveness, dehumanising and contingency criticisms by operationalising a more holistic and dynamic triangulated framework inclusive of qualitative waste analysis, complementary to the extant quantitative data from VSM. Sawhney et al. (2009) have developed a value stream map to evaluate breakdown maintenance operations. This work on maintenance management has found new vigour and purpose to increase equipment capacity and capability due to increasing focus on lean manufacturing. The case study has been focused on the improvement of production systems for the manufacture of plastic casing on mobile phones. They have derived the various proposals for the improvement of the manufacturing system of the case company. They have developed the seven VSM tools for specific applications in a distribution industry.
2.2 Literature review on QFD applications
Dr Yoji Akao is regarded as the father of QFD who has contributed a widely used definition of QFD. QFD provides the means for translating the consumer needs to appropriate technical requirements for each stage of a product/process development cycle (Akao and Mazur, 2003). It helps in the development of customer friendly and
504 R. Mohanraj, M. Sakthivel and S. Vinodh
high-quality products. QFD is an excellent management tool that enables the teams to focus on the needs of the customers for enabling product design. QFD has been used in the industry for the past two decades. QFD emphasises quality in design process to prevent the defects at early stages, thereby reducing cost and improving productivity. Other benefits of QFD include reduced design changes, increased market share and improved product quality (Akao and Mazur, 2003; Chan and Wu, 2002). Researchers have reported the limitations of QFD, some of them are narrated as follows: QFD is a complicated process, which requires the expertise of qualified professionals to develop a house of quality (HOQ) (Olhager and West, 2002). In QFD process, there is no provision to incorporate the opinions and preferences of all levels of employees (Dijkstra and van der Bij, 2002). There also exists problem in the decomposition of tables separately from HOQ. Sharma et al. (2010) have analysed programming tools for the development of QFD software. This work attempted to explore the various available programming languages, analyse them and pick a suitable one for the QFD software automation. Along with an insight into traditional QFD, this work also explores QFD from the software automation perspective. Nikhil et al. (2010) have reported the modelling customer satisfaction using QFD which details customer satisfaction is of paramount importance in research due to rapidly increasing customer demands and the usage of internet and the computerised models. Oke et al. (2009) presented the application of QFD and value analysis tools in design of an automobile which reported significant improvement in manufacturing cost. Waterworth and Eldridge (2010) reported an investigation into the application of QFD in e-commerce. This study had developed ultimately demonstrating how organisations can adapt traditional quality management tools to measure quality and guide improvement efforts in an e-commerce environment. Kabeil (2010) has described an analytical hierarchy process (AHP)–QFD approach to develop decision support system for crisis management which includes a framework based on the AHP and QFD technique; QFD is used for defining and assigning relative weights for design components that support the defined requirements. Xu et al. (2010) have made a comprehensive review on recent developments in QFD. This work aims to provide a more balanced review of QFD that exhibits enough depth to be useful to researchers, as well as enough breadth to cater for amateur readers. This paper reviewed methodologies that include fuzzy set theory, multicriteria decision analysis model, artificial neural network and hybrid approaches. Resource allocation, Kano’s model, failure mode and effects analysis, robust design and an assortment of other recently developed tools are reviewed.
2.3 Research gap
Based on the literature review, it has been found that there has been no concrete research reported on the integration of QFD with VSM framework for enabling leanness.
3 Objective of the study and hypothesis
The objective of the study is to integrate QFD in VSM framework to enable the achievement of leanness. The hypothesis set is that how to introduce QFD technique in VSM framework for scientific prioritisation of wastes and the identification of techniques to eliminate them.
QFD integrated value stream mapping: an enabler of lean manufacturing 505
4 Research methodology
The research begins with the literature review on VSM and QFD. Then the research gap has been identified as the lack of method for scientific prioritisation of wastes and the identification of techniques to eliminate wastes in VSM (Vinodh and Chintha, 2010). Next, QFD has been identified as the suitable technique to be inducted to fulfil this gap. A suitable manufacturing organisation has been identified to conduct the study. The manufacturing process followed by the organisation has been studied. This is followed by the development of current state map, QFD application for prioritising the wastes, as well as the techniques for waste elimination and development of future state map.
5 Concept of QFD integration into VSM
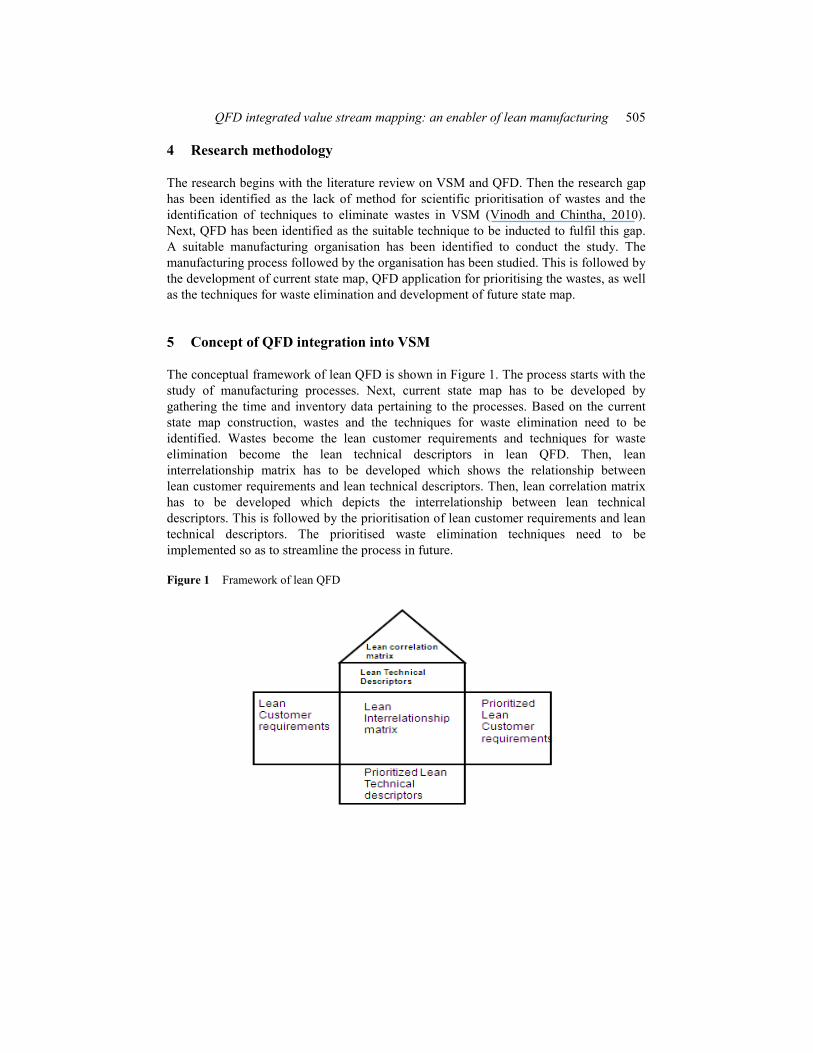
The conceptual framework of lean QFD is shown in Figure 1. The process starts with the study of manufacturing processes. Next, current state map has to be developed by gathering the time and inventory data pertaining to the processes. Based on the current state map construction, wastes and the techniques for waste elimination need to be identified. Wastes become the lean customer requirements and techniques for waste elimination become the lean technical descriptors in lean QFD. Then, lean interrelationship matrix has to be developed which shows the relationship between lean customer requirements and lean technical descriptors. Then, lean correlation matrix has to be developed which depicts the interrelationship between lean technical descriptors. This is followed by the prioritisation of lean customer requirements and lean technical descriptors. The prioritised waste elimination techniques need to be implemented so as to streamline the process in future.
Figure 1 Framework of lean QFD
506 R. Mohanraj, M. Sakthivel and S. Vinodh
6 Case study
The details of the case study are presented in the following subsections.
6.1 About the company
The case study has been carried out in a pump manufacturing organisation, Mayur Industry, Coimbatore, Tamil Nadu, India. It is one of the premier and pioneer pump manufacturing industries. The organisation manufactures pumps for agriculture and domestic needs. The products manufactured by the company includes submersible pumps, centrifugal pumps, etc. such as bore well pump, jet pump, domestic/mini mono block, open well submersible mono block, industrial motors, bore well compressor pumps, power loom motors, shallow well pumps. There existed a need for the managers of the case organisation to identify a method for scientific prioritisation of wastes and the identification of techniques to eliminate wastes in VSM. In this context, the authors discussed with the managers of the case organisation to conduct the study.
6.2 Current state map
Current state map is a snapshot of the existing processes based on which the improvement areas need to be identified. The case study is carried out for the component pump casing, which is one of vital parts in the pump.
6.2.1 Production time calculation
The production time calculations are presented as follows:
Available production time: 8.5 hr × 60 min = 510 min
Two 10-min breaks = 20 min
One 30-min lunch break = 30 min
Actual available production time = (510 50) = 460 min
= 460 × 60 = 27,600 sec
The total of 27,600 sec is the actual available production time to produce the products what the customer demands.
6.2.2 Takt time
Takt time is the rate at which a company must produce a product to satisfy customer demand.
Takt time calculation for pump casing: Takt time = available production time/total daily quantity required = 460/75 Takt time = 6 .13 min/piece
6.2.3 Pitch
Pitch = takt time × pack-out quantity = 6.13 × 5 = 30.666 min = 1,840 sec.
QFD integrated value stream mapping: an enabler of lean manufacturing 507
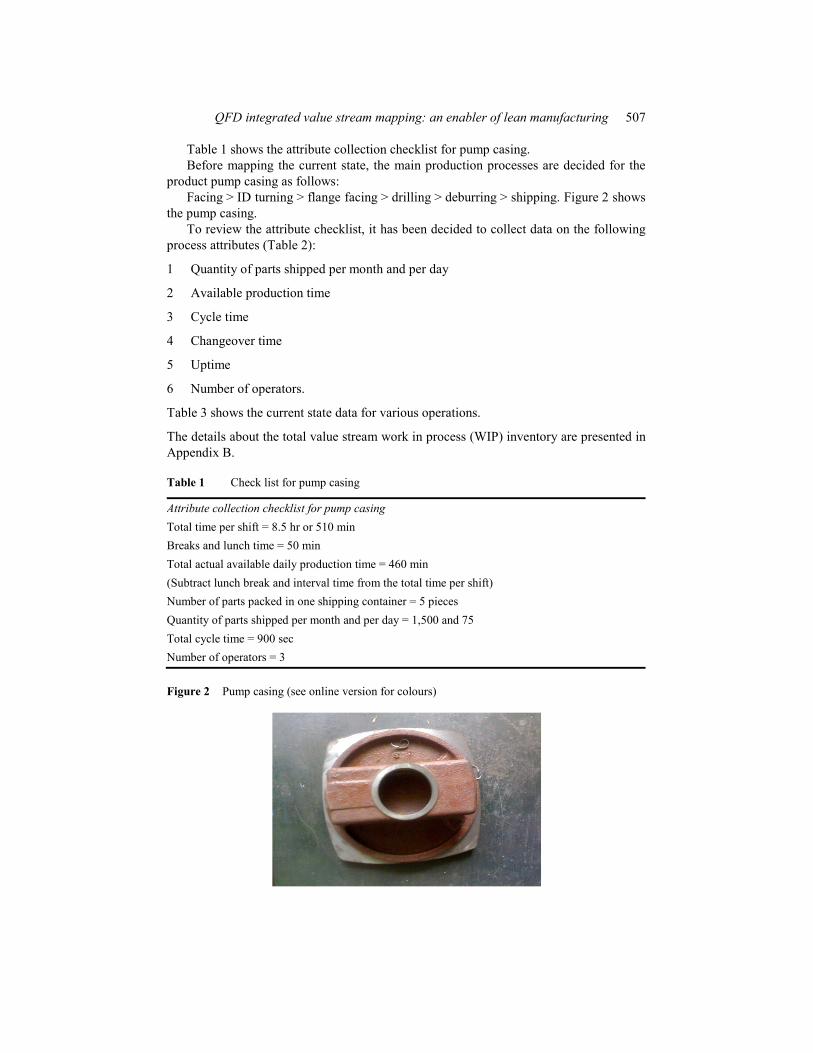
Table 1 shows the attribute collection checklist for pump casing. Before mapping the current state, the main production processes are decided for the
product pump casing as follows: Facing > ID turning > flange facing > drilling > deburring > shipping. Figure 2 shows
the pump casing. To review the attribute checklist, it has been decided to collect data on the following
process attributes (Table 2):
1 Quantity of parts shipped per month and per day
2 Available production time
3 Cycle time
4 Changeover time
5 Uptime
6 Number of operators.
Table 3 shows the current state data for various operations.
The details about the total value stream work in process (WIP) inventory are presented in Appendix B.
Table 1 Check list for pump casing
Attribute collection checklist for pump casing Total time per shift = 8.5 hr or 510 min Breaks and lunch time = 50 min Total actual available daily production time = 460 min (Subtract lunch break and interval time from the total time per shift) Number of parts packed in one shipping container = 5 pieces Quantity of parts shipped per month and per day = 1,500 and 75 Total cycle time = 900 sec Number of operators = 3
Figure 2 Pump casing (see online version for colours)

508 R. Mohanraj, M. Sakthivel and S. Vinodh
Table 2 Data collection for pump casing (Figure 3)
Current state data collection sheet for pump casingCustomer requirements: 1 Average demand: 1,500 units per month, i.e. 75 units per day 2 Shipping month: 20 days 3 Units per container: 5 4 Container per day: 15 Supplier information: The organisation receives a weekly shipment of 550 units from its supplier The details of process attributes are presented in Appendix A
Table 3 Current state data
Faci
ng
Idtu
rnin
g
Flan
ge
faci
ng
Dri
lling
Deb
urri
ng
Cycle time (sec) 300 300 150 120 30 Changeover (sec) 150 150 100 80 0 Operators 1 1 0 1 0 Uptime (%) 99.4 99.4 99.6 99.7 100 Availability (sec) 27,600 27,600 27,600 27,600 27,600
Figure 3 Current state map for pump casing
QFD integrated value stream mapping: an enabler of lean manufacturing 509
6.3 Lean QFD
QFD is a technique used for translating the customer demands into design targets and major quality assurance points to be used through the production phase. In our study, QFD has been used for prioritising the wastes as well as the techniques to eliminate them.
The major steps include the following:
1 Identification of wastes.
2 Identification of techniques for waste elimination.
3 Development of relationship matrix.
4 Development of correlation matrix.
5 Prioritisation of wastes.
6 Prioritisation of waste elimination technique.
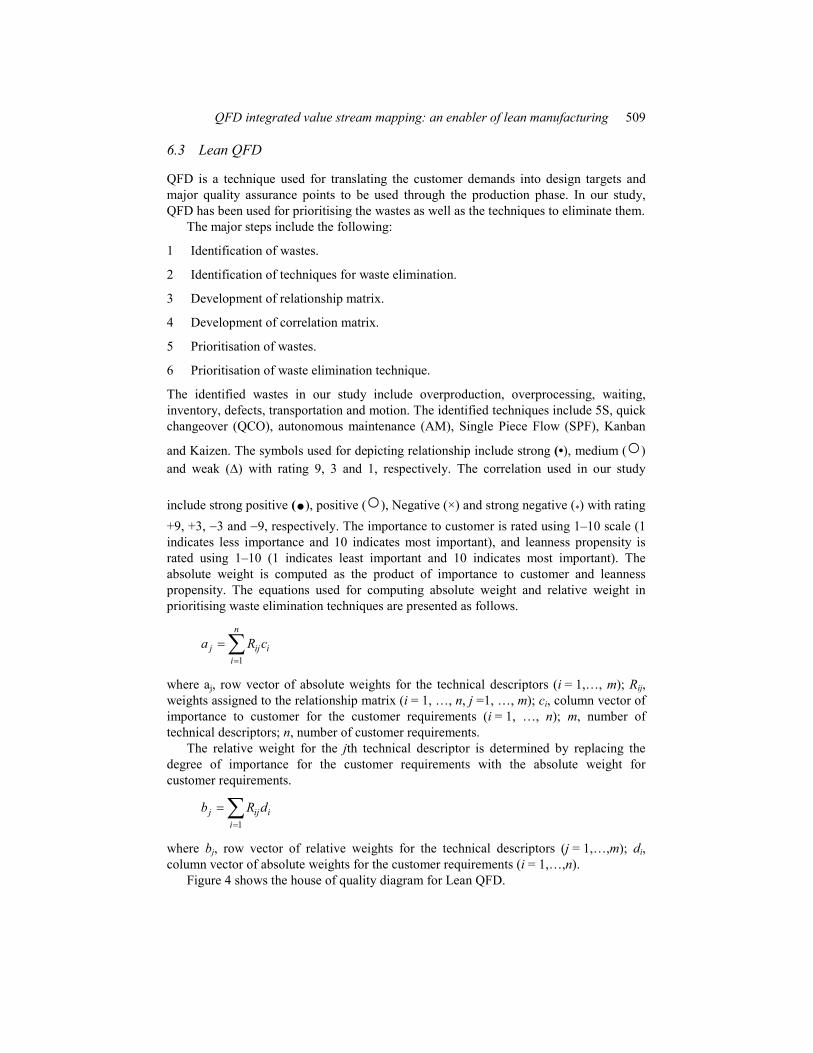
The identified wastes in our study include overproduction, overprocessing, waiting, inventory, defects, transportation and motion. The identified techniques include 5S, quick changeover (QCO), autonomous maintenance (AM), Single Piece Flow (SPF), Kanban
and Kaizen. The symbols used for depicting relationship include strong (•), medium ( )and weak ( ) with rating 9, 3 and 1, respectively. The correlation used in our study
include strong positive (.), positive ( ), Negative (×) and strong negative (*) with rating +9, +3, 3 and 9, respectively. The importance to customer is rated using 1–10 scale (1 indicates less importance and 10 indicates most important), and leanness propensity is rated using 1–10 (1 indicates least important and 10 indicates most important). The absolute weight is computed as the product of importance to customer and leanness propensity. The equations used for computing absolute weight and relative weight in prioritising waste elimination techniques are presented as follows.
1
n
j ij ii
a R c
where aj, row vector of absolute weights for the technical descriptors (i = 1,…, m); Rij,weights assigned to the relationship matrix (i = 1, …, n, j =1, …, m); ci, column vector of importance to customer for the customer requirements (i = 1, …, n); m, number of technical descriptors; n, number of customer requirements.
The relative weight for the jth technical descriptor is determined by replacing the degree of importance for the customer requirements with the absolute weight for customer requirements.
1j ij i
i
b R d
where bj, row vector of relative weights for the technical descriptors (j = 1,…,m); di,column vector of absolute weights for the customer requirements (i = 1,…,n).
Figure 4 shows the house of quality diagram for Lean QFD.
510 R. Mohanraj, M. Sakthivel and S. Vinodh
The highly prioritised wastes include inventory and waiting. The prioritised techniques include ‘kanban’ and ‘SPF’.
6.4 Development of future state map
The identified techniques for waste elimination will be incorporated in the future state map. The future state map enables the identification of improvement proposals for eliminating wastes, thereby streamlining the processes.
Operator balance chart for current state:
Total cycle time = 900 sec, takt time = 368 sec and three operators.
Figure 5 shows the cycle time for various operations.
300s 300s 150s 120s 30s
Figure 4 House of quality for lean QFD

QFD integrated value stream mapping: an enabler of lean manufacturing 511
Figure 5 Cycle time (see online version for colours)
Notes: F, facing; T, ID turning; FF, flange facing; DR, drilling; DB, deburring.
After reviewing the current state, discussion is made with operators and the production supervisor to set the total cycle time of 720 sec as a target for future state which is derived from total cycle time of 900 sec of current state. Only two operators are required to achieve this cycle time.
Number of operators 720 / 3681.95 i.e. 02 operators
The new target can be achieved by making the following changes:
1 improve the programming and tooling maintenance
2 distribute the work of five operations between two operators
3 reducing the changeover times in machining operations
4 rearrange the processes according to operators’ allocation.
It has been decided that the value stream must operate with two operators with a total cycle time of 720 sec.
The operator balance chart for the future state is shown in Figure 6.
Total cycle time = 720 sec
Takt time = 368 sec
Operators = 2
512 R. Mohanraj, M. Sakthivel and S. Vinodh
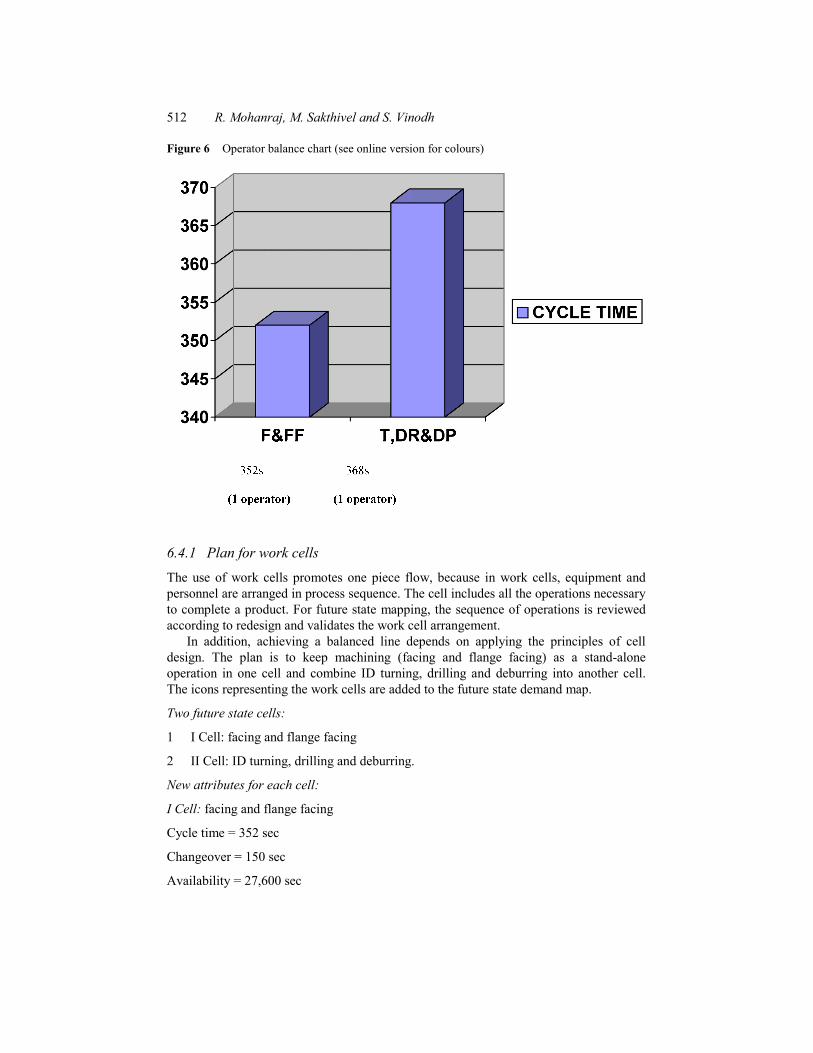
Figure 6 Operator balance chart (see online version for colours)
6.4.1 Plan for work cells
The use of work cells promotes one piece flow, because in work cells, equipment and personnel are arranged in process sequence. The cell includes all the operations necessary to complete a product. For future state mapping, the sequence of operations is reviewed according to redesign and validates the work cell arrangement.
In addition, achieving a balanced line depends on applying the principles of cell design. The plan is to keep machining (facing and flange facing) as a stand-alone operation in one cell and combine ID turning, drilling and deburring into another cell. The icons representing the work cells are added to the future state demand map.
Two future state cells:
1 I Cell: facing and flange facing
2 II Cell: ID turning, drilling and deburring.
New attributes for each cell:
I Cell: facing and flange facing
Cycle time = 352 sec
Changeover = 150 sec
Availability = 27,600 sec

QFD integrated value stream mapping: an enabler of lean manufacturing 513
Uptime = 99.4%
Operator = 1
II Cell: ID turning, drilling and deburring
Total cycle time = 368 sec
Changeover = <2 min
Availability = 27,600 sec
Uptime = 99.5%
Takt time = 368 sec
Operator = 1
Figure 7 depicts the future state map with all improvement proposals incorporated.
Figure 7 Future state map
514 R. Mohanraj, M. Sakthivel and S. Vinodh
7 Results and discussions
The integration of QFD in VSM framework enables the systematic identification of wastes and techniques for eliminating them. The prioritised wastes in our study include the following:
1 inventory
2 waiting
3 defects
4 transport.
The prioritised techniques for waste elimination include the following:
1 Kanban
2 SPF
3 QCO and
4 Kaizen.
The improvement techniques are being subjected to implementation in the case organisation. In order to minimise the raw material and work in progress inventory, kanban system is under design stage to ensure streamlining of processes.
7.1 Single piece flow
As plan to work towards the goal of achieving one-piece flow, the future state map should include the methods or tools that will improve flow. Some improvements necessary for achieving targets are identified. The list of the improvement methods will be necessary for creating and sustaining continuous flow.
1 5S, AM and QCO at facing and flange facing cell
2 QCO and AM at ID turning, drilling and deburring cell
3 5S at ID turning, drilling and deburring cell and shipping.
Focus on leveling the production
Leveling the production is evenly distributing the work required to fulfil customer demand over a shift or a day. If leveling the production is not carried out, some cells will fall behind in production causing idle time at downstream, while at other times, they may be waiting for work.
The facts which are determined earlier in the process of creating the future state are reviewed by the decision makers of the case organisation.
1 It will be necessary to create a kanban system.
2 The customer has requested a container size of 5 units per container.
3 The container can be reusable.
QFD integrated value stream mapping: an enabler of lean manufacturing 515
Pitch has not changed since it is calculated while focusing on demand, because takt time (368 sec) and container size of 5 (pack out quantity) have not changed.
Pitch 368 takt time 5 pack out quantity1,840 sec or 31 min
It means that every 31 min a container of 5 units must be packed and ready to ship.
7.2 Kanban
It has been decided that the value stream requires the following types of kanbans in the following locations:
1 Withdrawal kanbans indicate the material handler how many units to be pulled from the finished-goods supermarket and staged in shipping.
2 Production kanbans indicate operators in the turning, drilling and deburring cell how many units must be produced to fill up again those pulled from the finished-goods supermarket.
3 Signal kanbans at the in-process supermarket between facing, flange facing cell and turning/drilling/deburring cell that tell the machining operator how many units have been pulled from the supermarket.
4 Signal kanbans just upstream of machining indicate the supplier how many units have been pulled from raw material inventory.
7.2.1 Mapping of material and information flow
An operator from the turning/drilling/deburring – cell will be responsible for pulling required parts from the supermarket between that cell and facing and flange facing – cell. This is shown on the map by drawing a supermarket parts icon and a manual material pull icon between the supermarket icon and the turning/drilling/deburring – cell.
1 When the turning/drilling/deburring cell operator pulls machined parts from the in-process supermarket, the operator will also pull a signal kanban from the container and place it in a special holder on the side of the supermarket flow rack. The facing and flange – cell operator will retrieve signal kanbans when he delivers machined parts to the supermarket flow rack. To mark this activity draws a manual communication arrow and a signal kanban icon from supermarket icon to turning/drilling/deburring – cell icon. It draws a material push arrow running from the turning/drilling/deburring – cell icon to the in-process supermarket icon before facing and flange facing – cell.
2 The facing and flange facing operator will be responsible for pulling containers from the materials supermarket just upstream. To illustrate this plan, draw a manual material pull icon and a supermarket parts icon between the supermarket icon and the facing and flange facing – cell icon.
3 The facing and flange facing – cell operator will also be responsible for pulling signal kanbans from raw material containers and placing the signal kanbans on a special kanban post. The raw materials supplier truck driver will be responsible for

516 R. Mohanraj, M. Sakthivel and S. Vinodh
collecting the signal kanbans and taking them back to the supplier’s plant. To illustrate this part of the plan, draw a kanban post icon between the supermarket icon and the supplier truck icon. A manual communication arrow and a signal kanban icon are drawn running from the kanban post icon to the supplier icon.
7.3 Kaizen
It has been decided to use visual controls, or visual workplace, at the turning, drilling, deburring cell and the heijunka box. It adds these icons to the map along with lead times and total cycle time.
7.3.1 Creating kaizen plan While proceeding with the kaizen planning process, it is necessary to implement these steps: 1 Review the future state map and create a monthly kaizen plan.
2 Determine milestones for each major kaizen activity and create a kaizen milestone chart.
3 Complete the value stream management storyboard.
4 Obtain management approval for kaizen plans through catch ball.
7.3.2 Implementing kaizen plan
All the planning and preparation done so far should now allow to proceed to the implementation phase with enthusiasm and confidence. However, remember that when implementation begins in earnest, kaizen activities will have an impact on virtually everyone connected to the target value stream.
7.4 Improvement in lean performance measures
The performance measures of lean practices include productivity, quality, cost, delivery and flexibility (Anand and Kodali, 2009). The improvement in lean performance measures are gathered from the managers of the case organisation using a Likert’s scale of range 1–10 (1 indicates least improvement, 5 indicates medium improvement and 10 indicates significant improvement), and the average values are presented in Table 4. Table 4 Improvement in lean performance measures
Performance measures Level before the conduct of the study Level after the conduct of the study
Productivity 7.5 8.7 Quality 6.5 7.8 Cost 6.3 8.6 Delivery 6.5 7.9 Flexibility 6.7 8.6
QFD integrated value stream mapping: an enabler of lean manufacturing 517
7.5 Managerial implications
An orientation programme has to be conducted to the managers about the essence of the conduct of the study. Then a cross-functional team has to be formed with managers from different departments. Then the manufacturing processes pertaining to the assembly line has to be studied. This is followed by the development of current state map, introduction of lean QFD technique for scientific prioritisation of wastes and techniques to eliminate them and development of future state map. The management commitment, employee involvement and team work has to be ensured for achieving success.
8 Conclusions
Rapidly increasing competition has been forcing the emergence of modern manufacturing paradigms. This situation has stimulated the emergence of lean manufacturing where the focus is on waste elimination. VSM is one of the vital techniques used for streamlining the processes. This paper presents a case study in which QFD has been integrated into VSM framework for enabling the identification of wastes and the techniques to eliminate them. The unique contribution of the study is that it is a first attempt to introduce QFD framework for scientific prioritisation of wastes and techniques for eliminating them in VSM framework. The approach has been test implemented in an Indian pump manufacturing organisation. The result of the study indicates that the approach enabled the scientific implementation of lean manufacturing tools/techniques. The approach has been test implemented in a single pump manufacturing organisation. In future, more number of studies could be conducted across several pump manufacturing organisations as well as in other sectors to derive practical inferences.
Acknowledgements
The authors are thankful to the anonymous referees, whose constructive comments have been used to improve the presentation quality of this paper. The authors are equally thankful to Professor Angappa Gunasekaran, the editor of this journal, for his valuable suggestions during the review process.
References Abdulmalek, F.A. and Rajgopal, J. (2007) ‘Analyzing the benefits of lean manufacturing and value
stream mapping via simulation: a process sector case study’, Int. J. Production Economics,Vol. 107, No. 1, pp.223–236.
Akao, Y. and Mazur, G.A. (2003) ‘The leading edge in QFD: past, present and future’, Int. J. Quality & Reliability Management, Vol. 20, No. 1, pp.20–35.
Anand, G. and Kodali, R. (2009) ‘Selection of lean manufacturing systems using the analytic network process – a case study’, Journal of Manufacturing Technology Management, Vol. 20, No. 2, pp.258–289.
Bandarian, R. (2008) ‘Exploiting value chain process concepts in research organizations’, Int. J. Value Chain Management, Vol. 2, No. 3, pp.400–416.
518 R. Mohanraj, M. Sakthivel and S. Vinodh
Chan, L-K. and Wu, M-L. (2002) ‘Quality function deployment: a literature review’, European Journal of Operations Research, Vol. 143, No. 3, pp.463–497.
Dijkstra, L. and van der Bij, H. (2002) ‘Quality function deployment in health care methods for meeting customer requirements in redesign and renewal’, Int. J. Quality & Reliability Management, Vol. 19, No. 1, pp.67–89.
Esain, A. (2000) ‘Networks, benchmarking and development of the strategic supply base: a case study’, Int. J. Logistics Resource Application, Vol. 3, No. 2, pp.157–171.
Gadalla, M. (2010) ‘A conceptual framework to excogitate agile from lean transformation’, Int. J. Rapid Manufacturing, Vol. 1, No. 3, pp.308–322.
Gibbons, P.A. (2008) ‘Introducing a lean resource mapping framework’, Int. J. Six Sigma and Competitive Advantage, Vol. 4, No. 4, pp.355–381.
Grewal, C. (2008) ‘An initiative to implement lean manufacturing using value stream mapping in a small company’, Int. J. Manufacturing Technology and Management, Vol. 15, Nos. 3/4, pp.404–417.
Hines, P. and Rich, N. (1997) ‘The seven value stream mapping tools’, Int. J. Operations and Production Management, Vol. 17, No. 1, pp.46–64.
Hines, P., Rich, N. and Esain, A. (1999) ‘Value stream mapping – a distribution industry application’, Benchmarking International Journal, Vol. 6, No. 1, pp.60–77.
Huang, C.C. and Liu, S.H. (2005) ‘A novel approach to lean control for Taiwan-funded enterprises in mainland China’, Int. J. Production Research, Vol. 43, No. 12, pp.2553–2575.
Kabeil, M.M. (2010) ‘An AHP-QFD approach to developing DSS for crisis management’, Int. J. Management and Decision Making, Vol. 11, No. 1, pp.55–68.
Kocakulah, M.C. and Upson, J. (2005) ‘Cost analysis of computerized physician order entry using value stream analysis: a case study’, Resource Healthcare and Financial Management,Vol. 10, No. 1, pp.13–25.
Lasa, I.S., Laburu, C.O. and Vila, R.C. (2008) ‘An evaluation of the value stream mapping tool’, Business Process Management, Vol. 14, No. 1, pp.39–52.
Lummus, R.R., Vokurka, R.J. and Rodeghiero, B. (2006) ‘Improving quality through value stream mapping: a case study of a physician’s clinic’, Total Quality Management, Vol. 17, No. 8, pp.1063–1075.
McDonald, T., Aken, E.M.V. and Rentes, A.F. (2002) ‘Utilising simulation to enhance value stream mapping: a manufacturing case application’, Int. J. Logistics Research Application,Vol. 5, No. 2, pp.213–232.
Nikhil, C.S., Ameer, A. and Nafize, R.P. (2010) ‘Robust customer satisfaction model using QFD’, Int. J. Productivity and Quality Management, Vol. 6, No. 1, pp.112–136.
Oke, S.A., Onabajo, O.A., Oyekeye, M.O., Oluwo, A. and Adeoye, S.A. (2009) ‘Application of QFD and VA tools in the design of an automobile’, Int. J. Productivity and Quality Management, Vol. 4, No. 5/6, pp.525–548.
Olhager, J. and West, B.M. (2002) ‘The house of flexibility: using the QFD approach to deploy manufacturing flexibility’, Int. J. Operations and Production Management, Vol. 22, No. 1, pp.50–79.
Sawhney, R., Kannan, S. and Li, X. (2009) ‘Developing a value stream map to evaluate breakdown maintenance operations’, Int. J. Industrial and Systems Engineering, Vol. 4, No. 3, pp.229–240.
Sharma, A.K., Mehta, I.C. and Jitendra, R.S. (2010) ‘Analysing programming tools for the development of quality function deployment software’, Int. J. Information and Decision Sciences, Vol. 2, No. 2, pp.132–146.
Singh, B., Garg, S.K. and Sharma, S.K. (2010) ‘Scope for lean implementation: a survey of 127 Indian industries’, Int. J. Rapid Manufacturing, Vol. 1, No. 3, pp.323–333.

QFD integrated value stream mapping: an enabler of lean manufacturing 519
Sullivan, W.G., McDonald, T.N. and Aken, E.M.V. (2002) ‘Equipment replacement decisions and lean manufacturing’, Robotics and Computer Integrated Manufacturing, Vol. 18, No. 3, pp.255–265.
Vinodh, S. and Chintha, S.K. (2010) ‘Application of fuzzy QFD for enabling leanness in a manufacturing organisation’, Int. J. Production Research, Vol. 49, No. 6, pp.1627–1644, DOI: 10.1080/002075 40903568729.
Waterworth, A. and Eldridge, S. (2010) ‘An investigation into the application of QFD in e-commerce’, Int. J. Productivity and Quality Management, Vol. 5, No. 3, pp.231–251.
Xu, J., Xun, X. and Shane, Q.X. (2010) ‘A comprehensive review on recent developments in quality function deployment’, Int. J. Productivity and Quality Management, Vol. 6, No. 4, pp.457–494.
Zakuan, N. and Saman, M.Z. (2009) ‘Lean manufacturing concept: the main factor in improving manufacturing performance – a case study’, Int. J. Manufacturing Technology and Management, Vol. 17, No. 4, pp.353–363.
520 R. Mohanraj, M. Sakthivel and S. Vinodh
Appendix I
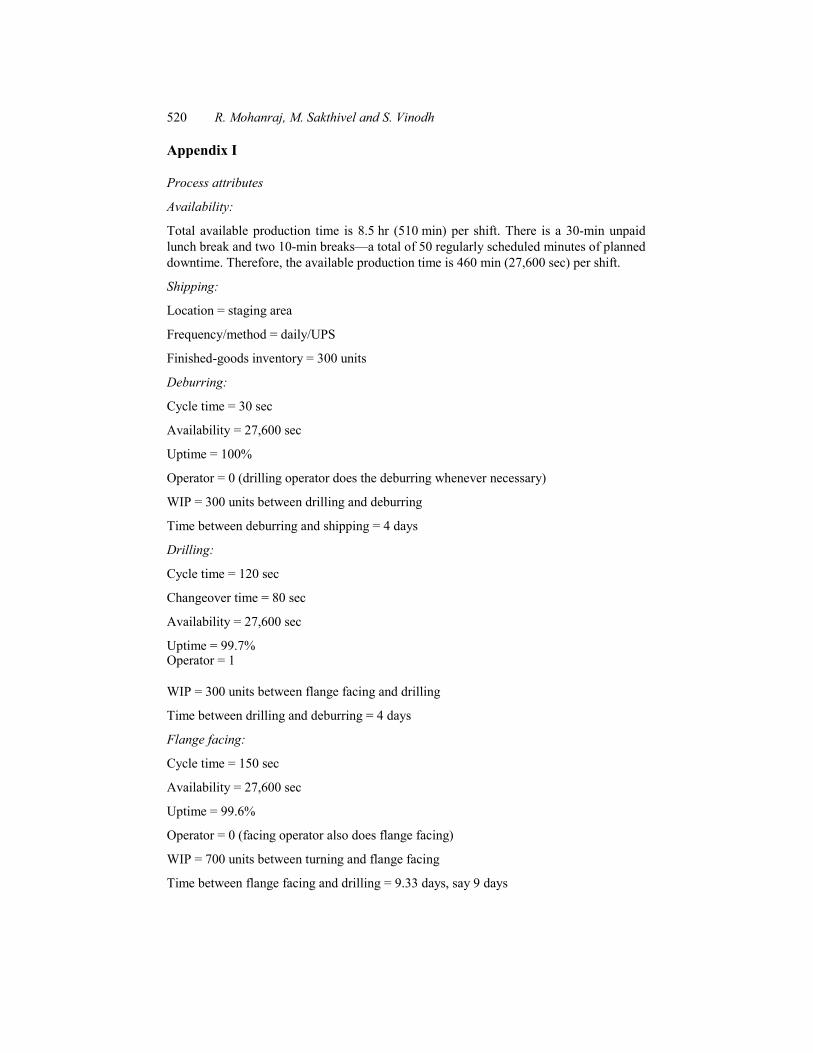
Process attributes
Availability:
Total available production time is 8.5 hr (510 min) per shift. There is a 30-min unpaid lunch break and two 10-min breaks—a total of 50 regularly scheduled minutes of planned downtime. Therefore, the available production time is 460 min (27,600 sec) per shift.
Shipping:
Location = staging area
Frequency/method = daily/UPS
Finished-goods inventory = 300 units
Deburring:
Cycle time = 30 sec
Availability = 27,600 sec
Uptime = 100%
Operator = 0 (drilling operator does the deburring whenever necessary)
WIP = 300 units between drilling and deburring
Time between deburring and shipping = 4 days
Drilling:
Cycle time = 120 sec
Changeover time = 80 sec
Availability = 27,600 sec
Uptime = 99.7% Operator = 1
WIP = 300 units between flange facing and drilling
Time between drilling and deburring = 4 days
Flange facing:
Cycle time = 150 sec
Availability = 27,600 sec
Uptime = 99.6%
Operator = 0 (facing operator also does flange facing)
WIP = 700 units between turning and flange facing
Time between flange facing and drilling = 9.33 days, say 9 days
QFD integrated value stream mapping: an enabler of lean manufacturing 521
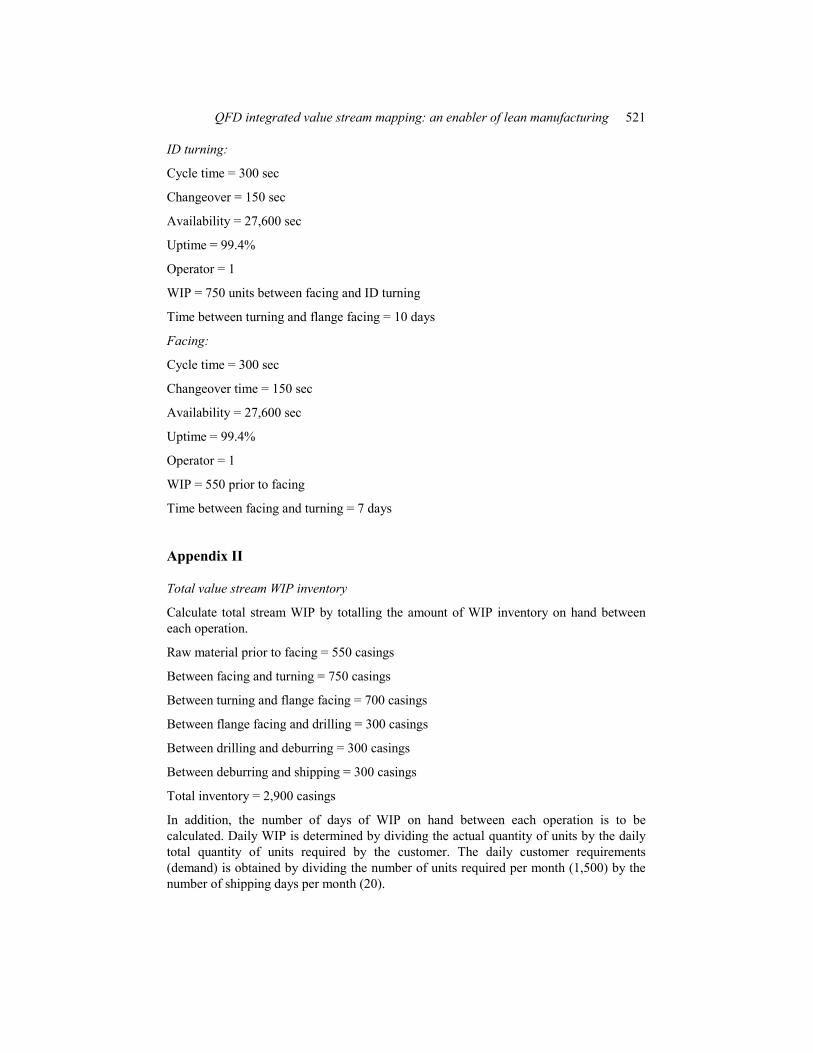
ID turning:
Cycle time = 300 sec
Changeover = 150 sec
Availability = 27,600 sec
Uptime = 99.4%
Operator = 1
WIP = 750 units between facing and ID turning
Time between turning and flange facing = 10 days
Facing:
Cycle time = 300 sec
Changeover time = 150 sec
Availability = 27,600 sec
Uptime = 99.4%
Operator = 1
WIP = 550 prior to facing
Time between facing and turning = 7 days
Appendix II
Total value stream WIP inventory
Calculate total stream WIP by totalling the amount of WIP inventory on hand between each operation.
Raw material prior to facing = 550 casings
Between facing and turning = 750 casings
Between turning and flange facing = 700 casings
Between flange facing and drilling = 300 casings
Between drilling and deburring = 300 casings
Between deburring and shipping = 300 casings
Total inventory = 2,900 casings
In addition, the number of days of WIP on hand between each operation is to be calculated. Daily WIP is determined by dividing the actual quantity of units by the daily total quantity of units required by the customer. The daily customer requirements (demand) is obtained by dividing the number of units required per month (1,500) by the number of shipping days per month (20).

522 R. Mohanraj, M. Sakthivel and S. Vinodh
Total number of units required per day: 1,500 units required per month/20 shipping days per month = 75 units per day
WIP in terms of days on hand:
Raw material prior to facing: 550 units (75 units per day = 7 days on hand)
Between facing and turning: 750 units (75 units per day = 10 days on hand)
Between turning and flange facing: 700 units (75 units per day = 9.33 days, say 9 days on hand)
Between flange facing and drilling: 300 units (75 units per day = 4 days on hand)
Between drilling and deburring: 300 units (75 units per day = 4 days on hand)
Between deburring and shipping: 300 units (75 units per day = 4 days on hand)
Total inventory (in days): 7 + 10 + 9 + 4 + 4 + 4 = 38 days on hand (i.e.) total lead time is 38 days
Total product cycle time:
The total product cycle time is also considered as total value adding time, the cycle time for each operation is listed as below:
1 Facing: 300 sec
2 Turning: 300 sec
3 Flange facing: 150 sec
4 Drilling: 120 sec
5 Deburring: 30 sec.
By adding the cycle times for each operation, the total product cycle time becomes 300 sec + 300 sec + 150 sec + 120 sec + 30 sec = 900 sec.