the dynamics of individual nucleosomes controls the chromatin condensation pathway: direct atomic...
TRANSCRIPT

544 Biophysical Journal Volume 97 July 2009 544–553
The Dynamics of Individual Nucleosomes Controls the ChromatinCondensation Pathway: Direct Atomic Force Microscopy Visualizationof Variant Chromatin
Fabien Montel,†‡ Herve Menoni,§ Martin Castelnovo,†‡ Jan Bednar,{k Stefan Dimitrov,†† Dimitar Angelov,§*and Cendrine Faivre-Moskalenko†‡*†Universite de Lyon; Laboratoire Joliot-Curie, CNRS USR 3010, Ecole Normale Superieure de Lyon, 69364 Lyon cedex 07, France; ‡Universitede Lyon; Laboratoire de Physique, CNRS UMR 5672, Ecole Normale Superieure de Lyon, 69364 Lyon cedex 07, France; §Universite de Lyon;Laboratoire de Biologie Moleculaire de la Cellule, CNRS UMR 5239, Ecole Normale Superieure de Lyon, 69364 Lyon cedex 07, France;{CNRS/UJF, Laboratoire de Spectrometrie Physique, UMR 5588, BP87, 38402 St. Martin d’Heres cedex, France; kCharles University inPrague, Institute of Cellular Biology and Pathology, First Faculty of Medicine, and Department of Cell Biology, Institute of Physiology, Academyof Sciences of the Czech Republic, Albertov 4, 128 01 Prague 2, Czech Republic, and ††Universite Joseph Fourier-Grenoble 1; INSERM InstitutAlbert Bonniot U823, Site Sante, BP 170, 38042 Grenoble cedex 9, France
ABSTRACT Chromatin organization and dynamics is studied at scales ranging from single nucleosome to nucleosomal arrayby using a unique combination of biochemical assays, single molecule imaging technique, and numerical modeling. We showthat a subtle modification in the nucleosome structure induced by the histone variant H2A.Bbd drastically modifies the higherorder organization of the nucleosomal arrays. Importantly, as directly visualized by atomic force microscopy, conventionalH2A nucleosomal arrays exhibit specific local organization, in contrast to H2A.Bbd arrays, which show ‘‘beads on a string’’ struc-ture. The combination of systematic image analysis and theoretical modeling allows a quantitative description relating theobserved gross structural changes of the arrays to their local organization. Our results suggest strongly that higher-order orga-nization of H1-free nucleosomal arrays is determined mainly by the fluctuation properties of individual nucleosomes. Moreover,numerical simulations suggest the existence of attractive interactions between nucleosomes to provide the degree of compactionobserved for conventional chromatin fibers.
INTRODUCTION
The major elementary building blocks of chromatin (1) are
known to be the nucleic acid (DNA) bearing the genetic
information, and the four different histones (H2A, H2B,
H3, H4) arranged by pairs into an octamer. The first level
of conserved organization of these molecules is the nucleo-
some, in which ~1.75 turns of DNA (147 bp) are wrapped
around the histone octamer (2). The spatial organization of
nucleosomal array in the presence of the linker histone H1
gives rise to several higher order structures of chromatin
fiber, the first one being the so-called 30 nm chromatin fiber.
Several different models for the 30 nm chromatin fiber struc-
ture were proposed in the literature (3–6). Chromatin is
highly dynamic and numerous factors including nucleosome
remodeling complexes, histone chaperones, and histone vari-
ants are essential for maintaining its dynamics (7).
Histone variants are nonallelic isoforms of the conven-
tional histones (1) and are expressed in a relatively low
amount compared to their conventional counterparts suggest-
ing that in addition to their structural role, they might have
some specialized function (see Boulard et al. (8) for a recent
review). Whereas all histones, except H4, possess their vari-
ants, H2A has the largest family of them (8). The histone
Submitted January 13, 2009, and accepted for publication April 21, 2009.
Fabien Montel and Herve Menoni contributed equally to the work.
*Correspondence: [email protected] or dimitar.anguelov@
ens-lyon.fr
Editor: Peter Hinterdorfer.
� 2009 by the Biophysical Society
0006-3495/09/07/0544/10 $2.00
variant H2A Barr body-deficient (H2A.Bbd) belongs to the
H2A family. It shares only 48% homology with its parental
histone (9). H2A.Bbd is excluded from the X inactive chro-
mosome of female vertebrate (10) and its localization in chro-
mosome regions where the chromatin is acetylated suggests
that H2A.Bbd could have a positive role in transcription (10).
A characteristic feature of the histone variant H2A.Bbd
structure is that the residues that contribute to the nucleosome
core particle (NCP) acidic patch are missing (9). In addition, it
lacks the C-terminus characteristic of the H2A family as well
as the end of the docking domain of H2A that was shown to be
involved in the interaction of the H2A/H2B dimer with the
(H3/H4)2 tetramer (10,11). Several types of experiments based
on biochemical approaches or microscopy techniques have
shown that less DNA is organized in H2A.Bbd nucleosomes
compared to conventional nucleosomes (11). Moreover this
subcomplexed nucleosomal structure is more dynamic
(12,13) and exhibits a weaker thermodynamic stability than
the canonical nucleosome (12,14). The more open structure
of H2A.Bbd nucleosome was shown to facilitate the access
of transcription factors (15) and base excision repair factors
(16), which suggests that this variant nucleosome represents
a lower physical barrier for chromatin associated processes.
By using a fusion protein Bbd.ddH2A (a H2A.Bbd
chimera, in which the docking domain is replaced with
that of conventional H2A), we were able to show recently
that the docking domain is in part responsible for the specific
properties of the H2A.Bbd mononucleosome (12). In
doi: 10.1016/j.bpj.2009.04.042

Biophysical Journal 97(2) 544–553
AFM Visualization of Variant Chromatin 545
addition, recent analytical centrifugation experiments
showed that H2A.Bbd nucleosomal arrays exhibited less
compact structure in the presence of magnesium compared
to that of conventional H2A arrays (17). This specific prop-
erty of the H2A.Bbd arrays seemed to be determined by the
lack of acidic patch in the H2A.Bbd histone octamer (17).
In this study, we use a combination of biochemical tech-
niques, atomic force microscopy (AFM), and numerical
modeling to visualize and compare quantitatively the struc-
tural and dynamic properties of reconstituted nucleosomal
arrays with either conventional H2A or H2A.Bbd histone
variant or chimeric Bbd.ddH2A protein. When combined
with image analysis, AFM allows the detection of the position
of each nucleosome within the analyzed chromatin coil.
Subsequently, the 2D structure factor for each type of studied
chromatin sample can be calculated, which enables us to
probe the structure and dynamics of the chromatin at various
scales ranging from the monomer size (~10 nm) to the whole
fiber size (~100 nm). By comparing the experimental struc-
ture factors to those obtained for simulated chromatin arrays,
we quantitatively relate the equilibrium parameters measured
on the mononucleosome to the structural parameters des-
cribing the corresponding nucleosomal arrays and thereby
unravel the individual nucleosome mechanical requirements
for nucleosome array to fold into a compact fiber.
MATERIALS AND METHODS
Preparation of DNA fragments
The DNA fragments containing 5, 9, 15, or 32 repeats of 601 sequence
(197 bp) were constructed essentially as described in Huynh et al. (18).
The long DNA fragments for chromatin reconstitution were gel or PEG puri-
fied as described in Huynh et al. (18).
Protein purification, nucleosome, and chromatinreconstitution
Recombinant Xenopus laevis full-length histone proteins were produced in
bacteria and purified as described (19). For the H2A.Bbd protein and the
H2A.Bbd-ddH2A mutant (H2A domain from M1 to I80 fused to
H2A.Bbd domain from T84 to D115), the coding sequences were amplified
by PCR and introduced in the pET3a vector. Recombinant proteins were
purified as described previously (15).
Chromatin reconstitution was carried out by the salt dialysis procedure
(20). A low quantity (<~10%) of competitor 5S DNA fragments was added
to avoid oversaturation of the nucleosomal array.
Biochemical analysis
Micrococcal nuclease digestion was carried out at 8 U/mL at room temperature
for indicated times in 10 mM Tris, pH 7.4, 1 mM DTT, 25 mM NaCl, 5% glyc-
erol, 100 mg/mL BSA, 1.5 mM CaCl2, and 100 mg/mL of plasmid carrier DNA.
The digestion was stopped by adding 20 mM EDTA, 0.1% SDS, 200 mg/mL
Proteinase K (30 min at 45�C). DNA was then extracted and run on a 1.4%
agarose gel.
AFM and surface preparation
For the AFM imaging, the conventional and variant nucleosomal arrays
were immobilized onto APTES-mica surfaces. The functionalization of
freshly cleaved mica disks (muscovite mica, grade V-1, SPI) was obtained
by self-assembly of a monolayer of APTES under argon atmosphere for
2 hr (21). A 5-mL droplet of the chromatin solution in low salt buffer
(10 mM Tris pH ¼ 7.4, 1 mM EDTA, and 5 mM NaCl) was deposited
onto the APTES-mica surface for 1 min, rinsed with 1 mL of milliQ-Ultra-
pure water (Millipore, Billerica, MA) and gently dried by nitrogen flow. The
samples were visualized by using a Nanoscope III AFM (Digital Instru-
ments, Veeco, Santa Barbara, CA). The images were obtained in tapping
mode in air, using diamond-like carbon spikes tips (resonant frequency
~150 kHz) at scanning rates of 2 Hz over scan areas of 1 mm wide.
Image analysis
The parameters of interest were extracted from the AFM images using
a homemade MATLAB (The MathWorks, Natick, MA) script based essen-
tially on morphological tools such as binary dilatation and erosion (22), and
height/areas selections. The aim of the first two steps of this algorithm was to
select relevant objects:
1. To remove the piezoelectric scanner thermal drift, flattening of the image
is carried out. The use of a height criteria (h > 0.5 nm where h is the
height of the object) allows us to avoid the shadow artifact induced by
high objects on the image.
2. Building of a binary image using a simple thresholding (h > 0.25 nm
where h is the height of the object) followed by selection of the binary
objects in the good area range (X < A < Y nm2 where A is the area of
the object, X and Y depends on the number of repeats).
These two steps lead to the selection of binary objects whose area is
between for example for X ¼ 5000 nm2 and Y ¼ 15,000 nm2 for a five
repeats of 601 positioning sequence and corresponds in the AFM image to
a group of connected pixels with a minimum height of >0.25 nm.
The next steps correspond to the characterization of these objects done
automatically for each selected chromatin fiber
3. Measurement of the fiber projected total area, Atot, (number of pixels
above the noise threshold (0.25 nm) for an object in the good area
range).
4. Segmentation of the NCPs by selecting regions exhibiting a local curva-
ture below �0.01 nm�1 and a size larger than 20 nm2.
5. Detection of the NCP centroid by extracting the center of mass for each
NCP and determination of the number Nnucs of NCPs in this fiber.
6. Measurement of Euclidian distances (dij) between centroids of NCPs i
and j, for i and j ¼ 1 to Nnucs using distances.
7. Extraction of the first two principal components of the 2D series defined
by NCP centroids. Determination of the major and minor axis of the
ellipse defined by the two principal directions and the value of the asso-
ciated semi-major axis a, and semi-minor axis b.
8. Estimation of C2D, the fiber 2D compacity (surface fraction) by calcu-
lating the ratio between the fiber projected area Atot (estimated in step 3)
and the ellipse area AEllipse ¼ p*a*b.
9. Determination of the distance to its nearest neighbor (d1st_neighbor) for
each NCP.
10. Estimation of the characteristic distance between nucleosomes by
computing
dinter nucs ¼ 2
ffiffiffiffiffiffiffiffiffiffiffiffiffiAtotal
pNnucs
r:
11. Calculation of the radius of gyration, Rg, defined as the mean-square
distance to the center of mass for all NCP centroids that belong to
one object,
R2g ¼
1
N2
XN
i¼ 1
XN
j¼ 1
d2ij:

546 Montel et al.
12. Calculation of the hydrodynamic radius, Rh, defined as
R�1H ¼ 1=NðN � 1Þ
XN
i¼ 1
XN
j¼ 1;jsi
1
dij
;
where dij is the distance between centroids of NCPs i and j (calculated in
step 6) and N the total number of nucleosome in the fiber.
The steps 4 and 5 lead to quick and robust measurements. Indeed, the
combined use of local curvature, area threshold, and center of mass to locate
NCP centroid lead to a subnanometer resolution in the X/Y positions and
exclude compactly bent DNA from being considered as a candidate NCP.
For each estimated global or local structural parameter, the error on the
mean value of the distribution is estimated as s=ffiffiffiffiNp
, where s is the standard
deviation of the distribution and N the total number of objects.
Structure factor calculations
From the image analysis described previously, it is possible to extract
distances dij between each nucleosomes center on each analyzed chromatin
type. Using these data, the 2D structure factors (isotropically averaged) are
calculated as follows:
SðqÞ ¼ 1
N
XN
i¼ 1
XN
j¼ 1
J0
�q $ dij
�;
where J0 is the 0th order Bessel function of the first kind. The analysis of
structure factors can benefits from many different representations developed
over the last 50 years within the field of polymer physics. In particular, the
Kratky plot representation (q2S(q) versus q) of a structure factor is a conve-
nient way to highlight a locally compact structure, as it is shown by its recent
use in the characterization of protein or RNA folding/unfolding by small
angle x-ray scattering (23). Indeed, within such a representation, any peak
in the curve is associated to a structure that is more compact than the equiv-
alent random walk or Gaussian chain. In the case of a Gaussian chain, the
structure factor scales like q�2, whereas for a compact state the structure
would scale like q�a where 2 < a % 4.
Numerical simulations
The purpose of the numeric simulations carried out in this study is to extend
the analysis of experimental data obtained by AFM visualization of chro-
matin fibers. In this section, we describe the rules of the simulations more
precisely. Our 2D model of H1-depleted chromatin fibers has essentially
four major ingredients:
i. A basic mechanical model taking into account the geometrical relation
between DNA complexed length within each nucleosome and linker
length between consecutive nucleosomes.
ii. The possibility to use as an input the experimental distribution of mono-
nucleosome opening angles obtained in our previous work (13), through
the equivalent DNA complexation length distribution;
iii. The excluded volume between NCP.
iv. Eventually some short range attractive interactions between NCP.
The building blocks of the model are hard disks representing NCP and
straight linkers. The first step is essential in providing realistic 2D positioning
distributions of consecutive nucleosomes. The relevant exact geometrical
relationships are summarized in Fig. S4 in the Supporting Material. Each
chain is constructed as follows. We first decided to construct the chain of
N nucleosomes by placing the nucleosomes sequentially: this assumption is
supposed to mimic the process of deposition of fibers on the surface starting
from one end of the fiber. Once the ith nucleosome is placed, the position of
the next one is determined by choosing first a trial angle q from the distribution
of DNA complexation length of mononucleosomes observed experimentally.
Any deviation from the canonical value of q ¼ q0 is translated into linker
Biophysical Journal 97(2) 544–553
length variation according the relations in Fig. S4. It should be noted that
this relation assumes that the linker variation are done in a forward way.
Any piece of chain already constructed is immobilized for the rest of the
construction process. Once the opening angle and linker length are known,
the putative position of the (i þ 1)th nucleosome is known. If the position
does not overlap with any previous NCP with effective diameter dev¼ 17 nm
(the most optimal choice), the position is accepted and the computation
proceeds toward the next step, whereas on NCP overlap a new angle q is
generated repeatedly until successful position has been found.
The specificity of the model with respect to histone content is made by
choosing as an input, different DNA complexation length distributions for
different histone content (conventional and variant). We previously charac-
terized these DNA complexation length distribution on conventional and
variant mononucleosome by measuring its mean hLci and width sLc. In
particular, we have shown that (12): 1), for the conventional H2A nucleo-
some, hLc_H2Ai ¼ 146 5 1 bp, and sLc_H2A ~ 20 bp; 2), for the variant
H2A.Bbd nucleosome, the distribution is enlarged and shifted toward lower
Lc value: hLc_H2A.Bbdi ¼ 127 5 2 bp, and sLc_H2A.Bbd ~ 35 bp; and 3), for
the chimeric Bbd.ddH2A nucleosome, the mean value is shifted back close
to the conventional nucleosome wrapped length distribution but its width
remains large: hLc_Bbd.ddH2Ai ¼ 143 5 2 bp, and sLc_Bbd.ddH2A ~ 35 bp.
Using these rules, a set of chains is then generated. The number of nucle-
osomes per fiber was chosen to be 5, 9, 15, and 30 for the different
constructs, so that this number matched with the average number of nucle-
osome per fibers. Our simulation therefore neglects the effect of polydisper-
sity in the number of nucleosome per fibers. From the chains generated this
way, it is possible to compute all the characteristic quantities discussed in
this study: radius of gyration, hydrodynamic radius, nearest neighbor distri-
bution, pairwise distance distribution, and structure factors. Representative
snapshots of simulated fibers and the corresponding Kratky plots of the
structure factors are shown in Fig. S5.
RESULTS AND DISCUSSION
Nucleosomal arrays reconstituted on 601 DNA repeats with
different repeat numbers were used in the experiments. The
601 DNA sequence exhibits a high positioning signal that
enables us to obtain both conventional and variant nucleosomes
accurately positioned along the DNA at specific positions (24).
In addition, our experimental conditions were restricted to low
salt environment to prevent both variant octamer destabiliza-
tion (25) and fiber-fiber interactions in high divalent salt
concentration as used in the centrifugation studies (17).
Conventional H2A, histone variant H2A.Bbd, and chimeric
Bbd.ddH2A nucleosomal arrays were reconstituted by salt
dialysis onto DNA fragments of 1, 1.8, 3, and 6.3 kbp contain-
ing 5, 9, 15, and 32 repeats of 601 positioning sequences
respectively (repeat length 197 bp). Small amount of mononu-
cleosomal sized 5S DNA was used as a competitor DNA in the
chromatin reconstitution to achieve complete saturation of
601 chromatin. The quantity of competitor DNAs was low
enough not to affect the AFM image and allowed tuning the
histone DNA ratio in a fine manner to avoid aggregation.
Biochemical characterization of the reconstitutedarrays
The reconstituted nucleosomal arrays were first character-
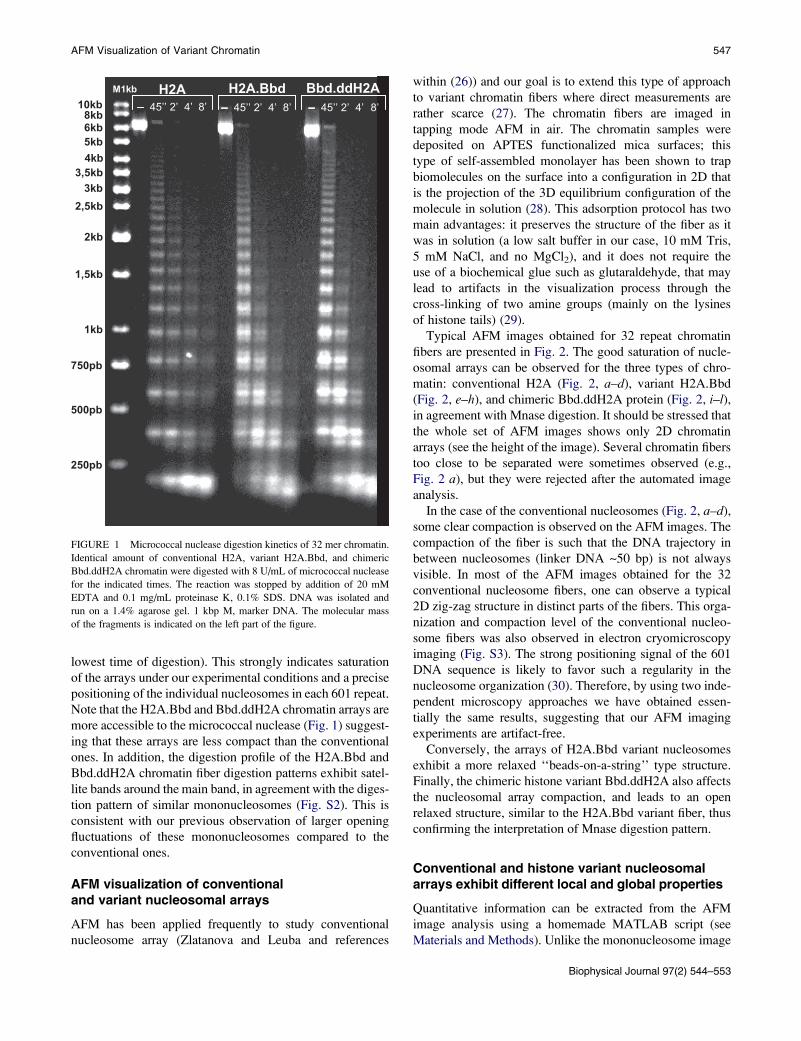
ized by micrococcal nuclease digestion (Fig. 1). The diges-
tion pattern of the three types of 32 repeat nucleosomal
arrays was very regular (>20 bands were visible at the
AFM Visualization of Variant Chromatin 547
lowest time of digestion). This strongly indicates saturation
of the arrays under our experimental conditions and a precise
positioning of the individual nucleosomes in each 601 repeat.
Note that the H2A.Bbd and Bbd.ddH2A chromatin arrays are
more accessible to the micrococcal nuclease (Fig. 1) suggest-
ing that these arrays are less compact than the conventional
ones. In addition, the digestion profile of the H2A.Bbd and
Bbd.ddH2A chromatin fiber digestion patterns exhibit satel-
lite bands around the main band, in agreement with the diges-
tion pattern of similar mononucleosomes (Fig. S2). This is
consistent with our previous observation of larger opening
fluctuations of these mononucleosomes compared to the
conventional ones.
AFM visualization of conventionaland variant nucleosomal arrays
AFM has been applied frequently to study conventional
nucleosome array (Zlatanova and Leuba and references
FIGURE 1 Micrococcal nuclease digestion kinetics of 32 mer chromatin.
Identical amount of conventional H2A, variant H2A.Bbd, and chimeric
Bbd.ddH2A chromatin were digested with 8 U/mL of micrococcal nuclease
for the indicated times. The reaction was stopped by addition of 20 mM
EDTA and 0.1 mg/mL proteinase K, 0.1% SDS. DNA was isolated and
run on a 1.4% agarose gel. 1 kbp M, marker DNA. The molecular mass
of the fragments is indicated on the left part of the figure.
within (26)) and our goal is to extend this type of approach
to variant chromatin fibers where direct measurements are
rather scarce (27). The chromatin fibers are imaged in
tapping mode AFM in air. The chromatin samples were
deposited on APTES functionalized mica surfaces; this
type of self-assembled monolayer has been shown to trap
biomolecules on the surface into a configuration in 2D that
is the projection of the 3D equilibrium configuration of the
molecule in solution (28). This adsorption protocol has two
main advantages: it preserves the structure of the fiber as it
was in solution (a low salt buffer in our case, 10 mM Tris,
5 mM NaCl, and no MgCl2), and it does not require the
use of a biochemical glue such as glutaraldehyde, that may
lead to artifacts in the visualization process through the
cross-linking of two amine groups (mainly on the lysines
of histone tails) (29).
Typical AFM images obtained for 32 repeat chromatin
fibers are presented in Fig. 2. The good saturation of nucle-
osomal arrays can be observed for the three types of chro-
matin: conventional H2A (Fig. 2, a–d), variant H2A.Bbd
(Fig. 2, e–h), and chimeric Bbd.ddH2A protein (Fig. 2, i–l),in agreement with Mnase digestion. It should be stressed that
the whole set of AFM images shows only 2D chromatin
arrays (see the height of the image). Several chromatin fibers
too close to be separated were sometimes observed (e.g.,
Fig. 2 a), but they were rejected after the automated image
analysis.
In the case of the conventional nucleosomes (Fig. 2, a–d),
some clear compaction is observed on the AFM images. The
compaction of the fiber is such that the DNA trajectory in
between nucleosomes (linker DNA ~50 bp) is not always
visible. In most of the AFM images obtained for the 32
conventional nucleosome fibers, one can observe a typical
2D zig-zag structure in distinct parts of the fibers. This orga-
nization and compaction level of the conventional nucleo-
some fibers was also observed in electron cryomicroscopy
imaging (Fig. S3). The strong positioning signal of the 601
DNA sequence is likely to favor such a regularity in the
nucleosome organization (30). Therefore, by using two inde-
pendent microscopy approaches we have obtained essen-
tially the same results, suggesting that our AFM imaging
experiments are artifact-free.
Conversely, the arrays of H2A.Bbd variant nucleosomes
exhibit a more relaxed ‘‘beads-on-a-string’’ type structure.
Finally, the chimeric histone variant Bbd.ddH2A also affects
the nucleosomal array compaction, and leads to an open
relaxed structure, similar to the H2A.Bbd variant fiber, thus
confirming the interpretation of Mnase digestion pattern.
Conventional and histone variant nucleosomalarrays exhibit different local and global properties
Quantitative information can be extracted from the AFM
image analysis using a homemade MATLAB script (see
Materials and Methods). Unlike the mononucleosome image
Biophysical Journal 97(2) 544–553

548 Montel et al.
a b c d
i j k l
e f g h
FIGURE 2 Typical set of AFM topographic images obtained in tapping mode in air for nucleosome arrays reconstituted on 32 repeats of 601 positioning
DNA sequences (repeat length 197 bp) with (a–d) the conventional histone H2A, (e–h) the histone variant H2A.Bbd, and (i–l) the chimeric variant histone
Bbd.ddH2A.
analysis procedure used in our previous study (13), a simple
height criterion is not sufficient to faithfully detect each nucle-
osome position within the compact conventional fiber. There-
fore, we have implemented an algorithm that identifies local
curvature maxima, thereby enabling to detect the position of
the NCP centroid with a subnanometer precision. For each
fiber ‘‘object’’ identified, the script measures several parame-
ters of interests (see Materials and Methods). For the calcula-
tion of these various parameters, only the fibers with a number
of nucleosomes in agreement with the expected value for each
DNA construction were selected (4 % Nnuc % 5 for 5 repeats
of 601 positioning sequences, 7 % Nnuc % 10 for 9 repeats,
12 % Nnuc % 17 for 15 repeats and 25 % Nnuc % 35 for
32 repeats) and this at the expense of our statistical sampling.
These criteria allow elimination of over- and subsaturated
fibers as well as the ‘‘connected’’ fibers from the data analysis.
In this study, we discuss only the most relevant parame-
ters: Rg the radius of gyration, RH the hydrodynamic radius,
Nnucs the number of nucleosomes in the selected fiber,
d1st_neighbor, the distance to its nearest neighbor for each
nucleosome, and dinter_nuc, the average internucleosomal
distance within the fiber. The mean value of each quantity
has been estimated for each type of reconstituted fiber
(conventional or variant, 5, 9, 15, or 32 repeats) and the
complete data are summarized in Table 1. The results for
Biophysical Journal 97(2) 544–553
two relevant representative parameters are represented in
Fig. 3: the nearest neighbor distance (Fig. 3 a) that is a local
parameter characterizing the fiber organization, and the
radius of gyration (Fig. 3 b) that is a global one.
The fiber configuration can be characterized at the mono-
mer scale by calculating for each nucleosome the distance to
its nearest neighbor. The nearest neighbor distance distribu-
tion obtained for each type of 32 repeat nucleosomal fibers is
plotted in Fig. 3 a. The conventional nucleosome nearest
neighbor distance is centered on hd1st_neighbori ¼ 20.1 5
0.3 nm and the value found for each DNA template (5, 9,
15, or 32 repeats) is very close (see Table 1) showing that
the local organization of the conventional fiber is similar
for several saturated DNA template lengths. For variant
nucleosomal fibers (H2A.Bbd and Bbd.ddH2A), the nearest
neighbor distance distribution is markedly broaden and
asymmetric. This reflects a larger tendency of nearest
neighbor nucleosomes in the case of variants to be less local-
ized, and therefore a smaller degree of local compaction of
the fiber.
The data measured at the local scale on our reconstituted
chromatin can also be compared to previous AFM measure-
ments on native chromatin. In particular, the nearest
neighbor distance and the average internucleosomal distance
found for conventional chromatin are consistent with data

AFM Visualization of Variant Chromatin 549
TABLE 1 Various parameters extracted from the automated images analysis describing the local and global conformation of the
conventional H2A, variant H2A.Bbd, and chimeric Bbd.ddH2A chromatin fibers of various sizes
Chromatin fiber type Repeats (n) Total Nfiber/Nnucl Mean Nnucl/fiber
Radius of
gyration (nm)
Hydrodynamic
radius (nm)
Nearest neighbor
distance (nm)
Internucleosomal
distance (nm)
Conventional H2A 5 1335/6185 4.63 5 0.01 22.1 5 0.1 28.8 5 0.1 21.2 5 0.1 26.8 5 0.1
9 261/2338 8.96 5 0.06 32.6 5 0.4 35.5 5 0.3 19.8 5 0.1 26.4 5 0.1
15 551/8177 14.79 5 0.06 53.7 5 0.5 50.2 5 0.3 21.5 5 0.1 28.7 5 0.1
32 54/1629 30.2 5 0.4 71.8 5 2.2 62.5 5 1.1 20.1 5 0.3 28.5 5 0.3
Variant H2A.Bbd 9 132/1116 8.45 5 0.08 46.0 5 1.1 47.6 5 0.8 26.2 5 0.3 30.4 5 0.3
32 19/593 31.2 5 0.7 88.1 5 4.9 73.2 5 2.9 21.7 5 0.3 30.0 5 0.7
Chimeric Bbd.ddH2A 9 112/995 8.9 5 0.1 50.2 5 1.1 50.9 5 0.9 26.8 5 0.3 32.8 5 0.4
32 28/795 28.4 5 0.5 95.3 5 4.4 79.7 5 2.6 24.2 5 0.3 29.9 5 0.5
Error is calculated as the SE ð sffiffiffiNp Þ where s is the standard deviation on the mean and N the number of events in the distribution.
from Kepert et al. (31). In this study, a mean value of 17.6 5
0.1 nm for the nearest neighbor distance and 27.6 5 0.6 nm
for the internucleosomal distance are found for native chro-
matin fibers extracted from HeLa cells, depleted from linker
histone H1. Despite the difference in the origin of chromatin
studied and the deposition conditions for AFM imaging, the
similarities of these results show that the features of extracted
data are intrinsically relevant of chromatin structure.
At a global scale, this difference in compaction is also
observed through the comparison of typical radii (radius of
gyration, hydrodynamic radius) between conventional and
variant fibers (Fig. 3 b and Table 1). The mean radius of
gyration of conventional fibers with 32 nucleosomes (on
average) is Rg_H2A¼ 71.8 nm, whereas the same mean radius
for the variant fiber is Rg_H2A.Bbd ¼ 88.1 nm. The compac-
tion of conventional fibers with respect to H2A.Bbd variant
fibers has already been measured at this global level by Zhou
et al. (17) for chromatin with 12 nucleosomes. Our results for
similar fibers (with nine nucleosomes per fibers; see Table 1)
are qualitatively consistent with Zhou et al. (17), the relative
deviation being easily explained by different buffer condi-
tions and the difference between 2D and 3D fibers. Neverthe-
less, the use of image analysis to compute global parameters
like radii of gyration allows us to go beyond the average
value of radii and to obtain its full distribution on the given
set of analyzed fibers. Again, the larger width of this distri-
bution in the case of variant fibers (Fig. 3 b) is consistent
with a smaller degree of fiber compaction. However, further
investigation of radius of gyration scaling with the number of
nucleosomes is hampered due to the limited range of scales
experimentally accessible.
In summary, we have shown that both at the local and
global scales the variant chromatin fiber is statistically
more open and less organized than the conventional one.
2D structure factors allows quantifyingthe compaction of conventional fiberswith respect to the variant fibers
To gap our observations between the local and the global
scale of the fiber, we computed 2D structure factors out of
internucleosome distances measurements, after the proce-
dure described in Materials and Methods. The use of struc-
ture factors has two main advantages: 1), the quantification
of the fiber structure at different length scales (32); and 2),
the comparison between experimental and simulation results.
Using the distances between each nucleosome for each
fibers extracted from the image analysis, we compute a 2D
structure factor (S(q)). This quantity bears useful information
on the structure of the observed objects at different scales,
ranging from the nucleosome scale to the global fiber scale.
The 3D structure factors are usually obtained by various Small
Angle Scattering techniques (neutrons, x-rays, or light).
Within our experimental setup, computing artificially a struc-
ture factor from real images may not make sense at first
glance, but it turns out to be an extremely powerful tool to
quantitatively compare experimental results and numerical
simulations at various length scales, as it is discussed below.
The experimental 2D structure factors are conveniently
represented as Kratky plots (q2S(q) versus q) (23). Within
such a representation, a simple semiflexible polymer (for
example DNA) will exhibit three regimes: at low q (i.e.,
for distances larger than the radius of gyration Rg of the
coil), q2S(q) increases as a function of q (Guinier regime,
where S(q) decays exponentially), then for Rg < q < mono-
mer size, there is a plateau corresponding to a Gaussian chain
regime (where S(q) scales as q�2), and finally for large q (i.e.,
sizes smaller than the monomer size) q2S(q) increases line-
arly with q (rigid rod regime S(q) a q�1). An additional
peak may eventually appear in the Kratky plot representa-
tion, that is associated to a structure that is more compact
(or organized) at an intermediate scale between monomer
and coil size, than a Gaussian chain. This peak is a typical
signature of intramolecular partial compaction, as it has
been shown recently to monitor folding/unfolding transition
in RNA and proteins (23,33).
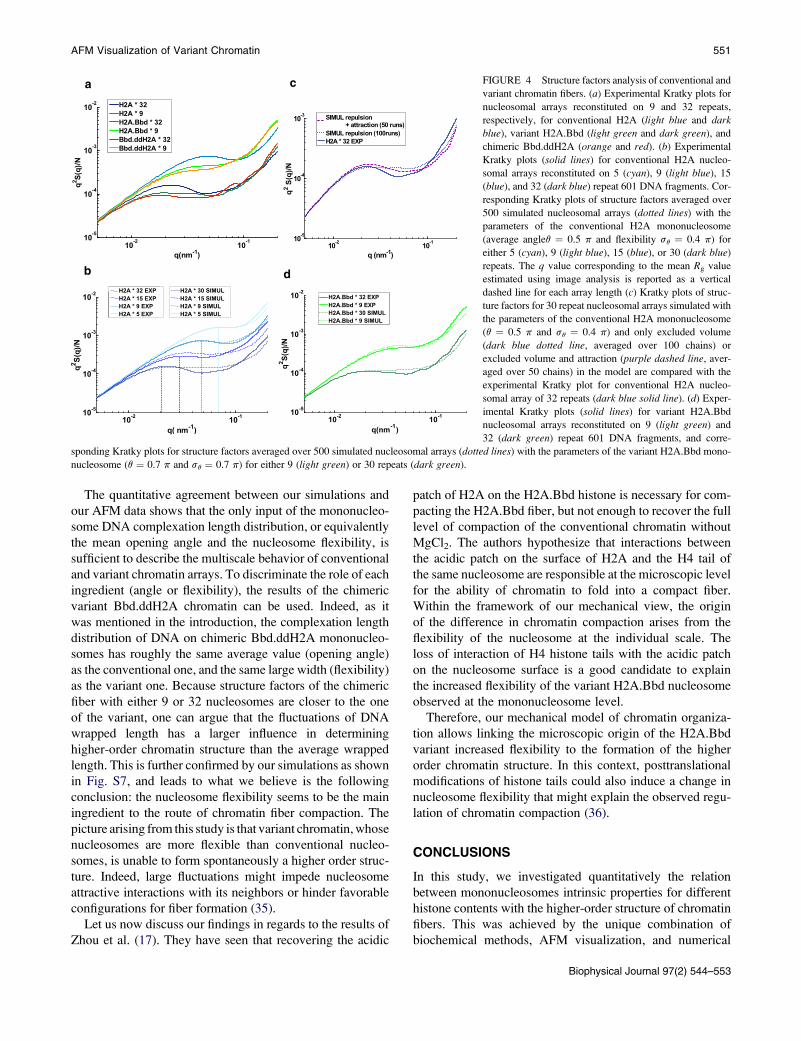
Experimentally, conventional fibers with 9 and 32 nucle-
osomes exhibit these three regimes with a significant peak
associated to some degree of compaction in the structure,
whereas variant fibers with the same nucleosome numbers
do not (Fig. 4 a). As we already mentioned, this maximum
in our experimental data is the signature of the tendency to
form locally some ordered (zig-zag) configuration of con-
ventional nucleosomes, as can be observed directly on
Biophysical Journal 97(2) 544–553

550 Montel et al.
many images of fibers (Fig. 2, a–d) or exhibited by simula-
tion results on highly ordered fibers (Fig. S5). On the
contrary, the absence of any significant peak in the Kratky
plot of variant fibers indicates an organization of the whole
chain that is closer to a random walk or Gaussian chain.
Interestingly, the structure factor of chimeric Bbd.ddH2A
fiber is closer to the one of Bbd.H2A fiber, in agreement
with image snapshots shown in Fig. 2.
To gain more insights into the interpretation of these struc-
ture factors, we developed simple simulations of 2D chro-
matin fibers (described in Materials and Methods and the
Supporting Material). Using the experimental distribution
of DNA complexed length for both conventional and variant
mononucleosomes as an input, we were able to generate
FIGURE 3 Local and global parameters as measured with automated
computer analysis of the AFM images. (a) Nearest neighbor distance distri-
bution for conventional H2A (black line), variant H2A.BBd (dark gray line),
and chimeric Bbd.ddH2A (light gray line) nucleosomal arrays reconstituted
on the 32 repeats of 601 DNA fragment. (b) Radii of gyration for conven-
tional H2A (black), variant H2A.BBd (dark gray), and chimeric Bbd.ddH2A
(light gray) nucleosomal arrays reconstituted on the 9 and 32 repeats of 601.
The radius of gyration distribution is conveniently displayed as a box plot,
where the horizontal inner line corresponds to the median value. The lower
and upper bounds of the box point respectively the first and last quartiles of
the distribution. Notches represent a robust estimate of the uncertainty about
the medians for box-to-box comparison.
Biophysical Journal 97(2) 544–553
different sets of representative conformations, from which
we calculated 2D structure factors. For each type of simu-
lated chromatin fibers, we averaged over 500 chains to
ensure statistical reliability of the Kratky plots. Focusing first
on the conventional and variant fiber data (Fig. 4, b and d),
a remarkable agreement can be observed between the exper-
iments and the simulations once an appropriate excluded
volume is chosen for all nucleosomes. In particular, the
low-q regime, i.e., at the fiber scale, is well described within
our model. This means that using a single model for chro-
matin fibers, together with two different distributions of
nucleosome complexation length representing different
histone compositions, it is possible to capture quantitatively
the relevant features of the observed fiber conformations.
The only adjustable parameter for these simulations is the
choice of excluded volume distance (dev) between nearest
nucleosomes, whose optimal value is found to be dev ~17 nm.
This value is consistent with both the experimental average
nearest neighbor distance, and the typical excluded volume
due to the presence of histone tails (34).
Remarkably, the experimental radius of gyration matches
the peak (or inflection point) position in the Kratky plots as
evidenced in Fig. 4 c. A closer inspection of the structure
factors for conventional fibers with different number of nucle-
osomes (N¼ 5, 9, 15, and 32,) at moderate-q regime (10�2<q < 10�1) shows, however, some quantitative discrepancies
(Fig. 4 c). These discrepancies between the experiment and
the theory become more evident with increasing number of
nucleosomes (15 or 32 nucleosomes) in the array. Indeed,
further analysis of simulations with pure excluded volume
interactions (Fig. 4 b) shows that although the relative
‘‘rigidity’’ of conventional nucleosomes seems to be enough
to produce some compaction or structuring of the array for
5 or 9 nucleosomes, it is not able to compact larger number
of nucleosome (15 or 32 nucleosomes). This means that some
physical ingredient like nucleosome attractions favoring
compaction over a larger range of scales is missing to repro-
duce the experimental structure factors.
To qualitatively test this assumption, we extended our
simulations to include effective attractions between nucleo-
somes. This was achieved as a first approximation by
increasing the acceptance rate in the process of chain
construction for nucleosome distances close to solid contact
relatively to larger distances. This generates chains that
exhibit a stronger degree of compaction. If a large number
of chains is generated this way (500 chains), the structure
factor shows now a significant peak in the Kratky represen-
tation compared to the same simulation with pure excluded
volume interactions, in qualitative agreement with the exper-
imental results. As the experimental Kratky plots were ob-
tained from a rather limited set of chromatin chains, we
observe interestingly in the simulation, that lowering the
statistics of chain generation to values similar to the experi-
mental results (~50 chains) produces structure factors
remarkably close to the experimental one (see Fig. 4 c).
AFM Visualization of Variant Chromatin 551
a c
b d
FIGURE 4 Structure factors analysis of conventional and
variant chromatin fibers. (a) Experimental Kratky plots for
nucleosomal arrays reconstituted on 9 and 32 repeats,
respectively, for conventional H2A (light blue and darkblue), variant H2A.Bbd (light green and dark green), and
chimeric Bbd.ddH2A (orange and red). (b) Experimental
Kratky plots (solid lines) for conventional H2A nucleo-
somal arrays reconstituted on 5 (cyan), 9 (light blue), 15
(blue), and 32 (dark blue) repeat 601 DNA fragments. Cor-
responding Kratky plots of structure factors averaged over
500 simulated nucleosomal arrays (dotted lines) with the
parameters of the conventional H2A mononucleosome
(average angleq ¼ 0.5 p and flexibility sq ¼ 0.4 p) for
either 5 (cyan), 9 (light blue), 15 (blue), or 30 (dark blue)
repeats. The q value corresponding to the mean Rg value
estimated using image analysis is reported as a vertical
dashed line for each array length (c) Kratky plots of struc-
ture factors for 30 repeat nucleosomal arrays simulated with
the parameters of the conventional H2A mononucleosome
(q ¼ 0.5 p and sq ¼ 0.4 p) and only excluded volume
(dark blue dotted line, averaged over 100 chains) or
excluded volume and attraction (purple dashed line, aver-
aged over 50 chains) in the model are compared with the
experimental Kratky plot for conventional H2A nucleo-
somal array of 32 repeats (dark blue solid line). (d) Exper-
imental Kratky plots (solid lines) for variant H2A.Bbd
nucleosomal arrays reconstituted on 9 (light green) and
32 (dark green) repeat 601 DNA fragments, and corre-
sponding Kratky plots for structure factors averaged over 500 simulated nucleosomal arrays (dotted lines) with the parameters of the variant H2A.Bbd mono-
nucleosome (q ¼ 0.7 p and sq ¼ 0.7 p) for either 9 (light green) or 30 repeats (dark green).
The quantitative agreement between our simulations and
our AFM data shows that the only input of the mononucleo-
some DNA complexation length distribution, or equivalently
the mean opening angle and the nucleosome flexibility, is
sufficient to describe the multiscale behavior of conventional
and variant chromatin arrays. To discriminate the role of each
ingredient (angle or flexibility), the results of the chimeric
variant Bbd.ddH2A chromatin can be used. Indeed, as it
was mentioned in the introduction, the complexation length
distribution of DNA on chimeric Bbd.ddH2A mononucleo-
somes has roughly the same average value (opening angle)
as the conventional one, and the same large width (flexibility)
as the variant one. Because structure factors of the chimeric
fiber with either 9 or 32 nucleosomes are closer to the one
of the variant, one can argue that the fluctuations of DNA
wrapped length has a larger influence in determining
higher-order chromatin structure than the average wrapped
length. This is further confirmed by our simulations as shown
in Fig. S7, and leads to what we believe is the following
conclusion: the nucleosome flexibility seems to be the main
ingredient to the route of chromatin fiber compaction. The
picture arising from this study is that variant chromatin, whose
nucleosomes are more flexible than conventional nucleo-
somes, is unable to form spontaneously a higher order struc-
ture. Indeed, large fluctuations might impede nucleosome
attractive interactions with its neighbors or hinder favorable
configurations for fiber formation (35).
Let us now discuss our findings in regards to the results of
Zhou et al. (17). They have seen that recovering the acidic
patch of H2A on the H2A.Bbd histone is necessary for com-
pacting the H2A.Bbd fiber, but not enough to recover the full
level of compaction of the conventional chromatin without
MgCl2. The authors hypothesize that interactions between
the acidic patch on the surface of H2A and the H4 tail of
the same nucleosome are responsible at the microscopic level
for the ability of chromatin to fold into a compact fiber.
Within the framework of our mechanical view, the origin
of the difference in chromatin compaction arises from the
flexibility of the nucleosome at the individual scale. The
loss of interaction of H4 histone tails with the acidic patch
on the nucleosome surface is a good candidate to explain
the increased flexibility of the variant H2A.Bbd nucleosome
observed at the mononucleosome level.
Therefore, our mechanical model of chromatin organiza-
tion allows linking the microscopic origin of the H2A.Bbd
variant increased flexibility to the formation of the higher
order chromatin structure. In this context, posttranslational
modifications of histone tails could also induce a change in
nucleosome flexibility that might explain the observed regu-
lation of chromatin compaction (36).
CONCLUSIONS
In this study, we investigated quantitatively the relation
between mononucleosomes intrinsic properties for different
histone contents with the higher-order structure of chromatin
fibers. This was achieved by the unique combination of
biochemical methods, AFM visualization, and numerical
Biophysical Journal 97(2) 544–553

552 Montel et al.
simulations. The comparison of fiber’s structures for conven-
tional, H2A.Bbd variant, and Bbd.ddH2A chimeric nucleo-
some content probed by all three methods leads to the
following conclusion: there is a direct connection between
DNA complexation length distribution on mononucleo-
somes and the structure of nucleosomal array. More
precisely, the width of this distribution, or equivalently the
spontaneous tendency of nucleosome to unwrap more or
less easily, is a major determinant of higher-order structure
as observed through AFM. Moreover, the use of simulations
allowed highlighting the role of attractive interactions among
nucleosomes in providing the observed degree of compac-
tion for conventional fibers.
These results have some important biological implica-
tions. They strengthen the idea that the ability of H2A.Bbd
histone variant to modify the structural and dynamic proper-
ties of the mononucleosome provides a regulation pathway
for DNA accessibility within the chromatin fiber.
In a more general context, our results suggest that any
process likely to modify mononucleosome dynamics (like
a transcription factor binding, chromatin remodeling or post-
traductional histone modifications) can potentially induce
a modification of a higher order chromatin structure. They
highlight the deep role of fluctuations at the nucleosome
scale for the whole chromatin organization. Therefore,
a next step would be to study how localized flexibility defect
generated by presence of a single variant nucleosome, would
propagate to neighboring nucleosome creating a locally
opened chromatin structure.
SUPPORTING MATERIAL
Additional text, seven figures, and references are available at http://www.
biophysj.org/biophysj/supplemental/S0006-3495(09)00909-6.
The authors acknowledge Dr. Daniela Rhodes for the kind gift of the 32
repeat 601 array DNA template. We thank Sajad Syed for his help with the
15 repeat chromatin reconstitution used in the electron cryo-microscopy
experiments.
This work was supported by the Contrat Plan-Etat Region ‘‘Nouvelles
Approches Physiques des Sciences du Vivant’’, the Association pour la
Recherche sur le Cancer (D.A.), La Ligue Nationale contre le Cancer
(Equipe labellisee La Ligue to S.D.), the Grant Agency of the Czech
Republic (grant 304/05/2168 to J.B.), the Ministry of Education, Youth
and Sports (MSM0021620806 and LC535), and the Academy of Sciences
of the Czech Republic (grant AV0Z50110509).
REFERENCES
1. van Holde, K. 1988. Chromatin. Springer-Verlag KG, Berlin.
2. Luger, K., A. W. Mader, R. K. Richmond, D. F. Sargent, and T. J. Richmond.1997. Crystal structure of the nucleosome core particle at 2.8 A resolution.Nature. 389:251–260.
3. Schalch, T., S. Duda, D. F. Sargent, and T. J. Richmond. 2005. X-raystructure of a tetranucleosome and its implications for the chromatinfibre. Nature. 436:138–141.
4. Robinson, P. J., L. Fairall, V. A. Huynh, and D. Rhodes. 2006. EMmeasurements define the dimensions of the ‘‘30-nm’’ chromatin fiber:
Biophysical Journal 97(2) 544–553
evidence for a compact, interdigitated structure. Proc. Natl. Acad. Sci.USA. 103:6506–6511.
5. Routh, A., S. Sandin, and D. Rhodes. 2008. Nucleosome repeat length
and linker histone stoichiometry determine chromatin fiber structure.
Proc. Natl. Acad. Sci. USA. 105:8872–8877.
6. Robinson, P. J., W. An, A. Routh, F. Martino, L. Chapman, et al. 2008.
30 nm chromatin fibre decompaction requires both H4–K16 acetylation
and linker histone eviction. J. Mol. Biol. 381:816–825.
7. Sims, 3rd, R. J., and D. Reinberg. 2008. Is there a code embedded in
proteins that is based on post-translational modifications? Nat. Rev.Mol. Cell Biol. 9:815–820.
8. Boulard, M., P. Bouvet, T. K. Kundu, and S. Dimitrov. 2007. Histone
variant nucleosomes: structure, function and implication in disease.
Subcell. Biochem. 41:71–89.
9. Gonzalez-Romero, R., J. Mendez, J. Ausio, and J. M. Eirin-Lopez.
2008. Quickly evolving histones, nucleosome stability and chromatin
folding: All about histone H2A.Bbd. Gene. 413:1–7.
10. Chadwick, B. P., and H. F. Willard. 2001. A novel chromatin protein,
distantly related to histone H2A, is largely excluded from the inactive
X chromosome. J. Cell Biol. 152:375–384.
11. Bao, Y., K. Konesky, Y. J. Park, S. Rosu, P. N. Dyer, et al. 2004. Nucle-
osomes containing the histone variant H2A.Bbd organize only 118 base
pairs of DNA. EMBO J. 23:3314–3324.
12. Doyen, C. M., F. Montel, T. Gautier, H. Menoni, C. Claudet, et al. 2006.
Dissection of the unusual structural and functional properties of the
variant H2A.Bbd nucleosome. EMBO J. 25:4234–4244.
13. Montel, F., E. Fontaine, P. St.-Jean, M. Castelnovo, and C. Faivre-
Moskalenko. 2007. Atomic force microscopy imaging of SWI/SNF action:
mapping the nucleosome remodeling and sliding. Biophys. J. 93:566–578.
14. Gautier, T., D. W. Abbott, A. Molla, A. Verdel, J. Ausio, et al. 2004.
Histone variant H2ABbd confers lower stability to the nucleosome.
EMBO Rep. 5:715–720.
15. Angelov, D., A. Verdel, W. An, V. Bondarenko, F. Hans, et al. 2004.
SWI/SNF remodeling and p300-dependent transcription of histone
variant H2ABbd nucleosomal arrays. EMBO J. 23:3815–3824.
16. Menoni, H., D. Gasparutto, A. Hamiche, J. Cadet, S. Dimitrov, et al.
2007. ATP-dependent chromatin remodeling is required for base exci-
sion repair in conventional but not in variant H2A.Bbd nucleosomes.
Mol. Cell. Biol. 27:5949–5956.
17. Zhou, J., J. Y. Fan, D. Rangasamy, and D. J. Tremethick. 2007. The
nucleosome surface regulates chromatin compaction and couples it
with transcriptional repression. Nat. Struct. Mol. Biol. 14:1070–1076.
18. Huynh, V. A., P. J. Robinson, and D. Rhodes. 2005. A method for the
in vitro reconstitution of a defined ‘‘30 nm’’ chromatin fibre containing
stoichiometric amounts of the linker histone. J. Mol. Biol. 345:957–968.
19. Luger, K., T. J. Rechsteiner, and T. J. Richmond. 1999. Expression and
purification of recombinant histones and nucleosome reconstitution.
Methods Mol. Biol. 119:1–16.
20. Mutskov, V., D. Gerber, D. Angelov, J. Ausio, J. Workman, et al. 1998.
Persistent interactions of core histone tails with nucleosomal DNA
following acetylation and transcription factor binding. Mol. Cell. Biol.18:6293–6304.
21. Lyubchenko, Y. L., P. I. Oden, D. Lampner, S. M. Lindsay, and
K. A. Dunker. 1993. Atomic force microscopy of DNA and bacterio-
phage in air, water and propanol: the role of adhesion forces. NucleicAcids Res. 21:1117–1123.
22. Gonzales, R. C., and P. Wintz. 1987. Digital Image Processing. 2nd ed.
Addison-Wesley, Reading, MA.
23. Koch, M. H., P. Vachette, and D. I. Svergun. 2003. Small-angle scat-
tering: a view on the properties, structures and structural changes of bio-
logical macromolecules in solution. Q. Rev. Biophys. 36:147–227.
24. Lowary, P. T., and J. Widom. 1998. New DNA sequence rules for high
affinity binding to histone octamer and sequence-directed nucleosome
positioning. J. Mol. Biol. 276:19–42.

AFM Visualization of Variant Chromatin 553
25. Claudet, C., D. Angelov, P. Bouvet, S. Dimitrov, and J. Bednar. 2005.
Histone octamer instability under single molecule experiment condi-
tions. J. Biol. Chem. 280:19958–19965.
26. Zlatanova, J., and S. H. Leuba. 2003. Chromatin fibers, one-at-a-time.
J. Mol. Biol. 331:1–19.
27. Dalal, Y., H. Wang, S. Lindsay, and S. Henikoff. 2007. Tetrameric
structure of centromeric nucleosomes in interphase Drosophila cells.
PLoS Biol. 5:e218.
28. Valle, F., M. Favre, P. De Los Rios, A. Rosa, and G. Dietler. 2005.
Scaling exponents and probability distributions of DNA end-to-end
distance. Phys. Rev. Lett. 95:158105.
29. Yodh, J. G., Y. L. Lyubchenko, L. S. Shlyakhtenko, N. Woodbury, and
D. Lohr. 1999. Evidence for nonrandom behavior in 208–12 subsatu-
rated nucleosomal array populations analyzed by AFM. Biochemistry.
38:15756–15763.
30. Poirier, M. G., M. Bussiek, J. Langowski, and J. Widom. 2008. Spon-
taneous access to DNA target sites in folded chromatin fibers. J. Mol.
Biol. 379:772–786.
31. Kepert, J. F., J. Mazurkiewicz, G. L. Heuvelman, K. F. Toth, andK. Rippe. 2005. NAP1 modulates binding of linker histone H1 to chro-matin and induces an extended chromatin fiber conformation. J. Biol.Chem. 280:34063–34072.
32. Lebedev, D. V., M. V. Filatov, A. I. Kuklin, A. K. Islamov, J. Stellbrink,et al. 2008. Structural hierarchy of chromatin in chicken erythrocytenuclei based on small-angle neutron scattering: Fractal nature of thelarge-scale chromatin organization. Crystallogr. Rep. 53:110–115.
33. Akiyama, S., S. Takahashi, T. Kimura, K. Ishimori, I. Morishima, et al.2002. Conformational landscape of cytochrome c folding studied bymicrosecond-resolved small-angle x-ray scattering. Proc. Natl. Acad.Sci. USA. 99:1329–1334.
34. Schiessel, H. 2006. The nucleosome: a transparent, slippery, sticky andyet stable DNA-protein complex. Eur. Phys, J.E. 19:251–262.
35. Wu, C., A. Bassett, and A. Travers. 2007. A variable topology for the30-nm chromatin fibre. EMBO Rep. 8:1129–1134.
36. Shogren-Knaak, M., H. Ishii, J. M. Sun, M. J. Pazin, J. R. Davie, et al.2006. Histone H4–K16 acetylation controls chromatin structure andprotein interactions. Science. 311:844–847.
Biophysical Journal 97(2) 544–553