chromatin techniques for plant cells
TRANSCRIPT

TECHNIQUES FOR MOLECULAR ANALYSIS
Chromatin techniques for plant cells
Chris Bowler1,2,*, Giovanna Benvenuto1, Pierre Laflamme1,†, Diana Molino1, Aline V. Probst3, Muhammad Tariq3,‡ and
Jerzy Paszkowski3,*
1Laboratory of Molecular Plant Biology, Stazione Zoologica Anton Dohrn, Villa Comunale, I-80121 Naples, Italy,2CNRS/ENS FRE2433, Organismes Photosynthetiques et Environnement, Departement de Biologie, Ecole Normale Superieure,
46 Rue d’Ulm, 75230 Paris Cedex 05, France, and3Laboratoire de Genetique Vegetale, Universite de Geneve, 30 Quai Ernest-Ansermet, CH-1211 Geneve 4, Switzerland
Received 8 February 2004; revised 9 June 2004; accepted 18 June 2004.*For correspondence (fax þ33 1 4432 3935; e-mail [email protected]; fax þ41 22 379 3107; e-mail [email protected]).†Present address: Department of Biological Sciences, Brock University, 500 Glenridge Ave., St Catharines, Ont., Canada.‡Present address: Centre for Molecular Biology Heidelberg, Im Neuenheimerfeld 282, D69120 Heidelberg, Germany.
Summary
A large number of recent studies have demonstrated that many important aspects of plant development are
regulated by heritable changes in gene expression that do not involve changes in DNA sequence. Rather, these
regulatory mechanisms involve modifications of chromatin structure that affect the accessibility of target
genes to regulatory factors that can control their expression. The central component of chromatin is the
nucleosome, containing the highly conserved histone proteins that are known to be subject to a wide range of
post-translational modifications, which act as recognition codes for the binding of chromatin-associated
factors. In addition to these histone modifications, DNA methylation can also have a dramatic influence on
gene expression. To accommodate the burgeoning interest of the plant science community in the epigenetic
control of plant development, a series of methods used routinely in our laboratories have been compiled that
can facilitate the characterization of putative chromatin-binding factors at the biochemical, molecular and
cellular levels.
Keywords: chromatin, chromatin immunoprecipitation, histone code, histones, mononucleosomes, nucleo-
somes.
Introduction
The DNA of a eukaryotic cell must be compacted several
thousand-fold in order for it to fit into the nucleus. Cells are
able to package their chromosome complement in such a
way that it remains accessible to regulatory proteins that can
activate or repress specific genes, repair damage, mediate
recombination and replicate the DNA during the cell cycle.
The term chromatin is used to describe packaged DNA. The
basic unit of chromatin is the nucleosome, which contains
approximately 146 bp of DNA wrapped almost twice around
a core histone octamer, composed of two molecules each of
the histones H2A, H2B, H3 and H4 (organized into an H3–H4
tetramer and two H2A–H2B dimers) (Luger et al., 1997). Each
nucleosome has a diameter of around 10 nm, although the
least compacted chromatin appears in the electron
microscope as a 30 nm diameter fibre, which contains the
linker histone H1 that binds to the 40–70 bp of DNA that
separates each nucleosome. These 30 nm fibres appear to
be helical structures containing around six nucleosomes per
turn, an arrangement that compacts the DNA around 40-fold
(Goodrich and Tweedie, 2002).
The 30 nm fibres appear to correspond to euchromatin,
the component of a eukaryotic genome that is actively
transcribed. Heterochromatin, on the contrary, is typically
silent transcriptionally and is characterized by higher order
packaging of the nucleosomes up to several thousand-
fold. Heterochromatin can be reversibly relaxed into
euchromatin to allow activation of gene expression, or
may be permanently inactive, for example, as found in
776 ª 2004 Blackwell Publishing Ltd
The Plant Journal (2004) 39, 776–789 doi: 10.1111/j.1365-313X.2004.02169.x

gene-poor regions of the genome such as peri-centromeric
regions.
The regulation of chromatin structure has a key role in the
epigenetic control of gene expression. A central mechanism
whereby chromatin can be modulated is by recognition by
chromatin remodelling proteins of post-translational mod-
ifications of highly charged and flexible histone tails, which
protrude from the nucleosomes. The core histones can be
modified (sometimes reversibly) by acetylation, methyla-
tion, phosphorylation, ubiquitination or ADP-ribosylation
(Fischle et al., 2003; Jenuwein and Allis, 2001; Strahl and
Allis, 2000). Lysine residues within the amino-terminal tails
are the best characterized sites for these modifications. For
example, actively transcribed genes are predominantly
associated with highly acetylated histones whereas inactive
genes are often characterized by the presence of hypoacet-
ylated histones in the nucleosomes that are associated with
them. Consequently, histone acetylation and deacetylation
reactions are thought to be central for the epigenetic control
of gene expression, by altering the accessibility of the
associated DNA to transcription factors and to chromatin
modifying proteins.
Histone tail modifications are often inter-connected, for
example, deacetylation of lysine 9 of histone H3 is a
prerequisite for its subsequent methylation, which pro-
motes binding of repressor proteins such as heterochroma-
tin protein 1, that maintain heterochromatin in an inactive
state (Rice and Allis, 2001). Examples such as this have lead
to the ‘histone code’ hypothesis, whereby combinatorial
post-translational modifications on different histone tails act
as recognition sequences for binding of different chromatin-
associated factors (Fischle et al., 2003; Jenuwein and Allis,
2001; Strahl and Allis, 2000). Such dynamic and reversible
modifications considerably extend the information potential
of DNA and provide heritable (although often reversible)
mechanisms for the epigenetic control of gene expression
during development.
In addition to histone modifications, the DNA itself can be
modified, most commonly by cytosine methylation, which
often characterizes inactive genes (Martienssen and Colot,
2001; Ng and Bird, 1999). Furthermore, RNA has also been
found associated with heterochromatin (Maison et al.,
2002).
Numerous chromatin-associated factors have now been
characterized, many of which mediate post-translational
histone tail modifications or DNA methylation. Major fam-
ilies include histone acetyltransferases (HATs), histone
deacetylases (HDACs), SET-domain containing proteins
(that typically methylate histones), and DNA methyltransf-
erases. In addition, SWI/SNF complexes modulate chroma-
tin compaction by ATP-dependent repositioning of
nucleosomes. Members from each of these families have
now been characterized in plants (Fransz and de Jong, 2002;
Goodrich and Tweedie, 2002; Wagner, 2003).
In addition, a range of factors that recognize histone and
DNA modifications are also known. Well known families
include bromodomain- and chromodomain-containing pro-
teins, that recognize specific histone modifications and
methylcytosine-binding domain proteins. A comprehensive
list of chromatin-related factors identified in plants is
available at http://www.chromdb.org.
Studies of chromatin-level epigenetic effects are now an
intense area of plant research. Most notably, they have been
inferred to be involved in the regulation of flowering time,
vernalization and photomorphogenesis (He et al., 2003;
Schafer and Bowler, 2002; Sung and Amasino, 2004). For
this reason, we have compiled a series of protocols routinely
used in our laboratories that can be of use for the investi-
gation of such mechanisms. Obviously, other equally useful
techniques have been developed or optimized in other
laboratories, so this article should be considered as a useful
starting point rather than an all-inclusive reference guide.
Some of the protocols we detail are in fact rather old and
have been derived from experiments of several decades
ago, in which basic studies were made of histone modifica-
tions and histone-binding proteins. For example, in vitro
experiments that study binding of proteins or complexes to
purified mononucleosomes can now be very useful for
characterizing putative chromatin-binding proteins, as can
separation of modified histones on acetic acid-urea-triton
(AUT) polyacrylamide gels. In addition, we detail a protocol
for chromatin immunoprecipitation (ChIP), a technique that
can be used to identify genes associated with particular
modified histones or chromatin-interacting proteins, and a
protocol for fluorescent in situ hybridization (FISH), which
can be used to reveal subnuclear sites in which modified
histones or associated factors are localized. All of these
techniques have now been greatly potentiated by the
availability of a large range of antibodies (many of which
are available commercially) that can reveal specific histone
tail modifications.
Methods
Isolation of mononucleosomes
Plant nuclei can be easily obtained from cauliflower florets
and used as a source of nuclear material such as nucleo-
somes. Furthermore, these nucleosomes can be depleted
of their H1 linker histones by limited nuclease digestion to
generate mononucleosomes which can then be fixed to a
chromatographic support and used for in vitro binding
studies as in Benvenuto et al. (2002). The protocol we
present here for isolating plant nuclei was adapted from
Foster et al. (1992), while the protocol for isolating mono-
nucleosomes was adapted from Schnitzler (2000). As a
close relative of Arabidopsis, cauliflower provides a con-
venient source of mononucleosomes that can be utilized
Chromatin techniques for plant cells 777
ª Blackwell Publishing Ltd, The Plant Journal, (2004), 39, 776–789

for studying chromatin-interacting proteins from Arabid-
opsis. If, on the contrary, Arabidopsis-derived mononucle-
osomes are required, the protocol described below should
be easily adaptable provided sufficient starting material is
available.
Isolation of nuclei from plants
Equipment and reagents. Note: All operations must be
carried out at 4�C, either in a cold room or on ice. All solu-
tions should be kept at 4�C, unless stated otherwise.
Cauliflower florets from a local market
Miracloth
Refrigerated high-speed centrifuge (e.g. Beckman Avanti
J-25; Beckman Coulter, Inc., Fullerton, CA, USA) with a fixed
angle rotor (e.g. Beckman JA 14, JA 25.50; Beckman)
Phenylmethylsulphonyl fluoride (PMSF) stock solution:
prepare a 100 mM stock solution in isopropanol and store in
a dark bottle at room temperature
Glycerol, sterile
Nuclei grinding buffer (NGB): 1 M hexylene glycol, 10 mM
PIPES/KOH (pH 7.0), 10 mM MgCl2, 0.2% Triton X-100, 5 mM
2-mercaptoethanol*, 0.8 mM PMSF* (*these components
should be added immediately prior to use)
Nuclei wash buffer (NWB): 0.5 M hexylene glycol, 10 mM
PIPES/KOH (pH 7.0), 10 mM MgCl2, 0.2% Triton X-100, 5 mM
2-mercaptoethanol*, 0.8 mM PMSF* (*these components
should be added immediately prior to use)
Experimental protocol. 1. Grind 200 g of cauliflower florets
in 800 ml of NGB in a commercial blender fitted with a
customized razor blade holder.
2. Filter the mixture through four layers of Miracloth and
centrifuge filtrate at 2000 g for 10 min at 4�C. Centrifuge
without brake.
3. Decant supernatant and gently resuspend the pellet in
40 ml of NWB and centrifuge at 3000 g for 10 min at 4�C.
Repeat this washing procedure two more times.
4. Gently resuspend the nuclei, following the last wash
step, with two volumes of NWB (with respect to the pellet
volume). Add an equal volume of sterile glycerol and mix
gently to obtain a homogeneous resuspension. Divide into
equal aliquots and store nuclei at )20�C until further
processing is required. If necessary, nuclei can be further
purified on a Percoll gradient according to Slatter et al.
(1991), although Percoll-purified nuclei are not necessary for
nucleosome isolation.
Isolation of H1-depleted oligonucleosomes from plant nuclei
Equipment and reagents. Note: All operations must be
carried out at 4�C, either in a cold room or on ice. All solu-
tions should be kept at 4�C, unless stated otherwise.
Washed plant nuclei (see above)
Refrigerated high-speed centrifuge (e.g. Beckman Avanti
J-25) with a fixed angle rotor (e.g. Beckman JA 25.50)
Refrigerated ultracentrifuge with a swing-out rotor (e.g.
Beckman SW28; Beckman)
UV spectrophotometer
Agarose- and SDS-polyacrylamide (vertical, mini slab)
(e.g. Bio-Rad Mini-Protean II; Bio-Rad Laboratories, Hercu-
les, CA, USA)-gel electrophoresis apparatus
Gradient maker, capable of holding 20 ml per side with a
side outlet, to prepare linear concentration gradients with a
volume of 32 ml, with a stirring mechanism
Thinwall polyallomer tubes (2.5 · 8.9 cm)
21-G needles
Tubing (1/16¢¢ ID · 1/8¢¢ OD) (e.g. Tygon-Schlauch ST;
Saint-Gobain Performance Plastic Corporation, Akron, OH,
USA)
Peristaltic pump
Potter homogenizer
Dialysis membrane, 6–8 kDa molecular weight cut off
(MWCO)
Proteinase K stock solution: prepare a 10 mg ml)1 stock
solution in water and store in aliquots at )20�CCentricon-10 concentrators (Amicon, INC, Beverly, MA,
USA)
Slide-a-Lyzer dialysis cassettes (7 kDa MWCO) (Pierce
Biotechnology, Inc., Rockford, IL, USA)
Phenylmethylsulphonyl fluoride stock solution: prepare a
100 mM stock solution in isopropanol and store in a dark
bottle at room temperature
Pepstatin A stock solution: prepare a 1 mM stock solution
in methanol and store at )20�CLeupeptin stock solution: prepare a 1 mM stock solution in
water and store at )20�CLow salt buffer (LSB): 20 mM HEPES, pH 7.5, 0.1 M NaCl,
1 mM EDTA, 1 mM b-mercaptoethanol (b-ME)*, 0.5 mM
PMSF* (*these components should be added immediately
prior to use)
Medium salt buffer (MSB): 20 mM HEPES, pH 7.5, 0.4 M
NaCl, 1 mM EDTA, 5% (v/v) glycerol, 1 mM b-ME*, 0.5 mM
PMSF*, 1 lM pepstatin A*, 1 lM leupeptin* (*these compo-
nents should be added immediately prior to use)
High salt buffer (HSB): 20 mM HEPES, pH 7.5, 0.65 M NaCl,
1 mM EDTA, 0.34 M sucrose, 0.5 mM PMSF* (*this compo-
nent should be added immediately prior to use)
2 M NaCl
0.1 M CaCl20.5 M ethylene glycol-bis(2-aminoethyl)-N,N,N¢,N¢-tetra-
acetic acid (EGTA), pH 8.0
High salt buffer, without sucrose, containing 10% (v/v) and
40% (v/v) glycerol (HSB/glycerol), respectively, for glycerol
gradients
0.5% (w/v) SDS
25 U ll)1 micrococcal nuclease (purchased as 500 U of
solid from Sigma, St Louis, MO, USA): resuspend in 10 ll of
100 mM Tris–HCl, pH 8.0, 0.1 mM CaCl2 and once resuspend-
ed add 10 ll of sterile glycerol and mix by pipetting.
778 Chris Bowler et al.
ª Blackwell Publishing Ltd, The Plant Journal, (2004), 39, 776–789

Micrococcal nuclease solution can be stored at )20�C in this
fashion and is stable for approximately 1 year (Note: Differ-
ent suppliers define micrococcal nuclease units differently
and therefore if a supplier other than Sigma is used, one
must be sure that the same unit definition is used, or
determine the proper conversion ratio to Sigma units)
Dialysis buffer: 20 mM HEPES, pH 7.5, 1 mM EDTA, 1 mM
b-ME*, 0.5 mM PMSF* (*these components should be added
immediately prior to use)
CNBr-activated Sepharose 4B (Amersham Pharmacia
Biotech, Piscataway, NJ, USA)
Experimental protocol. 1. Gently mix an aliquot of plant
nuclei suspension (prepared as above and stored at )20�C)
to obtain a homogeneous mixture.
2. Using a pipette, resuspend approximately 2 ml of plant
nuclei suspension with 40 ml MSB, divide equally among
two centrifuge tubes and centrifuge using a fixed angle rotor
at 10 000 g for 10 min at 4�C.
3. Resuspend the nuclear pellets with 4 vol of HSB (with
respect to the pellet volume), transfer to a Potter homoge-
nizer, homogenize with 40–50 strokes and centrifuge at
10 000 g for 20 min at 4�C.
4. Remove the gelatinous supernatant and place in
dialysis tubing (6–8 kDa MWCO), previously wetted and
rinsed with distilled water followed by LSB. Clamp the
dialysis tubing securely and dialyse overnight against 4 l of
cold LSB, at 4�C with gentle stirring.
5. Collect the dialysate and gently press along the sides of
the dialysis tubing to mix and collect any precipitated
oligonucleosomes.
6. Add 0.1 M CaCl2 to 3 mM (final) and warm the sample at
37�C for 5 min.
7. Add micrococcal nuclease (25 U ll)1) to the warmed
sample of oligonucleosomes to a final concentration of
0.01 U ll)1 and incubate at 37�C for 8 min.
8. Add 0.1 vol of 0.5 mM EGTA to the reaction mix and chill
on ice. This will terminate the nuclease digestion.
9. Add 2 M NaCl to the chilled reaction mixture, while
gently vortexing, to a final NaCl concentration of 0.6 M. Keep
on ice.
10. In a cold room, prepare 32 ml linear 10–40% glycerol
gradients using the respective HSB/glycerol buffers, in thin-
wall polyallomer centrifuge tubes (2.5 · 8.9 cm) with the use
of the peristaltic pump and gradient maker. The pump must
run at a flow rate of about 1.5 ml min)1 to avoid introducing
any air bubbles in the gradient. Place the outlet of the tubing
along the inside edge at the bottom of the tube slowly
moving the tubing upwards as the gradient carefully fills the
tube. The lighter glycerol-containing buffer is at the top.
11. Remove any precipitated protein and carefully apply
2 ml of the quenched digestion reaction on top of each
gradient and centrifuge in a swing-out rotor (e.g. Beckman-
type SW28) at 45 000 g for 20 h at 4�C.
12. Harvest the gradients by piercing the bottom edge of
the tubes with a 21-G needle attached to tubing which is
attached to a peristaltic pump, making sure the pump is not
operating during this time. Holding the needle with the
bevelled edge up, carefully pierce the tube and place the tip
of the needle near the bottom of the gradient. Cover the top
of the tube with Parafilm and gently apply pressure to start
the flow. Turn on the pump with a flow rate of about
1.5 ml min)1 avoiding any air bubble formation and collect
1 ml fractions. The fractions can be stored at 4�C while they
are being analysed.
13. Determine the DNA concentration in the fractions by
diluting an aliquot 10–40-fold in 2 M NaCl and measuring the
absorbance at 260 nm.
14. Digest aliquots of fractions (‡0.5 lg) with proteinase K
(0.5 mg ml)1) in 0.5% SDS for 60 min at 50�C.
15. The proteinase K-digested reaction products can be
analysed on 1.5% agarose/TBE gels and stained with
0.1 lg ml)1 ethidium bromide (Figure 1a). A smear of over-
digested DNA along with a band of DNA at approximately
150 bp (mononucleosomes) and larger bands equal to
approximately 150 bp with multiples of approximately
200 bp (di-, tri-, tetranucleosomes, etc.) should be observed,
whereby the smaller fragments will be located in fractions
isolated towards the top of the gradient (Figure 1a). Frac-
tions containing DNA which is smaller than 150 bp has been
overdigested and should not be considered for further
experimentation.
16. Analyse 5–20 ll of the glycerol gradient fractions on
15% SDS-PAGE gels and stain with Coomassie brilliant blue
for the presence of all four core histones (H2A, H2B, H3 and
Figure 1. Qualitative analysis of samples from a plant mononucleosome
preparation.
(a) Glycerol gradient fractions (from 18 to 26) loaded on a 1.5% agarose/TBE
gel after digestion with proteinase K. M is 100 bp ladder.
(b) Fractions 20 (polynucleosomes) to 26 (mononucleosomes) loaded on 15%
SDS-PAGE and stained with Coomassie brilliant blue.
Chromatin techniques for plant cells 779
ª Blackwell Publishing Ltd, The Plant Journal, (2004), 39, 776–789

H4) and for the absence of H1 in the mono- and dinucleo-
some containing fractions (Figure 1b).
17. Pool the H1-depleted mono- and dinucleosome-
containing fractions and concentrate to approximately
1 mg ml)1 using Centricon-10 concentrators according to
the manufacturer’s instructions.
18. Dialyse the concentrated samples against 100 vol of
dialysis buffer at 4�C for a minimum of 4 h using Slide-a-
Lyzer dialysis cassettes (7 kDa MWCO).
19. Dialysed mono- and dinucleosomes can be stored at
4�C for several weeks or frozen in liquid nitrogen and stored
at )80�C for up to 2 years.
An effective way of investigating protein–nucleosome
interactions is by immobilizing nucleosomes to CNBr-acti-
vated Sepharose 4B, as was carried out in Benvenuto et al.
(2002). Approximately 1 mg of a mixture of mono- and
di-nucleosomes can be immobilized to approximately 500 ll
of CNBr-activated Sepharose 4B according to the manufac-
turer’s instructions. Coupling of the ligand to the resin and
blocking of the remaining active groups is carried out
overnight at 4�C. The blocking buffer used is 200 mM
glycine, pH 8.0. The resin can be stored as a 50% slurry in
phosphate-buffered saline (PBS) at 4�C until ready for use.
Acetic acid-urea-triton polyacrylamide gels for analysing
histone variants
Acetic acid-urea-triton polyacrylamide gels allow for the
separation of modified histone variants (derived from dif-
ferent post-translational modifications) and histone H2A,
H2B, and H3 subtypes (derived from different gene prod-
ucts) based on charge and mass. The protocol we present
here is a modification of a procedure used by Boulikas
(1985) to resolve histone variants from calf thymus nuclei.
The addition of a non-ionic detergent such as Triton X-100
to the gels causes a differential reduction in the elec-
trophoretic mobility of the different histones as a result of
the formation of mixed micelles between the detergent and
the hydrophobic moieties of histones (Zweidler, 1978).
There are several early reports on the use of AUT gels,
either in one and/or two dimensions, to resolve histone
variants from plant sources (Moehs et al., 1988; Spiker,
1982; Spiker and Ley, 1976; Waterborg et al., 1987). The
advantage of using AUT gels is that they provide a
superior separation of histone variants with respect to
standard SDS-PAGE gels (see Figure 2), and when com-
bined with immunoblotting can allow the precise identifi-
cation of different bands corresponding to specific histone
modifications.
Equipment and reagents
Note: This gel electrophoresis system does not require a
stacking gel. Gel methods are for 60 · 100 · 0.75 mm gels.
All reagents must be of highest quality.
Vertical mini slab polyacrylamide gel electrophoresis
apparatus (e.g. Bio-Rad Mini-Protean II system)
Power supply
Vacuum pump or vacuum line
Stock acrylamide: 30% (w/v) acrylamide, N,N¢-methylene-
bis-acrylamide (BIS) (37.5:1), electrophoresis grade
Water, high quality (milliQ)
Glacial acetic acid (17.4 M)
Methanol
Urea, high quality
10% (w/v) Triton X-100 solution
10% (w/v) ammonium persulphate (APS) solution in water
N,N,N¢,N¢-tetramethylenediamine (TEMED)
b-mercaptoethanol
Sample buffer (1X): 0.9 M acetic acid, 20% (v/v) glycerol,
6 M urea, 0.05% (w/v) pyronin Y, 0.7 M b-ME* (*this compo-
nent should be added immediately prior to use)
Running buffer: 0.9 M acetic acid
Silver Stain Plus (Bio-Rad)
Experimental protocol
Preparation of gel. 1. Prepare the following resolving gel
(for one 15% acrylamide gel, 0.75 mm thick):
Component For 15% acrylamide gel (0.75 mm)30% Acrylamide stock 5.0 mlGlacial acetic acid (17.4 M) 517 ll (¼0.9 M final)10% Triton X-100 370 ll (¼0.37% final)Urea 3.6 g (¼6 M final)Water (milliQ) to 10 ml10% APS 125 llTEMED 50 ll
2. Dissolve the indicated quantity of urea in the stated
volume of acrylamide. While gently agitating, add the acetic
acid.
3. When the urea is completely dissolved, degas the
solution for 10 min under vacuum.
Figure 2. Differential separation of histones on SDS-PAGE and AUT gels.
Nucleosome fractions were loaded on a 15% SDS-PAGE gel and stained with
Coomassie brilliant blue (1) and on an AUT gel which was subsequently
stained with Silver Stain Plus (2).
780 Chris Bowler et al.
ª Blackwell Publishing Ltd, The Plant Journal, (2004), 39, 776–789

4. Add the Triton X-100 and swirl to mix, add the water to a
final volume of 10 ml and degas for 5 min.
5. Add the APS and degas for a further 5 min.
6. Add the TEMED, gently mix the solution avoiding air
bubbles and carefully pipette the gel solution between the
assembled glass plates with the well-forming comb parti-
ally inserted. After having completely filled the space
between the glass plates, gently, but firmly, insert the
comb to its limit in the gel solution, avoiding trapping air
bubbles underneath the comb. Allow to polymerize at
room temperature for a minimum of 1 h. Store gel(s) well-
wrapped with a moist paper towel in plastic film overnight
at room temperature.
7. Remove gels from wrapping and pre-electrophorese in
running buffer, with reversed polarity, at room temperature
at 130 V until the current no longer drops (4–5 h).
Sample preparation. 1. Prepare samples to be electro-
phoresed by resuspending lyophilized histones in 5 ll of 1X
sample buffer. However, if a fairly concentrated histone
preparation is used, as in the mononucleosome fractions, 1–
2 ll of sample can be added to 9 ll of 1X sample buffer. The
quantity of histones to be electrophoresed should be in the
order of 5 lg in order to view by Coomassie staining or 1 lg
to view by silver staining.
2. Replace pre-electrophoresis buffer with fresh running
buffer.
3. Load 5 ll (or 10 ll maximum, if using a concentrated
sample, as stated above) of each sample to be analysed.
Electrophoresis conditions. 1. Run gel(s) with reversed
polarity at room temperature, with agitation, at 150 V for
the initial 20 min and then decrease voltage to 100 V
and let electrophoresis proceed overnight (approximately
16–18 h).
2. After electrophoresis, gels can be visualized by either
Coomassie brilliant blue or silver staining (see step 3) or by
electrophoretic transfer and immunoblotting, as described
by Delcuve and Davie (1992). Immunoblotting using anti-
bodies that recognize specific histone modifications can
allow specific bands to be identified.
3. Stain gel(s) for 1 h with Coomassie brilliant blue or
silver staining according to the manufacturer’s instructions.
4. Resolution can be further improved by using a larger
gel electrophoresis apparatus.
Chromatin immunoprecipitation
Chromatin immunoprecipitation combines immunoprecipi-
tation of chromatin fragments and polymerase chain reac-
tion to map sites of protein–DNA interaction in vivo. The
ChIP technique has been successfully used in Drosophila
and yeast to study histone modifications of eu/heterochro-
matin and localization of regulatory chromatin factors. The
method relies on the rapid cross-linking of protein/DNA
complexes within the nucleus of living cells, followed by
chromatin isolation, its random shearing and immunopre-
cipitation with antibodies directed towards proteins of
interest. The amount of co-immunoprecipitated DNA is
analysed by PCR. The relative enrichment or depletion of a
particular DNA fragment in the immunoprecipitated fraction
reflects its in vivo association with the examined protein
(Hecht and Grunstein, 1999; Orlando et al., 1997).
In plants, ChIP was first used to map the subnuclear
distribution of linker histone variants in Arabidopsis thali-
ana (Ascenzi and Gantt, 1999). Further studies in plants
exploiting ChIP investigated the chromatin structure of the
pea plastocyanin gene (PetE) by determination of the
acetylation states of histones H3 and H4 and the nuclease
accessibility of this gene (Chua et al., 2001). The protocols
used for Arabidopsis as well as for pea were essentially
adopted, with slight modifications, from either Drosophila
(Orlando et al., 1997) or yeast (Hecht and Grunstein, 1999).
The major difficulty encountered in plants was the limiting
amount of material, as early protocols (Ascenzi and Gantt,
1999; Chua et al., 2001) required 100 g of Arabidopsis
tissue for a single ChIP experiment. This problem was
circumvented by recent studies that successfully combined
various protocols (Gendrel et al., 2002; Johnson et al.,
2002; Tariq et al., 2003). These methods used ChIP with
antibodies directed against modified histone tails and
allowed downscaling to 1–1.5 g of Arabidopsis. Here we
describe a ChIP protocol adapted from Gendrel et al. (2002)
with slight modifications.
Equipment and reagents
Miracloth
Formaldehyde (Fluka, Buchs SG, Switzerland)
Glycine 2 M
Double distilled autoclaved water
Vacuum chamber
Vortex
Rotator
Liquid nitrogen
Falcon tubes for 50 and 15 ml
Refrigerated centrifuge
Branson Sonifier 250 (Branson-sonifier, Frankfurt, Ger-
many)
Sheared salmon sperm DNA/protein A agarose mix
(Upstate Biotechnology, Lake Placid, NY, USA)
1 M Tris–HCl, pH 6.5
5 M NaCl
0.5 M EDTA
Heating block at 65�CProteinase K (14 mg ml)1; Boehringer Mannheim GmbH,
Mannheim, Germany)
Novagen pellet paint (CN Bioscience, Darmstadt, Ger-
many)
Chromatin techniques for plant cells 781
ª Blackwell Publishing Ltd, The Plant Journal, (2004), 39, 776–789

RNase A (DNase-free)
Phenol:chloroform:isoamylalcohol, 25:24:1
Chloroform
Ethanol
Extraction buffer 1 for 100 ml
0.4 M Sucrose 20 ml of 2 M stock10 mM Tris–HCl, pH 8.0 1 ml of 1 M stock5 mM b-ME 35 ll of 14.3 M stock0.1 mM PMSF 50 ll of 0.2 M stockProtease inhibitors Protease inhibitors should be added
immediately before use becausethey are quickly degraded
Aprotinin 100 ll of 1 mg ml)1 stockPepstatin A 100 ll of 1 mg ml)1
Leupeptin 100 ll of 1 mg ml)1
Antipain 100 ll of 1 mg ml)1
TPCK 100 ll of 3 mg ml)1
Benzamidine 100 ll of 1 mg ml)1
Extraction buffer 2 for 10 ml
0.25 M Sucrose 1.25 ml of 2 M stock10 mM Tris–HCl, pH 8.0 100 ll of 1 M stock10 mM MgCl2 100 ll of 1 M stock1% Triton X-100 0.5 ml of 20% stock5 mM b-ME 3.5 ll of 14.4 M stock0.1 mM PMSF 5 ll of 0.2 M stockProtease inhibitors 10 ll of each as in buffer 1
Extraction buffer 3 for 10 ml
1.7 M Sucrose 8.2 ml of 2 M stock10 mM Tris–HCl, pH 8.0 100 ll of 1 M stock0.15% Triton X-100 75 ll of 20% stock2 mM MgCl2 20 ll of 1 M stock5 mM BME 3.5 ll of 14.3 M stock0.1 mM PMSF 5 ll of 0.2 M stockProtease inhibitors as in buffer 1 and 2
Nuclei lysis buffer for 5 ml50 mM Tris–HCl, pH 8.0 0.25 ml of 1 M
10 mM EDTA 24 ll of 0.5 M
1% SDS 0.25 ml of 20%PMSF and protease inhibitors as in buffer 1
ChIP dilution buffer for 10 ml
1.1% Triton X-100 550 ll of 20%1.2 mM EDTA 24 ll of 0.5 M
16.7 mM Tris–HCl, pH 8.0 167 ll of 1 M
167 mM NaCl 334 ll of 5 M
PMSF and protease inhibitors as in buffer 1
Elution buffer for 20 ml
1% SDS 1 ml of 20%0.1 M NaHCO3 0.168 g
Low salt wash buffer for 50 ml
150 mM NaCl 1.5 ml of 5 M
0.1% SDS 0.25 ml of 20%1% Triton X-100 2.5 ml of 20%2 mM EDTA 200 ll of 0.5 M
20 mM Tris–HCl, pH 8.0 1 ml of 1 M
High salt wash buffer for 50 ml
500 mM NaCl 5 ml of 5 M
0.1% SDS 0.25 ml of 20%1% Triton X-100 2.5 ml of 20%2 mM EDTA 200 ll of 0.5 M
20 mM Tris–HCl, pH 8.0 1 ml 1 M
LiCl wash buffer for 50 ml
0.25 M LiCl 3.125 ml of 4 M
1% NP-40 2.5 ml of 20%1% sodium deoxycholate 0.5 g1 mM EDTA 100 ll of 0.5 M
10 mM Tris–HCl, pH 8.0 0.5 ml of 1 M
TE buffer for 50 ml
10 mM Tris–HCl, pH 8.0 5 ml of 1 M
1 mM EDTA 100 ll of 0.5 M
Experimental protocol
Note: All steps must be carried out at 4�C, unless stated
otherwise.
Preparation of plant material. 1. Sow Arabidopsis seeds on
soil covered with miracloth. Miracloth is needed to avoid soil
contamination during the harvest.
2. After 3–4 weeks (preferably 3 weeks), harvest 1.5 g of
seedlings in a 50 ml Falcon tube.
3. Rinse seedlings twice with 40 ml of double distilled (dd)
autoclaved water by gently shaking the tube (room tem-
perature).
Formaldehyde cross-linking. 4. After thoroughly removing
the water, submerge seedlings in 37 ml of 1% formaldehyde
in cross-linking solution, extraction buffer 1 (room tem-
perature) and vacuum infiltrate for 10 min.
5. Stop the cross-linking by addition of glycine to a final
concentration of 0.125 M (2.5 ml of 2 M glycine in 37 ml of
extraction buffer 1) and application of vacuum for additional
5 min. At this stage, seedlings should appear translucent.
6. Rinse seedlings twice with 40 ml cold dd autoclaved
water.
7. Remove water as thoroughly as possible by placing
seedlings on a paper towel before transferring to a new
Falcon tube. At this stage cross-linked material can be either
782 Chris Bowler et al.
ª Blackwell Publishing Ltd, The Plant Journal, (2004), 39, 776–789

frozen in liquid nitrogen and stored at )80�C or processed
further for chromatin isolation at step 8.
Isolation and sonication of chromatin. 8. Pre-cool mortar
and pestle by filling with liquid nitrogen before placing
seedlings in the rest of the liquid nitrogen and grinding them
to a fine powder.
9. Resuspend the powder in 30 ml extraction buffer 1 (4�C)
in a 50 ml Falcon tube.
10. Filter the solution through four layers of miracloth into
a new 50 ml Falcon tube.
11. Spin the filtered solution for 20 min at 2880 g at 4�C.
12. Gently remove supernatant and resuspend the pellet
in 1 ml of extraction buffer 2.
13. Transfer the solution to 1.5 ml Eppendorf tube.
14. Centrifuge at 12 000 g for 10 min at 4�C.
15. Remove the supernatant and resuspend pellet in
300 ll of extraction buffer 3.
16. Overlay the resuspended pellet onto 300 ll of extrac-
tion buffer 3 in a fresh Eppendorf tube.
17. Spin for 1 h at 16 000 g at 4�C.
18. Remove the supernatant and resuspend the chromatin
pellet in 300 ll of nuclei lysis buffer by vortexing and
pipetting up and down (keep solution at 4�C). At this stage
save a 1–2 ll aliquot for later examination. Aliquots taken at
this step as well as at step 21 (see below) must be treated as
described in ‘elution and reverse cross-linking’ procedure
(see below) before analysing on the gel.
19. Once resuspended, sonicate the chromatin solution
for 10 sec, four times on 5% power (setting 3) using
a Branson Sonifier 250, to shear DNA to approximately
0.5–2 kb DNA fragments. The sonicated chromatin solution
can be frozen at )80�C or processed to step 20 for immu-
noprecipitation.
Immunoprecipitation. 20. Spin the sonicated chromatin
suspension for 5 min at 4�C (16 000 g) to pellet debris.
21. Remove supernatant to a new tube. Use an aliquot of
1–2 ll to check sonication efficiency by reverse cross-linking
(follow from step 35) and electrophoretic determination of
the average size of DNA fragments as compared with the
aliquot from step 18 (Figure 3).
22. Split the 200 ll into two tubes with 100 ll each.
23. Add 900 ll of ChIP dilution buffer to each tube. This
dilutes the SDS to 0.1% SDS.
24. Pre-clear each chromatin sample with 40 ll of salmon
sperm-sheared DNA/protein A agarose beads for at least 1 h
at 4�C with gentle agitation. Prior to use, the beads should be
rinsed three times and resuspended in ChIP dilution buffer.
25. Spin the chromatin/beads solution at 4�C for 2 min at
16 000 g.
26. Combine the two 1 ml supernatants into a 15 ml
Falcon tube, and then split the 2 ml into three Eppendorf
tubes (666 ll each).
27. Add 4 ll of antibody, for example, anti-H3K4Me or
anti-H3K9Me to two of the three tubes (anti-histone H3
di-methylated at K4 and K9 from Upstate Biotechnology;
concentrations may vary between batches of antibodies and
the titre should be determined empirically). The third tube
without antibody should be used as mock/negative control.
28. Incubate overnight at 4�C with gentle agitation.
29. Collect immunoprecipitate with 40 ll of protein A
agarose beads (rinsed in ChIP dilution buffer) for at least 1 h
at 4�C with gentle agitation.
30. Prepare fresh elution buffer (1% SDS, 0.1 M NaHCO3).
31. Pellet beads by centrifugation (2 min, 16 000 g) and
wash them with gentle agitation for 10 min at 4�C each
wash, using 1 ml of buffer per wash followed by pelleting
the beads. Apply the following washes in the order listed
below:
(a) Low salt wash buffer (one wash).
(b) High salt wash buffer (one wash).
(c) LiCl wash buffer (one wash).
(d) TE buffer (two washes).
After the final wash, remove TE thoroughly.
Elution and reverse cross-linking of chromatin. 32. Release
bead-bound complexes by adding 250 ll of elution buffer
(made fresh at step 30) to the pelleted beads.
33. Vortex briefly to mix and incubate at 65�C for 15 min
with gentle agitation.
Figure 3. Analysis of purified DNA from plantlets cross-linked (X-linked) for
10 min to check sonication efficiency. Lanes 1 and 2: Aliquots of cross-linked
chromatin taken at step 18 (before sonication) were reverse cross-linked and
purified DNA was analysed on an agarose gel. DNA before sonication is
visible as a high molecular weight fraction (white arrow). Lanes 3 and 4:
Purified DNA from aliquots taken at step 21 (after sonication). The smear
between 0.5 and 3 kb shows the sheared DNA after sonication. M, marker kb
ladder; ), before sonication; þ, after sonication.
Chromatin techniques for plant cells 783
ª Blackwell Publishing Ltd, The Plant Journal, (2004), 39, 776–789

34. Spin beads and carefully transfer the supernatant
(eluate) to a fresh tube and repeat elution of beads. Combine
the two eluates.
35. Add 20 ll 5 M NaCl to the eluate to reverse the cross-
links by an overnight incubation at 65�C.
36. Add 10 ll of 0.5 M EDTA, 20 ll 1 M Tris–HCl, pH 6.5,
and 1.5 ll of 14 mg ml)1 proteinase K to the eluate and
incubate for 1 h at 45�C.
37. Extract DNA by phenol/chloroform (equal volume) and
precipitate with ethanol in the presence of Novagen pellet
paint (CN Bioscience). Wash pellets with 70% ethanol.
38. Resuspend the pellet in 40–50 ll of TE supplemented
with 10 lg ml)1 RNase A (Roche Pharmaceuticals, Nutley,
NJ, USA). The immunoprecipitated and purified DNA is then
used in PCR reactions to amplify examined target sequence
in relation to a reference sequence (internal control), prefer-
ably in a multiplex PCR in order to quantify the enrichment or
depletion of target(s) as compared with the reference and
mock control. If multiplex PCR does not work because of
different melting temperatures for primers, the DNA precipi-
tated in ChIP can be normalized by using a primer
pair (Johnson et al., 2002) specific for the 5¢ end of
ACTIN2/7 (a constitutively expressed gene assumed to be
euchromatic).
39. Use 0.5 ll for a 25 ll PCR reaction. The amount of
recovered templates may vary between experiments
depending upon efficiency of immunoprecipitation, thus
PCR conditions, for example, number of cycles may need
adaptation. The real time PCR quantification may be used as
an alternative.
ChIP on microarray (ChIP on chip). Studies in yeast and
Drosophila have combined ChIP and DNA microarrays
commonly called ChIP on chip (Iyer et al., 2001; Nal et al.,
2001; Ng et al., 2002). The possibility to apply the immuno-
precipitated DNA to a microarray allows the determination
of genome-wide patterns of chromatin protein associations
and/or to examine the global distribution of particular his-
tone modifications. After standard ChIP protocol, the puri-
fied DNA is amplified linearly by ligation-mediated PCR and
labelled with fluorophores (Cy3 or Cy5) (Iyer et al., 2001).
ChIP on chip has been successfully used in yeast and animal
systems (Iyer et al., 2001; Nal et al., 2001; Ng et al., 2002),
and recently it has also been described in plants to identify
specific regions of tobacco genes associated with acetylated
histones (Chua et al., 2004).
Fluorescence in situ hybridization
Fluorescence in situ hybridization allows the specific detec-
tion of DNA sequences within cytological preparations.
Hybridizations to metaphase or (with higher resolution)
pachytene chromosomes can be used to map multicopy and
unique sequences relative to euchromatin and heterochro-
matin regions (Fransz et al., 2000). FISH on interphase
nuclear spreads has been employed to study the organiza-
tion of heterochromatin and euchromatin in the interphase
nucleus and to examine the effects of mutations affecting
epigenetic inheritance and/or chromatin structure (Probst
et al., 2003; Soppe et al., 2002).
Plants with larger genomes and/or large numbers of
chromosomal repeats (wheat, barley, rye) have been pref-
erentially used in DNA FISH experiments (Nkongolo et al.,
1993; Pedersen and Linde-Laursen, 1994). Technical
improvements over the years have allowed studies of plants
with smaller genomes such as the model plant A. thaliana
with a genome size of only 130 Mb and a nuclear size of only
approximately 5 lm (Bauwens et al., 1991; Fransz et al.,
1998; Maluszynska and Heslop-Harrison, 1991; Murata and
Motoyoshi, 1995). Because its genome is fully sequenced
and many genetic resources are available, we exclusively
focus this part of the methodology on Arabidopsis.
Nuclei of diploid Arabidopsis contain 10 chromosomes,
and each of them displays a conspicuous heterochromatin
region, called chromocenter, marking the position of cen-
tromeric and peri-centromeric DNA (Figure 4a–d). In addi-
tion, nucleolus organizing regions present on chromosomes
2 and 4 form the clearly distinct nucleolus (Figure 4b). The
centromeric DNA consists of the core repeats (180 bp
repeats, Figure 4a), flanked by peri-centric heterochromatin
containing remnants of transposons and other dispersed
repeats (Haupt et al., 2001). Euchromatic loops of one
chromosome emanate from its defined chromocenter and
mark a chromosome territory (Fransz et al., 2002).
On interphase spreads, the DNA-FISH technique has so far
been mainly applied to analyse the structural organization of
repetitive sequences associated with chromocenters. How-
ever, recent reports prove the feasibility to use selected BAC
clones (Fransz et al., 2002) or a combination of BACs
representing a chromosome to visualize whole chromoso-
mal territories (Lysak et al., 2001, 2003).
Equipment and reagents
Glass staining jars
Moist chamber
Microscope slides, coverslips (24 · 32 mm; Menzel-Gla-
ser, Braunschweig, Germany)
Heating plate with precise temperature settings
Waterbath
Fluorescence microscope with camera system (e.g. Zeiss;
Zeiss, Feldbach, Switzerland) and fluorescence filters for
4¢,6-diamidino-2-phenylindole (DAPI), FITC and TRITC
Acetic acid (Fluka)
Ethanol (Fluka)
Citrate buffer (10 mM Na-citrate, pH 4.5)
Cellulase, pectolyase, cytohelicase (Sigma)
Biotin-dUTP, digoxigenin-dUTP (Roche)
DIG and Biotin Nick translation mix (Roche)
784 Chris Bowler et al.
ª Blackwell Publishing Ltd, The Plant Journal, (2004), 39, 776–789

0.5 M EDTA, pH 8.0
20x SSC (sodium chloride/sodium citrate buffer)
1 M Tris–HCl, pH 7.5
1.5 M NaCl
Phosphate-buffered saline, pH 7.4
Paraformaldehyde (PFA) (Sigma)
RNase A (DNase-free; Gibco, Langley, OK, USA)
1 M Sodium phosphate, pH 7.0
Deionized formamide (Sigma)
Dextran sulphate (Sigma)
Tween-20 (Merck, Darmstadt, Germany)
Non-fat dry milk (Bio-Rad)
Blocking reagent (Roche)
Texas Red-conjugated avidin (Vector Laboratories, Peter-
borough, UK)
Biotinylated goat-anti-avidin antibody (Vector Laborator-
ies)
Mouse anti-digoxigenin antibody (Roche)
FITC-conjugated rabbit anti-mouse antibody (Sigma)
Alexa 488 conjugated goat anti-rabbit antibody (Molecular
Probes, Leiden, the Netherlands)
Vectashield mounting medium (Vector Laboratories)
DAPI
Experimental protocol
Plant material. The nuclear architecture in interphase nuclei
is best studied in the tissue of young rosette leaves (1–
1.5 cm) that are not expected to display any mitotic activity
(Donnelly et al., 1999). If wild type and mutants are to be
compared, it is important that leaf samples are collected
from plants grown under identical conditions and of the
same age or at comparable developmental stage (best
before bolting). Multiple mutant and control plants
should be processed simultaneously in order to assess
variation between individuals.
Metaphase chromosome spreads can be obtained from
root tips of young seedlings and pachytene chromosomes
from young flower buds with the appropriate meiotic stages
(Ross et al., 1996).
Preparation of leaf nuclear spreads for analysis of interphase
nuclei. 1. Fix young rosette leaves (1–1.5 cm) in freshly
prepared ethanol/acetic acid solution mixed in a proportion
of 3:1, change the solution at least three times till the tissue
is completely white. It is possible to store the fixed material
at )20�C until use.
2. Wash the leaves twice with ddH2O and twice with citrate
buffer.
3. Cut the leaves with a scalpel into three to four pieces.
4. Incubate the tissue with cellulase, pectolyase and
cytohelicase (all at 0.3% w/v) in citrate buffer for 3 h at
37�C. Use just enough volume to cover the tissue.
5. Stop the incubation by dilution with 1 ml of citrate
buffer.
6. Move one piece of leaf to a clean slide (add a small drop
of citrate buffer if necessary) and tap the tissue with forceps,
so that single cells are released (the suspension should not
dry out). If the suspension still contains larger cell clumps,
the digestion time needs to be extended.
7. Add 20 ll of 60% acetic acid to the suspension and stir
for 1 min on a heating plate set to 45�C. At this step the
nuclei are spread on the glass slide and freed from acid-
soluble proteins and cytoplasmic components.
8. Surround the acetic acid spot with ethanol/acetic acid
solution (3:1, use approximately 500 ll) and mix by tilting
the slide. Wash the slide in ddH2O, post-fix for 5 min in 2%
PFA in PBS, wash again with ddH2O and air dry. All washing
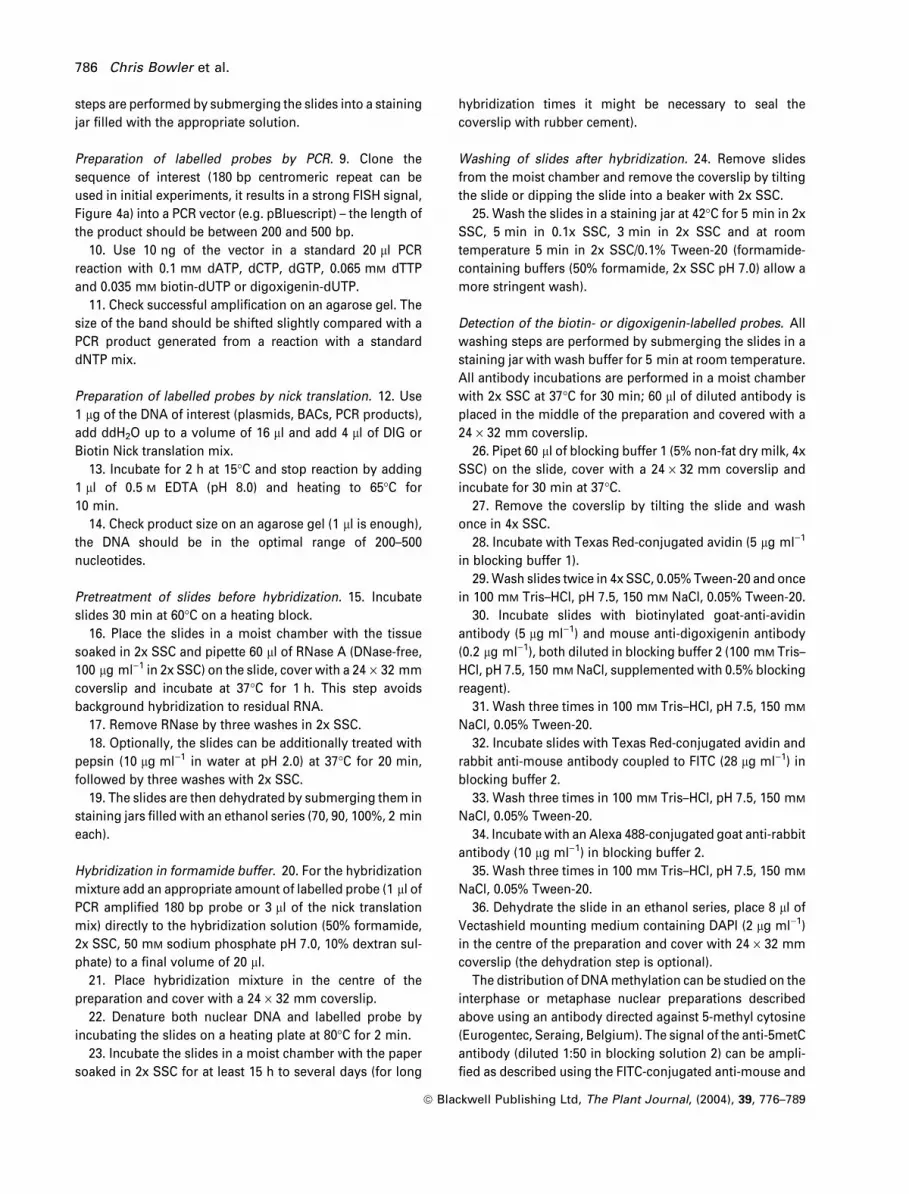
Figure 4. Visualization of different structures within interphase nuclear
spreads of wild type Arabidopsis thaliana. The DAPI staining (left panels)
reveals intensely stained regions termed chromocenters. They can be
visualized using a biotin-labelled centromere-specific 180 bp probe (a, right
panel). The nucleolus organizer regions (NORs) on chromosomes 2 and 4,
encoding rRNA, are likewise mainly heterochromatic and contribute to four
chromocenters (b, right panel). In contrast to the Rabl configuration observed
in wheat and barley (Abranches et al., 1998; Jasencakova et al., 2001),
centromeres in Arabidopsis thaliana do not accumulate at one pole of the
nucleus (a, b), but are distributed at the nuclear periphery. The telomeres
assemble around the nucleolus (c, right panel). To study the distribution of
methylated DNA, an antibody raised against 5metC (Eurogentec) can be
applied to spread nuclei. DNA methylation levels are higher in heterochro-
matin of chromocenters (d, right panel).
Chromatin techniques for plant cells 785
ª Blackwell Publishing Ltd, The Plant Journal, (2004), 39, 776–789
steps are performed by submerging the slides into a staining
jar filled with the appropriate solution.
Preparation of labelled probes by PCR. 9. Clone the
sequence of interest (180 bp centromeric repeat can be
used in initial experiments, it results in a strong FISH signal,
Figure 4a) into a PCR vector (e.g. pBluescript) – the length of
the product should be between 200 and 500 bp.
10. Use 10 ng of the vector in a standard 20 ll PCR
reaction with 0.1 mM dATP, dCTP, dGTP, 0.065 mM dTTP
and 0.035 mM biotin-dUTP or digoxigenin-dUTP.
11. Check successful amplification on an agarose gel. The
size of the band should be shifted slightly compared with a
PCR product generated from a reaction with a standard
dNTP mix.
Preparation of labelled probes by nick translation. 12. Use
1 lg of the DNA of interest (plasmids, BACs, PCR products),
add ddH2O up to a volume of 16 ll and add 4 ll of DIG or
Biotin Nick translation mix.
13. Incubate for 2 h at 15�C and stop reaction by adding
1 ll of 0.5 M EDTA (pH 8.0) and heating to 65�C for
10 min.
14. Check product size on an agarose gel (1 ll is enough),
the DNA should be in the optimal range of 200–500
nucleotides.
Pretreatment of slides before hybridization. 15. Incubate
slides 30 min at 60�C on a heating block.
16. Place the slides in a moist chamber with the tissue
soaked in 2x SSC and pipette 60 ll of RNase A (DNase-free,
100 lg ml)1 in 2x SSC) on the slide, cover with a 24 · 32 mm
coverslip and incubate at 37�C for 1 h. This step avoids
background hybridization to residual RNA.
17. Remove RNase by three washes in 2x SSC.
18. Optionally, the slides can be additionally treated with
pepsin (10 lg ml)1 in water at pH 2.0) at 37�C for 20 min,
followed by three washes with 2x SSC.
19. The slides are then dehydrated by submerging them in
staining jars filled with an ethanol series (70, 90, 100%, 2 min
each).
Hybridization in formamide buffer. 20. For the hybridization
mixture add an appropriate amount of labelled probe (1 ll of
PCR amplified 180 bp probe or 3 ll of the nick translation
mix) directly to the hybridization solution (50% formamide,
2x SSC, 50 mM sodium phosphate pH 7.0, 10% dextran sul-
phate) to a final volume of 20 ll.
21. Place hybridization mixture in the centre of the
preparation and cover with a 24 · 32 mm coverslip.
22. Denature both nuclear DNA and labelled probe by
incubating the slides on a heating plate at 80�C for 2 min.
23. Incubate the slides in a moist chamber with the paper
soaked in 2x SSC for at least 15 h to several days (for long
hybridization times it might be necessary to seal the
coverslip with rubber cement).
Washing of slides after hybridization. 24. Remove slides
from the moist chamber and remove the coverslip by tilting
the slide or dipping the slide into a beaker with 2x SSC.
25. Wash the slides in a staining jar at 42�C for 5 min in 2x
SSC, 5 min in 0.1x SSC, 3 min in 2x SSC and at room
temperature 5 min in 2x SSC/0.1% Tween-20 (formamide-
containing buffers (50% formamide, 2x SSC pH 7.0) allow a
more stringent wash).
Detection of the biotin- or digoxigenin-labelled probes. All
washing steps are performed by submerging the slides in a
staining jar with wash buffer for 5 min at room temperature.
All antibody incubations are performed in a moist chamber
with 2x SSC at 37�C for 30 min; 60 ll of diluted antibody is
placed in the middle of the preparation and covered with a
24 · 32 mm coverslip.
26. Pipet 60 ll of blocking buffer 1 (5% non-fat dry milk, 4x
SSC) on the slide, cover with a 24 · 32 mm coverslip and
incubate for 30 min at 37�C.
27. Remove the coverslip by tilting the slide and wash
once in 4x SSC.
28. Incubate with Texas Red-conjugated avidin (5 lg ml)1
in blocking buffer 1).
29. Wash slides twice in 4x SSC, 0.05% Tween-20 and once
in 100 mM Tris–HCl, pH 7.5, 150 mM NaCl, 0.05% Tween-20.
30. Incubate slides with biotinylated goat-anti-avidin
antibody (5 lg ml)1) and mouse anti-digoxigenin antibody
(0.2 lg ml)1), both diluted in blocking buffer 2 (100 mM Tris–
HCl, pH 7.5, 150 mM NaCl, supplemented with 0.5% blocking
reagent).
31. Wash three times in 100 mM Tris–HCl, pH 7.5, 150 mM
NaCl, 0.05% Tween-20.
32. Incubate slides with Texas Red-conjugated avidin and
rabbit anti-mouse antibody coupled to FITC (28 lg ml)1) in
blocking buffer 2.
33. Wash three times in 100 mM Tris–HCl, pH 7.5, 150 mM
NaCl, 0.05% Tween-20.
34. Incubate with an Alexa 488-conjugated goat anti-rabbit
antibody (10 lg ml)1) in blocking buffer 2.
35. Wash three times in 100 mM Tris–HCl, pH 7.5, 150 mM
NaCl, 0.05% Tween-20.
36. Dehydrate the slide in an ethanol series, place 8 ll of
Vectashield mounting medium containing DAPI (2 lg ml)1)
in the centre of the preparation and cover with 24 · 32 mm
coverslip (the dehydration step is optional).
The distribution of DNA methylation can be studied on the
interphase or metaphase nuclear preparations described
above using an antibody directed against 5-methyl cytosine
(Eurogentec, Seraing, Belgium). The signal of the anti-5metC
antibody (diluted 1:50 in blocking solution 2) can be ampli-
fied as described using the FITC-conjugated anti-mouse and
786 Chris Bowler et al.
ª Blackwell Publishing Ltd, The Plant Journal, (2004), 39, 776–789
the Alexa 488-conjugated anti-rabbit antibodies as described
above (see also Figure 4d). The detection of methylated DNA
can be combined with FISH for one DNA sequence using a
biotin-labelled probe.
Immunostaining
The DNA-FISH procedure described allows study of the DNA
organization in the nucleus and to perform cytological
mapping. Nuclear proteins, however, can only be detected
using alternative fixation methods that better preserve the
nuclear structure and the distribution of nuclear proteins, for
example, using cross-linkers such as (para)formaldehyde.
The experimental procedure should preserve the antige-
nicity of the target proteins, provide maximal accessibility of
the antibody to its antigen and reduce autofluorescence to a
minimum. In previous studies nuclei have been directly
released from the fixed tissue into isolation buffer (Mayr
et al., 2003), which guarantees immediate preservation of
their structure. However, in our experience this method
results in low amounts of nuclei and thus may require
enrichment by flow sorting. We routinely apply a protocol
adapted from Arnim et al., from the 1996 Cold Spring Harbor
Arabidopsis Course (http://www.arabidopsis.org/info/proto-
cols.jsp), which involves isolation of leaf mesophyll
protoplasts. This method guarantees a sufficient number
of nuclei per preparation with low autofluorescence levels
(Figure 5a,b). It must be remembered that the nucleus may
undergo structural changes during protoplast isolation.
However, in our experiments in which we compare the
nuclear organization of wild type and gene silencing
mutants, the results are comparable with other methods
(Probst et al., 2003; Soppe et al., 2002).
Equipment and reagents
Tilting and horizontal shakers
50 and 100 lm meshes
Benchtop centrifuge (e.g. from Hettich, Universal II;
Hettich, Tuttlingen, Germany)
Snap-cap tubes
Moist chamber
Glass staining jars
Microscope slides, coverslips (24 · 32 and 24 · 24 mm;
Menzel-Glaser)
Vacuum pump and vacuum chamber
Fluorescence microscope with deconvolution option or
confocal microscope
Bovine serum albumin (BSA)
Paraformaldehyde (PFA)
Whatman paper
Digestion solution (1% cellulase, 0.25% macerozyme,
10 mM MES, pH 5.7, 0.4 M mannitol, 30 mM CaCl2, 5 mM b-
ME and 0.1% BSA)
Wash solution (4 mM MES, pH 5.7, 2 mM KCl and 0.5 M
mannitol)
PHEM buffer (6 mM PIPES, 25 mM HEPES, 10 mM EGTA,
2 mM MgCl2, pH 6.9)
Phosphate-buffered saline, pH 7.4
Poly-lysine solution (0.1% w/v in water; Sigma)
NP-40 (Sigma)
Methanol (Fluka)
Acetone (Fluka)
Antibody against the protein of interest
Fluorescently labelled secondary antibody [e.g. Alexa 488-
coupled goat anti-rabbit antibody (Molecular Probes) or
Alexa 488-coupled goat anti-mouse antibody (Molecular
Probes)]
Vectashield mounting medium (Vector Laboratories)
DAPI
Experimental protocol
Isolation of protoplasts. 1. Harvest young rosette leaves
from soil-grown plants and cut the tissue in digestion solu-
tion into 3–4 pieces.
2. Apply vacuum for 2 min to facilitate uptake of the
digestion solution into the tissue.
3. Incubate the leaf tissue for 3–3.5 h on a tilting shaker
(15 rpm, Polymax 1040; Heidolph Instruments, Cinnamin-
son, NJ, USA) at room temperature.
4. Shake the tissue at 100 rpm on a horizontal shaker
(Adolf Kuhner AG, Birsfelden, Switzerland) for 10 min to
release protoplasts.
5. Filter suspension through a 100 lm and a 50 lm mesh.
6. Pellet cells in a 15 ml snap-cap tube in the protoplast
centrifuge at low rpm for 5 min and remove the digestion
solution.
7. Resuspend the protoplasts in 10 ml of wash solution
and invert tube gently several times.
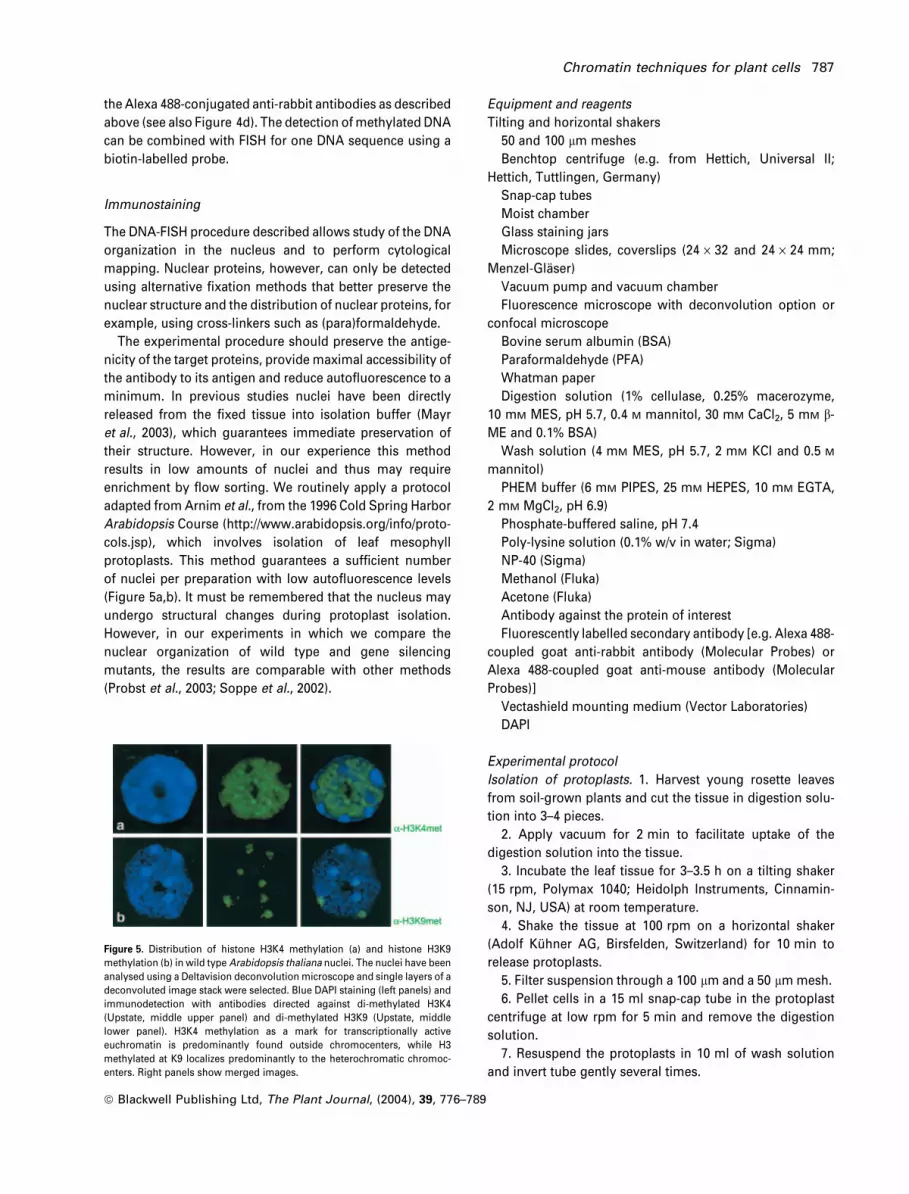
Figure 5. Distribution of histone H3K4 methylation (a) and histone H3K9
methylation (b) in wild type Arabidopsis thaliana nuclei. The nuclei have been
analysed using a Deltavision deconvolution microscope and single layers of a
deconvoluted image stack were selected. Blue DAPI staining (left panels) and
immunodetection with antibodies directed against di-methylated H3K4
(Upstate, middle upper panel) and di-methylated H3K9 (Upstate, middle
lower panel). H3K4 methylation as a mark for transcriptionally active
euchromatin is predominantly found outside chromocenters, while H3
methylated at K9 localizes predominantly to the heterochromatic chromoc-
enters. Right panels show merged images.
Chromatin techniques for plant cells 787
ª Blackwell Publishing Ltd, The Plant Journal, (2004), 39, 776–789

8. Repeat washing and centrifugation.
9. To generate poly-lysine coated slides, flame slides
quickly, cool to room temperature and distribute 10 ll
of poly-lysine on the slide, air-dry and flame the slide again.
10. Gently resuspend the protoplast pellet in approxi-
mately 200 ll of wash solution and place a drop on the
poly-lysine coated slides placed in a moist chamber with
PBS-soaked tissue – let the protoplasts settle for about 1 h.
Fixation of protoplasts. 11. Carefully remove non-adherent
protoplasts by tilting the slide.
12. Fix the protoplasts in a staining jar in freshly prepared
2% PFA in PHEM buffer (to dissolve the PFA, the fixation
solution can be vortexed and heated to maximum 55�C) for
10 min at room temperature, permeabilize them for 5 min in
0.5% NP-40 in PHEM buffer at room temperature, and post-
fix in methanol:acetone 1:1 at )20�C for 10 min.
Immunodetection. 13. Rehydrate the protoplasts with three
washes (5 min each) in PBS (all washing steps are per-
formed by submerging the slides in a staining jar with PBS
or PBS þ NP-40 for 5 min at room temperature).
14. Pipet 60 ll of 2% BSA in PBS on the slide, cover with a
24 · 32 mm coverslip and incubate for 30 min at 37�C in a
wet chamber.
15. Incubate the slides with 40 ll of the primary antibody
diluted in 1% BSA in PBS overnight at 4�C in a moist
chamber and cover with a 24 · 24 mm coverslip.
16. Wash the slides once in PBS, once in PBS with 0.1%
NP40 and again with PBS.
17. Incubate with fluorescently labelled secondary anti-
body [e.g. Alexa 488-coupled goat anti-rabbit antibody (use
20 lg ml)1) or Alexa 488-coupled goat anti-mouse antibody
(use 10 lg ml)1)] diluted in 0.5% BSA in PBS for 45 min at
37�C.
18. Wash as in step 16.
19. Wipe the slides from the back, add 6 ll of Vectashield
mounting medium containing DAPI (2 lg ml)1) to the centre
of the preparation and cover with a 24 · 24 mm coverslip,
remove excessive washing solution carefully with a small
strip of Whatman paper.
If it is desired to combine immunostaining and FISH on
the same nucleus, the slides have first to be processed as for
immunostaining. After incubation with the fluorescently
labelled secondary antibody, the slides are dehydrated in an
ethanol series (2 min in 70%, 2 min in 90% and 2 min in
100%), air-dried and baked at 60�C for 30 min on a heating
block. Following an RNase treatment (100 lg ml)1 in 2x SSC)
for 1 h at 37�C, the slides are washed in PBS, post-fixed in 4%
PFA in PBS for 20 min at 4�C, washed again in PBS,
dehydrated in an ethanol series and air-dried. Hybridization,
washing and detection of the labelled probe are then carried
out as for FISH on spread nuclei from step 21 (Jasencakova
et al., 2003).
Acknowledgements
CB would like to thank Steven Spiker for supplying purified wheathistones and anti-H2B antibodies, which have been very useful forestablishing the methods reported here. JP would like to thank PaulFransz, Ingo Schubert and Steve Jacobsen for help and discussionsduring establishment of ChIP and cytology methodologies. PL wassupported in Naples by a postdoctoral fellowship from the Fondspour la Formation de Chercheurs et l’Aide a la Recherche (FCAR)(Quebec, Canada). CB acknowledges funding from the EuropeanUnion (contract QLK5-CT-2000-00357), the Italian Ministry forResearch and Education (FIRB contract RBNE01CFKB) and theItalian Ministry of Agriculture and Forestry (contract EcoPom).
References
Abranches, R., Beven, A.F., Aragon-Alcaide, L. and Shaw, P.J. (1998)Transcription sites are not correlated with chromosome territor-ies in wheat nuclei. J. Cell Biol. 143, 5–12.
Ascenzi, R. and Gantt, J.S. (1999) Subnuclear distribution of theentire complement of linker histone variants in Arabidopsisthaliana. Chromosoma, 108, 345–355.
Bauwens, S., Van Oostveldt, P., Engler, G. and Van Montagu, M.
(1991) Distribution of the rDNA and three classes of highlyrepetitive DNA in the chromatin of interphase nuclei of Arabid-opsis thaliana. Chromosoma, 101, 41–48.
Benvenuto, G., Formiggini, F., Laflamme, P., Malakhov, M. and
Bowler, C. (2002) The photomorphogenesis regulator DET1 bindsthe amino-terminal tail of histone H2B in a nucleosome context.Curr. Biol. 12, 1529–1534.
Boulikas, T. (1985) Electrophoretic separation of histones and high-mobility-group proteins on acid-urea-triton gels. Anal. Biochem.149, 379–386.
Chua, Y.L., Brown, A.P. and Gray, J.C. (2001) Targeted histoneacetylation and altered nuclease accessibility over short regionsof the pea plastocyanin gene. Plant Cell, 13, 599–612.
Chua, Y.L., Mott, E., Brown, A.P., MacLean, D. and Gray, J.C. (2004)Microarray analysis of chromatin-immunoprecipitated DNAidentifies specific regions of tobacco genes associated withacetylated histones. Plant J. 37, 789–800.
Delcuve, G.P. and Davie, J.R. (1992) Western blotting and immun-ochemical detection of histones electrophoretically resolved onacid-urea-triton and sodium dodecyl sulfate-polyacrylamide gels.Anal. Biochem. 200, 339–341.
Donnelly, P.M., Bonetta, D., Tsukaya, H., Dengler, R.E. and Dengler,
N.G. (1999) Cell cycling and cell enlargement in developing leavesof Arabidopsis. Dev. Biol. 215, 407–419.
Fischle, W., Wang, Y. and Allis, C.D. (2003) Binary switches andmodification cassettes in histone biology and beyond. Nature,425, 475–479.
Foster, R., Gash, A., Kay, S. and Chua N.-H. (1992) Analysis of pro-tein/DNA interactions. In Methods in Arabidopsis Research(Koncz, C., Chua, N.-H. and Schell, J., eds). Singapore: WorldScientific, pp. 378–392.
Fransz, P.F. and de Jong, J.H. (2002) Chromatin dynamics in plants.Curr. Opin. Plant Biol. 5, 560–567.
Fransz, P., Armstrong, S., Alonso-Blanco, C., Fischer, T.C., Torres-
Ruiz, R.A. and Jones, G. (1998) Cytogenetics for the model systemArabidopsis thaliana. Plant J. 13, 867–876.
Fransz, P.F., Armstrong, S., de Jong, J.H., Parnell, L.D., van Drunen,
C., Dean, C., Zabel, P., Bisseling, T. and Jones, G.H. (2000)Integrated cytogenetic map of chromosome arm 4S of A. thali-ana: structural organization of heterochromatic knob and cen-tromere region. Cell, 100, 367–376.
788 Chris Bowler et al.
ª Blackwell Publishing Ltd, The Plant Journal, (2004), 39, 776–789

Fransz, P., de Jong, J.H., Lysak, M., Castiglione, M.R. and Schubert,
I. (2002) Interphase chromosomes in Arabidopsis are organizedas well defined chromocenters from which euchromatin loopsemanate. Proc. Natl Acad. Sci. USA, 99, 14584–14589.
Gendrel, A.V., Lippman, Z., Yordan, C., Colot, V. and Martienssen,
R.A. (2002) Dependence of heterochromatic histone H3 methyla-tion patterns on the Arabidopsis gene DDM1. Science, 297, 1871–1873.
Goodrich, J. and Tweedie, S. (2002) Remembrance of things past:chromatin remodeling in plant development. Ann. Rev. Cell Dev.Biol. 18, 707–746.
Haupt, W., Fischer, T.C., Winderl, S., Fransz, P. and Torres-Ruiz, R.A.
(2001) The centromere1 (CEN1) region of Arabidopsis thaliana:architecture and functional impact of chromatin. Plant J. 27, 285–296.
He, Y., Michaels, S.D. and Amasino, R.M. (2003) Regulation offlowering time by histone acetylation in Arabidopsis. Science,302, 1751–1754.
Hecht, A. and Grunstein, M. (1999) Mapping DNA interaction sites ofchromosomal proteins using immunoprecipitation and polym-erase chain reaction. Methods Enzymol. 304, 399–414.
Iyer, V.R., Horak, C.E., Scafe, C.S., Botstein, D., Snyder, M. and
Brown, P.O. (2001) Genomic binding sites of the yeast cell-cycletranscription factors SBF and MBF. Nature, 409, 533–538.
Jasencakova, Z., Meister, A. and Schubert, I. (2001) Chromatinorganization and its relation to replication and histone acetylationduring the cell cycle in barley. Chromosoma, 110, 83–92.
Jasencakova, Z., Soppe, W.J., Meister, A., Gernand, D., Turner, B.M.
and Schubert, I. (2003) Histone modifications in Arabidopsis-highmethylation of H3 lysine 9 is dispensable for constitutiveheterochromatin. Plant J. 33, 471–480.
Jenuwein, T. and Allis, C.D. (2001) Translating the histone code.Science, 293, 1074–1080.
Johnson, L., Cao, X. and Jacobsen, S. (2002) Interplay between twoepigenetic marks. DNA methylation and histone H3 lysine 9methylation. Curr. Biol. 12, 1360–1367.
Luger, K., Mader, A.W., Richmond, R.K., Sargent, D.F. and Rich-
mond, T.J. (1997) Crystal structure of the nucleosome core par-ticle at 2.8 A resolution. Nature, 389, 251–260.
Lysak, M.A., Fransz, P.F., Ali, H.B. and Schubert, I. (2001) Chromo-some painting in Arabidopsis thaliana. Plant J. 28, 689–697.
Lysak, M.A., Pecinka, A. and Schubert, I. (2003) Recent progress inchromosome painting of Arabidopsis and related species. Chro-mosome Res. 11, 195–204.
Maison, C., Bailly, D., Peters, A.H., Quivy, J.P., Roche, D., Taddei, A.,
Lachner, M., Jenuwein, T. and Almouzni, G. (2002) Higher-orderstructure in pericentric heterochromatin involves a distinct pat-tern of histone modification and an RNA component. NatureGenet. 30, 329–334.
Maluszynska, J. and Heslop-Harrison, J.S. (1991) Localization oftandemly repeated DNA sequences in Arabidopsis thaliana. PlantJ. 1, 159–166.
Martienssen, R.A. and Colot, V. (2001) DNA methylation and epi-genetic inheritance in plants and filamentous fungi. Science, 293,1070–1074.
Mayr, C., Jasencakova, Z., Meister, A., Schubert, I. and Zink, D.
(2003) Comparative analysis of the functional genome architec-ture of animal and plant cell nuclei. Chromosome Res. 11, 471–484.
Moehs, C.P., McElwain, E.F. and Spiker, S. (1988) Chromosomalproteins of Arabidopsis thaliana. Plant Mol. Biol. 11, 507–515.
Murata, M. and Motoyoshi, F. (1995) Floral chromosomes of Ara-bidopsis thaliana for detecting low-copy DNA sequences byfluorescence in situ hybridization. Chromosoma, 104, 39–43.
Nal, B., Mohr, E. and Ferrier, P. (2001) Location analysis of DNA-bound proteins at the whole-genome level: untangling tran-scriptional regulatory networks. Bioessays, 23, 473–476.
Ng, H.H. and Bird, A. (1999) DNA methylation and chromatinmodification. Curr. Opin. Genet. Dev. 9, 158–163.
Ng, H.H., Robert, F., Young, R.A. and Struhl, K. (2002) Genome-widelocation and regulated recruitment of the RSC nucleosome-remodeling complex. Genes Dev. 16, 806–819.
Nkongolo, K.K., Lapitan, N.L., Quick, J.S. and Muhlmann, M.D.
(1993) An optimized fluorescence in situ hybridization procedurefor detecting rye chromosomes in wheat. Genome, 36, 701–705.
Orlando, V., Strutt, H. and Paro, R. (1997) Analysis of chromatinstructure by in vivo formaldehyde cross-linking. Methods, 11,205–214.
Pedersen, C. and Linde-Laursen, I. (1994) Chromosomal locations offour minor rDNA loci and a marker microsatellite sequence inbarley. Chromosome Res. 2, 65–71.
Probst, A.V., Fransz, P.F., Paszkowski, J. and Scheid, O.M. (2003)Two means of transcriptional reactivation within heterochroma-tin. Plant J. 33, 743–749.
Rice, J.C. and Allis, C.D. (2001) Histone methylation versus histoneacetylation: new insights into epigenetic regulation. Curr. Opin.Cell Biol. 13, 263–273.
Ross, K.J., Fransz, P. and Jones, G.H. (1996) A light microscopicatlas of meiosis in Arabidopsis thaliana. Chromosome Res. 4,507–516.
Schafer, E. and Bowler, C. (2002) Phytochrome-mediated photo-perception and signal transduction in higher plants. EMBORep. 3,1042–1048.
Schnitzler, G.R. (2000) Isolation of histones and nucleosome coresfrom mammalian cells. In Current Protocols in Molecular Biology(Ausubel, F.M., Brent, R., Kingston, R.E., Moore, D.D., Seidman,J.G., Smith, J.A. and Struhl, K., eds). New York: Green Publishing/Wiley Interscience, pp. 21.5.3–21.5.5.
Slatter, R.E., Dupree, P., and Gray J.C. (1991) A scaffold-associatedDNA region is located downstream of the pea plastocyanin gene.Plant Cell, 3, 1239–1250.
Soppe, W.J., Jasencakova, Z., Houben, A., Kakutani, T., Meister, A.,
Huang, M.S., Jacobsen, S.E., Schubert, I. and Fransz, P.F. (2002)DNA methylation controls histone H3 lysine 9 methylation andheterochromatin assembly in Arabidopsis. EMBO J. 21, 6549–6559.
Spiker, S. (1982) Histone variants in plants. J. Biol. Chem. 257,14250–14255.
Spiker, S. and Ley, J.L. (1976) Identification and fractionation ofplant histones. Arch. Biochem. Biophys. 176, 510–518.
Strahl, B.D. and Allis, C.D. (2000) The language of covalent histonemodifications. Nature, 403, 41–45.
Sung, S. and Amasino, R.M. (2004) Vernalization and epigenetics:how plants remember winter. Curr. Opin. Plant Biol. 7, 4–10.
Tariq, M., Saze, H., Probst, A.V., Lichota, J., Habu, Y. and Pasz-
kowski, J. (2003) Erasure of CpG methylation in Arabidopsisalters patterns of histone H3 methylation in heterochromatin.Proc. Natl Acad. Sci. USA, 100, 8823–8827.
Wagner, D. (2003) Chromatin regulation of plant development. Curr.Opin. Plant Biol. 6, 20–28.
Waterborg, J.H., Winicov, I. and Harrington, R.E. (1987) Histonevariants and acetylated species from the Alfalfa plant Medicagosativa. Arch. Biochem. Biophys. 256, 167–178.
Zweidler, A. (1978) Resolution of histones by polyacrylamide gelelectrophoresis in presence of non-ionic detergents. Meth. CellBiol. 17, 223–265.
Chromatin techniques for plant cells 789
ª Blackwell Publishing Ltd, The Plant Journal, (2004), 39, 776–789