phase transition in reconstituted chromatin
TRANSCRIPT

arX
iv:q
-bio
/040
7011
v3 [
q-bi
o.SC
] 1
0 Se
p 20
04
Phase Transition in Reconstituted Chromatin
Tonau Nakai and Kenichi Yoshikawa∗
Department of Physics,
Graduate School of Science,
Kyoto University & CREST,
Kyoto 606-8502, Japan
Kohji Hizume, Shige. H. Yoshimura, and Kunio Takeyasu
Graduate School of Biostudies,
Kyoto University, Kyoto 606-8502, Japan
(Dated: February 9, 2008)
Abstract
By observing reconstituted chromatin by fluorescence microscopy (FM) and atomic force mi-
croscopy (AFM), we found that the density of nucleosomes exhibits a bimodal profile, i.e., there is
a large transition between the dense and dispersed states in reconstituted chromatin. Based on an
analysis of the spatial distribution of nucleosome cores, we deduced an effective thermodynamic
potential as a function of the nucleosome-nucleosome distance. This enabled us to interpret the
folding transition of chromatin in terms of a first-order phase transition. This mechanism for the
condensation of chromatin is discussed in terms of its biological significance.
PACS numbers: 87.15.He, 64.75.+g, 36.20.Ey
1

Genomic DNA in eukaryotes is compactly folded into chromatin through several hierar-
chical packings [1]. The fundamental unit of such packing, the nucleosome, consists of 146 bp
of DNA wrapped around a histone octamer (two molecules each of H2A, H2B, H3 and H4).
The semi-flexible DNA chain wraps around a histone core about two turns [2]. It is widely
expected that the manner of packing and the dynamics of nucleosomes are associated with
gene activities in living cells [3–6]. There have been many studies on the static [7–10] and
dynamic [11] properties of nucleosomes. It has been shown that nucleosomes condense under
various conditions; for example, under a high salt concentration [12]. However, the nature of
the higher-order structure is not well understood and the underlying physics of nucleosome
condensation have not yet been clarified. It has been suggested, for example, that mea-
surement of the actual interaction energy between nucleosomes is essential [8,11,13,14] for
obtaining deeper insight into chromatin condensation, but there have been no experimental
studies on the interaction potential.
On the other hand, it has recently been found that linear DNA larger than several tens
of base pairs exhibits a large discrete coil-globule transition, accompanied by a change in
density on the order of 104–105, upon the addition of various kinds of condensing agents
[15,16]. It has been revealed that this transition is a first-order phase transition under the
criterion of Landau, i.e., an ON/OFF transition from an elongated coil state to a compact
globule state [17]. Very recently, such an ON/OFF transition of DNA has been suggested
to play an important role in gene activity [17]. Discreteness of the coil-globule transition is
a general characteristic of single semi-flexible polymer chains [18].
The purpose of this study was to obtain a deeper understanding of the conformational
changes of chromatin, which is essential for obtaining insight into genetic activity including
duplication, transcription, etc. We investigated the physical properties of reconstituted chro-
2

matin using fluorescence microscopy (FM) and atomic force microscopy (AFM). We obtained
the pair interaction potential between nucleosome cores from an analysis of AFM images
and used it to dissect the mechanism of chromatin compaction, or chromatin condensation
[19].
The preparation of core histones and 106-kbp plasmids (circular DNA) and the reconsti-
tution of chromatin were carried out as previously reported [20]. In this study, the mass ratio
[histone]/[DNA] was set to 1.0 and 1.3. Concentration of NaCl, which affects the interac-
tion between nucleosomes [7], was 50 mM throughout this article. Reconstituted chromatin
samples were fixed with 0.3% glutaraldehyde in 10mM Hepes-NaOH [pH 7.5] for 30 minutes
at 25˚C. The chromatin was placed on a freshly cleaved thin piece of mica (thickness; ca.
30–50 µm) stuck to a glass cover plate (Matsunami Glass, No. 1, Japan) for FM obser-
vation. The mica surface was pre-treated with 10 mM spermidine. This treatment was
performed so that chromatin would adsorb onto the mica surface. The chromatin complexes
were visualized by fluorescent microscopy using a fluorescent dye, 0.1 µM 4’, 6-diamidino-
2-phenylindole (DAPI). The observation was performed on a droplet (10 µL) instilled on
mica. The sample droplet on mica was washed with Millipore water and blown dry with
nitrogen gas for 5 minutes. Fluorescent chromatin complexes were observed under a Zeiss
Axiovert 200 microscope with a 100× oil-immersed objective lens at 25˚C, and recorded
on Axio Vision with an AxioCam camera. To obtain two-dimensional real-time fluorescent
image data, an inverted microscope (IX-70, Olympus) with a 100× oil-immersed objective
lens and a highly sensitive EB-CCD camera with an image-processing system (Hamamatsu
Photonics) were used. The video data were recorded on videotapes, and then analyzed with
personal computers. Due to the blurring effect [21] in the observation with a highly sensitive
video system, the size of observed DNA images was assumed to be slightly larger (ca. 0.3
3

µm) than the actual size of the chromatin. The reconstituted chromatin structures observed
by FM observation were analyzed under Tapping ModeTM in AFM (Nanoscope Bioscope,
Digital Instruments) in air at room temperature. Both FM and AFM images were obtained
on exactly the same chromatin. The distance distribution of nucleosomes was obtained on
AFM images acquired with a high-resolution AFM apparatus (Nanoscope IIIa).
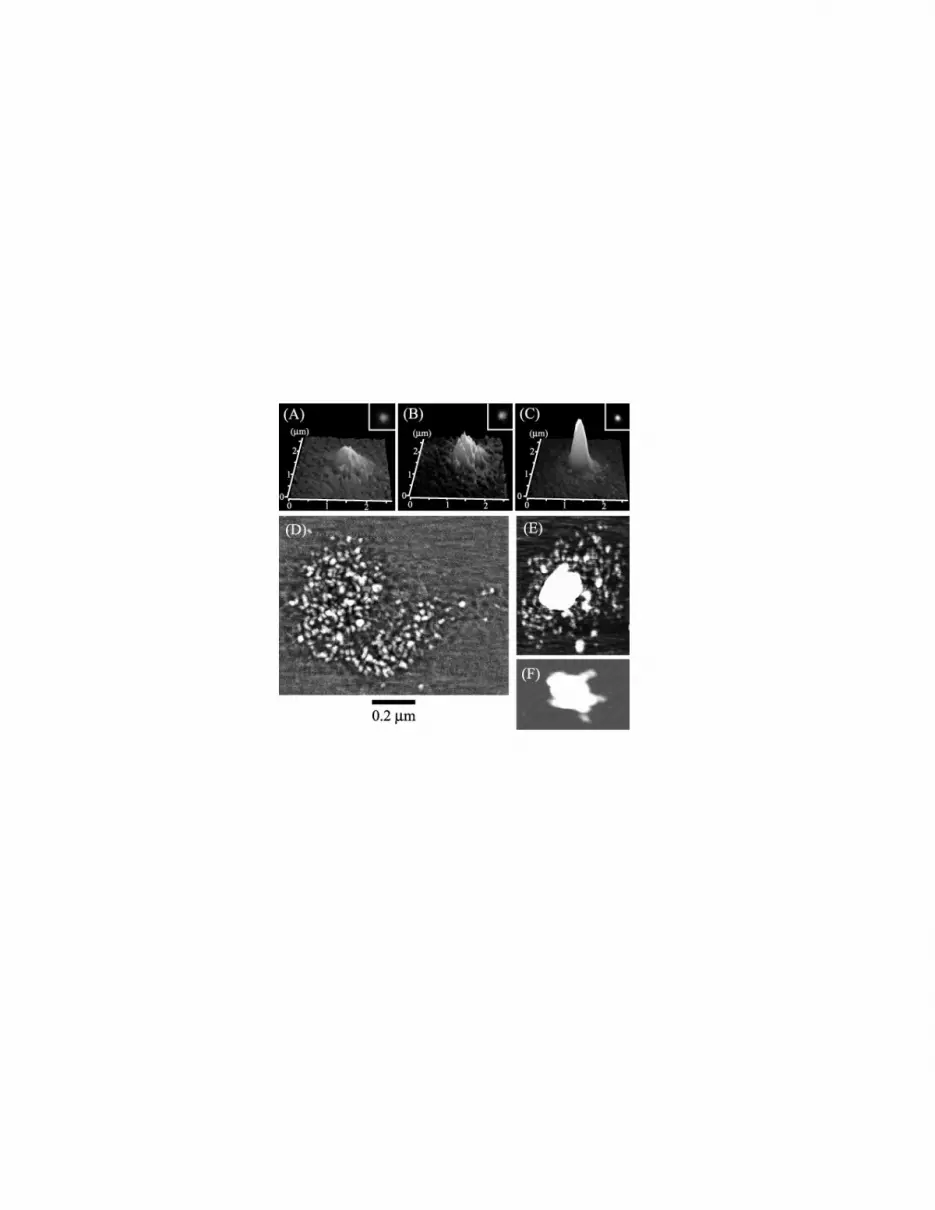
Figure 1 shows quasi-three-dimensional (3D) FM images (A–C), corresponding 2D images
(insets), and AFM images (D–F) of reconstituted chromatin adsorbed onto a mica surface.
The pictures in Fig. 1 (A, D), (B, E), and (C, F) show exactly the same molecules [22]. The
mass ratio [histone]/[DNA] is 1.0 in (A, D) and 1.3 in (B, C, E, and F). In (D), nucleosomes
are dispersed in the chromatin, whereas in (E) the condensed and dispersed parts coexist.
In (F) the chromatin is entirely condensed. Under the condition [histone]/[DNA] = 1.3, the
partially and entirely condensed states exist in almost equal proportions, while there is a
very low proportion (< 5%) of the dispersed state. Under [histone]/[DNA] = 1.0, more than
95% of chromatin is in the dispersed state, while the remainder is in the partially condensed
state. Despite the low resolution, FM observation provides information on the degree of
condensation of individual reconstituted chromatin in the bulk solution as well as on the
surface.
To evaluate the actual size of reconstituted chromatin in bulk solution, we measured the
Brownian motion of individual chromatin complexes using FM. From the time-dependence
of the mean square displacement of the center of mass of chromatin, we obtained the dif-
fusion constant D using the following relationship: 〈(r(0) − r(t))2〉 = 4Dt [23]. The hy-
drodynamic radius RH is thus deduced as in Table I using the Stokes-Einstein relationship,
RH = kBT/(6πηD), where kB is the Boltzmann constant, T is the absolute temperature
and η is the viscosity of the solvent (0.89 mPas for pure water at T = 297 K). We also
4

evaluated the size of reconstituted chromatin by AFM measurement. The major axis RL
and the minor axis RS of reconstituted chromatin were measured in two-dimensional AFM
images. Table I shows RL and RS, together with RAFM =√
RLRS. The relative ratio of
RAFM/RH is almost the same for [histone]/[DNA] ratios both of 1.0 and 1.3, regardless of
the difference in the observed state, i.e., the former is chromatin on a surface and the latter
is chromatin in bulk solution.
We obtained the distribution of distances N(r) as a function of the distance r between
pairs of nucleosomes in AFM images. It is expected that nucleosomes exhibit a nearly
equilibrium structure on a 2D mica surface [24]. We assumed that the radial distribu-
tion function g(r) is proportional to N(r)/r. Since the nucleosome density is low enough
with [histone]/[DNA] = 1.0 (see Fig. 1(A)), the pair potential can be roughly deduced
from g(r) assuming a Boltzmann distribution, U(r) = −kBT ln g(r) [25–27], where g(r) and
U(r) were calculated after fitting N(r) to a polynomial. The analysis was performed for
[histone]/[DNA] = 1.0, since in this condition we can count all of the nucleosomes in recon-
stituted chromatin. The result is shown in Fig. 2 and indicates that U(r) has a minimum
0.3 kBT depth at r ≈ 13 nm. By fitting the experimental data in Fig. 2 with the following
equation of potential, U(r) = −Ar−µ + Br−ν (µ, ν: integer; µ < ν), we obtain A = 2.4, B
= 12, µ = 9, and ν = 23, where r is normalized with the diameter of a nucleosome (11 nm).
These values are much larger than those of the Lennard-Jones potential (µ = 6 and ν =
12). The large values of the exponents can be attributed to the large excluded volume of the
nucleosome core. A similar profile of potential, i.e., relatively large values for the exponents
µ and ν, can also be deduced from an analysis of the interaction of neighboring nucleosomes
along the DNA chain (data not shown). Such large values of the exponents can explain the
discrete nature of the transition as described below.
5

Next, we will discuss the conformational stability of chromatin based on the above pair
interaction energy. The total free energy F of reconstituted chromatin with n nucleosomes
can be described as
F (n) = Fela + Fint(n), (1)
where Fela is the entropic elasticity of the DNA chain and Fint(n) is the volume interaction
between nucleosomes. We neglect the volume interaction of double-stranded DNA, since the
thickness of DNA (∼ 2 nm) is much smaller than the diameter of a nucleosome (∼ 11 nm).
Using the swelling parameter α, we obtain
Fela/kBT = α2 + α−2, (2)
where α2 = 〈R2〉/〈R20〉. 〈R2〉 is the mean square of the radius of gyration and R0 is the
analogous size of an ideal Gaussian coil. α2 and α−2 correspond to extension and compres-
sion of the chain, respectively [28]. Assuming that U(r) has a narrow minimum so that
nucleosome-nucleosome interaction occurs only among the nearest neighbors, we can take
Fint(n) ∼ nU(r). By adapting U(r) = −Ar−9 + Br−23, Fint(n) can be written as
Fint(n, ρ)/kBT ∼ −Anρ3 + Bnρ7.7, (3)
where ρ is the normalized density of nucleosomes, ρ ≈ r−3. Thus, we obtain
F (n, ρ)/kBT ∼ α2 + α−2 − Anρ3 + Bnρ7.7. (4)
In the present model, R0 decreases with an increase in n. Thus, we define L as the apparent
6

contour length of chromatin, L = L0 − an, where L0 is the contour length of DNA without
any histones (36 µm for this sample), and a is the length of DNA wrapped around a histone
octamer, ca. 50 nm (146 bp). With the Kuhn length λ (100 nm for a DNA chain) and the
number of Kuhn segments NS, the size of an ideal Gaussian chain is described as 〈R20〉1/2 =
λN1/2
S . Since NS = L/λ, we obtain a modified R0, which we call R′
0, 〈R′20 〉1/2 = λ(L/λ)1/2 =
λ1/2L1/2. Using the relation ρ ∼ nR−3, we obtain
F (n, ρ)
nkBT=
ρ−2/3
n1/3λ(L0 − an)+
λ(L0 − an)
n5/3ρ2/3 − Aρ3 + Bρ7.7. (5)
It is obvious that F (n, ρ)/nkBT has two minima. The one at the lower-density region is
derived from the first and second terms in Eq. (5) and the other at the higher-density region
is derived from the third and fourth terms. As n increases, the minimum of the condensed
state becomes deeper while a double-minimum profile is maintained. When the two minima
have a similar depth, two different states of high and low nucleosome density coexist. Figure
3 shows the free-energy profiles of nucleosomes with n = 400, 500 and 600 calculated with
Eq. (5) together with schemes of the corresponding conformations in three dimensions.
The observed result regarding the elongated conformation in Fig. 1 corresponds to the
deeper minimum at ρ ≈ 0. With an increase in n, the free energy of the condensed state
becomes the absolute minimum, which reproduces the experimental trend. In the actual
experiment for [histone]/[DNA] = 1.3, there are two different states: fully condensed and
partially condensed. Any instability due to the interfacial energy between the condensed and
dispersed parts should be negligible considering the zero-dimensional nature of the interface.
Therefore, we can expect the appearance of an intrachain phase-segregated state as in Fig.
1(B). Previous studies on native linear DNA chains have indicated that a phase-segregated
7

state is actually observed in individual DNA molecules and that the characteristic scale of
segregation depends on the degree of the surviving electronic charge in the condensed part
[29,30].
Several biological studies have demonstrated that the higher-order folding of chromatin
fiber and its dynamic structural changes largely depend on the proper functions of various
structural and regulatory proteins in the nucleus [31,32], which are critical for gene expression
and chromosome segregation. On the other hand, the results obtained in this study, together
with those in several previous studies [11,33], suggest that the physical properties of a DNA
strand (length and superhelicity) and the interaction between nucleosomes play fundamental
roles in chromatin dynamics. The higher-order architecture of chromatin is determined by
the fundamental properties of chromatin fiber itself. In this sense, it should be noted that
chromosomes are composed of several chromatin loops on the order of ∼100 kb [34–36],
which is approximately the same length as used in this study. A first-order large-scale
conformational transition may explain why previous experiments have failed to observe
an intermediate state in chromatin condensation. More importantly, it may explain the
switching of a large number of genes. Recently, it has been reported that transcription
is completely inhibited through an all-or-none transition in the structure of giant DNA
molecules [17,37]. Thus, we would like to propose a hypothesis of gene self-regulation through
a combination of large-scale ON/OFF switching due to a conformational transition and
several regulatory factors to bind specific regions.
This work was supported by a Grant-in-Aid for the 21st Century COE “Center for Di-
versity and Universality in Physics”, the Special Co-ordination Funds (to K. T.), and the
COE Research Grant from Ministry of Education, Culture, Sports, Science, and Technology
of Japan (to K. T.). S. H. Y was the recipient of a predoctoral fellowship from the Japan
8
Society for the Promotion of Science.
[1] C. L. Woodcock and S. Dimitrov, Curr. Opin. Genet. Dev. 11, 130 (2001).
[2] K. Luger, A. W. Mader, R. K. Richmond, D. F. Sargent, and T. J. Richmond, Nature 389,
251 (1997).
[3] A. Wolffe, Chromatin Structure and Function, 3rd ed. (Academic, London, 1998).
[4] R. D. Kornberg and Y. Lorch, Cell 98 285 (1999).
[5] G. E. Croston and J. T. Kadonaga, Curr. Opin. Cell Biol. 5, 417 (1993).
[6] G. J. Narlikar, H. Y. Fan, and R. E. Kingston, Cell 108, 475 (2002).
[7] S. Mangenot, E. Raspaud, C. Tribet, L. Belloni, and F. Livolant, Eur. Phys. J. E, 7, 221
(2002).
[8] M. H. Sato, K. Ura, K. I. Hohmura, F. Tokumasu, S. H. Yoshimura, F. Hanaoka, and K.
Takeyasu, FEBS Lett. 452, 267 (1999).
[9] J. Zlatanova and S. H. Leuba, J. Mol. Biol. 331, 1 (2003).
[10] B. D. Brower-Toland, C. L. Smith, R. C. Yeh, J. T. Lis, C. L. Peterson, and M. D. Wang,
Proc. Natl. Acad. Sci. USA 99, 1960 (2002).
[11] T. Sakaue, K. Yoshikawa, S. H. Yoshimura, and K. Takeyasu, Phys. Rev. Lett. 87, 078105
(2001).
[12] J. Widom, J. Mol. Biol. 190, 411 (1986).
[13] F. Thoma, T. H. Koller, and A. Klug, J. Cell Biol. 83, 403 (1979).
[14] H. Schiessel, J. Phys.: Condens. Matter 15, 699 (2003).
[15] S. M. Mel’nikov, V. G. Sergeyev, and K. Yoshikawa, J. Am. Chem. Soc. 117, 2401 (1995).
[16] V. A. Bloomfield, Curr. Opin. Struct. Biol. 6, 334 (1996).
9

[17] K. Yoshikawa, J. Biol. Phys. 28, 701 (2002)
[18] H. Noguchi and K. Yoshikawa, J. Chem.Phys. 109, 5070 (1998).
[19] In this paper, we use the term ‘condensation’ to describe the apparent aggregation of nu-
cleosomes in vitro. In general, the term ‘aggregation’ means random concentration, while
‘condensation’ or ‘compaction’ has biological significance and reflects ordered packing such
as in chromatin condensation. The structures we observed are likely to be biologically sig-
nificant because they mimic the situation in vivo. Therefore, we would like to use the term
‘condensation’.
[20] K. Hizume, S. H. Yoshimura, H. Maruyama, J. Kim, H. Wada, and K. Takeyasu, Arch. Histol.
Cytol. 65, 405 (2002).
[21] K. Yoshikawa, M. Takahashi, V. V. Vasilevskaya, and A. R. Khokhlov, Phys. Rev. Lett. 76,
3029 (1996).
[22] We performed AFM measurements on reconstituted chromatin with and without DAPI, and
confirmed that there is essentially no difference between these conditions.
[23] M. Matsumoto, T. Sakaguchi, H. Kimura, M. Doi, K. Minagawa, Y. Matsuzawa, and K.
Yoshikawa, J. Polym. Sci. B: Polym. Phys. 30, 779 (1992).
[24] N. Yoshinaga, K. Yoshikawa, and S. Kidoaki, J. Chem. Phys. 116, 9926 (2002).
[25] J. P. Hansen and I. R. McDonald, Theory of Simple Liquids, 2nd ed. (Academic, San Diego,
1986).
[26] Y. Han and D. G. Grier, Phys. Rev. Lett. 91, 038302 (2003).
[27] M. D. Carbajal-Tinoco, F. Castro-Roman, and J. L. Arauz-Lara, Phys. Rev. E 53, 3745
(1996).
[28] A. Grosberg and A. Khokhlov, Statistical Physics of Macromolecules (American Institute of
10

Physics, NY, 1994).
[29] S. Takagi, K. Tsumoto, and K. Yoshikawa, J. Chem. Phys. 114, 6942 (2001).
[30] M. Ueda and K. Yoshikawa, Phys. Rev. Lett. 77, 2133 (1996).
[31] K. Maeshima and U. K. Laemmli, Developmental Cell 4, 467 (2003).
[32] T. Hirano, Curr. Opin. Cell Biol. 10, 317 (1998).
[33] K. Hizume, S. H. Yoshimura, and K. Takeyasu, Cell Biochem. Biophys. 40, 249 (2004).
[34] K. Tsumoto, F. Luckel, and K. Yoshikawa, Biophys. Chem. 106, 23 (2003).
[35] C. Benyajati and A. Worcel, Cell 9, 393 (1976).
[36] D. A. Jackson, P. Dickinson, and P. R. Cook, EMBO J. 9, 567 (1990).
[37] P. R. Cook and I. A. Brazell, J. Cell Sci. 19, 261 (1975).
11

TABLE I: The major axis of a chromatin RL, the minor axis RS , RAFM, and the hydrodynamic
radius RH . RL and RS were measured in AFM images by assuming that a chromatin complex
is elliptical. RH was measured in fluorescent images. RAFM ( =√
RLRS ) and RH are the
hypothetical radii of chromatin if they are considered to be spheres on a mica surface and in bulk
solution, respectively.
[histone]/[DNA] RL (nm) RS (nm) RAFM (nm) RH (nm)1.0 420 ± 180 250 ± 90 320 ± 120 370 ± 701.3 220 ± 100 130 ± 90 170 ± 100 190 ± 50
12

Figure Captions
FIG. 1: Reconstituted chromatin with [histone]/[DNA] = 1 (A, D) and 1.3 (B, C, E, and F).
The images in (A, D), (B, E), and (C, F) are photographs of the same chromatin complex.
(A–C) Light-intensity distribution of fluorescent images of reconstituted chromatin situated
on a mica surface. Insets are corresponding 2D fluorescent images. (D–F) AFM images of
the same chromatin as in the fluorescent images. The scale bar is 0.2 µm in AFM images.
FIG. 2: The pair potential of nucleosomes obtained by an equation for the Boltzmann
distribution. Inset: The nucleosome-nucleosome distance distribution N(r) of chromatin
reconstituted with [histone]/[DNA] = 1.0. U(r) is deduced by polynomial curve-fitting of
N(r).
FIG. 3: Free-energy profiles of a nucleosome with n = 400, 500, and 600 and corresponding
schematic representations, where n is the number of nucleosomes in a single chromatin
complex. The free energy as a function of the normalized density of nucleosomes in the
three-dimensional conformation was calculated from Eq. (5).
13