the data explosion: tackling the taboo of automatic feature recognition in the use of airborne...
TRANSCRIPT
The data explosion: tackling the tabooof automatic feature recognition inairborne survey dataRebecca Bennett1, Dave Cowley2 & Veronique De Laet3,4
IntroductionThe increasing availability of multi-dimensional remote-sensing data covering largegeographical areas is generating a new wave of landscape-scale research that promises to be asrevolutionary as the application of aerial photographic survey during the twentieth century.Data are becoming available to historic environment professionals at higher resolution,greater frequency of acquisition and lower cost than ever before. To take advantage of thisexplosion of data, however, a paradigm change is needed in the methods used routinelyto evaluate aerial imagery and interpret archaeological evidence. Central to this is afuller engagement with computer-aided methods of feature detection as a viable way toanalyse airborne and satellite data. Embracing the new generation of vast datasets requiresreassessment of established workflows and greater understanding of the different types ofinformation that may be generated using computer-aided methods.
Automated and semi-automated image analysis is routine in fields such as environmentalremote sensing, where it underpins analysis of extensive datasets (see Lasaponara & Masini2012 for a review of these techniques). Aspects of these developments have made theirway into archaeological applications, but they remain rarely used and are often viewedwith suspicion. It is important therefore to outline the status quo and identify the keyissues in debates that have mainly played out at conferences and steering groups butare seldom committed to print. There are difficulties in the creation of geographicallyextensive, systematic datasets for heritage management and research from high-volume dataderived from airborne laser scanning (ALS), satellite imagery and airborne digital spectralsensors. Yet fuller exploitation of computer assisted techniques can exponentially increase therapidity with which initial historic environment datasets can be created, moving beyond the‘human-timescales’ within which most archaeological survey is undertaken (i.e. ‘manual’analysis). This requires recognition of the fundamentally different but complimentarytypes of information that the two approaches produce, and assessment of their valueand contribution as part of broader research objectives. Throughout we use the term‘computer vision’ to define all methods by which imagery can be processed, analysed and
1 Department of Archaeology, University of Winchester, King Alfred Campus, Sparkford Road, Winchester SO224NR, UK
2 Royal Commission on the Ancient and Historical Monuments of Scotland, John Sinclair House, 16 BernardTerrace, Edinburgh EH8 9NX, UK
3 Department of Earth and Environmental Sciences, KU Leuven, Celestijnenlaan 200E, B-3001Leuven-Heverlee, Belgium
4 3GeoID, Researchpark Haasrode, Interleuvenlaan 62, 3001 Leuven, Belgium
C© Antiquity Publications Ltd.ANTIQUITY 88 (2014): 896–905 http://antiquity.ac.uk/ant/088/ant0880896.htm
896
Met
hod
Rebecca Bennett, Dave Cowley & Veronique De Laet
understood using computer-generated algorithms (including classifications), with referenceto the electronic replication of the abilities of human ocular perception (Sonka et al. 2008).
Discussion of computer vision and pattern detection techniques in archaeology has oftenbeen from polarised positions that are as much about belief in the value of a particulartype of output as a rational assessment of the contribution of new techniques. There islittle doubt that the rhetoric has softened in recent years, thanks in part to the increasinglymainstream use of digital images rendered from ALS data, but also to a number of consideredand rigorous applications of automated techniques (e.g De Laet et al. 2007; Trier & Pilø2012; Verhagen & Dragut 2012; Lambers & Zingman 2013). There is, however, stillvocal opposition within historic environment circles to any type of computer-generateddetection process, stemming from a view that computer vision techniques are no substitutefor manual interpretation (Parcak 2009; Hanson 2010). While recognising the legitimacy ofsome concerns, we argue that most objections overlook the potential role of such techniquesas complementary to, rather than a direct substitute for, traditional methods.
A twentieth-century approach to a twenty-first-century problemA sound and systematic knowledge base is fundamental to effective archaeological researchand heritage management (Horne 2009; Cowley & Huld Sigurðardottir 2011). Globally,however, the historic environment is poorly recorded both in terms of spatial coverage andquality of information. In parts of Europe with long traditions of inventory going backinto the nineteenth century, analysis of the contents and structure of the records quicklyillustrates the unsystematic nature of data collection and record compilation, alongsidemany inherent biases (Cowley 2011; Risbøl et al. 2013). While techniques such as aerialphotographic analysis have revolutionised archaeological knowledge in some areas (e.g.Gojda 2011), these depend on manual and time-consuming assessment processes to createbaseline records.
The ability of historic environment professionals to engage with large datasets is impededby an overwhelming adherence to an entirely manual prospection and interpretationapproach, as traditionally applied to aerial photographic interpretation (Wilson 2000;Cowley et al. 2013). While this can produce detailed, research-engaged interpretationsof the data, it is also time consuming and requires heavy commitment of resources. Thusthe ground-breaking English Heritage National Mapping Programme (Horne 2009), whichdraws principally on aerial photographs, achieves an average coverage rate of 1km2 perperson/day. With a variable number of staff (averaging 15–20 for long periods), theprogramme has examined about 52 000km2 of English countryside since its inceptionin the 1990s, locating over 100 000 archaeological sites. This project has created recordsthat underpin effective heritage management and support better understanding of the past,but its exclusively manual approach requires significant resources. With accelerating rates oflandscape change and the limited resourcing of cultural heritage globally, traditional methodsof remote landscape survey are a financially unsustainable and painfully inefficient way tocreate the spatially extensive, systematic datasets required for effective resource management.
Additional problems are encountered when traditional methods are applied to newdatasets. Multiple methods of visualisation are often required to render archaeological
C© Antiquity Publications Ltd.
897

The data explosion
features from topographic data (Bennett et al. 2012), while modern air- and spacebornespectral systems have such high spectral dimensionality that a single survey results inhundreds of images to be assessed. Extracting relevant content from these images exceedswhat is practically possible for a traditional manual approach and moreover this methodologyfails to engage with the depth of content that such data has to offer. For example, theadditional spectral response information could be critical to understanding how and whyfeatures of archaeological interest manifest in the imagery (Beck 2011; Bennett et al.2011; Verhoeven 2012). There is a fundamental tension generated by the inability oftraditional manual approaches to enable archaeological interpretation of extensive andcomplex remote sensing data. The pressure to break from tradition and explore othermethods has undoubtedly contributed to the polarised debate on the role of automaticfeature identification and computer vision in archaeological landscape analysis. However,there is potential for a middle ground that recognises the role of the expert in creating reliableinterpretations, but looks to the development of analytical frameworks that are appropriateto the emergent datasets.
The role of the expertA distinct advantage of manual interpretation is the ability to identify and categorise thewide range of direct and proxy features that are of potential archaeological significance, andskilled archaeological interpreters are crucial to the quality of feature interpretation (Palmer2011; Halliday 2013). Thus, many believe that any form of semi-automated assessment is oflittle worth in comparison to knowledge-based expert interpretation. Parcak (2009: 110–11)promotes this view, arguing that computers simply do not have the ability of the human eyeand mind to detect patterns that might denote traces of past human activity and separatethem from geological and recent disturbances. The sophisticated use of image processing andartefact recognition in a wide range of applications from number plate and face recognitionto medical imaging and military reconnaissance would undermine this view, but it findssome support in the history of automated detection techniques in archaeology. New remotesensing technologies for archaeological prospection have had to rely on data and imageprocessing expertise from other fields. This has undeniably led to poor communication ofpurpose and over-enthusiastic claims of success, particularly as the type of features soughtby archaeologists are categorically different from those the environmental and geologicalremote-sensing communities are trained to observe. Detecting one feature or one class offeature in one type of environment is not the same as providing both identification andinterpretation of features across a landscape. This has fed criticism of automated detectionfocusing on high rates of ‘false positives’ (Hanson 2010), and generated fears that expertisein archaeological interpretation is undervalued.
The importance of interpretation based on the cognitive abilities, expertise andexperience of the interpreter should not be overlooked. The complex mix of observation,feature identification, classification, interpretation and narrative are virtually impossible todisambiguate, and it is important to recognise that they are rarely examined or held to acc-ount (Halliday 2013). Deconstructing these often subconscious processes can help us tobetter understand the cognitive processes and reasoning underlying traditional approaches.C© Antiquity Publications Ltd.
898
Met
hod
Rebecca Bennett, Dave Cowley & Veronique De Laet
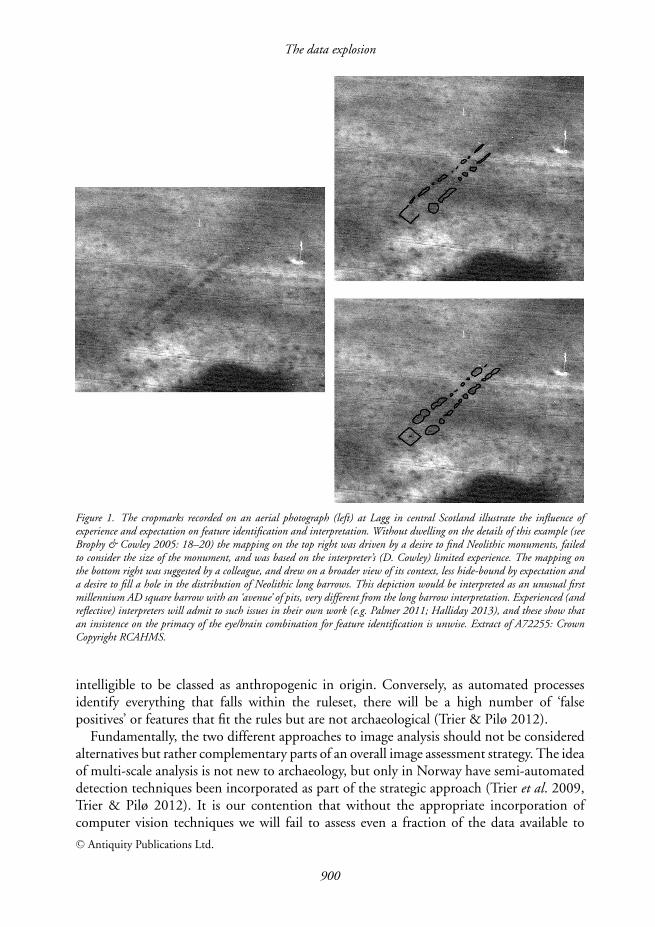
Archaeological interpretations are heavily conditioned by varying observational abilities,experience and knowledge. Our innate ability to identify patterns, which is a strength inanalysing visual data, can sometimes mislead. There is the widely recognised tendency to‘complete the circle’ where features are ‘fitted’ to the template of a familiar shape. Expectationand our existing knowledge-base will bias what we see, or do not see, and how we interpretit (Figure 1): “give half a dozen people the same information . . . you get half a dozendifferent interpretations, all equally valid and probably not even mutually contradictory inany significant way, but each of them will bear the style of the individual interpreter” (Hill2009: 3). Multiplicity of interpretations is inevitable and yet often undocumented, leadingto a tendency to view an expert transcription as the paramount and only interpretation ofthe data.
However, experienced interpreters would admit that the information they derive is heavilybiased towards their expectations and knowledge, with the risk of missing or dismissingfeatures (Halliday 2013). If one subscribes even partially to this conditional and contingentview of interpretation, then it seems unwise to argue for the primacy or exclusivity of humanor manual processes with no room for computer vision techniques.
A computer algorithm designed to extract features with specific attributes from data isnot as flexible as a human observer, and is therefore not able to filter and rationalise a massof visual information. While the algorithm is not flexible, it removes a major source of biasin detection and ensures that all features within the set criteria will be detected. The value ofinformation extracted will depend on the coherence of the enquiry, but it will be systematicand can be applied across large datasets, and, moreover, with good documentation it can bereplicated. Such an approach does not, however, provide archaeological interpretations. Thisis an important point because some critics of automated and computer vision approacheshave conflated feature detection and archaeological interpretation, largely because in atraditional manual workflow they are invariably intertwined. With the systematic applicationof explicit algorithms to identify features, a major source of bias in observation and detectionis offset, with the potential to flag up features that might have been dismissed by the observer.Moreover, a growing number of researchers are developing analyses in an iterative processwhich takes account of field observation and evaluation to assess and refine the algorithms(Trier & Pilø 2012; Lambers & Zingman 2013).
Recognising the value of different approachesCritique of manual and semi-automated methods for feature detection is hampered bythe fact that the two methods result in different products and therefore cannot easily becompared. This can be demonstrated by the results of two aerial prospection projects withdifferent methodologies (Table 1). The coverage rate of the Baden-Wurttemberg projectis impressive compared to the NMP approach, but the results are considered ‘potentialarchaeological features’ that require verification. The Baden-Wurttemberg product is seenas a baseline, a segmented image highlighting areas of potential archaeological features basedon predetermined rules for subsequent verification. The NMP approach adds to featuredetection a level of archaeological interpretation that allows for assessment of significanceand meaning; in doing so it also rejects without record those features deemed insufficiently
C© Antiquity Publications Ltd.
899
The data explosion
Figure 1. The cropmarks recorded on an aerial photograph (left) at Lagg in central Scotland illustrate the influence ofexperience and expectation on feature identification and interpretation. Without dwelling on the details of this example (seeBrophy & Cowley 2005: 18–20) the mapping on the top right was driven by a desire to find Neolithic monuments, failedto consider the size of the monument, and was based on the interpreter’s (D. Cowley) limited experience. The mapping onthe bottom right was suggested by a colleague, and drew on a broader view of its context, less hide-bound by expectation anda desire to fill a hole in the distribution of Neolithic long barrows. This depiction would be interpreted as an unusual firstmillennium AD square barrow with an ‘avenue’ of pits, very different from the long barrow interpretation. Experienced (andreflective) interpreters will admit to such issues in their own work (e.g. Palmer 2011; Halliday 2013), and these show thatan insistence on the primacy of the eye/brain combination for feature identification is unwise. Extract of A72255: CrownCopyright RCAHMS.
intelligible to be classed as anthropogenic in origin. Conversely, as automated processesidentify everything that falls within the ruleset, there will be a high number of ‘falsepositives’ or features that fit the rules but are not archaeological (Trier & Pilø 2012).
Fundamentally, the two different approaches to image analysis should not be consideredalternatives but rather complementary parts of an overall image assessment strategy. The ideaof multi-scale analysis is not new to archaeology, but only in Norway have semi-automateddetection techniques been incorporated as part of the strategic approach (Trier et al. 2009,Trier & Pilø 2012). It is our contention that without the appropriate incorporation ofcomputer vision techniques we will fail to assess even a fraction of the data available toC© Antiquity Publications Ltd.
900

Met
hod
Rebecca Bennett, Dave Cowley & Veronique De Laet
Table 1. Details of two aerial prospection projects, summarised from Cowley et al. (2013).
English Heritage National Mapping Baden-Wurttemberg ALSProgramme (NMP) Mapping, Germany
Aerial resource used Predominantly aerial photographs,latterly some ALS
ALS project
Area covered 52 000km2 35 000km2
Personnel Multiple operators for each projectarea
Single operator
Method Manual classification andinterpretation based ontopographic, soil and vegetationcontrast
Semi-automated classification ofdigital terrain models based onmicrotopographic variation (LRM),with manual verification
Timescale 20 years (since 1992/93) 6 yearsNumber of sites Over 100 000 sites 600 000 sites (estimated)
us. Even for well-resourced nations with an established body of professionals trained in thefield, current methods of interpretation are a major limitation on the potential exploitationof new imagery. For those without an infrastructure for image interpretation and culturalresource management the situation will prove even more acute.
Developing applicationsDespite a steady increase in the sophistication and application of detection techniques insectors as diverse as medical imaging, security, materials science and robotics, the techniquesthat have been tentatively used in archaeological contexts to date are frequently too simplisticto cope with the subtleties of archaeological feature detection. Lasaponara and Masini (2012)provide a very brief review of a handful of projects that have used computer detectiontechniques for classification, and while pointing out the inconclusive nature of the results,fail to observe that while the wholesale importation of techniques from the environmentalsciences might be useful for monitoring the expression of known sites, it is inappropriate forthe identification of archaeological remains, especially those that are previously undetected.
The over-simplicity and inflexibility of the modes of automated or semi-automateddetection selected for analysis mean they are poorly suited to the diversity in shape, size,spectral and topographic properties of the features we categorise as archaeological (De Laetet al. 2007; Grøn et al. 2011: 2030). Embedded in this problem is the difficulty of preciselydefining what an archaeological feature is. The truth of the matter is that regardless ofthe level of sophistication, a single detection algorithm could never adequately accountfor the range of feature types, let alone incorporate obfuscating factors such as ploughdamage, geological background variations and vegetation cover that significantly alter theappearance of a feature from a given normal descriptor. Picking apart these factors andproviding a reasoned archaeological interpretation supported by observation and knowledgeis a valuable specialist skill that computer detection methods, however sophisticated, willultimately fail to replace.
C© Antiquity Publications Ltd.
901
The data explosion
This is why, far from being made redundant by automated techniques, skilled interpretersare vital to any computer vision process. The expert role is not simply to annotatetraining images or validate results, but as an integral part of the feature engineeringprocess (see Domingos 2012 for discussion of the critical factors relating to the successof machine learning applications). To do this there has to be willingness to engage withboth the practical and theoretical challenges of explaining and replicating human visualinterpretation processes. With respect to openness of method, objectivity and repeatabilityof interpretations, asking ‘what are we looking for?’ and justifying the response can only beseen as a positive demonstration of critical thinking.
In our opinion the development of computer vision techniques for the analysis of airborneremote-sensing data is a high priority, and restructuring assessment methods and engagementin research are vital to providing assessment and protection of the historic environment.We identify the following areas for development, and although we recognise that some willrequire significant investment, we suggest them as the basis of a road-map to discipline-specific computer vision approaches that will pay dividends in the longer term.
1) A credible benchmark, based on Big Research
Large scale, high quality, systematic and discipline-aware research is required into theapplication of computer vision techniques to image analysis. This will need to incorporaterobust and repeatable workflows that integrate computer vision and manual methods.
The creation of benchmark material for the evaluation of algorithms from an internationalrange of archaeological and environmental contexts using a variety of data types isfundamental. Expert interpretations of the material can provide training and validationdatasets, and support better understanding of why and how features are identified. Projectssuch as the PASCAL Object Recognition Database (PASCAL & PASCAL2 2013) provideexemplars for this type of work.
Key to the success of computer applications will be clearer definitions of archaeologicalfeatures in various datasets. Although some work is already being undertaken forhyperspectral data under the DART project (Beck 2011), the knowledge-base needs tobe expanded significantly. That can only practically be achieved via benchmarking andtimely observations of the physical and chemical properties of features observed remotely.A clear distinction should be made between contrast detection and feature identification.
2) Improved protocols for recording pre-processing, data categorisation and metadata
Acceptance of data pre-processing as a beneficial first step for some archaeological analysisis critical to more mainstream adoption of semi-automated techniques. This includesmasking high-contrast features (roads and buildings), high pass and low pass filters, localrelief models to filter low relief and segmentation based on land cover. These techniqueshelp to reduce large-scale variation in an image or model, and have been shown to helpwith the visualisation and detection of generally subtle archaeological traces. Metadatais needed to explain and qualify processing steps to improve the intelligibility of andconfidence in the results of semi-automated techniques. To assist with standardisation, acategorisation system of different levels of processing (such as is common in environmentalC© Antiquity Publications Ltd.
902
Met
hod
Rebecca Bennett, Dave Cowley & Veronique De Laet
remote-sensing applications) should be established and included as metadata in all featureassessments. It would also be helpful to modify the language of feature detection to reflectthe level of interpretation (i.e. potential archaeological feature or suspected archaeologicalanomaly).
Feature recording protocols should be expanded to include complementary environmentaldata such as land use, land management strategies, dates of feature visibility andproportion of known feature visible. If systematically recorded, this ancillary informationwill assist with the definition of archaeological features and help to explain gaps inidentification.
3) Incorporation of multi-sensor data
The benefits of multi-sensor survey could be enhanced if computer vision techniques wereused to combine different data from common geospatial locations, addressing a tendencyto consider only one data source for computation, therefore limiting feature detection.The strength of computer-aided analysis of multi-sensor data has yet to be explored in anydepth, and incorporation of tools such as decision tree analysis could begin to allow strategictargeting of attributes within multiple datasets that represent archaeological features. Thisis an area where computer vision techniques may have the most to contribute.
4) Innovative manual interpretation methods
Finally, in the interim, if manual detection is the best method we have to identify features ofinterest, some thought should be given to improving its rapidity and coverage. Some recentexperimentation in the use of ‘crowd-sourced’ interpretations of ALS-derived visualisationsis described by Duckers (2013). Information gathered could also include non-archaeologicalattributes like land use and ‘noise’ such as vegetation overlaying features and shadows, withthe potential to derive a breadth of image information.
AcknowledgementsThe authors would like to thank Carlo Tomasi, Chair of Computer Science, Duke University, for his commentson the draft and for expert input on the potential and practicalities of computer vision techniques, and to staff atEnglish Heritage for providing estimates of manual aerial photograph interpretation rates. Numerous colleagueshave contributed to the discussion of the issues at the heart of this paper, but particular thanks are due to KarstenLambers, Rachel Opitz, Rog Palmer, Ole Risbøl and Øivind Due Trier.
ReferencesBECK, A. 2011. Archaeological applications of
multi/hyper-spectral data—challenges andpotential, in D.C. Cowley (ed.) Remote sensing forarchaeological heritage management (EuropaeArchaeologiae Consilium Occasional Papers 5):87–97. Budapest: Archaeolingua.
BENNETT, R., K. WELHAM, R.A. HILL & A. FORD.2011. Making the most of airborne remote sensingtechniques for archaeological survey andinterpretation, in D.C. Cowley (ed.) Remote sensingfor archaeological heritage management (EuropaeArchaeologiae Consilium Occasional Papers 5):99–106. Budapest: Archaeolingua.
– 2012. A comparison of visualization techniques formodels created from airborne laser scanned data.Archaeological Prospection 19: 41–48.http://dx.doi.org/10.1002/arp.1414
C© Antiquity Publications Ltd.
903

The data explosion
BROPHY, K. & D. COWLEY. 2005. From theair—understanding aerial archaeology. Stroud:Tempus.
COWLEY, D.C. 2011. Remote sensing for Europeanarchaeology and heritage management—sitediscovery, interpretation and registration, in D.C.Cowley (ed.) Remote sensing for archaeologicalheritage management (Europae ArchaeologiaeConsilium Occasional Papers 5): 43–55. Budapest:Archaeolingua.
COWLEY, D.C. & K. HULD SIGUR−DARDOTTIR. 2011.Remote sensing for archaeological heritagemanagement, in D.C. Cowley (ed.) Remote sensingfor archaeological heritage management (EuropaeArchaeologiae Consilium Occasional Papers 5):11–16. Budapest: Archaeolingua.
COWLEY, D.C., V. DE LAET & R.A. BENNETT. 2013.Auto-extraction techniques and cultural heritagedatabases, in W. Neubauer, I. Trinks, R. Salisbury& C. Einwogerer (ed.) Proceedings of the 10th
International Conference on ArchaeologicalProspection, Vienna, May 29–June 2 2013:406–408. Vienna: Ludwig Boltzmann Institute.
DOMINGOS, P. 2012. A few useful things to know aboutmachine learning. Communications of the ACM55(10): 78–87. http://dx.doi.org/10.1145/2347736.2347755
DUCKERS, G.L. 2013. Bridging the ‘geospatial divide’ inarchaeology: community based interpretation ofLIDAR data. Internet Archaeology 35.http://dx.doi.org/10.11141/ia.35.10
GOJDA, M. 2011. Remote sensing for the integratedstudy and management of sites and monuments—aCentral European perspective and Czech case study,in D.C. Cowley (ed.) Remote sensing forarchaeological heritage management (EuropaeArchaeologiae Consilium Occasional Papers 5):215–34. Budapest: Archaeolingua.
GRØN, O., S. PALMER, F. STYLEGAR, K. ESBENSEN, S.KUCHERYAVSKI & S. AASE. 2011. Interpretation ofarchaeological small-scale features in spectralimages. Journal of Archaeological Science 38:2024–30. http://dx.doi.org/10.1016/j.jas.2009.11.023
HALLIDAY, S. 2013. I walked, I saw, I surveyed, but whatdid I see? . . .and what did I survey? in R. Opitz &D.C. Cowley (ed.) Interpreting archaeologicaltopography: lasers, 3D data, observation, visualisationand applications: 63–75. Oxford: Oxbow.
HANSON, W.S. 2010. The future of aerial archaeologyin Europe. Photo Interpretation: European Journal ofApplied Remote Sensing 46(1): 3–11.
HILL, R. 2009. The roar of the butterflies. London:HarperCollins.
HORNE, P. 2009. A strategy for the National MappingProgramme. Swindon: English Heritage.
DE LAET, V., E. PAULISSEN & M. WAELKENS. 2007.Methods for the extraction of archaeologicalfeatures from very high-resolution Ikonos-2 remotesensing imagery, Hisar (southwest Turkey). Journalof Archaeological Science 34: 830–41.http://dx.doi.org/10.1016/j.jas.2006.09.013
LAMBERS, K. & I. ZINGMAN. 2013. Texturesegmentation as a first step towards archaeologicalobject detection in high resolution satellite imagesof the Silvretta Alps, in W. Neubauer, I. Trinks, R.Salisbury & C. Einwogerer (ed.) Proceedings of the10th International Conference on ArchaeologicalProspection, Vienna May 29–June 2 2013: 327–29.Vienna: Ludwig Boltzmann Institute.
LASAPONARA, R. & N. MASINI. 2012. Satellite remotesensing: a new tool for archaeology. New York:Springer. http://dx.doi.org/10.1007/978-90-481-8801-7
PALMER, R. 2011. Knowledge-based aerial imageinterpretation, in D.C. Cowley (ed.) Remote sensingfor archaeological heritage management (EuropaeArchaeologiae Consilium Occasional Papers 5):283–91. Budapest: Archaeolingua.
PARCAK, S. 2009. Satellite remote sensing for archaeology.London: Routledge.
PASCAL & PASCAL2. 2013. Pattern analysis,statistical modelling and computational learning.Available at: http://pascallin.ecs.soton.ac.uk/ andhttp://pascallin2.ecs.soton.ac.uk/ (accessed 17 June2014).
RISBØL, O., O.M. BOLLANDSAS, A. NESBAKKEN, H.ØRKA, E. NÆSSET & T. GOBAKKEN. 2013.Interpreting cultural remains in airborne laserscanning generated digital terrain models: effects ofsize and shape on detection success rates. Journal ofArchaeological Science 40: 4688–700.http://dx.doi.org/10.1016/j.jas.2013.07.002
SONKA, M., V. HLAVAC & R. BOYLE. 2008. Imageprocessing, analysis and machine vision. Toronto:Thomson Learning.
TRIER, Ø. & L. PILØ. 2012. Automatic detection of pitstructures in airborne laser scanning data.Archaeological Prospection 19: 103–21.http://dx.doi.org/10.1002/arp.1421
TRIER, Ø., S. LARSEN & R. SOLBERG. 2009. Automaticdetection of circular structures in high-resolutionsatellite images of agricultural land. ArchaeologicalProspection 16: 1–15. http://dx.doi.org/10.1002/arp.339
VERHAGEN, P. & L. DRAGUT. 2012. Object-basedlandform delineation and classification from DEMsfor archaeological predictive mapping. Journal ofArchaeological Science 39: 698–703.http://dx.doi.org/10.1016/j.jas.2011.11.001
C© Antiquity Publications Ltd.
904

Met
hod
Rebecca Bennett, Dave Cowley & Veronique De Laet
VERHOEVEN, G. 2012. Near-infrared aerial crop markarchaeology: from its historical use to current digitalimplementations. Journal of Archaeological Methodand Theory 19: 132–60.http://dx.doi.org/10.1007/s10816-011-9104-5
WILSON, D.R. 2000. Air photo interpretation forarchaeologists. London: Tempus.
Received: 10 September 2013; Accepted: 18 October 2013; Revised: 5 November 2013
C© Antiquity Publications Ltd.
905