tackling the computation and memory needs of interactive
TRANSCRIPT

The Pennsylvania State UniversityThe Graduate School
TACKLING THE COMPUTATION AND MEMORY NEEDS OF INTERACTIVE
WORKLOADS ON NEXT GENERATION PLATFORMS
A Dissertation in
Computer Science and Engineering
by
Prasanna Venkatesh Rengasamy
c© 2019 Prasanna Venkatesh Rengasamy
Submitted in Partial Fulfillment
of the Requirements
for the Degree of
Doctor of Philosophy
December 2019

The dissertation of Prasanna Venkatesh Rengasamy was reviewed and approved∗ by the follow-
ing:
Anand SivasubramaniamDistinguished Professor of Computer Science and EngineeringDissertation Advisor, Chair of Committee
Mahmut T KandemirProfessor of Computer Science and Engineering
Chita R DasDistinguished Professor and Department Head of Computer Science and Engineering
Dinghao WuAssociate Professor of Information Sciences and Technology
∗Signatures are on file in the Graduate School.

Abstract
User interactive applications are hugely popular today with millions of applications to downloadfrom various app stores. These growing number of applications with billions of active users allaround the world, simultaneously leverage both a wimpy, battery powered edge device, typicallya mobile phone or a tablet, as well as the high end cloud servers for their computation needs.Although prior works have optimized different parts of the high end servers such as CPU, mem-ory, GPU, etc., it is not clear whether the same set of optimizations is sufficient for optimizingsuch simultaneous executions in both high end servers and the wimpy edge devices. In fact, anend-to-end characterization and optimization of bottlenecks for these emerging workloads havenot been given sufficient importance till date. Our preliminary characterization reveals that theuser-interactive applications exploit both edge devices and cloud servers for their computationsand also use very different compute components for their executions. As an indication of thework done, the time spent by the execution in edge device is close to 66% and the spends 27% ofexecution time for computations in the cloud servers, and the rest 6% time on the communicationbetween edge and cloud. Within the edge device, the same app uses CPU and IO dominantlywhile it uses memory and GPU in the cloud servers. This Ph D thesis leverages this characteriza-tion knowledge to apply the a set of optimizations for the interactive workload executions using afour pronged approach spanning all of edge and cloud executions. First, the thesis addresses theinefficiency in edge CPUs by moving the most common and frequent parts of the execution toa novel, lightweight, generic hardware accelerator. Second, it fixes the front end bottleneck suf-fered by the critical instruction chains at the software side by identifying and representing themin a reduced bit width ISA. Third, it exploits the opportunities for short-circuiting the entirecomputation from user-input till output-generation at the edge execution by learning the redun-dant event processing (stemming from user-interactions) through machine learning. Finally, atthe cloud servers, this thesis addresses the data access inefficiencies at the GPU execution, bya novel compiler and runtime assisted relayout at the host that computes and transfers only theuseful data for the GPU execution.
With these optimizations, our experimental evaluations show that we can achieve 32% en-ergy savings at the edge device and 34% performance benefits at the cloud server execution forthese class of workloads.
iii

Table of Contents
List of Figures viii
List of Tables xii
Acknowledgments xiii
Chapter 1Introduction 1
1.0.1 An edge device . . . . . . . . . . . . . . . . . . . . . . . . . . . . . . 31.0.2 Cloud servers . . . . . . . . . . . . . . . . . . . . . . . . . . . . . . . 3
1.1 What to optimize? . . . . . . . . . . . . . . . . . . . . . . . . . . . . . . . . . 41.2 Proposed Solutions in this Thesis . . . . . . . . . . . . . . . . . . . . . . . . . 5
Chapter 2Related Work 102.1 Moving computations from CPU to accelerators . . . . . . . . . . . . . . . . . 102.2 Criticality and Front end optimizations . . . . . . . . . . . . . . . . . . . . . . 112.3 Short circuiting executions . . . . . . . . . . . . . . . . . . . . . . . . . . . . 112.4 Data transfer Optimizations in CPU-GPU systems . . . . . . . . . . . . . . . . 122.5 Novelty of this thesis . . . . . . . . . . . . . . . . . . . . . . . . . . . . . . . 12
Chapter 3LOST: Hardware Optimization for mobile/edge CPU 143.1 Coarse Grain Customization . . . . . . . . . . . . . . . . . . . . . . . . . . . 15
3.1.0.1 Hardware Characterization . . . . . . . . . . . . . . . . . . 153.1.0.2 Software Characterization . . . . . . . . . . . . . . . . . . . 15
3.2 Load-to-Store (LOST) Sequences . . . . . . . . . . . . . . . . . . . . . . . . 173.2.1 Methodology for Extracting LOSTs . . . . . . . . . . . . . . . . . . . 203.2.2 Characteristics of LOST Sequences . . . . . . . . . . . . . . . . . . . 213.2.3 Top 5 LOST Sequences from All Apps . . . . . . . . . . . . . . . . . 22
iv

3.3 LOST Hardware Customization . . . . . . . . . . . . . . . . . . . . . . . . . 233.3.1 Execution Time Breakdown . . . . . . . . . . . . . . . . . . . . . . . 243.3.2 Exploring Existing Acceleration Solutions . . . . . . . . . . . . . . . . 253.3.3 Addressing Spatial Separation of LOST Instructions . . . . . . . . . . 263.3.4 Encoding and Supplying Operands for LOST Execution . . . . . . . . 283.3.5 Proposed Hardware Integration . . . . . . . . . . . . . . . . . . . . . 29
3.4 Experimental Evaluation . . . . . . . . . . . . . . . . . . . . . . . . . . . . . 313.4.1 Performance benefits from LOST . . . . . . . . . . . . . . . . . . . . 323.4.2 Trade-offs with LOST acceleration . . . . . . . . . . . . . . . . . . . 33
3.5 Related Work . . . . . . . . . . . . . . . . . . . . . . . . . . . . . . . . . . . 343.6 Chapter Summary . . . . . . . . . . . . . . . . . . . . . . . . . . . . . . . . . 36
Chapter 4CritIC: Software only optimization for CPU Execution in the edge 374.1 Critiquing Criticality . . . . . . . . . . . . . . . . . . . . . . . . . . . . . . . 38
4.1.1 Conventional criticality identification . . . . . . . . . . . . . . . . . . 384.1.2 Do these criticality schemes work for mobile apps? . . . . . . . . . . . 394.1.3 Why do they not work? . . . . . . . . . . . . . . . . . . . . . . . . . . 404.1.4 What do these instructions need? . . . . . . . . . . . . . . . . . . . . . 41
4.2 CritICs: Critical Instruction Chains . . . . . . . . . . . . . . . . . . . . . . . . 444.2.1 Identifying CritICs . . . . . . . . . . . . . . . . . . . . . . . . . . . . 44
4.2.1.1 CritIC Sequences . . . . . . . . . . . . . . . . . . . . . . . 444.2.1.2 How to find them? . . . . . . . . . . . . . . . . . . . . . . . 46
4.2.2 Optimizing CritIC Sequences . . . . . . . . . . . . . . . . . . . . . . 484.2.3 Summarizing our Methodology . . . . . . . . . . . . . . . . . . . . . 50
4.3 Evaluations . . . . . . . . . . . . . . . . . . . . . . . . . . . . . . . . . . . . 524.3.1 Switching Approach 1: On Actual Hardware . . . . . . . . . . . . . . 524.3.2 Switching Approach 2: Extending Existing ARM Instruction . . . . . . 534.3.3 Simulation Results . . . . . . . . . . . . . . . . . . . . . . . . . . . . 544.3.4 Design Space . . . . . . . . . . . . . . . . . . . . . . . . . . . . . . . 554.3.5 Performance Results . . . . . . . . . . . . . . . . . . . . . . . . . . . 574.3.6 System-Wide Energy Gains . . . . . . . . . . . . . . . . . . . . . . . 584.3.7 Comparing with Conventional Hardware Fetch Optimizations . . . . . 584.3.8 Sensitivity to CritIC length . . . . . . . . . . . . . . . . . . . . . . . . 604.3.9 Sensitivity to Profiling . . . . . . . . . . . . . . . . . . . . . . . . . . 61
4.4 Why even bother with criticality? . . . . . . . . . . . . . . . . . . . . . . . . . 614.5 Related Work . . . . . . . . . . . . . . . . . . . . . . . . . . . . . . . . . . . 634.6 Chapter Summary . . . . . . . . . . . . . . . . . . . . . . . . . . . . . . . . . 65
Chapter 5Short circuiting the entire execution in the edge 665.1 Overview of Gaming Workloads . . . . . . . . . . . . . . . . . . . . . . . . . 68
5.1.1 What happens in the hardware? . . . . . . . . . . . . . . . . . . . . . 69
v

5.1.2 Characterizing the game executions . . . . . . . . . . . . . . . . . . . 705.1.3 Opportunities, drawbacks, and challenges . . . . . . . . . . . . . . . . 71
5.2 Impracticality of Lookup Table Approach . . . . . . . . . . . . . . . . . . . . 735.3 Input-Output Behavior of Event Processing . . . . . . . . . . . . . . . . . . . 76
5.3.1 Inputs Characteristics . . . . . . . . . . . . . . . . . . . . . . . . . . . 765.3.2 Shrinking the table using event data to lookup . . . . . . . . . . . . . . 77
5.4 Selecting Necessary InPuts (SNIP) . . . . . . . . . . . . . . . . . . . . . . . . 805.4.1 Identifying necessary inputs . . . . . . . . . . . . . . . . . . . . . . . 805.4.2 Methodology . . . . . . . . . . . . . . . . . . . . . . . . . . . . . . . 83
5.5 Experimental Setup . . . . . . . . . . . . . . . . . . . . . . . . . . . . . . . . 855.5.1 Game Workloads . . . . . . . . . . . . . . . . . . . . . . . . . . . . . 855.5.2 System Setup . . . . . . . . . . . . . . . . . . . . . . . . . . . . . . . 86
5.6 Results . . . . . . . . . . . . . . . . . . . . . . . . . . . . . . . . . . . . . . . 875.6.1 Energy benefits and overheads of SNIP approach . . . . . . . . . . . . 895.6.2 Continuous learning to avoid developer intervention . . . . . . . . . . 90
5.7 Related Work . . . . . . . . . . . . . . . . . . . . . . . . . . . . . . . . . . . 915.7.1 Memoization . . . . . . . . . . . . . . . . . . . . . . . . . . . . . . . 915.7.2 Mobile SoC Optimizations . . . . . . . . . . . . . . . . . . . . . . . . 915.7.3 ML based Optimizations . . . . . . . . . . . . . . . . . . . . . . . . . 92
5.8 Chapter Summary . . . . . . . . . . . . . . . . . . . . . . . . . . . . . . . . . 92
Chapter 6OppoRel: Opportunistic Relayout for data exchanges between CPU and GPU in
the cloud 946.1 Background and Motivation . . . . . . . . . . . . . . . . . . . . . . . . . . . 100
6.1.1 Current CPU-GPU Architecture . . . . . . . . . . . . . . . . . . . . . 1006.1.2 Granularity of Data Sharing . . . . . . . . . . . . . . . . . . . . . . . 1016.1.3 Can this be fixed by modulating the transfer granularity? . . . . . . . . 102
6.2 Why revisit this problem? . . . . . . . . . . . . . . . . . . . . . . . . . . . . . 1036.2.1 Hardware differences . . . . . . . . . . . . . . . . . . . . . . . . . . . 1046.2.2 Application differences . . . . . . . . . . . . . . . . . . . . . . . . . . 1046.2.3 Programming paradigm differences . . . . . . . . . . . . . . . . . . . 105
6.3 Motivating our solution . . . . . . . . . . . . . . . . . . . . . . . . . . . . . . 1066.3.1 Software rather than Hardware . . . . . . . . . . . . . . . . . . . . . . 1066.3.2 Automated vs. Programmer initiated? . . . . . . . . . . . . . . . . . . 1076.3.3 Can we reduce the Relayout overhead? . . . . . . . . . . . . . . . . . 1086.3.4 Can we hide the (remaining) overhead? . . . . . . . . . . . . . . . . . 109
6.4 OppoRel . . . . . . . . . . . . . . . . . . . . . . . . . . . . . . . . . . . . . . 1126.4.1 OppoRel Compiler Pass . . . . . . . . . . . . . . . . . . . . . . . . . 1126.4.2 Limitations, challenges and boundary conditions . . . . . . . . . . . . 1146.4.3 Protection Issues: . . . . . . . . . . . . . . . . . . . . . . . . . . . . . 115
6.5 Experimental Evaluation . . . . . . . . . . . . . . . . . . . . . . . . . . . . . 116
vi

6.5.1 Workloads . . . . . . . . . . . . . . . . . . . . . . . . . . . . . . . . 1166.5.2 Speedup on Actual Hardware . . . . . . . . . . . . . . . . . . . . . . 1176.5.3 Sensitivity Experiments with Simulation . . . . . . . . . . . . . . . . . 119
6.5.3.1 GPU Memory/Data Capacity . . . . . . . . . . . . . . . . . 1206.5.3.2 Multiple GPU cards . . . . . . . . . . . . . . . . . . . . . . 1216.5.3.3 Less Opportunity - Non-idle CPU cores . . . . . . . . . . . 122
6.5.4 Comparison to prior solutions . . . . . . . . . . . . . . . . . . . . . . 1226.6 Related Work . . . . . . . . . . . . . . . . . . . . . . . . . . . . . . . . . . . 1236.7 Chapter Summary . . . . . . . . . . . . . . . . . . . . . . . . . . . . . . . . . 124
Chapter 7Conclusions and Future Work 1297.1 Addressing Frontend bottlenecks in cloud with CritIC . . . . . . . . . . . . . . 1307.2 AI based system optimizations . . . . . . . . . . . . . . . . . . . . . . . . . . 1307.3 Approximations on user-interactions . . . . . . . . . . . . . . . . . . . . . . . 1307.4 System optimizations using data relayout . . . . . . . . . . . . . . . . . . . . 131
Bibliography 132
vii
List of Figures
1.1 A user interacts with a mobile (edge) device that performs some computationson the rich inputs using CPUs and ASICs and offloads the rest of the computa-tions to powerful cloud servers where CPUs and GPUs perform heavy compu-tations . . . . . . . . . . . . . . . . . . . . . . . . . . . . . . . . . . . . . . . 3
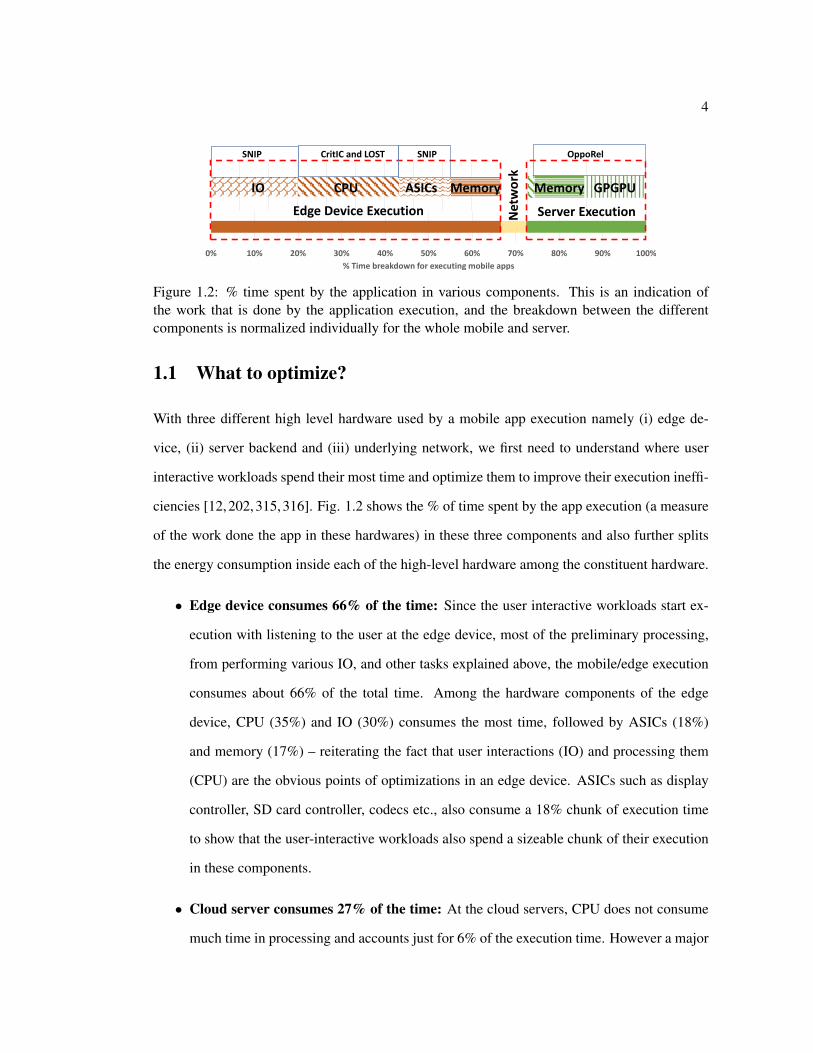
1.2 % time spent by the application in various components. This is an indication ofthe work that is done by the application execution, and the breakdown betweenthe different components is normalized individually for the whole mobile andserver. . . . . . . . . . . . . . . . . . . . . . . . . . . . . . . . . . . . . . . . 4
3.1 Execution Time and energy breakdown of Maps(CPU Dominant), Youtube(IPDominant) and Overall characteristics. . . . . . . . . . . . . . . . . . . . . . . 15
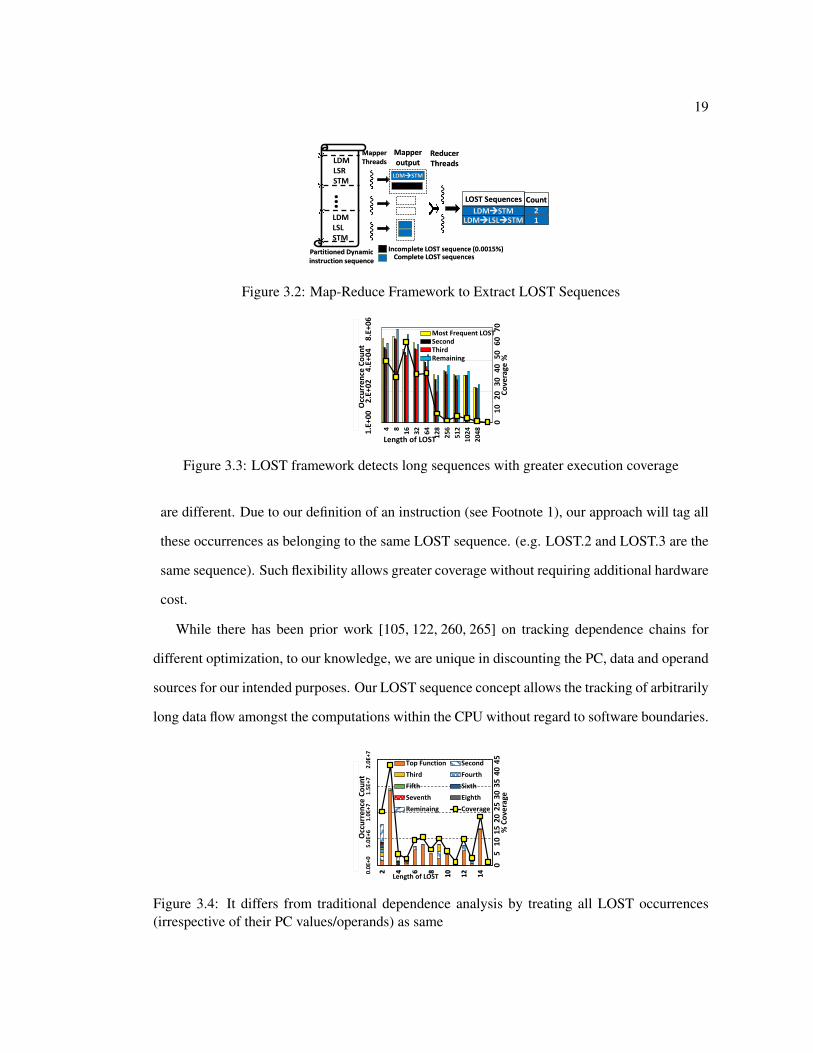
3.2 Map-Reduce Framework to Extract LOST Sequences . . . . . . . . . . . . . . 193.3 LOST framework detects long sequences with greater execution coverage . . . 193.4 It differs from traditional dependence analysis by treating all LOST occurrences
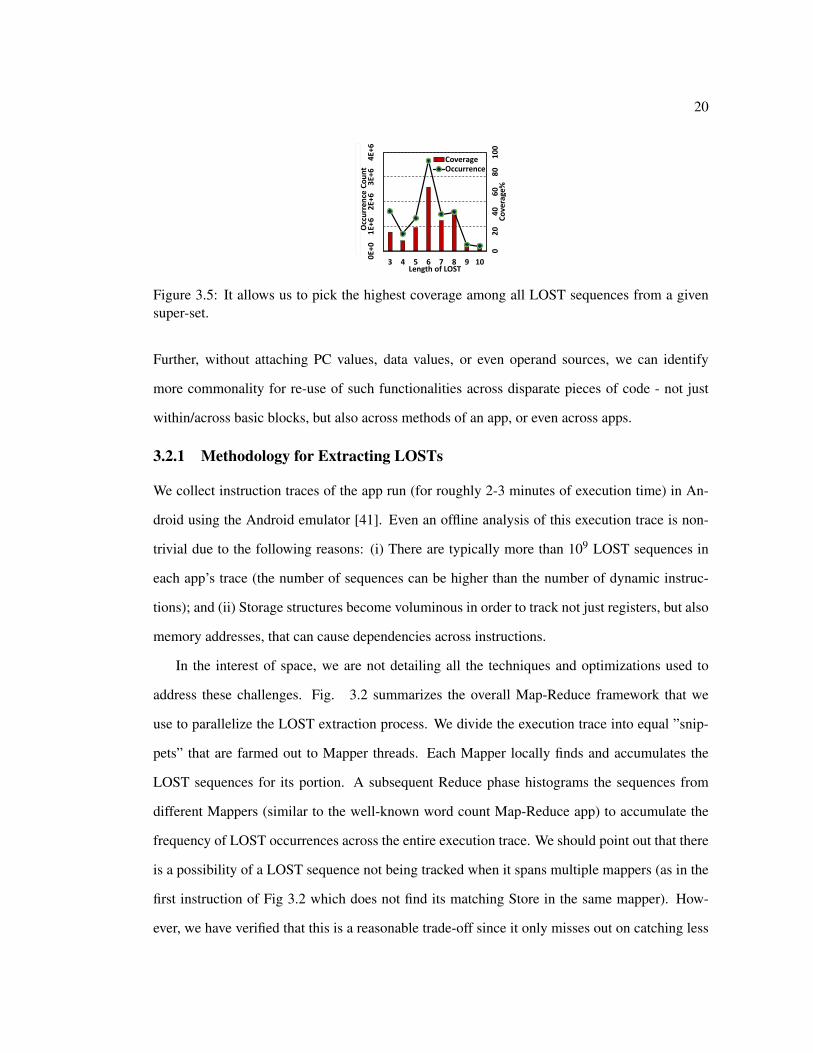
(irrespective of their PC values/operands) as same . . . . . . . . . . . . . . . . 193.5 It allows us to pick the highest coverage among all LOST sequences from a
given super-set. . . . . . . . . . . . . . . . . . . . . . . . . . . . . . . . . . . 203.6 (a)We use 5 apps to validate LOST’s generality. (b)We identify the CPU bottle-
neck in executing the LOST instructions . . . . . . . . . . . . . . . . . . . . . 243.7 Dependence Scenarios between LOST Instructions and Normal Execution . . . 273.8 Operand-lists of Generic LOSTs vary between their occurrences, shorted and
shown as CDF of their contributions to the the corresponding LOST coverage . 283.9 Incorporating the LOST Accelerators in Datapath (shown in yellow) . . . . . . 283.10 LOST execution example: CDP takes 1 cycle for simplicity. . . . . . . . . . . 303.11 Performance speedup with LOST hardware acceleration . . . . . . . . . . . . 333.12 (a) shows LOST sequence benefits across all the CPU execution stages; (b) Un-
favorable branches, bulges and operand-list based coverage limitations cannotbe accelerated by LOST, shown as ”unacceleratable”. . . . . . . . . . . . . . . 33
viii
4.1 (a) Despite having frequent Critical Instructions, mobile apps do not benefitas much. (b) Reason: Critical instructions in SPEC do not depend much onother critical instructions. But, Android apps have two successive high-fanoutinstructions in a dependence chain, with 0(direct-dependence) to 5 low fanoutinstructions between them. . . . . . . . . . . . . . . . . . . . . . . . . . . . . 38
4.2 Illustrating why high-fanout prioritization may not help. . . . . . . . . . . . . 394.3 (a) Fetch to Commit breakdown of high-fanout instructions in SPEC vs An-
droid (b) In Android, Fetch is more bottlenecked due to both (i) stalling forinstructions to be fetched (F.StallForI), and (ii) stalling for resources and de-pendencies (F.StallForR+D) to move the instructions down the pipeline. (c)Mobile apps have fewer high latency instructions compared to SPEC. . . . . . 42
4.4 Example: Need to optimize CritICs . . . . . . . . . . . . . . . . . . . . . . . 454.5 (a)IC length and their corresponding spread in dynamic instruction execution in
SPEC vs Android apps; (b)CDF of coverage by unique CritICs. . . . . . . . . . 464.6 Each CritIC instruction is transformed from the original 32-bit format to the
16-bit Thumb format of ARM ISA [22, 302]. . . . . . . . . . . . . . . . . . . 484.7 Proposed Software Framework for our Methodology . . . . . . . . . . . . . . 504.8 Optimizing CritICs in existing hardware leaves 11% performance gap with the
Ideal scenario. . . . . . . . . . . . . . . . . . . . . . . . . . . . . . . . . . . . 534.9 Code Generation after CritICs have been identified. There are 2 CritICs, A
and B, in this original instruction sequence. . . . . . . . . . . . . . . . . . . . 534.10 Speedup over baseline with CritIC optimization . . . . . . . . . . . . . . . . . 564.11 Fetch stage savings of CritIC instructions . . . . . . . . . . . . . . . . . . . . 564.12 Energy gains with CritIC optimization . . . . . . . . . . . . . . . . . . . . . . 564.13 Comparison with Hardware Mechanisms (a) Speedup and (b) Impact on F.StallForIand
F.StallForR+D. . . . . . . . . . . . . . . . . . . . . . . . . . . . . . . . . . 594.14 Sensitivity Analysis: (a) Fetch savings and speedup w.r.t CritIC length; and (b)
Speedup w.r.t CritIC Profile Coverage. . . . . . . . . . . . . . . . . . . . . . . 604.15 Opportunistically transforming to 16-bit Thumb format. (a) Speedup and (b)
Percentage of Dynamic Instructions converted to 16-bit format. . . . . . . . . . 62
5.1 Example game execution in a smart phone. The user generated events are cap-tured at sensors, to be processed at both CPUs and IPs and finally produces theoutputs back to the user. . . . . . . . . . . . . . . . . . . . . . . . . . . . . . . 68
5.2 Game executions drain the battery at ¿2× the rate at which an idle phone drainsthe battery. . . . . . . . . . . . . . . . . . . . . . . . . . . . . . . . . . . . . . 70
5.3 Both CPU and IPs consume more or less equal amount of energy in these exe-cutions. . . . . . . . . . . . . . . . . . . . . . . . . . . . . . . . . . . . . . . 70
5.4 % of user events captured in mobile games that resulted in the exact same outputas current state after processing. . . . . . . . . . . . . . . . . . . . . . . . . . 72
ix
5.5 To short-circuit a computation, it should ideally exhibit the properties of (a)where all input/output locations are pre-determined and only the values in theinput/output change with instances of computation. Whereas (b) has many dy-namic input/output loaded and stored from memory, and it will be difficult toimplement a variable length input/output based lookup table. . . . . . . . . . . 73
5.6 A naive lookup table approach for AB Evolution is prohibitively expensive. Ittakes the entire memory capacity (and SD card capacity) to short-circuit 40% ofthe execution . . . . . . . . . . . . . . . . . . . . . . . . . . . . . . . . . . . 74
5.7 Example characteristics of AB Evolution game illustrates that (a) the three typesof inputs vary in sizes and vary for different instances of event processing; (b)likewise, the three types of outputs also vary similarly; and (c) the reason forsuch variations is the dynamism involved in these game executions. . . . . . . 75
5.8 (a) Using only In.Event objects for input records, the AB Evolution game’slookup table characteristics show better size but has erroneous outputs; (b) Thebreakdown of erroneous outputs. . . . . . . . . . . . . . . . . . . . . . . . . . 78
5.9 An example instance of Permutation Feature Importance [49] employed to iden-tify the most influential input fields from different input categories. . . . . . . . 81
5.10 Overall flow of the proposed methodology . . . . . . . . . . . . . . . . . . . . 835.11 (a) Energy benefits using various schemes; (b) The % execution that can lever-
age each of the optimizations; (c) The overheads in SNIP are due to the extraenergy spent at the CPU and memory for looking up the table before each eventprocessing. . . . . . . . . . . . . . . . . . . . . . . . . . . . . . . . . . . . . 88
5.12 Avoiding developer intervention is possible with adaptive, continuous learningof user behavior. . . . . . . . . . . . . . . . . . . . . . . . . . . . . . . . . . . 90
6.1 Differences in access to the same page from CPU and GPU cores before evictionin QTClustering [80] benchmark. Despite sparsity in the page access by GPU,all its bytes get transferred and stored in GPU memory. . . . . . . . . . . . . . 96
6.2 % Slowdown in baseline execution w.r.t infinite GPU memory . . . . . . . . . 996.3 Capacity misses in GPU memory . . . . . . . . . . . . . . . . . . . . . . . . . 996.4 Average % of page used in GPU memory before eviction . . . . . . . . . . . . 996.5 Architecture of contemporary CPU-GPU systems. . . . . . . . . . . . . . . . . 1016.6 Performance impact of changing the granularity of transfers. . . . . . . . . . . 1036.7 Example code snippet from QTClustering benchmark . . . . . . . . . . . . . . 1056.8 Addresses generated by GPU Kernels can be dynamic and complex . . . . . . 1076.9 % Execution time spent in CPU performing relayout . . . . . . . . . . . . . . 1086.10 Overlapping relayouts with slack . . . . . . . . . . . . . . . . . . . . . . . . . 1096.11 Ability to hide ovhd within SlackCPU . . . . . . . . . . . . . . . . . . . . . . . 1096.12 Ability to hide Ovhd within SlackCPU +SlackGPU . . . . . . . . . . . . . . . . 1116.13 The same code snippet in Fig. 6.7 is modified with our proposed mem relayout
and mem undo relayout calls. . . . . . . . . . . . . . . . . . . . . . . . . . . 1266.14 Performance Speedup with OppoRel on actual hardware . . . . . . . . . . . . 127
x

6.15 Capacity misses on the GPU . . . . . . . . . . . . . . . . . . . . . . . . . . . 1276.16 Effect of increasing GPU memory capacity . . . . . . . . . . . . . . . . . . . 1276.17 Effect of OppoRel on 2 GPU setup . . . . . . . . . . . . . . . . . . . . . . . . 1286.18 Effect of varying CPU utilization . . . . . . . . . . . . . . . . . . . . . . . . . 1286.19 Comparison with prior page-granularity aware prefetching approach . . . . . . 128
xi
List of Tables
3.1 Top 2 APIs by coverage for each app is shown in 2nd and 4th columns. 3rd
column shows the 2 most invoked functions from APIs in 2nd column with theirrespective coverage. API Size (5th) and #Changes (6th) for both the top APIs isshown in order. The 7th and 8th columns denote the coverage from the 2 mostcommon functions. . . . . . . . . . . . . . . . . . . . . . . . . . . . . . . . . 16
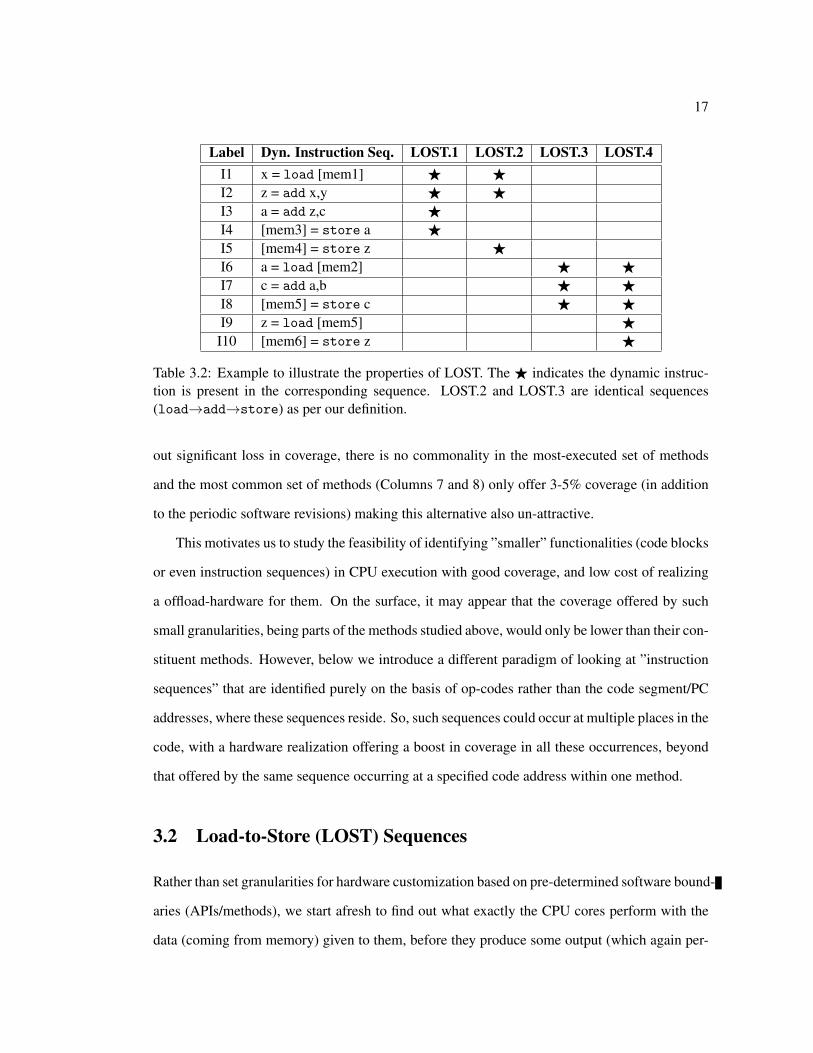
3.2 Example to illustrate the properties of LOST. The F indicates the dynamic in-struction is present in the corresponding sequence. LOST.2 and LOST.3 areidentical sequences (load→add→store) as per our definition. . . . . . . . . 17
3.3 Top 5 LOST sequence across all apps: The names are based on the function inwhich the LOST commonly occurs. The numbers appended to names are just todistinguish between the LOSTs of the same group. The descriptions are derivedfrom their respective function documentations. Common action indicates thatthe same LOST is found in many functions. The LOST sequences which haveblue-text are the specific ones that we will use in the subsequent evaluations,
and the percentages indicated next to them is the coverage of these sequencesacross all 10 apps. In others, it is the coverage in those apps given in the lastcolumn; Underlined= Top LOSTs for app. . . . . . . . . . . . . . . . . . . . 22
3.4 Simulation Configuration . . . . . . . . . . . . . . . . . . . . . . . . . . . . . 313.5 Popular Handheld Apps Used for Evaluation . . . . . . . . . . . . . . . . . . . 31
4.1 Baseline Simulation configuration. . . . . . . . . . . . . . . . . . . . . . . . . 544.2 Popular Mobile and SPEC apps used in evaluation. . . . . . . . . . . . . . . . 55
5.1 Example Code in Games and what parts can be optimized by the prior works. . 87
6.1 Workload Characteristics. Numbers in brackets give the number of GPU kernelsin each benchmark. . . . . . . . . . . . . . . . . . . . . . . . . . . . . . . . . 116
6.2 Hardware Configuration . . . . . . . . . . . . . . . . . . . . . . . . . . . . . 1176.3 Simulation Parameters . . . . . . . . . . . . . . . . . . . . . . . . . . . . . . 118
xii

Acknowledgments
Many have helped me towards completing this thesis over the course of time. My advisor, ProfAnand has tolerated me for all my ignorances and patiently taught me whatever I would beneeding. From the littlest of nudges to go read a paper from the 1900s to the torrential downpourof ideas, I have been awestruck by the elegance of his thought process almost everytime we hada discussion. He made sure I am always moving on the right direction and made me think ahead,even when that one reviewer killed our submissions. I also am immensely fortunate to work withProf Das and Prof Kandemir – who always allocated their time and energy to direct me towardsthe right research paths whenever I got stuck or speculated the wrong path.
Not only in research, the amount of life-lessons, free food and coffee/tea we were lavishedin the lab kept getting better with time. They also encouraged to us plan and go for trips to PoeValley, Ridenour Overlook, Harrisburg, etc., to recuperate after intense deadline weeks. I willcherish all these moments and life lessons for the rest of my life.
When I had seemingly impossible tasks like working on my first paper or a bad debug/resultday, there were always quality people around me in the lab. I cannot thank these people enoughfor playing accelerators for debugging, paper writing and recuperating after a bad day. Moreover,the technical conversations, random stuffs and jokes we had in the lab were always refreshing:whether it is the long evening conversations or car rides with Prof Anand, Prof Das, Prof Kan-demir, Prof Vijay or Prof Jack or fun moments like watching cricket, having “surprise” birthdayparties, everyday lunch outings, analyzing batman vs superman, playign ping pong tournaments,etc., my friendship in HPCL, CSL and other labs grew to a bigger crowd each time. Some of mycherished times were spent with Haibo Zhang, Shulin Zhao, Ashutosh Pattnaik, Srivatsa Ren-gachar Srinivasa, Prashanth Thinakaran, Siddarth Rai Balakrishna, Alexandar Devic, Chia-HaoChang, Adithya Kumar, Yunjin Wang, Aman Jain, Anup Sarma, Tulika Parija, Sonali Singh,Jashwant Gunasekaran, Huaipan Jiang, Cyan Mishra, Nima Elyasi, Morteza Ramezani, Mo-hamed Arjomand, Sampad Mohapatra, Sandeepa Bhuyan, Berkay Zeynel Celik and MichaelNorris.
Apart from the wonderful work culture I enjoyed with these people, we also were lucky tohave the warm and welcoming families of the professors and labmates. They always talked to uswith beaming smiles whenever we met them. Vivek helped me solve my acid issues by gettingmeds from his room right away, and checking on me later. Vidhya ma’am cooked deliciousfoods for us everytime she came to the US and had cooked a grand lunch for me when I dropped
xiii

by. Lucy aunty took our entire lab to their family wedding in Detroit and fed us everytime wewent to their home, irrespective of the timeofday. Jashwant’s parents invited us to eat a warmdelicious south Indian meal on a typical state college winter afternoon. His wife invited us fordinner on multiple occassions and spoilt us with her famous baking all the time. Ashutosh’sparents fed us everytime we went to their place. Aman the one man cooking army cooked hissignature delicacies for us – as a non-repeating set of double digit dishes on every Indian festivaloccassions.
Lastly, my own family and friends circle from my past understood and accepted the quirks ofPh D more than I could wish for. I was also fortunate to have my wife and brother do Ph D alongwith me. My brother, sister and uncles taught me most of my CS basics to pivot me towards CSresearch. My wife became my best friend during my Ph D and since she was on a different areathan me, she saw through my problems with a different lens. It helped me shape the ideas forthe problems (e.g., applying ML for SNIP in this thesis), radically different than what I wouldhave come up on my own. Our parents/in-laws with their rock of a support system, strenuouslyinsulated us from the all the distractions at home – leaving us to be as comfortable as possible.
I also thank the funding agencies for generously supporting the works in this thesis with NSFgrants 1763681, 1714389, 162651, 1409095, 1629129, 1626251, 1439021, 1439057, 1320478,1317560, 1629915, 1213052, 1302557, 1526750, 182293, a DARPA/SRC and a grant from Intel.Disclaimer: The findings and conclusions in this thesis do not necessarily reflect the view of thefunding agencies.
xiv

Chapter 1Introduction
The proliferation of mobile devices over the past decade has been fueled by not just hardware
advancements, but also by the numerous and diverse applications (apps) that these devices can
support. The number of such devices far exceeds the desktop and server markets, with nearly
2.6 billion mobile devices serving more than 35% of the world population today. Fueled by this
widespread adoption of mobile phones, various mobile apps belonging to very diverse domains
such as video streaming, gaming, messengers, office productivity, healthcare, creativity, etc.
have been developed, published, downloaded and installed by over 25 billion times [271, 272].
While the hardware inside a phone is largely based on the lessons learnt from decades of server
and desktop computing domains with workloads such as SPEC [131], PARSEC [45], Parboil
[274], etc., that mainly target the raw computation power of the CPUs, the data delivery from
storage/memory, etc., mobile apps do much further than just computations. We next take an
example execution of a very popular and ubiquitiosly used mobile app, Google Maps to illustrate
the high level difference between a mobile app executing in a phone and a server app execution.
At a high-level a mobile phone is constantly near a human user, and has the following con-
trasts when compared to server platforms:
1. Differences in User Interaction: The user constantly “interacts” with the phone with var-
ious types of inputs such as searching for a destination in the Maps (text input using touch),
using voice commands (audio feed through microphone) while driving (GPS feed), tilting

2
and walking with it (gyro and gravity sensors), pinching/zooming/swiping, etc., that are
interpretted inside the phone as triggers for performing computations like understanding
the voice to text, route computations, etc.
2. Differences in energy budgets: Mobile phones are typically powered by a small battery
and so, if Maps app is used in navigation, even a fully charged battery of 3300mAh capac-
ity drains within a few hours. In contrast, server executions do not suffer from such tight
energy budgets.
3. Differences in compute capability: The compute capability in a phone is much wimpy
[24–26] when compared to a server. This naturally limits the phone from performing
heavy computations. For example, to find the optimal route to a destination, the Maps
app cannot process the terabytes of road network data that is typically used in finding the
optimal route. It has very limited memory and storage and can only process limited data.
In contrast, servers potentially can host terabytes of main memory today [31], and can
easily process the road network with seemingly heavy computations such as finding the
shortest path using graph traversal algorithms to get the shortest path, live traffic feed, etc.
4. Differences in compute paradigm: To perform heavy computations, mobile executions
use two options: (i) either the computation is performed in one of the compute units
inside the mobile hardware; or (ii) the computation is offloaded to the cloud servers and
seamlessley get the results back from the cloud to the user. For example, when the Maps
application executes in the phone, it locally performs certain computations such as reading
the inputs from various sensors (e.g., GPS location), process the user inputs to get the
source and destination for the user to find route, and then offload the route-finding process
to the cloud and subsequently get the route from the cloud, locally process the route data
to display to the user.
The above set of differences is summarized as the underlying architecture used for a mobile app
execution (Google Maps in this example) in Fig. 1.1 and the hardware is detailed below:

3
Mo
bile
Arc
hit
ect
ure
LOST and CritICControl flowData flow
CPU
GPGPUMemory
Memory
Serv
er
Arc
hit
ect
ure
OppoRel
ASICs Memory
Input Sensors
Input Sensors
Output Devices
CPUIns1
Ins2
Ins3
Ins4
Ins5
Ins6
… Net
wo
rk
SNIP
Figure 1.1: A user interacts with a mobile (edge) device that performs some computations on therich inputs using CPUs and ASICs and offloads the rest of the computations to powerful cloudservers where CPUs and GPUs perform heavy computations
1.0.1 An edge device
To enable user interactions the edge device (typically a smart phone or tablet) precisely captures
information about the user behavior in realtime such as touch, swipe, tilt, images of the sur-
roundings, audio feed, geo location, etc. in the Google Maps example, using many input sensors
like camera, microphone, touch, accelerometers, gyroscopes, GPS, etc., and processes them in-
side the phone. For example, the user may type the source/destination information with a series
of touch inputs or using dictations (microphone), or it automatically picks the geographic locale
of the user from GPS, etc., and process the information using a relatively small compute power
consisting of a lightweight ARM CPU [7, 26], some domain specific accelerator IPs for specific
functionalities like image processing [100], audio/video codec [136], display controller [7], etc.
Subsequently, it offloads the data-intensive chunk of the computation, i.e., finding the route
from source to destination in the maps app, to the server backend using the underlying wireless
network such as LTE/WiFi etc., and receives the output to display back to the user.
1.0.2 Cloud servers
At the cloud, the offloaded task to find the route between a source and destination uses the hard-
ware consisting of multiple high-end general purpose CPU cores, GPU accelerators and FPGAs,
or even domain specific accelerators such as TPUs, etc., each with their own local or shared
memory hierarchies (as shown in Figure 1.1) and computes the route. Once the computation is
complete, the response is sent back to the querying edge device from the cloud.
4
0% 10% 20% 30% 40% 50% 60% 70% 80% 90% 100%
% Time breakdown for executing mobile apps
CritIC and LOST OppoRelSNIP SNIP
Edge Device Execution Server ExecutionNet
wo
rk
IO CPU ASICs Memory Memory GPGPU
Figure 1.2: % time spent by the application in various components. This is an indication ofthe work that is done by the application execution, and the breakdown between the differentcomponents is normalized individually for the whole mobile and server.
1.1 What to optimize?
With three different high level hardware used by a mobile app execution namely (i) edge de-
vice, (ii) server backend and (iii) underlying network, we first need to understand where user
interactive workloads spend their most time and optimize them to improve their execution ineffi-
ciencies [12,202,315,316]. Fig. 1.2 shows the % of time spent by the app execution (a measure
of the work done the app in these hardwares) in these three components and also further splits
the energy consumption inside each of the high-level hardware among the constituent hardware.
• Edge device consumes 66% of the time: Since the user interactive workloads start ex-
ecution with listening to the user at the edge device, most of the preliminary processing,
from performing various IO, and other tasks explained above, the mobile/edge execution
consumes about 66% of the total time. Among the hardware components of the edge
device, CPU (35%) and IO (30%) consumes the most time, followed by ASICs (18%)
and memory (17%) – reiterating the fact that user interactions (IO) and processing them
(CPU) are the obvious points of optimizations in an edge device. ASICs such as display
controller, SD card controller, codecs etc., also consume a 18% chunk of execution time
to show that the user-interactive workloads also spend a sizeable chunk of their execution
in these components.
• Cloud server consumes 27% of the time: At the cloud servers, CPU does not consume
much time in processing and accounts just for 6% of the execution time. However a major

5
chunk of execution time is spent on GPGPUs (52%) followed by the memory accesses
in both host and GPU (41%). Thus, in stark contrast to the mobile/edge execution where
CPU and IO are dominant, cloud spends its time on memory and GPGPUs.
• Network consumes only 6%: Network is not a major part of the whole application ex-
ecution as it only consumes 6% of the whole execution. This is primarily because of
the fact that network is already optimized for a huge data rate/bandwidth (e.g., HD video
streaming, tele-conferencing, etc.) and interactive applications such as Google Maps just
send and receive texts and images from the cloud, with relatively lower bandwidth require-
ments. Therefore, it is not as important to optimize for network traffic for these categories
of workloads.
Thus we need to explore different optimization strategies for edge device execution where CPU
and IO are important, and cloud execution where GPU and memory are important, in order to
optimize for the execution of user interactive workloads. In fact, this proposal targets specific
optimizations to increase the CPU execution and IO efficiency at the edge device and memory
optimizations at the cloud device.
1.2 Proposed Solutions in this Thesis
This thesis tackles the computation and memory requirements of user interactive workloads in
four parts that targets specific components in both edge and cloud and optimizes their execution.
To understand the optimizations, consider the same Google Maps app execution example:
Hardware Optimization for mobile/edge CPU: As mentioned above, the maps app starts
with user interaction to input the application regarding the source and destination for which the
route is to be found. When the cloud gets the route information back to the mobile device, again
the mobile CPU processes the result from cloud to display them back to the user. Therefore the
CPU at the edge device is responsible for processing both the user input and the resulting output
from cloud (to be visualized as output by the user at the display/speakers). This translates to IO

6
and CPU consuming 65% of the total execution time within the mobile device. This functionality
of user input and output processing at the mobile CPU is rather a common characteristic of all
app executions.
In order to optimize this functionality among app executions at the CPU, this research iden-
tifies the repeated high-level functionalities in app executions as data dependent sequence of
operations in the app code. Since the CPU already has a function unit pool (execution unit pool
in superscalar CPUs), this optimization leverages these resources to fuse them along a certain
path to represent the high level functionalities such as user event processing, XML parsing of
data from cloud, etc., that occur frequently in app execution.
In this way, any repeated high level functionality for any app execution (and even common
occurences across apps) can be optimized by just identifying and configuring the CPU datapath
to fuse the function units to follow the specific high level functionality. By fusing the datapath
between functional units, these configurable acceleration sequences can still be integrated into
the superscalar datapath itself and by thus accelerating the data movement between functional
units, mobile executions can potentially save 25% of CPU execution time.
Software Optimization for mobile/edge CPU: Customizing hardware is an expensive propo-
sition and it may not be conducive for realizing the above optimization. Instead, the second
part of this thesis focuses on achieving similar optimizations with off-the-shelf hardware itself,
with a purely software approach. Towards optimizing CPU execution at the software, this part
optimizes the instructions that are critical for application performance (referred to as critical
instructions [52, 102, 267, 268, 276, 283]). Specifically, this proposal characterizes that exist-
ing critical instruction optimizations proposed in the context of desktop and server class work-
loads [60, 164, 172, 185, 197, 200, 230, 231, 285, 314] are not helpful for mobile app executions.
Compared to desktop/server workloads, the critical instructions in mobile app executions occur
in larger volumes in the form of Critical Instruction Chains or CritICs, which are a set of data
dependent sequence of critical instructions with some non-critical instructions interspersed in
the data flow. For example, in Google Maps app, when it needs to find the orientation/direction

7
in which the user is walking/driving, it needs to compare two successive position values from
GPS/gyro. Both these values are critical for the execution and it is useless if only one of the
values are loaded and the execution still waits for the other.
Further analysis on their execution characteristics point that these CritICs are bottlenecked
in the front end of the superscalar pipeline. Hence, to optimize CritICs, we propose a software
framework to profile, identify and represent the CritICs in the already existing 16-bit thumb ISA
format and halve the fetch-side bottleneck for these executions at the software that results in
12.6% CPU energy savings.
Short circuiting the entire execution in the edge: While the CritIC optimization is generi-
cally applicable for any CPU execution, this third research takes a step further to investigate what
is the unique trait of edge workload executions that can be exploited? This research exploits the
highly user interactive nature of mobile app executions and that the computation is driven by
the user inputs. And if this is the case, why restrict the optimization to short sequences of in-
structions and why not short circuit the whole computation itself? To focus on leveraging the
user-interaction to the most, this optimization specifically applies for a domain of apps execut-
ing in the edge devices – user-interactive gaming, where many different user inputs such as tilt,
swipe etc., will result in a frequently occurring limited set of outputs. Characterizations of event
processing activities in several popular games show that (i) some of the user events are exactly
repetitive in their inputs, not requiring any processing at all; or (ii) a significant number of user
events are redundant in that even if the inputs for these events are different, the output matches
events already processed. Memoization is one of the obvious choices to optimize such behavior,
however the problem is a lot more challenging in this context because the computation can span
even functional/OS boundaries, and the input space required for tables can takes gigabytes of
storage. Instead, this research proposes Selecting Necessary InPuts (SNIP) software solution to
use machine learning to isolate the input features that we really need to track in order to consid-
erably shrink memoization tables. We show that SNIP can save up to 32% of the energy in these
games without requiring any hardware modifications.

8
Memory optimizations on CPU-GPU executions in the cloud: To optimize for the huge
memory/GPU execution time in the cloud, this final part of the thesis identifies that due to the
limited GPU memory capacity, when many of the pages are migrated to the GPU memory on
demand during execution, it leads to a thrashing behavior where pages get kicked out before they
are fully used by the GPU execution. To overcome this problem, this optimization exploits the
uniqueness of the GPU workload executions – where the CPU execution invokes a GPU kernel
and waits for the kernel to finish execution at the GPU before continuing its execution. So,
effectively, there is cycles available at the CPU side to waste. This proposal leverages this wasted
CPU time to compute the addresses that will be accessed by the next GPU kernel execution
at the CPU host, to opportunistically ”pick and pack” only the useful data in a page and only
transfer the packed data to the GPU memory from the host. By doing this Opportunistic Relayout
or OppoRel, we observe that we can save 34% of the application execution time in the GPU,
translating to corresponding cloud energy benefits as well.
The rest of the thesis is organized as follows: In the next chapter, the thesis presents a sum-
marized view of the related works spanning the different optimizations proposed across the edge
and cloud server executions. The third chapter presents the motivation and underlying ineffi-
ciencies in the mobile CPU execution and explore the best approach in terms of performance an
energy efficiency to short-circuit frequently occurring load-to-store sequences of instructions at
the hardware. The fourth chapter addresses the software execution inefficiencies in the mobile
edge CPU execution and points out that mobile app executions have contrasting characteristics
when compared to the traditional CPU benchmarks such as SPEC, PARSEC, etc. Such differ-
ences also manifest in short-circuiting executions of a mobile app in the fifth chapter. In this
chapter, we discuss that existing approaches to short-ciruit a function call or a sequence of in-
structions or data flow graphs using lookup tables are not feasible and becomes prohibitively
expensive to short-circuit an end-to-end mobile app execution in the edge – that starts from sen-
sor event occurence and ends in displaying some outputs to the user. Therefore, this chapter
exploits the unique characteristics of mobile games to leverage a machine learning technique
and short-circuit end to end executions. While the above three chapters from two to five focus

9
on optimizing the mobile execution, the sixth chapter tackles the severe memory inefficiencies
in the cloud execution for user interactive apps’ backend.

Chapter 2Related Work
2.1 Moving computations from CPU to accelerators
Domain specific coarse grained hardware customizations such as [66, 83, 133, 221, 308] move
the computations out of the CPU to a specialized circuitry off the CPU for performance/energy
benefits. A somewhat fine grained accelerator design such as [118, 122, 128, 154, 204, 298]
integrate a reconfigurable execution unit into the CPU pipeline. These works accelerate in-
struction sequences in the ranges of thousands of instructions, while general purpose acceler-
ation extensions to the main CPU such as [205, 242, 265] and ISA extensions like SIMD and
VLIW [54, 91, 93, 159, 186, 247, 280] accelerate tens of instructions by exploiting spatially and
temporally proximate computations occurring in various regular code executions and compile
them into special instructions in the ISA. In the next chapter, we will show how mobile ex-
ceutions already leverage many of these optimizations for CPU executions and yet remain bot-
tlenecked. Further, we will also demonstrate how our proposed LOST acceleration can help
alleviate the CPU execution inefficiencies.

11
2.2 Criticality and Front end optimizations
Instruction criticality has been shown to be an important criterion in selectively optimizing the
instruction stream. Prior work has revolved around both (i) identifying critical instructions [89,
172, 267, 268, 283, 285] using metrics such as fanout, tautness, execution latencies, slack, and
execution graph representations, as well as (ii) optimizing for those identified using techniques
such as critical load optimizations [52, 102, 267, 268, 276] or even backend optimizations for
critical instructions such as [60, 164, 172, 185, 197, 200, 230, 231, 285, 314].
Fetch stage bottlenecks have been extensively addressed in high end processors through
numerous techniques - smart i-cache management (e.g. [132,156,219,264,273,299]) prefetching
(e.g. [55, 142, 147, 189, 309]), branch prediction (e.g [5, 258, 306, 313]), instruction compression
[57] SIMD [91, 280], VLIW [93], vector processing [77], etc. However, many of these require
extensive hardware that mobile platforms may not be conducive for.
In Chapter 4, we will investigate why these optimizations studied in high-end systems are
not sufficient for mobile app execution optimization and how to adapt these optimizations for an
important class of workloads namely, user interactive workloads in mobile devices.
2.3 Short circuiting executions
Short circuiting executions by looking up the previous history and predicting the output has
been studied in the past for high end CPU executions [5, 70, 230, 231, 250, 265, 305], with the
lookup/prediction logic built either into the hardware [176] or the software [181, 252]. While
lookup table based mechanisms generally are used for correct outcomes, approximation is also
used in many domain specific executions such as image processing [86, 192, 193, 224], that are
inherently tolerant to erroneous executions. In particular, [224] presents motivating results that
humans generally are tolerant to 26% errors in audio outputs.
In chapter ??, this thesis demonstrates why these prior works need revisiting in the context
of mobile app executions – especially the highly user interacitve games – and how machine
learning can help in successfully short-circuiting redundant executions.
12
2.4 Data transfer Optimizations in CPU-GPU systems
Data transfer optimizations such as page migrations [1, 163, 168], granularity decisions [4, 40,
81, 101, 161, 222, 256] have been studied in the context of CMPs, between memory and disks in
the past. In the context of GPUs, works such as [43, 148] optimize data transfers between host
memory and GPU memory for regular applications, prefetch pages corresponding to multiple
concurrent contexts [28, 29, 292], remove translation overheads [44, 222, 304], using specific
software [261] and hardware additions to the memory layer [6, 165, 255]. Also, works such
as [153] leverage compiler and runtime support, to insert hints for data prefetching [28, 29],
group threads in different warps for better locality [157, 170, 257, 307] in GPUs.
In chapter 6, this thesis leverages a missed opportunity in these prior works that there are
ample idle compute/memory resources at the host when it offloads a kernel to the GPUs that
can be used to precisely understand what the GPU execution requires in terms of data, and
subsequently re-arrange them too. Doing so results in a better management of GPU resources
with no extra hardware costs.
2.5 Novelty of this thesis
Overall, this thesis defines the goal of optimizing the execution of user-interactive workloads –
both at the mobile/edge device as well as the cloud servers, by contributing to several key miss-
ing pieces of the goal. Although there are many prior works optimizing parts of the system, this
thesis specifically addresses the most bottlenecked components in each device, by leveraging the
innate domain-specific property of these systems. First, in the area of mobile CPU execution, it
identifies the otherwise “LOST” opportunities to arrive at a generic, and useful hardware accel-
erator that benefit diverse apps ranging from office suites like PDF reader, mail client, etc., to
mainstream apps such as video streaming, messenger, games etc. Second, the proposal identifies
and fixes the front end bottlenecks posed by the critical instruction chains by using a software
compiler pass to halve their fetch bandwidth consumption using 16-bit thumb ISA to represent
them. Third, the proposal explores machine learning approaches to learn a user behavior and use

13
that knowledge to cut-down on the lookup table costs for short-circuiting user input behavior to
output generation and not execute the computation in the middle, whenever possible. Finally, it
leverages the CPU idle time seen in CPU-GPU based high end servers to relayout the data to be
useful for GPU execution and increase the data access efficiency for the GPU workloads.

Chapter 3LOST: Hardware Optimization for
mobile/edge CPU
In order to tackle the computation and memory requirements of user interactive workloads in
contemporary hardware, as discussed in Chapter 1, one need to focus on solving individual
requirements of workload executions in two extreme scenarios namely, (i) the user-interaction
rich mobile phone/edge device executions and (ii) its high-end counter part in the server backend.
Of these two components, this chapter first explores techniques towards optimizing the for-
mer, i.e., the mobile phone/edge device execution. Drilling down into the mobile execution,
the largest consumer of energy in mobile execution in Fig. 1.2 is the CPU execution. Towards
optimizing CPU execution, a lot of past research have proposed to accelerate CPU execution by
offloading hot code to specialized hardware [66, 83, 118, 128, 133], custom hardware units from
DFGs [122,205,242], µOps [54,140], etc. These optimizations target throughput-oriented apps
in scientific domain such as SPEC [131]. In contrast, handheld apps are user-oriented wherein
there is a great deal of user interactions based on which events are processed. Note that, these
events also repeat over time, giving rise to frequently executed and common functionalities. So,
this thesis first validate whether the existing methods such as hot function offloading is applicable
for this handheld domain or not.

15
27%
46%
15%
12%Youtube Time
30%
34%
24%
13%Youtube Energy
62%14%
13%
11%Maps Time
40%
13%
31%
16%
Maps Energy
48%
25%
14%
13%Overall Time
35%
18%
30%
17%
Overall Energy
CPU
IP
Peripherals
Memory
Figure 3.1: Execution Time and energy breakdown of Maps(CPU Dominant), Youtube(IP Dom-inant) and Overall characteristics.
3.1 Coarse Grain Customization
In this section, we analyze a spectrum of ten diverse and popular Android apps, listed in Ta-
ble 3.5, to understand which are the dominant contributors in hardware and software to sub-
sequently optimize for performance and/or power. These apps have been ported to run on
Gem5 [46] with IP models [68] framework. The configuration used is discussed in Sec. 3.4.
3.1.0.1 Hardware Characterization
Fig. 3.1 shows a breakdown of execution time and energy expended in different hardware com-
ponents. We find that, while current IPs (e.g., codecs, GFX) are extremely useful in some apps
(e.g., Youtube), they are not universally applicable to others (such as Maps) because of their
coarse grain customization. This is evident from the overall breakdown where CPUs are still the
dominant contributor of both execution time (48%) and energy (35%).
3.1.0.2 Software Characterization
We next present characterization results from the software perspective to examine which are
the dominant software portions in the execution? and how common/frequent are these domi-

16
1.App 2.Most executed 3.Top two most 4: 2nd most executed 5: #inst. 6: # Fix 7: % 8: %APIs/Libs invoked methods APIs/Libs in APIs from 2008 CF1 CF2
Browser Landroid 25% Handler.enqueueMessage 10.8% libc/timekeeping 11% 30.6M 3657 5% 4.5%TextView.setText 8.5% 21k 107
Angry Lcom/android/ 23% SensorEventListenerImp 21% libc/timekeeping 10% 226k 0 4.6% 5%birds internal/policy PrintWriter.Write 0.4% 21k 107Photo Lcom/android/ 23% createBitmap 21.6% libc/timekeeping 10% 150k 136 4.3% 5.3%Gallery graphics irq exit 0.7% 21k 107Youtube Landroid/ 21% Message.sendToTarget 12% Lcom/android/ 8.7% 30.6M 3657 5% 4.7%
getSqlStatementType 3.6% graphics 150k 136Maps Landroid/content 14% XMLBlock.parse 13% Landroid 10% 399k 308 5.6% 5%
raise softirq irqoff 0.2% 30.6M 3657Music Landroid/ 13% LocalSocket.getOutputStream 6.6% libc/timekeeping 9% 30.6M 3657 4.4% 4%Player LoadedApk.ReceiverDispatched 2% 21k 107Acrobat Landroid/ 11% UserHandle.getUserId 6.5% libc/pthread 5% 30.6M 3657 5.7% 5.8%Reader FrameDisplayEventReceive 2.5% 101k 107Email Landroid/ 11% UserHandle.getUserId 5.3% Lcom/android/ 5% 30.6M 3657 4.5% 4%
ComponentName.equals 3.7% email 885k 34PPT Landroid/ 7% getInterpolation 5% Lcom/microsoft/ 5% 612k 3657 5% 4.8%Office view printRatio 0.6% NA NAFace- libc/sys 8% core sys select 4% Lcom/facebook 3% 91k 107 3% 3%bookIM sock mmap 2% NA NAAcross libc/timekeeping 9% CF1:ktime get ts 4.4% libc/pthread 4.5% 21k 107all apps CF2:getnstimeofday 4.2% 101k 107
Table 3.1: Top 2 APIs by coverage for each app is shown in 2nd and 4th columns. 3rd columnshows the 2 most invoked functions from APIs in 2nd column with their respective coverage. APISize (5th) and #Changes (6th) for both the top APIs is shown in order. The 7th and 8th columnsdenote the coverage from the 2 most common functions.
nant portions not just within one app, but across apps? Prior studies have looked at profiling
these APIs and/or individual methods during a single (or a group of related) app’s execution
(e.g., [138, 152, 316]) in order to develop app/domain specific hardware [69, 316], whereas be-
low we examine the execution characteristics at two granularities of the software namely, APIs
and methods, in the ten selected apps. Beyond studying their contribution to each app, we are
also interested in their importance across apps. We discuss these questions with the results in
Table 3.1, that shows top APIs and methods by execution coverage for each app and the top
APIs and methods common across apps (last row). In this paper, we use coverage to denote the
percentage of total dynamic instructions executed by the app.
APIs: As can be seen, the top two APIs in Columns 2 and 4 has up to 36% (25% + 11%) cover-
age (in Browser). But entire Android APIs , albeit with reasonable coverage, are not amenable
to ready hardware customization due to high code size (Column 5) and frequent changes to the
repo (Column 6).
Methods: Even if a drill-down to individual methods is much more tractable (Column 3), with-
17
Label Dyn. Instruction Seq. LOST.1 LOST.2 LOST.3 LOST.4I1 x = load [mem1] F FI2 z = add x,y F FI3 a = add z,c FI4 [mem3] = store a FI5 [mem4] = store z FI6 a = load [mem2] F FI7 c = add a,b F FI8 [mem5] = store c F FI9 z = load [mem5] FI10 [mem6] = store z F
Table 3.2: Example to illustrate the properties of LOST. The F indicates the dynamic instruc-tion is present in the corresponding sequence. LOST.2 and LOST.3 are identical sequences(load→add→store) as per our definition.
out significant loss in coverage, there is no commonality in the most-executed set of methods
and the most common set of methods (Columns 7 and 8) only offer 3-5% coverage (in addition
to the periodic software revisions) making this alternative also un-attractive.
This motivates us to study the feasibility of identifying ”smaller” functionalities (code blocks
or even instruction sequences) in CPU execution with good coverage, and low cost of realizing
a offload-hardware for them. On the surface, it may appear that the coverage offered by such
small granularities, being parts of the methods studied above, would only be lower than their con-
stituent methods. However, below we introduce a different paradigm of looking at ”instruction
sequences” that are identified purely on the basis of op-codes rather than the code segment/PC
addresses, where these sequences reside. So, such sequences could occur at multiple places in the
code, with a hardware realization offering a boost in coverage in all these occurrences, beyond
that offered by the same sequence occurring at a specified code address within one method.
3.2 Load-to-Store (LOST) Sequences
Rather than set granularities for hardware customization based on pre-determined software bound-
aries (APIs/methods), we start afresh to find out what exactly the CPU cores perform with the
data (coming from memory) given to them, before they produce some output (which again per-

18
colates into memory). Understanding this functionality from the input to the output stages can
better help determine granularities, rather than be governed by pre-defined software-boundaries,
that are intended for other purposes. Towards this goal, we define a Load-to-Store (LOST) se-
quence that a core performs, starting with a LOAD from memory, until it produces output in the
form of a STORE into memory, with all the intermediate functional operations performed between
them (in the data flow) becoming part of this sequence. Such a sequence offers the opportunity
for offloading those functionalities between the LOAD and the STORE to an accelerator. However,
the number of such sequences and the size/length of these sequences can become inordinately
large to be implemented in hardware. To address this concern, we pick the ones that yields the
most benefit at low realization costs.
More formally, a LOST sequence starts with a LOAD instruction, and ends with a STORE
instruction that is on the dependence chain of the LOAD. In between, it includes all the instruc-
tions1 on this dependence chain, in the same order of dependence. For instance, Table 3.2 gives
4 LOST sequences for the dynamic instruction sequence I1 to I10. The salient characteristics of
a LOST chain are discussed below:
• Each subsequent instruction of a LOST chain (after the first Load) is dependent on the prior
instruction of that chain.
•Adjacent instructions of a LOST chain do not need to be spatially adjacent either in the code
segment or temporally adjacent in the dynamic execution sequence (e.g. I3 and I4 are not part
of LOST.2). Hence, a single sequence (or even adjacent instructions of a sequence) can cross
basic block and/or method/function boundaries.
•An instruction can simultaneously belong to multiple LOST chains (e.g. I2 belongs to both
LOST.1 and LOST.2), i.e. sequences can intersect. In fact, one can even be a subset of another
(e.g. LOST.3 is a subset of LOST.4).
• The same sequence of CPU functionality (i.e. add, eor, mov/shift [22], etc.) can occur in
multiple places in the code segment, even if the source of the operands (and not just the data)1Note that an instruction, in our discussions, refers to the operation (i.e. opcode) performed by the CPU, and not
the PC value of that instruction, or even the operands used. E.g., add r3, r2, r1 and add r4, r5, r6 are treated as thesame instruction for our purposes since we are only interested in accelerating the functionality once the input data ismade available.
19
LDM LSRSTM
Partitioned Dynamic instruction sequence
Mapper Threads
Reducer Threads
Incomplete LOST sequence (0.0015%)
LDM LSL STM
Mapper output
LDMSTM
…
Complete LOST sequences
LDMSTM 2
LOST Sequences
LDMLSLSTM
Count
1
Figure 3.2: Map-Reduce Framework to Extract LOST Sequences
01
02
03
04
05
06
07
0
1.E
+0
02
.E+
02
4.E
+0
48
.E+
06
4 8
16
32
64
12
8
25
6
51
2
10
24
20
48
Co
vera
ge %
Occ
urr
en
ce C
ou
nt
Length of LOST
Most Frequent LOSTSecondThirdRemaining
Figure 3.3: LOST framework detects long sequences with greater execution coverage
are different. Due to our definition of an instruction (see Footnote 1), our approach will tag all
these occurrences as belonging to the same LOST sequence. (e.g. LOST.2 and LOST.3 are the
same sequence). Such flexibility allows greater coverage without requiring additional hardware
cost.
While there has been prior work [105, 122, 260, 265] on tracking dependence chains for
different optimization, to our knowledge, we are unique in discounting the PC, data and operand
sources for our intended purposes. Our LOST sequence concept allows the tracking of arbitrarily
long data flow amongst the computations within the CPU without regard to software boundaries.
05
10
15
20
25
30
35
40
45
0.0
E+0
5.0
E+6
1.0
E+7
1.5
E+7
2.0
E+7
2 4 6 8
10
12
14
% C
ove
rage
Occ
urr
en
ce C
ou
nt
Length of LOST
Top Function Second
Third Fourth
Fifth Sixth
Seventh Eighth
Reminaing Coverage
Figure 3.4: It differs from traditional dependence analysis by treating all LOST occurrences(irrespective of their PC values/operands) as same
20
02
04
06
08
01
00
0E+
01
E+6
2E+
63
E+6
4E+
6
3 4 5 6 7 8 9 10
Co
vera
ge%
Occ
urr
en
ce C
ou
nt
Length of LOST
CoverageOccurrence
Figure 3.5: It allows us to pick the highest coverage among all LOST sequences from a givensuper-set.
Further, without attaching PC values, data values, or even operand sources, we can identify
more commonality for re-use of such functionalities across disparate pieces of code - not just
within/across basic blocks, but also across methods of an app, or even across apps.
3.2.1 Methodology for Extracting LOSTs
We collect instruction traces of the app run (for roughly 2-3 minutes of execution time) in An-
droid using the Android emulator [41]. Even an offline analysis of this execution trace is non-
trivial due to the following reasons: (i) There are typically more than 109 LOST sequences in
each app’s trace (the number of sequences can be higher than the number of dynamic instruc-
tions); and (ii) Storage structures become voluminous in order to track not just registers, but also
memory addresses, that can cause dependencies across instructions.
In the interest of space, we are not detailing all the techniques and optimizations used to
address these challenges. Fig. 3.2 summarizes the overall Map-Reduce framework that we
use to parallelize the LOST extraction process. We divide the execution trace into equal ”snip-
pets” that are farmed out to Mapper threads. Each Mapper locally finds and accumulates the
LOST sequences for its portion. A subsequent Reduce phase histograms the sequences from
different Mappers (similar to the well-known word count Map-Reduce app) to accumulate the
frequency of LOST occurrences across the entire execution trace. We should point out that there
is a possibility of a LOST sequence not being tracked when it spans multiple mappers (as in the
first instruction of Fig 3.2 which does not find its matching Store in the same mapper). How-
ever, we have verified that this is a reasonable trade-off since it only misses out on catching less
21
than 0.0015% sequences (the mappers are relatively coarse grained working with around 200K
instructions each), and such sequences do not occur frequently either. Further, the hardware sup-
ports ARMv7 ISA, which encompasses ≈2k opcodes with T1ARM, T2, T2EE, NeonSIMD and
VFP instruction formats. So at the mappers, we build an instruction parser supporting ARMv7
ISA to process all the opcodes seen in the execution traces.
3.2.2 Characteristics of LOST Sequences
With an offline analysis of the apps’ dynamic execution, we observe several interesting insights
on LOST sequences:
• Fig. 3.3 plots the number of occurrences and the corresponding coverage of LOST sequences
of different lengths in the Music Player app. In the interest of clarity, the x-axis only shows
sequences of powers of 2, though there are sequences of all lengths in-between. We show
contributions of the top 3 sequences for each length, along with the contribution of all other
sequences of that length. As can be seen, we do find a wide spectrum of sequence lengths,
ranging from the small single digits to as high 200k, though lengths up to 2K are shown in the
Figure. There are many more sequences of smaller lengths compared to those of larger lengths,
and the former has cumulatively higher contribution to the overall coverage because of their
much more frequent occurrences.
• Fig. 3.4 shows the difference between our definition of an instruction in a sequence (i.e. without
regard to PC values) compared to the traditional way [116, 118, 122, 260] of associating an
address with an instruction. In the latter, the same opcode sequence appearing in different
places/functions would get counted as separate sequences (shown as stacked bars for each of
these sequences), and the benefits of a hardware realization for that sequence may not be as
apparent. Our approach on the other hand exploits much more commonality across the entire
code segment.
•Note that because of the property that one LOST sequence can be a proper subset of another,
there is a trade-off in the benefits vs. costs in realizing a superset sequence vs. a subset se-
quence in hardware. The former may incur a higher hardware realization cost, but may not

22
Category LOST Details of Instruction Mnemonics Description Apps benefitedNet.1 17% ld-st Common action: All apps,Top LOST for YoutubeNet.2 3% ld-mv-ld-st All apps
Net Net.3 4% ld-mv-st Found mainly in net, FB,MapsNet.4 43% ld-mv-st-ld-mv-ld-st process creation etc FBNetReceive 13% ld-mv-st-sub-ld-mv-ld-st Processes a net-queue Acro,Angry,Music,Office,PhotoDataTx(kernel)1 26% ld-mveq-ld-mv-st-sub-ld-mv-ld-st Transfers data All apps except Maps and FB
Data- DataTx(kernel)2 5% ld-mveq-mv-ld-mvs-mv-ld-mv-ld-st between kernel Acro,Email,Music,Office,Transfer DataTx(kernel)3 17% ld-mveq-mv-ld-mv-st and user space All apps(Kernel) DataTx(kernel)4 12% ld-mveq-mv-ld-mv-st-mv-ld-eor-st-ld-st Browser,Email,FB,Music,Office,Photo
DataTx(kernel)5 4% ld-mveq-mv-mvs-mv-ld-mv-ld-st EmailDataTx(kernel)6 4% ld-mveq-ld-mv-st All appsDataTx(kernel)7 3% ld-mveq-ld-mv-st-sub-ld-st FBEventListener1 33% ld-asr-smlal-st Part of reading All appsEventListener2 34% ld-asr-smlal-st-ld-sub-mveq-ld-st input from a Acro,Angry,Music,Office,Youtube
Event- EventListener3 45% ld-smlal-st-ld-sub-mveq-mv-ld-st selected IO file Angry,FB,PhotoListener EventListener4 11% ld-mv-ld-mv-mvs-ld-st including sensors Maps
EventListener5 3% ld-mv-mvs-mv-ld-mv-ld-st MapsOrient.Listn.1 53% ld-st-ld-st-ld-st Listens to orientation Angry
Orientation Orient.Listn.2 7% ld-add-mv-add-ld-blx-add-ld-add-ld-add-mv-ld-st sensors and reads AngryListener Orient.Listn.3 8% ld-mv-ld-mv-ld-st-ld-st an integer value FB
Orient.Listn.4 7% ld-mv-ld-mv-st All appsOrient.Listn.5 4% ld-mv-ld-mv-ld-mv-st-ld-st FB,PhotoIterator 5% ld-add-st Common action: All apps
Iterator Iterator.2 3% ld-eor-st e.g. locking,iterator Angry,Browser
Table 3.3: Top 5 LOST sequence across all apps: The names are based on the function in whichthe LOST commonly occurs. The numbers appended to names are just to distinguish betweenthe LOSTs of the same group. The descriptions are derived from their respective function doc-umentations. Common action indicates that the same LOST is found in many functions. TheLOST sequences which have blue-text are the specific ones that we will use in the subsequentevaluations, and the percentages indicated next to them is the coverage of these sequences acrossall 10 apps. In others, it is the coverage in those apps given in the last column; Underlined = TopLOSTs for app.
benefit as much from the effort. In Fig. 3.5, we plot the number of occurrences, and the corre-
sponding coverage, for the most common LOST sequence and its supersets (i.e. the sequences
get larger as we move to the right) for Music player. There are two counter-acting factors af-
fecting the coverage - the number of occurrences decreases as we move to supersets, but since
each sequence is longer, each invocation would contribute to a larger coverage. Consequently,
we see a sweet spot in each of these LOST sequences, and we have used this optimal point in
our hardware realizations as will be explained next.
3.2.3 Top 5 LOST Sequences from All Apps
In Table 3.3, we list the top 5 LOST (by coverage) sequences in the apps. We identify 5 cat-
egories of LOST sequences (segregated by rows) and describe their functionality in their re-
spective app source codes in the fourth column. Recall that, one LOST may occur at different
23
PCs or functions in the source code (Fig. 3.4). So, we identify the functionality of LOSTs as
the most commonly occurring ones in this table. They are network-based (Net), data-transfer
between kernel and user spaces (DataTransfer), event listeners (EventListener), orientation lis-
teners (OrientationListener), and iterators (Iterator). The instruction mnemonics for each of the
above LOSTs (in third column), range from 2 to 15 instructions. But, by considering instruc-
tions as opcodes, we are able to find several LOST sequences with high coverage in many apps,
with values reaching as high as 54%, making even each of them an individually attractive design
choice. Note that, all these LOSTs such as Net, EventListener, etc., map to the hot functions
such as SensorEventListenerImp, ReceiverDispatched, in Table 3.1, as well as other functions
with similar instruction sequences. Table 3.3 also lists overlapping LOST chains from the same
functionality. For example, DataTransfer(Kernel) has 7 frequently executed paths (or DFG),
along with their respective coverages. This detail allows us the flexibility to optimize for only
the most relevant LOSTs for all the apps and not the infrequent paths of a DFG. In the interest of
space, we concentrate on our goal towards a generic acceleration unit for all apps by picking the
5 LOST sequences that are common across all the 10 apps (and are not overlapping with each
other in the same DFG) in our training set shown in Table 3.3 with blue-text . We validate their
generality by observing their coverage in a different set of 5 popular apps as listed in Fig. 3.6a.
Note that, the average coverage by these ”generic” LOST sequences varies between 4% to 45%
and vary in length between 2 to 5 instructions only. So, any acceleration mechanism targeting
these relatively small sequence of instructions can derive substantial performance benefits. We
next explore the mechanisms to accelerate these LOSTs and their impacts on app performance.
3.3 LOST Hardware Customization
The LOST instruction sequences, which each individually constitute as much as 54% of the dy-
namic instruction stream of these apps, are simple enough for hardware implementation, while
simultaneously being generic enough to be useful in several popular apps. In this context, we ad-
dress five pertinent questions: (i)What are the bottlenecks in the execution of a LOST sequence?

24
0%
10%
20%
30%
40%
50%
60%
Playstore Contacts Instagram Deskclock Calculator
% C
ove
rage
DataTransfer(kernel)6 EventListener1Iterator OrientationListener4Net.1
(a)
Fetch15%
Decode16%
Wait for data32%
Execute20%
Rename16%
Other
(b)
Figure 3.6: (a)We use 5 apps to validate LOST’s generality. (b)We identify the CPU bottleneckin executing the LOST instructions
This would suggest us which stage should be targeted. (ii) What is the most suitable solution for
a LOST hardware acceleration? (iii) What other issues such as interspersed non-LOST instruc-
tions in a LOST sequence and control divergence are addressed? (iv) How to supply required
operands for executing a LOST sequence? and (v) How to invoke the proposed LOST hardware
during runtime?
3.3.1 Execution Time Breakdown
To better understand what needs to be accelerated (for LOST sequences), we show the profile
of LOST instructions on the baseline CPU in Fig. 3.6b. As can be seen, no one stage is overly
dominant, making us simultaneously consider several issues for speedup. An instruction spends
around 15% and 16% time in the Fetch and Decode stages respectively, reiterating the well-
known observation that a von-Neumann architecture is highly inefficient for executing repetitive
code. Further, we see that (i) stalling for availability of functional units, and (ii) stalling for data
produced from other instructions (whether in the same LOST or not), contribute to as much as
20% and 32%, respectively. Consequently, a good acceleration option should consider all these
4 aspects - fetch, decode, availability of functional units, and data dependencies - for extracting
the maximum performance from LOSTs.
25
3.3.2 Exploring Existing Acceleration Solutions
Below, we discuss the suitability of four alternatives from traditional solutions for accelerating
LOSTs:
SIMD: Having separate SIMD units [91, 280] with many functional units can be one way
to address the corresponding functional unit bottlenecks. Also, with one SIMD instruction
fetch/decode, one could perform multiple parallel operations to avoid the fetch/decode bottle-
neck. However, our LOSTs are at best a few instructions long, with dependencies flowing from
one to the next (otherwise they would be part of the same LOST). Hence, there is no data paral-
lelism for SIMD to exploit; consequently, we discard this alternative.
Configurable/programmable offload hardware: In order to avoid explicit instruction fetch/decode,
Coarse Grained Reconfigurable/programmable Arrays have been proposed [116, 118, 140, 260],
where simple functional units get connected together based on the data flow by runtime con-
figuration. In order to accommodate the overheads of such configuration (conservatively 64
cycles [118]), and also the explicit data transfers between the main core and the programmable
hardware, the offloaded functionality needs to be relatively coarse grained and repetitive. How-
ever, any one execution of a LOST is only a few instructions long, and though repetitive in the
overall app execution, the separation between successive invocations is temporally disparate and
the corresponding control flow graph (CFG) for each such invocation may not be the same either.
Hence, we discard this alternative as well.
IPs: IP cores/accelerators [100, 136], are instead the ideal mechanism to allow direct data flow
between these successive LOST instructions, without the bottleneck of instruction fetch and de-
code. However, we need these to get integrated into the processor datapath, since the overheads
would be very high to interface with a coprocessor-like entity with explicit calls and data trans-
fers just to accelerate a few (≤ 15) instructions.
On-core Customized Execution Units: We would thus like to integrate the hardware entity that
performs LOST acceleration as close to the CPU datapath as possible. This will allow us to (i)
invoke the hardware with minimal overhead, and (ii) reduce any data transfer back-and-forth,
by facilitating resource sharing (e.g. registers) between the two. Such on-core Customized Ex-
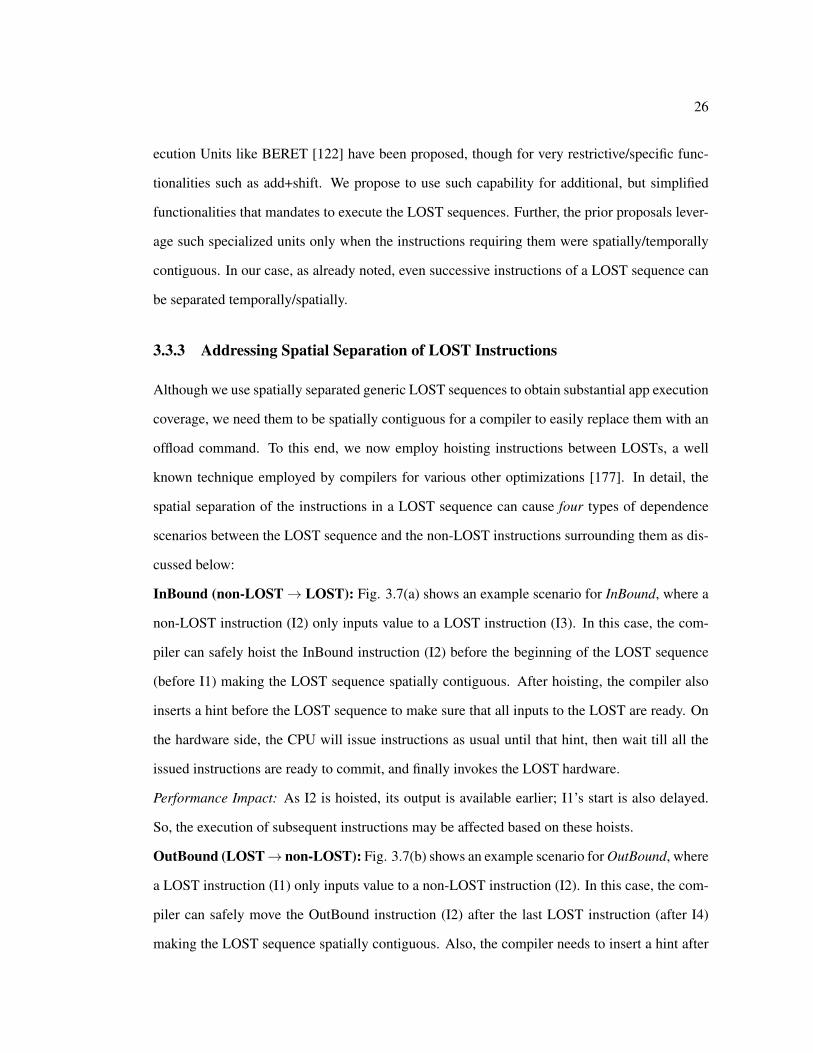
26
ecution Units like BERET [122] have been proposed, though for very restrictive/specific func-
tionalities such as add+shift. We propose to use such capability for additional, but simplified
functionalities that mandates to execute the LOST sequences. Further, the prior proposals lever-
age such specialized units only when the instructions requiring them were spatially/temporally
contiguous. In our case, as already noted, even successive instructions of a LOST sequence can
be separated temporally/spatially.
3.3.3 Addressing Spatial Separation of LOST Instructions
Although we use spatially separated generic LOST sequences to obtain substantial app execution
coverage, we need them to be spatially contiguous for a compiler to easily replace them with an
offload command. To this end, we now employ hoisting instructions between LOSTs, a well
known technique employed by compilers for various other optimizations [177]. In detail, the
spatial separation of the instructions in a LOST sequence can cause four types of dependence
scenarios between the LOST sequence and the non-LOST instructions surrounding them as dis-
cussed below:
InBound (non-LOST→ LOST): Fig. 3.7(a) shows an example scenario for InBound, where a
non-LOST instruction (I2) only inputs value to a LOST instruction (I3). In this case, the com-
piler can safely hoist the InBound instruction (I2) before the beginning of the LOST sequence
(before I1) making the LOST sequence spatially contiguous. After hoisting, the compiler also
inserts a hint before the LOST sequence to make sure that all inputs to the LOST are ready. On
the hardware side, the CPU will issue instructions as usual until that hint, then wait till all the
issued instructions are ready to commit, and finally invokes the LOST hardware.
Performance Impact: As I2 is hoisted, its output is available earlier; I1’s start is also delayed.
So, the execution of subsequent instructions may be affected based on these hoists.
OutBound (LOST→ non-LOST): Fig. 3.7(b) shows an example scenario for OutBound, where
a LOST instruction (I1) only inputs value to a non-LOST instruction (I2). In this case, the com-
piler can safely move the OutBound instruction (I2) after the last LOST instruction (after I4)
making the LOST sequence spatially contiguous. Also, the compiler needs to insert a hint after

27
I 1
I 4
I 3
I 2
I 1
I 4
I 3
I 2
I 1
I 4
I 3
I 2
I 1
I 4
I 3
BRANCH
I 9
Control Flow
Data FlowI 9LOST
InstructionI 1non-LOST Instruction
(a) InBound
(b) OutBound
(c) Bulge
(d) Branch
Figure 3.7: Dependence Scenarios between LOST Instructions and Normal Execution
the LOST sequence to guarantee that the LOST sequence’s results are ready. On the hardware
side, the CPU will only issue I2 when the LOST is ready to commit.
Performance Impact: As I1, I3, I4 are hoisted, their outputs are available earlier; I2’s start is also
delayed. So, the execution of subsequent instructions may be affected based on these hoists.
Bulge: Fig. 3.7(c) shows a scenario for Bulge, where a LOST instruction (I1) inputs value to
a non-LOST instruction (I2), and I2 inputs value to a subsequent LOST instruction (I3). Here,
I2 cannot be hoisted, and so we do not accelerate such scenarios.We will also show later, that
the occurrence of these cases are relatively small resulting in negligible gains from acceleration.
Thus, we decide not to accelerate such cases.
Branch: There are three types of control divergence scenarios. First, there could be a branch
from outside the LOST sequence, wherein existing CPU mechanisms like ROB squashes handle
the correct path execution. Second, a branch in the LOST sequence also is acceleratable because
the acceleration logic will take the required decision and change the control flow. For our five
generic LOST sequences, this does not occur. The third case is where a non-LOST branch occurs
between two instructions in a LOST sequence as depicted in Fig. 3.7(d), where there is Branch,
between two LOST instructions (I1 and I3). In this case, we use compiler support to profile the
most frequent path in runtime, and convert the control-flow to assert-style data-flow as proposed
in [227] and used by [122, 260] and apply the above steps as applicable.
The LOST sequence may now become contiguous in most cases and thus enables, one-shot
execution in these scenarios. This implies that the LOST sequence can be merged as a macro
instruction that can be invoked at runtime. But to facilitate this one-shot acceleration, we need
the required operands for all the instructions which is described next.

28
0
10
20
30
40
50
60
70
80
90
100
0 8 16 24 32 40 48 56 64 72 80 88 96
% L
OST
Occ
urr
en
ces
Co
vere
d
Operand-list ID
Net.1DataTransfer(kernel)6EventListener1OrientationListener4Iterator
up to 5k
Figure 3.8: Operand-lists of Generic LOSTs vary between their occurrences, shorted and shownas CDF of their contributions to the the corresponding LOST coverage
#1 #2 #3 #4 #5
R13, [R3] R5, R3 R7, [R5] R8, R7 SP!, R8
Operand-List Table Entry of DAT_TX_K6DataTransfer(Kernel6)Original LOST Insts.
1 LDR R13, [R3]2 MOVEQ R5, R13
3 LDR R7, [R5]
4 MOV R8, R7
5 STR SP!, R8
1
2
3
OPCODE LOSTID Operand-list-ID
13bits 3bits 6bits
CDP2 DAT_TX_K6 #54
LOST Invocation(10b reserved, 32b in total)
Figure 3.9: Incorporating the LOST Accelerators in Datapath (shown in yellow)
3.3.4 Encoding and Supplying Operands for LOST Execution
Recall that, LOST sequences are obtained by accounting for only the instruction opcodes without
considering their operands. Although this helped us cover more instructions using a LOST
sequence, to execute them, we need the corresponding LOST hardware unit to know the exact
order of operands (both input/output of registers or memory addresses or immediate values)
needed by each of its constituent instructions. We term this as operand-list in this work. To
encode (and subsequently supply) the operands for LOST executions, there are two issues: (i)
Diversity: There may be multiple variants of operand-lists for a LOST sequence. For example,
I1: add r1, r2, r3 and I2: add r3, r4, r1 have the operands 〈r1, r2, r3〉 and 〈r3,
r4, r1〉, respectively. We count both ld→I1→st and ld→I2→st as occurrences of ld→add→st,
irrespective of their differences in operand-lists namely 〈...〈r1, r2, r3〉...〉 and 〈...〈r3, r4,
r1〉...〉. (ii) Efficient encoding: Given that there could be many such operand-lists for the same
LOST hardware, we need an efficient way of supplying the operand-list to a LOST hardware for
each of its invocation.

29
To understand operand-list diversity, we profile the operand-lists across multiple apps and
present our insights in handling their diversity using an example app (MusicPlayer). We show
the top 100 operand-lists sorted by their respective LOST coverage for all the generic LOST
sequences in Fig. 3.8. As can be seen, there could be potentially up to 5k different varieties
of operand-lists for each of the LOST sequences and thus, we need an efficient mechanism of
encoding/supplying the operand-list for the entire LOST sequence. A naive way of doing this
is by using the original list of instructions themselves. Although this method supplies all the
required operand-list to the hardware, it is highly inefficient because it needs fetch and decode
for each of such instructions.
Alternatively, we construct a simple hardware lookup table and populate it with the most
commonly used operand-lists and use the table entries to supply inputs to LOST invocations (as
shown in Fig. 3.9, steps 1 and 2). Consequently, the compiler can replace the spatially contigu-
ous set of LOST instructions with one simple ARM co-processor invocation instruction namely,
CDP2 [22] with an index to this lookup table that holds the operand-list for that corresponding
invocation. Note that, the compiler will not synthesize the CDP2 call for the operand-lists other
than the entries in the lookup table. We will quantify this lost opportunity in Sec. 3.4.1.
In Step 3, Fig. 3.9 shows that the compiler can generate the CDP2 instruction by replacing an
example sequence of our generic LOST DataTransfer(Kernel)6 sequence, which is subsequently
used in looking up the hardware operand-list table for supplying the appropriate operand-list for
LOST acceleration. Using this approach, we can make CDP2 call to invoke LOSTs of any length
in one instruction, with a caveat that the operand-list table will increase by 10 bits per entry for
encoding one instruction. We observe that 64 entries to be a sufficient operand-list table size for
all the apps to capitalize on their respective LOST coverages and accelerate them.
3.3.5 Proposed Hardware Integration
LOST Execution Support: Fig. 3.9 shows the micro-architecture enhancements to the baseline
Out-of-Order (OoO) CPU design to support LOST execution. They are: a) Operand-List Table
with 64 entries (400 bytes per LOST); b) Execution Units attached to the Common Data Bus.

30
1 2 3 4 5 6 7 8 9 10 11 12 13 14I1 F D R I X CI2 (LOST1) F D R I X CI3 (InBound) F D R I X CI4 (LOST2) F D R I X CI5 (LOST3) F D R I X CI6 (LOST4) F D R I X CI7 (OutBound) F D R I X CI8 (LOST5) F D R I X CI9 F D R I X C
I1 F D R I X CI3 (InBound) F D R I X CCDP2 (LOST) F D R I X CI7 (OutBound) F D R I X CI9 F D R I X C
F=Fetch; D=Decode; R=Rename; I=Issue; X=Execution; C=Commit.F:D:R:I:X:C=1:1:1:1:1:1
Instructions/Cycles
Bas
elin
e O
oO
CP
U
Exe
cuti
on
LOST
en
able
d
CP
U
After Hoisting and Instruction Replacement.
LOST/CPU Execution Example
SavedCycles
Data Dependence
Figure 3.10: LOST execution example: CDP takes 1 cycle for simplicity.
Whenever there is a LOST invocation (e.g. CDP2 LOST.id, LOST.operand-list-index),
the instruction decoder will use the LOST.id (DATA TX k6) and LOST.operand-list-index
(54) fields (as a normal ARM instruction) to lookup the corresponding operand-list entry in the
LOST Operand-list Table. The operand-lists will supply operands to the ROB in the same way
other instructions are inserted. The only difference is that these accelerator instructions have
m input and n output registers, as opposed to 2 input registers and 1 output register in most of
the conventional instructions (even in the current ARM ISA there are instructions such as STM
and LDM which take multiple inputs/outputs). When all the input registers in the operand-list are
ready (i.e., InBound instructions are ready to commit), the LOST instruction will be issued to the
corresponding LOST Execution Unit. After that, it will execute and commit/squash as a normal
CPU instruction.
Example of a LOST Sequence Execution We now illustrate the difference between a CPU
execution and a LOST hardware execution using the timing diagram shown in Fig. 3.10. The
upper part shows a list of nine CPU instructions, where there is an InBound scenario between
I3 (non-LOST) to I5 (LOST), and a similar OutBound scenario between I5 (LOST) to I7 (non-
LOST). If executed in a normal OoO CPU, it finishes in 14 cycles. The bottom part shows the
code transformed (by the compiler) into five instructions, including hoisting the InBound (I3)
above and moving the OutBound (I7) below the LOST instructions, and subsequently replacing
LOST instruction by a single CDP2 instruction. In this setup, I1 and I3 are executed in the normal
CPU pipeline. Next, the LOST invocation instruction (CDP2) is fetched as usual at 3rd cycle and
waits for I3′s result. When the InBound (I3) is ready to commit, the CDP2 is issued at the
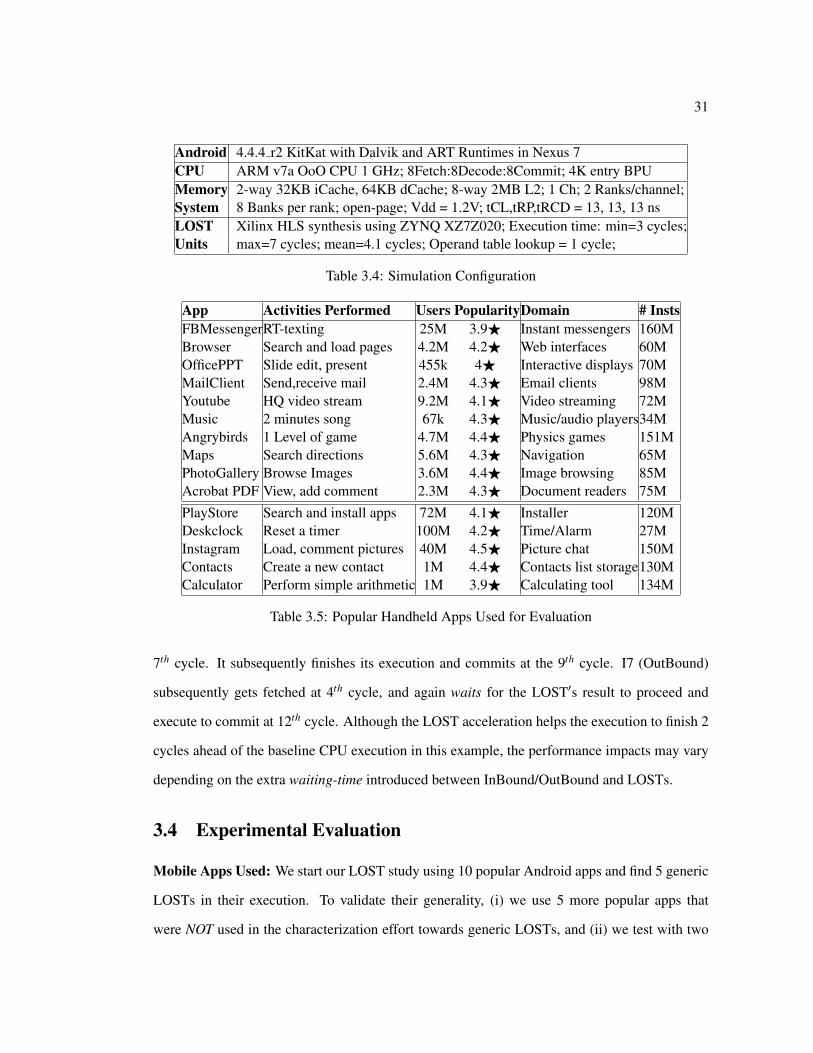
31
Android 4.4.4 r2 KitKat with Dalvik and ART Runtimes in Nexus 7CPU ARM v7a OoO CPU 1 GHz; 8Fetch:8Decode:8Commit; 4K entry BPUMemory 2-way 32KB iCache, 64KB dCache; 8-way 2MB L2; 1 Ch; 2 Ranks/channel;System 8 Banks per rank; open-page; Vdd = 1.2V; tCL,tRP,tRCD = 13, 13, 13 nsLOST Xilinx HLS synthesis using ZYNQ XZ7Z020; Execution time: min=3 cycles;Units max=7 cycles; mean=4.1 cycles; Operand table lookup = 1 cycle;
Table 3.4: Simulation Configuration
App Activities Performed Users PopularityDomain # InstsFBMessengerRT-texting 25M 3.9F Instant messengers 160MBrowser Search and load pages 4.2M 4.2F Web interfaces 60MOfficePPT Slide edit, present 455k 4F Interactive displays 70MMailClient Send,receive mail 2.4M 4.3F Email clients 98MYoutube HQ video stream 9.2M 4.1F Video streaming 72MMusic 2 minutes song 67k 4.3F Music/audio players34MAngrybirds 1 Level of game 4.7M 4.4F Physics games 151MMaps Search directions 5.6M 4.3F Navigation 65MPhotoGallery Browse Images 3.6M 4.4F Image browsing 85MAcrobat PDF View, add comment 2.3M 4.3F Document readers 75MPlayStore Search and install apps 72M 4.1F Installer 120MDeskclock Reset a timer 100M 4.2F Time/Alarm 27MInstagram Load, comment pictures 40M 4.5F Picture chat 150MContacts Create a new contact 1M 4.4F Contacts list storage130MCalculator Perform simple arithmetic 1M 3.9F Calculating tool 134M
Table 3.5: Popular Handheld Apps Used for Evaluation
7th cycle. It subsequently finishes its execution and commits at the 9th cycle. I7 (OutBound)
subsequently gets fetched at 4th cycle, and again waits for the LOST′s result to proceed and
execute to commit at 12th cycle. Although the LOST acceleration helps the execution to finish 2
cycles ahead of the baseline CPU execution in this example, the performance impacts may vary
depending on the extra waiting-time introduced between InBound/OutBound and LOSTs.
3.4 Experimental Evaluation
Mobile Apps Used: We start our LOST study using 10 popular Android apps and find 5 generic
LOSTs in their execution. To validate their generality, (i) we use 5 more popular apps that
were NOT used in the characterization effort towards generic LOSTs, and (ii) we test with two
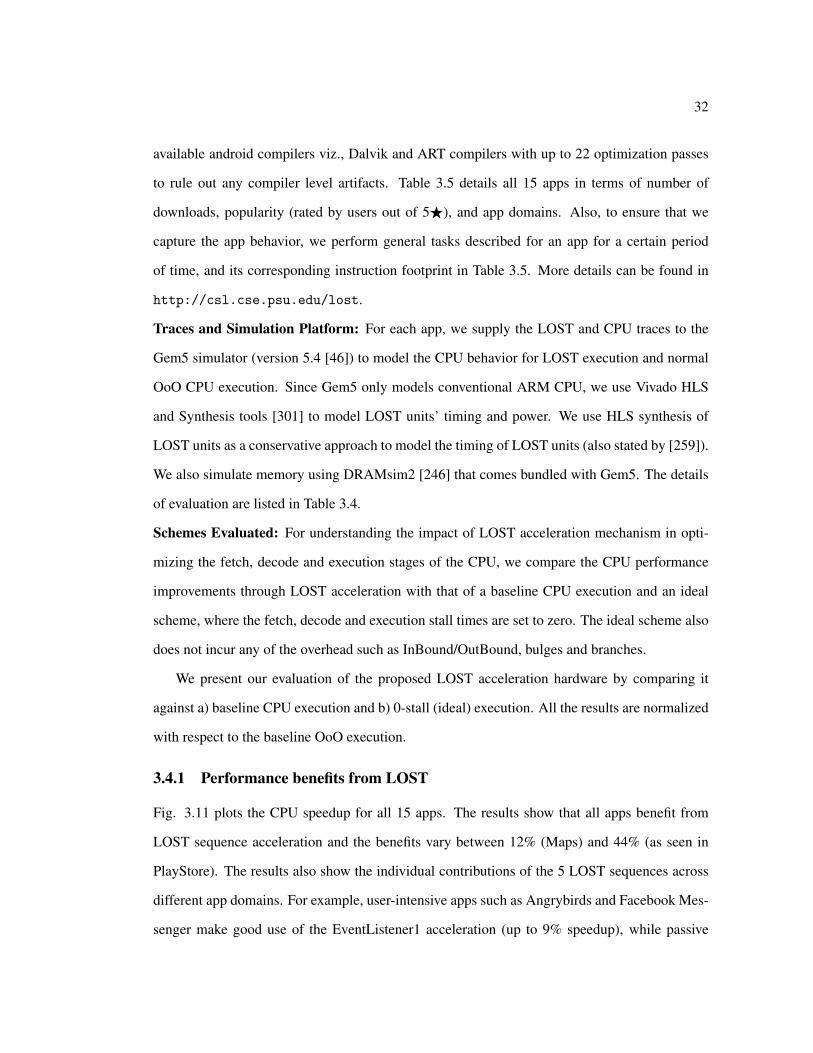
32
available android compilers viz., Dalvik and ART compilers with up to 22 optimization passes
to rule out any compiler level artifacts. Table 3.5 details all 15 apps in terms of number of
downloads, popularity (rated by users out of 5F), and app domains. Also, to ensure that we
capture the app behavior, we perform general tasks described for an app for a certain period
of time, and its corresponding instruction footprint in Table 3.5. More details can be found in
http://csl.cse.psu.edu/lost.
Traces and Simulation Platform: For each app, we supply the LOST and CPU traces to the
Gem5 simulator (version 5.4 [46]) to model the CPU behavior for LOST execution and normal
OoO CPU execution. Since Gem5 only models conventional ARM CPU, we use Vivado HLS
and Synthesis tools [301] to model LOST units’ timing and power. We use HLS synthesis of
LOST units as a conservative approach to model the timing of LOST units (also stated by [259]).
We also simulate memory using DRAMsim2 [246] that comes bundled with Gem5. The details
of evaluation are listed in Table 3.4.
Schemes Evaluated: For understanding the impact of LOST acceleration mechanism in opti-
mizing the fetch, decode and execution stages of the CPU, we compare the CPU performance
improvements through LOST acceleration with that of a baseline CPU execution and an ideal
scheme, where the fetch, decode and execution stall times are set to zero. The ideal scheme also
does not incur any of the overhead such as InBound/OutBound, bulges and branches.
We present our evaluation of the proposed LOST acceleration hardware by comparing it
against a) baseline CPU execution and b) 0-stall (ideal) execution. All the results are normalized
with respect to the baseline OoO execution.
3.4.1 Performance benefits from LOST
Fig. 3.11 plots the CPU speedup for all 15 apps. The results show that all apps benefit from
LOST sequence acceleration and the benefits vary between 12% (Maps) and 44% (as seen in
PlayStore). The results also show the individual contributions of the 5 LOST sequences across
different app domains. For example, user-intensive apps such as Angrybirds and Facebook Mes-
senger make good use of the EventListener1 acceleration (up to 9% speedup), while passive

33
0%
10
%2
0%
30
%4
0%
50
%6
0%
Acr
ob
at
An
gryb
ird
s
Bro
wse
r
Emai
l
Face
bo
ok
Mu
sic
Map
s
Off
ice
Ph
oto
Yo
uTu
be
Avg
.
Clo
ck
Co
nta
cts
Cal
cula
tor
Pla
ySto
re
Inst
agra
m
Avg
.
Tota
l Avg
.
Spe
ed
up
w.r
.t. B
ase
line
CP
U
DataTransfer(Kernel)6IteratorEventListener1OrientationListener4Net1
Characterization Set Validation Set
LOST0-Stall
Figure 3.11: Performance speedup with LOST hardware acceleration
0%
10%
20%
30%
40%
50%
Acr
ob
at
An
gryb
ird
s
Bro
wse
r
Emai
l
Face
bo
ok
Mu
sic
Map
s
Off
ice
Ph
oto
Yo
utu
be
Clo
ck
Co
nta
cts
Cal
cula
tor
Pla
ySto
re
Inst
agra
m
Ave
rage
Spe
ed
up
w.r
.t. B
ase
line Fetch Decode Execution (LOST)
Execution (CPU) OutBound Stalls
(a)
0%10%20%30%40%50%60%70%80%90%
% O
ccu
rre
nce
in L
OST
s
1%
UnacceleratableAcceleratable
(b)
Figure 3.12: (a) shows LOST sequence benefits across all the CPU execution stages; (b) Unfa-vorable branches, bulges and operand-list based coverage limitations cannot be accelerated byLOST, shown as ”unacceleratable”.
apps like Clock and Calculator achieve considerable performance gains from Iterator (10.3%)
and Net1 (19%). With the ideal (0-stall) case, we see an average CPU speedup of 30% w.r.t the
baseline OoO CPU execution with a maximum speedup of 52%. Our LOST acceleration, on the
other hand, provides on an average 25% speedup, thus lagging behind the 0-stall setup by only
5%. We can see that CPU intensive apps such as Acrobat, Browser, Email and Office perform
within 3% of the ideal case. But, the gap widens when the coverage becomes higher in cases
such as calculator when the latency to fetch/decode becomes dominant before invoking LOST
(discussed later in Fig. 3.12a).
3.4.2 Trade-offs with LOST acceleration
Where does it gain? We next analyze the reasoning behind the LOST acceleration gains by
breaking down the performance benefits across various CPU execution stages. Fig. 3.12a shows
the LOST execution speedup breakdown across the Fetch, Decode, execution of LOST sequence,
execution of CPU instructions, and OutBound scenarios. We do not show stalls due to InBounds
because of its negligible contribution to the speedup. We gain performance speedup from all 4
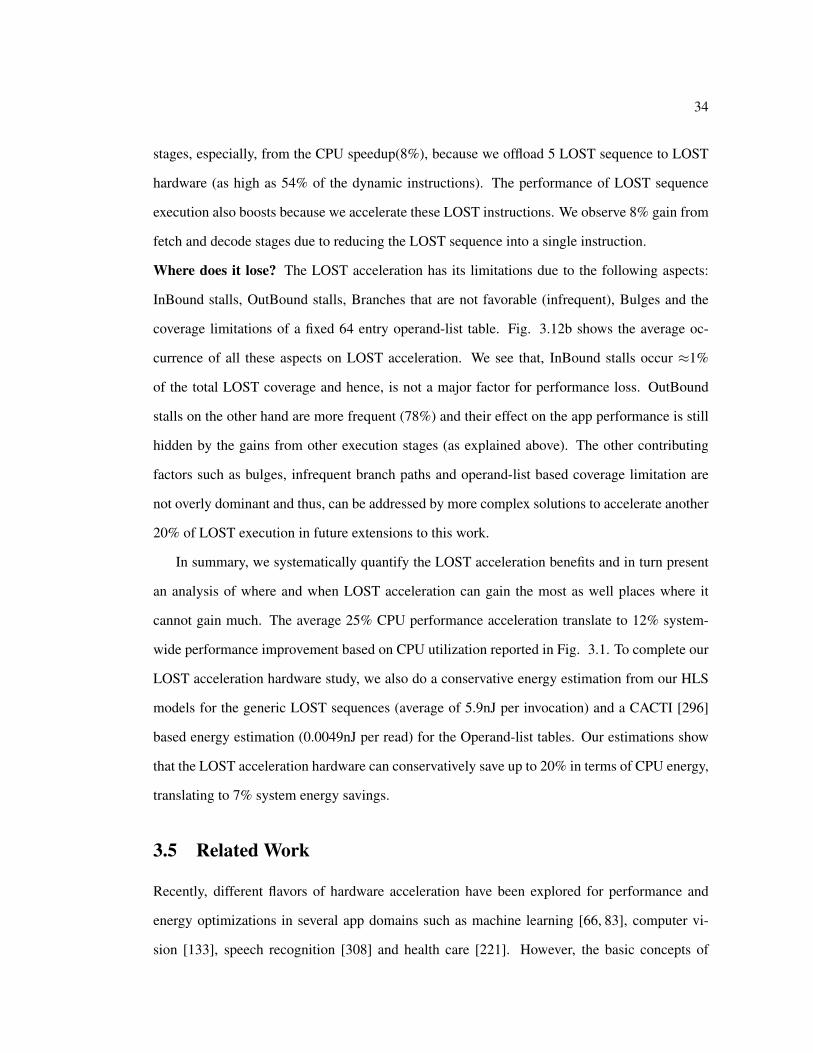
34
stages, especially, from the CPU speedup(8%), because we offload 5 LOST sequence to LOST
hardware (as high as 54% of the dynamic instructions). The performance of LOST sequence
execution also boosts because we accelerate these LOST instructions. We observe 8% gain from
fetch and decode stages due to reducing the LOST sequence into a single instruction.
Where does it lose? The LOST acceleration has its limitations due to the following aspects:
InBound stalls, OutBound stalls, Branches that are not favorable (infrequent), Bulges and the
coverage limitations of a fixed 64 entry operand-list table. Fig. 3.12b shows the average oc-
currence of all these aspects on LOST acceleration. We see that, InBound stalls occur ≈1%
of the total LOST coverage and hence, is not a major factor for performance loss. OutBound
stalls on the other hand are more frequent (78%) and their effect on the app performance is still
hidden by the gains from other execution stages (as explained above). The other contributing
factors such as bulges, infrequent branch paths and operand-list based coverage limitation are
not overly dominant and thus, can be addressed by more complex solutions to accelerate another
20% of LOST execution in future extensions to this work.
In summary, we systematically quantify the LOST acceleration benefits and in turn present
an analysis of where and when LOST acceleration can gain the most as well places where it
cannot gain much. The average 25% CPU performance acceleration translate to 12% system-
wide performance improvement based on CPU utilization reported in Fig. 3.1. To complete our
LOST acceleration hardware study, we also do a conservative energy estimation from our HLS
models for the generic LOST sequences (average of 5.9nJ per invocation) and a CACTI [296]
based energy estimation (0.0049nJ per read) for the Operand-list tables. Our estimations show
that the LOST acceleration hardware can conservatively save up to 20% in terms of CPU energy,
translating to 7% system energy savings.
3.5 Related Work
Recently, different flavors of hardware acceleration have been explored for performance and
energy optimizations in several app domains such as machine learning [66, 83], computer vi-
sion [133], speech recognition [308] and health care [221]. However, the basic concepts of

35
hardware customization has been proposed much before that [104, 128, 297, 298]. Unlike our
work, most of these designs are at a coarse-grain granularity targeted for a specific function.
A body of work like BERET [122], Chimaera [128], OneChip [298], and others [154, 204]
integrates a reconfigurable execution unit into the CPU pipeline. These accelerate instruction
sequences in the ranges of thousands of instructions. Works like programmable functional units
(PFU) [242], specialization-engines for data-flows [205], work at the granularity of tens of in-
structions. During runtime, they track the instructions executed and dynamically reconfigure
the execution unit. This unit is triggered with a customized/extended instruction set, where a
commonly used sequence of instructions are replaced by one instruction. There are other works,
which optimize the ISA for specific apps and domains, e.g. MMX, NEON, SSE, RISC-V [54]
etc. This approach (adopted by [186, 251]) uses a SIMD architecture for accelerating regular
code such as a loop-based computations. Thus, they are limited in scope for general purpose
apps. Similarly, chained vector units (e.g. [159, 247]) exploit the strategy of optimizing instruc-
tion sequences based on data flow. They are beneficial for code, where dependencies are not just
statically identifiable, but are also spatially/temporally proximate. However, as we observe, our
LOST sequences have much larger spatial and temporal spans, than those exploited by chained
vector units.
Compiler optimizations [65,317] in the mobile space focus on reducing the amount of com-
pute to achieve the same result or provide hints to the run-time for better memory/compute
scheduling [3, 228]. Dalvik, a VM framework in Android OS, is one such framework which not
only interprets the source code at runtime, but also identifies and compiles the hot-spot trace [65].
Our proposal can complement these proposals in finding more opportunities for hardware accel-
eration.
The most related to ours is DySER [118], which uses dynamically synthesized data-paths
based on opportunities identified by the compiler. These paths are configured statically into
CGRA cores at runtime. However, the offloaded functionality is restricted (i.e. cannot perform
memory operations), thus requiring all memory data to be explicitly passed (no shared registers
either) through FIFOs. While this may work in apps from SPEC, PARSEC, etc., we find mobile

36
apps have many more data-dependent interspersed loads, making it difficult to pre-load all the
required data needed for a reasonable amount of off-loaded computation. As shown, many of
the frequently occurring LOST sequences (Table 3.3) do contain such data dependent loads. To
our knowledge, this is the first effort to analyze a wide variety of mobile apps and propose a
fine-grain accelerator design that is more universally beneficial.
3.6 Chapter Summary
We present a fine-grain hardware acceleration mechanism for alleviating CPU involvement,
thereby improving app performance in handhelds. In this context, we have developed a com-
prehensive framework to effectively identify and extract all LOST sequences of instructions
from an app and pick the commonly occurring sequences within and across apps. Unlike prior
approaches that identify instruction sequences based on PC addresses or operands, the LOST
sequences are defined based on a sequence of opcodes that can even span method boundaries,
effectively increasing coverage and the potential for finding opportunities for hardware accelera-
tion. We also discuss solutions for handling critical dependence issues in hardware acceleration
such as control flow divergence and operand supply to a LOST hardware unit and design a micro-
architecture that integrates these customized hardware sequences as macro functional units into
the CPU datapath. Experimental evaluations with fifteen mobile apps indicate that the proposed
techniques can provide on an average 25% CPU speedup (12% overall system performance im-
provement). These improvements are significant considering the broad coverage across apps
from different domains, as well as requiring just five very small LOST sequences.
Chapter 4CritIC: Software only optimization
for CPU Execution in the edge
While the above LOST optimization extends the CPU hardware to add new acceleratability of
common/frequently executed functionalities in the edge, it is still expensive to perform a hard-
ware level change in the highly resource constrained edge device. Therefore, the second part of
this thesis instead focuses on achieving similar optimizations with off-the-shelf hardware itself,
with a purely software approach. To a large extent, the evolution of the edge devices has drawn
from lessons learned over the years from their desktop/server counterparts and adapted them
for different resource constraints – energy/power, form-factor, etc. However, many of the app
executions in the edge have very different characteristics, and are used in very different ways
compared to desktop/server workloads (e.g., high amount of user-interaction, handling sensors,
etc.). And so, it is not clear whether the same high-end device optimizations are effective for
the mobile platforms. Thus, this chapter starts with a fundamental question: can we borrow the
optimizations from the server counterparts to optimize edge CPUs?

38
0
50
100
150
200
250
0%
10
%2
0%
30
%4
0%
50
%
Nu
m C
riti
cal I
nst
sP
er
1K
Inst
s
% S
pe
ed
up
Prefetcher (Loads)Backend Prioritization (ALU)Num Critical LoadsNum Critical ALU Insts
0.7%
(a)
0
10
20
30
40
50
60
70
% C
riti
cal C
hai
ns
SPEC.float SPEC.int Android
1 2 3 4 5
# of Non-critical Instns between Two Critical Instns. in Dependence Chain.
Large # of Independent
Critical Instns.
0%
Directly Dependent Critical Instns.
Interspersed with Non-Critical Instns.nearly
(b)
Figure 4.1: (a) Despite having frequent Critical Instructions, mobile apps do not benefit as much.(b) Reason: Critical instructions in SPEC do not depend much on other critical instructions. But,Android apps have two successive high-fanout instructions in a dependence chain, with 0(direct-dependence) to 5 low fanout instructions between them.
4.1 Critiquing Criticality
Within the confines of the given resources of a superscalar processor, one of the most important
issues is deploying and assigning these resources to the incoming stream of instructions. This
is essentially determined by the priority order (scheduling) for fetching and executing these
instructions. When there are adequate resources, we would give all instructions the resources
that they need. However, when resources are constrained, priority has to be given to “critical
instructions” [89, 172, 267, 268, 283, 285]. In this work, we use a simple definition of criticality,
similar to those in some prior works [89, 283] - an instruction is critical if its execution time
becomes visible (i.e., does not get hidden) in the overall app execution.
4.1.1 Conventional criticality identification
As per the above definition, an instruction can be marked critical, only after its execution - by
which time it is too late to assign resources for it. Hence, prior works propose different ways
of estimating criticality of an instruction before it is even fetched. Two common heuristics
for marking an instruction as critical are by using thresholds for (i) execution latency of an
instruction (a long latency instruction implies instructions depending on it have to be delayed,
thus making it more critical) [94, 267, 283] and (ii) number of dependent instructions (referred
to as fanout in this paper), particularly in the ROB at the time the instruction is being executed
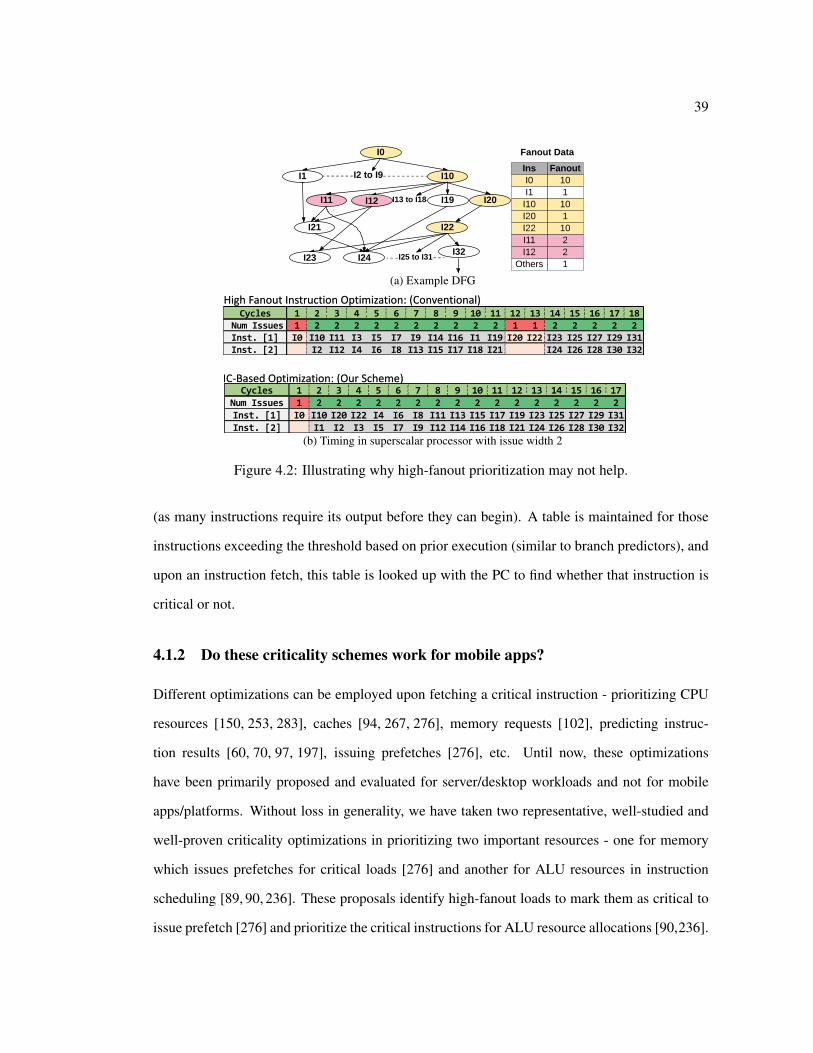
39
I10
I19 I20I11
I0
I1 I2 to I9
I21 I22
I32I23 I24 I25 to I31
I12 I13 to I18
Ins FanoutI0 10I1 1
I10 10I20 1I22 10I11 2I12 2
Others 1
Fanout Data
(a) Example DFG
High Fanout Instruction Optimization: (Conventional)
IC-Based Optimization: (Our Scheme)
Cycles 1 2 3 4 5 6 7 8 9 10 11 12 13 14 15 16 17 18 Num Issues 1 2 2 2 2 2 2 2 2 2 2 1 1 2 2 2 2 2Inst. [1] I0 I10 I11 I3 I5 I7 I9 I14 I16 I1 I19 I20 I22 I23 I25 I27 I29 I31Inst. [2] I2 I12 I4 I6 I8 I13 I15 I17 I18 I21 I24 I26 I28 I30 I32
Cycles 1 2 3 4 5 6 7 8 9 10 11 12 13 14 15 16 17Num Issues 1 2 2 2 2 2 2 2 2 2 2 2 2 2 2 2 2Inst. [1] I0 I10 I20 I22 I4 I6 I8 I11 I13 I15 I17 I19 I23 I25 I27 I29 I31Inst. [2] I1 I2 I3 I5 I7 I9 I12 I14 I16 I18 I21 I24 I26 I28 I30 I32
(b) Timing in superscalar processor with issue width 2
Figure 4.2: Illustrating why high-fanout prioritization may not help.
(as many instructions require its output before they can begin). A table is maintained for those
instructions exceeding the threshold based on prior execution (similar to branch predictors), and
upon an instruction fetch, this table is looked up with the PC to find whether that instruction is
critical or not.
4.1.2 Do these criticality schemes work for mobile apps?
Different optimizations can be employed upon fetching a critical instruction - prioritizing CPU
resources [150, 253, 283], caches [94, 267, 276], memory requests [102], predicting instruc-
tion results [60, 70, 97, 197], issuing prefetches [276], etc. Until now, these optimizations
have been primarily proposed and evaluated for server/desktop workloads and not for mobile
apps/platforms. Without loss in generality, we have taken two representative, well-studied and
well-proven criticality optimizations in prioritizing two important resources - one for memory
which issues prefetches for critical loads [276] and another for ALU resources in instruction
scheduling [89, 90, 236]. These proposals identify high-fanout loads to mark them as critical to
issue prefetch [276] and prioritize the critical instructions for ALU resource allocations [90,236].
40
These techniques have shown significant benefits for server workloads. The high-fanout based
optimization has also been shown to outperform the latency based ways of identifying and ex-
ploiting criticality [276,284]. We next evaluate the usefulness of both these criticality optimiza-
tions (depicted as bars) in mobile apps and compare the mean speedup obtained from employing
both these techniques for SPEC.int, SPEC.float and Android apps in Fig. 4.1a (experimental
details are in Sec. 4.3.2).
As can be seen, the performance gains from prefetching high-fanout loads and prioritizing
them at ALU resource scheduling are both quite significant for SPEC.int (15% from prefetch-
ing, 9% from prioritizing) and SPEC.float (34% from prefetching, 25% from prioritizing), re-
affirming prior results [236, 276]. Interestingly, the gains from these two optimizations are a
relatively measly 0.7% from prefetching and 5% from prioritizing in the mobile apps. Based on
this, one may think that perhaps mobile apps do not have a significant number of high fanout
loads/ALU instructions to benefit from these optimizations. On the contrary, we observe that (in
right y-axis of Fig. 4.1a) the mobile apps have a much higher percentage of critical instructions
than their SPEC counterparts. This should have, in turn, resulted in more opportunities for opti-
mizing the execution. To understand why this is not the case, we next identify scenarios where
these optimizations may not work and point out that such scenarios are common in mobile apps.
4.1.3 Why do they not work?
Fig. 4.2a shows an example DFG (Directed Flow Graph) where, executing the first instruction
I0, triggers ten following instructions (I1 to I10) to become ready for execution. Any high fanout
optimization will obviously execute I0 first. After this step, let us say I10 again has a fanout of
10 (i.e., instructions I11 to I20 become ready), which would cause I10 to be prioritized in the
execution over say I1. If, subsequently, I11 and I12 each have 2 fanouts and each of I13 to I20
has a fanout of just 1, I11 and I12 will get scheduled before I13 to I20. But since each of I13
to I20 instructions has a fanout of 1, a high-fanout instruction prioritization will not differentiate
between them. Note that, I20 in turn has a dependent high fanout instruction, I22, that cannot
be scheduled till I20 is completed. So, as seen in Fig. 4.2b, by not doing this optimization
41
of prioritizing I20 over its siblings, single a instruction criticality optimization scheme as de-
scribed previously, stalls 2 cycles (12, 13) in the execution. This scenario occurs commonly in
mobile executions (explained below), where an instruction despite having a low fanout, requires
high-priority since there is a subsequently dependent high-fanout instruction. Consequently, it
is insufficient to optimize individual high-fanout instructions independently. Instead, the whole
sequence of dependent instructions from 〈I0, I10, I20 to I22〉 should be scheduled as early as
possible, even though I20 is a low-fanout instruction.
We find evidence of this scenario occurring much more in mobile apps compared to their SPEC
counterparts as shown in Fig. 4.1b, which breaks down the dependence chains containing high-
fanout instructions in terms of the number of low-fanout instructions between two successive
high fanout instructions in a dependence chain. We find that the dependence chains can have
between 1(22%) to 5(7%) low-fanout instructions in the dependence chain between two high
fanout critical instructions, for cumulatively 52% of the time in Android apps. On the other
hand, the SPEC.float and SPEC.int apps have no dependent high-fanout instructions for around
60% and 35% of the time. Compare that to Android apps, where this hardly ever happens, i.e.,
there is at least 1 low fanout instruction between 2 successive high fanout, and thereby critical
ones. It is no surprise that SPEC apps benefited from optimizing each critical instruction indi-
vidually as opposed to Android ones, where such dependent chains reduce the effectiveness of
individual optimizations. These mobile app results also suggest that: (a)prioritizing/optimizing
each critical instruction individually as it comes (i.e., for the “present”) would not be as effective
in rightfully apportioning the given resources; and (b)we need to consider these temporally prox-
imate and dependent critical instructions (chains/sequences) together for possible optimizations,
i.e., look into the future as well. Traditional criticality based optimizations [102, 267, 268, 276]
have targeted one critical instruction at a time, rather than groups or chains.
4.1.4 What do these instructions need?
Before optimizing for these closely occurring and dependent critical instructions in Android
apps, it is important to understand where they spend their time amongst the different superscalar

42
0%
20%
40%
60%
80%
100%
120%
SPEC.float SPEC.int Android apps
% E
xecu
tio
n T
ime
Fetch Fetch QueueDecode Instruction QueueExecution Queue ExecutionRoB Memory
0%
10%
20%
30%
40%
50%
60%
SPEC.float SPEC.int Android apps
I-Cache MissBranch Mis-predictExecutionWait For Exec UnitsWait For Dependencies
F.StallForI
(a)
73%
26%
SPEC
High-Latency Instructions
Low-Latency Instructions
39%
61%
Android apps(c)
(b)
F.StallForR+D
I
I
IR+D R+D
R+D
Figure 4.3: (a) Fetch to Commit breakdown of high-fanout instructions in SPEC vs Android(b) In Android, Fetch is more bottlenecked due to both (i) stalling for instructions to be fetched(F.StallForI), and (ii) stalling for resources and dependencies (F.StallForR+D) to move theinstructions down the pipeline. (c) Mobile apps have fewer high latency instructions comparedto SPEC.
pipeline stages. Towards this, we present a breakdown of their execution profiles amongst these
stages in Fig. 4.3(a). In the same graph, we provide a similar profile for critical instructions
identified by the same ”high fanout” metric in the SPEC.float and SPEC.int apps. From these
results, we observe the following: (i) unlike SPEC apps, where the Execute stage, and conse-
quently the back-pressure in ROB queue residencies, are quite dominant, the Android apps have
a much lower Execution stage latency (and consequently the ROB residency). The mix of critical
instructions in Android apps do not take as much execution time (fewer long latency instructions
compared to their SPEC counterparts as shown in Fig. 4.3(c)). (ii) However, the fetch stage,
and the decode stage to some extent, are much more dominant in Android apps, compared to the
SPEC ones (due to the drop in contribution from the Execute stage). As much as 40% of the
time goes in the Fetch stage, while similar critical instructions in SPEC spend less than 5% of
their time in this stage.
This shift in the profile from the rear to the front Fetch stage (consumes 40%) of the pipeline
in Android, warrants us to take a closer look into this stage. Fig. 4.3(b) breaks down the Fetch
execution time in these apps into two parts - F.StallForI, which is responsible for supplying
the instruction stream into this stage, and the F.StallForR+D which pulls out the instruction
from this stage for subsequent decoding. The former depends on the I-cache latency, miss costs,
and branch mis-prediction costs, while the latter is largely determined by the back-pressure
43
exerted by the subsequent pipeline stages (i.e., wait for decode to commit time for the prior
instructions).
The relative contributions of the F.StallForI and F.StallForR+D (2:3) to the overall
Fetch side overheads are quite comparable across the SPEC and Android apps. However, the
actual values are quite different. While F.StallForI contributes to 3% of the overall exe-
cution in SPEC, Android apps execute from a much larger code base with a diverse set of li-
braries (>7k APIs [27, 110, 235]) with more frequent function calls, which causes i-cache stalls
for 15% of the execution and branch prediction stalls for another 2% from the F.StallForI.
At F.StallForR+D, SPEC apps execute many high-latency instructions that creates a back-
pressure on the fetch stage by 3.6% (out of the 5.4% in SPEC.float) and 13% (out of 21% in
SPEC.int). In Android apps, as shown in Fig. 4.3(c), majority of the high-fanout instructions are
low-latency instructions, not imposing much back-pressure from the execute stage itself (6% out
of 40%). Instead, the dependence resolutions between various instructions (as discussed in Fig.
4.1b) causes the most stall (11%) for the F.StallForR+D in these apps. Thus, any optimization
for these critical instructions should try to reduce both F.StallForI and F.StallForR+D la-
tencies, i.e., a simple i-cache/branch- prediction optimization, or a back-end optimization alone
may not suffice as we will show later on.
Key Insights on Android Apps (a) With high fanout, and thereby ”critical” instructions oc-
curring in close temporal proximity with one or more non-critical/low-fanout instructions in the
dependence chain between them, we should consider optimizing groups/sequences of these in-
structions concurrently, rather than one at a time; (b) Fetch stage is much more important for
these instructions, and optimizations for this stage are likely to yield more rewards than throw-
ing more hardware for the conventionally bottlenecked execute-to-commit stages; (c) We need
to accelerate not just the rate of bringing in the instructions to the Fetch stage, but also accelerate
the rate of pushing out instructions into the rest of the pipeline.
44
4.2 CritICs: Critical Instruction Chains
Having identified the requirements, we now explore (i) how to identify these ”critical” instruc-
tions occurring in a dependence chain/sequence in close temporal proximity, and (ii) how to
optimize for these sequences to provide the minimal F.StallForI and F.StallForR+D laten-
cies in the fetch stage with minimal hardware extensions.
4.2.1 Identifying CritICs
4.2.1.1 CritIC Sequences
As was shown in the example in Fig. 4.2a, identifying and optimizing for individual high fan-out,
and thereby critical, instructions can only provide limited options. Instead, we need to look into
the future, and find other possible future critical instructions which are in its forward dependence
chain/graph. Consequently, the entire chain should be prioritized/optimized even if intermediate
instructions in the forward dependence chain (such as I20 in the forward dependence chain of
〈I10, I20, I22〉) may not traditionally have been marked as critical because of their low fan-outs.
Towards identifying such “Critical Instruction Chains (CritIC)”, we first introduce the following
metric and definitions.
Instruction Chain (IC) An instruction chain is any acyclic path of a Data Flow Graph (DFG)
that is independently schedulable at that instant in the execution. In our previous example DFG
of Fig. 4.2a:
• The paths 〈I0, I10, I20, I22〉 and 〈I0, I10, I11〉 are independent of the other paths in the DFG.
So, they are independently schedulable, and both qualify as ICs.
• The path 〈I0, I1, I21〉 does not qualify as an IC as it depends on another path, 〈I0, I10, I11, I21〉
and is thus not independently schedulable.
• Still, the sub-path 〈I0, I1〉 qualifies as an IC as it does not depend on any other paths of this
DFG, i.e., any sub-path of an IC is also an IC.
An IC is thus a self-contained sequence of instructions, and is executable as an atomic entity

45
I1
I6
I0
I5I2-to I4
I18
I24 I23I19 I20 to-I22
I7
I8
I9I17I13
I10I11
I14-to I16
IC Fanout Fanout/Ins<I0-I1-I6-I7-I8-I9-I10-I11-I12> 5+1+1+6+1*5 18/9=2
<I0-I5-I18> 5+1+6 12/3=4
IC based Fanout Data
Ins FanoutI0 5I7 6
I18 6Others 1
Fanout Data
I12
(a) Example DFG
High Fanout Optimization: (Conventional)
CritIC Optimization: (Our Scheme)
Cycles 1 2 3 4 5 6 7 8 9 10 11 12 13 14 Num Issues 1 2 2 2 2 2 2 2 2 1 1 2 2 2
Inst. [1] I0 I1 I6 I7 I8 I9 I10 I11 I12 I5 I18 I19 I21 I23Inst. [2] I2 I3 I4 I13 I14 I15 I16 I17 I20 I22 I24
Cycles 1 2 3 4 5 6 7 8 9 10 11 12 13Num Issues 1 2 2 2 2 2 2 2 2 2 2 2 2
Inst. [1] I0 I5 I18 I2 I3 I4 I13 I14 I15 I16 I17 I20 I22Inst. [2] I1 I6 I7 I8 I9 I10 I11 I12 I24 I19 I21 I23
(b) Timing in superscalar processor with issue width 2
Figure 4.4: Example: Need to optimize CritICs
(e.g., a macro instruction [54, 77, 91, 93, 105, 140, 280] consisting of several micro-instructions
in the sequence) without any dependencies into its individual instructions. We will exploit this
property later when optimizing critical ICs.
Crit At any instant, a DFG has several individual ICs. The goal is then to find the right order
for executing these ICs - to prioritize based on their relative criticalities. For example, in Fig.
4.4b, the execution at the top (high-fanout optimization) shows that prioritizing an IC with low-
fanout instructions, 〈I1, I6, I7, I8, I9, I10, I11, I12〉 is inefficient - as observed in cycles 10, 11,
the execution becomes serialized and there is no ILP for 2 cycles.
However, identifying the relative criticalities of ICs is non-trivial, since each instruction in
an IC can have a different fan-out/criticality. Simply adding up the fan-out of all its constituent
instructions may not paint an accurate measure of an IC’s criticality since there could be high
variance amongst its instructions - a cumulatively high-fanout IC may have a very high fanout
instruction at the beginning, with all subsequent instructions ending up with very low fanout, or

46
1
8
64
512
4096
SPEC.int SPEC.float Android apps
IC L
en
gth
Mean Length Max LengthMean Spread Max Spread
(a) (b)
Figure 4.5: (a)IC length and their corresponding spread in dynamic instruction execution inSPEC vs Android apps; (b)CDF of coverage by unique CritICs.
vice-versa. While one could consider higher order representations for capturing such variances
in future work, in this paper, we use a simple average fanout per instruction of an IC to capture
the criticality of an IC. ICs whose average fanout per instruction exceed a certain threshold
(e.g. 8) are marked as CritIC sequences in this work. Fig. 4.4 gives an example DFG, where
a conventional instruction-level fanout based prioritization would give an execution as in the top
part of (b) taking 14 cycles on a 2-way issue superscalar processor, while our CritIC approach
would identify two ICs 〈I1, I6, I7, I8, I9, I10, I11, I12〉 and 〈I0, I5, I18〉 and prioritize the latter
over the former because of its higher average fanout per instruction (4 vs. 2). This results in a
schedule as in the lower part of (b), taking only 13 cycles.
4.2.1.2 How to find them?
There are two broad strategies for identifying CritICs: (a) using hardware predictor tables as
used in many prior works [89,94,268,285] and/or (b) using software profile-driven compilation.
As explained, we would like to minimize hardware requirements as much as possible, especially
since mobile devices can become highly resource constrained. So we opt for the latter approach,
which raises additional issues that we address as discussed below:
• Ability to do this without User Intervention: Unlike desktop environments where users
may write their own apps, many of the mobile apps are published a priori (on the Play
store, iTunes, etc.). It is not unreasonable for many of these popular apps to have under-
gone a profile-driven compiler optimization phase, which many of them already do (for

47
quality, revisions, performance, bugs, etc. [9, 20]) before they get published. Our solution
can be integrated into such phases for appropriate code generation.
• Dealing with diverse inputs (user-interactivity): Even if apps are available a priori, their
execution can depend a lot on the input data - this is especially true for mobile apps which
have high user interactivity. Conveniently, common cases of user inputs are readily pro-
vided for many of these apps in standard formats [11,227], that we avail for our approach.
• Ability to track long ICs and their spread: Software based approaches are often criticized
because of their restricted scope in analyzing large segments of code concurrently. This
would pose a problem if the ICs were long and spread out considerably in the dynamic
instruction stream. For instance, if we were to apply our approach for SPEC apps, Fig.
4.5a shows that we would need to track ICs of lengths up to 1.3K, which are spread over
up to 6.3K instructions in the dynamic stream. On the other hand, in our favor, ICs for the
mobile apps (as shown in the Fig. 4.5a), are at the maximum 20 instructions long, and are
at most spread over 540 instructions to make them conducive to our approach.
• Tractability of tracking all ICs: Even when tracking 5 to 10 instruction long ICs, an app
execution can generate a huge volume of profile data (100s of GB of CritIC sequences),
with numerous sequences at any given instant. So, instead of tracking and optimizing for
every possible CritIC sequence in an app, we track the top few CritIC sequences based
on their coverage in the dynamic execution stream. This substantially reduces the profile
size to a few kBs.
We have built this profile-driven compilation framework to automatically identify and op-
timize the CritIC sequences in a large number of Android apps. The app execution is profiled
using AOSP emulation [111, 237] and GEM5 hardware simulator [46] to get the instruction
stream from which we identify the CritIC sequences. The on-device Android Runtime Com-
piler (ART compiler) then generates optimized ARM binary using various compiler optimization
passes [10]. After these passes, we have implemented an additional instrumentation pass in the
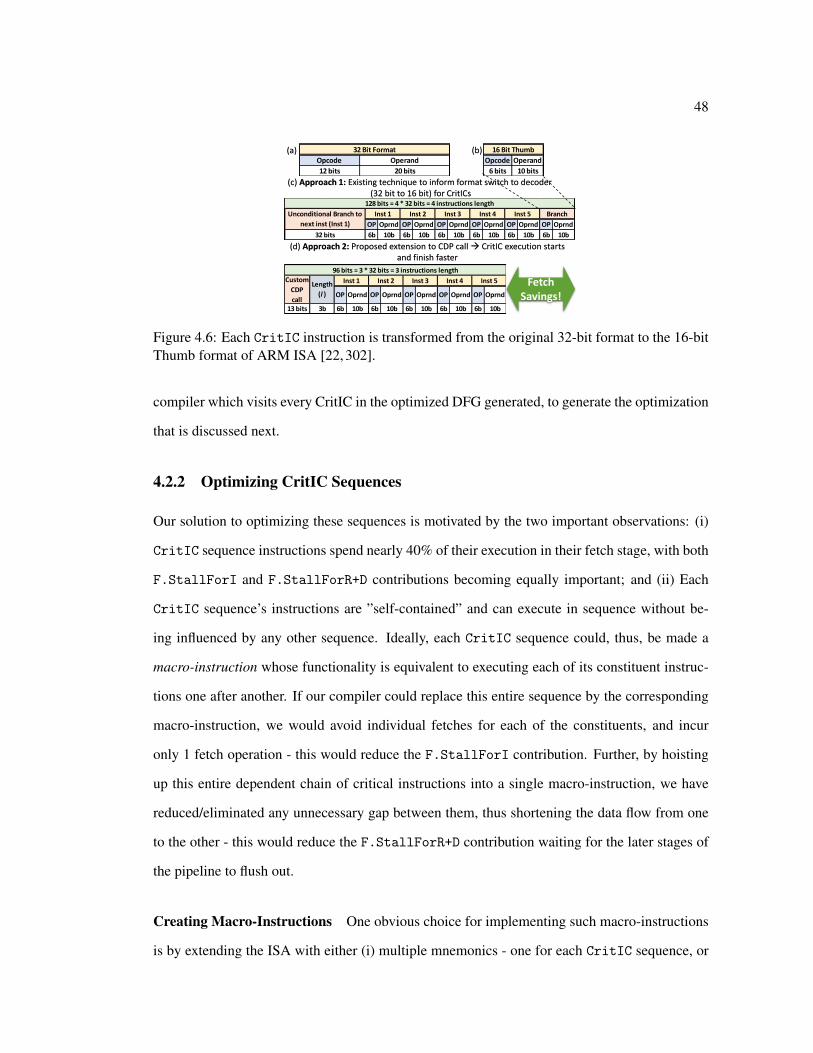
48
OP Oprnd OP Oprnd OP Oprnd OP Oprnd OP Oprnd OP Oprnd
6b 10b 6b 10b 6b 10b 6b 10b 6b 10b 6b 10b32 bits
Branch
128 bits = 4 * 32 bits = 4 instructions length
Inst 1 Inst 2 Inst 3 Inst 4 Inst 5Unconditional Branch to
next inst (Inst 1)
OP Oprnd OP Oprnd OP Oprnd OP Oprnd OP Oprnd
13 bits 3b 6b 10b 6b 10b 6b 10b 6b 10b 6b 10b
96 bits = 3 * 32 bits = 3 instructions length
Custom
CDP
call
Length
(l )
Inst 1 Inst 2 Inst 3 Inst 4 Inst 5
(b)Opcode Operand
12 bits 20 bits
32 Bit Format
Opcode Operand
6 bits 10 bits
16 Bit Thumb
(d) Approach 2: Proposed extension to CDP call → CritIC execution starts and finish faster
(a)
FetchSavings!
(c) Approach 1: Existing technique to inform format switch to decoder(32 bit to 16 bit) for CritICs
Figure 4.6: Each CritIC instruction is transformed from the original 32-bit format to the 16-bitThumb format of ARM ISA [22, 302].
compiler which visits every CritIC in the optimized DFG generated, to generate the optimization
that is discussed next.
4.2.2 Optimizing CritIC Sequences
Our solution to optimizing these sequences is motivated by the two important observations: (i)
CritIC sequence instructions spend nearly 40% of their execution in their fetch stage, with both
F.StallForI and F.StallForR+D contributions becoming equally important; and (ii) Each
CritIC sequence’s instructions are ”self-contained” and can execute in sequence without be-
ing influenced by any other sequence. Ideally, each CritIC sequence could, thus, be made a
macro-instruction whose functionality is equivalent to executing each of its constituent instruc-
tions one after another. If our compiler could replace this entire sequence by the corresponding
macro-instruction, we would avoid individual fetches for each of the constituents, and incur
only 1 fetch operation - this would reduce the F.StallForI contribution. Further, by hoisting
up this entire dependent chain of critical instructions into a single macro-instruction, we have
reduced/eliminated any unnecessary gap between them, thus shortening the data flow from one
to the other - this would reduce the F.StallForR+D contribution waiting for the later stages of
the pipeline to flush out.
Creating Macro-Instructions One obvious choice for implementing such macro-instructions
is by extending the ISA with either (i) multiple mnemonics - one for each CritIC sequence, or
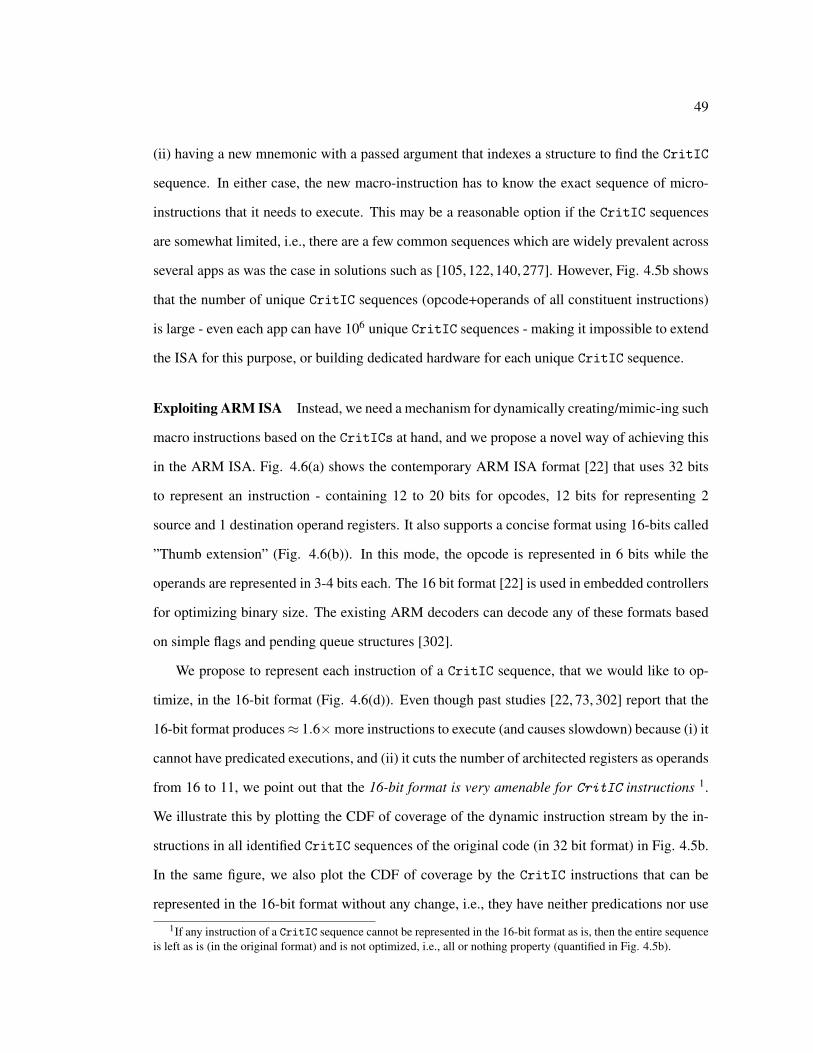
49
(ii) having a new mnemonic with a passed argument that indexes a structure to find the CritIC
sequence. In either case, the new macro-instruction has to know the exact sequence of micro-
instructions that it needs to execute. This may be a reasonable option if the CritIC sequences
are somewhat limited, i.e., there are a few common sequences which are widely prevalent across
several apps as was the case in solutions such as [105, 122, 140, 277]. However, Fig. 4.5b shows
that the number of unique CritIC sequences (opcode+operands of all constituent instructions)
is large - even each app can have 106 unique CritIC sequences - making it impossible to extend
the ISA for this purpose, or building dedicated hardware for each unique CritIC sequence.
Exploiting ARM ISA Instead, we need a mechanism for dynamically creating/mimic-ing such
macro instructions based on the CritICs at hand, and we propose a novel way of achieving this
in the ARM ISA. Fig. 4.6(a) shows the contemporary ARM ISA format [22] that uses 32 bits
to represent an instruction - containing 12 to 20 bits for opcodes, 12 bits for representing 2
source and 1 destination operand registers. It also supports a concise format using 16-bits called
”Thumb extension” (Fig. 4.6(b)). In this mode, the opcode is represented in 6 bits while the
operands are represented in 3-4 bits each. The 16 bit format [22] is used in embedded controllers
for optimizing binary size. The existing ARM decoders can decode any of these formats based
on simple flags and pending queue structures [302].
We propose to represent each instruction of a CritIC sequence, that we would like to op-
timize, in the 16-bit format (Fig. 4.6(d)). Even though past studies [22, 73, 302] report that the
16-bit format produces≈ 1.6×more instructions to execute (and causes slowdown) because (i) it
cannot have predicated executions, and (ii) it cuts the number of architected registers as operands
from 16 to 11, we point out that the 16-bit format is very amenable for CritIC instructions 1.
We illustrate this by plotting the CDF of coverage of the dynamic instruction stream by the in-
structions in all identified CritIC sequences of the original code (in 32 bit format) in Fig. 4.5b.
In the same figure, we also plot the CDF of coverage by the CritIC instructions that can be
represented in the 16-bit format without any change, i.e., they have neither predications nor use
1If any instruction of a CritIC sequence cannot be represented in the 16-bit format as is, then the entire sequenceis left as is (in the original format) and is not optimized, i.e., all or nothing property (quantified in Fig. 4.5b).
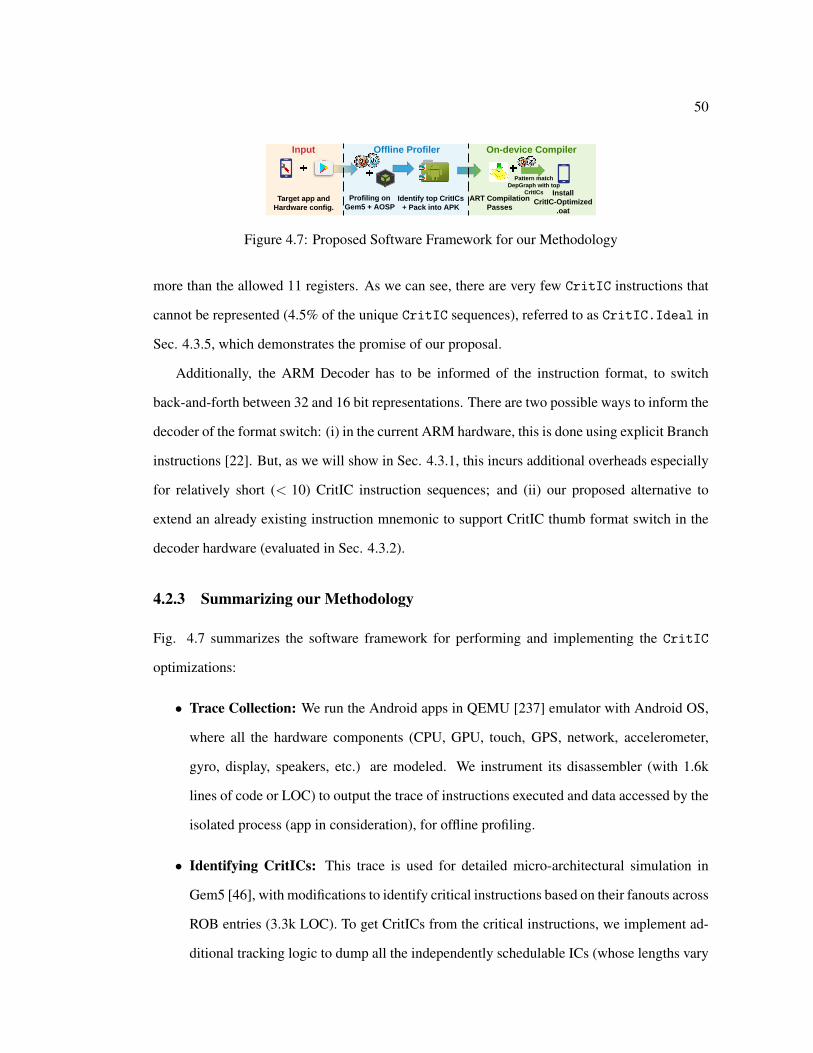
50
Input On-device Compiler Offline Profiler
Target app and Hardware config.
Profiling on Gem5 + AOSP
Identify top CritICs + Pack into APK
ART Compilation Passes
Install CritIC-Optimized
.oat
Pattern match DepGraph with top
CritICs
Figure 4.7: Proposed Software Framework for our Methodology
more than the allowed 11 registers. As we can see, there are very few CritIC instructions that
cannot be represented (4.5% of the unique CritIC sequences), referred to as CritIC.Ideal in
Sec. 4.3.5, which demonstrates the promise of our proposal.
Additionally, the ARM Decoder has to be informed of the instruction format, to switch
back-and-forth between 32 and 16 bit representations. There are two possible ways to inform the
decoder of the format switch: (i) in the current ARM hardware, this is done using explicit Branch
instructions [22]. But, as we will show in Sec. 4.3.1, this incurs additional overheads especially
for relatively short (< 10) CritIC instruction sequences; and (ii) our proposed alternative to
extend an already existing instruction mnemonic to support CritIC thumb format switch in the
decoder hardware (evaluated in Sec. 4.3.2).
4.2.3 Summarizing our Methodology
Fig. 4.7 summarizes the software framework for performing and implementing the CritIC
optimizations:
• Trace Collection: We run the Android apps in QEMU [237] emulator with Android OS,
where all the hardware components (CPU, GPU, touch, GPS, network, accelerometer,
gyro, display, speakers, etc.) are modeled. We instrument its disassembler (with 1.6k
lines of code or LOC) to output the trace of instructions executed and data accessed by the
isolated process (app in consideration), for offline profiling.
• Identifying CritICs: This trace is used for detailed micro-architectural simulation in
Gem5 [46], with modifications to identify critical instructions based on their fanouts across
ROB entries (3.3k LOC). To get CritICs from the critical instructions, we implement ad-
ditional tracking logic to dump all the independently schedulable ICs (whose lengths vary

51
as discussed in Fig. 4.5) which results in 100s of GBs of ICs. These are processed offline
with a distributed hash-table using Spark PairRDD [19] to sort and get the top CritICs (ICs
with average fanout threshold > 8) with the most coverage (3.8k LOC). We fix 8 as the
most beneficial average fanout threshold and also observe that other values result in slight
performance degradations. The resulting CritICs is relatively concise (≈10KB) to account
for ≈30% of dynamic coverage.
• Compilation: Next, we modify the open-source ART compiler to add a final pass (CritIC
instrumentation pass) that applies CritIC optimizations on the apk binary (.oat genera-
tion). Note that, the ART compiler already comes with different optimization passes such
as constant folding, dead code elimination, etc., which work on DEX intermedi-
ate representation, as well as load store elimination, register allocation, etc.,
which work on the destination ARM assembly code before binary generation. Our CritIC
pass works on ARM assembly code (similar to instruction simplifier pass) to take
each CritIC (from the profile), checks whether each of its instructions are convertible
into a 16-bit Thumb format, and if so, it lays down the entire CritIC sequence instruc-
tions one after another in this 16-bit format with appropriate two approaches explained
next for switching the instruction format (1.8k LOC). Note that, other than hoisting and
Thumb-converting the CritICs encountered, this pass does not affect the existing instruc-
tion scheduling.
• Off the Shelf Apps: Our framework can be readily applied to any off-the-shelf app (apk
file) from the PlayStore [109]. Table 4.2 shows the ten mobile apps we use for evalua-
tions. These apps belong to a diverse set of domains ranging from texting to gaming and
video/audio streaming. These apps are also top rated and have millions of downloads in
PlayStore.
• Net Benefits: We have roughly doubled the instruction fetch rate (halving F.StallForI)
of the critical instruction sequences by switching formats, and reduced the F.StallForR+D
delays by making this self-contained dependent chain contiguous in time. We will also
52
demonstrate that our proposed solution has very little hardware overhead to interpret the
format switch. In fact, our first approach can be readily done on current hardware, albeit
with some inefficiencies as shown next. The second approach uses an existing mnemonic
to switch format, which is a very small extension to the switch supported in existing ARM
decoders.
4.3 Evaluations
4.3.1 Switching Approach 1: On Actual Hardware
We use the conventional approach present in ARM decoders for switching between the two
instruction formats, where two unconditional branch instructions are added at the beginning and
end of each CritIC instruction sequence. The purpose of these branch instructions is to inform the
decoder of the impending format switch and so both their target branch addresses are statically
encoded to point to the subsequent instruction. As shown in Fig. 4.6, (i) the branch before the
CritIC sequence, is in 32 bit format (that sets the Thumb flag at decode), and jumps to the first
instruction of the CritIC; (ii) the subsequent 5 CritIC instructions are decoded in 16 bit Thumb
format at the decoder; (iii) the branch after the CritIC sequence is also in 16 bit format, with
its target set to the next instruction after the CritIC, that resets the format flag to 32-bit at the
decoder. Note that the costs of these branches would mandate long CritIC sequences in order to
amortize them.
We have implemented this on a Google Tablet hardware having 4 ARM cores and 2 GB
LPDDR3 memory. Fig. 4.8 shows the gains on this hardware from our CritIC optimization for
all 10 apps. Along with the actual speedup gains (of a measly 3% on the average), we also show
the lost potential which we could have got if there were no branches before and after the CritICs
for the format switches. We are getting only 15 th of the possible gains since the CritIC sequences
are not long enough (typically of length 5) to amortize the branch overheads. Motivated by this,
we next propose an alternative, which does a very slight enhancement to the hardware, to address
this problem to win back those gains.

53
0%
5%
10%
15%
20%
% S
pe
ed
up
Approach 1 Lost opportunities Branch after CritIC→Consumers are delayed
Branch before CritIC→ CritICexecution is delayed
Figure 4.8: Optimizing CritICs in existing hardware leaves 11% performance gap with the Idealscenario.
CritIC B4
Inst 8
Inst 6
CritIC B2
CritIC B3
Inst 7
Inst 0
Inst 1
CritIC A0
Inst 2
CritIC A2
CritIC A1
CritIC A3
Inst 4
CritIC B0
Inst 5
CritIC B1
CritIC A4
Inst 3
Original Instruction Sequence
Cri
tIC
AC
ritI
CB
Allowed Dependence
Not AllowedDependence
CritIC A0
Inst 0
CritIC A1
Inst 0
Inst 1
CritIC A0
Inst 2
CritIC A1
CritIC A2
CritIC A3
Inst 3
CritIC A4
Inst 4
CritIC B0
Inst 5
CritIC B1
Inst 6
CritIC B2
CritIC B3
Inst 7
CritIC B4
Inst 8
Inst 0
Inst 1
CritIC A0
1
2
3
4
5
6
7
8
9
10
11
12
13
14
15
16
17
18
19
Transformed Instruction Sequence (32b/inst)
Seq Thumb Flag 1st half word 2nd half word Description
1 32 bits Inst 0 Normal Inst
2 32 bits Inst 1 Normal Inst
3 32 bits [CDP.a, length(5)], CritIC.a A0 Set flag; Enqueue A0 for decoding; Decode A0-A4
as Thumb; Reset Flag.4 16 bits CritIC.a A1 CritIC.a A2
5 16 bits CritIC.a A3 CritIC.a A4
6 32 bits Inst 2 Normal Inst
7 32 bits Inst 3 Normal Inst
8 32 bits Inst 4 Normal Inst
9 32 bits [CDP.b, length(5)], CritIC.b B0 Set flag; Enqueue B0 for decoding; Decode B0-B4
as Thumb; Reset Flag.10 16 bits CritIC.b B1 CritIC.b B2
11 16 bits CritIC.b B3 CritIC.b B4
12 32 bits Inst 5 Normal Inst
13 32 bits Inst 6 Normal Inst
14 32 bits Inst 7 Normal Inst
15 32 bits Inst 8 Normal Inst
CritIC A1
Inst 2
CritIC A2
Figure 4.9: Code Generation after CritICs have been identified. There are 2 CritICs, A andB, in this original instruction sequence.
4.3.2 Switching Approach 2: Extending Existing ARM Instruction
To avoid the aforementioned overheads, we propose to use an already existing instruction mnemonic,
CDP (Co-processor Data Processing call), and the 3-bit argument with it to denote that the next
l +1 instructions would be 16-bit format to inform the decoder accordingly. Fig. 4.9 illustrates
this translation by our compiler pass for a CritIC sequence. In the first 32-bit word, the first
half contains the CDP command, together with the l argument (Fig. 4.6(d)). The second half of
this word contains the first instruction of the CritIC sequence in 16-bit format. The next dl/2e
32-bit words contain the next l instructions of the CritIC sequence in 16-bit format. Upon
encountering the CDP command, the decoder puts the subsequent l + 1 (1 coming in the latter
half of the CDP word itself, and the other l coming from the remaining dl/2e words) CritIC
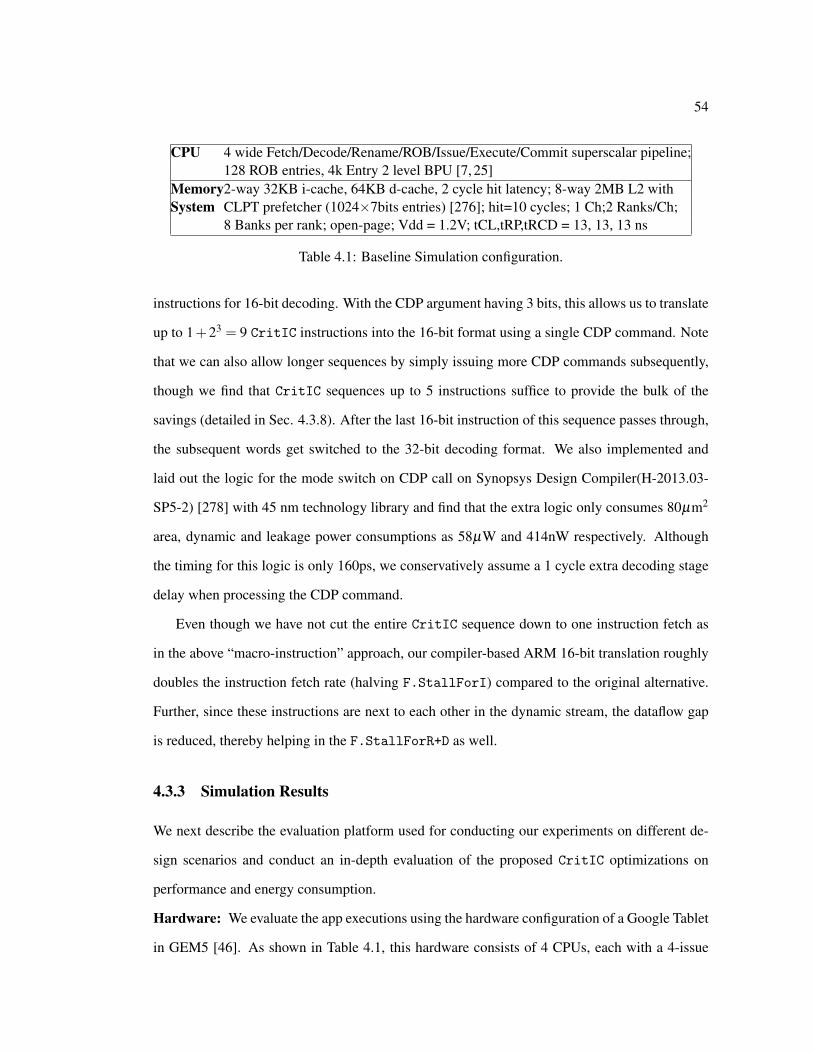
54
CPU 4 wide Fetch/Decode/Rename/ROB/Issue/Execute/Commit superscalar pipeline;128 ROB entries, 4k Entry 2 level BPU [7, 25]
Memory2-way 32KB i-cache, 64KB d-cache, 2 cycle hit latency; 8-way 2MB L2 withSystem CLPT prefetcher (1024×7bits entries) [276]; hit=10 cycles; 1 Ch;2 Ranks/Ch;
8 Banks per rank; open-page; Vdd = 1.2V; tCL,tRP,tRCD = 13, 13, 13 ns
Table 4.1: Baseline Simulation configuration.
instructions for 16-bit decoding. With the CDP argument having 3 bits, this allows us to translate
up to 1+23 = 9 CritIC instructions into the 16-bit format using a single CDP command. Note
that we can also allow longer sequences by simply issuing more CDP commands subsequently,
though we find that CritIC sequences up to 5 instructions suffice to provide the bulk of the
savings (detailed in Sec. 4.3.8). After the last 16-bit instruction of this sequence passes through,
the subsequent words get switched to the 32-bit decoding format. We also implemented and
laid out the logic for the mode switch on CDP call on Synopsys Design Compiler(H-2013.03-
SP5-2) [278] with 45 nm technology library and find that the extra logic only consumes 80µm2
area, dynamic and leakage power consumptions as 58µW and 414nW respectively. Although
the timing for this logic is only 160ps, we conservatively assume a 1 cycle extra decoding stage
delay when processing the CDP command.
Even though we have not cut the entire CritIC sequence down to one instruction fetch as
in the above “macro-instruction” approach, our compiler-based ARM 16-bit translation roughly
doubles the instruction fetch rate (halving F.StallForI) compared to the original alternative.
Further, since these instructions are next to each other in the dynamic stream, the dataflow gap
is reduced, thereby helping in the F.StallForR+D as well.
4.3.3 Simulation Results
We next describe the evaluation platform used for conducting our experiments on different de-
sign scenarios and conduct an in-depth evaluation of the proposed CritIC optimizations on
performance and energy consumption.
Hardware: We evaluate the app executions using the hardware configuration of a Google Tablet
in GEM5 [46]. As shown in Table 4.1, this hardware consists of 4 CPUs, each with a 4-issue
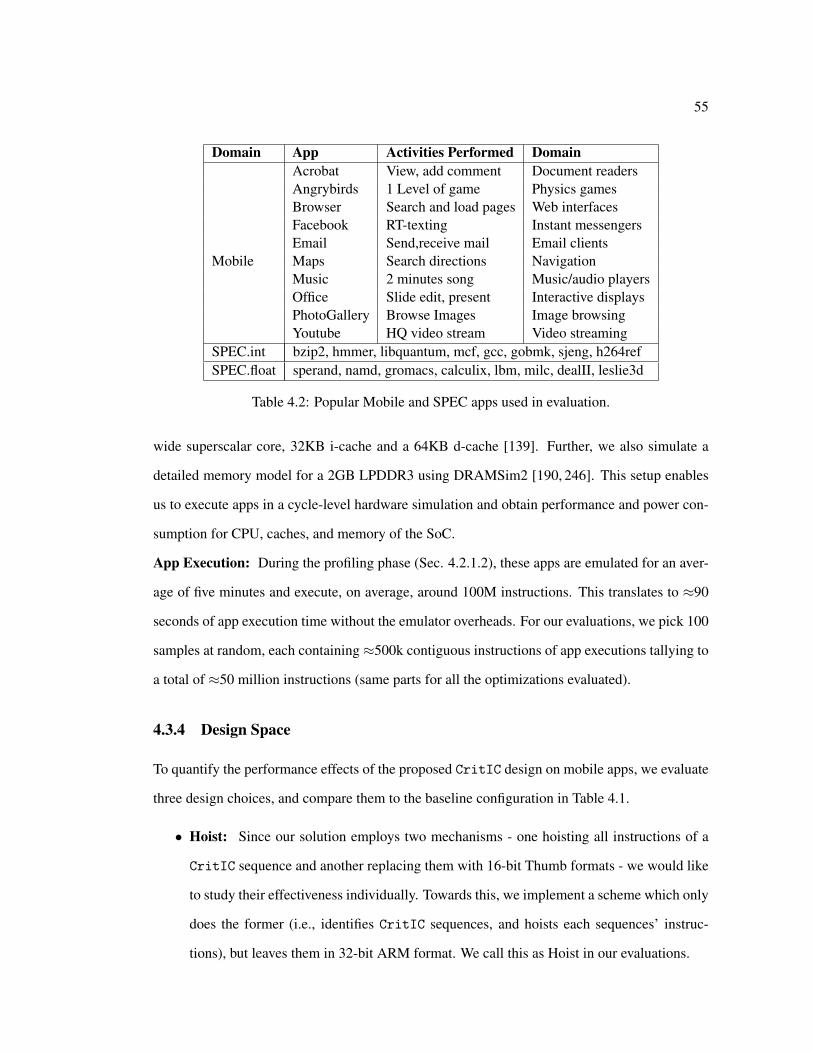
55
Domain App Activities Performed DomainAcrobat View, add comment Document readersAngrybirds 1 Level of game Physics gamesBrowser Search and load pages Web interfacesFacebook RT-texting Instant messengersEmail Send,receive mail Email clients
Mobile Maps Search directions NavigationMusic 2 minutes song Music/audio playersOffice Slide edit, present Interactive displaysPhotoGallery Browse Images Image browsingYoutube HQ video stream Video streaming
SPEC.int bzip2, hmmer, libquantum, mcf, gcc, gobmk, sjeng, h264refSPEC.float sperand, namd, gromacs, calculix, lbm, milc, dealII, leslie3d
Table 4.2: Popular Mobile and SPEC apps used in evaluation.
wide superscalar core, 32KB i-cache and a 64KB d-cache [139]. Further, we also simulate a
detailed memory model for a 2GB LPDDR3 using DRAMSim2 [190, 246]. This setup enables
us to execute apps in a cycle-level hardware simulation and obtain performance and power con-
sumption for CPU, caches, and memory of the SoC.
App Execution: During the profiling phase (Sec. 4.2.1.2), these apps are emulated for an aver-
age of five minutes and execute, on average, around 100M instructions. This translates to ≈90
seconds of app execution time without the emulator overheads. For our evaluations, we pick 100
samples at random, each containing≈500k contiguous instructions of app executions tallying to
a total of ≈50 million instructions (same parts for all the optimizations evaluated).
4.3.4 Design Space
To quantify the performance effects of the proposed CritIC design on mobile apps, we evaluate
three design choices, and compare them to the baseline configuration in Table 4.1.
• Hoist: Since our solution employs two mechanisms - one hoisting all instructions of a
CritIC sequence and another replacing them with 16-bit Thumb formats - we would like
to study their effectiveness individually. Towards this, we implement a scheme which only
does the former (i.e., identifies CritIC sequences, and hoists each sequences’ instruc-
tions), but leaves them in 32-bit ARM format. We call this as Hoist in our evaluations.

56
Acrobat Angrybirds
Browser Email Facebook Maps Music Office Photogallery
Youtube Average
0%
5%
10%
15%
Ho
ist
Cri
tIC
Cri
tIC
.Id
eal
Ho
ist
Cri
tIC
Cri
tIC
.Id
eal
Ho
ist
Cri
tIC
Cri
tIC
.Id
eal
Ho
ist
Cri
tIC
Cri
tIC
.Id
eal
Ho
ist
Cri
tIC
Cri
tIC
.Id
eal
Ho
ist
Cri
tIC
Cri
tIC
.Id
eal
Ho
ist
Cri
tIC
Cri
tIC
.Id
eal
Ho
ist
Cri
tIC
Cri
tIC
.Id
eal
Ho
ist
Cri
tIC
Cri
tIC
.Id
eal
Ho
ist
Cri
tIC
Cri
tIC
.Id
eal
Ho
ist
Cri
tIC
Cri
tIC
.Id
eal
Spe
ed
up
%Figure 4.10: Speedup over baseline with CritIC optimization
0%
20%
40%
60%
% E
xecu
tio
n T
ime
F.StallForI F.StallForR+D
Baseline CritIC
Figure 4.11: Fetch stage savings of CritIC instructions
• CritIC: This is our proposed CritIC design that aims to tackle the fetch side bottle-
necks for high-fanout instructions as well as the F.StallForR+D bottlenecks by hoist-
ing/aggregating the constituent instructions together and also translating these instructions
to 16-bit Thumb format.
• CritIC.Ideal: As was noted earlier in Fig. 4.5b, we choose to leverage only a subset of the
total number of CritIC sequences - (i) those that are at most length 5, and (ii) those whose
instructions can be translated directly to the 16-bit Thumb format. In order to find out the
lost opportunity, we also evaluate a scheme called CritIC.Ideal which hypothetically
aggregates and Thumb-translates for all CritIC instructions (i.e., the black CDF of Fig.
4.5b).
0%
1%
2%
3%
4%
5%
6%
7%
% S
yste
m W
ide
En
erg
y Sa
vin
gs
I-CacheCPU ExecutionMemory
Figure 4.12: Energy gains with CritIC optimization
57
4.3.5 Performance Results
Fig. 4.10 plots the CPU execution speedup of each app for the three scenarios discussed above to
study the individual as well as combined effects of the two components of CritIC optimizations.
We discuss app level speedups of each of these optimizations normalized with respect to the
baseline design. When we consider the individual optimizations evaluated in Fig. 4.10, we see
that the CritIC optimizations consistently perform well in all apps with 9% (Music) to 15% (Ac-
robat) speedup. However, Hoist (which only targets StallforRD) by itself, only gives marginal
improvements (average gain of 2.5%) compared to CritIC which combines both F.StallForI
and F.StallForR+D optimizations, suggesting that just moving instructions does not suffice.
Since this scheme only reduces the dataflow gap across critical instructions, without boosting
the fetch efficiency, the impact of just a F.StallForR+D optimization is not felt across these
apps, reiterating the need for fetch side improvements. Of the apps, Maps and Youtube are more
bottlenecked in the F.StallForR+D (26.7% in Youtube in baseline of Fig. 4.11) and this in turn
translates to the most benefits when it comes to optimizations for F.StallForR+D (3.1%). All
the other apps have even less improvements from hoisting the CritIC instructions, with Browser
and Photogallery showing the least benefits of 1.7%. CritIC, which implements both 16-bit
conversions to boost the fetch bandwidth, as well as the Hoist improvements, gives 12.6%
speedup improvements on the average. In fact, we see that the differences between CritIC and
CritIC.Ideal, to be quite small (e.g. only 1% gap in Acrobat, Browser and Office). Limiting
ourselves to CritIC lengths of 5 or to those that can be directly translated to 16-bit Thumb for-
mat, does not seem to hurt. This is because, a majority of CritIC instructions are amenable to
16-bit Thumb representation, leaving <1% room for any further improvement on the average.
As discussed in Sec. 4.2, the volume of CritIC instructions representable with the 16-bit format
is within 5% of the entire CritIC instruction volume. We note that the average 12.6% speedup
with CritIC significantly outperforms the previously proposed single instruction criticality opti-
mizations - load prefetching and ALU prioritization - for which we showed speedups of 0.7%
and 4.1% respectively.

58
4.3.6 System-Wide Energy Gains
The effect of our CritIC optimizations in terms of the energy gains from various components
of the mobile SoC is plotted in Fig. 4.12. Recall that CritIC optimizations decrease the number
of accesses to the i-cache by 40% (Fig. 4.6) for each IC execution by representing 5 × 32-bit
instructions as 3 × 32-bit instructions. This translates to energy gains from i-cache by 0.8% for
the whole SoC. The CPU speedup discussed above also results in additional energy gains for
both CPU and memory. On an average, CPU contributes to 2.2% of the energy savings and the
memory side of the execution contributes an additional 1.5%. Overall, we observe 4.6% energy
saving for the whole system on the average, with the maximum energy savings of 6.3% (in
Photogallery). Specifically, the CPU execution alone (excluding peripherals, ASIC accelerators,
etc.) realizes an average energy saving of 15%.
4.3.7 Comparing with Conventional Hardware Fetch Optimizations
One may note that numerous prior hardware enhancements proposed to address the Fetch stage
problems, including larger and more intelligently managed i-caches [156,273,299], better branch
predictors [5,258,306,313], and/or instruction prefetchers [55,142,147,189,309]. While adding
sophisticated hardware for high end CPUs may be acceptable, the resource constraints of mobile
platforms may not warrant such sophisticated hardware. Still, we have implemented a number of
hardware solutions for addressing the Fetch bottleneck (described below), and compared them
to the speedup obtained with our software-only solution – CritIC:
• 2×FD: Since CritIC uses a 16-bit format to put 2 instructions into each fetched word
(selectively doubling fetch bandwidth for critical instructions), we consider a hypothetical
hardware where the Fetch and Decode stage bandwidths are doubled (for all instructions -
not just critical ones), with no change to other stages. In this scheme (2×FD), we simulate
a hardware with half the i-cache latency and double the resources (hardware units/queues)
in the fetch and decode stages.
• 4×i-cache: Though unreasonable, we compare with a hardware that has 4× the i-cache

59
0%5%
10%15%20%25%30%35%
% S
pe
ed
up
Plain With CritIC
(a)
0%
10%
20%
30%
40%
50%
% E
xecu
tio
n T
ime
F.StallForI F.StallForR+D
Plain With CritIC
(b)
Figure 4.13: Comparison with Hardware Mechanisms (a) Speedup and (b) Impact onF.StallForIand F.StallForR+D.
capacity (128KB vs. 32KB) to reduce instruction misses.
• EFetch [55]: We implemented a recently proposed instruction prefetcher [55] that is
specifically useful for user-event driven applications, as in our mobile apps. This prefetcher
[55] tracks history of user-event call stack, and uses it to predict the next functions and
prefetch its instructions. It needs a 39KB lookup table for maintaining the call stacks.
• PerfectBr: This is a hypothetical system where we assume there is no branch mispredic-
tion in the entire execution.
Since CritIC addresses both (i) F.StallForIwhich the above 3 address; and (ii) F.StallForR+D,
which is somewhat addressed by prior criticality optimizations such as [60, 164, 172, 185, 197,
200, 230, 231, 314], which prioritize the back-end resources for those instructions, we addition-
ally consider the following configurations:
• BackendPrio [236]: This platform implements the prioritization hardware for the back-
end resources proposed in [236], using the tracking hardware proposed in [90], which
requires 1.5KB SRAM for maintaining the tokens.
• AllHW: This consists of hardwares for both front and backends, i.e., 4×i-cache + EFetch
+ PerfectBr + BackendPrio.
• With CritIC: In addition to comparing with vanilla CritIC, which has no additional hard-
ware needs, we also study CritIC in combinations with every above hardware mechanisms.
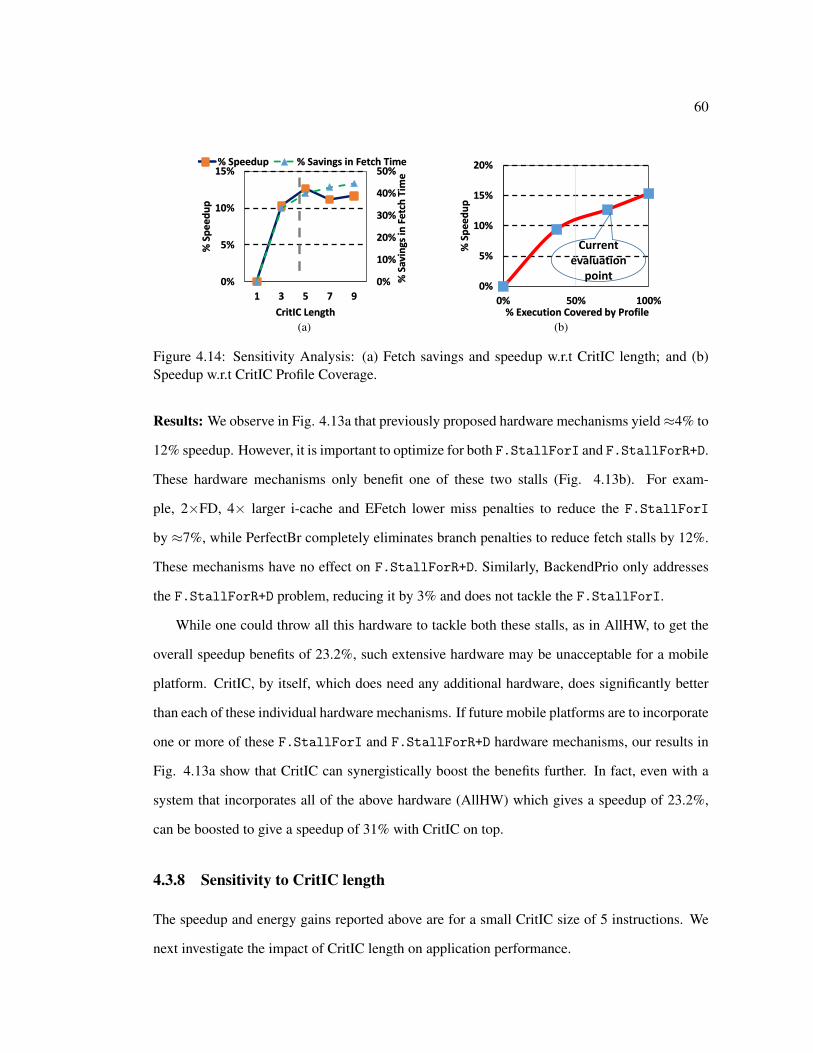
60
0%
10%
20%
30%
40%
50%
0%
5%
10%
15%
1 3 5 7 9
% S
avin
gs in
Fet
ch T
ime
% S
pe
ed
up
CritIC Length
% Speedup % Savings in Fetch Time
(a)
0%
5%
10%
15%
20%
0% 50% 100%
% S
pe
ed
up
% Execution Covered by Profile
Current evaluation
point
(b)
Figure 4.14: Sensitivity Analysis: (a) Fetch savings and speedup w.r.t CritIC length; and (b)Speedup w.r.t CritIC Profile Coverage.
Results: We observe in Fig. 4.13a that previously proposed hardware mechanisms yield≈4% to
12% speedup. However, it is important to optimize for both F.StallForI and F.StallForR+D.
These hardware mechanisms only benefit one of these two stalls (Fig. 4.13b). For exam-
ple, 2×FD, 4× larger i-cache and EFetch lower miss penalties to reduce the F.StallForI
by ≈7%, while PerfectBr completely eliminates branch penalties to reduce fetch stalls by 12%.
These mechanisms have no effect on F.StallForR+D. Similarly, BackendPrio only addresses
the F.StallForR+D problem, reducing it by 3% and does not tackle the F.StallForI.
While one could throw all this hardware to tackle both these stalls, as in AllHW, to get the
overall speedup benefits of 23.2%, such extensive hardware may be unacceptable for a mobile
platform. CritIC, by itself, which does need any additional hardware, does significantly better
than each of these individual hardware mechanisms. If future mobile platforms are to incorporate
one or more of these F.StallForI and F.StallForR+D hardware mechanisms, our results in
Fig. 4.13a show that CritIC can synergistically boost the benefits further. In fact, even with a
system that incorporates all of the above hardware (AllHW) which gives a speedup of 23.2%,
can be boosted to give a speedup of 31% with CritIC on top.
4.3.8 Sensitivity to CritIC length
The speedup and energy gains reported above are for a small CritIC size of 5 instructions. We
next investigate the impact of CritIC length on application performance.
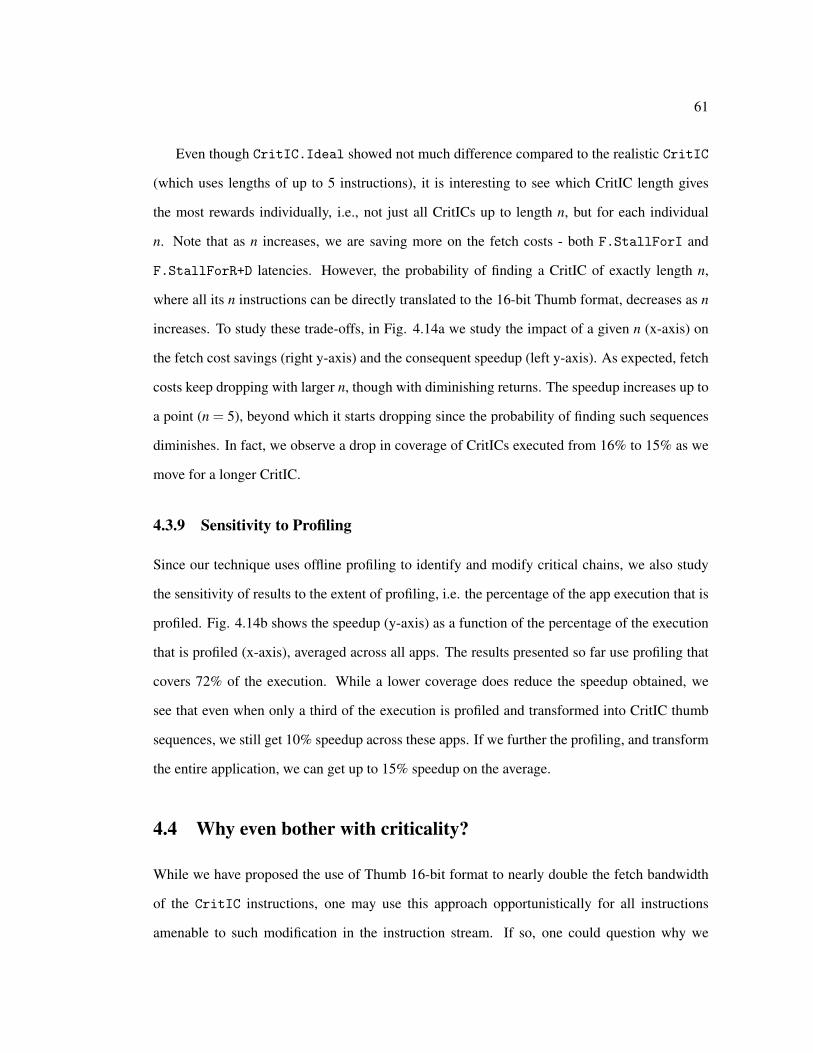
61
Even though CritIC.Ideal showed not much difference compared to the realistic CritIC
(which uses lengths of up to 5 instructions), it is interesting to see which CritIC length gives
the most rewards individually, i.e., not just all CritICs up to length n, but for each individual
n. Note that as n increases, we are saving more on the fetch costs - both F.StallForI and
F.StallForR+D latencies. However, the probability of finding a CritIC of exactly length n,
where all its n instructions can be directly translated to the 16-bit Thumb format, decreases as n
increases. To study these trade-offs, in Fig. 4.14a we study the impact of a given n (x-axis) on
the fetch cost savings (right y-axis) and the consequent speedup (left y-axis). As expected, fetch
costs keep dropping with larger n, though with diminishing returns. The speedup increases up to
a point (n = 5), beyond which it starts dropping since the probability of finding such sequences
diminishes. In fact, we observe a drop in coverage of CritICs executed from 16% to 15% as we
move for a longer CritIC.
4.3.9 Sensitivity to Profiling
Since our technique uses offline profiling to identify and modify critical chains, we also study
the sensitivity of results to the extent of profiling, i.e. the percentage of the app execution that is
profiled. Fig. 4.14b shows the speedup (y-axis) as a function of the percentage of the execution
that is profiled (x-axis), averaged across all apps. The results presented so far use profiling that
covers 72% of the execution. While a lower coverage does reduce the speedup obtained, we
see that even when only a third of the execution is profiled and transformed into CritIC thumb
sequences, we still get 10% speedup across these apps. If we further the profiling, and transform
the entire application, we can get up to 15% speedup on the average.
4.4 Why even bother with criticality?
While we have proposed the use of Thumb 16-bit format to nearly double the fetch bandwidth
of the CritIC instructions, one may use this approach opportunistically for all instructions
amenable to such modification in the instruction stream. If so, one could question why we

62
0%
5%
10%
15%
20%
% S
pe
ed
up
OPP16 Compress CritIC Opp16+CritIC
(a)
0%
10%
20%
30%
40%
50%
% D
ynam
ic In
stru
ctio
ns
Co
nve
rte
d t
o T
hu
mb
Fo
rmat
OPP16 CritIC Compress
(b)
Figure 4.15: Opportunistically transforming to 16-bit Thumb format. (a) Speedup and (b) Per-centage of Dynamic Instructions converted to 16-bit format.
bothered to identify CritICs in the first place. To justify the need, in Fig. 4.15a, we plot the
speedup obtained with the following schemes:
• OPP16: In this approach, we opportunistically convert any amenable sequence of consec-
utive dynamic instructions (sequence has to be of at least length 3) to the 16-bit Thumb
format, regardless of whether they are critical or not. Note that if there is an instruction
which is not amenable to such format conversion between two other instructions which
are amenable, OPP16 will NOT move the instructions around for the conversion. Also,
as explained earlier, if the dynamic sequence exceeds 9 contiguous instructions that can
be converted, we use another CDP instruction to accommodate longer sequences for such
conversion.
• Compress: This is a state-of-the-art thumb compression technique, implementing the
Fine-Grained Thumb Conversion heuristic from [160], that first converts a whole function
to Thumb, then replaces frequently occurring “slower thumb instructions” back to 32 bit
ARM instructions.
• CritIC: This implements our CritIC mechanism described earlier, moving/hoisting iden-
tified CritIC sequence instructions and converting them to 16-bit format as long as they
are amenable to such conversion and they are of length ≤ 5.
• OPP16+CritIC: We combine CritIC (for CritIC sequence instructions) and OPP16 (for
others) in this approach.
63
As seen, just opportunistically leveraging the 16-bit Thumb format (in OPP16) only provides 6%
benefit on the average over the baseline. Even smartly employing the Thumb format (Compress),
as in [160], only yields a 8% speedup. Since both OPP16 and Compress are agnostic to critical
instruction chains, they can only save on fetch costs (F.StallForI) whenever possible without
hoisting the dependent instructions in the chain. Hence, both these techniques provide less
than 40% of the benefits provided by our CritIC optimization, even though as shown in Fig.
4.15b, CritIC converts around 37% and 50% fewer instructions in the dynamic stream to the
16-bit format compared to OPP16 and Compress respectively. This clearly points out the need
to identify the critical instruction sequences for such optimization, instead of blindly doing this
for all instructions. In fact, nothing precludes adding on the optimization for other instructions
on top of CritIC, as is shown for OPP16+CritIC schemes, furthering the speedup by 25% over
doing CritIC alone.
4.5 Related Work
Criticality: Instruction criticality has been shown to be an important criterion in selectively
optimizing the instruction stream. Prior work has revolved around both (i) identifying critical
instructions [89, 172, 267, 268, 283, 285] using metrics such as fanout, tautness, execution laten-
cies, slack, and execution graph representations, as well as (ii) optimizing for those identified
using techniques such as critical load optimizations [52,102, 267, 268,276] or even backend op-
timizations for critical instructions such as [60,164,172,185,197,200,230,231,285,314]. While
one can potentially employ these optimizations for mobile apps, as we showed (in Fig. 4.1b),
mobile apps have close data-dependent, clustered occurrences of critical instructions, requiring
their ensemble optimization rather than their consideration individually.
Optimizing Instruction Chains/Ensembles: There are prior works, specifically for high-end
processors, in identifying and extracting dependence chains [50, 223, 281]. However, such tech-
niques require fairly extensive hardware to identify these chains, and optimizing for them, e.g.
techniques such as [230, 231, 276] require 16KB SRAM, and [52] incurs 22% additional power,
making them less suitable for resource-constrained mobile SoCs. In contrast, our solution is an

64
entirely software approach for identifying dependence chains, and a software approach in op-
timizing for them by intelligently employing the ARM 16-bit thumb compression [24–26, 302]
mechanism.
Front-end Optimizations for Mobile Platforms: There has been significant recent interest to
optimize mobile CPU execution [48,123–125,199,293,295]. Some of these optimizations target
specific domains (e.g. web-browsers [56,134,316,317]), while others address overall efficiency
[23,47,235,303]. Unlike our approach, many of these optimizations either provision more CPU
hardware [23, 47, 316], or optimize for only specific app domains [56, 316, 317]. This work is
amongst the first to show that mobile apps are bottlenecked in the Fetch stage of the pipeline,
suggesting that there can be considerable rewards in targeting this stage. Fetch stage bottlenecks
have been extensively addressed in high end processors through numerous techniques - smart i-
cache management (e.g. [132,156,219,264,273,299]) prefetching (e.g. [55,142,147,189,309]),
branch prediction (e.g [5, 258, 306, 313]), instruction compression [57] SIMD [91, 280], VLIW
[93], vector processing [77], etc. However, many of these require extensive hardware that mobile
platforms may not be conducive for. As we showed, our software solution employs a simple trick
of hoisting and Thumb conversion on critical instructions to extract the same performance that
many of these high-end hardware mechanisms provide. Further, as mobile processors evolve
to incorporate more hardware for optimizing the fetch stage, as shown, our CritIC software
approach can synergistically integrate with them to significantly boost the improvements. While
similar in spirit to some of the prior work on instruction stream compression [166,167,245], we
quantitatively showed the need to identify critical chains and hoisting the instructions selectively
before doing the compression.
Software Profiling for Mobile Platforms: A number of software profiling frameworks have
been proposed [27, 129, 282, 291, 294] - studying library usage [27, 282], app-market level
changes to the source/advertisement models, [291, 294], dynamic instrumentation mechanisms
[129], developer side debugging/optimizations [112, 312] etc. Some of these tools can also be
extended for the profiling and compilation phases described in this work. We have built on top
of the AOSP emulation [111, 237] and Gem5 hardware simulator [46] for profiling, and ART

65
compiler for code transformation.
4.6 Chapter Summary
The optimizations proposed in this chapter, CritIC, targets to enhance the performance a grow-
ing class of applications - mobile apps – that are more prevalent and user driven than traditional
server/scientific workloads. In this context, we show that mobile apps have unique characteristics
such as high volume of critical instructions occurring as short sequences of dependent instruc-
tions that makes them less attractive for exploiting well-known criticality-based optimization
techniques. We instead introduce the concept of CritICs as a granularity for tracking and ex-
ploiting criticality in these apps. We present a novel profiler-driven approach to identify these
CritICs, and hoist and aggregate them by exploiting existing ARM ISA’s Thumb instruction
format in a compiler pass to boost the front-end fetch bandwidth. The end-to-end design starting
from application profiling, identification of CritICs, hoisting those instructions and transforma-
tion them to the 16-bit Thumb format has been evaluated for a Google Tablet using the GEM5
simulator to estimate the performance and energy benefits. Evaluations with ten popular mo-
bile apps indicate that the proposed solution results in an average 12.6% speedup and 4.6%
reduction in system-wide energy consumption compared to the baseline design, requiring lit-
tle to no hardware support. The proposed technique can also be synergistically integrated with
other optimizations such as hardware prefetching, or even opportunistically converting as many
instructions as possible to the Thumb format, to further the benefits.

Chapter 5Short circuiting the entire execution
in the edge
Both the above optimizations, LOST hardware acceleration and CritIC compiler based front-end
optimization of critical instruction chains target only the CPU part of the app execution in the
edge (Fig. 1.2). Although this captures 35% of the execution time, the other component that
is the unique trait of user interactive workloads – IO has not been optimized yet at all. This
research exploits the repetitive nature of user interaction in mobile apps and short-circuits the
execution from end-to-end, i.e., from the sensors reading the inputs to outputs getting displayed
on the screen on a hugely popular sub-domain of mobile apps, gaming, that is known for its
intense user interactions. This research looks to develop a holistic solution to reduce end-to-end
energy consumption of the entire mobile device rather than a piece-meal solution for any single
component.
The main idea of this optimization is selective event processing, rather than reacting to ev-
ery event. As discussed earlier in general for all edge executions, gaming applications are also
inherently event driven, with user input continuously (generated by numerous sensors) driving
the computation. The applications need to prepare and react to each such event, which can result
in significant energy consumption. Instead, if we are selective about which event will really
impact the game behavior, we could avoid unnecessarily (re-)processing thousands of events.
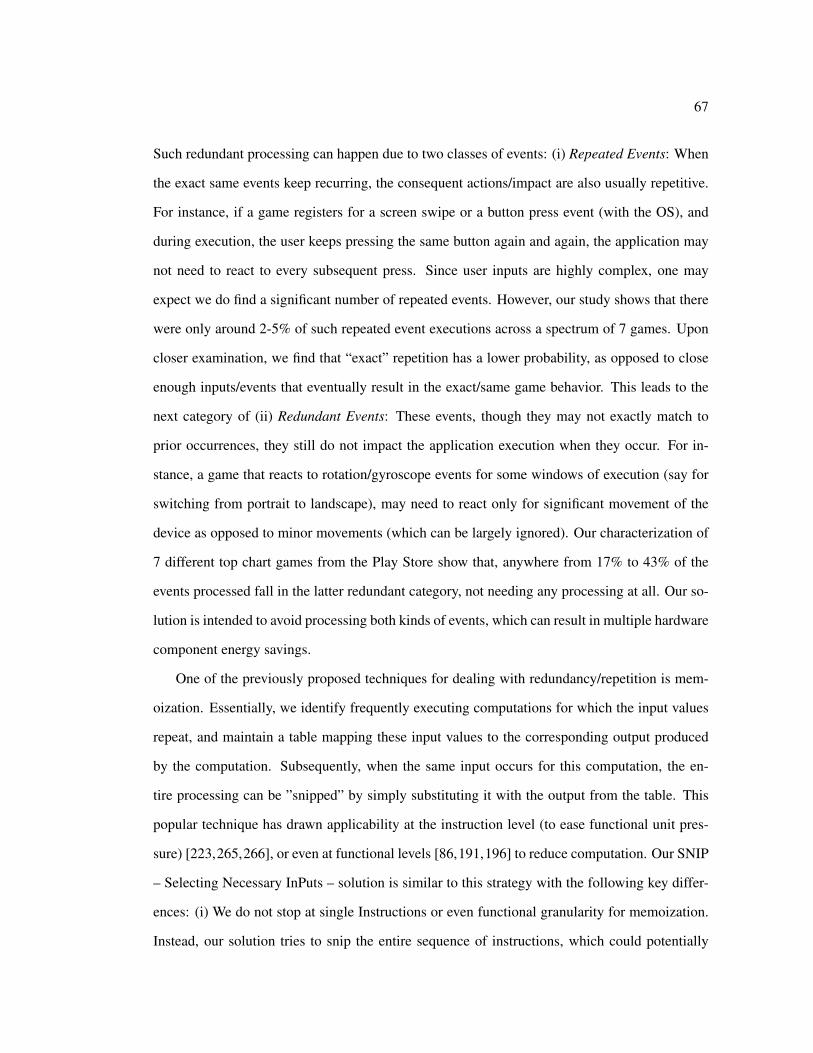
67
Such redundant processing can happen due to two classes of events: (i) Repeated Events: When
the exact same events keep recurring, the consequent actions/impact are also usually repetitive.
For instance, if a game registers for a screen swipe or a button press event (with the OS), and
during execution, the user keeps pressing the same button again and again, the application may
not need to react to every subsequent press. Since user inputs are highly complex, one may
expect we do find a significant number of repeated events. However, our study shows that there
were only around 2-5% of such repeated event executions across a spectrum of 7 games. Upon
closer examination, we find that “exact” repetition has a lower probability, as opposed to close
enough inputs/events that eventually result in the exact/same game behavior. This leads to the
next category of (ii) Redundant Events: These events, though they may not exactly match to
prior occurrences, they still do not impact the application execution when they occur. For in-
stance, a game that reacts to rotation/gyroscope events for some windows of execution (say for
switching from portrait to landscape), may need to react only for significant movement of the
device as opposed to minor movements (which can be largely ignored). Our characterization of
7 different top chart games from the Play Store show that, anywhere from 17% to 43% of the
events processed fall in the latter redundant category, not needing any processing at all. Our so-
lution is intended to avoid processing both kinds of events, which can result in multiple hardware
component energy savings.
One of the previously proposed techniques for dealing with redundancy/repetition is mem-
oization. Essentially, we identify frequently executing computations for which the input values
repeat, and maintain a table mapping these input values to the corresponding output produced
by the computation. Subsequently, when the same input occurs for this computation, the en-
tire processing can be ”snipped” by simply substituting it with the output from the table. This
popular technique has drawn applicability at the instruction level (to ease functional unit pres-
sure) [223,265,266], or even at functional levels [86,191,196] to reduce computation. Our SNIP
– Selecting Necessary InPuts – solution is similar to this strategy with the following key differ-
ences: (i) We do not stop at single Instructions or even functional granularity for memoization.
Instead, our solution tries to snip the entire sequence of instructions, which could potentially

68
Figure 5.1: Example game execution in a smart phone. The user generated events are capturedat sensors, to be processed at both CPUs and IPs and finally produces the outputs back to theuser.
span multiple functions and even application-OS boundaries, that are driven by the event we
are targeting to avoid processing; (ii) Apart from reducing the overhead of fetching and execut-
ing these instructions, SNIP also avoids the overheads when certain parts of the computation
(in event processing) are offloaded to accelerators/IPs on the mobile SoC; and (iii) As pointed
above, if we are to stick to exactly matching inputs, the scope for optimization is relatively small.
Instead, we also include the Redundant Events in our memoization, where even if the inputs do
not exactly match, we can still snip those computation to produce an output that is no differ-
ent than performing the entire computation. SNIP, thus, goes well beyond prior techniques to
identify and cut-short computations for redundant events.
We next analyze the various challenges in achieving this goal and propose the heuristics and
methodology of SNIP that achieves this goal.
5.1 Overview of Gaming Workloads
Gaming workloads perform event-driven computations to react to various user actions, gestures,
etc., and render the resulting output to the user. For example, Fig. 5.1 shows a user playing a
typical Augmented Reality (AR) game [202] on a phone, where the user swipes, tilts and walks
with the device. The objective of the user in this game is to capture the various objects that
are augmented into the scene that is captured continuously in the phone’s camera (and simulta-
neously processed and displayed on its screen). To achieve this, the game uses the input data
(walking, tilting, swiping, camera feeds, etc.) to process and respond back to the user. Under
the hood, the gaming device captures the three events below continuously: (i) swipe action is
captured using a series of touch events on the screen; (ii) tilt is captured using a series of gyro

69
events; and (iii) walk is captured using a series of both the camera feed and the GPS position. To
understand the implications of such events in the hardware, we next walk through the example
in Fig. 5.1 and illustrate what happens in the hardware.
5.1.1 What happens in the hardware?
Towards better performance and energy efficient executions, the apps running on contemporary
System on Chip (SoC) designs leverage a combination of compute units (such as general pur-
pose CPU, GPU cores) and domain-specific accelerators/IPs (such as encoders, decoders, neural
networks, image processors), to take advantage of the spectrum of performance and energy ef-
ficiency tradeoffs offered by them. To understand how these components get orchestrated and
work together during execution, we next delve into what happens in the underlying hardware
during application execution. As depicted in Fig. 5.1, the event generation begins with the user
interacting with the device. As the user interacts (e.g., swipes, walks with the phone, etc.), the
corresponding sensors are read by the sensor hub (step 2 in Fig. 5.1), and the values of the sen-
sors are subsequently passed on to the CPU as interrupts. The OS framework for these interrupts
(e.g., SensorManager in Android [13]) processes these raw sensor values into high-level events
(e.g., swipe, tilt, etc.) – that are further passed onto the game execution at the CPU through
shared memory between the sensor hub’s runtime and the game workload execution (step 3 in
Fig. 5.1). This is accomplished using the Binder framework in Android [115]. The workload
execution at the CPU subsequently processes these events using a sequence of event handler
functions in CPU as well as accelerator/IPs and after processing, renders the outputs back to the
user (e.g., display “pokemon is captured” on the screen).
In short, the CPU cores initiate and manage all the event handling and initial processing, and
it subsequently offloads the heavier tasks such as frame/audio rendering, storing and batching
events etc., to domain-specific microphone, display controller, codecs, GPUs and sensor hubs.
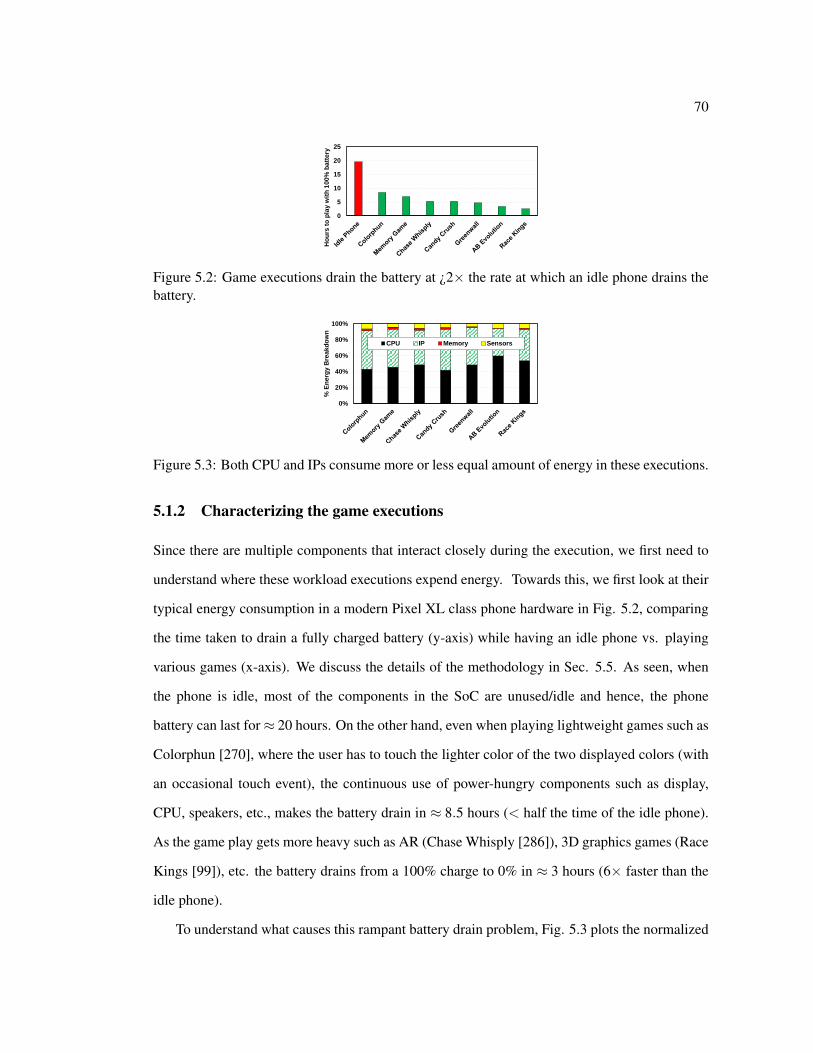
70
0
5
10
15
20
25
Ho
urs
to
pla
y w
ith
100%
batt
ery
Figure 5.2: Game executions drain the battery at ¿2× the rate at which an idle phone drains thebattery.
0%
20%
40%
60%
80%
100%%
En
erg
y B
rea
kd
ow
n
CPU IP Memory Sensors
Figure 5.3: Both CPU and IPs consume more or less equal amount of energy in these executions.
5.1.2 Characterizing the game executions
Since there are multiple components that interact closely during the execution, we first need to
understand where these workload executions expend energy. Towards this, we first look at their
typical energy consumption in a modern Pixel XL class phone hardware in Fig. 5.2, comparing
the time taken to drain a fully charged battery (y-axis) while having an idle phone vs. playing
various games (x-axis). We discuss the details of the methodology in Sec. 5.5. As seen, when
the phone is idle, most of the components in the SoC are unused/idle and hence, the phone
battery can last for≈ 20 hours. On the other hand, even when playing lightweight games such as
Colorphun [270], where the user has to touch the lighter color of the two displayed colors (with
an occasional touch event), the continuous use of power-hungry components such as display,
CPU, speakers, etc., makes the battery drain in ≈ 8.5 hours (< half the time of the idle phone).
As the game play gets more heavy such as AR (Chase Whisply [286]), 3D graphics games (Race
Kings [99]), etc. the battery drains from a 100% charge to 0% in ≈ 3 hours (6× faster than the
idle phone).
To understand what causes this rampant battery drain problem, Fig. 5.3 plots the normalized

71
breakdown of the energy consumption across the CPUs, IPs, and sensors in these game execu-
tions. As seen, the sensors and memory consume very small portion of the total energy (¡ 10%),
while the rest is split more or less equally between the CPU and IPs. The major components
of energy consumption are from the CPU and IP executions, where the CPU consumes 40% to
60% of the total energy, and the IPs also consuming 34% to 51% of the total energy. Therefore,
in contrast to Fig. 5.2, where the heavy applications (e.g., RacesKings) drain the battery faster
than light-weight applications (e.g., Colorphun), Fig. 5.3 shows that both CPU and IPs drain the
battery more or less equally for all the applications. Thus, to optimize for energy efficiency in
these workloads, in this paper, we look into the ”whole” SoC execution rather than optimizing
for one or more individual components.
5.1.3 Opportunities, drawbacks, and challenges
Since the SoC hardware is used for many app executions in general, a particular game execution
may or may not need all of the features exposed by the hardware. And, in turn, we can use this
application-level domain knowledge to optimize execution and improve energy efficiency. In
the example shown in Fig. 5.1, the hardware execution starts from the sensors generating raw
values, to the output generation at the display/speakers, etc. Below, we describe the different
opportunities for exploiting this domain knowledge in this example:
At the sensors: Each of the sensors have a range of values it can generate for an external user
interaction. For example, a gravity/rotation sensor has value limits from 0◦ to 360◦ its x (α), y
(β ) and z(γ) rotation angles, that captures the accurate way in which the device is currently held
by the user. However, the execution may only require whether the device is held in landscape
(β ¿ 90◦) or portrait mode (β ¡ 90◦), and not care about the rest of the details at all. In such
scenarios, as discussed in [135, 158, 173], one could employ a low fidelity mode for the sensors
to save energy.
However, the drawback of such an optimization is that our workloads do not consume much
energy at the sensors itself (Fig. 5.3). Optimizing at this level could result in very small energy

72
0%
10%
20%
30%
40%
50%
0%
10%
20%
30%
40%
50%
% B
att
ery
co
ns
um
pti
on
wa
ste
d
on
pro
ce
ss
ing
us
ele
ss
eve
nts
% E
ven
ts t
hat
did
no
t h
ave a
ny
imp
ac
t in
th
e g
am
e
% Useless Events % Energy Wasted
Figure 5.4: % of user events captured in mobile games that resulted in the exact same output ascurrent state after processing.
benefits overall.
When processing an event and generating output: After the sensor values are obtained at
the OS, the app event handler is invoked with the corresponding sensor data packed into an
event object as arguments. To leverage the limited use of the sensor values by the application
executions, we first need to understand when the sensor values are useful and when they will not
be useful before the the event processing at the CPU. For example, a swipe-up in Fig. 5.1 may
only be relevant when the game has a pokemon displayed for the user to swipe up and has no
effect otherwise. To understand whether there is scope for such “wasted processing” in the game
execution, we present the % of events that resulted in no change in the game state at all in Fig.
5.4. We observe that, in all the workloads, anywhere from 17% to 43% of event processing result
in no output change at all, and that in turn wastes about 34% of energy in processing these events.
For example, in AB Evolution game, the game play involves stretching a catapult to release an
object aimed towards a target. But, when the catapult is stretched to the maximum, no matter
what the user swipe action is, it has no effect on the game. Thus, it leads to the highest useless
events (43%). If we can successfully identify the event to not affect the execution at all before we
process the event, we can save energy from the CPU side execution – and further not invoke the
accelerators as well. To do so, we can potentially leverage the prior occurrences of event values
in knowing whether the event resulted in any output change or not and use it for short-circuiting
subsequent occurrences. Such history based lookup table approaches have been studied in the
past [36, 265, 266] in the context of scientific computations. However, in the context of mobile

73
Figure 5.5: To short-circuit a computation, it should ideally exhibit the properties of (a) whereall input/output locations are pre-determined and only the values in the input/output change withinstances of computation. Whereas (b) has many dynamic input/output loaded and stored frommemory, and it will be difficult to implement a variable length input/output based lookup table.
game executions that are already draining battery, we need to be careful in employing such
an approach. Specifically, there are three main questions that collectively determine whether
such approach is feasible or not: (i) are the inputs and outputs reasonably small to fit a naive
lookup table approach?, (ii) are all the input/output locations known apriori?, and (iii) is there
any dynamism involved in loading inputs or generating outputs among instances of repeating
execution? We next analyze the workload behavior and answer these design aspects for a naive
lookup table approach.
5.2 Impracticality of Lookup Table Approach
Towards short-circuiting redundant executions, we first explore whether the most common method
for skipping redundant executions using a lookup table could be beneficial in this context or not.
Lookup tables store constant size inputs and outputs per record with the record itself consisting
of the input/output values seen in prior executions. Using this history, future executions can in-
dex into a particular record based on the current input values, and get the outputs directly without
actually executing the computations. For such an approach to be feasible, all the locations from
where the inputs are loaded and outputs are stored should be known apriori (see the example
in Fig. 5.5(a)). However, the various hardware components involved in the compute black box
(CPU cores and IPs) in a mobile SoC often involve dynamic memory accesses during execution,
as shown in Fig. 5.5(b) – where two instances of the computation (shown as different shades),
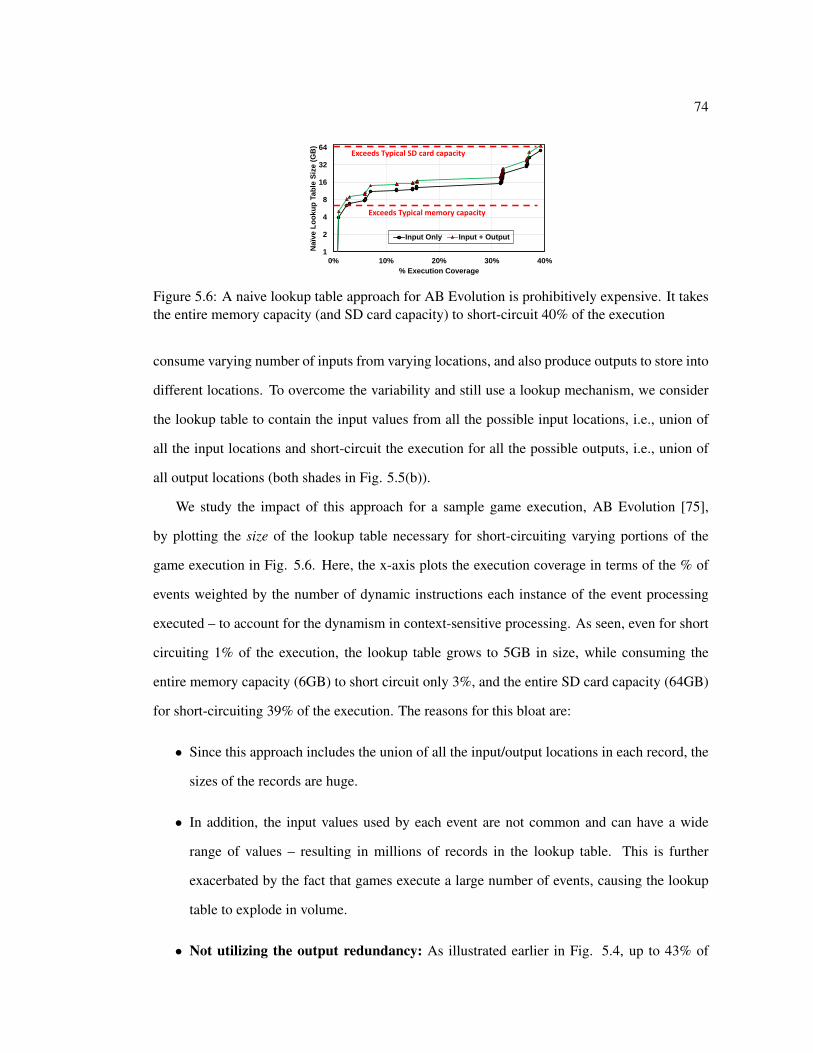
74
1
2
4
8
16
32
64
0% 10% 20% 30% 40%
Na
ïve
Lo
ok
up
Ta
ble
Siz
e (
GB
)
% Execution Coverage
Input Only Input + Output
Exceeds Typical SD card capacity
Exceeds Typical memory capacity
Figure 5.6: A naive lookup table approach for AB Evolution is prohibitively expensive. It takesthe entire memory capacity (and SD card capacity) to short-circuit 40% of the execution
consume varying number of inputs from varying locations, and also produce outputs to store into
different locations. To overcome the variability and still use a lookup mechanism, we consider
the lookup table to contain the input values from all the possible input locations, i.e., union of
all the input locations and short-circuit the execution for all the possible outputs, i.e., union of
all output locations (both shades in Fig. 5.5(b)).
We study the impact of this approach for a sample game execution, AB Evolution [75],
by plotting the size of the lookup table necessary for short-circuiting varying portions of the
game execution in Fig. 5.6. Here, the x-axis plots the execution coverage in terms of the % of
events weighted by the number of dynamic instructions each instance of the event processing
executed – to account for the dynamism in context-sensitive processing. As seen, even for short
circuiting 1% of the execution, the lookup table grows to 5GB in size, while consuming the
entire memory capacity (6GB) to short circuit only 3%, and the entire SD card capacity (64GB)
for short-circuiting 39% of the execution. The reasons for this bloat are:
• Since this approach includes the union of all the input/output locations in each record, the
sizes of the records are huge.
• In addition, the input values used by each event are not common and can have a wide
range of values – resulting in millions of records in the lookup table. This is further
exacerbated by the fact that games execute a large number of events, causing the lookup
table to explode in volume.
• Not utilizing the output redundancy: As illustrated earlier in Fig. 5.4, up to 43% of

75
outputs are exactly the same as prior executions. While even a one byte difference in the
input record can potentially create a new entry in this lookup table approach, the outputs
are still going to be the same for up to 43% of the events.
While prior works identify lookup tables as an efficient way for optimizing redundant output
generations in other workload domains [36, 265], there is a clear difference in game executions,
where the inputs can grow in both size and number to become prohibitively large for lookup
tables and still result in huge volume of redundant outputs. Thus, we next look into reducing the
lookup table size by exploiting the innate characteristics of input-outputs observed in game exe-
cutions to identify the best heuristics to detect and short-circuit redundant output computations,
albeit having vastly varying inputs for processing them.
0%
10%
20%
30%
40%
50%
60%
70%
80%
90%
100%
1 8 64 512 4096 32768 262144
Cu
mu
lati
ve
oc
cu
rre
nc
e o
f in
pu
ts i
n
va
rio
us
eve
nt
pro
ce
ss
ing
Input size per event processing (Bytes)
In.Event+
In.History+
ExternalSources
(In.Extern)
In.Event+
Previous execution
output (In.History)
Event Objects
(In.Event)
(a)
0%
10%
20%
30%
40%
50%
60%
70%
80%
90%
100%
1 8 64 512 4096 32768
Cu
mu
lati
ve
oc
cu
rre
nc
e o
f o
utp
uts
fr
om
va
rio
us
eve
nt
pro
ce
ss
ing
Output size per event processing (Bytes)
Transient (Out.Temp)
Out.Temp+
Out.History+
External Scope
(Out.Extern)
Store and Reuse
(Out.History)+
Out.Temp
(b)
(c)
Figure 5.7: Example characteristics of AB Evolution game illustrates that (a) the three typesof inputs vary in sizes and vary for different instances of event processing; (b) likewise, thethree types of outputs also vary similarly; and (c) the reason for such variations is the dynamisminvolved in these game executions.

76
5.3 Input-Output Behavior of Event Processing
Though the lookup table approach is impractical, it captures all the inputs used by the execution
and produces all the exact outputs of the computation. In order to overcome its drawbacks, we
need to answer the following questions: what constitutes the huge input/output records?, are all
these records necessary to capture the redundant event outputs in Fig. 5.4?, if not, what parts
of input/output to keep? and what to trim down? To answer these questions, we first define the
categories of input fields the lookup table should contain, and subsequently use the definition to
explore the size and feasibility of trimming the input-output records used in event processing,
while ensuring that it will not result in erroneous executions.
5.3.1 Inputs Characteristics
At any instance of event processing, the execution not only takes the sensor events as input,
but also the internal application state data from memory/storage, and external data from net-
work/cloud. Specifically, there are three categories of input data, with each of them residing in
different locations, namely, Event Objects (In.Event), Previous Execution Output (In.History),
and External Sources (In.Extern). To understand whether they are amenable for memoization or
not, we next study their size/location characteristics in detail for an example execution of AB
Evolution game in Fig. 5.7a by plotting the size spread of each of these categories in the x-axis
and their cumulative % occurrences among various events processed during the game execution
in y-axis.
Event Objects (In.Event): These contain the sensor values from user interactions and are
passed as arguments to event handlers and OS queues in binder [115]. Fig. 5.7a (x-axis) shows
that the size of In.Events are relatively small and varies from 2 to 640 bytes (different event
types have different sizes). While all event processing consume In.Event data, these inputs are
also easily located using their object handles, and have fixed size for the same event type. For
example, the event handler for detecting a change of swipes, always gets a MotionEvent object
of a fixed size passed as argument to the handler – making the handler know its location in
77
memory.
Previous Execution Output (In.History): While In.Event data are instantaneous user inter-
actions captured from sensors, the game needs the context involved in the execution progress.
We term this as In.History.
To understand the huge spread of sizes for In.History in Fig. 5.7a (600 bytes to 119 kB), we
next use the example in Fig. 5.7c. Here, a user playing some AR game has two options to walk
in. If it is an empty room, processing the camera feed will result in a plain surface to render the
AR objects on top. Owing to the simplicity, the input data is also relatively small. On the other
hand, if the room is cluttered with a lot of physical objects, the camera feed generates many
options for rendering the AR objects, making the input size larger. This user input-based data
size variation illustrates that this input cannot be found in static memory locations and, as seen
in Fig. 5.7a, In.History is consumed as input in 47% of the event processing.
External Sources (In.Extern): This is the data received from outside the scope of an appli-
cation execution. For example, data from the cloud, network, etc., are not within the scope of
the application executing inside the phone. We observe from Fig. 5.7a that In.Extern input is
only used in the ¡ 0.05% of the events, as most of the images/audio, etc. are read from external
sources only a limited number of times during execution and are stored in memory for future
(becomes In.History). Note that, the audio, images etc. are also huge in size and thus consume
1MB size of inputs in those instances of event processing.
To summarize, In.Event can be used to index into the lookup table because of their ubiquitous
occurrence (53%) in event processing and their fixed-size and fixed-location property. On the
other hand, In.History and In.Extern do not have a fixed size and also are not statically located
in the memory. Therefore, it is impractical for using them in lookup tables.
5.3.2 Shrinking the table using event data to lookup
Stemming from the previous characterization, we next study the effects of trimming the naive
lookup table by using only the input fields from In.Event categories for indexing the table. Since

78
0%
5%
10%
15%
20%
25%
30%
% Sizew.r.t.naïve
Lookuptable
%ExecutionCoverage
%Coverage
witherroneous
outputs
No
rma
lize
d V
alu
es
Out.Temp
Out.History
Out.Extern
(a)(b)Only 5% correct outputs
Figure 5.8: (a) Using only In.Event objects for input records, the AB Evolution game’s lookuptable characteristics show better size but has erroneous outputs; (b) The breakdown of erroneousoutputs.
this scheme only uses In.Event data to index into the lookup table, there is a chance that it can
lead to wrong outputs. For example, if a swipe up event is generated in the example in Fig. 5.1,
it may lead to increase in a user’s game score output only when the Pokemon object is displayed
(In.History category). When the object is not displayed, the swipe up event will not result in any
change. By considering only the swipe event (In.Event data) to index into the lookup table, and
not using the knowledge of whether a pokemon is being displayed or not (no In.History data),
the memoization may sometime lead to correct outputs and erroneous outputs some other times
as well.
To understand the impact of such a scheme on both execution coverage and erroneous out-
puts, we present the differences in employing In.Event based memoization with respect to the
naive lookup table approach in Fig. 5.8(a).
As seen, this scheme is clearly advantageous in terms of size of lookup table when compared
to the naive approach explored in Sec. 5.2, with just 1.5% (290 MB) of the original size (19GB
in Fig. 5.6) for short-circuiting 27% of the execution. This lookup table can easily fit in the
memory, and to short circuit the execution, we can just perform the lookup table indexing at the
software [289] to get all the outputs whenever an entry is found in the memoization table.
While this can help in improving the overall energy efficiency, this scheme can match more
than one possible outputs for 22% of the total execution. Since there is no way of knowing
which of these possible outputs is correct without additional input data, namely the In.History
and In.Extern inputs that are not known prior to execution, this scheme cannot be realized for

79
short-circuiting redundant events. Thus, the clear advantage of implementing a much smaller
lookup table by only indexing the In.Event data is not possible as it can result in erroneous
outputs.
Note that, similar to different input categories, outputs also belong to the categories below.
Fig. 5.7b shows that there are three categories of outputs:
• Out.Temp: Temporary responses from a game to the user such as a displayed frame
block, vibrate/haptic feedback etc., are categorized as Out.Temp. Even if this category of
outputs is short-circuited to a wrong output value, the execution itself does not get affected
except for the particular user reaction. This could still go unnoticed by the user and can
result in expected correct execution progress. Note in Fig. 5.7b that, these outputs are
usually ¡ 64 bytes in size. For example, there may be a tile in the displayed frame for the
user that is wrong due to an erroneous output from this In.Event based lookup table. Since
60 frames or higher [215, 216] are displayed per second in these devices, one frame’s tile
being wrong will have little to no impact on the user as well (displayed for ¡ 16ms – while
the user’s reaction time is ≈ 10×−20× slower [141]).
• The other two categories, Out.History and Out.Extern compliment the In.History and
In.Extern respectively, i.e., Out.History outputs are used as inputs in subsequent event
processing and Out.Extern are outputs sent to the cloud/network, etc. Therefore, if we
short-circuit either of the Out.History or Out.Extern outputs wrong, the execution it-
self risks becoming erroneous as these outputs are used subsequently as inputs to future
executions. Thus, as long as the erroneous results of this approach is not in these two out-
put categories, it could still be a useful tool for identifying and short-circuiting redundant
executions, albeit with wrong Out.Temp outputs.
Fig. 5.8(b) shows the breakdown of erroneous outputs produced as a result of this scheme and as
seen, 44% of the erroneous executions are Out.Temp, and so, even if it has errors, it will only lead
to minimal quality degradation to the user. On the other hand, the remaining 56% of erroneous
executions fall into the other two output categories (Out.History and Out.Extern) being wrong,

80
and so, the scheme cannot be realized as a viable approach to short-circuit redundant event
processing.
We next analyze how such erroneous executions can be avoided by augmenting this mecha-
nism to still take advantage of a relatively small lookup table.
5.4 Selecting Necessary InPuts (SNIP)
Motivated by the fact that ≈ 600 bytes of In.Event fields of the 1MB input data are enough
to short-circuit 14% of the execution, we further investigate whether there are other “influ-
ential” input fields from In.History and In.Extern categories that can help avoid erroneous
outputs or not?. Since there is no specific fixed location or fixed size known for these most-
influential/necessary input fields to identify, we actually need to search the mega bytes of inputs
that determine the correct outputs when short-circuiting executions. Therefore, finding neces-
sary input fields could involve much complex techniques such as scouring through gigabytes of
profile data. We next address this problem with our proposed SNIP approach.
5.4.1 Identifying necessary inputs
While dataflow analysis techniques such as [52, 118, 223, 260] traverse through the dataflow
graphs within a function or basic blocks and find the necessary inputs for every output, such
schemes do not scale well to analyze executions spanning multiple function calls, OS, and IP
invocations, that are a common occurrence in mobile game executions. Fortunately, scouring big
data to identify necessary fields are well known in the machine learning domain, where mature
techniques such as Permutation Feature Importance (PFI [49, 92]) have already been employed.
In the context of identifying necessary input fields, the PFI takes the lookup table described
in Sec. 5.2, and trims it down by identifying a subset of input fields that is most influential
in accurately short-circuiting the output fields. Towards achieving this, PFI searches through
different random permutations of input fields and measure the % output fields that resulted in
erroneous values. By repeating this process for different permutations of input fields, it identifies
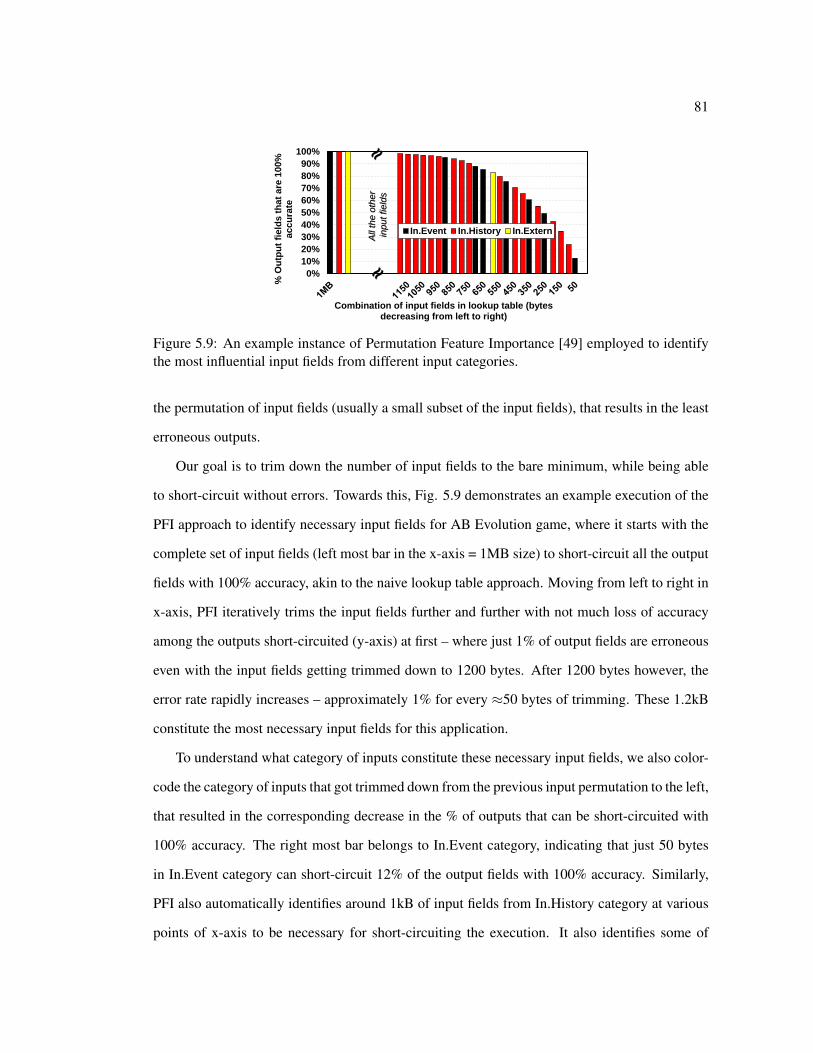
81
0%
10%
20%
30%
40%
50%
60%
70%
80%
90%
100%
% O
utp
ut
fie
lds
th
at
are
10
0%
a
cc
ura
te
Combination of input fields in lookup table (bytes decreasing from left to right)
In.Event In.History In.Extern
All
the o
ther
inp
utfie
lds
Figure 5.9: An example instance of Permutation Feature Importance [49] employed to identifythe most influential input fields from different input categories.
the permutation of input fields (usually a small subset of the input fields), that results in the least
erroneous outputs.
Our goal is to trim down the number of input fields to the bare minimum, while being able
to short-circuit without errors. Towards this, Fig. 5.9 demonstrates an example execution of the
PFI approach to identify necessary input fields for AB Evolution game, where it starts with the
complete set of input fields (left most bar in the x-axis = 1MB size) to short-circuit all the output
fields with 100% accuracy, akin to the naive lookup table approach. Moving from left to right in
x-axis, PFI iteratively trims the input fields further and further with not much loss of accuracy
among the outputs short-circuited (y-axis) at first – where just 1% of output fields are erroneous
even with the input fields getting trimmed down to 1200 bytes. After 1200 bytes however, the
error rate rapidly increases – approximately 1% for every ≈50 bytes of trimming. These 1.2kB
constitute the most necessary input fields for this application.
To understand what category of inputs constitute these necessary input fields, we also color-
code the category of inputs that got trimmed down from the previous input permutation to the left,
that resulted in the corresponding decrease in the % of outputs that can be short-circuited with
100% accuracy. The right most bar belongs to In.Event category, indicating that just 50 bytes
in In.Event category can short-circuit 12% of the output fields with 100% accuracy. Similarly,
PFI also automatically identifies around 1kB of input fields from In.History category at various
points of x-axis to be necessary for short-circuiting the execution. It also identifies some of
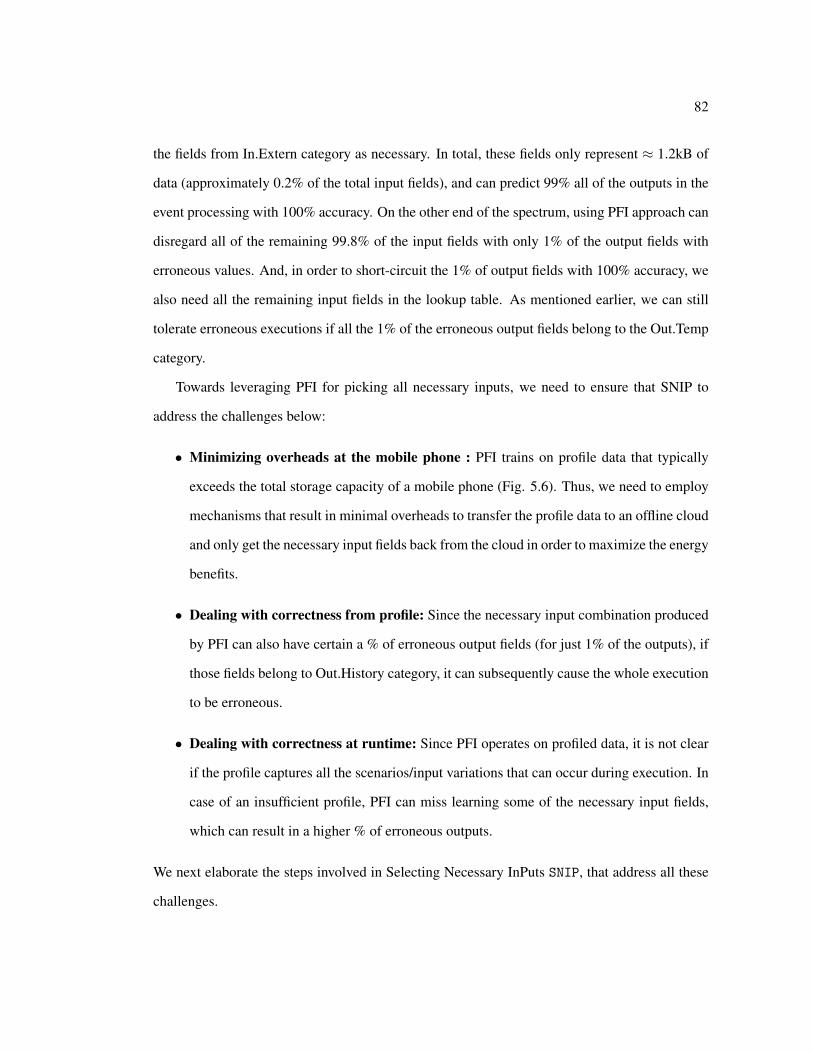
82
the fields from In.Extern category as necessary. In total, these fields only represent ≈ 1.2kB of
data (approximately 0.2% of the total input fields), and can predict 99% all of the outputs in the
event processing with 100% accuracy. On the other end of the spectrum, using PFI approach can
disregard all of the remaining 99.8% of the input fields with only 1% of the output fields with
erroneous values. And, in order to short-circuit the 1% of output fields with 100% accuracy, we
also need all the remaining input fields in the lookup table. As mentioned earlier, we can still
tolerate erroneous executions if all the 1% of the erroneous output fields belong to the Out.Temp
category.
Towards leveraging PFI for picking all necessary inputs, we need to ensure that SNIP to
address the challenges below:
• Minimizing overheads at the mobile phone : PFI trains on profile data that typically
exceeds the total storage capacity of a mobile phone (Fig. 5.6). Thus, we need to employ
mechanisms that result in minimal overheads to transfer the profile data to an offline cloud
and only get the necessary input fields back from the cloud in order to maximize the energy
benefits.
• Dealing with correctness from profile: Since the necessary input combination produced
by PFI can also have certain a % of erroneous output fields (for just 1% of the outputs), if
those fields belong to Out.History category, it can subsequently cause the whole execution
to be erroneous.
• Dealing with correctness at runtime: Since PFI operates on profiled data, it is not clear
if the profile captures all the scenarios/input variations that can occur during execution. In
case of an insufficient profile, PFI can miss learning some of the necessary input fields,
which can result in a higher % of erroneous outputs.
We next elaborate the steps involved in Selecting Necessary InPuts SNIP, that address all these
challenges.

83
Figure 5.10: Overall flow of the proposed methodology
5.4.2 Methodology
Fig. 5.10 shows the overall flow of the proposed methodology with the following steps:
Record and send events to cloud: The first step in SNIP is to record the different inputs and
outputs of event processing observed when the user is playing a game. This can be done either
during the rigorous testing phases involved in app development [9,11,20] or continuously when
users play the game. We describe the latter approach in Fig. 5.10. As recording the input-output
of event processing is data intensive (Fig. 5.6), SNIP records only the event inputs and send them
to the cloud. To do so, we instrument the Android HAL framework [114] to log all event data
sent to the app execution from the Binder threads [115], and dump them into a profile, which is
subsequently transferred to the cloud.
Run app on AOSP Emulator and build the profile: At the cloud, we use an offline profiler
based on the AOSP emulator setup [111, 112, 237] running the game app with input events from
the previous step in Fig. 5.10. In order to capture the input-output behavior accurately, the
recorded events are fed in the same manner as if the user is playing the game once again in
the emulator using additional tools such as [11, 112, 227]. During this emulation, we dump the
input and outputs consumed by the event processing (across various game execution threads) by
instrumenting the emulator to record memory traces [68,227] along with additional information
about the source of the data accesses (e.g., CPU instruction, IP, sensor hub, etc.).

84
PFI gets necessary inputs: Once the input-output data is available from the previous step,
SNIP runs the PFI technique on the profiled data to get the necessary input fields. To ensure
correctness during execution, SNIP allows two options:
Option 1: Developer intervention: This option is useful when PFI is applied on the testing
phase of app development, where the necessary input fields from PFI, can be fed back to the
app developers for further corrections as shown in Fig. 5.10. As seen, the necessary input fields
are mapped to the source code’s variables using the additional information tracked during the
above profile phase, and the app developers can fine tune the necessary inputs by adding more
necessary inputs and/or marking Out.Temp variables that can tolerate errors.
Option 2: Continuous learning: Instead of statically fixing the necessary inputs for an app
during the development stage, SNIP also facilitates continuous learning by just looping through
the initial steps (without developer intervention stage) by recording events, building the profile
and developing a PFI based lookup approach repeatedly when the user is playing the game. This
option is more generic than the developer intervention, as it allows to fix any short comings due
to insufficient profile data. We will demonstrate in Sec. 5.6 that this continuous learning can
effectively adapt and control the erroneous executions based on user behaviors.
Using the lookup table during execution: After the PFI based lookup table is built as men-
tioned above, it contains only the necessary inputs and is subsequently sent to the device as an
over-the-air update, along with additional code instrumentation as shown in Fig. 5.10. As seen,
the lookup table is loaded when the app is initialized as a hash table, that is indexed using the
event data. During execution, on any event, the lookup table is indexed with the event hash-code
and if hit, all the other necessary inputs are loaded and compared against the corresponding im-
portant input entries in the lookup table. If the comparisons lead to a match, the execution is
directly short-circuited. Else, the execution proceeds as usual with the event processing.
Thus, we can have a minimal overhead profile driven system in place that can adapt an
execution to tune towards a user’s game play and can potentially short-circuit all the redundant

85
event processing in turn. We next evaluate the benefits and overheads of SNIP, and compare the
benefits to the state of the art optimization strategies.
5.5 Experimental Setup
We next describe the experimental setup we use to study the different aspects of SNIP approach
in detail.
5.5.1 Game Workloads
We consider a mix of both open source and off the shelf games from Play store with a mix of
input data characteristics as described below, to study the effects of SNIP on a wide spectrum of
game workload execution behaviors. All these apps are consistently ranked as top games in Play
Store top charts [17].
Simple Touch based games: Simple In.Event based games such as Colorphun [270] and
Memory Game [162] involve the user to touch specific places on the display to score and make
forward progress. These games are also light on graphics and compute components, and mainly
use CPU and display for most of their execution.
Swipe based games: Games such as Candy Crush [21] and Greenwall [188] (open source
version Fruit Ninja [275] game) involve swipe as the major In.Event input, and also have more
animations in the game outputs compared to the simple touch based games. These games also
display more components on the screen compared to touch based games, with which the users
can interact, performs animated reactions, and more computations in each event processing as
well.
Multi In.Event games: AB Evolution or Angrybirds Evolution [75], Chase Whisply [286] and
Race Kings [99] games have much more complex In.Event objects involving drag, tilt, and multi-
touch events. Unlike the above four games, these games also use 3D rendering in the screen

86
with the GPU heavily involved to process the events, that involve heavy physics computations
[53, 85, 287]. In addition to other IPs, ChaseWhisply also uses the camera feed continuously to
render AR objects in it and display them to the user.
5.5.2 System Setup
All our studies and experiments are conducted in a Pixel XL class mobile device, that has a Qual-
comm Snapdragon 821 SoC [238] containing Quad-core Kryo CPUs, a 4 GB LPDDR4 memory
and a 32 GB internal storage, and is powered by a 3450 mAh battery. Using this hardware for
our experiments has two specific objectives, namely, (i) measure the energy consumption of the
different hardware components in the app execution; and (ii) record the event data during app
execution to subsequently send to cloud to follow the steps in Sec. 5.4. We next describe the
system setup to achieve the objectives.
Measuring the energy at hardware components: While there are multiple ways of measur-
ing energy at the hardware [14, 16, 239], we use Qualcomm’s Trepn power monitor app [239]
installed in the phone, that can tap into any process or the whole system execution to collect de-
tailed stats on battery consumption, CPU, memory, GPU, and other hardware usage. To record
individual components’ energy consumption, we deploy specific microbenchmark apps to use
only specific components, namely, CPU, CPU+memory, display, sensors, camera, audio and
video codecs and measure their power consumption using the Trepn app. With this system, any
game execution’s events recorded (using the process described next) can be plugged-in with the
power consumption of the different components to get a detailed time series view of what the
component consumed how much energy in the course of execution.
To compute the duration taken to drain a 100% charged battery, we also make use of the
above system to measure the game play’s power consumption behavior over a duration of ≈ 5-
10 minutes, to calculate how long the execution will take to consume 3450 mAh (100% battery
capacity).

87
Example Code Max CPU [86, 265, 266] Max IP [198] SNIPEventCPUFunc1() Yes No Short-circuitCPUFunc2() Yes No the wholeCPUFunck() Yes No executionIP1() No YesCPUFunck+1() Yes NoIP2() No Yes
Output
Table 5.1: Example Code in Games and what parts can be optimized by the prior works.
Recording the events in game execution: In order to record all the events occurring during
execution (as described in Sec. 5.4.2), we customize the Android OS to log all the event data
occurring in the execution. In our experiments, we connect the phone to an Android Debugger
[18] client and collect the event logs directly and use it for building the profile with the setup
described earlier. However, we envision that the system will be able to transfer the event logs to
cloud from any smartphone in the future. While capturing all the sensor activities and events are
straightforward (by instrumenting binder threads), capturing the camera feed is a special case
because of how the underlying hardware is built in modern SoCs [238]. For tracking camera
events, we run a screen record process that simultaneously record the camera feed into a video
file that are sent to the cloud for building the PFI. In the future, the screen record feature in
upcoming Android versions [30] can be leveraged to accomplish this across all apps. We next
use this experimental setup to study the effectiveness and drawbacks of SNIP.
5.6 Results
To evaluate the benefits from SNIP, we next list comparison points from prior works and best
case scenarios, that specifically test the different aspects of our proposal namely, optimizing only
the CPU part [86, 266, 289], optimizing only the IP part [198] and the lookup table overheads.
The schemes are:
•Max CPU: To study the effects of short-circuiting the CPU computations alone using prior
approaches such as [86,266] for game executions, and also understand the energy gap between
optimizing just for CPU execution (example in Table 5.1) vs optimizing the whole SoC in SNIP,
we present the Max CPU scheme. Note that, this scheme also assumes quantifies the maximum
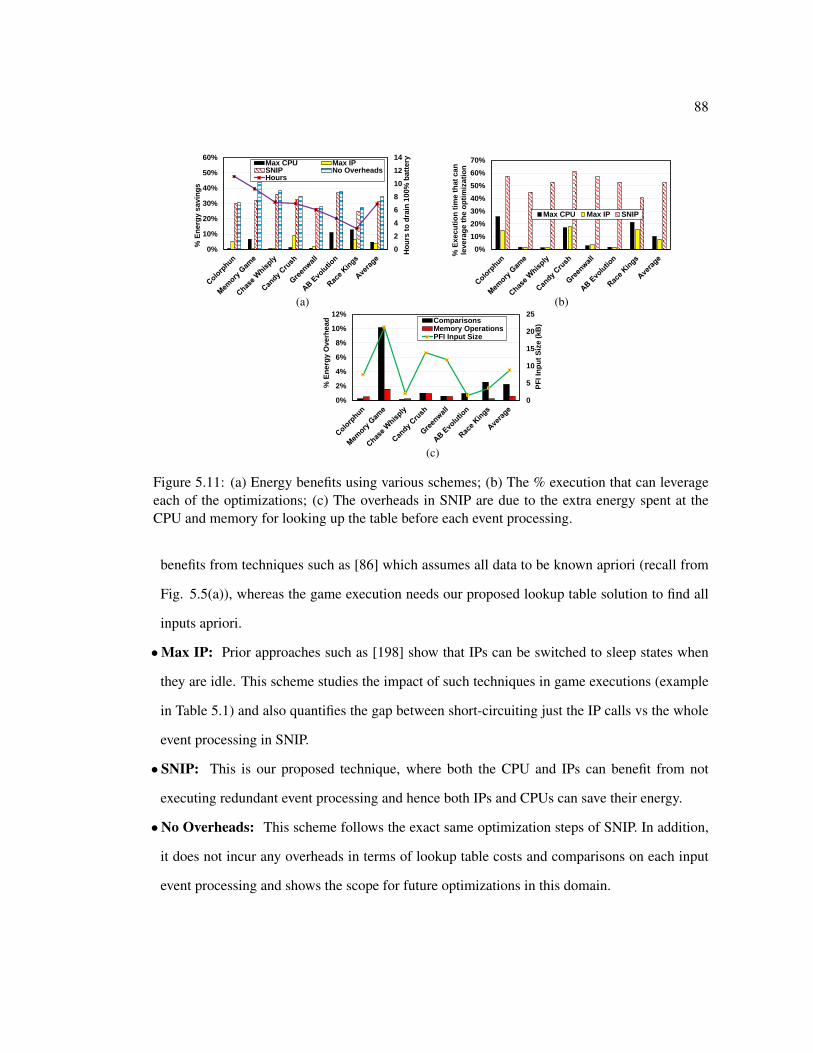
88
0
2
4
6
8
10
12
14
0%
10%
20%
30%
40%
50%
60%
Ho
urs
to
dra
in 1
00
% b
att
ery
% E
ne
rgy s
avin
gs
Max CPU Max IPSNIP No OverheadsHours
(a)
0%
10%
20%
30%
40%
50%
60%
70%
% E
xe
cu
tio
n t
ime
th
at
ca
n
leve
rag
e t
he
op
tim
iza
tio
n
Max CPU Max IP SNIP
(b)
0
5
10
15
20
25
0%
2%
4%
6%
8%
10%
12%
PF
I In
pu
t S
ize
(k
B)
% E
ne
rgy O
ve
rhe
ad Comparisons
Memory OperationsPFI Input Size
(c)
Figure 5.11: (a) Energy benefits using various schemes; (b) The % execution that can leverageeach of the optimizations; (c) The overheads in SNIP are due to the extra energy spent at theCPU and memory for looking up the table before each event processing.
benefits from techniques such as [86] which assumes all data to be known apriori (recall from
Fig. 5.5(a)), whereas the game execution needs our proposed lookup table solution to find all
inputs apriori.
•Max IP: Prior approaches such as [198] show that IPs can be switched to sleep states when
they are idle. This scheme studies the impact of such techniques in game executions (example
in Table 5.1) and also quantifies the gap between short-circuiting just the IP calls vs the whole
event processing in SNIP.
• SNIP: This is our proposed technique, where both the CPU and IPs can benefit from not
executing redundant event processing and hence both IPs and CPUs can save their energy.
•No Overheads: This scheme follows the exact same optimization steps of SNIP. In addition,
it does not incur any overheads in terms of lookup table costs and comparisons on each input
event processing and shows the scope for future optimizations in this domain.
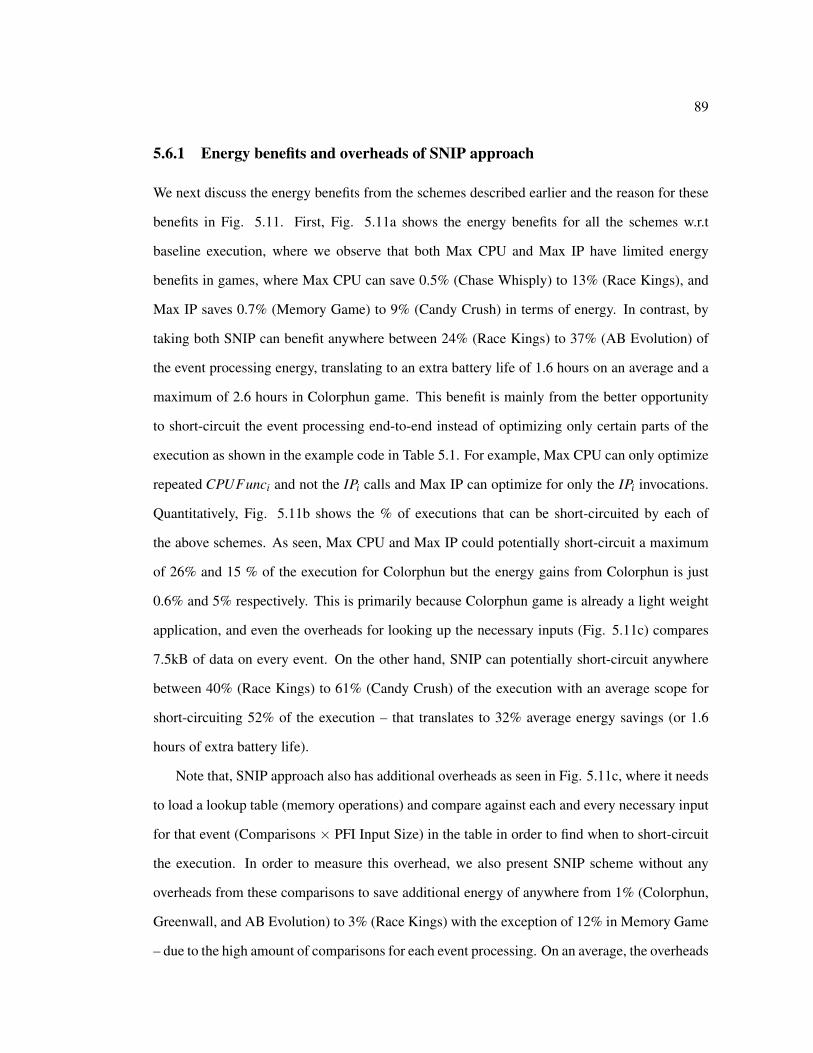
89
5.6.1 Energy benefits and overheads of SNIP approach
We next discuss the energy benefits from the schemes described earlier and the reason for these
benefits in Fig. 5.11. First, Fig. 5.11a shows the energy benefits for all the schemes w.r.t
baseline execution, where we observe that both Max CPU and Max IP have limited energy
benefits in games, where Max CPU can save 0.5% (Chase Whisply) to 13% (Race Kings), and
Max IP saves 0.7% (Memory Game) to 9% (Candy Crush) in terms of energy. In contrast, by
taking both SNIP can benefit anywhere between 24% (Race Kings) to 37% (AB Evolution) of
the event processing energy, translating to an extra battery life of 1.6 hours on an average and a
maximum of 2.6 hours in Colorphun game. This benefit is mainly from the better opportunity
to short-circuit the event processing end-to-end instead of optimizing only certain parts of the
execution as shown in the example code in Table 5.1. For example, Max CPU can only optimize
repeated CPUFunci and not the IPi calls and Max IP can optimize for only the IPi invocations.
Quantitatively, Fig. 5.11b shows the % of executions that can be short-circuited by each of
the above schemes. As seen, Max CPU and Max IP could potentially short-circuit a maximum
of 26% and 15 % of the execution for Colorphun but the energy gains from Colorphun is just
0.6% and 5% respectively. This is primarily because Colorphun game is already a light weight
application, and even the overheads for looking up the necessary inputs (Fig. 5.11c) compares
7.5kB of data on every event. On the other hand, SNIP can potentially short-circuit anywhere
between 40% (Race Kings) to 61% (Candy Crush) of the execution with an average scope for
short-circuiting 52% of the execution – that translates to 32% average energy savings (or 1.6
hours of extra battery life).
Note that, SNIP approach also has additional overheads as seen in Fig. 5.11c, where it needs
to load a lookup table (memory operations) and compare against each and every necessary input
for that event (Comparisons × PFI Input Size) in the table in order to find when to short-circuit
the execution. In order to measure this overhead, we also present SNIP scheme without any
overheads from these comparisons to save additional energy of anywhere from 1% (Colorphun,
Greenwall, and AB Evolution) to 3% (Race Kings) with the exception of 12% in Memory Game
– due to the high amount of comparisons for each event processing. On an average, the overheads
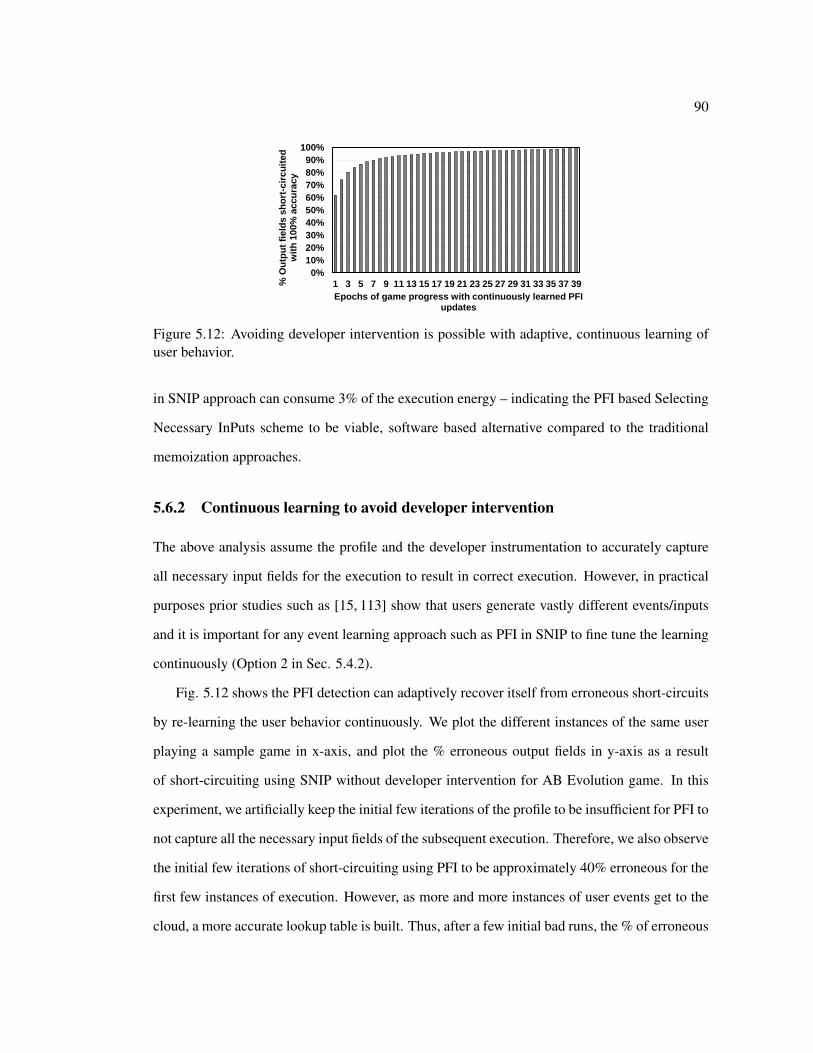
90
0%
10%
20%
30%
40%
50%
60%
70%
80%
90%
100%
1 3 5 7 9 11 13 15 17 19 21 23 25 27 29 31 33 35 37 39% O
utp
ut
fie
lds
sh
ort
-cir
cu
ite
d
wit
h 1
00
% a
cc
ura
cy
Epochs of game progress with continuously learned PFI updates
Figure 5.12: Avoiding developer intervention is possible with adaptive, continuous learning ofuser behavior.
in SNIP approach can consume 3% of the execution energy – indicating the PFI based Selecting
Necessary InPuts scheme to be viable, software based alternative compared to the traditional
memoization approaches.
5.6.2 Continuous learning to avoid developer intervention
The above analysis assume the profile and the developer instrumentation to accurately capture
all necessary input fields for the execution to result in correct execution. However, in practical
purposes prior studies such as [15, 113] show that users generate vastly different events/inputs
and it is important for any event learning approach such as PFI in SNIP to fine tune the learning
continuously (Option 2 in Sec. 5.4.2).
Fig. 5.12 shows the PFI detection can adaptively recover itself from erroneous short-circuits
by re-learning the user behavior continuously. We plot the different instances of the same user
playing a sample game in x-axis, and plot the % erroneous output fields in y-axis as a result
of short-circuiting using SNIP without developer intervention for AB Evolution game. In this
experiment, we artificially keep the initial few iterations of the profile to be insufficient for PFI to
not capture all the necessary input fields of the subsequent execution. Therefore, we also observe
the initial few iterations of short-circuiting using PFI to be approximately 40% erroneous for the
first few instances of execution. However, as more and more instances of user events get to the
cloud, a more accurate lookup table is built. Thus, after a few initial bad runs, the % of erroneous
91
output fields get to ¡ 0.1% in just 40 training epochs.
Thus, to avoid developer intervention (option 1), the profiler at the cloud can train the PFI
model and test on subsequent event records from the user till a confidence threshold is reached.
By doing so, the user will only start experiencing PFI based short-circuiting when the % of
erroneous output fields is negligible. As a future extension, the profiler can also direct the mobile
phone to “clear” the PFI lookup table if it detects the error rate to worsen (although not observed
in our experiments).
5.7 Related Work
We next discuss the related works to SNIP in three categories:
5.7.1 Memoization
Prior works such as [36, 72, 117, 180, 265, 266, 311] have built look up tables (both in hardware
and software) for short-circuiting such repeated computations in the CPU execution contexts for
scientific workloads. For example, [36,96,223,265] use hardware table to short circuit data flow
graphs based on register information, [51, 82, 289] uses a software based compiler and runtime
memoization engine, [86] replaces frequently executed hot codes with a trained CNN engine to
approximately short circuit the execution. However, as the example code in Table 5.1 illustrates,
these prior works cannot be directly adopted to fully exploit short-circuit the end to end execution
from event generation and all the nested function calls crossing app/OS/IP invocations occurring
in a mobile game execution.
5.7.2 Mobile SoC Optimizations
In mobile SoC, many prior works such as [48, 55, 125, 173, 198, 199, 226, 316, 317] target op-
timizations towards a single component such as CPU [47, 134, 140, 235, 316], video codecs
[124, 136, 138], sensors [221], interconnects [199], memory [123], neural/vision processing
[58, 66, 71, 84, 133, 174, 225] and battery [8, 12, 33, 169, 175], and while considering the whole
92
SoC, works such as [168] aim to meet the QoS requirements of frame based apps by reorganiz-
ing the IP scheduling. The most related work to our proposal is [198] where individual IPs are
aggressively switched to sleep states when they are idle, to save energy. While SNIP also aims
to conserve energy of the whole SoC, it creates more opportunities by exploiting the significant
occurrences of redundant event processing in game workloads and snips the computation to get
the outputs directly.
5.7.3 ML based Optimizations
ML is emerging as a useful tool to optimize different parts of the system such as prefetchers
[35, 42, 127, 229], branch predictors [145], approximating executions [86], resource allocation
[194], and scheduling [8, 12] in the recent years. Particularly techniques such as [8, 12, 15, 113]
are already implemented in mobile phones, and they focus on better user interactions, manage
the battery as per user behavior, etc. by training appropriate ML models for them. However,
Android battery optimization techniques such as [8, 12] are not domain specific and just learn
to suspend/kill idle threads in the whole system. SNIP exploits the huge volume of redundant
events in these games to bring additional gains on top of the existing energy savings from the
Android battery optimization techniques.
5.8 Chapter Summary
Although gaming is a widely popular domain of applications in mobile phones, these applica-
tions drain the battery much faster than many other classes of applications. This is primarily
because of the user-driven interactive mode of operation, where the generated events continu-
ously stress the SoC. In this paper, we propose a software solution, called SNIP, to minimize
the energy consumption by exploiting the repetitive nature of inputs and outputs. While mem-
oization can identify and short-circuit redundant events, the event processing involves multiple
function calls spanning to even OS and IP invocations and hence, the lookup table size becomes
prohibitively large. Our proposed solution SNIP uses a machine learning technique on the execu-

93
tion profile, to trim down the lookup table size by keeping only a small subset of necessary inputs
needed to generate correct outputs. The complete SNIP design consists of a lightweight event
tracker at the smartphone, a cloud based offline profiler, a Permutation Feature Importance (PFI)
module to trim down the lookup table size, and subsequent compiler based code instrumentation
to leverage the PFI lookup table during execution. We have implemented and evaluated SNIP
approach on a Pixel XL phone and observe that we can save 32% energy in 7 popular games
while being almost completely error free.

Chapter 6OppoRel: Opportunistic Relayout for
data exchanges between CPU and
GPU in the cloud
Recall from Chapter 1 that user-interactive applications exploit the compute power from both
mobile/edge devices and cloud servers. While the prior chapters optimized both the CPU and
IO in the edge side execution, this chapter aims to optimize for the same user interactive app
execution’s cloud counterpart. For example, a Google Maps execution at the edge frequently
requests the cloud servers for finding new routes, traffic updates, etc., that triggers applications
such as BFS, k-nearest neighbors, single source shortest path, etc. As this execution also account
for a significant portion of the user-interactive app execution’s time (Fig. 1.2), we optimize for
the server side execution next.
At the cloud servers processing user interactive applications Data accesses and transfers
constitute a significant overhead in parallel systems where computing engines have to share data.
This is a long recognized problem [1, 163, 168] in the context of homogeneous multiprocessors
[143,149] where similar processors access shared data under a data parallel programming model
[120, 121, 217] with relatively similar access patterns. Such a model partitions the work and the
95
corresponding data assuming a homogeneous set of compute engines. However, as we evolve
into the accelerator era, where compute engines have specialized capabilities, it is important to
re-visit the same problem in the heterogeneous context - data accesses and transfers between the
main CPU and the specialized accelerator. These two heterogeneous entities may fundamentally
differ, using a functional parallelism model, in what data they access and how they access it.
This can result in inefficient data transfers between the two and ineffective use of the available
memory space. Focusing on the growingly popular CPU-GPU heterogeneous systems, this work
looks to architect how data should be re-laid out for the latter to access what is provided by the
former, to efficiently transfer and make maximal use of the limited GPU memory. To tackle this
problem, we propose OppoRel, a purely software-based solution, that opportunistically uses any
available spare CPU cycles to relayout the data in host memory so that only data that is actually
used by the GPU will be transferred and stored in its memory.
It is relatively easy today to plug in one or more high-end GPU cards into server PCI slots
to build accelerator-based heterogeneous systems. Such CPU-GPU systems are becoming om-
nipresent in numerous personal and datacenter environments - gaming, finance, graphics, visu-
alization, big data analytics and other HPC applications. The main CPU, despite having several
cores, offloads GPU-conducive kernels to the GPU to avail the thousands of cores on the lat-
ter. It uses interfaces like CUDA [213], OpenCL [121], etc., with the main (host) memory
serving as the conduit to pass along the data to be processed by the GPU. Unlike conventional
multiprocessors, despite sharing memory through mechanisms such as Unified Virtual Memory
(UVM) [248], there is no cache coherence across these diverse engines in today’s hardware. Fur-
ther, in current systems, GPUs typically need to DMA-in the data to their local memory, from
the host, before they can work on it. These hardware inefficiencies, can eat into the speedups
offered by the high degrees of parallelism offered by the GPUs.
Apart from these hardware differences from their multiprocessor counterparts, there are soft-
ware inefficiencies arising due to the differential access patterns for the same data on CPU-GPU
systems. For instance, Figure 6.1 shows the accesses to the same page in the QTClustering ap-
plication by both the CPU and the GPU before it gets evicted. Such access pattern differences

96
GPU AccessCPU Access
Used before 1st eviction
Used before 2nd eviction
Used before 3rd eviction
Figure 6.1: Differences in access to the same page from CPU and GPU cores before evictionin QTClustering [80] benchmark. Despite sparsity in the page access by GPU, all its bytes gettransferred and stored in GPU memory.
can lead to redundant data transfers (not the entire page may be useful). Equally important is the
precious space in GPU memory - we need to ensure that we retain only the useful data in each
page and avoid any wastage.
Such differences in how the data is laid out in host memory and how the GPU threads access
this data can lead to significant overheads in data transfers and subsequent data accesses. There
is no fall-back hardware cache-coherent data transfer mechanism (available on homogeneous
multiprocessors) whose finer granularity of transfers can hide this software mismatch. While
there is a considerable amount of prior work on dealing with memory organizations and data
layouts within GPU memory itself (e.g. [62, 87, 151, 203, 256]), optimizing data transfers and
accesses between host and GPU memory, which can lead to as much as 85% slowdown, is still
very much in its infancy. This problem is likely to become even more important as thread counts
on GPUs increase, and the number of GPUs on a single server grows.
Recognizing the importance of supporting sharing between the host and GPU memories,
there have been recent efforts on a shared Unified Virtual Memory model (UVM) [248] between
the two, with pages migrated between them for locality. It does adhere to page granularity access
control, allowing conventional TLB and address translation mechanisms for data accesses. How-
ever, UVM does not preclude non-useful data in the pages being moved, still wasting transfer
bandwidth and valuable GPU memory space. Recent proposals (e.g. [126,233]), more generally

97
in the context of accelerators, have argued for completely doing away with address translation
(i.e. virtual and physical address are the same) and having cache level transfers between the two.
Another recent study [28] has proposed hardware-based dynamic adjustment of the granularity
of data transfer between the two. While finer granularity of transfers (on demand) can save trans-
fer bandwidth, it still needs sophisticated address translation mechanisms to not devote space for
“non-useful data” within the pages brought to GPU memory. Further, the higher set up costs to
initiate the data transfer (say by programming a DMA engine) in the context of current CPU-
GPU systems may mandate a higher granularity of data transfer to amortize these set up costs.
Finally, all these proposals require additional hardware and cannot be directly implemented on
existing off-the-shelf GPU cards.
Based on these observations, we identify the following motivation-derived requirements
from our system:
•Motivation: CPU and GPU may have very different access patterns, where even if the data that
is useful to the former is laid out contiguously, it may be interspersed with useless data for the
latter.
Requirement: We need to selectively transfer only useful data, avoiding useless data, to save on
transfer bandwidth and GPU memory capacity;
•Motivation: Hardware selectivity in data transfer typically only optimizes for the data transfer
cost, and not necessarily for the GPU memory capacity. Optimizing for the latter requires
sophisticated access control and address translation mechanisms (not necessarily at page level).
We look for solutions readily implementable on current hardware.
Requirement: We need software solutions that examine data access patterns of both CPU and
GPU to pick and pack the data in host memory to move only useful data on subsequent demand
(page) misses from the GPU. The existing hardware mechanisms would then suffice to avoid
useless transfers and ensuring full utilization of GPU memory.
•Motivation: Such software relayout should not burden programming complexity. Also, the
associated overheads can overwhelm the savings we provide in data transfer costs and lower
capacity misses.

98
Requirement: We require automated code insertion by the compiler to avoid burdening the
programmer. We need opportunities for finding spare bandwidth (main CPU cycles) when such
relayout can be done so that it does not get into the critical path of the execution.
With these requirements, we propose OppoRel, an opportunistic software-based data relay-
out mechanism for current and future CPU-GPU systems. OppoRel implements a compiler pass
in LLVM [177] and Clang++ [178] version 7 with CUDA support [300] for off-the-shelf CPU-
GPU applications that examines the memory accesses of the main CPU cores and the offloaded
GPU kernels to pick-and-pack data into contiguous segments that will be needed by the latter
after the last access to them from the main CPU is done. The addresses for the GPU kernels are
also fixed to ensure resolution to offsets within these new segments so that existing hardware
based page level address translation mechanisms suffice to bring them to GPU memory. As a
result, only useful data is transferred and resides in GPU memory.
A key feature of OppoRel is in doing the relayout only when there is ”opportunistic” spare
bandwidth on the host CPU. When offloading computation, the host CPU core is often waiting
for results from the GPU. We try to leverage such waiting periods of prior kernels to perform
data layout of future kernels, with the ability to stretch even into the execution of the required
kernel until its data is actually required. Further, servers today have several main CPU cores,
not all of which may be serving this (or other) applications(s) (the data center under-utilization
problem has been often pointed out [38, 119, 206]). The relayout option is also well suited to
be performed in parallel by all these cores to further reduce the overhead. Since this is a pure
software technique, one could always turn this feature off, if the overheads start overwhelming
the intended savings - hence termed opportunistic.
Using several CPU-GPU applications from Rodinia [61], SHOC [79] and Polybench [234]
suites that capture a spectrum of GPU capacity misses and opportunities for hiding the relayout
costs, we show the following results on real hardware (and simulations where we study sensitiv-
ity):
• In applications where there is significant GPU capacity misses, and opportunities for hiding
nearly all of the overheads, OppoRel provides as much as 61% speedup over the baseline. On
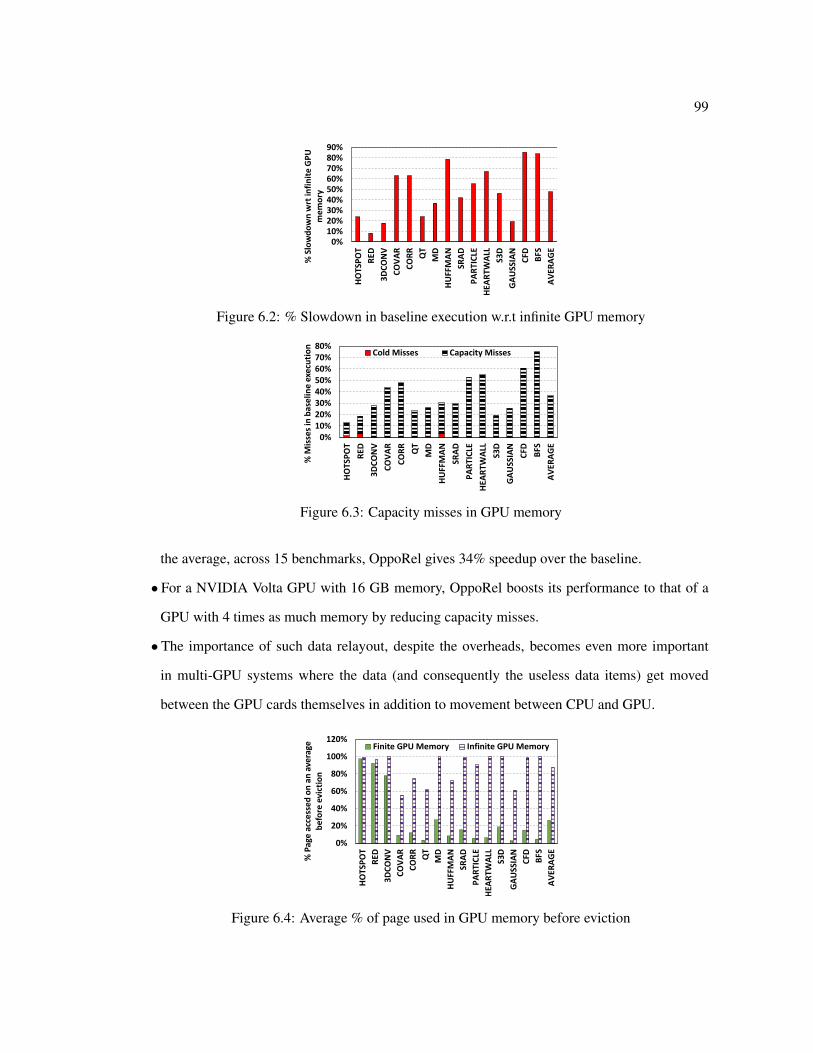
99
0%10%20%30%40%50%60%70%80%90%
HO
TSP
OT
RED
3D
CO
NV
CO
VA
R
CO
RR
QT
MD
HU
FFM
AN
SRA
D
PA
RTI
CLE
HEA
RTW
ALL
S3D
GA
USS
IAN
CFD BFS
AV
ERA
GE
% S
low
do
wn
wrt
infi
nit
e G
PU
m
em
ory
Figure 6.2: % Slowdown in baseline execution w.r.t infinite GPU memory
0%10%20%30%40%50%60%70%80%
HO
TSP
OT
RED
3D
CO
NV
CO
VA
R
CO
RR
QT
MD
HU
FFM
AN
SRA
D
PA
RTI
CLE
HEA
RTW
ALL
S3D
GA
USS
IAN
CFD BFS
AV
ERA
GE
% M
isse
s in
bas
elin
e e
xecu
tio
n
Cold Misses Capacity Misses
Figure 6.3: Capacity misses in GPU memory
the average, across 15 benchmarks, OppoRel gives 34% speedup over the baseline.
• For a NVIDIA Volta GPU with 16 GB memory, OppoRel boosts its performance to that of a
GPU with 4 times as much memory by reducing capacity misses.
• The importance of such data relayout, despite the overheads, becomes even more important
in multi-GPU systems where the data (and consequently the useless data items) get moved
between the GPU cards themselves in addition to movement between CPU and GPU.
0%
20%
40%
60%
80%
100%
120%
HO
TSP
OT
RED
3D
CO
NV
CO
VA
R
CO
RR
QT
MD
HU
FFM
AN
SRA
D
PA
RTI
CLE
HEA
RTW
ALL
S3D
GA
USS
IAN
CFD BFS
AV
ERA
GE
% P
age
acc
ess
ed
on
an
ave
rage
b
efo
re e
vict
ion
Finite GPU Memory Infinite GPU Memory
Figure 6.4: Average % of page used in GPU memory before eviction
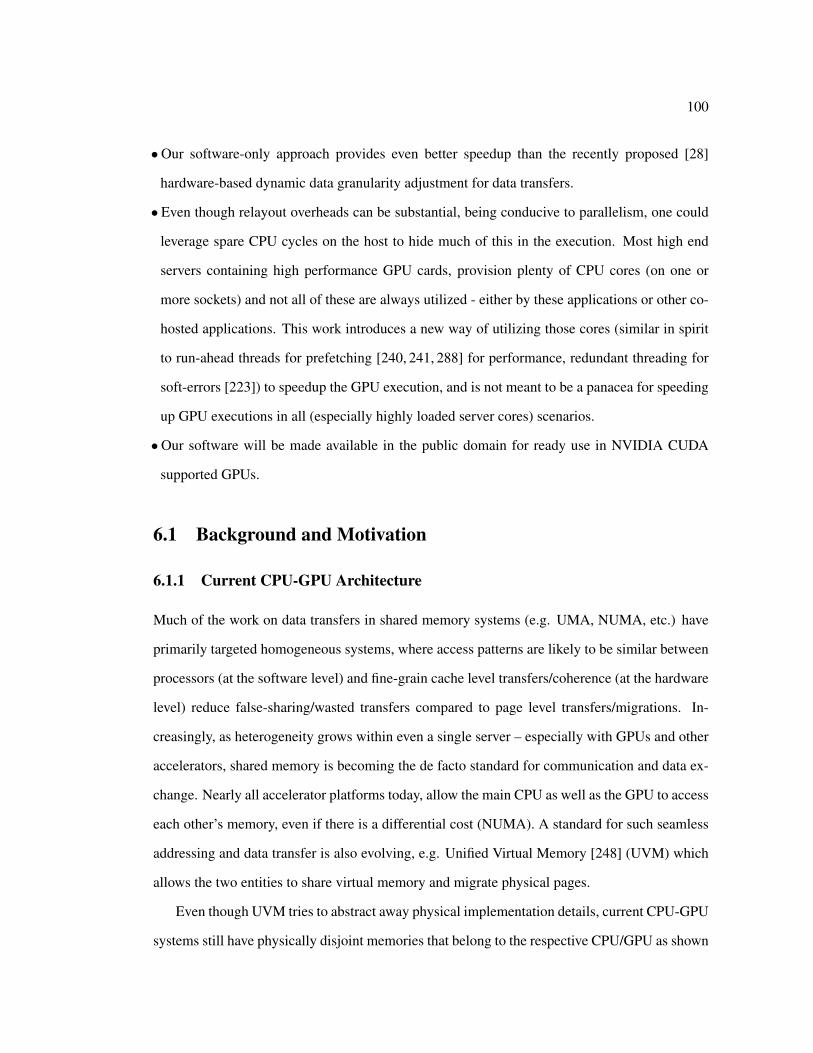
100
•Our software-only approach provides even better speedup than the recently proposed [28]
hardware-based dynamic data granularity adjustment for data transfers.
• Even though relayout overheads can be substantial, being conducive to parallelism, one could
leverage spare CPU cycles on the host to hide much of this in the execution. Most high end
servers containing high performance GPU cards, provision plenty of CPU cores (on one or
more sockets) and not all of these are always utilized - either by these applications or other co-
hosted applications. This work introduces a new way of utilizing those cores (similar in spirit
to run-ahead threads for prefetching [240, 241, 288] for performance, redundant threading for
soft-errors [223]) to speedup the GPU execution, and is not meant to be a panacea for speeding
up GPU executions in all (especially highly loaded server cores) scenarios.
•Our software will be made available in the public domain for ready use in NVIDIA CUDA
supported GPUs.
6.1 Background and Motivation
6.1.1 Current CPU-GPU Architecture
Much of the work on data transfers in shared memory systems (e.g. UMA, NUMA, etc.) have
primarily targeted homogeneous systems, where access patterns are likely to be similar between
processors (at the software level) and fine-grain cache level transfers/coherence (at the hardware
level) reduce false-sharing/wasted transfers compared to page level transfers/migrations. In-
creasingly, as heterogeneity grows within even a single server – especially with GPUs and other
accelerators, shared memory is becoming the de facto standard for communication and data ex-
change. Nearly all accelerator platforms today, allow the main CPU as well as the GPU to access
each other’s memory, even if there is a differential cost (NUMA). A standard for such seamless
addressing and data transfer is also evolving, e.g. Unified Virtual Memory [248] (UVM) which
allows the two entities to share virtual memory and migrate physical pages.
Even though UVM tries to abstract away physical implementation details, current CPU-GPU
systems still have physically disjoint memories that belong to the respective CPU/GPU as shown
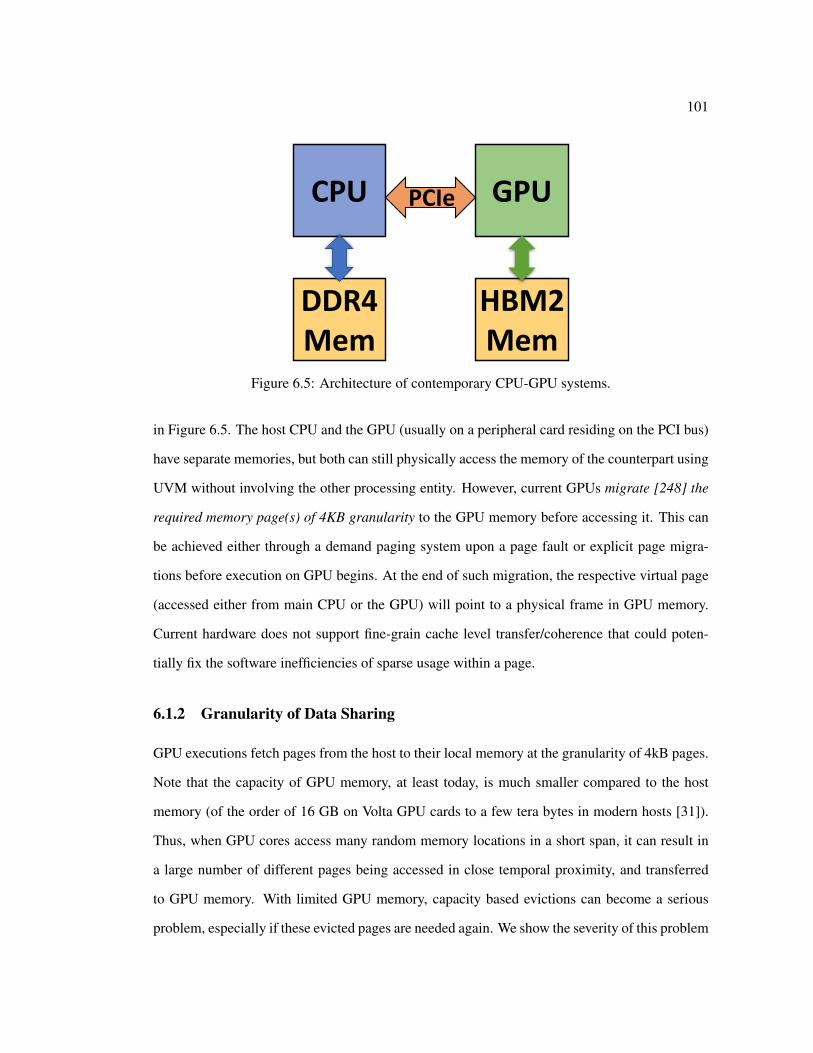
101
CPU GPU
DDR4Mem
PCIe
HBM2Mem
Figure 6.5: Architecture of contemporary CPU-GPU systems.
in Figure 6.5. The host CPU and the GPU (usually on a peripheral card residing on the PCI bus)
have separate memories, but both can still physically access the memory of the counterpart using
UVM without involving the other processing entity. However, current GPUs migrate [248] the
required memory page(s) of 4KB granularity to the GPU memory before accessing it. This can
be achieved either through a demand paging system upon a page fault or explicit page migra-
tions before execution on GPU begins. At the end of such migration, the respective virtual page
(accessed either from main CPU or the GPU) will point to a physical frame in GPU memory.
Current hardware does not support fine-grain cache level transfer/coherence that could poten-
tially fix the software inefficiencies of sparse usage within a page.
6.1.2 Granularity of Data Sharing
GPU executions fetch pages from the host to their local memory at the granularity of 4kB pages.
Note that the capacity of GPU memory, at least today, is much smaller compared to the host
memory (of the order of 16 GB on Volta GPU cards to a few tera bytes in modern hosts [31]).
Thus, when GPU cores access many random memory locations in a short span, it can result in
a large number of different pages being accessed in close temporal proximity, and transferred
to GPU memory. With limited GPU memory, capacity based evictions can become a serious
problem, especially if these evicted pages are needed again. We show the severity of this problem

102
by plotting the performance degradation of a number of GPU workloads with a finite 16GB
memory normalized to their execution on a hypothetical system that has infinite GPU memory
capacity in Figure 6.2. We see that the limited memory capacity leads to a very significant
performance degradation - as high as 85% in CFD, with an average degradation of 48% across
these 15 GPU applications. This is because, as Figure 6.3 shows, the capacity misses (due to
subsequent reuse), overshadows the cold misses for initial transfer of data to GPU memory.
This makes it imperative to derive the maximum utilization out of what is resident in GPU
memory. When a page is fetched, there is a presumption that every byte of this page will be
accessed - which we call as the percentage utilization of the page. However, as Figure 6.4 shows,
in all these applications, only a small fraction is used - 27% on the average. In fact, in some apps
such as GAUSSIAN, BFS, etc., the utilization is as low as 3-5% (see the bars for Finite capacity)
even if a lot higher fraction is accessed across the entire execution (Infinite Capacity bars). As a
result, despite the limited GPU memory capacity, we are not efficiently utilizing this space.
6.1.3 Can this be fixed by modulating the transfer granularity?
One way of addressing this utilization problem is by selectively transferring only bytes that
will be accessed by the GPU cores. We could make transfer sizes as small as single words (on
demand) to ensure 100% utilization. However, we will not be exploiting any spatial locality and
the cost of setting up the transfer (e.g. DMA set up, address translation costs) will dominate
the execution. At the other extreme, setting page sizes to several MBs (e.g. superpaging) will
worsen memory space utilization. To evaluate the trade-offs, we vary transfer granularities from
as small as single cache blocks (128 bytes) to as large as 1MB, and plot the resulting performance
(normalized to the current 4K page size default transfer granularity) in Figure 6.6 - averaged
across all applications.
The results confirm our intuitive rationale that at small transfer granularities - smaller than
the default 4K page - even though most of the transfers (and space in GPU memory) is for
useful data, the overheads of frequently performing transfers - costs for figuring out the physical
location on the host memory (address translation), costs for setting up DMA, etc. - dominate
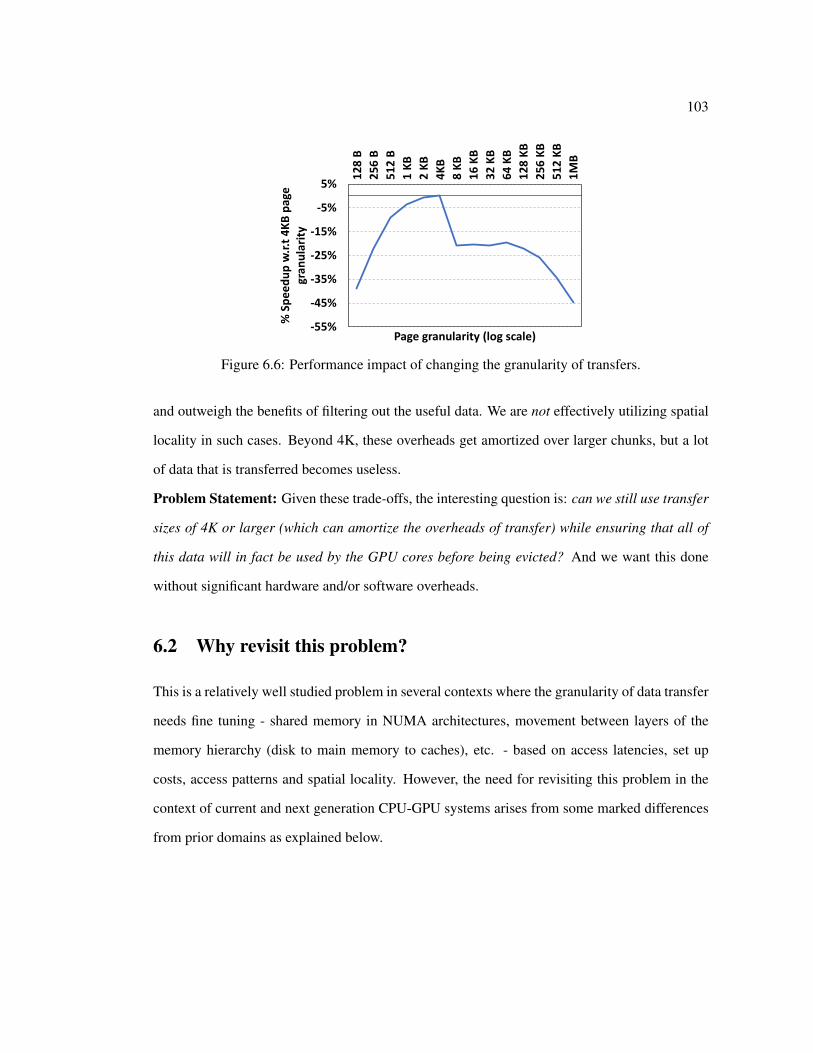
103
-55%
-45%
-35%
-25%
-15%
-5%
5%
12
8 B
25
6 B
51
2 B
1 K
B
2 K
B
4K
B
8 K
B
16
KB
32
KB
64
KB
12
8 K
B
25
6 K
B
51
2 K
B
1M
B
% S
pe
ed
up
w.r
.t 4
KB
pag
e
gran
ula
rity
Page granularity (log scale)
Figure 6.6: Performance impact of changing the granularity of transfers.
and outweigh the benefits of filtering out the useful data. We are not effectively utilizing spatial
locality in such cases. Beyond 4K, these overheads get amortized over larger chunks, but a lot
of data that is transferred becomes useless.
Problem Statement: Given these trade-offs, the interesting question is: can we still use transfer
sizes of 4K or larger (which can amortize the overheads of transfer) while ensuring that all of
this data will in fact be used by the GPU cores before being evicted? And we want this done
without significant hardware and/or software overheads.
6.2 Why revisit this problem?
This is a relatively well studied problem in several contexts where the granularity of data transfer
needs fine tuning - shared memory in NUMA architectures, movement between layers of the
memory hierarchy (disk to main memory to caches), etc. - based on access latencies, set up
costs, access patterns and spatial locality. However, the need for revisiting this problem in the
context of current and next generation CPU-GPU systems arises from some marked differences
from prior domains as explained below.

104
6.2.1 Hardware differences
Whether it be data movement between secondary storage and processor caches or between mul-
tiple processors, even if access control and translation mechanisms are done at large granularity
(such as a 4K page), they still allow fine grain of movement within this large granularity to avoid
some of the problems. For instance, multiprocessors on NUMA systems employ cache-coherent
transfers, where only those cache blocks that miss are fetched on demand. Hence, if some blocks
within a page are not needed, they will not be unnecessarily moved. So also when fetching data
from disk - though the page itself is brought into main memory at a 4K granularity, only selective
cache blocks within this page are placed in processor caches on demand.
However, contemporary CPU-GPU systems, owing to heterogeneity in terms of their com-
putational capabilities, do not support cache coherence between the main CPU cores and the
GPU cores even if mechanisms such as UVM support a shared address space at page granularity.
When any location within a page misses on the GPU, the entire page has to be copied from host
memory even if not all of it will be accessed. This requires careful analysis to identify what
exactly will be needed before performing transfers. This problem is exacerbated with GPUs run-
ning thousands of threads in SIMT fashion. If one thread misses, it is quite likely that another
thread will also miss (because of the data parallel programming model and the high degrees of
parallelism would automatically spread out the accesses across multiple pages). This creates a
burst of transfers being requested from GPU cores at the same time, rather than being evenly
spaced out during execution, resulting in high contention for the shared transfer fabric (buses,
DMAs, memory controllers, etc.) As a result, it is all the more important to ensure that what is
being transferred during this high burst period is useful, and possibly combine multiple transfers
initiated by different GPU cores as a single coalesced transfer for better efficiency.
6.2.2 Application differences
Access patterns of many GPU kernels are different from conventional spatial locality found in
several conventional parallel applications. Consider the piece of GPU code from the QTClus-
tering application in the SHOC benchmark suite [79] in Figure 6.7. This code is executed in
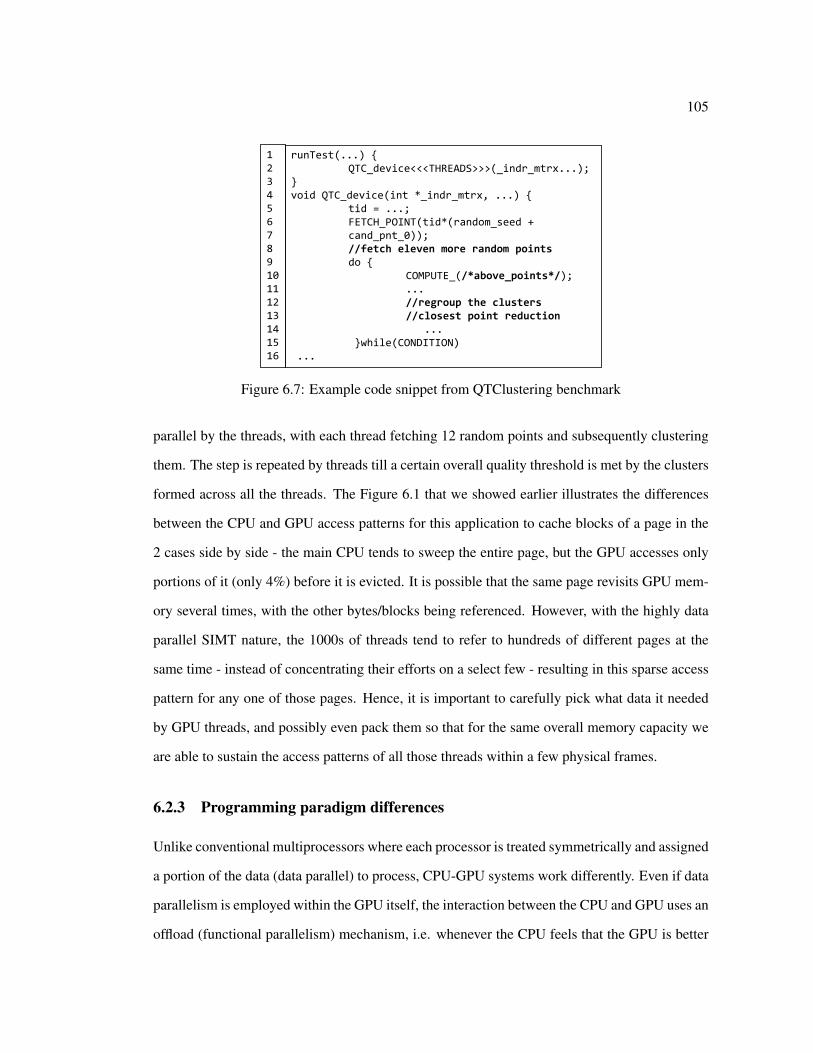
105
runTest(...) {QTC_device<<<THREADS>>>(_indr_mtrx...);
}void QTC_device(int *_indr_mtrx, ...) {
tid = ...;FETCH_POINT(tid*(random_seed + cand_pnt_0));//fetch eleven more random pointsdo {
COMPUTE_(/*above_points*/);...//regroup the clusters//closest point reduction
...}while(CONDITION)
...
12345678910111213141516
Figure 6.7: Example code snippet from QTClustering benchmark
parallel by the threads, with each thread fetching 12 random points and subsequently clustering
them. The step is repeated by threads till a certain overall quality threshold is met by the clusters
formed across all the threads. The Figure 6.1 that we showed earlier illustrates the differences
between the CPU and GPU access patterns for this application to cache blocks of a page in the
2 cases side by side - the main CPU tends to sweep the entire page, but the GPU accesses only
portions of it (only 4%) before it is evicted. It is possible that the same page revisits GPU mem-
ory several times, with the other bytes/blocks being referenced. However, with the highly data
parallel SIMT nature, the 1000s of threads tend to refer to hundreds of different pages at the
same time - instead of concentrating their efforts on a select few - resulting in this sparse access
pattern for any one of those pages. Hence, it is important to carefully pick what data it needed
by GPU threads, and possibly even pack them so that for the same overall memory capacity we
are able to sustain the access patterns of all those threads within a few physical frames.
6.2.3 Programming paradigm differences
Unlike conventional multiprocessors where each processor is treated symmetrically and assigned
a portion of the data (data parallel) to process, CPU-GPU systems work differently. Even if data
parallelism is employed within the GPU itself, the interaction between the CPU and GPU uses an
offload (functional parallelism) mechanism, i.e. whenever the CPU feels that the GPU is better
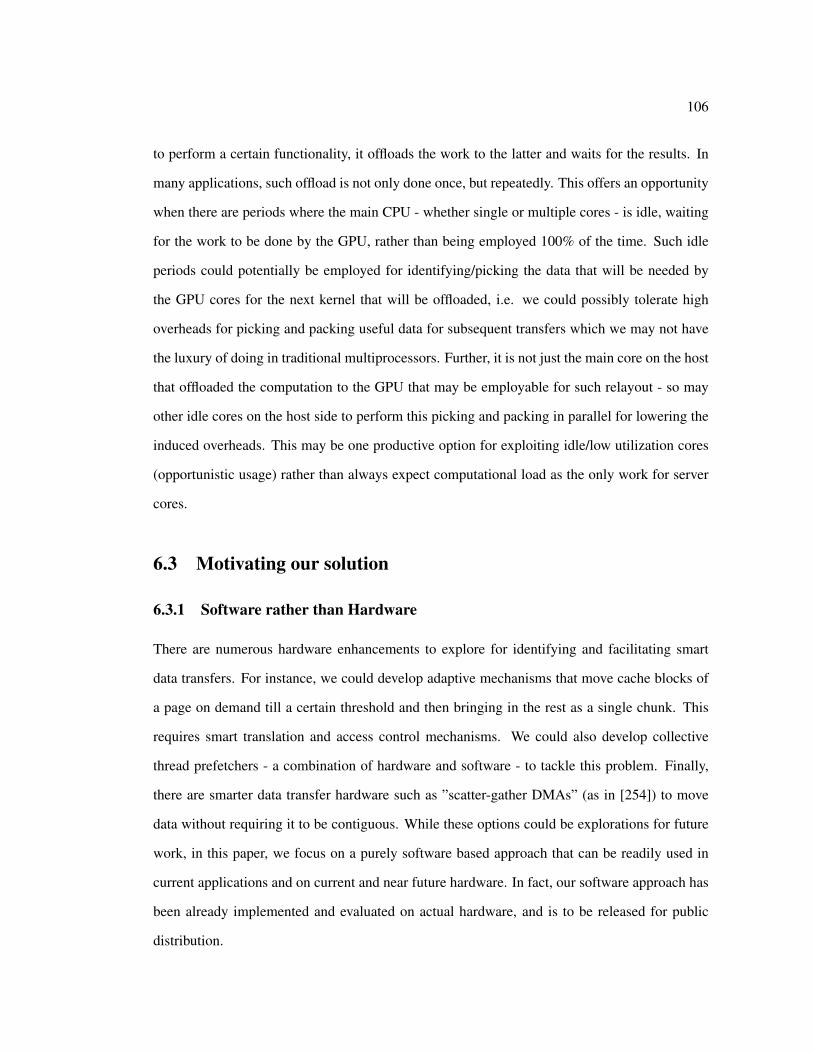
106
to perform a certain functionality, it offloads the work to the latter and waits for the results. In
many applications, such offload is not only done once, but repeatedly. This offers an opportunity
when there are periods where the main CPU - whether single or multiple cores - is idle, waiting
for the work to be done by the GPU, rather than being employed 100% of the time. Such idle
periods could potentially be employed for identifying/picking the data that will be needed by
the GPU cores for the next kernel that will be offloaded, i.e. we could possibly tolerate high
overheads for picking and packing useful data for subsequent transfers which we may not have
the luxury of doing in traditional multiprocessors. Further, it is not just the main core on the host
that offloaded the computation to the GPU that may be employable for such relayout - so may
other idle cores on the host side to perform this picking and packing in parallel for lowering the
induced overheads. This may be one productive option for exploiting idle/low utilization cores
(opportunistic usage) rather than always expect computational load as the only work for server
cores.
6.3 Motivating our solution
6.3.1 Software rather than Hardware
There are numerous hardware enhancements to explore for identifying and facilitating smart
data transfers. For instance, we could develop adaptive mechanisms that move cache blocks of
a page on demand till a certain threshold and then bringing in the rest as a single chunk. This
requires smart translation and access control mechanisms. We could also develop collective
thread prefetchers - a combination of hardware and software - to tackle this problem. Finally,
there are smarter data transfer hardware such as ”scatter-gather DMAs” (as in [254]) to move
data without requiring it to be contiguous. While these options could be explorations for future
work, in this paper, we focus on a purely software based approach that can be readily used in
current applications and on current and near future hardware. In fact, our software approach has
been already implemented and evaluated on actual hardware, and is to be released for public
distribution.
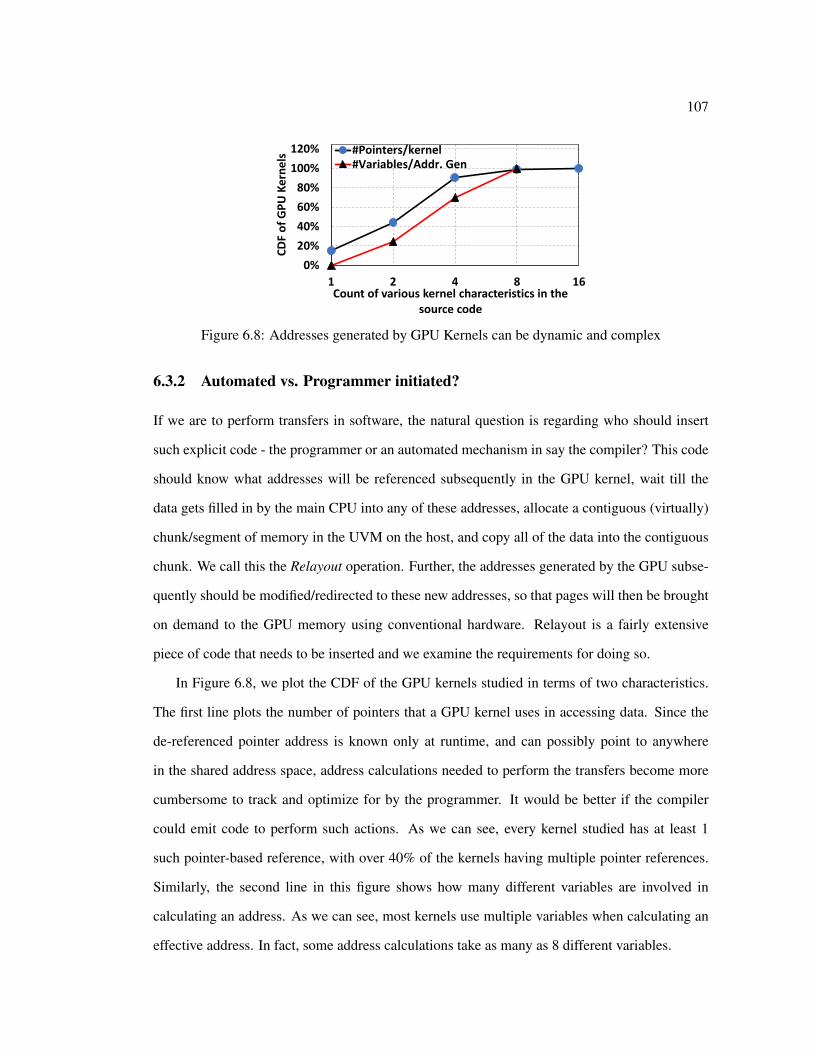
107
0%
20%
40%
60%
80%
100%
120%
1 2 4 8 16C
DF
of
GP
U K
ern
els
Count of various kernel characteristics in the source code
#Pointers/kernel#Variables/Addr. Gen
Figure 6.8: Addresses generated by GPU Kernels can be dynamic and complex
6.3.2 Automated vs. Programmer initiated?
If we are to perform transfers in software, the natural question is regarding who should insert
such explicit code - the programmer or an automated mechanism in say the compiler? This code
should know what addresses will be referenced subsequently in the GPU kernel, wait till the
data gets filled in by the main CPU into any of these addresses, allocate a contiguous (virtually)
chunk/segment of memory in the UVM on the host, and copy all of the data into the contiguous
chunk. We call this the Relayout operation. Further, the addresses generated by the GPU subse-
quently should be modified/redirected to these new addresses, so that pages will then be brought
on demand to the GPU memory using conventional hardware. Relayout is a fairly extensive
piece of code that needs to be inserted and we examine the requirements for doing so.
In Figure 6.8, we plot the CDF of the GPU kernels studied in terms of two characteristics.
The first line plots the number of pointers that a GPU kernel uses in accessing data. Since the
de-referenced pointer address is known only at runtime, and can possibly point to anywhere
in the shared address space, address calculations needed to perform the transfers become more
cumbersome to track and optimize for by the programmer. It would be better if the compiler
could emit code to perform such actions. As we can see, every kernel studied has at least 1
such pointer-based reference, with over 40% of the kernels having multiple pointer references.
Similarly, the second line in this figure shows how many different variables are involved in
calculating an address. As we can see, most kernels use multiple variables when calculating an
effective address. In fact, some address calculations take as many as 8 different variables.

108
0%10%20%30%40%50%60%70%80%
0 10 20 30% O
verh
ead
du
e t
o r
ela
you
tNumber of cores available for relayout
Figure 6.9: % Execution time spent in CPU performing relayout
While it is not infeasible for the programmer to deal with these issues in writing explicit code
to perform relayout before the kernel execution on the latter starts, it is a rather cumbersome
task. Instead, we opt for a pass in the compiler to insert this explicit code, without requiring any
explicit support from the programmer.
6.3.3 Can we reduce the Relayout overhead?
Depending on how much data needs to be relaid out, the overhead for this operation can become
substantial. Over the 15 applications we study, this overhead (averaged) turns out to be 73%
(of the execution time) which makes this completely not worth it. However, this operation is
inherently parallel - as long as we can partition the data to be relaid amongst the main server
cores, each can independently perform its operation with appropriate offsets. In Figure 6.9, we
show (averaged across all GPU kernels), the overhead for relayout as a function of the number of
CPU cores employed to perform this operation. As we can see, this operation scales reasonably
well up to 24 cores - the total number of cores on our server hardware. Most server systems with
high end GPU cards, do have multi-socket and multiple cores within each socket for the host.
Even a single socket Xeon E5 has 12 cores, and more recent v7 CPUs have 48 cores. Further,
the GPU applications, are more reliant on the GPU cores rather than on CPU cores, making
the latter less utilized. Even in cloud offerings, as in Amazon AWS [31], a user procuring a
Tesla/Volta GPU automatically gets between 16-64 main CPU cores, and very often such cores
are under/un-utilized in GPU intensive applications. Hence, one could “opportunistically” use

109
Kernel-A Execution
GP
UM
em
ory
Ho
st
Me
mo
ryCPU
GPU
First data access
CPU Computation
C’s Last ref available
Visible overhead due to relayout
T1
A’s Last refavailable
T2
SlackCPU SlackGPU
A’s Slack
A’s relaidsegment
B’s Last refavailable
T3
Kernel-B Execution
T4
__syncFirst data
access
SlackCPU SlackGPU
B’s Slack
CPU Computation
Kernel-C Execution
__syncFirst data
access
__sync
T5 T6
SlackCPU SlackGPU
C’s Slack
A’s undo_ relayout ovhd
B’s undo_relayoutovhd
C’s relayout ovhd
A’s relayoutovhd
B’s relayoutovhd
On Demand Migration
CPU Computation
On Demand Migration
Figure 6.10: Overlapping relayouts with slack
0.000.25
0.500.75
1.00
1.251.50
1.752.00
1%
8%
15
%
21
%
28
%
35
%
41
%
48
%
55
%
61
%
68
%
75
%
81
%
88
%
95
%
ovh
d/S
lack
CP
U
Relayout functions sorted in increasing order of ovhd/SlackCPU
Category A
Figure 6.11: Ability to hide ovhd within SlackCPU
these main CPU cores to perform the re-layout, in this era of multi-cores where memory becomes
more of a bottleneck than raw computing power. One could always avoid, since we are doing this
in software anyway, the relayout and default to the baseline if the cost overwhelms the benefits.
6.3.4 Can we hide the (remaining) overhead?
Despite reducing relayout overheads, it could still delay the start/execution of the GPU kernel
beyond the baseline case. We explain this by defining a term called slack, which is the gap that

110
is available between the availability of the last CPU memory address that needs to be re-laid out
to the first subsequent use of any of the relaid data by the GPU kernel. For instance, in Figure
6.10, the main CPU performs some computation which accesses data in its memory. At some
point T 1 , all such data access is done, with the CPU invoking the GPU to work on it. The
GPU begins execution and at some point T 2, starts accessing this data. The time gap between
T 1 and T 2 is the slack, since any delay introduced may extend the execution. Normally the
GPU would have fetched into GPU memory the original pages filled in the main CPU. In our
relayout mechanism, we will copy all of the data, after time T 1 into a separate segment (shown
pictorially as A’s relaid segment). The GPU will generate UVM addresses pointing to this relaid
data, and bring in pages on demand by its default mechanism - our compiler will change those
address generations to point to the relaid segment. In order to hide the overhead of relayout,
this operation which can start any time after T 1 should finish before T 2. We note that this slack
between T 1 and T 2 has 2 components - SlackCPU which is the slack before the GPU kernel even
launches, and SlackGPU which is the slack from its launch till T 2
In Figure 6.11, we plot the CDF (x-axis) of the GPU kernel relayout functions in terms of
increasing ovhdSlackCPU
(y-axis), where ovhd is the overhead of the corresponding relayout function.
As can be seen, whenever this fraction is lower than 1.0, it denotes that there is sufficient slack
even before the GPU kernel is launched. For instance, in Figure 6.10, GPU Kernel ”A” is an
example of this category since A relayout gets done before T 1+ SlackCPU . Note that this does
not necessarily imply that this potential is always realizable since the main CPU core may still be
executing some other computations (not related to the relaid addresses) in the application code.
However, even if the main CPU core is busy with subsequent application code, there could be
other idle cores on the host to perform the re-layout. As we can see from this figure, nearly 83%
of the kernels have a ratio lower than 1.0, suggesting that even the host side slack (i.e. before
launching the GPU kernel) is sufficient to hide the relayout overheads in a majority of cases. In
fact, up to 34% of the kernels have a ratio as small as 0.6%, showing even more promise in terms
of having their overheads completely hidden. On the other hand, only 17% of the kernels have
an overhead larger than 1.0, and we next focus on those.

111
0.00
0.20
0.40
0.60
0.80
1.00
1.20
1.40
0% 20% 40% 60% 80% 100%o
vhd
/(Sl
ack C
PU+S
lack
GP
U)
Relayout functions sorted increasing order of ovhd/(SlackCPU+SlackGPU)
Category B
Category C
Figure 6.12: Ability to hide Ovhd within SlackCPU +SlackGPU
Note that it is not necessary for the relayout function to complete before the GPU kernel
starts. In fact, we could allow the overlap until the first reference (we conservatively allow until
the first reference and not for each of the references) to the relaid data from the GPU core, i.e. the
SlackGPU component. To facilitate this we introduce additional sync mechanisms to ensure that
the GPU executes those address references only after the relayout function completes. Hence, as
long as the relayout completes before this sync operation, we could potentially hide all of its
overhead. This is illustrated in Figure 6.10 for Kernel B, where the sync is used to ensure data
accesses are complete to the relaid segment. We show the potential for allowing slack to grow
in the GPU execution in Figure 6.12 for the tail 17% of the kernels that exceeded 1.0 in Figure
6.11. The x-axis is similar to 6.11 except that we only consider the tail 17% of the kernels.
The y-axis now extends the slack window to SlackCPU +SlackGPU . We now see that 40% of the
relayout functions whose ovhdSlackCPU
exceeded 1.0 can still be overlapped with the GPU execution
because of the extra SlackGPU . Despite this, 60% of the 13% of the total kernels (i.e. 8% of all
kernels considered) exceed both components of the slack put together, and Kernel C in Figure
6.10 illustrates this category (relayout goes beyond its slack). We will consider applications
containing all 3 categories of kernels in our evaluation.
Apart from relayout when the CPU hands over the computation to the GPU, the reverse
relayout also needs to be done when the GPU returns the control back to the CPU. We call this
the undo relayout() function which could again have a slack component with the potential to hide

112
some or all of the reverse relayout overheads. The Undo relayout() functions are also shown in
Figure 6.10.
6.4 OppoRel
Based on the observations from our prior section, we now present our OppoRel mechanism,
which opportunistically (based on spare main CPU utilization) picks and packs the data that will
be useful to the GPU for a future kernel. Our compiler enhancements introduces code on the
host side for such picking and packing, and also modifies the addresses that will be generated
by the GPU cores, and subsequently the normal runtime mechanism will transfer the pages on
demand which will likely only contain useful data.
6.4.1 OppoRel Compiler Pass
We have implemented a LLVM [177] and clang++ [178] based compiler pass that takes off-the-
shelf CUDA workloads and transforms them as follows:
Identifies all GPU address generations: It scans through all GPU kernels, and finds the address
generation codes. For example, this pass identifies lines 6 and 7 in Fig. 6.7 where each thread
accesses specific offsets in the indr mtrx array.
Insert a mem relayout function: For each such identified memory access, it inserts code in a
mem relayout() function that will copy data from these addresses at runtime using the operand
variables to calculate the addresses. This way, only the data that will be used by GPU cores will
be picked-and-packed. This function will be called by the main CPU to copy the data before the
GPU kernel starts. Since there may be a considerable amount of data that needs to be copied, we
exploit both “idleness” and “parallelism” (using OpenMP [217] calls) in the host CPU cores for
performing this operation as described in previous section. In our example, the FETCH POINT
uses four operands, namely tid, random seed, cand pnt i, and indr mtrx[]. Note that both
indr mtrx and random seed are passed as arguments to the kernel in line 3 of Fig. 6.13a, and
cand pnt i is a local variable declared inside the kernel. The consequent mem relayout() code is

113
shown in Fig. 6.13b.
Rewrite the address generation at the GPU: Since the original GPU addresses are no longer
valid, we need to recalculate the addresses to the new relaid data. While the relaid segment
may contain any GPU thread’s data at any location, this may complicate the subsequent address
generation at each GPU thread to access the new location. To simplify this process, we use a
relatively standardized template across all applications for relaying the data. This can be ex-
plained (and is shown in Fig. 6.13a for our above example) using the following parameters:
thread id (tid), per thread data size (s), offset per thread (o). Essentially the relaid segment uses
a contiguous chunk of s bytes for each thread tid, and within this chunk, the successive accesses
of the original chronological order are laid out spatially contiguous (e.g. indx mtrx[0..11] and
indx mtrx[1 ∗ 12+0..11] are accessed by thread 0 and 1 respectively. With such a template, it
becomes relatively easier to go back and modify the addresses generated by each GPU thread to
the corresponding offset within its respective chunk. Note that if two threads do reference the
same memory location, then our relayout function would create two copies of this data, one in
each of the thread’s chunks. This will not create a coherence issue since CUDA does not en-
courage any other thread to read or write when one thread is a writer to this location. For codes
which do such read-write sharing across threads, we simply do not relay such memory locations
and default to their original memory accesseses.
Insert a undo relayout function: While the main CPU could live with the relaid data after the
GPU execution, it becomes quite messy to redo the addresses on the CPU, especially since there
is considerable spatial locality on the CPU. Further, it is not clear if the next GPU kernel has
the same access pattern/sparsity as the prior (we will investigate this in future work). Instead,
in this paper, we revert back to the original layout after the GPU execution, where we need this
undo relayout() to undo the operation of the relayout function. In this example, to get the original
data back, the undo function has a similar function body as the relayout function – except for
lines 8 and 9 in Fig. 6.13c where the source and destination are switched (lines 13 and 14 in Fig.
6.13b.
Leveraging Parallelism for relayout executions: To reduce the overheads due to relayout (as

114
discussed in Sec 6.3), we also leverage the available CPU cores to execute the for loop in line
8 of Fig. 6.13b in parallel using the OpenMP construct # pragma omp for [217] in line 7.
Note that it is also possible for multiple relayouts/undo relayouts to be simultaneously ready for
execution (across multiple kernels). To enable this, we also use omp parallel blocks to execute
these multiple relayouts, undo relayouts and kernel launches in parallel as and when applicable.
6.4.2 Limitations, challenges and boundary conditions
Non-universal: The above compiler transformations are feasible only for those where the
compiler can insert code to calculate the effective address at runtime - the addresses themselves
are not necessarily known at compile time, just the knowledge of how to compute them using
values/variables available at the main CPU is needed before offloading to the GPU. However,
there could be situations where this may not be possible, e.g. an address is known only based
on a value/variable that is itself calculated at the GPU end, and not the CPU. Except in 5 of the
176 GPU kernels across our 15 applications, we did not encounter such cases, emphasizing the
usefulness of our simple solution.
Handling races: This relayout mechanism works on the assumption that the CUDA kernels
obey the cardinal rule that no two concurrent warps can access (with at least one writing to it) the
same cache block during execution [209]. So, if the kernel is already doing this, it means it has
some race condition issues. While the race condition detection tools such as NVIDIA NSight
Compute [208, 211, 214], can warn about this during execution in debug mode, our relayout
avoids the race condition totally, and will go undetected. If undetected, the relayout based code
may potentially create copies of the same data - one for each accessing thread to which the
warps can individually write their copy of data. When calling undo relayout() call at the end of
the kernel execution, the two copies will be merged in parallel (due to omp parallel for) to get
unforeseen consequences. To avoid this, we suggest users first run their code using the NVIDIA
NSight Compute tool and then run it through our compiler passes for the transformed version.

115
Handling atomics: One way current kernels share data during execution is by using atomic
constructs. To be safe, we do not relayout the data structures used inside atomics.
Handling syncs: sync constructs provide a barrier mechanism within warps, block and
grids to share data between the threads in the corresponding level. The SM’s scheduler en-
gine makes a context switch on executing syncthreads(), and waits for the sync condition to
get satisfied, for the context to again be marked as ready. The reason we need to be concerned
when this occurs is because subsequent to a sync, a GPU thread may access some other thread’s
data/locations - making it insufficient to simply offset within a thread’s chunk in the relaid seg-
ment. There are several ways to address this. We could recalculate addresses and index into
other thread’s chunks in during address generation. However, this can become very complicated
and difficult to do in a compiler pass. Another option, is to break the computation across syncs
into separate GPU kernels with a relayout function performed at the main CPU in-between as
before. We found that despite the higher overhead of the latter, this is still a better option since
the number of such cases is relatively low across the applications considered.
Launching dynamic child kernels: CUDA constructs such as dynamic parallelism APIs [210],
allows potential nested kernel launches from inside the GPU execution. While we can look into
extending our compiler framework to support the relayout features for such extensions, none of
the existing workload suites have this in them. We leave this exploration as a future extension.
6.4.3 Protection Issues:
Implicit in the CUDA model is that any GPU thread can access any other thread’s data, and so
can any CPU thread - i.e. they are all within one protection domain determined by the operating
system for that process. Our solution does not deviate - either amplify or restrict this model.
We are only moving data within this protection domain, and any thread even if devious, can
only access or corrupt its (or another thread’s) data in this protection domain and cannot access
outside this domain. The cross-domain protection is still enforced by the underlying page tables

116
Workloads Input % Capacity OvhdSlackCPU
OvhdSlackGPU+SlackCPU(# Kernels) Size Miss
Cat
egor
yA HOTSPOT (1) 4k2 11% 0.33 0.29
RED (8) 26G items 16% 0.42 0.313DCONV (1) 5123 28% 0.81 0.55COVAR (4) 32k2 44% 0.61 0.15CORR (3) 32k2 48% 0.69 0.23
Cat
egor
yB QT (5) 65k points 23% 1.01 0.74
MD (1) 3G points 25% 1.03 0.99HUFFMAN (42) 1G file 27% 1.12 0.66SRAD (9) 50k2 29% 1.11 0.90PARTICLE (3) 1k×8k frames 53% 1.24 0.97
Cat
egor
yC HEARTWALL (1) 1k×8k frames 55% 1.17 1.01
S3D (56) 1G points 19% 1.30 1.02GAUSSIAN (2) 32k2 25% 1.25 1.23CFD (38) 1G file 61% 1.65 1.27BFS (2) 1G nodes 75% 1.34 1.20
Table 6.1: Workload Characteristics. Numbers in brackets give the number of GPU kernels ineach benchmark.
whose protection bits are put in by the operating system. We are not in any way changing
the OS/hardware mechanisms of how physical addresses are generated and accessed - they go
through TLBs/pages tables/page-walk caches etc. We are only changing logical/virtual addresses
within the address space, so as to not affect any protection issues.
6.5 Experimental Evaluation
6.5.1 Workloads
To analyze the benefits and shortcomings of our proposed OppoRel approach, we pick numerous
off-the-shelf CUDA benchmarks from Rodinia, SHOC and Polybench workload suites. In the
interest of clarity, in this paper, we present results for 5 applications in each category as is shown
in Table 6.1 that are representative of different overheads vs. inherent slack ratios - (i) category
A with slack in the main CPU core itself to not delay the initiation of the GPU kernel (column 5
of the Table with ratios less than 1.0; (ii) category B with not enough slack in the CPU core itself
(column 5 of Table with ratio greater than 1.0) but the first reference to the relaid data by the
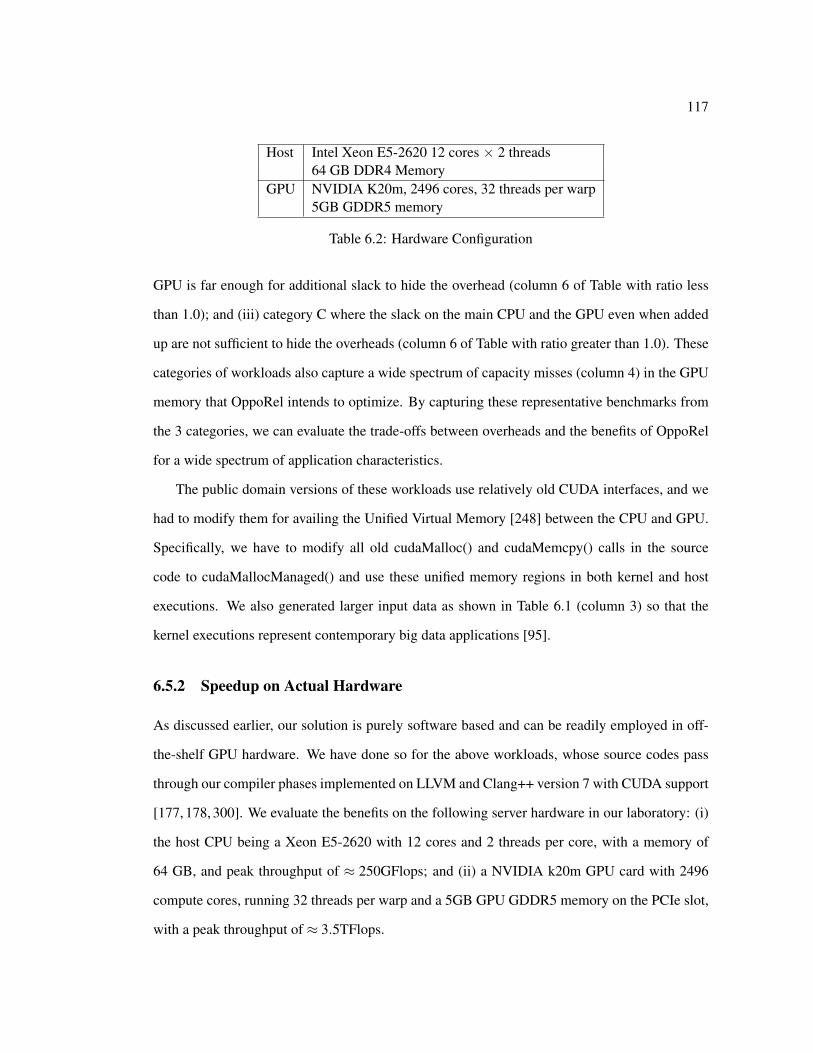
117
Host Intel Xeon E5-2620 12 cores × 2 threads64 GB DDR4 Memory
GPU NVIDIA K20m, 2496 cores, 32 threads per warp5GB GDDR5 memory
Table 6.2: Hardware Configuration
GPU is far enough for additional slack to hide the overhead (column 6 of Table with ratio less
than 1.0); and (iii) category C where the slack on the main CPU and the GPU even when added
up are not sufficient to hide the overheads (column 6 of Table with ratio greater than 1.0). These
categories of workloads also capture a wide spectrum of capacity misses (column 4) in the GPU
memory that OppoRel intends to optimize. By capturing these representative benchmarks from
the 3 categories, we can evaluate the trade-offs between overheads and the benefits of OppoRel
for a wide spectrum of application characteristics.
The public domain versions of these workloads use relatively old CUDA interfaces, and we
had to modify them for availing the Unified Virtual Memory [248] between the CPU and GPU.
Specifically, we have to modify all old cudaMalloc() and cudaMemcpy() calls in the source
code to cudaMallocManaged() and use these unified memory regions in both kernel and host
executions. We also generated larger input data as shown in Table 6.1 (column 3) so that the
kernel executions represent contemporary big data applications [95].
6.5.2 Speedup on Actual Hardware
As discussed earlier, our solution is purely software based and can be readily employed in off-
the-shelf GPU hardware. We have done so for the above workloads, whose source codes pass
through our compiler phases implemented on LLVM and Clang++ version 7 with CUDA support
[177, 178, 300]. We evaluate the benefits on the following server hardware in our laboratory: (i)
the host CPU being a Xeon E5-2620 with 12 cores and 2 threads per core, with a memory of
64 GB, and peak throughput of ≈ 250GFlops; and (ii) a NVIDIA k20m GPU card with 2496
compute cores, running 32 threads per warp and a 5GB GPU GDDR5 memory on the PCIe slot,
with a peak throughput of ≈ 3.5TFlops.

118
Hos
t 16 core superscalar CPU, 32 kB 4-way L1-D cache (2 cycle hit);256 kB L2 (12 cycle hit), 8MB LLC (42 cycle hit);64-entry L1 D TLB (1 cycle hit); 12 way 1.5k-entry L2 TLB (9 cycle hit);128 MB L4 eDRAM; 2 TB DDR4 memory, tRAS, tCAS, tACT = 12ns;
GPU 84 SMs, 32 threads/warp, 64 warps/SM, 256 kB registers/SM;
64 kB L1, 128-entry L1 TLB; 512-entry shared page walk cache;6MB shared L2; 8 × 2GB HBM2 memory
Table 6.3: Simulation Parameters
Figure 6.14 shows the performance benefits of OppoRel normalized with respect to the con-
ventional baseline execution for the 3 categories of workloads in Table 6.1. Additionally, we also
show a scheme (No Overheads) where the relayout does not incur any overheads. Figure 6.15
shows the capacity misses incurred/reduced in GPU memory as a result of OppoRel compared
to the baseline.
First, let us consider the ”No Overheads” execution which depicts the potential of OppoRel
if we are to hide all its overheads. As is to be expected, the benefits of this approach will increase
with the greater impact of capacity misses in a finite GPU memory. We see that applications such
as CFD and BFS show speedups higher than 80% with this approach since the capacity misses
in these applications are significantly higher - 61% and 75% respectively. OppoRel is able to
reduce these misses to 44% and 64% respectively, to provide the higher speedup. On the other
hand, in applications such as RED, and 3DCONV, the capacity misses even in the baseline are
only 11% and 28% respectively, that the speedups with “No Overhead” OppoRel are only 8%
and 18% respectively.
The ”No Overheads” bars depict the potential, but the realistic speedups for OppoRel will
clearly depend on the overheads for the relayout and the characteristics (slack) of the applications
to hide it. This ability will determine how close the OppoRel bar is to the ”No Overhead” bar
in each application. This is the reason why applications in Category C, such as CFD, despite
showing a very high potential for speedup (85%) only resulted in an actual speedup of 26%,
which is much lower. The 6th column of Table 6.1 shows that the overhead is 0.27× larger than
the slack available in this application, making this visible in the execution. Despite this overhead
being larger, the consequence of a lower capacity miss rate still results in a 26% speedup, which

119
is non-trivial. Of all the applications, only in GAUSSIAN of Category C, do the overheads
outweigh the benefits of lower capacity misses to result in a slowdown.
At the other end, applications such as COVAR have high capacity misses (44%) for the ”No
Overhead” scheme to show a potential of 63% speedup, and at the same time have a overhead to
slack ratio of 0.15, making the actual OppoRel come very close to the potential (61% speedup).
These are example applications which are ideally suited for OppoRel.
Finally, there are cases such as 3DCONV and RED, where even though OppoRel overheads
can be completely hidden - overhead to slack ratios of 0.55 and 0.31 respectively - the capacity
misses in the baseline are not severe (16% and 28%) enough to have any meaningful speedups
with OppoRel (overheads or otherwise).
Across these 3 very different categories of applications, we see an average speedup of 34%
with OppoRel (including its overheads) compared to a theoretical potential of 48%. This sug-
gests that OppoRel can provide benefits across numerous applications even if its overheads can-
not be fully hidden. Given that it is only a software optimization to take opportunistic advantage
of low utilization periods in the main CPU cores, one could always turn this feature off if and
when the overheads start dominating as observed in GAUSSIAN.
6.5.3 Sensitivity Experiments with Simulation
Simulation Framework Since we cannot change several parameters on an actual platform, we
next simulate sensitivity to different parameters by building an integrated simulation framework
consisting of three off-the-shelf simulation tools - GPGPUSim [34] for GPU execution, Gem5
[46] for CPU execution and DRAMSim [246] for the memory accesses. The experiments get the
binary execution started on the CPU side (using Gem5). After performing some initializations
(e.g., file reads, input parsing, etc.) in the memory (using DRAMSim), the CPU offloads the
GPU kernels to execute on the GPU side (using GPGPUSim). The benchmark execution begins
with a Gem5+DRAMSim instance (simulating a CPU system along with its memory hierarchy).
Note that, the Gem5 simulator does not understand CUDA invocations. So, we instrument the
benchmark binary with m5op (magic instruction) calls before every GPU kernel invocation to

120
make Gem5 hand off the execution to GPGPUSim where the subsequent GPU kernels run. For
simulating multiple GPU cards, Gem5 hands off the execution to more than one GPGPUSim
instance.
Upon a GPU kernel invocation from the CPU side, the appropriate GPGPUSim instance is
invoked. We have extended this simulator to support address translations to support UVM-like
demand paging, (GPGPUSim currently does not support address translations) with per SM TLB
and a shared page walk cache. We integrated GPGPUSim, with a DRAMSim instance to capture
the GPU’s HBM memory controller behavior as well. We have also implemented a PCIe inter-
face between the GPGPUSim and Gem5 to capture kernel invocations, sync constructs, paging
and translation requests between their executions. In the multiple GPU executions, any data
transfers between the GPU cards themselves is done through a dedicated NVLink-like interface
model.
All the costs for relayout which runs on the main CPU before the kernels are offloaded
are also simulated in detail using Gem5. As explained earlier, rather than put this operation in
the critical path, we try to perform such re-layouts concurrent with the GPU execution of the
previous kernel, thus fully or partially hiding the overheads. Further, as pointed out in Sec. 6.3,
multiple main CPU cores are used to speedup this operation. While most of the experiments
assume these main CPU cores are idle (to perform this operation), we study the impact of them
being busy with other workloads in Sec. 6.5.3.3. We use the hardware configuration for the CPU
and GPUs as shown in Table 6.3 for our experiments.
6.5.3.1 GPU Memory/Data Capacity
Since OppoRel makes sense only when the capacity miss reduction in GPU memory outweighs
the cost of relayout overheads, we next study the impact of varying GPU memory capacities.
Fig. 6.16 presents three lines - the Baseline System, and the two schemes (”No Overheads” and
OppoRel discussed earlier in Section 6.5.2) - with increasing GPU memory size on x-axis. All
the results are normalized with respect on the Baseline GPU memory configuration of 16 GB.
OppoRel essentially gives an impression of higher memory capacity by reducing capacity

121
misses. As seen, it roughly increases the effective capacity of the GPU by 4× without actu-
ally adding that much physical capacity – i.e, the performance benefits from OppoRel at 16GB
GPU memory is roughly the same as the baseline execution at 64GB GPU memory. As is to
be expected, OppoRel also saturates early at 64 GB of GPU memory for the workloads in con-
sideration, while the baseline continues benefiting from increase in GPU memory till 256 GB
memory suggesting its importance when physical resources are tight. Even if GPU memory
capacities grow in the future, workloads will continue to impose considerable demands in the
emerging big data era, continuing to stress the importance of mechanisms such as OppoRel. The
continuing disparity between OppoRel and the ”No Overheads” approach suggests the need for
future work to develop solutions (possibly even in hardware) to reduce/speedup the overheads
associated with the relayout of OppoRel.
6.5.3.2 Multiple GPU cards
With the trend towards moving more compute into accelerators, dozens of GPU cards are already
offered by cloud vendors on a single server that can share the UVM memory space to collaborate
and execute the same workload with a higher degree of parallelism than a single GPU. We study
the effect of OppoRel in such systems by extending our simulations to support two concurrent
GPUs. In such environments, the baseline performance not only has overheads from host to GPU
memory transfers, but also transfers between GPU memories. The performance impact is shown
in Fig. 6.17, with two speedup bars – OppoRel and ”No Overheads” approach as described
earlier with respect to a 2 GPU baseline.
As seen, the benefits from OppoRel as well as the No Overheads schemes are consistently
greater than that of the single GPU setup (3% more for OppoRel scheme and 7% more for No
Overheads). In fact, even in applications such as Gaussian, where OppoRel overheads were
impacting negatively on the single GPU execution setup, the two GPU setup actually provides
rewards by employing OppoRel (3%). Overall, the performance of the 2GPU executions are
improved by 40% with OppoRel compared to the average of 34% with the single GPU executions
shown earlier.

122
6.5.3.3 Less Opportunity - Non-idle CPU cores
Fig. 6.18 shows the effect of not having all the CPU cores available for performing our proposed
relayout optimizations. We make other cores busy, and give lower opportunity for our GPU
application to utilize those cores. The x-axis shows the % of CPU utilization that is being devoted
to serving other applications on the server, with only the remaining utilization available for our
GPU application. The y-axis plots the resulting speedup for OppoRel over the baseline. For
instance, 0% CPU utilization for other applications implies all 24 cores are available to OppoRel
for performing the relayout. As we move to the right, there is lower opportunity for OppoRel
to leverage host resources for performing the relayout, thereby diminishing the speedup. We
still see speedup until the remaining cores are available for 100-66=34% of the time for the
GPU application. Beyond this, the overheads from OppoRel outweigh the gains. As pointed out
earlier, our software based opportunistic relayout can be selectively turned off in such situations -
the CUDA runtime can be instrumented to track the current CPU utilization and make a decision
on whether to execute the baseline flavor or leverage the spare CPU utilization for relayout.
6.5.4 Comparison to prior solutions
Prior works have tried to address the CPU-GPU data transfer problem (and the transfer granular-
ity problem) with a hardware prefetcher to dynamically adjust the granularity of the data being
moved based on workload execution characteristics. We have implemented this previously pro-
posed hardware scheme, MOSAIC [28] on our simulation platform, and compare it with our
OppoRel approach in Fig. 6.19. As seen, OppoRel provides better speedups than MOSAIC in
11 out of the 15 workloads. This is specifically in applications where the usefulness within a
page is low - compare with Fig. 6.4 shown earlier. On the other hand, when there is regular
access patterns as in CFD, GAUSSIAN and HUFFMAN, MOSAIC outperforms OppoRel, but
OppoRel is not far behind. Note that MOSAIC requires extra hardware to address this problem,
while the proposed OppoRel is a purely software approach that can work on existing hardware
too.
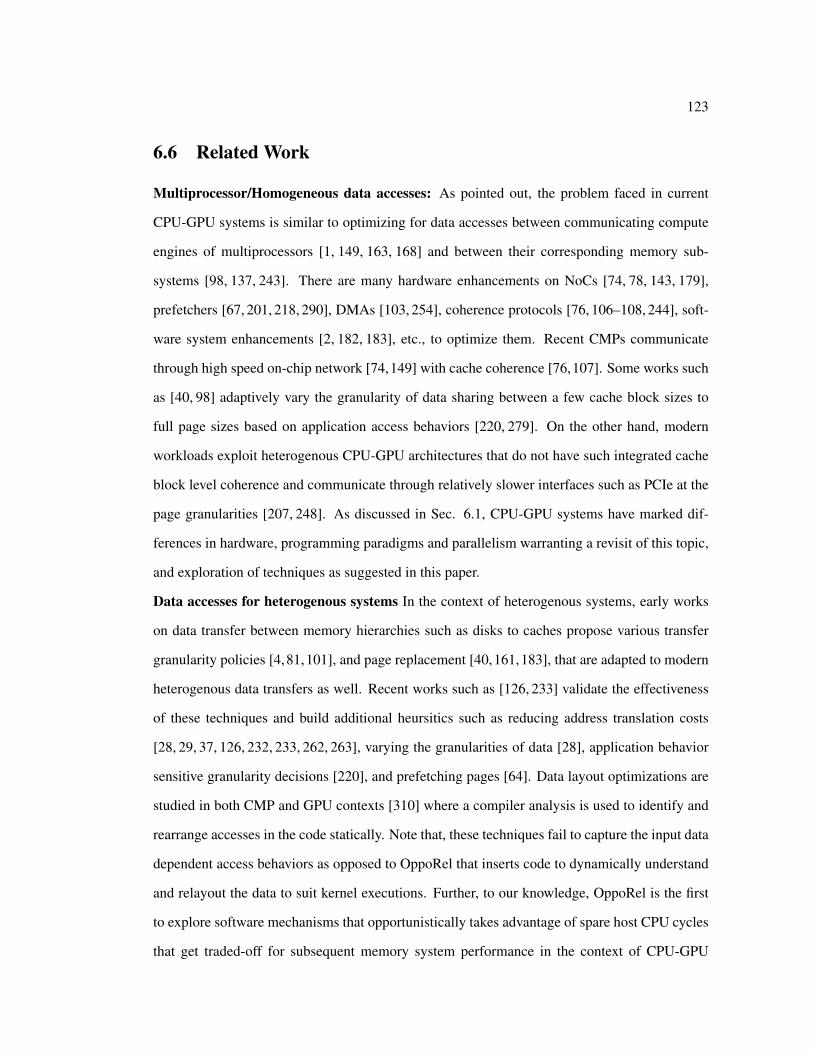
123
6.6 Related Work
Multiprocessor/Homogeneous data accesses: As pointed out, the problem faced in current
CPU-GPU systems is similar to optimizing for data accesses between communicating compute
engines of multiprocessors [1, 149, 163, 168] and between their corresponding memory sub-
systems [98, 137, 243]. There are many hardware enhancements on NoCs [74, 78, 143, 179],
prefetchers [67, 201, 218, 290], DMAs [103, 254], coherence protocols [76, 106–108, 244], soft-
ware system enhancements [2, 182, 183], etc., to optimize them. Recent CMPs communicate
through high speed on-chip network [74,149] with cache coherence [76,107]. Some works such
as [40, 98] adaptively vary the granularity of data sharing between a few cache block sizes to
full page sizes based on application access behaviors [220, 279]. On the other hand, modern
workloads exploit heterogenous CPU-GPU architectures that do not have such integrated cache
block level coherence and communicate through relatively slower interfaces such as PCIe at the
page granularities [207, 248]. As discussed in Sec. 6.1, CPU-GPU systems have marked dif-
ferences in hardware, programming paradigms and parallelism warranting a revisit of this topic,
and exploration of techniques as suggested in this paper.
Data accesses for heterogenous systems In the context of heterogenous systems, early works
on data transfer between memory hierarchies such as disks to caches propose various transfer
granularity policies [4,81,101], and page replacement [40,161,183], that are adapted to modern
heterogenous data transfers as well. Recent works such as [126, 233] validate the effectiveness
of these techniques and build additional heursitics such as reducing address translation costs
[28, 29, 37, 126, 232, 233, 262, 263], varying the granularities of data [28], application behavior
sensitive granularity decisions [220], and prefetching pages [64]. Data layout optimizations are
studied in both CMP and GPU contexts [310] where a compiler analysis is used to identify and
rearrange accesses in the code statically. Note that, these techniques fail to capture the input data
dependent access behaviors as opposed to OppoRel that inserts code to dynamically understand
and relayout the data to suit kernel executions. Further, to our knowledge, OppoRel is the first
to explore software mechanisms that opportunistically takes advantage of spare host CPU cycles
that get traded-off for subsequent memory system performance in the context of CPU-GPU

124
heterogeneous systems.
GPGPU workload execution optimizations In the context of GPU execution, prior works
identify memory access bottlenecks [62, 130, 151, 171], control and memory divergence is-
sues [59, 87, 151, 249], and interference between co-scheduled kernels [28, 29] as reasons for
their inefficiencies and fix them using combinations of compiler optimizations, runtime support
and hardware extensions [39,63,146,155,184,203]. With the ever growing demand for process-
ing large volumes of data [95], modern GPUs also incorporate many of these techniques like
assistive prefetching [212], better memory capacity and bandwidth, larger thread count, buffer
sizes, [144,207,248]. While the above optimizations are helpful, this work proposes a fully soft-
ware approach that can be adopted in existing CPU-GPU systems as well. Software approaches
such as [155, 195] have looked at partitioning the GPU application to run simultaneously across
multiple CPUs and GPUs. Note that, this methodology still suffers from the drawbacks we ob-
serve in terms of page utilization. So, whenever a workload exhibits such sparse page utilizations
as discussed in Sec. 6.1, utilizing the CPU cycles for OppoRel mechanism is beneficial over the
workload partitioning approach.
6.7 Chapter Summary
This work has presented a pure software based mechanism to address the mismatch between the
access patterns of the CPU and GPU to the same shared pages that can result in poor utilization
of the data transfer bandwidth and limited GPU memory capacity. Our solution, OppoRel, takes
opportunistic advantage of any spare host CPU cycles to relay the data in a fashion that will
avoid redundant bytes from being transferred. Despite having significant overheads, by trading
off any spare compute parallelism on the host side, there are significant gains to be attained
subsequently with lower GPU memory capacity misses. Most servers running GPU applications,
do provision multiple sockets and multiple cores per socket, and not all of these are always
utilized. Even in cloud environments, despite virtualization and consolidation, several reports of
under-utilization have been noted [38, 119, 206] and there is always a need to utilize any spare

125
capacity in innovative ways. OppoRel is a step in that direction similar to creating extra threads
for run-ahead optimizations, prefetchers, etc., that have been proposed in prior work. Further,
since we are a fully software mechanism, it is relatively easy to turn this off at runtime when
there are no such spare cycles.
The differences between the “No Overhead” vs the realistic OppoRel provides sufficient
motivation for future work to bridge this gap. We are looking to develop hardware mechanisms
to transfer data that may be non-contiguous (as in Scatter-gather DMAs), address translation
mechanisms to provider finer granularity of access control, etc. On the software side, we only
looked at the immediate next GPU kernel for relayout. Given that most applications have several
kernels being called one after another, we could investigate global mechanisms for better layout
across the sequence to avoid/amortize undo relayout().

126
runTest(...){int*_relaid_indr_mtrx = mem_relayout(_indr_mtrx, random_seed, 0, THREADS);QTC_device<<<THREADS>>>(_relaid_indr_mtrx...);undo_relayout(indr_mtrx, relaid_indr_mtrx,...);
}Void QTC_device(_relaid_indr_mtrx, ...){
tid = ...; s=12; o = 0..11;points = _relaid_indr_mtrx[tid*s + o];
}
12345678910
(a) QT Clustering code instrumented with relayout calls
void* mem_relayout(int *_indr_mtrx, int random_seed,int tidStart, int tidEnd) {
int *new_relaid_memory = (int *)cudaMalloc-Managed((tidEnd - tidStart) * 12 * sizeof(int));int cand_pnt_0 = ..., cand_pnt_11 = ..;//copy local constants too#pragma omp for num_threads(MAX_CPU_THREADS)for(tid = tidStart; tid < tidEnd; tid ++) {
//exact FETCH_POINT codeint old_location_data = _indr_mtrx[tid*(random_seed + cand_pnt_0)];int new_address = tid*12 + 0;*(new_relaid_memory + new_address) =old_location_data;//same for cand_pnt_1 to 11
}return (void *)new_relaid_memory;
}
123456789101112131415161718
(b) mem relayout function for indr mtrx
void undo_relayout(int *_indr_mtrx, int *relaid_memory, int random_seed, int tidStart, int tidEnd) {/** Same as relayout – Swap source and destination **/...
int old_location = tid*(random_seed + cand_pnt_0);int new_address = *new_tid*12 + 0;_indr_mtrx[old_location] = *(new_relaid_memory + new_address);
...}
1234567891011
(c) undo relayout function for indr mtrx
Figure 6.13: The same code snippet in Fig. 6.7 is modified with our proposed mem relayout andmem undo relayout calls.
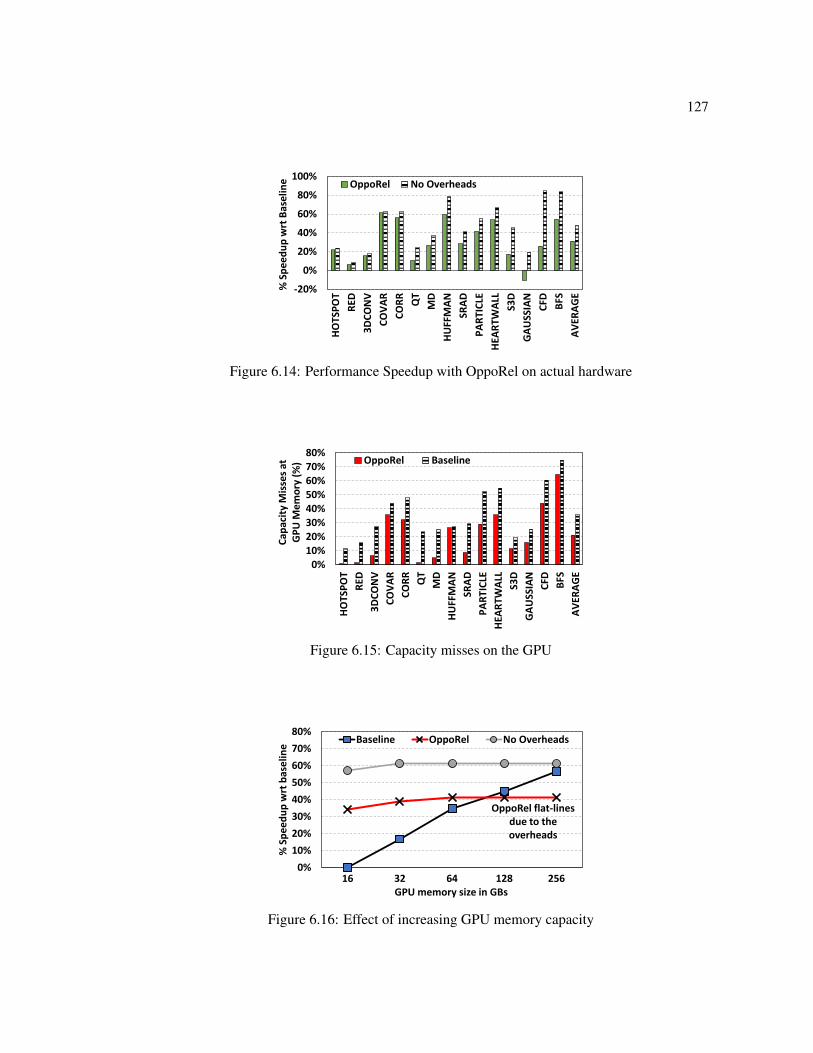
127
-20%
0%
20%
40%
60%
80%
100%
HO
TSP
OT
RED
3D
CO
NV
CO
VA
R
CO
RR
QT
MD
HU
FFM
AN
SRA
D
PA
RTI
CLE
HEA
RTW
ALL
S3D
GA
USS
IAN
CFD BFS
AV
ERA
GE
% S
pe
ed
up
wrt
Bas
elin
e OppoRel No Overheads
Figure 6.14: Performance Speedup with OppoRel on actual hardware
0%10%20%30%40%50%60%70%80%
HO
TSP
OT
RED
3D
CO
NV
CO
VA
R
CO
RR
QT
MD
HU
FFM
AN
SRA
D
PA
RTI
CLE
HEA
RTW
ALL
S3D
GA
USS
IAN
CFD BFS
AV
ERA
GE
Cap
acit
y M
isse
s at
G
PU
Me
mo
ry (
%) OppoRel Baseline
Figure 6.15: Capacity misses on the GPU
0%
10%
20%
30%
40%
50%
60%
70%
80%
16 32 64 128 256
% S
pe
ed
up
wrt
bas
elin
e
GPU memory size in GBs
Baseline OppoRel No Overheads
OppoRel flat-lines due to the overheads
Figure 6.16: Effect of increasing GPU memory capacity

128
0%
20%
40%
60%
80%
100%
120%
HO
TSP
OT
RED
3D
CO
NV
CO
VA
R
CO
RR
QT
MD
HU
FFM
AN
SRA
D
PA
RTI
CLE
HEA
RTW
ALL
S3D
GA
USS
IAN
CFD BFS
AV
ERA
GE
% S
pe
ed
up
wrt
2G
PU
Bas
elin
e OppoRel.2GPU No Overheads.2GPU
Figure 6.17: Effect of OppoRel on 2 GPU setup
-30%
-20%
-10%
0%
10%
20%
30%
40%
0% 20% 40% 60% 80% 100%
% S
pe
ed
up
wrt
bas
elin
e
% CPU Utilized by other process
Figure 6.18: Effect of varying CPU utilization
-20%-10%
0%10%20%30%40%50%60%70%80%
HO
TSP
OT
RED
3D
CO
NV
CO
VA
R
CO
RR
QT
MD
HU
FFM
AN
SRA
D
PA
RTI
CLE
HEA
RTW
ALL
S3D
GA
USS
IAN
CFD BFS
AV
ERA
GE
% S
pe
ed
p w
rt b
ase
line OppoRel Mosaic
Figure 6.19: Comparison with prior page-granularity aware prefetching approach

Chapter 7Conclusions and Future Work
In the widely popular domain of user-interactive workloads, this proposal identifies that the
workloads expend different amount of energy/work on different components in the edge and
cloud server devices. The first two optimizations, LOST and CritIC conclusively show that one
can reduce the edge CPU work by up to 25% by offloading many parts of the CPU execution to
our novel LOST accelerators and an addition 12.6% by recompiling the binary using our pro-
posed CritIC compiler pass – that halves the front end bottleneck for critical instruction chains.
These target the single biggest component of work done during user-interactive app executions
and demonstrate that we can automatically identify LOST acceleration opportunities, and Crit-
ical Instruction Chains by thorough offline analysis of execution traces and also propose the
frameworks for achieving these gains in the future for other emerging workloads and translating
the speedups to significant energy savings.
The third optimization, SNIP targets the entire execution pipeline in an edge device specif-
ically for the intense user-interaction based hugely popular domain of gaming and shows that
we can extend the battery for playing games by 32% on an average by just selectively short-
circuiting the redundant event processing.
When the user-interactive applications offload computations such as finding the shortest
route, etc. to the cloud, our fourth OppoRel optimization addresses the data access inefficiency
of GPU executions found in the CPU-GPU based servers, by opportunistically picking and pack-

130
ing only the useful data needed by GPU executions at the host, before transferring them to the
GPU memory, and speeds up the execution by 34%.
Overall, LOST + CritIC + SNIP + OppoRel can holistically optimize the entire user-interactive
workload execution stack at different parts to tackle both their compute and memory require-
ments.
In the future, user-interactive workloads and their optimizations are going to involve much
more data processing, reliance on AI and approximations.
7.1 Addressing Frontend bottlenecks in cloud with CritIC
A significant problem faced in the recent times by cloud applications is severe front end bott-
lencks [32, 269]. The CritIC approach proposed for optimizing mobile workload execution in
Chapter 4 is a software based approach that can easily be extended to cloud systems using a
similar profiling-compiling approach, to alleviate the front end bottlenecks at the cloud.
7.2 AI based system optimizations
We have already shown the potential that AI can offer to optimize the execution of an user
interactive workload. With the cloud growing closer to the devices, techniques such as federated
ML, where the indivdual devices can actively profile their respective user characteristics send
the inputs to the cloud at a much finer granularity (cycle level, memory request level, etc.).
At the cloud, due to the emergence of ubiquitous TPU like architectures, the learning can also
speedup and can detect/react to erroneous short-circuits faster – and even avoid error propagation
reactively to many other users [187].
7.3 Approximations on user-interactions
User interactions captured using sensors are already approximated to certain extents. While the
ML approach in SNIP leverages this to favor execution efficiency, the potential of erroneous out-

131
puts limits its use in other domains than games as of now. In the future, with further knowledge
on user interactions to specific domains such as productivity, banking, etc., we can actually make
cautious decisions on whether we can approximate or not – and still leverage the energy savings
from short-circuiting redundant event processing.
7.4 System optimizations using data relayout
Our OppoRel optimizations throws light on the problems posed by plain adaptations of generic
CPU based systems towards the emerging heterogenous compute systems. We show the poten-
tial for a well-managed memory system to achieve up to 60% execution speedup with a pure
software approach that makes use of the otherwise idle CPU cores. In the future, with the ever-
increasing amount of data captured from various edge/cloud devices, processing them needs as
much compute power as possible. While this challenge for processing very large volumes of
data is being addressed today with many new and old compute hardwares such as multiproces-
sor CPUs, GPUs, FPGAs, TPUs, ASICs and other devices such as wafer scale systems [88], etc.,
the interface to communicate and share work amongst these different devices is nascent. While
new heterogenity enabling interfaces such as a smart DMA, processing in memory based relay-
out techniques, smart address translation engines, etc. can play a vital role at the hardware side,
techniques such as OppoRel in Chapter 6 demonstrated significant performance gains by en-
abling the heterogenous data processing completely at the software – while exploiting spare/idle
cycles of the available resources for making the interface efficient. In the future, one can sim-
ply extend the ideas demonstrated between a CPU-GPU heterogenous computing platform to a
more sophisticated CPU - GPU - TPU - FPGA - ASIC - etc., for improving the interaction and
co-processing efficiencies.
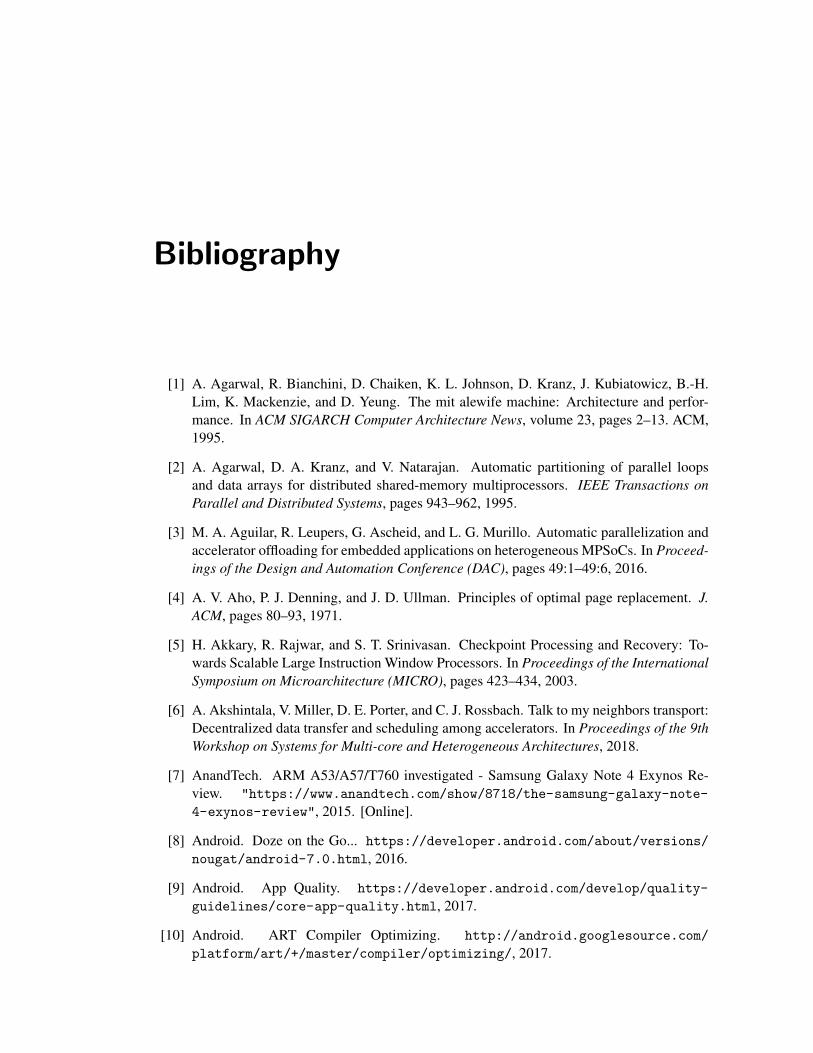
Bibliography
[1] A. Agarwal, R. Bianchini, D. Chaiken, K. L. Johnson, D. Kranz, J. Kubiatowicz, B.-H.Lim, K. Mackenzie, and D. Yeung. The mit alewife machine: Architecture and perfor-mance. In ACM SIGARCH Computer Architecture News, volume 23, pages 2–13. ACM,1995.
[2] A. Agarwal, D. A. Kranz, and V. Natarajan. Automatic partitioning of parallel loopsand data arrays for distributed shared-memory multiprocessors. IEEE Transactions onParallel and Distributed Systems, pages 943–962, 1995.
[3] M. A. Aguilar, R. Leupers, G. Ascheid, and L. G. Murillo. Automatic parallelization andaccelerator offloading for embedded applications on heterogeneous MPSoCs. In Proceed-ings of the Design and Automation Conference (DAC), pages 49:1–49:6, 2016.
[4] A. V. Aho, P. J. Denning, and J. D. Ullman. Principles of optimal page replacement. J.ACM, pages 80–93, 1971.
[5] H. Akkary, R. Rajwar, and S. T. Srinivasan. Checkpoint Processing and Recovery: To-wards Scalable Large Instruction Window Processors. In Proceedings of the InternationalSymposium on Microarchitecture (MICRO), pages 423–434, 2003.
[6] A. Akshintala, V. Miller, D. E. Porter, and C. J. Rossbach. Talk to my neighbors transport:Decentralized data transfer and scheduling among accelerators. In Proceedings of the 9thWorkshop on Systems for Multi-core and Heterogeneous Architectures, 2018.
[7] AnandTech. ARM A53/A57/T760 investigated - Samsung Galaxy Note 4 Exynos Re-view. "https://www.anandtech.com/show/8718/the-samsung-galaxy-note-
4-exynos-review", 2015. [Online].
[8] Android. Doze on the Go... https://developer.android.com/about/versions/
nougat/android-7.0.html, 2016.
[9] Android. App Quality. https://developer.android.com/develop/quality-
guidelines/core-app-quality.html, 2017.
[10] Android. ART Compiler Optimizing. http://android.googlesource.com/
platform/art/+/master/compiler/optimizing/, 2017.

133
[11] Android. Monkeyrunner. https://developer.android.com/studio/test/
monkeyrunner/index.html, 2017.
[12] Android. Power management — Android. https://developer.android.com/
about/versions/pie/power, 2018.
[13] Android. android.hardware.SensorManager. https://developer.android.com/
reference/android/hardware/SensorManager, 2019. [Online].
[14] Android. android.os.BatteryManager. https://developer.android.com/
reference/android/os/BatteryManager, 2019.
[15] Android. Gesture Navigation: A Backstory. https://android-developers.
googleblog.com/2019/08/gesture-navigation-backstory.html, 2019.
[16] Android. Inspect energy use with Energy Profiler. https://developer.android.com/studio/profile/energy-profiler, 2019.
[17] Android. Top Charts – Android Apps on Google Play. https://play.google.com/
store/apps/top/category/GAME, 2019.
[18] Android Studio. Android Debug Bridge (adb). https://developer.android.com/
studio/command-line/adb, 2019.
[19] Apache. spark.api.java.JavaPairRDD. https://spark.apache.org/docs/0.7.2/
api/core/spark/api/java/JavaPairRDD.html, 2016.
[20] Apple. App Review. https://developer.apple.com/app-store/review/, 2017.
[21] K. L. Aragon. Candy Crush Saga. https://play.google.com/store/apps/
details?id=com.king.candycrushsaga, 2019.
[22] ARM. ARM architecture reference manual. In Technical Reference Manual, 2014.
[23] ARM. ARM big.LITTLE Technology. In Technical Reference Manual, 2014.
[24] arm.com. Cortex-A35. "https://developer.arm.com/products/processors/
cortex-a/cortex-a35", 2018. [Online].
[25] arm.com. Cortex-A55. "https://developer.arm.com/products/processors/
cortex-a/cortex-a55", 2018. [Online].
[26] arm.com. Cortex-A75. "https://developer.arm.com/products/processors/
cortex-a/cortex-a75", 2018. [Online].
[27] V. Atlidakis, J. Andrus, R. Geambasu, D. Mitropoulos, and J. Nieh. POSIX Abstractionsin Modern Operating Systems: The Old, the New, and the Missing. In Proceedings of theEleventh European Conference on Computer Systems, pages 19:1–19:17, 2016.
[28] R. Ausavarungnirun, J. Landgraf, V. Miller, S. Ghose, J. Gandhi, C. J. Rossbach, andO. Mutlu. Mosaic: Enabling application-transparent support for multiple page sizes inthroughput processors. ACM SIGOPS Operating Systems Review, pages 27–44, 2018.
134
[29] R. Ausavarungnirun, V. Miller, J. Landgraf, S. Ghose, J. Gandhi, A. Jog, C. J. Rossbach,and O. Mutlu. Mask: Redesigning the gpu memory hierarchy to support multi-applicationconcurrency. In Proceedings of the International Conference on Architectural Support forProgramming Languages and Operating Systems (ASPLOS), pages 503–518, 2018.
[30] A. Authority. Android Q has a native screen recorder, but its pretty roughfor now. https://www.androidauthority.com/android-q-screen-recorder-
965837/, 2019. [Online].
[31] aws.amazon.com. Aws pricing. https://us-east-2.console.aws.amazon.com/
ec2/v2/home?region=us-east-2#LaunchInstanceWizard:, 2019.
[32] G. Ayers, N. P. Nagendra, D. I. August, H. K. Cho, S. Kanev, C. Kozyrakis, T. Krishna-murthy, H. Litz, T. Moseley, and P. Ranganathan. AsmDB: understanding and mitigatingfront-end stalls in warehouse-scale computers. In Proceedings of the International Sym-posium on Computer Architecture (ISCA), pages 462–473. ACM, 2019.
[33] A. Badam, R. Chandra, J. Dutra, A. Ferrese, S. Hodges, P. Hu, J. Meinershagen, T. Mosci-broda, B. Priyantha, and E. Skiani. Software defined batteries. In Proceedings of theSymposium on Operating Systems Principles (SOSP), pages 215–229, 2015.
[34] A. Bakhoda, G. L. Yuan, W. W. Fung, H. Wong, and T. M. Aamodt. Analyzing cudaworkloads using a detailed gpu simulator. In 2009 IEEE International Symposium onPerformance Analysis of Systems and Software, pages 163–174. IEEE, 2009.
[35] M. Bakhshalipour, M. Shakerinava, P. Lotfi-Kamran, and H. Sarbazi-Azad. Bingo SpatialData Prefetcher. In Proceedings of the International Symposium on High-PerformanceComputer Architecture (HPCA), pages 399–411, 2019.
[36] S. Balakrishnan and G. S. Sohi. Exploiting value locality in physical register files. InProceedings of the International Symposium on Microarchitecture (MICRO), pages 265–276, 2003.
[37] T. W. Barr, A. L. Cox, and S. Rixner. Translation caching: skip, don’t walk (the pagetable). Proceedings of the International Symposium on Computer Architecture (ISCA),38(3):48–59, 2010.
[38] L. A. Barroso and U. Holzle. The case for energy-proportional computing. 2007.
[39] M. Bauer, H. Cook, and B. Khailany. Cudadma: Optimizing gpu memory bandwidth viawarp specialization. In Proceedings of 2011 International Conference for High Perfor-mance Computing, Networking, Storage and Analysis, pages 12:1–12:11, 2011.
[40] L. A. Belady. A study of replacement algorithms for a virtual-storage computer. IBMSystems Journal, pages 78–101, 1966.
[41] F. Bellard. Qemu, a fast and portable dynamic translator. In ATC, ATEC, 2005.
[42] E. Bhatia, G. Chacon, S. Pugsley, E. Teran, P. V. Gratz, and D. A. Jimenez. Perceptron-based Prefetch Filtering. In Proceedings of the International Symposium on ComputerArchitecture (ISCA), pages 1–13, 2019.

135
[43] P. Bhatotia, R. Rodrigues, and A. Verma. Shredder: Gpu-accelerated incremental storageand computation. In FAST, volume 14, page 14, 2012.
[44] A. Bhattacharjee. Breaking the address translation wall by accelerating memory replays.IEEE Micro, pages 69–78, May 2018.
[45] C. Bienia, S. Kumar, J. P. Singh, and K. Li. The PARSEC Benchmark Suite: Characteri-zation and Architectural Implications. In Proceedings of the International Conference onParallel Architecture and Compilation Techniques (PACT), pages 72–81, 2008.
[46] N. Binkert, B. Beckmann, G. Black, S. K. Reinhardt, A. Saidi, A. Basu, J. Hestness, D. R.Hower, T. Krishna, S. Sardashti, R. Sen, K. Sewell, M. Shoaib, N. Vaish, M. D. Hill, andD. A. Wood. The gem5 simulator. SIGARCH Comput. Archit. News, 39(2):1–7, Aug.2011.
[47] D. Boggs, G. Brown, B. Rozas, N. Tuck, and K. S. Venkatraman. NVIDIA’s Denverprocessor. HOTChips, pages 86–95, 2011.
[48] A. Boroumand, S. Ghose, Y. Kim, R. Ausavarungnirun, E. Shiu, R. Thakur, D. Kim,A. Kuusela, A. Knies, P. Ranganathan, and O. Mutlu. Google Workloads for ConsumerDevices: Mitigating Data Movement Bottlenecks. In Proceedings of the InternationalConference on Architectural Support for Programming Languages and Operating Systems(ASPLOS), pages 316–331, 2018.
[49] L. Breiman. Random forests. Machine learning, pages 5–32, 2001.
[50] M. D. Brown, J. Stark, and Y. N. Patt. Select-free instruction scheduling logic. In Pro-ceedings of the International Symposium on Microarchitecture (MICRO), pages 204–213,2001.
[51] I. Brumar, M. Casas, M. Moreto, M. Valero, and G. S. Sohi. ATM: Approximate TaskMemoization in the Runtime System. In 2017 IEEE International Parallel and DistributedProcessing Symposium (IPDPS), pages 1140–1150, 2017.
[52] T. E. Carlson, W. Heirman, O. Allam, S. Kaxiras, and L. Eeckhout. The Load SliceCore microarchitecture. In Proceedings of the International Symposium on ComputerArchitecture (ISCA), pages 272–284, 2015.
[53] E. Catto. Box 2D, A 2D physics engine for games. https://github.com/erincatto/Box2D, 2015.
[54] C. Celio, P. Dabbelt, D. A. Patterson, and K. Asanovic. The Renewed Case for the Re-duced Instruction Set Computer: Avoiding ISA Bloat with Macro-Op Fusion for RISC-V.arXiv preprint arXiv:1607.02318, 2016.
[55] G. Chadha, S. Mahlke, and S. Narayanasamy. Efetch: Optimizing instruction fetch forevent-driven web applications. In Proceedings of the International Conference on ParallelArchitecture and Compilation Techniques (PACT), pages 75–86, Aug 2014.
136
[56] G. Chadha, S. Mahlke, and S. Narayanasamy. Accelerating Asynchronous ProgramsThrough Event Sneak Peek. In Proceedings of the International Symposium on ComputerArchitecture (ISCA), pages 642–654, 2015.
[57] S. G. Chandar, M. Mehendale, and R. Govindarajan. Area and Power Reduction ofEmbedded DSP Systems Using Instruction Compression and Re-configurable Encod-ing. In IEEE/ACM International Conference on Computer Aided Design. ICCAD 2001.IEEE/ACM Digest of Technical Papers (Cat. No.01CH37281), pages 631–634, 2001.
[58] N. Chandramoorthy, G. Tagliavini, K. Irick, A. Pullini, S. Advani, S. A. Habsi, M. Cot-ter, J. Sampson, V. Narayanan, and L. Benini. Exploring architectural heterogeneityin intelligent vision systems. In Proceedings of the International Symposium on High-Performance Computer Architecture (HPCA), pages 1–12, 2015.
[59] N. Chatterjee, M. O’Connor, G. H. Loh, N. Jayasena, and R. Balasubramonian. Managingdram latency divergence in irregular gpgpu applications. In Proceedings of the Interna-tional Conference for High Performance Computing, Networking, Storage and Analysis,pages 128–139, 2014.
[60] S. Chaudhry, R. Cypher, M. Ekman, M. Karlsson, A. Landin, S. Yip, H. Zeffer, andM. Tremblay. Rock: A High-Performance Sparc CMT Processor. IEEE Micro, pages6–16, 2009.
[61] S. Che, M. Boyer, J. Meng, D. Tarjan, J. W. Sheaffer, S.-H. Lee, and K. Skadron. Rodinia:A benchmark suite for heterogeneous computing. In Proceedings of the InternationalSymposium on Workload Characterization (IISWC), pages 44–54, 2009.
[62] S. Che, J. W. Sheaffer, and K. Skadron. Dymaxion: Optimizing memory access patternsfor heterogeneous systems. In Proceedings of 2011 International Conference for HighPerformance Computing, Networking, Storage and Analysis, SC ’11, pages 13:1–13:11,2011.
[63] G. Chen, B. Wu, D. Li, and X. Shen. Porple: An extensible optimizer for portable dataplacement on gpu. In Proceedings of the International Symposium on Microarchitecture(MICRO), pages 88–100, 2014.
[64] L. Chen, B. Shou, X. Hou, and L. Huang. A compiler-assisted runtime-prefetchingscheme for heterogeneous platforms. In B. M. Chapman, F. Massaioli, M. S. Muller, andM. Rorro, editors, OpenMP in a Heterogeneous World, pages 116–129. Springer BerlinHeidelberg, 2012.
[65] L. Chen, J. Tarango, T. Mitra, and P. Brisk. A just-in-time customizable processor. InProceedings of the International Conference on Computer-Aided Design (ICCAD), pages524–531, 2013.
[66] T. Chen, Z. Du, N. Sun, J. Wang, C. Wu, Y. Chen, and O. Temam. DianNao: a small-footprint high-throughput accelerator for ubiquitous machine-learning. In Proceedings ofthe International Conference on Architectural Support for Programming Languages andOperating Systems (ASPLOS), pages 269–284, 2014.
137
[67] T.-F. Chen and J.-L. Baer. Effective hardware-based data prefetching for high-performance processors. IEEE transactions on computers, 44(5):609–623, 1995.
[68] N. Chidambaram Nachiappan, P. Yedlapalli, N. Soundararajan, A. Sivasubramaniam,M. Kandemir, and C. R. Das. GemDroid: A framework to evaluate mobile platforms.In Proceedings of the International Conference on Measurement and Modeling of Com-puter Systems (SIGMETRICS), 2014.
[69] J. Clemons, A. Jones, R. Perricone, S. Savarese, and T. Austin. EFFEX: An EmbeddedProcessor for Computer Vision Based Feature Extraction. In Proceedings of the Designand Automation Conference (DAC), pages 1020–1025, 2011.
[70] J. D. Collins, D. M. Tullsen, H. Wang, and J. P. Shen. Dynamic Speculative Precompu-tation. In Proceedings of the International Symposium on Microarchitecture (MICRO),pages 306–317, 2001.
[71] J. Cong, B. Grigorian, G. Reinman, and M. Vitanza. Accelerating vision and naviga-tion applications on a customizable platform. In Proceedings of the International Confer-ence on Application-specific Systems, Architectures and Processors (ASAP), pages 25–32,2011.
[72] D. A. Conners and W. W. Hwu. Compiler-directed dynamic computation reuse: rationaleand initial results. In Proceedings of the International Symposium on Microarchitecture(MICRO), pages 158–169, 1999.
[73] K. D. Cooper and N. McIntosh. Enhanced Code Compression for Embedded RISC Pro-cessors. Proceedings of the ACM SIGPLAN 1999 Conference on Programming LanguageDesign and Implementation, pages 139–149, 1999.
[74] I. Coorporation. An introduction to the intel R© quickpath interconnect, 2013.
[75] R. E. Corporation. Angry Birds Evolution. https://play.google.com/store/apps/details?id=com.rovio.tnt, 2019.
[76] A. L. Cox and R. J. Fowler. Adaptive cache coherency for detecting migratory shareddata. SIGARCH Comput. Archit. News, pages 98–108, May 1993.
[77] S. R. Cray. Computer Vector Register Processing, 1976. US Patent 4,128,880.
[78] W. J. Dally and B. Towles. Route packets, not wires: on-chip inteconnection networks.In Proceedings of the Design and Automation Conference (DAC), pages 684–689. Acm,2001.
[79] A. Danalis, G. Marin, C. McCurdy, J. S. Meredith, P. C. Roth, K. Spafford, V. Tipparaju,and J. S. Vetter. The scalable heterogeneous computing (shoc) benchmark suite. In Pro-ceedings of the 3rd Workshop on General-Purpose Computation on Graphics ProcessingUnits, pages 63–74, 2010.
[80] A. Danalis, G. Marin, C. McCurdy, J. S. Meredith, P. C. Roth, K. Spafford, V. Tippa-raju, and J. S. Vetter. shoc/qtclustering. https://github.com/vetter/shoc/tree/
master/src/cuda/level2/qtclustering, 2014.

138
[81] P. J. Denning. The working set model for program behavior. In Proceedings of the FirstACM Symposium on Operating System Principles, SOSP ’67, pages 15.1–15.12, 1967.
[82] Y. Ding and Z. Li. A compiler scheme for reusing intermediate computation results.In Proceedings of the International Symposium on Code Generation and Optimization(CGO), pages 277–288, 2004.
[83] Z. Du, D. D. Ben-Dayan Rubin, Y. Chen, L. He, T. Chen, L. Zhang, C. Wu, and O. Temam.Neuromorphic accelerators: A comparison between neuroscience and machine-learningapproaches. In Proceedings of the International Symposium on Microarchitecture (MI-CRO), pages 494–507, 2015.
[84] Z. Du, R. Fasthuber, T. Chen, P. Ienne, L. Li, T. Luo, X. Feng, Y. Chen, and O. Temam.ShiDianNao: Shifting Vision Processing Closer to the Sensor. Proceedings of the Inter-national Symposium on Computer Architecture (ISCA), pages 92–104, 2015.
[85] U. Engine. What is Unreal Engine 4. https://www.unrealengine.com, 2019.
[86] H. Esmaeilzadeh, A. Sampson, L. Ceze, and D. Burger. Neural acceleration for general-purpose approximate programs. In Proceedings of the International Symposium on Mi-croarchitecture (MICRO), pages 449–460, 2012.
[87] N. Fauzia, L.-N. Pouchet, and P. Sadayappan. Characterizing and enhancing global mem-ory data coalescing on gpus. In Proceedings of the 13th Annual IEEE/ACM InternationalSymposium on Code Generation and Optimization, CGO ’15, pages 12–22, 2015.
[88] Feldman, Andrew. Cerebras Wafer Scale Engine: Why we need big chips forDeep Learning. https://www.cerebras.net/cerebras-wafer-scale-engine-
why-we-need-big-chips-for-deep-learning/, 2019.
[89] B. Fields, R. Bodik, and M. D. Hill. Slack: Maximizing Performance Under Technologi-cal Constraints. In Proceedings of the International Symposium on Computer Architecture(ISCA), pages 47–58, 2002.
[90] B. Fields, S. Rubin, and R. Bodik. Focusing Processor Policies via Critical-path Predic-tion. In Proceedings 28th Annual International Symposium on Computer Architecture,pages 74–85, 2001.
[91] N. Firasta, M. Buxton, P. Jinbo, K. Nasri, and S. Kuo. Intel AVX: New frontiers inperformance improvements and energy efficiency. Intel white paper, 2008.
[92] A. Fisher, C. Rudin, and F. Dominici. All Models are Wrong but many are Useful: Vari-able Importance for Black-Box, Proprietary, or Misspecified Prediction Models, usingModel Class Reliance. arXiv e-prints, page arXiv:1801.01489, Jan 2018.
[93] J. A. Fisher. Very Long Instruction Word Architectures and the ELI-512. In Proceedingsof the International Symposium on Computer Architecture (ISCA), pages 140–150, 1983.
139
[94] B. R. Fisk and R. I. Bahar. The Non-critical Buffer: Using Load Latency Tolerance toImprove Data Cache Efficiency. In Proceedings 1999 IEEE International Conferenceon Computer Design: VLSI in Computers and Processors (Cat. No.99CB37040), pages538–545, 1999.
[95] Forbes Inc. 10 charts that will change your perspective of big data’s growth. https:
//www.forbes.com/sites/louiscolumbus/2018/05/23/10-charts-that-
will-change-your-perspective-of-big-datas-growth/#5858c9b62926, 2018.
[96] A. Fuchs and D. Wentzlaff. Scaling Datacenter Accelerators with Compute-Reuse Ar-chitectures. In Proceedings of the International Symposium on Computer Architecture(ISCA), pages 353–366, June 2018.
[97] F. Gabbay and A. Mendelson. The Effect of Instruction Fetch Bandwidth on Value Pre-diction. SIGARCH Comput. Archit. News, pages 272–281, 1998.
[98] M. Galles. Spider: a high-speed network interconnect. IEEE Micro, pages 34–39, Jan1997.
[99] H. Games. Race Kings. https://play.google.com/store/apps/details?id=
com.hutchgames.racingnext, 2019.
[100] G. Gammie, N. Ickes, M. E. Sinangil, R. Rithe, J. Gu, A. Wang, H. Mair, S. Datla,B. Rong, S. Honnavara-Prasad, L. Ho, G. Baldwin, D. Buss, A. P. Chandrakasan, andU. Ko. A 28nm 0.6v low-power dsp for mobile applications. In 2011 IEEE InternationalSolid-State Circuits Conference, pages 132–134, Feb 2011.
[101] E. Gelenbe and J. C. A. Tiberio, P.and Boekhorst. Page size in demand-paging systems.Acta Informatica, pages 1–23, Mar 1973.
[102] S. Ghose, H. Lee, and J. F. Martınez. Improving Memory Scheduling via Processor-side Load Criticality Information. In Proceedings of the International Symposium onComputer Architecture (ISCA), pages 84–95, 2013.
[103] GNU. Dma api. https://www.kernel.org/doc/Documentation/DMA-API-HOWTO.txt.
[104] S. C. Goldstein, H. Schmit, M. Moe, M. Budiu, S. Cadambi, R. R. Taylor, and R. Laufer.Piperench: A coprocessor for streaming multimedia acceleration. In Proceedings of theInternational Symposium on Computer Architecture (ISCA), 1999.
[105] C. Gonzlez-lvarez, J. B. Sartor, C. lvarez, D. Jimnez-Gonzlez, and L. Eeckhout. Auto-matic Design of Domain-specific Instructions for Low-power Processors. In 2015 IEEE26th International Conference on Application-specific Systems, Architectures and Proces-sors (ASAP), pages 1–8, 2015.
[106] J. Goodman and H. Hum. Mesif: A two-hop cache coherency protocol for point-to-pointinterconnects (2004). Technical report, 2004.

140
[107] J. R. Goodman. Using cache memory to reduce processor-memory traffic. SIGARCHComput. Archit. News, pages 124–131, June 1983.
[108] J. R. Goodman, M. K. Vernon, and P. J. Woest. Efficient synchronization primitives forlarge-scale cache-coherent multiprocessors. SIGARCH Comput. Archit. News, pages 64–75, Apr. 1989.
[109] Google. Google Play. https://play.google.com/store?hl=en, 2016.
[110] Google. Android Developer Reference Doc. https://developer.android.com/
reference/packages.html, 2017.
[111] Google. Android Open Source Project (AOSP). https://github.com/android, 2017.
[112] Google. Android Studio. https://developer.android.com/studio/index.html,2017.
[113] Google. What do 50 million drawings look like? https://github.com/
googlecreativelab/quickdraw-dataset, 2018.
[114] Google. Android Hardware Abstraction Layer (HAL). https://source.android.
com/devices/architecture/hal, 2019.
[115] Google. Binder. "https://developer.android.com/reference/android/os/
Binder", 2019. [Online].
[116] N. Goulding-Hotta, J. Sampson, G. Venkatesh, S. Garcia, J. Auricchio, P. C. Huang,M. Arora, S. Nath, V. Bhatt, J. Babb, S. Swanson, and M. Taylor. The GreenDroid mobileapplication processor: An architecture for silicon’s dark future. IEEE Micro, 31:86–95,2011.
[117] A. G. Gounares, Y. Li, C. D. Garrett, and M. D. Noakes. Memoizing with read only sideeffects, Sept. 2 2014. US Patent 8,826,254.
[118] V. Govindaraju, C. H. Ho, and K. Sankaralingam. Dynamically specialized datapathsfor energy efficient computing. In Proceedings of the International Symposium on High-Performance Computer Architecture (HPCA), 2011.
[119] A. Greenberg, J. Hamilton, D. A. Maltz, and P. Patel. The cost of a cloud: Researchproblems in data center networks. SIGCOMM Comput. Commun. Rev., pages 68–73,2008.
[120] W. D. Gropp, W. Gropp, E. Lusk, and A. Skjellum. Using MPI: portable parallel pro-gramming with the message-passing interface, volume 1. MIT press, 1999.
[121] K. Group. The open standard for parallel programming of heterogeneous systems.https://www.khronos.org/opencl/, 2019.
[122] S. Gupta, S. Feng, A. Ansari, S. Mahlke, and D. August. Bundled execution of recurringtraces for energy-efficient general purpose processing. In Proceedings of the InternationalSymposium on Microarchitecture (MICRO), 2011.

141
[123] Haibo Zhang and Prasanna Venkatesh Rengasamy and Nachiappan Chidambaram Nachi-appan and Shulin Zhao and Anand Sivasubramaniam and Mahmut Kandemir and ChitaR. Das. FLOSS: FLOw Sensitive Scheduling on Mobile Platforms. In Proceedings of theDesign and Automation Conference (DAC), 2018.
[124] Haibo Zhang and Prasanna Venkatesh Rengasamy and Shulin Zhao and Nachiappan Chi-dambaram Nachiappan and Anand Sivasubramaniam and Mahmut Kandemir and RaviIyer and Chita R. Das. Race-To-Sleep + Content Caching + Display Caching: A Recipefor Energy-efficient Video Streaming on Handhelds . In Proceedings of the InternationalSymposium on Microarchitecture (MICRO), Oct 2017.
[125] M. Halpern, Y. Zhu, and V. J. Reddi. Mobile CPU’s Rise to Power: Quantifying theImpact of Generational Mobile CPU Design Trends on Performance, Energy, and UserSatisfaction. In Proceedings of the International Symposium on High-Performance Com-puter Architecture (HPCA), pages 64–76, 2016.
[126] S. Haria, M. D. Hill, and M. M. Swift. Devirtualizing memory in heterogeneous systems.In Proceedings of the International Conference on Architectural Support for Program-ming Languages and Operating Systems (ASPLOS), pages 637–650, 2018.
[127] M. Hashemi, K. Swersky, J. A. Smith, G. Ayers, H. Litz, J. Chang, C. Kozyrakis, andP. Ranganathan. Learning memory access patterns. arXiv preprint arXiv:1803.02329,2018.
[128] S. Hauck, T. W. Fry, M. M. Hosler, and J. P. Kao. The chimaera reconfigurable functionalunit. IEEE Transactions on Very Large Scale Integration (VLSI) Systems, 12(2), Feb 2004.
[129] K. Hazelwood and A. Klauser. A Dynamic Binary Instrumentation Engine for the ARMArchitecture. In Proceedings of the 2006 International Conference on Compilers, Archi-tecture and Synthesis for Embedded Systems, pages 261–270, 2006.
[130] B. He, N. K. Govindaraju, Q. Luo, and B. Smith. Efficient gather and scatter operationson graphics processors. In Proceedings of the 2007 ACM/IEEE Conference on Supercom-puting, SC ’07, 2007.
[131] J. L. Henning. SPEC CPU2006 Benchmark Descriptions. SIGARCH Comput. Archit.News, pages 1–17, 2006.
[132] A. Holey, V. Mekkat, P.-C. Yew, and A. Zhai. Performance-Energy Considerations forShared Cache Management in a Heterogeneous Multicore Processor. ACM Transactionson Architecture and Code Optimization (TACO), pages 3:1–3:29, 2015.
[133] I. Hong, J. Clemons, R. Venkatesan, I. Frosio, B. Khailany, and S. W. Keckler. A real-timeenergy-efficient superpixel hardware accelerator for mobile computer vision applications.In Proceedings of the Design and Automation Conference (DAC), pages 95:1–95:6, 2016.
[134] C.-H. Hsiao, J. Yu, S. Narayanasamy, Z. Kong, C. L. Pereira, G. A. Pokam, P. M. Chen,and J. Flinn. Race Detection for Event-driven Mobile Applications. In Proceedings ofthe ACM SIGPLAN Conference on Programming Language Design and Implementation(PLDI), pages 326–336, 2014.
142
[135] J. Hu, A. Shearer, S. Rajagopalan, and R. LiKamWa. Banner – an image sensor recon-figuration framework for seamless resolution-based tradeoffs (video). In Proceedings ofthe ACM Annual International Conference on Mobile Systems, Applications, and Services(MOBISYS), pages 705–706, 2019.
[136] C. T. Huang, M. Tikekar, C. Juvekar, V. Sze, and A. Chandrakasan. A 249mpixel/s hevcvideo-decoder chip for quad full hd applications. In 2013 IEEE International Solid-StateCircuits Conference Digest of Technical Papers, pages 162–163, Feb 2013.
[137] J. Huh, C. Kim, H. Shafi, L. Zhang, D. Burger, and S. W. Keckler. A nuca substratefor flexible cmp cache sharing. IEEE Transactions on Parallel and Distributed Systems,pages 1028–1040, 2007.
[138] N. Ickes, G. Gammie, M. E. Sinangil, R. Rithe, J. Gu, A. Wang, H. Mair, S. Datla,B. Rong, S. Honnavara-Prasad, L. Ho, G. Baldwin, D. Buss, A. P. Chandrakasan, andU. Ko. A 28 nm 0.6 V low power DSP for mobile applications. IEEE Journal of Solid-State Circuits, 47(1), 2012.
[139] A. Inc. Nexus 7 Tablet Specifications. https://goo.gl/aPRBuw, 2013.
[140] C. IP. Tensilica Custimizable Processor and DSP IP. https://ip.cadence.com/
ipportfolio/tensilica-ip, 2017.
[141] A. Jain, R. Bansal, A. Kumar, and K. Singh. A comparative study of visual and auditoryreaction times on the basis of gender and physical activity levels of medical first yearstudents. International Journal of Applied and Basic Medical Research, page 124, 2015.
[142] A. Jain and C. Lin. Rethinking Beladys Algorithm to Accommodate Prefetching. InProceedings of the International Symposium on Computer Architecture (ISCA), 2018.
[143] N. E. Jerger, A. Kannan, Z. Li, and G. H. Loh. Noc architectures for silicon interposersystems: Why pay for more wires when you can get them (from your interposer) for free?In Proceedings of the International Symposium on Microarchitecture (MICRO), pages458–470. IEEE, 2014.
[144] Z. Jia, M. Maggioni, B. Staiger, and D. P. Scarpazza. Dissecting the nvidia volta gpuarchitecture via microbenchmarking. arXiv preprint arXiv:1804.06826, 2018.
[145] D. A. Jimenez and C. Lin. Dynamic branch prediction with perceptrons. In Proceedingsof the International Symposium on High-Performance Computer Architecture (HPCA),pages 197–206, 2001.
[146] A. Jog, O. Kayiran, N. Chidambaram Nachiappan, A. K. Mishra, M. T. Kandemir,O. Mutlu, R. Iyer, and C. R. Das. Owl: Cooperative thread array aware scheduling tech-niques for improving gpgpu performance. Proceedings of the International Conferenceon Architectural Support for Programming Languages and Operating Systems (ASPLOS),pages 395–406, 2013.
143
[147] N. P. Jouppi. Improving direct-mapped cache performance by the addition of a small fully-associative cache and prefetch buffers. In Proceedings of the International Symposium onComputer Architecture (ISCA), pages 364–373, 1990.
[148] S. Kamil, K. Datta, S. Williams, L. Oliker, J. Shalf, and K. Yelick. Implicit and explicitoptimizations for stencil computations. In Proceedings of the 2006 workshop on Memorysystem performance and correctness, pages 51–60. ACM, 2006.
[149] C. N. Keltcher, K. J. McGrath, A. Ahmed, and P. Conway. The amd opteron processorfor multiprocessor servers. IEEE Micro, pages 66–76, 2003.
[150] D. R. Kerns and S. J. Eggers. Balanced Scheduling: Instruction Scheduling when MemoryLatency is Uncertain. In Proceedings of the ACM SIGPLAN Conference on ProgrammingLanguage Design and Implementation (PLDI), pages 278–289, 1993.
[151] F. Khorasani, K. Vora, R. Gupta, and L. N. Bhuyan. Cusha: vertex-centric graph process-ing on gpus. In Proceedings of the 23rd international symposium on High-performanceparallel and distributed computing, pages 239–252. ACM, 2014.
[152] Khronos. OpenMAX Integration Layer Application Programming Interface Specification,Version 1.2.0 Provisional. https://www.khronos.org/registry/omxil/, 2011.
[153] H. Kim, R. Hadidi, L. Nai, H. Kim, N. Jayasena, Y. Eckert, O. Kayiran, and G. Loh.Coda: Enabling co-location of computation and data for multiple gpu systems. ACMTrans. Archit. Code Optim., pages 32:1–32:23, Sept. 2018.
[154] H.-S. Kim, A. K. Somani, and A. Tyagi. A reconfigurable multi-function computing cachearchitecture. In Proceedings of the International Symposium on Field Programmable GateArrays, pages 85–94, 2000.
[155] J. Kim, S. Seo, J. Lee, J. Nah, G. Jo, and J. Lee. Snucl: an opencl framework for hetero-geneous cpu/gpu clusters. In Proceedings of the 26th ACM international conference onSupercomputing, pages 341–352. ACM, 2012.
[156] J. Kim, E. Teran, P. V. Gratz, D. A. Jimenez, S. H. Pugsley, and C. Wilkerson. Kill theProgram Counter: Reconstructing Program Behavior in the Processor Cache Hierarchy.SIGOPS Oper. Syst. Rev., pages 737–749, 2017.
[157] J. Kloosterman, J. Beaumont, M. Wollman, A. Sethia, R. Dreslinski, T. Mudge, andS. Mahlke. Warppool: Sharing requests with inter-warp coalescing for throughput pro-cessors. In Proceedings of the International Symposium on Microarchitecture (MICRO),pages 433–444, 2015.
[158] V. Kodukula, S. B. Medapuram, B. Jones, and R. LiKamWa. A case for temperature-driven task migration to balance energy efficiency and image quality of vision processingworkloads. In Proceedings of the International Workshop on Mobile Computing Systems& Applications, pages 93–98, 2018.
[159] C. Kozyrakis and D. Patterson. Overcoming the limitations of conventional vector pro-cessors. In ISCA, pages 399–409. ACM, 2003.

144
[160] A. Krishnaswamy and R. Gupta. Profile Guided Selection of ARM and Thumb Instruc-tions. In Proceedings of the Joint Conference on Languages, Compilers and Tools forEmbedded Systems: Software and Compilers for Embedded Systems, LCTES/SCOPES,pages 56–64, 2002.
[161] J. M. Kurtzberg. On the memory conflict problem in multiprocessor systems. IEEETransactions on Computers, pages 286–293, 1974.
[162] R. Kushnarenko. Simple and Beautiful Memory Game for Kids. https://github.com/sromku/memory-game, 2019.
[163] J. Laudon and D. Lenoski. System overview of the sgi origin 200/2000 product line. InCompcon’97. Proceedings, IEEE, pages 150–156. IEEE, 1997.
[164] A. R. Lebeck, J. Koppanalil, T. Li, J. Patwardhan, and E. Rotenberg. A Large, FastInstruction Window for Tolerating Cache Misses. In Proceedings of the InternationalSymposium on Computer Architecture (ISCA), pages 59–70, 2002.
[165] D. Lee, L. Subramanian, R. Ausavarungnirun, J. Choi, and O. Mutlu. Decoupled di-rect memory access: Isolating cpu and io traffic by leveraging a dual-data-port dram. InProceedings of the International Conference on Parallel Architecture and CompilationTechniques (PACT), pages 174–187, Oct. 2015.
[166] C. Lefurgy, P. Bird, I. C. Chen, and T. Mudge. Improving Code Density Using Compres-sion Techniques. In Proceedings of the International Symposium on Microarchitecture(MICRO), pages 194–203, 1997.
[167] C. Lefurgy, E. Piccininni, and T. Mudge. Reducing Code Size with Run-time Decom-pression. In Proceedings of the International Symposium on High-Performance ComputerArchitecture (HPCA), pages 218–228, 2000.
[168] D. Lenoski, M. S. Lam, K. Gharachorloo, M. Horowitz, J. Hennessy, W. Weber,J. Laudon, and A. Gupta. The stanford dash multiprocessor. Computer, pages 63–79,1992.
[169] M. Lentz, J. Litton, and B. Bhattacharjee. Drowsy power management. In SOSP, pages230–244, 2015.
[170] A. Li, S. L. Song, W. Liu, X. Liu, A. Kumar, and H. Corporaal. Locality-aware cta clus-tering for modern gpus. In Proceedings of the International Conference on ArchitecturalSupport for Programming Languages and Operating Systems (ASPLOS), pages 297–311,2017.
[171] C. Li, S. L. Song, H. Dai, A. Sidelnik, S. K. S. Hari, and H. Zhou. Locality-driven dynamicgpu cache bypassing. In Proceedings of the 29th ACM on International Conference onSupercomputing, pages 67–77, 2015.
[172] T. Li, A. R. Lebeck, and D. J. Sorin. Quantifying Instruction Criticality for Shared Mem-ory Multiprocessors. In Proceedings of the Fifteenth Annual ACM Symposium on ParallelAlgorithms and Architectures, pages 128–137, 2003.
145
[173] R. LiKamWa, Y. Hou, J. Gao, M. Polansky, and L. Zhong. RedEye: Analog ConvNetImage Sensor Architecture for Continuous Mobile Vision. In Proceedings of the Interna-tional Symposium on Computer Architecture (ISCA), pages 255–266, 2016.
[174] H. Lim, K. You, and W. Sung. Design and implementation of speech recognition on asoftcore based FPGA. In IEEE International Conference on Acoustics Speech and SignalProcessing Proceedings, volume 3, 2006.
[175] F. X. Lin, Z. Wang, R. LiKamWa, and L. Zhong. Reflex: Using low-power processorsin smartphones without knowing them. In Proceedings of the International Conferenceon Architectural Support for Programming Languages and Operating Systems (ASPLOS),pages 13–24, 2012.
[176] M. H. Lipasti, C. B. Wilkerson, and J. P. Shen. Value locality and load value prediction.ACM SIGPLAN Notices, 31(9):138–147, 1996.
[177] LLVM. Loop invariant code motion pass. http://llvm.org/docs/doxygen/html/
LICM_8cpp_source.html, 2016.
[178] LLVM. Clang: a c language family frontend for llvm. https://clang.llvm.org/,2019.
[179] G. H. Loh, N. E. Jerger, A. Kannan, and Y. Eckert. Interconnect-memory challenges formulti-chip, silicon interposer systems. In Proceedings of the 2015 International Sympo-sium on Memory Systems, pages 3–10, 2015.
[180] G. Long, D. Franklin, S. Biswas, P. Ortiz, J. Oberg, D. Fan, and F. T. Chong. MinimalMulti-threading: Finding and Removing Redundant Instructions in Multi-threaded Pro-cessors. In Proceedings of the International Symposium on Microarchitecture (MICRO),pages 337–348, 2010.
[181] C.-K. Luk. Tolerating memory latency through software-controlled pre-execution in si-multaneous multithreading processors. In Proceedings of the International Symposium onComputer Architecture (ISCA), pages 40–51, June 2001.
[182] C.-K. Luk. Tolerating memory latency through software-controlled pre-execution in si-multaneous multithreading processors. In Proceedings of the International Symposium onComputer Architecture (ISCA), pages 40–51, 2001.
[183] M. Marchetti, L. Kontothanassis, R. Bianchini, and M. L. Scott. Using simple page place-ment policies to reduce the cost of cache fills in coherent shared-memory systems. InProceedings of 9th International Parallel Processing Symposium, pages 480–485, 1995.
[184] C. Margiolas and M. F. P. O’Boyle. Portable and transparent host-device communicationoptimization for gpgpu environments. In Proceedings of the International Symposium onCode Generation and Optimization (CGO), CGO ’14, pages 55:55–55:65, 2014.
[185] J. F. Martınez, J. Renau, M. C. Huang, M. Prvulovic, and J. Torrellas. Cherry: Check-pointed Early Resource Recycling in Out-of-order Microprocessors. In Proceedings ofthe International Symposium on Microarchitecture (MICRO), pages 3–14, 2002.

146
[186] T. Maruyama, T. Yoshida, R. Kan, I. Yamazaki, S. Yamamura, N. Takahashi, M. Hondou,and H. Okano. SPARC64 VIIIfx: a new-generation octocore processor for petascalecomputing. IEEE Micro, 30(2):30–40, 2010.
[187] B. McMahan and D. Ramage. Federated Learning: Collaborative Machine Learning with-out Centralized Training Data. https://ai.googleblog.com/2017/04/federated-learning-collaborative.html, 2019.
[188] T. Messick. A Weirdly Addictive Arcade-style Android Game, Where you Fling Fruit ata Wall. https://github.com/awlzac/greenwall, 2019.
[189] P. Michaud. Best-offset hardware prefetching. In Proceedings of the International Sym-posium on High-Performance Computer Architecture (HPCA), pages 469–480, 2016.
[190] MICRON. Production Data Sheet: 8Gb, 16Gb: 253-Ball, Dual-Channel 2C0F MobileLPDDR3 SDRAM (pdf). "https://goo.gl/JELDcz", 2016. [Online; accessed March-29-2017].
[191] J. S. Miguel, J. Albericio, A. Moshovos, and N. E. Jerger. Doppelganger: a cache forapproximate computing. In Proceedings of the International Symposium on Microarchi-tecture (MICRO), pages 50–61, 2015.
[192] J. S. Miguel, M. Badr, and N. E. Jerger. Load value approximation. In Proceedings of theInternational Symposium on Microarchitecture (MICRO), pages 127–139, Dec 2014.
[193] J. S. Miguel and N. E. Jerger. The anytime automaton. SIGARCH Comput. Archit. News,pages 545–557, June 2016.
[194] C.-J. Mike Liang, H. Xue, M. Yang, and L. Zhou. The Case for Learning-and-SystemCo-design. SIGOPS Oper. Syst. Rev., pages 68–74, 2019.
[195] S. Mittal and J. S. Vetter. A survey of cpu-gpu heterogeneous computing techniques. ACMComput. Surv., pages 69:1–69:35, 2015.
[196] A. Moshovos and G. S. Sohi. Microarchitectural innovations: boosting microprocessorperformance beyond semiconductor technology scaling. Proceedings of the IEEE, pages1560–1575, 2001.
[197] O. Mutlu, J. Stark, C. Wilkerson, and Y. N. Patt. Runahead Execution: An Alternativeto Very Large Instruction Windows for Out-of-order Processors. In Proceedings of theInternational Symposium on High-Performance Computer Architecture (HPCA), pages129–140, 2003.
[198] N. C. Nachiappan, P. Yedlapalli, N. Soundararajan, A. Sivasubramaniam, M. T. Kandemir,R. Iyer, and C. R. Das. Domain knowledge based energy management in handhelds. InProceedings of the International Symposium on High-Performance Computer Architec-ture (HPCA), pages 150–160, 2015.
147
[199] N. C. Nachiappan, H. Zhang, J. Ryoo, N. Soundararajan, A. Sivasubramaniam, M. T.Kandemir, R. Iyer, and C. R. Das. Vip: Virtualizing ip chains on handheld platforms.In Proceedings of the International Symposium on Computer Architecture (ISCA), pages655–667, 2015.
[200] R. Nagarajan, X. Chen, R. G. McDonald, D. Burger, and S. W. Keckler. Critical PathAnalysis of the TRIPS Architecture. In 2006 IEEE International Symposium on Perfor-mance Analysis of Systems and Software, pages 37–47, 2006.
[201] K. J. Nesbit and J. E. Smith. Data cache prefetching using a global history buffer. In Pro-ceedings of the International Symposium on High-Performance Computer Architecture(HPCA), pages 96–96, 2004.
[202] I. Niantic. Pokmon GO. https://play.google.com/store/apps/details?id=
com.nianticlabs.pokemongo, 2019.
[203] A. H. Nodehi Sabet, J. Qiu, and Z. Zhao. Tigr: Transforming irregular graphs for gpu-friendly graph processing. Proceedings of the International Conference on ArchitecturalSupport for Programming Languages and Operating Systems (ASPLOS), pages 622–636,2018.
[204] A. Nohl, F. Schirrmeister, and D. Taussig. Application specific processor design: Archi-tectures, design methods and tools. In Proceedings of the International Conference onComputer-Aided Design (ICCAD), 2010.
[205] T. Nowatzki, V. Gangadhar, and K. Sankaralingam. Exploring the potential of hetero-geneous von Neumann/dataflow execution models. In Proceedings of the InternationalSymposium on Computer Architecture (ISCA), 2015.
[206] NRDC.org. Americas data centers consuming massive and growing amounts of electricity.https://www.nrdc.org/media/2014/140826, 2014.
[207] NVIDIA. V100 gpu architecture. http://images.nvidia.com/content/volta-
architecture/pdf/volta-architecture-whitepaper.pdf, 2017.
[208] NVIDIA. Compute sanitizer api. https://docs.nvidia.com/cuda/compute-
sanitizer/index.html, 2019.
[209] NVIDIA. Cuda c best practices guide. https://docs.nvidia.com/cuda/cuda-c-
best-practices-guide/index.html, 2019.
[210] NVIDIA. Cuda dynamic parallelism api and principles. https://devblogs.nvidia.com/cuda-dynamic-parallelism-api-principles/, 2019.
[211] NVIDIA. Cuda-memcheck. https://docs.nvidia.com/cuda/cuda-memcheck/
index.html, 2019.
[212] NVIDIA. Cuda memory management. https://docs.nvidia.com/cuda/cuda-
runtime-api/group__CUDART__MEMORY.html, 2019.

148
[213] NVIDIA. Cuda toolkit documentation. https://docs.nvidia.com/cuda/cuda-c-
programming-guide/index.html, 2019.
[214] NVIDIA. Use the memory checker. https://docs.nvidia.com/gameworks/
content/developertools/desktop/nsight/use_memory_checker.htm, 2019.
[215] Oculus. Play the Next Level of Gaming. https://www.oculus.com, 2019.
[216] OnePlus. Never Settle – OnePlus. https://www.oneplus.com/, 2019.
[217] openmp.org. The openmp api specification for parallel programming. https://www.
openmp.org/specifications/, 2018.
[218] V. S. Pai, P. Ranganathan, S. V. Adve, and T. Harton. An evaluation of memory consis-tency models for shared-memory systems with ilp processors. Proceedings of the Interna-tional Conference on Architectural Support for Programming Languages and OperatingSystems (ASPLOS), pages 12–23, Sept. 1996.
[219] P. Panda, G. Patil, and B. Raveendran. A survey on replacement strategies in cache mem-ory for embedded systems. In IEEE Distributed Computing, VLSI, Electrical Circuits andRobotics (DISCOVER), pages 12–17, Aug 2016.
[220] A. Panwar, A. Prasad, and K. Gopinath. Making huge pages actually useful. Proceedingsof the International Conference on Architectural Support for Programming Languagesand Operating Systems (ASPLOS), pages 679–692, 2018.
[221] R. Paradiso, G. Loriga, and N. Taccini. A Wearable Health Care System Based on KnittedIntegrated Sensors. IEEE Transactions on Information Technology in Biomedicine, pages337–344, 2005.
[222] M. Parasar, A. Bhattacharjee, and T. Krishna. Seesaw: Using superpages to improvevipt caches. In 2018 ACM/IEEE 45th Annual International Symposium on ComputerArchitecture (ISCA), pages 193–206, June 2018.
[223] A. Parashar, S. Gurumurthi, and A. Sivasubramaniam. SlicK: Slice-based Locality Ex-ploitation for Efficient Redundant Multithreading. Proceedings of the International Con-ference on Architectural Support for Programming Languages and Operating Systems(ASPLOS), 40(5):95–105, Oct. 2006.
[224] J. Park, E. Amaro, D. Mahajan, B. Thwaites, and H. Esmaeilzadeh. Axgames: Towardscrowdsourcing quality target determination in approximate computing. SIGPLAN Not.,pages 623–636, Mar. 2016.
[225] J. J. K. Park, Y. Park, and S. Mahlke. Efficient execution of augmented reality applicationson mobile programmable accelerators. In Proceedings of the International Conference onField-Programmable Technology (FPT), pages 176–183, 2013.
[226] Y. Park, J. J. K. Park, and S. Mahlke. Efficient performance scaling of future CGRAsfor mobile applications. In Proceedings of the International Conference on Field-Programmable Technology (FPT), pages 335–342, 2012.
149
[227] S. J. Patel and S. S. Lumetta. replay: A hardware framework for dynamic optimization.IEEE Transactions on Computers, 50(6):590–608, Jun 2001.
[228] A. Pattnaik, X. Tang, A. Jog, O. Kayiran, A. K. Mishra, M. T. Kandemir, O. Mutlu, andC. R. Das. Scheduling Techniques for GPU Architectures with Processing-In-MemoryCapabilities. In PACT, 2016.
[229] L. Peled, U. C. Weiser, and Y. Etsion. Towards Memory Prefetching with Neural Net-works: Challenges and Insights. CoRR, abs/1804.00478, 2018.
[230] A. Perais and A. Seznec. EOLE: Paving the Way for an Effective Implementation of ValuePrediction. In Proceedings of the International Symposium on Computer Architecture(ISCA), pages 481–492, 2014.
[231] A. Perais and A. Seznec. BeBoP: A Cost Effective Predictor Infrastructure for SuperscalarValue Prediction. In Proceedings of the International Symposium on High-PerformanceComputer Architecture (HPCA), pages 13–25, 2015.
[232] B. Pichai, L. Hsu, and A. Bhattacharjee. Architectural support for address translation ongpus: designing memory management units for cpu/gpus with unified address spaces. InACM SIGPLAN Notices, volume 49, pages 743–758. ACM, 2014.
[233] J. Picorel, D. Jevdjic, and B. Falsafi. Near-memory address translation. In Proceed-ings of the International Conference on Parallel Architecture and Compilation Techniques(PACT), pages 303–317, 2017.
[234] L.-N. Pouchet. Polybench: The polyhedral benchmark suite (2011). URL http://www-roc.inria. fr/˜ pouchet/software/polybench, 2015.
[235] Prasanna Venkatesh Rengasamy and Haibo Zhang and Nachiappan ChidhambaramNachiappan and Shulin Zhao and Anand Sivasubramaniam and Mahmut Kandemir andChita R Das . Characterizing Diverse Handheld Apps for Customized Hardware Accelera-tion . In In Proceedings of IEEE International Symposium on Workload Characterization,Oct 2017.
[236] R. Pyreddy and G. Tyson. Evaluating design tradeoffs in dual speed pipelines. In Work-shop on Complexity-Effective Design in conjunction with ISCA, 2001.
[237] QEMU Project. The Fast! processor emulator. http://www.qemu-project.org/,2017.
[238] Qualcomm Inc. Qualcomm Snapdragon 821 Mobile Platform. https://www.
qualcomm.com/products/snapdragon-821-mobile-platform, 2019.
[239] Qualcomm Inc. Trepn Power Profiler. https://developer.qualcomm.com/forums/software/trepn-power-profiler, 2019.
[240] T. Ramirez, A. Pajuelo, O. J. Santana, and M. Valero. Runahead threads: Reducingresource contention in smt processors. In Proceedings of the International Conference onParallel Architecture and Compilation Techniques (PACT), pages 423–, 2007.
150
[241] T. Ramirez, A. Pajuelo, O. J. Santana, and M. Valero. Runahead threads to improvesmt performance. In Proceedings of the International Symposium on High-PerformanceComputer Architecture (HPCA), pages 149–158, 2008.
[242] R. Razdan and M. D. Smith. A high-performance microarchitecture with hardware-programmable functional units. In Proceedings of the International Symposium on Mi-croarchitecture (MICRO), 1994.
[243] S. K. Reinhardt, R. W. Pfile, and D. A. Wood. Decoupled hardware support for distributedshared memory. In Proceedings of the International Symposium on Computer Architecture(ISCA), pages 34–43, 1996.
[244] B. F. Romanescu, A. R. Lebeck, D. J. Sorin, and A. Bracy. Unified instruc-tion/translation/data (unitd) coherence: One protocol to rule them all. In Proceedingsof the International Symposium on High-Performance Computer Architecture (HPCA),pages 1–12, 2010.
[245] M. Ros and P. Sutton. Code Compression Based on Operand-factorization for VLIWProcessors. In Data Compression Conference, 2004. Proceedings., 2004.
[246] P. Rosenfeld, E. Cooper-Balis, and B. Jacob. Dramsim2: A cycle accurate memory systemsimulator. IEEE Computer Architecture Letters, 10(1):16–19, Jan 2011.
[247] R. M. Russell. The CRAY-1 Computer System. pages 63–72, 1978.
[248] N. Sakharnykh. Unified memory on pascal and volta. In GPU Technology Conference(GTC), 2017.
[249] J. Sartori and R. Kumar. Branch and data herding: Reducing control and memory di-vergence for error-tolerant gpu applications. IEEE Transactions on Multimedia, pages279–290, 2013.
[250] P. G. Sassone and D. S. Wills. Dynamic strands: Collapsing speculative dependencechains for reducing pipeline communication. In Proceedings of the International Sympo-sium on Microarchitecture (MICRO), pages 7–17, 2004.
[251] G. Sayilar and D. Chiou. Cryptoraptor: High Throughput Reconfigurable CryptographicProcessor. In Proceedings of the International Conference on Computer-Aided Design,pages 154–161, 2014.
[252] Y. Sazeides and J. E. Smith. The predictability of data values. In Proceedings of theInternational Symposium on Microarchitecture (MICRO), pages 248–258, 1997.
[253] E. Schnarr and J. R. Larus. Instruction Scheduling and Executable Editing. In Proceedingsof the International Symposium on Microarchitecture (MICRO), pages 288–297, 1996.
[254] L. Semiconductors. Scatter gather dma controller ip. http://www.latticesemi.com/Products/DesignSoftwareAndIP/IntellectualProperty/IPCore/IPCores01/
ScatterGatherDMAController.
151
[255] V. Seshadri, Y. Kim, C. Fallin, D. Lee, R. Ausavarungnirun, G. Pekhimenko, Y. Luo,O. Mutlu, P. B. Gibbons, M. A. Kozuch, et al. Rowclone: fast and energy-efficient in-dram bulk data copy and initialization. In Proceedings of the 46th Annual IEEE/ACMInternational Symposium on Microarchitecture, pages 185–197, 2013.
[256] V. Seshadri, G. Pekhimenko, O. Ruwase, O. Mutlu, P. B. Gibbons, M. A. Kozuch, T. C.Mowry, and T. Chilimbi. Page overlays: An enhanced virtual memory framework toenable fine-grained memory management. In Proceedings of the International Symposiumon Computer Architecture (ISCA), pages 79–91, June 2015.
[257] A. Sethia, D. A. Jamshidi, and S. Mahlke. Mascar: Speeding up gpu warps by reducingmemory pitstops. In High Performance Computer Architecture (HPCA), 2015 IEEE 21stInternational Symposium on, pages 174–185. IEEE, 2015.
[258] A. Seznec. A New Case for the TAGE Branch Predictor. In Proceedings of the Interna-tional Symposium on Microarchitecture (MICRO), pages 117–127, 2011.
[259] Y. S. Shao, B. Reagen, G. Y. Wei, and D. Brooks. Aladdin: A Pre-RTL, Power-performance Accelerator Simulator Enabling Large Design Space Exploration of Cus-tomized Architectures. In Proceedings of the International Symposium on Computer Ar-chitecture (ISCA), pages 97–108, 2014.
[260] A. Sharifan, S. Kumar, A. Guha, and A. Shriraman. Chainsaw: Von-neumann acceleratorsto leverage fused instruction chains. In Proceedings of the International Symposium onMicroarchitecture (MICRO), 2016.
[261] L. Shen, S. Zhang, Y. Yang, and Z. Wang. Gpu memory management solution supportingincomplete pages. In F. Zhang, J. Zhai, M. Snir, H. Jin, H. Kasahara, and M. Valero, edi-tors, Network and Parallel Computing, pages 174–178. Springer International Publishing,2018.
[262] S. Shin, G. Cox, M. Oskin, G. H. Loh, Y. Solihin, A. Bhattacharjee, and A. Basu. Schedul-ing page table walks for irregular gpu applications. In Proceedings of the InternationalSymposium on Computer Architecture (ISCA), pages 180–192. IEEE Press, 2018.
[263] S. Shin, M. LeBeane, Y. Solihin, and A. Basu. Neighborhood-aware address transla-tion for irregular gpu applications. In Proceedings of the International Symposium onMicroarchitecture (MICRO), 2018.
[264] A. J. Smith. Cache memories. ACM Computing Survey, pages 473–530, 1982.
[265] A. Sodani and G. S. Sohi. Dynamic instruction reuse. SIGARCH Comput. Archit. News,25(2):194–205, May 1997.
[266] A. Sodani and G. S. Sohi. An Empirical Analysis of Instruction Repetition. In Pro-ceedings of the International Conference on Architectural Support for Programming Lan-guages and Operating Systems (ASPLOS), pages 35–45, 1998.
152
[267] S. T. Srinivasan, R. D.-c. Ju, A. R. Lebeck, and C. Wilkerson. Locality vs. Criticality.In Proceedings of the International Symposium on Computer Architecture (ISCA), pages132–143, 2001.
[268] S. T. Srinivasan and A. R. Lebeck. Load Latency Tolerance in Dynamically ScheduledProcessors. In Proceedings of the International Symposium on Microarchitecture (MI-CRO), pages 148–159, 1998.
[269] A. Sriraman, A. Dhanotia, and T. F. Wenisch. SoftSKU: optimizing server architecturesfor microservice diversity@ scale. In Proceedings of the International Symposium onComputer Architecture (ISCA), pages 513–526. ACM, 2019.
[270] P. Srivastav. A Simple Color Game in Android. https://github.com/prakhar1989/ColorPhun, 2019.
[271] statista.com. Cumulative number of apps downloaded from the Google Play as of May2016 (in billions) . https://www.statista.com/statistics/281106/number-of-android-app-downloads-from-google-play/, 2018.
[272] Statista.com. Number of Smartphone Users WorldWide. https://www.statista.com/topics/779/mobile-internet/, 2018.
[273] H. S. Stone, J. Turek, and J. L. Wolf. Optimal partitioning of cache memory. IEEETransactions on Computers, pages 1054–1068, 1992.
[274] J. A. Stratton, C. Rodrigues, I.-J. Sung, N. Obeid, L.-W. Chang, N. Anssari, G. D. Liu,and W.-m. W. Hwu. Parboil: A Revised Benchmark Suite for Scientific and CommercialThroughput Computing. Center for Reliable and High-Performance Computing, 2012.
[275] H. Studios. Fruit Ninja. https://play.google.com/store/apps/details?id=
com.halfbrick.fruitninjafree, 2019.
[276] S. Subramaniam, A. Bracy, H. Wang, and G. H. Loh. Criticality-based Optimizationsfor Efficient Load Processing. In Proceedings of the International Symposium on High-Performance Computer Architecture (HPCA), pages 419–430, 2009.
[277] F. Sun, S. Ravi, A. Raghunathan, and N. K. Jha. A Scalable Application-specific ProcessorSynthesis Methodology. In ICCAD-2003. International Conference on Computer AidedDesign (IEEE Cat. No.03CH37486), pages 283–290, 2003.
[278] Synopsys. DC Ultra. https://www.synopsys.com/implementation-and-
signoff/rtl-synthesis-test/dc-ultra.html, 2013.
[279] M. Talluri and M. D. Hill. Surpassing the tlb performance of superpages with less operat-ing system support. Proceedings of the International Conference on Architectural Supportfor Programming Languages and Operating Systems (ASPLOS), pages 171–182, 1994.
[280] S. Thakkur and T. Huff. Internet streaming SIMD extensions. Computer, 32(12):26–34,1999.

153
[281] F. Tip. A survey of program slicing techniques. Technical report, Amsterdam, The Nether-lands, The Netherlands, 1994.
[282] C.-C. Tsai, B. Jain, N. A. Abdul, and D. E. Porter. A Study of Modern Linux API Usageand Compatibility: What to Support when You’Re Supporting. In Proceedings of theEleventh European Conference on Computer Systems, pages 16:1–16:16, 2016.
[283] E. Tune. Critical-path Aware Processor Architectures. PhD thesis, 2004.
[284] E. Tune, D. Liang, D. M. Tullsen, and B. Calder. Dynamic Prediction of Critical PathInstructions. In Proceedings of the International Symposium on High-Performance Com-puter Architecture (HPCA), pages 185–195, 2001.
[285] E. S. Tune, D. M. Tullsen, and B. Calder. Quantifying Instruction Criticality. In Proceed-ings of the International Conference on Parallel Architecture and Compilation Techniques(PACT), pages 104–113, 2002.
[286] tvbarthel. Chase Whisply - Beta. https://play.google.com/store/apps/
details?id=fr.tvbarthel.games.chasewhisply, 2019.
[287] Unity. The Worlds Leading Real-time Creation Platform. https://unity3d.com/
unity, 2019.
[288] K. Van Craeynest, S. Eyerman, and L. Eeckhout. Mlp-aware runahead threads in a si-multaneous multithreading processor. In International Conference on High-PerformanceEmbedded Architectures and Compilers, pages 110–124. Springer, 2009.
[289] H. J. M. M. van GoghBrian C. Beckman. Automatic and Transparent Memoization, 2012.US Patent 8,108,848 B2.
[290] S. P. Vanderwiel and D. J. Lilja. Data prefetch mechanisms. ACM Comput. Surv., pages174–199, 2000.
[291] N. Viennot, E. Garcia, and J. Nieh. A Measurement Study of Google Play. SIGMETRICSPerform. Eval. Rev., pages 221–233, 2014.
[292] N. Vijaykumar, G. Pekhimenko, A. Jog, A. Bhowmick, R. Ausavarungnirun, C. Das,M. Kandemir, T. C. Mowry, and O. Mutlu. A case for core-assisted bottleneck accelerationin gpus: Enabling flexible data compression with assist warps. In Proceedings of theInternational Symposium on Computer Architecture (ISCA), pages 41–53, 2015.
[293] J. Wan, R. Wang, H. Lv, L. Zhang, W. Wang, C. Gu, Q. Zheng, and W. Gao. AVS videodecoding acceleration on ARM Cortex-A with NEON. In Proceedings of InternationalConference on Signal Processing, Communication and Computing (ICSPCC),, 2012.
[294] H. Wang, Z. Liu, Y. Guo, X. Chen, M. Zhang, G. Xu, and J. Hong. An Explorative Studyof the Mobile App Ecosystem from App Developers’ Perspective. In Proceedings of the26th International Conference on World Wide Web, pages 163–172, 2017.
154
[295] W. Wang, P.-C. Yew, A. Zhai, S. McCamant, Y. Wu, and J. Bobba. Enabling Cross-ISA Offloading for COTS Binaries. In Proceedings of the ACM Annual InternationalConference on Mobile Systems, Applications, and Services (MOBISYS), pages 319–331,2017.
[296] S. J. E. Wilton and N. P. Jouppi. Cacti: an enhanced cache access and cycle time model.IEEE Journal of Solid-State Circuits, 31(5):677–688, May 1996.
[297] M. J. Wirthlin and B. L. Hutchings. A dynamic instruction set computer. In Proceedingsof the Symposium on FPGAs for Custom Computing Machines., pages 99–107, 1995.
[298] R. D. Wittig and P. Chow. OneChip: an FPGA processor with reconfigurable logic. InProceedings of the Symposium on FPGAs for Custom Computing Machines, pages 126–135, 1996.
[299] W. A. Wong and J. L. Baer. Modified LRU policies for improving second-level cachebehavior. In Proceedings of the International Symposium on High-Performance ComputerArchitecture (HPCA), pages 49–60, 2000.
[300] J. Wu, A. Belevich, E. Bendersky, M. Heffernan, C. Leary, J. Pienaar, B. Roune,R. Springer, X. Weng, and R. Hundt. gpucc: an open-source gpgpu compiler. In Pro-ceedings of the International Symposium on Code Generation and Optimization (CGO),pages 105–116. ACM, 2016.
[301] Xilinx. Vivado design suite HLx editions - Accelerating high level design. http://www.xilinx.com/products/design-tools/vivado.html, 2016.
[302] X. H. Xu, C. T. Clarke, and S. R. Jones. High Performance Code Compression Architec-ture for the Embedded ARM/THUMB Processor. In Proceedings of the 1st Conferenceon Computing Frontiers, pages 451–456, 2004.
[303] K. Yan and X. Fu. Energy-efficient Cache Design in Emerging Mobile Platforms: TheImplications and Optimizations. In Proceedings of the Design, Automation & Test inEurope Conference & Exhibition (DATE), pages 375–380, 2015.
[304] Z. Yan, J. Vesely, G. Cox, and A. Bhattacharjee. Hardware translation coherence forvirtualized systems. SIGARCH Comput. Archit. News, pages 430–443, June 2017.
[305] A. Yazdanbakhsh, G. Pekhimenko, B. Thwaites, H. Esmaeilzadeh, O. Mutlu, and T. C.Mowry. Rfvp: Rollback-free value prediction with safe-to-approximate loads. ACMTrans. Archit. Code Optim., pages 62:1–62:26, Jan. 2016.
[306] T.-Y. Yeh and Y. N. Patt. Two-level Adaptive Training Branch Prediction. In Proceedingsof the International Symposium on Microarchitecture (MICRO), pages 51–61, 1991.
[307] M. K. Yoon, K. Kim, S. Lee, W. W. Ro, and M. Annavaram. Virtual thread: Maximizingthread-level parallelism beyond gpu scheduling limit. In Proceedings of the InternationalSymposium on Computer Architecture (ISCA), pages 609–621, June 2016.

155
[308] S. Yoshizawa, N. Wada, N. Hayasaka, and Y. Miyanaga. Scalable Architecture for WordHMM-based Speech Recognition and VLSI Implementation in Complete System. IEEETransactions on Circuits and Systems I: Regular Papers, pages 70–77, 2006.
[309] X. Yu, S. K. Haider, L. Ren, C. Fletcher, A. Kwon, M. van Dijk, and S. Devadas. Proram:Dynamic prefetcher for oblivious ram. In Proceedings of the International Symposium onComputer Architecture (ISCA), pages 616–628, 2015.
[310] E. Z. Zhang, Y. Jiang, Z. Guo, K. Tian, and X. Shen. On-the-fly elimination of dynamicirregularities for gpu computing. In Proceedings of the International Conference on Archi-tectural Support for Programming Languages and Operating Systems (ASPLOS), pages369–380, 2011.
[311] G. Zhang and D. Sanchez. Leveraging Hardware Caches for Memoization. IEEE Comput.Archit. Lett., pages 59–63, 2018.
[312] X. Zhang, N. Gupta, and R. Gupta. Whole Execution Traces and their use in Debugging.The Compiler Design Handbook: Optimizations and Machine Code Generation, 2007.
[313] C. Zhou, L. Huang, T. Zhang, Y. Wang, C. Zhang, and Q. Dou. Effective Optimization ofBranch Predictors through Lightweight Simulation. In IEEE International Conference onComputer Design (ICCD), pages 653–656, 2017.
[314] H. Zhou. Dual-core Execution: Building a Highly Scalable Single-thread InstructionWindow. In Proceedings of the International Conference on Parallel Architecture andCompilation Techniques (PACT), pages 231–242, 2005.
[315] Y. Zhu, M. Halpern, and V. J. Reddi. The Role of the CPU in Energy-Efficient MobileWeb Browsing. IEEE Micro, pages 26–33, 2015.
[316] Y. Zhu and v. J. Reddi. WebCore: Architectural Support for Mobileweb Browsing. InProceedings of the International Symposium on Computer Architecture (ISCA), pages541–552, 2014.
[317] Y. Zhu and V. J. Reddi. GreenWeb: Language Extensions for Energy-efficient MobileWeb Computing. In Proceedings of the ACM SIGPLAN Conference on ProgrammingLanguage Design and Implementation (PLDI), pages 145–160, 2016.

Vita
Prasanna Venkatesh Rengasamy
Prasanna Rengasamy was born in Pondicherry, India in 1988. Prasanna holds a bachelors degreein Computer Science and Engineering from SASTRA University, Thanjavur, India and a mastersdegree in Computer Science and Engineering from IIT Madras, Chennai, India. He joined as aPh D student at the Computer Systems Laboratory in Penn State in 2014 under the supervision ofProf Anand Sivasubramaniam and worked on optimizing both high-end computer systems andlow-end edge devices. He published the works in various top-tier conferences such as PACT,MICRO, IISWC, and DAC. During his stint as masters and Ph D student, he interned in IntelCorporation twice, working on eDRAM bandwidth optimizations for the Skylake, Cannonlakeprocessor architectures and replacing simulation modules with regression equations. He wasawarded the Letter of Intent from Intel for his contributions and will be joining Apple as SoCPerformance Architect.