tackling obesity in asean | economist impact
TRANSCRIPT

An Economist Intelligence Unit report commissioned by the Asia Roundtable on Food Innovation for Improved Nutrition
Tackling obesity in ASEAN Prevalence, impact, and guidance on interventions
Commissioned by
About The Economist Intelligence UnitThe world leader in global business intelligenceThe Economist Intelligence Unit (The EIU) is the research and analysis division of The Economist Group, the sister company to The Economist newspaper. Created in 1946, we have 70 years’ experience in helping businesses, financial firms and governments to understand how the world is changing and how that creates opportunities to be seized and risks to be managed.
Given that many of the issues facing the world have an international (if not global) dimension, The EIU is ideally positioned to be commentator, interpreter and forecaster on the phenomenon of globalisation as it gathers pace and impact.
EIU subscription servicesThe world’s leading organisations rely on our subscription services for data, analysis and forecasts to keep them informed about what is happening around the world. We specialise in:
• Country Analysis: Access to regular, detailed country-specific economic and political forecasts, as well as assessments of the business and regulatory environments in different markets.• Risk Analysis: Our risk services identify actual and potential threats around the world and help our clients understand the implications for their organisations. • Industry Analysis: Five year forecasts, analysis of key themes and news analysis for six key industries in 60 major economies. These forecasts are based on the latest data and in-depth analysis of industry trends.
EIU ConsultingEIU Consulting is a bespoke service designed to provide solutions specific to our customers’ needs. We specialise in these key sectors:
• Consumer Markets: Providing data-driven solutions for consumer-facing industries, we and our management consulting firm, EIU Canback, help clients to enter new markets and be successful in current markets.• Healthcare: Together with our two specialised consultancies, Bazian and Clearstate, The EIU helps healthcare organisations build and maintain successful and sustainable businesses across the healthcare ecosystem.• Public Policy: Trusted by the sector’s most influential stakeholders, our global public policy practice provides evidence-based research for policy-makers and stakeholders seeking clear and measurable outcomes.
The Economist Corporate NetworkThe Economist Corporate Network (ECN) is The Economist Group’s advisory service for organisational leaders seeking to better understand the economic and business environments of global markets. Delivering independent, thought-provoking content, ECN provides clients with the knowledge, insight, and interaction that support better-informed strategies and decisions.
The Network is part of The Economist Intelligence Unit and is led by experts with in-depth understanding of the geographies and markets they oversee. The Network’s membership-based operations cover Asia-Pacific, the Middle East, and Africa. Through a distinctive blend of interactive conferences, specially designed events, C-suite discussions, member briefings, and high-calibre research, The Economist Corporate Network delivers a range of macro (global, regional, national, and territorial) as well as industry-focused analysis on prevailing conditions and forecast trends.

Tackling obesity in ASEANPrevalence, impact, and guidance on interventions
© The Economist Intelligence Unit Limited 2017 1
About the Asia Roundtable on Food Innovation for Improved Nutrition (ARoFIIN)
The double burden of obesity and undernutrition has become an emerging threat to health and healthcare systems in Asia. It requires immediate action driven not only by governments and
regulators, but by innovations in the food industry driven by the private sector, as well as scientists and academics, operating in the region.
The Asia Roundtable on Food Innovation for Improved Nutrition (ARoFIIN) was set up in January 2015 to leverage public-private partnerships to bring together experts from across government, academia, industry, and civil society, to initiate and sustain a regional, multi-stakeholder dialogue on the role of food innovation in tackling obesity and chronic disease. ARoFIIN is convened by the Health Promotion Board (HPB), A*STAR, Singapore Institute for Clinical Sciences (SICS) and Food Industry Asia (FIA).
ARoFIIN is made up of a group of key decision-makers who work towards fostering a conducive forum to support dissemination of science-based information on the causes and drivers of obesity and chronic disease, and improve clarity on the barriers and enablers for R&D and food innovation in the region.
ARoFIIN leverages effective public-private partnerships and stimulates scalable, cost-effective and multi-stakeholder strategies that drive food innovation and positive change in consumer behaviour. This public-private platform gives us the ability to scale up projects at a quicker rate, ease the transfer of technology and skills, and conduct wider outreach and dissemination of knowledge and resources.
ARoFIIN’s vision is: “Addressing Asia’s public health and nutrition challenges through partnerships and innovation.”
Tackling obesity in ASEANPrevalence, impact, and guidance on interventions
© The Economist Intelligence Unit Limited 20172
About the Asia Roundtable on Food Innovation for Improved Nutrition (ARoFIIN) 1Foreword 3
Key findings and policy insights 4Prevalence 4Impact and economic cost 5Interventions 6
Obesity in Asia: a call to action 10Trends in Asia 10Country profiles 16
Singapore 16Malaysia 18Thailand 19The Philippines 19Indonesia 20Vietnam 21
The cost of inaction: an economic cost assessment 23Model framework 23Economic cost calculations: results 25
Obesity interventions 29Introduction 29The framework 30
Global evidence searches 30ASEAN and Asian evidence searches 30Analysis of the “promise” of interventions 30Policy research 31
Key findings from the evidence review 32Overall findings 32Interventions by category 33
Conclusions and policy recommendations 53
Appendix 55Survey 55Evidence review 56Economic cost model 59Expert interview programme 65
References 66
Contents

Tackling obesity in ASEANPrevalence, impact, and guidance on interventions
© The Economist Intelligence Unit Limited 2017 3
Obesity is a growing public health burden, not just in affluent countries but also in many developing nations at all income levels. Increases in obesity prevalence are driven by a range of interlinked
factors, including rising incomes, urbanisation, shifting lifestyles and genetic factors that may trigger obesity among individuals in once food-scarce environments. Obesity incidence is also rising steadily, bringing with it new challenges. The Association of South-East Asian Nations (ASEAN) is no exception to these trends.
If action is not taken, countries could find themselves fighting a range of related non-communicable diseases (NCDs), including type 2 diabetes, cancer, cardiovascular disease and stroke, as well as a range of chronic diseases including musculoskeletal disorders. For some countries, this challenge will emerge as they continue to battle a range of communicable and infectious diseases, as well as under-nutrition in some portions of the population, placing a great strain on public health systems.
This study, commissioned by the Asia Roundtable on Food Innovation for Improved Nutrition, responds to this challenge by providing an authoritative assessment of the current obesity landscape in a sample of six ASEAN countries: Indonesia, Malaysia, the Philippines, Singapore, Thailand and Vietnam. Its goal is to help guide policymakers, health organisations and industry to work together and tackle the rising threat of obesity in the region.
The project includes a global clinical evidence review of interventional effectiveness in the fight against obesity, a unique model calculating the economic cost of obesity in our ASEAN country sample, a high-level interview programme with over 20 nutrition experts from regional institutions and governments, and a unique survey of obese persons and healthcare practitioners across our country sample, providing original data on obesity drivers, prevalence and perceptions of policy responses.
The study develops and implements a framework to quantify the economic cost of obesity across our country sample—with Malaysia and Indonesia emerging as the worst affected—as well as the real impact of obesity in terms of years of productivity lost. It also examines the underlying causes of the problem, the trends across our country sample, and ASEAN-specific cultural, social and genetic factors.
It then advances a series of evidence-based recommendations and insights to help guide stakeholders to respond to the obesity challenge. Strategies and approaches discussed in this report include the growing role of public–private partnerships and collaborations, from product innovation to advertising codes of practice; the importance of well-designed education and public awareness campaigns; and best practices in food labelling.
Taken together, these connected research streams provide a novel, comprehensive assessment of obesity in a region where data has historically been scarce. They also provide actionable and credible strategies for all stakeholders, including governments, companies and citizens.
Foreword
Tackling obesity in ASEANPrevalence, impact, and guidance on interventions
© The Economist Intelligence Unit Limited 20174
PrevalenceIn ASEAN countries, the prevalence of obesity and overweight is increasing due to rising incomes, urbanisation and the forces of globalisation. Furthermore, rates of obesity may be underestimated by traditional metrics such as the Body Mass Index (BMI).
Obesity and overweight have been steadily increasing in ASEAN countries over the last three decades, not just in higher income countries but also in low- and middle-income nations. The
incidence of obesity and overweight is also increasing at an earlier stage in the development cycle than was experienced by today’s affluent countries, and, unlike affluent nations, obesity is affecting those on relatively higher incomes more than those on low incomes. Expert interviewees also warn that obesity and overweight prevalence may be even higher than current estimates indicate, because conventional measures based on body size (BMI) are a sub-optimal measure for Asian populations. This is because Asian populations have a more centralised body fat distribution compared to Europeans,1 and because they are experiencing associated morbidity and mortality at a lower BMI than Caucasians.2 Asia’s recent economic development is another factor that makes the challenges faced by ASEAN governments unique: under-nutrition early in life may predispose children to overweight and NCDs such as diabetes and heart disease later in life,3 and in 2015, more than half of all stunted children under five lived in Asia.4
ASEAN obesity rates vary widely depending on ethnic, genetic, regional and economic differences. Although overall obesity and overweight rates are increasing, there is considerable variation between men and women, between ethnic groups, and between rural and urban dwellers. Indonesia, for instance, has higher obesity rates in the capital of Jakarta than in its eastern provinces. In Malaysia, obesity is shaped more by ethnicity, with higher obesity prevalence rates evident among Indians and Malays than among Chinese. Turning to gender, obesity affects women more than men in all six countries in our sample: Indonesia, Malaysia, the Philippines, Singapore, Thailand and Vietnam (hereafter referred to as our “country sample”). These variations underscore the need for a carefully tailored obesity prevention strategy, rather than a one-size-fits-all approach. Taking time to identify at-risk communities—such as particular ethnic groups, or one gender over another—can inform more targeted obesity strategies.
Cultural and social norms are contributing to obesity and overweight in the ASEAN. Populations in countries that are still battling poverty, as well as those with recent experiences of hunger and under-nutrition, tend not to consider obesity a top priority. This makes it an even greater threat, as does the related perception that fat children are healthier. In the Philippines, for instance,
Key findings and policy insights

Tackling obesity in ASEANPrevalence, impact, and guidance on interventions
© The Economist Intelligence Unit Limited 2017 5
cultural norms among certain socioeconomic groups reinforce this perception, according to expert interviewees. Thailand, which has long focused on improving nutrition, also needs to change public perceptions about obesity, as declining family sizes mean that parents are focusing their resources on a smaller number of children, which can lead to overfeeding. Some populations also consider the treatment of obesity to be the healthcare system’s responsibility, rather than something that can be improved simply through lifestyle choices. Malaysia emerged as a particular example of this within our country sample, according to experts interviewed as part of this study.
Impact and economic costMalaysia and Indonesia are experiencing the highest overall costs of obesity as a percentage of healthcare spending. Total (direct and indirect) costs of obesity are highest in Malaysia, where we estimate that they are equivalent to between 10% and 19% of national healthcare spending. Indonesia’s costs range from 8% to 16% of national healthcare spending. Costs are lowest in Vietnam (1–3% of national healthcare spending) and Thailand (3–6%).
Figure 1: Total costs of obesity as a percentage of healthcare spending(%)
Vietnam
Thailand 3.02% 5.75%
Singapore
Philippines
Malaysia
Indonesia
2.91%
4.11%
9.57%
7.97%
1.49% 2.71%
9.64%
7.87%
19.36%
15.71%
Figure 2: Total costs of obesity as a percentage of nominal GDP(%)
Vietnam
Thailand 0.20% 0.38%
Singapore
Philippines
Malaysia
Indonesia
0.14%
0.18%
0.39%
0.20%
0.10% 0.18%
0.48%
0.35%
0.80%
0.40%

Tackling obesity in ASEANPrevalence, impact, and guidance on interventions
© The Economist Intelligence Unit Limited 20176
Obesity is reducing productive years by a weighted average of between four and nine across our ASEAN country sample. A significant number of productive years are lost due to conditions related to obesity in our ASEAN country sample, although with high levels of variation by gender and no clear correlation with countries’ development level. Among obese males, the most significant reductions in productive years as a result of obesity were found in the Philippines (between 8 and 12 years), followed by Malaysia (between 6 and 11 years) and Indonesia (between six and ten years). In Singapore, between one and six years are lost. For women, however, outcomes are different. Malaysia has the highest number of productive years lost due to obesity among obese women (between 7 and 12 years). In Singapore, productive years lost due to obesity among obese women (between five and ten years) are higher than among men.
Hypertension and type 2 diabetes risks are heightened in obese persons in our country sample.Our survey showed a strong correlation between obesity and a range of NCDs. Morbidly obese people in the survey had a 24% chance of hypertension (compared to 10% among the non-obese) and a 7% chance of diabetes (compared to 3% among the non-obese).
Interventions
Interventions that target food intake show considerable promise in terms of impact on obesity at both the individual and population level, according to global studies. Low glycaemic index, low-calorie, low-fat and low-carbohydrate diets have all been found to be effective globally but cannot be directly legislated or regulated. More realistic options include
Figure 3: Inteventions showing the greatest promise5
Stakeholder driving change
Category Subcategory Example interventions/focus of interventions
Promise of intervention
Direction of evidence base
Quality of body of evidence
Magnitude of population impact
Physiology Individual Anti-obesity drugs «« ä Strong Medium l l
Activity Individual Physical activity ««« ä Moderate to strong
High l l l
Food
Individual
Calorie-controlled diet «« á Moderate Medium l l l
Low-fat diet «« á Moderate Medium l
Low-carbohydrate diet «« á Moderate Medium l
Low-glycaemic index diet ««« á Moderate to strong
Medium l
Population
School and workplace policies «« ä Moderate High l l l l
Controlling portion size in processed and prepackaged foods
«« ä Moderate High l l
Taxation «« ä Moderate High l
Hea
lthc
are
Educ
atio
n
Food
Polic
y
Tackling obesity in ASEANPrevalence, impact, and guidance on interventions
© The Economist Intelligence Unit Limited 2017 7
“nudges” and prompts that encourage citizens to eat a balanced and healthy diet, and these remain valid strategies across a diversity of contexts and cultures. Reducing portion sizes (which have increased dramatically since the 1970s), taxing specific food types and implementing “choice environment” measures (such as removing vending machines and providing water coolers) have all shown promise in the fight against obesity in our review of global studies.
Exercise jointly ranks at the top of our framework for preventing and reducing obesity. Governments can positively influence people’s access to exercise facilities in the ASEAN, especially in schools. Obesity in childhood is hard to reverse and can lead to chronic illness. Physical education must therefore become a more central part of school curricula in the ASEAN, backed by investment that ensures that educational establishments have the necessary facilities. (ASEAN countries currently have a mismatch between physical activity curricula and the infrastructure to enable children to exercise.) Investing in exercise infrastructure at schools could also lead to significant economic cost savings. Governments and public authorities should also invest more broadly in exercise infrastructure. ASEAN countries are hot and tropical, with increasingly congested cities, which means that affordable and accessible exercise facilities are essential. Our survey revealed that lack of access to affordable exercise facilities or open spaces was a critical reason for people’s lack of physical activity, creating a strong case for providing low-cost gym access to citizens in the lower income percentiles. Governments should also invest more in food safety, as concerns about pollution and contamination can lead consumers to choose processed foods over fresh fruit and vegetables, particularly in emerging ASEAN economies.
Low and middle-income ASEAN policymakers have a “blind spot” when it comes to obesity.With the exception of Singapore, ASEAN governments have only recently overcome—and in some cases, may still face—the challenge of under-nutrition. In countries such as Thailand, the Philippines, Indonesia and Vietnam, for example, memories of famine, food shortages and under-nutrition are still recent. As a result, countries are not prioritising obesity as a public health issue, limited resources are being allocated to interventional responses and populations have little awareness about the dangers of obesity. Although these countries have other challenges to tackle, the long-term cost of obesity and its connection to several NCDs (including cancer, type 2 diabetes and stroke) suggest that acting early would be prudent.
ASEAN countries lack granular data on obesity prevalence and intervention impact. Data on obesity prevalence is uneven (and often absent altogether) across the ASEAN. The policy-making process becomes problematic when there is no empirical basis upon which to design interventions, constraining policy-making and leading to untargeted programmes with almost no evaluations of programme impact. In order to design smarter policies, it is crucial for governments and healthcare stakeholders to understand where obesity is increasing in terms of ethnic groups, gender and region. For example, urban planning reforms designed to improve access to exercise facilities could be targeted at regions that are densely populated with groups more vulnerable to obesity. Alternatively, outreach efforts could target areas where child obesity is increasing rapidly. For
Tackling obesity in ASEANPrevalence, impact, and guidance on interventions
© The Economist Intelligence Unit Limited 20178
example, hospital staff and midwives could be trained to teach pregnant women about the importance of exclusive breastfeeding and a child’s diet during his or her early years. At present, public initiatives designed to tackle obesity in the ASEAN (bar a few exceptions) are being performed with limited evidence of their effectiveness and a lack of metrics to track their performance. Randomised trials of interventions would help to track effectiveness and could inform decisions regarding budgetary allocation. Randomised trials can also help to monitor the impact of an intervention and exclude confounding variables, helping to reveal which factors play the most substantial role in driving obesity. Without rigorous evaluations, governments may be deploying time and resources into ineffective obesity campaigns.
There is room to promote simpler and more effective food labelling. Consumers need to make informed choices about their diet, but ASEAN countries are not currently producing accessible labelling to aid consumer choice. Labels should be easy to understand for people from all socioeconomic backgrounds, and governments should explore partnerships with health organisations and industry to devise the most effective and informative approach. Governments have multiple options to choose from—from text and number-based labels to visual signposting—each with its own strengths and weaknesses. For example, Guideline Daily Amount (GDA) notifications inform consumers about the percentages of recommended daily nutritional intake provided by a product, varying across gender and at times age group. More visual approaches include a colour-coded GDA system (for example, the system used in the United Kingdom), “health stars” (used in Australia) and a visual/badge for healthy foods (used in Singapore). More recently, some health organisations have recommended “activity-equivalent calorie labelling”,6 which indicates how much exercise is required to burn off the product’s calories. It should be noted that food labelling did not emerge as a high-promise intervention in our review, but its limited impact may be due to the lack of documentation on initiatives undertaken thus far. Further experimentation could yield improved results.
Alliances between government, the healthcare community and the food and beverage industry are being trialled globally. Industry, government and healthcare stakeholders are actively collaborating across the globe to develop foods that are lower in obesogenic ingredients. A number of global food and beverage companies have already constructively engaged in product innovation,7,8 launching low-fat and low-sugar variants of their products, and more research and development (R&D) is being conducted to find new ways of reducing obesogenic ingredients. In some Asian countries (e.g., Vietnam, Indonesia and the Philippines), firms have also used targeted communication techniques to raise awareness and promote behavioural changes in favour of healthy lifestyles, with support from their governments.9
Public–private partnerships can leverage both the health sector’s understanding of obesity and the private sector’s expertise in food and beverage R&D, leading to the creation of products that are healthier but also commercially viable. Examples of these types of alliances are common in the pharmaceutical sector, for example in Europe.10 In the ASEAN, some examples of cross-sector collaboration are already evident. For example, the Global Alliance for Improved Nutrition (GAIN) works with governments, businesses and civil society to identify solutions to malnutrition.11 These

Tackling obesity in ASEANPrevalence, impact, and guidance on interventions
© The Economist Intelligence Unit Limited 2017 9
initiatives already have a strong track record in cross-sector collaboration for tackling under-nutrition, and they could be repurposed to deal with obesity.
Controlling the obesogenic environment may be advisable in public spaces, for example school canteens, play areas and other community settings. Proximity and convenience—known as the food environment—are important determinants in consumption decisions, which means that stronger interventions are advisable in controllable cases such as schools (as well as other public institutions like prisons or government premises). Schools should be a priority target because obesity in childhood is extremely difficult to reverse, as are the behaviours and eating habits associated with it. Restricting access to energy-dense, nutrient-poor food and beverages should be considered in and around school premises. School canteens could review plate sizes to influence portion size, and authorities could work with industry to promote responsible marketing pledges and reduce the package sizes of energy-dense, nutrient-poor foods and drinks consumed by children.
Energy-dense, nutrient-poor food and beverage advertisements aimed at children can pose a health threat. Globally, a growing number of countries have restricted certain types of food and beverage advertisements aimed at children. Children are not fully aware of the persuasion techniques used in advertising and cannot always discern between facts and entertainment, which makes them more vulnerable to advertisers’ influence. ASEAN governments and the food and beverage industry should introduce appropriate measures to ensure that advertising content is suitable in order to protect child health (including through self-regulation interventions).
Taxation could potentially make a difference, with examples from multiple countries outside the ASEAN pointing towards decreasing consumption as a result of taxes.In 2011, the United Nations (UN) General Assembly High-Level Meeting on Non-Communicable Diseases recommended implementation of “fiscal measures” to improve diets and health.12 Our analysis of systematic reviews conducted at a global level (including household expenditure surveys, dietary survey data, longitudinal data and sales data, etc.) points to a reduction in the consumption of sugar-sweetened beverages proportional to the taxes applied, with declines of between 5% and 48% following the introduction of taxes.13 (Reviews examining the impact of sugar taxation on consumption are less conclusive and the evidence less abundant.) These findings highlight that fiscal measures can be effective in reducing consumption of targeted food products. However, as most of the existing studies have been conducted in OECD economies, any attempt to assess the impact of taxation in an ASEAN country sample should account for the region’s idiosyncrasies. For example, demand elasticity in low- and middle-income economies is likely to be different, and the substitution effect (i.e., where consumers purchase other products in lieu of taxed goods) is likely to be magnified by the presence of a more pervasive street food culture, providing unregulated and easily accessible alternatives. Policymakers should consider national and regional specificities when deciding on the shape and scope of these regulations.

Tackling obesity in ASEANPrevalence, impact, and guidance on interventions
© The Economist Intelligence Unit Limited 201710
Trends in Asia
Over the last three decades, the global prevalence of obesity has more than doubled. Between 1980 and 2013, the proportion of adults with a BMI at or above 25 kg/m2 (i.e., adults who are
overweight) grew from 28.8% to 36.9% in men, and from 29.8% to 38% in women.14 Obesity rates have stabilised in some developed countries (such as Canada, Italy and South Korea), but in others they have increased (such as Australia, France and Switzerland).15
Historically, the prevalence of obese and overweight people has been low in ASEAN countries, compared to other regions. In 1980, for example, obesity rates in the region ranged from 1.1% to 1.9%, based on the World Health Organisation’s (WHO) definition of obesity. Countries in Central and Eastern Europe had the highest rates of obesity, ranging from 16.3% to 18.2%. By 2013, however, obesity rates in South-East Asia had risen to an average of 4.8% among adult males and 7.6% among adult females. Although these rates are still low compared to global averages (13% of the world is obese), the prevalence of obesity is increasing rapidly. For instance, Indonesia and Vietnam experienced a 30% increase in the number of obese individuals between 2010 and 2014 alone. During the same period, the number of obese individuals in the United Kingdom and the United States increased by only 10% and 8%, respectively.
The most worrying trend is the increase in the number of overweight people in low- and middle-income (LMIC) countries, which more than tripled between 1980 and 2008, with incidence rates increasing from 23% to 34%.16 By 2014, Asia was home to 48% of overweight children under five and, in absolute numbers, there are now more overweight children in LMICs than in high-income countries.17
Obesity in Asia: a call to action
Figure 4: Obesity prevalence in ASEAN country sample and selected other countriesPercentage obese adults
Country 2010 2014 Increase in number of obese people (%), 2010-2014
ASEAN country sample
Indonesia 4.3% 5.7% 33%
Malaysia 10.5% 13.3% 27%
Philippines 4.1% 5.1% 24%
Singapore 5% 6.2% 24%
Thailand 6.7% 8.5% 27%
Vietnam 2.6% 3.6% 38%
Comparator countries
Japan 2.9% 3.3% 14%
South Korea 4.2% 5.8% 38%
United Kingdom 25.5% 28.1% 10%
United States 31.2% 33.7% 8%

Tackling obesity in ASEANPrevalence, impact, and guidance on interventions
© The Economist Intelligence Unit Limited 2017 11
The implications of this trend are severe. Obesity is linked to many NCDs, including colorectal cancer, type 2 diabetes, hypertension, coronary heart disease and stroke. Today, almost three-quarters of deaths from NCDs (28m) occur in LMICs, and obesity is a risk factor for many of these conditions.18 Obesity is also reducing life expectancy, which has serious consequences for household income, economic growth and productivity.
Obesity tends to increase as a by-product of economic development, with an average prevalence of 7% in LMICs compared to 24% in upper-middle-income countries.19 Here, the forces of globalisation are partially to blame: ever-more available food products and the rise of “24-hour” consumer stores increase the ease and convenience of food consumption and may also stimulate over-eating. Increased urbanisation also plays a role, as it is linked to more sedentary lifestyles and more desk-bound, sedentary occupations, reflecting the rise of office work in the globally growing service economy.
In South-East Asia, urban living has been consistently associated with obesity in all age groups and both genders, and the association is even stronger in countries with lower gross national income. For instance, those living in an urban environment in Malaysia or the Philippines are 1.29 times more likely to suffer from obesity, relative to someone living in a rural environment. Similarly, people living in an urban environment in Vietnam or Laos were 3.36 times more likely to be obese, relative to those living in rural areas.20 Obesity is also the result of increased incomes, which naturally lead to increased food intake and consumption of “convenience” foods.
For some, the rise in overweight and obesity might be seen as a sign of success—for example, in countries that have long battled poverty and under-nutrition but suddenly face challenges associated with affluence. However, this interpretation is a dangerous one. LMICs are experiencing obesity and overweight at a far earlier stage in their developmental cycle than affluent countries did,21 and the combined effects of communicable and non-communicable diseases now represent a sizeable public health threat.
Certain characteristics of LMICs also mean that their obesity pathways are different from—and more worrying than—those experienced by rich countries. Take, for example, the “thrifty gene” hypothesis. Thrifty genes are believed to enable individuals to efficiently deposit fat during times of food abundance in preparation for times of food shortage. According to this theory, these genes served a purpose in our evolutionary history, but they can cause obesity when nutritional shocks are no longer present, as may be the case in countries that have quickly upgraded from food insecure to food stable or food abundant. These genes can also be passed on to children born to mothers who faced malnutrition—a genetic inheritance that increases their likelihood of becoming obese. Although evidence on the validity of this hypothesis is not conclusive, it should be taken into consideration when assessing the drivers of obesity in the Asian context.
There are also other Asia-specific factors to consider. Firstly, common measures of obesity do not apply well to Asian populations (due to differences in body type and fat distribution, compared to Caucasians). As a result, BMI may not be the best measure of obesity, which means that the problem is likely to be more widespread than current data suggests. Secondly, physiological responses to food could vary between ethnic and racial groups. For example, the glucose response in the blood of Asians could be significantly higher than that of Caucasians.22

Tackling obesity in ASEANPrevalence, impact, and guidance on interventions
© The Economist Intelligence Unit Limited 201712
There are also cultural and behavioural factors that complicate the fight against obesity in ASEAN countries. Firstly, these countries have a higher percentage of unregulated street food (available around the clock) in their national diet, compared to Western countries, which makes food content regulation more difficult to implement consistently across the formal and informal sectors. Food safety is also a bigger problem because pollution and contamination are more common, leading consumers to be more concerned about fruit and vegetable intake. This could have an impact on consumers’ preference for packaged products (both food and beverages), offering both a challenge and an opportunity in terms of driving positive changes in dietary habits. Secondly, hot and tropical weather makes it more difficult to exercise, especially if people do not have access to air-conditioned gymnasiums and physical infrastructure is not conducive to exercise in open spaces.
Thirdly, populations in countries with high rates of poverty or recent experiences of under-nutrition have a greater “perception gap” and tend to overlook the magnitude of the impact obesity is set to have on their health. ASEAN experts continually cite this problem. In Malaysia, for example, many people believe that obesity should be managed by the medical system, while cultural norms in the Philippines equate fatter children with healthier children. Although Thailand has long focused on improving nutrition, it too needs to shift the public mind-set to recognise the threat of obesity.24 Due to demographic change, families are focusing their resources on a smaller number of children, which Professor Visith Chavasit of Mahidol University notes can lead to overfeeding.
Figure 5: Body Mass Index23
Classification BMI (kg/m2)
Principal cut-off points Additional cut-off points
Underweight <18.50 <18.50
Severe thinness <16.00 <16.00
Moderate thinness 16.00–16.99 16.00–16.99
Mild thinness 17.00–18.49 17.00–18.49
Normal range18.50–24.99 18.50–22.99
23.00–24.99
Overweight ≥25.00 ≥25.00
Pre-obese25.00–29.99 25.00–27.49
27.50–29.99
Obese ≥30.00 ≥30.00
Obese class I30.00–34.99 30.00–32.49
32.50–34.99
Obese class II35.00–39.99 35.00–37.49
37.50–39.99
Obese class III ≥40.00 ≥40.00
Body Mass Index (BMI) measures weight-for-height, and is used to classify underweight, overweight and obesity in adults. BMI is defined as the weight in kilograms divided by the square of the height in metres (kg/m2). BMI values are independent of age and the same for both sexes. However, BMI may not correspond to the same degree of fatness in different populations due to different body proportions. This has led to calls for different cut-off points for different ethnic groups because the associations between BMI, body fat, and body fat distribution differ across populations, which means that health risks can increase below the cut-off point of 25 kg/m2.

Tackling obesity in ASEANPrevalence, impact, and guidance on interventions
© The Economist Intelligence Unit Limited 2017 13
Figure 6: Overweight (BMI>=25) age-standardised adjusted estimates, adults>1828
(%)
0
5
10
15
20
25
30
35
40
0
5
10
15
20
25
30
35
40FemaleMaleOverall
VietnamPhilippinesIndonesiaThailandSingaporeMalaysia
Figure 7: Obesity prevalence (BMI>=30) age-standardised adjusted estimates, adults>1829
(%)
0
5
10
15
20
0
5
10
15
20FemaleMaleOverall
VietnamPhilippinesIndonesiaSingaporeThailandMalaysia
Although the WHO reports that South-East Asia has the lowest overweight ratios of any WHO region and the lowest rates of overweight in children under five, data shows that the incidence is increasing.25 In our ASEAN country sample, overweight rates are highest in the countries with a higher GDP per capita, with Malaysia and Singapore the worst affected. Some countries are also experiencing diverging trends, with increased prevalence of both obesity and under-nutrition, resulting in the so-called double burden of under-nutrition and obesity.26 In Indonesia, for example, 12% of children are overweight, but another 12% suffer from “wasting” or moderate malnutrition. In Thailand, both child wasting and overweight are on the rise: between 2006 and 2012, child wasting increased from 5% to 7%, and child overweight increased from 8% to 11%.27
The rise of childhood and adolescent obesity is a particular concern. One study30 of 30,284 school children found that the overall prevalence of overweight across the full ASEAN group was 9.9%, and was higher among boys (11.5%) than girls (8.3%). According to the same study, among the full ASEAN grouping, the highest prevalence was in Brunei Darussalam (36.1%), followed by Malaysia (23.7%), and the lowest was in Cambodia (3.7%) and Myanmar (3.4%). If this phenomenon is not addressed promptly, there is a clear risk for obesity prevalence to increase substantially in the future.

Tackling obesity in ASEANPrevalence, impact, and guidance on interventions
© The Economist Intelligence Unit Limited 201714
Along with the socio-economic drivers of obesity, a unique survey conducted for this project (see Appendix 1) revealed a number of generational dynamics at play. The survey was conducted on two communities: a population of obese and non-obese individuals (1,200 in total) and 60 healthcare practitioners (HCPs) across our ASEAN country sample. Questions focused on obese and non-obese respondents’ eating and physical activity habits, their state of health and their perceptions of policy interventions designed to tackle obesity in their country. The HCP survey participants included general practitioners (GPs), cardiologists, endocrinologists and oncologists. Questions focused on HCPs’ opinions about the linkages between obesity and diseases, the impact of obesity on life expectancy and perceptions of government responses.
Being overweight as a child was determined to be a major factor contributing to adult obesity, and parents who were obese were also more likely to have obese children. Among obese respondents, 54% claimed to have been obese when they were children, and 32% of obese parents claimed their child was obese, compared to 12% of non-obese parents. A further multigenerational dynamic was also found to be at play: 18% of obese people said their grandparents ate “Western food” or processed food more than three times a week, compared to just 3% of the non-obese survey population.
Figure 8: Behavioural insights31
Behavioural indicators Obese (n=600) % Non-obese (n=600) % Description Behavioural gap
Overweight as a child 54% 13% Overweight when they were children
41%
Western food 36% 14% Eat Western food at least 3 times a week
22%
Carbonated drinks consumption
74% 55% Consume carbonated drinks at least once a week
19%
White bread 57% 38% Use white bread for meals at least 3 times a week
19%
Grand-parents and western food
29% 12% Grandparents consume Western food at least 2 times a week
17%
Grand-parents and carbonated drinks
30% 13% Grandparents consume carbonated drinks at least 2 times a week
17%
Use of palm oil for cooking 61% 44% Use palm oil at least 3 times a week for cooking
17%
Figure 9: Children consumption patterns as reported by non-obese parents (n=366) (%)(%)
Not applicableOver 3 times a week2-3 times a weekOnce a weekLess than once a week/never
Traditional food
Western cuisine
Processed packaged food
Carbonated drinks/cola
Coffee or tea (with sugar) 48 16 20 14 2
34 24 28 13 1
23 29 33 13 2
35 30 25 9 1
7 13 19 60 1
Tackling obesity in ASEANPrevalence, impact, and guidance on interventions
© The Economist Intelligence Unit Limited 2017 15
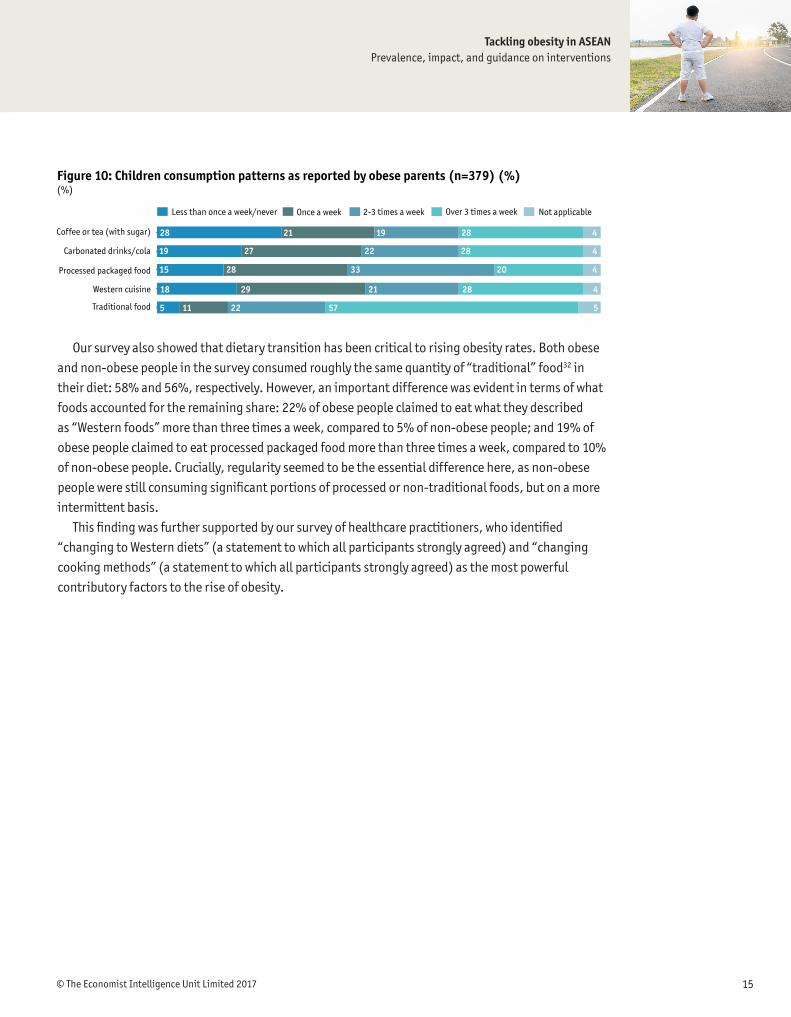
Our survey also showed that dietary transition has been critical to rising obesity rates. Both obese and non-obese people in the survey consumed roughly the same quantity of “traditional” food32 in their diet: 58% and 56%, respectively. However, an important difference was evident in terms of what foods accounted for the remaining share: 22% of obese people claimed to eat what they described as “Western foods” more than three times a week, compared to 5% of non-obese people; and 19% of obese people claimed to eat processed packaged food more than three times a week, compared to 10% of non-obese people. Crucially, regularity seemed to be the essential difference here, as non-obese people were still consuming significant portions of processed or non-traditional foods, but on a more intermittent basis.
This finding was further supported by our survey of healthcare practitioners, who identified “changing to Western diets” (a statement to which all participants strongly agreed) and “changing cooking methods” (a statement to which all participants strongly agreed) as the most powerful contributory factors to the rise of obesity.
Figure 10: Children consumption patterns as reported by obese parents (n=379) (%)(%)
Not applicableOver 3 times a week2-3 times a weekOnce a weekLess than once a week/never
Traditional food
Western cuisine
Processed packaged food
Carbonated drinks/cola
Coffee or tea (with sugar) 28 21 19 28 4
19 27 22 28 4
15 28 33 20 4
18 29 21 28 4
5 11 22 57 5

Tackling obesity in ASEANPrevalence, impact, and guidance on interventions
© The Economist Intelligence Unit Limited 201716
Country profilesSingapore
According to the latest age-standardised adjusted estimates by the WHO,33 Singapore has the second highest overweight prevalence in the ASEAN at 32.8%—a reflection of its significantly
higher income level. The 2010 Singapore National Health Survey put this figure at 40.1% and revealed several notable long-term trends (see Figure 11). Firstly, there was considerable variation by ethnicity: Malays had the highest prevalence of obese people at 24% in 2010, compared to 7.9% among Chinese; and Indians suffered from a higher obesity prevalence than Chinese, but were experiencing a slower increase over time. Secondly, abdominal fatness—an alternative measure of obesity—revealed a rather different story, in which Indians had both the highest obesity rates as a percentage and the highest growth rate.
Singapore’s government has responded proactively to these challenges. The country’s first National Healthy Lifestyle Programme, launched in 1992, outlined national strategies for controlling obesity through public education campaigns focused on physical activity and healthy eating. Singapore has also targeted different segments of the population in schools, workplaces, healthcare institutions and communities, using the following approaches:
l Implementing health promotion policies (e.g., Healthier Choice Symbol Programme)
l Promoting supportive environments (e.g. Healthy Meals in Schools Programme)
l Engaging in partnerships to increase availability of healthy options (e.g., the Healthier Dining Programme).
l Using technology in media campaigns to promote physical activity (e.g. National Steps Challenge).
Figure 11: Age-standardised adjusted prevalence of obese respondents (BMI equal or more than 30 kg/m2) in Singapore by ethnic group and year of survey (%)
0
5
10
15
20
25
0
5
10
15
20
25
2010200419981992
IndiansChineseMalay
13.4
18.020.0
24.0
3.7 4.0 4.2
7.9
11.512.6 13.2
16.9

Tackling obesity in ASEANPrevalence, impact, and guidance on interventions
© The Economist Intelligence Unit Limited 2017 17
In terms of health promotion policies, official dietary and physical activity guidelines are available for both children and adults. For example, the Healthier Choice Symbol, a positive food labelling programme, indicates when a packaged food product or beverage is healthier (e.g. lower in fat, sodium, and/or sugar) relative to comparable products.
Singapore has been particularly active in school-based initiatives. For instance, the Trim and Fit Programme, introduced by the Ministry of Education in 1992, aimed to improve physical fitness and reduce the prevalence of overweight students. Although the initiative was impressive in scale, its impact was modest, with the percentage of overweight students decreasing from 11.7% in 1993 to 9.5% in 2006. More positively, however, the percentage of students who passed the physical fitness test rose from 61.5% in 1993 to 80.8% in 2006.35 Turning to nutrition, the Healthy Meals in Schools Programme was introduced in 2011 to promote healthier food options in schools.
It is worth noting that there may be other intervening variables which might also have contributed to determining the outcomes of the interventions discussed in this section. For instance, the National Steps Challenge in Singapore is a nation-wide intervention that encourages Singaporeans to weave physical activity into their daily lives. It encourages the use of a wearable device (to track steps) and a phone application, and it offers incentives to motivate users to clock more steps. Participants are encouraged to achieve 10,000 steps each day, which is associated with improved health outcomes. Sub-challenges such as inter-school competitions have also been introduced as part of the campaign. The launch of the National Steps Challenge Season 1 in 2015 attracted interest from over 150,000 adults in Singapore and saw significant improvements in the physical activity levels of its participants. Participants registered 1,500 more steps a day on average than adults in a controlled group study conducted by the Health Promotion Board. Singapore also launched the Healthier Canteen Certification Programme in 2006 to help employers encourage employees to adopt better diets. Health facilitators and food vendors worked with nutritionists to help implement the programme.
Figure 12: Age-standardised prevalence of abdominal fatness (measured by “waist-to-hip ratio”) in Singapore by ethnic group and year of survey (%)
0
5
10
15
20
25
30
0
5
10
15
20
25
30
2010200419981992
IndiansChineseMalay
5.2
12.414.3
18.9
2.9
9.0
11.9
15.5
6.4
13.5
19.0
26.1
Source: NHS 2010, MOH34
Tackling obesity in ASEANPrevalence, impact, and guidance on interventions
© The Economist Intelligence Unit Limited 201718
Lastly, in recognition of the important role that street food and restaurants play in consumption, Singapore’s Health Promotion Board launched the Healthier Dining Programme in 2014, in partnership with private-sector participants. This programme seeks to improve access to healthy dishes in restaurants by encouraging food vendors to use healthier ingredients. The Health Promotion Board worked with participating restaurants to modify dishes to contain less oil, salt and sugar and include more fruit and vegetables, and to introduce healthier new dishes. As of 2016, more than 60 unique brands participate in the Healthier Dining Programme, exceeding 1,600 food and beverage (F&B) touch points (i.e., restaurant outlets and food court stalls).
These efforts are reflected in Singapore’s Healthy Living Master Plan, a set of initiatives to help create an environment conducive to healthier lifestyles in the community, schools and workplaces by 2020.
MalaysiaMalaysia has the highest obesity and overweight prevalence in our country sample (13.3% and 38.5%, respectively), according to the latest estimates by the WHO.36 Fat and sugar intake increased by 80% and 33%, respectively, between the early 1960s and 2005,37 and the Malaysian Adult Nutrition Study reported that only one-third of the adult population had ever exercised and only 14% performed adequate levels of exercise.38 Dr Tee E. Siong, President of the Nutrition Society of Malaysia, has also argued that an increasing emphasis on academic excellence has resulted in additional hours of tuition and academic work among children, to the detriment of physical education. Dietary quality is also low, with the Malaysian National Health and Morbidity Survey finding that 92.5% of adults aged 18 and above (16.4m) consume less than five portions of fruit or vegetables per day.39 In terms of affected communities, Malaysia is unusual in that, according to interviewees, there is not a significant difference between urban and rural obesity. The proportion of people with undiagnosed diabetes and hypertension is high in Malaysia, according to a 2010 public statement from the Ministry of Health.40
Some of Malaysia’s obesity drivers are common to many nations passing through a period of rapid economic change. For instance, its GDP per capita (PPP at 2005 prices) increased from US$7,101 in 1980 to US$23,267 in 2015,41 and this has had a knock-on effect on obesity and overweight, with rising incomes fuelling increased food consumption (particularly of processed foods). Cultural factors are also pertinent. For instance, popular Malaysian foods include deep fried snacks, dishes heavy in coconut oil and fatty foods. Zalma Binti Abu Bakar, Director of the Nutrition Division at the Ministry of Health, commented that “Malaysians love eating,” and there is a strong culture of entertaining guests with food. Ms Zalma believes that restaurants and food outlets that serve unhealthy food at cheap prices, and sometimes in large portions, are also a contributing factor. There also appears to be a continuing lack of awareness about obesity and its dangers. “It’s [viewed as] a cosmetic issue,” said Dr Siong. “Malaysians do not see the link between obesity and NCDs,” added Ms Zalma. Dr Tee believes that this may be due to the presence of a universal national healthcare system, which provides Malaysians with access to affordable healthcare: “Many people think it is cheap to get treated, so why bother [with preventative measures].”
Tackling obesity in ASEANPrevalence, impact, and guidance on interventions
© The Economist Intelligence Unit Limited 2017 19
ThailandThailand is experiencing increased urbanisation, longer life expectancy and reduced malnutrition, leading to the increased prevalence of obesity and overweight. For example, adult overweight prevalence rose from 26% in 1995 to 31.3% in 2003, and to 34.7% by 2009.42 A review of two nationally representative surveys (conducted in 1997 and 2004) confirmed that obesity is on a long-term upwards trend. Among adults, the prevalence of Class I obesity in men and all four obesity categories in women “significantly increased” between 1997 and 2004, and this included people of lower socioeconomic status.43 Professor Visith Chavasit, Director of the Institute of Nutrition at Mahidol University, noted that a key obesity driver is the increased availability of calorie-dense, nutrient-poor foods. He also added that Thailand’s family planning programme has resulted in fewer children per family, which has led to a tendency to overfeed.
As a result, NCDs are on the rise in Thailand. By 2011, cardiovascular diseases and stroke were the leading causes of death in Thailand, responsible for 30 deaths per 100,000 population.44 The prevalence of cardiovascular diseases, stroke, diabetes mellitus and hypertension were 936, 278, 849 and 1,178 per 100,000 population, respectively.45
Fortunately, expert interviewees believe that governmental awareness about Thailand’s obesity and overweight problem is increasing. Furthermore, after focusing on under-nutrition for many years, the government is beginning to prioritise efforts to tackle obesity. In 2008, for example, a National Food Committee was established—Thailand’s highest multi-stakeholder forum on food management—to improve food policy, including in relation to obesity. The following year, obesity was included in the National Economic and Social Development Plan of 2009,46 and in 2012, the Ministry of Public Health developed the Thailand Healthy Lifestyle Strategic Plan, which emphasised the risks of unhealthy eating habits. The Bureau of Nutrition also developed the National Nutrition Plan.
Thailand has also mounted several public awareness campaigns involving the government, academics and non-governmental organisations (NGOs), according to Dr Renu Garg, Medical Officer for NCDs at WHO Thailand. Despite the Ministry of Public Health’s modest budget,47 campaigns including “Thai people with no big belly” and the “Sweet Enough Network” all drew positive comments from the experts interviewed for this report, although scientific evaluations of their effectiveness are lacking. Civil society organisations and institutions have been very active participants, including the International Health Policy Programme, Thailand (IHPP)—a semi-autonomous programme conducting research on national health priorities. Other stakeholders include the Royal College of Physicians of Thailand, the Sports Science Society of Thailand, the Nutrition Association of Thailand and the Thai Association for Health, Physical Education and Recreation. Thailand has also seen active collaboration between health organisations and the media, notably through the Thai Health Promotion Foundation’s funding of a television series in collaboration with the Thai Public Broadcasting Service.
The PhilippinesThe Philippines continues to battle under-nutrition and this has been the focus of the government in recent years. Operation Timbang, for example, is an annual weighing and height measurement exercise for all pre-schoolers to identify malnourished children. As a result, the 2011–16 Philippine Plan of Action for Nutrition48 focuses on hunger, child under-nutrition, maternal under-nutrition, and
Tackling obesity in ASEANPrevalence, impact, and guidance on interventions
© The Economist Intelligence Unit Limited 201720
deficiencies in iron, iodine and vitamin A. Obesity and overweight has since been added as a fifth pillar, but they are still not a high priority. “There are a wide range of eating patterns in the Philippines, and the poor don’t get enough to eat,” noted Dr Cecilia Acuin, Chief Science Research Specialist at the Nutritional Assessment and Monitoring Division at the Food and Nutrition Research Institute.
According to WHO estimates for 2014, 23.6% of Filipino adults above the age of 18 are overweight.49 Women were more affected than men (26.3% and 21%, respectively), and Dr Acuin reports that there is also variation between ethnic groups. With greater access to and availability of food, urban Filipinos are also opting for energy-dense foods and foods high in saturated fats, and they are consuming fewer fruits and vegetables. Indeed, Dr Acuin believes that the true prevalence of obesity and overweight may be even higher than the figures suggest: “There might be a problem of high abdominal obesity but low BMI.” Measuring the waist-to-hip ratio might be a better tool to identify this problem, which could result in the BMI cut-off being reduced from 25 to 23. Attention also needs to be paid to the alarming stunting figures in the Philippines. According to a Save the Children report issued in September 2015, approximately 30% of Filipino children under five years of age are facing stunted growth, and the Philippines ranks ninth highest in the world in terms of the number of children facing stunted growth.
Physical inactivity is also a significant problem in the Philippines. Many adults are not physically active, and children lack places to play. According to Dr Demetria Bongga, Senior Consultant for Early Warning Systems for Food and Nutrition Security at the Food and Agriculture Organisation, the Department of Education integrates physical activity in the public school curricula but the necessary infrastructure is not in place, particularly in urban areas. Wealthier children are also spending more time on computers, video games and electronic gadgets, and they are assailed by food advertisements on television, computers and billboards, as well as in newspapers. Dr Roberto Mirasol, President of the Philippine Association for the Study of Overweight and Obesity (PASOO), also highlights habits in the home as a problem. Specifically, he argues that parents who do not eat well set the wrong example for their children—an insight substantiated by the results of our population survey.
IndonesiaIndonesia’s economic growth over the past three decades has produced a burgeoning middle class that is increasingly urbanised and sedentary. Partly as a result of this, Indonesia now has an overweight prevalence of 24.5% (28.4% among females compared to 20.6% among males).50 Regional overweight prevalence variation is significant, ranging from 15.2% in East Nusa Tenggara (the poorest province in Indonesia) to 39.2% in Jakarta (the richest province—yet another indication of the correlation between income levels and obesity prevalence).51 Obesity, better access to primary healthcare services and improvements in life expectancy are also contributing to an increase in the burden of NCDs. Furthermore, 37.2% of children under the age of five are stunted (although public awareness of this issue is low), which increases the risks of developing NCDs when older—the so-called double burden of malnutrition.52
Food availability and changing diets have played an important role in increasing the prevalence of overweight in Indonesia. For example, food availability per capita has grown by 40%, with 20% coming from fat sources,53 and 93.5% of the population do not consume enough fruits and vegetables (i.e., they eat less than five portions a day).54 A larger working population also means that people spend

Tackling obesity in ASEANPrevalence, impact, and guidance on interventions
© The Economist Intelligence Unit Limited 2017 21
more time commuting and less time on food preparation, leading to a preference for processed or pre-prepared food that is ready to eat but tends to be high in carbohydrates and fats. Experts cite the huge array of ready-made food products as a problem, as they are geared to attract all income and age groups, including the young. “The diet in Indonesia is sweet, salty and fatty,” said Dr Torlesse. “For children, there is a lot of snacking that is replacing good, healthy family meals. Often it is a third of total food intake.”
Dr Harriet Torlesse, chief of nutrition at UNICEF Indonesia, argues that “the changing diet is a key driver [of obesity],” and that there is insufficient awareness about the linkages between food, nutrition and health, despite public awareness campaigns. Dr Torlesse explained that in many local cultures, it is considered healthy for children to be overweight, and it is shameful for mothers to have underweight babies. This is a legacy of earlier times, when gizi buruk (severe underweight) symbolised the dire national nutritional situation.55
There are also behavioural changes leading to more sedentary lifestyles. For example, “children are given free reign when it comes to TV,” noted Dr Torlesse. Watching excessive amounts of television is a double threat: being sedentary increases the risk of obesity, and television is an important source of advertising for unhealthy foods. Indeed, a multi-country survey on the influence of television advertisements on children found that 16% of children in Indonesia watched over eight hours of television a day, and that for each hour of children’s TV programmes there were 15 minutes of advertising, during which food advertising was dominant.56 The majority of children in Indonesia enjoyed watching TV advertisements (61%), which they thought informed them about product quality/features (75%) and updated them about new products (91%). Although 75% of parents in Indonesia based their buying decisions on their own judgement and only 33% said their decisions were influenced by advertisements, 58% said they were influenced by their children. Indonesia’s physical environment also contributes to increasingly sedentary lifestyles because it is not particularly conducive to physical activity. For example, there are few bike lanes, sidewalks or pedestrian precincts, and parks are rare.
VietnamVietnam has undergone rapid economic growth over the past two decades, spurred by the lifting of the US trade embargo,57 reforms in socioeconomic policy and urbanisation. The country has also seen a concurrent rise in the incidence of both overweight and obesity, particularly when Asia-specific BMI figures are applied. For example, a National Nutritional Survey conducted in 2005 found that one-sixth of the population was obese, including 14.6% of men and 18.1% of women.58 Children and teenagers are particularly affected, with a 2009–10 survey on nutrition finding that almost 6% of children under five were overweight—six times higher than in 2000.59
Nutritional problems diverge in rural and urban areas, and the country still faces what the WHO describes as a “double burden of over and under-nutrition”.60 For example, city-dwellers are three times more likely than their rural peers to be obese,61 children living in rural areas are much more likely to suffer from under-nutrition and stunting, and children based in cities are much more likely to be overweight (32.5%, compared to 13.5% in rural areas).62 A study63 of adolescents in Vietnam’s largest city, Ho Chi Minh, revealed that boys were also more likely to be overweight or obese than girls, with those from the wealthiest households most likely to be affected. The authors of the study suggest that,
Tackling obesity in ASEANPrevalence, impact, and guidance on interventions
© The Economist Intelligence Unit Limited 201722
in part, this reflects a mentality that favours overfeeding sons due to cultural norms. Household diets have also changed, with meals now including much more salt and fat than in the past, as well as more animal- than plant-based protein. The amount of energy from fats consumed has also doubled.64
At the same time, urbanisation and economic growth have brought about a shift in lifestyle. Abandoning the physical demands of agricultural labour, some Vietnamese now live in cities and work in sedentary jobs. As a result, one-quarter of the adult population did not engage in enough physical activity in 2009–10, with young women aged 25–34 the least active demographic. Motorcycles are also replacing bicycles as a favoured mode of transport, and as the economy grows, more Vietnamese are choosing cars.65
General awareness about the problems of obesity is low. Following the Vietnam War, Vietnam suffered a series of famines in the 1970s and 1980s, and memories of food rationing may lead Vietnamese to ignore excess weight, which is still viewed as a sign of prosperity and wealth. Although Vietnam’s Ministry of Health set up the National Institute of Nutrition (NIN) in 1980 to conduct research into the population’s dietary habits, develop nutritional guidelines, implement programmes to improve community knowledge of nutrition, reduce malnutrition in mothers and children, and help the government outline policy, it has tended to focus on under-nourishment rather than obesity. As the WHO observed in 2011, “there has been little activity in Vietnam in addressing the increasing prevalence of overweight and obesity in children and adults”66 and no budget had been allocated to the task.
In 2012, however, the government published its National Nutrition Strategy for 2011–2020,67 which appeared to recognise this gap. Its objectives included the goal of “effectively control[ling] overweight and obesity, and risk factors of nutrition related to non-communicable chronic disease in adults”. The Finance Ministry tabled a proposed tax on carbonated drinks (of 10%), although this was later dismissed by the Ministry of Planning and Investment, which questioned whether carbonated beverages actually had a negative impact on the health of consumers. (The Ministry of Trade also expressed concerns about whether foreign and domestic producers of these beverages would be able to absorb the shock of this “special consumption tax”.68) Other interventional possibilities include better communication campaigns to raise awareness, as well as development policies for health promotion interventions targeting poor diet and physical inactivity. Urban planners could also create more green spaces in cities to facilitate exercise in public.
Some positive steps have already been taken. For example, Vietnam has initiated campaigns to encourage breastfeeding, and it has banned advertisements of formula for children younger than two (although other forms of milk marketing continue). It has also introduced programmes69 promoting healthy diets and exercise, such as one in Ho Chi Minh (although obesity rates still increased there between 2004 and 2010). Some schemes focusing on nutrition and physical activity have been successful in moderating children’s diets.70
Tackling obesity in ASEANPrevalence, impact, and guidance on interventions
© The Economist Intelligence Unit Limited 2017 23
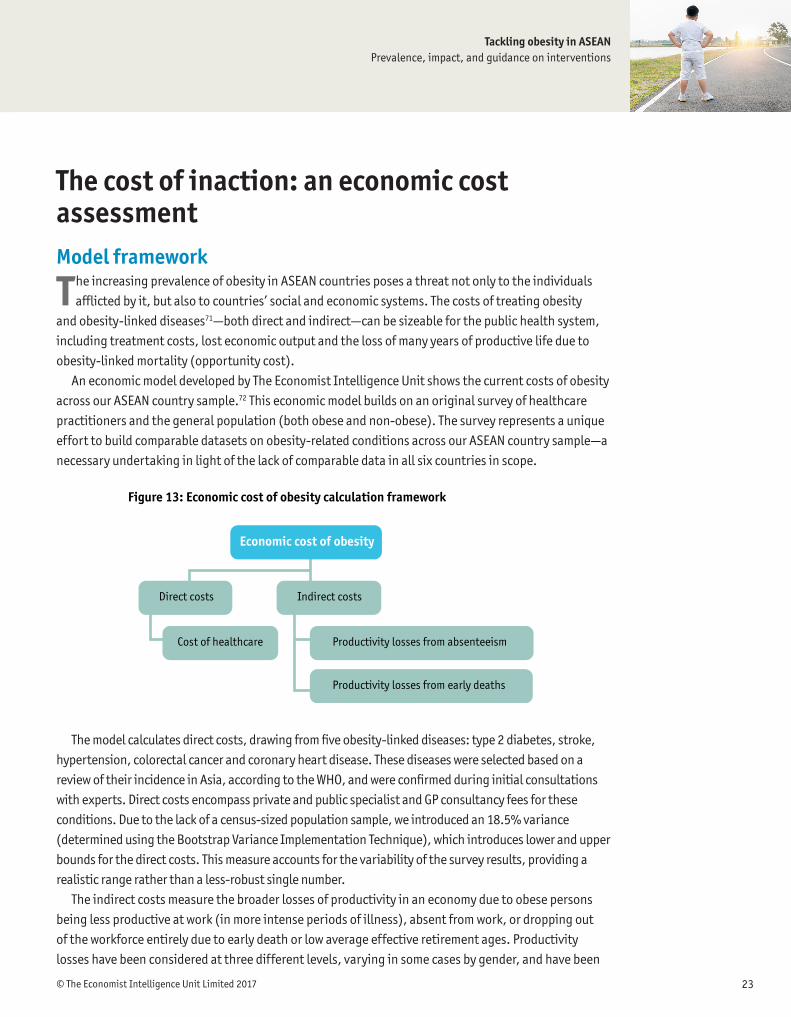
Model framework
The increasing prevalence of obesity in ASEAN countries poses a threat not only to the individuals afflicted by it, but also to countries’ social and economic systems. The costs of treating obesity
and obesity-linked diseases71—both direct and indirect—can be sizeable for the public health system, including treatment costs, lost economic output and the loss of many years of productive life due to obesity-linked mortality (opportunity cost).
An economic model developed by The Economist Intelligence Unit shows the current costs of obesity across our ASEAN country sample.72 This economic model builds on an original survey of healthcare practitioners and the general population (both obese and non-obese). The survey represents a unique effort to build comparable datasets on obesity-related conditions across our ASEAN country sample—a necessary undertaking in light of the lack of comparable data in all six countries in scope.
The model calculates direct costs, drawing from five obesity-linked diseases: type 2 diabetes, stroke, hypertension, colorectal cancer and coronary heart disease. These diseases were selected based on a review of their incidence in Asia, according to the WHO, and were confirmed during initial consultations with experts. Direct costs encompass private and public specialist and GP consultancy fees for these conditions. Due to the lack of a census-sized population sample, we introduced an 18.5% variance (determined using the Bootstrap Variance Implementation Technique), which introduces lower and upper bounds for the direct costs. This measure accounts for the variability of the survey results, providing a realistic range rather than a less-robust single number.
The indirect costs measure the broader losses of productivity in an economy due to obese persons being less productive at work (in more intense periods of illness), absent from work, or dropping out of the workforce entirely due to early death or low average effective retirement ages. Productivity losses have been considered at three different levels, varying in some cases by gender, and have been
The cost of inaction: an economic cost assessment
Figure 13: Economic cost of obesity calculation framework
Economic cost of obesity
Direct costs
Cost of healthcare
Indirect costs
Productivity losses from absenteeism
Productivity losses from early deaths

Tackling obesity in ASEANPrevalence, impact, and guidance on interventions
© The Economist Intelligence Unit Limited 201724
adjusted based on three sets of considerations. Firstly, we included productivity losses as a result of absenteeism in relation to employees’ obesity-linked illnesses. In order to introduce a statistically robust estimate on days of absence attributable to the five obesity-related illnesses in our study, we used an encompassing US-focused dataset.73 We adjusted these numbers to make them relevant to ASEAN nations by accounting for each country’s informal sector in the labour force participation rate. We adjusted the number of days of absence based on the estimated likelihood of an employee in the informal sector taking a sick day, relative to the same probability of this occurring in the formal sector. Secondly, the productivity losses due to either early death (males) or low average effective retirement ages (females) were integrated into the economic cost calculations. The estimate of years of life lost for obese males was based on the difference between the life expectancy of an average male in the country and the average life expectancy of an obese male in the same country. In the case of obese females, early death was not a significant concern across our ASEAN country sample. Instead, the years of productivity lost for obese females was based on the gradient between their legal retirement ages and the actual effective retirement ages in each nation—a number considerably below the legal retirement age. (In other words, women retire before the legal retirement age, meaning that productivity losses are not as substantial.) Lastly, the indirect cost computation took into consideration the fact that obese individuals suffering from the five obesity-related diseases tend to be less productive at work as their age nears their life expectancy, but before their legal retirement age. We therefore adjusted productivity down for the last years of their working life.

Tackling obesity in ASEANPrevalence, impact, and guidance on interventions
© The Economist Intelligence Unit Limited 2017 25
Economic cost calculations: resultsMalaysia and Indonesia are experiencing the highest overall costs of obesity in the country sample.Tackling obesity can free up resources in national healthcare systems, potentially enabling investment in expanding access to healthcare and improving the quality of healthcare provision. Total (direct and indirect) costs of obesity represented as a percentage of national healthcare spending in our country sample are highest in Malaysia (10–19%) and Indonesia (8–16%). They are lowest in Vietnam (1–3%) and Thailand (3–6%). The direct costs of obesity account for a major part of these estimates, with Malaysia’s direct costs accounting for 9–18% of healthcare spending and Indonesia’s direct costs accounting for 7–15%. Vietnam is again the lowest, with direct costs of obesity accounting for 1¬2% of the country’s national healthcare spending. These percentage ranges are benchmarked to each country’s national healthcare spending in order to enhance the readability of these estimates. However, not all costs assessed in our economic impact analysis are included in a country’s national healthcare spending.
Absolute costs of obesity depend largely on population size.In absolute terms, Indonesia and Malaysia remain the countries most affected by obesity in our country sample: total (direct and indirect) costs of obesity in 2016 were highest in Indonesia (US$2–4bn), closely followed by Malaysia (US$1–2bn). The dollar-value impact observed in the Philippines was US$0.5–1bn, while the total costs of obesity in Thailand stood at US$0.8–2bn. The absolute cost of obesity was lowest in Vietnam, with a dollar-value impact of US$203–371m. In our analysis, absolute costs are driven by three key factors: (1) the size of the population; (2) the prevalence/incidence of obesity; and (3) the cost of treatment.
1. In spite of fairly low prevalence rates (5%), obesity has a strong impact in the Philippines, due to the large number of obese persons.
2. In Thailand, the high economic impact of obesity is directly attributable to the high prevalence rate of obesity (at about 9%).
3. Among the smaller nations within our ASEAN country sample, Singapore has the highest dollar-value impact of obesity for 2016, estimated at US$0.4–1bn. This is largely due to the high cost of healthcare in the country.
We used international obesity prevalence estimated from the WHO to ensure data comparability. However, some national sources suggest that the prevalence of obesity may be higher.For example, we conducted an alternative calculation using Singapore’s National Health Survey (NHS 2010) headline estimate of 10.8% obesity prevalence in the country. The estimated cost of obesity was significantly higher than in our baseline scenario, which used the WHO 2014 estimates. Singapore’s total cost of obesity estimates under this alternative scenario is US$0.7–2.0bn, representing 5.1–13.9% of the country’s national healthcare spending in year 2016.
When analysing these estimates, it is important to recognise that it is not statistically accurate to pick the median point of the ranges and use these values as headline estimates.i
i Please refer to the meth-odology section for a full explanation.

Tackling obesity in ASEANPrevalence, impact, and guidance on interventions
© The Economist Intelligence Unit Limited 201726
Relative to nominal GDP, the direct costs of obesity in our ASEAN country sample are relatively low. As a percentage of national nominal GDP, the direct costs of obesity never exceed 0.8% (lower bound 0.4%) in Malaysia (the worst affected country) and go as low as 0.1% in Vietnam’s lower-bound estimate (upper bound 0.15%). The remaining four countries have direct costs of between 0.1% and 0.5% of nominal GDP. However, it should be noted that direct costs in this model do not cover the costs of medication, hospitalisation and surgery; they only cover the costs of practitioner/specialist consultations. This suggests that the numbers for direct costs produced in this study are likely to be an underestimate of the actual cost of obesity.
Obesity is reducing productive years by a weighted average of between four and nine years across our ASEAN country sample. Productive years lost due to either early death linked to obesity (males) or low average effective retirement ages when compared to legal retirement ages (females) are significant in our ASEAN country sample, with noticeably high variation across gender and no obvious correlation with countries’ development level. Among obese males, obesity-linked diseases are reducing productive
Figure 14: Total costs of obesity as a percentage of nominal GDP(%)
Vietnam
Thailand
Singapore
Philippines
Malaysia
Indonesia
0.03 0.07 0.0350.15
0.04 0.16 0.048
Direct costs (lower bound)
0.33
0.01 0.14 0.0090.47
0.03 0.16 0.0330.32
0.05 0.35 0.0490.75
0.02 0.18 0.0280.37
Indirect costs (lower bound)
Direct costs (upper bound)Indirect costs (upper bound)
Figure 15: Total costs of obesity as a percentage of healthcare spending(%)
Vietnam
Thailand
Singapore
Philippines
Malaysia
Indonesia
0.45 1.04 0.522.19
0.64 2.38 0.73
Direct costs (lower bound)
5.02
0.17 2.74 0.189.46
0.62 3.49 0.737.13
1.11 8.46 1.2018.16
0.97 7.00 1.1014.61
Indirect costs (lower bound)
Direct costs (upper bound)Indirect costs (upper bound)

Tackling obesity in ASEANPrevalence, impact, and guidance on interventions
© The Economist Intelligence Unit Limited 2017 27
Figure 16: Productive years lost, male (by country)(%)
Vietnam
Thailand 5 years lost 10 years lost
Singapore
Philippines
Malaysia
Indonesia
8 years lost
6 years lost
6 years lost
2 years lost 7 years lost
6 years lost
12 years lost
11 years lost
10 years lost
1 year lost
Figure 17: Productive years lost, female (by country)(%)
Vietnam
Thailand 2 years lost 7 years lost
Singapore
Philippines
Malaysia
Indonesia
0.3 years lost
7 years lost
3 years lost
5 years lost 9 years lost
10 years lost
5 years lost
12 years lost
8 years lost
5 years lost
years by between eight and 12 years in the Philippines (the worst affected), between six and 11 years in Malaysia and between six and ten years in Indonesia. In Singapore, between one and six years are lost, possibly reflecting the country’s stronger healthcare system. For obese women, outcomes are somewhat different and are attributable to their low average effective retirement ages, rather than early death (prior to life expectancy levels), across the country sample. Malaysia has the largest number of years lost due to obesity among obese females (between seven and 12 years), and Singapore has a higher loss among obese women than men (between five and ten years).
In a theoretical scenario where the prevalence of obesity across our country sample goes from 6% to 25% (the current prevalence of overweight) in the year 2016, the economic cost of obesity would increase by 4.5 times compared to our baseline calculations.In this theoretical scenario, we assumed that the prevalence of obesity across our ASEAN country sample increases from 6% to 25% (the current prevalence of overweight) in 2016 and that population suffers from the same conditions highlighted by our survey for the actual obese population. Intuitively, the results and the magnitude of the total costs of obesity in this scenario follow the same direction
Tackling obesity in ASEANPrevalence, impact, and guidance on interventions
© The Economist Intelligence Unit Limited 201728
observed in our baseline scenario. The effect of population size is magnified: Indonesia, the most populous country in our study, records drastic increases in its total cost of obesity (moreover, a very large section of Indonesia’s population is already overweight). The total costs of obesity for Indonesia under this scenario lie between US$10bn and US$18bn. The Philippines also experiences a significant increase, driven by similar factors, with a total cost of obesity under this scenario falling between US$3bn and US$6bn. Conversely, the cost of obesity in Vietnam under this scenario lies between US$2bn and US$3bn due to a smaller population size, lower overweight prevalence/incidence rates and lower cost of treatment. For Singapore, Malaysia and Thailand, the total costs of obesity in this scenario are US$2–6bn, US$4–7bn and US$3–5bn, respectively.
To maintain comparability and consistency with other studies, this economic impact assessment uses the WHO’s BMI cut-offs for overweight and obesity. Our economic cost assessment is based on the WHO’s overweight/obesity incidence and prevalence figures (2014). However, the underlying dataset for our relative-risk values— which measure the incidence rate of being obese and having one or more of the obesity-related conditions—is unavailable. For this reason, it is not possible to base our analysis on the lower Asian BMI cut-off points.ii
ii Asian BMI cutoff points: overweight (BMI>=23); obese (BMI>=27.5)

Tackling obesity in ASEANPrevalence, impact, and guidance on interventions
© The Economist Intelligence Unit Limited 2017 29
Introduction
G iven the economic and social costs of obesity, the case for acting quickly is beyond dispute. However, designing appropriate interventions is not easy. Obesity has genetic, behavioural
and environmental causes, and responses must be judged against political and technical feasibility, competing health priorities and cost. Obesity is also just one of many challenges faced by Asian countries, which are often battling infectious disease, poverty and under-nutrition.
Obesity results primarily from excessive or inadequate (from a macronutrients perspective) food intake, although lack of physical activity and genetic susceptibility are also contributors. Simple guidelines exist, primarily from the WHO, to help people maintain a healthy weight: total dietary fat should not exceed 30% of total energy intake, fat consumption should shift from saturated to unsaturated fats, and industrial trans fats should be eliminated from diets. The WHO also advises limiting intake of free sugars to less than 10% of total energy intake and a further reduction to less than 5% of total energy intake for additional health benefits; calls for exclusive breastfeeding of babies, which can protect against obesity; and recommends at least 150 minutes of physical activity per week.74
Unlike guidance for preventing cancer—which only reduces probabilities and never eliminates risk entirely—the chances of developing obesity are minimal if a person follows these rules. Despite this, getting people to adopt healthy behaviours is surprisingly difficult. A global study of overweight and obesity trends in children and adults between 1980 and 2013, published in The Lancet, came to a sobering conclusion: “No national success stories have been reported in the past 33 years.”75 The authors systematically identified 1,769 surveys, reports and published studies over three decades76 and found that the proportion of adults with a BMI of 25 kg/m2 or greater (overweight) increased from 28.8% to 36.9% between 1980 and 2013, with a substantial increase in overweight and obesity in children and adolescents in both developed and developing countries.
This chapter provides an evidence review of published academic studies of obesity interventions globally and within the ASEAN, as well as an assessment of policy responses applied in our country sample in comparison with this evidence. The goal is to provide evidence-based principles to help policymakers and health organisations design the best interventions.
Obesity interventions

Tackling obesity in ASEANPrevalence, impact, and guidance on interventions
© The Economist Intelligence Unit Limited 201730
The frameworkIn order to evaluate the evidence regarding the effectiveness of interventions for preventing and controlling obesity, The Economist Intelligence Unit reviewed seven international frameworks that have been used to identify and group obesity interventions. Following this review, we selected the United Kingdom’s Foresight framework as most appropriate for the ASEAN and this study.77
Global evidence searchesUsing this framework, we compiled a long list of policy intervention categories based on 41 systematic reviews published in the past ten years. To identify high-quality global evidence, we performed a broad search of the Cochrane Database of Systematic Reviews for reviews published in the past ten years relating to obesity. We identified 734 Cochrane reviews, which were sifted for relevance. Nineteen reviews were included in the final evidence review. The long list of intervention categories informed further focused searches for each intervention in the PubMed database. The most relevant studies identified by these searches were included in the evidence review.
ASEAN and Asian evidence searchesRapid, focused searches of the PubMed database for the last ten years identified evidence specific to our ASEAN country sample and the Asia region more broadly. Out of 112 articles assessed for relevance, 52 were assessed based on the full text and 15 ASEAN and Asian studies from this phase of searching were included in the evidence review. Additional top-up searches focused on studies from the ASEAN and Asia. Supplemental search techniques (such as citation searching and scanning reference lists) were used to identify otherwise difficult-to-find articles. Our searches resulted in 70 global studies and 24 ASEAN or Asian-focused studies for evidence review.
Analysis of the “promise” of interventionsThe analysed studies are summarised in the evidence tables in each of the policy interventions sections. These tables indicate the overall promise of each intervention, the primary stakeholders that drive the initiatives and an assessment of their effectiveness at the individual and population level. The evidence for each intervention is outlined, including relevant studies from South-East Asia.
The promise of an intervention is based on the following information:
l The direction of the evidence base: our judgment of the clinical effectiveness of the intervention. This is defined as evidence of a strong positive effect, a moderate positive effect, uncertain or mixed evidence, no available evidence or evidence of no effect.
l The quality of the evidence: a judgment of the quality of the overall evidence base for the intervention. Strong evidence is characterised by high-quality research methods with a low risk of bias. Moderate evidence is characterised by good-quality evidence that may be liable to risks of bias. Weak evidence is either evidence of poor quality or a high-quality systematic review based on poor-quality studies, both of which increase the risk of bias.
l The magnitude of population impact: a judgement of the reach, scalability and practicality of the intervention for the target population. Interventions are assessed as having a high, medium or low population impact.

Tackling obesity in ASEANPrevalence, impact, and guidance on interventions
© The Economist Intelligence Unit Limited 2017 31
Taken together, these three components offer an evaluation of the overall promise of an intervention.78 Although some interventions appear to have low promise, this does not necessarily mean that they would be ineffective in all circumstances. It may be that there is a lack of evidence of effectiveness, or that they need to be implemented in combination with other interventions.79
Policy researchThis review was supplemented by primary and secondary research on policies and interventions that are being trialled and tested in ASEAN countries. In order to provide a detailed account of ongoing initiatives that may not have been covered in academic studies, we conducted extensive desk research focused on policy documents and grey literature, and we conducted in excess of 20 interviews with policymakers, academics and public health specialists in our ASEAN country sample. Additional insights were generated through our survey of healthcare practitioners, covering 60 specialists in countries in our ASEAN country sample.
Four categories of intervention were identified through the review, encompassing medical (physiological), psychological and lifestyle (food and physical activity) interventions targeted at both individuals and populations:80
l Physiological interventions
l Physical activity interventions
l Psychology interventions
l Food interventions.

Tackling obesity in ASEANPrevalence, impact, and guidance on interventions
© The Economist Intelligence Unit Limited 201732
Figure 18: Interventions showing the greatest promise81
Stakeholder driving change
Category Subcategory Example interventions/focus of interventions
Promise of intervention
Direction of evidence base
Quality of body of evidence
Magnitude of population impact
Physiology Individual Anti-obesity drugs «« ä Strong Medium l l
Activity Individual Physical activity ««« ä Moderate to strong
High l l l
Food
Individual
Calorie-controlled diet «« á Moderate Medium l l l
Low-fat diet «« á Moderate Medium l
Low-carbohydrate diet «« á Moderate Medium l
Low-glycaemic index diet ««« á Moderate to strong
Medium l
Population
School and workplace policies «« ä Moderate High l l l l
Controlling portion size in processed and prepackaged foods
«« ä Moderate High l l
Taxation «« ä Moderate High l
Hea
lthc
are
Educ
atio
n
Polic
y
Food
Key findings from the evidence review Overall findingsInterventions that target food intake show the most promise in terms of impact at the population level to reduce obesity.Low glycaemic index diets show the greatest promise as far as dietary interventions are concerned, although low-calorie, low-fat and low-carbohydrate diets have also been found to be effective. Interventions delivered at the population level that target food consumption are also important. Based on global evidence, reducing portion sizes (which have increased dramatically since the 1970s), taxing specific food types and implementing certain school and workplace policies (such as removing vending machines and providing water coolers) have all shown promise in the fight against obesity and the creation of an obesogenic environment.
Interventions that target physical activity also show promise. There is moderate to strong evidence that individual exercise and increased physical activity help to tackle obesity, especially when combined with a diet. A Cochrane systematic review of 43 randomised controlled trials confirmed that exercise alone, three to five times a week, caused 0.5–4 kg of weight loss, compared to the outcome without any exercise. The same review also found that a combination of exercise and a monitored diet is more effective than a diet alone, causing a further 1 kg of weight loss over and above the results of exercising only.
The evidence is weaker for activity-related population-level interventions, such as workplace activity schemes, land-use mix or active transport. However, schemes that enable more physical activity through infrastructure have met with some success—for example, introducing cycle paths and safe paths and increasing the provision of playgrounds.

Tackling obesity in ASEANPrevalence, impact, and guidance on interventions
© The Economist Intelligence Unit Limited 2017 33
Media campaigns that promote physical activity have also met with some success, especially when they focus on lifestyle factors and diet alongside activity. Other psychological interventions designed to change behaviour show promise, including the regulation of marketing targeted at children and adolescents, campaigns to raise awareness and smartphone interventions. However, the evidence behind such interventions tends to be of low quality, which precludes them from featuring in our list of the most promising interventions.
Finally, there is moderately good-quality evidence that various keyhole surgical techniques are safe, and that they qualify as effective methods for inducing often-dramatic weight loss in people who are morbidly obese. However, high costs limit the applicability of surgical interventions at a population level.
Interventions by category1. Physiological interventionsThe physiological interventions that tackle obesity fall into two broad groups: surgical procedures and anti-obesity medications. Surgery could be a safe and effective option that leads to greater weight loss than non-surgical interventions in the short term (up to one or two years). It improves quality of life and can put type 2 diabetes into remission. Gastric bypass and sleeve gastrectomy performed by keyhole surgery are the most effective operations, although for morbidly obese people, biliopancreatic diversion with duodenal switch is applied. Most current evidence relates to adults, but adjustable gastric banding was also effective in a case series of 50 adolescents aged 14 to 18 with BMIs greater than 35. The literature on the outcomes of surgical interventions in ASEAN countries specifically is sparse. Although surgical interventions are effective, they are expensive to perform, require technical expertise and involve ongoing medical costs that can be considerable (due to revision surgery, which has been reported in 2–13% of cases, as well as managing complications, which can occur in up to 37% of cases).82 For these reasons, surgical interventions have a low magnitude impact at a population level.
Anti-obesity drugs have wider potential application. Orlistat, Lorcaserin and Phentermine plus Topiramate–extended release, combined with lifestyle interventions, are effective and safe for weight loss, although they will not be effective for everyone.83 There is some evidence of small changes in weight for adolescents with Orlistat, Metformin and Exenatide. Bupropion and Zonisamide also have emerging evidence of inducing weight loss, especially when combined with a low-calorie diet. Sibutramine and Rimonabant have been removed from the market due to cardiovascular risks. Worryingly, however, Sibutramine has been found in some unregulated supplements available on the Internet in South-East Asia.
No randomised controlled trials were identified from any of the ASEAN countries.
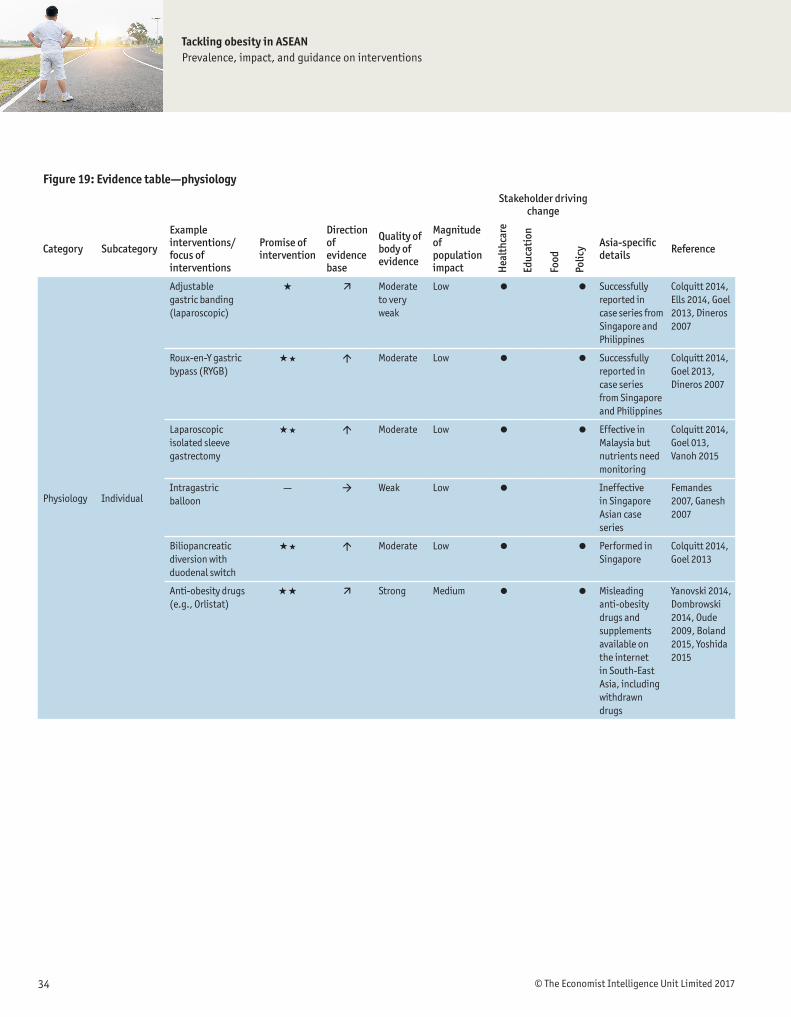
Tackling obesity in ASEANPrevalence, impact, and guidance on interventions
© The Economist Intelligence Unit Limited 201734
Figure 19: Evidence table—physiologyStakeholder driving
change
Category Subcategory
Example interventions/focus of interventions
Promise of intervention
Direction of evidence base
Quality of body of evidence
Magnitude of population impact
Asia-specific details Reference
Physiology Individual
Adjustable gastric banding (laparoscopic)
« ä Moderate to very weak
Low l l Successfully reported in case series from Singapore and Philippines
Colquitt 2014, Ells 2014, Goel 2013, Dineros 2007
Roux-en-Y gastric bypass (RYGB)
«« á Moderate Low l l Successfully reported in case series from Singapore and Philippines
Colquitt 2014, Goel 2013, Dineros 2007
Laparoscopic isolated sleeve gastrectomy
«« á Moderate Low l l Effective in Malaysia but nutrients need monitoring
Colquitt 2014, Goel 013, Vanoh 2015
Intragastric balloon
— à Weak Low l Ineffective in Singapore Asian case series
Femandes 2007, Ganesh 2007
Biliopancreatic diversion with duodenal switch
«« á Moderate Low l l Performed in Singapore
Colquitt 2014, Goel 2013
Anti-obesity drugs (e.g., Orlistat)
«« ä Strong Medium l l Misleading anti-obesity drugs and supplements available on the internet in South-East Asia, including withdrawn drugs
Yanovski 2014, Dombrowski 2014, Oude 2009, Boland 2015, Yoshida 2015
Hea
lthc
are
Educ
atio
n
Polic
y
Food
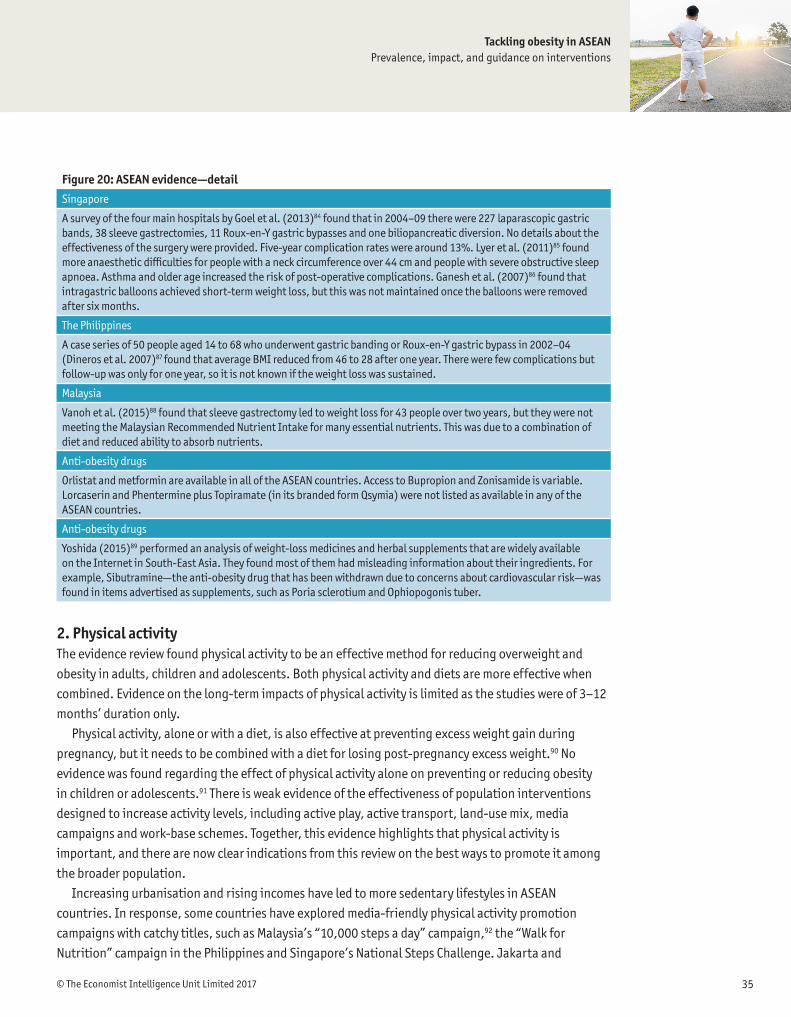
Tackling obesity in ASEANPrevalence, impact, and guidance on interventions
© The Economist Intelligence Unit Limited 2017 35
Figure 20: ASEAN evidence—detailSingapore
A survey of the four main hospitals by Goel et al. (2013)84 found that in 2004–09 there were 227 laparascopic gastric bands, 38 sleeve gastrectomies, 11 Roux-en-Y gastric bypasses and one biliopancreatic diversion. No details about the effectiveness of the surgery were provided. Five-year complication rates were around 13%. Lyer et al. (2011)85 found more anaesthetic difficulties for people with a neck circumference over 44 cm and people with severe obstructive sleep apnoea. Asthma and older age increased the risk of post-operative complications. Ganesh et al. (2007)86 found that intragastric balloons achieved short-term weight loss, but this was not maintained once the balloons were removed after six months.
The Philippines
A case series of 50 people aged 14 to 68 who underwent gastric banding or Roux-en-Y gastric bypass in 2002–04 (Dineros et al. 2007)87 found that average BMI reduced from 46 to 28 after one year. There were few complications but follow-up was only for one year, so it is not known if the weight loss was sustained.
Malaysia
Vanoh et al. (2015)88 found that sleeve gastrectomy led to weight loss for 43 people over two years, but they were not meeting the Malaysian Recommended Nutrient Intake for many essential nutrients. This was due to a combination of diet and reduced ability to absorb nutrients.
Anti-obesity drugs
Orlistat and metformin are available in all of the ASEAN countries. Access to Bupropion and Zonisamide is variable. Lorcaserin and Phentermine plus Topiramate (in its branded form Qsymia) were not listed as available in any of the ASEAN countries.
Anti-obesity drugs
Yoshida (2015)89 performed an analysis of weight-loss medicines and herbal supplements that are widely available on the Internet in South-East Asia. They found most of them had misleading information about their ingredients. For example, Sibutramine—the anti-obesity drug that has been withdrawn due to concerns about cardiovascular risk—was found in items advertised as supplements, such as Poria sclerotium and Ophiopogonis tuber.
2. Physical activityThe evidence review found physical activity to be an effective method for reducing overweight and obesity in adults, children and adolescents. Both physical activity and diets are more effective when combined. Evidence on the long-term impacts of physical activity is limited as the studies were of 3–12 months’ duration only.
Physical activity, alone or with a diet, is also effective at preventing excess weight gain during pregnancy, but it needs to be combined with a diet for losing post-pregnancy excess weight.90 No evidence was found regarding the effect of physical activity alone on preventing or reducing obesity in children or adolescents.91 There is weak evidence of the effectiveness of population interventions designed to increase activity levels, including active play, active transport, land-use mix, media campaigns and work-base schemes. Together, this evidence highlights that physical activity is important, and there are now clear indications from this review on the best ways to promote it among the broader population.
Increasing urbanisation and rising incomes have led to more sedentary lifestyles in ASEAN countries. In response, some countries have explored media-friendly physical activity promotion campaigns with catchy titles, such as Malaysia’s “10,000 steps a day” campaign,92 the “Walk for Nutrition” campaign in the Philippines and Singapore’s National Steps Challenge. Jakarta and

Tackling obesity in ASEANPrevalence, impact, and guidance on interventions
© The Economist Intelligence Unit Limited 201736
Bandung have also experimented with car-free Sundays to encourage people to use the streets for physical activities. Physical activity has also been built into national strategies aimed at fighting obesity, with regular exercise established as a pillar of the Thai Ministry of Public Health’s strategic plan for 2011–20.93
Figure 21: Evidence table—physical activityStakeholder driving
change
Category Subcategory
Example interventions/focus of interventions
Promise of intervention
Direction of evidence base
Quality of body of evidence
Magnitude of population impact
Asia specific details Reference
Activity
Individual
Physical activity ««« ä Moderate to strong
High l l l Ineffective intervention in a Malaysian university
Stoner 2016, Shaw 2006, Amorim 2013, Muktabhant 2015, Soon 2013
Population
Active play — à Weak Low l l 40% of Malaysian 4 to 6 year olds have more than 2 hours active play per day
WHO 2016, Tremblay 2015, Lee 2016
Active transport «« ä Weak High l Shorter weekly walking and cycling linked to less obesity in China
WHO 2013, Flint 2016, Lu 2013
Land-use mix «« ä Weak High l Increased urbanisation across South-East Asia is associated with obesity
Mackenbach 2014, Angkurawara- non 2014
Mass-media campaigns promoting physical activity
«« à Moderate High l l None found WHO 2013, Baker 2015, Brown 2012, Wardie 2001, Ankan 2014, Bauman 2001
Work-based physical activity schemes
— à Weak Low l l l Singapore national workplace weight loss competition initially successfully
Freak-Poli 2013, Vasquez 2015
Trade agreements
«« ä Weak High l Sugar-sweelened fizzy drinks sales increased from 3.3% to 12.1% per capita per year after import restrictions were removed
Schram 2015
Hea
lthc
are
Educ
atio
n
Polic
y
Food
Tackling obesity in ASEANPrevalence, impact, and guidance on interventions
© The Economist Intelligence Unit Limited 2017 37
However, there have been very few evaluations of these promotional campaigns. Singapore is one of the few countries to have implemented a structured and evaluated exercise intervention: the Trim and Fit Programme, introduced in primary, secondary and pre-university schools in 1992.94 This programme included physical activity regimens for overweight students, combined with curricular measures and restrictions on food and drinks in canteens. The scheme led to a reduction in the prevalence of obesity in 11 to 12 year olds from 16.6% in 1992 to 14.6% in 2000, and in 15 to 16 year olds from 15.5% to 13.1%. However, because this was a multidimensional programme, it was not possible to calculate the impact of physical activity alone, nor the effect of other intervening external variables. The percentage of overweight students fell modestly, from 11.7% in 1993 to 9.5% in 2006.95 The nation-wide National Steps Challenge, which launched in 2015, leverages the use of technology in the form of a wearable device (to track steps) coupled with incentives for participants who walk more. Participants were found to register 1,500 more steps daily on average as compared to adults in a controlled group study conducted by the Health Promotion Board.
There have been four other Asia-region evaluations or meta-analyses of physical activity interventions. A systematic review and meta-analysis by Stoner et al. (2016)96 included randomised controlled trials of children in schools in Singapore, South Korea and China, and found that increasing physical activity to an average of three times per week led to a small to moderate amount of weight loss in overweight children aged 10–19. The change in BMI was 1.19 over the course of 6 and 36 weeks.
In the Philippines, Tan-Ting and Llido (2011)97 found that a hospital-based multidisciplinary intervention was successful in reducing the weight of 44 obese children and adolescents over three months. The intervention involved a paediatrician, endocrinologist, cardiologist, registered dietitian, rehabilitation medicine physician, physical therapist and psychiatrist. The children, aged between 5 and 17, were provided with tailored physical activity and diet plans, with support to identify triggers for overeating behaviours. The study did not involve a control group, however, which reduces the strength of the results, and longer term follow-up was not reported, so it is not known if the achievements were sustained. It is also not possible to measure the impact of the physical exercise alone, as it was part of a broader programme of activity that included dietary changes. A Malaysia-based randomised trial involving 107 participants (Wafa et al. 201198) also successfully promoted weight loss in obese 7 to 11 year olds. The programme provided counselling to change sedentary behaviour, increased physical activity and changed diets through eight one-hour sessions over 26 weeks. Again, it was not possible to isolate the impact of physical activity alone in this multicomponent programme.
Studies of other physical activity programmes have shown more limited impact. Soon et al. (2013)99 found that over 12 weeks, 28 abdominally obese adults working in a Malaysian University did not alter calorie intake or increase activity levels, despite being provided with a pedometer and a goal to walk 10,000 steps per day. Lectures, group discussions, a telephone calls, a diary and an intervention booklet were provided to help achieve the targets, but the intervention did not lead to any significant change in weight or BMI.
Other physical activity interventions in ASEAN countries include efforts to redesign public spaces to make them more exercise-friendly. Singapore is the most active country in this area: its Urban Redevelopment Authority Draft Master Plan 2014 focused on recreation and open spaces, set a goal of
Tackling obesity in ASEANPrevalence, impact, and guidance on interventions
© The Economist Intelligence Unit Limited 201738
having over 90% of residents living within 400 metres of a park and pledged to build new housing with access to walking and cycling facilities. Singapore’s 2013 Land Transport Master Plan also sought to develop off-road cycling paths, setting a goal of building 190 km of track by 2020. Some Indonesian provincial capitals (including Balikpapan, Yogyakarta, Surabaya, Denpasar, Bandung and Palembang) have also introduced bike lanes, and Jakarta developed a 1.5 km lane (introduced in May 2011) with funds raised by an NGO rather than the city authorities.100 In the rest of the ASEAN country sample, more targeted attempts to promote physical activity include efforts in Thailand to integrate exercise into school curricula, according to Professor Visith. However, such efforts are sporadic and no evaluations have been conducted. Countries are also developing guidelines for citizens such as the National Physical Activity Guidelines for Singapore, which suggest that healthy adults undertake at least 150 minutes of physical activity per week.
There are two broad lessons from the ASEAN experience: (1) physical activity is relevant as part of a successful campaign to fight obesity, but (2) physical activity is not, on its own, sufficient. Although governments cannot enforce physical activity regimes in the same way as researchers in a study group, the data lends support for any interventions that make it easier for people to exercise, including providing more public spaces in cities or subsidised gym memberships. The urban planning dimension is particularly important as many ASEAN countries have increasingly congested and polluted cities without open spaces for exercise, and their hot and tropical weather deters people from physical activity. The problem is greater for the poor, who cannot afford membership of air-conditioned gymnasiums.
3. Psychology and behaviour Obesity can develop as a result of genetic factors, but it is more commonly the result of consuming unhealthy foods and undertaking insufficient exercise. This may be due to habits formed in childhood, lack of information or education, or behavioural biases such as present bias, status quo bias, over-optimism or a preference for immediate gratification.101 However, people can change their dietary behaviours, and genetic factors are rarely too overwhelming to prevent a reversal of obesity.102 For these reasons, measures to counteract obesity, or to stop it arising in the first place, rely heavily (either implicitly or explicitly) on addressing psychological and behavioural factors. Restricting
Challenges for ASEAN countries: survey insights on physical activity
In the survey, respondents alluded to the difficulties they have engaging in physical activity. Approximately one-third (32–36%) said they did not undertake exercise because it was not available in their location, and roughly the same proportion
(23–32%, depending on the country) claimed it was due to cost considerations. Some factors, such as lack of time, cannot be influenced directly by the government but are nonetheless common explanations for not undertaking physical activity (cited by 65–70% of respondents). Unsurprisingly, there was a connection between the development level of the country and the degree to which cost was an inhibiting factor.

Tackling obesity in ASEANPrevalence, impact, and guidance on interventions
© The Economist Intelligence Unit Limited 2017 39
Figure 22: Evidence table—psychology and behaviourStakeholder driving
change
Category Subcategory
Example interventions/focus of interventions
Promise of intervention
Direction of evidence base
Quality of body of evidence
Magnitude of population impact
Asia specific details Reference
Psychology
Individual
Multicomponent lifestyle intervention
«« ä Moderate Medium l l l Physical activity plus diet and support successful for case series of children in the Philippines, intervention successful for children but not adults in Malaysia
Colquitt 2016, Loveman 2015, Oude 2009, Walers 2011, Dombrowski 2014, Tan-Ting 2011, Wafa 2011, Soon 2013
Computer-based or smartphone interventions
« à Weak Medium l l None found Weiland 2012, Chaplais 2015, Khokhar 2014, Stephens 2013, Caims 2014
Population
Regulation of marketing to children and adolescents
« à Weak High l Singapore and Malaysia found high rates of advertising of unhealthy food to children. South Korea implemented TV advertising restrictions in 2010
WHO 2016, Kim 2012, Stead 2006, Huang 2012, Ng 2014, Baker 2014
Promotion and support of breastfeeding
« à Weak Medium l l Evidence from China and Japan supports the WHO breastfeeding recommen-dation but data from Singapore and Thailand shows no association
Fergusson 2014, Zheng 2014, Jwa 2014, Sabanayagam 2009, Tantrach-eewathorn 2005
Mass-media campaigns promoting multiple interventions (lifestyle, diet and physical activity)
«« ä Weak High l l l Dissemination of the nutritional flag and the Sweet Enough Network in Thailand and Malaysian Dietary Guidelines in a variety of media outlets
WHO 2009, Traill 2013, Mozaffarian 2012, Sirichakwal 2011, Tee 2011
Community level interventions in schools and workplaces
« à Weak Medium l l Singapore’s multifaceted Trim and Fit Programme for schools
WHO 2016, Mozaffarian 2012, Cairns 2014, Flodgren 2010, Toh 2002
Hea
lthc
are
Educ
atio
n
Polic
y
Food

Tackling obesity in ASEANPrevalence, impact, and guidance on interventions
© The Economist Intelligence Unit Limited 201740
certain types of food marketing, launching educational campaigns and tackling problem behaviours qualify as attempts to address these psychological and behavioural traits.
Our evidence review found that multicomponent interventions show promise in their effectiveness for obesity reduction in children and adolescents. A systematic review by Dombrowski et al.103 found that multicomponent interventions led to small reductions in weight for previously obese adults but smaller amounts of weight regain as well, indicating that the evidence is mixed for adults.104 However, an ASEAN study conducted by Soon et al. did not find these interventions effective at all.105 Nonetheless, the WHO recommends regulating marketing to children and adolescents as observational studies indicate that adverts influence children (although no high-quality studies were found on the direct effect of regulation on levels of obesity).106 The WHO also recommends breastfeeding107 to prevent obesity—a recommendation that is supported by large cohort studies in China108 and Japan109 (although small studies in Singapore110 and Thailand111 could not confirm the inverse relationship between breastfeeding and obesity).
Sustained media campaigns with simple messages appear to be the most effective, although their impact is often hard to quantify.112 There is mixed evidence about whether community level interventions in schools113 and workplaces114, and those using smart phones, text messages or computer-based programs, are effective strategies for reducing obesity.115
Behavioural and psychological interventions are popular in ASEAN countries for two reasons. Firstly, governments and health organisations know that lack of education about obesity is a primary cause of rising obesity incidence. Secondly, educational campaigns are low-cost initiatives that do not involve difficult compromises (such as those around regulation of food or advertising restrictions), and they are straightforward to manage. Less attention has been given to more complex behavioural measures, such as tightening regulations on food advertising, although countries have been active in this policy area, as discussed below.
Awareness-raising campaignsInterviewees agreed that across ASEAN countries, and especially in its LMICs, there is a low level of awareness about obesity. Due to a long (and recent) battle against under-nutrition in the likes of Thailand, Vietnam, Indonesia and the Philippines, populations do not see obesity as a health threat. Indeed, in some cases it is even seen as a sign of success or prosperity. “In Asia, many still consider it cute or part of growing up to be obese when young,” explained Dr Ganesh Ramalingam, Consultant General Surgeon with PanAsia Surgery at Mt Elizabeth Novena, Mt Elizabeth Orchard and Parkway East Hospitals.
To counter this, countries have implemented awareness-raising efforts, some of which date back to the 1990s, usually led by government and health stakeholders with involvement from civil society. For instance, Malaysia’s Ministry of Health launched a healthy eating campaign in 1997,129 and a “less is more” campaign (geared towards street food vendors) was introduced in 1998 to reduce sugar intake.130 More recently, Thailand’s National Health Commission sought to raise awareness about overweight and obesity (in 2010), while the Thailand Healthy Lifestyle Strategic Plan (2012) emphasised the risks of unhealthy eating. Despite the Ministry of Public Health’s modest budget,131 Thailand’s public awareness campaigns—including “Thai people with no big belly” and the “Sweet Enough
Tackling obesity in ASEANPrevalence, impact, and guidance on interventions
© The Economist Intelligence Unit Limited 2017 41
Network”—were judged by interviewees to have been successful. The country has also enjoyed a high level of multi-stakeholder engagement and very active civil society involvement. Dr Renu Garg, Medical Officer for NCDs at WHO Thailand, describes this type of intervention as a good collaboration between the government, academics and NGOs.
Interviewees cited the “Thai People have no big belly” campaign, funded by the Thai Health Promotion Foundation,132 as particularly successful. This campaign encouraged the public to check their waist circumferences and compare them against upper limits of 96 cm for males and 90 cm for
Figure 23: ASEAN evidence—detailThe Philippines
Tan-Ting and Llido (2011)116 found that a hospital-based, multidisciplinary intervention in the Philippines was successful in reducing the weight of 44 obese children and adolescents over a three-month period. It is not known whether the achievements were sustained in the longer term. The children (aged between 5 and 17) were provided with individually tailored physical activity and diet plans, as well as support to identify triggers for overeating and maladaptive behaviours. Parents and family were also included in the intervention. The study did not involve a control group, which reduces the strength of the results.
Malaysia
A randomised controlled trial by Wafa et al. (2011)117 of a behaviour change intervention aimed at obese 7–11 year olds in Malaysia was successful in achieving weight loss. It provided counselling to change sedentary behaviour, increased physical activity and altered diet through eight one-hour sessions over 26 weeks. As previously described, a non-randomised controlled trial by Soon et al. (2013)118 highlighted the challenge of engaging people in behaviour change. An intervention over 12 weeks with 28 abdominally obese adults working in a Malaysian university did not lead to any change in weight or BMI, and the control group also stayed the same. Lectures, group discussions, a telephone call, a diary and an intervention booklet were provided to help achieve the targets.
Advertising interventions
A survey conducted in Singapore by Huang et al. (2012)119 found an average of 2.6 adverts for unhealthy food per hour of children’s TV programmes in 2011 (33% of adverts were for food, and 57% of those were advertising unhealthy food). Ng et al. (2014) found similar results in Malaysia120: there were 1.93 adverts for unhealthy food per hour during normal days, rising to 3.51 in school holidays.
In 2010, South Korea implemented effective restrictions on TV advertising of energy-dense and nutrient-poor (EDNP) foods during hours when children are likely to be watching. Even during non-regulated hours, a significant decline was noticed in the number of similar advertisements aired.
Breastfeeding
The WHO recommends breastfeeding to reduce the risks of obesity for the child and mother. A cohort study by Sabanayagam et al. (2009)121 found no association between length of breastfeeding and risk of obesity for 797 children in Singapore. A small observational study by Tantracheewathorn et al. (2005)122 of 156 Thai children also found no difference in the risk of childhood obesity between breastfed and formula-fed infants.
However, Zheng (2014)123 studied a large Chinese birth cohort of 42,550 children and found that breastfeeding for three to five months reduced the risk of childhood overweight by 13%, while breastfeeding for six months or more reduced it by 27%, compared to breastfeeding for less than a month. Jwa (2014)124 found similar results in an observational study of 21,425 boys in Japan, although the results were not significant for girls.
Media campaigns
In Thailand, there is regular dissemination of the nutritional flag and food guide using mass media.125 The country also has an ongoing campaign called the “Sweet Enough Network”, which started in 2003 and has been successful in changing policy (such as removing sugar from follow-on formula milk for children aged six months to three years).126 The impact of these campaigns on obesity has not been evaluated.
Malaysia has promoted its Malaysian Dietary Guidelines through roadshows, exhibitions, leaflets, educational booklets for different ages, a website, newspapers, a cook book for infants and young children, and educational models for primary school children.127 It is also promoted each April during Nutrition Month Malaysia. Again, the effects have not yet been measured.
Community level interventions in schools and workplaces
Singapore’s Trim and Fit Programme was introduced in primary, secondary and pre-university schools in 1992.128 This involved adding nutrition to the education curriculum, providing water coolers, and restricting the food and drinks sold in the canteen. Extra physical activity programmes were provided to overweight students, and obese students were referred for more intensive help from dieticians and doctors. The scheme led to a reduction in the prevalence of obesity in 11 to 12 year olds from 16.6% in 1992 to 14.6% in 2000, and a reduction from 15.5% to 13.1% in 15 to 16 year olds.
Tackling obesity in ASEANPrevalence, impact, and guidance on interventions
© The Economist Intelligence Unit Limited 201742
females, informed by the expert consensus that waist circumference (rather than BMI) is a more accurate measure for assessing obesity and overweight. The UN considers this campaign to be well received by the public, although it points out that the impact is hard to quantify.133 Dr Napaphan Viriyautsahakul of the Ministry of Public Health reported that the programme had created the impetus for establishing the No Big Belly Organisation, which brought together communities, healthcare centres, the private sector and schools to influence dietary behaviours.
The Philippines has also been implementing awareness-raising programmes, including observing an annual National Obesity Prevention and Awareness Week in the first week of September since 1999, led by the Philippine Association for the Study of Overweight and Obesity (PASOO) and the Department of Health. Dr Mirasol claims that this has helped to improve awareness, especially among middle-aged people and older groups. Other popular government-led awareness-raising efforts include the Go4Health movement, which provided advice for citizens, and the Belly Gud programme, which measured the waist–hip ratios of 779 personnel in the Department of Health.134 The Health Secretary distributed prizes at the end of year to those who had reduced their waistlines the most. Although small in scale, initiatives such as this send a signal to the broader population about the need to manage one’s weight.
Singapore has also undertaken several psychology-based campaigns, often leveraging competitive or prize-giving incentives. For instance, the CHERISH Award for Schools (started in 2000) was implemented in primary and secondary schools, junior colleges and academic institutions to recognise schools with comprehensive health promotion programmes for staff and students. Singapore’s “Life’s sweeter with less sugar” campaign (2015) encouraged people to choose unsweetened drinks by offering scratch cards upon purchase of relevant products, with prizes including $300-equivalent vouchers.
These catchy, media-driven national campaigns are only one way to positively influence people’s psychology. Another strategy is to publish nutritional guidelines that inform consumers about how different ingredients affect their weight, using visual or text-based approaches. This includes dietary reference values, food pyramids, percentage recommendations (GDAs) and activity-equivalent calorie references, which are currently advocated by international organisations such as the United Kingdom’s Royal Society for Public Health.135
In this area, Thailand has been one of the most active countries in the ASEAN, regularly disseminating its nutritional flag and food guide via mass media.136 A cartoon logo, Noynoi, is used on educational materials in schools, books, games and videos. Malaysia has also promoted the Malaysian Dietary Guidelines through roadshows, exhibitions, leaflets, educational booklets, a website, newspapers, a cookbook for infants and young children, and educational models for primary school children.137 The impact of these campaigns has not been rigorously evaluated.138
A third form of psychological intervention involves educational and information campaigns at the school level. From a medical standpoint, these interventions are valuable because unhealthy eating behaviours acquired in childhood can be hard to change, and obesity over the full life cycle is more expensive for the individual—and for society—than late-onset obesity. According to Ms Zalma from the Nutrition Division at the Malaysian Ministry of Health, school interventions send a clear message
Tackling obesity in ASEANPrevalence, impact, and guidance on interventions
© The Economist Intelligence Unit Limited 2017 43
to children that can help them to avoid the pitfalls of obesity in later life. In Malaysia, a task force has explored policy options including developing modules to promote healthy eating and awareness of nutrition for children in grades as early as primary 3, 4 and 5.
Another awareness-raising issue facing ASEAN countries concerns falling breastfeeding rates. Exclusive breastfeeding appears to lower obesity in children,139 but UNICEF has warned that ASEAN levels of exclusive breastfeeding are now as low as 5% in Thailand.140 By definition, exclusive breastfeeding excludes unhealthy complementary foods that are high in fat and sugar. A number of studies found that protein and total energy intake, as well as the amount of energy metabolised, were higher among formula-fed infants relative to breastfed infants, and data suggests that higher protein intake and weight gain can lead to obesity later in childhood.141
The proportion of ASEAN countries with comprehensive legislation in line with the WHO Code142 is highest in the WHO South-East Asia Region (36%, or 4 out of 11 countries). Vietnam and Indonesia have multiple legal measures in place to enforce the code, but Thailand, Singapore and Malaysia have none.143 Among those countries that do have measures in place, however, implementation is uneven.144 Health workers must be educated about the importance of breastfeeding, not just for protecting against infectious diseases, but also to fight obesity.
AdvertisingAdvertising restrictions are an important psychology-based intervention, given that people are increasingly surrounded by advertising, both in conventional media such as television and newspapers, as well as on smart phones and electronic billboards and in public spaces. Advertising unhealthy foods in these domains contributes to the obesogenic environment. One 11-country study found that food advertisements145 accounted for between 11% and 29% of advertisements. Non-core foods were featured in 53–87% of these, and the rate of non-core food advertising was higher during children’s peak viewing times. Most food advertisements containing “persuasive marketing” were for “non-healthy” products (i.e., products “high in undesirable nutrients or energy, as defined by dietary standards”).146
Advertising for energy-dense, nutrient-poor food and beverages targeted at children is intensifying on television, the Internet and social media, and in apps and games, and Asia is not immune to this trend. A 2012 study by Huang et al.147 found that the level of TV advertising for unhealthy food targeted at children in Singapore was high, with an average of 2.6 adverts per hour of children’s TV programmes in 2011. (Over a period of 98 hours, there were 1,344 adverts. Of these, 33% were for food, 57% of which were for unhealthy food). Ng et al. (2014)148 found similar results in a survey in Malaysia. Unhealthy foods were advertised 3.51 times per hour on school holidays, compared to an average of 1.93 per hour during normal days. Non-core (non-healthy) foods were predominant in TV food advertising, with rates greater during school holidays.149 Health experts consider this to be dangerous because childhood obesity is a powerful predictor of obesity in later life, as demonstrated by our survey. This was especially the case in Indonesia, where 73% of obese people claimed to have been obese as children. In Singapore, the Philippines and Malaysia, the figures were 61%, 59% and 49%, respectively. Observational studies show that such advertising directly influences children’s

Tackling obesity in ASEANPrevalence, impact, and guidance on interventions
© The Economist Intelligence Unit Limited 201744
Figure 24: ASEAN evidence—food interventionsStakeholder driving
change
Category Subcategory
Example interventions/focus of interventions
Promise of intervention
Direction of evidence base
Quality of body of evidence
Magnitude of population impact
Asia-specific details Reference
Food Individual
Calorie-controlled diet
«« á Moderate Medium l l l Physical activity plus calorie-restricted diet and support successful for case series of children in the Philippines. Calorie-restricted diet successful for Malaysian men.
Langeveld 2015 Amorim 2013, Teng 2013, Soon 2013, Tan-Ting 2011, Colquitt 2016
Low-fat diet «« á Moderate Medium l None found Johnston 2014, Hooper 2015
Low-carbohydrate diet
«« á Moderate Medium l None found Johnston
2014
Low glycaemic index diet
««« á Moderate to strong
Medium l Low glycaemic diet successful for obese adolescents in Hong Kong
Thomas 2007, Muktabhant 2015, Oude 2009, Kong 2014
Macronutrient diet
«« ä Moderate Medium l l None found Johnston 2014
Dietary supplements
à Weak Low l l None found Tian 2013, Jull 2008
Reducing consumption of energy-rich drinks
«« ä Moderate Medium l l l Rapidly increasing consumption in Thailand, high levels in the Philippines and Singapore (although levels have reduced a little), stable in Malaysia and increasing in Vietnam and Indonesia
Zheng 2015, Avery 2015, Baker 2014
Meal scheduling patterns
« à Weak Medium l l Eating breakfast associated with lower BMI for Malaysian adolescents
Nurul-Fadhilah 2013
Hea
lthc
are
Educ
atio
n
Polic
y
Food

Tackling obesity in ASEANPrevalence, impact, and guidance on interventions
© The Economist Intelligence Unit Limited 2017 45
Figure 24: ASEAN evidence—Food interventions continuedStakeholder driving
change
Category Subcategory
Example interventions/focus of interventions
Promise of intervention
Direction of evidence base
Quality of body of evidence
Magnitude of population impact
Asia specific details Reference
Food Population
Disclosure—food labelling.
« à Moderate Medium l l Inaccurate labelling in 80% of Thailand laboratories, low nutritional labelling understanding
Cecchini 2016, Kerr 2015, U.S.FDA 2015, Kasapila 2016, Judprasong 2013
Reformulation—food prohibitions
« à Weak High l l l l None found Collins 2014, Ziauddeen 2015, Hendry 2015
School and workplace policies
«« ä Moderate High l l l l None found Linde 2012, Scoggins 2011
Controlling portion size in processed and pre-packaged foods
«« ä Moderate High l l None found Hollands 2015, Novak 2012
Taxation «« ä Moderate High l None found Colchero 2016, Thow 2014, Powell 2013, Alagiyawanna 2015
Healthy food subsidies
« à Weak Medium l l None found Cornelsen 2015, Thow 2014, Powell 2013, Alagiyawanna 2015
Trade arrangements
«« ä Weak High l Sugar-sweetened fizzy drinks sales increased from 3.3% to 12.1% per capita per year after import restrictions were removed
Schram 2015
The built environment—zoning laws to limit the prevalence of fast food outlets
«« ä Weak High l None found Boone-Heinonen 2011, Fox 2009, Currie 2010
Hea
lthc
are
Educ
atio
n
Polic
y
Food
Tackling obesity in ASEANPrevalence, impact, and guidance on interventions
© The Economist Intelligence Unit Limited 201746
preferences,150 with a recent qualitative survey by Cancer Research UK highlighting the degree to which children are influenced by energy-dense, nutrient-poor food advertising.151
Cognisant of the dangers of some types of food advertising, ASEAN governments (and several industry groups) have been active in publishing codes of conduct in recent years, some mandatory and some in the form of self-regulation. Although no systematic evidence has been identified regarding the magnitude of the effect on obesity and overweight achieved by limiting such advertising, policymakers and industry associations have levied restrictions nonetheless. Quebec, Norway and Sweden have banned such advertisements aimed at children aged 12 years and under, and the United Kingdom has laws restricting food advertising.152 Asian countries (both governments and the private sector) have placed some limitations on advertising or are reviewing such measures, as outlined below.
l Taiwan’s Food and Drug Administration restricted unhealthy food advertising in January 2016. Commercials promoting unhealthy foods are prohibited from broadcasting on children’s channels between 5pm and 9pm, and companies promoting unhealthy meals aimed at children are prohibited from offering free toys.153 Restrictions are also placed on foods with fat exceeding 30% of the total calorie count, saturated fat exceeding 10% of the total calorie count, foods with in excess of 400 milligrams of sodium per serving, and foods where added sugars make up over 10% of the total calorie count.
Figure 25: ASEAN evidence—detailDiet
A small randomised controlled trial by Teng et al. (2013)171 of overweight 50–70 year old men in Malaysia found that a calorie-restricted diet of 300–500 calories and two days a week of daytime fasting led to a small but significant reduction in BMI, from an average of 26.8 to 25.9 after three months, compared to no change in the control group. In contrast, a small randomised controlled trial by Soon et al. (2013)172 of adults with central obesity (excessive abdominal fat) working in a university in Malaysia found that the recommendation to eat a reduced calorie diet did not lead to any change in weight by three months.
Tan-Ting and Llido (2011)173 found that a hospital-based multidisciplinary intervention in the Philippines, including calorie-controlled diet plans of 1,200–1,500 calories/day, reduced the weight of 44 obese children and adolescents over a three-month period. Longer term follow-up was not reported. A randomised controlled trial by Kong et al. (2014)174 found that obese adolescents in Hong Kong lost significantly more weight on a low glycaemic index diet than the control group by six months.
A cross-sectional study by Nurul-Fadhilah et al. (2013)175 found that Malaysian adolescents who ate breakfast at least five times per week had significantly lower body weight and BMI than those who ate it infrequently. The study did take into account some possible confounding factors but cannot prove cause and effect.
Food labelling
Mandatory nutrition labelling is required in Indonesia and Malaysia, but it is voluntary in Singapore, the Philippines and Vietnam.176 In Thailand, GDA labelling on snack products is mandatory, as is the text “eat less, physical activity more” on some children’s snack products. No studies were identified that explored the impact of nutritional labelling on obesity in ASEAN countries.
With regard to food labelling, it is important to consider the accuracy of the information and the way in which it is displayed. A survey by Judprasong et al. (2013)177 of 17 laboratories in Thailand found that less than 20% demonstrated a good performance. According to a 2012 survey by the Nielsen Company, 8% of consumers in the Asia Pacific region did not understand the nutrition labelling information at all and 31% understood only part of it.178

Tackling obesity in ASEANPrevalence, impact, and guidance on interventions
© The Economist Intelligence Unit Limited 2017 47
l Singapore’s advertising standards authority has claimed that adverts “should not actively encourage children to eat excessively throughout the day or to replace main meals with confectionery or snack foods.”154 Advertising guidelines regulate children’s websites domiciled in Singapore, but they do not cover social media, apps or international websites. A new advertising code took effect in January 2015 to reduce children’s exposure to advertising for food and beverages high in fat, sugar and salt.
l In 2010, South Korea implemented effective restrictions on TV advertising for energy-dense and nutrient-poor (EDNP) foods during hours when children are likely to be watching.155 Even during non-regulated hours, a significant decline was noticed in the number similar advertisements aired.
l In Indonesia, advertisements are not allowed to use children under the age of five, unless the food product is specifically for children under five. Advertisements for processed foods containing ingredients that “endanger or disturb the growth and development” of children cannot be publicised in any media directed at children. However, Yayasan Lembaga Konsumen Indonesia, a consumer association, claims that there are cases where this has not been enforced, and experts interviewed for this report agreed that it has not been effectively implemented.
l In 2008, stakeholders in Thailand published a code of practice requiring companies to ensure that their products met minimum nutritional benchmarks before proceeding to any child-focused advertising. It also restricted communications to children at kindergarten or of primary-school age.
l In 2013, following an endorsement from the Malaysia Ministry of Health, the Malaysian Food Manufacturing Group launched the Responsible Advertising to Children Malaysia Pledge. This self-regulatory mechanism outlined minimum commitments by companies to abide by responsible marketing, including minimum nutritional criteria for child-focused advertising, varying by food type.
l In the Philippines, food companies signed the second edition of the Philippine Pledge on Responsible Advertising to Children in June 2014. Similar to other codes in the region, this requires minimum nutritional criteria for child-focused advertising and restricts advertising to primary school children unless express permission has been granted by schools.
4. Food interventionsDirect food interventions include a range of initiatives such as diets (particularly low glycaemic index diets), restrictions on the availability of food (especially in and around schools), food labelling and taxation. Although food interventions have clinical evidence in their favour, they are among the hardest to design from a policy standpoint, both because they involve difficult negotiations with industries and because people’s diets cannot be directly mandated.
The evidence review found that low glycaemic index diets were the most effective,156 but low-calorie,157 low-fat,158 and low-carbohydrate159 and macronutrient diets also led to weight loss.160 The differences between these diets are minimal and any can be recommended as long as the person is able to maintain the diet in the long term.
Tackling obesity in ASEANPrevalence, impact, and guidance on interventions
© The Economist Intelligence Unit Limited 201748
Other key findings included the following:
l Substituting high-energy drinks with water is a promising intervention, especially in ASEAN countries where the rate of consumption of sugared beverages is rapidly increasing.161
l Eating breakfast was associated with lower BMI in Malaysian adolescents, although the evidence for this of low quality.162
l Food nutritional labelling influences 18% more people to make healthier food choices, increasing to 29% for colour-coded labels.163 However, no impact was found on calorie consumption, and no evidence was found regarding the effect of labelling the nutritional content of food on obesity. This highlights the importance of improving consumer education in ASEAN nations.
l Reformulation of foods164 and zoning laws to limit the prevalence of fast food outlets165 show promise, although evidence to support these interventions is lacking. There is moderate-quality evidence that school and workplace policies are effective, such as increasing access to healthy foods, limiting unhealthy options (such as food from vending machines),166 controlling portion sizes in processed and pre-packaged foods,167 and taxing calorie-dense foods (such as sugar-sweetened beverages).168 There is little evidence on the effect of trade arrangements restricting imports169 or healthy food subsidies.170
Obesity is largely caused by diet, but dietary behaviours are difficult to influence. For this reason, one of the most direct ways to reduce obesity is to influence the contents and availability of food. This has generally been pursued in four ways: adopting a fiscal approach; implementing food-labelling rules; food “zoning”; and introducing school-based food menu interventions.
The fiscal approachGovernments around the world have been exploring taxation of unhealthy foods to discourage consumption, as well as subsidising healthy foods in order to achieve the opposite effect. Taxing energy-dense, nutrient-poor food and beverages is one option, and this approach have been trialled in Mexico, France, Hungary, Norway, California (Berkeley) in the United States and Britain (to be introduced in 2018). Mexico’s tax was estimated to have initially reduced consumption of sugary drinks by 12% and raised over $2bn in tax receipts. It is important to note, however, that this study did not account for the substitution effect and only focused on consumers in Mexican cities with more than 50,000 residents. The city of Berkeley in California, France and Chile introduced similar taxes.179 In Berkeley, the soda tax—the first in US history—reduced consumption by an estimated 21%.180 In Asia, the soft drinks market has been growing since 2010 and policymakers have responded with their own proposals and strategies to encourage responsible consumption. ASEAN countries have also explored policy options, with many proposals but few firm regulations, which indicates that such measures are still under consideration. For example:
l Governments have pondered sugar taxes in Indonesia, India and the Philippines.181
l In India, a government committee recommended a 40% sugary drinks levy in December 2015. This recommendation did not translate into any policy initiatives.
Tackling obesity in ASEANPrevalence, impact, and guidance on interventions
© The Economist Intelligence Unit Limited 2017 49
l Proposals are advancing in the Philippines, where the House of Representatives is set to rule on the introduction of a 10% excise tax on all sugar-sweetened drinks.182
l In Thailand, a proposal was made in April 2016 to tax packaged drinks according to sugar content, which would increase prices by up to 20%.183
l In Vietnam, lawmakers debated, but eventually scrapped, a proposed 10% tax on soft drinks in 2014.184
Of course, taxes have their challenges, but the global literature establishes a clear link between taxation and consumption. Although there is no ASEAN-specific evidence, price elasticity of demand for a product tends to be higher if total income is lower or if the good accounts for a higher share of overall expenditure. It is likely, therefore, that price elasticity is at least as high in ASEAN countries as it is in OECD economies, suggesting that taxation measures would be at least as effective. However, the nature of food and beverage markets in the region mean that the effectiveness of this measure would be at least partially undermined by substitution to informal, untaxed products, which are more prevalent in the ASEAN than in the OECD. In ASEAN countries, street food culture remains dominant, and unregulated alternatives are easily available. Only a limited number of studies account for the substitution effect, meaning that further research is needed to establish causation between, for example, taxation of sweetened drinks and its actual effect on lowering caloric intake (and therefore obesity prevalence). Nonetheless, it is unlikely that substitution would completely undermine the effectiveness of taxation in reducing obesity, and good policy design could minimise the extent to which the informal sector is not covered by a similar incentive.
Introducing subsidies or incentives is also an option. Most notably, Singapore has introduced an incentive to encourage food vendors to transition to healthier oils (i.e., blended vegetable oils, as opposed to palm oil, which is high in saturated fat). Suppliers receiving the incentive pass their savings to wholesalers and distributors, who in turn sell oils at an affordable price to food operators. The converse approach is to remove subsidies for obesogenic ingredients. This was implemented in Malaysia in 2014, when sugar subsidies were lifted (implemented in part due to the rising prevalence of diabetes).
Food labelling Food labelling has been pursued across ASEAN countries, albeit in different ways. Nutrition labelling is required in Indonesia and Malaysia, but it is voluntary in Singapore, Thailand and the Philippines.185
Singapore has adopted “positive labeling”, which rewards healthy foods. The Healthier Choice Symbol on packaged foods reflects a public–private partnership between the Singaporean government and industry, which helps consumers to make informed food choices and has functioned as an incentive for the industry to reformulate foods. Products carrying the label are lower in fat, saturated fat, sodium and/or sugar. More commonly, however, food labelling aims to deter consumers from obesogenic foods.
Thailand has a long history of food labelling, stretching back 100 years,186 but more recently (1998) it has implemented voluntary nutritional labelling (except for food products that make nutrition claims, in which labelling is mandatory). There were also growing calls for a “traffic light” system

Tackling obesity in ASEANPrevalence, impact, and guidance on interventions
© The Economist Intelligence Unit Limited 201750
to alert consumers to fat, sugar or sodium content. In 2010, the National Health Assembly and Thai cabinet proposed a system, followed by a petition by eight health organisations.187 However, after consultation with the Federation of Thai industries, the country opted for a GDA label approach, which came into effect on 24 August 2012. There are plans to expand this approach to include a trans-fat declaration and cover new food types.188
The impact of food labelling on purchasing and consumption behaviours has yet to be evaluated,189 but some broader insights are emerging. Firstly, simplicity is key. Consumer surveys carried out by the Thailand Food and Drug Administration (FDA) claimed that 63% of respondents correctly understand GDA labels,190 but research shows that the format (which is similar to the US Food and Drug Administration’s format) has proven complicated for some consumers. Research in the Asia-Pacific region suggests that 8% of consumers do not understand nutrition labelling information at all and 31% understand only part of it.191
Secondly, expert interviewees suggest that Indonesia’s experiences show that labelling is more effective in reaching better-educated middle-class consumers than those in lower income percentiles.
Lastly, any food contents intervention in an ASEAN country is faced with the challenge of street food, which may prevent price increases or labelling rules governing formal-sector foods from directly influencing the diets of many people. For example, according to Professor Visith Chavasit of Mahidol University, only 10% of Thais rely on industrial processed food, with the majority of the population instead getting their nutrition from traditional street food. A good practice to prevent street food from driving up obesity is Singapore’s community wide “healthy hawker” programme. Re-launched in 2011, this programme encourages street food vendors to prepare dishes with healthier ingredients—for example, substituting regular noodles with wholegrain noodles, substituting white rice with brown rice, using cooking oils with lower percentages of saturated fats, using low-fat milk instead of coconut milk, and reducing use of salt, oil and saturated fats. Vendors are also encouraged to sell drinks containing less sugar. The Singapore Health Promotion Board incentivises these changes by subsidising the costs of the healthier ingredients (e.g., absorbing 10% of the cost of healthier cooking oils).
Food “zoning”Restricting the availability of unhealthy foods is a promising approach, especially in schools, as behavioural evidence shows that influencing the choice environment is more effective than trying to directly dictate people’s food behaviour.192 The more inconvenient unhealthy food is to obtain, the less likely people are to consume it. In January 2012, Malaysia’s Ministry of Education and Ministry of Health announced new guidelines for food and beverages sold in school canteens, which thereafter had to display calorie contents.193 Malaysia also has guidelines regulating what foods and drinks can be sold in the vicinity of schools, although no penalties have been imposed on canteen operators that fail to comply.194
Measures limiting the availability of sugared drinks in schools also have scientific support. Zheng (2015)195 found evidence that substituting sugar-sweetened beverages with water or low-calorie drinks was associated with long-term lower energy intake and less weight gain in both adults and adolescents. Replacing sugar-sweetened beverages with water was associated with a 3 kg weight loss

Tackling obesity in ASEANPrevalence, impact, and guidance on interventions
© The Economist Intelligence Unit Limited 2017 51
and a decrease of 200 calories per day over 12 months. In Thailand, evidence showed that children who attended schools that did not sell carbonated beverages experienced a seven-fold reduction in the overall consumption of carbonated beverages.196 This type of intervention is more effective if it encompasses a broad range of high-sugar products, as this reduces the extent to which substitution undermines the impact of the policy on obesity.
A related intervention involves removing specific ingredients from foods consumed by children and babies. Perhaps the most notable efforts in this area have been focused on trying to remove or reduce sugar in milk formula products. According to Dr Napaphan, the Thai Health Promotion Foundation’s “Sweet Enough Network”, launched in 2003, successfully lobbied for the removal of sugar from follow-on formula milk for six months to three year olds.197 Dr Emorn Wasantwisut of Mahidol University reports that the initiative increased public awareness and garnered media attention on the harmful health consequences of rising sugar consumption.
School-based food programmesGiven the worrying rise in childhood obesity, school-based initiatives have been explored in ASEAN countries, notably Singapore and Thailand. In Thailand, Dr Garg claims that school-based food programmes developed to deal with under-nutrition have been successful. This includes the School Lunch Programme and School Milk Programme (SLP and SMP), a national initiative launched by the Ministry of Education in 1992, which initially covered kindergarten children but now also includes primary school children up to Grade 6.198 These programmes could be repurposed to ensure that school meals contain the optimal balance of nutrients to prevent obesity.
Singapore’s Health Promotion Board has also been active with regard to food in schools, ensuring that affordable healthy meals and beverages are accessible to pupils. Guidelines have also been issued by the Health Promotion Board that stipulate that water coolers are to be made available on the premises to promote water drinking, and teams of nutritionists have been sent to schools to evaluate adherence to guidelines.
Although there are few rigorous studies of these school-based food interventions, one study199 from Vietnam, led by the Ho Chi Minh Nutrition Centre, provides grounds for optimism. Of 2,481 children at two primary schools in the city’s inner and outlying districts, 43.5% were overweight at the beginning of the school year. The number fell to 37.8% six months after a nutrition intervention was carried out.
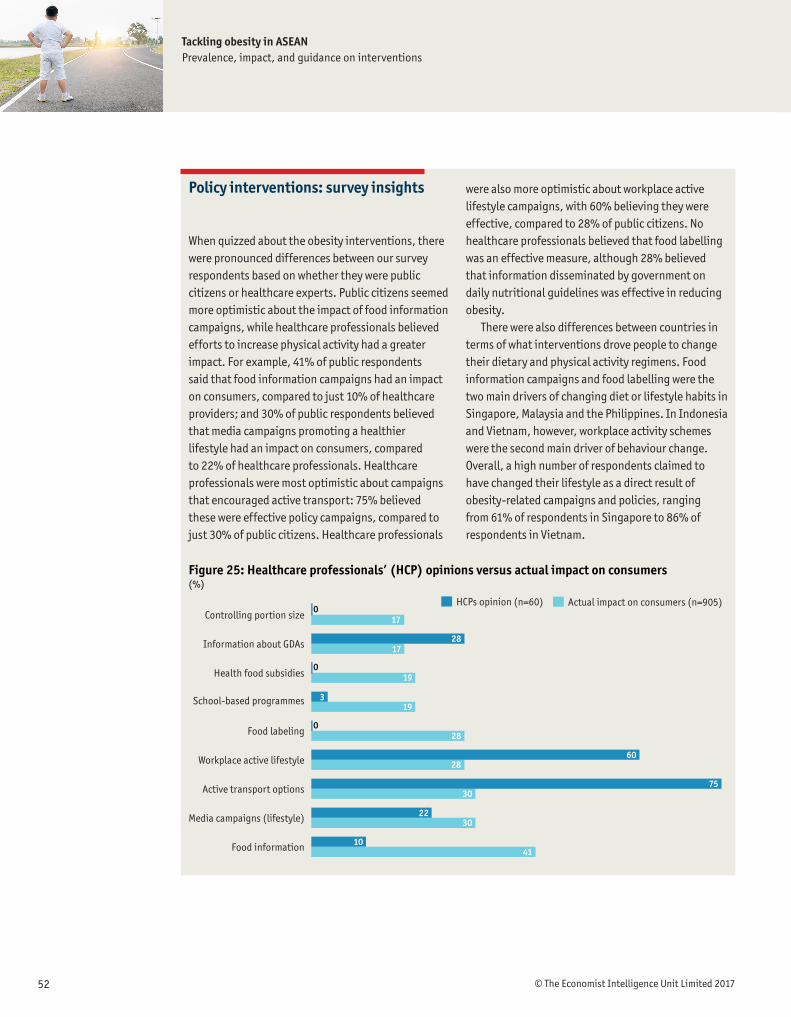
Tackling obesity in ASEANPrevalence, impact, and guidance on interventions
© The Economist Intelligence Unit Limited 201752
Policy interventions: survey insights
When quizzed about the obesity interventions, there were pronounced differences between our survey respondents based on whether they were public citizens or healthcare experts. Public citizens seemed more optimistic about the impact of food information campaigns, while healthcare professionals believed efforts to increase physical activity had a greater impact. For example, 41% of public respondents said that food information campaigns had an impact on consumers, compared to just 10% of healthcare providers; and 30% of public respondents believed that media campaigns promoting a healthier lifestyle had an impact on consumers, compared to 22% of healthcare professionals. Healthcare professionals were most optimistic about campaigns that encouraged active transport: 75% believed these were effective policy campaigns, compared to just 30% of public citizens. Healthcare professionals
were also more optimistic about workplace active lifestyle campaigns, with 60% believing they were effective, compared to 28% of public citizens. No healthcare professionals believed that food labelling was an effective measure, although 28% believed that information disseminated by government on daily nutritional guidelines was effective in reducing obesity.
There were also differences between countries in terms of what interventions drove people to change their dietary and physical activity regimens. Food information campaigns and food labelling were the two main drivers of changing diet or lifestyle habits in Singapore, Malaysia and the Philippines. In Indonesia and Vietnam, however, workplace activity schemes were the second main driver of behaviour change. Overall, a high number of respondents claimed to have changed their lifestyle as a direct result of obesity-related campaigns and policies, ranging from 61% of respondents in Singapore to 86% of respondents in Vietnam.
Figure 25: Healthcare professionals’ (HCP) opinions versus actual impact on consumers(%)
0Actual impact on consumers (n=905)HCPs opinion (n=60)
Food information
Media campaigns (lifestyle)
Active transport options
Workplace active lifestyle
Food labeling
School-based programmes
Health food subsidies
Information about GDAs
Controlling portion size 17
019
028
6028
7530
2230
1041
319
2817

Tackling obesity in ASEANPrevalence, impact, and guidance on interventions
© The Economist Intelligence Unit Limited 2017 53
Obesity and overweight represent a growing public health threat in ASEAN countries. Although the region currently has among the lowest rates of prevalence globally, it is likely that this reflects
its relatively low income status, which will change as countries grow their economies. The correlation between economic development, urbanisation, rising incomes and increasing obesity suggests that ASEAN countries are going to face substantial difficulties related to obesity and the NCDs it causes, including cancer, diabetes, stroke and heart disease.
This study has detailed the prevalence of obesity in the region along with its causes, which range from economic factors such as rising incomes and globalisation to genetic, cultural and biological influences. It has also provided estimates of the economic costs of obesity for a sample of six countries (identifying Malaysia and Indonesia as the worst affected nations), and it has discussed the human costs of obesity, including reduced years of productive life (by a weighted average of between four and nine years across the country sample).
Despite these challenges, effective interventions are available, underpinned by global and regional evidence. These include low glycaemic index, low-calorie, low-fat and low-carbohydrate diets, all of which can be encouraged through a variety of behavioural “nudges.” This includes clear, simple and evidence-based food labelling, restricted access to vending machines and portion size reductions in schools, as well as greater collaboration between industry and government on food product innovation and developing best-practice codes of conduct for food and beverage marketing, especially to children. The evidence also identifies physical activity as key intervention area—as important as diet in our analytical framework.
Drawing on both expert interviews and a global literature review, the study has identified several promising pathways for the future:
l Interventions that target food intake show high promise in terms of impact (reducing obesity) at both the individual and population level.
l Physical activity plays an important role in preventing and reducing obesity, and governments can positively influence people’s access to exercise facilities in ASEAN countries, especially in schools.
l There is an urgent need for simpler food labelling that can have a greater impact on consumers and help them make informed choices.
l Alliances between government, the health community and the food and beverage industry are being trialled globally and will be critical to success. The private sector can play a constructive role in developing new food products with lower sugar and fat contents.
l Obesity in childhood is hard to reverse and can lead to chronic illness, highlighting the importance of child-focused obesity measures. Options include restricting the availability of high-fat or high-sugar foods in school environments, investing more in school exercise infrastructure, restricting child-
Conclusions and policy recommendations
Tackling obesity in ASEANPrevalence, impact, and guidance on interventions
© The Economist Intelligence Unit Limited 201754
focused advertising for energy-dense or high-sugar foods and encouraging exclusive breastfeeding in early years. Physical education must also become a more central part of the school curricula in ASEAN countries, backed by investment that ensures that educational establishments have the necessary facilities. Controlling the obesogenic environment may be advisable in school canteens and play areas and in the outside vicinity. Energy-dense, nutrient-poor food and beverages advertisements aimed at children can pose a health threat.
l Education campaigns should not be dismissed. There are widespread misconceptions about obesity among ASEAN populations, including a lack of understanding of its origins and consequences. There are also cultural challenges, including the presence of unhealthy ingredients in national dishes and social norms that consider fat a sign of health in children. Simple educational campaigns and more effective food labelling can help to tackle complacency and promote healthier choices.

Tackling obesity in ASEANPrevalence, impact, and guidance on interventions
© The Economist Intelligence Unit Limited 2017 55
This report has been written using four linked work streams: a high-level interview programme with policymakers and health experts; an economic cost model; a survey of obese people and healthcare professionals in our ASEAN country sample; and an evidence review of obesity interventions globally. This appendix outlines the methodologies used for the survey, evidence review and economic model.
SurveyThe survey was conducted on two communities: obese individuals (600, with a comparator group of another 600 non-obese individuals) and healthcare professionals (approximately 60) across our ASEAN country sample: Malaysia, Singapore, Indonesia, Thailand, Vietnam and the Philippines. Public respondents were drawn from three age groups: 18–35, 36–50 and above 50. Gender balance varied by country, but the lowest ratio was 36% female respondents and 64% male respondents (the Philippines). Average residence status was approximately 80–85% urban and 15–20% rural. Questions focused on respondents’ eating and physical activity habits, state of health and perceptions of policy interventions designed to tackle obesity in their country. Healthcare professional survey participants included GPs, cardiologists, endocrinologists and oncologists. Questions focused on their opinions about the linkages between obesity and diseases, the impact of obesity of life expectancy and perceptions concerning government responses.
Appendix

Tackling obesity in ASEANPrevalence, impact, and guidance on interventions
© The Economist Intelligence Unit Limited 201756
Evidence reviewThe first phase of the evidence review researched frameworks that had been used to identify and group obesity interventions. We searched key high-quality sources (such as the WHO’s website) and performed other focused Internet searches. Frameworks were reviewed if they focused solely on obesity; those that looked at obesity within a larger set of NCDs were excluded. Our bespoke framework to assess weight-control interventions was built based on analysis of these frameworks.
To compile the long list of policy interventions, we performed a rapid, focused search of the biomedical database MEDLINE (via PubMed) to identify reviews of interventions targeting obesity and weight gain. To focus on the best quality and up-to-date global evidence, we looked for systematic reviews published in the last ten years. The universe of interventions was compiled from 41 publications identified from the grey and academic literature. The searches to find studies for the evidence review were undertaken in three phases to identify (1) high-quality global evidence and (2) evidence specific to our ASEAN country sample and the Asian region. Top-up searches of complementary (although often lower quality) evidence were then performed at the global, Asian and ASEAN level. To enable a top-level review of the global literature, we performed a broad search of the Cochrane Database of Systematic Reviews using variations on the keywords “obesity” and “overweight” for reviews published in the past ten years. Cochrane reviews are considered the gold standard in terms of methodological quality as they comprehensively collect individual trials from around the world on a focused question, sifting through multiple databases. When the studies are similar enough, the results can be synthesised in a meta-analysis, which allows conclusions to be drawn from the collective results. The rigour of Cochrane reviews also ensures that they identify any type of bias that may invalidate the research.
For the global evidence, the initial search was restricted to Cochrane reviews published in the past ten years, although the trials included in those reviews spanned a wider timescale. We identified 734 Cochrane reviews, which were then sifted for relevance based on title and abstract, and then using the full text of the review. Data from 22 Cochrane reviews was extracted and 19 reviews were included in the evidence review.
Additional searches were performed as we progressed through the evidence review for each specific intervention. These searches were performed in the PubMed database, which contains citations for articles published in thousands of journals worldwide. Studies were prioritised in the following hierarchical order: systematic reviews and meta-analyses, randomised controlled trials, non-randomised controlled trials, cohort studies and other observational studies. The most relevant studies identified by the searches were included in the evidence review.
To identify evidence specific to our ASEAN country sample and the Asia region, we performed rapid, focused searches of the PubMed database. The searches combined terms relating to all of the interventions in the long list, obesity and overweight, our ASEAN country sample and the Asia region. Searches used free text terms found in the title or abstract and the relevant medical subject headings (MeSH) indexing terms, where available. These search results were limited to articles published in the last ten years. Some searches were also focused to gather specific types of evidence (e.g., reviews or randomised controlled trials) if a large volume of evidence was retrieved. A total of 112 articles were

Tackling obesity in ASEANPrevalence, impact, and guidance on interventions
© The Economist Intelligence Unit Limited 2017 57
assessed for relevance. After sifting based on title and abstract, 52 were assessed using the full text. Fifteen ASEAN and Asian studies were included in the evidence review from this phase of searching.
Additional top-up searches were performed focusing on studies from ASEAN countries and Asia. Grey literature searching and supplemental search techniques (such as citation searching and scanning reference lists) were used to identify important and otherwise difficult-to-find articles.
The final evidence review included 70 global studies and 24 ASEAN and Asia-focused studies.
Evidence analysis tableThe evidence review is summarised in the evidence tables, where interventions are organised according to our bespoke ARoFIIN framework to assess weight-control interventions. The tables indicate the strengths and weaknesses of each intervention, the stakeholders who would drive the initiatives, as well as an assessment of their effectiveness at the individual and population level. The evidence for each intervention is then outlined in turn, including relevant studies from South-East Asia.
The ARoFIIN framework describes three key dimensions that need to be considered when addressing interventions designed to tackle obesity as a public health threat:
l Influencing factors: These are factors that drive obesity and can be targeted in interventions to help reduce obesity. They include food intake and activity levels, as well as the response of the individual body and the psychology of behaviour change.
l Stakeholders: Obesity is often perceived as being primarily a health problem. However, although the healthcare system is an important stakeholder, a range of other stakeholders are involved in different interventions designed to prevent and reduce obesity. Other key players include the education system, families, food suppliers, policymakers and the media.
l Intervention effectiveness: The effectiveness of an intervention is important, as is the potential magnitude of the impact an intervention may have on a population. For example, surgical or similar procedures may change one person’s life, but the impact is limited at a population level due to the cost and complexity of the intervention per individual.
The evidence table contains the following columns.
l Promise of the intervention: This combines the estimates for (1) the direction of the evidence base, (2) the level of the evidence base and (3) the magnitude of population impact. Each component is scored one star, half a star or no star, with a maximum score of three stars and a minimum score of no stars. The concept of the “promise” of the intervention is based on a framework for translating research evidence into practice.200 It takes factors such as likely uptake into account, as well as the potential for the future (for example, if an intervention has been shown to reduce consumption but data is not yet available on obesity outcomes). Although some interventions appear to have a low level of promise, this does not necessarily mean that they would be ineffective. It may be that there is a lack of evidence of effectiveness, or that they need to be implemented in combination with other interventions. We have used the following symbols to categorise promise:
««««««—
High promise
Low promise
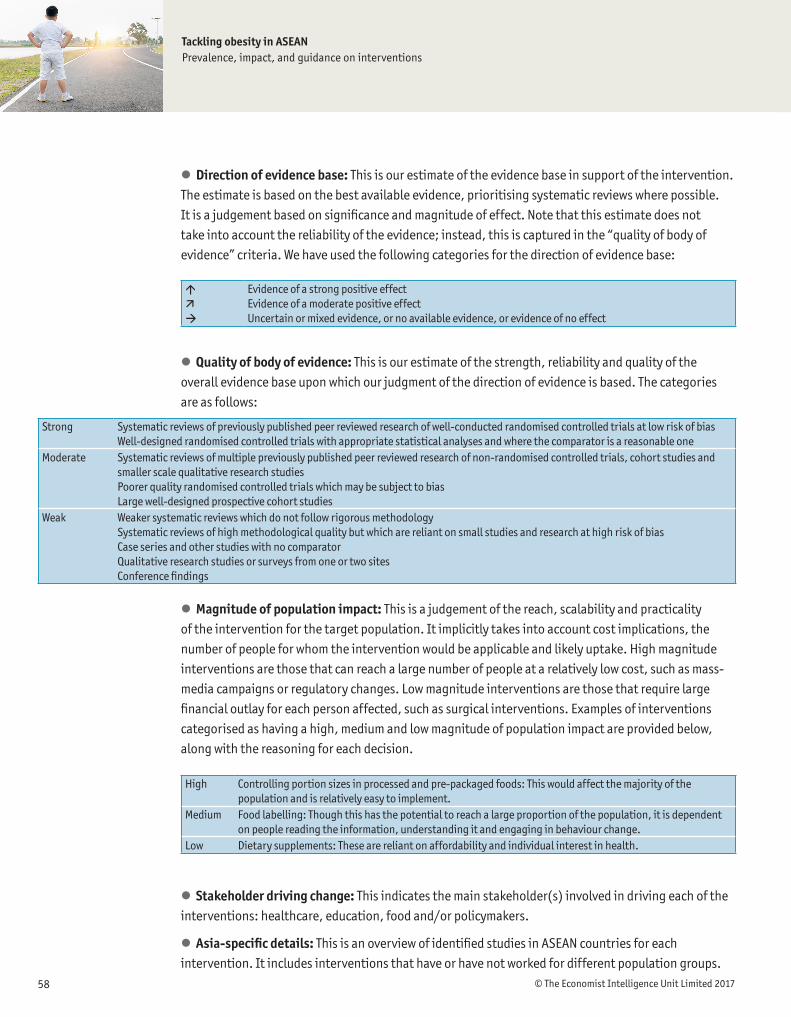
Tackling obesity in ASEANPrevalence, impact, and guidance on interventions
© The Economist Intelligence Unit Limited 201758
l Direction of evidence base: This is our estimate of the evidence base in support of the intervention. The estimate is based on the best available evidence, prioritising systematic reviews where possible. It is a judgement based on significance and magnitude of effect. Note that this estimate does not take into account the reliability of the evidence; instead, this is captured in the “quality of body of evidence” criteria. We have used the following categories for the direction of evidence base:
l Quality of body of evidence: This is our estimate of the strength, reliability and quality of the overall evidence base upon which our judgment of the direction of evidence is based. The categories are as follows:
l Magnitude of population impact: This is a judgement of the reach, scalability and practicality of the intervention for the target population. It implicitly takes into account cost implications, the number of people for whom the intervention would be applicable and likely uptake. High magnitude interventions are those that can reach a large number of people at a relatively low cost, such as mass-media campaigns or regulatory changes. Low magnitude interventions are those that require large financial outlay for each person affected, such as surgical interventions. Examples of interventions categorised as having a high, medium and low magnitude of population impact are provided below, along with the reasoning for each decision.
l Stakeholder driving change: This indicates the main stakeholder(s) involved in driving each of the interventions: healthcare, education, food and/or policymakers.
l Asia-specific details: This is an overview of identified studies in ASEAN countries for each intervention. It includes interventions that have or have not worked for different population groups.
High Controlling portion sizes in processed and pre-packaged foods: This would affect the majority of the population and is relatively easy to implement.
Medium Food labelling: Though this has the potential to reach a large proportion of the population, it is dependent on people reading the information, understanding it and engaging in behaviour change.
Low Dietary supplements: These are reliant on affordability and individual interest in health.
áäà
Evidence of a strong positive effectEvidence of a moderate positive effectUncertain or mixed evidence, or no available evidence, or evidence of no effect
Strong Systematic reviews of previously published peer reviewed research of well-conducted randomised controlled trials at low risk of biasWell-designed randomised controlled trials with appropriate statistical analyses and where the comparator is a reasonable one
Moderate Systematic reviews of multiple previously published peer reviewed research of non-randomised controlled trials, cohort studies and smaller scale qualitative research studiesPoorer quality randomised controlled trials which may be subject to biasLarge well-designed prospective cohort studies
Weak Weaker systematic reviews which do not follow rigorous methodology Systematic reviews of high methodological quality but which are reliant on small studies and research at high risk of biasCase series and other studies with no comparatorQualitative research studies or surveys from one or two sitesConference findings

Tackling obesity in ASEANPrevalence, impact, and guidance on interventions
© The Economist Intelligence Unit Limited 2017 59
Figure 26: Economic cost of obesity
Economic cost of obesity
Direct costs
Cost of healthcare
Indirect costs
Productivity losses from absenteeism
Productivity losses from early deaths or retirement
Further information about each study is provided in boxed-out text in the “description of studies” section of the report.
Economic cost modelWe developed a robust economic model to estimate the economic costs of obesity in six South-East Asian countries: Indonesia, the Philippines, Malaysia, Singapore, Thailand and Vietnam. The cost assessment is a first-of-its-kind evaluation that provides policymakers with a cross-country comparison of the prevalence of obesity and related comorbidities, as well as the direct and indirect costs of obesity (defined below).
l Direct costs refer to healthcare costs. We focused on healthcare costs for five diseases often linked to obesity: type 2 diabetes, stroke, hypertension, colon rectal cancer and coronary heart disease.
l Indirect costs assess the broader losses of productivity to an economy due to an obese person being less productive at work, or dropping from the workforce due to early death, or due to low average effective retirement ages.
Data collectionWe collected data for cost estimates from a variety of sources. During our early data review, we found significant data gaps, especially for key data points such as healthcare costs by disease, absenteeism from work due to obesity and life expectancy of obese persons in each country. To supplement these data gaps, we developed a customised survey of healthcare professionals (HCPs) and consumers. The survey was conducted from July 2016 to August 2016.
Calculating the direct cost of obesityThe direct cost of obesity is calculated based on the following two equations:
Population attributable fraction (PAF) = Pd (RR-1)/[Pd (RR-1) + 1]
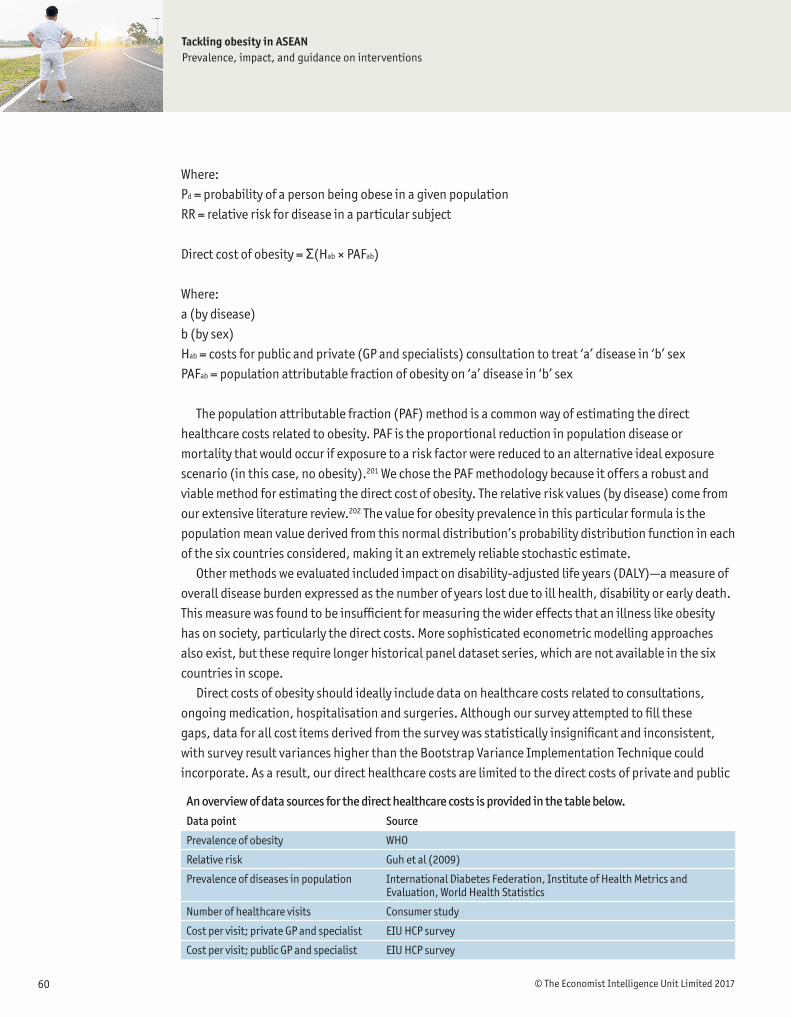
Tackling obesity in ASEANPrevalence, impact, and guidance on interventions
© The Economist Intelligence Unit Limited 201760
Where: Pd = probability of a person being obese in a given populationRR = relative risk for disease in a particular subject
Direct cost of obesity = Σ(Hab × PAFab)
Where:a (by disease)b (by sex)Hab = costs for public and private (GP and specialists) consultation to treat ‘a’ disease in ‘b’ sexPAFab = population attributable fraction of obesity on ‘a’ disease in ‘b’ sex
The population attributable fraction (PAF) method is a common way of estimating the direct healthcare costs related to obesity. PAF is the proportional reduction in population disease or mortality that would occur if exposure to a risk factor were reduced to an alternative ideal exposure scenario (in this case, no obesity).201 We chose the PAF methodology because it offers a robust and viable method for estimating the direct cost of obesity. The relative risk values (by disease) come from our extensive literature review.202 The value for obesity prevalence in this particular formula is the population mean value derived from this normal distribution’s probability distribution function in each of the six countries considered, making it an extremely reliable stochastic estimate.
Other methods we evaluated included impact on disability-adjusted life years (DALY)—a measure of overall disease burden expressed as the number of years lost due to ill health, disability or early death. This measure was found to be insufficient for measuring the wider effects that an illness like obesity has on society, particularly the direct costs. More sophisticated econometric modelling approaches also exist, but these require longer historical panel dataset series, which are not available in the six countries in scope.
Direct costs of obesity should ideally include data on healthcare costs related to consultations, ongoing medication, hospitalisation and surgeries. Although our survey attempted to fill these gaps, data for all cost items derived from the survey was statistically insignificant and inconsistent, with survey result variances higher than the Bootstrap Variance Implementation Technique could incorporate. As a result, our direct healthcare costs are limited to the direct costs of private and public
An overview of data sources for the direct healthcare costs is provided in the table below.Data point Source
Prevalence of obesity WHO
Relative risk Guh et al (2009)
Prevalence of diseases in population International Diabetes Federation, Institute of Health Metrics and Evaluation, World Health Statistics
Number of healthcare visits Consumer study
Cost per visit; private GP and specialist EIU HCP survey
Cost per visit; public GP and specialist EIU HCP survey
Tackling obesity in ASEANPrevalence, impact, and guidance on interventions
© The Economist Intelligence Unit Limited 2017 61
specialist and GP consultations related to the five conditions: type 2 diabetes, stroke, hypertension, colon rectal cancer and coronary heart disease.
Survey results cannot ever be 100% representative of the sample space. However, we have adjusted for this using an 18.50% Consumer Study variance, derived from the Bootstrap Variance Implementation Technique (6–31% standard errors). We also observed that HCPs were generally highly homogeneous in their responses to our survey, thereby increasing our confidence in the survey. For this reason, this variance is a sufficient adjustment to ensure that resultant predictive cost data from our analysis (upper and lower bound) accurately factors in the marginal variability of our survey results.
Calculating the indirect cost of obesityExcess weight has an impact on overall workforce productivity. The extent of a worker’s productivity is affected by a number of factors, including type of job and individual characteristics of the worker. In our study, we have estimated four types of indirect costs: loss of productivity due to absenteeism; loss of productivity due to early death (males); loss of productivity due to low effective retirement ages (females); and loss of productivity as an obese individual approaches his or her life expectancy (country-specific).
There are other indirect costs that our study did not consider. For example, some economic studies calculate the cost of presenteeism, where a worker’s productivity while at work is affected because of his or her excess weight.203 In the United States, relevant data for this is regularly gathered through the National Health and Wellness Survey of Employees and Companies. However, such information is not available for the countries in our study. We therefore decided to make our estimates more relevant to our ASEAN country sample using top-down adjustments to the US data on the days of absence (downwards). These adjustments were made on the basis of the size of the informal sector in each of the countries in the study, and lower/upper bounds were set based on the conservative estimates/user-controlled upper and lower bounds of the likelihood of an individual in the informal sector taking a sick day (expressed as a function of the same probability in the formal sector).
There are also studies that estimate disability payments due to obesity. In the Asian context, however, disability payments and disability insurance premiums are less relevant due to the way healthcare systems are set up. Other smaller costs included in some research papers include transportation costs (i.e., the cost of transport for obese persons and caregivers travelling to and
An overview of data sources for the direct healthcare costs are provided in the table below.Data point Source
Daily wages The Economist Intelligence Unit
Gender wage gap The Economist Intelligence Unit
Employment rate The Economist Intelligence Unit (adjusted for informal sector)
Labour force participation rate The Economist Intelligence Unit (adjusted for informal sector)
Number of days absent from work due to disease 2013 National Health Interview Survey

Tackling obesity in ASEANPrevalence, impact, and guidance on interventions
© The Economist Intelligence Unit Limited 201762
from doctor appointments). Systematic data on these issues across our ASEAN country sample is not available and the impact of these factors on the overall economic cost of obesity remains limited. For these reasons, we have excluded these factors from our analysis.
Indirect costs from absenteeismAbsenteeism is measured by absence due to conditions associated with obesity. This is a common measure of indirect costs, and several widely cited studies underline the relationship between absenteeism and being overweight or obese. Academic studies suggest that obese employees take more sick leave than colleagues with a normal weight, irrespective of occupational group.204
We calculated indirect costs from absenteeism based on the following equation:
Loss of productivity from absenteeism (sick days) = Ibd Σ(Nab x PAFab x Pb x Eb)
Where:Ibd = Average daily wage income of ‘b’ sexNab= Total number of days person suffering ‘a’ disease of ‘b’ sex is absent from workPAFab = Population attributable fraction of obesity on ‘a’ disease in ‘b sex’Pb = Labor force participation rate of ‘b’ sexEb = Employment rate of ‘b’ sex
Our research team developed estimates to determine the average wages for male and female workers in each country. We first took average wages from The Economist Intelligence Unit’s country data, and then adjusted these based on the gender wage gap and the employment ratios in order to compute the average gender-specific daily wage rates for each country. The research team also considered the structure of labour markets in each country and adjusted labour force participation and employment rates accordingly. The Economist Intelligence Unit’s country data was the main source of data. These numbers were adjusted upwards to integrate the casual and non-contracted employment of each country. This provides a more robust estimation of productivity losses due to absenteeism.
Indirect costs from early deathWe calculated the cost of early deaths using the human capital approach. This involves gathering data related to the number of deaths attributable to obesity for each disease, multiplied by the wage each person would have received had they lived out their lives.
Loss of productivity from early deaths / low effective retirement ages / approaching life expectancies = [Ib Σ(PAMab x Pb x Eb)]/(1 + r)n
Where:Ib = Average annual wage income of ‘b’ sexPAMab = Number of deaths attributable to obesity in ‘a’ disease in ‘b’ sexPb = Labour force participation rate of ‘b’ sexEb = Employment rate of ‘b’ sexr = Discount raten = Expected years of life lost

Tackling obesity in ASEANPrevalence, impact, and guidance on interventions
© The Economist Intelligence Unit Limited 2017 63
Productivity losses in obese men can be largely attributed to early death; productivity losses in obese women can be largely attributed to early retirement. Early deaths (males) have been calculated using the human capital approach (gathering data linked to number of deaths attributed to obesity for each disease in the analysis, multiplied by the wage lost per person). This form of productivity loss was not significant for females because their life expectancy exceeded the retirement age ceilings. On average, the working-age female population retires before the legal retirement age ceiling, which means that productivity losses arise from the gradient between the average effective retirement age and the official retirement age. This phenomenon was not significant in men as most of their productivity losses were due to early deaths linked to obesity in their section of the country’s population.
Productivity loss is computed using the product of daily gender-specific wage/income and the summation of the product of the number of deaths attributable to obesity by disease and gender, the gender specific employment rate and the gender-specific labour force participation rate (adjusted to integrate the informal sector in this number). The resulting term is then discounted based on our computed discount rate and the expected number of years of life/productive employment lost as a result of obesity.
Another proprietary addition we introduced in these calculations is an estimate of the loss of employee productivity arising as a result of an obese individual approaching his/her life expectancy age. This is integrated into our calculations through a conservative estimate/user-controlled input of the percentage of an obese individual’s life expectancy during which he/she tends to be comparatively unproductive. We do not adjust for the actual levels of productivity loss as these have already been factored into our macro data.
An overview of data sources for the direct healthcare costs is provided in the table below.Data point Source
Daily wages The Economist Intelligence Unit
Gender wage gap The Economist Intelligence Unit
Labour force participation rate The Economist Intelligence Unit (adjusted for informal sector)
Life expectancy of obese person HCP survey
Discount rate The Economist Intelligence Unit
Economic cost calculations: summaryIndonesia Malaysia Philippines Singapore Thailand Vietnam
Prevalence of obesity, % of total population 5.7 13.3 5.1 6.2 8.5 3.6
Direct cost of obesity, % of total healthcare expenditure 7.00–14.61 8.46-18.16 3.49–7.13 2.74– 9.46 2.38– 5.02 1.04– 2.19
Indirect cost of obesity, % of total healthcare expenditure 0.97-1.10 1.11-1.20 0.62-0.73 0.17-0.18 0.64-0.73 0.45-0.52
Total economic cost of obesity, % of total healthcare expenditure 7.97-15.71 9.57-19.36 4.11-7.87 2.91-9.64 3.02-5.75 1.49-2.71
Direct cost of obesity, dollar-impact (in US$ bn) 1.72-3.59 1.05-2.24 0.48-0.98 0.39-1.36 0.61-1.30 0.14-0.30
Indirect cost of obesity, dollar-impact (in US$ bn) 0.24-0.27 0.14-0.15 0.09-0.10 0.02-0.03 0.16-0.19 0.06-0.07
Total economic cost of obesity, dollar-impact (in US$ bn) 1.96-3.86 1.19-2.39 0.57-1.08 0.41-1.39 0.77-1.49 0.20-0.37

Tackling obesity in ASEANPrevalence, impact, and guidance on interventions
© The Economist Intelligence Unit Limited 201764
The discount rate used in this model is calculated as an average of three forward-looking, forecasted, five-year Compound Annual Growth Rates (CAGRs) based on the level-term nominal GDP statistics for each of the countries. CAGR-based calculations were used in place of simple averages so that a reasonable weight could be placed on compounding the GDP growth across the forecasted periods (2016–30). The discount rate variable returns a smoothed estimate of the discount rate rather than the simple average, which is a comparatively crude estimate.
When analysing these estimates, it is important to recognise that it is not statistically accurate to pick the median point of the ranges and use these values as headline estimates.
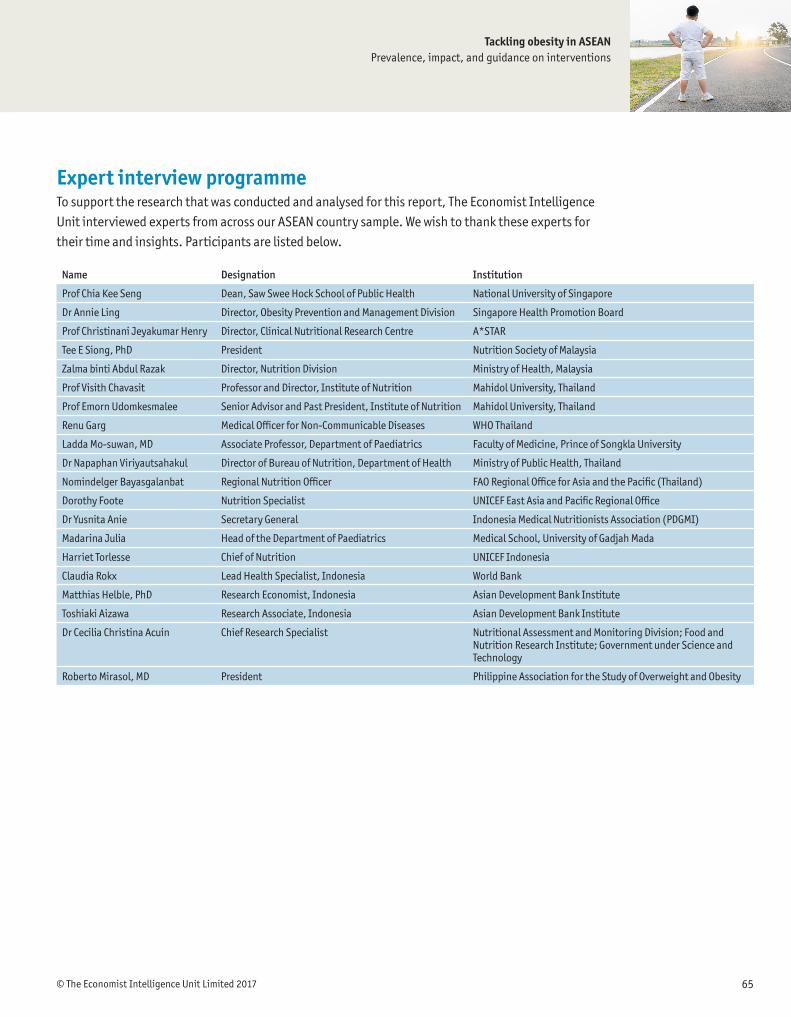
Tackling obesity in ASEANPrevalence, impact, and guidance on interventions
© The Economist Intelligence Unit Limited 2017 65
Name Designation Institution
Prof Chia Kee Seng Dean, Saw Swee Hock School of Public Health National University of Singapore
Dr Annie Ling Director, Obesity Prevention and Management Division Singapore Health Promotion Board
Prof Christinani Jeyakumar Henry Director, Clinical Nutritional Research Centre A*STAR
Tee E Siong, PhD President Nutrition Society of Malaysia
Zalma binti Abdul Razak Director, Nutrition Division Ministry of Health, Malaysia
Prof Visith Chavasit Professor and Director, Institute of Nutrition Mahidol University, Thailand
Prof Emorn Udomkesmalee Senior Advisor and Past President, Institute of Nutrition Mahidol University, Thailand
Renu Garg Medical Officer for Non-Communicable Diseases WHO Thailand
Ladda Mo-suwan, MD Associate Professor, Department of Paediatrics Faculty of Medicine, Prince of Songkla University
Dr Napaphan Viriyautsahakul Director of Bureau of Nutrition, Department of Health Ministry of Public Health, Thailand
Nomindelger Bayasgalanbat Regional Nutrition Officer FAO Regional Office for Asia and the Pacific (Thailand)
Dorothy Foote Nutrition Specialist UNICEF East Asia and Pacific Regional Office
Dr Yusnita Anie Secretary General Indonesia Medical Nutritionists Association (PDGMI)
Madarina Julia Head of the Department of Paediatrics Medical School, University of Gadjah Mada
Harriet Torlesse Chief of Nutrition UNICEF Indonesia
Claudia Rokx Lead Health Specialist, Indonesia World Bank
Matthias Helble, PhD Research Economist, Indonesia Asian Development Bank Institute
Toshiaki Aizawa Research Associate, Indonesia Asian Development Bank Institute
Dr Cecilia Christina Acuin Chief Research Specialist Nutritional Assessment and Monitoring Division; Food and Nutrition Research Institute; Government under Science and Technology
Roberto Mirasol, MD President Philippine Association for the Study of Overweight and Obesity
Expert interview programmeTo support the research that was conducted and analysed for this report, The Economist Intelligence Unit interviewed experts from across our ASEAN country sample. We wish to thank these experts for their time and insights. Participants are listed below.

Tackling obesity in ASEANPrevalence, impact, and guidance on interventions
© The Economist Intelligence Unit Limited 201766
References:1 http://www.ncbi.nlm.nih.gov/pubmed/16714222 http://www.wpro.who.int/nutrition/documents/docs/Redefiningobesity.pdf. One study in Thailand found that obesi-ty and overweight according to BMI were lower than an alternative measure—the Regional Office for the Western Pacific (WPRO) standard. Using the WPRO standard, 17.1% of adults were classified as overweight, 19% were classified as having class I obesity and 4.8% were classified as having class II obesity. Using the WHO definition, 19% were overweight, a mere 4% had class I obesity and just 0.8% had class II obesity. The authors of the study note the “vast difference in obesity preva-lence between the WHO and the WPRO criteria”.3 http://www.who.int/nutrition/double-burden-malnutrition/en/4 http://data.unicef.org/wp-content/uploads/2016/09/UNICEF-Joint-Malnutrition-brochure.pdf5 Effective interventions are defined as those with two or more stars.6 https://www.rsph.org.uk/asset/AF749523-C2E0-4871-90EC35AF4D159160/7 http://www.scientificamerican.com/index.cfm/_api/render/file/?fileid=9DF61608-D2E5-44A6-99B62D197FB86C2B8 http://www.scientificamerican.com/index.cfm/_api/render/file/?fileid=9DF61608-D2E5-44A6-99B62D197FB86C2B9 http://www.ncbi.nlm.nih.gov/pubmed/2659888010 The Innovative Medicines Initiative was launched in 2008 as a collaboration between the European Federation of Pharma-ceutical Industries and Associations (EFPIA) and the European Commission. It aims to identify and overcome barriers to the development of innovative treatments.11 http://ec.europa.eu/health/ph_determinants/life_style/nutrition/documents/ev20081028_wp_en.pdf12 United Nations General Assembly. Political declaration on the high-level meeting of the General Assembly on the Preven-tion and Control of Non-communicable Diseases. New York: United Nations; 2011.13 Thow AM. A systematic review of the effectiveness of food taxes and subsidies to improve diets: understanding the recent evidence. Nutr Rev. 2014;72(9):551-65.14 http://www.ncbi.nlm.nih.gov/pubmed/2488083015 http://www.oecd.org/health/Obesity-Update-2014.pdf16 http://www.who.int/healthinfo/global_burden_disease/GlobalHealthRisks_report_part2.pdf17 http://apps.who.int/iris/bitstream/10665/204176/1/9789241510066_eng.pdf?ua=1 18 (A) Lim SS, Vos T, Flaxman AD, Danaei G, Shibuya K, Adair-Rohani H et al. A comparative risk assessment of burden of disease and injury attributable to 67 risk factors and risk factor clusters in 21 regions, 1990-2010: a systematic analysis for the Global Burden of Disease Study 2010. Lancet, 2012;380(9859):2224-2260 (B) Mozaffarian D, Fahimi S, Singh GM, Micha R, Khatibzadeh S, Engell RE, Lim S et al.; Global Burden of Diseases Nutrition and Chronic Diseases Expert Group. Global so-dium consumption and death from cardiovascular causes. N Engl J Med. 2014;371(7):624−34. doi:10.1056/NEJMoa1304127.19 http://www.who.int/gho/ncd/risk_factors/obesity_text/en/20 http://www.ncbi.nlm.nih.gov/pmc/articles/PMC4245122/21 This could be attributed to greater access to obesogenic foods, different urbanisation patterns, and different demands from the work environment due to greater mechanisation. 22 http://www.ncbi.nlm.nih.gov/pubmed/2087336423 http://apps.who.int/bmi/index.jsp?introPage=intro_3.html24 United Nations Standing Committee on Nutrition. Country policy analysis: nutrition impact of agriculture and food sys-tems: Thailand. Bangkok: UNSCN; 2013. p. 1.25 http://www.who.int/gho/ncd/risk_factors/obesity_text/en/; http://apps.who.int/iris/bitstream/10665/204176/1/9789241510066_eng.pdf

Tackling obesity in ASEANPrevalence, impact, and guidance on interventions
© The Economist Intelligence Unit Limited 2017 67
26 ASEAN countries have significantly varying levels of nominal GDP per capita, ranging from US$2,050 in Vietnam to US$51,640 in Singapore in 2015. 27 https://ourworld.unu.edu/en/south-east-asias-children-face-double-burden-of-obesity-and-undernutrition 28 Overweight = BMI above or equal to 25. Source: WHO 2014 (latest year for which data available). Available at: http://apps.who.int/gho/data/node.main.A897C?lang=en29 Obese = BMI above or equal to 30. Source: WHO 2014 (latest year for which data available). Available at: http://apps.who.int/gho/data/node.main.A897C?lang=en30 A study of 30,284 school children between 13 and 15 years of age, from seven ASEAN members participating in the Global School-based Student Health Survey (GSHS) between 2007 and 2013. Available at: http://www.ncbi.nlm.nih.gov/pu-bmed/2724496431 EIU survey32 In our survey, the interpretation of “traditional food from [own] country” is left to the respondents due to the geographic and cultural variety of the sample.33 http://apps.who.int/iris/bitstream/10665/148114/1/9789241564854_eng.pdf34 http://cfps.org.sg/publications/the-singapore-family-physician/article/7135 http://cfps.org.sg/publications/the-singapore-family-physician/article/7136 http://apps.who.int/iris/bitstream/10665/148114/1/9789241564854_eng.pdf37 Academy of Sciences Malaysia. Prioritising food policy options to reduce obesity in Malaysia. Malaysia: Author; 2013.38 Poh BK, Safiah MY, Tahir A, Siti Haslinda MD, Siti Norazlin AK, Wan Manan W, et al. Physical activity pattern and energy expenditure of Malaysian adults: findings from the Malaysian Adult Nutrition Survey (MANS). Mal J Nutr. 2010;16(1):13-37.39 Institut Kesihatan Umum. National health and morbidity survey 2011. Kuala Lumpur: Author; 2011.40 http://www.moh.gov.my/images/gallery/nspncd/NSPNCD.pdf41 Real GDP – PPP US$ at 2005 prices, Economist Intelligence Unit Data42 http://www.unscn.org/files/Publications/Country_Case_Studies/Thailand_case_study_FINAL.pdf43 http://onlinelibrary.wiley.com/doi/10.1038/oby.2007.371/abstract44 United Nations Standing Committee on Nutrition. Country policy analysis: nutrition impact of agriculture and food sys-tems: Thailand. Bangkok: Author; 2013. p. 14.45 Thailand Bureau of Policy and Strategy 201346 Tenth National and Social Development Plan (2008–2011)47 The National Health Promotion Foundation (a funding agency) obtains 2% of excise tobacco and alcohol taxes and supple-ments the Ministry of Public Health’s budget.48 http://www.nnc.gov.ph/plans-and-programs/philippine-plan-of-action-for-nutrition-ppan49 http://apps.who.int/iris/bitstream/10665/148114/1/9789241564854_eng.pdf50 http://apps.who.int/iris/bitstream/10665/148114/1/9789241564854_eng.pdf51 http://www.worldbank.org/en/news/feature/2015/04/23/the-double-burden-of-malnutrition-in-indonesia (p. 226)52 http://www.worldbank.org/en/news/feature/2015/04/23/the-double-burden-of-malnutrition-in-indonesia53 World Bank. The double burden of malnutrition in Indonesia. Jakarta: Author; 2013. p. 53.54 Kementerian Kesehatan Republic Indonesia. Riset Kesehatan Dasar. Jakarta: Author; 2013. p. 143.55 World Bank. The double burden of malnutrition in Indonesia. Jakarta: World Bank; 2013. p. 2.56 World Bank. The double burden of malnutrition in Indonesia. Jakarta: World Bank; 2013. p. 38. 57 http://www.nytimes.com/1994/02/04/world/opening-vietnam-clinton-drops-19-year-ban-us-trade-with-vietnam-cites-hanoi-s.html

Tackling obesity in ASEANPrevalence, impact, and guidance on interventions
© The Economist Intelligence Unit Limited 201768
58 World Health Organisation. Vietnam noncommunicable disease prevention and control programme 2002–2010. Imple-mentation review. Geneva: Author; 2011. p. 8.59 http://www.unicef.org/vietnam/summary_report_gsn.pdf60 http://www.ncbi.nlm.nih.gov/pubmed/1829631661 http://www.michael-waibel.de/presse/2014_08_25_VoA_As Obesity Rises in Vietnam Millions Still Underweight.pdf62 World Health Organisation. Vietnam noncommunicable disease prevention and control programme 2002-2010. Implemen-tation review. Geneva: Author; 2011. p. 8.63 http://bmcpublichealth.biomedcentral.com/articles/10.1186/1471-2458-13-14164 World Health Organisation. Vietnam noncommunicable disease prevention and control programme 2002-2010. Implemen-tation review. Geneva: Author; 2011. p. 9.65 http://www.eastasiaforum.org/2016/06/10/whats-driving-growth-in-vietnams-auto-industry/66 World Health Organisation. Vietnam noncommunicable disease prevention and control programme 2002-2010. Implemen-tation Review. Geneva: Author; 2011. p. 38.67 http://www.unicef.org/vietnam/resources_18460.htm68 http://english.thesaigontimes.vn/35913/No-special-consumption-tax-for-carbonated-drinks.html69 http://bmcpublichealth.biomedcentral.com/articles/10.1186/1471-2458-13-14170 http://www2.kenes.com/apccn/scientific/Documents/Oral/226.pdf71 See The Economist Intelligence Unit’s economic cost estimates72 See appendix for full methodology73 http://www.cdc.gov/nchs/nhis/nhis_2013_data_release.htm74 http://www.who.int/nutrition/publications/guidelines/sugar_intake_information_note_en.pdf75 Ng M, Fleming T, Robinson M, Thompson B, Graetz N, Margono C, et al. Global, regional, and national prevalence of over-weight and obesity in children and adults during 1980¬–2013: A systematic analysis for the Global Burden of Disease Study 2013. The Lancet. 2014;384(9945): 766-781.76 Authors included data for height and weight through physical measurements and self-reports and used mixed-effects linear regression to correct for bias in self-reports. They obtained data for prevalence of obesity and overweight by age, sex, country and year with a spatiotemporal Gaussian process regression model to estimate prevalence with 95% uncertainty intervals.77 Foresight. Tackling obesities: future choices – project report. London: Government Office for Sciences; 2007. 78 The concept of the “promise” of an intervention is based on a framework for translating research evidence into practice. Swinburn B, Gill T, Kumanayika S. Obesity prevention: a proposed framework for translating evidence into action. Obesity Reviews. 2005;6(1):23-33.79 Although every care has been taken to make meaningful estimates of the potential effectiveness of each intervention using objective evidence, there is still an element of judgement. A lack of high-quality randomised controlled trials and relative paucity of South-East Asian evidence has made this task more difficult. Assessing many of these interventions in isolation is always going to be challenging, as interventions will mostly be used in combination. We believe that the evidence table provides a reasonable and meaningful top-level summary. However, there may be as-yet untapped literature behind each intervention, which could be used to support or oppose its use. The evidence table is not designed to guide national investment decisions.80 Across each category, governments have utilised hard measures (e.g., advertising restrictions, taxes on obesogenic foods or beverages) and soft measures (e.g., awareness-raising programmes, competitions and media initiatives).81 Effective interventions defined as those with two or more stars82 http://onlinelibrary.wiley.com/doi/10.1002/14651858.CD003641.pub4/full

Tackling obesity in ASEANPrevalence, impact, and guidance on interventions
© The Economist Intelligence Unit Limited 2017 69
83 Yanovski SZ. Long-term drug treatment for obesity: a systematic and clinical review. JAMA. 2014;311(1):74-86.84 Goel R, Agarwal A, Shabbir A, So JBY, Pasupathy S, et al. Bariatric surgery in Singapore from 2005 to 2009. Asian J Surg. 2013;36(1):36-9.85 Iyer US, Koh KF, Chia NC, Macachor J, Cheng A. Perioperative risk factors in obese patients for bariatric surgery: a Singa-pore experience. Singapore Med J. 2011;52(2):94-9.86 Ganesh R, Rao AD, Baladas HG, et al. The Bioenteric Intragastric Balloon (BIB) as a treatment for obesity: poor results in Asian patients. Singapore Med J. 2007;48(3):227-31.87 Dineros H, Sinamban R, Siozon M, et al. Obesity surgery in the Philippines: experience in a private tertiary care hospital for years 2002 to 2004. Obes Surg. 2007;17(1):82-7.88 Vanoh D, Shahar S, Mahmood NR. Association between nutrient adequacy and psychosocial factors with overall rate of weight loss after bariatric surgery. Asia Pac J Clin Nutr. 2015;24(4):610-9.89 Yoshida N. Study on health hazards through medicines purchased on the Internet: a cross-sectional investigation of the quality of anti-obesity medicines containing crude drugs as active ingredients. BMC Complement Altern Med. 2015;15(430).90 Amorim Adegboye Amanda R, Linne Yvonne M. Diet or exercise, or both, for weight reduction in women after childbirth. Cochrane Database of Systematic Reviews: John Wiley & Sons, Ltd; 2013.91 Oude Luttikhuis H, Baur L, Jansen H, et al. Interventions for treating obesity in children. Cochrane Database of Systematic Reviews: John Wiley & Sons, Ltd; 2009.92 http://www.ncbi.nlm.nih.gov/pmc/articles/PMC3919419/ 93 http://www.unscn.org/files/Publications/Country_Case_Studies/Thailand_case_study_FINAL.pdf94 Toh C. School-based intervention has reduced obesity in Singapore. BMJ. 2002;324:427.95 http://pacifichealthsummit.org/downloads/Obesity%20Prevention%20and%20Control%20Efforts%20in%20Singa-pore%20-%202008%20Case%20Study.pdf96 Stoner L. Efficacy of exercise intervention for weight loss in overweight and obese adolescents: meta-analysis and implica-tions. Sports Med. 2016. (Epub).97 Tan-Ting AM, Llido L. Outcome of a hospital based multidisciplinary weight loss program in obese Filipino children. Nutri-tion. 2011;27(1):50-4.98 Wafa SW, Talib RA, Hamzaid NH, et al. Randomised controlled trial of a good practice approach to treatment of childhood obesity in Malaysia: Malaysian Childhood Obesity Treatment Trial (MASCOT). Int J Pediatr Obes. 2011;6(2-2):e62-9.99 Soon HK, Saad HA, Taib MN, et al. Effects of combined physical activity and dietary intervention on obesity and metabolic parameters in adults with abdominal obesity. Southeast Asian J Trop Med Public Health. 2013;44(2):295-308.100 World Bank. The double burden of malnutrition in Indonesia. Jakarta: World Bank; 2013. p. 36.101 For a detailed analysis of people’s suboptimal health choices, see Kahneman D. Thinking fast and slow. New York: Farrar, Straus and Girouz. 2011; Ariely D, Predictably irrational: the hidden forces that shape our decisions. New York: HarperCol-lins. 2008.102 http://www.bmj.com/content/354/bmj.i4707103 Dombrowski SU, Knittle K, Avenell A, et al. Long term maintenance of weight loss with non-surgical interventions in obese adults: systematic review and meta-analyses of randomised controlled trials. BMJ. 2014;348:g2646.104 (A) Oude Luttikhuis H, Baur L, Jansen H, et al. Interventions for treating obesity in children. Cochrane Database of Sys-tematic Reviews: John Wiley & Sons, Ltd; 2009 (B) Colquitt Jill L, Loveman E, O’Malley C, et al. Diet, physical activity, and behavioural interventions for the treatment of overweight or obesity in preschool children up to the age of 6 years. Cochrane Database of Systematic Reviews: John Wiley & Sons, Ltd; 2016. (C) Loveman E, Al-Khudairy L, Johnson Rebecca E, et al. Parent-only interventions for childhood overweight or obesity in children aged 5 to 11 years. Cochrane Database of Systematic Reviews: John Wiley & Sons, Ltd; 2015.
Tackling obesity in ASEANPrevalence, impact, and guidance on interventions
© The Economist Intelligence Unit Limited 201770
(D) Waters E, de Silva-Sanigorski A, Burford Belinda J, et al. Interventions for preventing obesity in children. Cochrane Database of Systematic Reviews: John Wiley & Sons, Ltd; 2011. (E) Dombrowski SU, Knittle K, Avenell A, et al. Long term maintenance of weight loss with non-surgical interventions in obese adults: systematic review and meta-analyses of randomised controlled trials. BMJ. 2014;348:g2646.105 Soon HK, Saad HA, Taib MN, et al. Effects of combined physical activity and dietary intervention on obesity and metabolic parameters in adults with abdominal obesity. Southeast Asian J Trop Med Public Health. 2013;44(2):295-308.106 (A) https://www.nice.org.uk/guidance/ph6/evidence/behaviour-change-review-6-social-marketing-369664530 (B) http://apps.who.int/iris/bitstream/10665/204176/1/9789241510066_eng.pdf?ua=1 (C) Huang L, Mehta K, Wong ML. Television food advertising in Singapore: the nature and extent of children’s exposure. Health Promotion International. 2012;27(2):187-96. (D) Ng SH, Kelly B, Se CH, et al. Obesogenic television food advertising to children in Malaysia: sociocultural variations. Glob Health Action. 2014;7:25169. (E) Kim S, Lee YK, Yoon J, et al. Restriction of television food advertising in South Korea: impact on advertising of food companies. Health Promotion International. 2012;28(1):17-25. (F) Baker P, Friel S. Processed foods and the nutrition transition: evidence from Asia. Obes Rev. 2014;15(7):564-77.107 http://apps.who.int/iris/bitstream/10665/204176/1/9789241510066_eng.pdf?ua=1108 Zheng JS. Exclusive breastfeeding is inversely associated with risk of childhood overweight in a large Chinese cohort. J Nutr Educ Behav. 2014;144(9):1454-9.109 Jwa SC. Latent protective effects of breastfeeding on late childhood overweight and obesity: a nationwide prospective study. Obesity (Silver Spring). 2014;22(6):1527-37.110 Sabanayagam C. Breast-feeding and overweight in Singapore school children. Pediatr Int. 2009;51(5).111 Tantracheewathorn S. Growth of breast-fed and formula-fed infants compared with national growth references of Thai children. J Med Assoc Thai. 2005;88(2):168-75.112 (A) WHO. Interventions on diet and physical activity: what works. Summary report. Geneva: Author; 2009. (B) http://eatwellproject.eu/en/upload/Reports/Deliverable%205_1.pdf (C) Mozaffarian D. AHA scientific statement population approaches to improve diet, physical activity, and smoking habits. A scientific statement from the American Heart Association. Circulation. 2012;126(12). (D) Sirichakwal P. Food based dietary guidelines (FBDGs) development and promotion in Thailand. Asia Pac J Clin Nutr. 2011;20(3):477-83. (E) http://www.fao.org/docrep/017/i3235e/i3235e.pdf (F) Tee E-S. Development and promotion of Malaysian Dietary Guidelines. Asia Pac J Clin Nutr. 2011;20(3):455-61.113 (A) Mozaffarian D. AHA scientific statement population approaches to improve diet, physical activity, and smoking hab-its. Circulation. 2012;126(12). (B) Toh C. School based intervention has reduced obesity in Singapore. BMJ. 2002;324:427.114 (A) Maes L. Effectiveness of workplace interventions in Europe promoting healthy eating: a systematic review. Eur J Public Health. 2012;22(5):677-83. (B) Cairns J-M. Weighing up the evidence: a systematic review of the effectiveness of workplace interventions to tackle socio-economic inequalities in obesity. Journal of Public Health. 2014;37(4):659-70. (C) Flodgren G, Deane K, Dickinson Heather O, et al. Interventions to change the behaviour of health professionals and the organisation of care to promote weight reduction in overweight and obese adults. Cochrane Database of Systematic Reviews: John Wiley & Sons, Ltd; 2010.115 (A) Cairns J-M. Weighing up the evidence: a systematic review of the effectiveness of workplace interventions to tackle socio-economic inequalities in obesity. Journal of Public Health. 2014;37(4):659-70. (B) Chaplais E, Naughton G, Thivel D, et al. Smartphone interventions for weight treatment and behavioural change in pediatric obesity: A systematic review. Telemed J E Health. 2015;21(10):822-30. (C) Khokhar B, Jones J, Ronksley PE, et al. Effectiveness of mobile electronic devices in weight loss among overweight and obese populations: a systematic review and meta-analysis. BMC Obes. 2014;1:22.
Tackling obesity in ASEANPrevalence, impact, and guidance on interventions
© The Economist Intelligence Unit Limited 2017 71
(D) Stephens J. Mobile phone interventions to increase physical activity and reduce weight: a systematic review. J Cardio-vasc Nurs. 2013;28(4):320-9. (E) Wieland LS, Falzon L, Sciamanna Chris N, et al. Interactive computer-based interventions for weight loss or weight main-tenance in overweight or obese people. Cochrane Database of Systematic Reviews: John Wiley & Sons, Ltd; 2012.116 Tan-Ting AM, Llido L. Outcome of a hospital based multidisciplinary weight loss program in obese Filipino children. Nutri-tion. 2011;27(1):50-4.117 Wafa SW, Talib RA, Hamzaid NH, et al. Randomised controlled trial of a good practice approach to treatment of childhood obesity in Malaysia: Malaysian Childhood Obesity Treatment Trial (MASCOT). Int J Pediatr Obes. 2011;6(2-2):e62-9.118 Soon HK, Saad HA, Taib MN, et al. Effects of combined physical activity and dietary intervention on obesity and metabolic parameters in adults with abdominal obesity. Southeast Asian J Trop Med Public Health. 2013;44(2):295-308.119 Huang L, Mehta K, Wong ML. Television food advertising in Singapore: the nature and extent of children’s exposure. Health Promotion International. 2012;27(2):187-96.120 Ng SH, Kelly B, Se CH, et al. Obesogenic television food advertising to children in Malaysia: sociocultural variations. Glob Health Action. 2014;7:25169.121 Zheng JS. Exclusive breastfeeding is inversely associated with risk of childhood overweight in a large Chinese cohort. J Nutr Educ Behav. 2014;144(9):1454-9.122 Tantracheewathorn S. Growth of breast-fed and formula-fed infants compared with national growth references of Thai children. J Med Assoc Thai. 2005;88(2):168-75.123 Zheng JS. Exclusive breastfeeding is inversely associated with risk of childhood overweight in a large Chinese cohort. J Nutr Educ Behav. 2014;144(9):1454-9.124 Jwa SC. Latent protective effects of breastfeeding on late childhood overweight and obesity: a nationwide prospective study. Obesity (Silver Spring). 2014;22(6):1527-37.125 Sirichakwal P. Food based dietary guidelines (FBDGs) development and promotion in Thailand. Asia Pac J Clin Nutr. 2011;20(3):477-83.126 http://www.fao.org/docrep/017/i3235e/i3235e.pdf127 Tee E-S. Development and promotion of Malaysian Dietary Guidelines. Asia Pac J Clin Nutr. 2011;20(3):455-61.128 Toh C. School based intervention has reduced obesity in Singapore. BMJ. 2002;324:427.129 ASM Advisory Report. Prioritising food policy options to reduce obesity in Malaysia. Kuala Lumpur: Author; 2013. p. 9.130 ASM Advisory Report. Prioritising food policy options to reduce obesity in Malaysia. Kuala Lumpur: Author; 2013. p. 9. 131 The National Health Promotion Foundation, a funding agency, obtains 2% of excise tobacco and alcohol taxes and sup-plements the Ministry of Public Health’s budget.132 http://www.unscn.org/files/Publications/Country_Case_Studies/Thailand_case_study_FINAL.pdf133 United Nations Standing Committee on Nutrition. Country policy analysis: nutrition impact of agriculture and food sys-tems: Thailand. Bangkok: UNSCN; 2013.134 http://www.doh.gov.ph/belly-gud-for-health135 http://www.telegraph.co.uk/science/2016/04/06/food-packaging-should-show-exercise-needed-to-burn-off-calories/136 Sirichakwal P. Food based dietary guidelines (FBDGs) development and promotion in Thailand Asia Pac J Clin Nutr. 2011;20(3):477-83.137 Tee E-S. Development and promotion of Malaysian Dietary Guidelines. Asia Pac J Clin Nutr. 2011;20(3):455-61.138 This is a methodological issue due to the difficulties of identifying a “control group” in any national intervention such as a food pyramid, to which everyone is exposed. 139 http://www.ncbi.nlm.nih.gov/pmc/articles/PMC4301835/140 http://www.unescapsdd.org/files/documents/PUB_APPJ-Vol-5-No-1.pdf

Tackling obesity in ASEANPrevalence, impact, and guidance on interventions
© The Economist Intelligence Unit Limited 201772
141 http://www.who.int/elena/titles/bbc/breastfeeding_childhood_obesity/en/. Zheng (2014) found evidence to support exclusive breastfeeding for the first six months or more in a large Chinese birth cohort of 42,550 children. Breastfeeding for three to five months reduced the risk of childhood overweight by 13%, while breastfeeding for six months or more reduced it by 27%, compared to breastfeeding for less than a month. See Zheng JS. Exclusive breastfeeding is inversely associated with risk of childhood overweight in a large Chinese cohort. J Nutr Educ Behav. 2014;144(9):1454-9. Similar results were found in an observational study of 21,425 boys in Japan. See Jwa SC. Latent protective effects of breastfeeding on late childhood overweight and obesity: a nationwide prospective study. Obesity (Silver Spring). 2014;22(6):1527-37. 142 A best-practice code adopted in 1981 by the World Health Assembly of the WHO sought to restrict use of milk formula products in new borns, constrain marketing of milk formula products and encourage exclusive breastfeeding.143 http://apps.who.int/iris/bitstream/10665/206008/1/9789241565325_eng.pdf?ua=1&ua=1: 144 Indonesia’s 2009 law, for example, calls for every baby to be breastfed or given breast milk from donors and milk banks, exclusively, for the first six months of life, unless there are medical reasons not to do so, but the law does not appear to be strongly implemented.145 United States, Canada, Sweden, Australia, Germany, China, Italy, Greece, Spain, United Kingdom, Brazil.146 http://www.ncbi.nlm.nih.gov/pmc/articles/PMC2920955/147 Huang L, Mehta K, Wong ML. Television food advertising in Singapore: the nature and extent of children’s exposure. Health Promotion International. 2012;27(2):187-96.148 Ng SH, Kelly B, Se CH, et al. Obesogenic television food advertising to children in Malaysia: sociocultural variations. Glob Health Action. 2014;7:25169.149 http://dx.doi.org/10.3402/gha.v7.25169150 https://www.nice.org.uk/guidance/ph6/evidence/behaviour-change-review-6-social-marketing-369664530151 http://www.cancerresearchuk.org/sites/default/files/ad_brake_exec_summary.pdf152 http://www.ft.com/cms/s/0/64391ed6-20d2-11e2-9720-00144feabdc0.html#axzz4G4MbOHfy153 Act Governing Food Safety and Sanitation, passed on November 20, due to be implemented on January 1 2016. Violations of the act result in a fine between NT$40,000 and NT$4m (US$1211 to US$121,193). Sources: http://www.taipeitimes.com/News/taiwan/archives/2015/12/28/2003635862; http://www.asianscientist.com/2016/01/topnews/taiwan-ban-junk-food-marketing-kids/154 http://www.ft.com/cms/s/0/64391ed6-20d2-11e2-9720-00144feabdc0.html#axzz4G4MbOHfy155 Kim S, Lee YK, Yoon J, et al. Restriction of television food advertising in South Korea: impact on advertising of food com-panies. Health Promotion International. 2012;28(1):17-25.156 (A) Schram A, Labonte R, Baker P, et al. The role of trade and investment liberalisation in the sugar-sweetened carbonat-ed beverages market: a natural experiment contrasting Vietnam and the Philippines. Global Health. 2015;11:41. (B) Muktabhant B, Lawrie Theresa A, Lumbiganon P, et al. Diet or exercise, or both, for preventing excessive weight gain in pregnancy. Cochrane Database of Systematic Reviews: John Wiley & Sons, Ltd; 2015. (C) Thomas D, Elliott Elizabeth J, Baur L. Low glycaemic index or low glycaemic load diets for overweight and obesity. Cochrane Database of Systematic Reviews: John Wiley & Sons, Ltd; 2007. (D) Kong AP. A randomised controlled trial to investigate the impact of a low glycemic index (GI) diet on body mass index in obese adolescents. BMC Public Health. 2014;19(14).157 (A) Amorim Adegboye AR, Linne YM. Diet or exercise, or both, for weight reduction in women after childbirth. Cochrane Database of Systematic Reviews: John Wiley & Sons, Ltd; 2013. (B) Colquitt JL, Loveman E, O’Malley C, et al. Diet, physical activity, and behavioural interventions for the treatment of overweight or obesity in preschool children up to the age of 6 years. Cochrane Database of Systematic Reviews: John Wiley & Sons, Ltd; 2016. (C) Langeveld M. The long-term effect of energy restricted diets for treating obesity. Obesity (Silver Spring). 2015;23(8):1529-38.

Tackling obesity in ASEANPrevalence, impact, and guidance on interventions
© The Economist Intelligence Unit Limited 2017 73
(D) Teng NI, Shahar S, Rajab NF, et al. Improvement of metabolic parameters in healthy older adult men following a fasting calorie restriction intervention. Aging Male. 2013;16(4):177-83. (E) Soon HK, Saad HA, Taib MN, et al. Effects of combined physical activity and dietary intervention on obesity and metabol-ic parameters in adults with abdominal obesity. Southeast Asian J Trop Med Public Health. 2013;44(2):295-308. (F) Tan-Ting AM, Llido L. Outcome of a hospital based multidisciplinary weight loss program in obese Filipino children. Nutrition. 2011;27(1):50-4. 158 (A) Johnston BC. Comparison of weight loss among named diet programs in overweight and obese adults: a meta-analy-sis. JAMA. 2014;312(9):923-33. (B) Hooper L. Effects of total fat intake on body weight. Cochrane Database Syst Rev. 2015;7(8).159 Johnston BC. Comparison of weight loss among named diet programs in overweight and obese adults: a meta-analysis. JAMA. 2014;312(9):923-33.160 Johnston BC. Comparison of weight loss among named diet programs in overweight and obese adults: a meta-analysis. JAMA. 2014;312(9):923-33.161 (A) Baker P, Friel S. Processed foods and the nutrition transition: evidence from Asia. Obes Rev. 2014;15(7):564-77. (B) Zheng M. Substitution of sugar-sweetened beverages with other beverage alternatives: a review of long-term health outcomes. J Acad Nutr Diet. 2015;115(5):767-79. (C) Avery A. A systematic review investigating interventions that can help reduce consumption of sugar-sweetened beverag-es in children leading to changes in body fatness. J Hum Nutr Diet. 2015;28(Suppl 1):52-64.162 Nurul-Fadhilah A, Teo PS, Huybrechts I, et al. Infrequent breakfast consumption is associated with higher body adiposity and abdominal obesity in Malaysian school-aged adolescents. PLoS ONE. 2013;8(3):e59297.163 Cecchini M. Impact of food labelling systems on food choices and eating behaviours: a systematic review and meta-analy-sis of randomised studies. Obes Rev. 2016;17(3):201-10.164 (A) Collins M. An economic evaluation of salt reduction policies to reduce coronary heart disease in England: a policy modeling study. Value Health. 2014;17(5):517-24. (B) Ziauddeen N. Variability in the reported energy, total fat and saturated fat contents in fast-food products across ten countries. Public Health Nutr. 2015;18(16):2962-9. (C) Hendry VL. Impact of regulatory interventions to reduce intake of artificial trans-fatty acids: a systematic review. Am J Public Health. 2015;105(3):e32-42.165 (A) Boone-Heinonen J. Fast food restaurants and food stores: longitudinal associations with diet in young to mid-dle-aged adults: the CARDIA study. Arch Intern Med. 2011;171(13):1162-70. (B) Currie J. The effect of fast food restaurants on obesity and weight gain. American Economic Journal: Economic Policy 2. 2010:32-63.166 (A) Scoggins JF. Short-term and long-term weight management results of a large employer-sponsored wellness program. J Occup Environ Med. 2011;53(11):1215-20. (B) Linde JA. HealthWorks: results of a multi-component group-randomised worksite environmental intervention trial for weight gain prevention. Int J Behav Nutr Phys Act. 2012;9. (C) Fox MK. Association between school food environment and practices and body mass index of US public school children. J Am Diet Assoc. 2009;109(2 Suppl):S108-17.167 (A) Hollands GJ. Portion, package or tableware size for changing selection and consumption of food, alcohol and tobacco (Review). Cochrane Database Syst Rev. 2015. (B) Novak NL. Role of policy and government in the obesity epidemic. Circulation. 2012;126:2345-52.168 (A) Colchero A. Beverage purchases from stores in Mexico under the excise tax on sugar sweetened beverages: observa-tional study. BMJ. 2016;352. (B) Thow AM. A systematic review of the effectiveness of food taxes and subsidies to improve diets: understanding the recent evidence. Nutr Rev. 2014;72(9):551-65. (C) Powell LM. Assessing the potential effectiveness of food and beverage taxes and subsidies for improving public health: A systematic review of prices, demand and body weight outcomes. Obes Rev. 2013;14(2):110-28.

Tackling obesity in ASEANPrevalence, impact, and guidance on interventions
© The Economist Intelligence Unit Limited 201774
(D) Alagiyawanna A. Studying the consumption and health outcomes of fiscal interventions (taxes and subsidies) on food and beverages in countries of different income classifications; a systematic review. BMC Public Health. 2015;15(887).169 Schram A, Labonte R, Baker P, et al. The role of trade and investment liberalisation in the sugar-sweetened carbonated beverages market: a natural experiment contrasting Vietnam and the Philippines. Global Health. 2015;11:41.170 (A) Thow AM. A systematic review of the effectiveness of food taxes and subsidies to improve diets: understanding the recent evidence. Nutr Rev. 2014;72(9):551-65. (B) Powell LM. Assessing the potential effectiveness of food and beverage taxes and subsidies for improving public health: A systematic review of prices, demand and body weight outcomes. Obes Rev. 2013;14(2):110-28. (C) Cornelsen L. What happens to patterns of food consumption when food prices change? Evidence from a systematic review and meta-analysis of food price elasticities globally. Health Econ. 2015;24(12):1548-59.171 Teng NI, Shahar S, Rajab NF, et al. Improvement of metabolic parameters in healthy older adult men following a fasting calorie restriction intervention. Aging Male. 2013;16(4):177-83.172 Soon HK, Saad HA, Taib MN, et al. Effects of combined physical activity and dietary intervention on obesity and metabolic parameters in adults with abdominal obesity. Southeast Asian J Trop Med Public Health. 2013;44(2):295-308.173 Tan-Ting AM, Llido L. Outcome of a hospital based multidisciplinary weight loss program in obese Filipino children. Nutri-tion. 2011;27(1):50-4.174 Kong AP. A randomised controlled trial to investigate the impact of a low glycemic index (GI) diet on body mass index in obese adolescents. BMC Public Health. 2014;19(14).175 Nurul-Fadhilah A, Teo PS, Huybrechts I, et al. Infrequent breakfast consumption is associated with higher body adiposity and abdominal obesity in Malaysian school-aged adolescents. PLoS ONE. 2013;8(3):e59297.176 Kasapila W. Legislation – impact and trends in nutrition labeling: a global overview. Crit Rev Food Sci Nutr. 2016;56(1):56-64. 177 Judprasong K. Laboratory performance on analysis of mandatory nutrients and preparation of nutrition labelling. Food Chem. 2013;140(3):598-607.178 Kasapila W. Legislation – impact and trends in nutrition labeling: a global overview. Crit Rev Food Sci Nutr. 2016;56(1):56-64.179 http://www.ft.com/cms/s/0/7d733946-a864-11e5-955c-1e1d6de94879.html#ixzz4G5QNEUqX180 http://www.latimes.com/science/sciencenow/la-sci-sn-soda-tax-works-20160823-snap-story.html181 http://www.ft.com/cms/s/0/7d733946-a864-11e5-955c-1e1d6de94879.html#axzz4G4MbOHfy182 http://www.congress.gov.ph/legisdocs/basic_17/HB00292.pdf183 http://www.nationmultimedia.com/national/Thailand-one-of-many-countries-waging-war-on-sugar-30285928.html184 http://www.cnbc.com/2015/12/21/asian-countries-consider-raising-taxes-on-sugary-drinks.html185 Kasapila W. Legislation – impact and trends in nutrition labeling: a global overview. Crit Rev Food Sci Nutr. 2016;56(1):56-64.186 http://onlinelibrary.wiley.com/doi/10.1111/obr.12091/pdf187 http://www.ncbi.nlm.nih.gov/pmc/articles/PMC4608433/188 http://www.sciencedirect.com/science/article/pii/S0306919215000998189 United Nations Standing Committee on Nutrition. Country policy analysis: nutrition impact of agriculture and food sys-tems: Thailand. Bangkok: Author; 2013. p. 49.190 http://www.sciencedirect.com/science/article/pii/S0306919215000998#b0395191 Kasapila W. Legislation – impact and trends in nutrition labeling: a global overview. Crit Rev Food Sci Nutr. 2016;56(1):56-64.192 See Dolan P. Happiness by design. New York: Avery, Penguin Group; 2014.

Tackling obesity in ASEANPrevalence, impact, and guidance on interventions
© The Economist Intelligence Unit Limited 2017 75
193 Academy of Sciences Malaysia. Prioritising food policy options to reduce obesity in Malaysia. Kuala Lumpur: Author; 2013. p. 19.194 Academy of Sciences Malaysia. Prioritising food policy options to reduce obesity in Malaysia. Kuala Lumpur: Author; 2013. p. 17.195 Zheng M. Substitution of sugar-sweetened beverages with other beverage alternatives: a review of long-term health outcomes. J Acad Nutr Diet. 2015;115(5):767-79.196 Academy of Sciences Malaysia. Prioritising food policy options to reduce obesity in Malaysia. Kuala Lumpur: Author; 2013. p. 51. 197 http://www.fao.org/docrep/017/i3235e/i3235e.pdf.198 United Nations Standing Committee on Nutrition. Country policy analysis: nutrition impact of agriculture and food systems: Thailand. Bangkok: Author. 2013. p. 2.199 http://vietnamnews.vn/society/243139/nutrition-intervention-project-helps-cut-obesity-rate-among-children.htm-l#woAVHwsbWEDkzeYf.99200 Swinburn B, Gill T, Kumanayika S. Obesity prevention: a proposed framework for translating evidence into action. Obesity Reviews. 2005;6(1):23-33.201 World Health Organisation, 2016. Metrics: Population Attributable Fraction (PAF). Retrieved from http://www.who.int/healthinfo/global_burden_disease/metrics_paf/en/ 202 Guh et al. (2009). The incidence of co-morbidities related to obesity and overweight: A systematic review and meta-anal-ysis. Retrieved from http://bmcpublichealth.biomedcentral.com/articles/10.1186/1471-2458-9-88203 Finkelstein, EA, DiBonaventura, MD, Burgess S, Hale B. The costs of obesity in the workplace. Journal of Environmental Medicine. 2010;52(10):971-76.204 Konnopka A, Bodemann M, Konig HH. Health burden and costs of obesity and overweight in Germany. European Journal of Health Economics. 2011;12(4):345-352; Neovius K, Johansson K, Kark M, Neovius M. (2009). Obesity status and sick leave: a systematic review. Obesity Reviews. 2009;10(1):17-27; Gates, DM, Succop P, Brehm BJ, Gillespie GL, Sommers BD. (2008). Obesity and presenteeism: the impact of body mass index on workplace productivity. Journal of Occupational and Environmental Medicine. 2008;50(1):39.

Cover image - © kwanchai.c/Shutterstock
While every effort has been taken to verify the accuracy of this information, The Economist Intelligence Unit Ltd. cannot accept any responsibility or liability for reliance by any person on this report or any of the information, opinions or conclusions set out in this report.

LONDON20 Cabot SquareLondonE14 4QWUnited KingdomTel: +44 (0) 20 7576 8181E-mail: [email protected]
NEW YORK750 Third Avenue5th FloorNew York, NY 10017United StatesTel: + 1 212 698 9717E-mail: [email protected]
HONG KONG1301 Cityplaza Four12 Taikoo Wan RoadTaikoo ShingHong KongTel: + 852 2802 7288E-mail: [email protected]