asian infrastructure finance 2019 - economist
TRANSCRIPT
1
ASIAN INFRASTRUCTURE FINANCE 2019Bridging Borders: Infrastructure to Connect Asia and Beyond
With sections written by:
I
It gives me great pleasure to launch the first issue of the Asian Infrastructure Investment Bank’s (AIIB) publication: Bridging Borders: Infrastructure to Connect Asia and Beyond.
The Asian region is one of the most dynamic and productive on Earth, but it is held back from realizing its full potential by huge constraints in crucial infrastructure caused by a lack of investment. 2018 also marked the 20th anniversary of the Asian Financial Crisis. Many lessons have been learned, particularly with regard to macroeconomic prudence, including the need for sound fiscal rules and adequate reserves. Recently, increased attention has focused on the issue of how investment had fallen in many Asian economies in the years after the crisis, contributing to the infrastructure gap we see today.
In 2016, AIIB was created to address this infrastructure gap, and with the aim of fostering greater regional and global integration through connectivity. We are fully aware that Asia’s sustained development can only be achieved through greater connectivity with the rest of the world. There are tremendous opportunities for infrastructure to align with changes in trade and economic geography. For example, when it comes to renewable energy trade, the match between supply and demand may well extend beyond artificial boundaries. Similarly, many connectivity infrastructure projects would only make economic sense if linked up as a network to other countries and regions.
At AIIB, we work to promote sustainable economic and social development by investing in infrastructure and other productive sectors in our members, both in Asia and beyond. Sustaining high-quality infrastructure for improved economic, social and environmental outcomes is a global effort which AIIB is part of. Since its inception in January 2016, AIIB has provided financing in loans and other lending modalities, with commitments totaling close to USD7.5 billion (as of the end of 2018), including a number of projects outside Asia, and we hope to approve projects worth another USD4 billion in 2019.
While public spending still provides the bulk of needed infrastructure investments, fiscal constraints and debt sustainability considerations limit the extension of public finance. As it has long been recognized, the key is to ignite the “animal spirits” of private sector investors into infrastructure development. To do so, we need to build and sustain the set of supportive conditions. This is also clear in our strategy to mobilize private capital, approved by our Board of Directors in 2018.
Foreword

II
As part of this effort, we commissioned The Economist Intelligence Unit as our key partner to collate data and analyze developments in the infrastructure market in Asia. This is not a one-off exercise intended to address every issue in the large and diverse infrastructure space. Nor is it intended to be heavy with country-specific policy prescriptions. Rather, by providing an assessment of project financing and highlighting key topical issues, this publication will hopefully contribute to the collective understanding of the infrastructure financing market in Asia and beyond. AIIB will sustain a patient effort to grow and shape this market, including providing a regular update of the market as this report aims to do.
The team has also had the privilege of receiving valuable data and insights from other partners and stakeholders within the investment community. Though this is an AIIB publication, we have also incorporated the inputs of various industry experts. We believe that such a collaborative effort can strengthen the quality of this report and lead to greater shared understanding.
Let me turn to the short-term challenges. We do see risks factors ahead, with a slowing global economy, higher borrowing costs and geopolitical tensions conflating and leading to greater uncertainty. Our staff assessment is that there has yet to be a significant breakthrough in the mobilization of private capital for infrastructure. Structural issues around bankability, coupled with macroeconomic uncertainty which is all too palpable now, could further hold back private sector participation.
There are no quick fixes to these issues. But it is worth emphasizing that multilateral development banks (including AIIB) play a critical role to help countries sustain a higher level of infrastructure investment for the long term through this challenging period.
I hope you will find it an interesting report that raises the right issues for discussion. We at AIIB will work with the industry and development community to address near- and longer-term infrastructure challenges in Asia and beyond.
Jin Liqun President, Asian Infrastructure Investment Bank

III
Mobilizing private capital is not a new concept. Back in 2015, the Development Committee Discussion Note, prepared jointly by various multilateral institutions, already set out the “From Billions to Trillions” agenda of mobilizing private capital for development. Various MDBs have also made mobilizing private capital a priority. The Asian Development Bank (ADB) emphasizes private participation in infrastructure and capital market development in its private sector operations framework. The World Bank takes an approach of “Maximizing Finance for Development” to systematically leverage all sources of finance. It recently adopted the “cascade framework” that prioritizes private solutions (including finance) wherever possible, before public financing is considered.
AIIB is not unique in its priority to mobilize private capital. Yet unlike other MDBs, AIIB has a more focused mandate on infrastructure project financing and does not offer concessionary financing. Like others, AIIB will try to develop a high degree of flexibility in financing through various instruments. Its strategy on mobilizing private capital for infrastructure (2018) spells out its vision as a bank that will help develop emerging market infrastructure as an asset class. The first step toward creating infrastructure as an asset class for private sector investors would be to increase the level of data quality to facilitate a high-quality brainstorming around key issues, for international comparisons, and to help market participants make informed financing decisions. This report, which AIIB has prepared with The Economist Intelligence Unit (The EIU) and with inputs from industry experts, aims to contribute toward this objective.
For the purposes of this report, infrastructure covers, as conventionally understood, power, transport, renewables, water and telecommunications. Other sectors, which are not the key focus of this report but represented as part of data source, include oil and gas, mining, social and defense, and multiple sectors. The main datasets used for the study come from IJGlobal and Thomson Reuters. For IJGlobal, the dataset is mainly focused on private sector transactions, including public-private partnerships (PPPs) and infrastructure development through state-owned enterprises that have some market participation. For Thomson Reuters, the dataset covers bank financing in the syndicated loan market.
Taken together, the report thus focuses on the project financing in the market rather than infrastructure spending from purely fiscal
As a 21st-century multilateral development bank (MDB), AIIB was created with a specific mandate: to provide development finance in infrastructure and other productive sectors. As it is well-documented already, the infrastructure funding requirements in Asia are large. Much of the funding would continue to come from public resources, through better domestic revenue mobilization, cost recovery and better prioritization of fiscal resources. Yet it is also very clear that more private sector financing is required. Hence, from the outset, AIIB has been very keen to focus its resources in the infrastructure project financing market, not only to provide financing but also to help further infrastructure as an asset class to crowd in private capital.
Introduction
IV
resources (which still provide for the majority of infrastructure investments). This focus on the still relatively small segment of market project finance is in line with AIIB’s priority of mobilizing private capital into infrastructure. The level of transactions also differs from market to market not only just due to aggregate spending on infrastructure but also on how much is captured as market transactions. For this report, the definition of Asia will include Asia-Pacific (covering Australasia, Turkey as well as Russia), consistent with AIIB’s regional membership. In this first report, eight markets will be given specific focus given their large economic sizes and infrastructure needs.
In developing this report, more than 40 industry experts were consulted over the course of six months. The team has also created benchmarks in three areas—infrastructure financing volume, infrastructure financing cost and project construction cost (starting with road projects)—to provide a snapshot of the health and direction of the project financing market. AIIB will gradually deepen this data collection process in the coming years and build this into an information repository that can be shared with the community.
The first part of this report provides an assessment of the near- to medium-term state of the project financing market, with a focus on identifying the implications arising from the global economy. The assessment takes into consideration global economic developments (assessed by various international organizations) and data trends from various sources. The key takeaway is that infrastructure project financing is at an inflection point. A slowing global economy, higher cost of capital, currency volatility and geopolitical tensions will mean that governments have to balance between macroeconomic stability and sustaining a high level of infrastructure investment to meet growing needs. Trade frictions and rising nationalism is also highlighted as a risk factor that could affect infrastructure investments.
Notwithstanding the fact that discussions around near-term prospects would center around global macroeconomic development and trade frictions, it is clear that in the medium to long term, technology, economic growth and finance will reshape the way infrastructure is funded and developed.
The second part of this report includes six articles that explore some of these structural and longer-term issues. In this first publication, special focus is given to cross-border connectivity, which is itself also not a new agenda. Expanding regional
connectivity and integration is core to AIIB, as spelled out in its Articles of Agreement. Many multilateral institutions and governments have also promoted various regional connectivity initiatives. Yet at this time of rising trade frictions and populist sentiments against globalization, it is even more important to catch sight of the many opportunities that are either present or will come along for cross-border infrastructure crucial for countries to sustain trade and income growth. Entitled “Bridging Borders: Infrastructure to Connect Asia and Beyond,” the articles consider how investing in infrastructure connects markets and people. They are based on research conducted by The EIU, and research by the staff of AIIB, with inputs from stakeholders and industry professionals:
• Growth belts: mapping an overland future for Asian trade
• Latin America and Asia trade: a future beyond commodities manufactures
• The green imperative: developing interconnected low-carbon power networks in Asia
• Airports, airlines and visas: factors shaping cross-border tourism
• Infrastructure 3.0: how new technologies will facilitate intra-Asian trade and integration
• Connectivity, income growth and poverty reduction
Last but not least, the report presents a methodology for comparing road construction costs in various economies in Asia. This will be improved and expanded in the future to enhance understanding of the cost drivers for various infrastructure types. Infrastructure and its impact on trade will be an exciting space for AIIB, policy-makers and industry players for many years to come, and we look forward to continuing the conversation beyond this first publication.

V
Acknowledgments
The analysis presented in this report is based on in-depth interviews with key stakeholders in infrastructure financing and construction, conducted between August and October 2018. Additional insights and data were obtained from associations, government agencies and private sector stakeholders based in several of the focus countries. Our thanks are due to the following individuals and organizations (listed alphabetically by surname), as well as other experts who prefer to remain anonymous:
Adolfo Dindo Abueg
Co-Head, Project Finance, Asia Pacific, Korea Development Bank
Milind Agrawal
Principal, Global Infrastructure Partners India
Engr. Aftabuddin Ahmed
President, Bangladesh Association of Construction Industry
Ashraf Ahmed
Chief Executive Officer, Riverstone Capital Limited
Md. Faruque Ahmed
Director General (Programming & Investment Promotion), Public Private Partnership Authority, Prime Minister’s Office, Bangladesh
Zia Azeez
Deputy Head of Asia, Global Structured Finance, Sumitomo Mitsui Banking Corporation
Surya Bagchi
Global Head, Project & Export Finance, Corporate Finance, Standard Chartered
Alexander Boutovski
Deputy General Director for Strategic Business Development, AO Institute Stroyproekt
James Cameron
Managing Director, Co-Head of Infrastructure and Real Estate Group, Asia Pacific, HSBC
Raghav Chandra
Former Chairman, National Highways Authority of India

VI
Chong Teck Wei
Managing Director and Head of Project Finance, Asian Investment Banking Division, MUFG Bank
Abhishek Dangra
Director, Infrastructure – Sector Lead: South and Southeast Asia, Standard & Poor’s
Aled Davies
Partner, Milbank, Tweed, Hadley & McCloy
Christian Eigen-Zucchi
World Bank Programme Leader, Equitable Growth Finance & Institutions, World Bank Group
M. Siddiq Essa
President, Association of Consulting Engineers Pakistan (ACEP)
Hector Florento
Finance Director and Senior Advisor, CFP Transaction Advisors
Luca Fontana
Senior Vice President, Construction Services Asia-Pacific, AECOM
Pratap Giri
Adjunct Faculty Member, Indian Institute of Management–Bangalore (Project and Infrastructure Financing)
Iftikhar ul Haq
Managing Director, Engineering General Consultants EGC (Pvt) Ltd, Pakistan
Tetsunari Iida
Chairperson, Institute for Sustainable Energy Policies
Jing Shen
Senior Engineer and Deputy General Manager, 2nd International Department, CCCC Highway Consultants Co Ltd.
Kasey Kaplan
Asia-Pacific Managing Director, Blockchain in Transport Alliance
Tolga Kiral
Head of Project Finance, Turkiye Sinai Kalkinma Bankasi A.S
Andrew Hayan Lee
Former Managing Director of Sponsor Finance, ICBC Asia
Liang Jian
CEO, China Construction Engineering Policy Research Corporation Limited
Roger Lui
Partner, Allen & Overy
Eric Martinot
Professor, Management and Economics, Beijing Institute of Technology
Mark McLean
Managing Director and Head of Asia-Pacific, Morgan Stanley Infrastructure Partners
Khalid Z. Mirza
Chief Executive, Engineering Consultants International (Pvt) Ltd. Pakistan
Shah Jahan Mirza
Managing Director, Finance Department, Public Private Partnership Unit, Government of Sindh, Pakistan
Mark Moseley
COO, Global Infrastructure Hub
Subash Narayanan
Deputy Head, Project Finance, DBS Bank
Francis Nicolas Chua
First Vice President and Head, Corporate Finance Group, Development Bank of the Philippines
Mika Ohbayashi
Director, Renewable Energy Institute

VII
Simten Ozturk
Manager, Project & Acquisition Finance, Garanti Bank
Rajiv Panda
Head (Technical), South Asia Regional Initiative for Energy Integration
Ferdinand A. Pecson
Undersecretary and Executive Director, Philippines Public-Private Partnership Center
Nabil Mustafizur Rahman
Deputy Managing Director and Chief Risk Officer, United Commercial Bank Limited
Abhay Rangnekar
Managing Director, Regional Head of Project & Export Finance - ASEAN & South Asia
Mark Rathbone
Asia-Pacific Capital Projects & Infrastructure Leader, PwC
Dmitry Ladikov Roev
Managing Director for Assets and Liabilities, Eurasian Development Bank
Howard Rosen
Chairman, The Rail Working Group
M.P. Sharma
Technical Advisor, Ministry of Road Transport and Highways, India
Sharad Somani
Partner & Head - Infrastructure Advisory, KPMG in Singapore
Sanjay Srivastava
Programme Leader, Sustainable Development, World Bank Group
Randeep Sudan
Board Advisor, Ecosystm
Harold Tjiptadjaja
Managing Director, Chief Investment Officer, Indonesia Infrastructure Finance
Leyla Ünal
Director of Transportation Costs and Productivity Division, General Directorate of Highways, Ministry of Transport and Infrastructure, Turkey
Mehvish Waliany
Head of Investment Banking, Bank Alfalah
Zhang Guodong
Member of the Expert Committee and Senior Engineer, China Construction Engineering Policy Research Corporation Limited
VIII
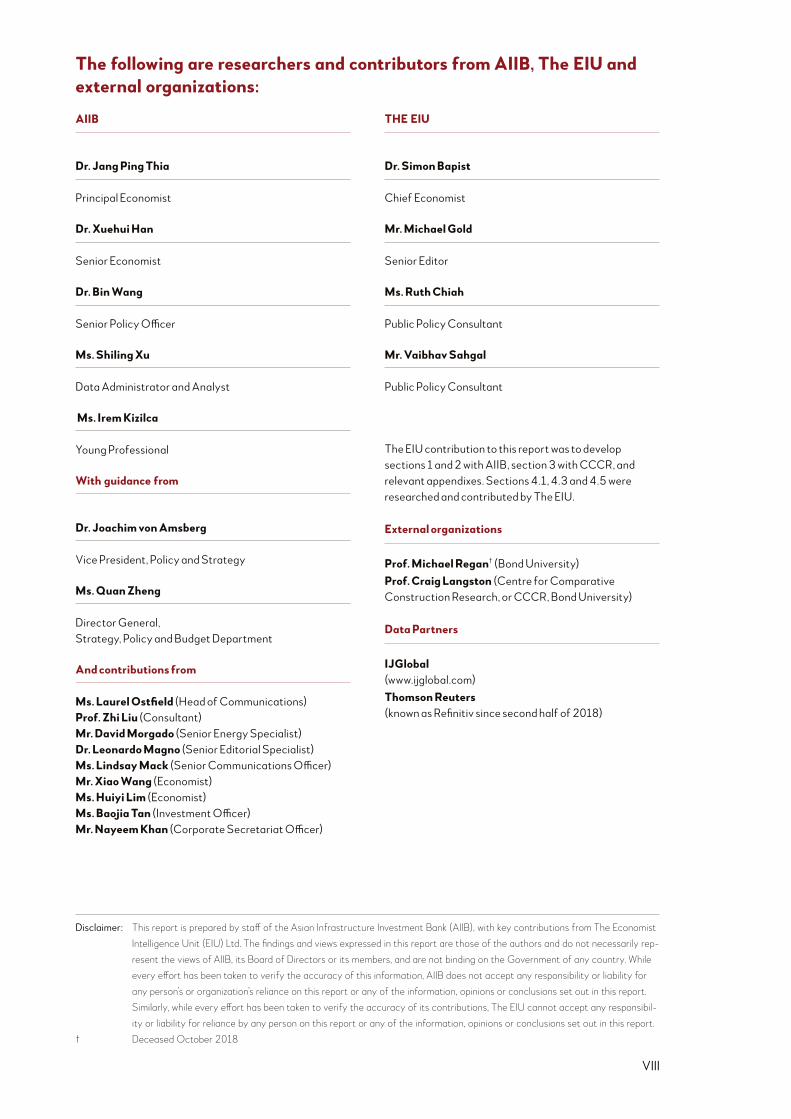
The following are researchers and contributors from AIIB, The EIU and external organizations:
AIIB
Dr. Jang Ping Thia
Principal Economist
Dr. Xuehui Han
Senior Economist
Dr. Bin Wang
Senior Policy Officer
Ms. Shiling Xu
Data Administrator and Analyst
Ms. Irem Kizilca
Young Professional
With guidance from
Dr. Joachim von Amsberg
Vice President, Policy and Strategy
Ms. Quan Zheng
Director General, Strategy, Policy and Budget Department
And contributions from
Ms. Laurel Ostfield (Head of Communications) Prof. Zhi Liu (Consultant) Mr. David Morgado (Senior Energy Specialist) Dr. Leonardo Magno (Senior Editorial Specialist) Ms. Lindsay Mack (Senior Communications Officer) Mr. Xiao Wang (Economist) Ms. Huiyi Lim (Economist) Ms. Baojia Tan (Investment Officer) Mr. Nayeem Khan (Corporate Secretariat Officer)
THE EIU
Dr. Simon Bapist
Chief Economist
Mr. Michael Gold
Senior Editor
Ms. Ruth Chiah
Public Policy Consultant
Mr. Vaibhav Sahgal
Public Policy Consultant
The EIU contribution to this report was to develop sections 1 and 2 with AIIB, section 3 with CCCR, and relevant appendixes. Sections 4.1, 4.3 and 4.5 were researched and contributed by The EIU.
External organizations
Prof. Michael Regan† (Bond University) Prof. Craig Langston (Centre for Comparative Construction Research, or CCCR, Bond University)
Data Partners
IJGlobal (www.ijglobal.com) Thomson Reuters (known as Refinitiv since second half of 2018)
Disclaimer: This report is prepared by staff of the Asian Infrastructure Investment Bank (AIIB), with key contributions from The Economist Intelligence Unit (EIU) Ltd. The findings and views expressed in this report are those of the authors and do not necessarily rep-resent the views of AIIB, its Board of Directors or its members, and are not binding on the Government of any country. While every effort has been taken to verify the accuracy of this information, AIIB does not accept any responsibility or liability for any person’s or organization’s reliance on this report or any of the information, opinions or conclusions set out in this report. Similarly, while every effort has been taken to verify the accuracy of its contributions, The EIU cannot accept any responsibil-ity or liability for reliance by any person on this report or any of the information, opinions or conclusions set out in this report.
† Deceased October 2018
IX
Contents
Foreword I
Introduction III
Acknowledgments V
Executive Summary 01
1. Infrastructure Finance in Asia: At an Inflection Point 05
1.1 The end of cheap debt will drive
a flight to quality 06
1.2 Pipeline in flux as geopolitical and market volatility rises 09
1.3 Rising skepticism about globalization and trade tensions, and their effect on infrastructure financing 12
1.4 Renewable energy will see increased focus but is still someway short of bankability 13
1.5 Conclusion 16
2. Infrastructure Financing Costs and Activity in Asia 19
2.1 Introduction to country
financing profiles 19
2.2 Bangladesh 20
2.3 China 23
2.4 India 28
2.5 Indonesia 31
2.6 Pakistan 35
2.7 Philippines 38
2.8 Russia 42
2.9 Turkey 45
X
3. Infrastructure Construction Costs in Asia 49
3.1 About the roadBLOC methodology 51
3.2 Overview of the current infrastructure landscape and outlook 53
3.2.3 Bangladesh 55 3.2.3 China 59 3.2.3 India 63 3.2.4 Indonesia 67 3.2.5 Pakistan 71 3.2.6 Philippines 75 3.2.7 Russia 79 3.2.8 Turkey 83
4. Bridging Borders 87
4.1 Growth belts: mapping an overland
future for Asian trade 87
4.2 Latin America and Asia trade: a future beyond commodities for manufactures 93
4.3 The green imperative: developing
interconnected low-carbon power networks in Asia 98
4.4 Airports, airlines and visas: factors shaping cross-border tourism 101
4.5 Infrastructure 3.0: how new technologies will facilitate intra-Asian trade and integration 105
4.6 Connectivity, income growth
and poverty reduction 108
5. Appendix 113
5.1 Appendix 1: Detailed description
of roadBLOC 113
5.2 Appendix 2: Methodology for infrastructure financing costs and activity benchmarking 117
5.2.1 Infrastructure financing activity 117 5.2.2 Infrastructure financing cost 118
5.3 Appendix 3: Latin America
and Asia trade: a future beyond commodities for manufactures 118
5.4 Appendix 4: Airports, airlines and visas: factors shaping cross-border tourism 120
5.5 Appendix 5: Connectivity, income growth and poverty reduction 122
6. References 123

01
Infrastructure is central to development in emerging Asia. There are significant infrastructure opportunities, and cross-border infrastructure in particular can bring about trade and development that supports income growth:
• Increased regional rail connectivity in Central Asia has the potential to bring about more Europe-China trade and integrate Central Asia with other regions. Traditional bottlenecks, such as gauge differences, can be gradually overcome with the right investments, technology and improved logistics. It is estimated that USD38 billion worth of investment is required up to 2030 for rail upgrades and new lines.
• Falling generation cost of renewable energy, coupled with greater awareness on
climate change issues, will lead to increase in investments. Investment platforms to aggregate projects are needed to overcome small deal sizes and bring about greater investor interest. It is also critical to enhance cross-border transmission, which is central to matching supply and demand across geographies. Adjusted for energy content, long distance transmission lines are more expensive than gas pipelines for energy trade, but the cost gap will narrow once carbon costs and sustainability considerations are factored in.
• Information and communications technology (ICT) is a key enabler to facilitate trade and integration. Technological improvements, such as the distributed ledger technology or applying artificial intelligence to logistics, hold promise to greatly improve on existing facilitation. However, some Asian economies are at risk of falling behind in basic ICT to support trade. They will require greater investment support from the international community.
Executive Summary
02
There are also significant opportunities to connect beyond Asia:
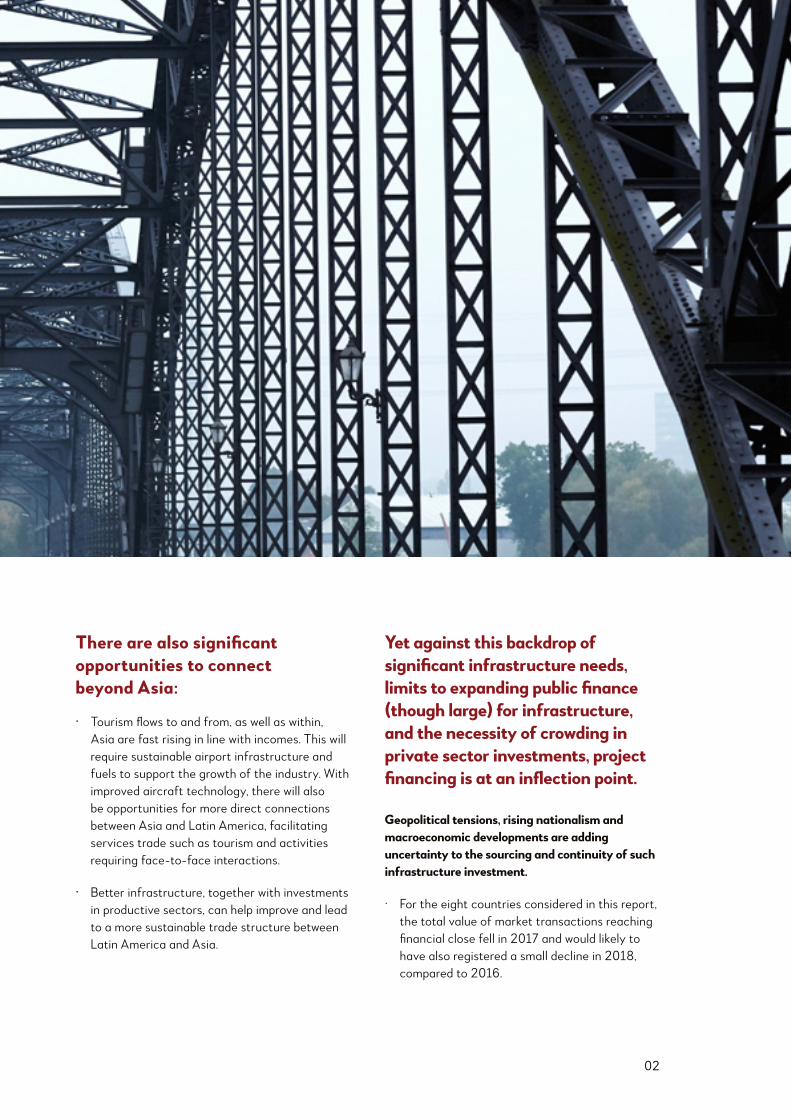
• Tourism flows to and from, as well as within, Asia are fast rising in line with incomes. This will require sustainable airport infrastructure and fuels to support the growth of the industry. With improved aircraft technology, there will also be opportunities for more direct connections between Asia and Latin America, facilitating services trade such as tourism and activities requiring face-to-face interactions.
• Better infrastructure, together with investments in productive sectors, can help improve and lead to a more sustainable trade structure between Latin America and Asia.
Yet against this backdrop of significant infrastructure needs, limits to expanding public finance (though large) for infrastructure, and the necessity of crowding in private sector investments, project financing is at an inflection point. Geopolitical tensions, rising nationalism and macroeconomic developments are adding uncertainty to the sourcing and continuity of such infrastructure investment.
• For the eight countries considered in this report, the total value of market transactions reaching financial close fell in 2017 and would likely to have also registered a small decline in 2018, compared to 2016.
03
Stakeholders in the infrastructure sector will face a very different situation in the next few years:
• Interest rates rise due to policy normalization by central banks will drive a flight to quality. The combination of remaining liquidity in the system, higher cost of capital, and the potential impact from the implementation of Basel III and International Financial Reporting Standards (IFRS) 9, which may drive banks to be more risk-averse in terms of long-term lending, is likely to drive a divergence in lending costs. There will be a widening credit spread between projects with strong contracts, government backing and Multilateral Development Banks (MDBs) involvement, and those without.
• Trade frictions and market volatility have increased uncertainty around project pipelines. Although it is too early to ascertain the exact impact, sustained trade tensions will
drive a shift in supply chains, potentially affecting long-term infrastructure and economic development plans. Currency volatility in some emerging markets is likely to increase uncertainty in the transaction pipeline, as governments put a hold on or delay projects with a view to protecting their currencies or reducing government expenditure.
• Rising geopolitical tensions and a busy election cycle will increase investor caution. As major economic infrastructure is sometimes classified as a national strategic asset, sponsors and lenders are likely to be more prudent in building such assets. Increased geopolitical uncertainty and shifts in terms of sources of infrastructure financing as well as broader trade and political partnerships, are also likely to accentuate such sensitivity. Many Asian economies will see national elections in 2019, which could induce investors to adopt a “wait-and-see” attitude.
The risk is that structural issues around bankability, coupled with near-term challenges, would continue to hold back private sector participation. Despite much discussion and effort, private capital is still not playing the role as it can and should play. MDBs and governments will therefore need to address near-term concerns in the context of longer-term market improvements. In the backdrop of macroeconomic uncertainty, MDBs such as AIIB can help reinforce public infrastructure investment where it is fiscally sustainable to do so, given the ability to lend counter-cyclically and take longer-term exposures.
There is also an urgent need to redouble efforts to mobilize private capital, and these would include improving project preparation, improving country policy framework, and sustaining the supporting conditions such as through better information for market players. MDBs will play a critical role in mobilizing private capital not just through cofinancing but also to improve project preparation and to reduce project risks (which is important in the context of investor caution arising from perceived geopolitical or policy uncertainty). Greater risk sharing between financiers can help cushion the impact from increase in borrowing costs.
To sum up, this report does not aim to present a new agenda or country specific policy recommendations. It marks AIIB’s first step in building up high-quality data and analysis to support broader policy discussions and investor decisions. AIIB will continue to work with the industry and other partners in this effort, and toward mobilizing private capital for infrastructure.
04
05
Globally, the economy is at an inflection point—there will be marked shifts in how businesses, governments and multilaterals will have to operate in the next few years. Credit will no longer be as cheap or as available, as central banks start to raise interest rates; partnerships and alliances once deemed key geopolitical relationships are now in doubt; rising skepticism about globalization has led to trade tensions and increasing national sovereignty concerns, threatening to disrupt supply chains; and the implementation of banking regulatory changes will have implications for the supply of long-term financing.
This set of structural changes has particular implications for infrastructure in Asia.Infrastructure finance is long term and particularly sensitive to the credit environment, especially in Asiai where it remains predominantly driven by bank loans due to less-developed capital markets. For projects in the region that enter into the market for financing, over 90 percent is currently raised from commercial bank loans, according to Moody’s.1 Moreover, ADB estimates that the infrastructure financing gap in the region is around USD459 billion per year.2 Geopolitical volatility, along with domestic political risks in Asia, also adds uncertainty to the sourcing and continuity of infrastructure investment.
Yet, in Asia, the need for infrastructure makes it imperative to find a sustainable source of funding beyond government. This section looks at key macroeconomic and political trends to better understand their impact on private infrastructure finance in Asia. It also incorporates insights from interviews to better understand private sector sentiment for the infrastructure and project finance market.
1 Infrastructure Finance in Asia: At an Inflection Point
i As highlighted in the introduction, for the purposes of this report, the definition of Asia will include Asia-Pacific (including Australasia) as well as Russia and Turkey, consistent with AIIB’s regional membership.
06
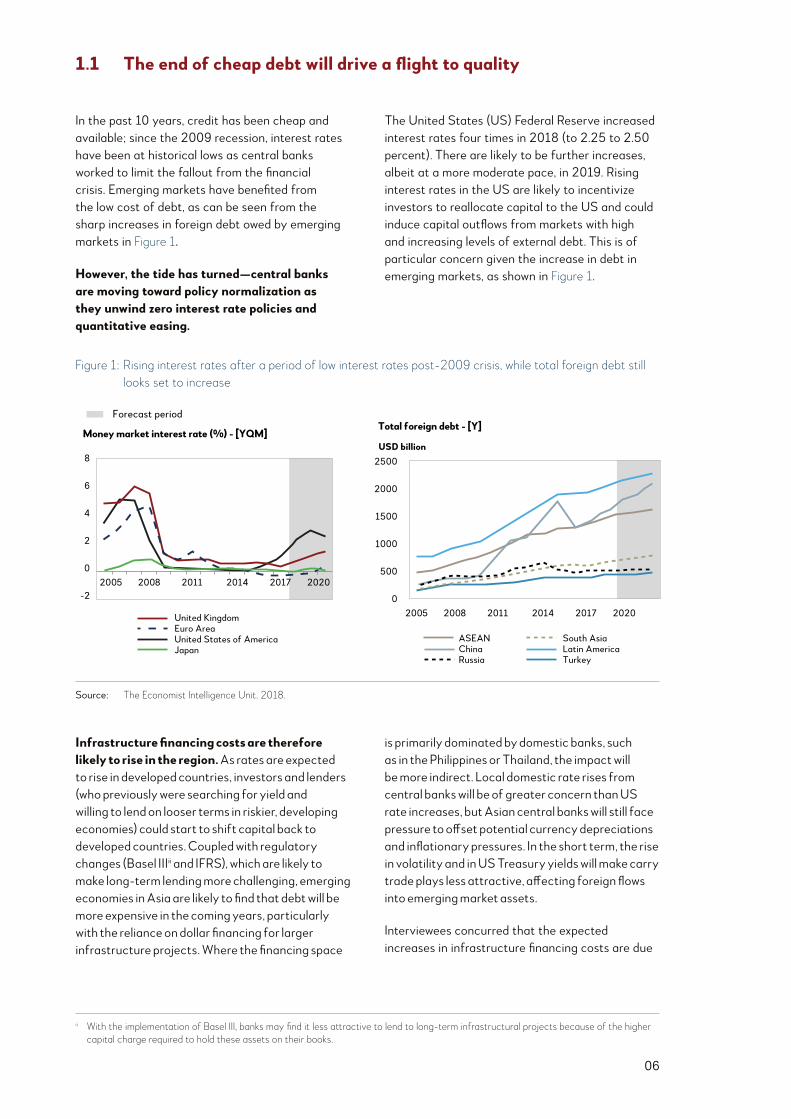
In the past 10 years, credit has been cheap and available; since the 2009 recession, interest rates have been at historical lows as central banks worked to limit the fallout from the financial crisis. Emerging markets have benefited from the low cost of debt, as can be seen from the sharp increases in foreign debt owed by emerging markets in Figure 1.
However, the tide has turned—central banks are moving toward policy normalization as they unwind zero interest rate policies and quantitative easing.
The United States (US) Federal Reserve increased interest rates four times in 2018 (to 2.25 to 2.50 percent). There are likely to be further increases, albeit at a more moderate pace, in 2019. Rising interest rates in the US are likely to incentivize investors to reallocate capital to the US and could induce capital outflows from markets with high and increasing levels of external debt. This is of particular concern given the increase in debt in emerging markets, as shown in Figure 1.
Infrastructure financing costs are therefore likely to rise in the region. As rates are expected to rise in developed countries, investors and lenders (who previously were searching for yield and willing to lend on looser terms in riskier, developing economies) could start to shift capital back to developed countries. Coupled with regulatory changes (Basel IIIii and IFRS), which are likely to make long-term lending more challenging, emerging economies in Asia are likely to find that debt will be more expensive in the coming years, particularly with the reliance on dollar financing for larger infrastructure projects. Where the financing space
is primarily dominated by domestic banks, such as in the Philippines or Thailand, the impact will be more indirect. Local domestic rate rises from central banks will be of greater concern than US rate increases, but Asian central banks will still face pressure to offset potential currency depreciations and inflationary pressures. In the short term, the rise in volatility and in US Treasury yields will make carry trade plays less attractive, affecting foreign flows into emerging market assets.
Interviewees concurred that the expected increases in infrastructure financing costs are due
1.1 The end of cheap debt will drive a flight to quality
Figure 1: Rising interest rates after a period of low interest rates post-2009 crisis, while total foreign debt still looks set to increase
Source: The Economist Intelligence Unit. 2018.
Source: The Economist Intelligence Unit 2018.
Forecast period
Money market interest rate (%) - [YQM]
United KingdomEuro AreaUnited States of AmericaJapan
2005 2008 2011 2014 2017 2020
8
6
4
2
0
-2
Total foreign debt - [Y]
ASEANChinaRussia
South AsiaLatin AmericaTurkey
2005 2008 2011 2014 2017 2020
2500
2000
1500
1000
500
0
USD billion
ii With the implementation of Basel III, banks may find it less attractive to lend to long-term infrastructural projects because of the higher capital charge required to hold these assets on their books.
07
The reliance on bank lending will also subject projects to refinancing risks. Typically, banks do not generally provide tenors longer than five to seven years due to their reliance on short-term deposits (a consequence of the maturity mismatch
issues between bank asset and liability portfolios).4 In terms of bonds, the Asia Securities Industry & Financial Markets Association noted that tenors of five years or less continued to account for the bulk of bond issuance in Q3 2018.5
primarily to macroeconomic pressures in most cases, rather than changes in country-specific risk premiums. In some countries, the risk premium has actually decreased (for example, because they are now rated investment-grade), but financing costs are still expected to rise overall due to the increase in the base rate. A country-specific discussion is included in Section 2.
However, this may have a more muted impact on infrastructure financing for two reasons. First, rates on long-term lending (which forms the bulk of infrastructure finance) tends to rise less quickly, as the yield curve over 10 to 15 years is less volatile than over one to three years. Second, it is likely that this will instead drive a divergence via a flight to quality. Asia has a long-running structural problem in the lack of bankable projects, and there remains liquidity in the region—higher interest rates and tougher regulations will instead drive a growing credit spread between projects
with strong contracts, government backing and MDB involvement, and those without. As an aside, one concern flagged is that a higher cost of capital could hinder low-carbon investment, given that most low-carbon generation options have high upfront capital costs and low variable operating costs.3 This could require more policy support.
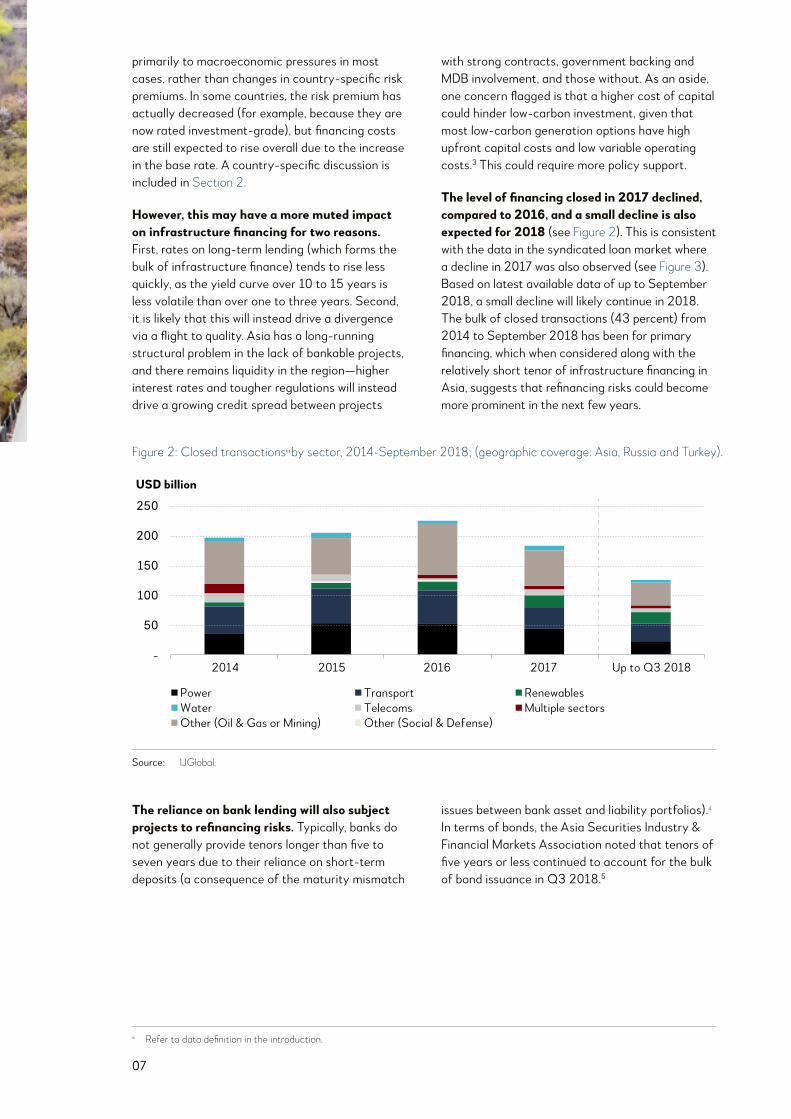
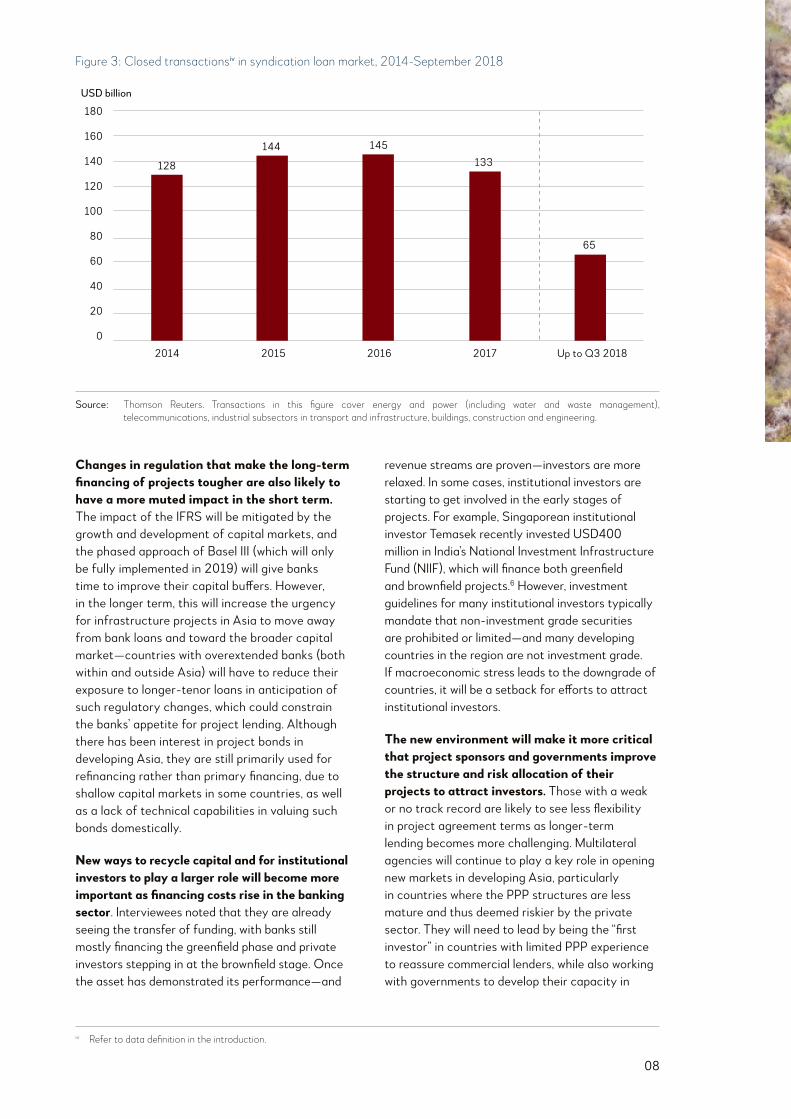
The level of financing closed in 2017 declined, compared to 2016, and a small decline is also expected for 2018 (see Figure 2). This is consistent with the data in the syndicated loan market where a decline in 2017 was also observed (see Figure 3). Based on latest available data of up to September 2018, a small decline will likely continue in 2018. The bulk of closed transactions (43 percent) from 2014 to September 2018 has been for primary financing, which when considered along with the relatively short tenor of infrastructure financing in Asia, suggests that refinancing risks could become more prominent in the next few years.
iii Refer to data definition in the introduction.
Figure 2: Closed transactionsiii by sector, 2014-September 2018; (geographic coverage: Asia, Russia and Turkey).
Source: IJGlobal
2014 2015 2016 2017 Up to Q3 2018
USD billion
250
200
150
100
50
-
PowerWaterOther (Oil & Gas or Mining)
TransportTelecomsOther (Social & Defense)
RenewablesMultiple sectors
Source: IJGlobal.
08
Changes in regulation that make the long-term financing of projects tougher are also likely to have a more muted impact in the short term. The impact of the IFRS will be mitigated by the growth and development of capital markets, and the phased approach of Basel III (which will only be fully implemented in 2019) will give banks time to improve their capital buffers. However, in the longer term, this will increase the urgency for infrastructure projects in Asia to move away from bank loans and toward the broader capital market—countries with overextended banks (both within and outside Asia) will have to reduce their exposure to longer-tenor loans in anticipation of such regulatory changes, which could constrain the banks’ appetite for project lending. Although there has been interest in project bonds in developing Asia, they are still primarily used for refinancing rather than primary financing, due to shallow capital markets in some countries, as well as a lack of technical capabilities in valuing such bonds domestically.
New ways to recycle capital and for institutional investors to play a larger role will become more important as financing costs rise in the banking sector. Interviewees noted that they are already seeing the transfer of funding, with banks still mostly financing the greenfield phase and private investors stepping in at the brownfield stage. Once the asset has demonstrated its performance—and
revenue streams are proven—investors are more relaxed. In some cases, institutional investors are starting to get involved in the early stages of projects. For example, Singaporean institutional investor Temasek recently invested USD400 million in India’s National Investment Infrastructure Fund (NIIF), which will finance both greenfield and brownfield projects.6 However, investment guidelines for many institutional investors typically mandate that non-investment grade securities are prohibited or limited—and many developing countries in the region are not investment grade. If macroeconomic stress leads to the downgrade of countries, it will be a setback for efforts to attract institutional investors.
The new environment will make it more critical that project sponsors and governments improve the structure and risk allocation of their projects to attract investors. Those with a weak or no track record are likely to see less flexibility in project agreement terms as longer-term lending becomes more challenging. Multilateral agencies will continue to play a key role in opening new markets in developing Asia, particularly in countries where the PPP structures are less mature and thus deemed riskier by the private sector. They will need to lead by being the “first investor” in countries with limited PPP experience to reassure commercial lenders, while also working with governments to develop their capacity in
iv Refer to data definition in the introduction.
Figure 3: Closed transactionsiv in syndication loan market, 2014-September 2018
Source: Thomson Reuters. Transactions in this figure cover energy and power (and water and sanitation), industrials, high technology, and telecommunication.
180
160
140
120
100
80
60
40
20
0
128
144 145
133
65
2014 2015 2016 2017 Up to Q3 2018
USD billion
Source: Thomson Reuters. Transactions in this figure cover energy and power (including water and waste management), telecommunications, industrial subsectors in transport and infrastructure, buildings, construction and engineering.

09
1.2 Pipeline in flux as geopolitical and market volatility rises
Global geopolitics have become less stable. This has resulted in more uncertainty but also presented some opportunities. Trade frictions are rising. Partnerships in infrastructure financing and construction are also shifting, tilting away from traditional aid and investment partners. China has emerged alongside Japan as a key player for major infrastructure projects in Southeast Asia,7 India and Japan signed an agreement to establish the Asia-Africa Growth Corridor; and European and South Korean firms also vie for rail-related contracts in the region.8 This has offered opportunities for Asian countries to demand more favorable deals. The establishment of multilateral institutions such as AIIB and the New Development Bank also provide new alternatives for Asian countries in terms of infrastructure finance.
However, domestic and bilateral political issues continue to be a key short-term risk for financiers to infrastructure projects and financing in Asia, whether international or domestic. Infrastructure is closely tied to the politics of the day, given that infrastructure is sometimes classified as a national strategic asset and the strong dependence on public-sector funding and operation. Political events such as elections may slow or delay the infrastructure pipeline, like the newly elected Malaysian government’s decision to scrap the Singapore-Kuala Lumpur High-Speed Rail (although Malaysia later said it would negotiate with Singapore and defer the project rather than cancel it, the decision will delay the original completion date of 2026 and increase costs).9 Shifts such as the Philippines’ economic pivot away from PPPs to foreign loans and official development assistance (ODA) have also disrupted the existing deal flow, with interviewees noting that these policy issues can make investors hesitant to participate in projects.10
Country Election Date
Bangladesh Held in 2018
India India general election (April-May 2019)
Indonesia Indonesia general election (April 2019)
Pakistan Held in 2018
Philippines Philippines general election (May 2019)
Russia Held in 2018
Turkey Held in 2018
Recent currency volatility in emerging markets is also a cause for concern, as it is likely to lead to delays in projects, weakening the outlook for the project pipeline. Indonesia for example announced a delay of 4.6 GW out of the planned 35 GW of electricity projects (revised from an initial decision to delay projects worth 10.56 GW).11 Similarly, Turkey indicated in its October Medium-Term Fiscal Plan that public investment projects that had not yet started would be postponed.12 The current trade disputes may also have an impact on currencies, particularly where there are large trade and/or budget deficits. This volatility exacerbates the lack of bankable projects, as significant depreciations could jeopardize project viability, particularly those with currency mismatches in their revenue and financing streams. Although a full-blown emerging market crisis is likely to be averted, periods of volatility remain likely, accompanied by a slowdown in the global economy in 2019.
Table 1: Upcoming general or parliamentary elections in focus countries
PPPs. Wary private sector participants are likely to rely on multilaterals acting as anchor investors in emerging markets, seeing their participation as a signal of greater transaction credibility.
A possible solution is for major offshore lenders and multilaterals to work more with local banks, as they are better able to take on local political risk compared with international lenders.
Source: The Economist Intelligence Unit, 2018.

10
Currency depreciations and inflationary pressures may increase the cost on major inputs (discussed in Section 3) and slow down deals in markets that are perceived to be more vulnerable to capital flight and exchange rate volatility. Currency conversion risk in infrastructure financing is a long-standing issue for banks—particularly as governments in Asia are wary of currency risks post-1997 and are less willing to provide explicit guarantees for projects. However, investors often price in implicit guarantees (utilities are often state-owned enterprises, for example), from which government-linked entities and local governments can benefit in periods of strong economic growth through lower borrowing costs. But in periods of volatility, this could have the opposite effect—in the event of uncertainty regarding the government’s stance on guarantees for government-linked entities, risk-averse investors may choose to price in a premium for all government-linked entities, driving up the cost of financing.
Government transparency around explicit guarantees can in such cases be beneficial, particularly if it is an organization that is strategically important enough that it cannot be allowed to fail. More broadly, a full-blown crisis is likely to be averted as the factors that have driven the Turkish lira and the Argentinian
peso down appear to be country-specific; few emerging markets suffer from a comparable lack of policy credibility. In addition, unlike in previous currency crises, many emerging markets now have flexible exchange rates and therefore will not need to deplete their foreign exchange reserves to defend them.
Multilateral agencies will face continued demand from commercial lenders for political risk guarantees and insurance. There will be demand to cover not only traditional political risks, but also risks that are quasi-commercial, such as contractual payment or performance of government counterparties such as state-owned utilities.
As noted previously, the combination of liquidity in the region with rising interest rates and changes in banking regulation is likely to lead to a flight in quality. In turn, there will be increasing pressure on governments to improve institutions, through credible commitments to honour contractual terms in a PPP, as well as through building investor and lender confidence in public procurement, permits and tariffs. Riskier sectors and countries are likely to see greater increases in lending rates, while sponsors of high-quality projects can leverage on the competition between lenders and investors to fund bankable projects within the region.
-2%
-3%
-4%
-8%
-10%
-11%
-15%
-39%
Philippines
Indonesia
China
Bangladesh
India
Russia
Pakistan
Turkey
Figure 4: Forecast change in exchange rate (USD/LCU) from 2017-2022 in selected countries; currency depreciation is forecast to be particularly marked in Turkey and Pakistan
Source: The Economist Intelligence Unit, 2018.
11
Long-term efforts by regional and multilateral organizations to provide and deepen local currency financing also will continue to be central to reducing devaluation risk for infrastructure projects (which are typically financed in hard currencies but collect revenue in local currencies). Although currency risk can be hedged with short-term products and rolled over, interviewees noted that many countries in developing Asia have less mature capital markets, without market-based hedges such as cross-currency swaps. The International Swaps and Derivatives Association noted that as of 2017, trading volumes of market-traded foreign exchange and interest rate derivatives in Asia-Pacific remain low as a proportion of global trading volumes, and even that is concentrated
in Australia; Hong Kong, China; Japan and Singapore.13 Additionally, even if there is a liquid market, these hedges can be costly, particularly as the currency hedges that are market-traded tend to be short term.
Given projected devaluations in the selected countries and the strengthening US dollar, as well as overall global interest rate uncertainties as central banks normalize policy, there will be continued demand from commercial lenders for customized hedging products from multilateral agencies. Newer products such as foreign-exchange swap guarantees from multilateral and development finance organizations can reduce the cost of hedging foreign exchange risks, improving the credit rating of such infrastructure projects.
12
1.3 Rising skepticism about globalization and trade tensions, and their effect on infrastructure financing
Global macroeconomic volatility is in part due to uncertainty over ongoing trade tensions. The dispute is expected to dampen growth in the wider global economy. The impacts of intensifying protectionism are twofold:
First, infrastructure investment plans may need to shift with the expected disruption in supply chains and trade flows. As the rest of the world adjusts to US protectionism by developing regional trade agreements and diversifying their trade partners, we expect more countries to develop trade ties with new partners. This will disrupt established supply chains as companies look to diversify, leading to changes in demand for shipping and port services. This could accelerate the need to invest in logistics and transport to capture this shift in supply chains (for example, the shift of manufacturing hubs to Southeast
Asia from China) or even mothball planned projects if there is insufficient projected demand to support project bankability. In the longer term, governments and project sponsors will have to consider if and how these disruptions could affect the long-term viability of planned projects.
Second, rising protectionism as well as populist sentiments against globalization and trade, has the potential to spill over to infrastructure investments and financing.14 Sponsors and lenders must work with increased caution around these sensitivities, as increased geopolitical tensions are also likely to increase these sentiments. This underscores the need for projects to be of high standards, with good governance transparency and openness. For projects fostering regional connectivity, there will be a need to ensure mutual benefits and respect of countries’ concerns.
13
Renewable energy is a key growth sector for private sector financing, due to increased concern over climate change. The Intergovernmental Panel on Climate Change’s latest report estimated that preventing the global temperature from increasing by more than 1.5°C will require greenhouse gas emissions to be 45 percent below 2010 levels by 2030, while current coal consumption must be reduced by a third.15 Thus, greater private sector interest in financing renewable projects will be important for supporting any targeted shift away from conventional power.
The need for increased power generation to supply growing populations, combined with
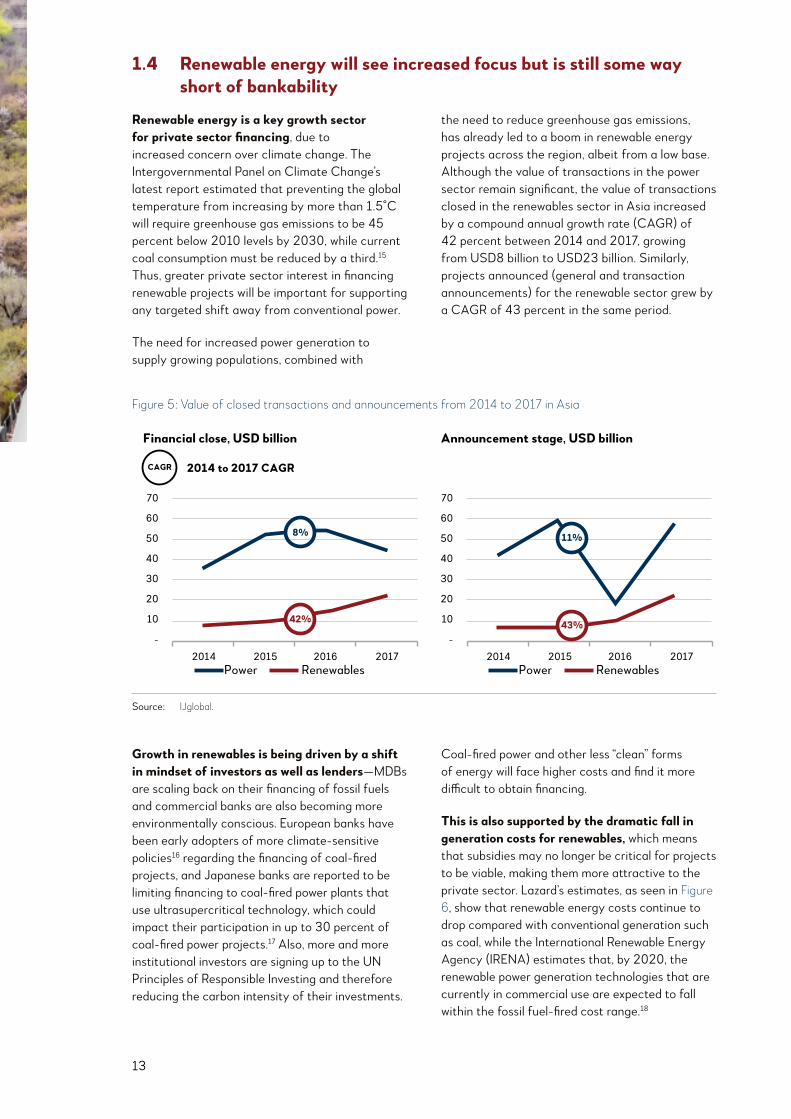
the need to reduce greenhouse gas emissions, has already led to a boom in renewable energy projects across the region, albeit from a low base. Although the value of transactions in the power sector remain significant, the value of transactions closed in the renewables sector in Asia increased by a compound annual growth rate (CAGR) of 42 percent between 2014 and 2017, growing from USD8 billion to USD23 billion. Similarly, projects announced (general and transaction announcements) for the renewable sector grew by a CAGR of 43 percent in the same period.
Growth in renewables is being driven by a shift in mindset of investors as well as lenders—MDBs are scaling back on their financing of fossil fuels and commercial banks are also becoming more environmentally conscious. European banks have been early adopters of more climate-sensitive policies16 regarding the financing of coal-fired projects, and Japanese banks are reported to be limiting financing to coal-fired power plants that use ultrasupercritical technology, which could impact their participation in up to 30 percent of coal-fired power projects.17 Also, more and more institutional investors are signing up to the UN Principles of Responsible Investing and therefore reducing the carbon intensity of their investments.
Coal-fired power and other less “clean” forms of energy will face higher costs and find it more difficult to obtain financing.
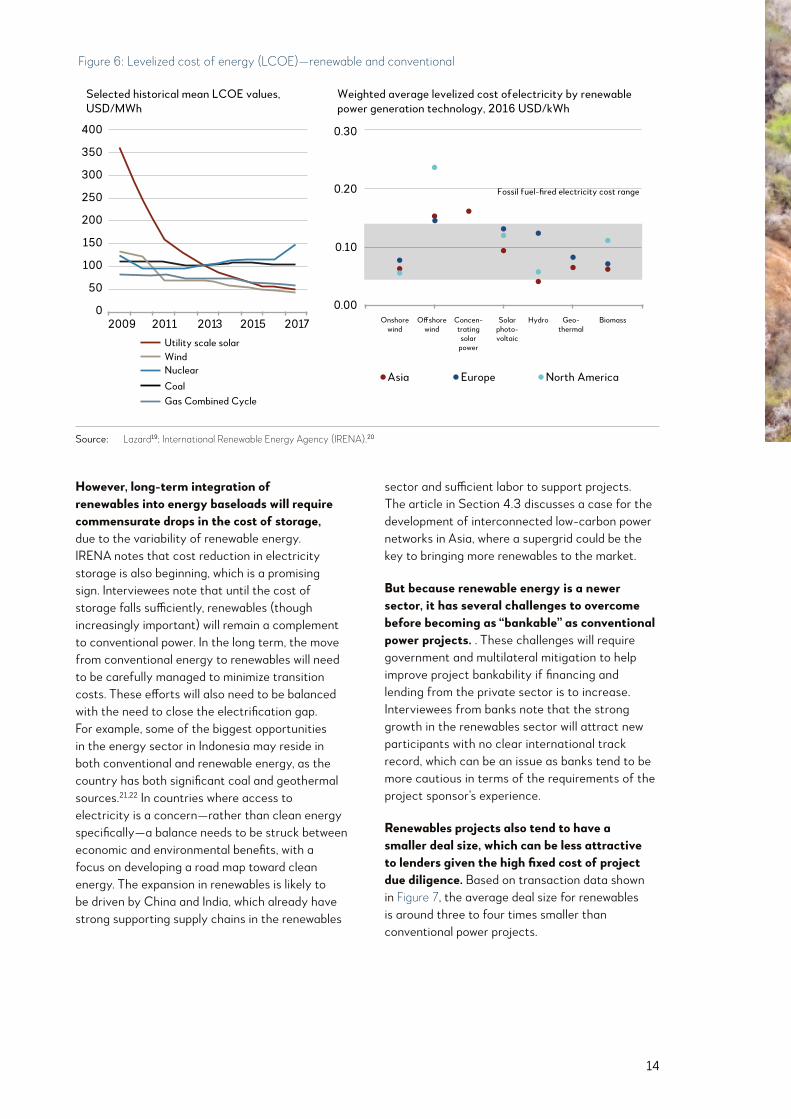
This is also supported by the dramatic fall in generation costs for renewables, which means that subsidies may no longer be critical for projects to be viable, making them more attractive to the private sector. Lazard’s estimates, as seen in Figure 6, show that renewable energy costs continue to drop compared with conventional generation such as coal, while the International Renewable Energy Agency (IRENA) estimates that, by 2020, the renewable power generation technologies that are currently in commercial use are expected to fall within the fossil fuel-fired cost range.18
1.4 Renewable energy will see increased focus but is still some way short of bankability
Figure 5: Value of closed transactions and announcements from 2014 to 2017 in Asia
Source: IJGlobal
Financial close, USD billion Announcement stage, USD billion
2014 to 2017 CAGRCAGR
2014 2015Power Renewables
2016 2017
70
60
50
40
30
20
10
-
2014 2015Power Renewables
2016 2017
70
60
50
40
30
20
10
-
11%8%
42% 43%
Source: IJglobal.
14
However, long-term integration of renewables into energy baseloads will require commensurate drops in the cost of storage, due to the variability of renewable energy. IRENA notes that cost reduction in electricity storage is also beginning, which is a promising sign. Interviewees note that until the cost of storage falls sufficiently, renewables (though increasingly important) will remain a complement to conventional power. In the long term, the move from conventional energy to renewables will need to be carefully managed to minimize transition costs. These efforts will also need to be balanced with the need to close the electrification gap. For example, some of the biggest opportunities in the energy sector in Indonesia may reside in both conventional and renewable energy, as the country has both significant coal and geothermal sources.21,22 In countries where access to electricity is a concern—rather than clean energy specifically—a balance needs to be struck between economic and environmental benefits, with a focus on developing a road map toward clean energy. The expansion in renewables is likely to be driven by China and India, which already have strong supporting supply chains in the renewables
sector and sufficient labor to support projects. The article in Section 4.3 discusses a case for the development of interconnected low-carbon power networks in Asia, where a supergrid could be the key to bringing more renewables to the market.
But because renewable energy is a newer sector, it has several challenges to overcome before becoming as “bankable” as conventional power projects. . These challenges will require government and multilateral mitigation to help improve project bankability if financing and lending from the private sector is to increase. Interviewees from banks note that the strong growth in the renewables sector will attract new participants with no clear international track record, which can be an issue as banks tend to be more cautious in terms of the requirements of the project sponsor’s experience.
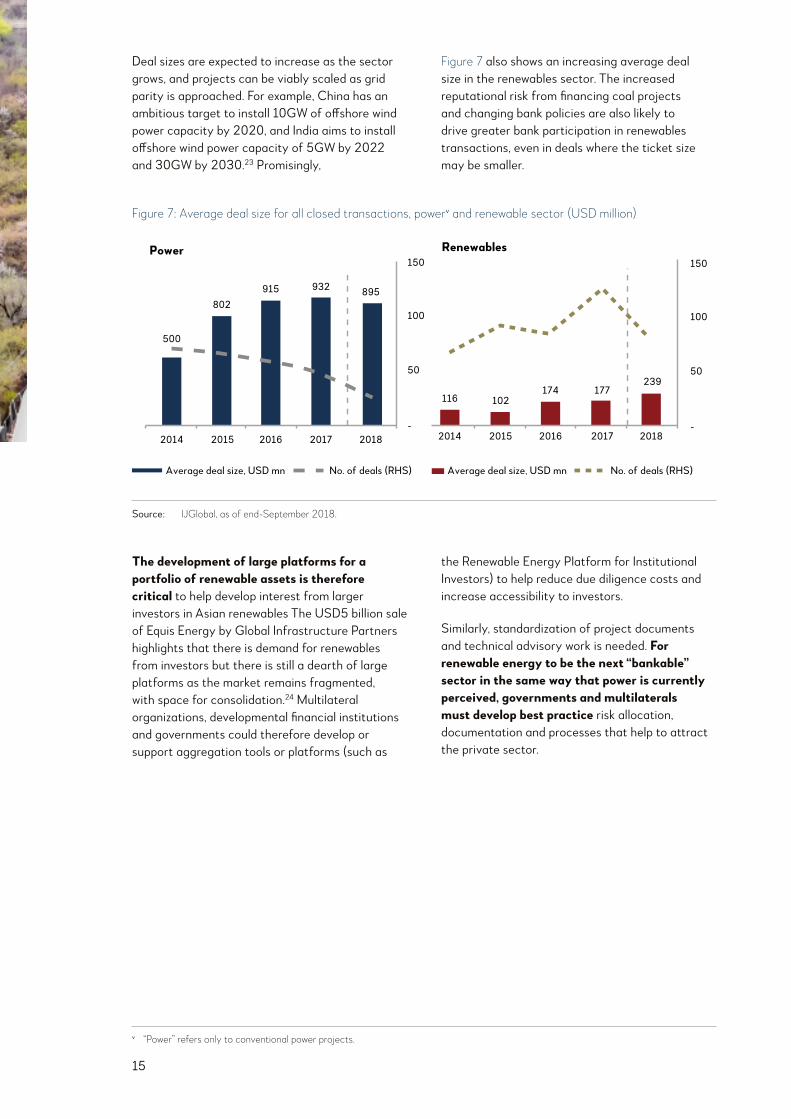
Renewables projects also tend to have a smaller deal size, which can be less attractive to lenders given the high fixed cost of project due diligence. Based on transaction data shown in Figure 7, the average deal size for renewables is around three to four times smaller than conventional power projects.
Figure 6: Levelized cost of energy (LCOE)—renewable and conventional
Source: Lazard20; International Renewable Energy Agency (IRENA).21
Selected historical mean LCOE values,USD/MWh
Weighted average levelized cost ofelectricity by renewablepower generation technology, 2016 USD/kWh
Utility scale solar
Onshorewind
O�shorewind
Concen-tratingsolar
power
Solarphoto-voltaic
Hydro Geo-thermal
Biomass
Fossil fuel-fired electricity cost range
WindNuclearCoalGas Combined Cycle
400
350
300
250
200
150
100
50
0
0.30
0.20
0.10
0.00
Asia Europe North America
2009 2011 2013 2015 2017
Source: Lazard19; International Renewable Energy Agency (IRENA).20
15
Deal sizes are expected to increase as the sector grows, and projects can be viably scaled as grid parity is approached. For example, China has an ambitious target to install 10GW of offshore wind power capacity by 2020, and India aims to install offshore wind power capacity of 5GW by 2022 and 30GW by 2030.23 Promisingly,
Figure 7 also shows an increasing average deal size in the renewables sector. The increased reputational risk from financing coal projects and changing bank policies are also likely to drive greater bank participation in renewables transactions, even in deals where the ticket size may be smaller.
The development of large platforms for a portfolio of renewable assets is therefore critical to help develop interest from larger investors in Asian renewables The USD5 billion sale of Equis Energy by Global Infrastructure Partners highlights that there is demand for renewables from investors but there is still a dearth of large platforms as the market remains fragmented, with space for consolidation.24 Multilateral organizations, developmental financial institutions and governments could therefore develop or support aggregation tools or platforms (such as
the Renewable Energy Platform for Institutional Investors) to help reduce due diligence costs and increase accessibility to investors.
Similarly, standardization of project documents and technical advisory work is needed. For renewable energy to be the next “bankable” sector in the same way that power is currently perceived, governments and multilaterals must develop best practice risk allocation, documentation and processes that help to attract the private sector.
v “Power” refers only to conventional power projects.
Figure 7: Average deal size for all closed transactions, powerv and renewable sector (USD million)
Source: IJGlobal, as of end-September 2018.
Power Renewables
Average deal size, USD mn Average deal size, USD mnNo. of deals (RHS) No. of deals (RHS)
2014
500
116 102174 177
239
150
100
50
-
150
100
50
-
802
915 932 895
2015 2016 2017 2018 2014 2015 2016 2017 2018
Source: IJGlobal, as of end-September 2018.
16
The trends that have been driving infrastructure development in Asia—demographic shifts, urbanization, the increasing affluence of the middle class and environmental concerns—will only grow in importance over the next decade. However, several key trends in the short to medium term will affect the infrastructure financing pipeline:
• Interest rates rise due to policy normalization by central banks will drive a flight to quality. The combination of remaining liquidity in the system, higher lending costs, and the potential impact from the implementation of Basel III and International Financial Reporting Standards (IFRS) 9, which may drive banks to be more risk-averse in terms of long-term lending, is likely to drive a divergence in lending costs. There will be a widening credit spread between projects with strong contracts, government backing and MDB involvement, and those without.
• Trade frictions and market volatility have increased uncertainty around project pipelines. Although it is too early to ascertain exact impact, sustained trade tensions will drive a shift in supply chains, potentially affecting long-term infrastructure and economic development plans. Currency volatility in some emerging markets is likely to increase uncertainty in the transaction pipeline, as governments put a hold on or delay projects with an eye to protecting their currencies or reducing government expenditure.
• Rising geopolitical tensions and a busy election cycle will increase investor caution. As major economic infrastructure is sometimes classified as a national strategic asset, sponsors and lenders are likely to have to work with increased caution around such assets. Increased geopolitical uncertainty and the pivot away from traditional alliances (in terms of sources of infrastructure financing as well as broader trade and political partnerships) are also likely to increase these sentiments. Many Asian economies will see national elections in 2019, which could add to investors’ caution.
In many ways, the sensitivities of the infrastructure pipeline in Asia to global fluctuations underline the long-term need for more local currency financing in the region, as well as support to deepen the local capital markets. However, aside from the shorter-term concerns impacting the financing pipeline, long-term structural issues around the bankability of projects in Asia remain, as underlying commercial issues hold back deals with private sector participation. Interviewees point to governments in developing Asia often mistakenly believe that PPP should shift all risk to the private sector, putting off private participants. Even when investors do get involved, they will factor in a premium that hikes up the costs of delivering the service.
In short, multilaterals and governments need to address these short-term concerns in the context of longer-term market improvements. Interviewees highlighted that power remains the key “bankable” sector, and its success is due to extensive work by multilaterals and governments to better crowd in private participation. However, challenges remain in other sectors. Despite the strong interest in renewables, it still needs support from development organizations and innovative mechanisms for the sector to reach the level of bankability that conventional power is currently at.
Institutions such as AIIB, ADB and the World Bank can play a crucial role here, not just by providing financial support but by offering overall assessments of project readiness and technical support. Given the scale of the infrastructure deficit and the financing gap, the technical role of MDBs in appraising and vetting projects is often an underappreciated one. Multilateral programs designed to increase local currency financing are also crucial to help mitigate the currency mismatch that frequently occurs in developing Asia, due to often-shallow capital markets. However, potential solutions—such as liquidity-focused derivative market strategies, derivative and debt capital market blended solutions, and sovereign- and multilateral-driven solutions—require a coordinated approach across the private sector,
1.5 Conclusion

17
development financial institutions, agencies and international organizations.25
In the longer term, bankability could be improved through use of smart technology, which is providing better ways of measuring use (and therefore revenue streams) of infrastructure, as well as reducing costs and supporting preventative/predictive maintenance. Much of this has been concentrated in the energy space—for example, Singapore’s smart grid initiative (which uses data analytics to predict demand and leverages remote sensors to track performance of the grid) and similar projects in Vietnam and Malaysia. Section 4.5 details the potential for technology to reshape infrastructure and supply chains.
In general, the demand for infrastructure in Asia remains so large that the long-term outlook remains positive in terms of activity and the financing pipeline. The need for infrastructure investment is after all tied up with broader goals to alleviate poverty and drive economic activity, such as through the tourism sector as shown in Section 4.4. Against the current macroeconomic backdrop, MDBs will play a critical role, given their ability to lend counter-cyclically, take longer-term exposures, and to reduce project risks (which is important in the context of investor caution due to perceived geopolitical or policy uncertainty). Greater risk sharing can help cushion the impact from increase in borrowing costs. Supporting governments and the private sector to sustain infrastructure investments in this challenging environment should be a focus for MDBs such as AIIB. The following sections discuss the outlook for infrastructure financing costs and activity in the context of global macroeconomic developments, as well impact on construction costs.

18

19
The eight infrastructure financing profiles contained in this section seek to provide a snapshot of the country-level infrastructure financing cost and activity landscape. Insights gathered through secondary research have been complemented by unique insights provided by country infrastructure financing experts.
Each country-financing profile opens with a table, highlighting some of the key infrastructure financing indicators, including: 10- and 20-year government bond yields; syndicated loan spreads (by sector and country average);vi estimates on the range of cost of debt (suggested by interviewees); and directional guidance on the outlook for the cost of infrastructure financing in the country in the next 12 months. Commentary then expands upon the table, discussing each of the key indicators and providing an accessible overview of
the domestic infrastructure financing landscape, including the ease of raising such financing on the domestic bond markets. Each profile also analyzes infrastructure financing activity in the country from 2016 to September 2018, based on IJGlobal infrastructure transaction data.vii The analysis categorizes transaction activity based on four key transaction milestones, including:
1. Transaction announcements.
2. From tender to financing.
3. Financial close.
4. Cancelations.
Four charts have been included in each profile, graphically highlighting changes in the level of infrastructure financing activity in the country (across sectors, transaction milestones, types of financing and time-series).
2.1 Introduction to country financing profiles
vi The analysis of syndicated loan spreads is based on Thomson Reuters data. In the analysis, coverage is limited to spreads for transac-tions that were financed in hard currencies (including USD, EUR, GBP and JPY) between 2017 and Q3 2018. The syndicated loan spreads represented in the country financing profiles are hence spreads over hard currency reference rate/s, averaged over the number of transactions. Where possible, greater granularity is provided by further disaggregating average spreads by sectors.
vii As mentioned in the introduction, transactions listed on the IJGlobal database do not cover the all infrastructure projects, across countries. The data is focused private infrastructure development, including PPPs and state-owned enterprises, with limited coverage of fiscally funded infrastructure development.
2 Infrastructure Financing Costs and Activity in Asia
20
2.2 Bangladesh
viii No relevant transactions available through 2017-Q3 2018.
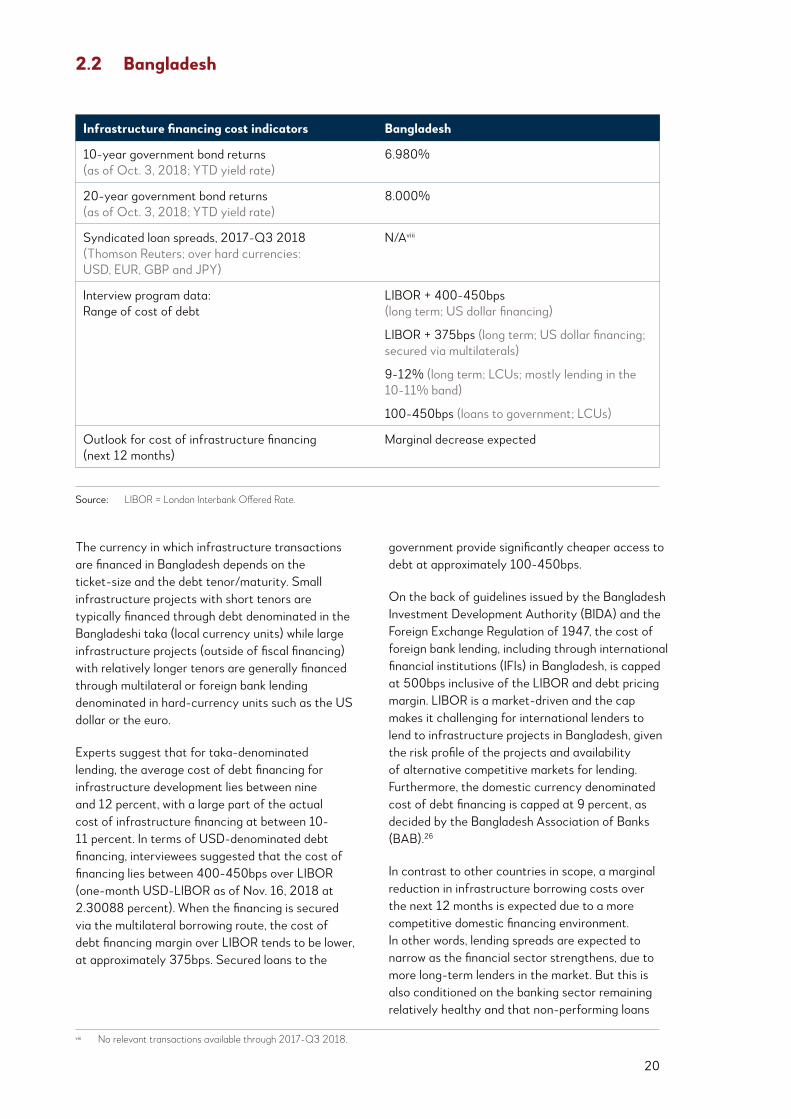
The currency in which infrastructure transactions are financed in Bangladesh depends on the ticket-size and the debt tenor/maturity. Small infrastructure projects with short tenors are typically financed through debt denominated in the Bangladeshi taka (local currency units) while large infrastructure projects (outside of fiscal financing) with relatively longer tenors are generally financed through multilateral or foreign bank lending denominated in hard-currency units such as the US dollar or the euro.
Experts suggest that for taka-denominated lending, the average cost of debt financing for infrastructure development lies between nine and 12 percent, with a large part of the actual cost of infrastructure financing at between 10-11 percent. In terms of USD-denominated debt financing, interviewees suggested that the cost of financing lies between 400-450bps over LIBOR (one-month USD-LIBOR as of Nov. 16, 2018 at 2.30088 percent). When the financing is secured via the multilateral borrowing route, the cost of debt financing margin over LIBOR tends to be lower, at approximately 375bps. Secured loans to the
government provide significantly cheaper access to debt at approximately 100-450bps.
On the back of guidelines issued by the Bangladesh Investment Development Authority (BIDA) and the Foreign Exchange Regulation of 1947, the cost of foreign bank lending, including through international financial institutions (IFIs) in Bangladesh, is capped at 500bps inclusive of the LIBOR and debt pricing margin. LIBOR is a market-driven and the cap makes it challenging for international lenders to lend to infrastructure projects in Bangladesh, given the risk profile of the projects and availability of alternative competitive markets for lending. Furthermore, the domestic currency denominated cost of debt financing is capped at 9 percent, as decided by the Bangladesh Association of Banks (BAB).26
In contrast to other countries in scope, a marginal reduction in infrastructure borrowing costs over the next 12 months is expected due to a more competitive domestic financing environment. In other words, lending spreads are expected to narrow as the financial sector strengthens, due to more long-term lenders in the market. But this is also conditioned on the banking sector remaining relatively healthy and that non-performing loans
Infrastructure financing cost indicators Bangladesh
10-year government bond returns (as of Oct. 3, 2018; YTD yield rate)
6.980%
20-year government bond returns (as of Oct. 3, 2018; YTD yield rate)
8.000%
Syndicated loan spreads, 2017-Q3 2018 (Thomson Reuters; over hard currencies: USD, EUR, GBP and JPY)
N/Aviii
Interview program data: Range of cost of debt
LIBOR + 400-450bps (long term; US dollar financing)
LIBOR + 375bps (long term; US dollar financing; secured via multilaterals)
9-12% (long term; LCUs; mostly lending in the 10-11% band)
100-450bps (loans to government; LCUs)
Outlook for cost of infrastructure financing (next 12 months)
Marginal decrease expected
Source: LIBOR = London Interbank Offered Rate.

21
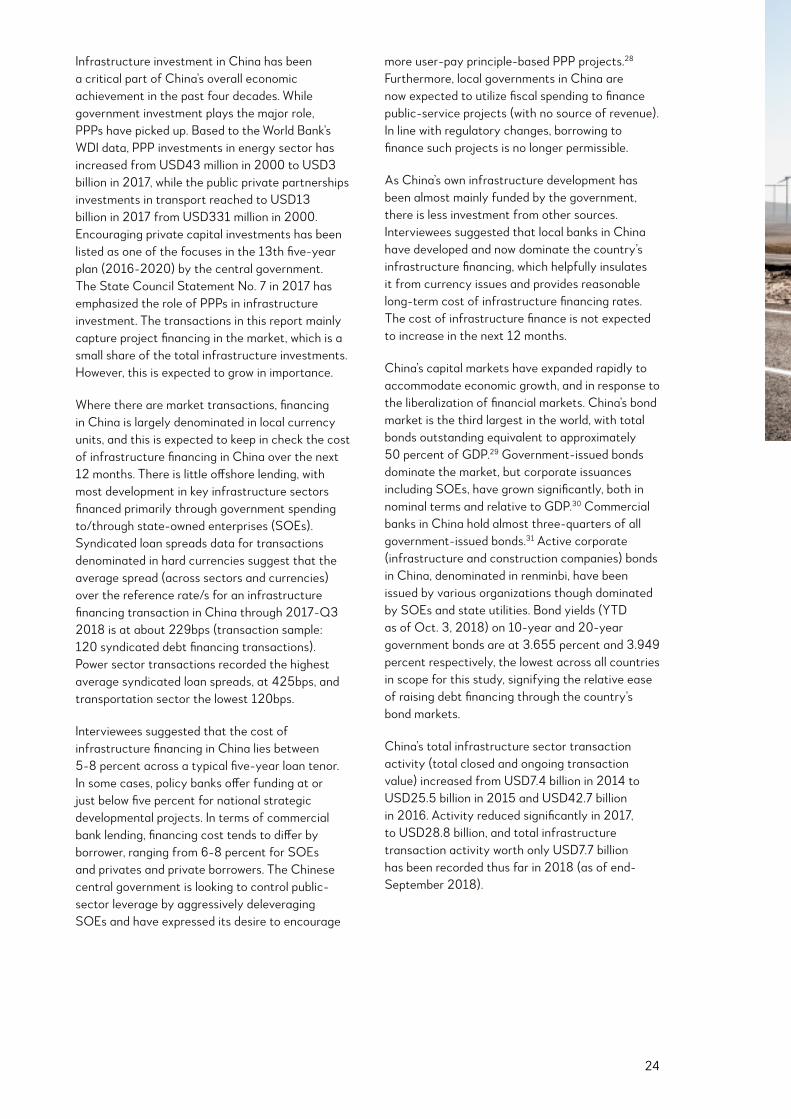
In 2014-2018, 36 infrastructure sector transactions reached financial close in Bangladesh (21 of which reached financial close in 2016-2018). Closed transactions in the past five years (see Figure 8) are dominated by transactions in the power and transportation sectors; with multisectoral transactions also representing a sizable section of all closed transactions. Fourteen transactions,
collectively worth USD9.8 billion, were in the power sector, with an average closed transaction size of USD702 million. Eight were in the transportation sector, collectively worth USD5.7 billion, with an average transaction size of USD718 million. Closed multisectoral transactions, across the same period, accounted for USD12.2 billion, with an average transaction size of USD1.8 billion.
remain under control. One interviewee warned that the exchange rate of the taka versus the USD makes financing more vulnerable although MDBs are expected to help with the hedging challenge.
Development financial institutions, along with China (the government and China Exim Bank), Japan (Japanese International Cooperation Agency) and India (Export-Import Bank of India) are the major funders of infrastructure development in the country, explaining the sizable number of multisectoral transactions through 2014-2018. Bond yields (YTD as of Oct. 3, 2018) on 10-year and 20-year government bonds are 6.98 percent and eight percent, respectively. Corporates in Bangladesh have not actively raised financing through the bond markets. The domestic
capital markets have only two listed corporate bonds (none linked to infrastructure/construction/state-owned utilities) and 221 listed government treasury bonds.27
Bangladesh’s “Vision 2021” road map, its plan to become a middle-income country by then, requires USD24.0 billion of infrastructure investment per year. There is some progress toward this target. Transaction activity (total closed and ongoing transaction value) was USD2.9 billion in 2014 and USD3.4 billion in 2015, but 2016 saw a massive jump to USD15.5 billion. This amount was more than doubled in 2017 (USD31.4 billion), increasing further to reach USD46.0 billion in 2018 (as of end-September 2018).
Figure 8: Value of closed transactions by sector—Bangladesh
-
5
10
15
2014 2015 2016 2017 Up to Q3 2018
USD billion
PowerWaterOther (Oil & Gas or Mining)
TransportTelecomsOther (Social & Defense)
RenewablesMultiple sectors
Note: 2018 data is as of September 2018.Source: IJGlobal.

22
Of the transactions that reached the announcement stages in 2016-2018 (collectively worth USD69.4 billion), public-sector finance transactions account for 65 percent (USD44.8 billion) and project finance transactions account for 35 percent (USD24.1 billion) of total pipeline value. In the 2016-2018 transaction pipeline, project finance transactions worth USD260 million lie between the tender and financing stages.
Type of financing differs significantly by sector. Although public-sector finance dominates infrastructure transaction value, in the Bangladeshi power sector, for example, project finance transactions account for a significant share (40
percent) of all closed transaction value through 2016-2018. By comparison, between 2016 and 2018, all closed transportation sector transaction value has been financed via public-sector financing. Power sector transactions worth USD37.9 billion were announced through 2016-2018, with project finance and public-sector finance accounting for 35 percent and 65 percent of transaction value respectively. Increasingly, transportation sector transactions announced through 2016-2018 are project finance transactions, with project financing accounting for 39 percent of all announced transportation activity. One oil and gas or mining transaction, worth USD2.0 billion, was canceled in 2018 (see Figure 9 and Figure 10).
Figure 9: Value of closed transactions by sector and finance type, from 2016 to September 2018—Bangladesh
-
5
10
15
20
25
Project Finance Public SectorFinance
Design-Build Corporate finance
USD billion
PowerWaterOther (Oil & Gas or Mining)
TransportTelecomsOther (Social & Defense)
RenewablesMultiple sectors
Source: IJGlobal.
Figure 10: Value of announcements (general and transaction) by sector and finance type, from 2016 to September 2018—Bangladesh
PowerWaterOther (Oil & Gas or Mining)
TransportTelecomsOther (Social & Defense)
RenewablesMultiple sectors
0
10
20
30
40
50
Project Finance Public SectorFinance
Design-Build Corporate finance
USD billion
Source: IJGlobal.Note: The Public Sector Finance category covers SOEs, and also includes transactions where 100 percent of the transaction debt
is provided by Development Finance Institutions (i.e., development banks, multilaterals or export credit agencies). Some SOE transactions are also recorded under Project Finance.

23
2.3 China
From 2016 to 2018, transactions reaching financial close account for 25 percent of the total activity, while transaction announcements account for 73 percent of the total transaction activity (see Figure 11). In terms of mode of financing, primary financing
(84 percent of all transaction value) and portfolio financing (13 percent) dominated all infrastructure activity through 2016-2018. During that time, no refinancing transactions were recorded.
Infrastructure financing cost indicators China
10-year government bond returns (as of Oct. 3, 2018; YTD yield rate)
3.655%
20-year government bond returns (as of Oct. 3, 2018; YTD yield rate)
3.949%
Syndicated loan spreads, 2017-Q3 2018 (Thomson Reuters; over hard currencies: USD, EUR, GBP and JPY)
Power: 425bpsTransport: 120bpsRenewables: 250bps Water: 210bpsOthers: 230bpsAverage across sectors: 229bps
Interview program data: Range of cost of debt
5-8% (5-year loan tenor; LCUs)
Approx. 5% (policy banks or national strategic development projects)
6–8% (commercial bank lending to private borrowers and SOEs; LCUs)
Outlook for cost of infrastructure financing (next 12 months)
Neutral
Figure 11: Pipeline of potential transactions by sector from 2016 to September 2018 in Bangladesh, USD billion
-
20
40
60
80
Announcementstage
From Tender to Financing
Financial close Canceled
USD billion
PowerWaterOther (Oil & Gas or Mining)
TransportTelecomsOther (Social & Defense)
RenewablesMultiple sectors
Source: IJGlobal.
Note: Figures in italics indicate fewer than five transactions between 2017 and Q3 2018.
24
Infrastructure investment in China has been a critical part of China’s overall economic achievement in the past four decades. While government investment plays the major role, PPPs have picked up. Based to the World Bank’s WDI data, PPP investments in energy sector has increased from USD43 million in 2000 to USD3 billion in 2017, while the public private partnerships investments in transport reached to USD13 billion in 2017 from USD331 million in 2000. Encouraging private capital investments has been listed as one of the focuses in the 13th five-year plan (2016-2020) by the central government. The State Council Statement No. 7 in 2017 has emphasized the role of PPPs in infrastructure investment. The transactions in this report mainly capture project financing in the market, which is a small share of the total infrastructure investments. However, this is expected to grow in importance.
Where there are market transactions, financing in China is largely denominated in local currency units, and this is expected to keep in check the cost of infrastructure financing in China over the next 12 months. There is little offshore lending, with most development in key infrastructure sectors financed primarily through government spending to/through state-owned enterprises (SOEs). Syndicated loan spreads data for transactions denominated in hard currencies suggest that the average spread (across sectors and currencies) over the reference rate/s for an infrastructure financing transaction in China through 2017-Q3 2018 is at about 229bps (transaction sample: 120 syndicated debt financing transactions). Power sector transactions recorded the highest average syndicated loan spreads, at 425bps, and transportation sector the lowest 120bps.
Interviewees suggested that the cost of infrastructure financing in China lies between 5-8 percent across a typical five-year loan tenor. In some cases, policy banks offer funding at or just below five percent for national strategic developmental projects. In terms of commercial bank lending, financing cost tends to differ by borrower, ranging from 6-8 percent for SOEs and privates and private borrowers. The Chinese central government is looking to control public-sector leverage by aggressively deleveraging SOEs and have expressed its desire to encourage
more user-pay principle-based PPP projects.28 Furthermore, local governments in China are now expected to utilize fiscal spending to finance public-service projects (with no source of revenue). In line with regulatory changes, borrowing to finance such projects is no longer permissible.
As China’s own infrastructure development has been almost mainly funded by the government, there is less investment from other sources. Interviewees suggested that local banks in China have developed and now dominate the country’s infrastructure financing, which helpfully insulates it from currency issues and provides reasonable long-term cost of infrastructure financing rates. The cost of infrastructure finance is not expected to increase in the next 12 months.
China’s capital markets have expanded rapidly to accommodate economic growth, and in response to the liberalization of financial markets. China’s bond market is the third largest in the world, with total bonds outstanding equivalent to approximately 50 percent of GDP.29 Government-issued bonds dominate the market, but corporate issuances including SOEs, have grown significantly, both in nominal terms and relative to GDP.30 Commercial banks in China hold almost three-quarters of all government-issued bonds.31 Active corporate (infrastructure and construction companies) bonds in China, denominated in renminbi, have been issued by various organizations though dominated by SOEs and state utilities. Bond yields (YTD as of Oct. 3, 2018) on 10-year and 20-year government bonds are at 3.655 percent and 3.949 percent respectively, the lowest across all countries in scope for this study, signifying the relative ease of raising debt financing through the country’s bond markets.
China’s total infrastructure sector transaction activity (total closed and ongoing transaction value) increased from USD7.4 billion in 2014 to USD25.5 billion in 2015 and USD42.7 billion in 2016. Activity reduced significantly in 2017, to USD28.8 billion, and total infrastructure transaction activity worth only USD7.7 billion has been recorded thus far in 2018 (as of end-September 2018).
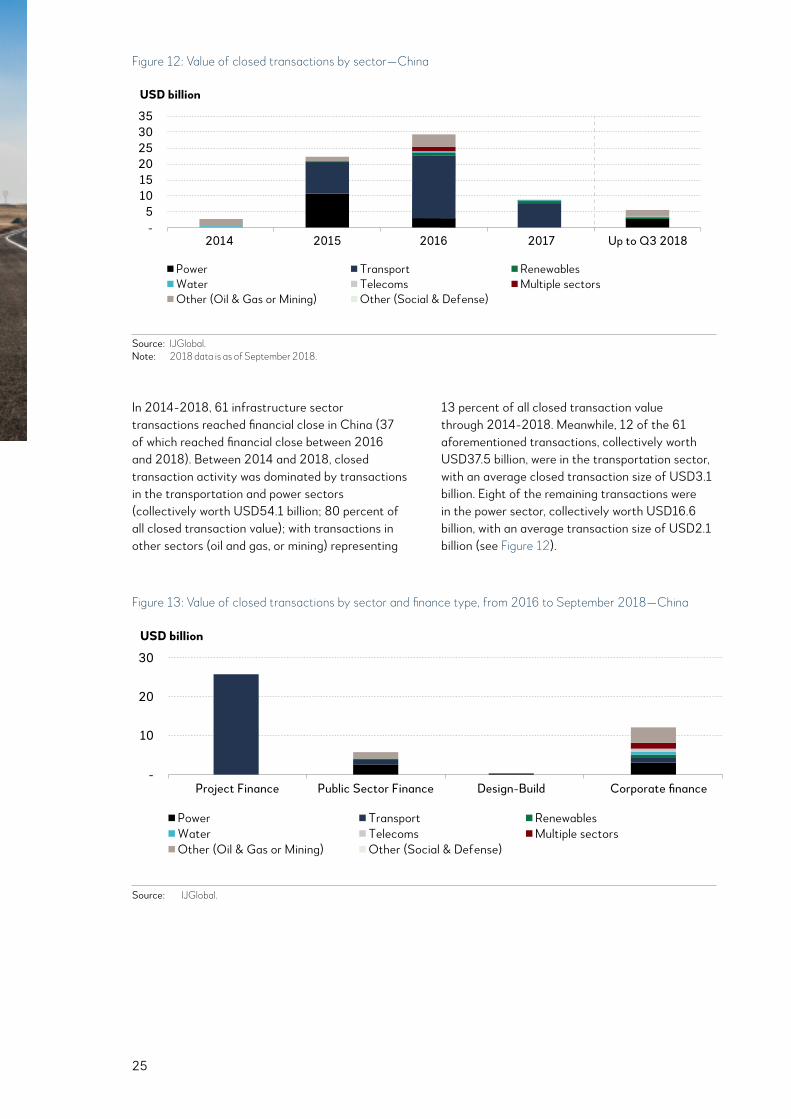
25
In 2014-2018, 61 infrastructure sector transactions reached financial close in China (37 of which reached financial close between 2016 and 2018). Between 2014 and 2018, closed transaction activity was dominated by transactions in the transportation and power sectors (collectively worth USD54.1 billion; 80 percent of all closed transaction value); with transactions in other sectors (oil and gas, or mining) representing
13 percent of all closed transaction value through 2014-2018. Meanwhile, 12 of the 61 aforementioned transactions, collectively worth USD37.5 billion, were in the transportation sector, with an average closed transaction size of USD3.1 billion. Eight of the remaining transactions were in the power sector, collectively worth USD16.6 billion, with an average transaction size of USD2.1 billion (see Figure 12).
Figure 12: Value of closed transactions by sector—China
Note: 2018 data is as of September 2018. Source: IJGlobal.
353025201510
5-
2014 2015 2016 2017 Up to Q3 2018
USD billion
PowerWaterOther (Oil & Gas or Mining)
TransportTelecomsOther (Social & Defense)
RenewablesMultiple sectors
Source: IJGlobal.Note: 2018 data is as of September 2018.
Figure 13: Value of closed transactions by sector and finance type, from 2016 to September 2018—China
PowerWaterOther (Oil & Gas or Mining)
TransportTelecomsOther (Social & Defense)
RenewablesMultiple sectors
Source: IJGlobal.
-
10
20
30
Project Finance Public Sector Finance Design-Build Corporate finance
USD billion
Source: IJGlobal.
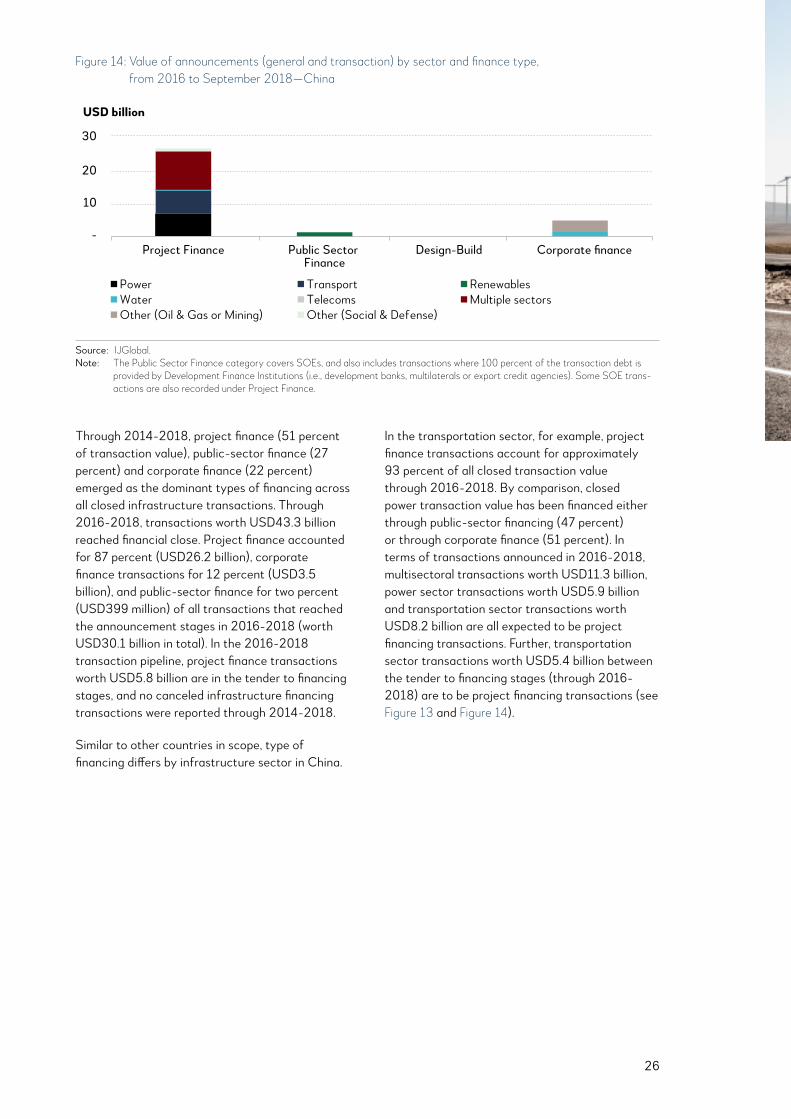
26
Through 2014-2018, project finance (51 percent of transaction value), public-sector finance (27 percent) and corporate finance (22 percent) emerged as the dominant types of financing across all closed infrastructure transactions. Through 2016-2018, transactions worth USD43.3 billion reached financial close. Project finance accounted for 87 percent (USD26.2 billion), corporate finance transactions for 12 percent (USD3.5 billion), and public-sector finance for two percent (USD399 million) of all transactions that reached the announcement stages in 2016-2018 (worth USD30.1 billion in total). In the 2016-2018 transaction pipeline, project finance transactions worth USD5.8 billion are in the tender to financing stages, and no canceled infrastructure financing transactions were reported through 2014-2018.
Similar to other countries in scope, type of financing differs by infrastructure sector in China.
In the transportation sector, for example, project finance transactions account for approximately 93 percent of all closed transaction value through 2016-2018. By comparison, closed power transaction value has been financed either through public-sector financing (47 percent) or through corporate finance (51 percent). In terms of transactions announced in 2016-2018, multisectoral transactions worth USD11.3 billion, power sector transactions worth USD5.9 billion and transportation sector transactions worth USD8.2 billion are all expected to be project financing transactions. Further, transportation sector transactions worth USD5.4 billion between the tender to financing stages (through 2016-2018) are to be project financing transactions (see Figure 13 and Figure 14).
Figure 14: Value of announcements (general and transaction) by sector and finance type, from 2016 to September 2018—China
USD billion
PowerWaterOther (Oil & Gas or Mining)
TransportTelecomsOther (Social & Defense)
RenewablesMultiple sectors
Source: IJGlobal.
-
10
20
30
Project Finance Public Sector Finance
Design-Build Corporate finance
Source: IJGlobal.Note: The Public Sector Finance category covers SOEs, and also includes transactions where 100 percent of the transaction debt is
provided by Development Finance Institutions (i.e., development banks, multilaterals or export credit agencies). Some SOE trans-actions are also recorded under Project Finance.
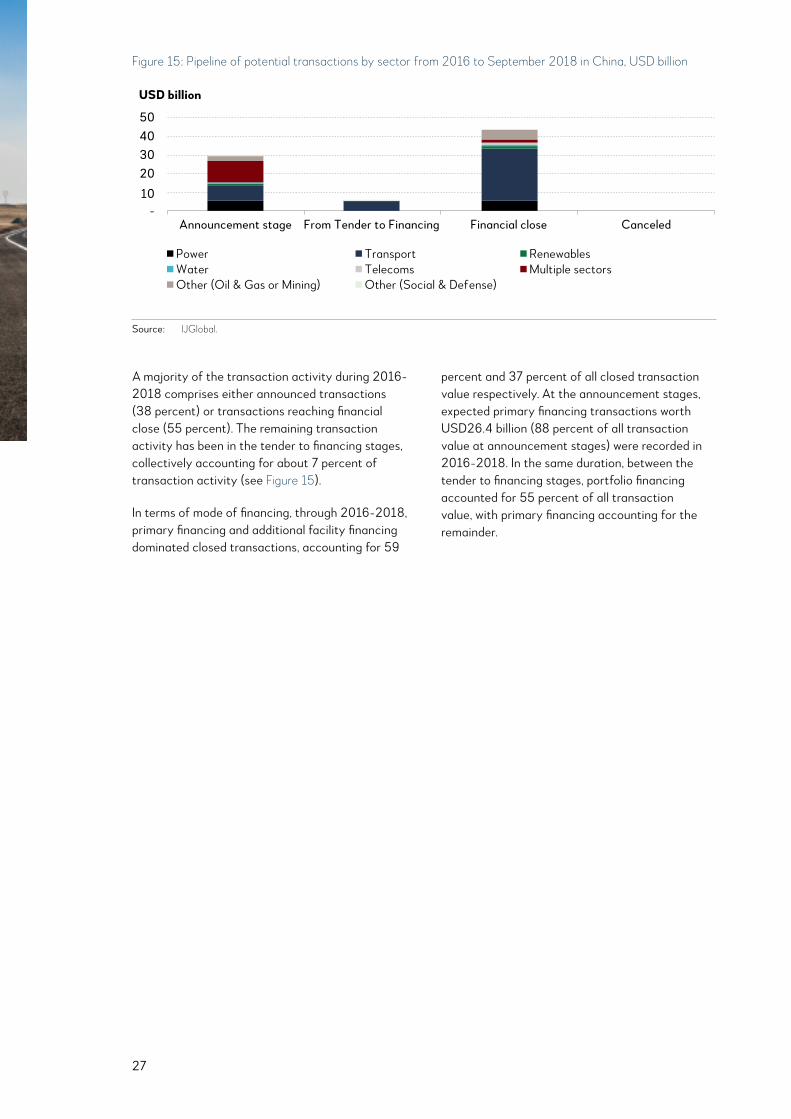
27
A majority of the transaction activity during 2016-2018 comprises either announced transactions (38 percent) or transactions reaching financial close (55 percent). The remaining transaction activity has been in the tender to financing stages, collectively accounting for about 7 percent of transaction activity (see Figure 15).
In terms of mode of financing, through 2016-2018, primary financing and additional facility financing dominated closed transactions, accounting for 59
percent and 37 percent of all closed transaction value respectively. At the announcement stages, expected primary financing transactions worth USD26.4 billion (88 percent of all transaction value at announcement stages) were recorded in 2016-2018. In the same duration, between the tender to financing stages, portfolio financing accounted for 55 percent of all transaction value, with primary financing accounting for the remainder.
Figure 15: Pipeline of potential transactions by sector from 2016 to September 2018 in China, USD billion
USD billion
PowerWaterOther (Oil & Gas or Mining)
TransportTelecomsOther (Social & Defense)
RenewablesMultiple sectors
Source: IJGlobal.
-10
2030
5040
Announcement stage From Tender to Financing Financial close Canceled
Source: IJGlobal.
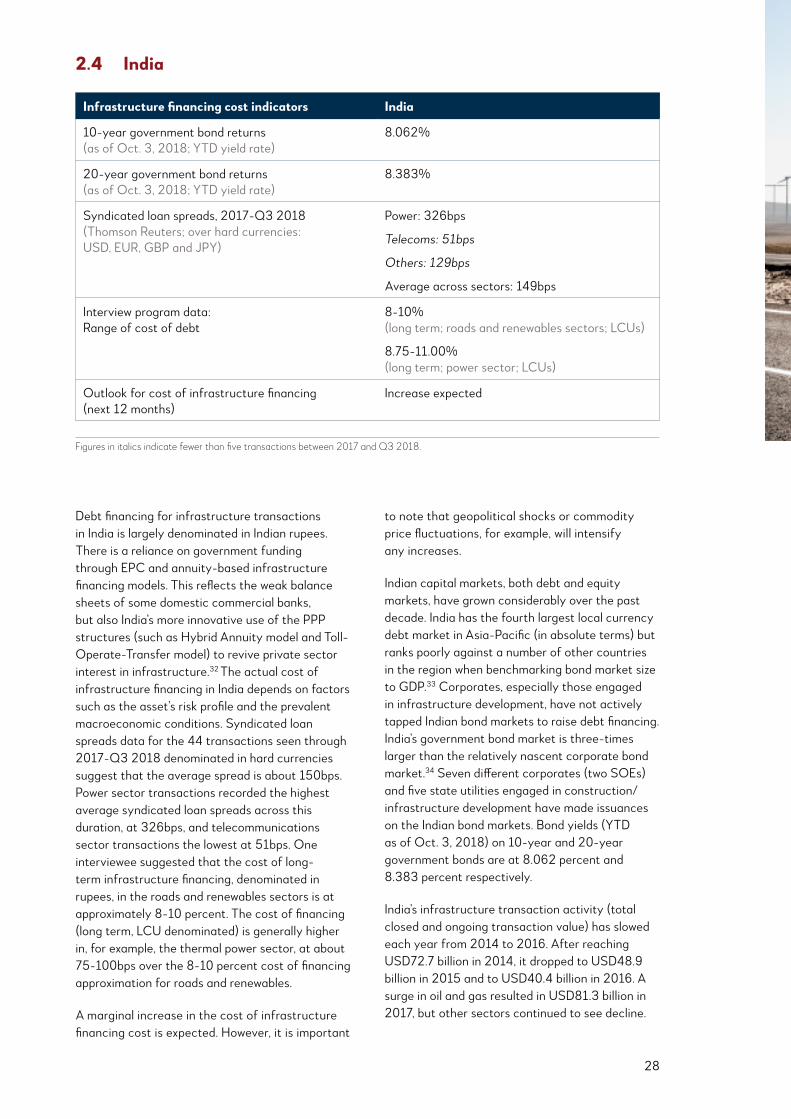
28
Debt financing for infrastructure transactions in India is largely denominated in Indian rupees. There is a reliance on government funding through EPC and annuity-based infrastructure financing models. This reflects the weak balance sheets of some domestic commercial banks, but also India’s more innovative use of the PPP structures (such as Hybrid Annuity model and Toll-Operate-Transfer model) to revive private sector interest in infrastructure.32 The actual cost of infrastructure financing in India depends on factors such as the asset’s risk profile and the prevalent macroeconomic conditions. Syndicated loan spreads data for the 44 transactions seen through 2017-Q3 2018 denominated in hard currencies suggest that the average spread is about 150bps. Power sector transactions recorded the highest average syndicated loan spreads across this duration, at 326bps, and telecommunications sector transactions the lowest at 51bps. One interviewee suggested that the cost of long-term infrastructure financing, denominated in rupees, in the roads and renewables sectors is at approximately 8-10 percent. The cost of financing (long term, LCU denominated) is generally higher in, for example, the thermal power sector, at about 75-100bps over the 8-10 percent cost of financing approximation for roads and renewables.
A marginal increase in the cost of infrastructure financing cost is expected. However, it is important
to note that geopolitical shocks or commodity price fluctuations, for example, will intensify any increases.
Indian capital markets, both debt and equity markets, have grown considerably over the past decade. India has the fourth largest local currency debt market in Asia-Pacific (in absolute terms) but ranks poorly against a number of other countries in the region when benchmarking bond market size to GDP.33 Corporates, especially those engaged in infrastructure development, have not actively tapped Indian bond markets to raise debt financing. India’s government bond market is three-times larger than the relatively nascent corporate bond market.34 Seven different corporates (two SOEs) and five state utilities engaged in construction/infrastructure development have made issuances on the Indian bond markets. Bond yields (YTD as of Oct. 3, 2018) on 10-year and 20-year government bonds are at 8.062 percent and 8.383 percent respectively.
India’s infrastructure transaction activity (total closed and ongoing transaction value) has slowed each year from 2014 to 2016. After reaching USD72.7 billion in 2014, it dropped to USD48.9 billion in 2015 and to USD40.4 billion in 2016. A surge in oil and gas resulted in USD81.3 billion in 2017, but other sectors continued to see decline.
2.4 India
Infrastructure financing cost indicators India
10-year government bond returns (as of Oct. 3, 2018; YTD yield rate)
8.062%
20-year government bond returns (as of Oct. 3, 2018; YTD yield rate)
8.383%
Syndicated loan spreads, 2017-Q3 2018 (Thomson Reuters; over hard currencies: USD, EUR, GBP and JPY)
Power: 326bps
Telecoms: 51bps
Others: 129bps
Average across sectors: 149bps
Interview program data: Range of cost of debt
8-10% (long term; roads and renewables sectors; LCUs)
8.75-11.00% (long term; power sector; LCUs)
Outlook for cost of infrastructure financing (next 12 months)
Increase expected
Figures in italics indicate fewer than five transactions between 2017 and Q3 2018.

29
In 2014-2018, 262 infrastructure sector transactions reached financial close in India (95 of which reached financial close through 2016-2018). In the past five years, closed transaction activity was dominated by transactions in the oil and gas, or mining sectors (collectively worth USD43.4 billion; 37 percent of all closed transaction value), with transactions in the power sector accounting for USD29.2 billion, representing 25 percent of all closed transaction value, and transactions in the transportation sector accounting for USD15.3 billion and representing 13 percent of closed transaction value. Transactions in the power sector
averaged USD512 million per transaction, while those in transportation had an average transaction size of USD240 million.
Interviewees noted that sectors including urban transport and waste-to-energy were expected to grow. However, as transport projects are not usually availability-based (paid for performance irrespective of demand), they carry a volume risk, which is difficult for project developers to handle. To mitigate the risk, there needs to be some form of support mechanism from the Indian government.
Figure 16: Value of closed transactions by sector—India
Note: 2018 data is as of September 2018. Source: IJGlobal.
353025201510
5-
2014 2015 2016 2017 Up to Q3 2018
USD billion
PowerWaterOther (Oil & Gas or Mining)
TransportTelecomsOther (Social & Defense)
RenewablesMultiple sectors
Note: 2018 data is as of September 2018.Source: IJGlobal.
Figure 17: Value of closed transactions by sector and finance type, from 2016 to September 2018—India
PowerWaterOther (Oil & Gas or Mining)
TransportTelecomsOther (Social & Defense)
RenewablesMultiple sectors
Source: IJGlobal.
-
10
20
30
40
Project Finance Public Sector Finance Design-Build Corporate finance
USD billion
Source: IJGlobal.
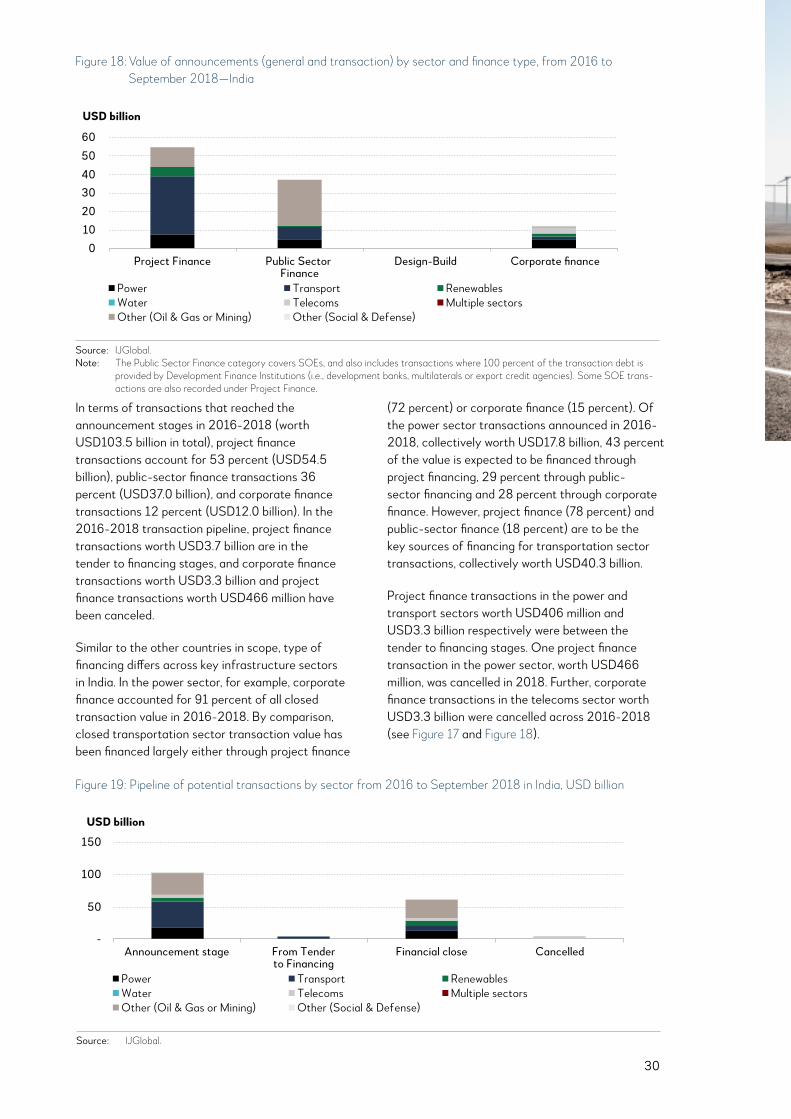
30
In terms of transactions that reached the announcement stages in 2016-2018 (worth USD103.5 billion in total), project finance transactions account for 53 percent (USD54.5 billion), public-sector finance transactions 36 percent (USD37.0 billion), and corporate finance transactions 12 percent (USD12.0 billion). In the 2016-2018 transaction pipeline, project finance transactions worth USD3.7 billion are in the tender to financing stages, and corporate finance transactions worth USD3.3 billion and project finance transactions worth USD466 million have been canceled.
Similar to the other countries in scope, type of financing differs across key infrastructure sectors in India. In the power sector, for example, corporate finance accounted for 91 percent of all closed transaction value in 2016-2018. By comparison, closed transportation sector transaction value has been financed largely either through project finance
(72 percent) or corporate finance (15 percent). Of the power sector transactions announced in 2016-2018, collectively worth USD17.8 billion, 43 percent of the value is expected to be financed through project financing, 29 percent through public-sector financing and 28 percent through corporate finance. However, project finance (78 percent) and public-sector finance (18 percent) are to be the key sources of financing for transportation sector transactions, collectively worth USD40.3 billion.
Project finance transactions in the power and transport sectors worth USD406 million and USD3.3 billion respectively were between the tender to financing stages. One project finance transaction in the power sector, worth USD466 million, was cancelled in 2018. Further, corporate finance transactions in the telecoms sector worth USD3.3 billion were cancelled across 2016-2018 (see Figure 17 and Figure 18).
Figure 19: Pipeline of potential transactions by sector from 2016 to September 2018 in India, USD billion
USD billion
PowerWaterOther (Oil & Gas or Mining)
TransportTelecomsOther (Social & Defense)
RenewablesMultiple sectors
Source: IJGlobal.
-
50
100
150
Announcement stage From Tenderto Financing
Financial close Cancelled
Figure 18: Value of announcements (general and transaction) by sector and finance type, from 2016 to September 2018—India
USD billion
PowerWaterOther (Oil & Gas or Mining)
TransportTelecomsOther (Social & Defense)
RenewablesMultiple sectors
Note: The Public Sector Finance category covers SOEs, and also includes transactions where 100 percent of the transaction debt is provided by Development Finance Institutions (i.e., development banks, multilaterals or export credit agencies). Some SOE transactions are also recorded under Project Finance. Source: IJGlobal.
0
10
20
30
40
50
60
Project Finance Public Sector Finance
Design-Build Corporate finance
Source: IJGlobal.
Source: IJGlobal.Note: The Public Sector Finance category covers SOEs, and also includes transactions where 100 percent of the transaction debt is
provided by Development Finance Institutions (i.e., development banks, multilaterals or export credit agencies). Some SOE trans-actions are also recorded under Project Finance.
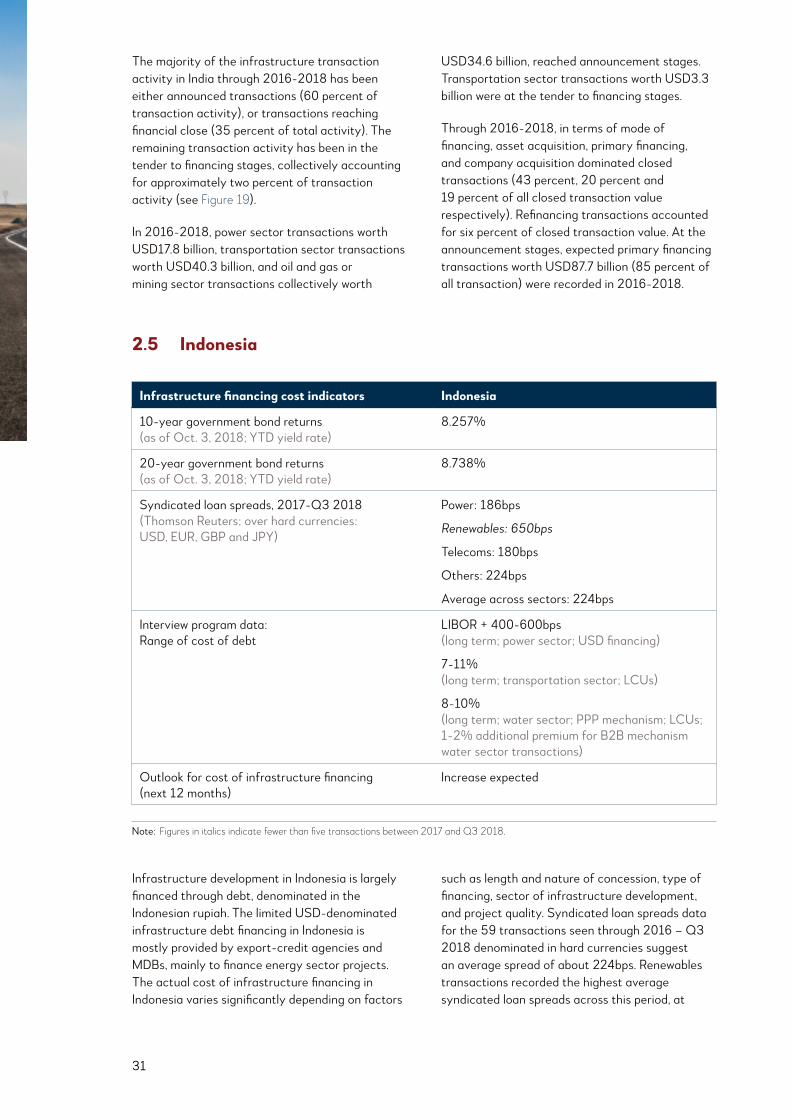
31
Infrastructure development in Indonesia is largely financed through debt, denominated in the Indonesian rupiah. The limited USD-denominated infrastructure debt financing in Indonesia is mostly provided by export-credit agencies and MDBs, mainly to finance energy sector projects. The actual cost of infrastructure financing in Indonesia varies significantly depending on factors
such as length and nature of concession, type of financing, sector of infrastructure development, and project quality. Syndicated loan spreads data for the 59 transactions seen through 2016 – Q3 2018 denominated in hard currencies suggest an average spread of about 224bps. Renewables transactions recorded the highest average syndicated loan spreads across this period, at
2.5 Indonesia
The majority of the infrastructure transaction activity in India through 2016-2018 has been either announced transactions (60 percent of transaction activity), or transactions reaching financial close (35 percent of total activity). The remaining transaction activity has been in the tender to financing stages, collectively accounting for approximately two percent of transaction activity (see Figure 19).
In 2016-2018, power sector transactions worth USD17.8 billion, transportation sector transactions worth USD40.3 billion, and oil and gas or mining sector transactions collectively worth
USD34.6 billion, reached announcement stages. Transportation sector transactions worth USD3.3 billion were at the tender to financing stages.
Through 2016-2018, in terms of mode of financing, asset acquisition, primary financing, and company acquisition dominated closed transactions (43 percent, 20 percent and 19 percent of all closed transaction value respectively). Refinancing transactions accounted for six percent of closed transaction value. At the announcement stages, expected primary financing transactions worth USD87.7 billion (85 percent of all transaction) were recorded in 2016-2018.
Infrastructure financing cost indicators Indonesia
10-year government bond returns (as of Oct. 3, 2018; YTD yield rate)
8.257%
20-year government bond returns (as of Oct. 3, 2018; YTD yield rate)
8.738%
Syndicated loan spreads, 2017-Q3 2018 (Thomson Reuters; over hard currencies: USD, EUR, GBP and JPY)
Power: 186bps
Renewables: 650bps
Telecoms: 180bps
Others: 224bps
Average across sectors: 224bps
Interview program data: Range of cost of debt
LIBOR + 400-600bps (long term; power sector; USD financing)
7-11% (long term; transportation sector; LCUs)
8-10% (long term; water sector; PPP mechanism; LCUs; 1-2% additional premium for B2B mechanism water sector transactions)
Outlook for cost of infrastructure financing (next 12 months)
Increase expected
Note: Figures in italics indicate fewer than five transactions between 2017 and Q3 2018.
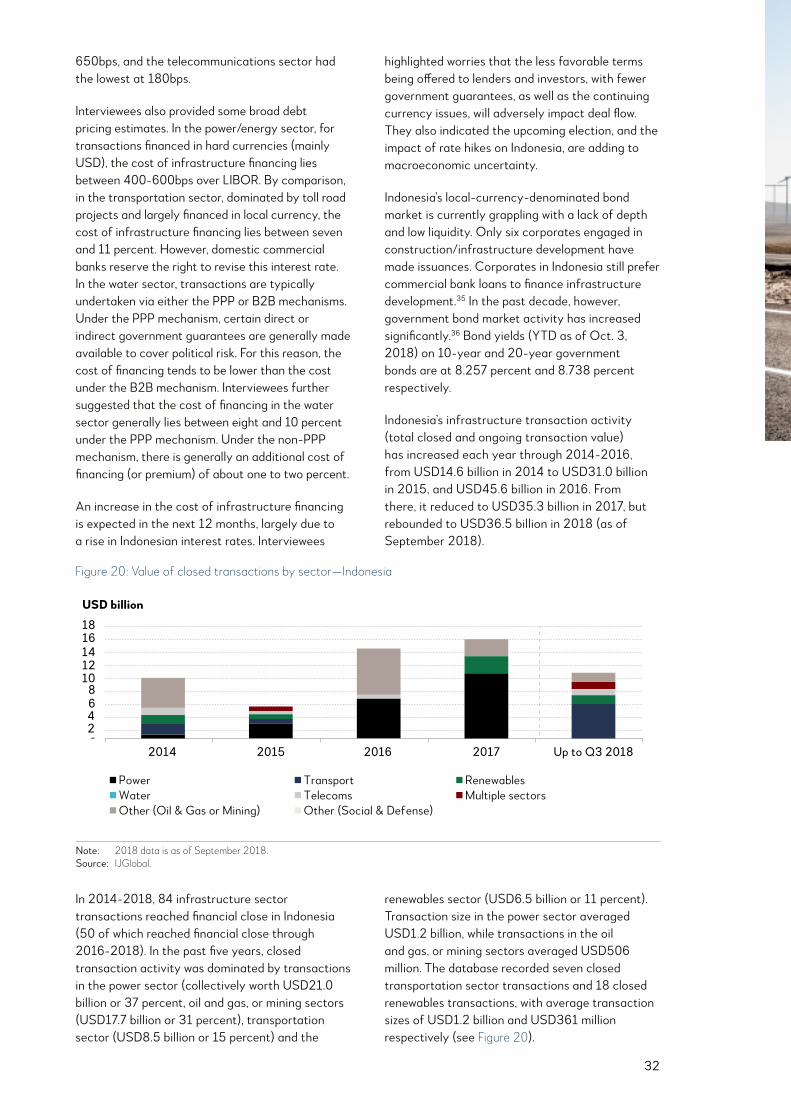
32
650bps, and the telecommunications sector had the lowest at 180bps.
Interviewees also provided some broad debt pricing estimates. In the power/energy sector, for transactions financed in hard currencies (mainly USD), the cost of infrastructure financing lies between 400-600bps over LIBOR. By comparison, in the transportation sector, dominated by toll road projects and largely financed in local currency, the cost of infrastructure financing lies between seven and 11 percent. However, domestic commercial banks reserve the right to revise this interest rate. In the water sector, transactions are typically undertaken via either the PPP or B2B mechanisms. Under the PPP mechanism, certain direct or indirect government guarantees are generally made available to cover political risk. For this reason, the cost of financing tends to be lower than the cost under the B2B mechanism. Interviewees further suggested that the cost of financing in the water sector generally lies between eight and 10 percent under the PPP mechanism. Under the non-PPP mechanism, there is generally an additional cost of financing (or premium) of about one to two percent.
An increase in the cost of infrastructure financing is expected in the next 12 months, largely due to a rise in Indonesian interest rates. Interviewees
highlighted worries that the less favorable terms being offered to lenders and investors, with fewer government guarantees, as well as the continuing currency issues, will adversely impact deal flow. They also indicated the upcoming election, and the impact of rate hikes on Indonesia, are adding to macroeconomic uncertainty.
Indonesia’s local-currency-denominated bond market is currently grappling with a lack of depth and low liquidity. Only six corporates engaged in construction/infrastructure development have made issuances. Corporates in Indonesia still prefer commercial bank loans to finance infrastructure development.35 In the past decade, however, government bond market activity has increased significantly.36 Bond yields (YTD as of Oct. 3, 2018) on 10-year and 20-year government bonds are at 8.257 percent and 8.738 percent respectively.
Indonesia’s infrastructure transaction activity (total closed and ongoing transaction value) has increased each year through 2014-2016, from USD14.6 billion in 2014 to USD31.0 billion in 2015, and USD45.6 billion in 2016. From there, it reduced to USD35.3 billion in 2017, but rebounded to USD36.5 billion in 2018 (as of September 2018).
In 2014-2018, 84 infrastructure sector transactions reached financial close in Indonesia (50 of which reached financial close through 2016-2018). In the past five years, closed transaction activity was dominated by transactions in the power sector (collectively worth USD21.0 billion or 37 percent, oil and gas, or mining sectors (USD17.7 billion or 31 percent), transportation sector (USD8.5 billion or 15 percent) and the
renewables sector (USD6.5 billion or 11 percent). Transaction size in the power sector averaged USD1.2 billion, while transactions in the oil and gas, or mining sectors averaged USD506 million. The database recorded seven closed transportation sector transactions and 18 closed renewables transactions, with average transaction sizes of USD1.2 billion and USD361 million respectively (see Figure 20).
Figure 20: Value of closed transactions by sector—Indonesia
Note: 2018 data is as of September 2018. Source: IJGlobal.
-
16141210
8642
18
2014 2015 2016 2017 Up to Q3 2018
USD billion
PowerWaterOther (Oil & Gas or Mining)
TransportTelecomsOther (Social & Defense)
RenewablesMultiple sectors
Note: 2018 data is as of September 2018.Source: IJGlobal.
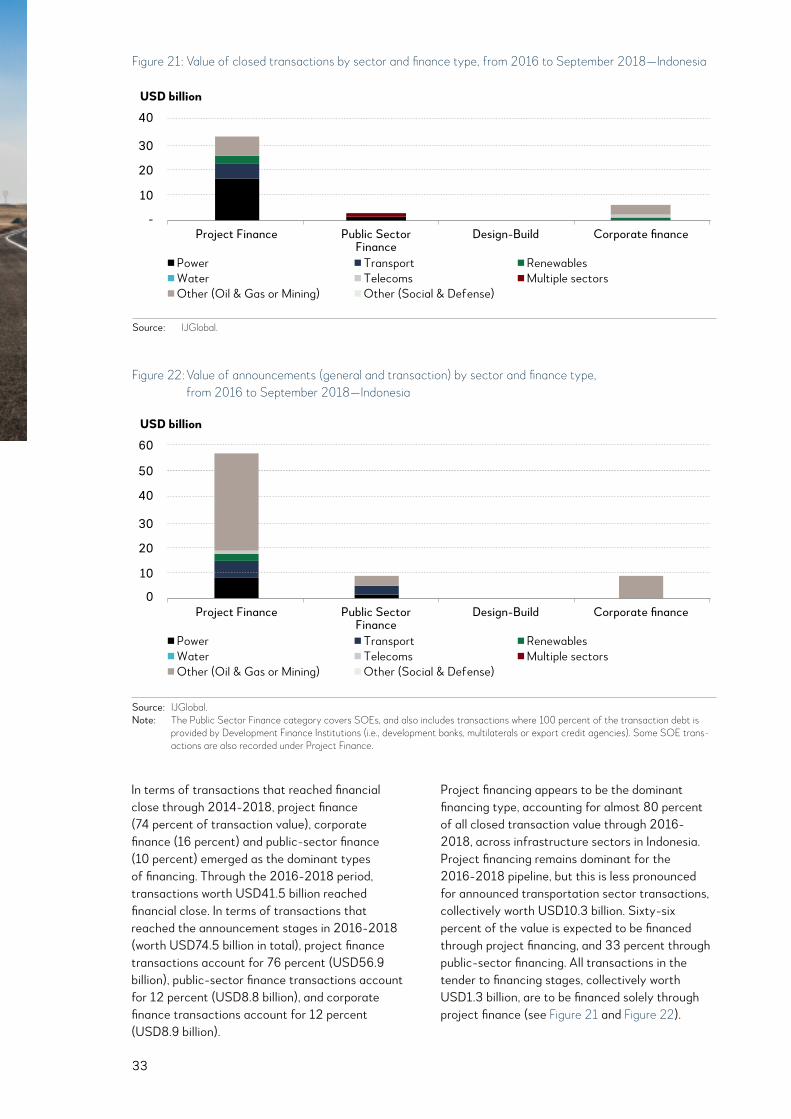
33
In terms of transactions that reached financial close through 2014-2018, project finance (74 percent of transaction value), corporate finance (16 percent) and public-sector finance (10 percent) emerged as the dominant types of financing. Through the 2016-2018 period, transactions worth USD41.5 billion reached financial close. In terms of transactions that reached the announcement stages in 2016-2018 (worth USD74.5 billion in total), project finance transactions account for 76 percent (USD56.9 billion), public-sector finance transactions account for 12 percent (USD8.8 billion), and corporate finance transactions account for 12 percent (USD8.9 billion).
Project financing appears to be the dominant financing type, accounting for almost 80 percent of all closed transaction value through 2016-2018, across infrastructure sectors in Indonesia. Project financing remains dominant for the 2016-2018 pipeline, but this is less pronounced for announced transportation sector transactions, collectively worth USD10.3 billion. Sixty-six percent of the value is expected to be financed through project financing, and 33 percent through public-sector financing. All transactions in the tender to financing stages, collectively worth USD1.3 billion, are to be financed solely through project finance (see Figure 21 and Figure 22).
Figure 21: Value of closed transactions by sector and finance type, from 2016 to September 2018—Indonesia
-
10
20
30
40
USD billion
PowerWaterOther (Oil & Gas or Mining)
TransportTelecomsOther (Social & Defense)
RenewablesMultiple sectors
Source: IJGlobal.
Project Finance Public SectorFinance
Design-Build Corporate finance
Source: IJGlobal.
PowerWaterOther (Oil & Gas or Mining)
TransportTelecomsOther (Social & Defense)
RenewablesMultiple sectors
Project Finance Public SectorFinance
Design-Build Corporate finance 0
10
20
30
40
50
60
USD billion
Figure 22: Value of announcements (general and transaction) by sector and finance type, from 2016 to September 2018—Indonesia
Source: IJGlobal.Note: The Public Sector Finance category covers SOEs, and also includes transactions where 100 percent of the transaction debt is
provided by Development Finance Institutions (i.e., development banks, multilaterals or export credit agencies). Some SOE trans-actions are also recorded under Project Finance.
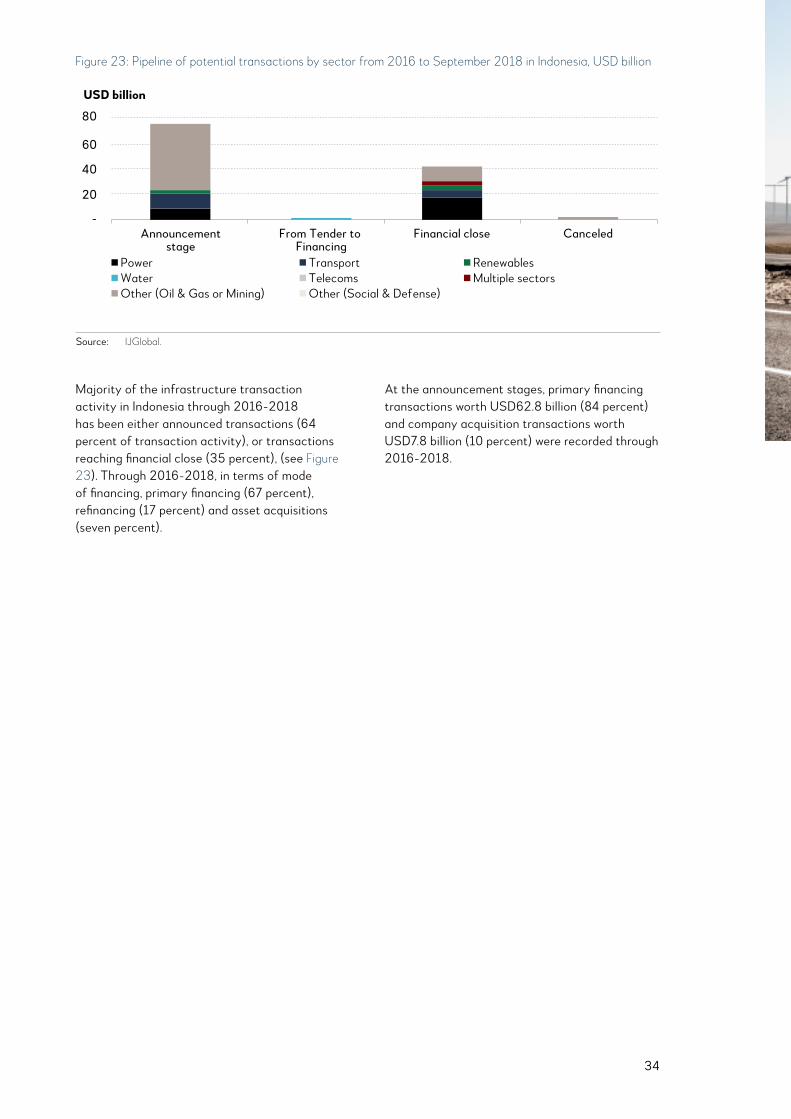
34
Majority of the infrastructure transaction activity in Indonesia through 2016-2018 has been either announced transactions (64 percent of transaction activity), or transactions reaching financial close (35 percent), (see Figure 23). Through 2016-2018, in terms of mode of financing, primary financing (67 percent), refinancing (17 percent) and asset acquisitions (seven percent).
At the announcement stages, primary financing transactions worth USD62.8 billion (84 percent) and company acquisition transactions worth USD7.8 billion (10 percent) were recorded through 2016-2018.
Figure 23: Pipeline of potential transactions by sector from 2016 to September 2018 in Indonesia, USD billion
-
20
40
60
80
Announcementstage
From Tender to Financing
Financial close Canceled
USD billion
PowerWaterOther (Oil & Gas or Mining)
TransportTelecomsOther (Social & Defense)
RenewablesMultiple sectors
Source: IJGlobal. Source: IJGlobal.
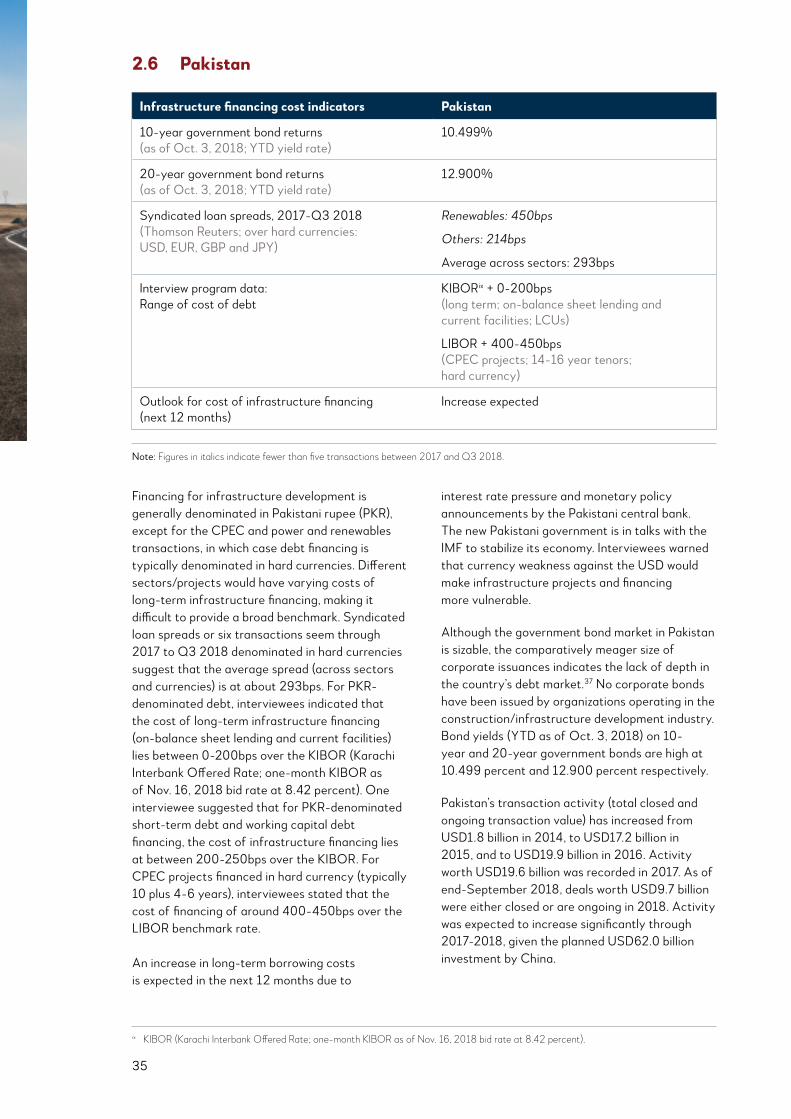
35
Financing for infrastructure development is generally denominated in Pakistani rupee (PKR), except for the CPEC and power and renewables transactions, in which case debt financing is typically denominated in hard currencies. Different sectors/projects would have varying costs of long-term infrastructure financing, making it difficult to provide a broad benchmark. Syndicated loan spreads or six transactions seem through 2017 to Q3 2018 denominated in hard currencies suggest that the average spread (across sectors and currencies) is at about 293bps. For PKR-denominated debt, interviewees indicated that the cost of long-term infrastructure financing (on-balance sheet lending and current facilities) lies between 0-200bps over the KIBOR (Karachi Interbank Offered Rate; one-month KIBOR as of Nov. 16, 2018 bid rate at 8.42 percent). One interviewee suggested that for PKR-denominated short-term debt and working capital debt financing, the cost of infrastructure financing lies at between 200-250bps over the KIBOR. For CPEC projects financed in hard currency (typically 10 plus 4-6 years), interviewees stated that the cost of financing of around 400-450bps over the LIBOR benchmark rate. An increase in long-term borrowing costs is expected in the next 12 months due to
interest rate pressure and monetary policy announcements by the Pakistani central bank. The new Pakistani government is in talks with the IMF to stabilize its economy. Interviewees warned that currency weakness against the USD would make infrastructure projects and financing more vulnerable.
Although the government bond market in Pakistan is sizable, the comparatively meager size of corporate issuances indicates the lack of depth in the country’s debt market.37 No corporate bonds have been issued by organizations operating in the construction/infrastructure development industry. Bond yields (YTD as of Oct. 3, 2018) on 10-year and 20-year government bonds are high at 10.499 percent and 12.900 percent respectively.
Pakistan’s transaction activity (total closed and ongoing transaction value) has increased from USD1.8 billion in 2014, to USD17.2 billion in 2015, and to USD19.9 billion in 2016. Activity worth USD19.6 billion was recorded in 2017. As of end-September 2018, deals worth USD9.7 billion were either closed or are ongoing in 2018. Activity was expected to increase significantly through 2017-2018, given the planned USD62.0 billion investment by China.
2.6 Pakistan
ix KIBOR (Karachi Interbank Offered Rate; one-month KIBOR as of Nov. 16, 2018 bid rate at 8.42 percent).
Infrastructure financing cost indicators Pakistan
10-year government bond returns (as of Oct. 3, 2018; YTD yield rate)
10.499%
20-year government bond returns (as of Oct. 3, 2018; YTD yield rate)
12.900%
Syndicated loan spreads, 2017-Q3 2018 (Thomson Reuters; over hard currencies: USD, EUR, GBP and JPY)
Renewables: 450bps
Others: 214bps
Average across sectors: 293bps
Interview program data: Range of cost of debt
KIBORix + 0-200bps (long term; on-balance sheet lending and current facilities; LCUs)
LIBOR + 400-450bps (CPEC projects; 14-16 year tenors; hard currency)
Outlook for cost of infrastructure financing (next 12 months)
Increase expected
Note: Figures in italics indicate fewer than five transactions between 2017 and Q3 2018.
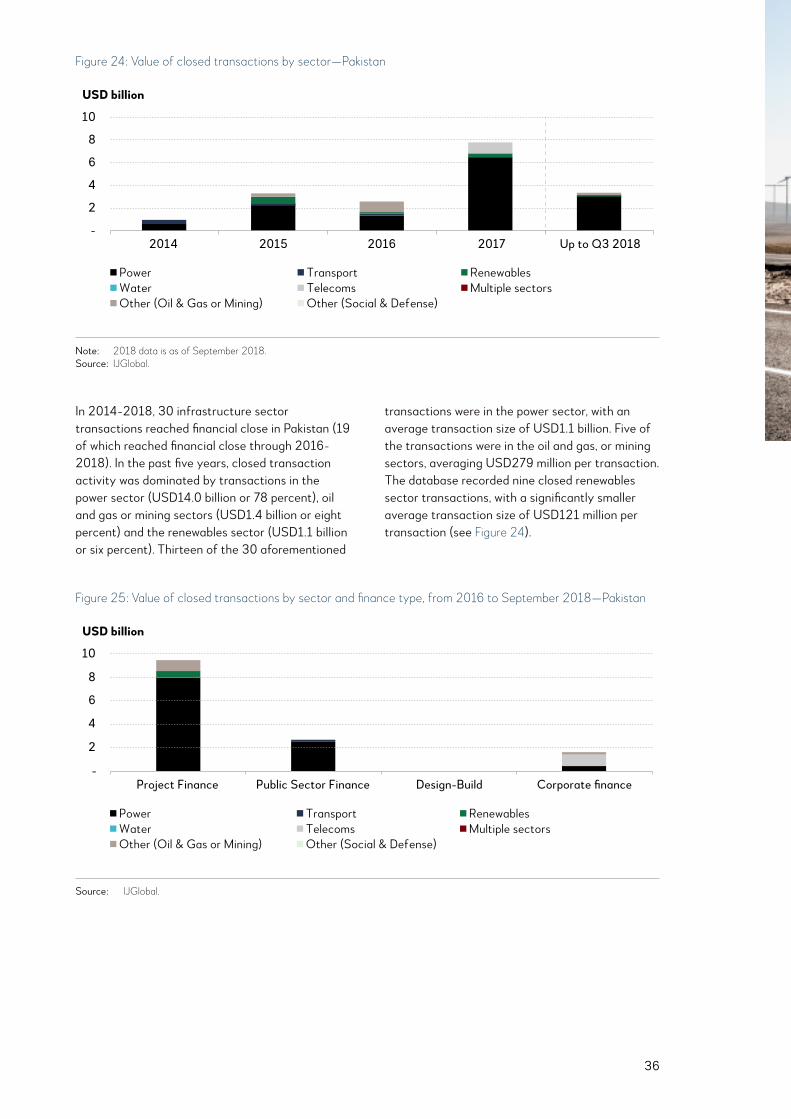
36
In 2014-2018, 30 infrastructure sector transactions reached financial close in Pakistan (19 of which reached financial close through 2016-2018). In the past five years, closed transaction activity was dominated by transactions in the power sector (USD14.0 billion or 78 percent), oil and gas or mining sectors (USD1.4 billion or eight percent) and the renewables sector (USD1.1 billion or six percent). Thirteen of the 30 aforementioned
transactions were in the power sector, with an average transaction size of USD1.1 billion. Five of the transactions were in the oil and gas, or mining sectors, averaging USD279 million per transaction. The database recorded nine closed renewables sector transactions, with a significantly smaller average transaction size of USD121 million per transaction (see Figure 24).
Figure 24: Value of closed transactions by sector—Pakistan
Note: 2018 data is as of September 2018. Source: IJGlobal.
10
8
6
4
2
-2014 2015 2016 2017 Up to Q3 2018
USD billion
PowerWaterOther (Oil & Gas or Mining)
TransportTelecomsOther (Social & Defense)
RenewablesMultiple sectors
Note: 2018 data is as of September 2018.Source: IJGlobal.
Figure 25: Value of closed transactions by sector and finance type, from 2016 to September 2018—Pakistan
PowerWaterOther (Oil & Gas or Mining)
TransportTelecomsOther (Social & Defense)
RenewablesMultiple sectors
Source: IJGlobal.
-
2
6
4
8
10
Project Finance Public Sector Finance Design-Build Corporate finance
USD billion
Source: IJGlobal.

37
Of the infrastructure transactions that reached financial close through 2014-2018, project finance (75 percent of transaction value), public-sector finance (16 percent) and corporate finance (nine percent) emerged as the dominant types of financing. However, of the transactions that reached the announcement stages in 2016-2018 (worth USD35.4 billion in total), project finance accounts for 62 percent (USD21.9 billion), while public-sector finance accounts for 33 percent (USD11.6 billion) of total pipeline value. Furthermore, across 2016-2018, one project finance transaction worth USD135 million is in the tender to financing stages.
Project financing appears to the dominant financing type across closed infrastructure sector
transactions in Pakistan through 2016-2018, accounting for 69 percent of all closed transaction value (19 percent public-sector finance and 12 percent corporate finance). In the transportation and oil and gas or mining sectors, project financing retains its dominance in the 2016-2018 transaction pipeline. Seventy eight percent of the announced transportation transactions (collectively worth USD6.8 billion) is to be financed through project financing, with public-sector financing accounting for the remaining transaction value. Similarly, almost all announced transaction value in the oil and gas or mining sectors (USD10.1 billion) is to be financed via project financing. One water sector transaction worth USD135 million in the tender to financing stages is expected to be a project financing (see Figure 25 and Figure 26).
Figure 26: Value of announcements (general and transaction) by sector and finance type, from 2016 to September 2018—Pakistan
USD billion
PowerWaterOther (Oil & Gas or Mining)
TransportTelecomsOther (Social & Defense)
RenewablesMultiple sectors
Note: The Public Sector Finance category covers SOEs, and also includes transactions where 100 percent of the transaction debt is provided by Development Finance Institutions (i.e., development banks, multilaterals or export credit agencies). Some SOE transactions are also recorded under Project Finance. Source: IJGlobal.
0
5
10
15
20
25
Project Finance Public Sector Finance
Design-Build Corporate finance
Source: IJGlobal.Note: The Public Sector Finance category covers SOEs, and also includes transactions where 100 percent of the transaction debt is
provided by Development Finance Institutions (i.e., development banks, multilaterals or export credit agencies). Some SOE trans-actions are also recorded under Project Finance.
Figure 27: Pipeline of potential transactions by sector from 2016 to September 2018 in Pakistan, USD billion
USD billion
PowerWaterOther (Oil & Gas or Mining)
TransportTelecomsOther (Social & Defense)
RenewablesMultiple sectors
Source: IJGlobal.
-
10
20
30
40
Announcement stage From Tenderto Financing
Financial close Cancelled
Source: IJGlobal.

38
Announced transactions accounted for 72 percent of transaction activity, and transactions reaching financial close accounted for 28 percent of Pakistan’s infrastructure transaction activity through 2016-2018 (see Figure 27). In terms of mode of financing, primary financing and company acquisition transactions dominated closed
transaction activity (90 percent and eight percent of all closed transaction value respectively). At the announcement stages, expected primary financing transactions worth USD33.5 billion (95 percent of all transaction value at announcement stages) were recorded through 2016-2018.
2.7 Philippines
Infrastructure financing cost indicators Philippines
10-year government bond returns (as of Oct. 3, 2018; YTD yield rate)
7.420%
20-year government bond returns (as of Oct. 3, 2018; YTD yield rate)
8.354%
Syndicated loan spreads, 2017-Q3 2018 (Thomson Reuters; over hard currencies: USD, EUR, GBP and JPY)
Others: 163bps
Average across sectors: 163bps
Interview program data: Range of cost of debt
25-100bps (loans to government; LCUs)
PDST(R2) + 175-250bps (limited recourse corporate debt facilities; LCUs)
Six-year treasury rate + 200bps (syndicated or direct project finance debt facilities; LCUs)
Outlook for cost of infrastructure financing (next 12 months)
Increase expected
Note: Figures in italics indicate fewer than five transactions between 2017 and Q3 2018.
The majority of infrastructure financing in the Philippines is denominated in Philippine pesos, which can be attributed to the high liquidity in the local banking market.38 However airport/port projects, for example, tend to have a portion of infrastructure financing denominated in hard currency, typically USD. Syndicated loan spreads data for 3 transactions seen through 2017 and Q3 2018 denominated in hard currencies suggest that the average spread of around about 163bps. Interviewees suggested that loans to government are priced between 25-100bps. Furthermore, the cost of financing through limited recourse debt facilities is around 175-250bps over the local benchmark rate (PDST-R2; one-month rate as of Oct. 26, 2018 at 4.8038 percent). In the case of refinancing transactions or expanding brownfield projects with stable and known cash flows, the financing cost is at the lower end of the range of 175bps over the local benchmark rate (PDST-R2) This is typical for toll-road projects or power plants
with off-take agreements. Another interviewee suggested that for infrastructure financing through syndicated or direct (limited recourse) project finance debt facilities, the cost of debt is at approximately 200bps over the six-year treasury rate (LCU-denominated lending, sector agnostic).
An increase in long-term debt financing costs is expected in the next 12 months due to high/rising inflation rates, as well as uncertainly surrounding tax reforms in the Philippines. However, one interviewee stated that, owing to the strength of the economy in the past 12 months and the fact that most infrastructure financing is denominated in LCUs, a significant increase in rates was not expected.
In 2017, the government announced the “Build, Build, Build” program to lift the country’s economy by building infrastructure. Spending on infrastructure will be increased from 5.4 percent
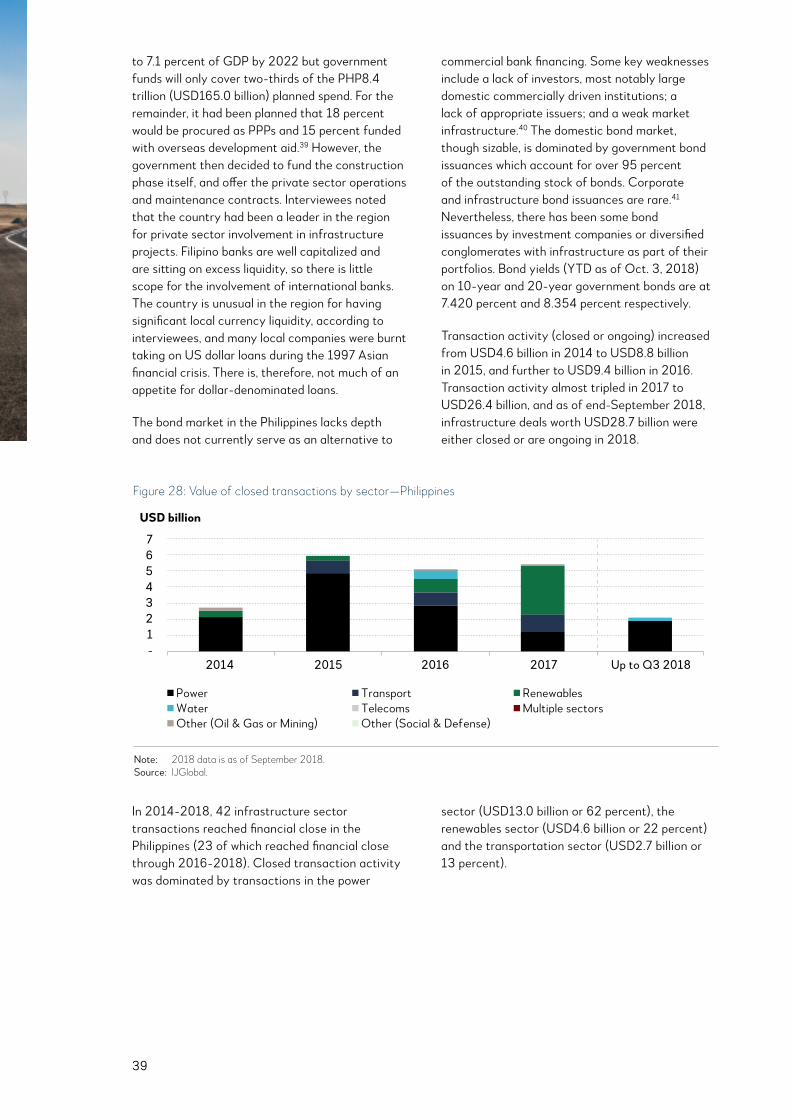
39
Figure 28: Value of closed transactions by sector—Philippines
to 7.1 percent of GDP by 2022 but government funds will only cover two-thirds of the PHP8.4 trillion (USD165.0 billion) planned spend. For the remainder, it had been planned that 18 percent would be procured as PPPs and 15 percent funded with overseas development aid.39 However, the government then decided to fund the construction phase itself, and offer the private sector operations and maintenance contracts. Interviewees noted that the country had been a leader in the region for private sector involvement in infrastructure projects. Filipino banks are well capitalized and are sitting on excess liquidity, so there is little scope for the involvement of international banks. The country is unusual in the region for having significant local currency liquidity, according to interviewees, and many local companies were burnt taking on US dollar loans during the 1997 Asian financial crisis. There is, therefore, not much of an appetite for dollar-denominated loans.
The bond market in the Philippines lacks depth and does not currently serve as an alternative to
commercial bank financing. Some key weaknesses include a lack of investors, most notably large domestic commercially driven institutions; a lack of appropriate issuers; and a weak market infrastructure.40 The domestic bond market, though sizable, is dominated by government bond issuances which account for over 95 percent of the outstanding stock of bonds. Corporate and infrastructure bond issuances are rare.41 Nevertheless, there has been some bond issuances by investment companies or diversified conglomerates with infrastructure as part of their portfolios. Bond yields (YTD as of Oct. 3, 2018) on 10-year and 20-year government bonds are at 7.420 percent and 8.354 percent respectively.
Transaction activity (closed or ongoing) increased from USD4.6 billion in 2014 to USD8.8 billion in 2015, and further to USD9.4 billion in 2016. Transaction activity almost tripled in 2017 to USD26.4 billion, and as of end-September 2018, infrastructure deals worth USD28.7 billion were either closed or are ongoing in 2018.
In 2014-2018, 42 infrastructure sector transactions reached financial close in the Philippines (23 of which reached financial close through 2016-2018). Closed transaction activity was dominated by transactions in the power
sector (USD13.0 billion or 62 percent), the renewables sector (USD4.6 billion or 22 percent) and the transportation sector (USD2.7 billion or 13 percent).
Note: 2018 data is as of September 2018. Source: IJGlobal.
7654321-
2014 2015 2016 2017 Up to Q3 2018
USD billion
PowerWaterOther (Oil & Gas or Mining)
TransportTelecomsOther (Social & Defense)
RenewablesMultiple sectors
Note: 2018 data is as of September 2018.Source: IJGlobal.
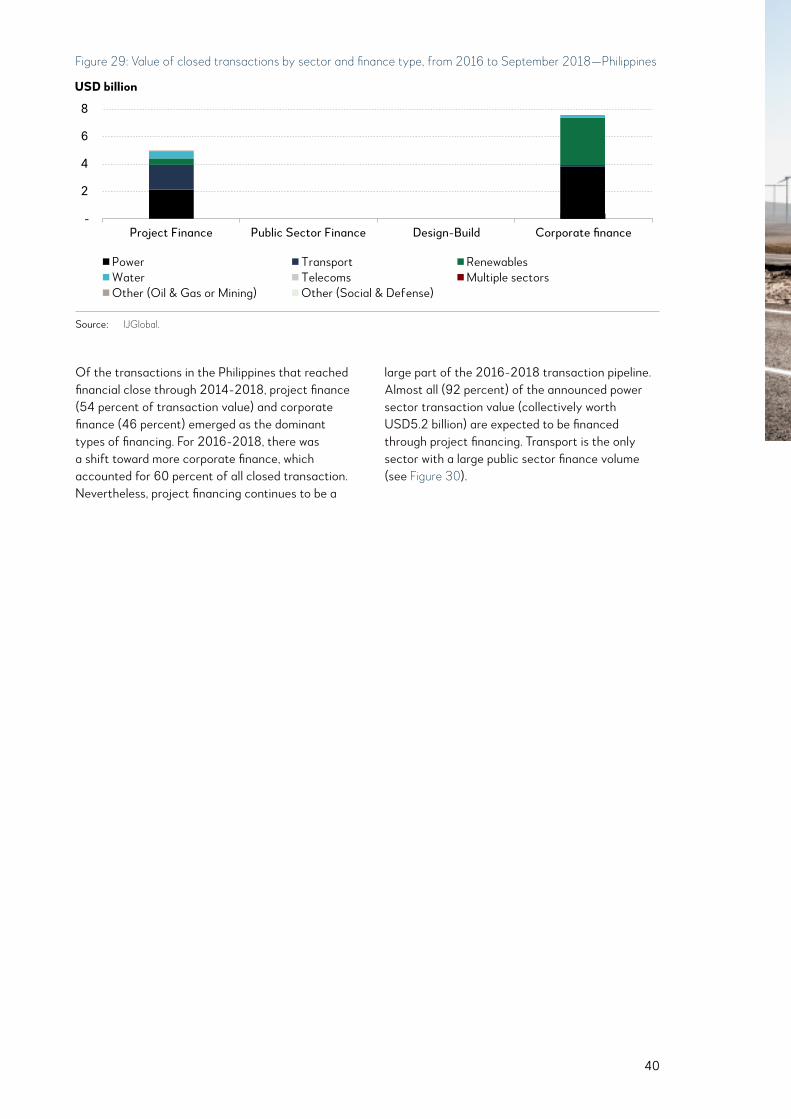
40
Figure 29: Value of closed transactions by sector and finance type, from 2016 to September 2018—Philippines
PowerWaterOther (Oil & Gas or Mining)
TransportTelecomsOther (Social & Defense)
RenewablesMultiple sectors
Source: IJGlobal.
-
2
6
4
8
Project Finance Public Sector Finance Design-Build Corporate finance
USD billion
Source: IJGlobal.
Of the transactions in the Philippines that reached financial close through 2014-2018, project finance (54 percent of transaction value) and corporate finance (46 percent) emerged as the dominant types of financing. For 2016-2018, there was a shift toward more corporate finance, which accounted for 60 percent of all closed transaction. Nevertheless, project financing continues to be a
large part of the 2016-2018 transaction pipeline. Almost all (92 percent) of the announced power sector transaction value (collectively worth USD5.2 billion) are expected to be financed through project financing. Transport is the only sector with a large public sector finance volume (see Figure 30).
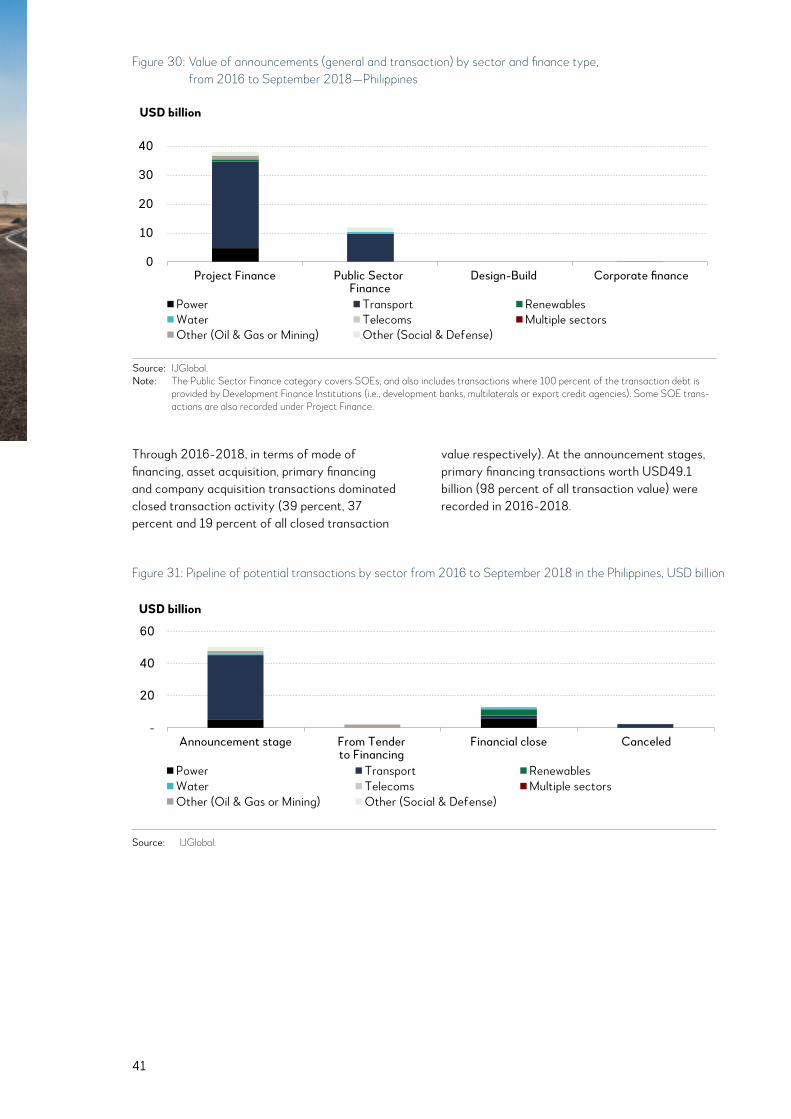
41
Through 2016-2018, in terms of mode of financing, asset acquisition, primary financing and company acquisition transactions dominated closed transaction activity (39 percent, 37 percent and 19 percent of all closed transaction
value respectively). At the announcement stages, primary financing transactions worth USD49.1 billion (98 percent of all transaction value) were recorded in 2016-2018.
Figure 31: Pipeline of potential transactions by sector from 2016 to September 2018 in the Philippines, USD billion
USD billion
PowerWaterOther (Oil & Gas or Mining)
TransportTelecomsOther (Social & Defense)
RenewablesMultiple sectors
Source: IJGlobal.
-
20
40
60
Announcement stage From Tenderto Financing
Financial close Canceled
Source: IJGlobal.
Figure 30: Value of announcements (general and transaction) by sector and finance type, from 2016 to September 2018—Philippines
USD billion
PowerWaterOther (Oil & Gas or Mining)
TransportTelecomsOther (Social & Defense)
RenewablesMultiple sectors
Note: The Public Sector Finance category covers SOEs, and also includes transactions where 100 percent of the transaction debt is provided by Development Finance Institutions (i.e., development banks, multilaterals or export credit agencies). Some SOE transactions are also recorded under Project Finance. Source: IJGlobal.
0
10
20
30
40
Project Finance Public Sector Finance
Design-Build Corporate finance
Source: IJGlobal.Note: The Public Sector Finance category covers SOEs, and also includes transactions where 100 percent of the transaction debt is
provided by Development Finance Institutions (i.e., development banks, multilaterals or export credit agencies). Some SOE trans-actions are also recorded under Project Finance.
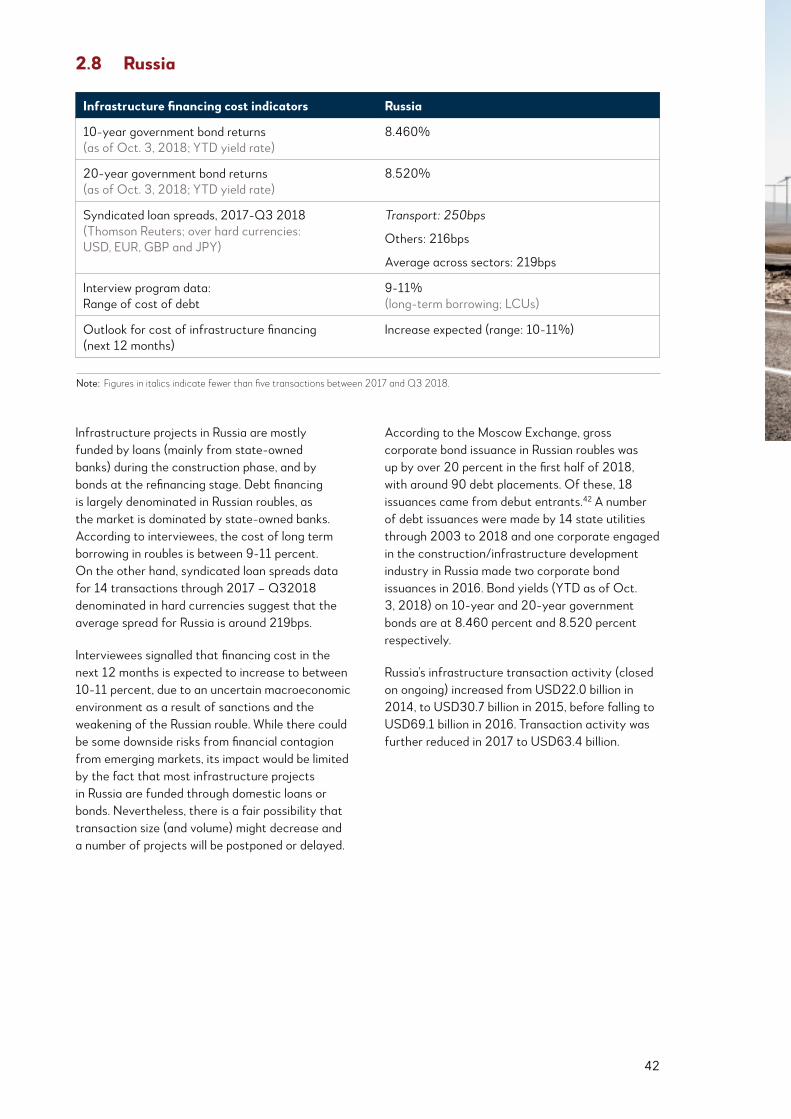
42
Infrastructure projects in Russia are mostly funded by loans (mainly from state-owned banks) during the construction phase, and by bonds at the refinancing stage. Debt financing is largely denominated in Russian roubles, as the market is dominated by state-owned banks. According to interviewees, the cost of long term borrowing in roubles is between 9-11 percent. On the other hand, syndicated loan spreads data for 14 transactions through 2017 – Q32018 denominated in hard currencies suggest that the average spread for Russia is around 219bps.
Interviewees signalled that financing cost in the next 12 months is expected to increase to between 10-11 percent, due to an uncertain macroeconomic environment as a result of sanctions and the weakening of the Russian rouble. While there could be some downside risks from financial contagion from emerging markets, its impact would be limited by the fact that most infrastructure projects in Russia are funded through domestic loans or bonds. Nevertheless, there is a fair possibility that transaction size (and volume) might decrease and a number of projects will be postponed or delayed.
According to the Moscow Exchange, gross corporate bond issuance in Russian roubles was up by over 20 percent in the first half of 2018, with around 90 debt placements. Of these, 18 issuances came from debut entrants.42 A number of debt issuances were made by 14 state utilities through 2003 to 2018 and one corporate engaged in the construction/infrastructure development industry in Russia made two corporate bond issuances in 2016. Bond yields (YTD as of Oct. 3, 2018) on 10-year and 20-year government bonds are at 8.460 percent and 8.520 percent respectively.
Russia’s infrastructure transaction activity (closed on ongoing) increased from USD22.0 billion in 2014, to USD30.7 billion in 2015, before falling to USD69.1 billion in 2016. Transaction activity was further reduced in 2017 to USD63.4 billion.
2.8 Russia
Infrastructure financing cost indicators Russia
10-year government bond returns (as of Oct. 3, 2018; YTD yield rate)
8.460%
20-year government bond returns (as of Oct. 3, 2018; YTD yield rate)
8.520%
Syndicated loan spreads, 2017-Q3 2018 (Thomson Reuters; over hard currencies: USD, EUR, GBP and JPY)
Transport: 250bps
Others: 216bps
Average across sectors: 219bps
Interview program data: Range of cost of debt
9-11% (long-term borrowing; LCUs)
Outlook for cost of infrastructure financing (next 12 months)
Increase expected (range: 10-11%)
Note: Figures in italics indicate fewer than five transactions between 2017 and Q3 2018.
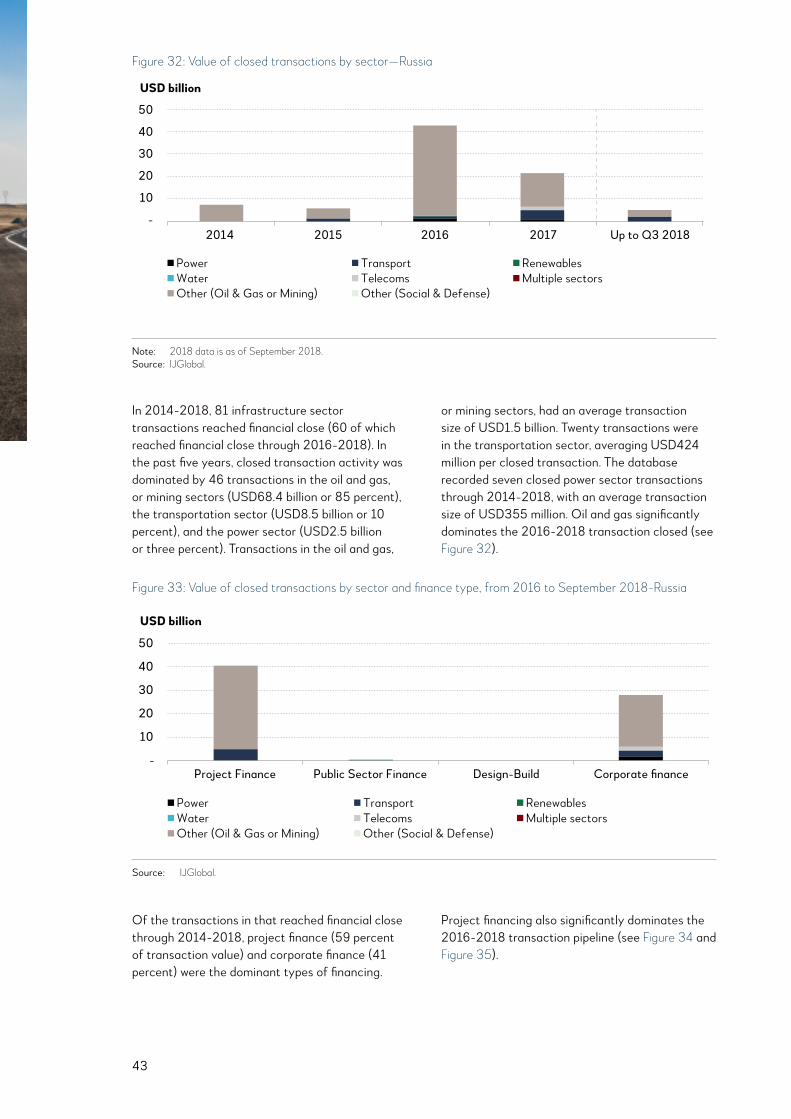
43
Note: 2018 data is as of September 2018. Source: IJGlobal.
50
40
30
20
10
-2014 2015 2016 2017 Up to Q3 2018
USD billion
PowerWaterOther (Oil & Gas or Mining)
TransportTelecomsOther (Social & Defense)
RenewablesMultiple sectors
Figure 32: Value of closed transactions by sector—Russia
In 2014-2018, 81 infrastructure sector transactions reached financial close (60 of which reached financial close through 2016-2018). In the past five years, closed transaction activity was dominated by 46 transactions in the oil and gas, or mining sectors (USD68.4 billion or 85 percent), the transportation sector (USD8.5 billion or 10 percent), and the power sector (USD2.5 billion or three percent). Transactions in the oil and gas,
or mining sectors, had an average transaction size of USD1.5 billion. Twenty transactions were in the transportation sector, averaging USD424 million per closed transaction. The database recorded seven closed power sector transactions through 2014-2018, with an average transaction size of USD355 million. Oil and gas significantly dominates the 2016-2018 transaction closed (see Figure 32).
Of the transactions in that reached financial close through 2014-2018, project finance (59 percent of transaction value) and corporate finance (41 percent) were the dominant types of financing.
Project financing also significantly dominates the 2016-2018 transaction pipeline (see Figure 34 and Figure 35).
Note: 2018 data is as of September 2018. Source: IJGlobal.
Figure 33: Value of closed transactions by sector and finance type, from 2016 to September 2018-Russia
PowerWaterOther (Oil & Gas or Mining)
TransportTelecomsOther (Social & Defense)
RenewablesMultiple sectors
Source: IJGlobal.
-
10
30
20
40
50
Project Finance Public Sector Finance Design-Build Corporate finance
USD billion
Source: IJGlobal.
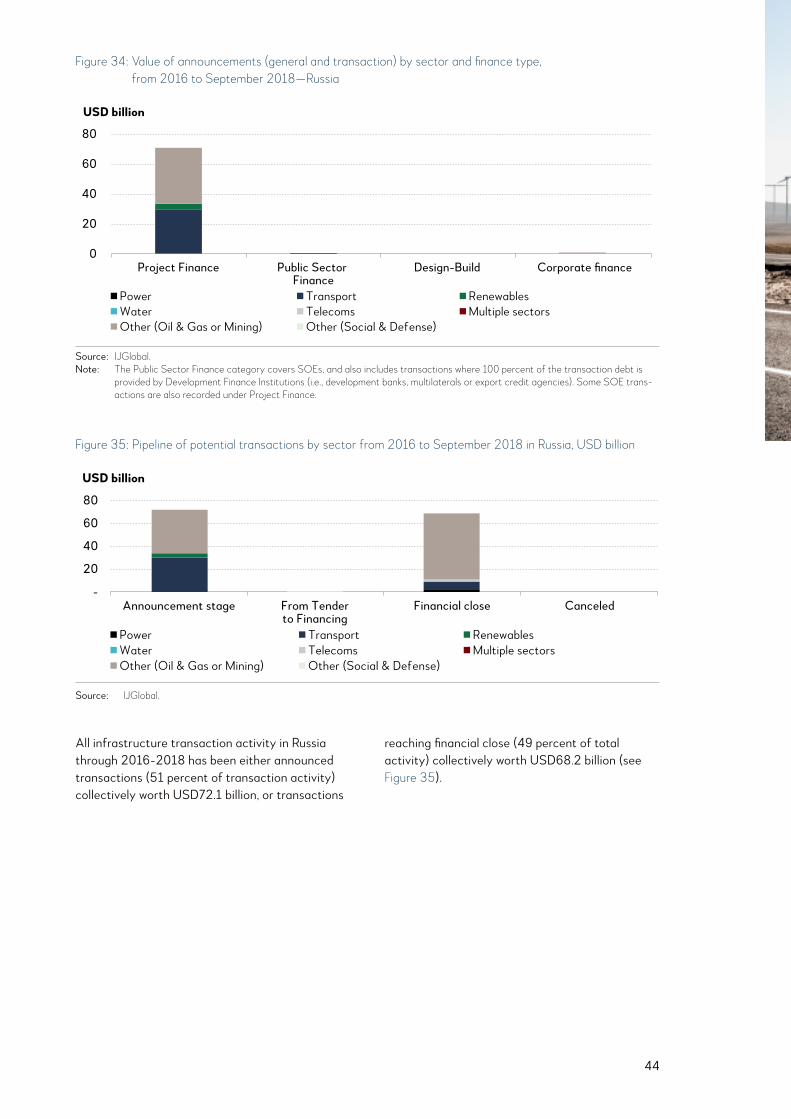
44
All infrastructure transaction activity in Russia through 2016-2018 has been either announced transactions (51 percent of transaction activity) collectively worth USD72.1 billion, or transactions
reaching financial close (49 percent of total activity) collectively worth USD68.2 billion (see Figure 35).
Figure 34: Value of announcements (general and transaction) by sector and finance type, from 2016 to September 2018—Russia
USD billion
PowerWaterOther (Oil & Gas or Mining)
TransportTelecomsOther (Social & Defense)
RenewablesMultiple sectors
Note: The Public Sector Finance category covers SOEs, and also includes transactions where 100 percent of the transaction debt is provided by Development Finance Institutions (i.e., development banks, multilaterals or export credit agencies). Some SOE transactions are also recorded under Project Finance. Source: IJGlobal.
0
20
40
60
80
Project Finance Public Sector Finance
Design-Build Corporate finance
Figure 35: Pipeline of potential transactions by sector from 2016 to September 2018 in Russia, USD billion
USD billion
PowerWaterOther (Oil & Gas or Mining)
TransportTelecomsOther (Social & Defense)
RenewablesMultiple sectors
Source: IJGlobal.
-
20
40
60
80
Announcement stage From Tenderto Financing
Financial close Canceled
Source: IJGlobal.
Source: IJGlobal.Note: The Public Sector Finance category covers SOEs, and also includes transactions where 100 percent of the transaction debt is
provided by Development Finance Institutions (i.e., development banks, multilaterals or export credit agencies). Some SOE trans-actions are also recorded under Project Finance.

45
Turkey has spent nearly USD100 billion in the past 15 years to build new railways, roadways, tunnels, bridges and airports, and plans to spend an additional USD325.0 billion over the next five years.43 In 2017, the government announced it will spend USD64 billion for existing and new projects,44 with the shortfall made up by outside investments. Debt financing for infrastructure development in Turkey is mostly denominated in hard currencies (such as US dollars or euros). US commercial banks are actively financiers (project financing) and DFIs including the European Bank for Reconstruction and Development (EBRD) and the World Bank/International Bank for Reconstruction and Development (IBRD) continue to fund key infrastructure projects in the country.45 Projects financed through domestic commercial bank loans are denominated in Turkish lira (local currency units).
Syndicated loan spreads data for 95 transactions seen through 2017 – Q3 2018 denominated in hard currencies suggest that the average spread of about 168bps. Renewables and power sector transactions recorded the highest average
syndicated loan spreads across this duration, at 550bps and 450bps respectively.
Interviewees indicated that for infrastructure financing denominated in hard currency for projects across a seven- to eight-year maturity period through either senior secured debt or syndicated/direct (limited recourse) project finance debt facilities, the cost of infrastructure financing lies at 500-575bps over the LIBOR. For corporate debt facilities denominated in hard currency with approximately three- to four-year maturity, the cost of infrastructure financing lies at 450-500bps over the LIBOR. Interviewees also suggested that financing transactions in the transportation sector tends to be marginally cheaper due to government guarantees typically applicable for transport projects.
An increase in long-term lending rates across the next 12 months is expected as funds are increasingly leaving emerging market economies. European investment through PPPs has been key to many of Turkey’s large-scale projects and the government has sought more, offering
2.9 Turkey 2.9 Turkey
Infrastructure financing cost indicators Turkey
10-year government bond returns (as of Oct. 3, 2018; YTD yield rate)
17.710%
20-year government bond returns (as of Oct. 3, 2018; YTD yield rate)
N/A
Syndicated loan spreads, 2017-Q3 2018 (Thomson Reuters; over hard currencies: USD, EUR, GBP and JPY)
Power: 450bps
Transport: 250bps
Renewables: 550bps
Telecoms: 185bps
Others: 159bps
Average across sectors: 168bps
Interview program data: Range of cost of debt
LIBOR + 500-575bps (7-8 year maturity; senior secured debt or syndicated/ direct project finance debt facilities; hard currency)
LIBOR + 450-500bps (3-4 year maturity; corporate debt facilities; hard currency)
Outlook for cost of infrastructure financing (next 12 months)
Increase expected
Note: Figures in italics indicate fewer than five transactions between 2017 and Q3 2018.
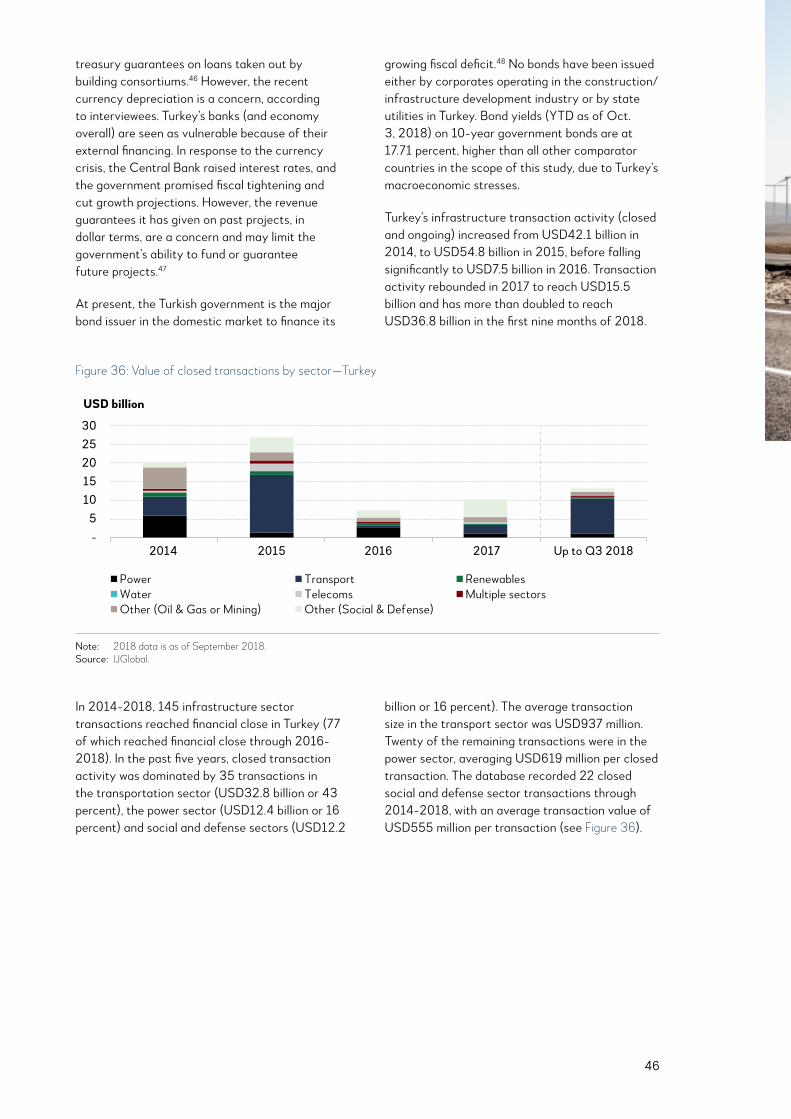
46
treasury guarantees on loans taken out by building consortiums.46 However, the recent currency depreciation is a concern, according to interviewees. Turkey’s banks (and economy overall) are seen as vulnerable because of their external financing. In response to the currency crisis, the Central Bank raised interest rates, and the government promised fiscal tightening and cut growth projections. However, the revenue guarantees it has given on past projects, in dollar terms, are a concern and may limit the government’s ability to fund or guarantee future projects.47
At present, the Turkish government is the major bond issuer in the domestic market to finance its
growing fiscal deficit.48 No bonds have been issued either by corporates operating in the construction/infrastructure development industry or by state utilities in Turkey. Bond yields (YTD as of Oct. 3, 2018) on 10-year government bonds are at 17.71 percent, higher than all other comparator countries in the scope of this study, due to Turkey’s macroeconomic stresses.
Turkey’s infrastructure transaction activity (closed and ongoing) increased from USD42.1 billion in 2014, to USD54.8 billion in 2015, before falling significantly to USD7.5 billion in 2016. Transaction activity rebounded in 2017 to reach USD15.5 billion and has more than doubled to reach USD36.8 billion in the first nine months of 2018.
In 2014-2018, 145 infrastructure sector transactions reached financial close in Turkey (77 of which reached financial close through 2016-2018). In the past five years, closed transaction activity was dominated by 35 transactions in the transportation sector (USD32.8 billion or 43 percent), the power sector (USD12.4 billion or 16 percent) and social and defense sectors (USD12.2
billion or 16 percent). The average transaction size in the transport sector was USD937 million. Twenty of the remaining transactions were in the power sector, averaging USD619 million per closed transaction. The database recorded 22 closed social and defense sector transactions through 2014-2018, with an average transaction value of USD555 million per transaction (see Figure 36).
Figure 36: Value of closed transactions by sector—Turkey
Note: 2018 data is as of September 2018. Source: IJGlobal.
3025201510
5-
2014 2015 2016 2017 Up to Q3 2018
USD billion
PowerWaterOther (Oil & Gas or Mining)
TransportTelecomsOther (Social & Defense)
RenewablesMultiple sectors
Note: 2018 data is as of September 2018.Source: IJGlobal.

47
Of the transactions that reached financial close through 2014-2018, project finance (80 percent of transaction value) and corporate finance (19 percent of transaction value) were the dominant types of financing. However, of transactions that reached the announcement stages between 2016 and 2018 (worth USD26.8 billion in total),
project financing accounts for the entire pipeline value. Project financing also dominated the Turkish transaction pipeline through 2016-2018, accounting for almost 99 percent (USD26.5 billion) of all transaction value through tender to financing stages (see Figure 37 and Figure 38).
Figure 37: Value of closed transactions by sector and finance type, from 2016 to September 2018-Turkey
PowerWaterOther (Oil & Gas or Mining)
TransportTelecomsOther (Social & Defense)
RenewablesMultiple sectors
Source: IJGlobal.
-
5
15
10
20
25
Project Finance Public Sector Finance Design-Build Corporate finance
USD billion
Source: IJGlobal.
Figure 38: Value of announcements (general and transaction) by sector and finance type, from 2016 to September 2018-Turkey
USD billion
PowerWaterOther (Oil & Gas or Mining)
TransportTelecomsOther (Social & Defense)
RenewablesMultiple sectors
Note: The Public Sector Finance category covers SOEs, and also includes transactions where 100 percent of the transaction debt is provided by Development Finance Institutions (i.e., development banks, multilaterals or export credit agencies). Some SOE transactions are also recorded under Project Finance. Source: IJGlobal.
0
15
10
5
20
25
30
Project Finance Public Sector Finance
Design-Build Corporate finance
Note: The Public Sector Finance category covers SOEs, and also includes transactions where 100 percent of the transaction debt is provided by Development Finance Institutions (i.e. development banks, multilaterals or export credit agencies). Some SOE transac-tions are also recorded under Project Finance.
Source: IJGlobal.
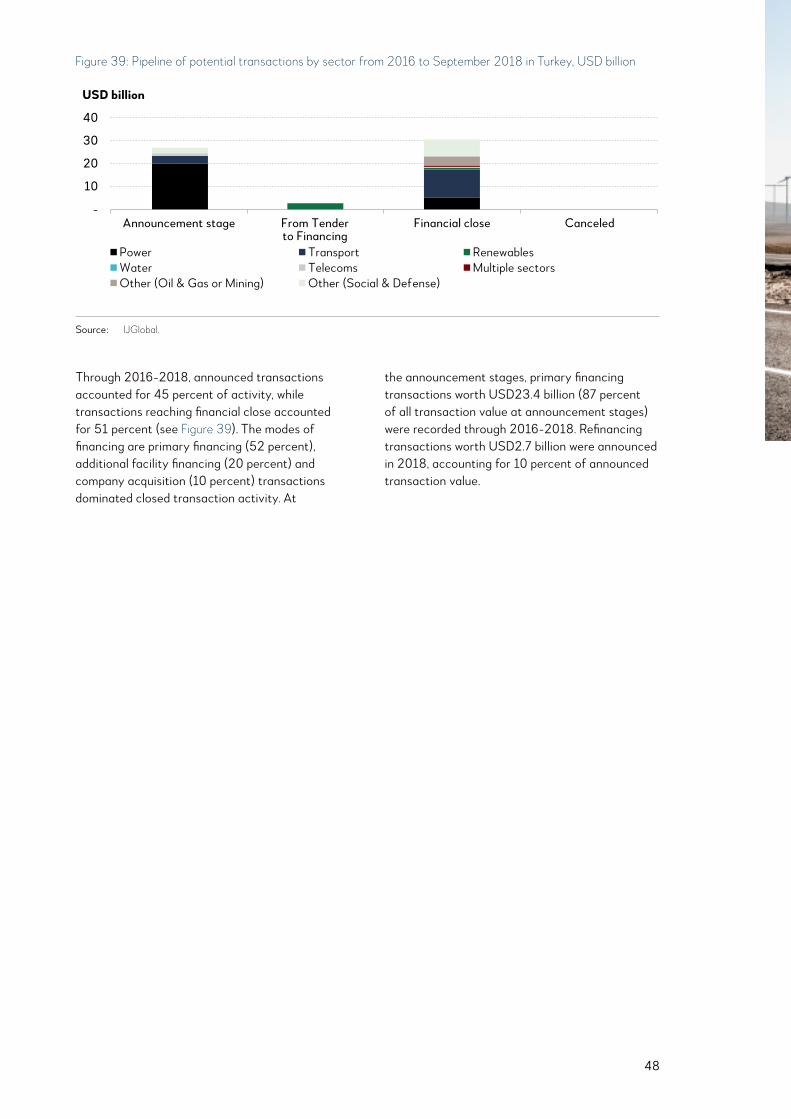
48
Through 2016-2018, announced transactions accounted for 45 percent of activity, while transactions reaching financial close accounted for 51 percent (see Figure 39). The modes of financing are primary financing (52 percent), additional facility financing (20 percent) and company acquisition (10 percent) transactions dominated closed transaction activity. At
the announcement stages, primary financing transactions worth USD23.4 billion (87 percent of all transaction value at announcement stages) were recorded through 2016-2018. Refinancing transactions worth USD2.7 billion were announced in 2018, accounting for 10 percent of announced transaction value.
Figure 39: Pipeline of potential transactions by sector from 2016 to September 2018 in Turkey, USD billion
USD billion
PowerWaterOther (Oil & Gas or Mining)
TransportTelecomsOther (Social & Defense)
RenewablesMultiple sectors
Source: IJGlobal.
-
10
20
30
40
Announcement stage From Tenderto Financing
Financial close Canceled
Source: IJGlobal.
49
3 Infrastructure Construction Costs in Asia

50
The previous section focuses on the costs of financing infrastructure, which is only part of the overall project cost. This section will explore the outlook in terms for infrastructure construction costs and activity in the eight focus countries, based on research, country analysis as well as interviews. It also details a pilot benchmark called roadBLOC (developed jointly by The EIU and the Centre of Comparative Construction Research or CCCR, with support from AIIB) which provides new and unique comparative information on the cost of road construction across the eight focus countries. This could serve as a model for future comparisons of infrastructure costs across countries.
In order to understand and compare the cost of infrastructure construction in one country versus another, a reliable method of conversion is critical.
A common approach is to convert construction costs into US dollars, but as recent events have shown, exchange rates can be volatile and will rise and fall over time for a range of reasons, resulting in a noisy construction costs benchmark.
The pilot benchmark roadBLOC is designed to track project costs both between countries and over time, independent of exchange rate movements (and inflation rates). The concept is based on an earlier method developed by Langston (2012) called citiBLOC,x which is a purchasing-power-parity measure for the construction of buildings in cities worldwide.49 This results in a more stable index that reflects local productivity and performance in-country over time, and it is reasonably easy to calculate regularly.
x The citiBLOC purchasing power parity uses a standard basket of 10 construction items, comprising notional 50 percent material, 40 percent labor and 10 percent plant, to calculate purchasing power parity relativities in each city.

51
In deciding how to benchmark infrastructure construction costs in various countries, there were two key issues to overcome: (a) the heterogeneity of infrastructure projects, and (b) the suitability of methods to compare costs in an international basis.
To deal with the first issue, roadBLOC benchmark uses a four-lane urban arterial road, including traffic-controlled intersections, to compare road construction costs. One challenge was that road projects comprise heterogeneous types, ranging from two-lane country roads to six-lane motorways, and often incorporating more complex engineering like tunnels and bridges. Hence, a simple average cost per meter (cost/m) would not make for a good cross-country comparison and choosing a representative road type was necessary. Various road types were empirically tested, and a four-lane urban road with controlled intersections was found to be the most suitable for cross-country comparison because of its lower coefficient of variation in the data collected.
Having selected this representative road type, the cost/m data were obtained in local currency. As pointed out, a direct conversion to USD would not give an accurate picture of local performance
due to currency fluctuations (unless all inputs are imported). A better alternative is to convert cost/m data into an index that is insensitive to macroeconomic influences. A standard “basket” (or BLOC: basket of locally obtained commodities) of labor, material and plant inputs to typical road construction projects globally was created. The cost/m could be divided by the local cost of the standard basket to determine a currency agnostic benchmark cost for international comparison (that is, local cost/m divided by local cost/basket to give the purchasing power adjusted construction cost).
It is also worth pointing out that the creation of such a basket is not straightforward, as there can be various methods. For example, a basket can be the weighted average of the most commonly used materials and labor (such as cost of a surveyor per hour, price of concrete). Alternatively, it can be based on the weighted average of different activities during construction (for example, installing crushed road base, cost of excavation). In the end, the method used here is similar to what is used for comparing construction costs of commercial buildings (known as citiBLOC). The results of construction cost/m converted into roadBLOC and USD are presented in Figure 40.
3.1 About the roadBLOC methodology
Figure 40: Comparison of road construction costs for a four-lane urban arterial road including traffic-controlled intersections in various cities, based on roadBLOC and currency conversion
-
5,000
10,000
15,000
20,000
25,000
3,620
7,240
10,860
14,480
18,100
Sydney Shanghai Islamabad Moscow Bangalore Jakarta Istanbul Manila Dhaka
roadBLOCequivalent cost/m
roadBLOC Currency, USD (RHS)
USD/m
Source: The Economist Intelligence Unit, Centre of Comparative Construction Research (CCCR)Source: The Economist Intelligence Unit, Centre of Comparative Construction Research (CCCR).

52
As seen in Figure 40, a traditional currency conversion (to USD) would show much lower costs of construction for the representative cities in the focus countries, relative to a developed economy city Sydney, Australia. Nevertheless, quite a few of the locations in developing countries in Asia are found to have high purchasing power adjusted construction cost, or roadBLOC. This reflects the relatively lower cost of labor and materials in these locations. In other words, construction costs in some Asian cities are high relative to what local labor and material costs indicate. It is important to note that different ways of constructing the standard basket would also result in different purchasing power adjusted construction cost. Indeed, under alternative methods chosen, Bangladesh’s adjusted cost would not be as high.
Although roadBLOC shows promise as a way to compare international road construction prices, properly adjusted for local price effects, there are also limitations to this method. For example, there will be differences in regulations, or differences
in taxes and subsidies affecting the construction sectors, across various economies which would not be captured by the standard basket. This implies that the road cost benchmarks will not be able to account for the differences in cost/m that arise from any of such differences from location to location.
It is also important to note that land costs, which investors or project builders are sometimes required to pay, are also not captured in this exercise. These construction costs and input prices are also indicative and provide a snapshot in time as this is the inaugural index. While all care was taken to achieve reasonable prices, a larger sample size would improve confidence in the results. Future iterations of this index will allow for the development of a dataset and comparison over time, refining the index. A similar methodology can be applied to other types of infrastructure such as power plants (powerBLOC).
A fuller elaboration of the methodology and discussion can be found in Appendix 1.
3.2 Overview of the current infrastructure landscape and outlook
Overall, activity and costs look likely to rise in most of the focus countries, activity due to growing demand and costs due to a range of issues: the interaction of currency fluctuations, inflation and the need to import; inefficiencies and lack of technology use leading to delays; and increasingly strict regulations and rising labor costs. Pakistan, Russia and Turkey are the exceptions to the positive outlook for activity. Pakistan’s outlook is neutral but with high uncertainty, as it recently approached the IMF for financial assistance but has yet to adopt any IMF program. Russia is also neutral as uncertainty over its economic outlook means that fixed investment rates look likely to remain low. Turkey looks likely to experience a downturn for the overall construction sector in the near-term, as the government has suspended investment projects for which the tender process has not been finalized.

55
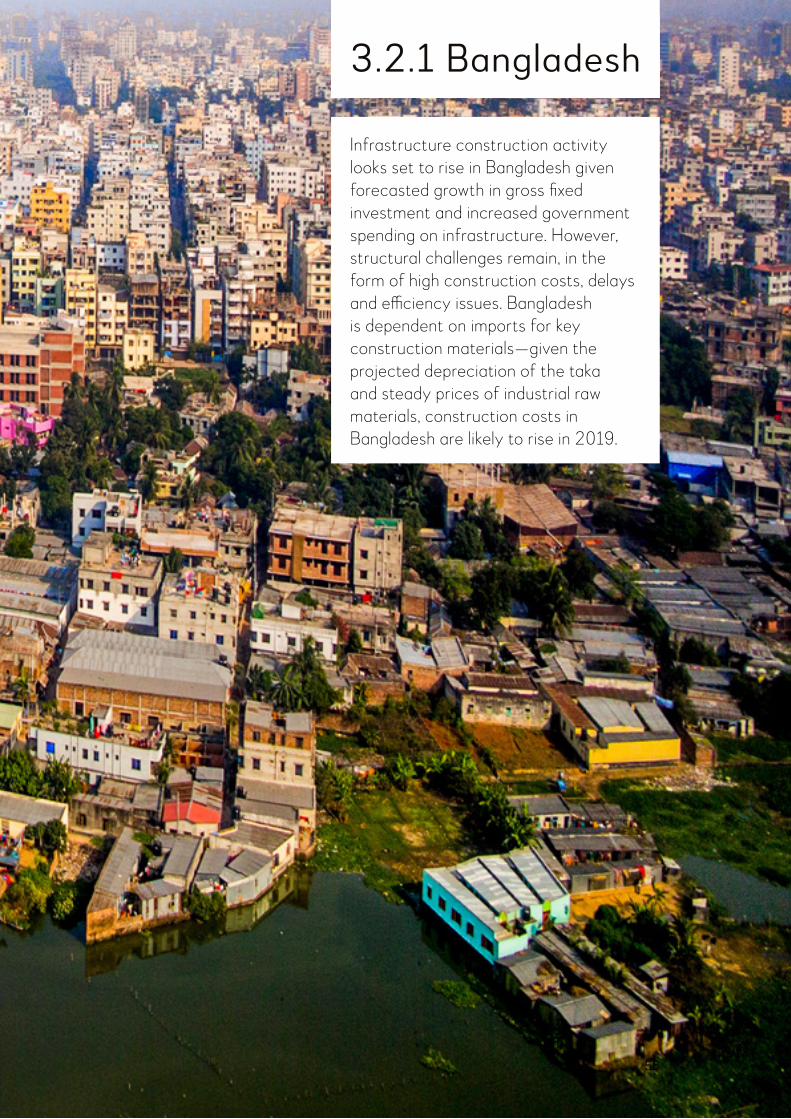
56
Infrastructure construction activity looks set to rise in Bangladesh given forecasted growth in gross fixed investment and increased government spending on infrastructure. However, structural challenges remain, in the form of high construction costs, delays and efficiency issues. Bangladesh is dependent on imports for key construction materials—given the projected depreciation of the taka and steady prices of industrial raw materials, construction costs in Bangladesh are likely to rise in 2019.
3.2.1 Bangladesh
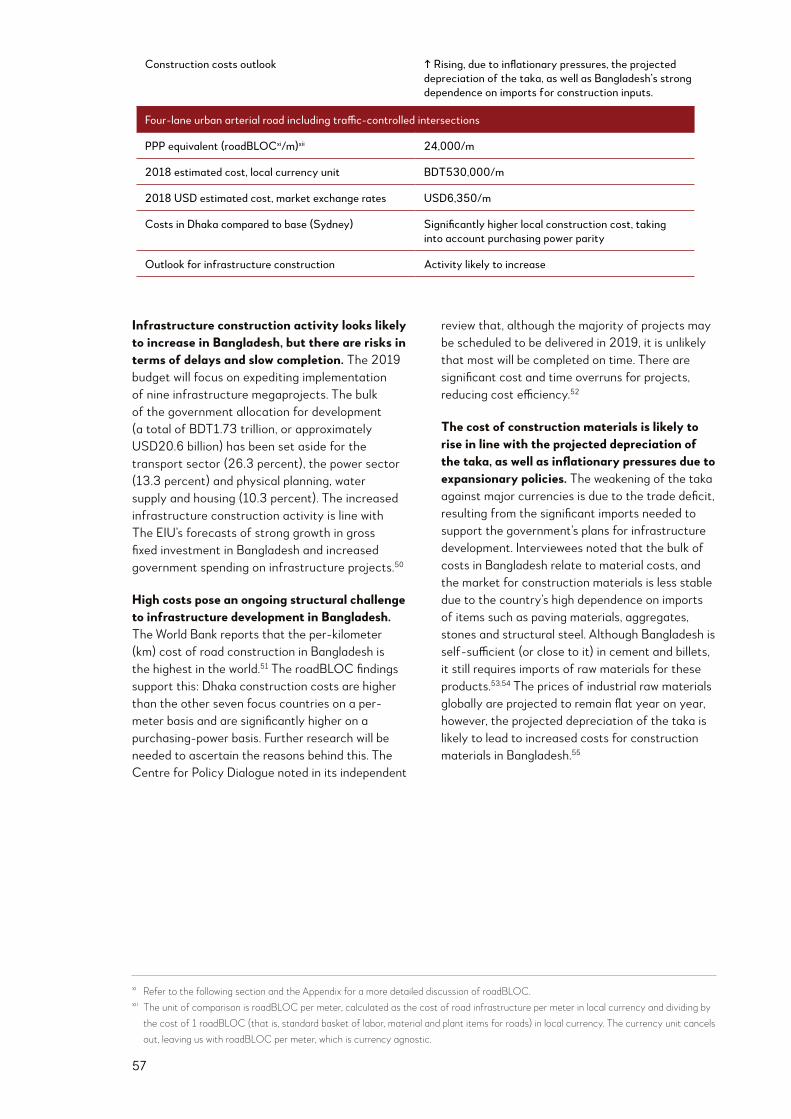
57
Infrastructure construction activity looks likely to increase in Bangladesh, but there are risks in terms of delays and slow completion. The 2019 budget will focus on expediting implementation of nine infrastructure megaprojects. The bulk of the government allocation for development (a total of BDT1.73 trillion, or approximately USD20.6 billion) has been set aside for the transport sector (26.3 percent), the power sector (13.3 percent) and physical planning, water supply and housing (10.3 percent). The increased infrastructure construction activity is line with The EIU’s forecasts of strong growth in gross fixed investment in Bangladesh and increased government spending on infrastructure projects.50
High costs pose an ongoing structural challenge to infrastructure development in Bangladesh. The World Bank reports that the per-kilometer (km) cost of road construction in Bangladesh is the highest in the world.51 The roadBLOC findings support this: Dhaka construction costs are higher than the other seven focus countries on a per-meter basis and are significantly higher on a purchasing-power basis. Further research will be needed to ascertain the reasons behind this. The Centre for Policy Dialogue noted in its independent
review that, although the majority of projects may be scheduled to be delivered in 2019, it is unlikely that most will be completed on time. There are significant cost and time overruns for projects, reducing cost efficiency.52
The cost of construction materials is likely to rise in line with the projected depreciation of the taka, as well as inflationary pressures due to expansionary policies. The weakening of the taka against major currencies is due to the trade deficit, resulting from the significant imports needed to support the government’s plans for infrastructure development. Interviewees noted that the bulk of costs in Bangladesh relate to material costs, and the market for construction materials is less stable due to the country’s high dependence on imports of items such as paving materials, aggregates, stones and structural steel. Although Bangladesh is self-sufficient (or close to it) in cement and billets, it still requires imports of raw materials for these products.53,54 The prices of industrial raw materials globally are projected to remain flat year on year, however, the projected depreciation of the taka is likely to lead to increased costs for construction materials in Bangladesh.55
xi Refer to the following section and the Appendix for a more detailed discussion of roadBLOC.xii The unit of comparison is roadBLOC per meter, calculated as the cost of road infrastructure per meter in local currency and dividing by
the cost of 1 roadBLOC (that is, standard basket of labor, material and plant items for roads) in local currency. The currency unit cancels out, leaving us with roadBLOC per meter, which is currency agnostic.
Construction costs outlook ↑ Rising, due to inflationary pressures, the projected depreciation of the taka, as well as Bangladesh’s strong dependence on imports for construction inputs.
PPP equivalent (roadBLOCxi/m)xii 24,000/m
2018 estimated cost, local currency unit BDT530,000/m
2018 USD estimated cost, market exchange rates USD6,350/m
Costs in Dhaka compared to base (Sydney) Significantly higher local construction cost, taking into account purchasing power parity
Outlook for infrastructure construction Activity likely to increase

58
59
Infrastructure construction activity looks likely to increase in China as the government could fast-track projects to cushion a potential slowdown from trade tensions and the ongoing deleveraging exercise. Construction costs in China are expected to increase, driven by an increased focus on compliance with environmental standards and regulations, as well as rising labor costs.
3.2.2 China

60
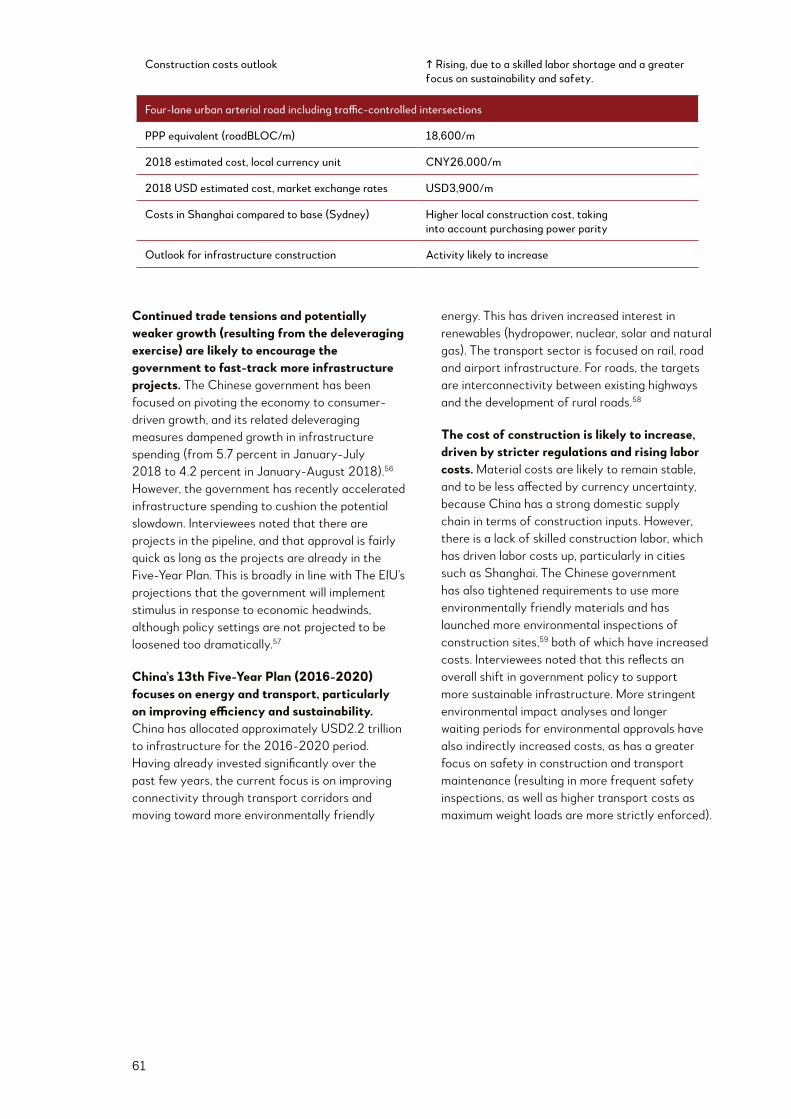
61
Continued trade tensions and potentially weaker growth (resulting from the deleveraging exercise) are likely to encourage the government to fast-track more infrastructure projects. The Chinese government has been focused on pivoting the economy to consumer-driven growth, and its related deleveraging measures dampened growth in infrastructure spending (from 5.7 percent in January-July 2018 to 4.2 percent in January-August 2018).56 However, the government has recently accelerated infrastructure spending to cushion the potential slowdown. Interviewees noted that there are projects in the pipeline, and that approval is fairly quick as long as the projects are already in the Five-Year Plan. This is broadly in line with The EIU’s projections that the government will implement stimulus in response to economic headwinds, although policy settings are not projected to be loosened too dramatically.57
China’s 13th Five-Year Plan (2016-2020) focuses on energy and transport, particularly on improving efficiency and sustainability. China has allocated approximately USD2.2 trillion to infrastructure for the 2016-2020 period. Having already invested significantly over the past few years, the current focus is on improving connectivity through transport corridors and moving toward more environmentally friendly
energy. This has driven increased interest in renewables (hydropower, nuclear, solar and natural gas). The transport sector is focused on rail, road and airport infrastructure. For roads, the targets are interconnectivity between existing highways and the development of rural roads.58
The cost of construction is likely to increase, driven by stricter regulations and rising labor costs. Material costs are likely to remain stable, and to be less affected by currency uncertainty, because China has a strong domestic supply chain in terms of construction inputs. However, there is a lack of skilled construction labor, which has driven labor costs up, particularly in cities such as Shanghai. The Chinese government has also tightened requirements to use more environmentally friendly materials and has launched more environmental inspections of construction sites,59 both of which have increased costs. Interviewees noted that this reflects an overall shift in government policy to support more sustainable infrastructure. More stringent environmental impact analyses and longer waiting periods for environmental approvals have also indirectly increased costs, as has a greater focus on safety in construction and transport maintenance (resulting in more frequent safety inspections, as well as higher transport costs as maximum weight loads are more strictly enforced).
Construction costs outlook ↑ Rising, due to a skilled labor shortage and a greater focus on sustainability and safety.
PPP equivalent (roadBLOC/m) 18,600/m
2018 estimated cost, local currency unit CNY26,000/m
2018 USD estimated cost, market exchange rates USD3,900/m
Costs in Shanghai compared to base (Sydney) Higher local construction cost, taking into account purchasing power parity
Outlook for infrastructure construction Activity likely to increase

62

63

64
Infrastructure construction activity looks likely to increase in India, although implementation issues could slow the realization of announced projects. Although construction materials tend to be sourced locally, the projected depreciation of the rupee may drive prices up due to the increased cost of imported raw materials such as steel and oil.
3.2.3 India

65
Infrastructure construction activity in India looks likely to increase, particularly for the transportation sector. This is broadly in line with The EIU forecasts that the government will increase spending on infrastructure in the next five years with a focus on improving the quality of infrastructure.60 The government has allocated USD92.2 billion (INR5.97 trillion) to infrastructure in the Union Budget 2018-2019, with a strong focus on transportation,61 and the Indian Ministry of Roads and Transport had identified 300 ongoing highway projects to be completed by 2019.62 There is also a broader plan to spend USD108.0 billion (INR7 trillion) on building nearly 84,000 km of new roads and bridges. In the first phase of this plan (which extends to 2022), the government’s aim is to construct 34,800 km of new highways and 1,837 km of expressways.63
Interviewees noted that the construction sector still faces short-term challenges as the costs of materials are likely to rise. It was reported by representative construction companies that costs have increased costs due to demonetization and the implementation of a goods and services tax (GST). The government has nonetheless asserted that demonetizaton had no adverse impact on cost of materials or labor at all. Interviewees also noted that road construction costs may be particularly affected by the rise in oil prices (due to the demand for bitumen), and that exchange rate uncertainties may adversely affect highway projects that require
heavy machinery. The costs of materials are less likely to be affected by exchange rate uncertainties as they are typically sourced domestically, although steelmakers have indicated that they are likely to increase prices due to the higher cost of imported raw material (caused by the depreciation in the rupee).64 Input costs have also been rising for cement, although lower use of this material has meant that prices remain fairly stagnant to date.65
Structural issues such as a lack of skilled labor, slow adoption of technology and land acquisition obstacles remain, but policy steps are being taken to address constraints. Interviewees and industry reports note that contractors remain slow to adopt technologies, even as new construction projects become more demanding in terms of both design and functionality. This reluctance is exacerbated by a lack of skilled labor. Although the number of announced projects points to a positive outlook for construction activity, implementation and approval issues may slow the translation of announced projects into realized projects.66 Concerns about financing and the lending environment due to the collapse of Infrastructure Leasing & Financial Services (IL&FS),67 as well as the high rate of non-performing assets in Indian banks, could also pose challenges to the timely implementation of flagship projects. India has taken policy steps—in banking, land and bankruptcy code—to address these constraints.
Construction costs outlook
PPP equivalent (roadBLOC/m) 7,900/m
2018 estimated cost, local currency unit INR104,000/m
2018 USD estimated cost, market exchange rates USD1,450/m
Costs in Bangalore compared to base (Sydney) Lower local construction cost, taking into account purchasing power parity
Outlook for infrastructure construction Activity likely to increase
↑ Rising, due largely to increasing material costs. The depreciation in the rupee is also likely to drive costs up because of the need for imported raw materials for construction, as well as imported machinery.

66

67

68
In Indonesia, infrastructure construction activity is expected to increase, although some projects may be delayed given the government’s desire to protect the currency. However, there is a long-term development goal to improve infrastructure, which is likely to be maintained. As such, continued demand for inputs from large-scale projects, along with a weakening rupiah and flat industrial raw materials prices, mean that construction costs look likely to rise.
3.2.4 Indonesia
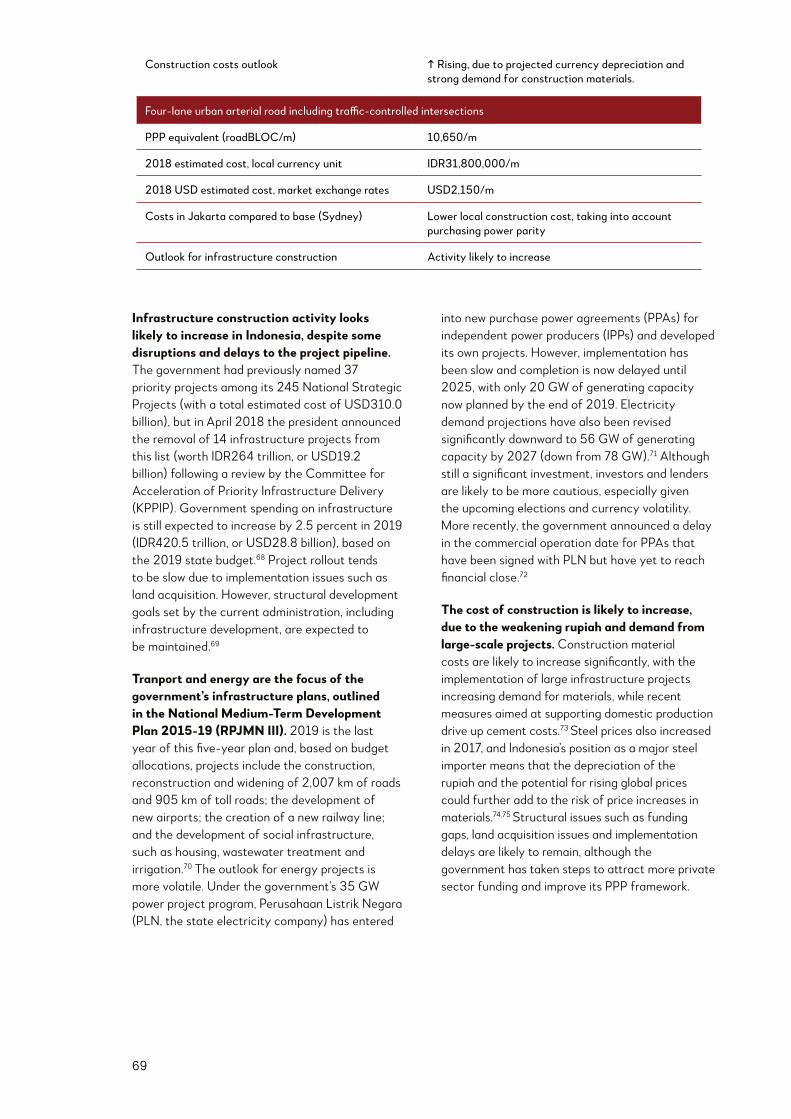
69
Infrastructure construction activity looks likely to increase in Indonesia, despite some disruptions and delays to the project pipeline. The government had previously named 37 priority projects among its 245 National Strategic Projects (with a total estimated cost of USD310.0 billion), but in April 2018 the president announced the removal of 14 infrastructure projects from this list (worth IDR264 trillion, or USD19.2 billion) following a review by the Committee for Acceleration of Priority Infrastructure Delivery (KPPIP). Government spending on infrastructure is still expected to increase by 2.5 percent in 2019 (IDR420.5 trillion, or USD28.8 billion), based on the 2019 state budget.68 Project rollout tends to be slow due to implementation issues such as land acquisition. However, structural development goals set by the current administration, including infrastructure development, are expected to be maintained.69
Tranport and energy are the focus of the government’s infrastructure plans, outlined in the National Medium-Term Development Plan 2015-19 (RPJMN III). 2019 is the last year of this five-year plan and, based on budget allocations, projects include the construction, reconstruction and widening of 2,007 km of roads and 905 km of toll roads; the development of new airports; the creation of a new railway line; and the development of social infrastructure, such as housing, wastewater treatment and irrigation.70 The outlook for energy projects is more volatile. Under the government’s 35 GW power project program, Perusahaan Listrik Negara (PLN, the state electricity company) has entered
into new purchase power agreements (PPAs) for independent power producers (IPPs) and developed its own projects. However, implementation has been slow and completion is now delayed until 2025, with only 20 GW of generating capacity now planned by the end of 2019. Electricity demand projections have also been revised significantly downward to 56 GW of generating capacity by 2027 (down from 78 GW).71 Although still a significant investment, investors and lenders are likely to be more cautious, especially given the upcoming elections and currency volatility. More recently, the government announced a delay in the commercial operation date for PPAs that have been signed with PLN but have yet to reach financial close.72
The cost of construction is likely to increase, due to the weakening rupiah and demand from large-scale projects. Construction material costs are likely to increase significantly, with the implementation of large infrastructure projects increasing demand for materials, while recent measures aimed at supporting domestic production drive up cement costs.73 Steel prices also increased in 2017, and Indonesia’s position as a major steel importer means that the depreciation of the rupiah and the potential for rising global prices could further add to the risk of price increases in materials.74,75 Structural issues such as funding gaps, land acquisition issues and implementation delays are likely to remain, although the government has taken steps to attract more private sector funding and improve its PPP framework.
Construction costs outlook ↑ Rising, due to projected currency depreciation and strong demand for construction materials.
PPP equivalent (roadBLOC/m) 10,650/m
2018 estimated cost, local currency unit IDR31,800,000/m
2018 USD estimated cost, market exchange rates USD2,150/m
Costs in Jakarta compared to base (Sydney) Lower local construction cost, taking into account purchasing power parity
Outlook for infrastructure construction Activity likely to increase

70

71
In Pakistan, the infrastructure construction activity outlook is neutral but with high uncertainty. Pakistan has approached IMF for financial assistance though it is unclear if Pakistan will eventually adopt the IMF program, which will likely include some austerity measures. The downward pressure on the rupee as well as cost-push inflation will drive inflationary pressure and increase the cost of construction materials, although the increase may be limited as prices have increased significantly earlier in 2018.
3.2.5 Pakistan

72
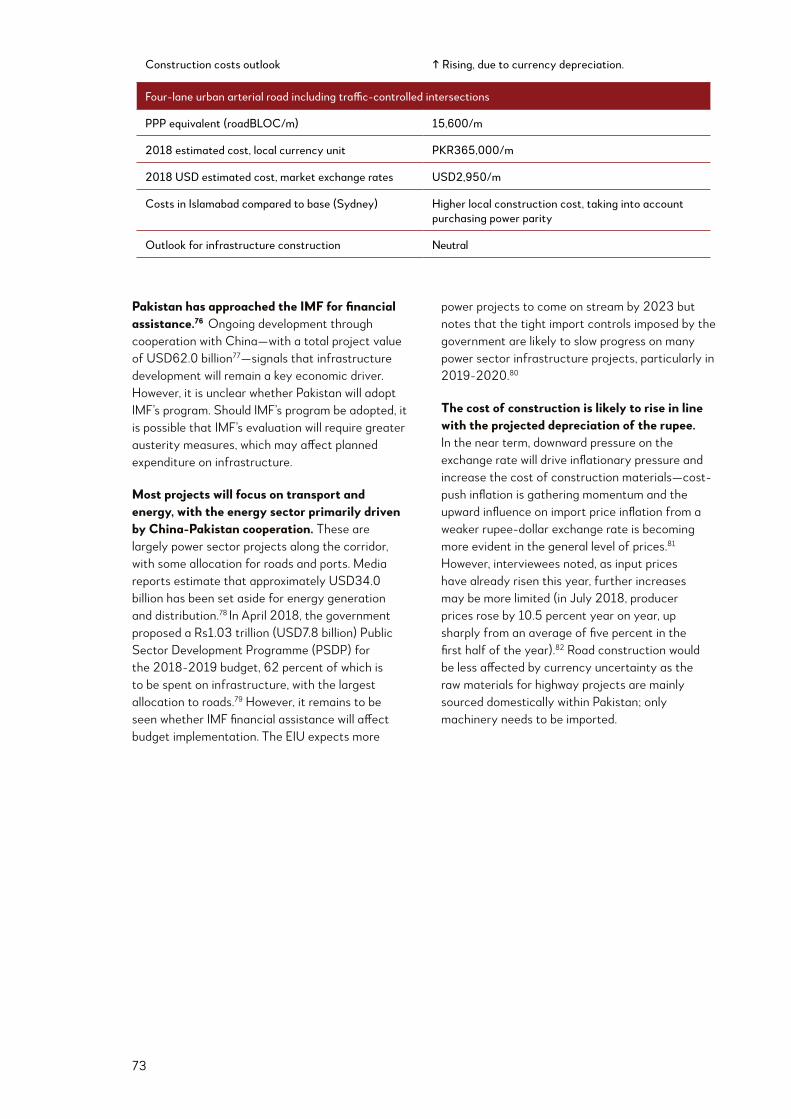
73
Pakistan has approached the IMF for financial assistance.76 Ongoing development through cooperation with China—with a total project value of USD62.0 billion77—signals that infrastructure development will remain a key economic driver. However, it is unclear whether Pakistan will adopt IMF’s program. Should IMF’s program be adopted, it is possible that IMF’s evaluation will require greater austerity measures, which may affect planned expenditure on infrastructure.
Most projects will focus on transport and energy, with the energy sector primarily driven by China-Pakistan cooperation. These are largely power sector projects along the corridor, with some allocation for roads and ports. Media reports estimate that approximately USD34.0 billion has been set aside for energy generation and distribution.78 In April 2018, the government proposed a Rs1.03 trillion (USD7.8 billion) Public Sector Development Programme (PSDP) for the 2018-2019 budget, 62 percent of which is to be spent on infrastructure, with the largest allocation to roads.79 However, it remains to be seen whether IMF financial assistance will affect budget implementation. The EIU expects more
power projects to come on stream by 2023 but notes that the tight import controls imposed by the government are likely to slow progress on many power sector infrastructure projects, particularly in 2019-2020.80
The cost of construction is likely to rise in line with the projected depreciation of the rupee. In the near term, downward pressure on the exchange rate will drive inflationary pressure and increase the cost of construction materials—cost-push inflation is gathering momentum and the upward influence on import price inflation from a weaker rupee-dollar exchange rate is becoming more evident in the general level of prices.81 However, interviewees noted, as input prices have already risen this year, further increases may be more limited (in July 2018, producer prices rose by 10.5 percent year on year, up sharply from an average of five percent in the first half of the year).82 Road construction would be less affected by currency uncertainty as the raw materials for highway projects are mainly sourced domestically within Pakistan; only machinery needs to be imported.
Construction costs outlook ↑ Rising, due to currency depreciation.
PPP equivalent (roadBLOC/m) 15,600/m
2018 estimated cost, local currency unit PKR365,000/m
2018 USD estimated cost, market exchange rates USD2,950/m
Costs in Islamabad compared to base (Sydney) Higher local construction cost, taking into account purchasing power parity
Outlook for infrastructure construction Neutral
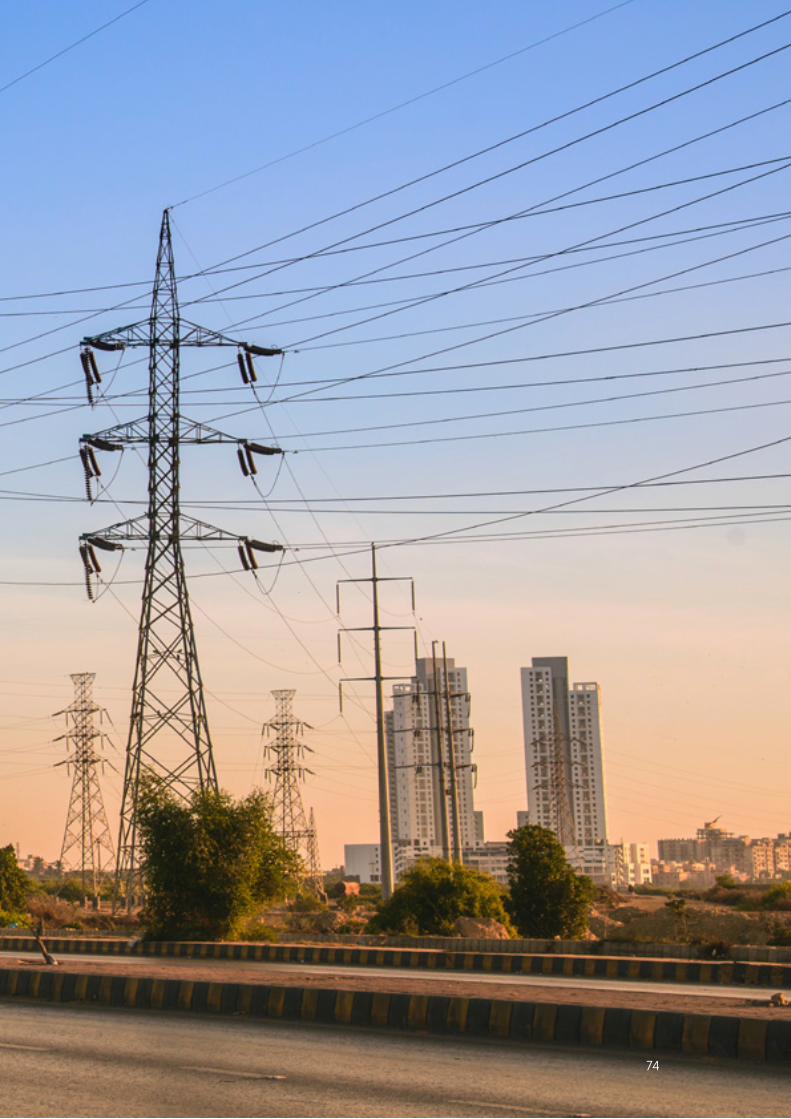
74

75
Infrastructure construction activity in the Philippines looks likely to increase, driven by the government’s state utilities in the Philippines. Authorities tend to underspend as compared to projected pipeline, given institutional constraints. Demand from “Build, Build, Build” and inflationary pressure from the projected depreciation of the peso are likely to drive construction costs up.
3.2.6 Philippines

76
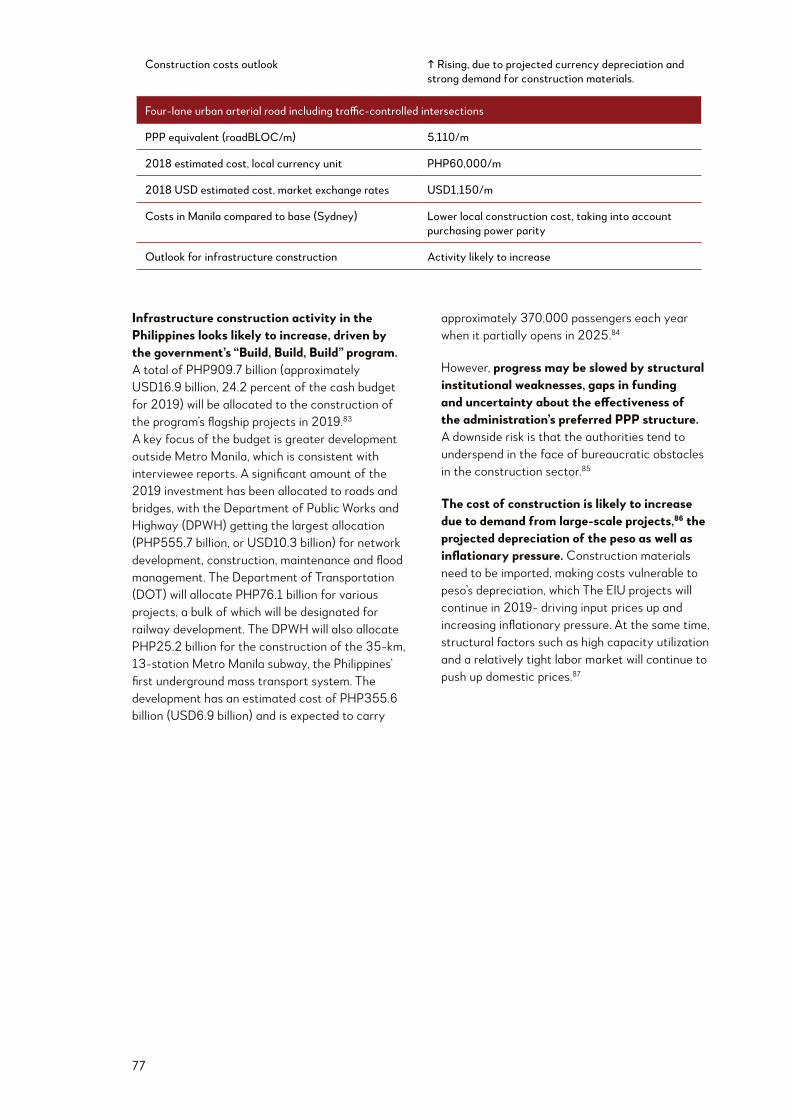
77
Infrastructure construction activity in the Philippines looks likely to increase, driven by the government’s “Build, Build, Build” program. A total of PHP909.7 billion (approximately USD16.9 billion, 24.2 percent of the cash budget for 2019) will be allocated to the construction of the program’s flagship projects in 2019.83 A key focus of the budget is greater development outside Metro Manila, which is consistent with interviewee reports. A significant amount of the 2019 investment has been allocated to roads and bridges, with the Department of Public Works and Highway (DPWH) getting the largest allocation (PHP555.7 billion, or USD10.3 billion) for network development, construction, maintenance and flood management. The Department of Transportation (DOT) will allocate PHP76.1 billion for various projects, a bulk of which will be designated for railway development. The DPWH will also allocate PHP25.2 billion for the construction of the 35-km, 13-station Metro Manila subway, the Philippines’ first underground mass transport system. The development has an estimated cost of PHP355.6 billion (USD6.9 billion) and is expected to carry
approximately 370,000 passengers each year when it partially opens in 2025.84
However, progress may be slowed by structural institutional weaknesses, gaps in funding and uncertainty about the effectiveness of the administration’s preferred PPP structure. A downside risk is that the authorities tend to underspend in the face of bureaucratic obstacles in the construction sector.85
The cost of construction is likely to increase due to demand from large-scale projects,86 the projected depreciation of the peso as well as inflationary pressure. Construction materials need to be imported, making costs vulnerable to peso’s depreciation, which The EIU projects will continue in 2019- driving input prices up and increasing inflationary pressure. At the same time, structural factors such as high capacity utilization and a relatively tight labor market will continue to push up domestic prices.87
Construction costs outlook ↑ Rising, due to projected currency depreciation and strong demand for construction materials.
PPP equivalent (roadBLOC/m) 5,110/m
2018 estimated cost, local currency unit PHP60,000/m
2018 USD estimated cost, market exchange rates USD1,150/m
Costs in Manila compared to base (Sydney) Lower local construction cost, taking into account purchasing power parity
Outlook for infrastructure construction Activity likely to increase

78

79

80
The outlook for infrastructure construction activity in Russia is neutral. Although the government has recently announced a strong push for infrastructure spending, uncertainty over the economic outlook means that fixed investment rates look likely to remain low, constraining infrastructure spending. As such, the outlook has been kept at neutral, pending greater commitment via more detailed infrastructure expenditure plans. The cost of construction is likely to increase, partly due to the potential depreciation of the rouble and flat prices of industrial raw materials leading to growing import costs for construction materials. However, the price increase for road construction inputs may be more muted as some materials are sourced locally.
3.2.7 Russia
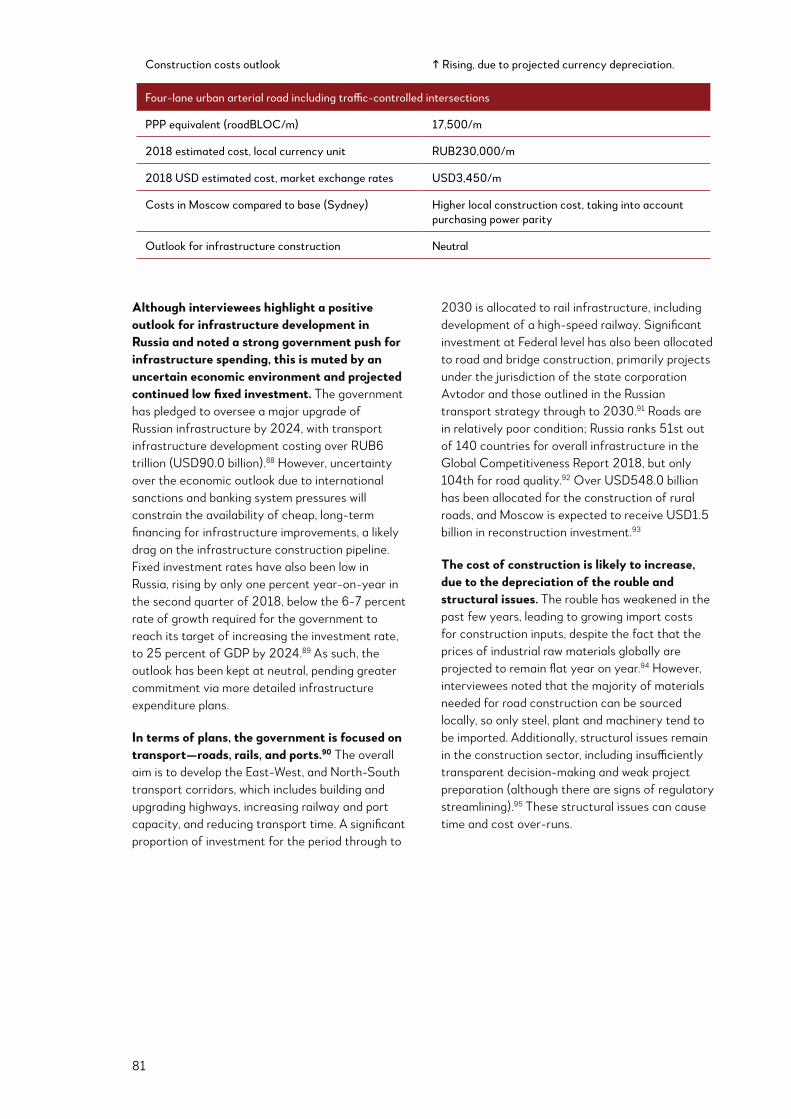
81
Although interviewees highlight a positive outlook for infrastructure development in Russia and noted a strong government push for infrastructure spending, this is muted by an uncertain economic environment and projected continued low fixed investment. The government has pledged to oversee a major upgrade of Russian infrastructure by 2024, with transport infrastructure development costing over RUB6 trillion (USD90.0 billion).88 However, uncertainty over the economic outlook due to international sanctions and banking system pressures will constrain the availability of cheap, long-term financing for infrastructure improvements, a likely drag on the infrastructure construction pipeline. Fixed investment rates have also been low in Russia, rising by only one percent year-on-year in the second quarter of 2018, below the 6-7 percent rate of growth required for the government to reach its target of increasing the investment rate, to 25 percent of GDP by 2024.89 As such, the outlook has been kept at neutral, pending greater commitment via more detailed infrastructure expenditure plans.
In terms of plans, the government is focused on transport—roads, rails, and ports.90 The overall aim is to develop the East-West, and North-South transport corridors, which includes building and upgrading highways, increasing railway and port capacity, and reducing transport time. A significant proportion of investment for the period through to
2030 is allocated to rail infrastructure, including development of a high-speed railway. Significant investment at Federal level has also been allocated to road and bridge construction, primarily projects under the jurisdiction of the state corporation Avtodor and those outlined in the Russian transport strategy through to 2030.91 Roads are in relatively poor condition; Russia ranks 51st out of 140 countries for overall infrastructure in the Global Competitiveness Report 2018, but only 104th for road quality.92 Over USD548.0 billion has been allocated for the construction of rural roads, and Moscow is expected to receive USD1.5 billion in reconstruction investment.93
The cost of construction is likely to increase, due to the depreciation of the rouble and structural issues. The rouble has weakened in the past few years, leading to growing import costs for construction inputs, despite the fact that the prices of industrial raw materials globally are projected to remain flat year on year.94 However, interviewees noted that the majority of materials needed for road construction can be sourced locally, so only steel, plant and machinery tend to be imported. Additionally, structural issues remain in the construction sector, including insufficiently transparent decision-making and weak project preparation (although there are signs of regulatory streamlining).95 These structural issues can cause time and cost over-runs.
Construction costs outlook ↑ Rising, due to projected currency depreciation.
PPP equivalent (roadBLOC/m) 17,500/m
2018 estimated cost, local currency unit RUB230,000/m
2018 USD estimated cost, market exchange rates USD3,450/m
Costs in Moscow compared to base (Sydney) Higher local construction cost, taking into account purchasing power parity
Outlook for infrastructure construction Neutral

82

83
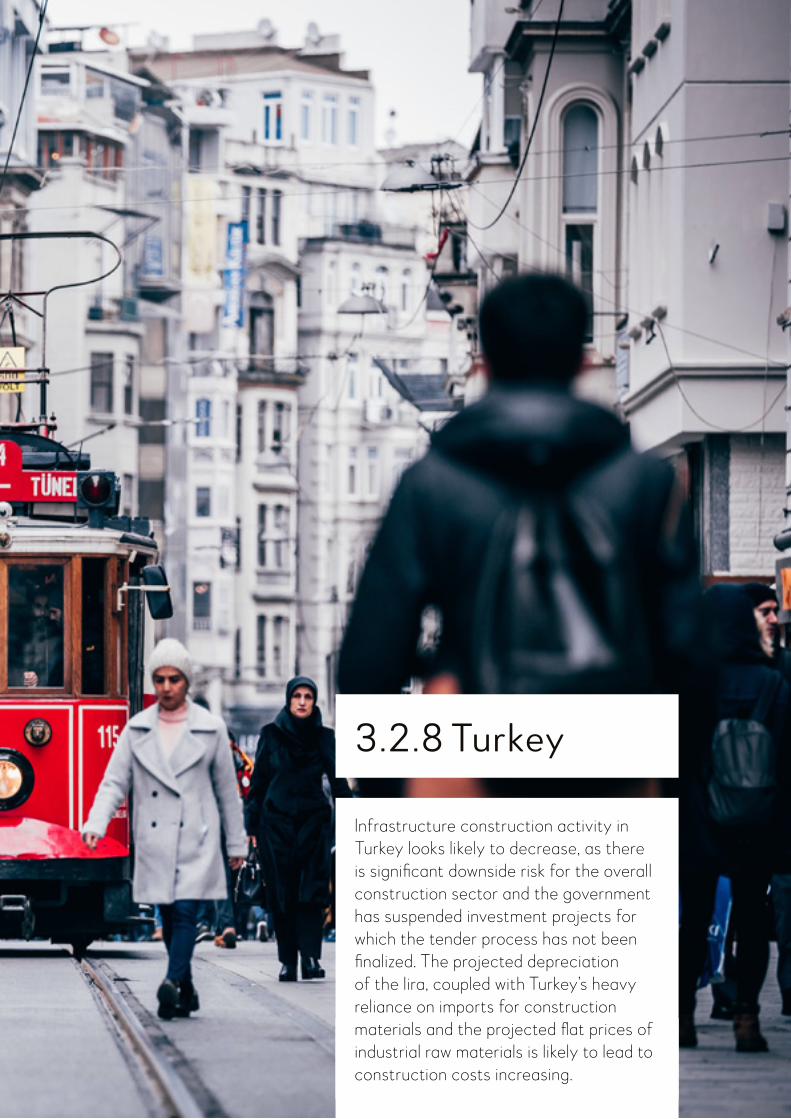
84
Infrastructure construction activity in Turkey looks likely to decrease, as there is significant downside risk for the overall construction sector and the government has suspended investment projects for which the tender process has not been finalized. The projected depreciation of the lira, coupled with Turkey’s heavy reliance on imports for construction materials and the projected flat prices of industrial raw materials is likely to lead to construction costs increasing.
3.2.8 Turkey
85
The depreciation of the lira will hit infrastructure investment and creates a significant downside risk for the construction sector. Turkey has depended on loans (mostly in US dollars) for its infrastructure development, and the rapid depreciation of the lira will drive up servicing costs on high levels of debt. Projects earning in lira but financed in hard currencies will face concerns over viability. Therefore, continued depreciation of the lira, along with macroeconomic uncertainty, is likely to reduce infrastructure investment. However, projects with hard-currency revenues may be less affected.
The projected weakening of the lira also will increase costs. Interviewees noted that Turkey is heavily dependent on imports of fuel, bitumen and similar materials, which means that the depreciation of the lira—along with an
expected pick-up in global oil prices—will increase construction costs.96
The weak macroeconomic environment has forced the government to curtail planned investment. The government aims to upgrade its infrastructure by 2030 through PPP projects worth USD135.0 billion,97 but recent macroeconomic uncertainty has led the it to suspend investment projects for which the tender process has not been finalized,98 and the president has stated that all ministries must review and prioritize projects, which will disrupt the construction pipeline.99 The macroeconomic environment, along with a sharp rise in interest rates will weaken the outlook for the construction sector. This will primarily hit transport, particularly roads, as that is where the bulk of the infrastructure gap is.100
Construction costs outlook ↑ Rising, due to projected currency depreciation and ensuing inflationary pressure.
PPP equivalent (roadBLOC/m) 8,350/m
2018 estimated cost, local currency unit TRY10,000/m
2018 USD estimated cost, market exchange rates USD1,700/m
Costs in Istanbul compared to base (Sydney) Lower local construction cost, taking into account purchasing power parity
Outlook for infrastructure construction Activity likely to decrease
86
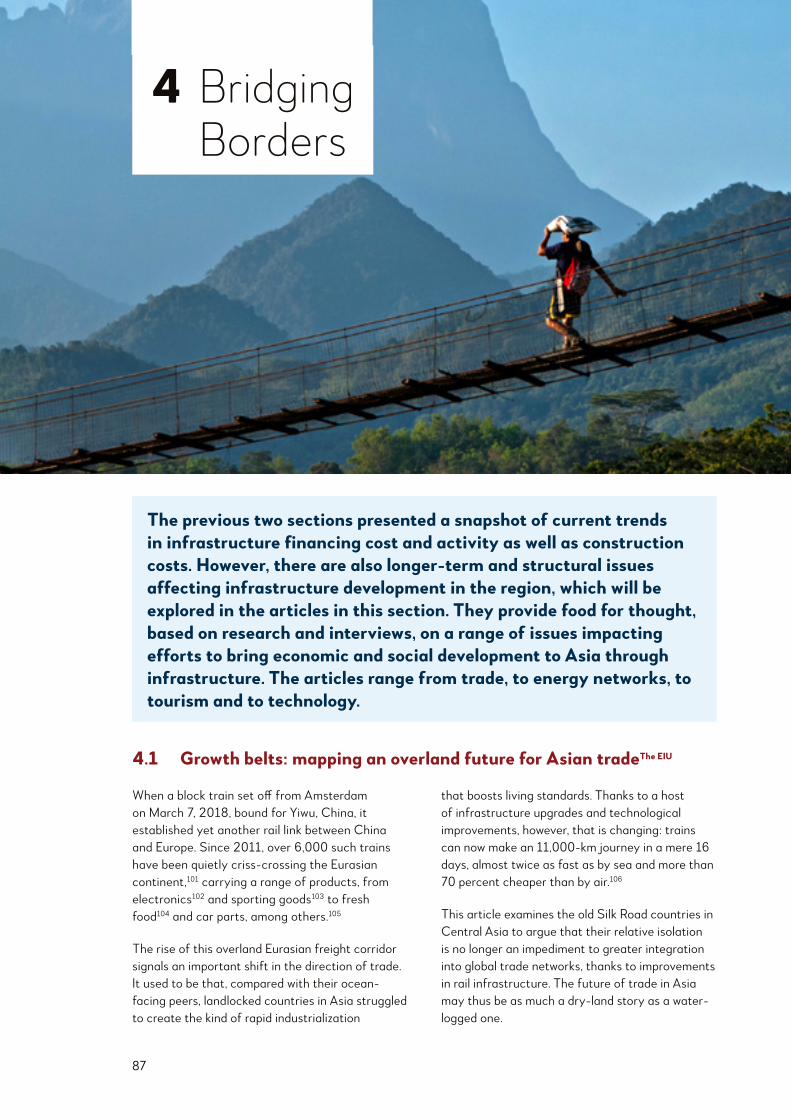
87
4 Bridging Borders
4.1 Growth belts: mapping an overland future for Asian tradeThe EIU
When a block train set off from Amsterdam on March 7, 2018, bound for Yiwu, China, it established yet another rail link between China and Europe. Since 2011, over 6,000 such trains have been quietly criss-crossing the Eurasian continent,101 carrying a range of products, from electronics102 and sporting goods103 to fresh food104 and car parts, among others.105
The rise of this overland Eurasian freight corridor signals an important shift in the direction of trade. It used to be that, compared with their ocean-facing peers, landlocked countries in Asia struggled to create the kind of rapid industrialization
that boosts living standards. Thanks to a host of infrastructure upgrades and technological improvements, however, that is changing: trains can now make an 11,000-km journey in a mere 16 days, almost twice as fast as by sea and more than 70 percent cheaper than by air.106
This article examines the old Silk Road countries in Central Asia to argue that their relative isolation is no longer an impediment to greater integration into global trade networks, thanks to improvements in rail infrastructure. The future of trade in Asia may thus be as much a dry-land story as a water-logged one.
The previous two sections presented a snapshot of current trends in infrastructure financing cost and activity as well as construction costs. However, there are also longer-term and structural issues affecting infrastructure development in the region, which will be explored in the articles in this section. They provide food for thought, based on research and interviews, on a range of issues impacting efforts to bring economic and social development to Asia through infrastructure. The articles range from trade, to energy networks, to tourism and to technology.
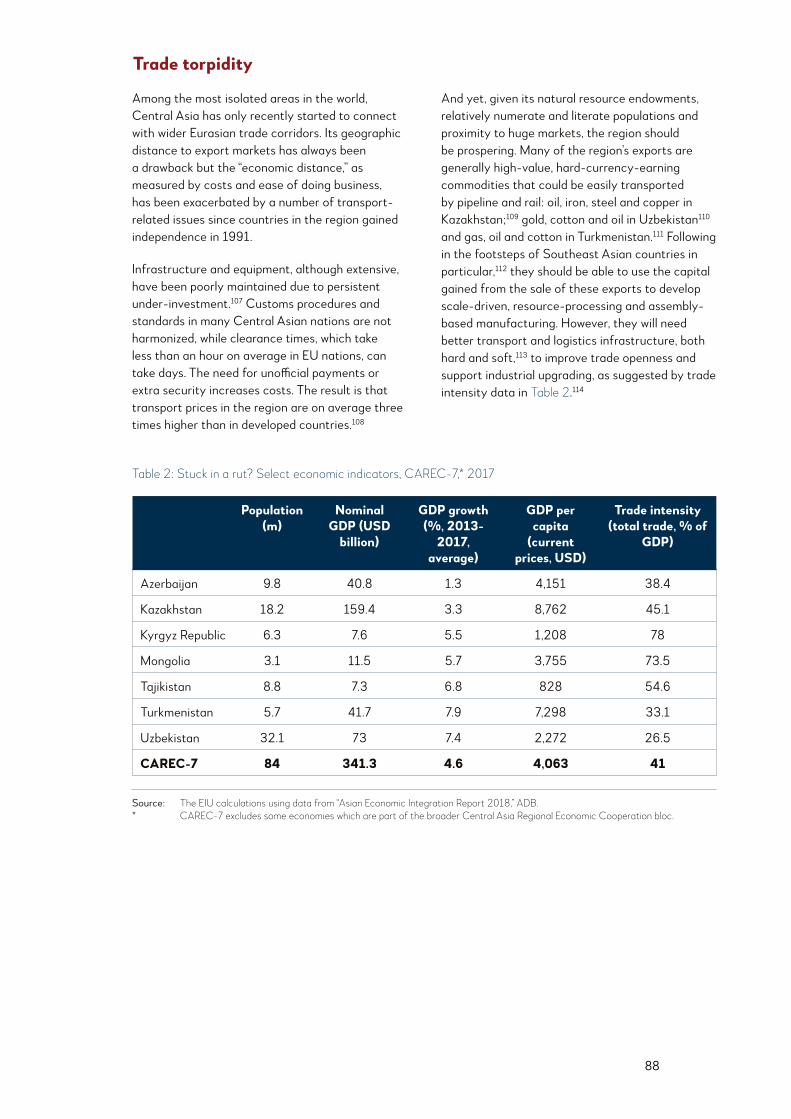
88
Among the most isolated areas in the world, Central Asia has only recently started to connect with wider Eurasian trade corridors. Its geographic distance to export markets has always been a drawback but the “economic distance,” as measured by costs and ease of doing business, has been exacerbated by a number of transport-related issues since countries in the region gained independence in 1991.
Infrastructure and equipment, although extensive, have been poorly maintained due to persistent under-investment.107 Customs procedures and standards in many Central Asian nations are not harmonized, while clearance times, which take less than an hour on average in EU nations, can take days. The need for unofficial payments or extra security increases costs. The result is that transport prices in the region are on average three times higher than in developed countries.108
And yet, given its natural resource endowments, relatively numerate and literate populations and proximity to huge markets, the region should be prospering. Many of the region’s exports are generally high-value, hard-currency-earning commodities that could be easily transported by pipeline and rail: oil, iron, steel and copper in Kazakhstan;109 gold, cotton and oil in Uzbekistan110 and gas, oil and cotton in Turkmenistan.111 Following in the footsteps of Southeast Asian countries in particular,112 they should be able to use the capital gained from the sale of these exports to develop scale-driven, resource-processing and assembly-based manufacturing. However, they will need better transport and logistics infrastructure, both hard and soft,113 to improve trade openness and support industrial upgrading, as suggested by trade intensity data in Table 2.114
Trade torpidity
Population (m)
Nominal GDP (USD
billion)
GDP growth (%, 2013-
2017, average)
GDP per capita
(current prices, USD)
Trade intensity (total trade, % of
GDP)
Azerbaijan 9.8 40.8 1.3 4,151 38.4
Kazakhstan 18.2 159.4 3.3 8,762 45.1
Kyrgyz Republic 6.3 7.6 5.5 1,208 78
Mongolia 3.1 11.5 5.7 3,755 73.5
Tajikistan 8.8 7.3 6.8 828 54.6
Turkmenistan 5.7 41.7 7.9 7,298 33.1
Uzbekistan 32.1 73 7.4 2,272 26.5
CAREC-7 84 341.3 4.6 4,063 41
Table 2: Stuck in a rut? Select economic indicators, CAREC-7,* 2017
Source: The EIU calculations using data from “Asian Economic Integration Report 2018,” ADB.* CAREC-7 excludes some economies which are part of the broader Central Asia Regional Economic Cooperation bloc.
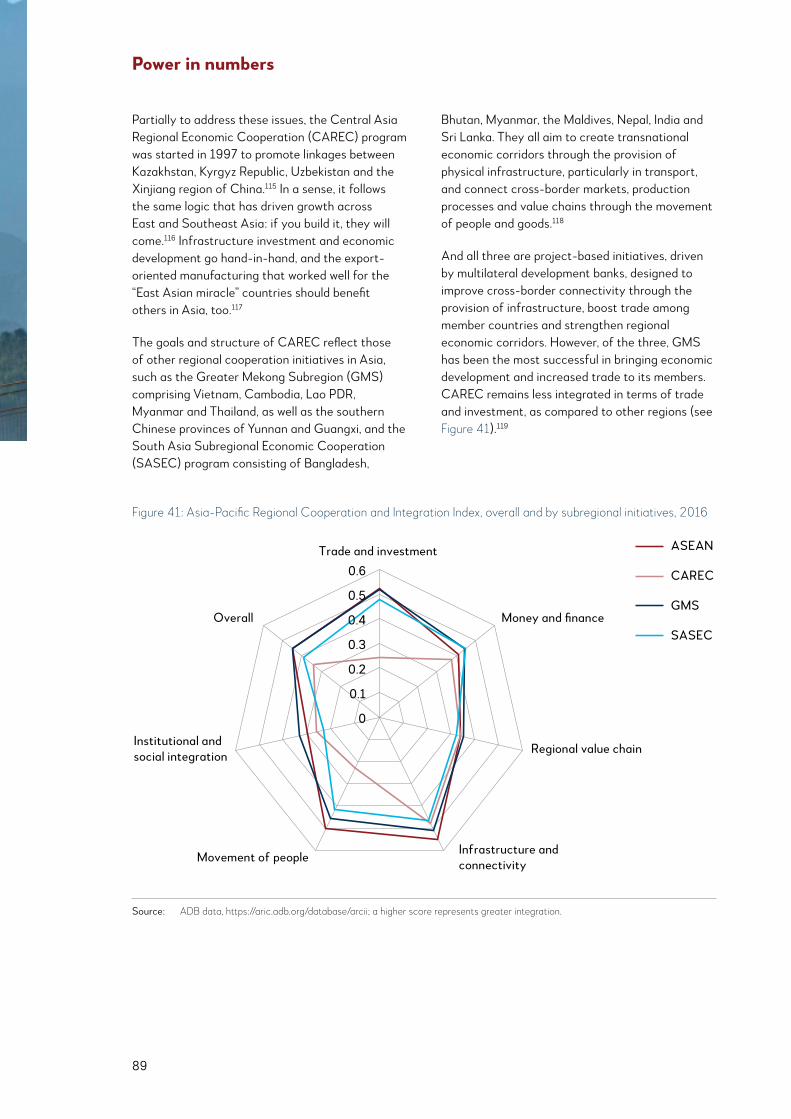
89
Partially to address these issues, the Central Asia Regional Economic Cooperation (CAREC) program was started in 1997 to promote linkages between Kazakhstan, Kyrgyz Republic, Uzbekistan and the Xinjiang region of China.115 In a sense, it follows the same logic that has driven growth across East and Southeast Asia: if you build it, they will come.116 Infrastructure investment and economic development go hand-in-hand, and the export-oriented manufacturing that worked well for the “East Asian miracle” countries should benefit others in Asia, too.117
The goals and structure of CAREC reflect those of other regional cooperation initiatives in Asia, such as the Greater Mekong Subregion (GMS) comprising Vietnam, Cambodia, Lao PDR, Myanmar and Thailand, as well as the southern Chinese provinces of Yunnan and Guangxi, and the South Asia Subregional Economic Cooperation (SASEC) program consisting of Bangladesh,
Bhutan, Myanmar, the Maldives, Nepal, India and Sri Lanka. They all aim to create transnational economic corridors through the provision of physical infrastructure, particularly in transport, and connect cross-border markets, production processes and value chains through the movement of people and goods.118
And all three are project-based initiatives, driven by multilateral development banks, designed to improve cross-border connectivity through the provision of infrastructure, boost trade among member countries and strengthen regional economic corridors. However, of the three, GMS has been the most successful in bringing economic development and increased trade to its members. CAREC remains less integrated in terms of trade and investment, as compared to other regions (see Figure 41).119
Power in numbers
Source: ADB data, https://aric.adb.org/database/arcii; a higher score represents greater integration.
0
0.1
0.2
0.3
0.4
0.5
0.6
Trade and investment
Money and finance
Regional value chain
Infrastructure and connectivityMovement of people
Institutional and social integration
Overall
ASEAN
CAREC
GMS
SASEC
Figure 41: Asia-Pacific Regional Cooperation and Integration Index, overall and by subregional initiatives, 2016
Source: ADB data, https://aric.adb.org/database/arcii; a higher score represents greater integration.
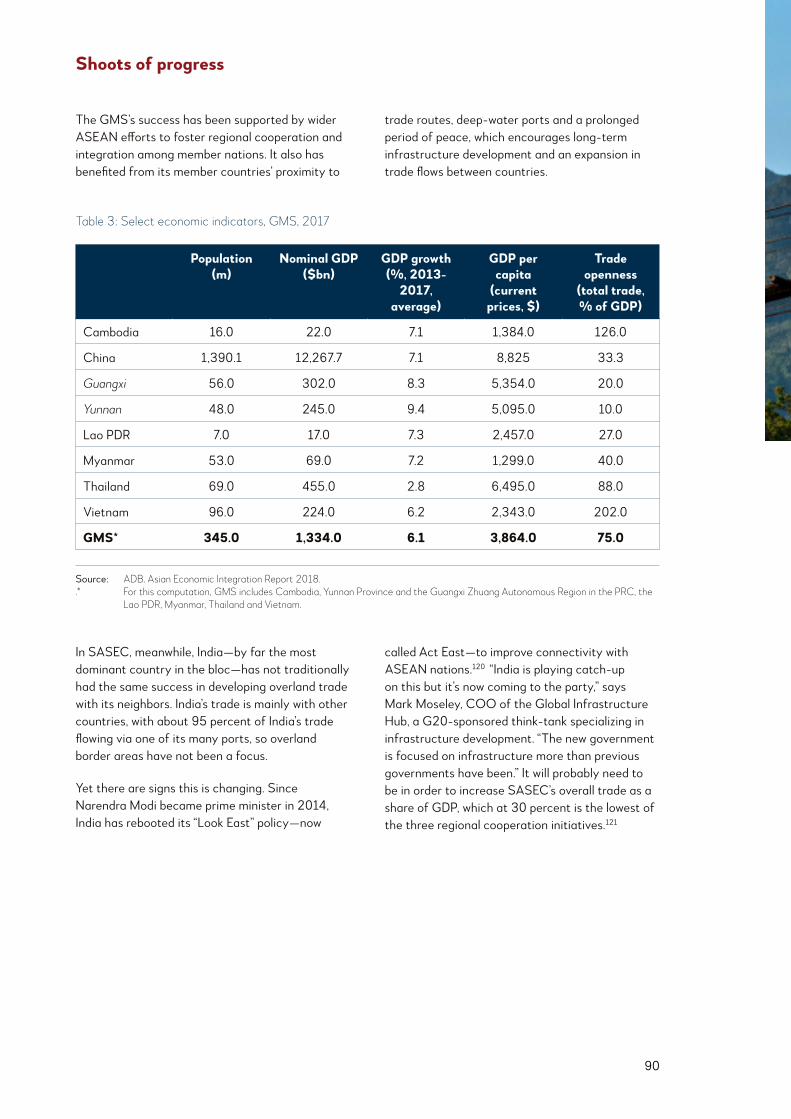
90
The GMS’s success has been supported by wider ASEAN efforts to foster regional cooperation and integration among member nations. It also has benefited from its member countries’ proximity to
trade routes, deep-water ports and a prolonged period of peace, which encourages long-term infrastructure development and an expansion in trade flows between countries.
In SASEC, meanwhile, India—by far the most dominant country in the bloc—has not traditionally had the same success in developing overland trade with its neighbors. India’s trade is mainly with other countries, with about 95 percent of India’s trade flowing via one of its many ports, so overland border areas have not been a focus.
Yet there are signs this is changing. Since Narendra Modi became prime minister in 2014, India has rebooted its “Look East” policy—now
called Act East—to improve connectivity with ASEAN nations.120 “India is playing catch-up on this but it’s now coming to the party,” says Mark Moseley, COO of the Global Infrastructure Hub, a G20-sponsored think-tank specializing in infrastructure development. “The new government is focused on infrastructure more than previous governments have been.” It will probably need to be in order to increase SASEC’s overall trade as a share of GDP, which at 30 percent is the lowest of the three regional cooperation initiatives.121
Shoots of progress
Population (m)
Nominal GDP ($bn)
GDP growth (%, 2013-
2017, average)
GDP per capita
(current prices, $)
Trade openness
(total trade, % of GDP)
Cambodia 16.0 22.0 7.1 1,384.0 126.0
China 1,390.1 12,267.7 7.1 8,825 33.3
Guangxi 56.0 302.0 8.3 5,354.0 20.0
Yunnan 48.0 245.0 9.4 5,095.0 10.0
Lao PDR 7.0 17.0 7.3 2,457.0 27.0
Myanmar 53.0 69.0 7.2 1,299.0 40.0
Thailand 69.0 455.0 2.8 6,495.0 88.0
Vietnam 96.0 224.0 6.2 2,343.0 202.0
GMS* 345.0 1,334.0 6.1 3,864.0 75.0
Table 3: Select economic indicators, GMS, 2017
Source: ADB. Asian Economic Integration Report 2018..* For this computation, GMS includes Cambodia, Yunnan Province and the Guangxi Zhuang Autonomous Region in the PRC, the
Lao PDR, Myanmar, Thailand and Vietnam.
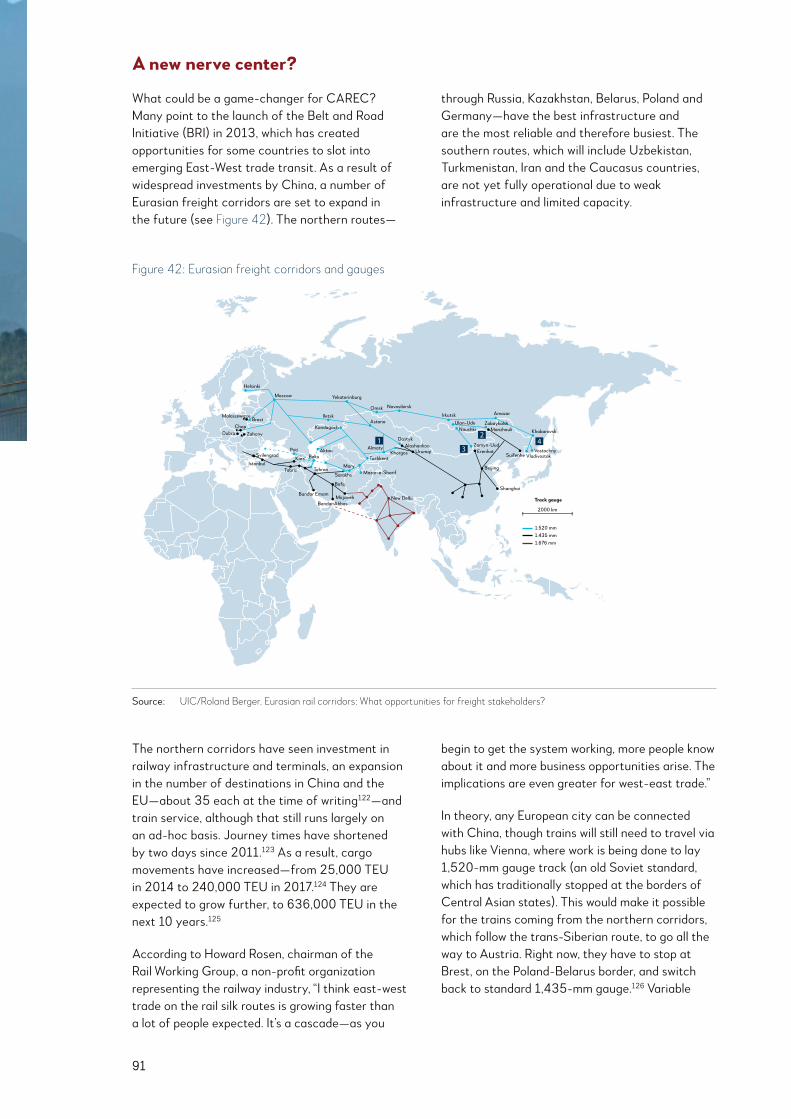
91
What could be a game-changer for CAREC? Many point to the launch of the Belt and Road Initiative (BRI) in 2013, which has created opportunities for some countries to slot into emerging East-West trade transit. As a result of widespread investments by China, a number of Eurasian freight corridors are set to expand in the future (see Figure 42). The northern routes—
through Russia, Kazakhstan, Belarus, Poland and Germany—have the best infrastructure and are the most reliable and therefore busiest. The southern routes, which will include Uzbekistan, Turkmenistan, Iran and the Caucasus countries, are not yet fully operational due to weak infrastructure and limited capacity.
A new nerve center?
The northern corridors have seen investment in railway infrastructure and terminals, an expansion in the number of destinations in China and the EU—about 35 each at the time of writing122—and train service, although that still runs largely on an ad-hoc basis. Journey times have shortened by two days since 2011.123 As a result, cargo movements have increased—from 25,000 TEU in 2014 to 240,000 TEU in 2017.124 They are expected to grow further, to 636,000 TEU in the next 10 years.125
According to Howard Rosen, chairman of the Rail Working Group, a non-profit organization representing the railway industry, “I think east-west trade on the rail silk routes is growing faster than a lot of people expected. It’s a cascade—as you
begin to get the system working, more people know about it and more business opportunities arise. The implications are even greater for west-east trade.”
In theory, any European city can be connected with China, though trains will still need to travel via hubs like Vienna, where work is being done to lay 1,520-mm gauge track (an old Soviet standard, which has traditionally stopped at the borders of Central Asian states). This would make it possible for the trains coming from the northern corridors, which follow the trans-Siberian route, to go all the way to Austria. Right now, they have to stop at Brest, on the Poland-Belarus border, and switch back to standard 1,435-mm gauge.126 Variable
Shanghai
UrumqiAlashankou
Dostyk
Khorgos
Beijing
ErenhotZamyn-Uud
Manzhouli
Amazar
Khabarovsk
1,520 mm
Vostochny
Irkutsk
Suifenhe Vladivostok
NovosibirskOmsk
Yekaterinburg
AstanaIletsk
Moscow
Helsinki
ZahonyDobraChop
Malaszewicze
Kandagach
AktauPoti Almaty
Tashkent
Mazar-e-SharifSarakhsTehranTabriz
Istanbul
Svilengrad
New DelhiMirjaveh
Bafq
Bandar Abbas2000 km
Track gaugeBandar Emam
NaushkiUlan-Ude Zabaykalsk
Mary
BakuKars
Brest
13
24
1,435 mm1,676 mm
Source: UIC/Roland Berger. Eurasian rail corridors: What opportunities for freight stakeholders?
Figure 42: Eurasian freight corridors and gauges
Source: UIC/Roland Berger. Eurasian rail corridors: What opportunities for freight stakeholders?
92
gauge wagons also could become more common and resolve incompatibility issues.
The regional initiatives are also becoming more connected. In addition to an expansion of the northern routes, such as a project linking Mongolia into a spur that joins the trans-Siberian corridor, a number of southern routes are planned that will connect CAREC countries. These will create corridors, and expand on nascent ones, that link China to Turkey through Kazakhstan, Uzbekistan, Turkmenistan, Azerbaijan and Georgia, as well as routes that travel through Afghanistan to connect to ports in Iran and onto Europe by rail.127 Eventually, rail networks in Central Asia may even link with those in SASEC countries.
It is unlikely that rail freight will soon compete with container shipping on price or on volume. It is
still around three to four times the cost of ocean freight and it still represents only 1.2 percent of cargo flows between Europe and Asia by volume128 and just over two percent by value.129 But for higher-value electronics, car parts or perishable food items, the faster times and improved reliability might justify a modal shift. “Rail offers a huge amount of flexibility,” says Mr. Rosen. “Unlike with ships, you can choreograph where cargo ends up. One part of a freight train from China may stop at a distribution point, such as Duisburg, while another part of it carries on to another city, say, Antwerp. Differentiated transport is far better suited as economies become more sophisticated.”
CAREC as engine for growth
This has implications for CAREC. Over the next decade, the economic logic of overland routes will probably warrant an expansion of infrastructure, both hard and soft. Services will become more regular and the increase in traffic should help bring prices down further. The countries along the southern corridors should be more motivated to invest in transport infrastructure, as they will be able to see the benefits it brings. National governments will need to become more aggressive about attracting investment and developing supporting industries, particularly around special economic zones and logistics hubs. They will need to improve the regulatory environment so that it facilitates cross-border trade and travel.
The long-term investment requirements to 2030 are estimated to be USD38 billion on the six designated rail corridors, and more for
maintenance and upgrades. This comprises the 25,200 km that currently exist and another 7,200 that need to be built.130
Failure to take action will mean missing out. “There is now a willingness throughout the region to explore greater connectivity,” says Mr. Moseley. “We should not underestimate the challenges: geographic, geopolitical, political and financing. But governments have realized that fostering additional trade can yield win-win benefits. And what we are seeing is a much more even-handed, multimodal approach.”
With the advent of new transport routes comes the opening of new markets that were previously inaccessible as land-locked regions, and land-locked countries within regions, become easier and faster to reach, potentially changing the nature of trade in Asia for decades to come.
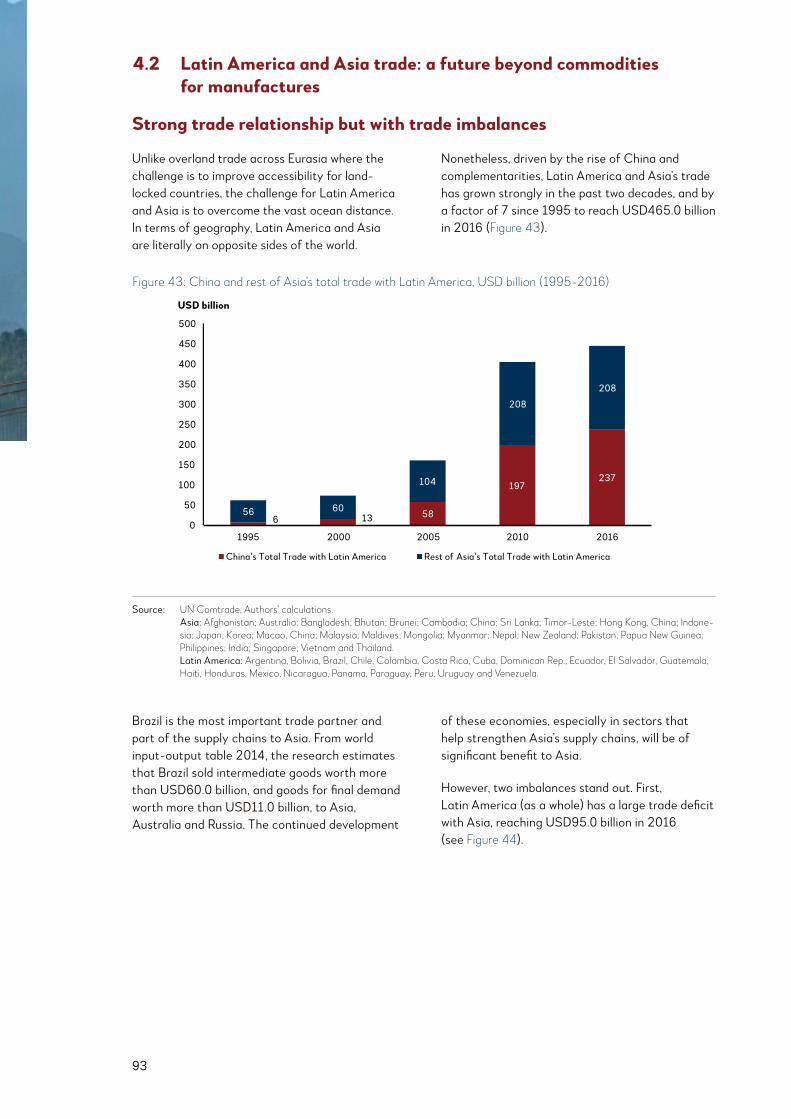
93
4.2 Latin America and Asia trade: a future beyond commodities for manufactures
Unlike overland trade across Eurasia where the challenge is to improve accessibility for land-locked countries, the challenge for Latin America and Asia is to overcome the vast ocean distance. In terms of geography, Latin America and Asia are literally on opposite sides of the world.
Nonetheless, driven by the rise of China and complementarities, Latin America and Asia’s trade has grown strongly in the past two decades, and by a factor of 7 since 1995 to reach USD465.0 billion in 2016 (Figure 43).
Strong trade relationship but with trade imbalances
Figure 43: China and rest of Asia’s total trade with Latin America, USD billion (1995-2016)
6 13 58
197237
56 60
104
208
208
0
50
100
150
200
250
300
350
400
450
500
1995 2000 2005 2010 2016
China's Total Trade with Latin America Rest of Asia's Total Trade with Latin America
USD billion
Source: UN Comtrade, Authors’ Calculations. Asia: Afghanistan; Australia; Bangladesh; Bhutan; Brunei; Cambodia; China; Sri Lanka; Timor-Leste; Hong Kong, China; Indonesia; Japan; Korea; Macao, China; Malaysia; Maldives; Mongolia; Myanmar; Nepal; New Zealand; Pakistan; Papua New Guinea; Philippines; India; Singapore; Vietnam and Thailand. Latin America: Argentina, Bolivia, Brazil, Chile, Colombia, Costa Rica, Cuba, Dominican Rep., Ecuador, El Salvador, Guatemala, Haiti, Honduras, Mexico, Nicaragua, Panama, Paraguay, Peru, Uruguay and Venezuela.
Brazil is the most important trade partner and part of the supply chains to Asia. From world input-output table 2014, the research estimates that Brazil sold intermediate goods worth more than USD60.0 billion, and goods for final demand worth more than USD11.0 billion, to Asia, Australia and Russia. The continued development
of these economies, especially in sectors that help strengthen Asia’s supply chains, will be of significant benefit to Asia.
However, two imbalances stand out. First, Latin America (as a whole) has a large trade deficit with Asia, reaching USD95.0 billion in 2016 (see Figure 44).
Source: UN Comtrade, Authors’ calculations. Asia: Afghanistan; Australia; Bangladesh; Bhutan; Brunei; Cambodia; China; Sri Lanka; Timor-Leste; Hong Kong, China; Indone-sia; Japan; Korea; Macao, China; Malaysia; Maldives; Mongolia; Myanmar; Nepal; New Zealand; Pakistan; Papua New Guinea; Philippines; India; Singapore; Vietnam and Thailand. Latin America: Argentina, Bolivia, Brazil, Chile, Colombia, Costa Rica, Cuba, Dominican Rep., Ecuador, El Salvador, Guatemala, Haiti, Honduras, Mexico, Nicaragua, Panama, Paraguay, Peru, Uruguay and Venezuela.
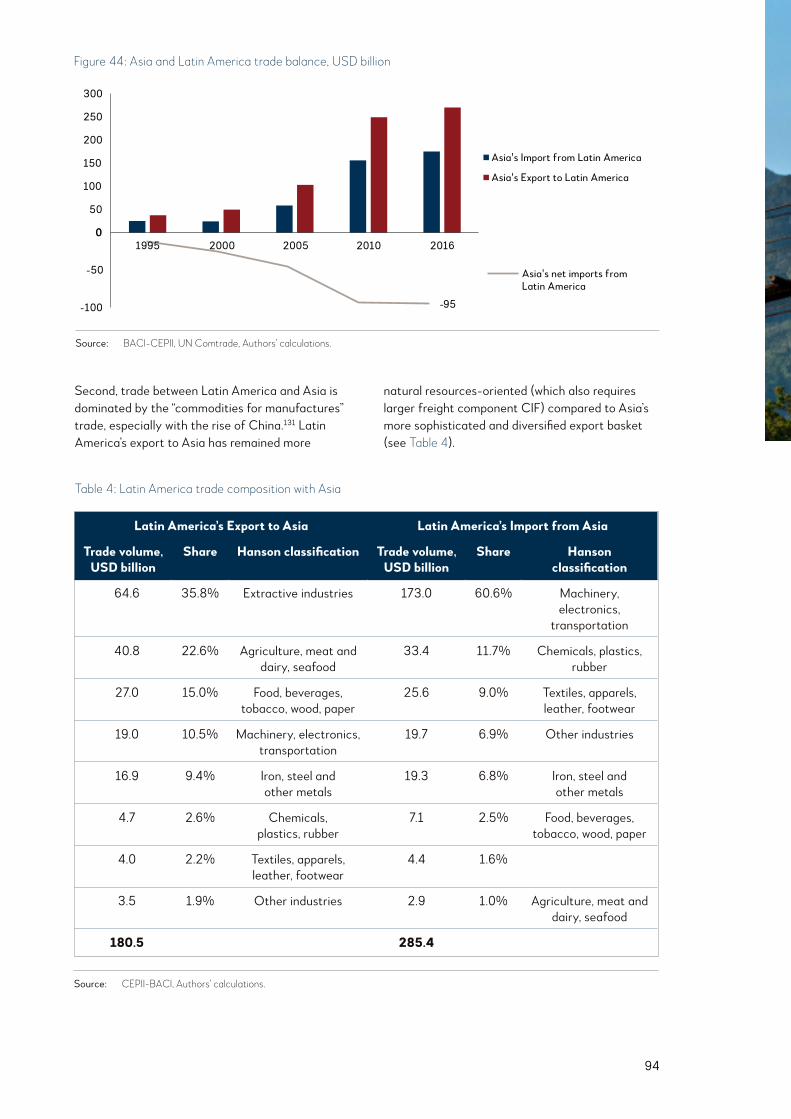
94
Figure 44: Asia and Latin America trade balance, USD billion
Source: BACI-CEPII, UN Comtrade, Authors’ Calculations.
0
50
100
150
200
250
300
2000 2005 2010 2016
Asia's Import from Latin America
Asia's Export to Latin America
-95-100
-50
0
Asia's net imports fromLatin America
1995
Second, trade between Latin America and Asia is dominated by the “commodities for manufactures” trade, especially with the rise of China.131 Latin America’s export to Asia has remained more
natural resources-oriented (which also requires larger freight component CIF) compared to Asia’s more sophisticated and diversified export basket (see Table 4).
Source: BACI-CEPII, UN Comtrade, Authors’ calculations.
Latin America’s Export to Asia Latin America’s Import from Asia
Trade volume, USD billion
Share Hanson classification Trade volume, USD billion
Share Hanson classification
64.6 35.8% Extractive industries 173.0 60.6% Machinery, electronics,
transportation
40.8 22.6% Agriculture, meat and dairy, seafood
33.4 11.7% Chemicals, plastics, rubber
27.0 15.0% Food, beverages, tobacco, wood, paper
25.6 9.0% Textiles, apparels, leather, footwear
19.0 10.5% Machinery, electronics, transportation
19.7 6.9% Other industries
16.9 9.4% Iron, steel and other metals
19.3 6.8% Iron, steel and other metals
4.7 2.6% Chemicals, plastics, rubber
7.1 2.5% Food, beverages, tobacco, wood, paper
4.0 2.2% Textiles, apparels, leather, footwear
4.4 1.6%
3.5 1.9% Other industries 2.9 1.0% Agriculture, meat and dairy, seafood
180.5 285.4
Table 4: Latin America trade composition with Asia
Source: CEPII-BACI, Authors’ calculations.
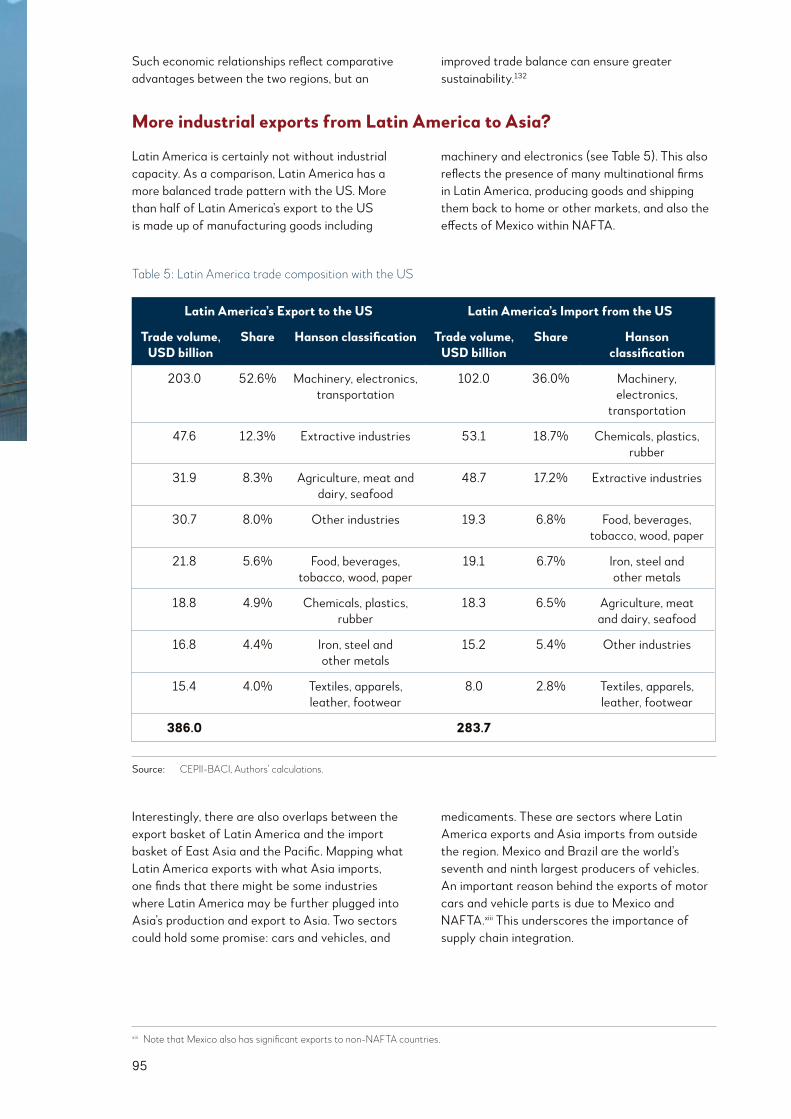
95
Latin America is certainly not without industrial capacity. As a comparison, Latin America has a more balanced trade pattern with the US. More than half of Latin America’s export to the US is made up of manufacturing goods including
machinery and electronics (see Table 5). This also reflects the presence of many multinational firms in Latin America, producing goods and shipping them back to home or other markets, and also the effects of Mexico within NAFTA.
More industrial exports from Latin America to Asia?
Latin America’s Export to the US Latin America’s Import from the US
Trade volume, USD billion
Share Hanson classification Trade volume, USD billion
Share Hanson classification
203.0 52.6% Machinery, electronics, transportation
102.0 36.0% Machinery, electronics,
transportation
47.6 12.3% Extractive industries 53.1 18.7% Chemicals, plastics, rubber
31.9 8.3% Agriculture, meat and dairy, seafood
48.7 17.2% Extractive industries
30.7 8.0% Other industries 19.3 6.8% Food, beverages, tobacco, wood, paper
21.8 5.6% Food, beverages, tobacco, wood, paper
19.1 6.7% Iron, steel and other metals
18.8 4.9% Chemicals, plastics, rubber
18.3 6.5% Agriculture, meat and dairy, seafood
16.8 4.4% Iron, steel and other metals
15.2 5.4% Other industries
15.4 4.0% Textiles, apparels, leather, footwear
8.0 2.8% Textiles, apparels, leather, footwear
386.0 283.7
Table 5: Latin America trade composition with the US
Interestingly, there are also overlaps between the export basket of Latin America and the import basket of East Asia and the Pacific. Mapping what Latin America exports with what Asia imports, one finds that there might be some industries where Latin America may be further plugged into Asia’s production and export to Asia. Two sectors could hold some promise: cars and vehicles, and
medicaments. These are sectors where Latin America exports and Asia imports from outside the region. Mexico and Brazil are the world’s seventh and ninth largest producers of vehicles. An important reason behind the exports of motor cars and vehicle parts is due to Mexico and NAFTA.xiii This underscores the importance of supply chain integration.
Such economic relationships reflect comparative advantages between the two regions, but an
improved trade balance can ensure greater sustainability.132
Source: CEPII-BACI, Authors’ calculations.
xiii Note that Mexico also has significant exports to non-NAFTA countries.
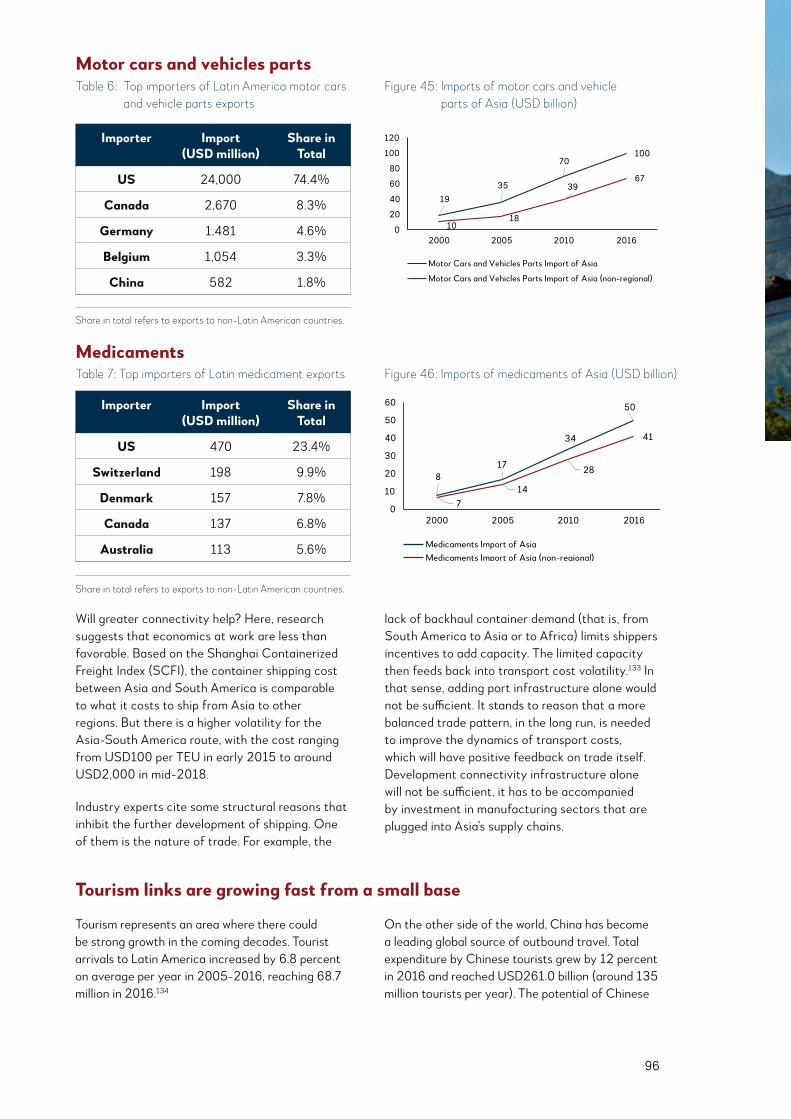
96
Will greater connectivity help? Here, research suggests that economics at work are less than favorable. Based on the Shanghai Containerized Freight Index (SCFI), the container shipping cost between Asia and South America is comparable to what it costs to ship from Asia to other regions. But there is a higher volatility for the Asia-South America route, with the cost ranging from USD100 per TEU in early 2015 to around USD2,000 in mid-2018.
Industry experts cite some structural reasons that inhibit the further development of shipping. One of them is the nature of trade. For example, the
lack of backhaul container demand (that is, from South America to Asia or to Africa) limits shippers incentives to add capacity. The limited capacity then feeds back into transport cost volatility.133 In that sense, adding port infrastructure alone would not be sufficient. It stands to reason that a more balanced trade pattern, in the long run, is needed to improve the dynamics of transport costs, which will have positive feedback on trade itself. Development connectivity infrastructure alone will not be sufficient, it has to be accompanied by investment in manufacturing sectors that are plugged into Asia’s supply chains.
Motor cars and vehicles parts
19
35
70100
1018
3967
0
20
40
60
80
100
120
2000 2005 2010 2016
Motor Cars and Vehicles Parts Import of Asia
Motor Cars and Vehicles Parts Import of Asia (non-regional)
Table 6: Top importers of Latin America motor cars and vehicle parts exports
Importer Import (USD million)
Share in Total
US 24,000 74.4%
Canada 2,670 8.3%
Germany 1,481 4.6%
Belgium 1,054 3.3%
China 582 1.8%
Figure 45: Imports of motor cars and vehicle parts of Asia (USD billion)
Table 7: Top importers of Latin medicament exports
Importer Import (USD million)
Share in Total
US 470 23.4%
Switzerland 198 9.9%
Denmark 157 7.8%
Canada 137 6.8%
Australia 113 5.6%
817
34
50
714
28
41
0
10
20
30
40
50
60
2000 2005 2010 2016
Medicaments Import of AsiaMedicaments Import of Asia (non-regional)
Figure 46: Imports of medicaments of Asia (USD billion)
Medicaments
Share in total refers to exports to non-Latin American countries.
Share in total refers to exports to non-Latin American countries.
Tourism represents an area where there could be strong growth in the coming decades. Tourist arrivals to Latin America increased by 6.8 percent on average per year in 2005-2016, reaching 68.7 million in 2016.134
On the other side of the world, China has become a leading global source of outbound travel. Total expenditure by Chinese tourists grew by 12 percent in 2016 and reached USD261.0 billion (around 135 million tourists per year). The potential of Chinese
Tourism links are growing fast from a small base
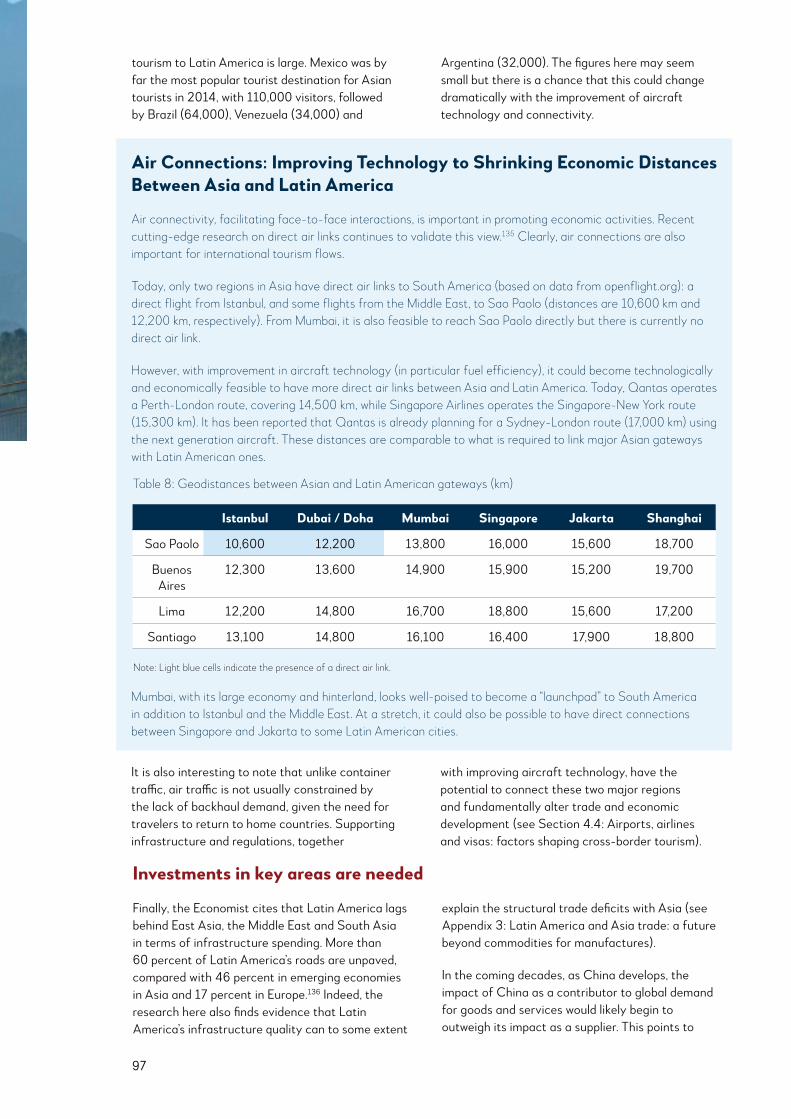
97
Air Connections: Improving Technology to Shrinking Economic Distances Between Asia and Latin America
Air connectivity, facilitating face-to-face interactions, is important in promoting economic activities. Recent cutting-edge research on direct air links continues to validate this view.135 Clearly, air connections are also important for international tourism flows.
Today, only two regions in Asia have direct air links to South America (based on data from openflight.org): a direct flight from Istanbul, and some flights from the Middle East, to Sao Paolo (distances are 10,600 km and 12,200 km, respectively). From Mumbai, it is also feasible to reach Sao Paolo directly but there is currently no direct air link.
However, with improvement in aircraft technology (in particular fuel efficiency), it could become technologically and economically feasible to have more direct air links between Asia and Latin America. Today, Qantas operates a Perth-London route, covering 14,500 km, while Singapore Airlines operates the Singapore-New York route (15,300 km). It has been reported that Qantas is already planning for a Sydney-London route (17,000 km) using the next generation aircraft. These distances are comparable to what is required to link major Asian gateways with Latin American ones.
Mumbai, with its large economy and hinterland, looks well-poised to become a “launchpad” to South America in addition to Istanbul and the Middle East. At a stretch, it could also be possible to have direct connections between Singapore and Jakarta to some Latin American cities.
Istanbul Dubai / Doha Mumbai Singapore Jakarta Shanghai
Sao Paolo 10,600 12,200 13,800 16,000 15,600 18,700
Buenos Aires
12,300 13,600 14,900 15,900 15,200 19,700
Lima 12,200 14,800 16,700 18,800 15,600 17,200
Santiago 13,100 14,800 16,100 16,400 17,900 18,800
Note: Light blue cells indicate the presence of a direct air link.
Table 8: Geodistances between Asian and Latin American gateways (km)
It is also interesting to note that unlike container traffic, air traffic is not usually constrained by the lack of backhaul demand, given the need for travelers to return to home countries. Supporting infrastructure and regulations, together
with improving aircraft technology, have the potential to connect these two major regions and fundamentally alter trade and economic development (see Section 4.4: Airports, airlines and visas: factors shaping cross-border tourism).
Finally, the Economist cites that Latin America lags behind East Asia, the Middle East and South Asia in terms of infrastructure spending. More than 60 percent of Latin America’s roads are unpaved, compared with 46 percent in emerging economies in Asia and 17 percent in Europe.136 Indeed, the research here also finds evidence that Latin America’s infrastructure quality can to some extent
explain the structural trade deficits with Asia (see Appendix 3: Latin America and Asia trade: a future beyond commodities for manufactures).
In the coming decades, as China develops, the impact of China as a contributor to global demand for goods and services would likely begin to outweigh its impact as a supplier. This points to
Investments in key areas are needed
tourism to Latin America is large. Mexico was by far the most popular tourist destination for Asian tourists in 2014, with 110,000 visitors, followed by Brazil (64,000), Venezuela (34,000) and
Argentina (32,000). The figures here may seem small but there is a chance that this could change dramatically with the improvement of aircraft technology and connectivity.
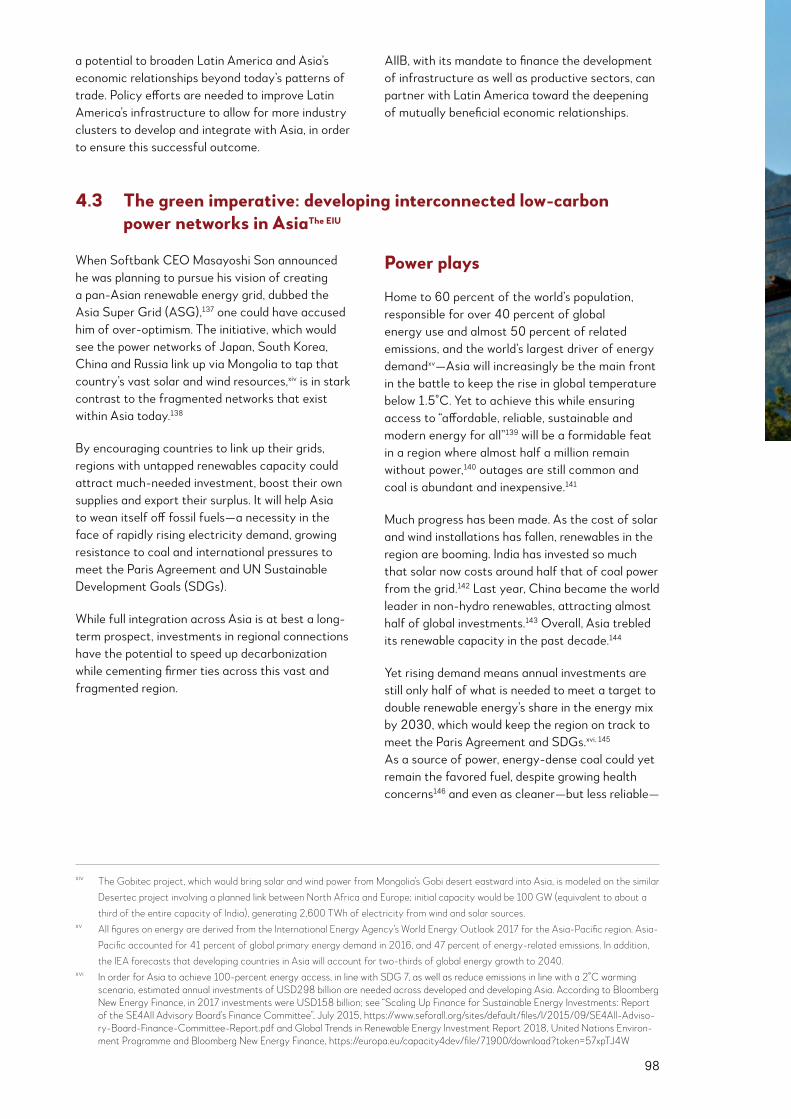
98
a potential to broaden Latin America and Asia’s economic relationships beyond today’s patterns of trade. Policy efforts are needed to improve Latin America’s infrastructure to allow for more industry clusters to develop and integrate with Asia, in order to ensure this successful outcome.
AIIB, with its mandate to finance the development of infrastructure as well as productive sectors, can partner with Latin America toward the deepening of mutually beneficial economic relationships.
4.3 The green imperative: developing interconnected low-carbon power networks in AsiaThe EIU
When Softbank CEO Masayoshi Son announced he was planning to pursue his vision of creating a pan-Asian renewable energy grid, dubbed the Asia Super Grid (ASG),137 one could have accused him of over-optimism. The initiative, which would see the power networks of Japan, South Korea, China and Russia link up via Mongolia to tap that country’s vast solar and wind resources,xiv is in stark contrast to the fragmented networks that exist within Asia today.138
By encouraging countries to link up their grids, regions with untapped renewables capacity could attract much-needed investment, boost their own supplies and export their surplus. It will help Asia to wean itself off fossil fuels—a necessity in the face of rapidly rising electricity demand, growing resistance to coal and international pressures to meet the Paris Agreement and UN Sustainable Development Goals (SDGs).
While full integration across Asia is at best a long-term prospect, investments in regional connections have the potential to speed up decarbonization while cementing firmer ties across this vast and fragmented region.
Power plays
Home to 60 percent of the world’s population, responsible for over 40 percent of global energy use and almost 50 percent of related emissions, and the world’s largest driver of energy demandxv—Asia will increasingly be the main front in the battle to keep the rise in global temperature below 1.5°C. Yet to achieve this while ensuring access to “affordable, reliable, sustainable and modern energy for all”139 will be a formidable feat in a region where almost half a million remain without power,140 outages are still common and coal is abundant and inexpensive.141
Much progress has been made. As the cost of solar and wind installations has fallen, renewables in the region are booming. India has invested so much that solar now costs around half that of coal power from the grid.142 Last year, China became the world leader in non-hydro renewables, attracting almost half of global investments.143 Overall, Asia trebled its renewable capacity in the past decade.144
Yet rising demand means annual investments are still only half of what is needed to meet a target to double renewable energy’s share in the energy mix by 2030, which would keep the region on track to meet the Paris Agreement and SDGs.xvi, 145 As a source of power, energy-dense coal could yet remain the favored fuel, despite growing health concerns146 and even as cleaner—but less reliable—
xiv The Gobitec project, which would bring solar and wind power from Mongolia’s Gobi desert eastward into Asia, is modeled on the similar Desertec project involving a planned link between North Africa and Europe; initial capacity would be 100 GW (equivalent to about a third of the entire capacity of India), generating 2,600 TWh of electricity from wind and solar sources.
xv All figures on energy are derived from the International Energy Agency’s World Energy Outlook 2017 for the Asia-Pacific region. Asia-Pacific accounted for 41 percent of global primary energy demand in 2016, and 47 percent of energy-related emissions. In addition, the IEA forecasts that developing countries in Asia will account for two-thirds of global energy growth to 2040.
xvi In order for Asia to achieve 100-percent energy access, in line with SDG 7, as well as reduce emissions in line with a 2°C warming scenario, estimated annual investments of USD298 billion are needed across developed and developing Asia. According to Bloomberg New Energy Finance, in 2017 investments were USD158 billion; see “Scaling Up Finance for Sustainable Energy Investments: Report of the SE4All Advisory Board’s Finance Committee”, July 2015, https://www.seforall.org/sites/default/files/l/2015/09/SE4All-Adviso-ry-Board-Finance-Committee-Report.pdf and Global Trends in Renewable Energy Investment Report 2018, United Nations Environ-ment Programme and Bloomberg New Energy Finance, https://europa.eu/capacity4dev/file/71900/download?token=57xpTJ4W

99
Best of both watts
In economic terms, connections over larger geographies mean countries can take advantage of different time zones to sell power to their neighbors while their own people sleep, which makes sense for intermittent renewables like wind, which can blow day or night. “If you have a larger grid, you can transfer power as the sun moves,” says Eric Martinot, professor of management and
economics at Beijing Institute of Technology. Distance matters in Asia, where some of the richest resources are in far-flung, less populated areas. Mongolia, with just three million people, has a wind power potential twice the current global installed capacity.154 China suffers from supply bottlenecks in its own windy north,155 India is struggling to expand its grid infrastructure in line with a recent explosion in solar farms in the west and south,xviii, 156 and across South Asia, 83 percent
Figure 47: Electricity trade, select Asian countries, 2016
-10.00
-5.00
0.00
5.00
10.00
15.00
20.00
25.00
30.00
35.00
40.00
-5000
-2500
0
2500
5000
7500
10000
12500
15000
17500
20000
%
GW
h
Net electricity imports (GWh)*
Bangladesh India Nepal Sri Lanka Thailand
Electricity imports as % of totaldomestic electricityconsumption#
*Source: BIMSTEC Energy Outlook 2030, South Asia Regional Initiative for Energy Integration, December 2017, https://sari-energy.org/wp-content/uploads/2018/03/SARI-EI-Report-on-BIMSTEC-Energy-Outlook-2030-Rajiv-SARI-EI-IRADe.pdf#Source: EIU calculations based on Statistics, International Energy Agency, https://www.iea.org/statistics, accessed Nov. 23, 2018.
*Source: BIMSTEC Energy Outlook 2030, South Asia Regional Initiative for Energy Integration, December 2017, https://sari-energy.org/wp-content/uploads/2018/03/SARI-EI-Report-on-BIMSTEC-Energy-Outlook-2030-Rajiv-SARI-EI-IRADe.pdf
#Source: EIU calculations based on ibid and Statistics, International Energy Agency, https://www.iea.org/statistics, accessed Nov. 23, 2018.
renewables overtake coal in terms of megawatts installed.xvii, 147 This is leading Asian nations to seek new ways to secure supply—including turning to their neighbors for green power.
Node to nowhere?
Compared with Europe’s long-established electricity market, where member states trade on average 11 percent of their electricity, power structures within Asia are a disjointed affair.148 The vast distances and differences in terrain, infrastructure and demand mean that overall trade in electricity consumed is estimated at less than one percent, while some big users, like Japan and South Korea, are not connected to any neighboring grids.149
Where links exist, they mainly involve bilateral agreements to export excess capacity, especially climate-dependent hydropower, on to neighbors. Bhutan, which has a 100-percent electrification rate, is the most active exporter, channeling about 70 percent of the electricity it produces via run-of-the-river hydropower onward to India (India, in turn, helped finance three major dams that generate most of the country’s power150).151 Lao PDR, thanks to its favorable position on the Mekong River, has been exporting traditional hydropower to Thailand since the 1970s; it recently expanded its links such that around 60 percent of its electricity now flows beyond its borders.152, 153
xvii According to the IEA, the generation capacity of renewables in the Asia-Pacific region is expected to double between 2016 and 2025. However, it will take until 2040 for generation to equal coal’s, by which time capacity should be some 3.7 times current levels.
xviii Solar capacity is currently 25 GW but will need to grow substantially to reach a governmental target of 100 GW by 2022; however, supply is still concentrated in a handful of states with ample resources (mainly in the west and south), leading to supply bottle-necks. See Saumy Prateek, “Green Energy Corridor is Underfunded, Says Standing Committee on Energy”, Mercom India, March 19, 2018, https://mercomindia.com/green-energy-corridor-underfunded/ and Rahul Tongia, “Embarrassment of riches? The rise of RE in India and steps to manage ‘surplus’ electricity”, Brookings Institute, June 15, 2018, https://www.brookings.edu/blog/planetpo-licy/2018/06/15/embarrassment-of-riches-the-rise-of-re-in-india-and-steps-to-manage-surplus-electricity/

100
of hydro resources, much of which are in remote mountain areas, have yet to be exploited.157
A plan to link up the grids of the eight countries that make up the South Asian Association for Regional Cooperation (SAARC) could add 36 GW of (mainly hydro) capacity—more than the current supply of all SAARC members outside of India combined—while reaping an estimated USD9 billion in annual net savings up to 2040.158 However, building all the necessary transmission infrastructure is just one of many hurdles to powering up the region. “Regional power plans are very challenging,” says Rajiv Panda, head-technical of the South Asia Regional Initiative for Energy Integration, established in 2000 with the goal of facilitating cross-border energy trade, improving regional energy security and clean energy development. So far, trade still only takes place on a bilateral basis (though Bangladesh may soon purchase hydropower from Nepal and Bhutan via
India).159 Among the issues to iron out are licensing agreements, harmonizing technical standards and guidelines on transmission pricing. With the price of storage falling quickly, countries will also need to weigh the costs and benefits of large-scale, complex transmissions projects against localized and distributed forms of energy that can be deployed more rapidly.xix, 160 Tetsunari Iida, chairperson of the Institute for Sustainable Energy Policies in Japan, would like to see more of that, as the share of renewables in Japan’s power mix is just 15 percent of the total, despite rapid expansion in recent years.161 Yet others argue that localized grids, while helpful in increasing energy access in various areas, fundamentally do not shift energy from energy-abundant places to areas of market demand. The following lists summarize a number of additional challenges and opportunities of regional power grids, drawn from examples in ASEAN.
Costs
• Cost of transmission infrastructure. A current ASEAN Power Grid (APG) plan is estimated to cost USD20 billion.
• Time and monetary costs of negotiations, such as licensing agreements, harmonizing technical standards and guidelines on transmission pricing.
• Sacrificing localized and distributed forms of energy projects, in which energy is consumed closer to the point of generation.
Benefits
• Increasing clean electricity capacity. Natural gas accounts for about two-thirds of power generation in Thailand as domestic reserves of petroleum and coal are limited. In order to reduce gas dependency and
maintain power security, Thailand’s electricity imports have tripled in the past decade.
• Saving billions in energy expenditure. Power integration in the Greater Mekong Subregion has resulted in USD14.3 billion in savings.
• Reducing energy wastage. The primary goal of the Singapore-Malaysia interconnection since 1983 is power stability and peak demand support.
• Raising interdependencies within the region, and ultimately, stability. The Thailand-Lao PDR hydropower interconnection established in 1971 is one of the longest-standing power cooperation initiatives in the region.
• Boosting economic integration.
xix Utility-scale renewable energy projects are typically cheaper on a per-KWh basis than smaller off-grid projects. However, if off-grid storage improves, the dynamic could change. The International Renewables Energy Agency (IRENA) forecasts that battery storage costs could fall by another 50-60 percent by 2030, with fuel cell costs falling even more sharply.
Note: All data cited in the above figure are sourced from Development Prospects of the ASEAN Power Sector: Towards an Inte-grated Electricity Market, International Energy Agency, 2015, https://www.researchgate.net/profile/Aaron_Praktiknjo/publica-tion/282860529_Development_Prospects_of_the_ASEAN_Power_Sector/links/561fc7d208aea35f267e0abe/Develop-ment-Prospects-of-the-ASEAN-Power-Sector.pdf
Both the SAARC and APG projects aim to adopt a market-based trading system in the vein of Scandinavia’s NordPool, which was established to balance intermittent hydropower from Norway
with thermal supplies from its neighbors, helping lower prices for consumers. It is now the largest international power trading market, pooling diverse sources, including wind power from Denmark and
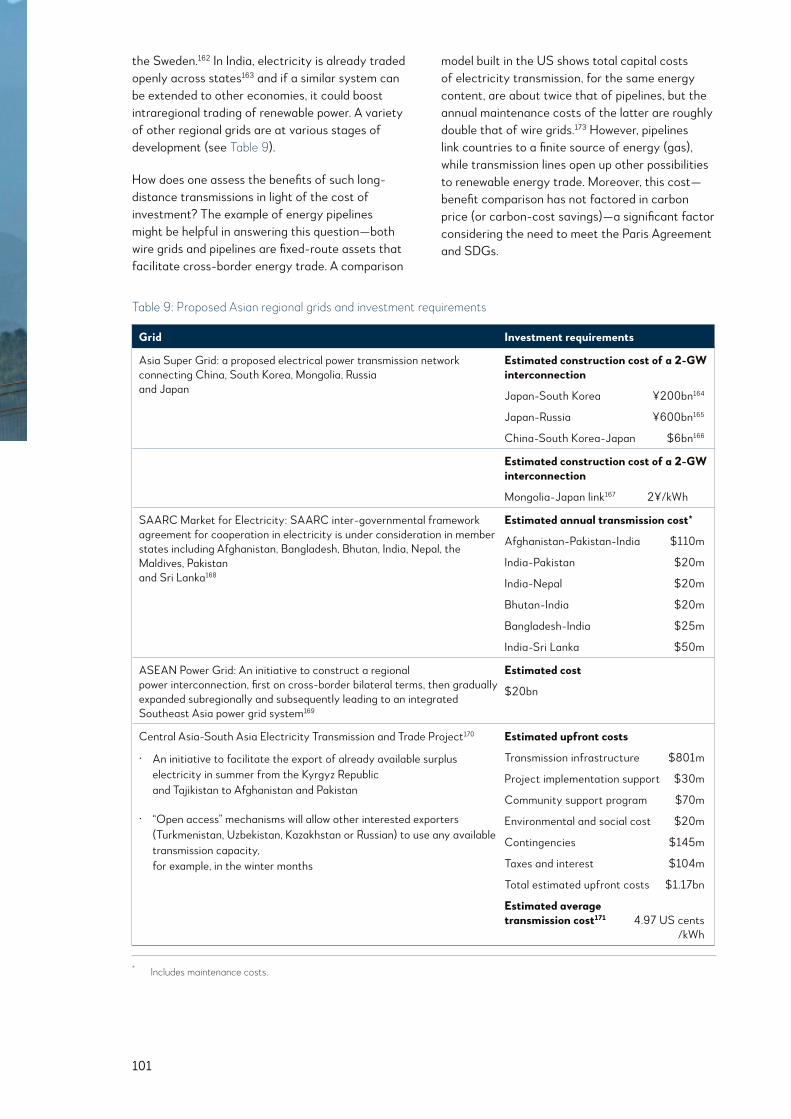
101
* Includes maintenance costs.
Grid Investment requirements
Asia Super Grid: a proposed electrical power transmission network connecting China, South Korea, Mongolia, Russia and Japan
Estimated construction cost of a 2-GW interconnection
Japan-South Korea ¥200bn164
Japan-Russia ¥600bn165
China-South Korea-Japan $6bn166
Estimated construction cost of a 2-GW interconnection
Mongolia-Japan link167 2¥/kWh
SAARC Market for Electricity: SAARC inter-governmental framework agreement for cooperation in electricity is under consideration in member states including Afghanistan, Bangladesh, Bhutan, India, Nepal, the Maldives, Pakistan and Sri Lanka168
Estimated annual transmission cost*
Afghanistan-Pakistan-India $110m
India-Pakistan $20m
India-Nepal $20m
Bhutan-India $20m
Bangladesh-India $25m
India-Sri Lanka $50m
ASEAN Power Grid: An initiative to construct a regional power interconnection, first on cross-border bilateral terms, then gradually expanded subregionally and subsequently leading to an integrated Southeast Asia power grid system169
Estimated cost
$20bn
Central Asia-South Asia Electricity Transmission and Trade Project170
• An initiative to facilitate the export of already available surplus electricity in summer from the Kyrgyz Republic and Tajikistan to Afghanistan and Pakistan
• “Open access” mechanisms will allow other interested exporters (Turkmenistan, Uzbekistan, Kazakhstan or Russian) to use any available transmission capacity, for example, in the winter months
Estimated upfront costs
Transmission infrastructure $801m
Project implementation support $30m
Community support program $70m
Environmental and social cost $20m
Contingencies $145m
Taxes and interest $104m
Total estimated upfront costs $1.17bn
Estimated average transmission cost171 4.97 US cents /kWh
Table 9: Proposed Asian regional grids and investment requirements
the Sweden.162 In India, electricity is already traded openly across states163 and if a similar system can be extended to other economies, it could boost intraregional trading of renewable power. A variety of other regional grids are at various stages of development (see Table 9).
How does one assess the benefits of such long-distance transmissions in light of the cost of investment? The example of energy pipelines might be helpful in answering this question—both wire grids and pipelines are fixed-route assets that facilitate cross-border energy trade. A comparison
model built in the US shows total capital costs of electricity transmission, for the same energy content, are about twice that of pipelines, but the annual maintenance costs of the latter are roughly double that of wire grids.173 However, pipelines link countries to a finite source of energy (gas), while transmission lines open up other possibilities to renewable energy trade. Moreover, this cost—benefit comparison has not factored in carbon price (or carbon-cost savings)—a significant factor considering the need to meet the Paris Agreement and SDGs.
102
Deeper ties
Such regional grid initiatives could potentially pave the way for economic ties in other areas, too, and create interdependencies that can add to regional cohesion. In Central Asia, when construction recently started on a project to connect Tajikistan and the Kyrgyz Republic—which have surplus hydropower—to Afghanistan and Pakistan, Afghanistan’s president hailed it as an opportunity to bring “peace and stability” to the region.173
South Korea’s president, Moon Jae-in, is also a strong proponent of regional power integration and backer of the ASG, which he sees as a means both to exploit renewable resources (South Korea currently derives about two percent of its power from renewables, a figure barely changed for the last 20 years174 ) as well as deepen regional ties. He has called on Russia to take part;175 South Korean and Chinese grid operators have already signed a cooperation agreement.176 North Korea has yet to formally join the ASG, but Mika Ohbayashi, director of the Japan-based Renewable Energy Institute, which is overseeing development of the ASG, believes a China-Russia-North Korea connection is likely and that the grid could even be a way to help stabilize the peninsula. “We have to find some way to help North Korea grow economically and renewable electricity is a must,” she says.
A wealth of flows
Asia has huge untapped potential for renewables, and regional networks could help develop more capacity, boost access and support stronger economic integration. But regional power grids will not happen overnight. Europe’s grid has been connected for over half a century and still only a tenth of power is traded among member states; Asia’s most developed interconnection projects, in South Asia and ASEAN, have each been in planning for around two decades and are only now taking their first steps toward multilateral trade.177
As for the ASG, Ms. Ohbayashi reckons it will take some more years for Japan to connect to the rest of the Korean peninsula (the project has yet to receive formal government backing) but that it should happen, given the need to reach the goals set forth in the Paris Agreement. “I cannot imagine that Japan will not be connected by 2050,” she says. “If Japan tries to reduce 80 percent of its emissions, 100 percent of renewable energy has to be realized and of course we need interconnections.” Whatever the eventual timeframe, what is clear is that further connections within Asia are likely, making regional power grids one more weapon in the climate change arsenal.
4.4 Airports, airlines and visas: factors shaping cross-border tourism
Tourism as a driver for development
International tourism has attracted far less attention than the trade in goods despite the fact that it is a truly global industry, accounting for seven percent of the world’s exports in goods and services.xx And, in the past decade, tourism exports exceeded manufacturing exports in four out of 10 developing countries.178 It is said to be the
“passport to development” by the World Bank and a source of “untapped potential” by the DFID.xxi International tourism grew at an average annual rate of 4.2 percent between 1995 and 2016 (from around 524 million to 1,245 million international arrivals). The countries in Asia and the Oceania saw even faster growth as seven percent per annum, reaching almost 400 million arrivals in 2016 (see Figure 48).xxii The share of Asia and
xx Based on UNWTO estimates for year 2016.xxi Research work has supported these views. For example, Sequeira and Nunes (2008) show that tourism specialization has a positive
impact on economic growth. Similarly, Arezki et al. (2009) found that tourism specialization, as instrumented by the UN World Heritage sites, increases annual growth rates over the period of 1980 to 2002. Using Mexican microdata to estimate a quantitative spatial equi-librium model, Faber and Gaubert (2016) found that tourism generates large and significant local economic gains, which are partly driven by the significantly positive spillovers on manufacturing. They also saw national gains from tourism that mainly come from the classical market integration effect. World Bank (1979) means for the report on Tourism: passport to development? Perspectives on the social and cultural effects of tourism on developing countries. DFID (1999) means for the report on Tourism and poverty elimination: untapped potential.
xxii Based on the World Bank’s WDI dataset. In 2016, there were 55 economies with available data. These include Armenia; American Samoa; Australia; Azerbaijan; Bahrain; Brunei Darussalam; Bhutan; China; Cyprus; Fiji; Micronesia States; Georgia; Guam; Hong Kong, China; In-donesia; India; Iran; Israel; Jordan; Japan; Kazakhstan; Kyrgyz Republic; Cambodia; Kiribati; Korea; Lao PDR; Lebanon; Sri Lanka; Macao, China; Maldives; Marshall Islands; Myanmar; Mongolia; Northern Mariana Islands; Malaysia; New Caledonia; Nepal; New Zealand; Oman; Philippines; Palau; West Bank and Gaza; French Polynesia; Qatar; Saudi Arabia; Singapore; Solomon Islands; Thailand; Timor-Leste; Tonga; Turkey; Tuvalu; Vietnam; Vanuatu and Samoa.

103
Figure 48: International tourism: World, Asia, Pacific
1,400
1,200
1,000
800
600
400
200
0
35
33
31
29
27
25
23
21
19
171995 2000 2005 2010 2015
No. of Arrivals in Asia and the Pacific No. of the World ArrivalsShare of Asia and the Pacific over the World
No. of arrivals,millions
Share of Asia andthe Pacific in %
Source: Authors’ calculations based on the World Bank’s WDI data.*Source: Authors’ calculations based on the World Bank’s WDI data.
Oceania in international tourism also increased from 18 percent in 1995 to more than 30 percent in 2016. Clearly many countries in the region are tapping into their potential, particularly China, which had the largest number of foreign visitors in 2016 at 59.3 million as well as Thailand (32.5 million),
Turkey (30.3 million), Malaysia (26.8 million) and Hong Kong, China (26.6 million). Other countries are growing their tourism more quickly but from a smaller base, such as Bhutan, which increased its international arrivals by 11 times from 2006 to 2016, Georgia by 5.5 times and Myanmar by 3.6 times (see Figure 49).
Figure 49: Fast-growing international arrivals in Asia and Pacific
Source: Authors’ calculations based on the World Bank’s WDI data.
NCLPYFWSM
2.5
5.0
7.5
10.0
12.5
0 20 40 60International Arrivals in 2016 (1,000,000 persons)
Ratio
of
2016
ove
r 200
6
International Arrivals in 2016 vs. Growth Rate between 2006 and 2016
CHN
THA
TUR
MYS
JPN
HKG
BTN
KOR
VNM
IDN
IND
SAU
MAC
NZL
SGP
KAZ
JORGUMMNPMNG
KIR
CYP
AUS
VUTFSM
BHR
ISRLBN
IRN
PHL
KHMQAT
KGZ
GEO
LKAPSE
PLW
MMRTUV
ARM
TON
MDV FJI
NPL
OMNLAO
Source: Authors’ calculations based on the World Bank’s WDI data.
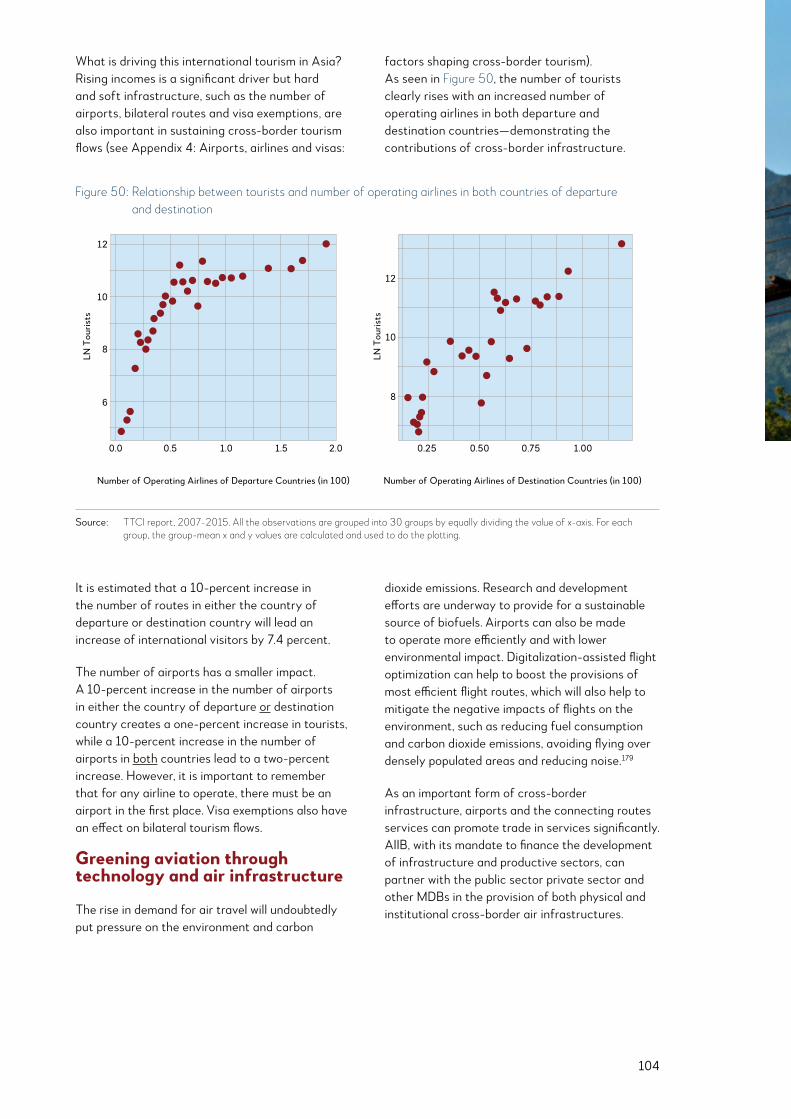
104
What is driving this international tourism in Asia? Rising incomes is a significant driver but hard and soft infrastructure, such as the number of airports, bilateral routes and visa exemptions, are also important in sustaining cross-border tourism flows (see Appendix 4: Airports, airlines and visas:
factors shaping cross-border tourism). As seen in Figure 50, the number of tourists clearly rises with an increased number of operating airlines in both departure and destination countries—demonstrating the contributions of cross-border infrastructure.
Figure 50: Relationship between tourists and number of operating airlines in both countries of departure and destination
12
12
10
8
10
8
6
0.0 0.25 0.50 0.75 1.000.5 1.0
Number of Operating Airlines of Departure Countries (in 100) Number of Operating Airlines of Destination Countries (in 100)
LN T
ouris
ts
LN T
ouris
ts
1.5 2.0
Source: TTCI report, 2007-2015. All the observations are grouped into 30 groups by equally dividing the value of x-axis. For each group, the group-mean x and y values are calculated and used to do the plotting.Source: TTCI report, 2007-2015. All the observations are grouped into 30 groups by equally dividing the value of x-axis. For each
group, the group-mean x and y values are calculated and used to do the plotting.
It is estimated that a 10-percent increase in the number of routes in either the country of departure or destination country will lead an increase of international visitors by 7.4 percent.
The number of airports has a smaller impact. A 10-percent increase in the number of airports in either the country of departure or destination country creates a one-percent increase in tourists, while a 10-percent increase in the number of airports in both countries lead to a two-percent increase. However, it is important to remember that for any airline to operate, there must be an airport in the first place. Visa exemptions also have an effect on bilateral tourism flows.
Greening aviation through technology and air infrastructure
The rise in demand for air travel will undoubtedly put pressure on the environment and carbon
dioxide emissions. Research and development efforts are underway to provide for a sustainable source of biofuels. Airports can also be made to operate more efficiently and with lower environmental impact. Digitalization-assisted flight optimization can help to boost the provisions of most efficient flight routes, which will also help to mitigate the negative impacts of flights on the environment, such as reducing fuel consumption and carbon dioxide emissions, avoiding flying over densely populated areas and reducing noise.179
As an important form of cross-border infrastructure, airports and the connecting routes services can promote trade in services significantly. AIIB, with its mandate to finance the development of infrastructure and productive sectors, can partner with the public sector private sector and other MDBs in the provision of both physical and institutional cross-border air infrastructures.
105
Imagine ships that pilot themselves, ports manned by robots and contracts that execute automatically when goods are delivered. Just as technology has enabled a transformation in shopping and delivery for consumers in recent years, new innovations in Asian infrastructure are likely to improve complicated international supply chains by cutting paperwork, reducing cost, saving time and enhancing transparency and trust. These technological improvements, combined with upgrades in physical infrastructure, have the potential to accelerate trade integration within Asia. However, significant variation in the cost and availability of underlying internet infrastructure, a key enabler of all new trade technologies, could mean countries that are not upgrading quickly enough could miss out on some of the benefits these trends will bring, with potential consequences for broader economic development.
Intelligence, upgraded
There are three key areas in which technology has the potential to improve “business as usual” in supply chains: information, trust and transport. Many of the enabling technologies, such as distributed ledger technology (DLT) and artificial intelligence (AI), overlap across these three areas, bringing challenges as well as opportunities. The main questions revolve not around whether these innovations will find their way into regional supply chains, but the speed and consistency of their adoption.
Online supply chain information has been available, to some extent, for a generation. However, the rise of the Internet of Things (IoT) and exponentially higher storage and computing power mean the quantity of data is now so large that big-data analytical tools, and, increasingly, AI, are needed to make sense of it.180 Two-thirds of supply chain leaders already expect big-data analytics to be of critical importance by 2020.181
Technological upgrades to infrastructure based on blockchain will also make inroads. The advantages of DLT, of which blockchains and cryptocurrencies are examples, include information flows that are collaborative, rather than just one-way document exchanges (as with electronic data interchanges, or EDI), and that are more transparent and auditable, including reducing fraud from duplicate invoicing. In addition, DLT creates the possibility
of using smart contracts that trigger events such as ownership transfer and payment, speeding up processes and cutting out intermediaries. Receipt of a delivery can trigger payment through a range of methods including letter of credits, the release of fiat currency funds in an escrow account or even direct payment using cryptocurrency tokens embedded in the contracts. Smart contracts can also mediate payments and refunds of sales taxes and customs duties.182
The integration of DLT builds on longstanding efforts to digitize paper-heavy trade processes, with EDI standards dating back 30 years,183 as well as more recent regional efforts such as the 2016 UNESCAP Framework Agreement on Facilitation of Cross-Border Paperless Trade in Asia184 and the Asia-Pacific Model E-Port Network, a 2015 Asia-Pacific Economic Cooperation initiative of 16 ports, which may soon trial blockchain technology for customs clearance in China.185
Kasey Kaplan, Asia-Pacific managing director for the Blockchain in Transport Alliance, an industry standards organization, says that DLT will roll out first “in elements of the supply chain that don’t touch government regulation, such as verification and tracking.” The biggest impact may come when DLT reaches customs processes: the World Bank estimates that documentary and border compliance can together take several days on average at both export and import points,186 a lag that proponents of the technology are hoping to reduce or eliminate. This, however, is “going to take more time,” says Mr. Kaplan, “because policy, producers and technology are all going to need to change.”
The hard infrastructure of ports will need to incorporate automation, robotics and analytics-inspired optimizations to match the ever-rising technological savvy of supply chain players. In May 2017, the Qingdao New Qianwan Automatic Container Terminal became Asia’s first fully automated port, combining automatic quay and stacking cranes with driverless vehicles to move containers between ships and storage, cutting costs by 70 percent and improving efficiency by 30 percent.187 This level of automation may become the norm at major greenfield ports, such as Singapore’s giant Tuas Port, while existing ports are likely to be gradually retrofitted with partial automation, as is happening in Indonesia’s freight transport program.188
4.5 Infrastructure 3.0: how new technologies will facilitate intra-Asian trade and integrationThe EIU
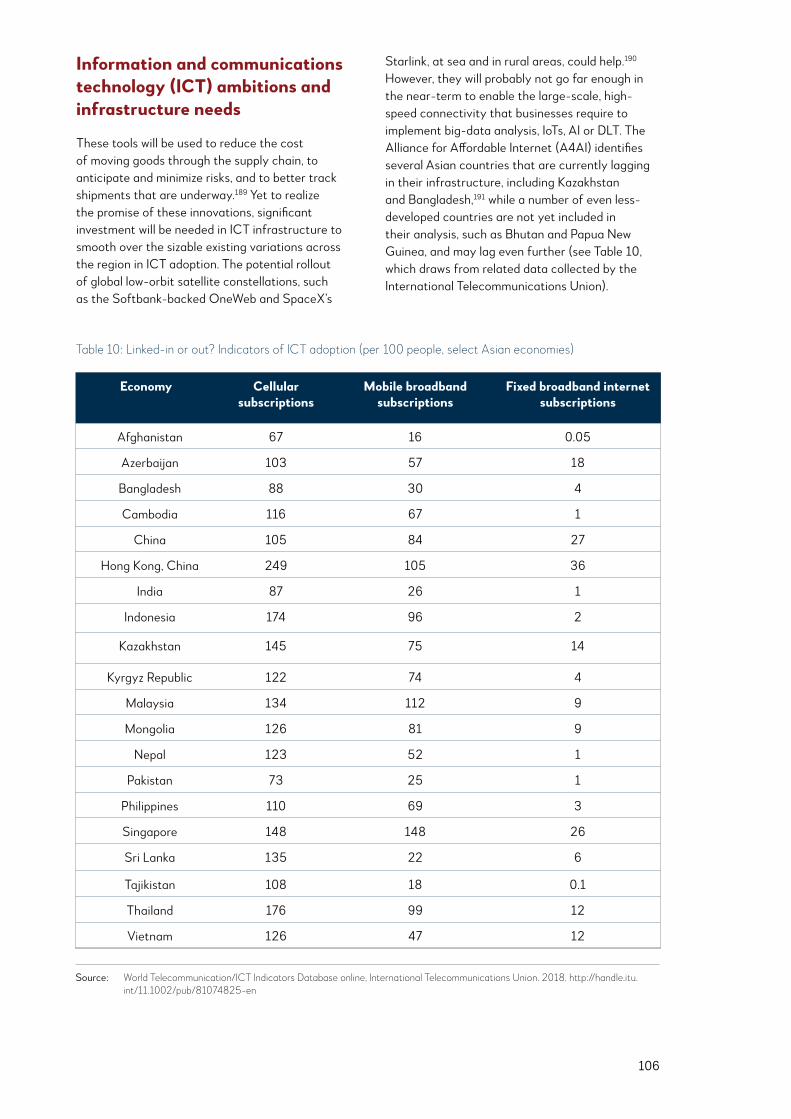
106
Economy Cellular subscriptions
Mobile broadband subscriptions
Fixed broadband internet subscriptions
Afghanistan 67 16 0.05
Azerbaijan 103 57 18
Bangladesh 88 30 4
Cambodia 116 67 1
China 105 84 27
Hong Kong, China 249 105 36
India 87 26 1
Indonesia 174 96 2
Kazakhstan 145 75 14
Kyrgyz Republic 122 74 4
Malaysia 134 112 9
Mongolia 126 81 9
Nepal 123 52 1
Pakistan 73 25 1
Philippines 110 69 3
Singapore 148 148 26
Sri Lanka 135 22 6
Tajikistan 108 18 0.1
Thailand 176 99 12
Vietnam 126 47 12
Table 10: Linked-in or out? Indicators of ICT adoption (per 100 people, select Asian economies)
Source: World Telecommunication/ICT Indicators Database online, International Telecommunications Union. 2018. http://handle.itu.int/11.1002/pub/81074825-en
Information and communications technology (ICT) ambitions and infrastructure needs
These tools will be used to reduce the cost of moving goods through the supply chain, to anticipate and minimize risks, and to better track shipments that are underway.189 Yet to realize the promise of these innovations, significant investment will be needed in ICT infrastructure to smooth over the sizable existing variations across the region in ICT adoption. The potential rollout of global low-orbit satellite constellations, such as the Softbank-backed OneWeb and SpaceX’s
Starlink, at sea and in rural areas, could help.190 However, they will probably not go far enough in the near-term to enable the large-scale, high-speed connectivity that businesses require to implement big-data analysis, IoTs, AI or DLT. The Alliance for Affordable Internet (A4AI) identifies several Asian countries that are currently lagging in their infrastructure, including Kazakhstan and Bangladesh,191 while a number of even less-developed countries are not yet included in their analysis, such as Bhutan and Papua New Guinea, and may lag even further (see Table 10, which draws from related data collected by the International Telecommunications Union).
107
Although the private sector typically provides the bulk of ICT investment, it is unlikely to be sufficient. Half of respondents in a survey of development banks agreed that the private sector alone will not extend affordable access to underserved areas.192 South Asia’s situation looks challenging: Afghanistan, Pakistan and India rank among the countries where A4AI believes private capital will lag the most in helping enable universal access—India alone accounts for 40 percent of the global investment shortfall. By contrast, private provision is likely to be sufficient elsewhere, such as in Myanmar and the Philippines. This suggests that more support is needed in some Asian countries, on top of private sector investment, from development banks—around USD6 billion a year over a decade to achieve universal access, according to A4AI estimates. A separate estimate puts annual Asia-Pacific ICT financing needs in the least-developed countries at about USD8 billion.193
There are a number of factors behind this discrepancy, including overall ease of doing business and previous attention given to this sector by development institutions, which can smooth the path for private investment. For example, McKinsey, a think tank, places India 48th out of 57 economies on dynamism of internet entrepreneurship, indicating an environment that may be discouraging the private sector’s role in enabling more basic levels of access.194 In a broader sense, governments generally do not put strong emphasis on developing their ICT sector, rather hoping to attract private capital to the cause—this mindset remains prevalent among multilateral development institutions as well, who fear “crowding out” private capital.195 This approach can work in some cases, but in environments less conducive to private enterprise involvement in the ICT sector, this can leave shortfalls.
These disparate levels of underlying infrastructure will inevitably lead to uneven adoption rates across the region. For example, although DLT-enabled trade is being widely trialed, there are still some countries in Asia that do not even utilize EDI systems yet, and many more that lack an electronic single window for customs clearance (defined as “a system that allows traders to lodge information with a single body to fulfil all import- or export-related regulatory requirements”),196 although systems are under development in some countries (see Table 11).197
Trading up
Addressing these shortfalls in ICT uptake could serve as an important enabler not only for trade but for overall development, in line with goal nine of the UN’s Sustainable Development Goals, which recognizes the importance of internet access.198 Randeep Sudan, board adviser at Ecosystm, a technology consultancy, and former global adviser on digital strategy at the World Bank, believes there could be broader implications for countries that do not upgrade. “Developing countries will be required to use these technologies and invest in some of them in a major way going forward,” he says. “They cannot escape using them if they want to remain competitive.”
This is largely because the overall impact of new trade technologies will be to reduce trade friction and encourage more integrated supply chains, thereby boosting volumes. It is difficult to extrapolate the full implications, but there are estimates for some aspects. Bain & Company, a consultancy, forecasts that closing the trade finance gap using blockchain and other technologies could boost global trade by USD1.1 trillion over a decade in real terms, with Asia representing about 40 percent of the current shortfall in trade finance to be filled.199 In Indonesia and in Hong Kong, China, for example, imports rose by 19 percent and 37 percent, respectively, in the years after introducing an EDI or electronic single window, while exports increased by 16 percent and 18 percent.200 Bringing down barriers via DLT and other technologies could make it easier for smaller companies, and those in less-well-integrated parts of Asia in particular, to enter supply chains.
Not only could overall trade volumes grow, but routes could reconfigure as improvements in cost and transport time make longer-distance supply chains more viable and AI analytics uncover unanticipated suppliers. New autonomous vehicles and fast unmanned ships could also reconfigure the way logistics firms use road, rail and ocean transport. This, in turn, may result in greater-than-anticipated pressure on certain routes and ports, requiring new investment, while also leaving other assets underutilized. The same AI and big data optimization tools that will help companies in the supply chain should also help governments identify emerging infrastructure bottlenecks that need addressing. ICT upgrades could also help governments’ abilities to collect tax
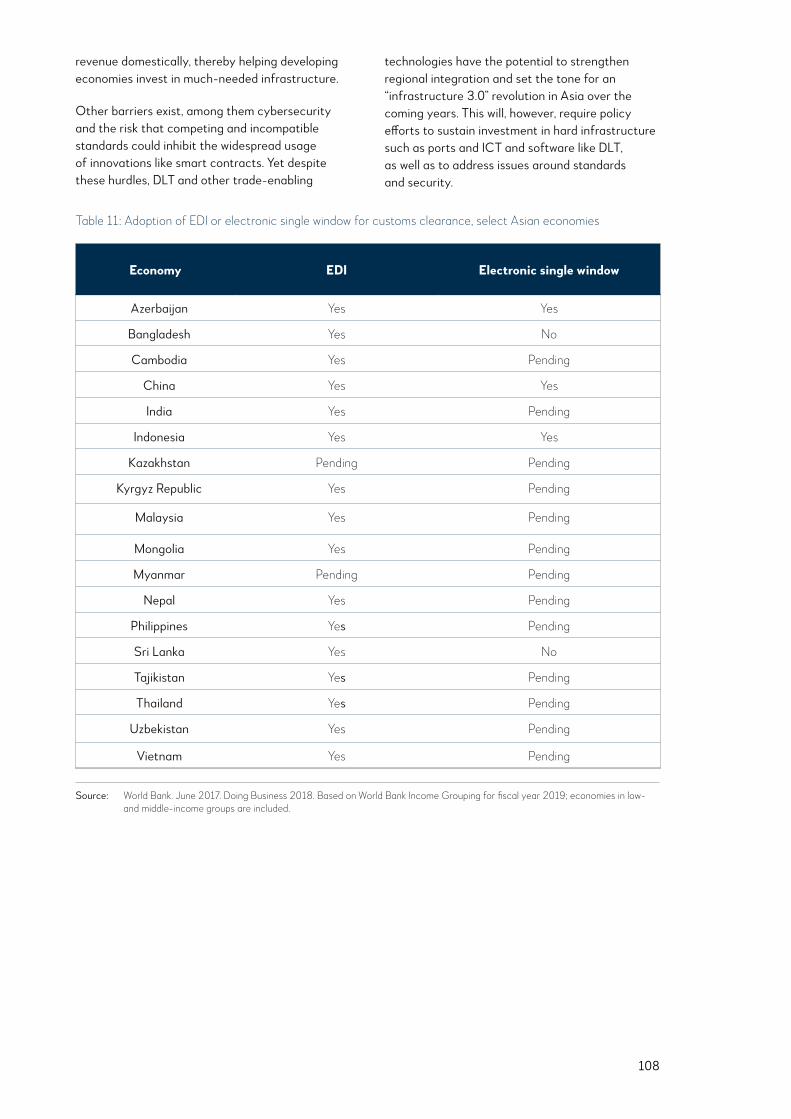
108
Economy EDI Electronic single window
Azerbaijan Yes Yes
Bangladesh Yes No
Cambodia Yes Pending
China Yes Yes
India Yes Pending
Indonesia Yes Yes
Kazakhstan Pending Pending
Kyrgyz Republic Yes Pending
Malaysia Yes Pending
Mongolia Yes Pending
Myanmar Pending Pending
Nepal Yes Pending
Philippines Yes Pending
Sri Lanka Yes No
Tajikistan Yes Pending
Thailand Yes Pending
Uzbekistan Yes Pending
Vietnam Yes Pending
Table 11: Adoption of EDI or electronic single window for customs clearance, select Asian economies
Source: World Bank. June 2017. Doing Business 2018. Based on World Bank Income Grouping for fiscal year 2019; economies in low- and middle-income groups are included.
revenue domestically, thereby helping developing economies invest in much-needed infrastructure.
Other barriers exist, among them cybersecurity and the risk that competing and incompatible standards could inhibit the widespread usage of innovations like smart contracts. Yet despite these hurdles, DLT and other trade-enabling
technologies have the potential to strengthen regional integration and set the tone for an “infrastructure 3.0” revolution in Asia over the coming years. This will, however, require policy efforts to sustain investment in hard infrastructure such as ports and ICT and software like DLT, as well as to address issues around standards and security.
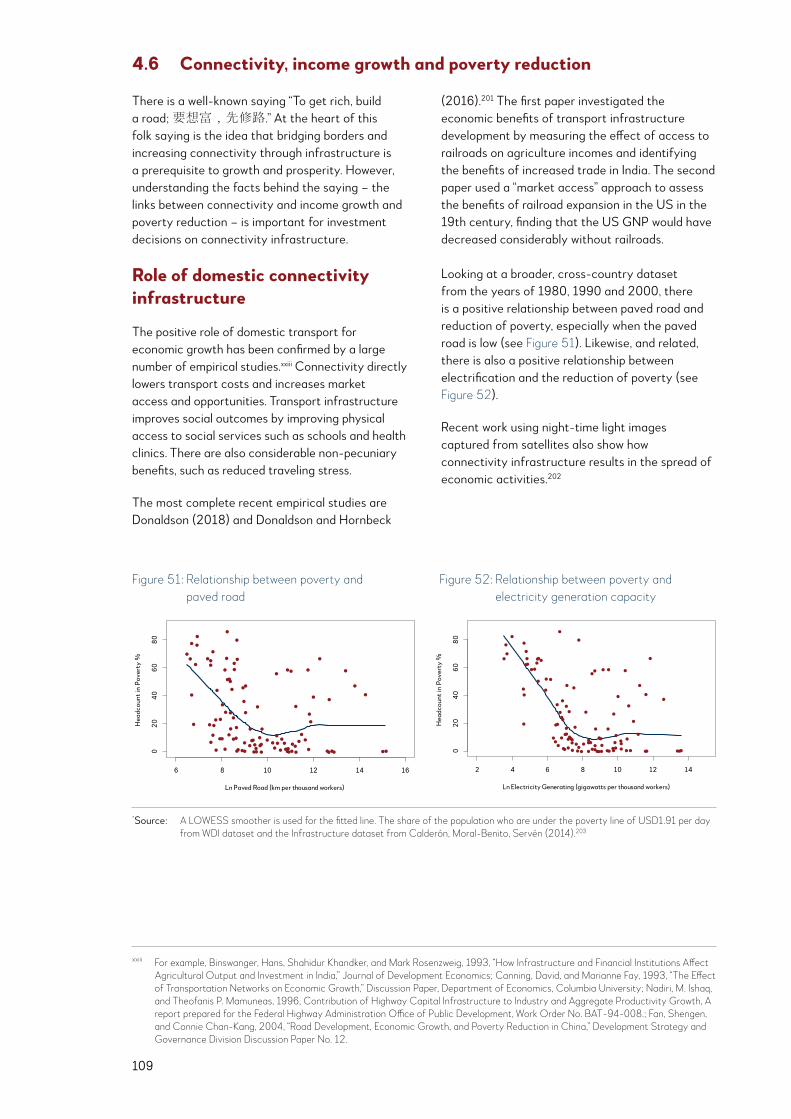
109
6 8 10 12 14 16
020
4060
80
Ln Paved Road (km per thousand workers)
Hea
dcou
nt in
Pov
erty
%
Figure 51: Relationship between poverty and paved road
Figure 52: Relationship between poverty and electricity generation capacity
2 4 6 8 10 12 14
020
4060
80
Ln Electricity Generating (gigawatts per thousand workers)
Hea
dcou
nt in
Pov
erty
%
xxiii For example, Binswanger, Hans, Shahidur Khandker, and Mark Rosenzweig, 1993, “How Infrastructure and Financial Institutions Affect Agricultural Output and Investment in India,” Journal of Development Economics; Canning, David, and Marianne Fay, 1993, “The Effect of Transportation Networks on Economic Growth,” Discussion Paper, Department of Economics, Columbia University; Nadiri, M. Ishaq, and Theofanis P. Mamuneas, 1996, Contribution of Highway Capital Infrastructure to Industry and Aggregate Productivity Growth, A report prepared for the Federal Highway Administration Office of Public Development, Work Order No. BAT-94-008.; Fan, Shengen, and Connie Chan-Kang, 2004, “Road Development, Economic Growth, and Poverty Reduction in China,” Development Strategy and Governance Division Discussion Paper No. 12.
*Source: A LOWESS smoother is used for the fitted line. The share of the population who are under the poverty line of USD1.91 per day from WDI dataset and the Infrastructure dataset from Calderón, Moral-Benito, Servén (2014).203
4.6 Connectivity, income growth and poverty reduction
There is a well-known saying “To get rich, build a road; 要想富,先修路.” At the heart of this folk saying is the idea that bridging borders and increasing connectivity through infrastructure is a prerequisite to growth and prosperity. However, understanding the facts behind the saying – the links between connectivity and income growth and poverty reduction – is important for investment decisions on connectivity infrastructure.
Role of domestic connectivity infrastructure
The positive role of domestic transport for economic growth has been confirmed by a large number of empirical studies.xxiii Connectivity directly lowers transport costs and increases market access and opportunities. Transport infrastructure improves social outcomes by improving physical access to social services such as schools and health clinics. There are also considerable non-pecuniary benefits, such as reduced traveling stress.
The most complete recent empirical studies are Donaldson (2018) and Donaldson and Hornbeck
(2016).201 The first paper investigated the economic benefits of transport infrastructure development by measuring the effect of access to railroads on agriculture incomes and identifying the benefits of increased trade in India. The second paper used a “market access” approach to assess the benefits of railroad expansion in the US in the 19th century, finding that the US GNP would have decreased considerably without railroads. Looking at a broader, cross-country dataset from the years of 1980, 1990 and 2000, there is a positive relationship between paved road and reduction of poverty, especially when the paved road is low (see Figure 51). Likewise, and related, there is also a positive relationship between electrification and the reduction of poverty (see Figure 52).
Recent work using night-time light images captured from satellites also show how connectivity infrastructure results in the spread of economic activities.202
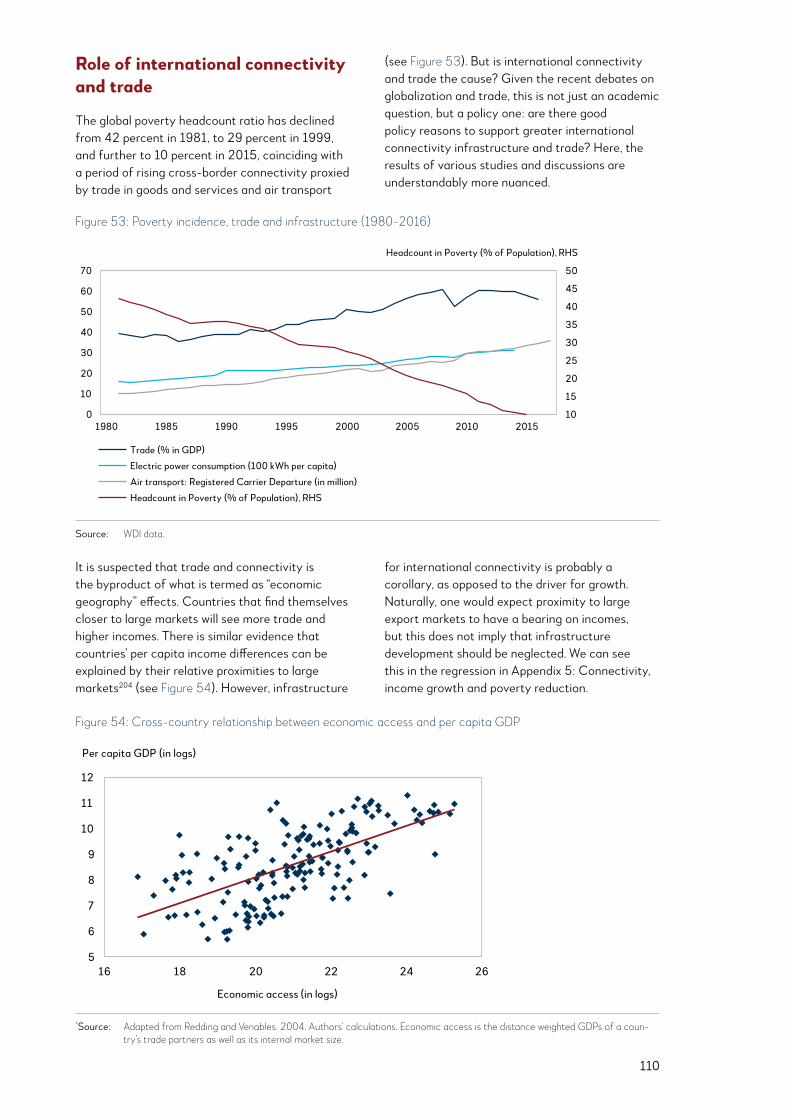
110
Role of international connectivity and trade
The global poverty headcount ratio has declined from 42 percent in 1981, to 29 percent in 1999, and further to 10 percent in 2015, coinciding with a period of rising cross-border connectivity proxied by trade in goods and services and air transport
(see Figure 53). But is international connectivity and trade the cause? Given the recent debates on globalization and trade, this is not just an academic question, but a policy one: are there good policy reasons to support greater international connectivity infrastructure and trade? Here, the results of various studies and discussions are understandably more nuanced.
Figure 53: Poverty incidence, trade and infrastructure (1980-2016)
Source: WDI data.
10
15
20
25
30
35
40
45
50
0
10
20
30
40
50
60
70
1980 1985 1990 1995 2000 2005 2010 2015
Headcount in Poverty (% of Population), RHS
Trade (% in GDP)
Electric power consumption (100 kWh per capita)
Air transport: Registered Carrier Departure (in million)
Headcount in Poverty (% of Population), RHS
Source: WDI data.
It is suspected that trade and connectivity is the byproduct of what is termed as “economic geography” effects. Countries that find themselves closer to large markets will see more trade and higher incomes. There is similar evidence that countries’ per capita income differences can be explained by their relative proximities to large markets204 (see Figure 54). However, infrastructure
for international connectivity is probably a corollary, as opposed to the driver for growth. Naturally, one would expect proximity to large export markets to have a bearing on incomes, but this does not imply that infrastructure development should be neglected. We can see this in the regression in Appendix 5: Connectivity, income growth and poverty reduction.
Figure 54: Cross-country relationship between economic access and per capita GDP
Source: Adapted from Redding and Venables. 2004. Authors’ calculations. Economic access is the distance weighted GDPs of a country’s trade partners as well as its internal market size.
5
6
7
8
9
10
11
12
16 18 20 22 24 26
Per capita GDP (in logs)
Economic access (in logs)
*Source: Adapted from Redding and Venables. 2004. Authors’ calculations. Economic access is the distance weighted GDPs of a coun-try’s trade partners as well as its internal market size.
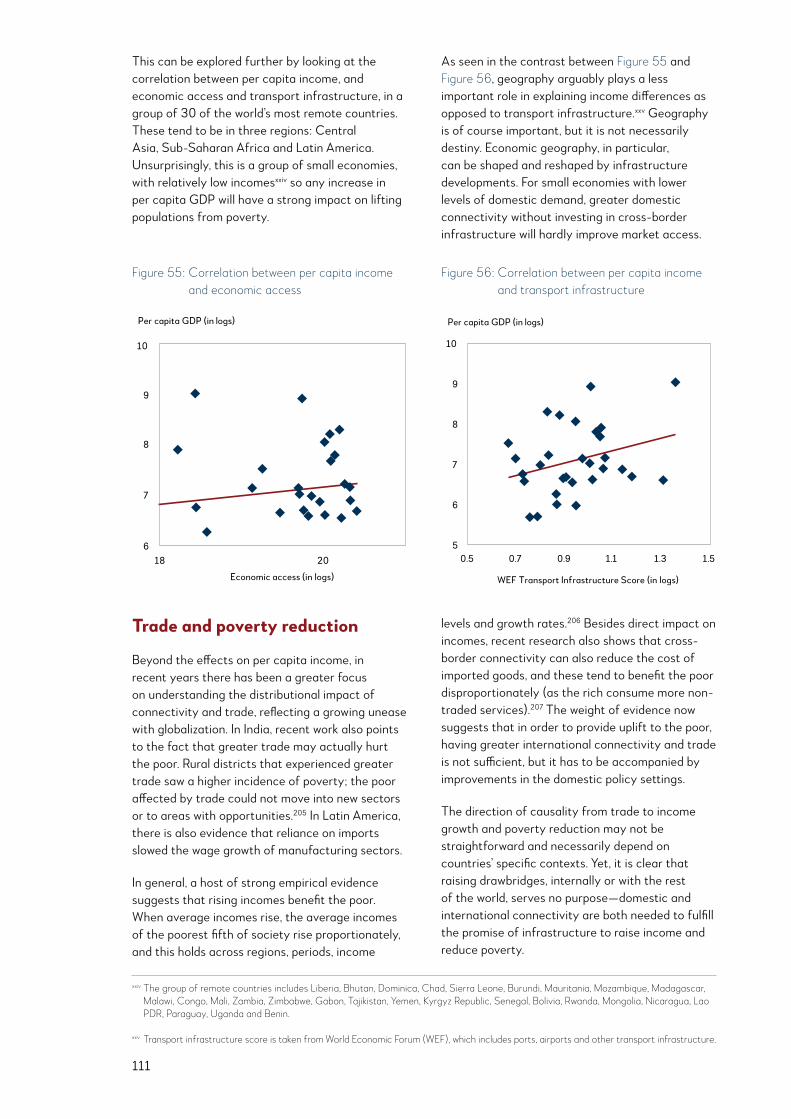
111
This can be explored further by looking at the correlation between per capita income, and economic access and transport infrastructure, in a group of 30 of the world’s most remote countries. These tend to be in three regions: Central Asia, Sub-Saharan Africa and Latin America. Unsurprisingly, this is a group of small economies, with relatively low incomesxxiv so any increase in per capita GDP will have a strong impact on lifting populations from poverty.
As seen in the contrast between Figure 55 and Figure 56, geography arguably plays a less important role in explaining income differences as opposed to transport infrastructure.xxv Geography is of course important, but it is not necessarily destiny. Economic geography, in particular, can be shaped and reshaped by infrastructure developments. For small economies with lower levels of domestic demand, greater domestic connectivity without investing in cross-border infrastructure will hardly improve market access.
Figure 55: Correlation between per capita income and economic access
Figure 56: Correlation between per capita income and transport infrastructure
6
7
8
9
10
18 20
Per capita GDP (in logs)
Economic access (in logs)
Per capita GDP (in logs)
5
6
7
8
9
10
0.5 0.7 0.9 1.1 1.3 1.5
WEF Transport Infrastructure Score (in logs)
xxiv The group of remote countries includes Liberia, Bhutan, Dominica, Chad, Sierra Leone, Burundi, Mauritania, Mozambique, Madagascar, Malawi, Congo, Mali, Zambia, Zimbabwe, Gabon, Tajikistan, Yemen, Kyrgyz Republic, Senegal, Bolivia, Rwanda, Mongolia, Nicaragua, Lao PDR, Paraguay, Uganda and Benin.
xxv Transport infrastructure score is taken from World Economic Forum (WEF), which includes ports, airports and other transport infrastructure.
Trade and poverty reduction
Beyond the effects on per capita income, in recent years there has been a greater focus on understanding the distributional impact of connectivity and trade, reflecting a growing unease with globalization. In India, recent work also points to the fact that greater trade may actually hurt the poor. Rural districts that experienced greater trade saw a higher incidence of poverty; the poor affected by trade could not move into new sectors or to areas with opportunities.205 In Latin America, there is also evidence that reliance on imports slowed the wage growth of manufacturing sectors.
In general, a host of strong empirical evidence suggests that rising incomes benefit the poor. When average incomes rise, the average incomes of the poorest fifth of society rise proportionately, and this holds across regions, periods, income
levels and growth rates.206 Besides direct impact on incomes, recent research also shows that cross-border connectivity can also reduce the cost of imported goods, and these tend to benefit the poor disproportionately (as the rich consume more non-traded services).207 The weight of evidence now suggests that in order to provide uplift to the poor, having greater international connectivity and trade is not sufficient, but it has to be accompanied by improvements in the domestic policy settings.
The direction of causality from trade to income growth and poverty reduction may not be straightforward and necessarily depend on countries’ specific contexts. Yet, it is clear that raising drawbridges, internally or with the rest of the world, serves no purpose—domestic and international connectivity are both needed to fulfill the promise of infrastructure to raise income and reduce poverty.

112

5.1 Appendix 1: Detailed description of roadBLOC
Data were collected in local currency in each of the nominated study locations. Costs are estimates in 2018 terms and checked against actual prices, where available, from recent projects. All data comprised locally obtained commodities as much as possible. Data were collected for the following projects:
R 1: Two-lane country road
R 2: Four-lane existing urban arterial road resurfacing
R 3: Four-lane urban arterial road including traffic-controlled intersections
R 4: As per R3, but on elevated post-tensioned concrete bridge (10-meter high pylons)
R 5: Six-lane divided motorway including bridgework, overpasses, and off-ramps
Five methods of cost comparison were evaluated as best reflecting the “Law of One Price,” which is the philosophical underpinning of purchasing power parity (PPP). The coefficient of variation (CoV) test (Langston, 2016; 2019),208, 209 was used to determine which of the following approaches best reflected a consistent cost/m for roads in each location. The methods included:
Method 1: Price relativities and resource weights (supply only)
Method 2: Detailed BoQ composite items (supply and install, including margin)
Method 3: Similar approach as used in citiBLOC (Langston, 2014)
Method 4: Standard global commodity (McDonald’s Big Mac hamburger)
Method 5: Currency conversion (USD, as at Sep. 30, 2018)
There were a small number of data (3.17 percent) that were missing and had to be estimated using online investigations and an even smaller number (1.27 percent) that were considered erroneous and were adjusted. However, the analogous pricing for the five road infrastructure types had high variances, and it was decided to focus the study on the four-lane urban arterial road including traffic-controlled intersections (R3) as it demonstrated the most certainty (see Figure 57).
5 Appendix
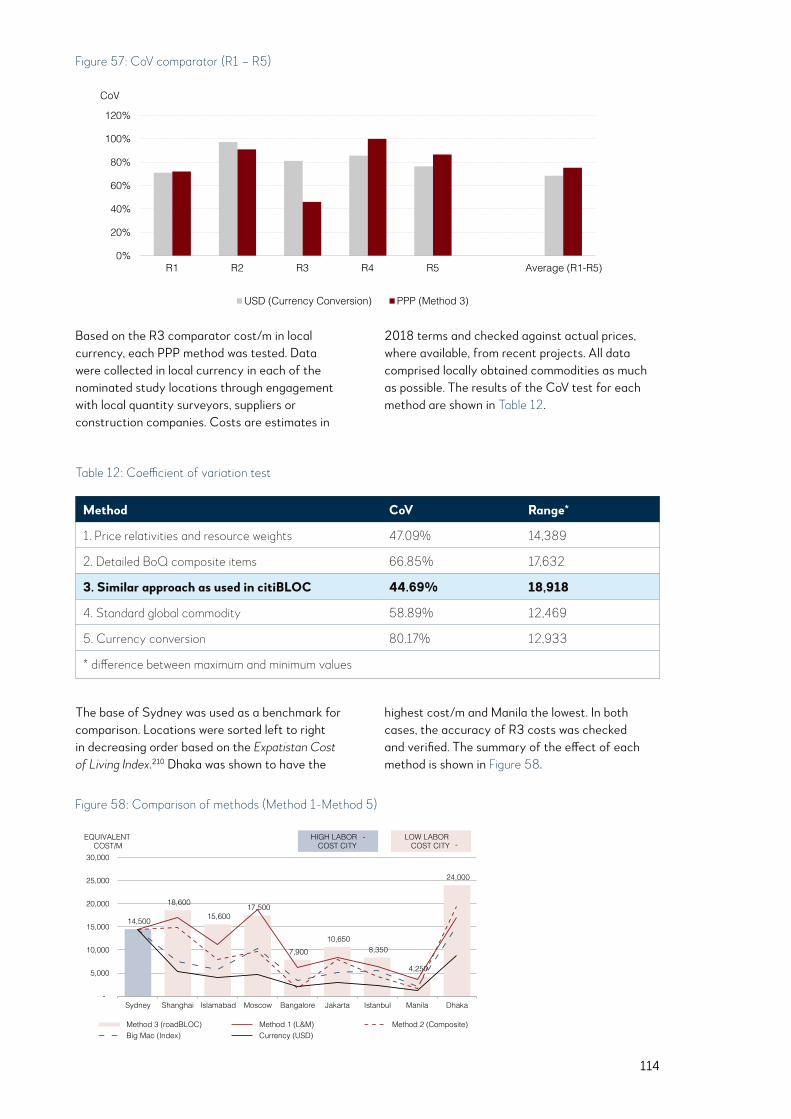
114
Figure 57: CoV comparator (R1 – R5)
Figure 58: Comparison of methods (Method 1-Method 5)
Table 12: Coefficient of variation test
Figure 56: CoV comparator (R1 -R5)
0%
20%
40%
60%
80%
100%
120%
R1 R2 R3 R4 R5 Average (R1-R5)
CoV
USD (Currency Conversion) PPP (Method 3)
Figure57: Comparison of methods (Method1– Method5)
14,500
18,600
15,600 17,500
7,90010,650
8,350
4,250
24,000
-
5,000
10,000
15,000
20,000
25,000
30,000
Sydney Shanghai Islamabad Moscow Bangalore Jakarta Istanbul Manila Dhaka
EQUIVALENT COST/M
Method 3 (roadBLOC) Method 1 (L&M) Method 2 (Composite) Big Mac (Index) Currency (USD)
HIGH LABOR -COST CITY
LOW LABOR-COST CITY
Based on the R3 comparator cost/m in local currency, each PPP method was tested. Data were collected in local currency in each of the nominated study locations through engagement with local quantity surveyors, suppliers or construction companies. Costs are estimates in
2018 terms and checked against actual prices, where available, from recent projects. All data comprised locally obtained commodities as much as possible. The results of the CoV test for each method are shown in Table 12.
The base of Sydney was used as a benchmark for comparison. Locations were sorted left to right in decreasing order based on the Expatistan Cost of Living Index.210 Dhaka was shown to have the
highest cost/m and Manila the lowest. In both cases, the accuracy of R3 costs was checked and verified. The summary of the effect of each method is shown in Figure 58.
Method CoV Range*
1. Price relativities and resource weights 47.09% 14,389
2. Detailed BoQ composite items 66.85% 17,632
3. Similar approach as used in citiBLOC 44.69% 18,918
4. Standard global commodity 58.89% 12,469
5. Currency conversion 80.17% 12,933
* difference between maximum and minimum values
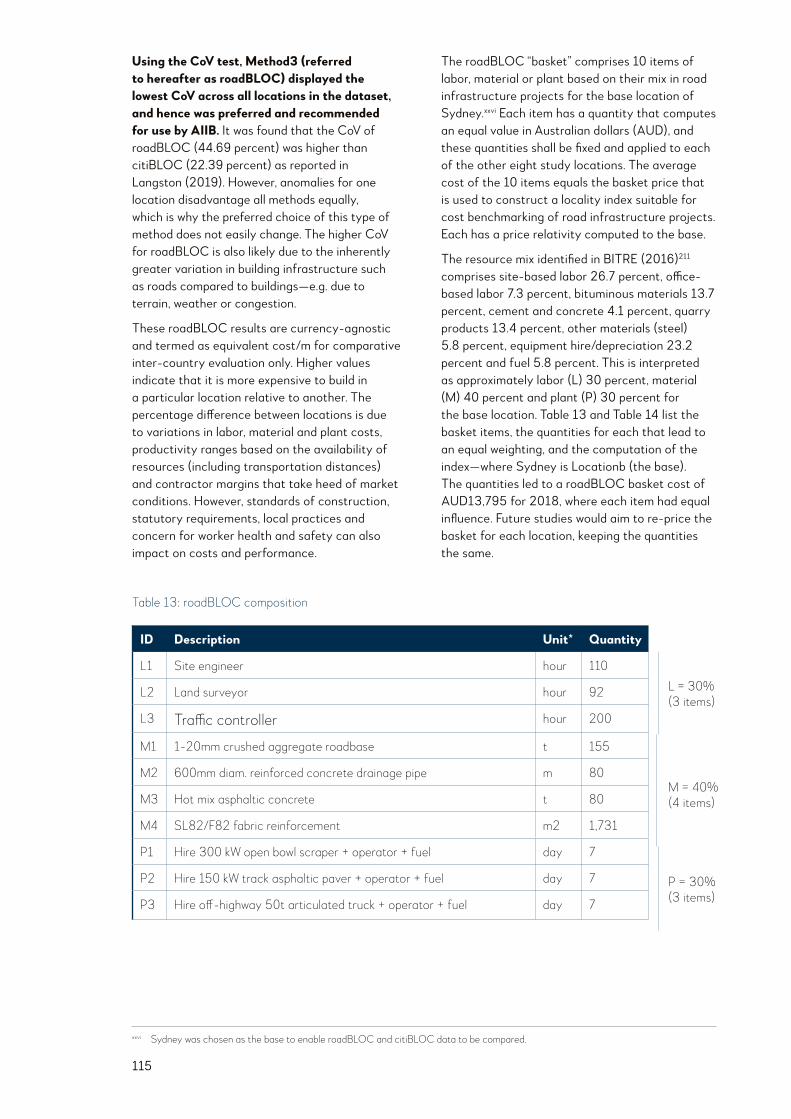
115
Using the CoV test, Method3 (referred to hereafter as roadBLOC) displayed the lowest CoV across all locations in the dataset, and hence was preferred and recommended for use by AIIB. It was found that the CoV of roadBLOC (44.69 percent) was higher than citiBLOC (22.39 percent) as reported in Langston (2019). However, anomalies for one location disadvantage all methods equally, which is why the preferred choice of this type of method does not easily change. The higher CoV for roadBLOC is also likely due to the inherently greater variation in building infrastructure such as roads compared to buildings—e.g. due to terrain, weather or congestion.
These roadBLOC results are currency-agnostic and termed as equivalent cost/m for comparative inter-country evaluation only. Higher values indicate that it is more expensive to build in a particular location relative to another. The percentage difference between locations is due to variations in labor, material and plant costs, productivity ranges based on the availability of resources (including transportation distances) and contractor margins that take heed of market conditions. However, standards of construction, statutory requirements, local practices and concern for worker health and safety can also impact on costs and performance.
The roadBLOC “basket” comprises 10 items of labor, material or plant based on their mix in road infrastructure projects for the base location of Sydney.xxvi Each item has a quantity that computes an equal value in Australian dollars (AUD), and these quantities shall be fixed and applied to each of the other eight study locations. The average cost of the 10 items equals the basket price that is used to construct a locality index suitable for cost benchmarking of road infrastructure projects. Each has a price relativity computed to the base.
The resource mix identified in BITRE (2016)211 comprises site-based labor 26.7 percent, office-based labor 7.3 percent, bituminous materials 13.7 percent, cement and concrete 4.1 percent, quarry products 13.4 percent, other materials (steel) 5.8 percent, equipment hire/depreciation 23.2 percent and fuel 5.8 percent. This is interpreted as approximately labor (L) 30 percent, material (M) 40 percent and plant (P) 30 percent for the base location. Table 13 and Table 14 list the basket items, the quantities for each that lead to an equal weighting, and the computation of the index—where Sydney is Locationb (the base). The quantities led to a roadBLOC basket cost of AUD13,795 for 2018, where each item had equal influence. Future studies would aim to re-price the basket for each location, keeping the quantities the same.
ID Description Unit* Quantity
L1 Site engineer hour 110
L2 Land surveyor hour 92
L3 Traffic controller hour 200
M1 1-20mm crushed aggregate roadbase t 155
M2 600mm diam. reinforced concrete drainage pipe m 80
M3 Hot mix asphaltic concrete t 80
M4 SL82/F82 fabric reinforcement m2 1,731
P1 Hire 300 kW open bowl scraper + operator + fuel day 7
P2 Hire 150 kW track asphaltic paver + operator + fuel day 7
P3 Hire off-highway 50t articulated truck + operator + fuel day 7
L = 30%(3 items)
M = 40%(4 items)
P = 30%(3 items)
Table 13: roadBLOC composition
xxvi Sydney was chosen as the base to enable roadBLOC and citiBLOC data to be compared.
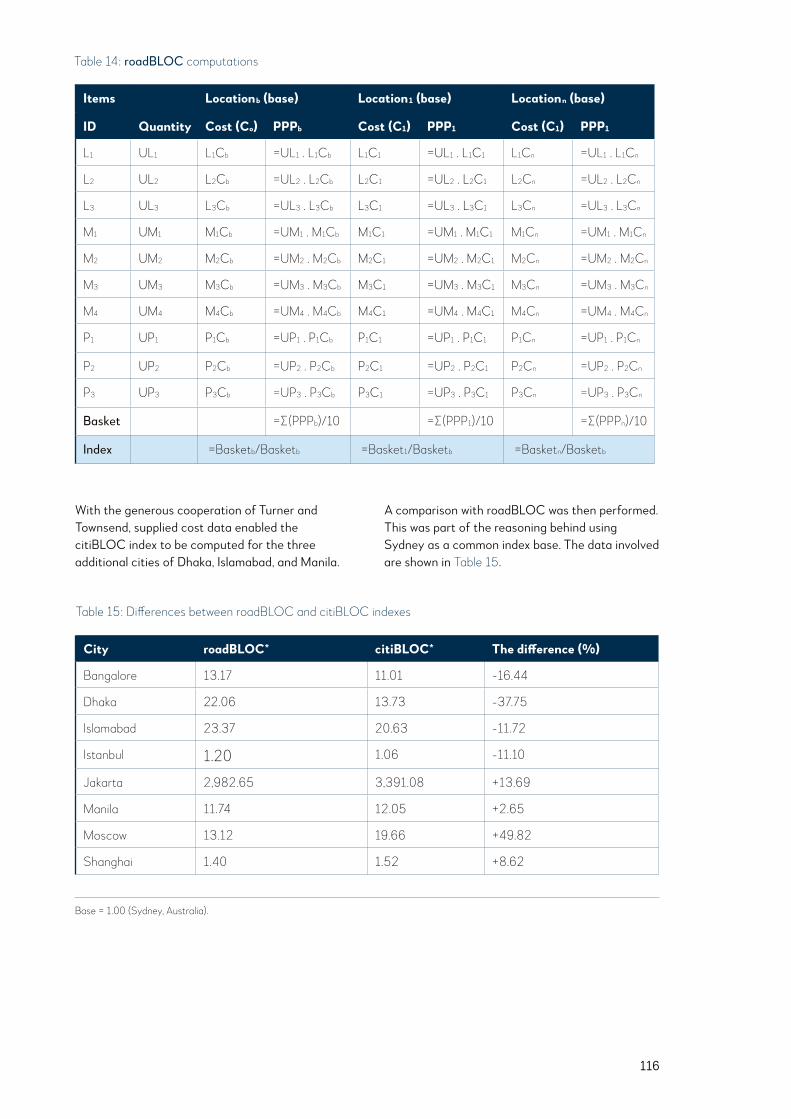
116
With the generous cooperation of Turner and Townsend, supplied cost data enabled the citiBLOC index to be computed for the three additional cities of Dhaka, Islamabad, and Manila.
A comparison with roadBLOC was then performed. This was part of the reasoning behind using Sydney as a common index base. The data involved are shown in Table 15.
Items Locationb (base) Location1 (base) Locationn (base)
ID Quantity Cost (Co) PPPb Cost (C1) PPP1 Cost (C1) PPP1
L1 UL1 L1Cb =UL1 . L1Cb L1C1 =UL1 . L1C1 L1Cn =UL1 . L1Cn
L2 UL2 L2Cb =UL2 . L2Cb L2C1 =UL2 . L2C1 L2Cn =UL2 . L2Cn
L3 UL3 L3Cb =UL3 . L3Cb L3C1 =UL3 . L3C1 L3Cn =UL3 . L3Cn
M1 UM1 M1Cb =UM1 . M1Cb M1C1 =UM1 . M1C1 M1Cn =UM1 . M1Cn
M2 UM2 M2Cb =UM2 . M2Cb M2C1 =UM2 . M2C1 M2Cn =UM2 . M2Cn
M3 UM3 M3Cb =UM3 . M3Cb M3C1 =UM3 . M3C1 M3Cn =UM3 . M3Cn
M4 UM4 M4Cb =UM4 . M4Cb M4C1 =UM4 . M4C1 M4Cn =UM4 . M4Cn
P1 UP1 P1Cb =UP1 . P1Cb P1C1 =UP1 . P1C1 P1Cn =UP1 . P1Cn
P2 UP2 P2Cb =UP2 . P2Cb P2C1 =UP2 . P2C1 P2Cn =UP2 . P2Cn
P3 UP3 P3Cb =UP3 . P3Cb P3C1 =UP3 . P3C1 P3Cn =UP3 . P3Cn
Basket =∑(PPPb)/10 =∑(PPP1)/10 =∑(PPPn)/10
Index =Basketb/Basketb =Basket1/Basketb =Basketn/Basketb
Table 14: roadBLOC computations
Table 15: Differences between roadBLOC and citiBLOC indexes
City roadBLOC* citiBLOC* The difference (%)
Bangalore 13.17 11.01 -16.44
Dhaka 22.06 13.73 -37.75
Islamabad 23.37 20.63 -11.72
Istanbul 1.20 1.06 -11.10
Jakarta 2,982.65 3,391.08 +13.69
Manila 11.74 12.05 +2.65
Moscow 13.12 19.66 +49.82
Shanghai 1.40 1.52 +8.62
Base = 1.00 (Sydney, Australia).
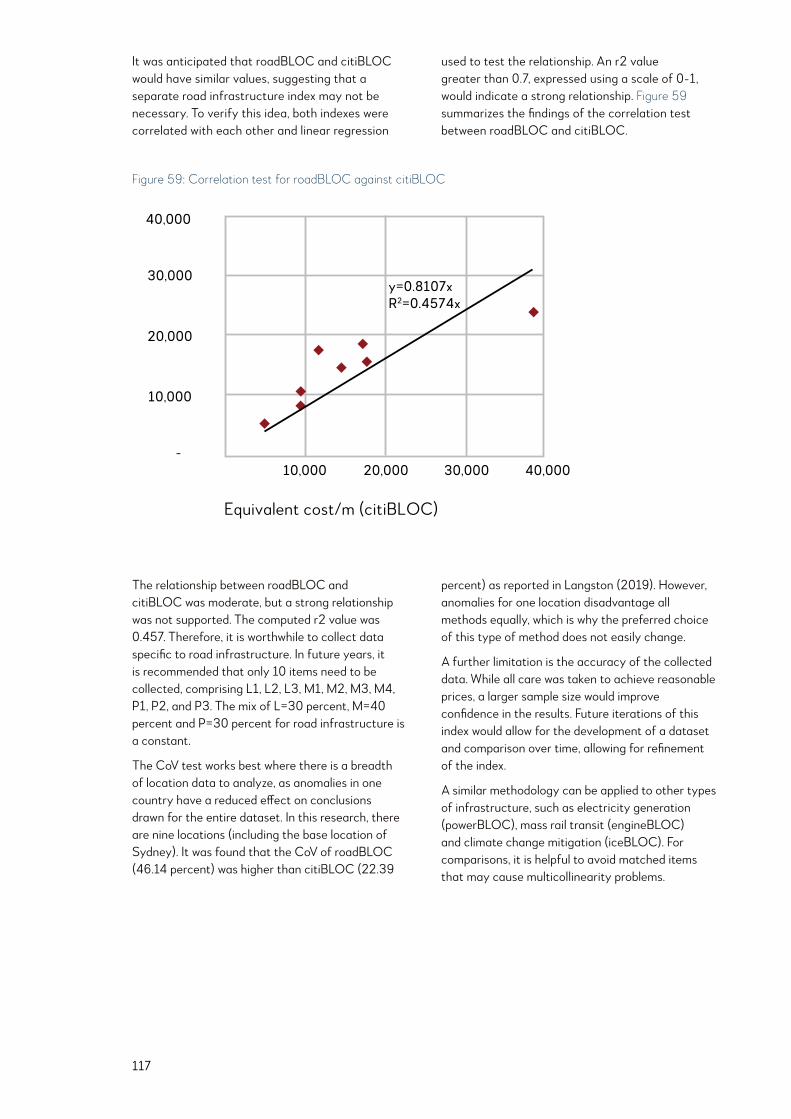
117
Figure 59: Correlation test for roadBLOC against citiBLOCEquivalent cost/m
(roadBLOC)
Equivalent cost/m (citiBLOC)
-
10,000
10,000 20,000 30,000 40,000
20,000
30,000
40,000
y=0.8107xR2=0.4574x
Figure 59: Correlation test for roadBLOC against citiBLOC
The relationship between roadBLOC and citiBLOC was moderate, but a strong relationship was not supported. The computed r2 value was 0.457. Therefore, it is worthwhile to collect data specific to road infrastructure. In future years, it is recommended that only 10 items need to be collected, comprising L1, L2, L3, M1, M2, M3, M4, P1, P2, and P3. The mix of L=30 percent, M=40 percent and P=30 percent for road infrastructure is a constant.
The CoV test works best where there is a breadth of location data to analyze, as anomalies in one country have a reduced effect on conclusions drawn for the entire dataset. In this research, there are nine locations (including the base location of Sydney). It was found that the CoV of roadBLOC (46.14 percent) was higher than citiBLOC (22.39
percent) as reported in Langston (2019). However, anomalies for one location disadvantage all methods equally, which is why the preferred choice of this type of method does not easily change.
A further limitation is the accuracy of the collected data. While all care was taken to achieve reasonable prices, a larger sample size would improve confidence in the results. Future iterations of this index would allow for the development of a dataset and comparison over time, allowing for refinement of the index.
A similar methodology can be applied to other types of infrastructure, such as electricity generation (powerBLOC), mass rail transit (engineBLOC) and climate change mitigation (iceBLOC). For comparisons, it is helpful to avoid matched items that may cause multicollinearity problems.
It was anticipated that roadBLOC and citiBLOC would have similar values, suggesting that a separate road infrastructure index may not be necessary. To verify this idea, both indexes were correlated with each other and linear regression
used to test the relationship. An r2 value greater than 0.7, expressed using a scale of 0-1, would indicate a strong relationship. Figure 59 summarizes the findings of the correlation test between roadBLOC and citiBLOC.
118
5.2 Appendix 2: Methodology for infrastructure financing costs and activity benchmarking
5.2.1 Infrastructure financing activity
This measure is based on market data published by IJGlobal. Constituent data will be presented by industry sector, by transaction type as well as financing type.
As described above, data will be drawn from empirical sources for years 2014 to August 2018 for all counties in the region, cross-referenced for omission and duplication, and published in aggregate form, by country and by sector. In future iterations, the Infrastructure Financing Activity Index for 2017 will provide a base year with subsequent years reported as a percentage rise or fall in 2017.
In future iterations, for consistency, the indexes for infrastructure financing activity and infrastructure financing costs (described in the next section of this brief) will commence in the same year (2017). A retrospective financier survey either for 2016 or for earlier is neither practical nor achievable with credibility.
5.2.2 Infrastructure financing cost
The infrastructure Financing Cost Index has two components each of which will be reported as subindexes: public debt using the proxy of 20-year government bond returns and private lending based on empirical data and interviews with lending institutions.
5.2.2.1 Public infrastructure debt costs
For countries that have not issued 20-year bonds, the ten-year bond will be substituted with a notation. Data will be drawn from stock market bond returns on domestic exchanges. Government bond returns will be published as an average of the aggregated data and based on sovereign credit ratings. Separate reporting of data will distinguish systematic risk factors in the aggregate return data for bonds and referenced to bond issues in foreign jurisdictions of similar maturity.
5.2.2.2 Private infrastructure debt costs
Data will be drawn from an interview program and is designed to remove unsystematic (or project specific) risk factors in pricing. Data will be drawn from empirical sources for the year 2017 for all countries in scope and specifically, the nominated countries, cross-referenced for omission and duplication, aggregated and averaged, by country and by sector.
Respondents were asked for information about senior debt for infrastructure loans before spreads (margins) to compensate for unsystematic (project), systematic and political risks. This should provide a reasonably accurate comparative benchmark with government bonds. The interviews also capture additional data about the types of infrastructure financing, credit assessment methods and sector lending preferences.
The objective was to obtain indicative market pricing to be used with government bond yields as a proxy for senior debt rates for infrastructure investment. Interview program respondents also were asked about future infrastructure debt pricing expectations with an opportunity to provide additional comments. The interview program canvassed banks, fund managers and institutional investors including portfolio investors and insurance companies.

119
Regression analysis further points to the fact that transport infrastructure alone is the significant variable in explaining bilateral trade balances (Table 16).
Figure 60: Correlations of bilateral trade balance with various WEF scores
8
6
4
2
0
-2
-4
-6
-8
-10-1.5 -1 -0.5 0 0.5 1
Transport Infrastructure
Transport infrastructure (dif ferences in scores)
Correlation 0.26
8
6
4
2
0
-2
-4
-6
-8
-10-1 -0.5 0 0.5
Labor Market E�ciency
Labor market(dif ferences in scores)
Correlation -0.024
8
6
4
2
0
-2
-4
-6
-8
-10-1 -0.5 0 0.5
Macroeconomic Environment
Macroeconomic environment(dif ferences in scores)
Correlation -0.043
8
6
4
2
0
-2
-4
-6
-8
-10-1 -0.5 0 0.5
Quality of Education
Education Quality(dif ferences in scores)
Correlation 0.092
xxvii As this section pertains to Latin America’s export of manufactured goods to Asia, extractive and agriculture exports are excluded from the analysis.
5.3 Appendix 3: Latin America and Asia trade: a future beyond commodities for manufactures
Taking the bilateral manufactured goods trade of all Latin American economies against their Asian counterparts, the trade balances are correlated against differences in transport infrastructure, macroeconomic environment, labor market efficiency and quality of education, as measured by World Economic Forum (WEF) scores (Figure 60).xxvii
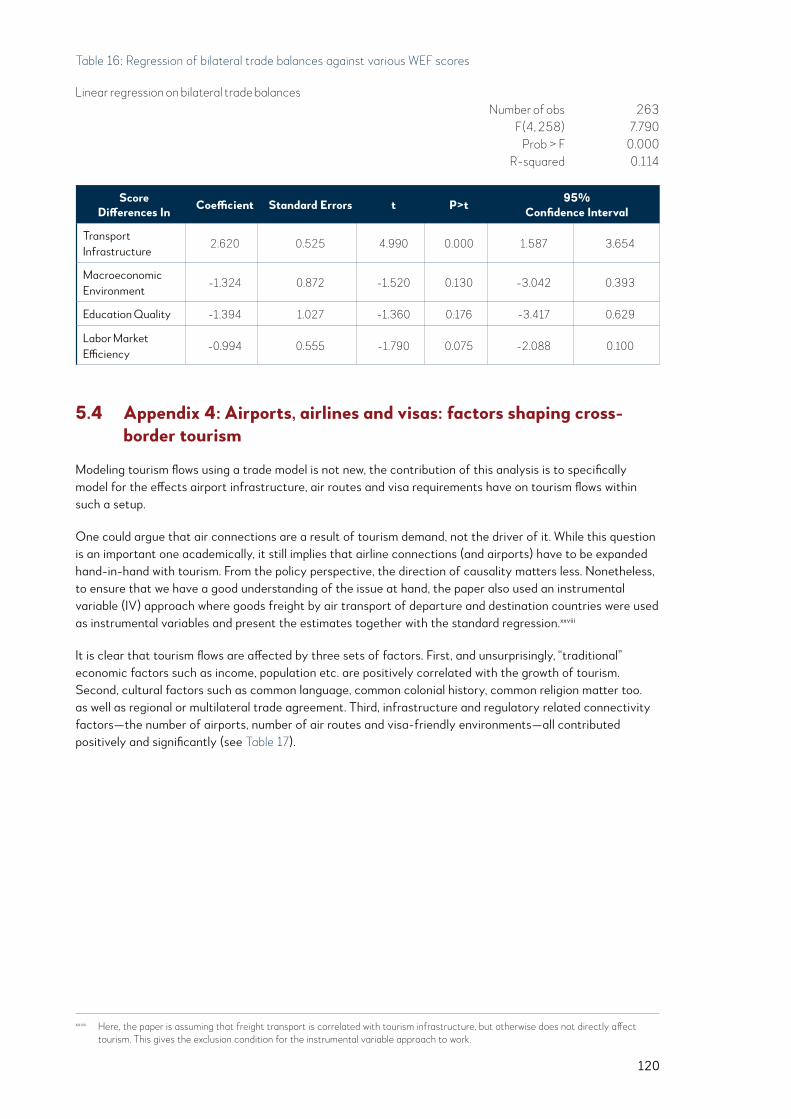
120
5.4 Appendix 4: Airports, airlines and visas: factors shaping cross- border tourism
Modeling tourism flows using a trade model is not new, the contribution of this analysis is to specifically model for the effects airport infrastructure, air routes and visa requirements have on tourism flows within such a setup.
One could argue that air connections are a result of tourism demand, not the driver of it. While this question is an important one academically, it still implies that airline connections (and airports) have to be expanded hand-in-hand with tourism. From the policy perspective, the direction of causality matters less. Nonetheless, to ensure that we have a good understanding of the issue at hand, the paper also used an instrumental variable (IV) approach where goods freight by air transport of departure and destination countries were used as instrumental variables and present the estimates together with the standard regression.xxviii
It is clear that tourism flows are affected by three sets of factors. First, and unsurprisingly, “traditional” economic factors such as income, population etc. are positively correlated with the growth of tourism. Second, cultural factors such as common language, common colonial history, common religion matter too. as well as regional or multilateral trade agreement. Third, infrastructure and regulatory related connectivity factors—the number of airports, number of air routes and visa-friendly environments—all contributed positively and significantly (see Table 17).
Table 16: Regression of bilateral trade balances against various WEF scores
xxviii Here, the paper is assuming that freight transport is correlated with tourism infrastructure, but otherwise does not directly affect tourism. This gives the exclusion condition for the instrumental variable approach to work.
Linear regression on bilateral trade balances Number of obs 263 F(4, 258) 7.790 Prob > F 0.000 R-squared 0.114
Score Differences In Coefficient Standard Errors t P>t 95%
Confidence Interval
Transport Infrastructure
2.620 0.525 4.990 0.000 1.587 3.654
Macroeconomic Environment
-1.324 0.872 -1.520 0.130 -3.042 0.393
Education Quality -1.394 1.027 -1.360 0.176 -3.417 0.629
Labor Market Efficiency
-0.994 0.555 -1.790 0.075 -2.088 0.100
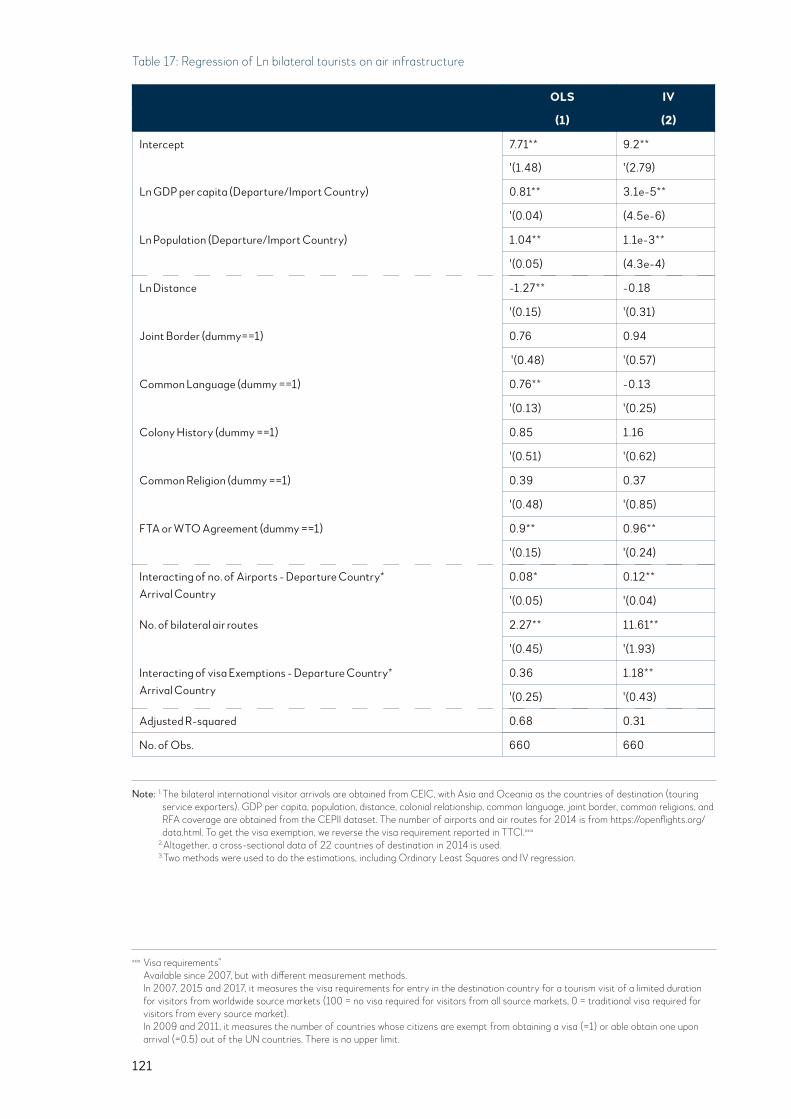
121
Table 17: Regression of Ln bilateral tourists on air infrastructure
Note: 1. The bilateral international visitor arrivals are obtained from CEIC, with Asia and Oceania as the countries of destination (touring service exporters). GDP per capita, population, distance, colonial relationship, common language, joint border, common religions, and RFA coverage are obtained from the CEPII dataset. The number of airports and air routes for 2014 is from https://openflights.org/data.html. To get the visa exemption, we reverse the visa requirement reported in TTCI.xxix
2. Altogether, a cross-sectional data of 22 countries of destination in 2014 is used. 3. Two methods were used to do the estimations, including Ordinary Least Squares and IV regression.
OLS IV
(1) (2)
Intercept 7.71** 9.2**
'(1.48) '(2.79)
Ln GDP per capita (Departure/Import Country) 0.81** 3.1e-5**
'(0.04) (4.5e-6)
Ln Population (Departure/Import Country) 1.04** 1.1e-3**
'(0.05) (4.3e-4)
Ln Distance -1.27** -0.18
'(0.15) '(0.31)
Joint Border (dummy==1) 0.76 0.94
'(0.48) '(0.57)
Common Language (dummy ==1) 0.76** -0.13
'(0.13) '(0.25)
Colony History (dummy ==1) 0.85 1.16
'(0.51) '(0.62)
Common Religion (dummy ==1) 0.39 0.37
'(0.48) '(0.85)
FTA or WTO Agreement (dummy ==1) 0.9** 0.96**
'(0.15) '(0.24)
Interacting of no. of Airports - Departure Country* Arrival Country
0.08* 0.12**
'(0.05) '(0.04)
No. of bilateral air routes 2.27** 11.61**
'(0.45) '(1.93)
Interacting of visa Exemptions - Departure Country* Arrival Country
0.36 1.18**
'(0.25) '(0.43)
Adjusted R-squared 0.68 0.31
No. of Obs. 660 660
xxix Visa requirements” Available since 2007, but with different measurement methods. In 2007, 2015 and 2017, it measures the visa requirements for entry in the destination country for a tourism visit of a limited duration for visitors from worldwide source markets (100 = no visa required for visitors from all source markets, 0 = traditional visa required for visitors from every source market). In 2009 and 2011, it measures the number of countries whose citizens are exempt from obtaining a visa (=1) or able obtain one upon arrival (=0.5) out of the UN countries. There is no upper limit.
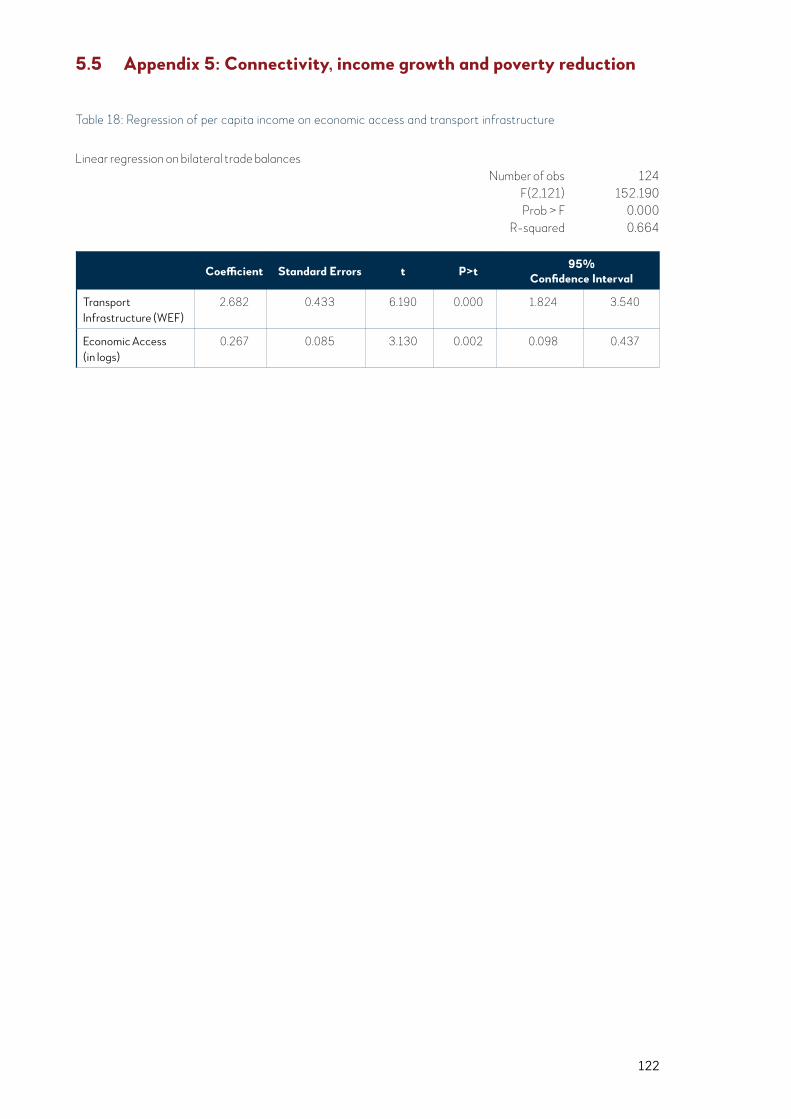
122
Table 18: Regression of per capita income on economic access and transport infrastructure
5.5 Appendix 5: Connectivity, income growth and poverty reduction
Coefficient Standard Errors t P>t 95% Confidence Interval
Transport Infrastructure (WEF)
2.682 0.433 6.190 0.000 1.824 3.540
Economic Access (in logs)
0.267 0.085 3.130 0.002 0.098 0.437
Linear regression on bilateral trade balances Number of obs 124 F(2,121) 152.190 Prob > F 0.000 R-squared 0.664
123
6 References
1. Moody’s Investors Service (2018). Infrastructure & project finance—Asia: Growing funding diversity to bridge infrastructure funding gap. New York, NY: Author.
2. Ra, S. (2018). Closing the Financing Gap in Asian Infrastructure.
3. OECD (2016). OECD Business and Finance Outlook 2016. Retrieved from: https://doi.org/10.1787/9789264257573-en
4. ASIFMA–ICMA (2016). Guide to Infrastructure Financing in Asia. Retrieved from: http://www.asifma.org/uploadedFiles/5363%20-%20ASIFMA_Brochure_v15.pdf
5. ASIFMA (2018). Asia Credit Report, Third Quarter 2018. Retrieved from: https://www.sifma.org/wp-content/uploads/2018/11/Asia-Credit-Report-2018-10-22-ASIFMA-SIFMA.pdf
6. The Economic Times (2018). Temasek to invest up to $400 mn in NIIF. Retrieved from: https://economictimes.indiatimes.com/news/economy/infrastructure/temasek-to-invest-up-to-400-mn-in-niif/articleshow/65699707.cms
7. The EIU (2016). Japan and China vie for infrastructure deals in Asia. Retrieved from http://country.eiu.com/article.aspx?articleid=963951880&Country=Singapore&
8. Stratfor (2018). China and Japan Compete for Southeast Asia’s Railway. Retrieved from: https://worldview.stratfor.com/article/china-and-japan-compete-southeast-asias-railways
9. Today Online (2018). KL-Singapore HSR project officially deferred to May 2020. Retrieved from: https://www.gov.sg/news/content/today-online---kl-singapore-hsr-pro-ject-officially-deferred-to-may-2020
10. The Straits Times (2017). Duterte’s policy shift on infrastructure raises concern: Philippine Daily Inquirer. Retrieved from: https://www.straitstimes.com/asia/se-asia/dutertes-policy-shift-on-infrastructure-raises-concern-philippine-daily-inquirer
11. The Jakarta Post (2018). Only 4.6 GW of electricity projects can be delayed: Official. Retrieved from: http://www.thejakartapost.com/news/2018/09/25/only-4-6-gw-of-electricity-projects-can-be-delayed-official.html
12. The EIU. Turkey Country Report October 2018.
13. The International Swaps and Derivatives Association (2017). ISDA Research Note: Asia-Pacific OTC Deriva-tives Study. Retrieved from: https://www.isda.org/a/jRTEE/Asia-Pacific-Derivatives-Study-November-2017.pdf
14. The Economist (2017). Whither nationalism?. Retrieved from: https://www.economist.com/christmas-spe-cials/2017/12/19/whither-nationalism
15. Bloomberg (2018). Scientists Weigh Call for Much Deeper Cuts to Coal Pollution. Retrieved from: https://www.bloomberg.com/news/articles/2018-09-30/coal-pollution-gets-much-deeper-cut-ipcc-report-on-climate-change
16. Bermingham, F. (2018). SMBC is the first Japanese bank to rethink coal financing policy. Global Trade Review (GTR). Retrieved from: https://www.gtreview.com/news/asia/smbc-is-the-first-japanese-bank-to-rethink-coal-financing-policy/
17. Market Forces. (n.d.). Coal cuts: Three leading Japanese banks’ coal policies rule them out of nearly a third of new coal power deals. Retrieved from https://www.marketforces.org.au/research/global-coal-finance/japanese-bank-policies/
18. IRENA (2018). Renewable Power Generation Costs in 2017.
19. Lazard (2017). Lazard’s Levelized Cost of Energy Analysis—Version 11.0. Retrieved from: https://www.lazard.com/media/450337/lazard-levelized-cost-of-energy-version-110.pdf
20. Ibid, IRENA (2018).
21. US Energy Information Agency (2018). Retrieved from: https://www.eia.gov/todayinenergy/detail.php?id=23392 US Energy Information Agency (2018). Retrieved from: https://www.eia.gov/todayinenergy/detail.php?id=23392 09” https://www.ft.com/content/0fd3ed3e-89b9-11e8-affd-da9960227309
22. Financial Times (2018). “Indonesia keeps faith with coal to meet growing energy demand”. Retrieved from: https://www.ft.com/content/0fd3ed3e-89b9-11e8-affd-da9960227309
23. Buckley, T., & Shah, K. (2018). IEEFA update: Offshore wind power, the underexplored opportunity that could replace coal in Asia - Institute for Energy Economics & Financial Analysis. Institute for Energy Economics & Financial Analysis. Retrieved from http://ieefa.org/offshore-wind-power-the-underexplored-opportunity-to-replace-coal-in-asia/
24. Inframation (2018). APAC: Equis Energy sale ignites Asian renewable prospects. Retrieved from: https://www.inframationgroup.com/apac-equis-energy-sale-ignites-asian-renewable-prospects
25. Monaco, J. (2017). Why addressing FX risk could hold the key to infrastructure investment [Blog post]. Retrieved from: http://blogs.worldbank.org/ppps/why-addressing-fx-risk-could-hold-key-infrastructure-investment
26. The Daily Star (2017). Interest Rate Cap: New Headache for pvt banks. Retrieved from: https://www.thedailystar.net/frontpage/interest-rate-cap-new-headache-pvt-banks-1601335
27. The Financial Express (2017). The necessity of a vibrant bond market. Retrieved from: https://thefinancialexpress.
124
com.bd/views/the-necessity-of-a-vibrant-bond-mar-ket-1512759188
28. Reuters (2018). China to use ‘more supportive’ measures to promote deleveraging: China Daily. Retrieved from: https://www.reuters.com/article/us-china-debt-delever-aging/china-to-use-more-supportive-measures-to-promote-deleveraging-china-daily-idUSKCN1LS03M
29. Asian Development Bank (2015). Local Currency Bonds and Infrastructure Finance in ASEAN+3. Retrieved from: https://asianbondsonline.adb.org/documents/abmi_lcy_bonds_infrastructure_finance.pdf
30. Asian Development Bank (2015). Local Currency Bonds and Infrastructure Finance in ASEAN+3. Retrieved from: https://asianbondsonline.adb.org/documents/abmi_lcy_bonds_infrastructure_finance.pdf
31. Forbes (2018). Who owns China’s Bond Market?. Retrieved from: https://www.forbes.com/sites/peter-pham/2018/02/28/who-owns-chinas-bond-market/#3b7432644361
32. Centrum (2016). Infrastructure Financing, Emerging Options in India. Retrieved from http://ficci.in/spdocument/20792/FICCI-Infrastructure-Financing-2016.pdf
33. Asifma (2018). Assessing India’s Equity Markets. Reform, Perform and Transform. Retrieved from http://www.asifma.org/uploadedfiles/resources/accessing%20india%27s%20equity%20markets%20(february%202018).pdf
34. Asifma (2018). Assessing India’s Equity Markets. Reform, Perform and Transform. Retrieved from http://www.asifma.org/uploadedfiles/resources/accessing%20india%27s%20equity%20markets%20(february%202018).pdf
35. Asian Development Bank (2018). Asian Development Bank Support to Indonesia’s Capital Market Development, 2002-2017: A Background Paper. Retrieved from: https://www.adb.org/sites/default/files/related/107606/ADB-Support-to-Indonesia-Capital-Market-Develop-ment-2002-2017.pdf
36. Asian Development Bank (2015). Local Currency Bonds and Infrastructure Finance in ASEAN +3. Retrieved from: https://asianbondsonline.adb.org/documents/abmi_lcy_bonds_infrastructure_finance.pdf
37. Capital Markets. Retrieved from: http://www.finance.gov.pk/survey/chapters/06-Capital08.pdf
38. Oxford Business Group. The outlook of the Philippine banking sector remains strong, with robust credit growth and ongoing reforms. Retrieved from: https://oxfordbusi-nessgroup.com/overview/stable-expansion-robust-cred-it-growth-and-ongoing-reforms-contribute-positive-sector-outlook
39. IJGlobal (2017). Philippines invites bids for Manila feeder rail link. Retrieved from: https://ijglobal.com/arti-cles/130884/philippines-invites-bids-for-manila-feeder-rail-link
40. The World Bank. Deepening and Diversifying the Financial System. Retrieved from: http://siteresources.worldbank.
org/INTPHILIPPINES/Resources/DB08-FinancialSys-tem-Jun23.pdf
41. The World Bank. Philippines: Meeting Infrastructure Challenges. Dec 2005. Retrieved from: http://documents.worldbank.org/curated/en/714851468294107526/pdf/317820PH0rev0P1ank0Infra1401PUBLIC1.pdf
42. Reuters (2018). More U.S. sanctions a risk for Russian companies’ rouble bond boom. Retrieved from: https://www.reuters.com/article/us-russia-bonds-corporate/more-u-s-sanctions-a-risk-for-russian-companies-ruble-bond-boom-idUSKBN1KD1QR
43. The Economist (2018). “Turkey President Hopes to Turn Huge Building Projects into Votes”. Retrieved from: https://www.economist.com/europe/2018/04/26/turkeys-president-hopes-to-turn-huge-building-projects-into-votes
44. The Borgen Project. Retrieved from: https://borgenpro-ject.org/infrastructure-in-turkey/
45. Export.gov (2018). Turkey—Project Financing. Retrieved from: https://www.export.gov/apex/article2?id=Turkey-Project-Financing
46. Voice of America (2018). Is Turkey Infrastructure Projects to Stifle European Criticism?. Retrieved from: https://www.voanews.com/a/is-turkey-infrastructure-projects-stifle-european-criticism/4267777.html
47. Reuters (2018). Turkey Lira Firms on Hopes of Better US ties after Akbank Loan. Retrieved from: https://uk.reuters.com/article/turkey-currency/update-1-turkish-lira-firms-on-hopes-of-better-us-ties-and-after-akbank-loan-idUKL8N1WD4CV
48. The World Bank (2012). Turkey Corporate Bond Market Development, Priorities and Challenges. Retrieved from: https://openknowledge.worldbank.org/bitstream/handle/10986/12439/667110ESW0P1010IC0dics-losed05090120.pdf?sequence=1&isAllowed=y
49. Langston, C. (2012). Comparing international construc-tion performance. Working paper, available at: http://epublications.bond.edu.au/sustainable_develop-ment/150/ (accessed Aug. 27, 2013).
50. The EIU. Country report for Bangladesh, October 2018.
51. bdnews24.com (2018). Bangladesh infrastructure is world’s costliest, says World Bank. Retrieved from: https://bdnews24.com/economy/2017/06/20/bangladesh-infra-structure-is-worlds-costliest-says-world-bank
52. Centre for Policy Development (2018). An analysis of the national budget for FY2018-19. Retrieved from: https://cpd.org.bd/wp-content/uploads/2018/06/CPD-Presen-tation-on-Analysis-of-the-National-Budget-for-FY2018-19.pdf
53. Rowland, J. (2017). Bangladesh to be a bright spot for cement demand. World Cement. Retrieved from: https://www.worldcement.com/indian-subcontinent/02062017/bangladesh-to-be-a-bright-spot-for-cement-demand/
54. The Financial Express (2018). Cut customs duty on scrap import. Retrieved from http://today.thefinancialexpress.
125
com.bd/trade-market/cut-customs-duty-on-scrap-import-1523034875
55. The EIU. Global Outlook, November 2018
56. The EIU. Country report for China, October 2018.
57. Ibid.
58. Murphy, D. (2018). Mapping China. Retrieved from: https://www.clsa.com/special/mappingchina/
59. Control Risks (2018). China’s environmental campaigns to disrupt supply chains. Retrieved from: https://www.controlrisks.com/our-thinking/insights/chinas-environ-mental-campaigns-will-continue-to-transform-industry-and-disrupt-supply-chains
60. The EIU. Country report for India, October 2018.
61. Government of India, Ministry of Finance (2018). Infrastructure allocation enhanced To Rs.5.97 lakh crore: Transport sector gets an all time high allocation. [Press release]. Retrieved from http://www.pib.nic.in/Pressreleaseshare.aspx?PRID=1518555
62. Government of India, Ministry of Road Transport & Highways (2018). Ministry of Road Transport & Highways identifies 300 ongoing national highways projects to be completed by March 2019 [Press release]. Retrieved from http://pib.nic.in/newsite/PrintRelease.aspx?relid=179964
63. IJGlobal (2017). India rolls out new road building program. Retrieved from: https://ijglobal.com/articles/130537/india-rolls-out-new-road-building-program
64. The Economic Times (2018). Steelmakers to raise prices as input costs rise on rupee depreciation. Retrieved from: https://economictimes.indiatimes.com/industry/indl-goods/svs/steel/steelmakers-to-raise-prices-as-input-costs-rise-on-rupee-depreciation/article-show/65570018.cms
65. The Times of India (2018). India ratings maintains stable outlook on cement sector. Retrieved from: https://timesofindia.indiatimes.com/business/india-business/india-ratings-maintains-stable-outlook-on-cement-sector/articleshow/66165593.cms
66. The EIU. Country report for India, October 2018.
67. Financial Express (2018). The collapse of IL&FS and what it tells us about fixing India’s critical need for infrastruc-ture finance. Retrieved from: https://www.financialexpress.com/opinion/the-collapse-of-ilfs-and-what-it-tells-us-about-fixing-indias-critical-need-for-infrastructure-finance/1346243/
68. Indonesia Investments (2018). 2019 State Budget Indonesia: Realistic & Rising Focus on Social Spending. Retrieved from: https://www.indonesia-investments.com/news/todays-headlines/2019-state-budget-indonesia-realistic-rising-focus-on-social-spending/item8945?
69. The EIU. Country report for Indonesia, October 2018.
70. Government of Indonesia (2018). Nota keuangan beserta RAPBN TA 2019 Buku II. Retrieved from: https://www.kemenkeu.go.id/media/10377/nota-keuangan-dan-rapbn-2019.pdf
71. Government of Indonesia (2018). Pengesahan rencana usaha penyediaan tenaga listrik PT Perusahaan Listrik Negara (Persero) yahun 2018 s.d. 2027. Retrieved from http://jdih.esdm.go.id/peraturan/Salinan%20Sesuai%20Aslinya_Kepmen%20ESDM%20ttg%20Pengesa-han%20RUPTL%20PT%20PLN%20(Persero)%202018-2027.pdf
72. Herbert Smith Freehills LLP (2018). Major regulatory and policy updates for the Indonesian energy sector—in-creased biodiesel requirements, proposed limitation of crude exports/imports, and potential delay of existing power projects. Retrieved from: https://www.lexology.com/library/detail.aspx?g=e8471e59-288b-4f98-b6aa-56aff0130a94
73. Oxford Business Group. (n.d.). Construction and real estate driven by Indonesia’s expanding infrastructure. Retrieved from: https://oxfordbusinessgroup.com/overview/positive-performance-government’s-infrastruc-ture-agenda-expected-drive-sector-expansion-further
74. Indonesia Investments (2017). High steel price may disturb Indonesia’s construction projects. Retrieved from: https://www.indonesia-investments.com/news/todays-headlines/high-steel-price-may-disturb-indonesia-s-construction-projects/item8156
75. The Indonesia Iron and Steel Industry Association (2017). Indonesia steel industry: Development & opportunities. Retrieved from: https://www.oecd.org/industry/ind/Item_9_5_Indonesia.pdf
76. The Economist (2018). Pakistan’s new prime minister turns to the IMF. Retrieved from: https://www.economist.com/asia/2018/10/11/pakistans-new-prime-minister-turns-to-the-imf
77. Foreign Affairs (2017). China’s $62 billion bet on Pakistan. Retrieved from: https://www.foreignaffairs.com/articles/china/2017-10-24/chinas-62-billion-bet-pakistan
78. Husain, Ishrat (2018). CPEC 2018 Summit. Retrieved from: https://www.dawn.com/news/1409517
79. Rana, S. (2018). Budget 2018-19: Historic high of Rs1.03tr allocated for PSDP. Retrieved from: https://tribune.com.pk/story/1696820/2-budget-2018-19-his-toric-high-rs1-03-tr-allocated-psdp/
80. The EIU. Country report for Pakistan, October 2018.
81. Ibid.
82. The EIU. Country report for Pakistan, September 2018.
83. Philippine News Agency (2018). P909.7-B allotted for ‘Build, Build, Build’ program in 2019. Retrieved from http://www.pna.gov.ph/articles/1042562
84. Oxford Business Group. (2018). Infrastructure investment in the Philippines set to drive growth. Retrieved from: https://oxfordbusinessgroup.com/news/infrastructure-investment-philippines-set-drive-growth
85. The EIU. Country report for Philippines. October 2018.
86. Oxford Business Group (2018). Demand for construction materials in the Philippines looks set to continue after hitting a five-year price high. Retrieved from: https://oxfordbusinessgroup.com/analysis/new-heights-demand-
126
building-materials-looks-set-continue-after-hitting-five-year-price-high
87. The EIU. Country report for Philippines. October 2018.
88. Realnoe Vremya (2018). Kremlin urges businesses to invest in transport infrastructure. Retrieved from: https://realnoevremya.com/articles/2890-kremlin-urges-busi-nesses-to-invest-in-transport-infrastructure
89. The EIU. Country report for Russia, October 2018.
90. President of Russia (2018). The president signed executive order on national goals and strategic objectives of the Russian Federation through to 2024. Retrieved from http://en.kremlin.ru/acts/news/57425
91. Ernst and Young. (n.d.). Russian infrastructure in the global context. Retrieved from: https://www.ey.com/ru/en/issues/business-environment/ey-road-to-2030-russian-infrastructure-in-global-context
92. World Economic Forum (2018). The global competitive-ness report 2018. Retrieved from http://www3.weforum.org/docs/GCR2018/05FullReport/TheGlobalCompetitivenessReport2018.pdf
93. ITE Transport & Logistics (2018). Russian infrastructure construction update. Retrieved from http://www.transport-exhibitions.com/Market-Insights/Russia/Russian-infrastructure-construction-update
94. The EIU. Global Outlook, November 2018.
95. Ernst and Young. (n.d.). Infrastructure development in Russia and Global Insights. Retrieved from: https://www.ey.com/ru/en/issues/business-environment/ey-road-to-2030-infrastracture-development-in-russia-and-global-insights
96. The Guardian (2018). How Turkey’s lira crisis was written in Istanbul’s skyline. Retrieved from: https://www.theguardian.com/cities/2018/aug/23/how-turkeys-lira-crisis-was-written-in-istanbuls-skyline
97. Republic of Turkey Investment Support & Promotion Agency (2018). Investing in infrastructure and public private partnership in Turkey. Retrieved from http://www.invest.gov.tr/en-US/infocenter/publications/Documents/INFRASTRUCTURE.INDUSTRY.pdf
98. CNBC (2018). Turkey slashes growth forecasts for 2018, 2019 in economic plan, lira steady. Retrieved from: https://www.cnbc.com/2018/09/20/reuters-america-turkey-slashes-growth-forecasts-for-2018-2019-in-economic-plan-lira-steady.html
99. Reuters (2018). Turkey to freeze new government projects, Erdogan says. Retrieved from: https://www.reuters.com/article/us-turkey-currency-erdogan/turkey-to-freeze-new-government-projects-erdogan-says-idUSKCN1LU11I
100. Republic of Turkey Investment Support & Promotion Agency (2018). Investing in infrastructure and public private partnership in Turkey. Retrieved from http://www.invest.gov.tr/en-US/infocenter/publications/Documents/INFRASTRUCTURE.INDUSTRY.pdf
101. RailFreight (2018). Amsterdam added to New Silk Road
with new freight line. Retrieved from: https://www.railfreight.com/corridors/2018/03/07/amsterdam-add-ed-to-new-silk-road-with-new-rail-freight-line/
102. Hillman (2018). The Rise of China-Europe Railways. Center for Strategic & International Studies. Retrieved from: https://www.csis.org/analysis/rise-china-europe-railways
103. Damco (2017). Damco launches first block train service from China to Europe. Retrieved from http://www.damco.com/en/about-damco/press/press-releases/2017/damco-launches-first-block-train-service-from-china-to-europe
104. JOC (2018). China’s first perishables block train leaves for Russia. JOC. Retrieved from: https://www.joc.com/rail-intermodal/international-rail/europe/china%E2%80%99s-first-perishables-block-train-leaves-russia_20180208.html
105. Reuters (2018). In Europe’s east, a border town strains under China’s Silk Road train boom. Retrieved from: https://uk.reuters.com/article/uk-china-europe-silkroad-insight/in-europes-east-a-border-town-strains-under-chinas-silk-road-train-boom-idUKKBN1JM36M
106. Davenne (2017). COTIF: Unified railway law to connect Europe, Asia and Africa. Intergovernmental Organisation for International Carriage by Rail. Retrieved from: https://uic.org/eurasian-rail-corridors
107. Molnar and Ojala (2003). Transport and Trade Facilita-tion Issues in the CIS 7, Kazakhstan and Turkmenistan, World Bank. http://documents.worldbank.org/curated/en/473671468111534904/Transport-and-trade-facili-tation-issues-in-the-CIS-7-Kazakhstan-and-Turkmeni-stan
108. Ibid.
109. The Central Intelligence Agency. The World Factbook: Central Asia, Kazakhstan. Retrieved from: https://www.cia.gov/library/publications/the-world-factbook/geos/kz.html
110. The Central Intelligence Agency. The World Factbook: Central Asia, Uzbekistan. Retrieved from: https://www.cia.gov/library/publications/the-world-factbook/geos/uz.html
111. The Central Intelligence Agency. The World Factbook: Central Asia, Turkmenistan. Retrieved from: https://www.cia.gov/library/publications/the-world-factbook/geos/tx.html
112. Kalirajan, K A U Zaman and Wijesekere G (2015). Strengthening Natural Resources Management in ASEAN: National and Regional Imperatives, Targets, and Opportunities. Economic Research Institute for ASEAN and East Asia. Retrieved from http://www.eria.org/ERIA-DP-2015-59.pdf;
113. OECD Issue Paper (2002). Territorial Development Policy: The Role of Infrastructures. Retrieved from: https://www.oecd.org/cfe/regional-policy/2756902.doc; Kingombe C. (2014). Hard and Soft Infrastructure Development in Africa. United Nations Conference on Trade and Development. Retrieved from: https://unctad.
127
org/meetings/en/Presentation/TLB_TF_2014MYEM_D2_P2_ChristianKingombe2.pdf
114. World Investment Report 2008: Transnational Corpora-tions and the Infrastructure Challenge. United Nations Conference on Trade and Development, Sep. 24, 2018 Retrieved from http://unctad.org/en/Docs/wir2008_en.pdf, Box III.9 (“Stages of industrial development and infrastructure industries”)
115. The CAREC Program, Central Asia Regional Economic Cooperation (CAREC). https://www.carecprogram.org/
116. Chang, Ha-Joon (2006). The East Asian Development Experience: The Miracle, the Crisis and the Future, University of Chicago Press. Retrieved from: https://www.scribd.com/document/194120290/The-East-Asian-Development-Experience-Ha-Joon-Chang
117. The World Bank (1993). The East Asian Miracle: Economic Growth and Public Policy. Retrieved from http://documents.worldbank.org/curated/en/975081468244550798/Main-report
118. Asian Development Bank (2015). Greater Mekong Subre-gion Economic Cooperation Program Overview. https://www.adb.org/publications/greater-mekong-subregion-economic-cooperation-program-overview
119. Asian Development Bank (2017). Asian Economic Integration Report 2017. https://www.adb.org/publica-tions/asian-economic-integration-report-2017
120. The Times of India (2018). Northeast is at heart of ‘Act East Policy’: PM Narendra Modi in Assam. Retrieved from: https://timesofindia.indiatimes.com/india/northeast-is-at-heart-of-act-east-policy-pm-narendra-modi-in-assam/articleshow/62766380.cms
121. Asian Development Bank (2018). Asian Economic Integration Report 2018. https://www.adb.org/sites/default/files/publication/456491/aeir-2018.pdf
122. Ibid,. RailFreight.com (2018).
123. Roland Berger (2017). Eurasian rail corridors: What opportunities for freight stakeholders?. International Union of Railways. Retrieved from: https://uic.org/com/IMG/pdf/corridors_exe_sum2017_web.pdf
124. RailFreight.com (2018). New rail freight route Hunan-Minsk launched. Retrieved from: https://www.railfreight.com/beltandroad/2018/07/03/new-rail-freight-route-hunan-minsk-launched/
125. Ibid.
126. Briginshaw. 2018. Austria backs broad-gauge extension to Vienna. International Railway Journal; Herbert Vytiska. 2018. Riding the train from Beijing to Vienna (in 2033) (translated by Alexandra Brzozowski). EURACTIV Germany. Retrieved from: https://www.euractiv.com/section/railways/news/riding-the-train-from-beijing-to-vienna-in-2033/
127. Asian Development Bank (2016). Unlocking the potential of railways: A railway strategy for CAREC, 2017-2030.
Retrieved from: https://www.adb.org/sites/default/files/institutional-document/227176/carec-railway-strate-gy-2017-2030.pdf
128. Ibid, Roland Berger (2017).
129. Ibid, Hillman (2018).
130. Asian Development Bank (2016).
131. ADB, IADB, ADBI (2012). Shaping the Future of the Asia-Latin America and the Caribbean Relationship.
132. Costa and Pessoa (2016). Winners and Losers from a Commodities-for-Manufactures Trade Boom. Journal of International Economics.
133. JOC (2018). Asia-ECSA volume, rate rise, but capacity increases lag. Retrieved from: https://www.joc.com/maritime-news/trade-lanes/asia-south-america/asia-ecsa-volume-rates-rise-capacity-increases-lag_20180518.html
134. UNWTO World Tourism Barometer.
135. Campante and Yanagizawa-Drott (2018). Long-Range Growth: Economic Development in the Global Network of Air Links. Quarterly Journal of Economics.
136. The Economist (2018). Latin America Needs an Infrastructure Upgrade. Retrieved from: https://www.economist.com/the-americas/2018/03/10/latin-ameri-ca-needs-an-infrastructure-upgrade
137. Renewable Energy Institute. About Asia Super Grid (ASG). Retrieved from: https://www.renewable-ei.org/en/asg/about/
138. Energy Charter (2014). Gobitec and the Asian Supergrid for Renewable Energy: Sources in Northeast Asia. Retrieved from: https://energycharter.org/fileadmin/DocumentsMedia/Thematic/Gobitec_and_the_Asian_Supergrid_2014_en.pdf; Korea Herald (2010). “Promot-ing an Asian version of ‘Desertec’”. Retrieved from http://www.koreaherald.com/view.php?ud=20090924000009; Indian Ministry of Power (2018). All India Installed Capacity (in MW) of Power Stations. Retrieved from http://www.cea.nic.in/reports/monthly/installedcapac-ity/2018/installed_capacity-10.pdf
139. SGD Compass. SDG 7: Ensure access to affordable, reliable, sustainable and modern energy for all. Retrieved from: https://sdgcompass.org/sdgs/sdg-7/
140. International Energy Agency (2017). WEO 2017 Special Report Energy Access Outlook. Retrieved from http://www.iea.org/publications/freepublications/publication/WEO2017SpecialReport_EnergyAccessOut-look.pdf
141. BP Statistical Review of World Energy (2018). Asia-Pacif-ic continues to be the largest consumer and producer of coal, accounting for 72% of global production and 75% of consumption in 2017. Retrieved from: https://www.bp.com/content/dam/bp/en/corporate/pdf/energy-eco-nomics/statistical-review/bp-stats-review-2018-coal.pdf
128
142. Quartz India (2018). Cheap renewable energy is killing India’s coal-based power plants. Retrieved from: https://qz.com/1272394/cheap-solar-and-wind-energy-prices-are-killing-indias-coal-power-plants/; Economist Intelligence Unit Interview on July 16, 2018. According to Rajiv Panda of the South Asia Regional Initiative for Energy Integration (SARI/EI), solar tariffs in July were around Rs2 per unit compared with Rs4.5 for coal.
143. Frankfurt School UNEP Collaborating Centre for Climate & Sustainable Energy Finance (2018). Global Trends in Renewable Energy Investment Report 2018.
144. IRENA (2018). Renewable Energy Capacity Statistics. Renewables capacity for Asia rose from 279 GW in 2007 to 917 GW in 2017. Retrieved from http://resourceirena.irena.org/gateway/dashboard/
145. SE4ALL (2015). Scaling Up Finance for Sustainable Energy Investments: Report of the SE4All Advisory Board’s Finance Committee. Retrieved from: https://www.seforall.org/sites/default/files/l/2015/09/SE4All-Adviso-ry-Board-Finance-Committee-Report.pdf; Global Trends in Renewable Energy Investment Report 2018, United Nations Environment Programme and Bloomberg New Energy Finance, https://europa.eu/capacity4dev/file/71900/download?token=57xpTJ4W
146. World Health Organization. WHO Global Ambient Air Quality Database (update 2018). Retrieved from http://www.who.int/airpollution/data/cities/en/
147. IEA (2017). World Energy Outlook 2017. Retrieved from: https://www.iea.org/Textbase/npsum/weo2017SUM.pdf
148. Renewable Energy Institute (2017). Asian Super Grid Interim Report 2017. Retrieved from: https://www.renewable-ei.org/en/activities/reports/img/20170419/REI_ASG_interim_report_EN_summary.pdf
149. Ibid.
150. The Economic Times (2018). India, Bhutan reaffirm commitment to hydropower cooperation. Retrieved from: https://energy.economictimes.indiatimes.com/news/power/india-bhutan-reaffirm-commitment-to-hydropow-er-cooperation/64892036
151. South Asia Regional Initiative for Energy Integration (2017). BIMSTEC Energy Outlook 2030. Retrieved from: https://sari-energy.org/publications-list/sari-ei-report-bimstec-energy-outlook-2030-final-design-version-14-3-2018-rajiv/
152. ASEAN Center for Energy and China Renewable Energy Engineering Institute (2017). ASEAN Power Cooperation Report 2017, East Asia Summit Clean Energy Forum. Retrieved from http://cloud.aseanenergy.org/s/25tqr2MtACeS6k0
153. The Laotian Times (2017). LAOS: Electricity Facts. Retrieved from: https://laotiantimes.com/2017/01/10/laos-latest-electricity-facts/
154. IRENA. Global installed wind power capacity totalled 514 GW in 2017. Retrieved from: https://www.irena.org/en/wind; Mongolian Ministry of Energy (2018). Mongolia is estimated to have 1,100 GW of wind power potential. Retrieved from: https://www.unescap.org/sites/default/files/Mr.%20Yeren-Ulzii%20-%20Mongolia%20
Presentation.pdf
155. South China Morning Post (2017). Gone with the wind? China determined to end wind power subsidies by 2020. Retrieved from: https://www.scmp.com/business/companies/article/2110228/gone-wind-china-deter-mined-end-wind-power-subsidies-2020
156. Mercom India (2018). Green Energy Corridor is Under-funded, Says Standing Committee on Energy. Retrieved from: https://mercomindia.com/green-energy-corridor-underfunded/; Tongia, Rahul (2018). Embarrassment of riches? The rise of RE in India and steps to manage ‘surplus’ electricity. Brookings Institute. Retrieved from: https://www.brookings.edu/blog/planetpoli-cy/2018/06/15/embarrassment-of-riches-the-rise-of-re-in-india-and-steps-to-manage-surplus-electricity/
157. South Asia Regional Initiative for Energy Integration (2018). Brief Report on SARI/EI Participation in the ‘ASEAN Power Grid Summit 2018-Enhancing APG Investment Towards Regional Energy Optimisation’. Retrieved from: https://sari-energy.org/ publications-list/brief-report-on-sari-ei-participation-in-the-asean-power-grid-summit-21st-23rd-may-2018-lao-pdr/
158. Timilsina, Toman, Karacsonyi and Tena Diego (2015). How Much Could South Asia Benefit from Regional Electricity Cooperation and Trade?. World Bank Group Policy Research Working Paper. Retrieved from http://documents.worldbank.org/curated/en/846141468001468272/pdf/WPS7341.pdf
159. The Economic Times (2018). Nepal invites Bangladesh for energy tie-up. Retrieved from: https://energy.economic-times.indiatimes.com/news/power/nepal-invites-bangla-desh-for-energy-tie-up/64885039; 2017. “Bhutan to supply hydropower to Bangladesh through India soon.” Retrieved from: https://energy.economictimes.indiatimes.com/news/power/bhutan-to-supply-hydropower-to-bangladesh-through-india-soon/59434785
160. IRENA (2017). Electricity Storage and Renewables: Costs and Markets to 2030. Retrieved from http://www.irena.org/publications/2017/Oct/Electricity-storage-and-renewables-costs-and-markets
161. Japan Ministry of Economy, Trade and Industry (2017). “再生可能エネルギーの現状と本年度の調達状格等算定委
員状について”. Retrieved from http://www.meti.go.jp/shingikai/santeii/pdf/030_01_00.pdf
162. Nord Pool Consulting (2016). Powering ASEAN: Can the Nordic Model Work? Retrieved from http://www.asean-aemi.org/wp-content/up-loads/2016/06/AEMI-ACEF2016-Hans-Arild-Bredesen.pdf’; Nord Pool Consulting. Retrieved from: https://www.nordpoolgroup.com/Market-data1/Power-system-data/Production1/Wind-Power/ALL/monthly/?view=table
163. IEX India Energy Exchange (2016). Trading at Power Exchange. Retrieved from http://www.iitk.ac.in/ime/anoops/IEX%20Training-2016/IITK%20-%20PPTs%20-%202016/Day%20-%203%20IITK/Mr.%20Prassana%20Rao%20-%202%20-%20Trading%20at%20Power%20Exchanges.pdf
164. UNESCAP (2018). Northeast Asia Regional Power Interconnection and Cooperation Forum 2018. Retrieved

129
from: https://www.unescap.org/sites/default/files/Concept%20note_NEARPIC2018_web.pdf
165. Ibid.
166. Churkin and Bialek (2018). Analysis of the prospective energy interconnections in Northeast Asia and develop-ment of the data portal. E3S Web of Conferences, 2018. Retrieved from: https://www.e3s-conferences.org/articles/e3sconf/pdf/2018/02/e3sconf_aec2018_01003.pdf
167. Mathews (2012). The Asian Super Grid. The Asia-Pacific Journal, Vol 10, Issue 48, No 1, Nov. 26, 2012.
168. UNESCAP (2018). Integrating South Asia’s Power Grid for a Sustainable and Low Carbon Future. Retrieved from: https://www.unescap.org/sites/default/files/Integrat-ing%20South%20Asia%E2%80%99s%20Power%20Grid%20for%20a%20Sustainable%20and%20Low%20Carbon%20Future_WEB.pdf
169. International Electricity Market (2015). Development Prospects of the ASEAN Power Sector: Towards an Integrated Electricity Market. Retrieved from: https://www.researchgate.net/profile/Aaron_Praktiknjo/publication/282860529_Development_Prospects_of_the_ASEAN_Power_Sector/links/561fc7d208aea35f267e0abe/Development-Pros-pects-of-the-ASEAN-Power-Sector.pdf
170. The World Bank (2016). Q&A: Central Asia-South Asia Electricity Transmission and Trade Project (CASA-1000). Retrieved from http://www.worldbank.org/en/news/speech/2016/05/10/central-asia-south-asia-electricity-transmission-and-trade-project-casa-1000
171. CASA-1000 (2011). Central Asia-South Asia Electricity Transmission and Trade (CASA-1000) Project Feasibility Study Update. SNC-Lavalin International Inc. Retrieved from: http://www.casa-1000.org/1)Techno-Econom-icFeasbilityStudy_MainRep_English.pdf
172. Bonneville Power Administration and the Northwest Gas Association. Comparing Pipes & Wires. Retrieved from www.northwestchptap.org/nwchpdocs/transmission_and_n_gas_comparing_pipes_and_wires_032304.pdf
173. CASA-1000 (2017). “Casa 100 enters construction phase with signing of EPC contracts for over 500 km of high voltage direct current transmission line in Afghani-stan”. Retrieved from http://www.casa-1000.org/Docs/TW03%20DABS%20Press%20Release%20ENG%2011.12.2017%20FINAL.pdf
174. IEA (2017). World Energy Data statistics. Retrieved from http://www.iea.org/statistics; The World Bank. Renewable electricity output (% of total electricity output). Retrieved from: https://data.worldbank.org/indicator/EG.ELC.RNEW.ZS?end=2015&locations=KR&start=1990&view=chart
175. Financial Times (2017). Plan for north-east Asian electricity ‘super grid’ boosted. Retrieved from: https://www.ft.com/content/4b04ed8e-bf8b-11e7-b8a3-38a6e068f464
176. Global Energy Interconnection Development and
Cooperation Organization.
177. ASEAN Centre for Energy. Retrieved from http://www.aseanenergy.org/program-area/apg/
178. Faber, B. and C. Gaubert (2016). Tourism and Economic Development: Evidence from Mexico’s Coastline. NBER working paper no. 22300.
179. Prologis (2017). Digitalization and Its Impact on Aviation. Retrieved from https://www.prologis.aero/wp-content/uploads/2017/05/Digitalization-and-its-impact-on-aviation.pdf
180. Ernst and Young (2016). Digital Supply Chain: it’s all about that data. Retrieved from: https://www.ey.com/Publication/vwLUAssets/Digital_supply_chain_-_its_all_about_the_data/$FILE/EY-digital-supply-chain-its-all-about-that-data-final.pdf
181. The Hackett Group (2017). Analytics: Laying the Foundation for Supply Chain Digital Transformation. Retrieved from: https://www.thehackettgroup.com/wp-content/uploads/2017/12/hackett-analytics-supply-chain-digital-1711.pdf
182. Allison (2018). Blockchain Refresh: Why KPMG’s New Strategy Focuses on Custom. Retrieved from: https://www.coindesk.com/blockchain-refresh-why-kpmgs-new-strategy-focuses-on-customs/
183. AFC International (2016). What is EDI and why should importers care about it? Retrieved from: https://www.afcinternationalllc.com/customs-brokerage-news/what-is-edi-and-why-should-importers-care-about-it/; DiCetral. EDI Standards: Understanding the Basics of EDI. Retrieved from: https://edi3.dicentral.com/edi-stand-ards
184. UNESCAP (2016). Framework Agreement on Facilitation of Cross-border Paperless Trade in Asia and the Pacific. Retrieved from: https://www.unescap.org/resources/framework-agreement-facilitation-cross-border-paper-less-trade-asia-and-pacific
185. Port Strategy (2018). Blockchain to Help China’s Port Clearance. Retrieved from: https://www.portstrategy.com/news101/port-operations/planning-and-design/blockchain-to-help-chinas-port-clearance
186. Doing Business: Trading across borders. Retrieved from http://www.doingbusiness.org/en/data/exploretopics/trading-across-borders
187. CGNT (2017). ‘Ghost port’: Asia’s first fully-automated port begins operations in Qingdao. Retrieved from: https://news.cgtn.com/news/3d637a4e31677a4d/share_p.html
188. Konecranes (2018). Konecranes receives another order from Indonesia for its Automated RTG System. Retrieved from: https://www.konecranes.com/resources/media/releases/2018/konecranes-receives-another-order-from-indonesia-for-its-automated-rtg-system
189. Bastian Consulting (2018). The Impact of Big Data on Supply China. Retrieved from: http://bconsult.io/2018/04/09/the-impact-of-big-data-on-supply-chain/
190. World Economic Forum (2018). Global Competitiveness
130
Report 2018. Retrieved from: http://reports.weforum.org/global-competitiveness-report-2018/competitiveness-rankings/#series=GCI4.A.03
191. Speedtest Global Index (2018). China’s mobile broadband download speed of 28.77 Mbps only slightly exceeds the global average of 23.80 Mbps; Norway, the top-ranked economy, has a speed of 67.17 Mbps. Retrieved from: http://www.speedtest.net/global-index
192. Alliance for Affordable Internet (2018). Closing the Investment Gap. Retrieved from: https://a4ai.org/closing-the-investment-gap-the-critical-role-of-devel-opment-banks-to-advance-digital-inclusion/
193. Branchoux, Fang and Tateno (2018). Estimating Infrastructure Financing Needs in the Asia-Pacific Least Developed Countries, Landlocked Developing Countries, and Small Island Developing States. Economies. Retrieved from: https://www.mdpi.com/2227-7099/6/3/43
194. McKinsey & Company (2012). Online and upcoming: The Internet’s impact on India. Retrieved from: https://www.mckinsey.com/~/media/mckinsey/dotcom/client_service/high%20tech/pdfs/online_and_upcoming_the_inter-nets_impact_on_india.ashx
195. Alliance for Affordable Internet (2018).
196. United Nations Economic Commission for Europe (2003). Retrieved from: https://ec.europa.eu/taxation_customs/sites/taxation/files/resources/documents/customs/policy_issues/e-customs_initiative/ind_projects/swannexv.pdf
197. The World Bank (2017). Customs Electronic Data Interchange systems dataset. Retrieved from: http://www.doingbusiness.org/content/dam/doingBusi-ness/media-api/topicsconfig-assets/docs/DB2018_TAB_Electronic-Platforms_Dataset_10-Oct.xlsx
198. UNDP (2016). Sustainable Development Goals. Retrieved from: https://sustainabledevelopment.un.org/sdg9
199. World Economic Forum and Bain & Company (2018). Trade Tech—A New Age for Trade and Supply Chain Finance. Retrieved from: https://www.bain.com/contentas-sets/83835c319cc649cfa6938dcbeaa7008c/white_paper_trade_tech_report.pdf
200. EIU calculations based on WTO data. Hong Kong, China introduced an EDI in February 2000; see Full Migration to Electronic Submission of Production Notification, Hong Kong Trade and Industry Department, Dec. 22, 1999, https://www.tid.gov.hk/english/aboutus/presspeech/press/1999/pn.html. For Hong Kong, China trade data see International trade statistics 2001, World Trade Organization, https://www.wto.org/english/res_e/statis_e/its2001_e/stats2001_e.pdf and International trade statistics 2000, World Trade Organization, https://www.wto.org/english/res_e/statis_e/stats2000_e.pdf; Indonesia introduced an electronic single window in 2007; see Indonesia General Information, ASEAN Single Window, http://asw.asean.org/nsw/indonesia/indonesia-
general-information. For Indonesia trade data see “International Trade Statistics 2009”, World Trade Organization, https://www.wto.org/english/res_e/statis_e/its2009_e/its2009_e.pdf and “International Trade Statistics 2008”, World Trade Organization, https://www.wto.org/english/res_e/statis_e/its2008_e/its2008_e.pdf
201. Donaldson, David (2018). Railroads of the Raj: Estimating the Impact of Transportation Infrastructure. American Economic Review; Donaldson, David, and Richard Hornbeck (2016). Railroads and American Economic Growth: A ‘Market Access’ Approach. Quarterly Journal of Economics.
202. AIDDATA (2018), Connective Financing: Chinese Infrastructure Projects and the Diffusion of Economic Activity in Developing Countries.
203. Calderón, C., Moral-Benito, E., Servén, L. (2014). Is Infrastructure Capital Productive? A Dynamic Heteroge-neous Approach. Journal of Applied Economics.
204. Redding, Stephen and Venables, Anthony J. (2004). Economic geography and international inequality. Journal of International Economics.
205. Topalova, Petia (2010). Factor Immobility and Regional Impacts of Trade Liberalization: Evidence on Poverty from India. American Economic Journal: Applied Economics.
206. Dollar, David, and Aart Kraay (2001). Growth is Good for the Poor. The World Bank Policy Research Working Paper No. 2587.
207. Fajgelbaum, Pablo D. and Amit K. Khandelwal (2016). Measuring the Unequal Gains from Trade. The Quarterly Journal of Economics.
208. Langston, C. (2016). The reliability of currency and purchasing power parity conversion for international project cost benchmarking., Benchmarking: An Interna-tional Journal, 23(1), 61-77.
209. Langston, C. (2019). Benchmarking international construction costs. Gruneberg, S. (ed.), Global construc-tion data, Routledge (in press).
210. Expatistan (2018). Cost of living comparisons. Retrieved from: https://www.expatistan.com/cost-of-living
211. Bureau of Infrastructure, Transport and Regional Economics (BITRE) (2016). Modelled road construction and maintenance price index. Department of Infrastruc-ture and Regional Development. Retrieved from: https://bitre.gov.au/publications/2017/files/is_083.pdf.
With sections written by: