investment finance
TRANSCRIPT

2016
Investment and Investment Finance
in Europe
Financing productivity growth
Inve
stm
ent a
nd In
vest
men
t Fin
ance
in E
urop
e
Fi
nanc
ing
prod
uctiv
ity g
row
th


Economics DepartmentEuropean Investment Bank
Investment and Investment Finance
in Europe
Financing productivity growth

Investment and Investment Finance in Europe European Investment Bank
2
Investment and Investment Finance in Europe© Economics Department (EIB), 2016. All rights reserved. Short sections of text, not to exceed two paragraphs, may be quoted in the original language without explicit permission provided that the source is acknowledged.
About the ReportThe EIB annual report on Investment and Investment Finance is designed to serve as a monitoring tool providing a comprehensive overview on the developments and drivers of investment and its financing in the EU. It combines an analysis and understanding of key market trends and developments, with a more in-depth thematic focus, which this year is devoted to the impact of financial constraints on investment dynamics. A new addition to the report this year is the new annual EIB Investment Survey (EIBIS). The report is a flagship product of the EIB Economics Department. It complements internal EIB analysis with contributions from leading experts on the field.
About the Economics Department of the EIBThe mission of the EIB Economics Department is to provide economic analyses and studies to support the Bank in its operations and in the definition of its positioning, strategy and policy. The Department, a team of 30 economists, is headed by Debora Revoltella, Director of Economics.
Main Contributors to this year’s reportEconomic Editors Atanas Kolev (lead), Philipp Brutscher, and Christoph Weiss, under the supervision of
Pedro De Lima, Head of Economic StudiesIntroduction Atanas Kolev Chapter 1 Atanas Kolev (chapter leader), Tim Bending, Philipp-Bastian Brutscher, Rocco Bubicco,
and Tanja Tanayama.Chapter 2 Carol Corrado (The Conference Board), Jonathan Haskel (Imperial College, CEPR and IZA),
Cecilia Jona-Lasinio (Istat and LUISS Lab), and Massimiliano Iommi (Istat and LUISS Lab).Chapter 3 Tim Bending and Philipp-Bastian Brutscher.Chapter 4 Laurent Maurin (chapter leader), Carlo de Nicola, Natacha Valla, Marcin Wolski (Box 3), João Pinto
(Catholic University, Portugal, Box 1) and Paulo Alves (Catholic University, Portugal, Box 1)Chapter 5 Hemlut Kraemer-Eis (EIF, chapter leader), Frank Lang (EIF), Wouter Torfs (EIF), and Salome
Gvetadze (EIF).Chapter 6 Atanas Kolev (chapter leader), Pauline Bourgeon, Christoph Weiss, Noelia Jiménez (Banco de
España, Box 2), Roberto Blanco (Banco de España, Box 2), Emilia Bonaccorsi di Patti (Banca d’Italia, Box 3), Luísa Farinha (Banco de Portugal, Box 4).
Chapter 7 Şebnem Kalemli-Özcan (University of Maryland, CEPR and NBER)
Published by the European Investment Bank.Linguistic editors: Peter Haynes, Chris ShawLayout: Daniel Cima, Marlène Hignoul, EIB GraphicTeamPrinted by Imprimerie Centrale SA on FSC Paper:FSC/Condat Silk (Cover), FSC/MagnoSatin (Content)
DisclaimerThe views expressed in this publication are those of the authors and do not necessarily reflect the position of the EIB.
AcknowledgementsResearch assistance from Floriana Borino, Jonas Heipertz, Benedetta di Lupidio, Ilaria Nava, and Alena Wabitsch is gratefully acknowledged.

CONTENTS
European Investment Bank Investment and Investment Finance in Europe
3
Executive summary 5
Introduction 11
Part I: Gross fixed investment and intangible capital
1. Gross fixed capital formation in the EU 25
2. Growth, tangible and intangible investment in the EU and US 73 before and since the Great Recession
3. The EIB Investment Survey: a preview 103
Part II: Investment finance
4. Credit conditions and corporate investment in Europe 145
5. Bottlenecks in financing SMEs’ competitiveness 193
Part III: Financing productivity growth
6. Credit supply and capital misallocation: implications for corporate investment 225
7. Financial frictions and sources of finance for European firms 259

145
European Investment Bank Investment and Investment Finance in Europe
Part II
Investment finance
Chapter 4
Credit conditions and corporate investment in Europe1
1 This chapter was prepared by Laurent Maurin with contributions from Natacha Valla, Carlo de Nicola and Marcin Wolski (EIB) and research assistance by Benedetta di Lupidio and Alena Wabitsch.

146
Investment and Investment Finance in Europe European Investment Bank

Investment finance PART II 147
European Investment Bank Investment and Investment Finance in Europe
Investment finance
Chapter at a glance
This chapter analyses recent developments in credit conditions in the EU in order to discuss some of the possible factors behind the relative weakness in corporate investment at this stage of the recovery. With the sovereign debt crisis, Europe has gone through a major crisis. During its resolution, both the corporate and the banking sectors have become stronger.
• Financial conditions have gradually normalised over recent years, from adverse credit supply conditions to conditions broadly neutral for EU corporate investment. Together with the accommodative monetary policy stance, they should support capital expenditure.
• The low interest rate environment may well reflect the profound deleveraging cycle that the banking and corporate sectors have gone through. To some extent, the length of the adjustment process may well reflect its magnitude, which pushed monetary policy to its limits in several parts of Europe. Besides, the current slow recovery may reflect some hysteresis effects from years of very low investment.
• The EU financial system seems to be starting to revert slowly from a situation of high fragmentation. Between core countries and vulnerable countries, government bond yields, the corporate cost of bank borrowing, bank credits and, more widely, access to external finance are starting to move in tandem across the euro area. Still, some stigma effects cannot be denied at this stage. Compared to the pre-crisis situation, capital flows in the cohesion countries have not resumed yet.
• The positive results of the 2016 EBA stress test have not been accompanied by a confidence rally in the banking sector. Despite the magnitude of the regulatory adjustment achieved, European banks continue to suffer from very low valuations. This most likely reflects a combination of factors, some of them being specific to some countries. The persistence of a low rate environment may require structural changes in the business model of some banking sectors.
• The European financial market is underdeveloped and not well integrated. The crisis has shown the need to further develop the European debt and capital markets as an alternative source of finance for European corporations. The deepening of the corporate debt market is especially important to free up bottlenecks in the distribution of bank credits.
Putting aside the negative risks going forward, the conditions for a strengthening of economic activity are met. This will be accompanied by acceleration of corporate investment in Europe. Looking beyond the cycle, the development of deeper financial markets across Europe would help to achieve better resource allocation, reduce the likelihood of entering secular stagnation, and better protect European economies against shocks.

PART II Investment finance148
Investment and Investment Finance in Europe European Investment Bank
We focus on the macro-financial environment of corporate investment in the EU, with a view to analysing how financing conditions, firms’ financial policies and banks’ credit supply conditions affect capital expenditure. The developments reviewed in this chapter support the view of a gradual normalisation over recent years, from adverse credit supply conditions to conditions broadly neutral for EU corporate investment overall, with some differences across groups of countries and types of firms. Asymmetric economic conditions between vulnerable and other economies continue to prevail, but are reducing. Cohesion countries are more affected by the retrenchment of cross-border financial flows. Small corporations are still facing tighter financing conditions.
We also find some evidence of increased financial soundness of the corporate sector, with some evidence of deleveraging, especially in vulnerable countries. As shown by the EBA 2016 stress test results, banks have also strengthened their balance sheets. However, their current valuation and its sensitivity to specific negative news or events suggest that they are continuing to evolve in a difficult environment. Looking forward, their capacity to accumulate capital may suffer from the environment of low and flat yields if it were to remain. Already, there are several signs that the business model of the European banking sector is being challenged.
This is one of the main risks with which the EU economy is confronted. Others such as the resurgence of uncertainty following the Brexit referendum, the persistent decline in long-term growth and the likelihood of entering a so-called secular stagnation scenario are also to be taken into consideration.
The current macro-financial environment results in a challenging situation for the financial system, banks and central banks, but also pension funds and more widely investment funds. So far, the financial system has proved relatively resilient, but its capacity to channel savings into their most efficient use may be harmed. On the monetary policy front, many of the parameters of current policies are close to their limits. The longer the current environment of low and flat yields remains in place, the higher the likelihood that the detrimental effects predominate.
In a context where monetary policy may start reaching the limits of what it can do to re-inflate the economy and keep price expectations anchored, support from other policies is urgently needed. On top of demand policy, structural policies aimed at deepening capital markets are needed. The European stock market remains undersized and Europe is missing a liquid and unified corporate debt market. The Banking Union and Capital Market Union (CMU) should become two pillars for increasing the efficient allocation of capital within the EU. The progress achieved since the crisis provides grounds for some cautious optimism but advancing more quickly and deeply in setting them up would increase the capacity of the EU economy to withstand the risks going forward.
This chapter consists of five sections and three boxes. In the first section, we review the macroeconomic environment surrounding corporate investment. Financial conditions have improved, but the negative impact of the rise in uncertainty resulting from the Brexit referendum may be expected. In the second section, we review the changes in worldwide cross-border financial flows in the aftermath of the financial crisis, with special attention devoted to countries belonging to the European Union. We show that FDI flows have proved relatively more resilient but intra-flows towards cohesion countries are still well below the pre-crisis level and several indicators suggest that the European financial system remains fragmented, thereby limiting the possibilities of risk-sharing. In the third section, we analyse the changes which have occurred regarding the financing of corporate capital expenditure. Financial resilience has increased along with reduced debt, a rise in income, a longer debt maturity structure
Investment finance PART II 149
European Investment Bank Investment and Investment Finance in Europe
and decreases in the cost of borrowing triggered by monetary policy. In the fourth section, we review the strengths and weaknesses of the EU banking sector. We show that banks go through a period of structural transformation and are probably affected by weak investor preference. The evolution of their balance sheets since the crisis will enable them to withstand current economic conditions as long as the low interest rate environment and the flat yield curve do not persist for too long. Section 5 concludes. The first box focuses on project finance and its attractiveness and peculiarity in comparison to corporate finance. The second box sheds some light on the role of demand and credit conditions in explaining the different pattern of financial flows in vulnerable and other countries. The third box presents models of bank lending rate pass-through to show that the risk components, mostly external to corporations, have contributed to raising bank lending spreads in the wake of the sovereign debt crisis.
4.1. Non-financial corporates’ investment in the
current macro-financial environment In mid-2016, eight years after Lehman´s bankruptcy, EU GDP was around its pre-crisis level while investment and bank loans remained at a lower level. So far, as shown in detail in Chapter 1, the recovery which started after the sovereign debt crisis has remained lacklustre. A debate has emerged about the causes of the weak recovery in a context of very accommodative monetary policy. Some have advanced the hypothesis of secular stagnation while others have evoked a deep debt deflation episode. In Europe, the deleveraging pressure has been uneven, but was especially strong in vulnerable countries during the sovereign debt crisis (Box 2). More recently, since the end of June 2016, risks of an even weaker recovery have increased, along with the prospect of Brexit.
4.1.1. Ongoing recovery but investment abnormally weak…Across Europe, the decline in bank loans came to a halt in 2015 and NFCs’ investment picked up in 2016 (Figure 1). However, the recovery in capital expenditure appears subdued compared to previous historical episodes of recovery, such as in 2005. NFCs’ investment remains well below its pre-crisis level and the investment share is well below its average value since the end of the nineties (Figure 2). While, after several years of weak investment, the reversion of investment towards this long-run value can be expected to provide support for investment, expectations such as those entailed in consensus economics support the view of a marginal acceleration of EU NFCs’ investment this year and the next. This comes at odds with the very accommodative monetary policy stance and the fiscal stance as well as specific policy measures such as the so-called Juncker Plan. Indeed, as shown in Chapter 1, the long-run historical relationship between investment, demand, profits and the cost of borrowing accounts for part of the subdued capital expenditure. The projected strengthening of both domestic and external demand, and the historically low cost of external financing, should indeed provide stronger support for investment growth.

PART II Investment finance150
Investment and Investment Finance in Europe European Investment Bank
Figure 1 Real investment growth (Annual growth rate, %, 4-qtr moving average)
Figure 2 Investment share in GDP (nominal, 4-qtr moving average)
Vulnerable Euro areaEU Cohesion (rhs)Core
-20
-15
-10
-5
0
5
10
2000
20
02
2004
20
06
2008
20
10
2012
20
14
2016
0.090
0.095
0.100
0.105
0.110
0.115
0.120
0.125
0.130
2000
20
02
2004
20
06
2008
20
10
2012
20
14
2016
-30-25-20-15-10-5051015202530
0.11
0.12
0.13
0.14
0.15
0.16
Source: ECON calculations based on Eurostat. Note: 4-quarter moving average. “Core countries” include Austria, Belgium, Germany, Denmark, Finland, France, Luxembourg,
the Netherlands, Sweden and the UK. “Vulnerable Member States” (VMS) include Cyprus, Greece, Spain, Ireland, Italy, Slovenia and Portugal. “Cohesion countries” include Bulgaria, the Czech Republic, Estonia, Hungary, Lithuania, Latvia, Malta, Poland, Romania and Slovakia. The availability of the series depends on the indicator and the country. Hence, it is not possible to maintain a constant composition. For some, the country may be missing over the whole period. For others, it may have reported during the recent past only. In this case, the aggregate series is back-cast using a changing composition.
4.1.2. … despite accommodative policies… The past negative surprises in corporate investment conditional upon the macroeconomic environment are striking as financial fragmentation diminishes across the euro area, financing conditions have improved and both monetary and fiscal policies appear supportive. On the one hand, the fiscal stance is assessed to be slightly supportive (EC 2016 spring forecast), and the Juncker Plan is becoming an important tool for supporting demand. On the other hand, the very accommodative monetary policy stance has successfully contributed to reducing the cost of external financing for NFCs, with non-standard measures (NSMs) in place to restore its transmission to the real economy.
More precisely, regarding monetary policy, across Europe several central banks have cut further the levels of monetary policy rates, and some, such as the Central Bank of Denmark, the Riksbank, and the ECB have entered into a so-called negative interest rate policy (NIRP) (Figure 3). Consequently, money market rates have become negative, and it has become clear that the Zero Lower Bound is below zero. The Zero Lower Bound corresponds to the monetary policy rate below which the resulting deposit rate in the banking sector would lead corporations and households to withdraw their bank deposits and hoard cash. Given, on the one hand, the uncertainty regarding the level of the ZLB and the impairments in the monetary transmission mechanism, and, on the other, the need to provide further monetary accommodation to restore a level of inflation ensuring the anchoring of inflation expectations, the cuts in monetary policy rates have been augmented by other measures, known as NSMs. Among these are forward guidance, liquidity injection measures and/or the asset purchase programme (APP) – first sovereign bonds, asset-backed securities and covered bonds, then bank debt and more lately, since June 2016, corporate bonds.2 The policy package has contributed to flattening the safe risk yield curve so that a larger portion of it has entered negative rate territory. Even the long-end of the sovereign yield curve has also gone down substantially and stands at an historically exceptionally low level (Figure 4).
2 The full-allotment policy as well as the extension of the pool of collateral may also be considered as part of the NSMs.

Investment finance PART II 151
European Investment Bank Investment and Investment Finance in Europe
Figure 3 Money market rates in the US and selected EU economies (% p.a., 3-month maturity)
Figure 4 10-year nominal government bond yields in the EU (% p.a.)
-1
0
1
2
3
4
5
6
7
Sweden UK USEuro area
02-2
000
02-2
016
02-2
014
02-2
012
02-2
010
02-2
008
02-2
006
02-2
004
02-2
002
0
1
2
3
4
5
6
7
8
0
1
2
3
4
5
6
7
8
interquartile range (50%) Euro area average
04-2
000
04-2
015
04-2
012
04-2
009
04-2
006
04-2
003
Source: Thomson Reuters.Note: last observation: September 2016.
Taking a longer-term perspective, long-term yields have declined in all euro area countries in the past three decades, possibly not only owing to the decline in inflation or, more recently, non-standard measures. In mid-2016, 18% (40%) of the world economy, weighted by GDP, is operating in an environment of negative (below 1%) central bank policy rates (Draghi, 2016). For most of the developed economies, government bond yields remain in negative territory over a large portion of the maturity spectrum (Figure 5).
Figure 5 Government bond yields in negative territory
SwitzerlandJapanGermanyNetherlandsFinlandAustriaSwedenFranceBelgiumDenmarkSpainItalyNorwayUKUS
1 2 3 4 5 6 7 8 9 10 30
Negative yield
Positive yield
Source: ECON calculations based on Thomson Reuters.Note: The x-axis refers to the maturity of the bonds in years. The countries in bold and italics belong to the EU. The graph refers to
the yields recorded in July 2016.
There are two main views on the main drivers of interest rates since the crisis, one related to cyclical factors, the “financial cycle”, and the other related to structural factors, “secular stagnation”. Each has very different implications in terms of outlook and policies required.

PART II Investment finance152
Investment and Investment Finance in Europe European Investment Bank
According to the secular stagnation view (Hansen 1939), the current exceptional policy configuration reflects a strong decline in the neutral rate of interest, the monetary policy rate consistent with price stability when output is at its potential level. In turn, the lower neutral rate of interest results from ageing, lower demographic growth and slower technological progress, as well as possibly capital scrapping and the global saving glut.
The natural rate of interest may currently not be reachable owing to the ZLB, and this is one of the reasons why monetary policy needs to deploy non-standard measures to produce an equivalent monetary stimulus. Indeed, several analysts, commentators and policy makers have recognised the disappointing recovery of advanced economies despite the low levels of rates recorded for a long time (William, 2016). The reason is that the industrial world is plagued by an increasing propensity to save and a declining propensity to invest, resulting in a declining equilibrium real interest rate (Constâncio, 2016, ICMBS, 2015, Hördah et al., 2016). In such a secular stagnation scenario for Europe, potential growth is adjusted downward substantially, as the EU is ageing, agents revise their anticipations, productivity growth recedes and political pressures towards a reversal of the globalisation trend or EU construction strengthen.
Rachel and Smith (2015) estimate that structural factors can account for a decline of up to 450 bps in long-term real interest rates over the past 30 years. An empirical analysis by the IMF (2014) shows that common forces explain a large part of the worldwide decline in real rates. According to a principal component analysis, the weight of the first component of the variation in real rates at the global level increased from 55% between 1980 and 1995 to 75% between 1995 and 2012. Some estimates even point to a negative neutral interest rate currently in the euro area and more widely in Europe (Holston, Katryn, and Laubach, 2016). In this case, it is possible that the real interest rate will not increase back to a positive “normal” level (Eggertsson and Woodford, 2003).
An alternative to the secular stagnation view is provided by the debt cycle view, developed in section 3. In this case, low interest rates prevail for a long period but are not permanent, financial risks increase as the financial sector changes, the banking sector must shrink, the economy adjusts painfully, and deleveraging is slower/more costly as growth weakens. While the two views are usually presented as alternatives, they share common ground. Corporate deleveraging puts additional downward pressures on long-term interest rates. Furthermore, the long period of low activity with which it is associated leads economic agents to revise downward long-term anticipations of economic growth, thereby reinforcing the adverse impact of lower productivity and demographic trends.
4.1.3. … and loosened financing conditions When filtering a large number of financial indicators available at relatively high frequency, the signal received is that, overall, financial conditions have remained relatively stable since 2015 in comparison to the marked swing recorded since the crisis. This assessment is confirmed by looking at the VIX indicator only up until the Brexit referendum (Figure 12). In mid-2016, financing conditions are estimated to be loosened compared to their level in 2014 (Figure 6). As they normalise, they are no longer hampering the economic outlook and investment, and, in some cases, are considered to be supportive.
Given the transmission lags, the past tighter financial conditions are estimated to have contributed to negatively affecting industrial production up until mid-2015 (Figure 7). But, since mid-2015, they have contributed to pushing up activity, compressing bank lending spreads and increasing loan demand. In the very last months, a slight reversal of the positive trend has been observed. This may be the first signs of the uncertainty shock surrounding the prospect of Brexit as, while the result of the referendum was not widely anticipated, the uncertainty it created contributed to creating volatility across financial markets.

Investment finance PART II 153
European Investment Bank Investment and Investment Finance in Europe
Figure 6 Euro area financial condition indicator
Figure 7 Selected macroeconomic series and estimated contribution of financial conditions (% and p.p., contributions as red bars)
-0.6
-0.5
-0.4
-0.3
-0.2
-0.1
0.0
0.1
0.2
0.3
0.4
01-2
007
01-2
015
01-2
013
01-2
011
01-2
009
LehmanBrothers
VLTROannouncement
TLTROannouncement
negative DFR
APPrecalibeation
OMTannouncement APP
-3
-2
-1
0
1
2
3
-2
-1
0
1
2
3
0
15
30
45
60
04-2
014
04-2
015
04-2
016
04-2
014
04-2
015
04-2
016
04-2
014
04-2
015
04-2
016
-8
-6
-4
-2
0
2
4
-10
-8
-6
-4
-2
0
0
10
20
30
40
50
60
70
80
Manufacturing production
Loans to NFCs
Bank lending spreads
Source: Author’s calculations based on M. Darracq-Parries, L. Maurin, D. Moccero (2014). Note: An increase signifies a loosening in financing conditions. Last record is June 2016.
The results of the UK referendum on 23 June may well translate into tightened financial conditions for the UK especially. The leave vote has resulted in financial market volatility, abrupt exchange rate changes, and a substantial increase in uncertainty. As it is well recognised that uncertainty is detrimental to economic activity (Carney, 2016, Bloom et al., 2007 or ECB, 2010), the uncertainty resulting from what is expected to be a protracted period of exit negotiations has the potential to damage the economic outlook in the UK and weaken the recovery in the EU.
The risks to the outlook, in both the short and the long runs, are not easy to read in indicators of financial market uncertainty (such as the VIX indicator shown in Figure 12) or in policy uncertainty indicators. While these indicators spiked in the very short term following the referendum outcome, in July 2016, they have mostly declined since then. Indeed, it should be noted that the reading of these indicators may be blurred at the current juncture. The post-Brexit decline may simply reflect the absence of new information, resulting in a wait-and-see attitude for investors and therefore preventing substantial changes in speculative positions and abrupt changes in asset prices. Moreover, the Brexit event is unprecedented, and this makes it difficult to infer from the past the nature of the shock, its magnitude and persistence. Yet, as shown in Chapter 3, respondents to the special question on Brexit incorporated in the 2016 investment survey emphasise the expected adverse impact on their investment plans.
Scenario analyses conducted by the European Commission suggest GDP losses of 0.25 to 0.50 p.p. until 2017 for the EU excluding the UK.3 The ECB has put the economic impact on growth of Brexit for the euro area at between 0.2% and 0.5% of GDP over three years.
While uncertainty is expected to diminish over time, forthcoming changes in the economic and political relationships between the UK and the Member States could have a longer lasting impact on the medium to long-term economic outlook. The impact should remain contained however for the EU. Given the uncertainty surrounding the settlement of new relationships between the UK and the EU, large risks prevail, mostly on the downside, including that of lower potential growth.
3 See European Commission (2016).

PART II Investment finance154
Investment and Investment Finance in Europe European Investment Bank
4.2. How persistent are the changes in cross-border investment flows in Europe?
International financial flows play a central role in the international monetary system, not just because they represent the necessary counterpart to trade flows. Together with trade flows, they act as a powerful channel through which domestic shocks are transmitted across borders. In good times, they channel savings to the countries and regions of the world where they are most productive. In crisis times, they have the potential to disrupt the domestic financial systems of the most dependent economies. Hence, close monitoring of international financial flows is key to assessing the state of the global economic environment and the risks surrounding it.
In recent years, international capital flows have registered profound changes, not only in terms of their magnitude but also in terms of geographical distribution and composition, bank flows, foreign direct investment, and portfolio (debt and equity) flows. Besides, in Europe, the sovereign debt crisis triggered a process of defragmentation of the financial system. This resulted in fewer intra-Europe cross-border financial flows. In this section, we highlight the recent evolution of international financial flows with a special focus on intra-European flows. We provide evidence of the resilience of foreign direct investment and show that the European financial system remains fragmented.
4.2.1. The “Great Retrenchment” of gross international financial flows seems fairly persistent and applies mainly to Europe and advanced economies
The decade preceding the financial crisis which erupted in 2008 was one of financial globalisation. The ramping-up of international capital flows and the accumulation of external assets and liabilities in the decades preceding the global financial crisis were perhaps even more dramatic than the already impressive acceleration of trade flows and the development of current account imbalances that took place over this period. As suggested by the index of Chinn and Ito (2008), part of the robust expansion of gross financial flows can be related to increased financial liberalisation and greater capital account openness (Figure 8).

Investment finance PART II 155
European Investment Bank Investment and Investment Finance in Europe
Figure 8 Capital account openness and the pre-crisis boom of gross inflows (as % GDP)
Figure 9 Post-crisis, global financial flows settled at a lower level (4-qtr moving average)
0.0
0.2
0.4
0.6
0.8
1.0
-0.5
0
0.5
1.0
1.5
2.0
2.5
3.0USD Trillions
1980 1985 1990 1995 2000 Q12005
Q12007
Q12009
Q12011
Q12013
Q12015
2005 2010 2015
As % of GDP
Index EME (lhs) Index ADV(lhs)
Inflows EME(rhs, % GDP) Inflows ADV(rhs, % GDP)
0
5
10
15
20
25
Level (left) % of GDP (right)
-2%
0%
2%
4%
6%
8%
10%
12%
Source: Chinn-Ito Index and ECON calculations based on IMF balance of payments statistics.
Note: EME consists of Latin America, Central and Eastern Europe, Emerging Asia. ADV consists of North America, Western Europe, Asia (China is not included). 2015 data partially extrapolated.
Source: ECON calculations based on IMF balance of payments statistics.
Note: World capital outflows. Last record, 2015Q4, partially extrapolated.
In the years preceding 2008, gross international financial flows were very substantial, hovering around 8% of global GDP from 2005 to 2007.4 The onset of the financial crisis in the summer of 2007 put a sudden stop to that flourishing regime and in the second quarter of 2008, international financial flows were abruptly reduced. In addition, the Lehman event set the stage for the banking collapse in the fourth quarter of 2008, when aggregate gross flows massively retrenched (Figure 9). In that quarter alone, their reversal was equivalent to -2% of global GDP.
Since then, gross cross-border financial flows have not returned to the buoyancy of the pre-crisis period, settling at a “new average” of around 4% of GDP in 2015. This muted revival is puzzling as it could mean, if it persists, that the global economy is becoming more fragmented than it used to be, after decades of increasing globalisation. Moreover, it raises questions about whether the pre-crisis intensification of global financial linkages was too exuberant.
The retrenchment in international financial flows seems to affect all economic regions, albeit to a different extent, being more pronounced for advanced than for emerging market economies. The EU has recorded significantly lower flows since the outburst of the crisis: in 2009, net flows declined by 3% of GDP (Figure 10). Among EU countries, the “core” ones suffered the largest shrinkage of net flows, of around 3.5% of GDP in 2009. In 2015, however, net flows sharply recovered, thereby driving the increase also recorded at the EU level, but gross flows remain well below their pre-crisis levels. Moreover, the increase in net flows recorded for “vulnerable” countries was much less pronounced, and, contrastingly, the “cohesion” countries continued to record diminishing net flows.5
4 International financial flows suffer from measurement problems and reconciling stock and flow measures is a further challenge. For this reason, we need to rely on different data sources, including the IMF Balance of Payments database, BIS Locational Banking Statistics and the TICS data for the US.
5 For a more detailed perspective on EU international financial flows in comparison to the rest of the world, see Bussière, Schmidt and Valla (2016).

PART II Investment finance156
Investment and Investment Finance in Europe European Investment Bank
These flows mirror the changes in the current account. In the EU, after having been substantially positive from 2012 to 2014, it became negative again in 2015. Looking at the core countries, and distinguishing between euro area and non-euro area Member States, it appears that the shift in the current account, from a substantial surplus in 2014 to a deficit in 2015 reflected the increase in the current account deficit of non-euro area countries, mostly the UK and Denmark. Core country members of the euro area continued to record a current account surplus of around 3% GDP at the end of 2015, mostly on the back of the very large current account surplus in Germany. Since the start of the sovereign debt crisis, both vulnerable and cohesion countries have recorded a major adjustment in their current account balance. At the end of the period, the current account of vulnerable countries is balanced and that of cohesion countries is in surplus. The changes in the current account balance have been mirrored by changes in the three main components of the financial balance, as we now analyse.
Figure 10 Evolution of capital outflows and inflows in the EU (level, USD trillions, lhs, and net flows in % GDP, rhs, both 4-qtr moving average)
European Union
Outflows Inflows Net inflows
-8
-4
0
4
8
-8
-4
0
4
8
-5.0%
-2.5%
0.0%
2.5%
5.0%
2001
Q1
2003
Q1
2005
Q1
2007
Q1
2009
Q1
2011
Q1
2013
Q1
2015
Q1
Core Countries
-8
-4
0
4
8
-8
-4
0
4
8
-5.0%
-2.5%
0.0%
2.5%
5.0%20
01Q1
2003
Q1
2005
Q1
2007
Q1
2009
Q1
2011
Q1
2013
Q1
2015
Q1
2001
Q1
2003
Q1
2005
Q1
2007
Q1
2009
Q1
2011
Q1
2013
Q1
2015
Q1
2001
Q1
2003
Q1
2005
Q1
2007
Q1
2009
Q1
2011
Q1
2013
Q1
2015
Q1
Vulnerable Countries
-2
-1
0
1
2
-2
-1
0
1
2
-10%
-5%
0%
5%
10%
Cohesion Countries
-0.4
-0.2
0.0
0.2
0.4
-10%
-5%
0%
5%
10%
Source: ECON calculations based on IMF balance of payments statistics.Note: See note to Figure 1 for the definition of the country groups. 4-quarter moving average. The net inflows are obtained by
subtracting outflows from inflows. A positive (negative) inflow is associated with a current account deficit (surplus)

Investment finance PART II 157
European Investment Bank Investment and Investment Finance in Europe
4.2.2. The composition of international financial flows also changed
The collapse of international financial flows described above and the sharp shifts in the current account balances have been mirrored by uneven changes across the main categories of the financial account, foreign direct investment, equity and debt instruments in international portfolios, and “other investment” encompassing mostly bank flows.6 Although all types of flows have been affected by the slowdown, some have been significantly more resilient than others, resulting in a marked change in the composition of financial flows. For each group of EU countries and each type of flow, we constructed a synthetic indicator that reflects the changes by type of flow, inflows and outflows. The indicator, called the “retrenchment ratio”, reports the difference between the value of these flows in the pre-crisis period (2005Q1–2007Q2) and the post-crisis period (2012Q1–2014Q4) in relation to GDP. Table 1 reports the retrenchment indicator computed at the level of each of the main categories.
Table 1 Retrenchment indicator decomposed across main categories (% GDP)
Source: Authors' calculations on the basis of IMF Balance of Payments (BoP) data (restricted sample). Note: Difference between average annual flows after the crisis (2012Q1-2014Q4) and before (2005Q1-2007Q2). CORE stands for
Core Countries in the EU, VUL for Vulnerable Countries, COH for Cohesion Countries.
The retrenchment indicator shows that the collapse of the other investment category explains the bulk of the financial retrenchment in Europe. It is particularly pronounced for core and vulnerable countries. This is related to the confidence crisis faced by the European banking sector in the wake of the sovereign debt crisis, which contributed to the fragmentation of the European financial system. This led it to undertake a deleveraging process, predominantly operated on external assets. This process lowered cross-border lending by banks to other financial institutions. Consequently, in Europe, local lending by foreign bank affiliates may now substitute for cross-border lending (IMF, 2015). This particularly suits the CESEE region, where roughly 50% of the international banks active in the area signal intentions to expand operations in the foreseeable future, albeit to a different extent among countries. Notably for the cohesion countries, the retrenchment of the other investment component has been much less pronounced in absolute terms and mostly focused on a reduction of inflows. This is associated with the specific nature of the banking sector in the region, which is dominated by international banks that used to finance local market development via direct funding from the parent company. As the crisis started, net inflows of intra-company loans declined, but massive outflows were prevented in the context of a gradual rebalancing of the local banking model towards more domestic financing.7
Turning to the other flows, one can note that the fall in FDI flows recorded in Western Europe was mainly driven by core countries, on the outflows side, and had a large impact on FDI inflows in cohesion countries, which declined much more than portfolio flows. Finally, portfolio category flows have fallen substantially in Western Europe, with the fall being less pronounced for equity flows.
Figure 11 shows the resulting changes in the composition of international financial flows in Europe. In the core countries, the other investment category (mostly bank flows) used to account for 47% of total
6 By construction, the current account balance mirrors the financial balance and the capital balance.7 See EIB (2016), “CESEE Bank Lending Survey, H1-2016”.
Outflows Inflows
Portfolio Equity
Portfolio Debt
Direct Investment
Other investment
Total Portfolio Equity
Portfolio Debt
Direct Investment
Other investment
Total
CORE -1.0 -5.3 -4.0 -19.8 -30.1 -0.7 -6.6 -2.0 -21.1 -30.4
VUL 0.8 -6.2 -2.9 -10.9 -19.2 1.4 -14.1 0.1 -12.2 -24.8
COH -0.4 -0.1 -2.0 -0.7 -3.2 0.5 -0.2 -3.4 -4.2 -7.3
EU -0.5 -5.6 -3.9 -17.6 -27.5 -0.2 -8.3 -1.5 -18.8 -28.7

PART II Investment finance158
Investment and Investment Finance in Europe European Investment Bank
flows before the crisis, whereas after the crisis they constitute a much smaller share of the total (8%). Conversely, the share of FDI has substantially increased in the core countries as well as the vulnerable countries. Differently in the cohesion countries, the decline in the share of other investment was not matched by an increase in the share of FDI flows but mostly by a shift towards portfolio flows. Within the portfolio category, the different paths described above have also led to a considerable reallocation: before the crisis, portfolio debt used to be two-thirds of the size of equity flows in the core and vulnerable countries, whereas they are now of roughly equal magnitudes in the former and in opposite proportions in the latter. On the other hand, one can notice portfolio debt overtaking equity flows after the crisis in the cohesion countries.
Figure 11 The resilience of direct investment and equity flows contrasts with the contraction of bank flows and portfolio debt (average annual level, USD billions or millions)
pre-crisis post-crisis pre-crisis post-crisis
Core Countries Vulnerable Countries Cohesion Countries
USD
Tril
lions
0.0
0.5
1.0
1.5
2.0
2.5
-0.1
-0.0
0.1
0.2
0.3
0.4
0.5
0
5
10
15
20
25
30
35
Portf
olio
Equit
y
Portf
olio
Debt
Portf
olio
Inves
tmen
t
FDI
Othe
rInv
estm
ents
Portf
olio
Equit
y
Portf
olio
Debt
Portf
olio
Inves
tmen
t
FDI
Othe
rInv
estm
ents
Portf
olio
Equit
y
Portf
olio
Debt
Portf
olio
Inves
tmen
t
FDI
Othe
rInv
estm
ents
pre-crisis post-crisis
Source: ECON computations based on IMF balance of payments statistics.Note: See footnote to Table 1 for the definition of the periods.
The changing composition of international financial flows documented above is a striking feature of the global economic environment. Weak economic activity is both a factor that could have triggered this change and at the same time, since negative shocks are transmitted through financial linkages, a consequence of weaker financial flows. Another key feature to emphasise is that some types of flows seem to be inherently more volatile than others. In this respect, bank flows and portfolio flows are often described as “hot money” (see, for instance, Bluedorn et al., 2013). By contrast, FDI flows are typically more stable over time, which is why they are generally considered to be a safer form of financing (in addition to other benefits they carry, such as technological transfers). Also, within portfolio flows, equities have been more resilient than debt. Yet, overall, the behaviour of financial flows after the global financial crisis has therefore been faithful to their reputation: “hot money” (with the exception of equity flows) has evaporated quickly, whereas FDI has been more robust (Table 2).
Table 2 Volatility of flows by sectors and by sub-periods (Coefficient of variation, entire world)
Source: ECON calculations based on IMF balance of payments statistics. Note: See footnote to Table 1 for definition of the periods.
Outflows Inflows
Portfolio Equity
Portfolio Debt Direct Investment
Other investment
Portfolio Equity
Portfolio Debt
Direct Investment
Other investment
CORE 0.36 0.23 0.30 0.54 0.34 0.25 0.25 0.58
COH 0.41 0.63 0.26 2.53 0.39 0.46 0.32 6.74
EU 0.87 1.08 0.33 2.35 0.78 0.67 0.33 2.46

Investment finance PART II 159
European Investment Bank Investment and Investment Finance in Europe
Among the possible explanatory factors, the paper by CGFS (2011) highlighted the role of risk aversion, proxied by the VIX index. Figure 12 reports the VIX, together with the policy indicators calculated by Bloom (2014) and Bloom et al. (2007). The rise of the VIX in the wake of Lehman Brothers correlates well with the drop in capital flows that took place during this period. The VIX has considerably abated since then, but this is not associated with a rebound in capital flows. Other uncertainty indicators do not seem to point to a high degree of uncertainty in recent years, suggesting that uncertainty does not play a central role in the weakness of financial flows. To some extent, the fall in bank flows could be interpreted as a correction from the “global banking glut” that prevailed in the pre-crisis period (Shin, 2011), through which European banks helped to enhance intermediation capacities in the US. These considerations represent a convincing argument as to why it is important to look at gross and not just net international financial flows.
The consequences of these changes, for financial stability issues, are not clear at this stage. The fact that the share of “hot money” has gone down while that of FDI has increased may lead to a more stable international monetary system, although “hot money” may actually impose discipline on the receiving countries. The changes that have taken place since the global financial crisis may correspond to a simple normalisation, after “exuberant” times in the pre-crisis period (see B. Coeuré, 2015).
4.2.3. Post-crisis stigma, fragmentation and bottleneck in the allocation of savings?
Besides the implications for financial stability, the reduction in intra-European capital flows may hamper European convergence by limiting the allocation of savings to their most productive use. A simple regression shows that indeed the response of domestic investment to domestic saving has increased on two occasions since the beginning of 2003 (Figure 13), after the Lehman bankruptcy and during the sovereign debt crisis. Theoretically, as argued by Feldstein and Horioka (1986), and later Obtsfeld (1994), in a world of perfect capital mobility, capital expenditure should be independent from domestic savings. Hence, the elasticity of investment to domestic savings should be close to zero. Figure 13 plots the median and the confidence interval of the time-varying coefficient obtained from individual regressions on EU countries. The figure shows important changes across the period, with the coefficient becoming significant at the 60% level in the wake of the Lehman bankruptcy when capital markets froze. The increase was much more pronounced during the sovereign debt crisis but the coefficient remained not significant at the 60% level, showing that, differently from the Lehman episode, not all European countries were affected. While having started to decline again at the end of the period, the coefficient remains relatively high. However, this does not necessarily reflect an elevated degree of fragmentation. Indeed, being estimated over a rolling window of 16 quarters, the value at the end of 2015 reflects an average over the period 2012 to 2015. Hence, by construction, the coefficient lags latest developments.

PART II Investment finance160
Investment and Investment Finance in Europe European Investment Bank
Figure 12 The role of the VIX and uncertainty indicators (3-month moving average)
Figure 13 Slope of the regression of investment on domestic savings for EU countries (rolling regression, windows of 4 years)
USA VIX (rhs)EU Median 85th decile15th decile
2005 2007 2009 2011 2013 2015 0
100
200
300
0
200
400
600
-0.8
-0.4
0.0
0.4
0.8
1.2
2003
Q1
2005
Q1
2007
Q1
2009
Q1
2011
Q1
2013
Q1
2015
Q1
Source: Scott R. Baker, Nicholas Bloom and Steven J. Davis (2016). http://www.policyuncertainty.com
Note: Last record is June 2016 except for the EU (July 2016).
Source: ECON calculations based on Eurostat.Note: Based on the distribution of the values estimated
with an OLS static regression including a constant.
Another indication of the degree of fragmentation of the European banking sector is provided by the evolution of cross-border asset holdings, loans and debt securities. After the sovereign debt crisis, the European financial system became fragmented. Cross-border financial flows diminished substantially mostly on the back of reduced investment in assets issued in other Member States, by governments Figure 14, banks Figure 15, or corporates. While the reduction has come to a half since the end of the sovereign crisis, so far the recovery in cross-border financial flow has remained subdued. This suggests that the financial system remains fragmented. Low intra-European financial flows limit the scope to benefit from risk-sharing as well as the potential to enhance economic growth with an efficient allocation of savings (see Alcidi and Thirion, 2016).
Figure 14 Euro area MFI holdings of government debt securities (EUR billions)
Figure 15 Euro area MFI holdings of MFI debt securities (EUR billions)
Government bonds issued by domestic Member StateGovernment bonds issued by another Member State
0
500
1000
1500
2000
1999
Q1 20
01Q1
2003
Q1 20
05Q1
2007
Q1 20
09Q1
2011
Q1 20
13Q1
2015
Q1
Loans, EA domestic
Loans, EU non-EA
Loans EA non-domestic
0
2000
4000
6000
8000
1999
Q1 20
01Q1
2003
Q1 20
05Q1
2007
Q1 20
09Q1
2011
Q1 20
13Q1
2015
Q1
Source: ECON calculations based on ECB.
Investment finance PART II 161
European Investment Bank Investment and Investment Finance in Europe
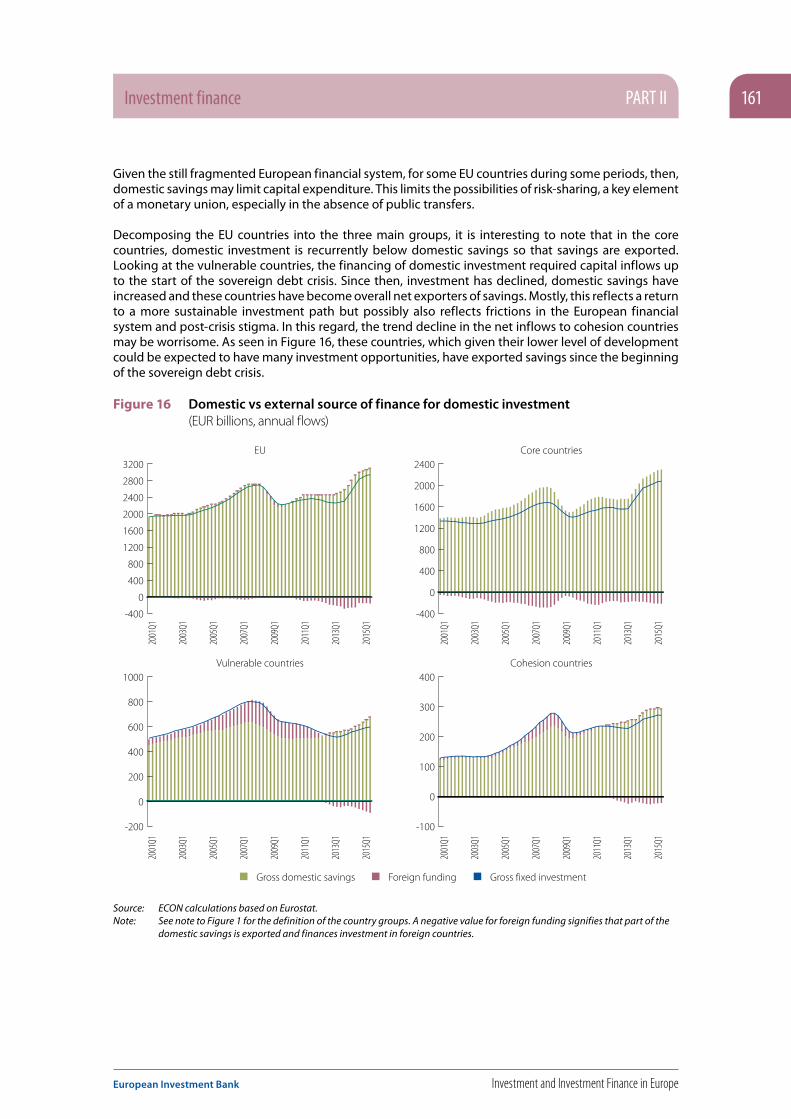
Given the still fragmented European financial system, for some EU countries during some periods, then, domestic savings may limit capital expenditure. This limits the possibilities of risk-sharing, a key element of a monetary union, especially in the absence of public transfers.
Decomposing the EU countries into the three main groups, it is interesting to note that in the core countries, domestic investment is recurrently below domestic savings so that savings are exported. Looking at the vulnerable countries, the financing of domestic investment required capital inflows up to the start of the sovereign debt crisis. Since then, investment has declined, domestic savings have increased and these countries have become overall net exporters of savings. Mostly, this reflects a return to a more sustainable investment path but possibly also reflects frictions in the European financial system and post-crisis stigma. In this regard, the trend decline in the net inflows to cohesion countries may be worrisome. As seen in Figure 16, these countries, which given their lower level of development could be expected to have many investment opportunities, have exported savings since the beginning of the sovereign debt crisis.
Figure 16 Domestic vs external source of finance for domestic investment (EUR billions, annual flows)
EU
Gross domestic savings Foreign funding Gross fixed investment
-400
0
400
800
1200
1600
2000
2400
2800
3200Core countries
-400
0
400
800
1200
1600
2000
2400
2001
Q1
2003
Q1
2005
Q1
2007
Q1
2009
Q1
2011
Q1
2013
Q1
2015
Q1
2001
Q1
2003
Q1
2005
Q1
2007
Q1
2009
Q1
2011
Q1
2013
Q1
2015
Q1
2001
Q1
2003
Q1
2005
Q1
2007
Q1
2009
Q1
2011
Q1
2013
Q1
2015
Q1
2001
Q1
2003
Q1
2005
Q1
2007
Q1
2009
Q1
2011
Q1
2013
Q1
2015
Q1Vulnerable countries
-200
0
200
400
600
800
1000Cohesion countries
-100
0
100
200
300
400
Source: ECON calculations based on Eurostat.Note: See note to Figure 1 for the definition of the country groups. A negative value for foreign funding signifies that part of the
domestic savings is exported and finances investment in foreign countries.

PART II Investment finance162
Investment and Investment Finance in Europe European Investment Bank
4.3. Can the balance sheet adjustment of NFCs explain the weakness in investment?
An alternative explanation of the weakness in investment is that, after the banking crisis, banks and corporations needed to deleverage to restore sound balance sheets (Lo and Rogoff, 1995). According to the “financial cycle” view, after years of relatively strong economic growth during which agents accumulated excessive debt on the basis of overly optimistic expectations of future income and revenues and a sharp regulatory adjustment, agents have to deleverage. The need to repay existing debt and also contract less new debt dampens investment spending. Household savings increase along a protracted corporate deleveraging process (Borio, 2012) and the interaction between the two behaviours reinforces the persistence of the cyclical dip (Cuerpo et al., 2013). The deleveraging process is weighing on investment and changes are at play in the corporate liability structure. The adjustment is long but the decline in economic momentum is not permanent and interest rates are expected to normalise at some point.
This section focuses on corporate finance and provides some elements supporting the debt supercyle view, as well as some analysis of the adjustment taking place within the euro area between core and vulnerable countries. Box 1 focuses on public project finance, a form of financing relatively developed in Europe where around half of the borrowers are located. The box details how its financial characteristics differ from those of corporate finance. It shows that, compared to corporate finance, this source of finance is more used for capital-intensive facilities and utilities and is associated with lower spreads.
4.3.1. Rebound in NFCs’ earnings accompanied by cash accumulation
While in the first years of the crisis, weak demand compressed internal financing capacity, more recently the start of a recovery in Europe has resulted in increased gross entrepreneurial income (Figure 17). This bodes well for corporate capital expenditure as retained earnings constitute around 70% of investment finance. As shown in Figure 17, the acceleration in gross entrepreneurial income was shared across the four EU groups. For the EU, core and vulnerable countries, the annual growth rate increased from around zero in the first half of 2013 to more than 5% in the first quarter of 2016. For cohesion countries, the acceleration over the period was very similar, but started from a higher level.
Higher gross entrepreneurial income has increased corporates’ financing capacity. Together with weaker capital expenditure, this has reduced the ratio of net borrowing over investment, similarly across country groups. Indeed, after the start of the financial crisis, since the middle of 2009, non-financial corporations have recorded negative financial gaps (Figure 18): they have invested less than their financing capacity. With the exception of the core countries, this is an unusual pattern over history since the beginning of the millennium. Moreover, the swing from net borrower to net saver is especially pronounced for cohesion countries and vulnerable countries. While for vulnerable countries, this may reflect the need for a sustained adjustment, it is difficult to explain for cohesion counties, which, being less advanced, should have more investment opportunities. From a macroeconomic perspective, since the financial crisis, in net terms, the European corporate sector has been providing savings to the rest of the economy. In 2015 and at the beginning of 2016, no major change was observed in this unusual pattern (Figure 18).

Investment finance PART II 163
European Investment Bank Investment and Investment Finance in Europe
Figure 17 Gross entrepreneurial income (annual growth rate, %, 4-qtr moving average)
Figure 18 Net borrowing over investment (%)
Vulnerable Euro areaEU CohesionCore
-20
-10
0
10
20
30
2000
2002
2004
2006
2008
2010
2012
2014
2016
-60
-40
-20
0
20
40
60
2000
2002
2004
2006
2008
2010
2012
2014
2016
Source: ECON calculations based on EUROSTAT sectoral accounts. Note: 4-quarter moving average of the annual growth rate of non-seasonally adjusted data. See note to Figure 1 for the
definition of the country groups.
Becoming net savers, European NFCs have improved their net financial position, partly by reducing debt, partly by accumulating financial assets. An interesting feature is that a large part of the asset accumulation has taken the form of the most liquid assets, cash and deposits (Figure 19). From the beginning of 2000 until the end of 2015, the ratio of cash and deposits of EU NFCs over GDP increased from 13% to 22%, a rise which was very similar among the group of countries. Nonetheless, it should be noted that the rise started well before the crisis, and does not seem to have accelerated since then. In fact, it is almost a trend increase over the period since 2000. Hence, it is difficult to disentangle what in the most recent developments reflects a reaction to the crisis – cash hoarding in the face of increased uncertainty – from other possible reasons, such as improvements in treasury management, or composition effects. The latter may be especially relevant. As shown by the Survey on the Access to Finance of Enterprises in the euro area (ECB, 2016), the level of liquid assets held by NFCs differs widely across companies as well as by size of enterprise. The percentage of firms reporting higher than usual levels of liquid assets minus those reporting levels lower than usual is positive, at 4% for large enterprises, but negative, at -11% for small and medium-sized enterprises (SMEs).8 Looking backward, the stronger cash position of European corporations reflects the lack of investment, at least in part, but looking forward, it is a relatively good sign as it reflects a stronger financial position. It reinforces the capacity to react quickly to a more pronounced pick-up in demand.
8 For a deeper analysis of the financing situation of SMEs in Europe, see the chapter “SME finance in Europe” in this report.

PART II Investment finance164
Investment and Investment Finance in Europe European Investment Bank
Box 1 Project Finance in Europe: An Overview and Discussion of Key Drivers9,10
Typically used for funding public and private capital-intensive facilities and utilities, project finance (PF) is a form of financing based on a standalone entity created by the sponsors, with highly leveraged capital structures and concentrated equity and debt ownerships.11
PF is an economically significant growing financial market segment, but one that is still largely understudied. According to Thomson Reuters, the PF market was smaller than both the corporate bond and the asset securitisation markets in 2014, but the amount invested in PF was larger than the amounts raised through IPOs or venture capital. In 2014, PF loans worth USD 54.1bn and USD 60.2bn were arranged in Western Europe and the US respectively, and a total of USD 260bn arranged worldwide. The extant literature on PF (Brealey et al. (1996), Esty (2003, 2004), and Corielli, Gatti, and Steffanoni (2010)) suggests that PF creates value and thus reduces funding costs by resolving agency problems, reducing asymmetric information costs, and improving risk management. However, PF transactions are complex, expensive to set up, take a long time to execute – they require a significant amount of cash flow evaluation, due diligence, negotiation, and legal processing – and are highly restrictive once in place (Esty (2004) and Gatti (2008)). Thus, the following questions arise: (1) What factors determine the choice between project financing and corporate financing structures? (2) How do spreads and common pricing characteristics compare between PF loans and other (non-PF) syndicated loans? (3) Is the spread on PF loans significantly lower than the spread on other syndicated loans? And (4) To what extent are PF loans and other syndicated loans priced by common characteristics? Additionally, empirical evidence (Carey and Nini (2007)) suggests that the corporate syndicated loan market is not globally integrated, offering evidence that spreads and pricing characteristics are different in Europe and the US. This raises one last question: (5) Are PF loans financed in integrated debt markets (Western Europe versus the US and Western Europe internally)?
9 This box was prepared by João M. Pinto (Catholic University of Portugal) and Paulo P. Alves (Catholic University of Portugal).10 We are grateful for the comments and advice provided by Philipp Brutscher and the participants in the 2016 Corporate Finance Alternatives in Europe Workshop
at the European Investment Bank and Católica Porto Business School 9th Internal Conference. We would also like to thank the European Investment Bank for providing the ORBIS data. For further details please refer to the full version of the working paper.
11 Due to its contractual idiosyncrasies, PF is also used to segregate the credit risk of the project from those of its sponsors so that lenders, investors and other parties will appraise the project strictly on its own economic merits. For further discussion, see Brealey, Cooper, and Habib (1996), Kleimeier and Megginson (2000), Esty (2003, 2004), Caselli and Gatti (2005), Fabozzi, Davis, and Choudhry (2006), Blanc-Brude and Strange (2007), Gatti (2008), and references therein.
Figure 19 Cash and deposit of NFCs to GDP (4-qtr moving average of the ratio)
Figure 20 Relative size of financial markets (%, as a ratio to GDP, average 2010-2014)
Vulnerable Euro areaEU
CohesionCore
4
8
12
16
20
24
2000
2002
2004
2006
2008
2010
2012
2014
2016
0
30
60
90
120
150
EU US China Japan
12
82
64
28
92
127
1020
84
16
55
76
Financial institutions' debt securitiesPublic equity markets
Corporate debt securities
Source: ECON calculations based on EUROSTAT sectoral accounts.Note: 4-quarter moving average of the annual growth rate of
non-seasonally adjusted data. See footnote to Figure 1 for the definition of the country groups.
Source: ECON calculations based on ECB and Valiante (2016).

Investment finance PART II 165
European Investment Bank Investment and Investment Finance in Europe
To compare the financial characteristics of PF loans to those of non-PF loans and examine which factors may explain the choice between project financing and corporate financing, we use a dataset including a comprehensive sample of syndicated loans closed between 1 January 2000 and 31 December 2014. Our sample contains information about 10,950 PF loans (5,935 PF deals worth USD 2,108.8bn) and 199,323 (129,256 non-PF deals worth USD 40,592.6bn) non-PF loans. In addition to deal characteristics (Dealscan), and in order to analyse what factors determine the choice between project financing and corporate financing structures, we also collected firm-specific accounting and market data (Datastream for publicly traded firms and Orbis for privately held firms) and macroeconomic variables, such as the level of interest rates, market volatility, and slope of the yield curve (Datastream).
Figures 1 to 3 present the distribution of PF deals across time, industry, and region. Figure 1 shows that PF lending peaked in 2008, fell in 2009 and rose again in 2010 and 2011. In 2014 a record USD 259.9bn in PF funding was globally arranged, a 278.5% increase from the USD 68.7bn reported for 2000. Similarly, a record USD 3,905.8bn in non-PF syndicated loans was globally arranged in 2014, a 101.1% increase from the USD 1,942.7bn reported for 2000. PF did not significantly contract during the 2007-2008 financial crisis when compared to other forms of syndicated credit. Figure 2 shows that PF lending is concentrated in five key industries, whereas the general population of non-PF deals reveals a far less concentrated industrial pattern: i.e. utilities (29.8%), construction (13.7%), manufacturing (12.6%), mining (10.7%) and transportation (10.7%) account for 77.3% of all PF lending, but only 55.2% of non-PF syndicated deals. This finding is consistent with the common understanding that PF is used primarily to fund tangible-asset-rich and capital-intensive projects. Figure 3 also shows clear differences between the countries which attract PF lending and those where other types of syndicated loans are directed. Whereas the majority of non-PF lending is concentrated in the US (46.1%), only 10.4% of PF lending goes to US borrowers. The biggest recipients of PF lending are Western Europe and Eastern Asia. These regions account for 23.4% and 18.4% of the total value of PF loans, respectively. UK borrowers and the rest of Western Europe accounts for an almost identical fraction (23.4% versus 24.3%) of both types of lending. The relevance of PF lending in Western Europe reflects two major trends. First, the emphasis placed by UK governments on the Private Finance Initiative (PFI): i.e. on private rather than public financing of large public infrastructure projects. Second, PF, especially public-private partnerships (PPPs), played an important role in reducing the need for government borrowing and shifting project risks to the private sector in Southern European countries. Through PPP structures, governments shift construction and operating risks to the private sector, which is usually more efficient in building and running the asset, and obtains both private sector funding and private sector management.
Figure 1 Evolution of PF and non-PF deals by year PF and non-PF deals by year
PF non-PF
2000
2001
2002
2003
2004
2005
2006
2007
2008
2009
2010
2011
2012
2013
2014
0
50000
100000
150000
200000
250000
300000
1500000
2000000
2500000
3000000
3500000
4000000
USD million

PART II Investment finance166
Investment and Investment Finance in Europe European Investment Bank
Figure 2 Evolution of PF and non-PF deals by year PF and non-PF deals by year
Agriculture, Forestry and Fishing
Mining
Construction
Manufacturing
Wholesale Trade
Retail Trade
Real Estate
Services
Utilities
Financial Services
Transportation
Public Administration/Government
Other
non-PF major industry groupPF major industry group
11%
13%13%
4%
5%
30%
1% 11%
3%
9%
2%
27%5%
5%
8%
12%
14% 11%
5%
1%
3%
7%
Figure 3 Geographic distribution of the full sample of PF and non-PF deals
US
Asia - Other
Asia - Western
Asia - Eastern
Africa
Australia and Pacific
Caribbean
Latin America
Europe-Western
Europe-Eastern
Canada
non-PF by regionPF by region
4.4%
2.4%
10.4%
15.7%
12.3%
18.4%
3.4%3.9%
0.5% 5.1%
23.4%
46.1%
3.3%
11.7%
0.7% 3.9% 0.3% 1.3%
24.3%
1.5%
5.1%
Univariate analyses show that most of the common pricing characteristics differ significantly between PF and non-PF loans, with PF being most commonly used for capital-intensive facilities and utilities in riskier than average countries, using relatively long-term financing.
In order to answer questions (3) to (5) we employ an OLS regression with standard errors clustered by deal. A Chow test for a structural break is used to investigate whether the credit spreads associated with PF and non-PF loans are influenced differently by common pricing factors, as well as whether PF loans in the US and Western Europe are priced in integrated or segmented debt markets. Our results reveal that PF loans and other syndicated loans – corporate control loans, capital structure loans, fixed asset based loans, and general corporate purpose loans – are debt instruments influenced differently by common pricing characteristics. Additionally, we create sub-samples for loans by US and Western European borrowers and we find that PF loans and each of the four categories of non-PF loans are not priced in an integrated debt market.
The results suggest that PF loans are associated with lower spreads: ceteris paribus, spreads on PF loans are, on average, 42.1 bps lower than the spreads on otherwise comparable corporate financing loans. Our results remain unchanged when estimating our base model for sub-samples created, based on whether the borrower is located in the US, UK, or Western Europe or when using

Investment finance PART II 167
European Investment Bank Investment and Investment Finance in Europe
the total cost of borrowing (TCB) measure as proposed by Berg, Saunders, and Steffen (2015) as an alternative to the spread. However, when re-estimating our model for each category of non-PF loans separately, we find that (i) PF loans are associated, when other factors remain constant, with lower spreads than corporate control, capital structure, and general corporate purpose loans; and (ii) whereas for loans extended to US borrowers, the spread on PF loans and fixed asset based loans do not differ significantly, the PF dummy variable is associated with a statistically significant 20.7 bps drop in spreads for loans arranged for Western European borrowers. Overall results support hypotheses of PF transactions as mechanisms for asymmetric information problems, principal-agent conflict reduction and improving risk management within the project: i.e. risks are allocated to the parties that are in the best position to manage them.
Our results also indicate that PF loans in the US and Western Europe are priced in segmented debt markets and that those in Western Europe are associated with lower spreads: PF loans extended to US borrowers are associated with a statistically significant 85.2 bps increase in the spread. Our results remain unchanged when estimating our model for sub-samples created, based on whether the Western European borrower is located in Continental Europe or in the UK. We also conclude that PF loans extended to Continental European and UK borrowers are priced in integrated debt markets and that PF loans are influenced differently by common pricing characteristics when considering borrowers located in Northern Europe versus Southern Europe. Finally, we document that the 2007-2008 financial crisis and the subsequent European sovereign debt crisis significantly impacted PF loan spreads and pricing processes: spreads increased significantly and bank liquidity and sovereign risk became important credit spread determinants during the crisis period.
In order to investigate how firms’ characteristics influence the choice between PF and non-PF debt we use a unique dataset, compiled from three different data providers (Dealscan, Orbis, and Datastream). Our sample includes 750 PF loans (470 PF deals) and 33,962 non-PF loans (25,838 non-PF deals) closed by 6,381 publically traded firms located in Western Europe and the US. It also includes 89 PF loans (59 PF deals) and 3,384 PF loans (2,031 non-PF deals) closed by 1,107 privately held firms. Following the extant literature, we focus on the firm characteristics that reflect transaction costs, renegotiation and liquidation risks, and information asymmetries. For this analysis, we use a logistic regression model. Our dependent variable, choice of debt, is a binary variable equal to 1 if the firm closes a PF loan and 0 if it, instead, closes a non-PF loan. We control for debt contracting characteristics and as the financing choice may be sector-specific, we use dummy variables to control for industry factors. We also account for macroeconomic conditions and if firms employ multiple debt types (PF loans and non-PF loans) within our sample period.
Our results regarding publicly traded firms’ choice between project financing and corporate financing support hypotheses of project financing as a mechanism of overcoming agency conflicts between borrowers and lenders, but provide mixed evidence concerning the relevance of PF in reducing deadweight costs from asymmetric information problems. We find that sponsors choose PF transactions when they seek long-term financing and want to maintain financial flexibility and protect their credit standing. Furthermore, firms that employ project financing over corporate financing are larger and more financially constrained; they also have higher asset tangibility and operate in countries with lower sovereign debt ratings. Finally, firms prefer project financing when issuing relatively lower amounts of debt and are less profitable.
Regarding privately held firms, our results support the asymmetric information hypothesis: Western European sponsors choose project financing when they are relatively smaller and seek long-term financing. Our results document that firms choose PF transactions for relatively large amounts of debt to economise on scale. In addition, firms that employ project financing over corporate financing are less profitable and operate in countries with lower sovereign debt ratings. Finally, UK borrowers positively affect the probability of observing a PF loan rather than a non-PF loan.
For both public and private sponsors, we document that firms which employ both PF and corporate finance lending within our sample period are more likely to choose PF loans when issuing new debt.

PART II Investment finance168
Investment and Investment Finance in Europe European Investment Bank
In addition, the 2007-2008 financial crisis and the subsequent European sovereign debt crisis increased the probability of choosing PF over other syndicated loans in Western Europe. Finally, transactions by firms in Western European countries with higher sovereign credit risk are more likely to be arranged as PF loans than other syndicated loans. These results noticeably reflect the importance of PF, namely PPPs, in reducing a government’s borrowing and shifting project risks to the private sector during the crisis period, mainly in Southern European countries.
References Berg, T., A. Saunders, and S. Steffen, 2015. The Total Cost of Corporate Borrowing in the Loan Market: Don't Ignore the Fees, Journal of Finance 71, 1357-1392.
Blanc-Brude, F., and R. Strange, 2007. How banks price loans to public-private partnerships: Evidence from the European markets, Journal of Applied Corporate Finance 19, 94-106.
Brealey, R., I. Cooper, and M. Habib, 1996. Using PF to fund infrastructure investments, Journal of Applied Corporate Finance 9, 25-38.
Carey, M., and G. Nini, 2007. Is the corporate loan market globally integrated? A pricing puzzle, Journal of Finance 62, 2969-3007.
Caselli, S., and S. Gatti, 2005. Structured Finance: Techniques, Products and Market, Springer: Berlin.
Corielli, F., S. Gatti, and A. Steffanoni, 2010. Risk Shifting through Nonfinancial Contracts: Effects on Loan Spreads and Capital Structure of PF Deals, Journal of Money, Credit and Banking 42, 1295-1320.
Esty, Benjamin, 2003. The Economic Motivations for Using PF, Boston: Harvard Business School publishing.
Esty, Benjamin, 2004. Modern PF – A Casebook, John Wiley & Sons, Inc.
Fabozzi, F., H. Davis, and M. Choudhry, 2006. Introduction to Structured Finance, Wiley Finance.
Gatti, Stefano, 2008. PF in Theory and Practice – Designing, Structuring, and Financing Private and Public Projects, Academic Press Advanced Finance Series.
Kleimeier, S., and W. Megginson, 2000. Are PF loans different from other syndicated credits?, Journal of Applied Corporate Finance 13, 75-87.
4.3.2. NFCs’ financial liabilities dominated by debtIn comparison to GDP, the size of equity markets in Europe is well below that in the US (Figure 20). It is even lower than in China and Japan. Turning to NFC debt securities, the outstanding amount is around 12% of GDP in the EU, while it is above that in Japan and the US. In fact, differently from the US where debt is almost equally split into securities traded on a market, in Europe most of corporate debt consists of banks loans. Looking across country groups, the predominance of bank loans is confirmed and remains a structural characteristic of the EU financial system12 and, overall, the European financial system is bank-centred when compared to the US. In particular, corporate bond issuance plays a relatively limited role. Equity financing plays a much smaller role in new external financing than in the US and the development of securitisation is much more limited.
Taking a time-series perspective and looking at the evolution of the liability structure of European NFCs, the ratio of debt to equity, which peaked in 2009, has since then declined, substantially in most countries apart from cohesion countries (Figure 21). In the latter, it remained unchanged but at a relatively lower level. The decline in the debt to equity ratio was more pronounced in vulnerable countries than in core countries, from more than 120% to less than 80% in the former and around 80% to 60% in the latter.
12 For more details, see EIB (2015), “Recent developments in investment finance”, Investment and Investment Finance in Europe, especially Figures 7 and 8.

Investment finance PART II 169
European Investment Bank Investment and Investment Finance in Europe
While this decline signals increased resilience of the financial structure to financial shock, it does not necessarily reflect deleveraging alone but also asset price changes. The rebound in stock prices since the end of the sovereign debt crisis has increased the value of equity and therefore lowered the debt to equity ratio.
The decline in the debt to equity ratio of European NFCs is linked to a very limited extent to new issuance increasing the outstanding amount of equity. The rebound in equity issuance recorded since the beginning of 2014 remains relatively contained. From the end of 2013 until the beginning of 2015, the acceleration in equity issuance is most likely explained by the decline in the cost of equity issuance linked to the higher stock prices over the period. Indeed, issuance and cost of equity tend to be negatively correlated (Figure 22). More recently, since the beginning of 2016, stock market issuance has remained subdued. Hence, the movements recorded since the beginning of the financial crisis do not indicate any structural change in the financial liability structure of European NFCs.
Figure 21 Debt to equity
(%, 4-qtr moving average)Figure 22 Equity issuance and cost of equity
(%)
Vulnerable Euro areaEU
CohesionCore
40
50
60
70
80
90
100
110
120
130
2000
2002
2004
2006
2008
2010
2012
2014
2016
2003
2004
2005
2006
2007
2008
2009
2010
2011
2012
2013
2014
2015
2016
-10
0
10
20
30
40
50 6
7
8
9
Cost of equity (rhs, inverted, % p.a.)
Growth rate of net issuance corrected for valuation
Source: ECON computation based on Eurostat sectoral accounts.
Note: Last record: 2016 Q1. Based on consolidated data.
Source: ECON computations based on ECB data.Note: The cost of equity is derived from a dividend
discount model using information from Datastream non-financial stock market index. Latest observation: June 2016.
Looking at the joint evolution of the net change in bank loans, inter-company loans and outstanding amount of debt, the overall net flow of external financing to European NFCs was positive in 2015 and continued to increase compared to the year before (Figure 23). In Europe as a whole and in core countries, NFCs’ external financing flows reached levels comparable to those at the beginning of the previous cyclical upturn in 2005 and prior to the start of the sovereign debt crisis. This is not the case in vulnerable countries where the net financing flows increased but remained negative in 2015.
Looking at the main sources of external financing together (Figure 23), it appears that bank loans, both short and long, dominate the corporate liability structure. Evolutions in long-term and short-term loans are highly correlated across time and group of countries and, overall, in the EU long-term loans predominate, especially during the pre-crisis period. This mostly reflects the financial structure of corporates in vulnerable countries, where the predominance of long-term loans is more pronounced. This is also true in cohesion countries but for much lower amounts. Net financing occurring through debt issuance is very limited overall and mostly used by corporates in core countries. It nonetheless provided some source of financing to NFCs in vulnerable countries at the end of the sovereign debt crisis. Almost all of it is constituted by long-term debt securities with short-term debt almost nil. Interestingly, inter-company loans compensated for a small part of the decline in short-term loans in vulnerable countries during the sovereign debt crisis.
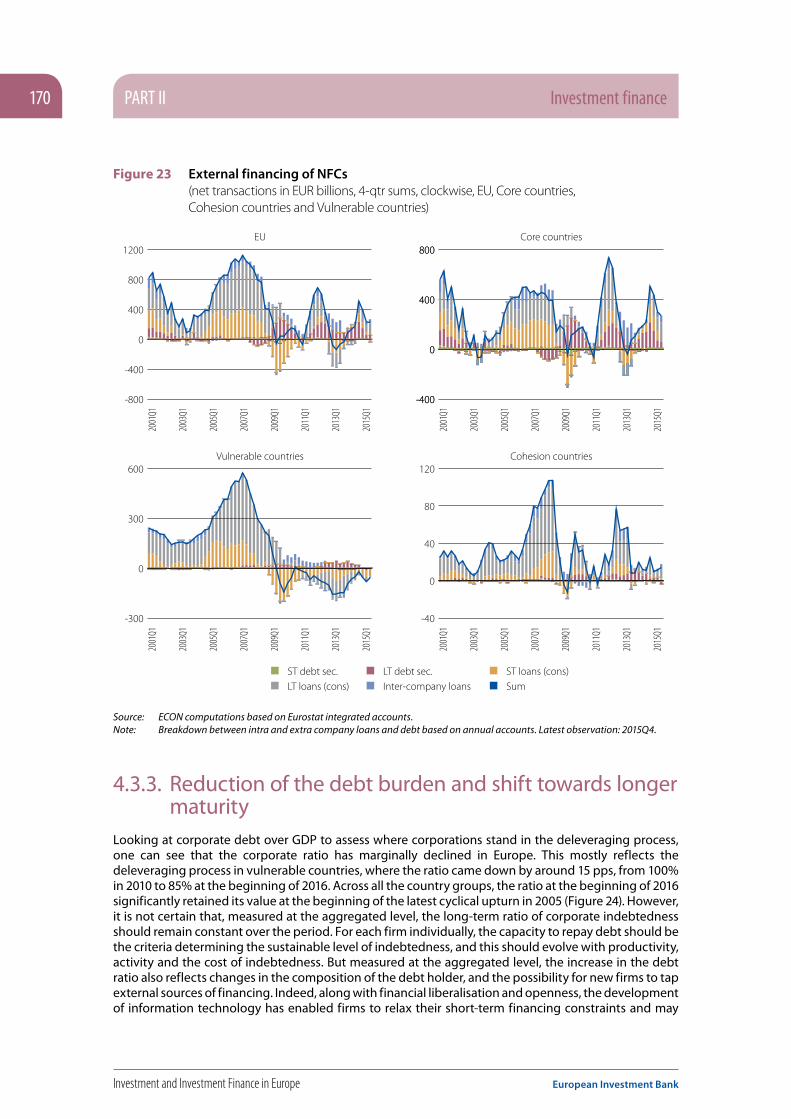
PART II Investment finance170
Investment and Investment Finance in Europe European Investment Bank
Figure 23 External financing of NFCs (net transactions in EUR billions, 4-qtr sums, clockwise, EU, Core countries, Cohesion countries and Vulnerable countries)
EU
ST debt sec. LT debt sec. ST loans (cons)LT loans (cons) Inter-company loans Sum
-800
-400
0
400
800
1200Core countries
2001
Q1
2003
Q1
2005
Q1
2007
Q1
2009
Q1
2011
Q1
2013
Q1
2015
Q1
-400
0
400
800
-400
0
400
800
2001
Q1
2003
Q1
2005
Q1
2007
Q1
2009
Q1
2011
Q1
2013
Q1
2015
Q1
2001
Q1
2003
Q1
2005
Q1
2007
Q1
2009
Q1
2011
Q1
2013
Q1
2015
Q1
2001
Q1
2003
Q1
2005
Q1
2007
Q1
2009
Q1
2011
Q1
2013
Q1
2015
Q1
-300
0
300
600
-40
0
40
80
120Vulnerable countries Cohesion countries
Source: ECON computations based on Eurostat integrated accounts.Note: Breakdown between intra and extra company loans and debt based on annual accounts. Latest observation: 2015Q4.
4.3.3. Reduction of the debt burden and shift towards longer maturity
Looking at corporate debt over GDP to assess where corporations stand in the deleveraging process, one can see that the corporate ratio has marginally declined in Europe. This mostly reflects the deleveraging process in vulnerable countries, where the ratio came down by around 15 pps, from 100% in 2010 to 85% at the beginning of 2016. Across all the country groups, the ratio at the beginning of 2016 significantly retained its value at the beginning of the latest cyclical upturn in 2005 (Figure 24). However, it is not certain that, measured at the aggregated level, the long-term ratio of corporate indebtedness should remain constant over the period. For each firm individually, the capacity to repay debt should be the criteria determining the sustainable level of indebtedness, and this should evolve with productivity, activity and the cost of indebtedness. But measured at the aggregated level, the increase in the debt ratio also reflects changes in the composition of the debt holder, and the possibility for new firms to tap external sources of financing. Indeed, along with financial liberalisation and openness, the development of information technology has enabled firms to relax their short-term financing constraints and may

Investment finance PART II 171
European Investment Bank Investment and Investment Finance in Europe
have shifted the sustainable debt ratio at the aggregate level. Overall, the slight decline in the debt ratio when measured against activity, after years of increase, supports the view that corporate deleveraging has taken place in Europe, and was concentrated in a few countries. As shown in Chapter 7, firms which accumulated more debt before the crisis have experienced a more pronounced decline in investment. Box 2 shows that while the adverse demand effect of deleveraging has been more pronounced in vulnerable countries, specific factors at play in the banking sector also contribute to explaining the asymmetric cyclical developments between core and vulnerable countries.
Together with this light deleveraging process, the decline in the composite cost of nominal debt, and the recovery in gross operating surplus or net entrepreneurial income fuelled by better demand conditions have helped to alleviate the burden of debt, the share of gross interest payments over GOS. Partly reflecting the slow deleveraging process, the burden of corporate debt has been decreasing since the beginning of 2013 (Figure 25). Indeed, for vulnerable countries, after having been well above the average, by more than 5% in 2009, it now stands below that of core Europe. For cohesion countries, given the structurally tighter access to external finance and the relatively lower debt, it remains well below and less volatile. Companies located in vulnerable countries have seen high but markedly decreasing debt service burdens, with the debt service burden now below the European average. At the beginning of 2016, across Europe, firms’ debt payment burdens were very low compared to the historical average since the beginning of 2000.
Figure 24 Consolidated debt over GDP
(%, 4-qtr moving average of the ratio)Figure 25 NFCs’ gross interest payments
(percent of nominal gross operating surplus, 4-qtr moving average)
Vulnerable Euro areaEU CohesionCore
20
30
40
50
60
70
80
90
100
110
2000
2001
2002
2003
2004
2005
2006
2007
2008
2009
2010
2011
2012
2013
2014
2015
2016
4
8
12
16
20
24
2000
2001
2002
2003
2004
2005
2006
2007
2008
2009
2010
2011
2012
2013
2014
2015
2016
Source: Based on Eurostat integrated accounts. Source: ECB. Note: 4-quarter moving average. Latest observation:
2016Q1
This is mostly due to the decline in bank lending rates, which are also at historically low levels. Indeed, even if the debt burden reflects the cost of the outstanding debt contracts, the cost of the part constituted by bank loans, which is the larger one, is largely reset within less than a year in most European countries, even if the loan is long term. Hence, corporations have been able to substantially benefit from the lower bank lending rates resulting from lower monetary policy rates. Figure 26 shows the decline in the composite nominal cost of debt financing for EU NFCs. From more than 6% at the beginning of 2009, the cost has declined to around 2.5% in mid-2016 in the EU. With the exception of the increase recorded on the occasion of the debt crisis, in 2011 and 2012, the cost has declined during the entire period. The movement has been shared by the three main components: long-term loans, short-term loans and debt securities, a component which has been more volatile and on many occasions less expensive than bank loans.

PART II Investment finance172
Investment and Investment Finance in Europe European Investment Bank
Figure 26 Composite nominal cost of debt financing for NFCs in the EU (% p.a., 3-month moving average)
Figure 27 Composite nominal bank lending rate on corporate loans in the EU (% p.a., 3-month moving average)
1
2
3
4
5
6
7
8
Debt
Short-term loans Long-term loans
Overall CoreEU
Euro area Vulnerable
Cohesion (lhs)
1
2
3
4
5
6
7
8
2008 2009 2010 2011 2012 2013 2014 2015 2016 2008 2009 2010 2011 2012 2013 2014 2015 20163
4
5
6
7
8
9
10
Source: ECON calculations based on ECB and Thomson Reuters.
Note: The overall cost of financing for NFCs is calculated as a weighted average of the cost of bank lending and the cost of market-based debt, based on their respective amounts outstanding derived from the EU sectoral accounts. Latest observation: June 2016.
In parallel to the change in the overall amount of corporate debt, the maturity of the corporate debt has also changed. Indeed, the ratio of short to long-term debt trends downward, a good sign of financial soundness (Figure 28). This can reflect two very different factors. On the one hand, simply the fact that short-term loans (debt), being renewed more frequently, are impacted more quickly than long-term loans (debt); on the other hand, an active policy of companies which want to benefit from the relatively low-term spread. Corporates in vulnerable and cohesion countries substantially modified their maturity structure before the crisis by debt instrument, increasing the share of short-term liabilities, while corporates in core countries were reducing it. For loans, the share of short-term diminished during the entire period. The change was more pronounced in vulnerable countries.
Figure 28 Maturity structure of main liabilities (ratio of short over long)
CoreEU
Euro area Vulnerable
CohesionCoreEU
Euro area Vulnerable
Cohesion
0.2
0.3
0.4
0.5
0.6
0.7
0.8
0.9
1.0
2000 2002 2004 2006 2008 2010 2012 2014 2016 2000 2002 204 206 2008 2010 2012 2014 20160.00
0.05
0.10
0.15
0.20
0.25
0.30
0.35
Source: ECON computations based on Eurostat integrated accounts.Note: Ratio of short to longer-term debt; corrected with short-term lending as proxy for inter-company loans.

Investment finance PART II 173
European Investment Bank Investment and Investment Finance in Europe
4.3.4. Evidence of corporate bond issuance fuelled by ECB policy
With an outstanding amount of EUR 1.8tn (1.2) respectively in the EU and in the euro area in mid-2016, the stock of non-financial corporate debt securities remains relatively low, at around 10% of GDP, and well below that of bank loans (50%). Although there is some evidence of a long-run trend increase, the pace is very slow. Being relatively small, the European corporate debt market is also concentrated across countries and firms, with a few issuers having a large market share (Figure 29). Corporates located in France represent the larger issuers, with a share averaging 31% in the first half of 2016, followed by those located in the UK (27%). Corporates in Germany represent the third largest issuers, but with a share well below the first two (8%). Together, the three largest European economies represent around two-thirds of the EU debt market. The market is not only concentrated by country but also on individual issuers. In the euro area, the first 20 issuers account for 45% of the turnover.
Figure 29 Geographical breakdown of the
European corporate debt market (%)
Figure 30 Net issuance of securities in the euro area (sum since the start of the year, billions)
-40
0
40
80
120
160
ItalySwedenNetherlands
France UKGermany
Others
201220112010
201520142013
2016
Source: Eurostat, ECB. Note: Last record is June 2016 (lhs, annual average from mid-2015 to mid-2016).
From the start of the sovereign debt crisis, in 2011, until 2015, corporate debt issuance in Europe remained relatively stable, except in 2012, with net issuance at the end of the year ranging between EUR 40 and 50bn (Figure 30). In 2012, net issuance amounted to more than EUR 120bn, a record number, explained by some specific factors. At the beginning of 2016, the pace of issuance was starting below that of the years excluding 2012, but since then, in February 2016, the pace has markedly shifted upward, catching up with the rhythm recorded in 2012. Moreover, differently from the recent past, the spike in activity was shared across core and vulnerable countries (Box 2). The increase is likely to partly result from a reaction to the ECB corporate-sector purchase programme announced in March 2016. The programme was part of a recalibration of the non-standard measure package. In June 2016, investment-grade euro-denominated bonds issued by non-bank corporations established in the euro area became eligible for the APP. The purchases can be conducted in the primary and secondary markets for ratings above BBB- and maturities of 6 months to 30 years. The programme, widely expected by market participants, has the capacity to foster debt security issuance (Box 2).

PART II Investment finance174
Investment and Investment Finance in Europe European Investment Bank
Box 2 Explaining the differences in investment dynamics between vulnerable and other euro area countries
Demand, policies, access to external financing and pricing conditions are all relevant factors to explain changes in business investment across the business cycles. Since the start of the sovereign crisis, capital spending has been weak in the euro area, and much more so in vulnerable countries. To understand the reasons behind the weakness of investment in Europe overall and the factors behind asymmetric patterns between core and vulnerable countries, we use two SVAR models. We show that beyond the weakness in demand, factors at play in the banking sector have also contributed in the vulnerable countries. While debt issuance may have helped corporations to circumvent tight access to bank credit, this possibility has been limited by the size and degree of concentration of the corporate debt market.
Given the data limitation, core countries are proxied by Germany, France and the Netherlands, while vulnerable countries consist of Italy and Spain. For each group, the country data are aggregated using GDP weights. We estimate two SVAR models consisting of the same seven variables each: entrepreneurial income, bank lending spreads, MFI loans, debt premium, annual growth in the outstanding amount of NFC debt securities, business investment (other private investment until end-2015 extended by gross fixed capital formation), and real short-term rate.13 All the series are country-specific except the series on corporate bond yields, which is available for EU NFCs only. The estimation covers the period from 1992Q1 – 2016Q2, 102 quarterly observations.
After estimation of the two models, that for core countries and that for vulnerable countries, the shocks are extracted following a recursive decomposition. Demand shocks are then assimilated to shocks to investment and to gross entrepreneurial income, shocks to access to bank loans assimilated to shocks on corporate loans and lending spreads, and shocks to access to the debt market to shocks to debt premiums and to debt issuance. Together with the estimated impulse response, the shocks are used to compute the contributions to each variable in each group of countries. This makes it possible to identify the factors which may have contributed to the different evolution observed between the core and the vulnerable countries for the variables in the model. We focus on investment, bank loans, bank lending spreads and debt issuance. Figures A-D below depict by how much the asymmetric demand conditions, and tighter access to bank loans or to the debt market, between the core and the vulnerable countries can account for the different evolution. The Figures in level are also appended.
Figure A shows that from the beginning of the 2010s to the beginning of 2014, investment growth in the vulnerable countries was much below, by more than two standard deviations, that in the core countries. Since then, the gap between the two has decreased, and at the end of 2015 investment growth in the core countries was above that in the vulnerable countries only marginally. The bulk of the difference was explained by demand conditions, which are estimated to have been in favour of the core countries over virtually the entire period. Yet, access to bank loans also played a role, but a more balanced one.
Figure B shows how much the swing in bank loans has been pronounced in the vulnerable countries, from well above the core countries from 2003 until 2007 to well below since 2010, and still remaining below at the end of the period. Differently than for investment, the main drivers of these differences are to be found in access to bank loans, which pushed bank loans before the crisis in favour of the vulnerable countries and has restricted them permanently since then. This was similar for demand. Again, access to debt markets plays a relatively minor role but may have favoured bank loans in the vulnerable countries at a time of high stress, given the difficulty to issue.
13 See Maurin L. (2014) for a detailed description of the model and its estimation at the euro area level.

Investment finance PART II 175
European Investment Bank Investment and Investment Finance in Europe
Figure A Investment growth (annual growth rate, %, and contribution, p.p., de-meaned)
Figure B MFI loans to NFCs (annual growth rate, %, and contribution, p.p., de-meaned)
Demand conditions Access to bank loans Access to debt market
Bank loans (other) Bank loans (vulnerable)
-0.2
-0.1
0.0
1999 2001 2003 2005 2007 2009 2011 2013 2015
0.1
-0.2
-0.1
0.0
0.1
0.2
1999 2001 2003 2005 2007 2009 2011 2013 2015
Source: Based on Maurin L. (2014). Note: Based on a SVAR identified with Choleski decomposition and incorporating the series in the following order:
entrepreneurial income, bank lending spread, MFI loans, debt premium, stock of debt, business investment, real short-term rate. The shadow area portrays the period during which investment growth in the vulnerable countries is below that in the other by more than two standard deviations. The contribution is the difference between that in the core and that in the vulnerable countries. The actual series are plotted in deviation from the historical average.
The differences in the movements in bank lending spreads are even more pronounced than for bank loans, with a gap opening in mid-2011. Since then, bank lending spreads in vulnerable countries have remained well above those in the core economies. The gap widened to around 120 bps at the turn of 2012 and subsequently declined to around 25 bps in mid-2016 (Figure C). According to the model, from mid-2011 until the end of 2015, the gap reflects more adverse demand conditions in the vulnerable countries, and therefore the inclusion of a stronger credit risk in the pricing of the loans, but not that alone. Indeed, factors specific to the banking sector, such as more impaired assets, fewer capital buffers and recapitalisation needs, resulted in tighter conditions for accessing bank loans in vulnerable countries during that period. These are estimated to have become more symmetric across the two groups of countries since the middle of 2015. Interestingly, relatively better debt issuance conditions in vulnerable countries have contributed to reducing the gap, as in 2013 and 2014 some corporations in vulnerable countries were able to substitute funding sources and benefit quickly from improved conditions in the debt market.
Debt issuance is much more volatile (Figure D). As explained in the main text, the law of large numbers does not apply, as the bulk of issuance is driven by a few corporations. Therefore, issuance activity may reflect conditions specific to the firms or the sector in which they operate more than the macroeconomy. As such, it is not surprising that the bulk of the differences in debt issuance appears to be driven by idiosyncratic events, portrayed by the green bars. Also, these contributions do not seem very persistent. Still, it is interesting to note that from 1999 until the beginning of 2012, debt issuance co-moves in core and vulnerable countries. Thereafter, until the end of 2014, debt issuance increases in the vulnerable countries when it decreases in the core and vice versa. At the end of the period, at the beginning of 2016, debt issuance rebounds in both groups of countries. This is due to specific factors becoming more supportive in both areas. Most likely, the support results from the extension of the ECB asset purchase programme to corporate debt securities.

PART II Investment finance176
Investment and Investment Finance in Europe European Investment Bank
Figure C Bank lending spread (p.p per annum, and contribution p.p., de-meaned)
Figure D Debt issuance (annual growth, %, and contribution p.p., de-meaned)
Demand conditions Access to bank loans Access to debt market
Bank lending spread (other) Bank lending spread (vulnerable)
-1
0
1
2
1999 2001 2003 2005 2007 2009 2011 2013 2015
0.1
1999 2001 2003 2005 2007 2009 2011 2013 2015-0.3
-0.2
-0.1
0.0
0.2
0.3
Source and Note: See Figure A
Besides demand conditions, conditions specific to the financial sector help to explain some of the differences recorded between vulnerable and core countries since the beginning of the sovereign debt crisis: a more pronounced decline in investment, a sharper decline in bank loans and the opening of a gap in bank lending spreads. Also, the limited capacity to issue debt securities is considered to have partly safeguarded core countries from the lasting effects of the banking sector adjustment. More recently, with the inclusion of corporate debt in the APP, the ECB may have reactivated this channel for the entire euro area. Beyond its role in supporting capital expenditure in the short-to-medium term this policy contributes to promoting the development of more diversified financial markets, improving market stability and resilience and the monetary transmission channel (Valiante, 2016). Helping to foster the corporate debt market, the inclusion of corporate debt in the APP can be instrumental to establishing the Capital Market Union. Although still at an early stage, the Capital Market Union can be expected to make it easier for smaller firms to raise funding, for example, by helping to free up bank balance sheets.

Investment finance PART II 177
European Investment Bank Investment and Investment Finance in Europe
Annex Shock contribution in each group of countries
Vulnerable Other
Investment growth (annual growth rate, %, and contribution, p.p., de-meaned)
Demand conditions Access to bank loans Access to debt market Business investment
-0.2
-0.1
0.0
0.1
1999 2001 2003 2005 2007 2009 2011 2013 2015-0.2
-0.1
0.0
1999 2001 2003 2005 2007 2009 2011 2013 2015
0.1
MFI loans to NFCs (annual growth rate, %, and contribution, p.p., de-meaned)
Demand conditions Access to bank loans Access to debt market Bank loans (other)
-0.2
-0.1
0.0
0.1
0.2
1999 2001 2003 2005 2007 2009 2011 2013 2015-0.2
-0.1
0.0
0.1
0.2
1999 2001 2003 2005 2007 2009 2011 2013 2015
Bank lending spread (p.p per annum, and contribution p.p., de-meaned)
Demand conditions Access to bank loans Access to debt market Bank lending spread
-1
0
1
2
1999 2001 2003 2005 2007 2009 2011 2013 2015-1
0
1
2
1999 2001 2003 2005 2007 2009 2011 2013 2015
Corporate debt (annual growth rate, %, and contribution, p.p., de-meaned)
Demand conditions Access to bank loans Access to debt market Debt issuance
-0.2
-0.1
0.0
0.1
0.2
0.3
1999 2001 2003 2005 2007 2009 2011 2013 2015-0.2
-0.1
0.0
0.1
0.2
0.3
1999 2001 2003 2005 2007 2009 2011 2013 2015

PART II Investment finance178
Investment and Investment Finance in Europe European Investment Bank
4.4. Banking sector’s capacity to take risk and finance capital expenditure
In this section, we analyse the strength of the European banking sector, in order to assess its capacity to provide loans. We review where banks stand in terms of capital adjustment and show that the European banking sector has become more resilient, as supported by the EBA 2016 stress test. ECB monetary policy has been successful in restoring the transmission channel of monetary policy, so that the pass-through of monetary policy rates to the cost of bank borrowing has been restored.
Box 3 shows that the risk components have been especially elevated for vulnerable countries in the wake of the sovereign debt crisis. However, the bulk of the risks reflect the vicious bank-to-sovereign loop and not risks originating in the corporate sector. More recently, since mid-2014, as Box 3 shows, the cuts in monetary policy rates have been passed-through to the cost of borrowing so that pricing conditions have become more symmetric across Europe. However, the European banking sector is going through a period of structural adjustment and the quality of bank assets remains very diverse across European jurisdictions. Looking forward, banking sectors may differ in their capacity to finance them through accumulated earnings in a low interest rate environment. This would be especially important if the current environment were to remain persistent. Banking sectors encumbered with impaired assets and drawing most of their income from net interest revenue would then be more exposed.
4.4.1. EU banks have strengthened their balance sheets…Over the last four years, EU banks have increased their capital ratio substantially, in an unprecedented manner. At the end of 2015, the EU banking sector had a Core Tier 1 capital ratio of 13.2% (EBA 2016).14 This was 200 bps higher than in the stress sample of 2014 and 400 bps higher than in that of 2011. A large part of the adjustment has occurred through equity issuance and capital retention. Indeed, the increase in the CET1 capital base is estimated to have contributed to almost all of the 3 p.p. increase in the CET1 ratio since the beginning of 2010 (Figure 31). This mostly resulted from recapitalisation.15 This was accompanied by a rise in assets, being offset by de-risking, and a change in the asset composition of banks towards relatively less risky components. The fact that the bulk of the adjustment took place through a stronger capital base does not mean that the effect on the economy was muted. Indeed, part of the stronger capital base resulted from higher earnings retention achieved through a higher bank lending margin. There is some evidence in the literature that the capital adjustment towards a more resilient banking sector has been detrimental to the provision of credit (BIS, 2010 or Bridges et al., 2014).
The CET1 capital ratio is one of the measures of bank balance sheet strength and it is possible that during the adjustment to more stringent capital requirements, European banks optimised their response by implementing regulatory arbitrage, following the less costly strategy to achieve the same goal. For instance, analysis has shown that banks implementing the Internal Risk Based Approach (IRBA) were reporting lower risk weights than those applying the Standard Risk Methodology (EBA, 2013). To some extent, this reflects differences in the sample of banks considered. Banks implementing IRBA are larger banks which have more expertise and more scope to minimise the risk on their entire portfolio by covering positions with risks negatively correlated. However, the implementation of IRBA may have also enabled banks to lower risk weights. This is supported by the fact that changes in risk weights contributed positively to the capital ratio over the period; they declined at the time of one of the worst economic crisis (Figure 31). Of course, several technical factors may explain this evolution, among them the shift of part of the bank portfolio towards the distressed portfolio during the crisis. However, in these conditions, other ratios, such as the leverage ratios, can provide a more accurate measure of the strength of bank balance sheets (Blundell-Wignal and Roulet, 2013). To take this possibility into consideration, we provide a measure of the change in capital ratio which computes the principal component of a broad set of measures, such as total capital ratio, risk-weighted capital ratio, leverage ratio, loan to deposit.
14 The stress test sample consists of 51 banks, covering around 70% of the European banking sector. 37 banks are domiciled in the euro area, with the remainder in Denmark, Hungary, Norway, Poland, Sweden and the United Kingdom.
15 See Maurin L. and M. Toivanen (2015).

Investment finance PART II 179
European Investment Bank Investment and Investment Finance in Europe
The rise observed in Figure 32 confirms that banks have strengthened the resilience of their balance sheets and their overall solvency. This assessment is confirmed by the stress test results released in July 2016, which show that, overall, the EU banking sector is robust enough to withstand adverse economic conditions.
Moreover, it confirms that the regulatory adjustment of capital ratios recommended under Basel III and enforced under CRR-CRD IV has come to completion.
Figure 31 Accounting-based decomposition of the change in CET1 capital ratios of EU banks
Figure 32 Factor-based measure of capital and leverage ratio of EU banks
-1.5
0.0
1.5
3.0
4.5
6.0
-2
-1
0
1
2
3
Change in total asset
Change in risk-weight
Change in capital
Change in CET1 ratio
25% quartile 75% quartileMedian
2010
Q1
2011
Q1
2012
Q1
2013
Q1
2014
Q1
2015
Q1
2016
Q1
2005
2006
2007
2008
2009
2010
2011
2012
2013
2014
2015
2016
Source: ECON calculations based on Eikon DataStream.Note: Change since 2010 and contributions (pp). Based
on the average of 33 listed banks. See footnote to Figure 32.
Source: ECON computations based on Eikon DataStream. Note: Based on 33 listed banks located in DE, FR, IT, ES,
AU, UK, SW and DK, see Galiay A. and L. Maurin (2015). For each bank, the principal component of a set of balance sheet indicators related to capital and leverage is computed and de-meaned over 2003Q1-2016Q2. The blue line inside the green ones portrays the median of the indicator across the sample of banks while the two green lines represent the 25% and 75% quartiles.
4.4.2 … and should be relatively resilient in the current environment…
On the one hand, the cost of funding of banks has substantially declined. Indeed, as shown in Figure 33, the spread to the underlying reference rate has declined by almost 200 bps since the beginning of 2013. However, it has remained relatively stable since the beginning of 2015, above the pre-Lehman period. This indicator may provide a rosy picture of the current situation and underestimate the tensions, at least in the euro area given that the incentive to issue bank debt may be relatively weak, especially in the euro area where Targeted Longer-Term Refinancing Operations and full allotment policies are being implemented. In this context, the less creditworthy issuer may favour recourse to ECB funding. Yet, as reiterated by the results of the July 2016 EBA stress tests, EU banks are well capitalised. In the adverse scenario, which entails a GDP 7.1 p.p. below the EC baseline forecast in 2018, the capital ratio decreases by 380 bps but stands at 9.4% at the end of 2018. European banks continue to suffer from weak investor preference and their valuation remains very sensitive to negative events hurting specific institutions.

PART II Investment finance180
Investment and Investment Finance in Europe European Investment Bank
As developed in Chapter 1 and reiterated throughout this report, the current macroeconomic environment, whilst remaining challenging, is improving across Europe. Hence, many indications suggest improved bank balance sheets and higher income. An indication of these improvements is provided in Figure 34. For most of the larger European banks, a dataset mixing indicators of the domestic macroeconomic environment where the bank is domiciled together with key indicators of profit and loss, liquidity and funding and capital and leverage ratios is set up. Out of it, the common component is extracted. The indicator characterises the bank’s operating environment: the higher it is, the more supportive it is to the conduct of banking operations and the supply of loans. Figure 34 reports the median common component and the inter-quartile interval for the 33 banks operating in the eight EU countries covered in the sample. It appears that after the trough of the Lehman crisis at the turn of 2008 and, more recently, that of the sovereign debt crisis, in mid-2012, the indicator has improved but remains below the levels reached before 2008. Interestingly also, the dispersion around the indicator has decreased, thereby suggesting less divergence across European banking systems.16
Figure 33 Spread between the cost of bank
debt issuance and the EURIBOR 3 months
Figure 34 Indicator of EU banks' operating environment
-5
-4
-3
-2
-1
0
1
2
3
4
-2
-1
0
1
2
3
4
25% quartile 75% quartileMedian
2005
2006
2007
2008
2009
2010
2011
2012
2013
2014
2015
2016
2005
2006
2007
2008
2009
2010
2011
2012
2013
2014
2015
2016
Source: ECON computation based on Eikon Datastream.Note: See Galiay A. and L. Maurin (2015). For each quarter,
the blue (green) line portrays the median (quartiles) of the spread at issuance between the bank bonds issued by European banks and the EURIBOR 3 months.
Source: ECON computations based on Eikon DataStream. Note: Based on 33 listed banks located in DE, FR, IT, ES,
AU, UK, SW and DK, see Galiay A. and L. Maurin (2015). For each bank, the principal component of around 15 indicators comprising both bank-specific indicators related to P&L and the macroeconomic situation of the country where the parent bank is located is computed and de-meaned over 2003Q1-2016Q2. The blue line inside the green ones portrays the median of the indicator across the sample of banks while the two green lines represent the 25% and 75% quartiles.
16 A very similar picture is provided by the systemic risk indicator computed over more than 300 European banks by the VLAB at the NY Stern University available on http://vlab.stern.nyu.edu/analysis/RISK.WORLDFIN-MR.GMES. See Archarya et al. (2012).

Investment finance PART II 181
European Investment Bank Investment and Investment Finance in Europe
4.4.3. ... in which the cost of bank borrowing has reached historically low levels
While the long-term benefits of more stringent capital requirements have not yet materialised,17 during the cyclical rebound, the more capitalised and stronger banking sector is in a better position to transmit the monetary policy measures to the real economy and provide loans. There are several evidences of this. On the back of cuts in monetary policy rates, the cost of bank borrowing has declined substantially, all across Europe and even in real terms. In June 2016, it stood lower than at the beginning of 2014, even in real terms, by between 47 bps on average across EU countries (Figure 35). The decline was even more impressive in the vulnerable countries, where it seems that, after having been relatively subdued, the transmission channel has been restored in Italy and Spain, on the back of non-standard measures implemented by the ECB (Box 2 and Box 3). For vulnerable countries as a whole, the real cost of bank borrowing declined by 114 bps from mid-2014 to June 2016. This stronger decline may reflect the success of non-standard measures implemented by the ECB to restore the monetary transmission channel of monetary policy. Indeed, prior to May 2014, the bank lending rate in these two countries had become relatively less responsive to the cuts in monetary policy rates. Following the implementation of the June 2014 package18, the pass-through is estimated to have rebounded in these two countries and the euro area as a whole, while remaining unchanged in France and Germany (Figure 36).
Figure 35 Real cost of bank borrowing for NFCs (deflated by one-year ahead HICPex-inflation, % p.a.)
Figure 36 Response of NFC bank cost of borrowing one year after a 10 bps decline in the market reference rate, larger EA economies (p.p. per annum)
up to Feb-16up to May-14CoreEU
Euro area Vulnerable
Cohesion
1
2
3
4
5
6
7
8
2008 2009 2010 2011 2012 2013 2014 2015 2016 Euro Area DE FR IT ES-10
-8
-6
-4
-2
0
Source: ECON estimations based on Eurostat. Note: See Figure 1.
Source: ECON estimationsNote: Model simulations based on bank lending rate
pass-through equations comprising a money market rate and a sovereign spread as a measure of risk. The equations are Single Error Correction Equations. They are estimated on monthly data starting in March 2003.
17 See Galiay and Maurin (2015).18 The package entails a cut in the deposit facility rate, which falls below zero, as well as the announcement of two targeted longer-term refinancing operations. It was
followed at the beginning of 2015 by the start of the Asset Purchase Programme.

PART II Investment finance182
Investment and Investment Finance in Europe European Investment Bank
Box 3 Drivers of bank lending rates
In normal times, as a consequence of arbitrage opportunities and market competition, banks’ lending rates closely reflect changes in their funding costs. In abnormal times, as a result of heterogeneous risk components and market segmentation, this relationship can be distorted, making policy-making particularly difficult. In the largely banking-dependent European financial sector this can place an additional burden on the corporate sector and curb real economic activity.
Asymmetric developments in bank lending rates in recent years have weighed on the process of financial integration across Europe. In this respect, the euro area is a particular example, as even with access to the common liquidity provided by the European Central Bank (ECB), bank lending rates differ strongly across different jurisdictions. As a consequence, the transmission of the euro-wide policy instruments to the real economy is hampered, or can even create asymmetric distortions across the Member States. Better understanding of the factors driving bank lending conditions can ensure more effective policy implementation and alleviate many of the borrowers’ constraints.
Empirical studies highlight that heterogeneity in bank lending conditions can originate in high levels of sovereign debt, sluggish economic activity, weak banks or high economic uncertainty (Paries, et al. 2014). High levels of sovereign indebtedness and therefore higher sovereign funding costs are a sign of unsustainable fiscal policy. They can increase the solvency risk of a country and force banks to account for them when granting loans. In the case of a sovereign default, debtors who are government-dependent would find it more difficult to finance their obligations, which will have a direct effect on banks. Similarly, in a slow-growing or stagnating economy incomes and investments are stalled, making the debt more burdensome than had been assumed when applying for a loan. The banks need to compensate for this risk by raising retail lending rates. Weak banking positions, i.e. low capital ratios or high riskiness of balance sheets, limit the incentives to take additional risk by granting new loans as well as increasing the counterparty risk in the interbank market. These two effects put upward pressure on retail rates. Similarly, high economic uncertainty and subdued economic growth increase the risk that the debtor will not be able to repay its obligations, which eventually makes banks demand higher risk premia on the loans they grant.
In this box we study the evolution of the factors which affected bank lending rates, taking the example of four euro area countries: Germany, France, Italy and Spain. We distinguish between three potential factors affecting bank lending: namely sovereign, supply-side and demand-side conditions, which we approximate by generalised macroeconomic measures. We look at interest rates on small loans (up to and including EUR 1m) which the Monetary Financial Institutions (MFIs) granted to Non-Financial Corporates (NFCs) in the period from January 2000 until March 2016. We estimate a factor-augmented pass-through model, explaining the dynamics of the bank lending rates (BR
t) as a function of interbank market rates (IR
t) and sovereign (SOV
t), supply (SF
t) and demand
factors (DFt). One can formally write the model as
∆BRt =
j = 1
J
∑ δj ΔBR
t-j+
j = 1
K
∑ λk ΔIR
t-k +
s = 1
S
∑ ωs ΔSOV
t-s +
m = 1
M
∑ σm
ΔSFt-m
+ n = 1
N
∑ ΔDFt-n
+ α(BRt-1
– β1 IR
t-1) – β
2 SOV
t-1
– β
3SF
t-1 – β
4 DF
t-1 – β
0 ) + ε
t ,
where Δ denotes the changes and εt is the error term. We approximate sovereign and supply-side
components by probabilities of default (PD). In particular, we take 1-year PDs for the sovereign, and sample median of 1-year PDs for the banking sector.19 As a demand-side proxy we take labour market conditions, expressed by either employment expectations or unemployment rate, depending on
19 The banking samples for which PDs are available tend to be skewed towards larger and more transparent entities. We therefore carried out several robustness checks, including rates granted on bigger loans and different quantiles of the PD distributions. The main results were robust to these specifications.

Investment finance PART II 183
European Investment Bank Investment and Investment Finance in Europe
the explanatory power of the variable. As a benchmark interbank rate we use the 3-month EURIBOR, which is the average interest rate at which euro area banks trade unsecured in the euro wholesale money market. The interest rate and labour market data come from the ECB, sovereign PDs come from Kamakura and banking PDs come from Moody’s. The dynamics are smoothed by the 3-month moving average. The results are presented in Figure A.
Figure A Estimated contibution to bank lending rates.
(a) Germany (b) France
-1
0
1
2
3
4
5
6
7
Risk factors Market rateFE and residuals Bank lending rate
01-2
004
01-2
016
01-2
015
01-2
014
01-2
013
01-2
012
01-2
011
01-2
010
01-2
009
01-2
008
01-2
007
01-2
006
01-2
005
-1
0
1
2
3
4
5
6
7
-1
0
1
2
3
4
5
6
7
01-2
004
01-2
016
01-2
015
01-2
014
01-2
013
01-2
012
01-2
011
01-2
010
01-2
009
01-2
008
01-2
007
01-2
006
01-2
005
-1
0
1
2
3
4
5
6
7
Bank
lend
ing
rate
(in
pp)
Bank
lend
ing
rate
(in
pp)
01-2
004
01-2
016
01-2
015
01-2
014
01-2
013
01-2
012
01-2
011
01-2
010
01-2
009
01-2
008
01-2
007
01-2
006
01-2
005
-1
0
1
2
3
4
5
6
7
Bank
lend
ing
rate
(in
pp)
Bank
lend
ing
rate
(in
pp)
01-2
004
01-2
016
01-2
015
01-2
014
01-2
013
01-2
012
01-2
011
01-2
010
01-2
009
01-2
008
01-2
007
01-2
006
01-2
005
(c) Italy (d) Spain
-1
0
1
2
3
4
5
6
7
Risk factors Market rateFE and residuals Bank lending rate
01-2
004
01-2
016
01-2
015
01-2
014
01-2
013
01-2
012
01-2
011
01-2
010
01-2
009
01-2
008
01-2
007
01-2
006
01-2
005
-1
0
1
2
3
4
5
6
7
-1
0
1
2
3
4
5
6
7
01-2
004
01-2
016
01-2
015
01-2
014
01-2
013
01-2
012
01-2
011
01-2
010
01-2
009
01-2
008
01-2
007
01-2
006
01-2
005
-1
0
1
2
3
4
5
6
7
Bank
lend
ing
rate
(in
pp)
Bank
lend
ing
rate
(in
pp)
01-2
004
01-2
016
01-2
015
01-2
014
01-2
013
01-2
012
01-2
011
01-2
010
01-2
009
01-2
008
01-2
007
01-2
006
01-2
005
-1
0
1
2
3
4
5
6
7
Bank
lend
ing
rate
(in
pp)
Bank
lend
ing
rate
(in
pp)
01-2
004
01-2
016
01-2
015
01-2
014
01-2
013
01-2
012
01-2
011
01-2
010
01-2
009
01-2
008
01-2
007
01-2
006
01-2
005
The contributions for each country are calculated from the augmented interest rate pass-through model. Market rate is taken as 3-month Euribor whereas risk factors include sovereign risk which is approximated by 1-year sovereign PDs, financial risk which is represented by 1-year PDs of the banking sector and macro risk which is taken as employment expectations for Germany, France and Spain, and as an unemployment rate for Italy. The contributions of the market rate and macro risks are de-meaned by the sample averages. The estimation sample covers the period from January 2000 until March 2016. The optimal lag order of particular variables has been selected on the basis of the in-sample goodness of fit. Source: ECB, Kamakura, Moody’s.
One can readily observe the differences in interest rate dynamics between the core and vulnerable euro area countries. In the former, the risk factors did not translate into much higher bank lending rates. To the contrary, low levels of risk put marginal downward pressure on bank lending rates in Germany. In France they jointly contributed around 7.5 bps as of March 2016.

PART II Investment finance184
Investment and Investment Finance in Europe European Investment Bank
The risk factors have substantially dampened monetary policy transmission in Italy and Spain, in particular, in the years following the financial and sovereign debt crises. Financial intermediation was strongly disturbed in Italy after 2008, reaching the apogee in 2013. Spanish risk contributed around 50 bps to bank lending rates before the crisis, but the effect surged during the sovereign debt crisis, mostly driven by sovereign disturbance. During the peak period in 2014 the risk factors added almost 2.6 pp to lending rates in Spain, and even though they declined over recent months they still contribute around 1.1 pp. In Italy, during the peak period, the risk built up to around 2.1 pp and it recently converged to nearly 0.9 pp.
With non-responsive retail rates the standard monetary policy actions are largely ineffective. The fact that the ECB operates near to the zero lower bound environment makes bank lending only more difficult to stimulate as the conventional tools run out of scope. Strategies which could improve the effectiveness of the transmission channels should gain more attention. These could include policies aimed at restoring market confidence, cross-border risk-sharing and fostering financial integration in the euro area.
BibliographyParies, Matthieu Darracq, Diego N. Moccero, Elizaveta Krylova, and Claudia Marchini. The Retail Bank Interest Rate Pass-Through: The Case of the Euro Area During the Financial and Sovereign Debt Crisis. Occasional Paper Series No 155, Frankfurt am Main: European Central Bank, 2014, 1-45.
4.4.4. But the persistence of the current policy configuration may pose a risk to the capacity to provide credits…
The most recent experience suggests that the Zero Lower Bound (ZLB) is below zero. The rate is defined as the minimum monetary policy rate that can be achieved without transmitting into a deposit rate provided by banks to money holders, which would trigger a rush on cash. Even the deposit rate may be below zero as storing and insuring a large quantity of cash is costly. However, should the return on monetary assets go down further and be expected to remain lower for a prolonged period, such behaviour could be triggered.
Because of this possibility, banks are reluctant to pass on negative interest rates to their depositors and the funding cost of banks becomes less elastic to monetary policy rates at low levels. Hence, when lowering the lending rate they offer on corporate loans, the net interest rate margin can be reduced. If all banks were sharing the same funding structure while operating competitively, the lending rate would just move according to the change in the funding cost without impacting the net interest margin. But banks have different liability structures, across countries and within countries, some being more market-funded and others more deposit-funded. The latter are likely to be more negatively affected by a negative interest rate policy (NIRP).
Beside the possible detrimental effect of a NIRP on the net interest margin, the current monetary policy may contribute to weakening banks’ income as it flattens the yield curve. Banks operate maturity transformation; they borrow short and lend long. Hence, their profits are negatively affected by a decline in the term spread. The reaction may however take time to materialise as given the maturity structure of banks’ balance sheets, the funding costs react more quickly than the return on assets. Assuming a high share of fixed rate loans, the short-term effect may even be positive.

Investment finance PART II 185
European Investment Bank Investment and Investment Finance in Europe
To summarise, banks’ interest margins may be negatively affected by the current monetary policy configuration. More exposed are banks which have a larger deposit base offering floating rate loans. However, this remains only part of the overall effect. The rebound in activity fuelled by the monetary accommodation is also likely to increase asset quality and loan demand, resulting in more activity for banks. Hence, it is difficult to draw conclusions about the impact of the current policy on banks’ returns, and the negative partial effect of the current monetary policy on banks’ net interest margins has to be compounded by the capital gains for banks and, beyond, the positive effects, in terms of stronger growth, for the economy as a whole.
Given the lack of public statistics on individual banks’ P&Ls, one should remain very cautious before drawing conclusions about what has recently happened, as aggregated figures may mask opposite dynamics partly explained by the reasons mentioned above. On top, other factors contribute to explaining the developments in banks’ P&Ls which can therefore not be directly attributed to policy. Some information suggests that indeed, net interest margins have declined, but that this decline has been offset and the return on equity has increased (Figure 37). Anecdotal evidence suggests that banks have started adapting their business model, increasing fees and commissions and reducing operating expenses. Asset quality also seems to have increased, resulting in lower provisions. So far, no clear signs of negative impact are visible in Europe and the euro area. But given the differences in business models, banks with a higher share of incomes drawn from net interest income may be more exposed (Figure 38).
Figure 37 Bank profitability and contributing factors (percentages of asset, average, 4-qtr moving average)
Figure 38 Share of net interest income and net fee and commission income in the income of the EU banking sector (average %, over 2008-2013)
Net interest income Non interest income
Non interest expenses Provisions for loan losses
Net return (rhs)
-0.4
-0.2
0.0
0.2
0.4
-0.10
-0.05
0.00
0.05
0.10
0.0 0.2 0.4 0.6 0.8 1.0
GR
IE
CY
SK
HR
MT
BG
SI
BE
DE
PL
UK
IT
FR
LU
EE
HU
DK
NL
CZ
RO
ES
AT
SE
EU
LT
PT
FI
LV
2006Q1 2008Q1 2010Q1 2012Q1 2014Q1 2016Q1
Net interest incomeNet fee and commission income
Source: ECON calculations based on Thomson Reuters.Note: Profit components are annualised median values
displayed as shares of equity. Yearly figures are 4-quarter averages. Based on a sample of 31 EU banks. Latest observation: 2016 Q2.
Source: ECON calculations based on ECB consolidated banking data.
While this assessment takes stock of the current picture, stock market information may help to gauge future evolutions (Figure 39). Indeed, European banks are suffering from an undervaluation which accelerated during the summer of 2016 after the release of the stress test results. This comes at odds with the conclusions of the EBA stress test released on 29 July 2016 (EBA, 2016), which shows that almost all the EU banks stress tested are well-capitalised and can withstand an adverse macroeconomic scenario.

PART II Investment finance186
Investment and Investment Finance in Europe European Investment Bank
The undervaluation of EU banks compared to the pre-crisis level, does not reflect a reassessment of the macroeconomic outlook as stocks of NFCs have rebounded (Figure 39). To some extent, the relatively low valuation of banks’ stocks may partly reflect the costs of adjusting to the remaining new regulatory requirements. A structural readjustment may have occurred, resulting in a persistently lower valuation of bank equity in the sense that in the wake of the financial crisis investors realise that banks should act with more capital.
Most likely, the bulk of the decline in banks' stock prices at a time when non-banks' stocks are increasing, suggests low earnings expectations. The low valuation pushes up the cost of bank capital. Overall, internal capital generation is reduced, an equity issuance is also more costly, therefore restricting banks’ capacity to provide loans. In turn, the relatively weak earnings expectations may reflect the belief that the current situation is not sustainable and may weaken the banking sector. The longer it lasts, the more financial stability is at risk and the more likely the detrimental effects on activity will predominate.20
Besides the risk to income generation in the current monetary policy environment, one should not forget the legacy assets and the ratio of non-performing loans undermining the capacity of banks to take on new risks. For a vast majority of the European banking sector, the results of the asset quality review conducted in 2014 alleviated concerns regarding asset quality. However, in some vulnerable countries, the ratios of NPLs over total loans increased dramatically during the sovereign debt crisis. While they have gone down substantially from their peak for most of them, more needs to be done in some jurisdictions, such as Italy and Ireland for instance (Figure 40). European banks’ problems stem from concerns about their future profitability rather than their solvency; the NPL issue needs to be addressed for the bank transmission channel to continue working properly.
Figure 39 Price to book ratio of banks and NFCs (percentages of equity, median values)
Figure 40 NPL impairments (%, as a ratio to the outstanding amount of loans)
Relative PTB ratio (RHS) Banks NFCs
0.0
0.2
0.4
0.6
0.8
1.0
0
1
2
3
0 5 10 15 20
United States
United Kingdom
Switzerland
Sweden
Spain
Poland
Netherlands
Japan
Italy
Ireland
Germany
France
Belgium
Austria
2007
Q1
2008
Q1
2009
Q1
2010
Q1
2011
Q1
2012
Q1
2013
Q1
2014
Q1
2015
Q1
2016
Q1
2014-20152009-2010
Source: ECON computations based on Eikon DataStream.Note: Latest observation: 2016Q3.
Source: IMF Financial stability indicatorsNote: For Germany, the data for the period 2014-2015 refers
to 2014 only.
20 This assessment is shared among European central banks, see Draghi (2016), Constâncio (2016), Praet (2016), Carney (2016).

Investment finance PART II 187
European Investment Bank Investment and Investment Finance in Europe
4.4.5. … and asymmetries across countries and size of enterprises remain
The improvements reviewed point to less fragmentation in the European banking sector. At the same time, there is evidence that the situation remains challenging for some corporates in some parts of the European financial system, with smaller corporations facing tighter access to credit especially in vulnerable countries. This is apparent when looking at the spread between the bank lending rate on small loans – a proxy for small corporations assuming that those are the bulk of the borrowers demanding small loans – and larger loans (Figure 41). While historically, the gap is positive, because smaller borrowers appear more risky over time21, the gap has widened in the wake of the post-Lehman crisis and even more during the sovereign debt crisis. Interestingly during the latter, the widening of the gap has been much more pronounced for the smaller corporations in the vulnerable countries, from 1.0 p.p. on average on short-term loans at the beginning of 2011 to around 1.7 p.p. in the first half of 2012. At the same time, the gap for core Europe remained relatively more stable.
The survey on access to finance for enterprises suggests that at the EU level, conditions have improved even for small corporations (Figure 42). But, overall, access to external finance remains tight for SMEs, which cannot access corporate debt markets – even less the stock market – and borrow from banks at more expensive rates. By providing intermediated lending, credit guarantees, securitisation and equity products, the EIB Group is committed to supporting SME finance by providing dedicated funds to, and sharing the credit risk with, the banking sector so that it can lend to this type of final borrowers.
Figure 41 Spread between small and large loans of short-term maturity (p.p., 3-month moving average)
Figure 42 Changes in factors affecting the availability of external financing for SMEs in the EU (p.p.)
CoreEU Euro area Vulnerable
0.6
0.8
1.0
1.2
1.4
1.6
1.8
2.0
2008 2009 2010 2011 2012 2013 2014 2015 2016
0% 20% 40% 60% 80% 100%
2011201320142015
2011201320142015
2011201320142015
2011201320142015
2011201320142015
-30%
-10%
10%
-20%
-10%
0%
-10%
0%
10%
20%
0%
10%
20%
-20%
0%
20%
General economic outlook
Public financial support
Firm specific outlook
Credit history
Bank lending
remained unchangedimproved deteriorated
net balance (RHS)not applicable/don't know
Source: ECON computations based on ECB. Green reflects improvements, yellow unchanged, red deteriorated, grey don’t know and not applicable. The net change is the difference between green and red.
21 For a more lengthy discussion on the long-term gap between rates on small loans and rates on large loans, as well as a link to the riskiness of the loan, see Chapter 5 of this report.

PART II Investment finance188
Investment and Investment Finance in Europe European Investment Bank
4.5. Concluding remarksIn this chapter we have analysed the macro-financial environment of European NFCs with a view to detecting financial factors possibly hindering their capital expenditure. We have provided evidence that the macro-financial environment has improved significantly since the end of 2012, and to a lesser extent since the end of 2014. Recently, the financing conditions appear to have been relatively supportive of investment, up to mid-2016 at least. After years of financial crisis, this positive achievement results from several policy measures, primarily monetary policy.
In this context, we have shown that the corporate sector has taken the opportunity to improve its financial soundness, very significantly where it was most needed, in vulnerable economies. At the same time, the banking sector has built up capital buffers and, having increased its resilience, stands in a better position to provide funding. However, the sector needs to adapt its business model. It is going through a period of major transformation and is confronted by weak investor preference.
Going forward, together with the high level of impaired assets, the low and flat yield environment may become a risk to the banking sector’s capacity to provide loans. In some countries, the twin coincidence of a banking sector more exposed to the low and flat yield environment, owing to structural features, and impaired assets, owing to a more pronounced cyclical dip, could prove very harmful to the European economy as a whole.
Monetary policy being close to its limits, other policies should be implemented. In the context of the EFSI plan, the EIB is providing more and more support for the recovery. In the longer term, the development of deeper financial markets across Europe would help to achieve better resource allocation, reduce the likelihood of entering secular stagnation, and better protect European economies against shocks.

Investment finance PART II 189
European Investment Bank Investment and Investment Finance in Europe
ReferencesAcharya, Viral, Pedersen Lasse, Phillipon Thomas and Matthew Richardson (2012), “Measuring Systemic Risk”, CEPR Discussion Paper, 8824.
Aglietta, Michel and Natacha Valla (2016), “Introduction générale à la problématique des taux d´intérêt négatifs”, taux d´intérêt négatifs, douze regards, Institut Messine.
Alcidi , Cinzia and Gilles Thirion, (2016), “Risk sharing, consumption smoothing and fiscal policy”, CEPS special report, n° 146, September.
Andy, Andreas, and Huidan Lin Jobst, (2016), “Negative Interest Rate Policy (NIRP): Implications for Monetary Transmission and Bank Profitability in the Euro Area”, IMF Working Paper, 16/172, August.
Backer, Scott R., and Bloom, Nicholas, and Steven J. Davis (2016). “Measuring Economic Policy Uncertainty”, at www.PolicyUncertainty.com.
Bank for International Settlements (2010), Final Report on “Assessing the macroeconomic impact of the transition to stronger capital and liquidity requirements”, Macroeconomic Assessment Group
Bloom, Nicholas (2014), Fluctuations in Uncertainty, Journal of Economic Perspectives, vol. 28, no. 2, Spring 2014, pp. 153-76
Bloom, Nick, John Van Reenen and Stephen Bond (2007), “Uncertainty and Investment Dynamics”, NBER Working Paper, No. 12383.
Borio, Claudio and Leonardo Gambacorta and Boris Hofmann (2015), “The influence of monetary policy on bank profitability”, BIS working paper, 514, October.
Bluedorn, John, Rupa Duttagupta, Jaime Guadardo and Petia Topalova (2013), “Capital flows are fickle: anytime, anywhere”, IMF working paper, 13/183.
Blundell-Wignal, Adriand and Carolien Roulet (2013), “Business models of banks, leverage and distance-to-default”, OECD Journal: Financial Market Trends, vol. 2012/2.
Borio, Claudio (2012), “The financial cycle and macroeconomics: What have we learnt?”, Bank for International Settlements Working Papers, No. 395.
Bussière, Matthieu, Julia Schmidt and Natacha Valla (2016), “International financial flows in the new normal: key patterns (and why we should care)”, EIB Working Paper, 2016/02.
Bridges, Jonathan, Gregory, David, Nielsen, Mette, Pezzini, Silvia, Radia, Amar and Spaltro, Marco (2014), “The impact of capital requirements on bank lending”, Bank of England Staff Working Paper No. 486
Carney, Mark, (2016), ‘’Uncertainty, the economy and policy”, Speech, Court Room, Bank of England, 30 June 2016.
Chinn, Menzie D. and Hiro Ito (2008), “A New Measure of Financial Openness”, Journal of Comparative Policy Analysis, Volume 10, Issue 3 September 2008, p. 309 - 322.
Coeuré, Benoît (2016), “Assessing the implications of negative interest rates”, Speech at Yale Financial Crisis Forum, 28 July.

PART II Investment finance190
Investment and Investment Finance in Europe European Investment Bank
Coeuré Benoit, (2015), Paradigm lost: Rethinking international adjustments, Egon and Joan von Kashnitz Lecture, Clausen Center for International Business and Policy, Berkeley, 21 November 2015.
Committee on the Global Financial System (2011), “Global liquidity - concept, measurement and policy implications”, CGFS Paper, No 45.
Constâncio, Victor (2016), “The challenge of low real interest rates for monetary policy”, Lecture, Macroeconomics Symposium, Utrecht School of Economics, 15 June 2016.
Cuerpo, Claudio, Ines Drumond, Julia Lendvai, Peter Pontuch and Rafal Raciborski (2013). “Indebtedness, Deleveraging Dynamics and Macroeconomic Adjustment”, European Economy, Economic Papers, No. 477.
Darracq-Parries, Matthieu, Laurent Maurin and Diego Moccero (2014), “Financing Condition Index and identification of credit supply shock for the euro area”, International finance, Vol. 17, Issue 3, p.p. 297-321.
Darracq-Parries, Matthieu, Elizaveta Krylova, Claudia Marchini, and Diego Moccero (2014), “The retail interest rate pass-through in the euro area during the financial and sovereign debt crisis”, ECB occasional paper, 155, https://www.ecb.europa.eu/pub/pdf/scpops/ecbop155.pdf?5a584c009e35f04fc83b38d5e8d8d5b3.
Didier, Tatiana, Ross Levine and Sergio L. Schmukler (2016), “Capital market financing, firm growth, and firm size distribution”, ESRB Working Paper Series, n°4, March 2016.
Draghi, Mario (2016), “Addressing the causes of low interest rates”, Introductory speech, Annual Meeting of the Asian Development Bank, 2 May 2016.
Eggertsson, G. B. and N. Mehrotra (2014). “A model of secular stagnation”, in Secular Stagnation: Facts, Causes, and Cures, C. Teulings and R. Baldwin, eds., Centre for Economic Policy Research
Eggertsson, Gauti, and Michael Woodford (2003), “the Zero Lower Bound on interest rates and optimal monetary policy”, Working Paper Columbia University, June
European Banking Authority (2016), “2016 EU-wide stress test results”, 29 July 2016.
European Banking Authority (2013), “Summary report on the comparability and pro-cyclicality of capital requirements under the Internal Ratings Basel approach in accordance with Article 502 of capital requirements regulation”, 17 December 20136.
European Central Bank (2010), “Macroeconomic and financial system uncertainty during the latest recession”, Financial Stability Review, June, pp. 66-71.
European Commission (2016), “The economic outlook after the UK referendum: a first assessment for the Euro Area and the EU”, Institutional Paper, 032, July 2016.
ECB (2016), “Survey on the Access to Finance of Enterprises in the euro area, October 2015 to March 2016”, June 2016.
Galiay, Artus, and Laurent Maurin (2015), “Drivers of banks’ cost of debt and long-term benefits of regulation – an empirical analysis based on EU banks”, ECB Working Paper 1849, https://www.ecb.europa.eu/pub/pdf/scpwps/ecbwp1849.en.pdf.
Hansen, Alvin H. (1939), “Economic progress and declining population growth”, The American Economic Review, Vol. 29, N°1, March, pp. 1-15.

Investment finance PART II 191
European Investment Bank Investment and Investment Finance in Europe
Harimohan, Rashmi, and Michael McLeay and Garry Young (2015), “Pass-through of bank funding costs to lending and deposit rates: lessons from the financial crisis”, BOE Working Paper, 590.
Holston, Katryn, Thomas Laubach and John C. Williams (2016), “Measuring the natural rate of interest: international trends and determinants, Federal Reserve Bank of San Francisco Working Paper Series, 2016-11, June.
Hördahl, Peter, Jhuvesh Sobrun and Philip Turner (2016), “Low long-run interest rates as a global phenomenon”, BIS Working Papers, n° 574.
International Center for Monetary and Banking Studies and Centre for European Policy Research (2015), “Low for long? Causes and consequences of persistency low interest rates” Bean, Charles and Christian Broda and Ito Takatoshi and Randall Rowsner Eds., Geneva reports on the world economy, 17, September 2015.
International Monetary Fund (2015), “International banking after the crisis: increasingly local and safer?”, Global Financial Stability Report, April.
International Monetary Fund (2014), “Perspectives on global real interest rates”, World Economic Outlook, Ch. 3.
Lo, Stéphanie and Kenneth Rogoff (2015). “Secular stagnation, debt overhang and other rationales for sluggish growth, six years on”, Bank for International Settlements Working Papers, No 482.
Maurin, Laurent, and Mervi Toivanen (2015), “Risk, capital buffer and bank lending: a granular approach to the adjustment of euro area banks”, Journal of Banking and Financial Economics, 1(3) 2015, 113–129. http://www.wz.uw.edu.pl/portaleFiles/3842-journal-of-b/articles/JBFE_1(3)2015_art5_kor3.pdf
Maurin, Laurent (2014), “Analysing recent developments in the financing of euro area NFCs”, in a flow-of-funds perspective on the financial crisis, B. Winkler, A. van Riet and P. Bull Eds, Palgrave Macmillan.
Valiante, Diego (2016), “Europe’s Untapped Capital Market: Rethinking financial integration after the crisis”, Centre for European Policy Studies, https://www.ceps.eu/topics/capital-markets-union.
Valla, Natacha, Xavier Ragot and Christian Thimann (2016), “Taux d´intérêt très bas: symptôme ou opportunité?”, forthcoming in rapport du Conseil d Analyse Economique.
Valla, Natacha, Jesper Berg, Laurent Clerc, Olivier Garnier and Erik Nielsen (2015), “A holistic approach to ECB asset purchases, the investment plan and CMU”, CEPII Policy Brief, n°7, April.
Rachel, Lukasz and Thomas Smith (2015), “Secular drivers of the global real interest rate”, Bank of England Staff Working Paper, n° 571.
Rey, Hélène (2013) “Dilemma not Trilemma: The global financial cycle and monetary policy independence”, Symposium, Global Dimensions of Unconventional Monetary Policy
Shin, Hyun Song (2011), “Global banking glut and loan risk premium”, Mundell-Fleming lecture conference.
Summers, L. H. (2014). “US Economic Prospects: Secular Stagnation, Hysteresis, and the Zero Lower Bound”, Business Economics, Vol. 49, No.2.
Williams, John (2016), “Monetary Policy in a Low R-star World”, FED San Francisco.

192
Investment and Investment Finance in Europe European Investment Bank