technical report land-based performance evaluation in ambient and augmented duluth- superior harbor...
TRANSCRIPT
GSI/LB/QAQC/TR/FLTR
Date Issued: December 2, 2014
Page 1 of 67
TECHNICAL REPORT
LAND-BASED PERFORMANCE EVALUATION IN
AMBIENT AND AUGMENTED DULUTH-
SUPERIOR HARBOR WATER OF EIGHT
COMMERCIALLY AVAILABLE BALLAST
WATER TREATMENT SYSTEM FILTER UNITS
December 2, 2014
Research Team
Allegra Cangelosi, NEMWI (Principal Investigator)
Meagan Aliff, NRRI, UMD
Lisa Allinger, NRRI, UMD
Mary Balcer, PhD, LSRI, UWS
Kimberly Beesley, LSRI, UWS
Lana Fanberg, LSRI, UWS
Steve Hagedorn, LSRI, UWS
Travis Mangan, NEMWI
Adam Marksteiner, AMI Engineering
Nicole Mays, NEMWI
Christine Polkinghorne, LSRI, UWS
Kelsey Prihoda, LSRI, UWS
Euan Reavie, PhD, NRRI, UMD
Deanna Regan, LSRI, UWS
Elaine Ruzycki, NRRI, UMD
Heidi Saillard, LSRI, UWS
Heidi Schaefer, LSRI, UWS
Tyler Schwerdt, AMI Engineering
Michael Stoolmiller, PhD, University of Oregon
Matthew TenEyck, LSRI, UWS
GSI/LB/QAQC/TR/FLTR
Date Issued: December 2, 2014
Page 2 of 67
Technical Report:
Land-Based Performance Evaluation in Ambient
and Augmented Duluth-Superior Harbor Water
of Eight Commercially Available Ballast Water
Treatment System Filter Units
December 2, 2014
Approved for Release by:
X
Allegra Cangelosi GSI Principal Investigator and Director
Great Ships Initiative Northeast-Midwest Institute
50 F St. NW, Suite 950 Washington, DC 20001
202-464-4014 [email protected]

GSI/LB/QAQC/TR/FLTR
Date Issued: December 2, 2014
Page 3 of 67
LIST OF ACRONYMS %D: Percent Difference
%T: Percent Transmittance
µM: Micrometer
BWMS: Ballast Water Management System
BWT: Ballast Water Treatment
CFD: Computational Fluid Dynamics
CMFDA: 5-Chloromethylfluorescein Diacetate
COC: Chain of Custody
DI: Deionized
DSH: Duluth Superior Harbor
ETV: Environmental Technology Verification
FDA: Fluorescein Diacetate
GSI: Great Ships Initiative
HMI: Human Machine Interface
ID: Internal Diameter
IMO: International Maritime Organization
LAN: Local Area Network
LSRI: Lake Superior Research Institute
MARAD: United State Maritime Administration
NEMWI: Northeast Midwest Institute
NRRI: Natural Resources Research Institute
PI: Principal Investigator
PLC: Programmable Logic Controller
POM: Particulate Organic Matter
PSC: Percent Similarity
QA: Quality Assurance
QA/QC: Quality Assurance/Quality Control
QAPP: Quality Assurance Project Plan
QC: Quality Control
RDTE: Research, Development, Testing, and Evaluation
RPD: Relative Percent Difference
SD: Secure Digital
SOP: Standard Operating Procedure
TQAP: Test/Quality Assurance Plan
TSS: Total Suspended Solids
USCG: United States Coast Guard
USEPA: United States Environmental Protection Agency
UV: Ultraviolet
UWS: University of Wisconsin-Superior
YSI: Yellow Springs Instruments
GSI/LB/QAQC/TR/FLTR
Date Issued: December 2, 2014
Page 4 of 67
EXECUTIVE SUMMARY
This Great Ships Initiative (GSI) technical report describes outcomes from controlled freshwater
operational and biological evaluations of the performance of eight commercially available filter
systems (FSs). Tests took place at the GSI Land-Based Research, Development, Testing and
Evaluation (RDTE) Facility located in the Duluth-Superior Harbor (DSH) of Lake Superior
(Superior, Wisconsin, USA) during September and October of 2013. Test objectives were:
To provide reliable information on FS operational and biological performance in
freshwater under controlled conditions, and to support limited performance comparisons
across FSs;
To explore any trade-offs between operational and biological performance endpoints;
and
To support FS, and thus ballast water management system (BWMS), freshwater
performance improvements.
The eight commercially available FS units GSI tested represented a range of filtering
technologies and nominal pore sizes. Tests took place over a five week period, with each FS unit
subjected to four test cycles of 3-4 hours each, at a rate of one test cycle per day. GSI tested FSs
sequentially in test “rounds”, involving, to the greatest extent possible, two FSs at a time. The
paired FS unit test cycles were scheduled on alternating mornings and afternoons of consecutive
days to provide for the greatest similarity and consistency of biological, physical and chemical
intake conditions possible across FS evaluations within each round. Each test cycle duration was
based on a target volume of water processed. The target volume for each FS was equivalent to
three times the design flow rate (designated by the developer) per one hour of operation,
hereafter referred to as the “unit volume”. Thus, for a FS with a target flow rate of 250 cubic
meters per hour, the FS processed 750 cubic meters of water per test cycle. The intake water for
the first two unit-volumes was ambient DSH water, while the third unit-volume was amended
with ISO 12103-1, A2 Arizona Fine Test Dust (Powder Technology, Inc.; Burnsville, Minnesota,
USA) to achieve a minimum concentration of 24 mg/L total suspended solids (TSS) in the intake
water.
Biological efficacy performance endpoints assessed in this study were density of zooplankton
(including total and live zooplankton ≥ 50 µm in minimum dimension), and organisms in the ≥
10 µm and < 50 µm size class. These endpoints were measured in FS discharge both in absolute
terms and as a percent reduction from intake. Operational performance endpoints were pre-FS
flow rate, post-FS flow rate, backflush flow rate (calculated from the difference between pre- and
post-FS flow rates), pre-FS pressure, post-FS pressure, and differential pressure (calculated from
the difference between pre- and post-FS pressure). GSI’s study did not assess FS performance
under identical challenge conditions, long term FS performance capacity, space requirements, FS
energy demands, FS durability in actual shipboard conditions, or the extent of FS developer
support for FS operation in the field.
GSI analyzed biological and physical/chemical parameters during each test cycle’s intake
operation to determine the degree of similarity in challenge conditions across and within FS test
cycles, and any influence these intake conditions may have had on FS performance. GSI also
GSI/LB/QAQC/TR/FLTR
Date Issued: December 2, 2014
Page 5 of 67
monitored and documented operational parameters during the test cycles for later comparison to
FS operational targets specified by the FS developer. Variations in biological and
physical/chemical intake conditions were controlled for statistically in evaluating biological
performance across FSs.
FS biological performance expressed as percent reduction of total organisms in the ≥ 50 µm size
class (i.e., zooplankton) ranged from 31.2 to 99.9 percent. FS performance was clearly
challenged by the large number of smaller-sized soft-bodied organisms (i.e., microzooplankton)
present in this regulated size class in the DSH. Performance relative to larger zooplankton
(i.e., macrozooplankton) in the ≥ 50 µm size class was consistently high across nominal pore
sizes. FS removal of organisms in the ≥ 10 µm and < 50 µm size class (i.e., protists) ranged from
22 to 89 percent. There was a statistically significant and large magnitude negative relationship
between FS nominal pore size and percent reduction for microzooplankton in the ≥ 50 µm size
class, as well as for organisms in the ≥ 10 µm and < 50 µm size class (i.e., protists). That is, the
smaller the nominal pore size the greater the percent reduction of organisms. These estimates of
FS effectiveness relative to the smaller organisms in the ≥ 50 µm size class are conservative, in
that live/dead status was not taken into account.
Operationally, each FS performed without significant mechanical failure and without requiring
manual servicing for the duration of testing. Operational performance of the FSs in terms of
pressure differential and percent flow lost to backflush as a percent of total water processed
ranged from 12.8 to undetectably low (i.e., under 2 percent). Operational performance
parameters measured did not strongly correlate (positively or negatively) with biological
performance such that clear and necessary “trade-offs” could be asserted. In particular, based on
GSI findings, volume lost to backflush is not necessarily greater with higher organism removal,
though unmeasured operational parameters, such as energy consumption may be.
Clearly, developers of FSs design units for diverse FS performance strengths, consistent with
diverse performance needs in the marketplace. For example, a BWMS developer or ship owner
may choose a FS based on one or more specific performance priorities, including mechanical
reliability, through-put rate, energy consumption, removal efficiency, pressure drop, the
requirements of a secondary treatment, and/or the amount of otherwise untapped operational
capacity of the ship. GSI’s study helps inform those choices to increase BWMS efficiency and
effectiveness for end users and the environment.
GSI/LB/QAQC/TR/FLTR
Date Issued: December 2, 2014
Page 6 of 67
ACKNOWLEDGMENTS
This project was a remarkable collaborative effort. We thank project funders: the
U.S. Environmental Protection Agency’s (USEPA’s) Great Lakes Restoration Initiative (GLRI),
and the U.S. Department of Transportation’s Maritime Administration. We thank the City of
Superior, Wisconsin, USA, for leasing us land for the GSI test facility. We thank Rick Harkins
and the Canadian Shipowners Association for in-kind support in test design and filter system
selection for this project. We are sincerely grateful to the participating filter system developers,
including Filtersafe®, Amiad Water Systems, Kuraray Co. Ltd., and GEA Westfalia, who agreed
to participate in the study, supported the transportation of their filter systems to and from the GSI
facility, supplied technical support to test plan development, and had personnel on site
throughout installation and test implementation. We wish to acknowledge the administrative
support of several academic and professional organizations at which GSI personnel are based.
These include the Northeast-Midwest Institute, the University of Wisconsin Superior, the
University of Minnesota Duluth, the University of Oregon, and AMI Consulting Engineers.

GSI/LB/QAQC/TR/FLTR
Date Issued: December 2, 2014
Page 7 of 67
TABLE OF CONTENTS
LIST OF ACRONYMS ....................................................................................................................................... 3
EXECUTIVE SUMMARY .................................................................................................................................. 4
ACKNOWLEDGMENTS ................................................................................................................................... 6
TABLE OF CONTENTS ..................................................................................................................................... 7
LIST OF FIGURES ............................................................................................................................................ 9
LIST OF TABLES ............................................................................................................................................ 10
1 INTRODUCTION ................................................................................................................................... 11
1.1 The Testing Organization ............................................................................................................ 12
1.2 Filter Systems Tested .................................................................................................................. 13
1.2.1 Optional Additional Filter System Developer Provided Information .................................. 14
1.3 Roles and Responsibilities of Organizations Involved ................................................................. 14
1.3.1 The Great Ships Initiative .................................................................................................... 14
1.3.2 Filter System Developers .................................................................................................... 15
1.3.3 Test Funders ........................................................................................................................ 15
2 THE TESTING FACILITY ......................................................................................................................... 15
3 METHODS ............................................................................................................................................ 20
3.1 Experimental Design ................................................................................................................... 20
3.1.1 Target Filter System Operational Window.......................................................................... 20
3.1.2 Testing Sequence and Test Cycle Components .................................................................. 21
3.1.3 Measured Endpoints ........................................................................................................... 24
3.1.4 Challenge Condition and Augmentation Methods ............................................................. 25
3.2 Filter System Installation and Commissioning Methods............................................................. 26
3.3 Collection of Samples and Measurements ................................................................................. 28
3.3.1 Water Chemistry ................................................................................................................. 30
3.3.2 Biological ............................................................................................................................. 30
3.4 Sample and Measurement Analysis ............................................................................................ 31
3.4.1 Physical/Chemistry Measurements .................................................................................... 31
3.4.2 Biological Samples ............................................................................................................... 31
3.4.3 Operational Measurements ................................................................................................ 32
3.5 Data Processing, Storage, Verification and Validation ............................................................... 33
GSI/LB/QAQC/TR/FLTR
Date Issued: December 2, 2014
Page 8 of 67
3.6 Statistical Analysis ....................................................................................................................... 34
4 FILTER SYSTEM PERFORMANCE EVALUATION RESULTS ..................................................................... 35
4.1 Intake Conditions Across FS Evaluations ..................................................................................... 35
4.1.1 Temperature, Total Suspended Solids, and Particulate Organic Matter ............................ 35
4.1.2 Intake Organism Density and Diversity ............................................................................... 38
4.2 FS Operational Performance ....................................................................................................... 42
4.3 FS Solids Removal Performance .................................................................................................. 43
4.3.1 Total Suspended Solids ....................................................................................................... 43
4.3.2 Particulate Organic Matter ................................................................................................. 45
4.4 FS Biological Performance........................................................................................................... 45
4.5 Correlations and Predictors of FS Performance Characteristics ................................................. 50
4.5.1 Simple Relationships Between Biological Performance and Operational Performance
Characteristics ..................................................................................................................................... 50
4.5.2 Relationships between Biological Performance and Operational Performance
Characteristics: Mixed Model Results ................................................................................................. 56
4.6 Test Validity and Data Quality Indicators .................................................................................... 57
4.6.1 Test Validity ......................................................................................................................... 57
4.6.2 Data Quality Indicators ....................................................................................................... 58
4.5.2.1 Water Chemistry .................................................................................................................. 58
4.5.2.2 Biology .................................................................................................................................. 58
5 DISCUSSION ......................................................................................................................................... 60
6 CONCLUSION ....................................................................................................................................... 61
7 REFERENCES ........................................................................................................................................ 62
APPENDIX 1 ................................................................................................................................................. 63
Filter System Company Statements ........................................................................................................ 63
GSI/LB/QAQC/TR/FLTR
Date Issued: December 2, 2014
Page 9 of 67
LIST OF FIGURES
Figure 1. Location of GSI's Land-Based RDTE Facility in Superior, Wisconsin, USA. .................................. 16
Figure 2. Aerial Photo of the GSI Land-Based RDTE Facility (Source: Google Earth). ................................ 16
Figure 3. Photo of the GSI Land-Based RDTE Facility. ................................................................................ 17
Figure 4. Simplified Schematic of the GSI Land-Based RDTE Facility Showing Location of Sample Points,
Sample Collection Tubs, Injection Points, Retention Tanks, and Treatment and Control Tracks. ............. 19
Figure 5. GSI Land-Based RDTE Facility Piping Diagram for FS Evaluation ................................................ 27
Figure 6. Daily Water Temperature of the Duluth Superior Harbor Measured Prior to the Start of Step 1.
Black line is estimated linear regression line indicating a statistically significant (p<0.001) downward
trend............................................................................................................................................................ 36
Figure 7. Range of Total Suspended Solids (TSS) Concentration Measured in Pre-Filter Grab Samples
Collected During Step 1 (Ambient; Black font) and Step 3 (Augmented; Red font). Green line indicates
target minimum TSS level in Step 3. Black and red lines are estimated linear regression lines showing no
statistical difference across FS test cycles. ................................................................................................. 37
Figure 8. Range of Particulate Organic Matter (POM) Concentration Measured in Pre-Filter Grab
Samples Collected During Step 1 (Ambient; Black font) and Step 3 (Augmented; Red font). Black and red
lines are estimated linear regression lines showing no statistically significant change across FS test
cycles. .......................................................................................................................................................... 38
Figure 9. Total Cell Density of Organisms in the > 10 µm and < 50 µm Size Class (i.e., Protists) as
Measured in Step 1 (Ambient; Black font) and Step 3 (Augmented; Red font) Intake Samples. Black font
is Step 1; red font is Step 3. Mean pre-filter system protist density dropped in a significant (p<0.001)
linear trend by about 133 total cells per day (green line). ......................................................................... 39
Figure 10. Protist Community Composition in Terms of Morphological Classification as Measured in
Intake Samples. Each pie diagram represents the average of all 12 samples collected for Steps 1, 2 and 3.
.................................................................................................................................................................... 40
Figure 11. Total Microzooplankton Density as Measured in Step 1 (Ambient; Black font) and Step 3
(Augmented; Red font) Intake Samples. Linear decline in mean densities over time (green line) is not
statistically significant. ................................................................................................................................ 41
Figure 12. Zooplankton Community Composition in Terms of Major Taxonomic Group as Measured in
Intake Samples from Step 3. ....................................................................................................................... 42
Figure 13. Average (± Standard Error of the Mean, N=8) Percent Reduction of Protists (Organisms in the
≥ 10 µm and < 50 µm Size Class; top third), Microzooplankton (the Majority of Organisms in the ≥ 50 µm
Size Class; middle), and Macrozooplankton (Organisms in the ≥ 50 µm Size Class; bottom third) by Filter
System Unit. ................................................................................................................................................ 47
Figure 14. Comparison of the Average Densities (#/m3) of Total Zooplankton, Live Zooplankton, and
Estimated Live Zooplankton ≥ 50 µm in Post-Filter Samples (Step 3 Data Only). ...................................... 49
Figure 15. Marginally Significant (p=0.06), Negative Linear Relationship (Red Line) Between Average
Percent Reduction in Total Microzooplankton (N=8) and Filter System (FS) Nominal Pore Size. .............. 51
Figure 16. Marginally Significant (p=0.06), Positive Linear Relationship (Red Line) Between Post-
Filtration Density of Live Zooplankton ≥ 50 microns (N=8) and Filter System (FS) Nominal Pore Size. ..... 52
GSI/LB/QAQC/TR/FLTR
Date Issued: December 2, 2014
Page 10 of 67
Figure 17. Significant (p<0.05) Negative Linear Relationship (Red Line) Between Average Percent
Reduction (N=8) of Total Protists and Nominal Pore Size. ......................................................................... 53
Figure 18. Non-Significant Linear Relationship Between Average Percent Reduction in Total
Macrozooplankton (N=8) and Nominal Pore Size. ...................................................................................... 54
Figure 19. Non-Significant Linear Relationship Between Average Differential Pressure (N=7*) and
Nominal Pore Size. ...................................................................................................................................... 55
Figure 20. Non-Significant Linear Relationship Between Average Backflush Flow Rate (N=8) and Nominal
Pore Size. ..................................................................................................................................................... 56
LIST OF TABLES
Table 1. Summary of Filter Systems Evaluated. .......................................................................................... 13
Table 2. Valid Range of Operational Parameters for Filter Systems Evaluated. ......................................... 20
Table 3. GSI Land-Based Filter System Performance Evaluation Sequence. .............................................. 21
Table 4. Target Values for GSI Amended Challenge Water Compared to those detailed in the
Environmental Technology Verification Program’s Generic Protocol, v. 5.1 (September 2010). .............. 24
Table 5. Filter System Performance Endpoints. ......................................................................................... 25
Table 6. Phases of Filter System Commissioning Trials. ............................................................................. 28
Table 7. Operational, Water Chemistry, and Biological Samples and Measurements Collected from Pre-
and Post-Filter System Water During Steps 1, 2 and 3 of each Test Cycle. ................................................ 29
Table 8. Operational, Water Chemistry and Biological Sample Handling and Storage Requirements. ..... 30
Table 9. Filter System Operational Performance in Terms of Pressure Differential and Percent Flow Lost
to Backflush as a Percent of Total Water Processed for Steps 1 and 3. Upper-case letters indicate filter
system (FS) unit ........................................................................................................................................... 43
Table 10. Total Suspended Solids (TSS) Removal Efficiency During Step 1 (Non-Augmented) Test Cycles.
Upper-case letters indicate filter system (FS) unit. .................................................................................... 44
Table 11. Total Suspended Solids (TSS) Removal Efficiency during Step 3 (i.e., Augmented) Test Cycles.
Upper-case letters indicate filter system (FS) unit. .................................................................................... 44
Table 12. Particulate Organic Matter (POM) Removal Efficiency during Step 1 (i.e., Non-Augmented)
Test Cycles. Upper-case letters indicate filter system (FS) unit. ................................................................ 45
Table 13. Particulate Organic Matter (POM) Removal Efficiency during Step 3 (i.e., Augmented) Test
Cycles. Upper-case letters indicate filter system (FS) unit. ........................................................................ 45
Table 14. Target Values and Results for GSI Challenge Water (Pre-Filter System) During Applicable Steps
of the Filter System Evaluations. ................................................................................................................ 58
Table 15. Data Quality Objectives, Criteria, and Results from Water Chemistry Analyses during the Filter
System Performance Evaluations. .............................................................................................................. 59
Table 16. Data Quality Objectives, Criteria, and Results from Analyses of Organisms ≥ 50 m during the
Filter System Performance Evaluations. ..................................................................................................... 59
Table 17. Data Quality Objectives, Criteria, and Results from Analyses of Organisms ≥ 10 and < 50 m
during the Filter System Performance Evaluations. ................................................................................... 60
GSI/LB/QAQC/TR/FLTR
Date Issued: December 2, 2014
Page 11 of 67
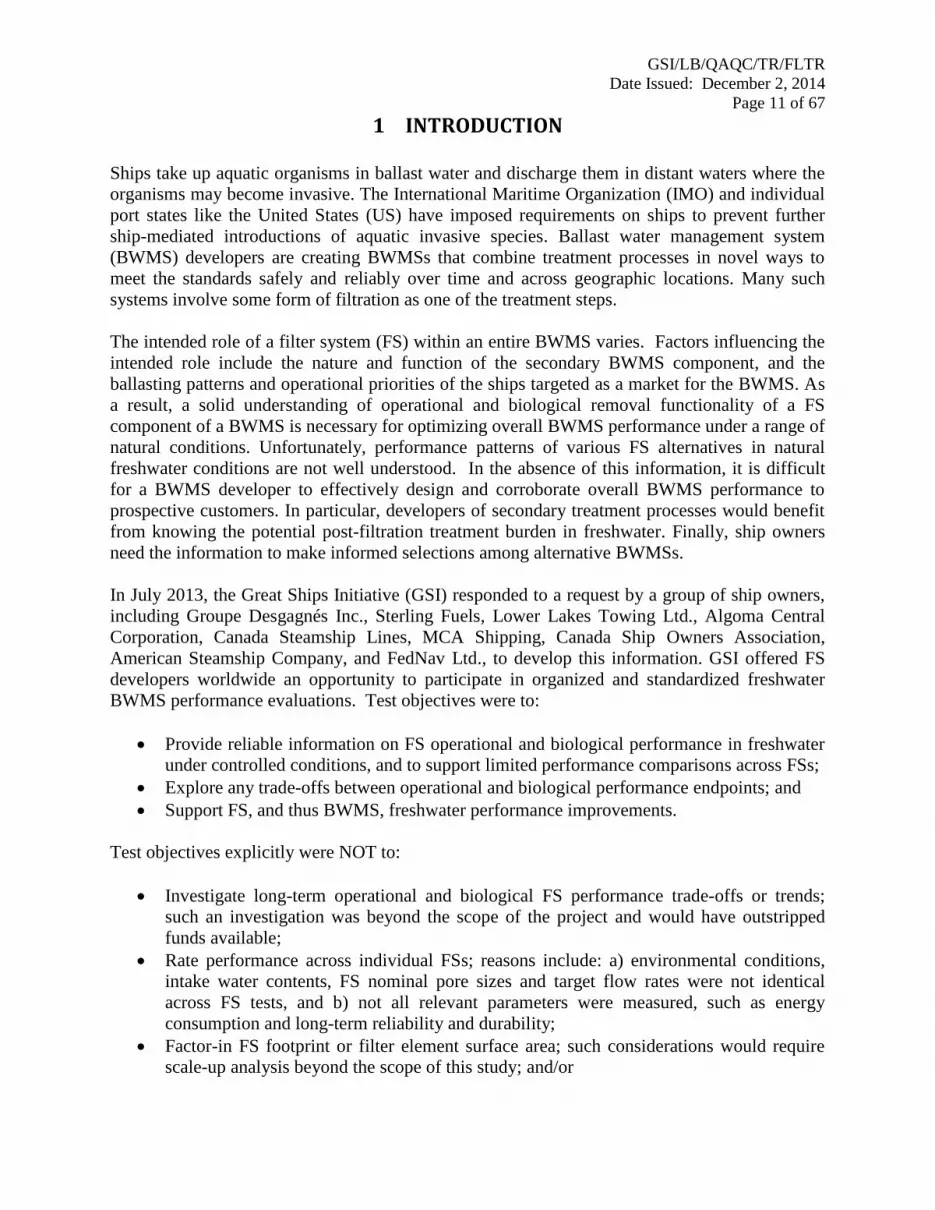
1 INTRODUCTION
Ships take up aquatic organisms in ballast water and discharge them in distant waters where the
organisms may become invasive. The International Maritime Organization (IMO) and individual
port states like the United States (US) have imposed requirements on ships to prevent further
ship-mediated introductions of aquatic invasive species. Ballast water management system
(BWMS) developers are creating BWMSs that combine treatment processes in novel ways to
meet the standards safely and reliably over time and across geographic locations. Many such
systems involve some form of filtration as one of the treatment steps.
The intended role of a filter system (FS) within an entire BWMS varies. Factors influencing the
intended role include the nature and function of the secondary BWMS component, and the
ballasting patterns and operational priorities of the ships targeted as a market for the BWMS. As
a result, a solid understanding of operational and biological removal functionality of a FS
component of a BWMS is necessary for optimizing overall BWMS performance under a range of
natural conditions. Unfortunately, performance patterns of various FS alternatives in natural
freshwater conditions are not well understood. In the absence of this information, it is difficult
for a BWMS developer to effectively design and corroborate overall BWMS performance to
prospective customers. In particular, developers of secondary treatment processes would benefit
from knowing the potential post-filtration treatment burden in freshwater. Finally, ship owners
need the information to make informed selections among alternative BWMSs.
In July 2013, the Great Ships Initiative (GSI) responded to a request by a group of ship owners,
including Groupe Desgagnés Inc., Sterling Fuels, Lower Lakes Towing Ltd., Algoma Central
Corporation, Canada Steamship Lines, MCA Shipping, Canada Ship Owners Association,
American Steamship Company, and FedNav Ltd., to develop this information. GSI offered FS
developers worldwide an opportunity to participate in organized and standardized freshwater
BWMS performance evaluations. Test objectives were to:
Provide reliable information on FS operational and biological performance in freshwater
under controlled conditions, and to support limited performance comparisons across FSs;
Explore any trade-offs between operational and biological performance endpoints; and
Support FS, and thus BWMS, freshwater performance improvements.
Test objectives explicitly were NOT to:
Investigate long-term operational and biological FS performance trade-offs or trends;
such an investigation was beyond the scope of the project and would have outstripped
funds available;
Rate performance across individual FSs; reasons include: a) environmental conditions,
intake water contents, FS nominal pore sizes and target flow rates were not identical
across FS tests, and b) not all relevant parameters were measured, such as energy
consumption and long-term reliability and durability;
Factor-in FS footprint or filter element surface area; such considerations would require
scale-up analysis beyond the scope of this study; and/or
GSI/LB/QAQC/TR/FLTR
Date Issued: December 2, 2014
Page 12 of 67
Corroborate FS developer claims as to FS nominal pore size or other aspects of the FS
physical mechanism; in particular, the FS developer was the sole-source of FS nominal
pore size information.
With input from the groups of ship owners listed above, GSI selected eight FSs for evaluation.
Qualifying FSs (as manifold subunits or a single unit) were: a) representative of models provided
to ships (i.e., capable of continuous ballasting without creating damaging pressure swings or
deadheading the ballast pump); and b) capable of flow rates between 150 and 340 cubic meters
(m3) per hour.
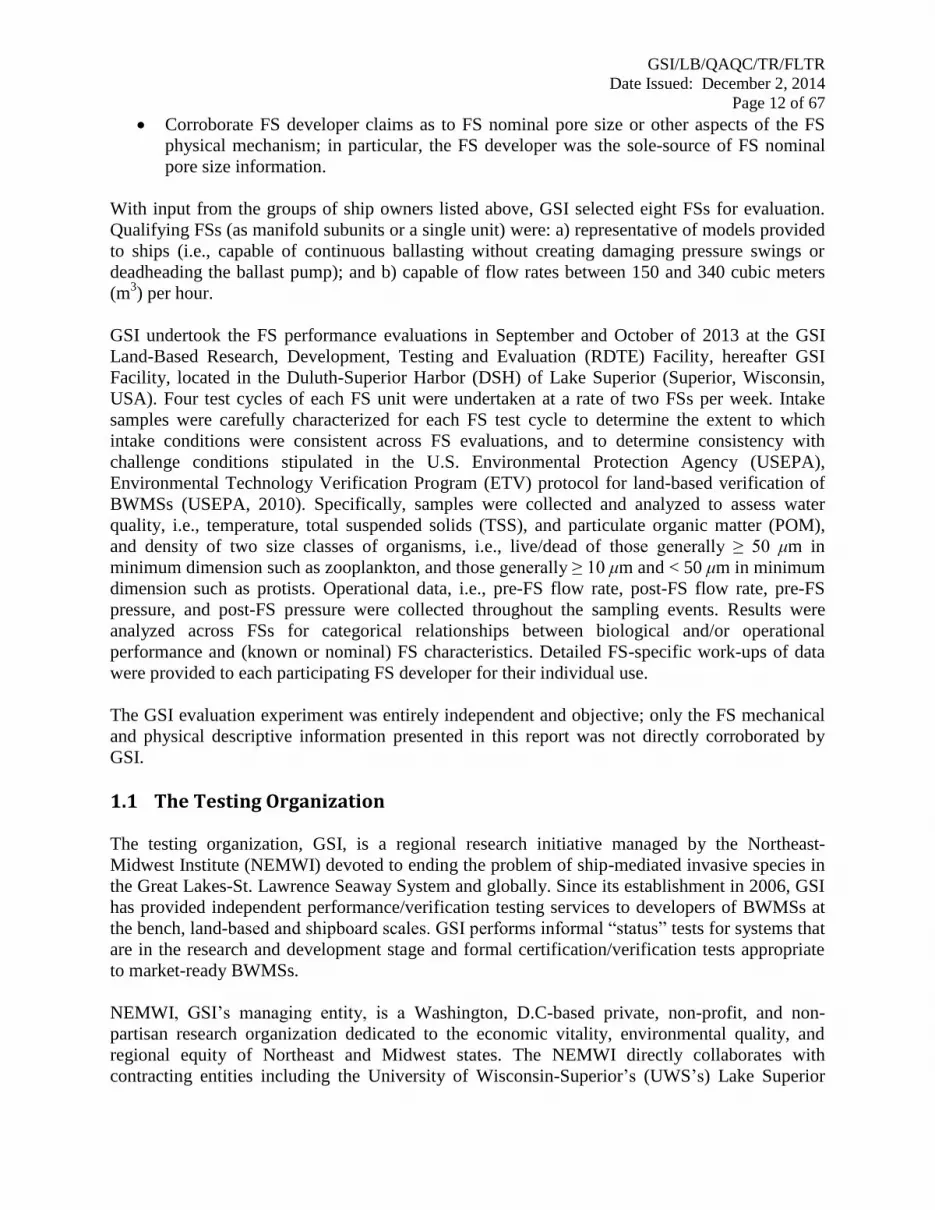
GSI undertook the FS performance evaluations in September and October of 2013 at the GSI
Land-Based Research, Development, Testing and Evaluation (RDTE) Facility, hereafter GSI
Facility, located in the Duluth-Superior Harbor (DSH) of Lake Superior (Superior, Wisconsin,
USA). Four test cycles of each FS unit were undertaken at a rate of two FSs per week. Intake
samples were carefully characterized for each FS test cycle to determine the extent to which
intake conditions were consistent across FS evaluations, and to determine consistency with
challenge conditions stipulated in the U.S. Environmental Protection Agency (USEPA),
Environmental Technology Verification Program (ETV) protocol for land-based verification of
BWMSs (USEPA, 2010). Specifically, samples were collected and analyzed to assess water
quality, i.e., temperature, total suspended solids (TSS), and particulate organic matter (POM),
and density of two size classes of organisms, i.e., live/dead of those generally ≥ 50 μm in
minimum dimension such as zooplankton, and those generally ≥ 10 μm and < 50 μm in minimum
dimension such as protists. Operational data, i.e., pre-FS flow rate, post-FS flow rate, pre-FS
pressure, and post-FS pressure were collected throughout the sampling events. Results were
analyzed across FSs for categorical relationships between biological and/or operational
performance and (known or nominal) FS characteristics. Detailed FS-specific work-ups of data
were provided to each participating FS developer for their individual use.
The GSI evaluation experiment was entirely independent and objective; only the FS mechanical
and physical descriptive information presented in this report was not directly corroborated by
GSI.
1.1 The Testing Organization
The testing organization, GSI, is a regional research initiative managed by the Northeast-
Midwest Institute (NEMWI) devoted to ending the problem of ship-mediated invasive species in
the Great Lakes-St. Lawrence Seaway System and globally. Since its establishment in 2006, GSI
has provided independent performance/verification testing services to developers of BWMSs at
the bench, land-based and shipboard scales. GSI performs informal “status” tests for systems that
are in the research and development stage and formal certification/verification tests appropriate
to market-ready BWMSs.
NEMWI, GSI’s managing entity, is a Washington, D.C-based private, non-profit, and non-
partisan research organization dedicated to the economic vitality, environmental quality, and
regional equity of Northeast and Midwest states. The NEMWI directly collaborates with
contracting entities including the University of Wisconsin-Superior’s (UWS’s) Lake Superior
GSI/LB/QAQC/TR/FLTR
Date Issued: December 2, 2014
Page 13 of 67
Research Institute (LSRI), the University of Minnesota-Duluth (UMD’s) Natural Resources
Research Institute (NRRI), the University of Oregon, and AMI Consulting Engineers, to achieve
GSI research objectives.
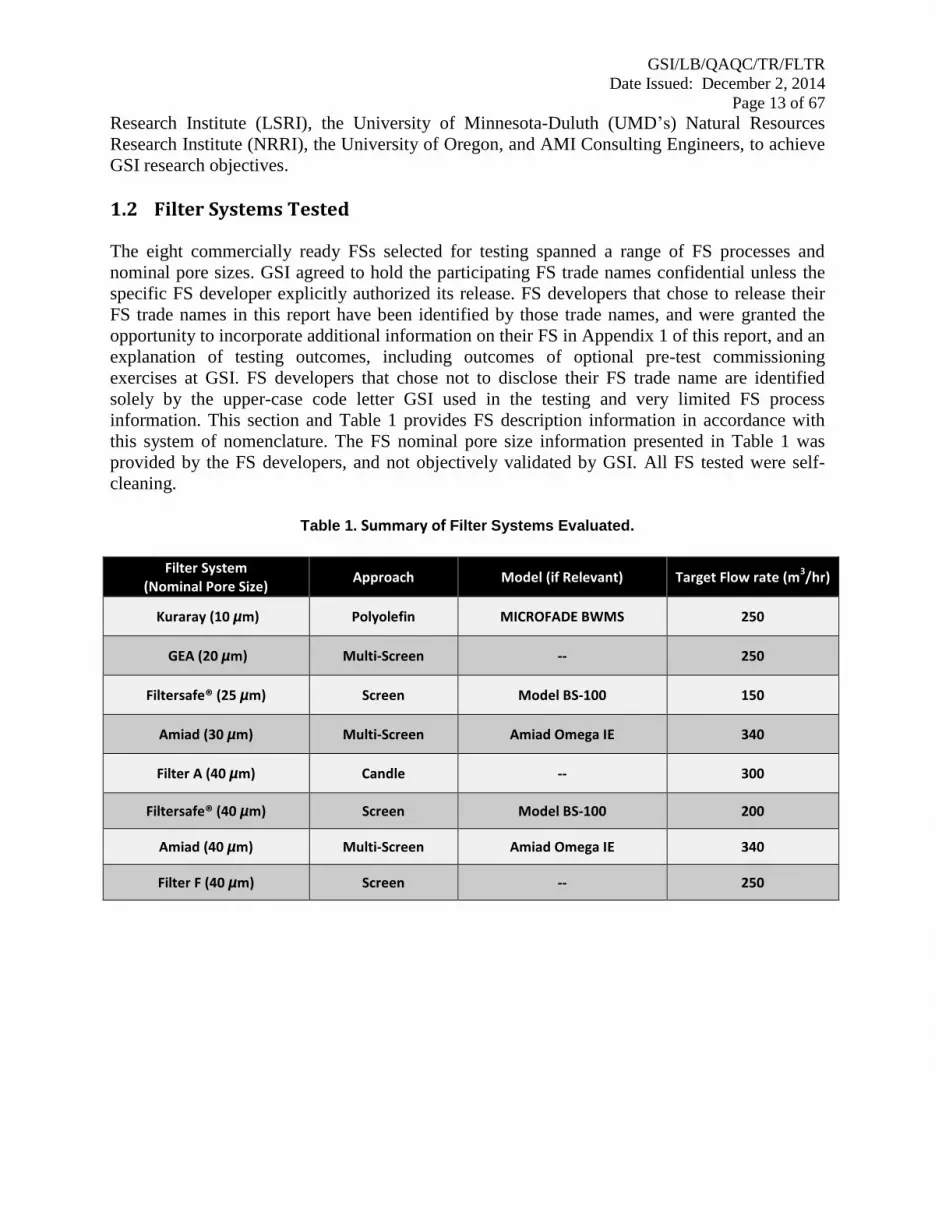
1.2 Filter Systems Tested
The eight commercially ready FSs selected for testing spanned a range of FS processes and
nominal pore sizes. GSI agreed to hold the participating FS trade names confidential unless the
specific FS developer explicitly authorized its release. FS developers that chose to release their
FS trade names in this report have been identified by those trade names, and were granted the
opportunity to incorporate additional information on their FS in Appendix 1 of this report, and an
explanation of testing outcomes, including outcomes of optional pre-test commissioning
exercises at GSI. FS developers that chose not to disclose their FS trade name are identified
solely by the upper-case code letter GSI used in the testing and very limited FS process
information. This section and Table 1 provides FS description information in accordance with
this system of nomenclature. The FS nominal pore size information presented in Table 1 was
provided by the FS developers, and not objectively validated by GSI. All FS tested were self-
cleaning.
Table 1. Summary of Filter Systems Evaluated.
Filter System
(Nominal Pore Size) Approach Model (if Relevant) Target Flow rate (m
3/hr)
Kuraray (10 µm) Polyolefin MICROFADE BWMS 250
GEA (20 µm) Multi-Screen -- 250
Filtersafe® (25 µm) Screen Model BS-100 150
Amiad (30 µm) Multi-Screen Amiad Omega IE 340
Filter A (40 µm) Candle -- 300
Filtersafe® (40 µm) Screen Model BS-100 200
Amiad (40 µm) Multi-Screen Amiad Omega IE 340
Filter F (40 µm) Screen -- 250

GSI/LB/QAQC/TR/FLTR
Date Issued: December 2, 2014
Page 14 of 67
1.2.1 Optional Additional Filter System Developer Provided Information
GSI provided FS developers which associated their trade name with the FS subject to testing the
opportunity to provide additional descriptive information about their FS. The information
provided by the FS developers appears below.
Filtersafe® (i.e., FS B and FS G, in these tests): The filter unit used in the tests represents the
wide range of ballast water treatment filters offered by Filtersafe® to the industry during the past
seven years, with a proven track record of hundreds of installations worldwide.
Amiad Water Systems (i.e., FS C and FS H, in these tests): Amiad offers automatic self-
cleaning screen filters with suction scanners cleaning mechanisms. Amiad Omega line offers
eight models with flows ranging from 100 m3/hr to 3,000 m
3/hr for a single filter unit. Amiad has
over 50 years of experience in fine filtration down to 3 micron. Every day, around the world,
Amiad filters handle the full spectrum of water contaminants from variable water sources –
organic and inorganic solids, algae bloom, storm-driven turbidity, changing flow rates, shifting
salinity, changing temperatures and varying water quality conditions
Kuraray Co. Ltd. (i.e., FS E, in these tests): The MICROFADE Filtration Unit, MF-250, is
equipped with two filter housings, each of which is backwashed at regular intervals. The system
is designed to treat a rated flow of water, 250 m3/hr, at all times, even when one housing is being
backwashed. MICROFADE’s Filtration Unit, MF-250 fine filter elements are installed in the
filter housing and can be replaced periodically after a designated number of hours of filtration
operation.
GEA Westfalia (i.e., FS D, in these tests): The filter consists of five layers of sintered stainless
steel mesh that is produced from corrosion-resistant steel and has a nominal depth of 20 μm. The
filter is equipped with a fully-automatic cleaning device that removes particles with high
cleaning forces from the inner surface of the filter screen. This cleaning device consists of a
suction tube with four suction nozzles (mounted with overlap). The cleaning process is based on
a pressure difference. A portion of the water that enters into the filter is sucked from the inside of
the filter into the concentrate pump by the suction nozzles and is discharged. The suction tube is
driven by the motor located at the top of the filter housing.
1.3 Roles and Responsibilities of Organizations Involved
Roles and responsibilities for these GSI-sponsored FS evaluations were shared among GSI, the
FS developers, participating ship owners, and the GSI funders.
1.3.1 The Great Ships Initiative
GSI was responsible for procuring funding for the FS evaluations described here, developing the
Test/Quality Assurance Plan (TQAP; GSI, 2013) for the evaluations, and subjecting the
document to review by the FS developers and participating ship owners prior to testing. GSI
prepared and maintained the testing facility, organized the testing schedule, monitored source
water conditions, supervised FS installation, supported FS developer commissioning exercises,

GSI/LB/QAQC/TR/FLTR
Date Issued: December 2, 2014
Page 15 of 67
and operated the FSs during testing in accordance with developer-provided instructions or
monitored the FS developer while they operated their specific FS. GSI was responsible for all
sample collection, sample analysis, and statistical analysis of data. In addition, GSI was
responsible for assuring data quality, and evaluating and reporting on the performance data from
the FS evaluations, maintaining security for testing activities, and assuring site safety for all
personnel. Finally, GSI was responsible for subjecting the data and data analysis to FS developer
review, and being as responsive to FS developer comments as possible within the bounds of
fairness, scientific and process constraints prior to publication. 1.3.2 Filter System Developers
FS developers were responsible for the delivery of their specific FSs to the GSI Facility, for
providing instructions to the GSI Engineers for proper installation of the units at the facility,
designating the installation requirements and operating conditions for their FSs during the
evaluations (including line pressure, flow rate, startup and shutdown procedures), and signing off
on successful commissioning outcomes of their specific FSs. FS developers were invited to
observe testing or, if they did not have representatives on site, to have a representative available
via phone and/or email during the testing period.
1.3.3 Test Funders
This project was supported by funds from the USEPA’s Great Lakes Restoration Initiative
(GLRI), and the U.S. Maritime Administration. Tests took place on land owned by the City of
Superior, Wisconsin. In-kind support in test design and FS selection was provided by the
Canadian Shipowners Association.
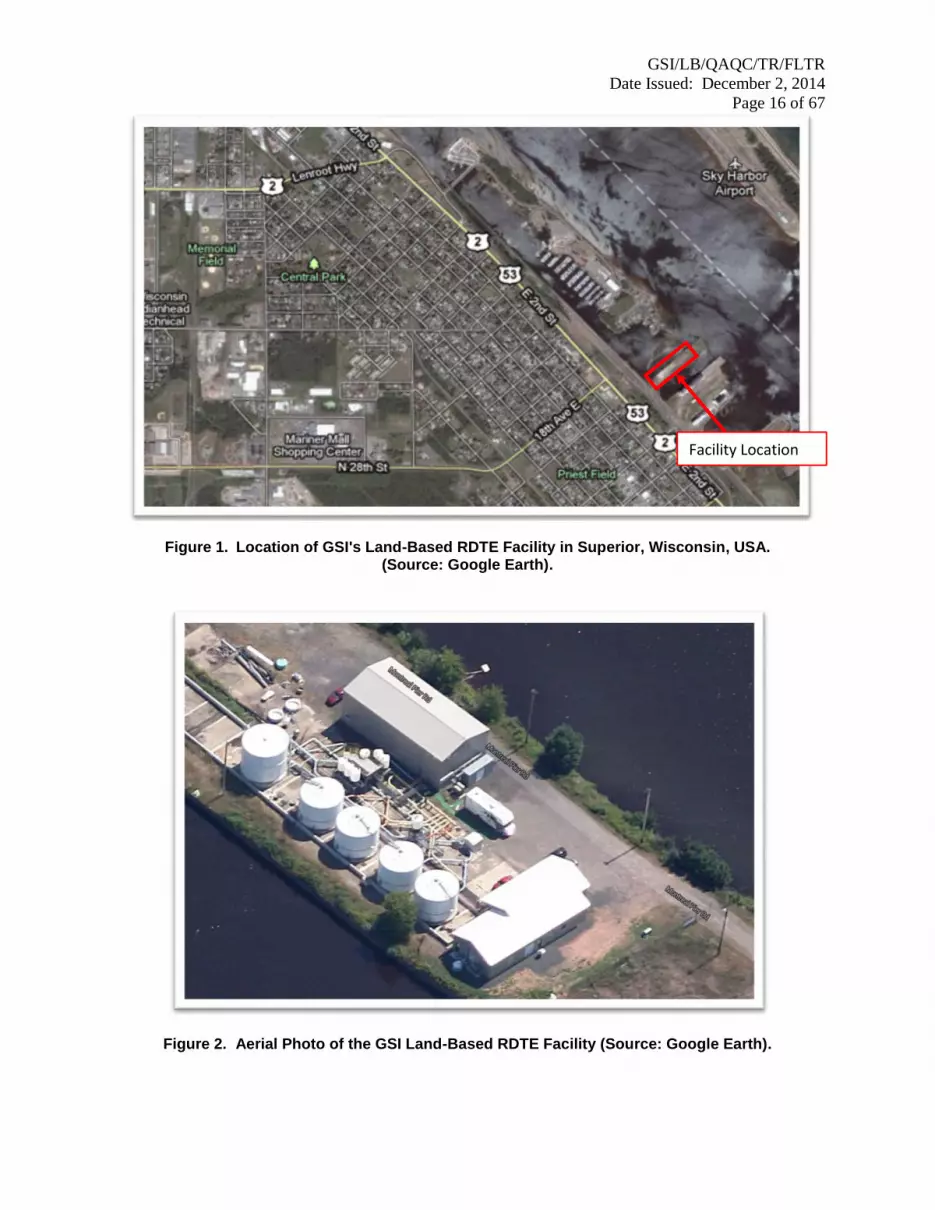
2 THE TESTING FACILITY
The FS performance evaluations took place at GSI’s Land-Based RDTE Facility located in the
DSH of Lake Superior (Figures 1-3). Relevant features of the GSI Facility include:
Control and treatment intake flows up to 340 m3/hour each;
Highly automated flow and pressure control, monitoring and data logging;
A freshwater estuary with diverse and plentiful aquatic life as a challenge water
intake source (during normal testing season May to October);
Capacity to amend intake challenge water to intensify challenge conditions;
Validated facility sanitation before and between test cycles;
High quality in-line sampling systems associated with identical 3.8 m3 sample
collection tubs;
On-site laboratory space for most live analyses, additional space minutes away; and
Easy plug-in connections for BWMSs.
GSI/LB/QAQC/TR/FLTR
Date Issued: December 2, 2014
Page 16 of 67
Figure 1. Location of GSI's Land-Based RDTE Facility in Superior, Wisconsin, USA. (Source: Google Earth).
Figure 2. Aerial Photo of the GSI Land-Based RDTE Facility (Source: Google Earth).
Facility Location Facility Location Facility Location Facility Location
GSI/LB/QAQC/TR/FLTR
Date Issued: December 2, 2014
Page 17 of 67
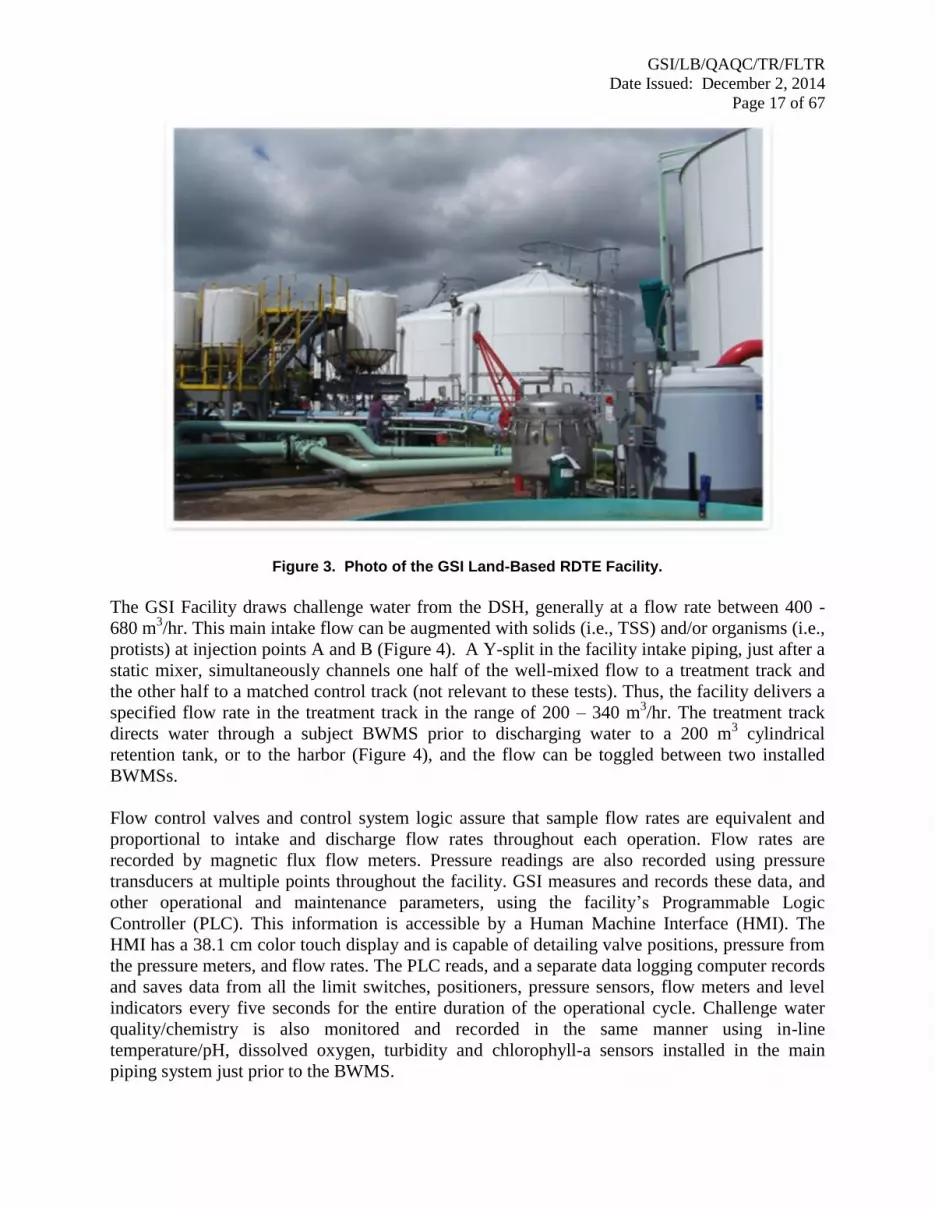
Figure 3. Photo of the GSI Land-Based RDTE Facility.
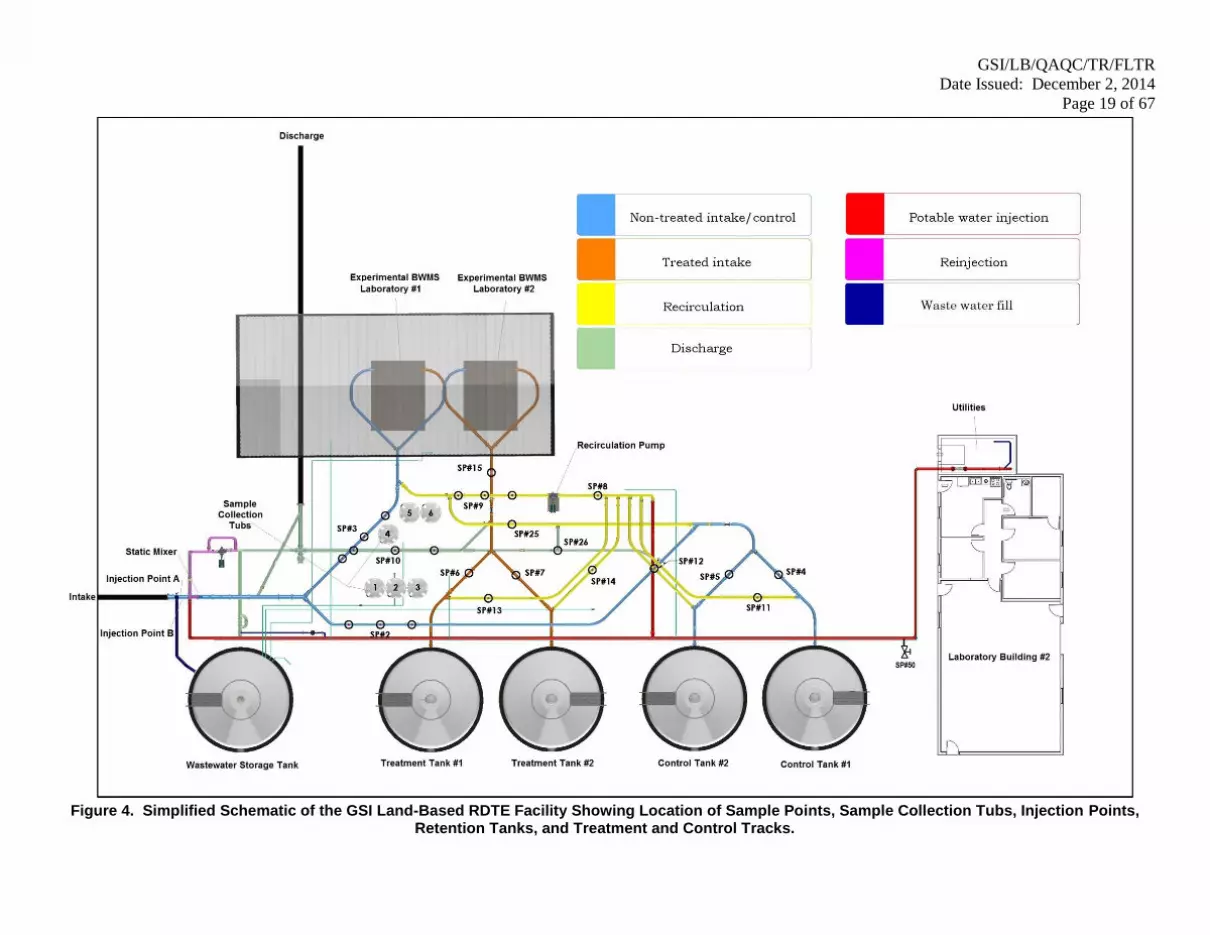
The GSI Facility draws challenge water from the DSH, generally at a flow rate between 400 -
680 m3/hr. This main intake flow can be augmented with solids (i.e., TSS) and/or organisms (i.e.,
protists) at injection points A and B (Figure 4). A Y-split in the facility intake piping, just after a
static mixer, simultaneously channels one half of the well-mixed flow to a treatment track and
the other half to a matched control track (not relevant to these tests). Thus, the facility delivers a
specified flow rate in the treatment track in the range of 200 – 340 m3/hr. The treatment track
directs water through a subject BWMS prior to discharging water to a 200 m3 cylindrical
retention tank, or to the harbor (Figure 4), and the flow can be toggled between two installed
BWMSs.
Flow control valves and control system logic assure that sample flow rates are equivalent and
proportional to intake and discharge flow rates throughout each operation. Flow rates are
recorded by magnetic flux flow meters. Pressure readings are also recorded using pressure
transducers at multiple points throughout the facility. GSI measures and records these data, and
other operational and maintenance parameters, using the facility’s Programmable Logic
Controller (PLC). This information is accessible by a Human Machine Interface (HMI). The
HMI has a 38.1 cm color touch display and is capable of detailing valve positions, pressure from
the pressure meters, and flow rates. The PLC reads, and a separate data logging computer records
and saves data from all the limit switches, positioners, pressure sensors, flow meters and level
indicators every five seconds for the entire duration of the operational cycle. Challenge water
quality/chemistry is also monitored and recorded in the same manner using in-line
temperature/pH, dissolved oxygen, turbidity and chlorophyll-a sensors installed in the main
piping system just prior to the BWMS.

GSI/LB/QAQC/TR/FLTR
Date Issued: December 2, 2014
Page 18 of 67
Sample water for biological analysis is generally collected continuously throughout each intake
and discharge operation via the facility’s in-line sample points (SPs). Samples for water
quality/chemistry analysis are collected from designated SPs during intake, tank retention and
discharge. All SPs, with the exception of SP#15, consist of three identical sample ports spaced at
regular intervals in a length of straight pipe (SP#15 consists of one sample port). Each port is
fitted with a center-located elbow-shaped tube (90 o) which samples the water. This design is
based on a design developed and validated analytically by the U.S. Naval Research Laboratory in
Key West, Florida. The design and lay-out of these replicate sample ports has also been validated
empirically at GSI, and shown to produce equivalent, representative and unbiased samples of
water flow.
On-site laboratories (Figure 4) support time sensitive analyses associated with GSI land-based
tests, including live analysis of organisms ≥ 50 µm (i.e., zooplankton) and organisms ≥ 10 and
< 50 µm (i.e., protists). The laboratories are climate-controlled, and have enough bench space to
allow for simultaneous analysis of samples by multiple personnel. All other analyses are
conducted in laboratories of LSRI on the UWS campus; approximately 5 km from the facility.
GSI/LB/QAQC/TR/FLTR
Date Issued: December 2, 2014
Page 19 of 67
Figure 4. Simplified Schematic of the GSI Land-Based RDTE Facility Showing Location of Sample Points, Sample Collection Tubs, Injection Points,
Retention Tanks, and Treatment and Control Tracks.
GSI/LB/QAQC/TR/FLTR
Date Issued: December 2, 2014
Page 20 of 67
3 METHODS
3.1 Experimental Design
The GSI experimental design for this set of FS evaluations revolved around reducing variables
other than FS type to the greatest extent possible through establishing a common approach to
determining the experimental unit volume and target pressure for each FS, amending test water
to meet at least a common threshold of challenge conditions across evaluations, scheduling
evaluations to minimize the amount of variability in ambient test conditions across FSs, and
statistically controlling for any remaining variability in ambient test conditions.
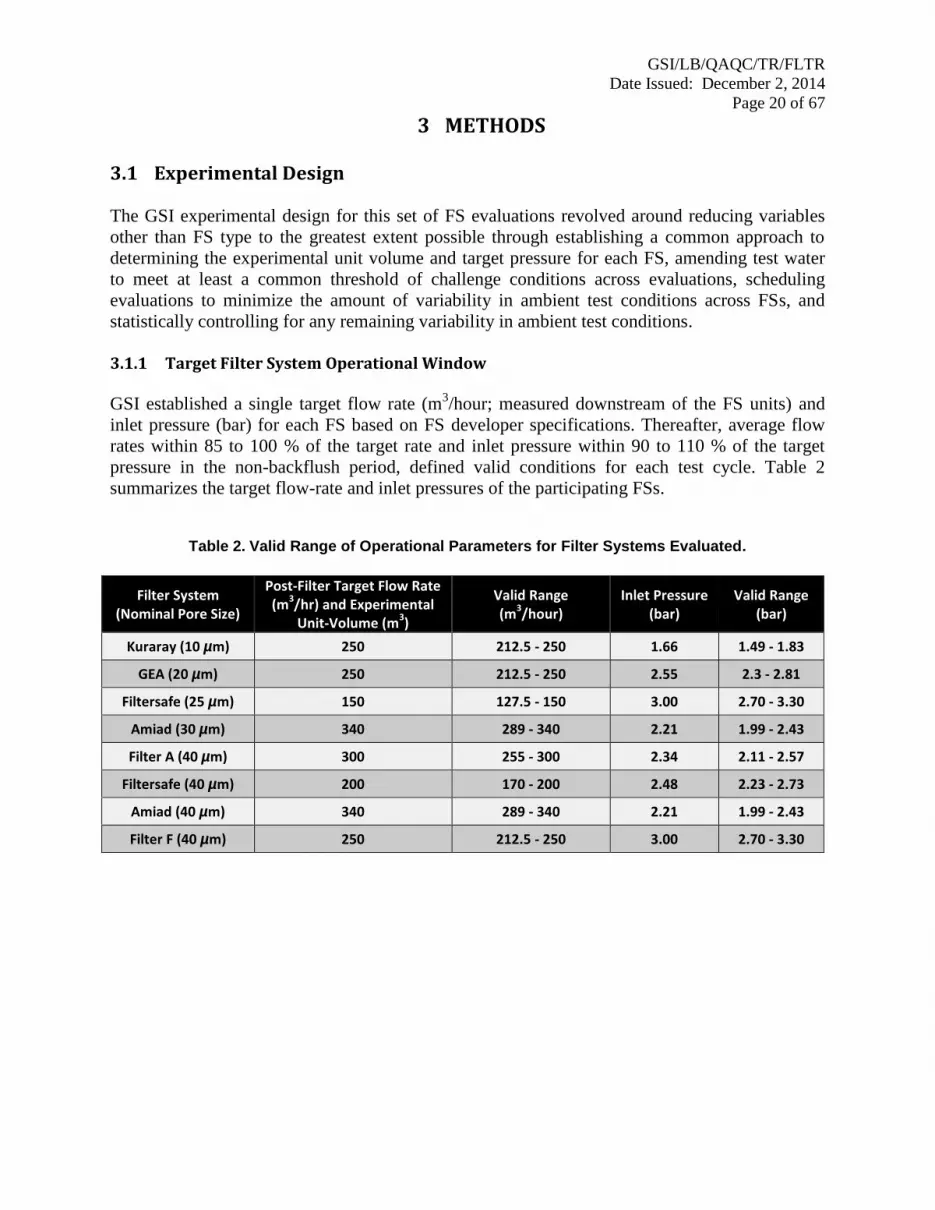
3.1.1 Target Filter System Operational Window
GSI established a single target flow rate (m3/hour; measured downstream of the FS units) and
inlet pressure (bar) for each FS based on FS developer specifications. Thereafter, average flow
rates within 85 to 100 % of the target rate and inlet pressure within 90 to 110 % of the target
pressure in the non-backflush period, defined valid conditions for each test cycle. Table 2
summarizes the target flow-rate and inlet pressures of the participating FSs.
Table 2. Valid Range of Operational Parameters for Filter Systems Evaluated.
Filter System (Nominal Pore Size)
Post-Filter Target Flow Rate (m
3/hr) and Experimental Unit-Volume (m
3)
Valid Range (m
3/hour)
Inlet Pressure (bar)
Valid Range (bar)
Kuraray (10 µm) 250 212.5 - 250 1.66 1.49 - 1.83
GEA (20 µm) 250 212.5 - 250 2.55 2.3 - 2.81
Filtersafe (25 µm) 150 127.5 - 150 3.00 2.70 - 3.30
Amiad (30 µm) 340 289 - 340 2.21 1.99 - 2.43
Filter A (40 µm) 300 255 - 300 2.34 2.11 - 2.57
Filtersafe (40 µm) 200 170 - 200 2.48 2.23 - 2.73
Amiad (40 µm) 340 289 - 340 2.21 1.99 - 2.43
Filter F (40 µm) 250 212.5 - 250 3.00 2.70 - 3.30
GSI/LB/QAQC/TR/FLTR
Date Issued: December 2, 2014
Page 21 of 67
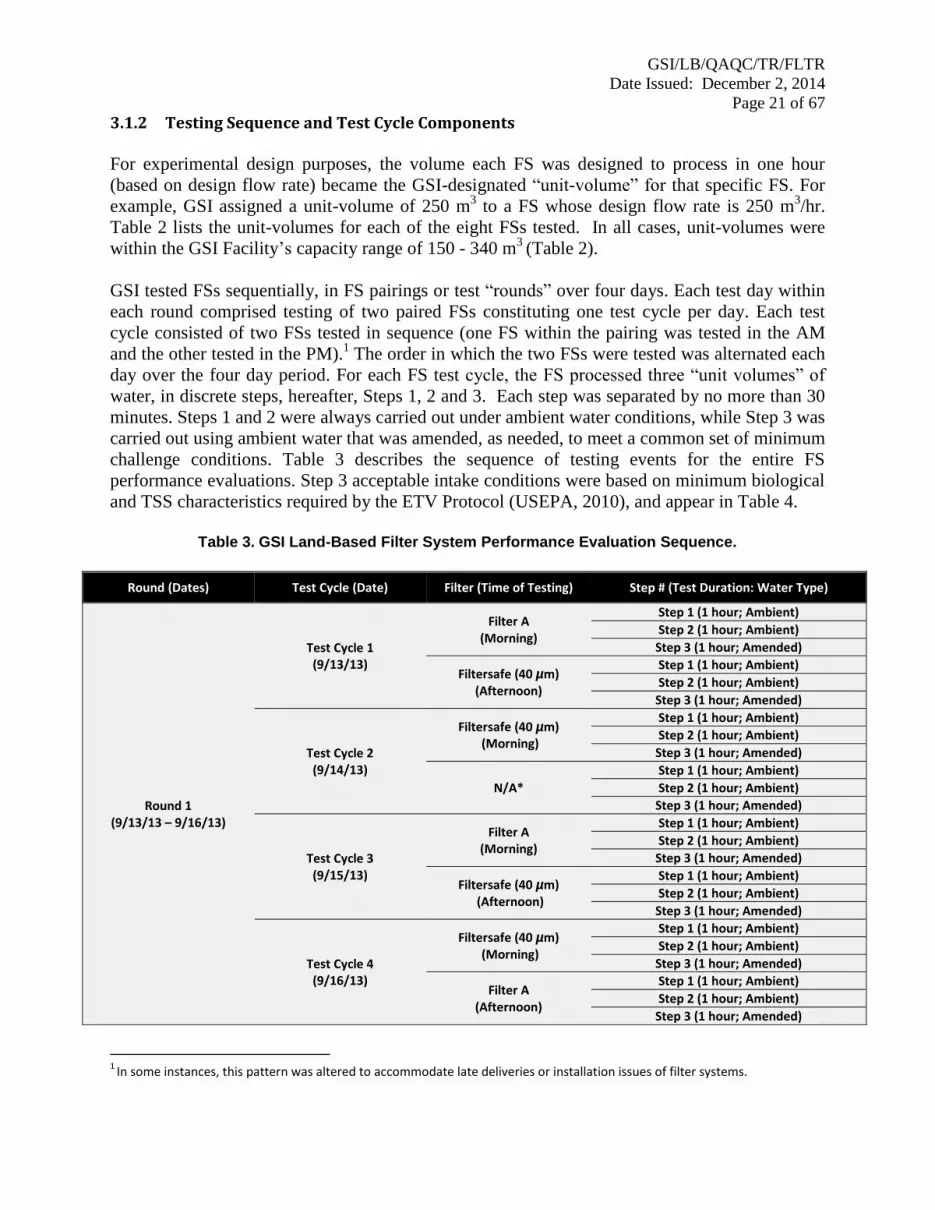
3.1.2 Testing Sequence and Test Cycle Components
For experimental design purposes, the volume each FS was designed to process in one hour
(based on design flow rate) became the GSI-designated “unit-volume” for that specific FS. For
example, GSI assigned a unit-volume of 250 m3 to a FS whose design flow rate is 250 m
3/hr.
Table 2 lists the unit-volumes for each of the eight FSs tested. In all cases, unit-volumes were
within the GSI Facility’s capacity range of 150 - 340 m3
(Table 2).
GSI tested FSs sequentially, in FS pairings or test “rounds” over four days. Each test day within
each round comprised testing of two paired FSs constituting one test cycle per day. Each test
cycle consisted of two FSs tested in sequence (one FS within the pairing was tested in the AM
and the other tested in the PM).1 The order in which the two FSs were tested was alternated each
day over the four day period. For each FS test cycle, the FS processed three “unit volumes” of
water, in discrete steps, hereafter, Steps 1, 2 and 3. Each step was separated by no more than 30
minutes. Steps 1 and 2 were always carried out under ambient water conditions, while Step 3 was
carried out using ambient water that was amended, as needed, to meet a common set of minimum
challenge conditions. Table 3 describes the sequence of testing events for the entire FS
performance evaluations. Step 3 acceptable intake conditions were based on minimum biological
and TSS characteristics required by the ETV Protocol (USEPA, 2010), and appear in Table 4.
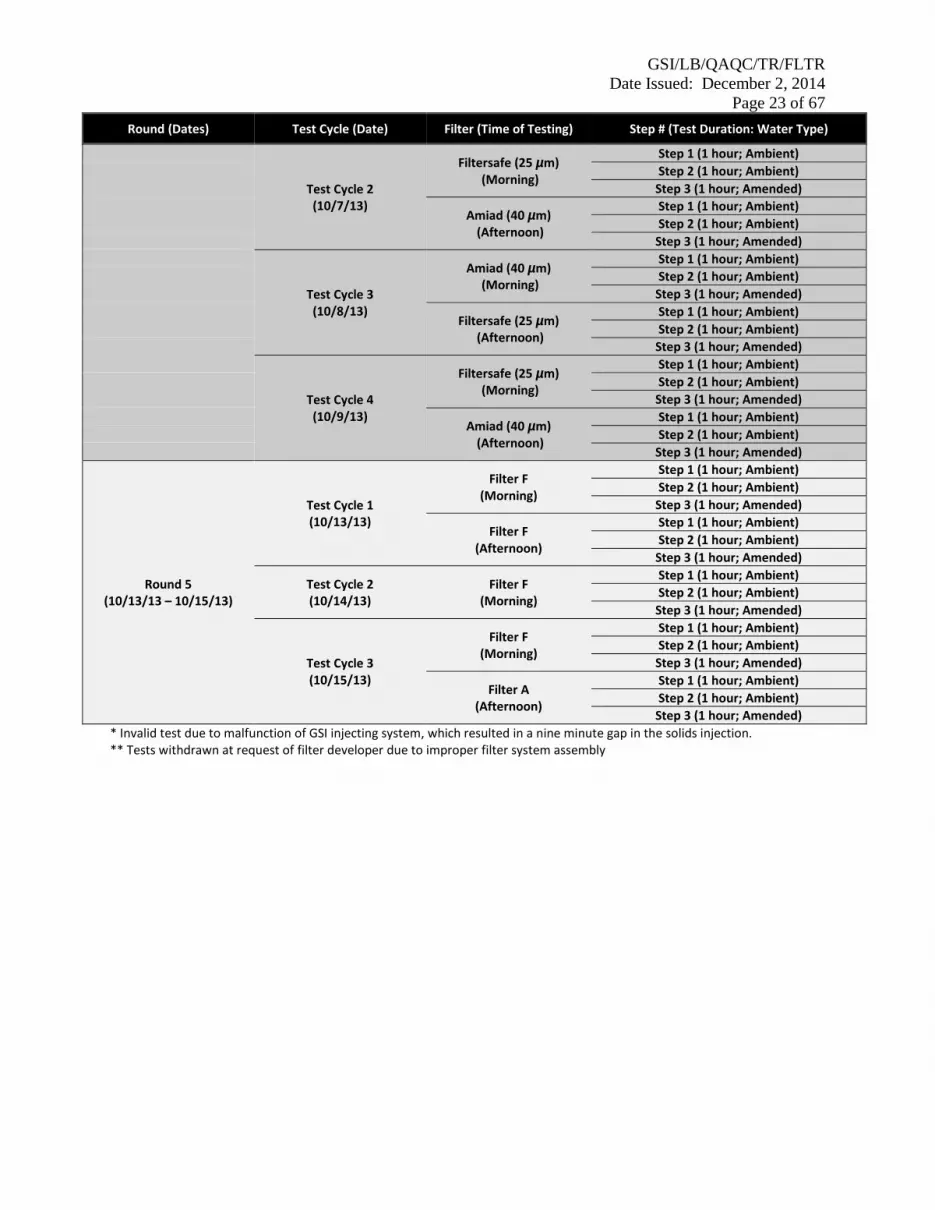
Table 3. GSI Land-Based Filter System Performance Evaluation Sequence.
Round (Dates) Test Cycle (Date) Filter (Time of Testing) Step # (Test Duration: Water Type)
Round 1 (9/13/13 – 9/16/13)
Test Cycle 1 (9/13/13)
Filter A (Morning)
Step 1 (1 hour; Ambient)
Step 2 (1 hour; Ambient)
Step 3 (1 hour; Amended)
Filtersafe (40 µm) (Afternoon)
Step 1 (1 hour; Ambient)
Step 2 (1 hour; Ambient)
Step 3 (1 hour; Amended)
Test Cycle 2 (9/14/13)
Filtersafe (40 µm) (Morning)
Step 1 (1 hour; Ambient)
Step 2 (1 hour; Ambient)
Step 3 (1 hour; Amended)
N/A*
Step 1 (1 hour; Ambient)
Step 2 (1 hour; Ambient)
Step 3 (1 hour; Amended)
Test Cycle 3 (9/15/13)
Filter A (Morning)
Step 1 (1 hour; Ambient)
Step 2 (1 hour; Ambient)
Step 3 (1 hour; Amended)
Filtersafe (40 µm) (Afternoon)
Step 1 (1 hour; Ambient)
Step 2 (1 hour; Ambient)
Step 3 (1 hour; Amended)
Test Cycle 4 (9/16/13)
Filtersafe (40 µm) (Morning)
Step 1 (1 hour; Ambient)
Step 2 (1 hour; Ambient)
Step 3 (1 hour; Amended)
Filter A (Afternoon)
Step 1 (1 hour; Ambient)
Step 2 (1 hour; Ambient)
Step 3 (1 hour; Amended)
1
In some instances, this pattern was altered to accommodate late deliveries or installation issues of filter systems.

GSI/LB/QAQC/TR/FLTR
Date Issued: December 2, 2014
Page 22 of 67
Round (Dates) Test Cycle (Date) Filter (Time of Testing) Step # (Test Duration: Water Type)
Round 2 (9/21/13 – 9/24/13)
Test Cycle 1 (9/21/13)
GEA (20 µm) (Morning)
Step 1 (1 hour; Ambient)
Step 2 (1 hour; Ambient)
Step 3 (1 hour; Amended)
N/A**
Step 1 (1 hour; Ambient)
Step 2 (1 hour; Ambient)
Step 3 (1 hour; Amended)
Test Cycle 2 (9/22/13)
N/A**
Step 1 (1 hour; Ambient)
Step 2 (1 hour; Ambient)
Step 3 (1 hour; Amended)
GEA (20 µm) (Afternoon)
Step 1 (1 hour; Ambient)
Step 2 (1 hour; Ambient)
Step 3 (1 hour; Amended)
Test Cycle 3 (9/23/13)
GEA (20 µm) (Morning)
Step 1 (1 hour; Ambient)
Step 2 (1 hour; Ambient)
Step 3 (1 hour; Amended)
N/A**
Step 1 (1 hour; Ambient)
Step 2 (1 hour; Ambient)
Step 3 (1 hour; Amended)
Test Cycle 4 (9/24/13)
N/A**
Step 1 (1 hour; Ambient)
Step 2 (1 hour; Ambient)
Step 3 (1 hour; Amended)
GEA (20 µm) (Afternoon)
Step 1 (1 hour; Ambient)
Step 2 (1 hour; Ambient)
Step 3 (1 hour; Amended)
Round 3 (9/29/13 – 10/2/13)
Test Cycle 1 (9/29/13)
Kuraray (10 µm) (Morning)
Step 1 (1 hour; Ambient)
Step 2 (1 hour; Ambient)
Step 3 (1 hour; Amended)
Amiad (30 µm) (Afternoon)
Step 1 (1 hour; Ambient)
Step 2 (1 hour; Ambient)
Step 3 (1 hour; Amended)
Test Cycle 2 (9/30/13)
Amiad (30 µm) (Morning)
Step 1 (1 hour; Ambient)
Step 2 (1 hour; Ambient)
Step 3 (1 hour; Amended)
Kuraray (10 µm) (Afternoon)
Step 1 (1 hour; Ambient)
Step 2 (1 hour; Ambient)
Step 3 (1 hour; Amended)
Test Cycle 3 (10/1/13)
Kuraray (10 µm) (Morning)
Step 1 (1 hour; Ambient)
Step 2 (1 hour; Ambient)
Step 3 (1 hour; Amended)
Amiad (30 µm) (Afternoon)
Step 1 (1 hour; Ambient)
Step 2 (1 hour; Ambient)
Step 3 (1 hour; Amended)
Test Cycle 4 (10/2/13)
Amiad (30 µm) (Morning)
Step 1 (1 hour; Ambient)
Step 2 (1 hour; Ambient)
Step 3 (1 hour; Amended)
Kuraray (10 µm) (Afternoon)
Step 1 (1 hour; Ambient)
Step 2 (1 hour; Ambient)
Step 3 (1 hour; Amended)
Round 4 (10/6/13 – 10/9/13)
Test Cycle 1 (10/6/13)
Amiad (40 µm) (Morning)
Step 1 (1 hour; Ambient)
Step 2 (1 hour; Ambient)
Step 3 (1 hour; Amended)
Filtersafe (25 µm) (Afternoon)
Step 1 (1 hour; Ambient)
Step 2 (1 hour; Ambient)
Step 3 (1 hour; Amended)
GSI/LB/QAQC/TR/FLTR
Date Issued: December 2, 2014
Page 23 of 67
Round (Dates) Test Cycle (Date) Filter (Time of Testing) Step # (Test Duration: Water Type)
Test Cycle 2 (10/7/13)
Filtersafe (25 µm) (Morning)
Step 1 (1 hour; Ambient)
Step 2 (1 hour; Ambient)
Step 3 (1 hour; Amended)
Amiad (40 µm) (Afternoon)
Step 1 (1 hour; Ambient)
Step 2 (1 hour; Ambient)
Step 3 (1 hour; Amended)
Test Cycle 3 (10/8/13)
Amiad (40 µm) (Morning)
Step 1 (1 hour; Ambient)
Step 2 (1 hour; Ambient)
Step 3 (1 hour; Amended)
Filtersafe (25 µm) (Afternoon)
Step 1 (1 hour; Ambient)
Step 2 (1 hour; Ambient)
Step 3 (1 hour; Amended)
Test Cycle 4 (10/9/13)
Filtersafe (25 µm) (Morning)
Step 1 (1 hour; Ambient)
Step 2 (1 hour; Ambient)
Step 3 (1 hour; Amended)
Amiad (40 µm) (Afternoon)
Step 1 (1 hour; Ambient)
Step 2 (1 hour; Ambient)
Step 3 (1 hour; Amended)
Round 5 (10/13/13 – 10/15/13)
Test Cycle 1 (10/13/13)
Filter F (Morning)
Step 1 (1 hour; Ambient)
Step 2 (1 hour; Ambient)
Step 3 (1 hour; Amended)
Filter F (Afternoon)
Step 1 (1 hour; Ambient)
Step 2 (1 hour; Ambient)
Step 3 (1 hour; Amended)
Test Cycle 2 (10/14/13)
Filter F (Morning)
Step 1 (1 hour; Ambient)
Step 2 (1 hour; Ambient)
Step 3 (1 hour; Amended)
Test Cycle 3 (10/15/13)
Filter F (Morning)
Step 1 (1 hour; Ambient)
Step 2 (1 hour; Ambient)
Step 3 (1 hour; Amended)
Filter A (Afternoon)
Step 1 (1 hour; Ambient)
Step 2 (1 hour; Ambient)
Step 3 (1 hour; Amended)
* Invalid test due to malfunction of GSI injecting system, which resulted in a nine minute gap in the solids injection. ** Tests withdrawn at request of filter developer due to improper filter system assembly
GSI/LB/QAQC/TR/FLTR
Date Issued: December 2, 2014
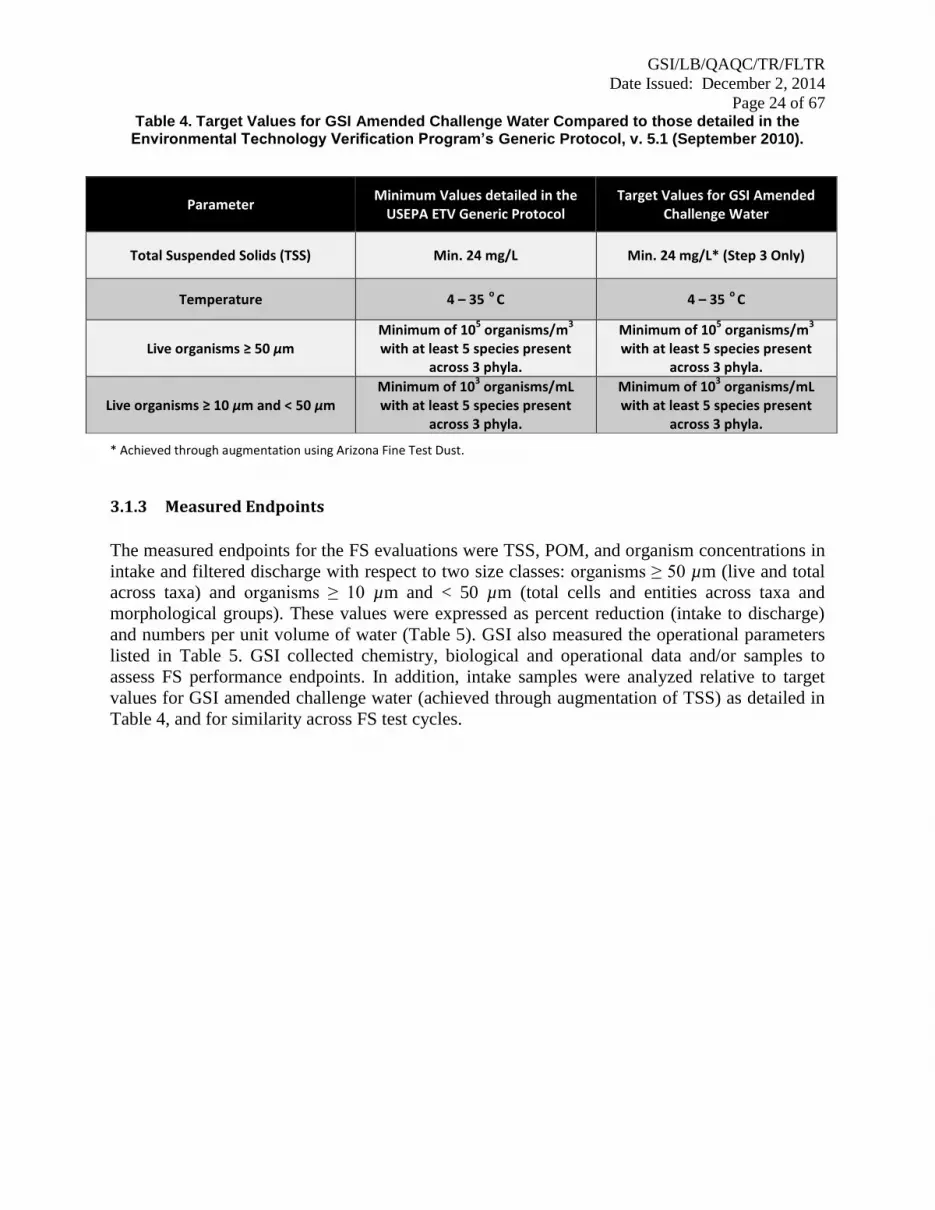
Page 24 of 67 Table 4. Target Values for GSI Amended Challenge Water Compared to those detailed in the
Environmental Technology Verification Program’s Generic Protocol, v. 5.1 (September 2010).
* Achieved through augmentation using Arizona Fine Test Dust.
3.1.3 Measured Endpoints
The measured endpoints for the FS evaluations were TSS, POM, and organism concentrations in
intake and filtered discharge with respect to two size classes: organisms ≥ 50 µm (live and total
across taxa) and organisms ≥ 10 µm and < 50 µm (total cells and entities across taxa and
morphological groups). These values were expressed as percent reduction (intake to discharge)
and numbers per unit volume of water (Table 5). GSI also measured the operational parameters
listed in Table 5. GSI collected chemistry, biological and operational data and/or samples to
assess FS performance endpoints. In addition, intake samples were analyzed relative to target
values for GSI amended challenge water (achieved through augmentation of TSS) as detailed in
Table 4, and for similarity across FS test cycles.
Parameter Minimum Values detailed in the
USEPA ETV Generic Protocol Target Values for GSI Amended
Challenge Water
Total Suspended Solids (TSS) Min. 24 mg/L Min. 24 mg/L* (Step 3 Only)
Temperature 4 – 35 o
C 4 – 35 o
C
Live organisms ≥ 50 µm Minimum of 10
5 organisms/m
3
with at least 5 species present across 3 phyla.
Minimum of 105 organisms/m
3
with at least 5 species present across 3 phyla.
Live organisms ≥ 10 µm and < 50 µm Minimum of 10
3 organisms/mL
with at least 5 species present across 3 phyla.
Minimum of 103 organisms/mL
with at least 5 species present across 3 phyla.
GSI/LB/QAQC/TR/FLTR
Date Issued: December 2, 2014
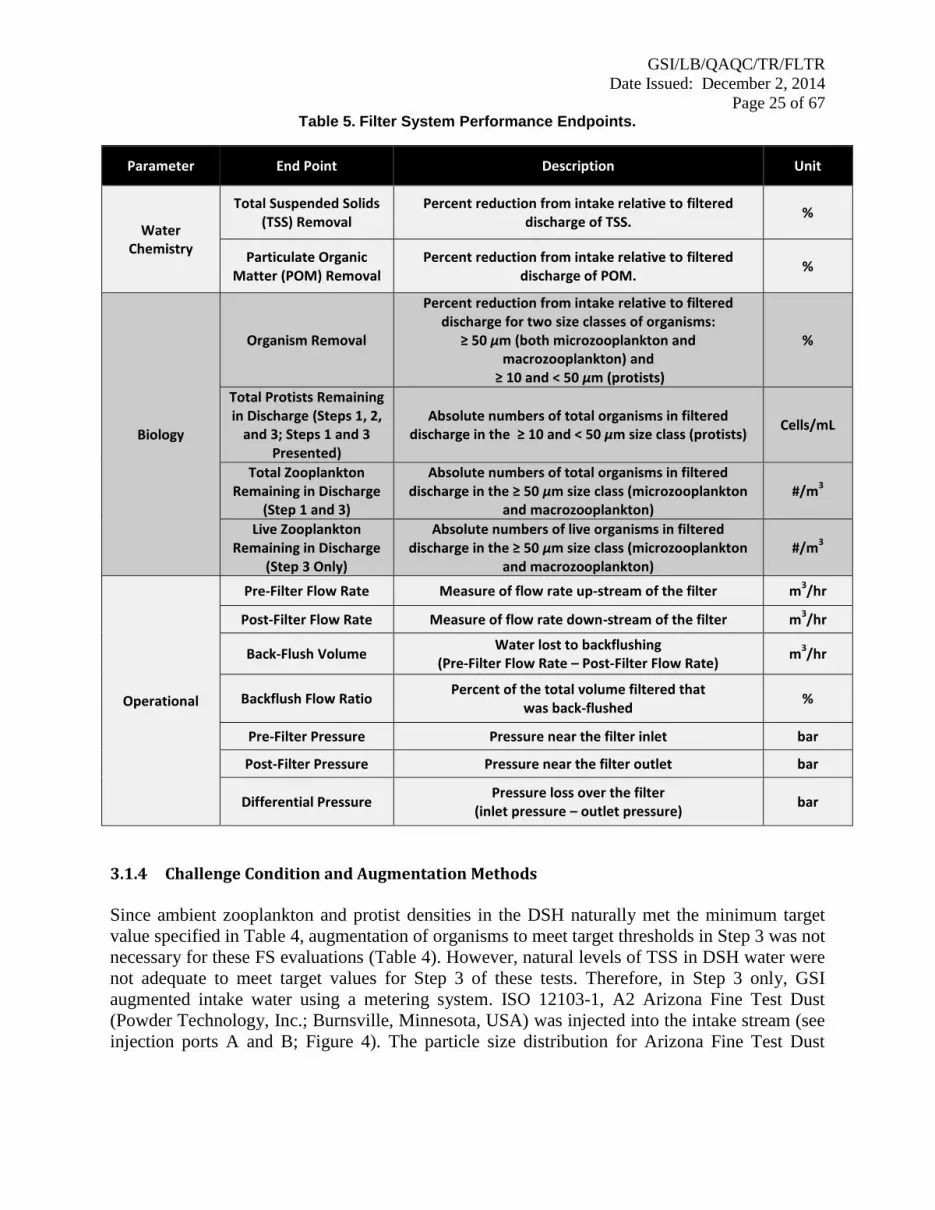
Page 25 of 67 Table 5. Filter System Performance Endpoints.
Parameter End Point Description Unit
Water Chemistry
Total Suspended Solids (TSS) Removal
Percent reduction from intake relative to filtered discharge of TSS.
%
Particulate Organic Matter (POM) Removal
Percent reduction from intake relative to filtered discharge of POM.
%
Biology
Organism Removal
Percent reduction from intake relative to filtered discharge for two size classes of organisms:
≥ 50 µm (both microzooplankton and macrozooplankton) and
≥ 10 and < 50 µm (protists)
%
Total Protists Remaining in Discharge (Steps 1, 2,
and 3; Steps 1 and 3 Presented)
Absolute numbers of total organisms in filtered discharge in the ≥ 10 and < 50 µm size class (protists)
Cells/mL
Total Zooplankton Remaining in Discharge
(Step 1 and 3)
Absolute numbers of total organisms in filtered discharge in the ≥ 50 µm size class (microzooplankton
and macrozooplankton) #/m
3
Live Zooplankton Remaining in Discharge
(Step 3 Only)
Absolute numbers of live organisms in filtered discharge in the ≥ 50 µm size class (microzooplankton
and macrozooplankton) #/m
3
Operational
Pre-Filter Flow Rate Measure of flow rate up-stream of the filter m3/hr
Post-Filter Flow Rate Measure of flow rate down-stream of the filter m3/hr
Back-Flush Volume Water lost to backflushing
(Pre-Filter Flow Rate – Post-Filter Flow Rate) m
3/hr
Backflush Flow Ratio Percent of the total volume filtered that
was back-flushed %
Pre-Filter Pressure Pressure near the filter inlet bar
Post-Filter Pressure Pressure near the filter outlet bar
Differential Pressure Pressure loss over the filter
(inlet pressure – outlet pressure) bar
3.1.4 Challenge Condition and Augmentation Methods
Since ambient zooplankton and protist densities in the DSH naturally met the minimum target
value specified in Table 4, augmentation of organisms to meet target thresholds in Step 3 was not
necessary for these FS evaluations (Table 4). However, natural levels of TSS in DSH water were
not adequate to meet target values for Step 3 of these tests. Therefore, in Step 3 only, GSI
augmented intake water using a metering system. ISO 12103-1, A2 Arizona Fine Test Dust
(Powder Technology, Inc.; Burnsville, Minnesota, USA) was injected into the intake stream (see
injection ports A and B; Figure 4). The particle size distribution for Arizona Fine Test Dust
GSI/LB/QAQC/TR/FLTR
Date Issued: December 2, 2014
Page 26 of 67
ranges from 0.97 µm to 124.50 µm, with ~ 88.7 % less than 40.00 µm2. The specific injection
procedure is detailed in GSI/SOP/LB/G/O/5 – Procedure for Injecting Organisms and Solids into
the GSI Land-Based RDTE Facility. To summarize, DSH water chemistry was monitored twice
daily (once prior to starting each test cycle) by GSI personnel allowing for close approximation
of the ambient TSS values. The weight of Fine Test Dust to be used in the Solids Injection
System (SIS) tank was determined based on the approximate ambient DSH concentrations and
desired intake concentration of ETV target levels (i.e., ≥ 24mg/L TSS; Table 4). The Fine Test
Dust was sterilized at LSRI prior to injection. Following, the SIS tank was filled with DSH water
and Fine Test Dust was poured into the SIS tank slowly to prevent clumping. The solids were
then mixed for a minimum of 20 minutes prior to the start of the sampling operation. The
contents of the SIS tank were injected into the intake water for the entire duration of the Step 3
sampling operation at a constant rate using a peristaltic pump located at Injection Point A
(Figure 4).
3.2 Filter System Installation and Commissioning Methods
Installation of the FSs took place in accordance with the documentation provided by the FS
developers, including plumbing the units into the GSI Facility using temporary schedule 80 PVC
and flexible hose for backflush lines, wiring required power connections to the facility,
connecting the FSs to facility air, and installing the FSs backflush signal cable. Installation
procedures and deviations from commissioning procedures were documented and reported by the
GSI Engineers. Once installation was complete, GSI Engineers conducted several installation
commissioning tests which required: passing a pressure test of 3.4 bar (49 psi), completing all FS
developer specified commissioning checks, and passing backflush signal tests. Figure 5 provides
a schematic of the GSI Facility’s piping layout relevant to the installation of the eight FSs.
The following connections were made available to the FS developers at the GSI Facility:
8 inch, 150 lb. ANSI flanges for inlet and outlet (ID 22.2 cm);
Local filtrate holding tank that could be plumbed to the FS backflush outlet;
100 Amp, 480 Volt, 3 Phase;
Compressed air up to 80 psi (FS developers provided regulators);
4-20 mA inputs for GSI to record analogue data output by the FS (upon FS developer
request); and
Filter backflush signal (other discrete inputs were also available if requested).
After installation, FSs that arrived on schedule were offered a two phase optional performance
commissioning trial. The optional trial was intended to help FS developers gather operational
data, including FS response to GSI challenge conditions and/or to identify the preferred flow rate
to declare for the tests. GSI required all FSs to participate in a third commissioning phase to
assure sufficient FS functionality to protect the GSI Facility assets. Each commissioning trial
phase is summarized in Table 6. FS developers whose FSs received Phase 1 and 2
2Determined using linear interpolation based on the data provided in the following link:
http://www.powdertechnologyinc.com/product/iso-12103-1-a2-fine-test-dust/

GSI/LB/QAQC/TR/FLTR
Date Issued: December 2, 2014
Page 27 of 67
commissioning trials had the option of including their data in Appendix 1 of this report to allow
for further explanation of FS performance in the context of these tests.
Figure 5. GSI Land-Based RDTE Facility Piping Diagram for FS Evaluation (Excluding Unused Portions of the Facility and Seep Samplers).

GSI/LB/QAQC/TR/FLTR
Date Issued: December 2, 2014
Page 28 of 67 Table 6. Phases of Filter System Commissioning Trials.
Phase 1 (Elective) Phase 2 (Elective) Phase 3 (Required)
Duration 0 - 4 hrs of flowing water.
Pauses in flow do not count against duration.
Time used to process a maximum 500 m
3 of water.
Minimum of 20 minutes and three consecutive (3) back
flushes with no performance degradation.
Inlet Pressure
At the discretion of the Filter System (FS) developer
At the discretion of the FS developer
Inlet pressure specified by FS Developer. Pressure specified
here was used for the remainder of testing
Flow Rate At the discretion of the FS
developer. At the discretion of the FS
developer
Flow rate specified by FS developer. Flow Rate specified
here was used for the remainder of testing.
Water Quality
Ambient Duluth-Superior Harbor (DSH) water quality augmented
with up to 10 mg/L total suspended solids (TSS) at the FS
developer’s request
Ambient DSH water quality augmented to USEPA ETV levels
of TSS and protist densities
Ambient DSH water quality augmented to USEPA ETV levels
of TSS and protist densities.
3.3 Collection of Samples and Measurements
Water for evaluation of FS biological performance was sampled continuously throughout each of
the three steps of each test cycle at pre- and post-FS SPs. Pre-FS sampling took place at SP#3
and immediate post-FS sampling at SP#10 (Figure 4). GSI collected water chemistry samples at
SP#15 (Figure 4). Table 7 summarizes the number and volume of operational, water chemistry,
and biological samples collected pre- and post-FS, respectively, during Steps 1, 2 and 3 of each
test cycle. Table 8 details sample handling and storage requirements.
GSI/LB/QAQC/TR/FLTR
Date Issued: December 2, 2014
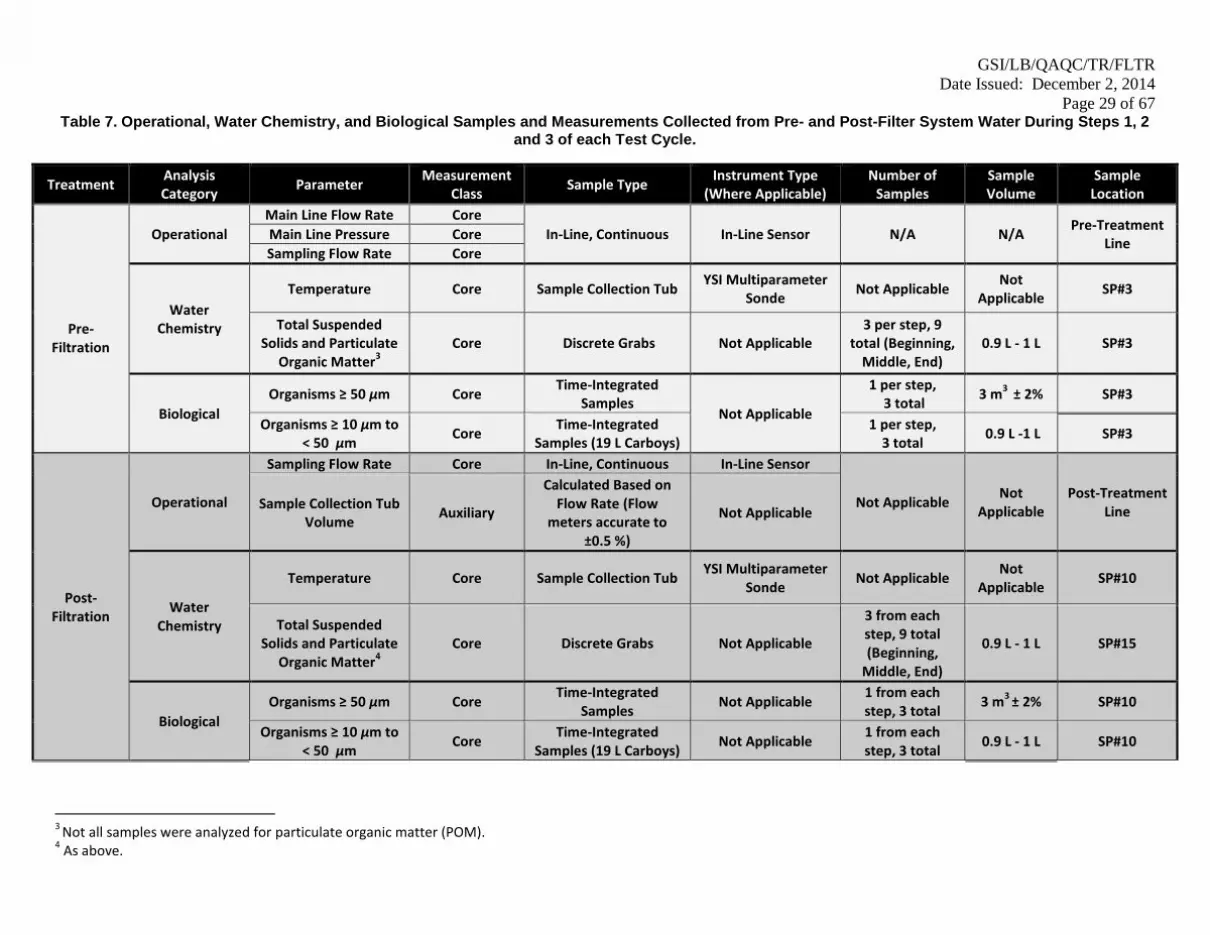
Page 29 of 67 Table 7. Operational, Water Chemistry, and Biological Samples and Measurements Collected from Pre- and Post-Filter System Water During Steps 1, 2
and 3 of each Test Cycle.
Treatment Analysis Category
Parameter Measurement
Class Sample Type
Instrument Type (Where Applicable)
Number of Samples
Sample Volume
Sample Location
Pre-
Filtration
Operational
Main Line Flow Rate Core
In-Line, Continuous In-Line Sensor N/A N/A Pre-Treatment
Line Main Line Pressure Core
Sampling Flow Rate Core
Water Chemistry
Temperature Core Sample Collection Tub YSI Multiparameter
Sonde Not Applicable
Not Applicable
SP#3
Total Suspended Solids and Particulate
Organic Matter3
Core Discrete Grabs Not Applicable 3 per step, 9
total (Beginning, Middle, End)
0.9 L - 1 L SP#3
Biological
Organisms ≥ 50 µm Core Time-Integrated
Samples Not Applicable
1 per step, 3 total
3 m3
± 2% SP#3
Organisms ≥ 10 µm to < 50 µm
Core Time-Integrated
Samples (19 L Carboys) 1 per step,
3 total 0.9 L -1 L SP#3
Post-Filtration
Operational
Sampling Flow Rate Core In-Line, Continuous In-Line Sensor
Not Applicable Not
Applicable Post-Treatment
Line Sample Collection Tub
Volume Auxiliary
Calculated Based on Flow Rate (Flow
meters accurate to ±0.5 %)
Not Applicable
Water Chemistry
Temperature Core Sample Collection Tub YSI Multiparameter
Sonde Not Applicable
Not Applicable
SP#10
Total Suspended Solids and Particulate
Organic Matter4
Core Discrete Grabs Not Applicable
3 from each step, 9 total (Beginning,
Middle, End)
0.9 L - 1 L SP#15
Biological
Organisms ≥ 50 µm Core Time-Integrated
Samples Not Applicable
1 from each step, 3 total
3 m3
± 2% SP#10
Organisms ≥ 10 µm to < 50 µm
Core Time-Integrated
Samples (19 L Carboys) Not Applicable
1 from each step, 3 total
0.9 L - 1 L SP#10
3
Not all samples were analyzed for particulate organic matter (POM). 4 As above.
GSI/LB/QAQC/TR/FLTR
Date Issued: November 12, 2014
Page 30 of 67
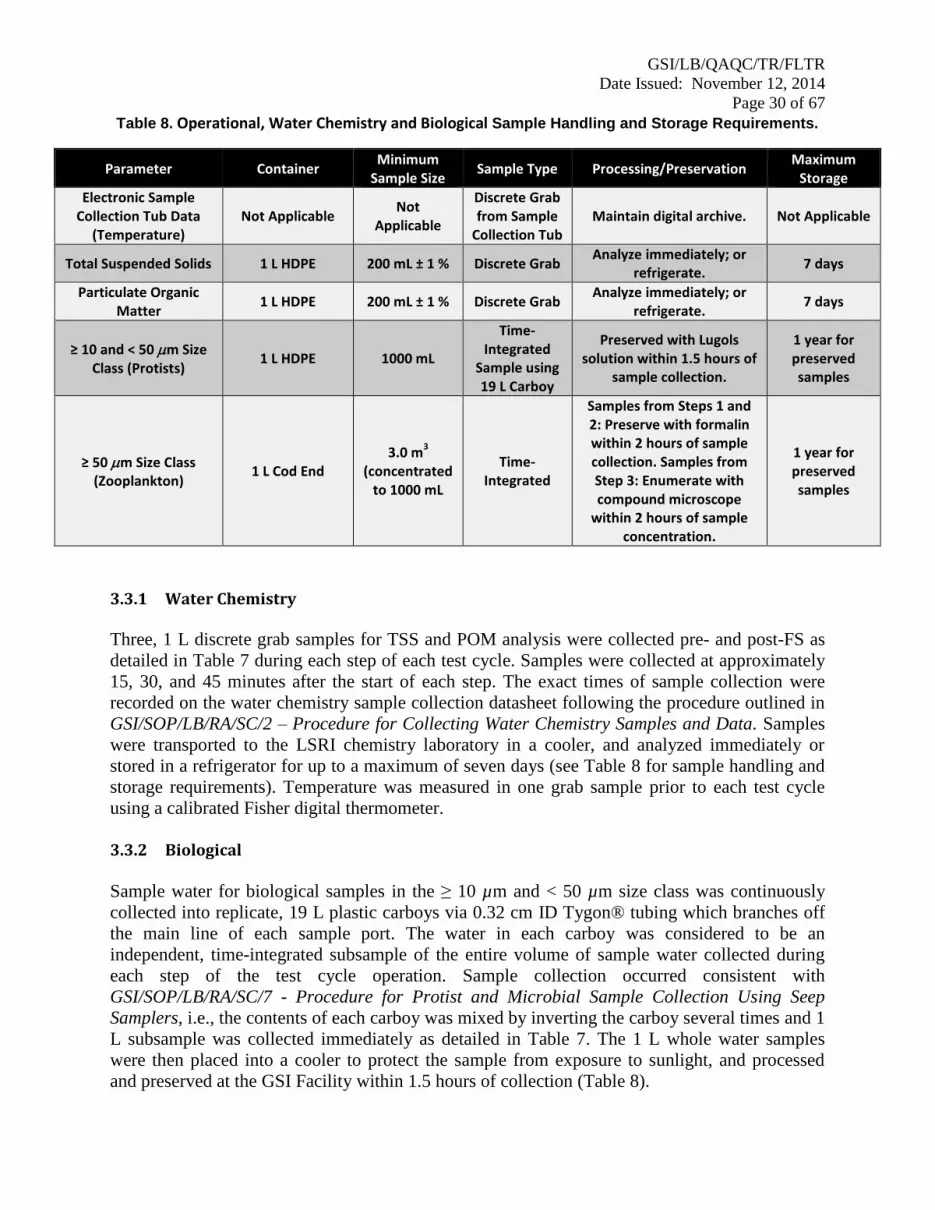
Table 8. Operational, Water Chemistry and Biological Sample Handling and Storage Requirements.
Parameter Container Minimum
Sample Size Sample Type Processing/Preservation
Maximum Storage
Electronic Sample Collection Tub Data
(Temperature) Not Applicable
Not Applicable
Discrete Grab from Sample
Collection Tub Maintain digital archive. Not Applicable
Total Suspended Solids 1 L HDPE 200 mL ± 1 % Discrete Grab Analyze immediately; or
refrigerate. 7 days
Particulate Organic Matter
1 L HDPE 200 mL ± 1 % Discrete Grab Analyze immediately; or
refrigerate. 7 days
≥ 10 and < 50 m Size Class (Protists)
1 L HDPE 1000 mL
Time-Integrated
Sample using 19 L Carboy
Preserved with Lugols solution within 1.5 hours of
sample collection.
1 year for preserved samples
≥ 50 m Size Class (Zooplankton)
1 L Cod End 3.0 m
3
(concentrated to 1000 mL
Time-Integrated
Samples from Steps 1 and 2: Preserve with formalin within 2 hours of sample collection. Samples from Step 3: Enumerate with compound microscope
within 2 hours of sample concentration.
1 year for preserved samples
3.3.1 Water Chemistry
Three, 1 L discrete grab samples for TSS and POM analysis were collected pre- and post-FS as
detailed in Table 7 during each step of each test cycle. Samples were collected at approximately
15, 30, and 45 minutes after the start of each step. The exact times of sample collection were
recorded on the water chemistry sample collection datasheet following the procedure outlined in
GSI/SOP/LB/RA/SC/2 – Procedure for Collecting Water Chemistry Samples and Data. Samples
were transported to the LSRI chemistry laboratory in a cooler, and analyzed immediately or
stored in a refrigerator for up to a maximum of seven days (see Table 8 for sample handling and
storage requirements). Temperature was measured in one grab sample prior to each test cycle
using a calibrated Fisher digital thermometer.
3.3.2 Biological
Sample water for biological samples in the ≥ 10 µm and < 50 µm size class was continuously
collected into replicate, 19 L plastic carboys via 0.32 cm ID Tygon® tubing which branches off
the main line of each sample port. The water in each carboy was considered to be an
independent, time-integrated subsample of the entire volume of sample water collected during
each step of the test cycle operation. Sample collection occurred consistent with
GSI/SOP/LB/RA/SC/7 - Procedure for Protist and Microbial Sample Collection Using Seep
Samplers, i.e., the contents of each carboy was mixed by inverting the carboy several times and 1
L subsample was collected immediately as detailed in Table 7. The 1 L whole water samples
were then placed into a cooler to protect the sample from exposure to sunlight, and processed
and preserved at the GSI Facility within 1.5 hours of collection (Table 8).

GSI/LB/QAQC/TR/FLTR
Date Issued: November 12, 2014
Page 31 of 67
Sample water for organisms in the ≥ 50 m size class was drawn by the relevant sample ports
and transferred simultaneously and continuously into replicate 3.8 m3
sample collection tubs via
clean 3.8 cm ID flexible hoses and automated flow-controlled pneumatic diaphragm valves. The
water in each sample collection tub was considered to be an independent, time-integrated sample
of the experimental water mass associated with each unit volume of flow. GSI has validated the
independence and equivalency of these sample ports and collection tub apparatus. Samples were
collected both pre-FS and post-FS for each step of the test cycle (Table 7). Sample processing
took place within two hours of collection and involved the entire contents of each sample
collection tub being drained and concentrated through a 35 µm mesh (50 µm diagonal
dimensions) plankton net into 1 L cod-ends as described in GSI/SOP/LB/RA/SC/6 - Procedure
for Zooplankton Sample Collection. Samples from Step 1 and Step 2 of each test cycle were
preserved with formalin for later enumeration of total organisms, while the samples from Step 3
were examined immediately for enumeration of live and total organisms and then preserved.
3.4 Sample and Measurement Analysis 3.4.1 Physical/Chemistry Measurements
TSS analysis was conducted according to GSI/SOP/BS/RA/C/8– Procedure for Analyzing Total
Suspended Solids (TSS), Particulate Organic Matter (POM), and Mineral Matter (MM).
Accurately measured sample volumes (± 1 %) were vacuum filtered through pre-washed, dried,
and pre-weighed glass fiber filters (i.e. Whatman 934-AH). After each sample was filtered it was
dried in an oven and brought to constant weight. TSS values were determined based on the
weight of particulates collected on the filter and the volume of water filtered. In addition, the
POM concentration was determined on some of the samples following Standard Method 2540 E
(American Public Health Association, 2012). The residue from the TSS analysis was ignited to a
constant weight at 550 °C in a muffle furnace. 3.4.2 Biological Samples
Sample analysis for organisms ≥ 10 µm to < 50 µm was performed on samples collected from
Steps 1, 2, and 3 that were preserved with Lugol’s solution within 1.5 hours of sample collection.
Prior to analysis, samples were concentrated through a 7 µm mesh plankton sieve and stored in a
25 mL sample container. This concentration step is estimated to result in 3 % - 8 % organism
loss based on analyses performed during GSI validation experiments. Sample analysis was
conducted according to GSI/SOP/MS/RA/SA/1 - Procedure for Protist Sample Analysis though
procedures involving staining with fluorescein diacetate (FDA) and epifluorescence microscopy
were not used. A 1.1 mL subsample from the concentrated slurry was transferred to a Sedgwick-
Rafter cell, covered and placed on the stage of a compound microscope that was set for
brightfield observation. At least two horizontal transects were analyzed (an area known to reflect
greater than 1 mL of original sample water), aiming for at least 100 entities (i.e., unicellular
organism, colony, or filament) counted. Records were kept of transect lengths and widths so that
the total counted area and volume analyzed could be calculated. Counting and measurement of
all other entities followed standard procedures for individuals (length and width), colonies (e.g.,
number of cells, cell length and width) and filaments (e.g., number of cells, cell length and width

GSI/LB/QAQC/TR/FLTR
Date Issued: November 12, 2014
Page 32 of 67
or total filament length if cells cannot be discerned). Unlike samples containing FDA, viable
cells were identified as those with cell contents; i.e., empty diatom frustules were not counted.
The remaining concentrated sample in the 25 mL bottle served as the sample archive.
Note that analysis of the ≥ 10 and < 50 µm size class of organisms for GSI varies from the ETV
Generic Protocol, v. 5.1 (USEPA, 2010) in two notable ways: (1) instead of concentrating a 1 m3
volume of water to 1 L for analysis, GSI protocols follow collection of a 1 L sample using a
time-integrated seep sampler; and (2) ETV protocols do not include analyses of preserved
samples. These deviations are necessary given the high densities of protists and other water
augmentations, such that there is no effective method to rapidly concentrate 1 m3 of water for
protist analysis without damaging the organisms or delaying analysis until die-off becomes a
possibility. Other variations from Generic Protocol, v. 5.1 (USEPA, 2010) include slight
variations in microscopy equipment, lack of vital staining (due to use of preserved samples) and
use of standard translucent HDPE bottles (kept in a cooler) for sampling instead of dark bottles,
but these variations are not expected to have an impact on results.
Analysis of samples for live and total organisms ≥ 50 µm in pre- and post-FS samples from Step
3 of each test cycle was conducted according to GSI/SOP/MS/RA/SA/2 - Procedure for
Zooplankton Sample Analysis, and took place within two hours of collecting, and concentrating
the individual samples. Microzooplankton (e.g., rotifers, copepod nauplii, and dreissenid
veligers) and macrozooplankton (e.g., copepods, cladocerans, and macroinvertebrates), all
generally greater than 50 µm in maximum dimension on the smallest axis, were analyzed
together in a Sedgewick Rafter counting chamber by examination under a compound microscope
at a magnification of 40X to 100X.
The preserved samples collected from Step 1 were analyzed at a later date to determine total
density of organisms passing through the FSs. Two replicate subsamples containing a minimum
of 200 organisms each were examined for each of the preserved samples. Intact organisms that
contained organic matter were identified and enumerated using a compound microscope. The
preserved samples collected from Steps 2 and 3 were set aside for later analysis, if required.
Taxa that were known to occasionally contain individuals below 50 µm in minimum dimension
were measured at this time.
3.4.3 Operational Measurements
Flow rates were recorded by magnetic flux flow meters. Pressure readings were also recorded
using pressure transducers at multiple points throughout the GSI Facility. However, FS D
differential pressure was monitored and calculated differently from the other FSs because this
specific FS had a built-in flow control valve located in a position that interfered with GSI
monitoring during normal testing. Instead, the FS D developer disabled the flow control for 10
minutes so GSI could measure differential pressure using the GSI pressure sensors.
GSI measured and recorded data on operational and maintenance parameters, including from all
the limit switches, positioners, pressure sensors, flow meters and level indicators, using the
facility’s PLC. A separate data logging computer recorded and saved data from all the limit
GSI/LB/QAQC/TR/FLTR
Date Issued: November 12, 2014
Page 33 of 67
switches, positioners, pressure sensors, flow meters and level indicators every five seconds for
the entire duration of each test cycle. This information was accessed by the facility’s HMI.
All operational data were exported to Microsoft Excel for subsequent analysis. GSI summarized
the data by providing averages and standard deviations for the parameters listed below.
Inlet pressure;
Outlet pressure;
Inlet flow; and
Outlet flow.
From these parameters differential pressure and flow lost to back flushing were calculated. GSI
summarized data for each step of each test cycle to evaluate FS operational performance and
consistency across test cycles. Data from each step was then averaged across test cycles and
divided so that augmented water and non-augmented water could be compared. GSI also
documented and reported any mechanical failures, required maintenance events and
modifications made to individual FSs during testing.
3.5 Data Processing, Storage, Verification and Validation
GSI personnel recorded sample collection and analysis data by hand (using indelible ink) on pre-
printed data collection forms and/or in bound laboratory notebooks that were uniquely-identified
and were specific to the GSI FS performance evaluations. The GSI Engineer recorded relevant
information and data generated from operation of the various FSs in a bound laboratory notebook
that was uniquely-identified (i.e., coded) and specific to the performance evaluations.
Completed data collection forms were secured in uniquely-identified three ring binders, specific
to the FS performance evaluations. Biological and water chemistry data that were recorded by
hand were manually entered into either a Microsoft Access Database that was designed,
developed, and is maintained by the GSI Database Manager, or the data were entered into a
Microsoft Excel spreadsheet.
A percentage of biological, chemical and physical data that was recorded by hand and entered
into Microsoft Access or Excel was verified against the original raw data by the GSI Senior
Quality Assurance/Quality Control (QAQC) Officer. This procedure also included verification of
the accuracy of computer-generated data through hand-calculation. The percentage of verified
raw data depended upon the amount of raw data that was generated, and ranged from 10 % to
100 % of the original raw data.
All electronic data files are stored on the LSRI’s secured Local Area Network (LAN) that can be
accessed only by relevant GSI personnel. The GSI Database Manager is the single point of
control for access to the LSRI LAN. The LSRI LAN is automatically backed up every 24 hours.
The electronic data files are also stored on the GSI’s internal SharePoint website
(greatshipsinitiative.net), which acts as a secondary data backup/storage mechanism. The GSI
Senior QAQC Officer is responsible for archiving and storing all original raw data applicable to
GSI/LB/QAQC/TR/FLTR
Date Issued: November 12, 2014
Page 34 of 67
the FS performance evaluations in a climate-controlled, secure archive room at the LSRI for a
period of seven years.
3.6 Statistical Analysis
As noted above, biological performance was characterized in terms of absolute organism
densities, i.e., total and/or live concentrations per unit volume, in discharge, and as percent
reduction of organisms:
Percent 𝑅𝑒𝑑𝑢𝑐𝑡𝑖𝑜𝑛 = [1 − (𝑃𝑜𝑠𝑡 𝐷𝑒𝑛𝑠𝑖𝑡𝑦
𝑃𝑟𝑒 𝐷𝑒𝑛𝑠𝑖𝑡𝑦)] × 100 %
Also as noted above, differential pressure and percent backflush flow ratio were the main
operational performance measures for Steps 1 and 3. Differential pressure was calculated as the
difference between the average measured pressure post-filter and the average measured pressure
pre-filter. The percent backflush flow was a measure of the percentage of intake (i.e., ballast)
flow lost to FS backflushing. It was defined using the following equation:
𝑃𝑒𝑟𝑐𝑒𝑛𝑡 𝐵𝑎𝑐𝑘𝑓𝑙𝑢𝑠ℎ 𝐹𝑙𝑜𝑤 = (𝐴𝑣𝑒𝑟𝑎𝑔𝑒 𝐵𝑎𝑐𝑘𝑓𝑙𝑢𝑠ℎ 𝐹𝑙𝑜𝑤 𝑅𝑎𝑡𝑒
𝐴𝑣𝑒𝑟𝑎𝑔𝑒 𝑃𝑟𝑒 𝐹𝑖𝑙𝑡𝑒𝑟 𝐹𝑙𝑜𝑤 𝑅𝑎𝑡𝑒) × 100 %
Solids (TSS and POM) removal performance was determined separately for TSS and POM in
Step 1 (ambient) and Step 3 (augmented). Percent solids removal of solids performance was
defined as the ratio of pre-filter and post-filter TSS concentration or POM concentration:
Percent 𝑆𝑜𝑙𝑖𝑑𝑠 𝑅𝑒𝑚𝑜𝑣𝑎𝑙 = [1 − (𝑃𝑜𝑠𝑡 𝐹𝑖𝑙𝑡𝑒𝑟 𝑇𝑆𝑆 𝑜𝑟 𝑃𝑂𝑀 𝐶𝑜𝑛𝑐𝑒𝑛𝑡𝑟𝑎𝑡𝑖𝑜𝑛
𝑃𝑟𝑒 𝐹𝑖𝑙𝑡𝑒𝑟 𝑇𝑆𝑆 𝑜𝑟 𝑃𝑂𝑀 𝐶𝑜𝑛𝑐𝑒𝑛𝑡𝑟𝑎𝑡𝑖𝑜𝑛)] × 100 %
Two levels of statistical analysis were applied to FS performance data to determine relationships
among operational and biological variables. The first was simple aggregation which involved
averaging repeated measurements across the eight test cycles for Step 1 and Step 3 values (per
FS) for each of the eight cases (i.e., FS units). The FS units were then ranked in terms of percent
removal of total organisms based on two categories of organisms, i.e., organisms ≥ 10 and < 50
µm (i.e., protists) and organisms ≥ 50 µm. The latter category was further analyzed in terms of
two size subcategories: microzooplankton, such as rotifers, copepod nauplii, and dreissenid
veligers; and macrozooplankton, such as copepods, cladocerans, and macroinvertebrates). Scatter
plots and estimated linear regressions were constructed and plotted (i.e., fitted) to determine if:
FS nominal pore size, differential pressure, or percent backflush flow were related to
percent reduction in organisms; and
FS differential pressure was related to percent backflush flow.
In the second and more complex statistical approach, we applied a multi-level or mixed model
analysis to the data. All eight test cycles for each FS were analyzed as individual cases, while
still accounting for the correlations associated with repeated measures within FS unit tests i.e. the
random effects statistical model.
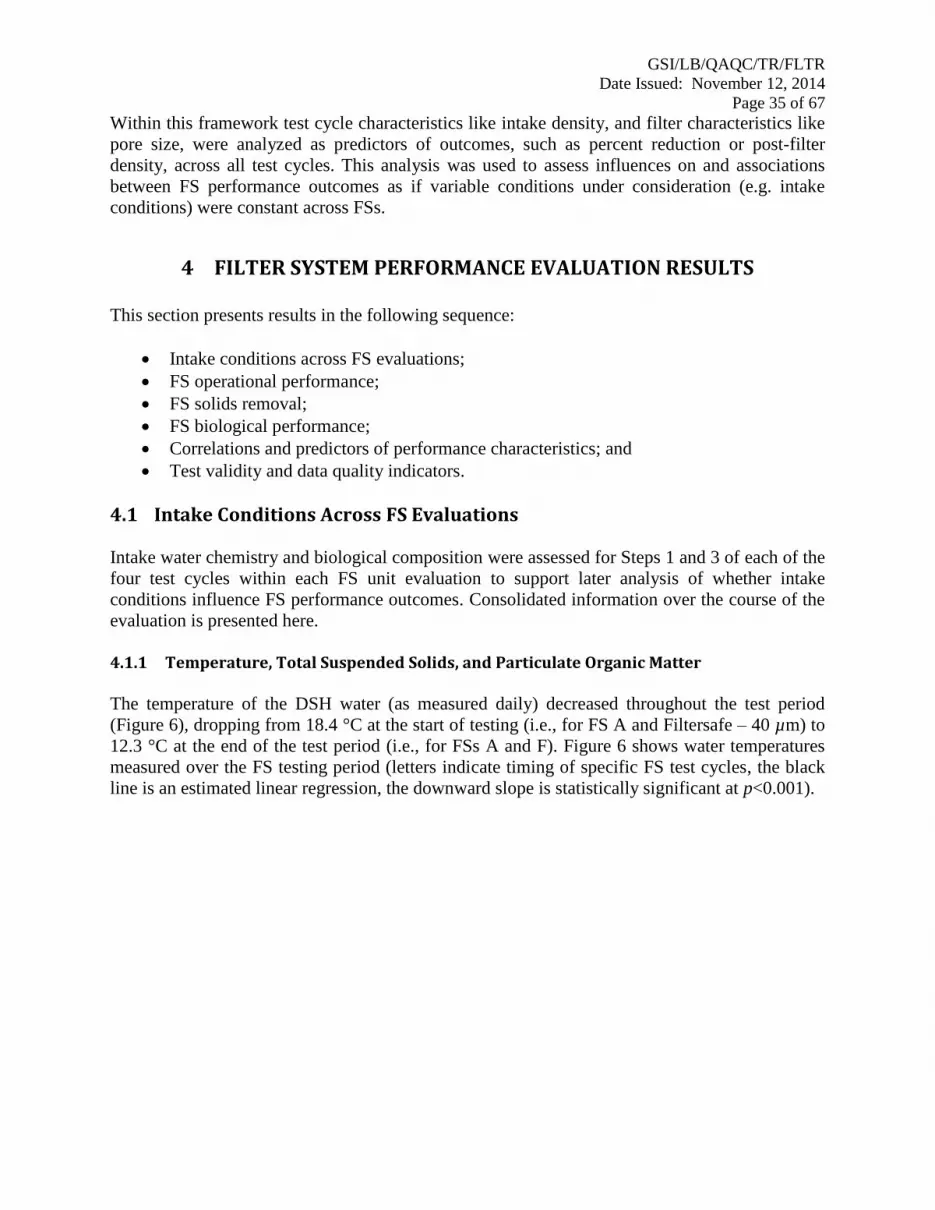
GSI/LB/QAQC/TR/FLTR
Date Issued: November 12, 2014
Page 35 of 67
Within this framework test cycle characteristics like intake density, and filter characteristics like
pore size, were analyzed as predictors of outcomes, such as percent reduction or post-filter
density, across all test cycles. This analysis was used to assess influences on and associations
between FS performance outcomes as if variable conditions under consideration (e.g. intake
conditions) were constant across FSs.
4 FILTER SYSTEM PERFORMANCE EVALUATION RESULTS
This section presents results in the following sequence:
Intake conditions across FS evaluations;
FS operational performance;
FS solids removal;
FS biological performance;
Correlations and predictors of performance characteristics; and
Test validity and data quality indicators.
4.1 Intake Conditions Across FS Evaluations
Intake water chemistry and biological composition were assessed for Steps 1 and 3 of each of the
four test cycles within each FS unit evaluation to support later analysis of whether intake
conditions influence FS performance outcomes. Consolidated information over the course of the
evaluation is presented here.
4.1.1 Temperature, Total Suspended Solids, and Particulate Organic Matter
The temperature of the DSH water (as measured daily) decreased throughout the test period
(Figure 6), dropping from 18.4 °C at the start of testing (i.e., for FS A and Filtersafe – 40 µm) to
12.3 °C at the end of the test period (i.e., for FSs A and F). Figure 6 shows water temperatures
measured over the FS testing period (letters indicate timing of specific FS test cycles, the black
line is an estimated linear regression, the downward slope is statistically significant at p<0.001).

GSI/LB/QAQC/TR/FLTR
Date Issued: November 12, 2014
Page 36 of 67
Figure 6. Daily Water Temperature of the Duluth Superior Harbor Measured Prior to the Start of
Step 1. Black line is estimated linear regression line indicating a statistically significant (p<0.001) downward trend.
Levels of TSS were fairly uniform on average across FS test cycles, with one notable exception.
Figure 7 shows the range of TSS measured in grab samples collected from pre-FS intake water.
The slopes of the fitted red (Step 3) and black (Step 1) linear trend lines in Figure 7 are not
statistically significant, indicating an absence of statistically significant change across FS unit
test cycles. The only significant difference (p<0.05) was between TSS levels across FSs in Step 1
vs. Step 3, due to the experimental manipulation (i.e., augmentation of the water) during Step 3.
Step 1 values, reflecting ambient TSS concentration in the DSH, ranged from 5.9 mg/L to
19.5 mg/L (Figure 7). Step 3 TSS values, reflecting ambient conditions augmented with Arizona
Fine Test Dust, ranged mostly from 16.4 mg/L to 33.2 mg/L. On one test day (i.e., 14 September
2013), TSS reached an average of 55.1 mg/L for FS A (data not presented) and 43.5 mg/L for
Filtersafe (40 µm) due to a GSI Facility error (Figure 7). The GSI team consulted with the FS
developers involved (i.e., developer of FS A and Filtersafe) as to whether they would like to
repeat the test cycles at a lower TSS, but both developers elected to keep the test cycle to test FS
A’s and the Filtersafe (40 µm)’s capacity to handle higher loads. However, on that same test day
there was also a nine minute gap in the solids injection during the test cycle with FS A.
Therefore, GSI deemed the test cycle with FS A invalid and repeated the test cycle in mid-
October. The GSI target minimum TSS level for Step 3 (horizontal green line in Figure 7) was
0 5 10 15 20 25 30
13
14
15
16
17
18
Day
Wa
ter
Te
mp
era
ture
(C
els
ius)
A
A
A
A
B
B
B
B
CC
C
C
DD
D
D
E
E
E E
F
F
F
F
G
G
G
G
HH
H
H
E = Kuraray (10 µm) D = GEA (20 µm) G = Filtersafe (25 µm) H = Amiad (30 µm) A = Filter A (40 µm) B = Filtersafe (40 µm) C = Amiad (40 µm) F = Filter F (40 µm)
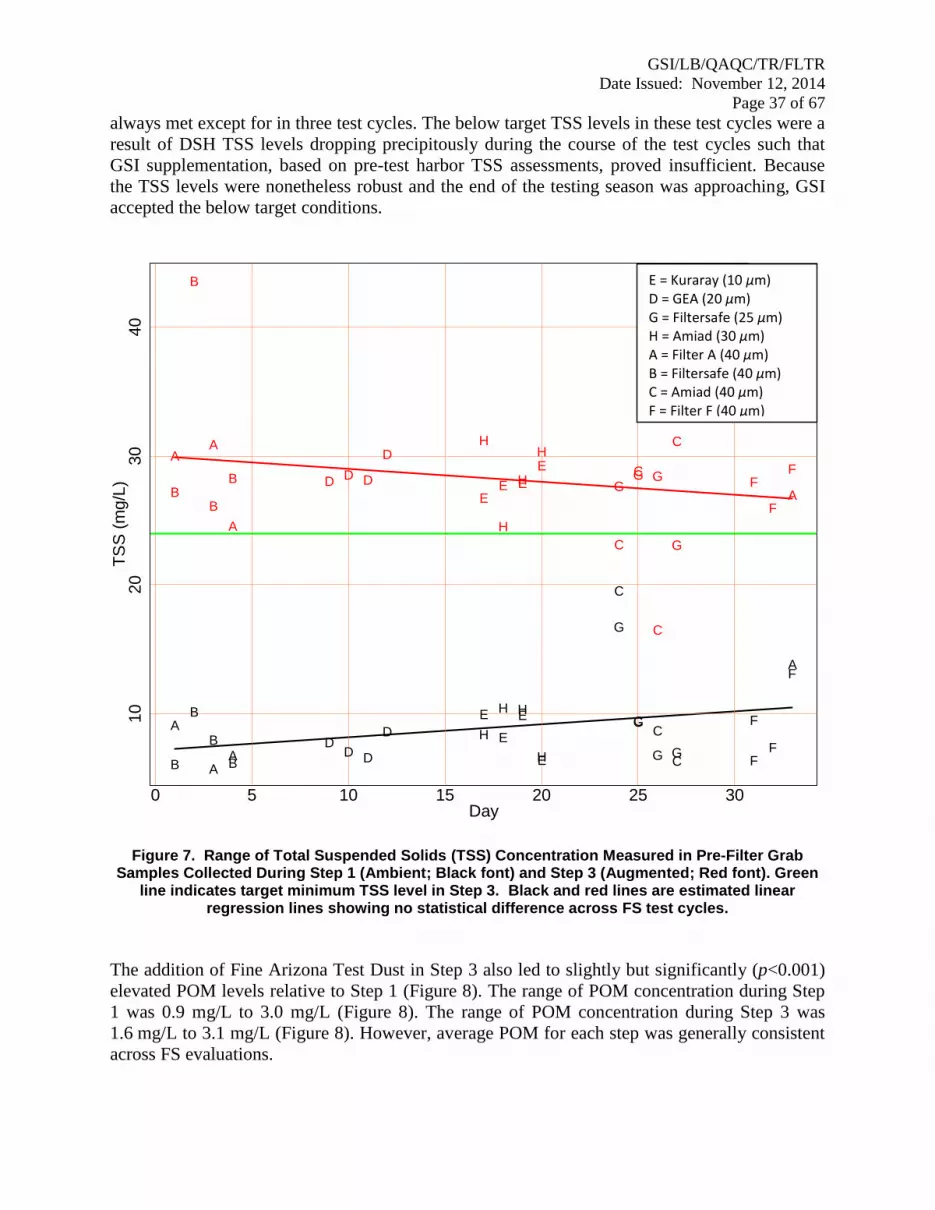
GSI/LB/QAQC/TR/FLTR
Date Issued: November 12, 2014
Page 37 of 67
always met except for in three test cycles. The below target TSS levels in these test cycles were a
result of DSH TSS levels dropping precipitously during the course of the test cycles such that
GSI supplementation, based on pre-test harbor TSS assessments, proved insufficient. Because
the TSS levels were nonetheless robust and the end of the testing season was approaching, GSI
accepted the below target conditions.
Figure 7. Range of Total Suspended Solids (TSS) Concentration Measured in Pre-Filter Grab Samples Collected During Step 1 (Ambient; Black font) and Step 3 (Augmented; Red font). Green
line indicates target minimum TSS level in Step 3. Black and red lines are estimated linear regression lines showing no statistical difference across FS test cycles.
The addition of Fine Arizona Test Dust in Step 3 also led to slightly but significantly (p<0.001)
elevated POM levels relative to Step 1 (Figure 8). The range of POM concentration during Step
1 was 0.9 mg/L to 3.0 mg/L (Figure 8). The range of POM concentration during Step 3 was
1.6 mg/L to 3.1 mg/L (Figure 8). However, average POM for each step was generally consistent
across FS evaluations.
0 5 10 15 20 25 30
10
20
30
40
Day
TS
S (
mg/L
)
A
AA
A
AA
A
A
B
B
B
B
B
B
B
B
C
CC
C
C
C
C
C
DD D
D
D D D
D
E
E
E
E
EE E
E
F
F
F
F
F
F
F
F
G
G
G G
GG G
G
H
H H
H
H
H
H
H
A
A
Step 1
Step 3
E = Kuraray (10 µm) D = GEA (20 µm) G = Filtersafe (25 µm) H = Amiad (30 µm) A = Filter A (40 µm) B = Filtersafe (40 µm) C = Amiad (40 µm) F = Filter F (40 µm)
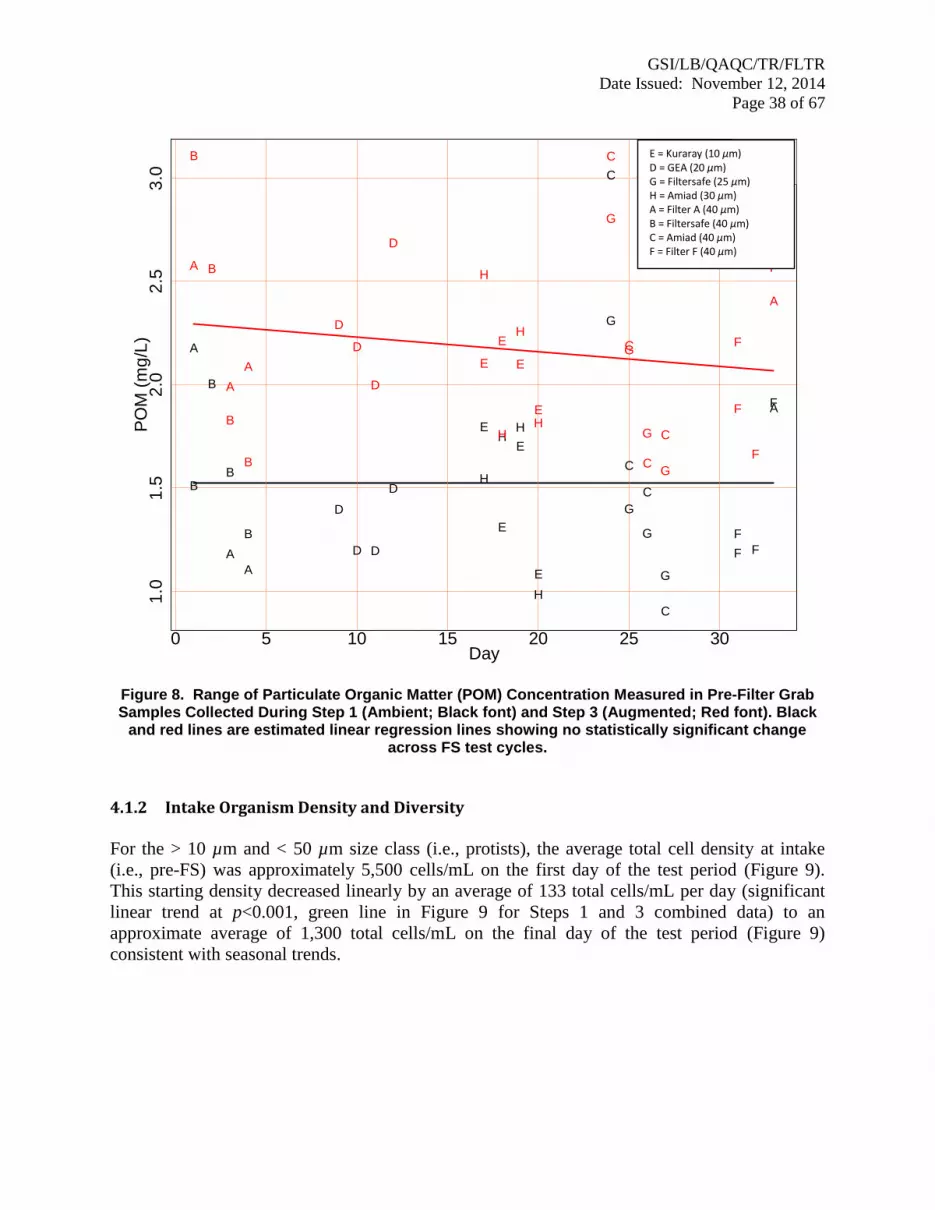
GSI/LB/QAQC/TR/FLTR
Date Issued: November 12, 2014
Page 38 of 67
Figure 8. Range of Particulate Organic Matter (POM) Concentration Measured in Pre-Filter Grab Samples Collected During Step 1 (Ambient; Black font) and Step 3 (Augmented; Red font). Black
and red lines are estimated linear regression lines showing no statistically significant change across FS test cycles.
4.1.2 Intake Organism Density and Diversity
For the > 10 µm and < 50 µm size class (i.e., protists), the average total cell density at intake
(i.e., pre-FS) was approximately 5,500 cells/mL on the first day of the test period (Figure 9).
This starting density decreased linearly by an average of 133 total cells/mL per day (significant
linear trend at p<0.001, green line in Figure 9 for Steps 1 and 3 combined data) to an
approximate average of 1,300 total cells/mL on the final day of the test period (Figure 9)
consistent with seasonal trends.
0 5 10 15 20 25 30
1.0
1.5
2.0
2.5
3.0
Day
PO
M (
mg
/L)
A
A
A
A
A
A
A
A
B
B
B
B
B
B
B
B
C
C
C
C
C
C
C
C
D
D D
D
D
D
D
D
E
E
E
E
E
E
E
E
F
F
F
F
F
F
F
F
G
G
G
G
G
G
G
GH
HH
H
H
H
H
H
A
A
Step 1
Step 3
E = Kuraray (10 µm) D = GEA (20 µm) G = Filtersafe (25 µm) H = Amiad (30 µm) A = Filter A (40 µm) B = Filtersafe (40 µm) C = Amiad (40 µm) F = Filter F (40 µm)
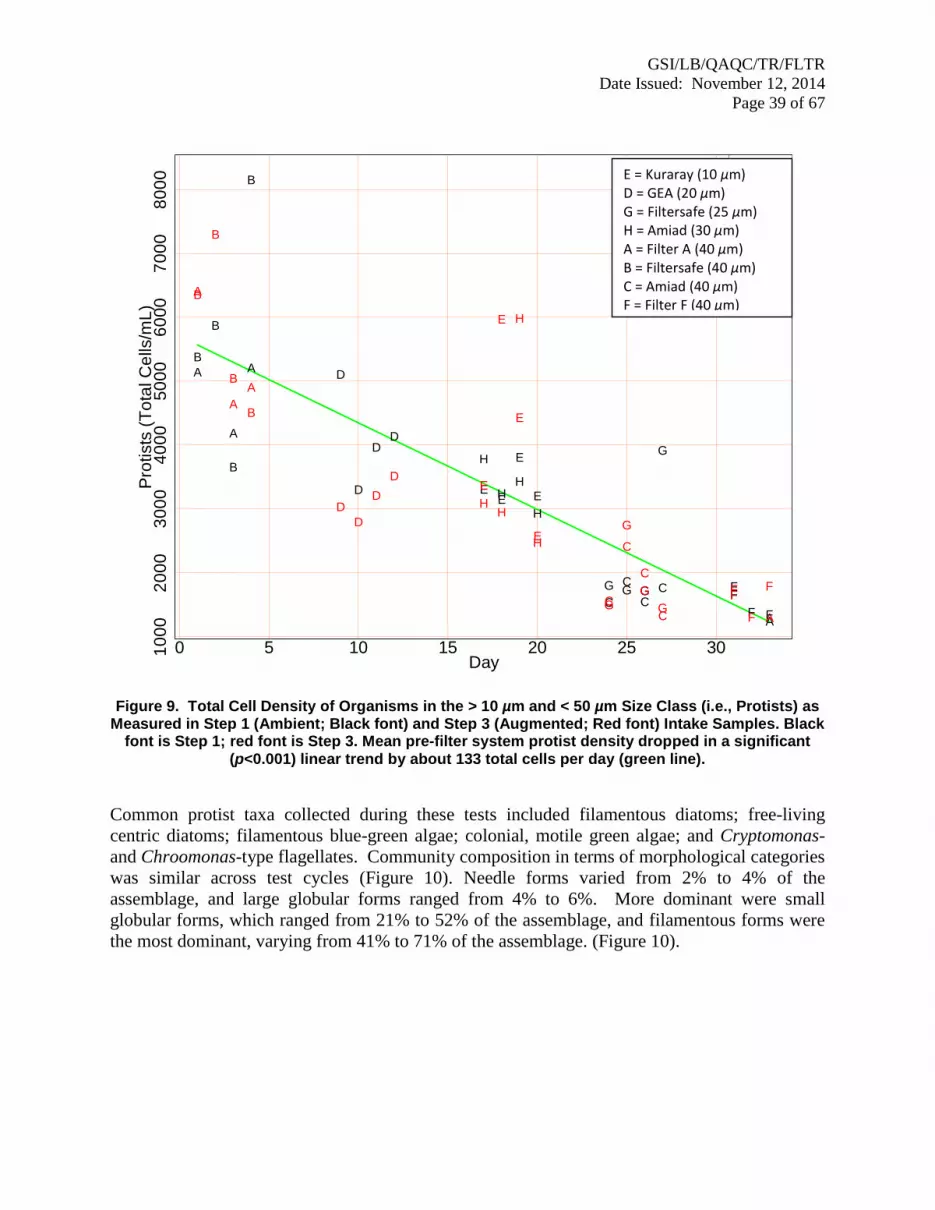
GSI/LB/QAQC/TR/FLTR
Date Issued: November 12, 2014
Page 39 of 67
Figure 9. Total Cell Density of Organisms in the > 10 µm and < 50 µm Size Class (i.e., Protists) as Measured in Step 1 (Ambient; Black font) and Step 3 (Augmented; Red font) Intake Samples. Black
font is Step 1; red font is Step 3. Mean pre-filter system protist density dropped in a significant (p<0.001) linear trend by about 133 total cells per day (green line).
Common protist taxa collected during these tests included filamentous diatoms; free-living
centric diatoms; filamentous blue-green algae; colonial, motile green algae; and Cryptomonas-
and Chroomonas-type flagellates. Community composition in terms of morphological categories
was similar across test cycles (Figure 10). Needle forms varied from 2% to 4% of the
assemblage, and large globular forms ranged from 4% to 6%. More dominant were small
globular forms, which ranged from 21% to 52% of the assemblage, and filamentous forms were
the most dominant, varying from 41% to 71% of the assemblage. (Figure 10).
0 5 10 15 20 25 3010
00
20
00
30
00
40
00
50
00
60
00
70
00
80
00
Day
Pro
tists
(T
ota
l C
ells
/mL
)
A
A
A
A
A
A
A
A
B
B
B
B
B
B
B
B
C
C
CC
C
C
C
C
D
D
DD
D
D
D
DE
E
E
EE
E
E
E
FF
F F
FF
F
FG G G
G
G
G
G
G
H
HH
HH
H
H
H
A
A
Step 1
Step 3E = Kuraray (10 µm) D = GEA (20 µm) G = Filtersafe (25 µm) H = Amiad (30 µm) A = Filter A (40 µm) B = Filtersafe (40 µm) C = Amiad (40 µm) F = Filter F (40 µm)

GSI/LB/QAQC/TR/FLTR
Date Issued: November 12, 2014
Page 40 of 67
Figure 10. Protist Community Composition in Terms of Morphological Classification as Measured in Intake Samples. Each pie diagram represents the average of all 12 samples collected for Steps
1, 2 and 3.
For the ≥ 50 µm size class, total zooplankton intake densities were high (i.e., > 200,000/m3)
during the entire test period. On average, 54 % of the zooplankton in the intake samples were
live (data not shown). The source water always contained more than five species from at least
three distinct phyla, meeting ETV protocol requirements for organism diversity (USEPA, 2010).
As noted above, DSH zooplankton fall into two size subcategories, both largely ≥ 50 µm in
minimum dimension5. During these tests, densities of the smaller subcategory of zooplankton,
i.e., microzooplankton, were largely stable over the entire test period and not significantly related
to time of day (i.e., AM vs. PM), or test cycle; the estimated green linear trend line shown in
Figure 11 shows an apparent drop in density over the testing period, but the trend is not
statistically significant. For samples collected during Step 3, the microzooplankton size subclass
was dominated by the phylum Rotifera, including soft bodied (illoricate) species, as well as, hard
bodied species possessing lorica (Figure 12). Similar to microzooplankton, the density of the
macrozooplankton also was stable over the course of testing, with a positive, non-significant
linear trend over time (plot not shown).
5 A proportion (historically less than 20 %) of the microzooplankton have minimum dimensions slightly less than
50 µm; these smaller organisms were not excluded from this analysis.
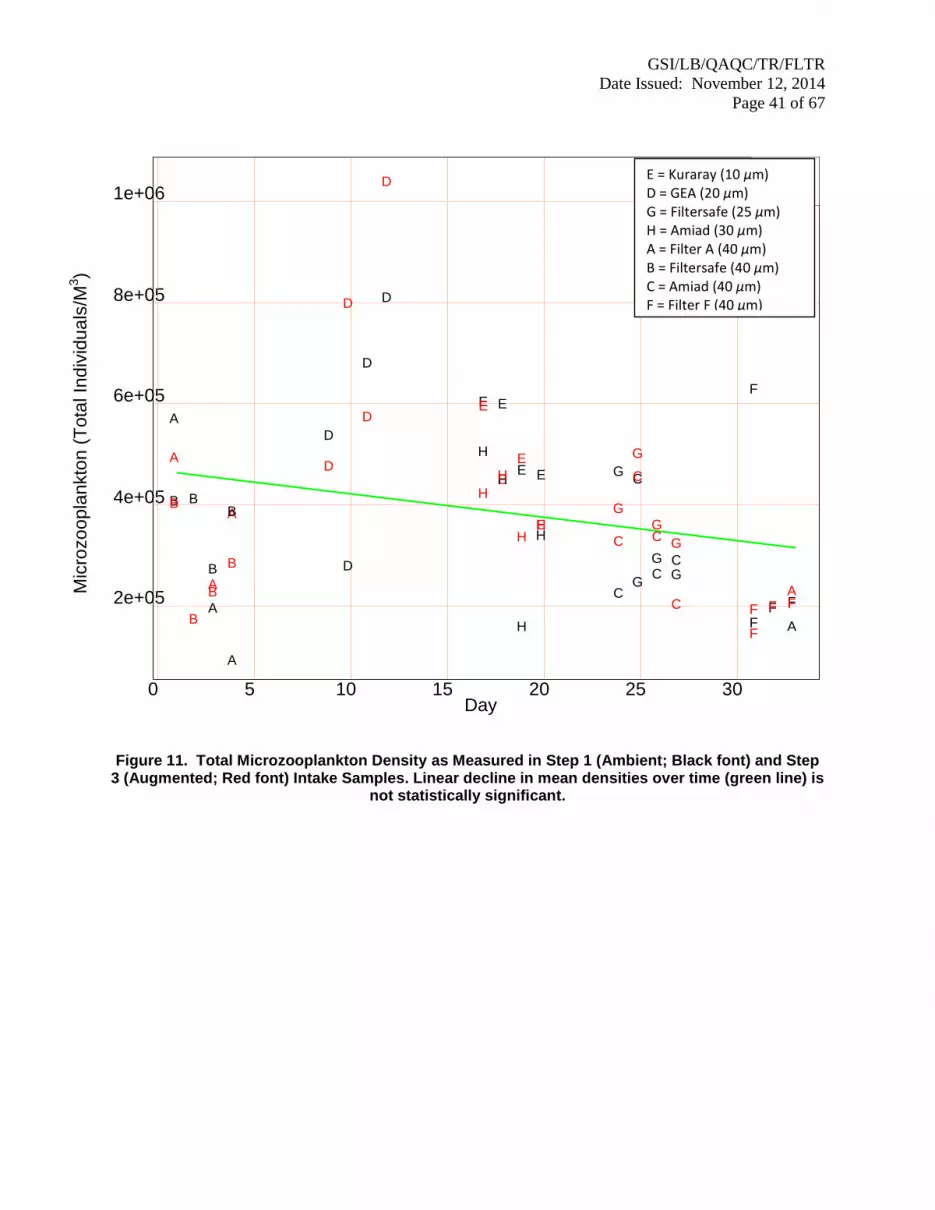
GSI/LB/QAQC/TR/FLTR
Date Issued: November 12, 2014
Page 41 of 67
Figure 11. Total Microzooplankton Density as Measured in Step 1 (Ambient; Black font) and Step 3 (Augmented; Red font) Intake Samples. Linear decline in mean densities over time (green line) is
not statistically significant.
0 5 10 15 20 25 30
2e+05
4e+05
6e+05
8e+05
1e+06
Day
A
A
A
A
A
A
A
A
B B
B
B B
B
B
B
C
C
C C
C
C
C
C
D
D
D
D
D
D
D
D
E E
E E
E
E E
E
F
F
F F F
F
F F
G
G
G G
G
G
G G
H
H
H
H
H H
H H
A A
Step 1 Step 3
E = Kuraray (10 µm) D = GEA (20 µm) G = Filtersafe (25 µm) H = Amiad (30 µm) A = Filter A (40 µm) B = Filtersafe (40 µm) C = Amiad (40 µm) F = Filter F (40 µm)
Mic
rozo
op
lan
kto
n (
Tota
l In
div
idu
als
/M3)
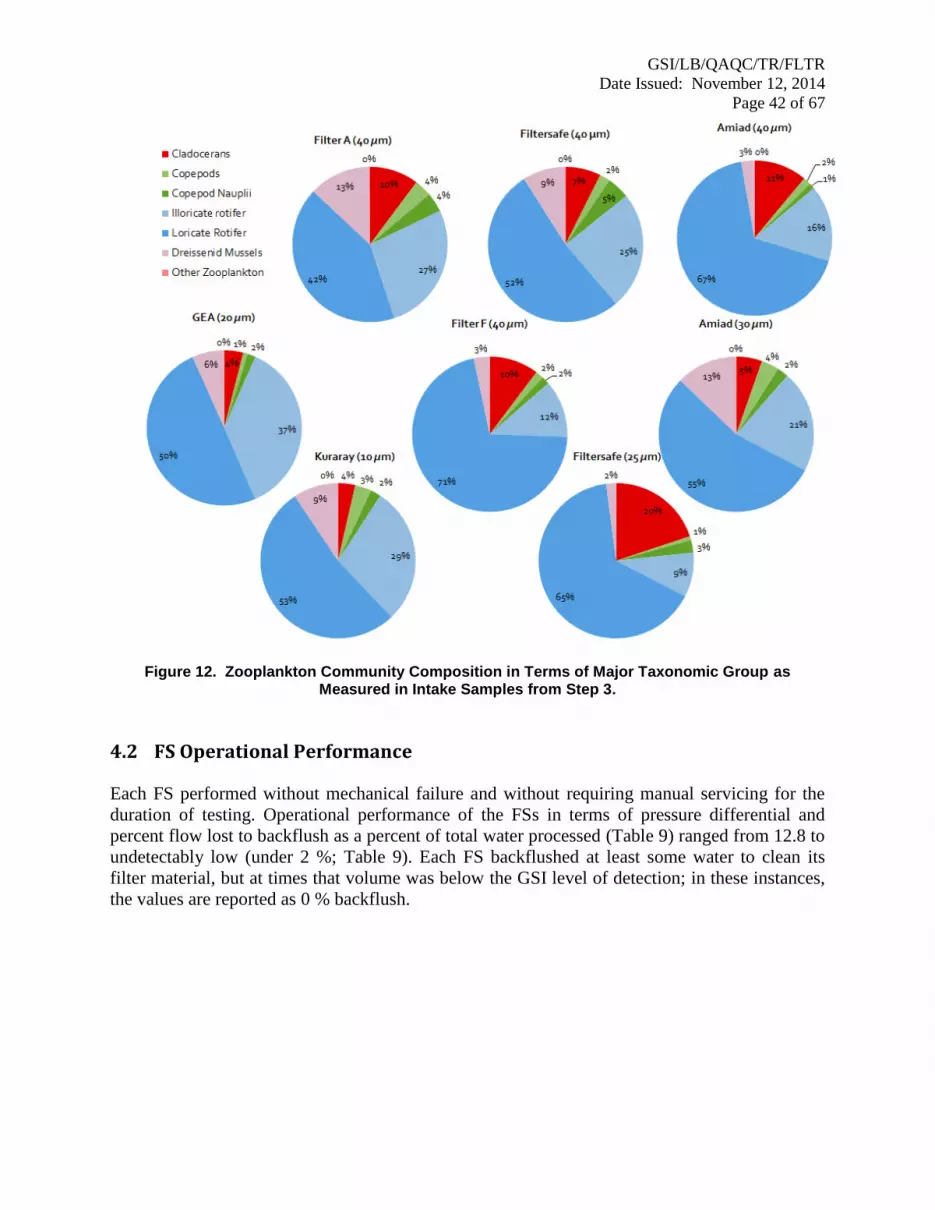
GSI/LB/QAQC/TR/FLTR
Date Issued: November 12, 2014
Page 42 of 67
Figure 12. Zooplankton Community Composition in Terms of Major Taxonomic Group as
Measured in Intake Samples from Step 3.
4.2 FS Operational Performance
Each FS performed without mechanical failure and without requiring manual servicing for the
duration of testing. Operational performance of the FSs in terms of pressure differential and
percent flow lost to backflush as a percent of total water processed (Table 9) ranged from 12.8 to
undetectably low (under 2 %; Table 9). Each FS backflushed at least some water to clean its
filter material, but at times that volume was below the GSI level of detection; in these instances,
the values are reported as 0 % backflush.
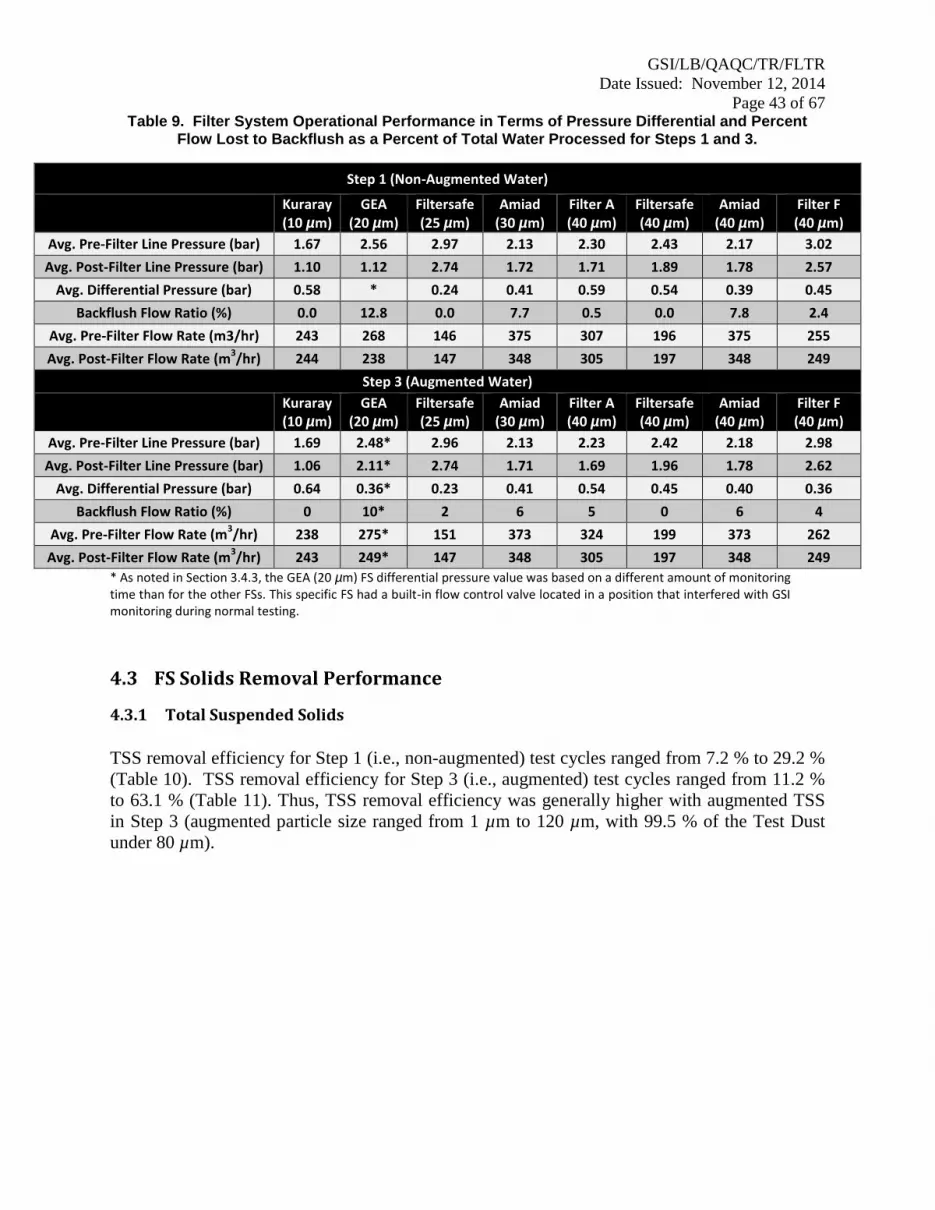
GSI/LB/QAQC/TR/FLTR
Date Issued: November 12, 2014
Page 43 of 67
Table 9. Filter System Operational Performance in Terms of Pressure Differential and Percent Flow Lost to Backflush as a Percent of Total Water Processed for Steps 1 and 3.
Step 1 (Non-Augmented Water)
Kuraray (10 µm)
GEA (20 µm)
Filtersafe (25 µm)
Amiad (30 µm)
Filter A (40 µm)
Filtersafe (40 µm)
Amiad (40 µm)
Filter F (40 µm)
Avg. Pre-Filter Line Pressure (bar) 1.67 2.56 2.97 2.13 2.30 2.43 2.17 3.02
Avg. Post-Filter Line Pressure (bar) 1.10 1.12 2.74 1.72 1.71 1.89 1.78 2.57
Avg. Differential Pressure (bar) 0.58 * 0.24 0.41 0.59 0.54 0.39 0.45
Backflush Flow Ratio (%) 0.0 12.8 0.0 7.7 0.5 0.0 7.8 2.4
Avg. Pre-Filter Flow Rate (m3/hr) 243 268 146 375 307 196 375 255
Avg. Post-Filter Flow Rate (m3/hr) 244 238 147 348 305 197 348 249
Step 3 (Augmented Water)
Kuraray (10 µm)
GEA (20 µm)
Filtersafe (25 µm)
Amiad (30 µm)
Filter A (40 µm)
Filtersafe (40 µm)
Amiad (40 µm)
Filter F (40 µm)
Avg. Pre-Filter Line Pressure (bar) 1.69 2.48* 2.96 2.13 2.23 2.42 2.18 2.98
Avg. Post-Filter Line Pressure (bar) 1.06 2.11* 2.74 1.71 1.69 1.96 1.78 2.62
Avg. Differential Pressure (bar) 0.64 0.36* 0.23 0.41 0.54 0.45 0.40 0.36
Backflush Flow Ratio (%) 0 10* 2 6 5 0 6 4
Avg. Pre-Filter Flow Rate (m3/hr) 238 275* 151 373 324 199 373 262
Avg. Post-Filter Flow Rate (m3/hr) 243 249* 147 348 305 197 348 249
* As noted in Section 3.4.3, the GEA (20 µm) FS differential pressure value was based on a different amount of monitoring time than for the other FSs. This specific FS had a built-in flow control valve located in a position that interfered with GSI monitoring during normal testing. 4.3 FS Solids Removal Performance
4.3.1 Total Suspended Solids
TSS removal efficiency for Step 1 (i.e., non-augmented) test cycles ranged from 7.2 % to 29.2 %
(Table 10). TSS removal efficiency for Step 3 (i.e., augmented) test cycles ranged from 11.2 %
to 63.1 % (Table 11). Thus, TSS removal efficiency was generally higher with augmented TSS
in Step 3 (augmented particle size ranged from 1 µm to 120 µm, with 99.5 % of the Test Dust
under 80 µm).

GSI/LB/QAQC/TR/FLTR
Date Issued: November 12, 2014
Page 44 of 67
Table 10. Total Suspended Solids (TSS) Removal Efficiency during Step 1 (i.e., Non-Augmented) Test Cycles.
Filter System
(Nominal Pore Size) Step
Pre-Filtration Average TSS (mg/L)
Post-Filtration Average TSS (mg/L)
Solids Removal Efficiency (%)
Kuraray (10 µm) 1 8.6 6.1 29.2
GEA (20 µm) 1 7.6 6.6 12.6
Filtersafe® (25 µm) 1 10.0 8.7 12.8
Amiad (30 µm) 1 9.0 7.9 11.9
Filter A (40 µm) 1 8.9 8.1 8.2
Filtersafe® (40 µm) 1 7.6 6.2 18.4
Amiad (40 µm) 1 11.1 10.2 8.1
Filter F (40 µm) 1 9.0 8.4 7.2
Table 11. Total Suspended Solids (TSS) Removal Efficiency during Step 3 (i.e., Augmented) Test Cycles.
Filter System (Nominal Pore Size)
Step Pre-Filtration
Average TSS (mg/L) Post-Filtration
Average TSS (mg/L) Solids Removal Efficiency (%)
Kuraray (10 µm) 3 27.9 10.3 63.1
GEA (20 µm) 3 28.8 21.0 27.2
Filtersafe® (25 µm) 3 27.0 19.5 27.8
Amiad (30 µm) 3 28.5 22.9 19.8
Filter A (40 µm) 3 28.1 22.3 20.6
Filtersafe® (40 µm) 3 31.3 27.0 13.8
Amiad (40 µm) 3 25.0 22.2 11.2
Filter F (40 µm) 3 29.1 23.8 18.4
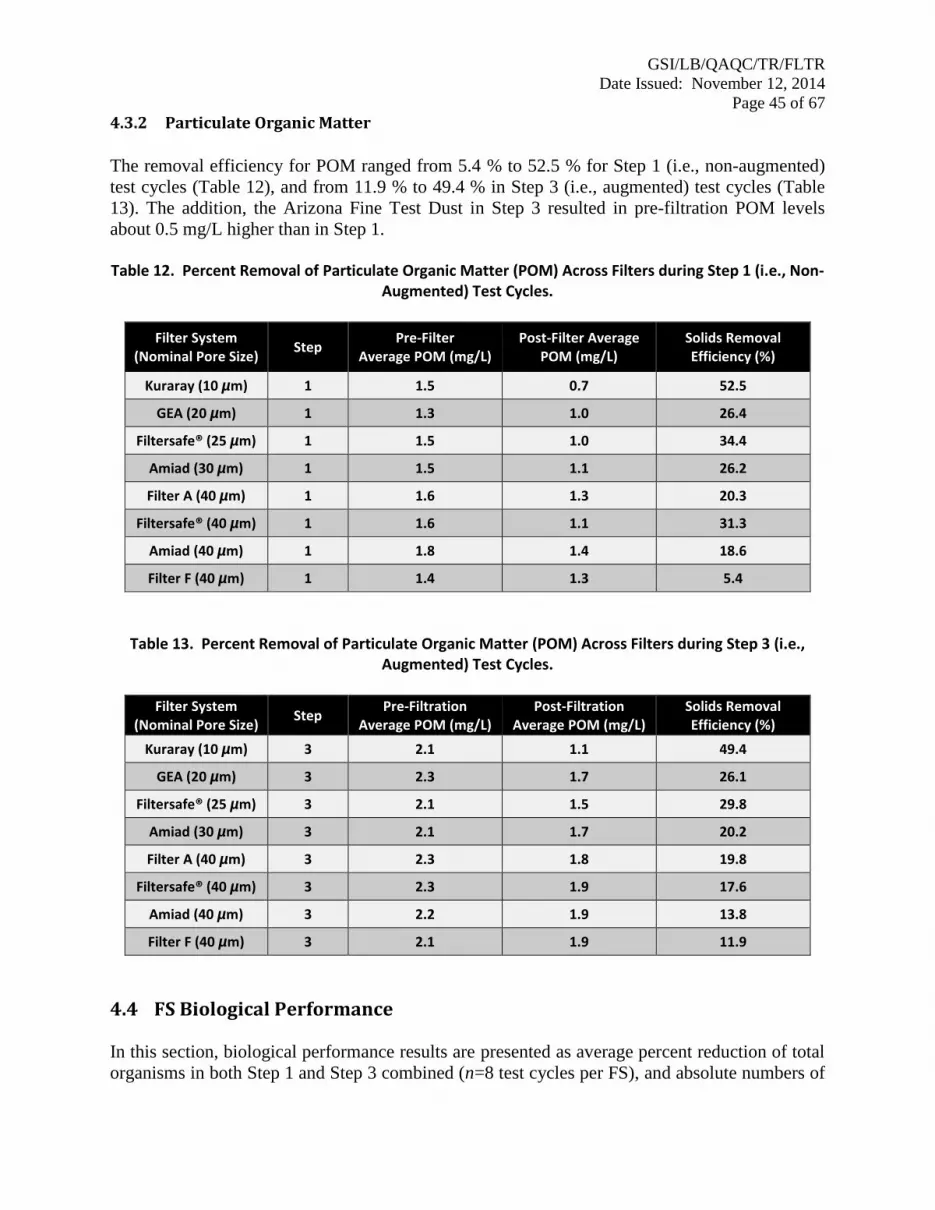
GSI/LB/QAQC/TR/FLTR
Date Issued: November 12, 2014
Page 45 of 67
4.3.2 Particulate Organic Matter
The removal efficiency for POM ranged from 5.4 % to 52.5 % for Step 1 (i.e., non-augmented)
test cycles (Table 12), and from 11.9 % to 49.4 % in Step 3 (i.e., augmented) test cycles (Table
13). The addition, the Arizona Fine Test Dust in Step 3 resulted in pre-filtration POM levels
about 0.5 mg/L higher than in Step 1. Table 12. Percent Removal of Particulate Organic Matter (POM) Across Filters during Step 1 (i.e., Non-
Augmented) Test Cycles.
Filter System (Nominal Pore Size)
Step Pre-Filter
Average POM (mg/L) Post-Filter Average
POM (mg/L) Solids Removal Efficiency (%)
Kuraray (10 µm) 1 1.5 0.7 52.5
GEA (20 µm) 1 1.3 1.0 26.4
Filtersafe® (25 µm) 1 1.5 1.0 34.4
Amiad (30 µm) 1 1.5 1.1 26.2
Filter A (40 µm) 1 1.6 1.3 20.3
Filtersafe® (40 µm) 1 1.6 1.1 31.3
Amiad (40 µm) 1 1.8 1.4 18.6
Filter F (40 µm) 1 1.4 1.3 5.4
Table 13. Percent Removal of Particulate Organic Matter (POM) Across Filters during Step 3 (i.e., Augmented) Test Cycles.
Filter System
(Nominal Pore Size) Step
Pre-Filtration Average POM (mg/L)
Post-Filtration Average POM (mg/L)
Solids Removal Efficiency (%)
Kuraray (10 µm) 3 2.1 1.1 49.4
GEA (20 µm) 3 2.3 1.7 26.1
Filtersafe® (25 µm) 3 2.1 1.5 29.8
Amiad (30 µm) 3 2.1 1.7 20.2
Filter A (40 µm) 3 2.3 1.8 19.8
Filtersafe® (40 µm) 3 2.3 1.9 17.6
Amiad (40 µm) 3 2.2 1.9 13.8
Filter F (40 µm) 3 2.1 1.9 11.9
4.4 FS Biological Performance
In this section, biological performance results are presented as average percent reduction of total
organisms in both Step 1 and Step 3 combined (n=8 test cycles per FS), and absolute numbers of
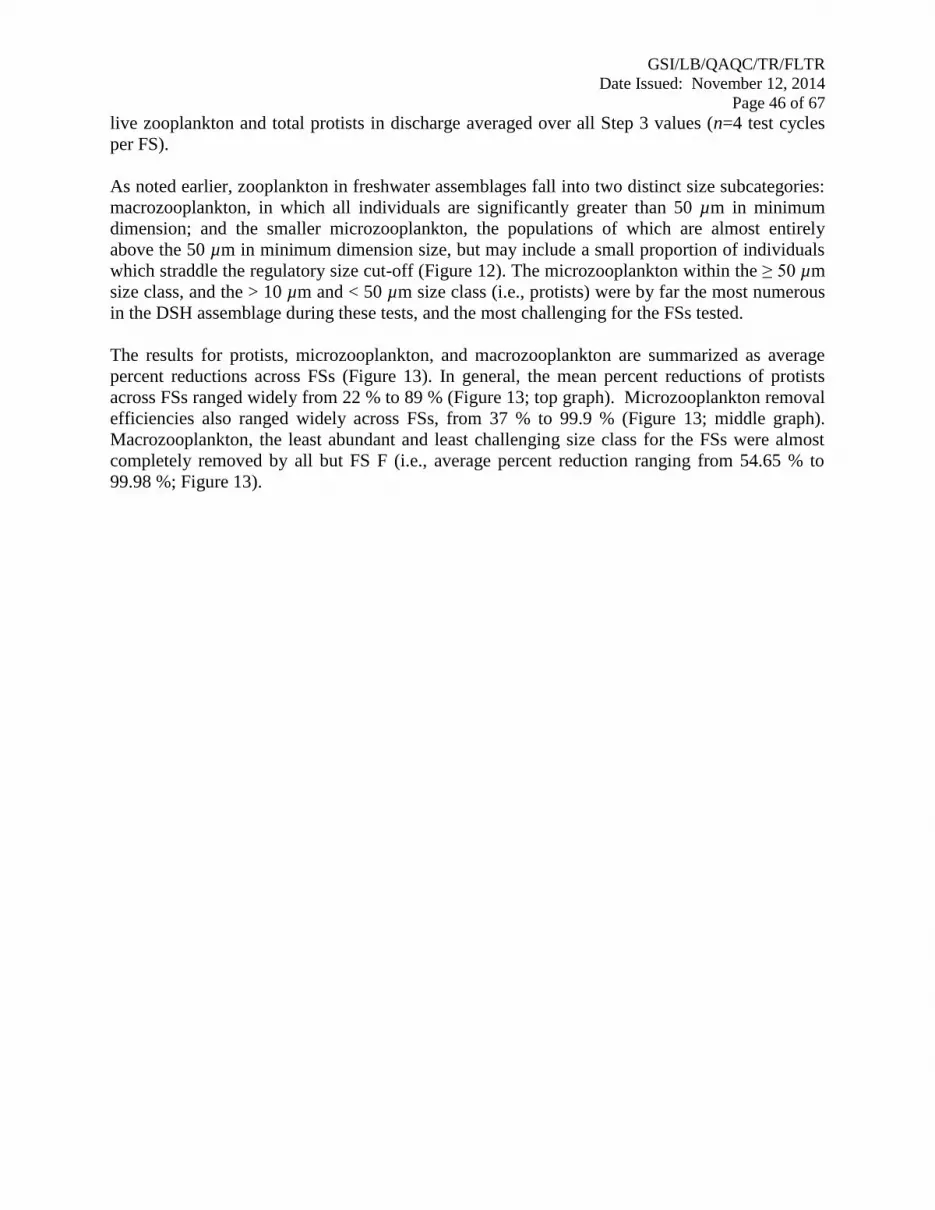
GSI/LB/QAQC/TR/FLTR
Date Issued: November 12, 2014
Page 46 of 67
live zooplankton and total protists in discharge averaged over all Step 3 values (n=4 test cycles
per FS).
As noted earlier, zooplankton in freshwater assemblages fall into two distinct size subcategories:
macrozooplankton, in which all individuals are significantly greater than 50 µm in minimum
dimension; and the smaller microzooplankton, the populations of which are almost entirely
above the 50 µm in minimum dimension size, but may include a small proportion of individuals
which straddle the regulatory size cut-off (Figure 12). The microzooplankton within the ≥ 50 µm
size class, and the > 10 µm and < 50 µm size class (i.e., protists) were by far the most numerous
in the DSH assemblage during these tests, and the most challenging for the FSs tested.
The results for protists, microzooplankton, and macrozooplankton are summarized as average
percent reductions across FSs (Figure 13). In general, the mean percent reductions of protists
across FSs ranged widely from 22 % to 89 % (Figure 13; top graph). Microzooplankton removal
efficiencies also ranged widely across FSs, from 37 % to 99.9 % (Figure 13; middle graph).
Macrozooplankton, the least abundant and least challenging size class for the FSs were almost
completely removed by all but FS F (i.e., average percent reduction ranging from 54.65 % to
99.98 %; Figure 13).
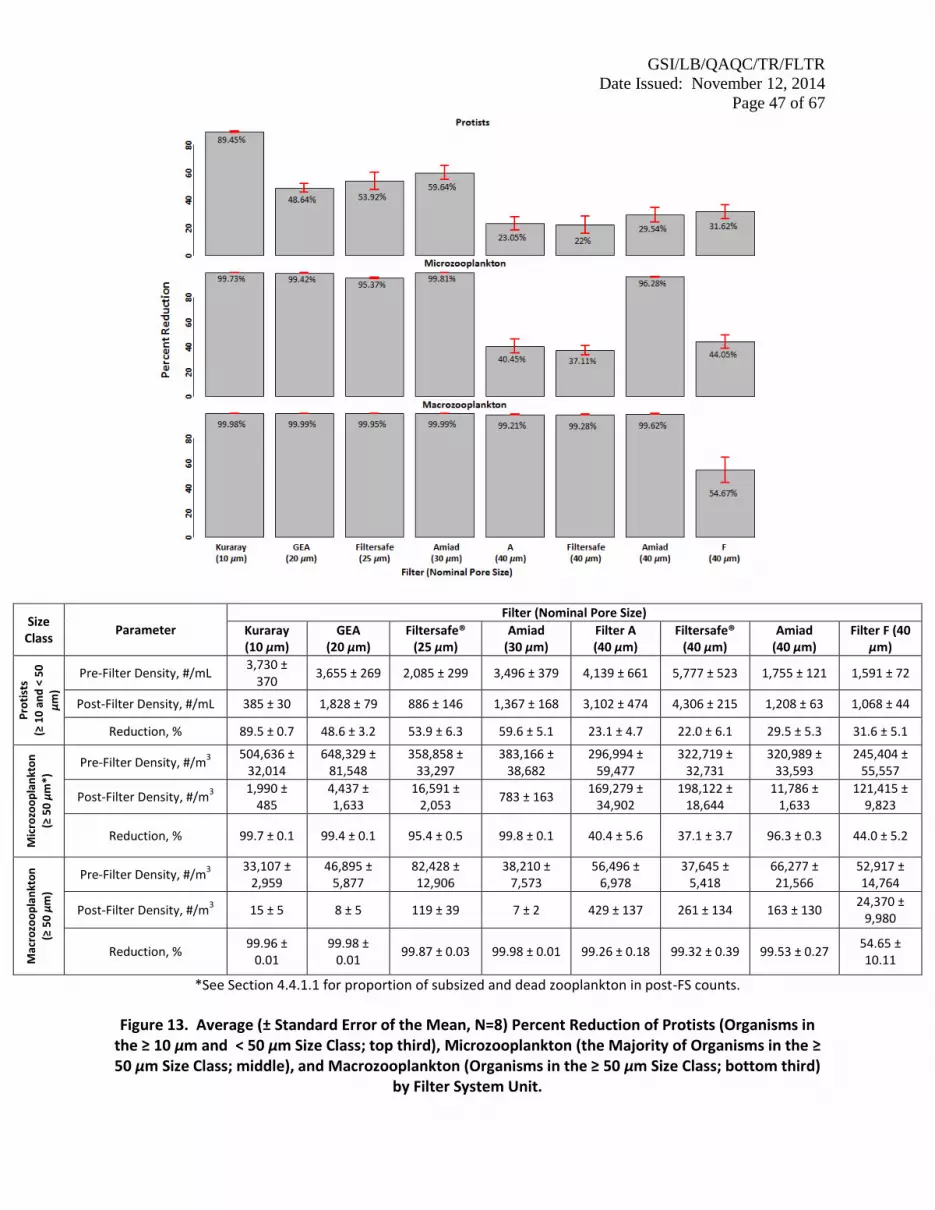
GSI/LB/QAQC/TR/FLTR
Date Issued: November 12, 2014
Page 47 of 67
Size Class
Parameter
Filter (Nominal Pore Size)
Kuraray (10 µm)
GEA (20 µm)
Filtersafe® (25 µm)
Amiad (30 µm)
Filter A (40 µm)
Filtersafe® (40 µm)
Amiad (40 µm)
Filter F (40 µm)
Pro
tist
s
(≥ 1
0 a
nd
< 5
0
µm
)
Pre-Filter Density, #/mL 3,730 ±
370 3,655 ± 269 2,085 ± 299 3,496 ± 379 4,139 ± 661 5,777 ± 523 1,755 ± 121 1,591 ± 72
Post-Filter Density, #/mL 385 ± 30 1,828 ± 79 886 ± 146 1,367 ± 168 3,102 ± 474 4,306 ± 215 1,208 ± 63 1,068 ± 44
Reduction, % 89.5 ± 0.7 48.6 ± 3.2 53.9 ± 6.3 59.6 ± 5.1 23.1 ± 4.7 22.0 ± 6.1 29.5 ± 5.3 31.6 ± 5.1
Mic
rozo
op
lan
kto
n
(≥ 5
0 µ
m*)
Pre-Filter Density, #/m3
504,636 ± 32,014
648,329 ± 81,548
358,858 ± 33,297
383,166 ± 38,682
296,994 ± 59,477
322,719 ± 32,731
320,989 ± 33,593
245,404 ± 55,557
Post-Filter Density, #/m3
1,990 ± 485
4,437 ± 1,633
16,591 ± 2,053
783 ± 163 169,279 ±
34,902 198,122 ±
18,644 11,786 ±
1,633 121,415 ±
9,823
Reduction, % 99.7 ± 0.1 99.4 ± 0.1 95.4 ± 0.5 99.8 ± 0.1 40.4 ± 5.6 37.1 ± 3.7 96.3 ± 0.3 44.0 ± 5.2
Mac
rozo
op
lan
kto
n
(≥ 5
0 µ
m)
Pre-Filter Density, #/m3
33,107 ± 2,959
46,895 ± 5,877
82,428 ± 12,906
38,210 ± 7,573
56,496 ± 6,978
37,645 ± 5,418
66,277 ± 21,566
52,917 ± 14,764
Post-Filter Density, #/m3 15 ± 5 8 ± 5 119 ± 39 7 ± 2 429 ± 137 261 ± 134 163 ± 130
24,370 ± 9,980
Reduction, % 99.96 ±
0.01 99.98 ±
0.01 99.87 ± 0.03 99.98 ± 0.01 99.26 ± 0.18 99.32 ± 0.39 99.53 ± 0.27
54.65 ± 10.11
*See Section 4.4.1.1 for proportion of subsized and dead zooplankton in post-FS counts.
Figure 13. Average (± Standard Error of the Mean, N=8) Percent Reduction of Protists (Organisms in
the ≥ 10 µm and < 50 µm Size Class; top third), Microzooplankton (the Majority of Organisms in the ≥ 50 µm Size Class; middle), and Macrozooplankton (Organisms in the ≥ 50 µm Size Class; bottom third)
by Filter System Unit.
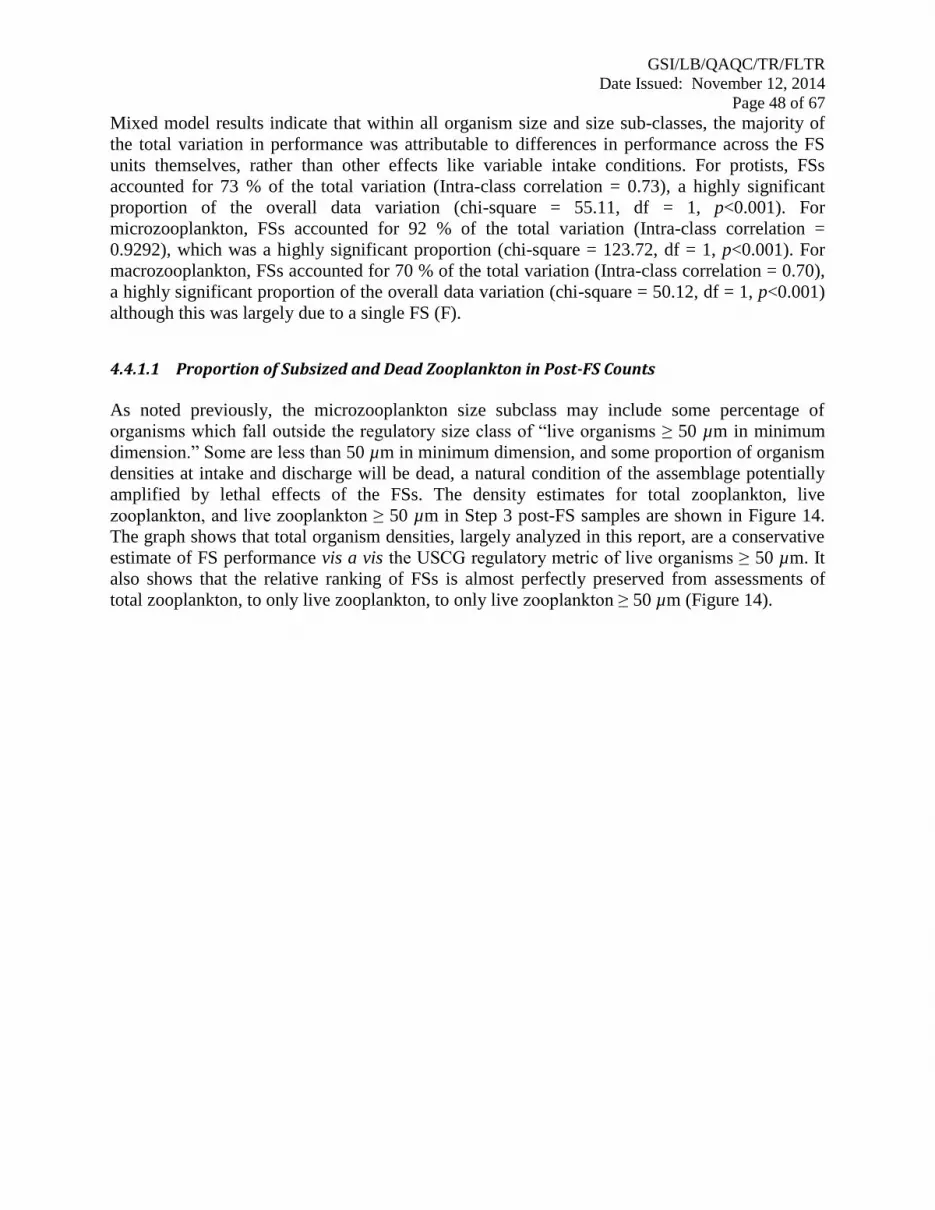
GSI/LB/QAQC/TR/FLTR
Date Issued: November 12, 2014
Page 48 of 67
Mixed model results indicate that within all organism size and size sub-classes, the majority of
the total variation in performance was attributable to differences in performance across the FS
units themselves, rather than other effects like variable intake conditions. For protists, FSs
accounted for 73 % of the total variation (Intra-class correlation = 0.73), a highly significant
proportion of the overall data variation (chi-square = 55.11, df = 1, p<0.001). For
microzooplankton, FSs accounted for 92 % of the total variation (Intra-class correlation =
0.9292), which was a highly significant proportion (chi-square = 123.72, df = 1, p<0.001). For
macrozooplankton, FSs accounted for 70 % of the total variation (Intra-class correlation = 0.70),
a highly significant proportion of the overall data variation (chi-square = 50.12, df = 1, p<0.001)
although this was largely due to a single FS (F).
4.4.1.1 Proportion of Subsized and Dead Zooplankton in Post-FS Counts
As noted previously, the microzooplankton size subclass may include some percentage of
organisms which fall outside the regulatory size class of “live organisms ≥ 50 µm in minimum
dimension.” Some are less than 50 µm in minimum dimension, and some proportion of organism
densities at intake and discharge will be dead, a natural condition of the assemblage potentially
amplified by lethal effects of the FSs. The density estimates for total zooplankton, live
zooplankton, and live zooplankton ≥ 50 µm in Step 3 post-FS samples are shown in Figure 14.
The graph shows that total organism densities, largely analyzed in this report, are a conservative
estimate of FS performance vis a vis the USCG regulatory metric of live organisms ≥ 50 µm. It
also shows that the relative ranking of FSs is almost perfectly preserved from assessments of
total zooplankton, to only live zooplankton, to only live zooplankton ≥ 50 µm (Figure 14).
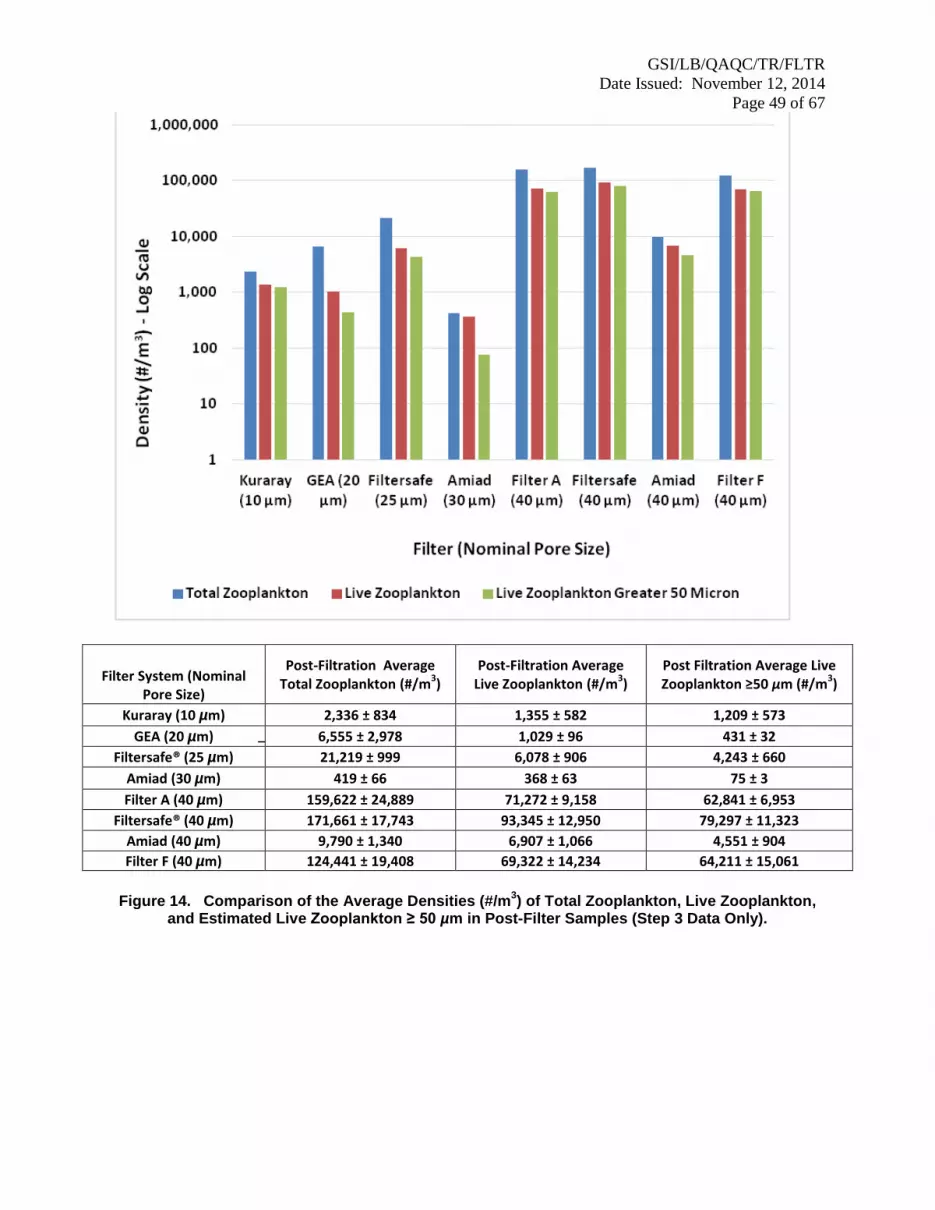
GSI/LB/QAQC/TR/FLTR
Date Issued: November 12, 2014
Page 49 of 67
Filter System (Nominal
Pore Size)
Post-Filtration Average Total Zooplankton (#/m
3)
Post-Filtration Average Live Zooplankton (#/m
3)
Post Filtration Average Live Zooplankton ≥50 µm (#/m
3)
Kuraray (10 µm) 2,336 ± 834 1,355 ± 582 1,209 ± 573
GEA (20 µm) 6,555 ± 2,978 1,029 ± 96 431 ± 32
Filtersafe® (25 µm) 21,219 ± 999 6,078 ± 906 4,243 ± 660
Amiad (30 µm) 419 ± 66 368 ± 63 75 ± 3
Filter A (40 µm) 159,622 ± 24,889 71,272 ± 9,158 62,841 ± 6,953
Filtersafe® (40 µm) 171,661 ± 17,743 93,345 ± 12,950 79,297 ± 11,323
Amiad (40 µm) 9,790 ± 1,340 6,907 ± 1,066 4,551 ± 904
Filter F (40 µm) 124,441 ± 19,408 69,322 ± 14,234 64,211 ± 15,061
Figure 14. Comparison of the Average Densities (#/m
3) of Total Zooplankton, Live Zooplankton,
and Estimated Live Zooplankton ≥ 50 µm in Post-Filter Samples (Step 3 Data Only).

GSI/LB/QAQC/TR/FLTR
Date Issued: November 12, 2014
Page 50 of 67
4.5 Correlations and Predictors of FS Performance Characteristics
As noted above, the simple aggregation model describes the simple relationships evident across
measured parameters and FS characteristics without controlling for random influences, such as
variations in intake conditions, or nominal pore sizes. The results from the mixed model analysis
describe relationships between FS biological and operational performance controlling for
variability in intake conditions and nominal pore sizes. 4.5.1 Simple Relationships Between Biological Performance and Operational Performance
Characteristics
Nominal pore size, pressure differential and percent backflush flow were analyzed using simple
aggregation to detect linkages with FS organism percent reductions across organism size classes.
There was only a marginally significant correlation between FS nominal pore size and percent
reduction of total microzooplankton (negative, p=0.06, Figure 16), and between FS nominal pore
size and post filtration absolute density of live zooplankton ≥ 50 µm (positive, p=0.06, Figure
17). However, FS nominal pore size was significantly negatively correlated with percent
reduction of protists (p=0.003, Figure 18). Nominal pore size was not significantly correlated
with percent removal of organisms in the larger zooplankton size subclass (p=0.38, Figure 19),
i.e., macrozooplankton, as these organisms were almost completely removed across all FSs
tested irrespective of nominal pore size.
FS nominal pore size was not a predictor of pressure differential (p=0.89, Figure 20) or
backflush flow percent (p = 0.80, Figure 21). FS backflush flow percent and pressure differential
also were not significantly related to percent removal of organisms across taxa (plots not shown).
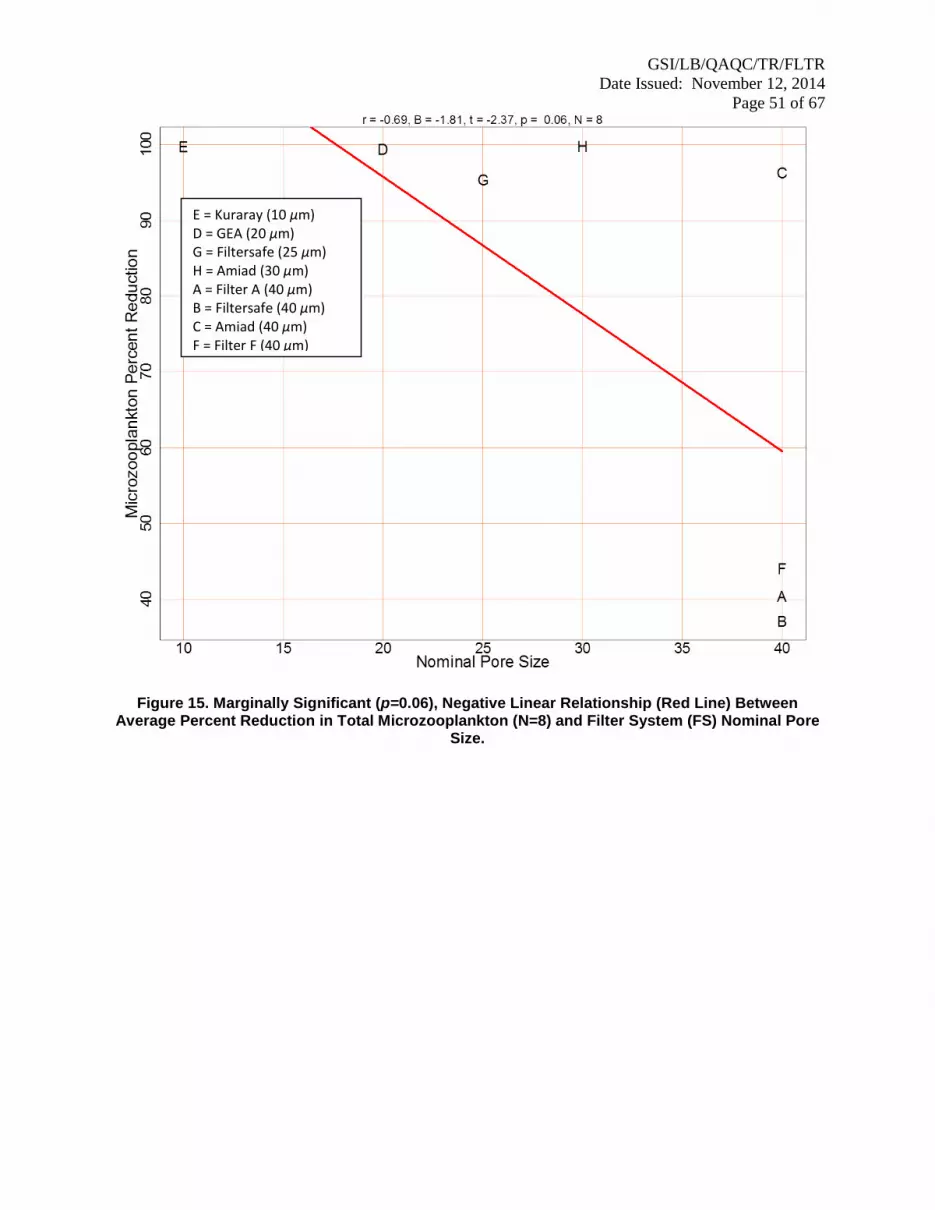
GSI/LB/QAQC/TR/FLTR
Date Issued: November 12, 2014
Page 51 of 67
Figure 15. Marginally Significant (p=0.06), Negative Linear Relationship (Red Line) Between Average Percent Reduction in Total Microzooplankton (N=8) and Filter System (FS) Nominal Pore
Size.
E = Kuraray (10 µm) D = GEA (20 µm) G = Filtersafe (25 µm) H = Amiad (30 µm) A = Filter A (40 µm) B = Filtersafe (40 µm) C = Amiad (40 µm) F = Filter F (40 µm)

GSI/LB/QAQC/TR/FLTR
Date Issued: November 12, 2014
Page 52 of 67
Figure 16. Marginally Significant (p=0.06), Positive Linear Relationship (Red Line) Between Post-Filtration Density of Live Zooplankton ≥ 50 microns (N=8) and Filter System (FS) Nominal Pore
Size.
E = Kuraray (10 µm) D = GEA (20 µm) G = Filtersafe (25 µm) H = Amiad (30 µm) A = Filter A (40 µm) B = Filtersafe (40 µm) C = Amiad (40 µm) F = Filter F (40 µm)
15
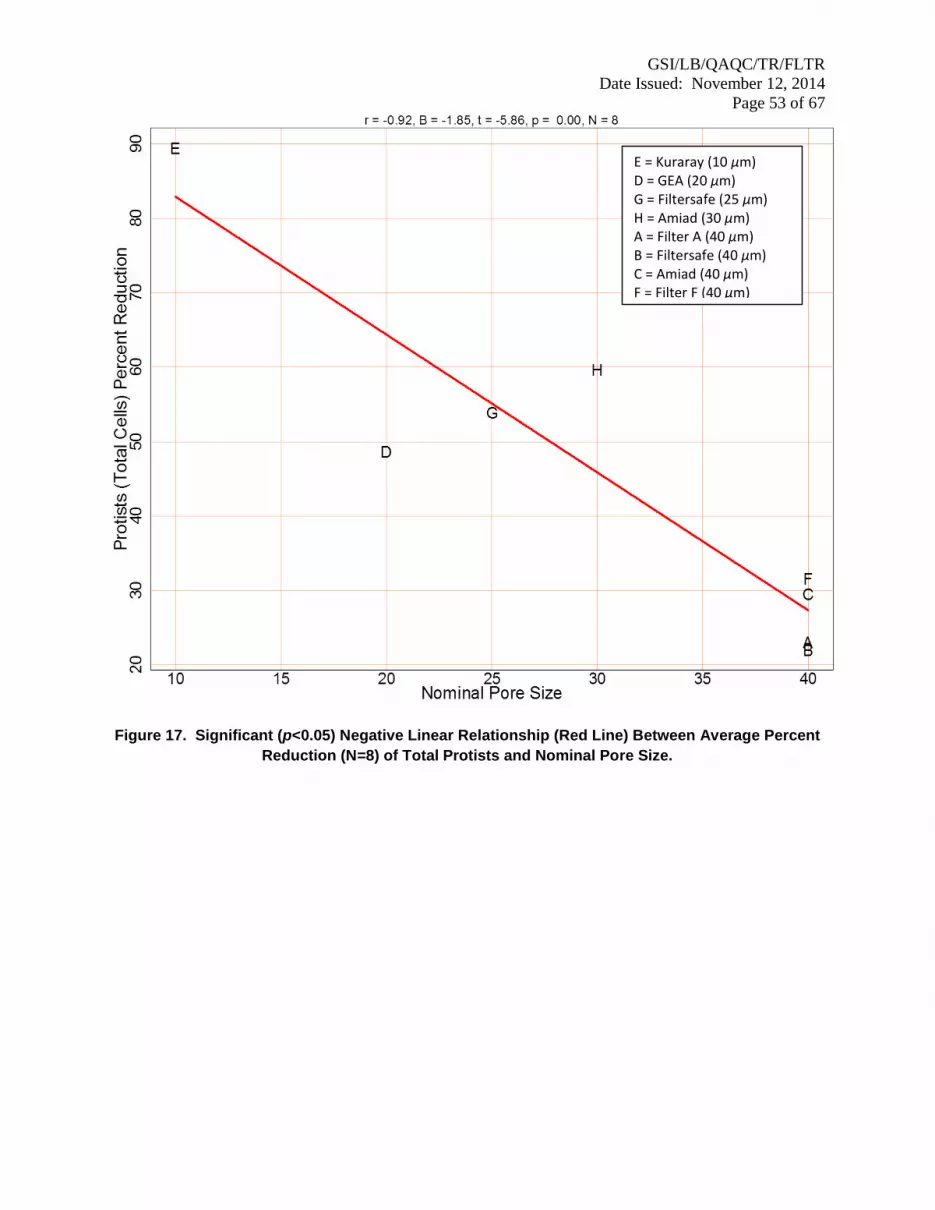
GSI/LB/QAQC/TR/FLTR
Date Issued: November 12, 2014
Page 53 of 67
Figure 17. Significant (p<0.05) Negative Linear Relationship (Red Line) Between Average Percent
Reduction (N=8) of Total Protists and Nominal Pore Size.
E = Kuraray (10 µm) D = GEA (20 µm) G = Filtersafe (25 µm) H = Amiad (30 µm) A = Filter A (40 µm) B = Filtersafe (40 µm) C = Amiad (40 µm) F = Filter F (40 µm)
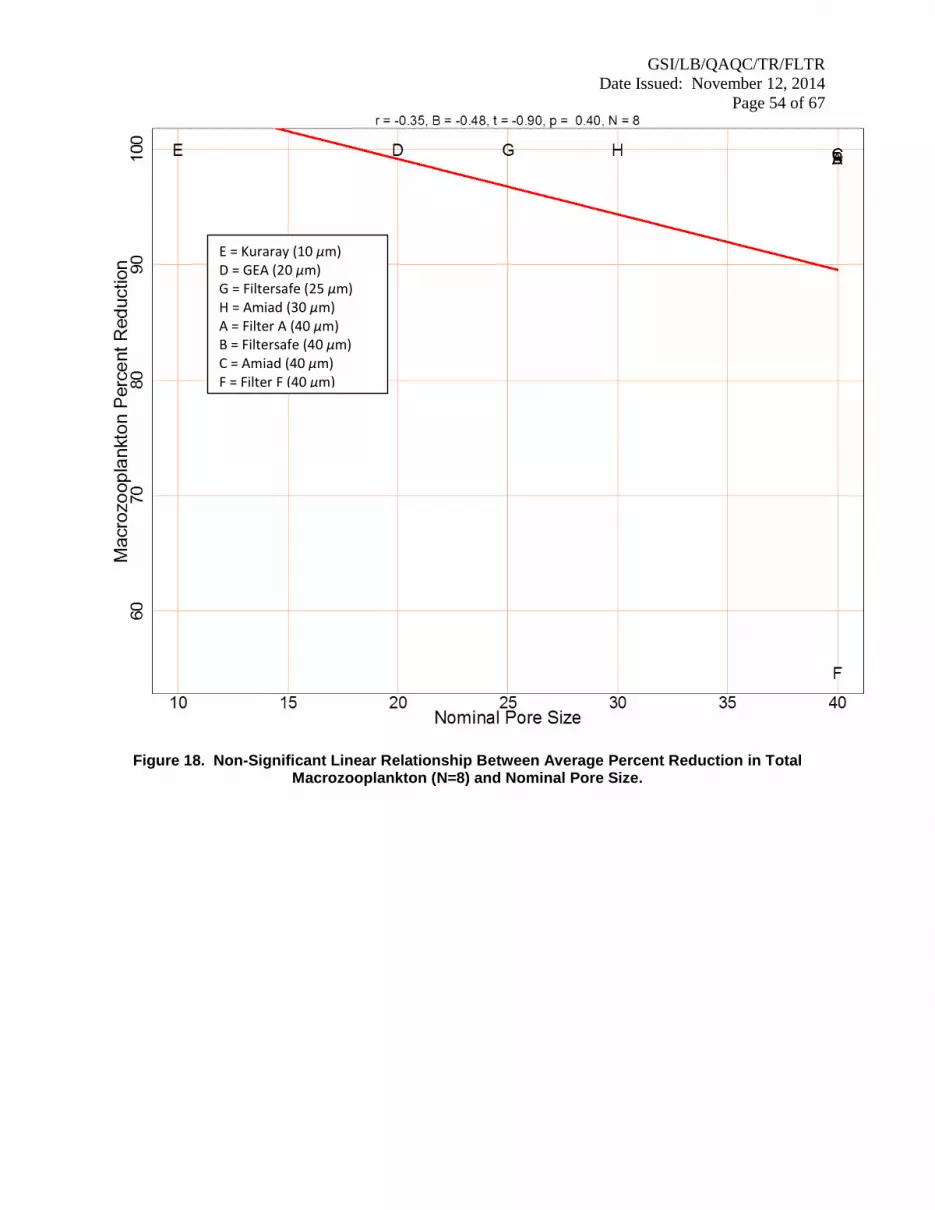
GSI/LB/QAQC/TR/FLTR
Date Issued: November 12, 2014
Page 54 of 67
Figure 18. Non-Significant Linear Relationship Between Average Percent Reduction in Total Macrozooplankton (N=8) and Nominal Pore Size.
E = Kuraray (10 µm) D = GEA (20 µm) G = Filtersafe (25 µm) H = Amiad (30 µm) A = Filter A (40 µm) B = Filtersafe (40 µm) C = Amiad (40 µm) F = Filter F (40 µm)
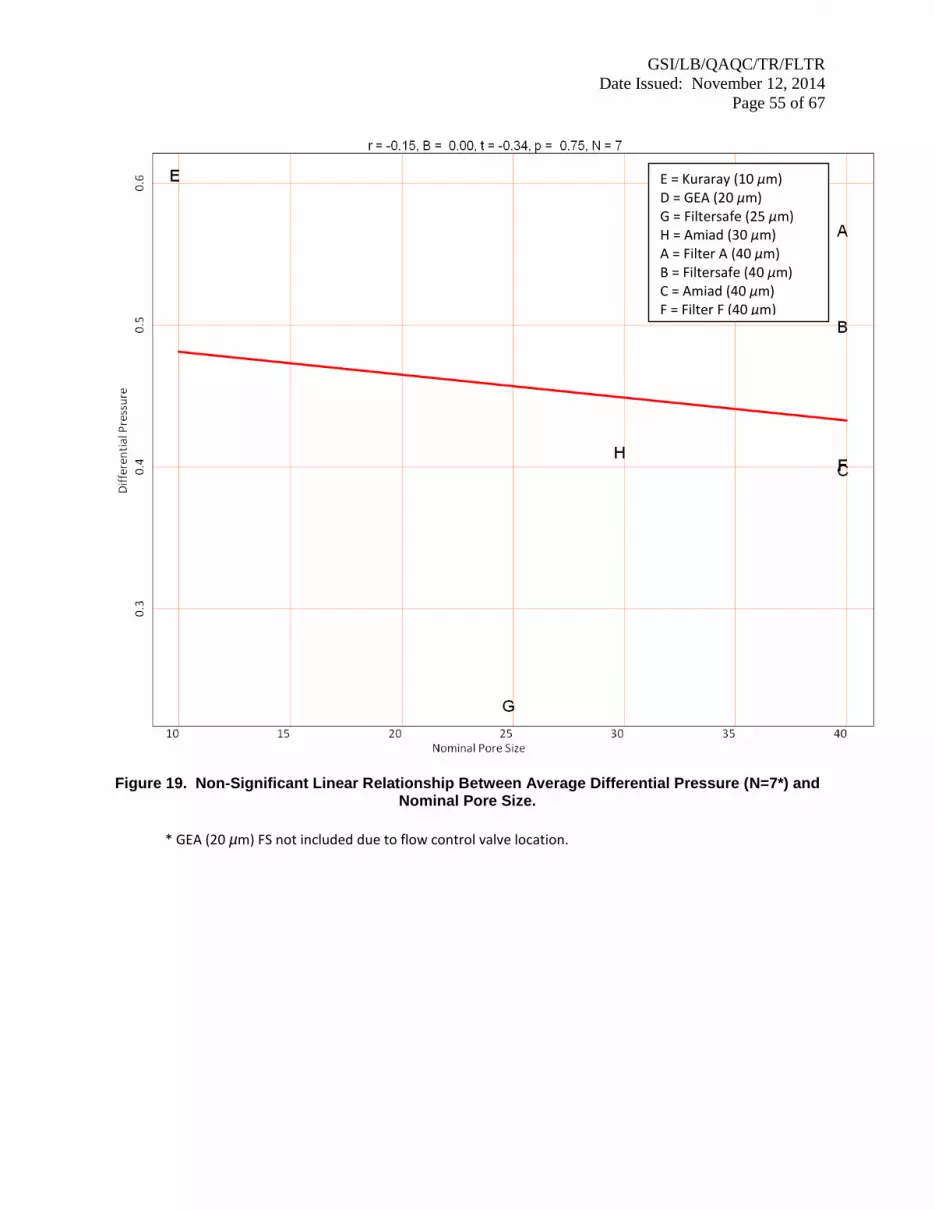
GSI/LB/QAQC/TR/FLTR
Date Issued: November 12, 2014
Page 55 of 67
Figure 19. Non-Significant Linear Relationship Between Average Differential Pressure (N=7*) and Nominal Pore Size.
* GEA (20 µm) FS not included due to flow control valve location.
E = Kuraray (10 µm) D = GEA (20 µm) G = Filtersafe (25 µm) H = Amiad (30 µm) A = Filter A (40 µm) B = Filtersafe (40 µm) C = Amiad (40 µm) F = Filter F (40 µm)

GSI/LB/QAQC/TR/FLTR
Date Issued: November 12, 2014
Page 56 of 67
Figure 20. Non-Significant Linear Relationship Between Average Backflush Flow Rate (N=8) and
Nominal Pore Size.
4.5.2 Relationships between Biological Performance and Operational Performance
Characteristics: Mixed Model Results
Controlling for intake water conditions (i.e., density of organisms across size classes and
subclasses, or TSS) did not alter the pattern of significance of findings obtained through simple
aggregation, though p values changed slightly. The mixed model results showed across FS
tested:
The relationship between FS nominal pore size and percent reduction of
microzooplankton was weaker (p = 0.078) than in the simple aggregation model (p =
0.06). The relationship between FS nominal pore size and percent reduction of protists
though also slightly weaker, remained highly significant (p=0.022).
E = Kuraray (10 µm) D = GEA (20 µm) G = Filtersafe (25 µm) H = Amiad (30 µm) A = Filter A (40 µm) B = Filtersafe (40 µm) C = Amiad (40 µm) F = Filter F (40 µm)

GSI/LB/QAQC/TR/FLTR
Date Issued: November 12, 2014
Page 57 of 67
From the FS with the smallest nominal pore size (10) to the FS with the largest nominal
pore size (40) the predicted delta in capacity for protist reduction was 55 percentage
points, and 49 percentage points for microzooplankton.
As FS nominal pore size increased, post-filtration density of live zooplankton ≥ 50 µm
significantly increased (p=0.039).
TSS did not affect FS organism removal capacity; neither natural fluctuations in Step 1
TSS levels nor the experimental augmentation in Step 3 were significant predictors of
percent reduction or post-filtration density of organisms measured.
The mixed model results further showed that:
Higher intake densities of protists and microzooplankton led to higher (p<0.05) percent
removal rates.
Higher intake density of live zooplankton in Step 3 was only marginally significantly
related to higher post-filtration density of live zooplankton ≥ 50 µm (p=0.063).
Higher percent reduction of protists significantly correlated with higher percent reduction
of microzooplankton, (r=0.733) but the correlation was not perfect (i.e., significantly
different from 1). One FS (FS C) had an unusual pattern of performance of relatively
lower percent reduction of protists and a relatively higher percent reduction of
microzooplankton compared to the other FSs.
Though they may appear contradictory, the first two observations are consistent with each other.
The higher intake densities of protists and microzooplankton led to higher percent removal by
FSs, likely due to more frequent partial occlusion of FS pores by organisms. Meanwhile, the
stepped up percent removal rates were not sufficiently higher to offset the increase in numbers of
organisms passing through the FS into post-filtered water.
4.6 Test Validity and Data Quality Indicators 4.6.1 Test Validity
Table 14 shows the biological and water chemistry/quality target values and results for pre-FS
water measured during applicable steps of the FS evaluations. For the ≥ 50 µm size class, i.e.,
zooplankton, the minimum target value was met for all FSs except FS F where live intake
densities dropped to 89,000/m3 and 92,000/m
3 for two of the four test cycles. FS F was tested in
mid-October, which is when zooplankton density in the DSH naturally begins to decline.
However, this reduction was only slightly below the minimum target of 100,000/m3. The
minimum target value for the ≥ 10 µm and < 50 µm size class was met for all FS test cycles
based on total density determined in preserved samples. The temperature target range was also
met for all FS test cycles. Finally, the TSS minimum target was met for all Step 3 FS test cycles,
except for two test cycles of Amiad (40 µm) and one test cycle of Filtersafe (25 µm).
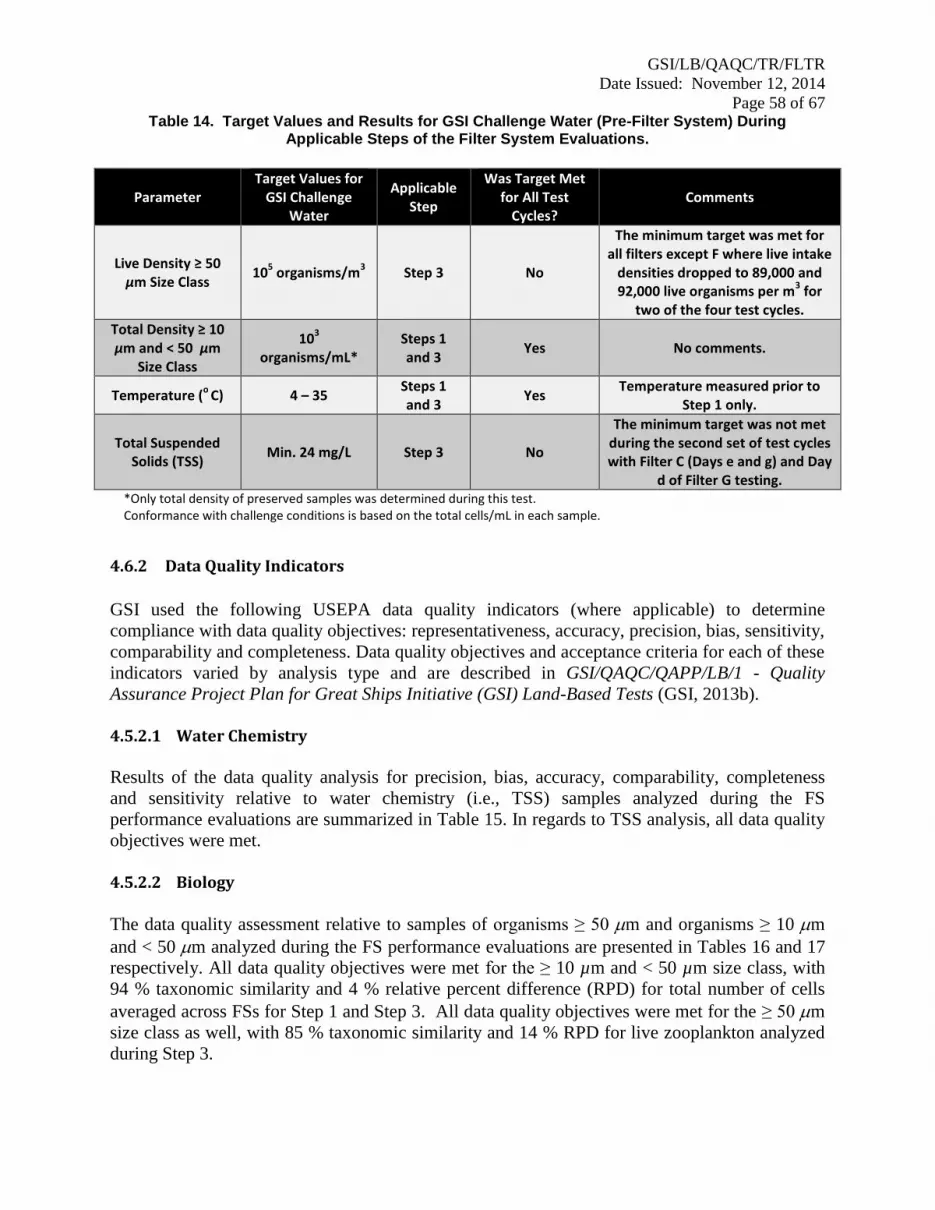
GSI/LB/QAQC/TR/FLTR
Date Issued: November 12, 2014
Page 58 of 67
Table 14. Target Values and Results for GSI Challenge Water (Pre-Filter System) During Applicable Steps of the Filter System Evaluations.
Parameter Target Values for
GSI Challenge Water
Applicable Step
Was Target Met for All Test
Cycles? Comments
Live Density ≥ 50 µm Size Class
105 organisms/m
3 Step 3 No
The minimum target was met for all filters except F where live intake
densities dropped to 89,000 and 92,000 live organisms per m
3 for
two of the four test cycles.
Total Density ≥ 10 µm and < 50 µm
Size Class
103
organisms/mL* Steps 1 and 3
Yes No comments.
Temperature (o
C) 4 – 35 Steps 1 and 3
Yes Temperature measured prior to
Step 1 only.
Total Suspended Solids (TSS)
Min. 24 mg/L Step 3 No
The minimum target was not met during the second set of test cycles with Filter C (Days e and g) and Day
d of Filter G testing. *Only total density of preserved samples was determined during this test. Conformance with challenge conditions is based on the total cells/mL in each sample.
4.6.2 Data Quality Indicators
GSI used the following USEPA data quality indicators (where applicable) to determine
compliance with data quality objectives: representativeness, accuracy, precision, bias, sensitivity,
comparability and completeness. Data quality objectives and acceptance criteria for each of these
indicators varied by analysis type and are described in GSI/QAQC/QAPP/LB/1 - Quality
Assurance Project Plan for Great Ships Initiative (GSI) Land-Based Tests (GSI, 2013b).
4.5.2.1 Water Chemistry
Results of the data quality analysis for precision, bias, accuracy, comparability, completeness
and sensitivity relative to water chemistry (i.e., TSS) samples analyzed during the FS
performance evaluations are summarized in Table 15. In regards to TSS analysis, all data quality
objectives were met.
4.5.2.2 Biology
The data quality assessment relative to samples of organisms ≥ 50 m and organisms ≥ 10 m
and < 50 m analyzed during the FS performance evaluations are presented in Tables 16 and 17
respectively. All data quality objectives were met for the ≥ 10 µm and < 50 µm size class, with
94 % taxonomic similarity and 4 % relative percent difference (RPD) for total number of cells
averaged across FSs for Step 1 and Step 3. All data quality objectives were met for the ≥ 50 m
size class as well, with 85 % taxonomic similarity and 14 % RPD for live zooplankton analyzed
during Step 3.

GSI/LB/QAQC/TR/FLTR
Date Issued: November 12, 2014
Page 59 of 67
Table 15. Data Quality Objectives, Criteria, and Results from Water Chemistry Analyses during the Filter System Performance Evaluations.
Data Quality Indicator Evaluation Process/
Performance Measurement Data Quality Objective Performance Measurement Result
Precision Samples (10 %) are collected in duplicate and analyzed. Performance measured by average
relative percent difference (RPD). < 20 % average RPD. 4.2 % RPD (TSS only)
Bias, Blanks and Filter Blanks
Deionized water samples (2 per day) filtered, dried, and weighed following the procedure
outlined in GSI/SOP/BS/RA/C/8 < 2.6 mg/L TSS Below detection
Accuracy Performance measured by average percent difference (%D) between all measured and
nominal reference standard values. < 20 % average 1.9 % D (TSS only)
Comparability Routine procedures conducted according to
appropriate SOPs to ensure consistency between test cycles.
Not Applicable – Qualitative.
The following GSI SOP was used for all TSS sample analyses:
GSI/SOP/BS/RA/C/8 – Procedure for Analyzing Total Suspended Solids (TSS), Particulate Organic Matter (POM) and
Mineral Matter (MM)
Sensitivity
The method detection limit (MDL) and limit of quantification (LOQ) for each analyte and
analytical method utilized determined annually prior to the start of the testing
season.
Not Applicable
TSS MDL = 0.78 mg/L TSS LOQ = 2.6 mg/L
POM MDL = 0.59 mg/L POM LOQ = 1.96 mg/L
Table 16. Data Quality Objectives, Criteria, and Results from Analyses of Organisms ≥ 50 m during the Filter System Performance Evaluations.
Data Quality
Indicator Evaluation Process/
Performance Measurement Data Quality Objective Performance Measurement Result
Bias
One pre-FS sample and one post-FS (Step 3 only) was analyzed by two separate
taxonomists per FS for each round of testing to determine operator bias.
> 80 % average Percent Similarity (PS) and < 20 % average Relative Percent
Difference (RPD).
85.76 % PS; 13.64 % RPD
Comparability Routine procedures are conducted according
to appropriate SOPs to ensure consistency between tests.
Not Applicable – Qualitative.
The following GSI SOP was used for all zooplankton sample analyses:
GSI/SOP/MS/RA/SA/2 – Procedure for Zooplankton Sample Analysis

GSI/LB/QAQC/TR/FLTR
Date Issued: November 12, 2014
Page 60 of 67
Table 17. Data Quality Objectives, Criteria, and Results from Analyses of Organisms ≥ 10 and < 50
m during the Filter System Performance Evaluations.
Data Quality Indicator
Evaluation Process/ Performance Measurement
Data Quality Objective Performance Measurement Result
Bias
One pre-FS sample and one post-FS sample (ambient or amended water) was analyzed by two separate taxonomists per FS for each test
cycle.
> 80 % average Percent Similarity (PS) and < 20 % average Relative Percent
Difference (RPD).
94.40% PS; 3.56% RPD
Comparability Routine procedures are conducted according
to appropriate SOPs to ensure consistency between tests.
Not Applicable – Qualitative.
The following GSI SOP was used for all protist sample analyses:
GSI/SOP/MS/RA/SA/1– Procedure for Protist Sample Analysis
5 DISCUSSION
The FSs evaluated in this study gave a strong performance operationally and biologically, more
so than the numbers may indicate at face value. The large proportion and relatively small size of
freshwater rotifers within the ≥ 50 µm size class of organisms, which often differentiate natural
freshwater challenge conditions from those confronted in saline systems or with cultured
organisms, presented a particular, though realistic, filtration challenge. Moreover, the values for
zooplankton reduction presented here are based on total numbers of organisms in filtered
discharge as opposed to live only, or live strictly ≥ 50 µm in minimum dimension. Therefore, the
filtered discharge density values contained in this study are conservative estimates of densities
relevant to numeric regulatory discharge standards. These realities make the strong FS
performance results in this study all the more remarkable. Still, it is clear from this study that
filtration alone, using processes and nominal pore sizes available in today’s market, cannot
deliver discharge meeting international or the U.S. regulatory standards for live organism
concentrations, in either the ≥ 50 µm, or ≥ 10 µm and < 50 µm size class, in fresh water.
Our results are an objective and reliable assessment of the range of FS operational and biological
capacities currently available, and conditions which influence them, based on a strong sampling
of the market. FS nominal pore size is currently only a marginally significant predictor of FS
biological effectiveness zooplankton and protists. Instead, currently, the FS itself (even for those
with a common nominal pore size) accounted for the vast majority of performance variability.
That is, currently, other FS attributes appeared to largely obscure the effect of nominal pore size
as a predictor of FS performance in the field.
In this study, higher organism intake densities affected reduction efficiency only in that higher
intake densities of organisms resulted in better removal rates for both protists and
microzooplankton; FS clogging effectively reduced FS nominal pore size for a period of time

GSI/LB/QAQC/TR/FLTR
Date Issued: November 12, 2014
Page 61 of 67
during FS operation. This reality did not translate to an improved position relative to a regulatory
standard, however, as these standards are based on absolute densities of organisms in discharge,
and absolute densities on discharge also increased with increased intake densities.
In our study, FS operational performance characteristics were not related (directly) to biological
performance trends. This fact runs counter to conventional wisdom that greater percent removal
of organisms comes at the expense of key operational performance priorities. Though some
important operational parameters such as power consumption were not tracked in these tests,
others—including flow rate, pressure differential and percent loss of flow to backflush—which
can be logically assumed at risk in the context of high biological removal, were tracked and the
relationship to biological performance efficiency proved non-significant.
Some additional important insights that our data may reveal are not yet presented in this
preliminary presentation of our results. For example, the relationship of FS nominal pore size to
the rate of removal of particular morphological subcategories of organisms within the
microzooplankton and protist taxonomic classes. This relationship likely varies, with some taxa
more sensitive to FS unit and nominal pore size differences than others. In addition, relationships
among pressure differential, backflush flow rate and percent reduction should be investigated in
a mixed model before drawing final conclusions. GSI collected a great deal of data not presented
here, including a third set of replicates for each FS, which will add power to all performance
analyses. These findings will be set forth in a subsequent and more comprehensive presentation
of our results.
Finally, GSI intentionally did not use information collected within this study to create an overall
ranking of FS performances across participating FS units for many reasons. Specifically, FSs
which comprise only one part of a BWMS, are typically designed to deliver specific
complementary capacities relative to a secondary treatment process. In addition, some important
operational and biological performance considerations were beyond the scope of this study, such
as comparative FS performance capacities over identical challenge conditions, long term FS
performance, FS energy demands, FS durability in actual shipboard conditions, or the extent of
FS developer support for FS operation in the field. GSI provided more detailed operational and
biological data to each of the FS developer for their in-house use, and GSI stands ready to
corroborate the validity of these data as an outcome of independent and objective assessment.
6 CONCLUSION
Consistent with project goals, this research provides reliable information on FS operational and
biological performance in freshwater under controlled conditions to FS developers, interested
ship owners, regulators and the public, without compromising the competitive standing of any
individual participating FSs in the market place. It explored trade-offs between operational and
biological performance endpoints; and supported FS, and thus BWMS performance
improvements in freshwater. The research revealed that numerous FSs are in the market place
which can perform effectively in challenging freshwater systems. It also showed that nominal
pore size, while a powerful predictor of FS performance, does not account for the wide
GSI/LB/QAQC/TR/FLTR
Date Issued: November 12, 2014
Page 62 of 67
variability in FS unit performances, and does not predict operational performance characteristics
measured here.
7 REFERENCES
GSI (2013). Great Ships Initiative (GSI) Test/Quality Assurance Plan for Land-Based Evaluation
of Filter Performance in Ambient and Augmented Duluth Superior Harbor Water. Northeast-
Midwest Institute, Washington, DC, USA.
GSI (2013b). Great Ships Initiative (GSI) GSI/QAQC/QAPP/LB/1 - Quality Assurance Project
Plan for Great Ships Initiative (GSI) Land-Based Tests. Northeast-Midwest Institute,
Washington, DC, USA.
IMO (2004). International Convention for the Control and Management of Ships Ballast Water
and Sediments. As adopted by consensus at a Diplomatic Conference at IMO, London, England,
February 13 2004.
United States Environmental Protection Agency (USEPA) (2010). Environmental Technology
Verification Program (ETV) Generic Protocol for the Verification of Ballast Water Treatment
Technology, Version 5.1. Report number EPA/600/R-10/146. U.S. EPA ETV in cooperation with
the U.S. Coast Guard Environmental Standards Division (CG-5224) and the U.S. Naval Research
Laboratory. National Sanitation Foundation International, Ann Arbor, Michigan, USA.
GSI/LB/QAQC/TR/FLTR
Date Issued: November 12, 2014
Page 63 of 67
APPENDIX 1
Filter System Company Statements
Company Statement from Manufacturer of Filter System A
Supplier of FS A wishes to thank the GSI for the test series performed and evaluated as well as
for the good working relationship. Being one of the filter suppliers not mentioning our names
within the report we specifically would like to point out that the decision to do so is purely based
on internal policy and not based on dissatisfying test results. On the contrary, we are very
satisfied and proud with the performance of our filter within the test.
Company Statement from Filtersafe®
Filtersafe® (www.filtersafe.net) wishes to thank GSI for its extensive efforts in conducting this
test trialing various filtration systems. Filtersafe® has participated in two trials, one using our
standard 40-50 µm filter and the second utilizing our 25-35 µm filter.
We are pleased with the test results, in particular with the mechanical reliability operation of our
filters achieving performance second to none. The zooplankton removal rate was also in line
with past experiences representing the screen‘s ratings.
Filtersafe®, the automatic screen filtration company, was founded more than 10 years ago with
the intent of servicing the new ballast water treatment (BWT) market. Based in Israel, the
company’s extensive experience in filtration and engineering has enabled it to deliver high
quality filtration solutions to BWT system vendors worldwide. Its filters are defined by
innovation that is directed by client requirements and executed by a strong research and
development programme.
Filtersafe’s® solutions stand out: There are five key factors. First, the
company has been involved in the BWT industry from its infancy 12 years ago and as such our
products have continually developed with and for this application; they are not off-the-shelf
products modified for BWT sales.
Second, the filters were designed to remove high dirt loads of organic matter (D-2 standard),
achieving 97 per cent removal rate of zooplankton and 50 per cent of phytoplankton.
Third, Filtersafe® manufactures and supplies a complete range of filter sizes catering for pre-
filtration of all BWT technologies; flow rates are from 50 m3/h up to 4300 m
3/h, and the filters
themselves are all single body units.
Fourth, our filters never clog and operate successfully in all water conditions to ensure smooth
operation of a BWT system.
GSI/LB/QAQC/TR/FLTR
Date Issued: November 12, 2014
Page 64 of 67
Fifth, our advanced and unique Proximity Nozzle and Sintered Screen technologies are used on
all filter models.
The Sintered Screen is Filtersafe’s® weave-wire technology utilizing four
finely meshed layers that are made of stainless steel for maximum durability. It is a standalone
screen requiring no further support but integrates perfectly with the Proximity Nozzle solution.
The Sintered Screen is available in two models: 316L for standard applications and 904L duplex
SST for high corrosion resistance and prolonged usage.
The Proximity Nozzle, is Filtersafe’s® patented autonomous hydraulic suction
system that cleans the screen. It covers less than one per cent of the screen to provide high and
consistent suction velocities. In doing so it minimizes residual water and pressure loss without
needing to halt the BWT system. Together, the two technologies push Filtersafe’s® products to
the forefront of the market.
As the company constantly developing its product portfolio, there have been several recent
technological developments. In 2010, for example, the first high flow rate model was released as
part of the BS-400 series, and in 2012 the first 4200 m3/h high flow rate filter (part of the BS-
1200 series) was produced. It has also worked hard to gain class approval from DNV, Lloyds
Register, BV, ABS and GL in order to assure clients and potential customers of the high
engineering standards across its range.
Filtersafe® currently has D-2 certification with over 15 BWT vendors the world over and
maintains a healthy and active relationship with them all. In terms of market share, as it currently
stands, this translates to over 20 per cent of the projected world market in BWT new build and
retrofit sales. Though we are not able to disclose with whom we currently have contracts, we do
have multiple contracts supplying both low and high flow rate filter units to leading maritime
hubs including Norway, South Korea, China, Europe and the US to name a few.
Anticipating D-2 ratification, Filtersafe® is opening a second manufacturing facility in 2014.
Expanded production capability will enable the company not only to turn out higher volumes of
filter units but also shorten the delivery times to its clients, thereby providing an even better
customer service. The site’s location in Asia was chosen for its strategic proximity to the
company’s important Chinese, Korean, Japanese, and Singaporean markets. Though located in
Asia, the plant will be owned and operated under supervision of the Israeli head office.
Filtersafe’s® plans for the coming years: “With time, and after selling and installing several
hundreds of filters onboard vessels, it is becoming clear that durability and ability to operate the
systems under all water conditions is the main challenge of BWT systems. Filtersafe® will keep
on investing heavily during the next two years in improvement of our filtration technologies.
Filtration will remain the backbone of BWT systems and constant R&D for this application will
dominate our activities in years to come.
GSI/LB/QAQC/TR/FLTR
Date Issued: November 12, 2014
Page 65 of 67
Company Statement from Amiad Water Systems
Amiad (www.amiad.com) wishes to thank GSI for the very professional and empirical manner of
research long awaited for by the market. The Amiad Omega Series of automatic self-cleaning
multi-screen filters provides high efficiency and a small footprint, combining Amiad’s Superior
Suction Scanning mechanism with a multi-screen design. Amiad’s robust, simple & efficient
filtration systems deliver the highest removal rates & filtration efficiency in the context of
changing and challenging solids loads. It is a proven filter that maintains performance integrity
and operation under the most challenging conditions.
The Amiad Omega Series designed for the Ballast Water market with multiple screens is
operated by a single electric self-cleaning mechanism. The “Omega” filter series range in flow
rates of up to 5,000 m³/h (22,000 gpm). Nominal pore sizes range from 500 microns down to 10
microns. Inlet/outlet flanges are available from 8”-24” diameter.
Based on Amiad’s proven suction scanning screen filtration technology
Highly efficient self-cleaning mechanism
Small footprint
High flow per unit
Back wash flow from 1% to 8% of total flow
High reliability
Easy and simple minimal maintenance
low energy consumption
Low-pressure operation
ASME / Ex Proof design optional
Applications: Membrane Protection, Ballast Water, Oil & Gas, Industrial Water and
Irrigation
Lloyds and DNV class approval
Company Overview
Amiad Water Systems is a leading global producer of automatic, self-cleaning water treatment
and filtration solutions. It has developed a range of innovative products and systems that provide
environmentally-sustainable solutions with low operating costs and a rapid return on capital
investment.
Amiad services the industrial, municipal, irrigation, oil & gas and ballast water markets. In these
segments, our patented products are being integrated into the core of systems for filtration and
water treatment, injection water, membrane protection, wastewater and potable water treatment,
industrial application, cooling systems and sea water filtration.
Since its establishment in 1962, Amiad has grown to include ten subsidiaries worldwide with
over 600 employees. Amiad solutions are delivered through its subsidiaries and extensive
distributor network to organizations spanning more than 80 countries. Amiad has built its global
reputation on high-quality standards, outstanding performance, product reliability, prompt
delivery, and excellent customer service.
GSI/LB/QAQC/TR/FLTR
Date Issued: November 12, 2014
Page 66 of 67
The Filtration Process
Raw water enters from the filter inlet and passes through the multi-screens. Clean water flows
through the filter outlet. Organisms and suspended solids, greater than the given filtration degree
accumulates on the screen surface, causing gradual buildup of differential pressure. A PLC
continuously monitors the DP across the filter and initiates the self-cleaning process according to
a pre-set program.
Global Presence
Amiad has ten subsidiaries and eight production sites across the globe; including: Australia,
Singapore, China, India, Turkey, Israel, Europe, Brazil, Mexico & USA east and west coast
Amiad invests extensive resources in R&D. Amiad is proud to be a technological leader with
broad engineering and research and development capabilities. Amiad constantly strives to
develop more efficient and superior water treatment and filtration solutions for both simple and
high-complexity projects.
Amiad’s mission is to continue to develop advanced and innovative water filtration solutions in
order to enhance production process, protecting infrastructure, reduce carbon footprint & comply
with regulations.
Notes on FS Performance in GSI Tests
Backwash flow: The back flush flow rate of Omega IE in continuous flushing mode is 36 m3/hr
which is 7.2 % of 500 m3/hr. the designed flow rate for Omega 1E. Since the filter in the test was
operating at 340 m3/hr than the flushing flow was about 10 % from the total flow
Removal rate: Amiad actual filtration degree in the GSI tests proves a persistent, high and
continually effective removal rate relevant to the declared filtration degree. Amiad removal rate
of organisms between of 10 to 50 µm indicates a strong correlation to the filtration degree and a
very efficient retention capacity of the screens as well efficient cleaning

GSI/LB/QAQC/TR/FLTR
Date Issued: November 12, 2014
Page 67 of 67
Company Statement from KURARAY CO., LTD.
We are grateful to GSI and NEMWI for the opportunity to join the filter system evaluation.
Kuraray Co., Ltd. is a manufacturer of the ballast water management system MICROFADE.
MICROFADE has a dual stage process of filtration followed by chemical infusion of calcium
hypochlorite. A neutralization step prior to discharge ensures environmental compliance of the
treated ballast water.
For this study, Kuraray Co., Ltd offered MIDROFADE’s filtration unit to GSI for the evaluation.
General information of MICROFADE is available at the following URL:
http://www.kuraray.co.jp/en/products/medical/microfade.html
Company Statement from GEA Westfalia
GEA Westfalia Separator Group offers leading technologies and individual systems for marine
use. Westfalia Separator® BallastMaster ultraV is a highly efficient mechanical/physical system
solution for treating ballast water including that with a high concentration of organisms and
sedimentary particles. The mechanical filtration used in the BallastMaster 250 ultraV is
developed by GEA Westfalia especially for the most challenging task of treating ships ballast
water with possible physical water parameters exiting worldwide.
The filter process upstream removes organisms and sedimentary particles larger than 20 microns
with a high reduction rate. According to the IMO convention, this prevents sedimentary deposits
accumulating in the ballast water tanks, as well as guaranteeing in the second stage an optimum
result for ballast water disinfecting. The filter modules are cleaned automatically by vacuum
extraction (self-cleaning).