final report of the shipboard testing of the sodium hydroxide (naoh) ballast water treatment system...
TRANSCRIPT

GSI/SB/F/TR/1 March 22, 2013
Page 1 of 53
FINAL REPORT OF THE SHIPBOARD TESTING OF THE SODIUM HYDROXIDE (NaOH) BALLAST WATER TREATMENT
SYSTEM ONBOARD THE MV INDIANA HARBOR
March 22, 2013
Principal Investigator:
Allegra Cangelosi, NEMWI
Research Team:
Lisa Allinger, NRRI, UMD
Mary Balcer, PhD, LSRI, UWS Lana Fanberg, LSRI, UWS Debra Fobbe, LSRI, UWS
Steve Hagedorn, LSRI, UWS Travis Mangan, NEMWI
Adam Marksteiner, AMI Engineering Nicole Mays, NEMWI
Christine Polkinghorne, LSRI, UWS Kelsey Prihoda, LSRI, UWS
Euan Reavie, PhD, NRRI, UMD Deanna Regan, LSRI, UWS
Donald Reid, Consultant Elaine Ruzycki, NRRI, UMD Heidi Saillard, LSRI, UWS Heidi Schaefer, LSRI, UWS
Tyler Schwerdt, AMI Engineering Matthew TenEyck, LSRI, UWS
GSI/SB/F/TR/1 March 22, 2013
Page 2 of 53
Final Report of the Shipboard Testing of the Sodium Hydroxide (NaOH) Ballast Water
Treatment System Onboard the MV Indiana Harbor
March 22, 2013
Allegra Cangelosi Principal Investigator and Director
Great Ships Initiative Northeast-Midwest Institute
50 F St. NW, Suite 950 Washington, DC 20001 Phone: 202-464-4014
Email: [email protected]
Approved for Release:
XAllegra CangelosiPrincipal Investigator of Great Ships Initiative

GSI/SB/F/TR/1 March 22, 2013
Page 3 of 53
EXECUTIVESUMMARY The Great Ships Initiative (GSI) provides independent performance/verification testing services to developers of ballast water treatment systems (BWTSs) at the bench, land-based and shipboard scales. GSI has the expertise and resources to perform tests consistent with the requirements of the International Maritime Organization’s (IMO’s) International Convention for the Control and Management of Ships Ballast Water and Sediments (IMO, 2004) and the United States Environmental Protection Agency (USEPA), Environmental Technology Verification (ETV) Program’s protocols (e.g., USEPA, 2010). GSI performs formal verification tests appropriate to market-ready prototype BWTSs, and informal “status tests” for BWTSs that are still in the research and development stages. GSI procedures, methods, materials and findings are publicly accessible on the GSI website (www.greatshipsinitiative.org). In the summer of 2010, the National Parks of Lake Superior Foundation and researchers from the U.S. Geological Survey’s Leetown Science Center (USGS), received support from the USEPA’s Great Lakes Restoration Initiative (GLRI) to develop and trial a full-scale BWTS involving NaOH with applicability to U.S. flag vessels in Great Lakes trade. As part of this project, the research team enlisted GSI to undertake a status test on BWTS’ biological effectiveness and residual toxicity in the context of a single shipboard trial (one ballast uptake operation, one retention period, and one ballast discharge operation). The installation to be tested was a temporary and partial (two tank) prototype installed in two tanks on board the motor vessel (MV) Indiana Harbor, with alternate dosing approaches in each of the two tanks. The subject BWTS involved elevating pH by adding sodium hydroxide (NaOH, in the same formulation used for lye or caustic soda), retaining treated ballast water for a minimum period, and then neutralizing the ballast water prior to discharge. GSI’s status test involved collecting preliminary data on the biological treatment efficacy and residual toxicity (i.e., via whole effluent toxicity, WET, testing) from a single demonstration voyage based on measurement of ballast uptake into and discharge from two treatment tanks and two control tanks. GSI developed a detailed test plan that described the design of the single biological efficacy trial (including sample collection, analysis endpoints, sample handling and custody, WET, and data collection and recording), which was subject to review and comment by the NaOH BWTS development team prior to finalization (GSI, 2011). The GSI status test began on August 18, 2011, during normal vessel ballast intake operations in the port of Gary, Indiana, and concluded three days later on August 22 during normal vessel ballast discharge operations in the port of Superior, Wisconsin. On intake, GSI sampled harbor water that was loaded into four of the ship’s port side tanks (2P, 3P, 4P and 5P). There were adequate numbers of live zooplankton in the intake water (i.e., 43,000/m3 to 235,000/m3 of live organisms ≥ 50 µm) to warrant continuation of the trial. The water in two of these tanks (3P and 4P) was concurrently dosed with enough 50 % (w/v) NaOH solution to achieve a pH of about 12. Approximately 18 hours prior to the MV Indiana Harbor’s arrival in Superior an in-tank carbonation system was activated in both treatment tanks to neutralize the pH of the treated water to below 8.8, i.e., a level considered safe for release into the receiving harbor. Following the vessel’s arrival in port, the ballast water from the treatment tanks and the untreated water from the control tanks was discharged in sequence and sampled.
GSI/SB/F/TR/1 March 22, 2013
Page 4 of 53
As a single replicate, this GSI status test of the prototype BWTS is in no way conclusive or determinative. The results reported here provide only an indication of the system’s potential effectiveness relative to no treatment. In this single trial, BWTS-treated discharge contained live organisms ≥ 50 µm (i.e., zooplankton) in concentrations ranging 178/m3 to 441/m3. These concentrations are lower than control discharge densities which ranged from 100,000/m3 to 167,000/m3. Densities of live organisms ≥ 10 and < 50 μm in the treatment discharge ranged from 2 cell/mL to 8 cells/mL, while control discharge concentrations were higher, ranging from 53 cells/mL to 92 cells/mL. In terms of organisms < 10 µm, the trial produced inconclusive results with concentrations of both total coliforms and heterotrophic bacteria highest in discharge samples from one of the treatment tanks (4P). The results from a WET test indicate that the treated and neutralized discharge water produced no residual toxicity to green algae (Selenastrum capricornutum) or the fathead minnow (Pimephales promelas). However, in these tests, the treated ballast water significantly affected both survival and reproduction of the cladoceran Ceriodaphnia dubia, indicating possible residual toxicity. The BWTS developer asserts that this toxicity could derive from artifactual pH-drift during the WET test; pH increased by a maximum of about one unit over the 24 hour period following each daily renewal (Appendix 1). The GSI team did not control pH drift in daily exposures during the WET tests to avoid altering the inherent properties (including conductivity) of the discharge water subject to toxicity testing. Overall, the BWTS warrants further development and evaluation at the land- and ship-based levels.
GSI/SB/F/TR/1 March 22, 2013
Page 5 of 53
ACKNOWLEDGMENTS
The authors would like to express our sincere gratitude to the Great Ships Initiative (GSI) Advisory Committee which provides invaluable input to the GSI project. We also wish to thank the ten United States and Canadian Great Lakes Ports which launched the GSI, and the Great Lakes Protection Fund which supported the initial scoping exercise. We sincerely thank the United States Department of Transportation, Maritime Administration, and National Oceanic and Atmospheric Administration for their substantial financial and in-kind support for the construction of the state-of-the-art GSI land-based testing facility. We thank the United States and Canadian St. Lawrence Seaway organizations, the Legislative Citizens Commission on Minnesota Resources, the University of Wisconsin-Superior, and the City of Superior, WI, for their active financial and/or in-kind support for GSI operations. This project was funded by the United States Environmental Protection Agency’s Great Lakes Restoration Initiative grant to the National Parks of Lake Superior Foundation. We thank the National Park Service, in particular Phyllis Green and Jeffrey Henquinet, and the United States Geological Survey, specifically Dr. Barnaby Watten, for their participation on this project, which included project coordination, permitting, and development and implementation of the ballast water treatment system. We especially thank the owners, officers and crew of the M/V Indiana Harbor and the owners and staff of the US Steel Gary Works (Gary, Indiana) and Midwest Energy (Superior, Wisconsin) port terminals.
GSI/SB/F/TR/1 March 22, 2013
Page 6 of 53
TABLEOFCONTENTS
EXECUTIVE SUMMARY .................................................................................................................................. 3
ACKNOWLEDGMENTS ................................................................................................................................... 5
TABLE OF CONTENTS ..................................................................................................................................... 6
LIST OF TABLES .............................................................................................................................................. 8
LIST OF FIGURES ............................................................................................................................................ 9
LIST OF ABBREVIATIONS AND ACRONYMS ................................................................................................. 10
1. INTRODUCTION ................................................................................................................................... 12
2. THE TESTING ORGANIZATION ............................................................................................................. 12
2.1. Overview ..................................................................................................................................... 12
2.2. Organization ................................................................................................................................ 13
2.3. Senior Research Personnel ......................................................................................................... 13
3. THE BALLAST WATER TREATMENT SYSTEM ........................................................................................ 16
4. DESCRIPTION OF THE TEST VESSEL ..................................................................................................... 16
5. TEST OBJECTIVES AND EXPERIMENTAL DESIGN ................................................................................. 17
5.1. Test Objectives ............................................................................................................................ 17
5.2. Experimental Design ................................................................................................................... 18
6. CHALLENGE CONDITIONS.................................................................................................................... 18
7. SAMPLE COLLECTION, HANDLING AND ANALYSIS .............................................................................. 19
7.1. Sample Collection........................................................................................................................ 19
7.1.1. Overview ............................................................................................................................. 19
7.1.2. Water Quality/Water Chemistry ......................................................................................... 23
7.1.3. Biology ................................................................................................................................. 24
7.1.4. Whole Effluent Toxicity (WET) ............................................................................................ 25
7.2. Sample Handling and Custody .................................................................................................... 26
7.3. Sample Analysis ........................................................................................................................... 27
7.3.1. Operational Data ................................................................................................................. 27
7.3.3. Water Chemistry ................................................................................................................. 28
7.3.4. Biology ................................................................................................................................. 28
7.3.5. Whole Effluent Toxicity (WET) ............................................................................................ 30
7.4. Data Management and Analysis ................................................................................................. 32
8. QUALITY MANAGEMENT..................................................................................................................... 32
9. RESULTS .............................................................................................................................................. 33
9.1. Experimental Conditions ............................................................................................................. 33

GSI/SB/F/TR/1 March 22, 2013
Page 7 of 53
9.1.1. Operational Characteristics ................................................................................................. 33
9.1.2. Water Quality ...................................................................................................................... 34
9.1.3. Water Chemistry ................................................................................................................. 36
9.1.4. Biota in Pre‐Treatment/Control Intake and Control Discharge Samples ............................ 39
Chain (Aulacoseira, Melosira, S. binderanus) ............................................................................................. 42
9.2. Experimental Outcomes .............................................................................................................. 43
9.2.1. Biological Treatment Efficacy .............................................................................................. 43
9.2.1.1. Organisms ≥ 50 µm ......................................................................................................... 43
9.2.1. Environmental Acceptability ............................................................................................... 45
10. DISCUSSION OF RESULTS ................................................................................................................ 49
11. CONCLUSION ................................................................................................................................... 50
REFERENCES ................................................................................................................................................ 50
Appendix 1 – Letter from Jeffrey W. Henquinet of the National Parks of Lake Superior Foundation. ...... 52

GSI/SB/F/TR/1 March 22, 2013
Page 8 of 53
LISTOFTABLES Table 1. Name, Project Role, Parent Organization, Experience and Education of GSI Personnel. ............ 15 Table 2. Test Vessel Data and Service Description. ................................................................................... 17 Table 3. Schedule of Events for Intake and Discharge Ballast Water Operations and Sample Collection Times for the NaOH BWTS Evaluation. ....................................................................................................... 18 Table 4. Type, Number and Size of Control and Pre‐Treatment Samples Collected During Ballast Intake Operations Onboard the MV Indiana Harbor on August 18‐19, 2011 in Gary, Indiana. ............................ 26 Table 5. Type, Number and Size of Control and Treatment Samples Collected During Ballast Discharge Operations Onboard the MV Indiana Harbor on August 21‐22, 2011 in Superior, Wisconsin. .................. 27 Table 6. GSI Standard Operating Procedures Used for Whole Effluent Toxicity Testing. ......................... 31 Table 7. Ballast Intake and Discharge Sample Collection Data from the Four Experimental Ballast Tanks Sampled during the Sodium NaOH BWTS Shipboard Trial onboard the MV Indiana Harbor. ................... 35 Table 8. Intake and Discharge Water Quality Data Measured in the Four Experimental Ballast Tanks (n=1 per Operation and Tank). ............................................................................................................................ 36 Table 9. Concentration of Total Suspended Solids (TSS), Percent Transmittance (%T, Filtered and Unfiltered), Non‐Purgeable Organic Carbon (NPOC), Dissolved Organic Carbon (DOC), Particulate Organic Carbon (POC), and Mineral Matter (MM) in Intake and Discharge Ballast Water Sampled from the MV Indiana Harbor. Note: Where n>1 the mean value is reported. ............................................................... 38 Table 10. Ballast Intake and Discharge Sample Collection and Analysis Times for Organisms in the ≥50
m Size Class. .............................................................................................................................................. 39 Table 11. Live Density (#/m3) and Taxonomic Diversity of Organisms in Intake and Control Discharge Samples Collected from Experimental Ballast Tanks. ................................................................................. 41
Table 12. Live Density (cells/mL) and Taxonomic Diversity of Organisms ≥ 10 m and 50 m in Intake and Control Discharge Samples Collected from Experimental Ballast Tanks. ............................................ 42 Table 13. Densities of E. coli, Total Coliforms, Enterococci and Heterotrophic Bacteria in Control Discharge Samples Collected from Experimental Ballast Tanks. ................................................................ 43 Table 14. Densities of Live Organisms by Size Class in Treated Discharge Samples Compared to the IMO Ballast Water Performance Standard. ........................................................................................................ 44 Table 15. Average Values (min, max) for Water Chemistry Parameters of Stock Solutions used in the Whole Effluent Tests with Ceriodaphnia dubia and Pimephales promelas. Effluent was Treated and Untreated Ballast Water from the MV Indiana Harbor. ............................................................................. 45 Table 16. Average Values (min, max) for Water Chemistry Parameters of Exposure Solutions used in Whole Effluent Tests with C. dubia. Effluent was Treated and Untreated Ballast Water from the MV Indiana Harbor. ........................................................................................................................................... 46 Table 17. Ceriodaphnia dubia Mean (n=10) Percent Survival and Total Number of Offspring Produced in a Three‐brood WET Test After Exposure to Treated and Untreated Ballast Water Collected from the MV Indiana Harbor. ........................................................................................................................................... 47 Table 18. Average Values (min, max) for Water Chemistry Parameters of Exposure Solutions used in Whole Effluent Tests with P. promelas. Effluent was Treated and Untreated Ballast Water from the MV Indiana Harbor. ........................................................................................................................................... 47 Table 19. Pimephales promelas Mean (n=4) Percent Survival and Average Weight per Individual After Exposure to Treated and Untreated Ballast Water Collected from the MV Indiana Harbor. .................... 48 Table 20. Average Values (minimum, maximum) for Water Chemistry Parameters of Exposure Solutions used in Whole Effluent Tests with Selenastrum capricornutum. Effluent was Treated and Untreated Ballast Water from the MV Indiana Harbor. ............................................................................................... 48

GSI/SB/F/TR/1 March 22, 2013
Page 9 of 53
Table 21. 96 Hour Mean (n=4) Cell Density of the Green Algae Selenastrum capricornutum After Exposure to Treated and Untreated Ballast Water Collected from the MV Indiana Harbor. .................... 49
LISTOFFIGURES Figure 1. Sample Collection Ports Installed in the MV Indiana Harbor's Ballast Piping. ........................... 21 Figure 2. Sample Collection Apparatus Installed in the MV Indiana Harbor's Engine Room. ................... 22

GSI/SB/F/TR/1 March 22, 2013
Page 10 of 53
LISTOFABBREVIATIONSANDACRONYMS %T: Percent Transmittance ACCU: Automated Control System Certified BWT: Ballast Water Treatment BWTS: Ballast Water Treatment System CFU: Colony Forming Units CO2: Carbon Dioxide DOC: Dissolved Organic Carbon DOM: Dissolved Organic Matter EMD: Electro Motive Division ETV: Environmental Technology Verification FDA: Fluorescein Diacetate ft.: Feet GSI: Great Ships Initiative GLRI: Great Lakes Restoration Initiative gpm: Gallons Per Minute HDPE: High Density Polyethylene Hr: Hour ID: Internal Diameter IMO: International Maritime Organization IN: Indiana LAN: Local Area Network LSRI: Lake Superior Research Institute MM: Mineral Matter MPN: Most Probable Number MS: Microsoft MTU: Michigan Technological University MV: Motor Vessel Na2CO3: Sodium Carbonate NaHCO3: Sodium Bicarbonate NaOH: Sodium Hydroxide NEMWI: Northeast-Midwest Institute NPOC: Non-Purgeable Organic Carbon NRRI: Natural Resources Research Institute PI: Principal Investigator and Director POC: Particulate Organic Carbon POM: Particulate Organic Matter PVC: Polyvinyl Chloride QA: Quality Assurance QAPP: Quality Assurance Project Plan QAQC: Quality Assurance/Quality Control QC: Quality Control QMP: Quality Management Plan RDTE: Research, Development, Testing, and Evaluation SOP: Standard Operating Procedure TOC: Total Organic Carbon TRO: Total Residual Oxidants TSS: Total Suspended Solids UMD: University of Minnesota-Duluth

GSI/SB/F/TR/1 March 22, 2013
Page 11 of 53
USCG: United States Coast Guard USEPA: United States Environmental Protection Agency USGS: United States Geological Survey UWS: University of Wisconsin-Superior WET: Whole Effluent Toxicity WI: Wisconsin WIDNR: Wisconsin Department of Natural Resources WPDES: Wisconsin Pollution Discharge Elimination System

GSI/SB/F/TR/1 March 22, 2013
Page 12 of 53
1. INTRODUCTION In the summer of 2010, the National Parks of Lake Superior Foundation and researchers from the U.S. Geological Survey’s Leetown Science Center (USGS) received support from the United States Environmental Protection Agency’s (USEPA’s) Great Lakes Restoration Initiative (GLRI) to trial a partial installation at the shipboard-scale of a ballast water treatment system (BWTS) involving sodium hydroxide (NaOH, in the same formulation used for lye or caustic soda) with applicability to U.S. flag vessels in Great Lakes trade. As part of this project, the researchers installed a temporary and partial (affecting two ballast tanks only) version of the treatment process on board the motor vessel (MV) Indiana Harbor and enlisted the Great Ships Initiative (GSI) to conduct an independent status test that would collect preliminary data on the BWTS’ biological treatment efficacy and environmental acceptability (i.e., residual toxicity). In April 2011, GSI drafted a test plan that described the design of the single biological efficacy trial (including sample collection; sample analysis; sample handling and custody; whole effluent toxicity, WET; and data collection and recording). The draft test plan was reviewed by the NaOH BWTS development team and the test plan was revised and finalized by GSI on August 9, 2011. GSI gathered data during a single demonstration voyage, according to the test plan (GSI, 2011). This report, which details methods and findings from that one trial, was also reviewed by the BWTS developer, and includes their one-page response to the GSI test findings (Appendix 1). GSI undertook status testing of a similar version of the NaOH BWTS in the summer of 2010 at its land-based testing facility in Superior, Wisconsin (GSI, 2011b). In those tests, the system treated source water without interruption, and neutralized treated water to levels acceptable for discharge to Wisconsin waters (i.e., within the range of pH 6-9). The BWTS also significantly reduced live organism densities in treated discharge relative to control discharge in all size classes of organisms (GSI, 2011b). Overall, GSI determined that the BWTS warranted additional testing at the land-based and ship-board scale (GSI, 2011b).
2. THETESTINGORGANIZATION 2.1. Overview GSI is a regional effort devoted to ending the problem of ship-mediated invasive species in the Great Lakes-St. Lawrence Seaway System and globally. In support of that goal, GSI provides independent, superlative freshwater ballast treatment evaluation capabilities at three scales—bench, land-based and on board ship. GSI testing is performed at the scale appropriate to the treatment’s state of development, with the goal of helping meritorious BWTSs progress as rapidly as possible to an approval-ready and market-ready condition. To assure relevancy of test output, GSI test protocols are consistent with the requirements of the International Maritime Organization’s (IMO’s) International Convention for the Control and Management of Ships Ballast Water and Sediments (IMO, 2004), and are also consistent with the USEPA Environmental Technology Verification (ETV) Program’s protocols (e.g., USEPA, 2010) as practicable. GSI procedures, methods, materials, and findings are also publicly accessibly on the GSI website (www.greatshipsinitiative.org).
GSI/SB/F/TR/1 March 22, 2013
Page 13 of 53
2.2. Organization GSI is a project of the Northeast-Midwest Institute (NEMWI)—a Washington, D.C-based private, non-profit, and non-partisan research organization dedicated to the economic vitality, environmental quality, and regional equity of Northeast and Midwest states. The project is carried out collaboratively with contracting entities including the Lake Superior Research Institute (LSRI) of the University of Wisconsin-Superior (UWS), AMI Consulting Engineers, Broadreach Services, and the Natural Resources Research Institute (NRRI) of the University of Minnesota-Duluth (UM-D), among others. 2.3. SeniorResearchPersonnel Ms. Allegra Cangelosi of NEMWI is GSI’s Principal Investigator and Director (GSI PI). She is responsible for planning and leading the overall GSI research agenda; developing experimental designs; approving quality system documents and standard operating procedures (SOPs); and making all final decisions on GSI shipboard sampling designs and modifications. In coordination with other GSI research team personnel, she is responsible for analyzing GSI experimental outcomes and writing up findings. She is also responsible for coordinating GSI research activities and funds to support them, and interaction with the project Advisory Committee, treatment developers, regulatory community, and public. Ms. Nicole Mays of NEMWI is the GSI’s Senior Quality Systems Officer responsible for development and maintenance of the GSI Quality Management Plan (QMP; GSI, 2011c), GSI’s Quality Assurance Project Plans (QAPPs), and SOPs, and writing of QAQC annual reports. Ms. Kelsey Prihoda of the UWS’s Lake Superior Research Institute (LSRI) is the GSI’s Senior Quality Assurance/Quality Control (QAQC) Officer. She is responsible for implementing all GSI project-specific QAQC activities including audits and assessments, and write-up of QAQC reports on specific test activities. Ms. Prihoda is also responsible for assisting in the development of SOPs and project-specific QAPPs. Researchers from UWS’s LSRI and the UMD’s NRRI, among others, provide critical scientific and technical complementary expertise and implementation services to the GSI PI. Dr. Mary Balcer of LSRI is GSI’s Senior Zooplankton Scientist and LSRI Team Leader. In the first role, she is responsible for developing SOPs and coordinating with GSI research personnel to assure effective zooplankton sample collection and handling. She is also responsible for the supervision of LSRI technicians in the implementation of relevant SOPs. In the latter role she serves as LSRI’s primary contact and is responsible for LSRI’s GSI-related project activities, including development of budgets, statements of work, scheduling, hiring, and contractual matters. Mr. Matt TenEyck is GSI’s Lead Investigator for WET Tests and Bench-Scale Studies. In this role Mr. TenEyck is responsible for development and implementation of WET testing SOPs and coordinating with GSI research personnel to assure effective sample collection and handling. Dr. Euan Reavie of UMD’s NRRI is GSI’s Senior Phytoplankton Scientist and NRRI Team Leader. In the first role he is responsible for development of phytoplankton/algal SOPs, coordinating with GSI research personnel to assure effective phytoplankton sample collection
GSI/SB/F/TR/1 March 22, 2013
Page 14 of 53
and handling, and supervision of technicians in the implementation of relevant SOPs. In the latter role he serves as NRRI’s primary contact and is responsible for NRRI’s GSI-related project activities, including development of budgets, statements of work, scheduling, hiring, and contractual matters. Ms. Heidi Saillard of LSRI is GSI’s Microbial Analyst. She is responsible for development and implementation of the microbial-related SOPs, coordinating with GSI personnel to assure appropriate microbial sample collection and handling, and analysis of microbial samples according to relevant SOPs. She is advised by Dr. Esther Angert of Cornell University’s Department of Microbiology (Ithaca, New York). Ms. Deanna Regan of LSRI is GSI’s Chemist. In this role she is responsible for development and implementation of chemistry-related SOPs at all scales of testing. Ms. Regan also works closely with Mr. Matt TenEyck to help execute SOPs at the bench-scale, particularly those involving active substances. Mr. Tyler Schwerdt of AMI Consulting Engineers P.A. is GSI’s Engineer. In this role Mr. Schwerdt serves as the field engineer supporting GSI land-based and shipboard test activities. He is also responsible for operating the GSI Land-Based Research, Development, Testing and Evaluation (RDTE) Facility and assuring that the facility is properly maintained. In addition Mr. Schwerdt is responsible for the development of SOPs as they relate to operational/engineering aspects of GSI land-based and shipboard tests, and coordinating with the GSI PI and senior researchers to assure effective sample and data collection. Mr. Schwerdt also coordinates land-based facility site security and makes certain that the facility is correctly commissioned and winterized each operating season. Mr. Schwerdt works under the supervision of Mr. Chad Scott, President and Principal of AMI Consulting Engineers, and is assisted by Mr. Adam Marksteiner, also of AMI Consulting Engineers. GSI’s Site Manager (Mr. Travis Mangan, NEMWI) works under the direct supervision of the GSI PI, and his role is to support GSI research and operational personnel to assure effective testing at GSI research sites, including at the land-based testing facility and onboard ships. Mr. Mangan assures that all equipment and supplies are in a ready state for each testing event, and facilitates real-time communication between the research team and Ms. Cangelosi during test activities. During testing activities, Mr. Mangan also provides a central locus of communication with the PI to assure thorough transmittal of relevant new information to the active team. In addition, Mr. Mangan provides scientific and engineering/operational support as needed and is responsible for ensuring worker health and safety at the land-based site, and coordinating GSI’s discharge permit reporting requirements. Mr. Steve Hagedorn of LSRI is GSI’s Database Manager. In this role he is responsible for management of the GSI Biological Research Database and development and implementation of data management SOPs. Mr. Hagedorn works closely with GSI’s senior scientists and the GSI Senior QAQC Officer to undertake this role. Overall, GSI personnel have extensive expertise in bench, land-based and shipboard testing and evaluation of BWTSs. The GSI QMP (GSI, 2011c) assures that personnel have the necessary

GSI/SB/F/TR/1 March 22, 2013
Page 15 of 53
education, qualifications, and experience needed to effectively carry out their specific roles and responsibilities within the project. Table 1 provides a list of GSI senior personnel involved in shipboard testing, as well as their title, and years of experience.
Table 1. Name, Project Role, Parent Organization, Experience and Education of GSI Personnel.
GSI Personnel GSI Role in Project Parent
Organization
No. of Years of Relevant Experience
Education
Ms. Allegra Cangelosi Principal Investigator and
Director Northeast‐
Midwest Institute
20+ MSc
Ms. Nicole Mays Senior Quality Systems Officer 15+ BSc
Mr. Travis Mangan GSI Land‐Based RDTE Facility
Site Manager 3+ BSc
Mr. Tyler Schwerdt GSI Land‐Based RDTE Facility
Engineer & Operations Manager AMI Consulting Engineers, PA
5+ BSc
Mr. Adam Marksteiner Assistant GSI Land‐Based RDTE
Facility Engineer 1+ BSc
Mr. Donald Reid Biological Operations Specialist Independent Consultant
20+ MSc
Dr. Mary Balcer Senior Zooplankton Scientist &
LSRI Team Leader
Lake Superior Research Institute
10+ PhD
Mr. Matthew TenEyck Lead Investigator for Whole Effluent Toxicity (WET) and
Bench Tests 10+ MSc
Ms. Deanna Regan Chemist 2+ BSc
Ms. Christine Polkinghorne
Chemist 15+ MSc
Ms. Kelsey Prihoda Senior QA/QC Officer 5+ MSc
Ms. Heidi Saillard Senior Microbial Analyst 5+ BSc
Mr. Steve Hagedorn Database Manger 10+ BSc
Ms. Heidi Schaefer Zooplankton Analyst
5+ BSc
Ms. Lana Fanberg 3+ BSc
Ms. Debra Fobbe Microbial Analyst and Zooplankton Analyst
2+ BSc
Dr. Euan Reavie Senior Phytoplankton Scientist
& NRRI Team Leader Natural Resources Research Institute
10+ PhD
Ms. Lisa Allinger Phytoplankton Analyst
5+ MSc
Ms. Elaine Ruzycki 3+ BSc
Dr. Esther Angert Microbial Consultant Cornell University 15+ PhD
GSI/SB/F/TR/1 March 22, 2013
Page 16 of 53
3. THEBALLASTWATERTREATMENTSYSTEM The BWTS process subject to evaluation in the trial reported here involves application of NaOH (as lye) to ballast water on intake to raise pH and kill entrained organisms, a retention period in the ballast tank, and application of carbon dioxide (CO2) to the treated water to neutralize the pH prior to discharge. The NaOH BWTS was developed by researchers from the USGS. In late 2010 the research team received support from the USEPA’s GLRI to investigate the BWTS’ potential shipboard application specific to U.S. flag vessels in Great Lakes trade. In spring 2011, the BWTS was installed as a temporary and partial (i.e., treatment of two ballast tanks only) treatment process on board a Great Lakes vessel, the MV Indiana Harbor. The system involved multiple steps:
Calculation of the amount of NaOH required to raise the pH of the ship’s ballast water from ambient (i.e., near neutral) to a designated level (e.g. pH 11.5 or 12);
Injection of the required volume of NaOH during ballast water intake using an automated injection system and an NaOH supply cache;
Retention of the treated ballast water for a designated period of time; In-tank neutralization of the treated water with CO2 via a carbonization/mixing system
from a CO2 cache; and Verification of complete neutralization before discharge of the treated water.
This shipboard study was precipitated by results from research and development trials of an earlier version of the NaOH BWTS evaluated by GSI at its land-based testing facility located in Superior, WI (GSI, 2011b). In those tests, the system successfully treated ballast water without interruption, and successfully neutralized treated ballast water to achieve Wisconsin Department of Natural Resources (WIDNR) levels for harbor discharge (i.e., pH 6-9; GSI, 2011b). The BWTS also significantly reduced live organism densities in treated discharge relative to control discharge in all size classes of organisms. Overall, the BWTS warranted additional testing at the land and ship-board scale (GSI, 2011b).
4. DESCRIPTIONOFTHETESTVESSEL
The specific test vessel was the MV Indiana Harbor operated by American Steamship Company (ASC) of Williamsville, New York (Table 2). Built in 1979, the vessel is a self-unloading bulk freighter that operates exclusively in the upper four Great Lakes where she is primarily used for long-haul transport of iron ore pellets and western coal. The vessel is 1,000 ft. in length with a breadth of 105 ft. and depth of 56 ft. The MV Indiana Harbor travels at an average full speed of 15 mph and is powered by four 3,500 HP General Motors Electro Motive Division (EMD) diesel engines. There are seven cargo holds onboard and 37 hatches. The vessel’s engine room is Automated Control System Certified (ACCU) and her crew compliment is 24. The MV Indiana Harbor’s ballast system comprises 18 ballast tanks including forepeak and aftpeak tanks, with a total ballast capacity of 16,424,360 US gallons (62,166 m3). Four ballast
GSI/SB/F/TR/1 March 22, 2013
Page 17 of 53
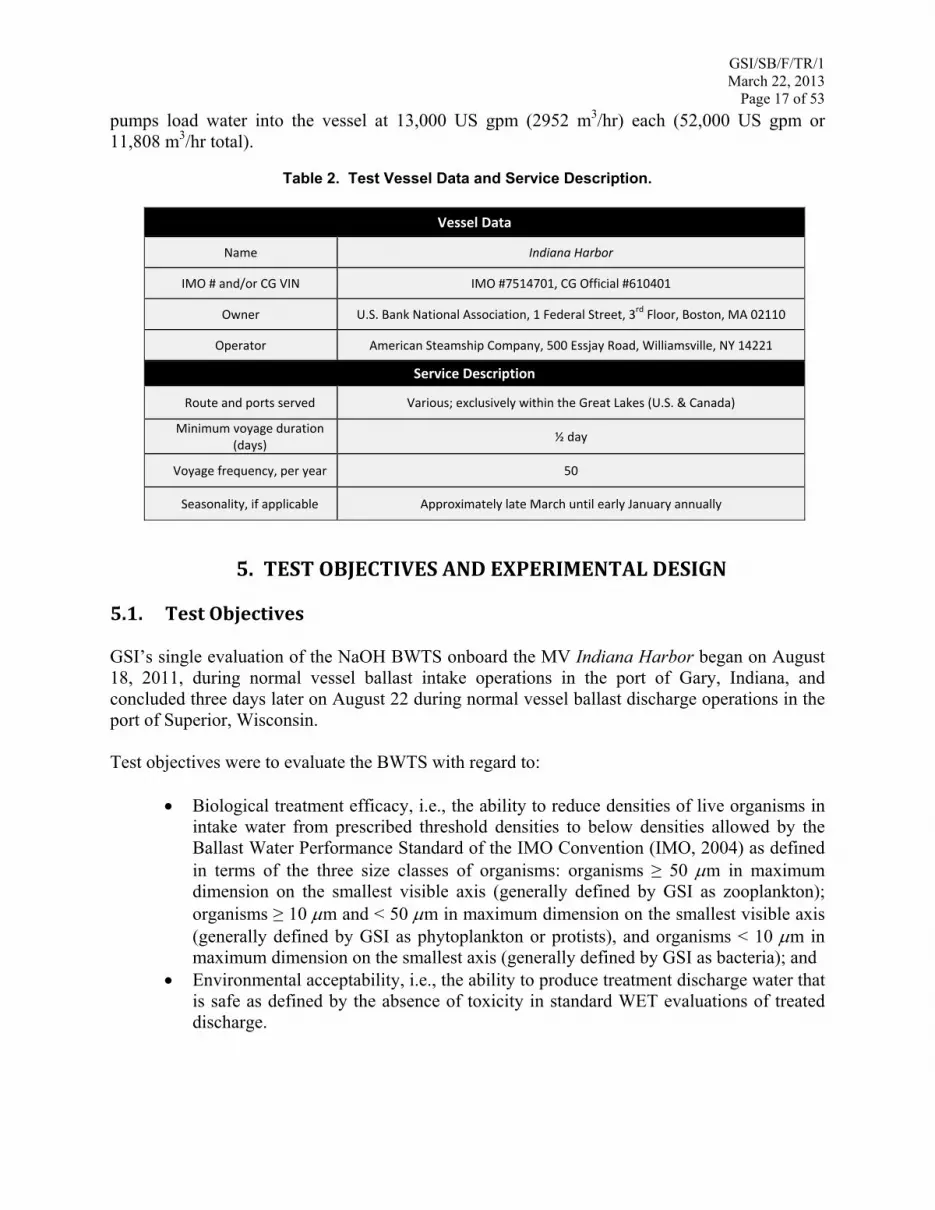
pumps load water into the vessel at 13,000 US gpm (2952 m3/hr) each (52,000 US gpm or 11,808 m3/hr total).
Table 2. Test Vessel Data and Service Description.
Vessel Data
Name Indiana Harbor
IMO # and/or CG VIN IMO #7514701, CG Official #610401
Owner U.S. Bank National Association, 1 Federal Street, 3rd Floor, Boston, MA 02110
Operator American Steamship Company, 500 Essjay Road, Williamsville, NY 14221
Service Description
Route and ports served Various; exclusively within the Great Lakes (U.S. & Canada)
Minimum voyage duration (days)
½ day
Voyage frequency, per year 50
Seasonality, if applicable Approximately late March until early January annually
5. TESTOBJECTIVESANDEXPERIMENTALDESIGN
5.1. TestObjectives GSI’s single evaluation of the NaOH BWTS onboard the MV Indiana Harbor began on August 18, 2011, during normal vessel ballast intake operations in the port of Gary, Indiana, and concluded three days later on August 22 during normal vessel ballast discharge operations in the port of Superior, Wisconsin. Test objectives were to evaluate the BWTS with regard to:
Biological treatment efficacy, i.e., the ability to reduce densities of live organisms in
intake water from prescribed threshold densities to below densities allowed by the Ballast Water Performance Standard of the IMO Convention (IMO, 2004) as defined in terms of the three size classes of organisms: organisms ≥ 50 m in maximum dimension on the smallest visible axis (generally defined by GSI as zooplankton); organisms ≥ 10 m and < 50 m in maximum dimension on the smallest visible axis (generally defined by GSI as phytoplankton or protists), and organisms < 10 m in maximum dimension on the smallest axis (generally defined by GSI as bacteria); and
Environmental acceptability, i.e., the ability to produce treatment discharge water that is safe as defined by the absence of toxicity in standard WET evaluations of treated discharge.

GSI/SB/F/TR/1 March 22, 2013
Page 18 of 53
5.2. ExperimentalDesign The single shipboard evaluation of the NaOH BWTS involved filling four of the MV Indiana Harbor’s port-side ballast tanks (2P, 3P, 4P and 5P) with harbor water from the port of Gary, IN (US Steel Gary Works dock). There were adequate numbers of live organisms in the intake water (see Section 6 “Challenge Conditions”) to warrant continuation of the test. Concurrently with ballasting, the BWTS dosed the water in two of these tanks (3P and 4P) with enough 50 % (w/v) NaOH solution to achieve a pH of approximately 12. A NaOH dosing system drew the reagent from deck-based temporary storage tanks. A water jet system, designed to operate with electrically powered in-tank mounted pumps, mixed the water in the treated tanks while the vessel was en route to Superior, WI. Approximately 18 hours prior to the MV Indiana Harbor’s arrival in Superior, the BWTS developers activated a carbonation system in both treatment tanks to react the NaOH with CO2 to yield sodium carbonate (Na2CO3) and sodium bicarbonate (NaHCO3), and ultimately reduce the pH of the treated water to between 8.8 and 6, i.e., a level considered safe for discharge to Wisconsin waters. Following the vessel’s arrival in Superior, WI (Midwest Energy dock) the vessel discharged, and GSI sampled, the ballast water from the treatment tanks and the untreated water from the control tanks in the following order: 3P, 4P, 5P, and 2P. Ship traffic and the need to remove deck mounted equipment delayed deballasting somewhat. Table 3 details the schedule of events, including the sequence of intake and discharge ballast water operations.
Table 3. Schedule of Events for Intake and Discharge Ballast Water Operations and Sample Collection Times for the NaOH BWTS Evaluation.
Date Location Operation Tank
Number Sample Type Start Time Finish Time
Length of Operation
August 18, 2011
Gary, IN Ballast Intake
5P Control 16:08:55 17:47:03 1:38:08
2P Control 17:47:03 18:57:21 1:10:18
3P Pre‐Treatment 19:26:37 20:51:10 1:24:33
4P Pre‐Treatment 23:09:51 0:27:35 (next day) 1:17:44
August 22, 2011
Superior, WI Ballast
Discharge
3P Treatment 23:10:00 (previous day) 0:47:00 1:37:00
4P Treatment 0:53:00 2:39:00 1:46:00
5P Control 2:46:00 4:47:00 2:01:00
2P Control 4:50:00 6:18:00 1:28:00
6. CHALLENGECONDITIONS
The goal of GSI’s NaOH BWTS status test was to provide information to the BWTS developer of use in research and development of their BWTS. As such, the testing was not strictly consistent with the IMO G8 Guidelines for Approval of Ballast Water Management Systems (IMO, 2008a) and the IMO G9 Guidelines for Approval of Ballast Water Management Systems that make use of Active Substances (IMO, 2008b). In particular, GSI did not take into account minimum

GSI/SB/F/TR/1 March 22, 2013
Page 19 of 53
requirements for intake or control discharge densities of live organisms that can constrain IMO-consistent trial validity. Specifically, for intake ballast water, IMO G8 requires:
For organisms greater than or equal to 50 µm in minimum dimension, more than 100 viable organisms per m3; and
For organisms less than 50 µm in minimum dimension and greater than or equal to 10 µm in minimum dimension, more than 100 viable per mL.
While for control discharge, IMO G8 requires:
For organisms greater than or equal to 50 µm in minimum dimension, more than 10 viable organisms per m3; and
For organisms less than 50 µm in minimum dimension and greater than or equal to 10 µm in minimum dimension, more than 10 viable organisms per mL.
GSI did analyze intake and control discharge densities relative to the two larger size classes of organisms to determine if IMO G8 threshold requirements were met.
7. SAMPLECOLLECTION,HANDLINGANDANALYSIS
7.1. SampleCollection
7.1.1. Overview Sample collection took place in the MV Indiana Harbor’s engine room via two in-line sample ports each having an internal diameter (ID) of 2.5 cm installed inside a 76 cm ballast piping (Figure 1). The sample ports were installed and commissioned by GSI personnel several weeks prior to the evaluation. Intake samples were collected using the sample port located at the end of the header leading to the ballast tanks, while discharge samples were collected using the sample port located on the overboard side of the header (see Figure 1). Water was drawn into the sample ports via a bent 90° elbow style pitot pointed into the direction of water flow and designed consistent with the United States Coast Guard’s (USCG) in-line sampling guidelines (Richard et al., 2008, Figures 1 and 2). Manual hand valves on the pitots themselves were used to isolate the sample collection system (Figure 1). Externally, the two sample ports were fitted with 2.5 cm ID polyvinyl chloride (PVC) tubing to transfer sample water across the ship’s engine room for subsequent collection—a distance of approximately 15 m (Figure 2). Prior to the start of intake sampling operations (i.e., prior to sampling Tank 5P), the MV Indiana Harbor’s main ballast lines were flushed with intake water directed into non-experimental tanks. This flushing was conducted during the commissioning of GSI’s shipboard sampling system, for a period of 17 minutes on 18 August, 2011. Water flowed through the lines to allow the ballast system to be cleared of water stagnant in the pipes from previous ballast operations. Sampling began in Tank 5P as soon as the ship began ballasting this tank. Intake sampling began for the
GSI/SB/F/TR/1 March 22, 2013
Page 20 of 53
other tanks (2P, 3P, and 4P) as soon as the ship began ballasting the tanks. Intake ballast operations ended when ballast tanks 5P, 2P, and 4P reached a depth of 20.0 feet each and when tank 3P reached a depth of 20.8 feet, therefore, as much of the entirety of the experimental tanks’ ballasting operations were sampled as is feasible through in-line sampling. At the start of discharge ballast operations, the MV Indiana Harbor’s main ballast lines were flushed until the salinity of the flush water read 0.07 ppt or less (as measured by a member of the BWTS developer team), which took five minutes before sampling of the first treatment tank (i.e., Tank 3P). The second treatment tank (Tank 4P) was only flushed for three minutes as the water in the line was already similar. Likewise, the main ballast lines were flushed for five minutes prior to sampling control Tank 5P discharge, and two minutes prior to sampling control Tank 2P for discharge. Sample collection then occurred continuously until the ballasting operation ceased at a tank depth of 0 feet. Therefore, as much of the entirety of the experimental tanks’ deballasting operations were sampled as is feasible with in line sampling and a brief flush period. Sample water was collected at a constant flow (i.e., 2.5 m3/hr or 11 US gpm) using a flexible impeller pump (sample intake pump) to ensure a constant flow rate was provided regardless of changes in pressure head.

GSI/SB/F/TR/1 March 22, 2013
Page 21 of 53
Figure 1. Sample Collection Ports Installed in the MV Indiana Harbor's Ballast Piping.

GSI/SB/F/TR/1 March 22, 2013
Page 22 of 53
Figure 2. Sample Collection Apparatus Installed in the MV Indiana Harbor's Engine Room.
GSI/SB/F/TR/1 March 22, 2013
Page 23 of 53
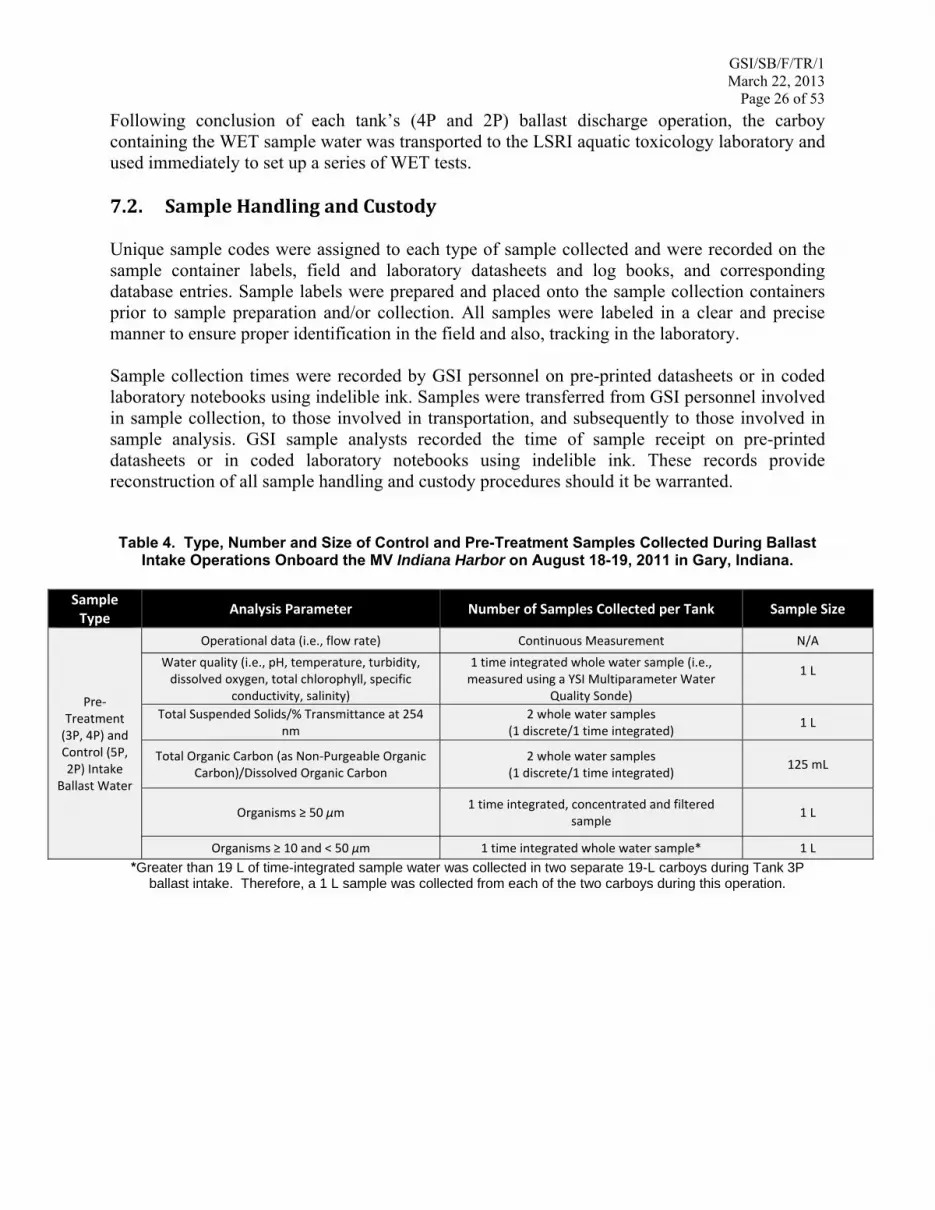
Sample collection methods are detailed in the sections below. Table 4 details the number of control and pre-treatment samples collected per analysis method during ballast intake. Table 5 details the number of control and treatment samples collected per analysis method during ballast discharge.
7.1.2. WaterQuality/WaterChemistry Water chemistry/quality sample collection for each tank was conducted using two different methods. Discrete grab samples were collected from the sample line flowing into sample tub/plankton net (Figure 2). Time-integrated samples were collected via a branch off the main sample line that directed at least 10 L of sample water into a 19 L high-density polyethylene (HDPE) carboy over the course of the entire intake or discharge ballast operation (Figure 2). The carboy was mixed well prior to collecting samples by inverting the carboy a minimum of six times. During the ballast intake operation for each tank, samples were collected at the approximate midpoint (50 % point) of the biological sampling period, while samples were collected at approximately the 25 % and 75 % points during the ballast discharge sampling operation for each tank. Time-integrated samples were collected from the 19 L HDPE carboy immediately following the ballast intake and discharge operation for each tank. The exact time of sample collection was recorded on the GSI Shipboard Intake Sample Collection Form or the GSI Shipboard Discharge Sample Collection Form.
7.1.2.1.TotalSuspendedSolids(TSS)/PercentTransmittance(%T)
Two, 1 L whole water samples (one discrete grab and one time-integrated) per ballast tank were collected for TSS and %T analysis during ballast intake (Table 4). Three, 1 L (two or three discrete and one time integrated) whole water samples per ballast tank were collected for TSS and %T analysis during discharge operations as detailed in Table 5. Following the conclusion of each intake/discharge operation, samples were transported to the LSRI chemistry laboratory in a cooler with ice packs, stored in a refrigerator and analyzed within 7 days of collection.
7.1.2.2.Non‐PurgeableOrganic Carbon (NPOC) andDissolvedOrganic Carbon(DOC)
Two, 125 mL whole water samples (one discrete and one time-integrated) per ballast tank were collected for analysis of NPOC and DOC during ballast intake (Table 4). Three, 125 mL whole water samples (two or three discrete grab and one time-integrated) per ballast tank were collected for NPOC and DOC analysis during ballast discharge (Table 5). Following the conclusion of each ballast intake/discharge operation, samples were transported to the LSRI chemistry laboratory in a cooler with ice packs. Upon arrival, the pH was adjusted to < 2 using hydrochloric acid (HCl) and the samples stored in a refrigerator for a maximum of 28 days prior to analysis. Please note that NPOC was used as a proxy for total organic carbon (TOC), though it may be a slight underestimate of TOC as the analytical instrument used to measure NPOC purges the sample with air to remove inorganic carbon before measuring organic carbon levels in the

GSI/SB/F/TR/1 March 22, 2013
Page 24 of 53
sample. Thus, NPOC analysis may not incorporate volatile organic carbon which may be present in the sample.
7.1.2.3.WaterQualityMeasurementsusing YSIMultiparameterWaterQuality
Sondes
Calibrated multiparameter sondes (YSI 6600 V2-4 Multiparameter Water Quality Sondes; YSI Incorporated; Yellow Springs, OH) were used to measure water quality parameters during sample collection on ballast intake and discharge. The sondes were calibrated prior to the ballast intake operation, according to GSI/SOP/LB/G/C/4 - Procedure for Calibration, Deployment, and Storage of YSI Multiparameter Water Quality Sondes. Approximately 1 L samples were collected from each 19 L carboy (after all other samples had been collected), and the following water quality parameters were measured: temperature, dissolved oxygen, pH, turbidity, salinity, specific conductivity, and total chlorophyll. Data was recorded on a pre-printed datasheet. The datasheets were scanned, converted to electronic (.pdf) files, and stored on the LSRI secure network and on GSI SharePoint. Samples were successfully collected and measured for all ballast tanks sampled on ballast intake and discharge, except for Tank 3P on ballast intake. During sample collection for this tank, GSI mistakenly overlooked the Sonde measurement.
7.1.3. Biology7.1.3.1.Organisms≥50µm
For collection of organisms ≥ 50 µm, a minimum of 2 m3 of water en route to and from each experimental ballast tank was directed into a 121 L free standing collection tub fitted with a bottom discharge valve (Figure 2). The sample return pump was set to automatically maintain a height in the tub of 85 % capacity returning the filtered sample water back to the ballast main. At 90 % capacity, an alarm sounded and the sample intake pump slowed down while a return pump (also an impeller pump; Figure 2) operated at full capacity. At 95 % capacity, another alarm sounded and the sample intake pump shut down completely. If one pump had significantly higher draw than the other an alarm would sound to indicate a possible leak or other mechanical problem. Interlocks were also used to protect the vessel from spills and overflow from the sample collection tub. Sample water contained within the collection tub was concentrated into a 35 µm mesh plankton net equipped with 1 L cod-end. The net was suspended in the collection tub from a net frame attached to the tub (Figure 2). Separate, but identical, nets were used for control and treatment tank sample collection. All spent sample water was discharged back to the ballast main downstream of the sample port using the return pump (Figure 2). Following the conclusion of the entire intake operation, samples were transported to the GSI mobile laboratory in a cooler with ice packs, and the pre-treatment samples were analyzed first, followed by the control samples. GSI had to deviate from the test plan and transport all of the zooplankton samples at one time to the GSI mobile laboratory, rather than transporting each sample at the end of the collection period, due to a mechanical breakdown of the mobile
GSI/SB/F/TR/1 March 22, 2013
Page 25 of 53
laboratory. As a consequence, the zooplankton sample holding time of two hours from the end of collection until the beginning of analysis was violated. However, this deviation only led to a more conservative estimate of intake live organism densities, and these estimates showed densities well in excess of the IMO threshold and sufficient to support a robust BWTS test (see Results). At the end of each tank’s discharge operation, samples were transported to the LSRI taxonomy laboratory in a cooler with ice packs, and the samples were analyzed immediately after receipt.
7.1.3.2.Organisms≥10µmand<50µm
For collection of organisms ≥ 10 µm and < 50 µm, time-integrated, whole water samples of approximately 1 L each were collected. Sample collection occurred via a branch off the main sample line that directed at least 10 L of sample water into a 19 L HDPE carboy (the same carboy from which the time-integrated water chemistry samples were collected) over the course of the entire intake or discharge ballast operation (Tables 4 and 5). Carboys were mixed by inverting to ensure sample water was homogenous just prior to whole water sample collection. Following the conclusion of each tank’s ballast intake operation, samples were transported to a nearby hotel room where analysis immediately took place. At the end of each tank’s ballast discharge operation, samples were transported to the LSRI taxonomy laboratory in a cooler with ice packs, and analyzed immediately after receipt.
7.1.3.3.Organisms<10µm Two, 1 L time-integrated, whole water samples were collected from each tank during ballast discharge only for analysis of organisms < 10 µm (including total coliform bacteria, Escherichia coli, Enterococcus spp., and total heterotrophic bacteria). Sample collection occurred via a branch off the main sample line that directed at least 10 L of sample water into a 19 L HDPE carboy (the same carboy from which the time-integrated water chemistry samples were collected) over the course of the entire intake or discharge ballast operation (Tables 4 and 5). Carboys were mixed by inverting to ensure sample water was homogenous just prior to whole water sample collection. Samples were collected in sterile, polypropylene bottles. Following the conclusion of each tank’s ballast discharge operation, samples were transported to the LSRI microbiology laboratory in a cooler with ice packs, stored in a refrigerator and analyzed within 24 hours of collection.
7.1.4. WholeEffluentToxicity(WET) Samples for WET testing were collected during ballast discharge only, from tanks 4P and 2P (Tables 4 and 5). A second branch line was used to collect an additional 17 L of water from treatment tank 4P and 14 L of water from control tank 2P for use in WET tests. The branch tubes were made of 3.2 mm ID Tygon® tubing with a manual flow control valve used to maintain a drip flow.
GSI/SB/F/TR/1 March 22, 2013
Page 26 of 53
Following conclusion of each tank’s (4P and 2P) ballast discharge operation, the carboy containing the WET sample water was transported to the LSRI aquatic toxicology laboratory and used immediately to set up a series of WET tests. 7.2. SampleHandlingandCustody Unique sample codes were assigned to each type of sample collected and were recorded on the sample container labels, field and laboratory datasheets and log books, and corresponding database entries. Sample labels were prepared and placed onto the sample collection containers prior to sample preparation and/or collection. All samples were labeled in a clear and precise manner to ensure proper identification in the field and also, tracking in the laboratory. Sample collection times were recorded by GSI personnel on pre-printed datasheets or in coded laboratory notebooks using indelible ink. Samples were transferred from GSI personnel involved in sample collection, to those involved in transportation, and subsequently to those involved in sample analysis. GSI sample analysts recorded the time of sample receipt on pre-printed datasheets or in coded laboratory notebooks using indelible ink. These records provide reconstruction of all sample handling and custody procedures should it be warranted.
Table 4. Type, Number and Size of Control and Pre-Treatment Samples Collected During Ballast Intake Operations Onboard the MV Indiana Harbor on August 18-19, 2011 in Gary, Indiana.
Sample Type
Analysis Parameter Number of Samples Collected per Tank Sample Size
Pre‐Treatment (3P, 4P) and Control (5P, 2P) Intake
Ballast Water
Operational data (i.e., flow rate) Continuous Measurement N/A
Water quality (i.e., pH, temperature, turbidity, dissolved oxygen, total chlorophyll, specific
conductivity, salinity)
1 time integrated whole water sample (i.e., measured using a YSI Multiparameter Water
Quality Sonde)
1 L
Total Suspended Solids/% Transmittance at 254 nm
2 whole water samples (1 discrete/1 time integrated)
1 L
Total Organic Carbon (as Non‐Purgeable Organic Carbon)/Dissolved Organic Carbon
2 whole water samples (1 discrete/1 time integrated)
125 mL
Organisms ≥ 50 µm 1 time integrated, concentrated and filtered
sample 1 L
Organisms ≥ 10 and < 50 µm 1 time integrated whole water sample* 1 L
*Greater than 19 L of time-integrated sample water was collected in two separate 19-L carboys during Tank 3P ballast intake. Therefore, a 1 L sample was collected from each of the two carboys during this operation.

GSI/SB/F/TR/1 March 22, 2013
Page 27 of 53 Table 5. Type, Number and Size of Control and Treatment Samples Collected During Ballast
Discharge Operations Onboard the MV Indiana Harbor on August 21-22, 2011 in Superior, Wisconsin.
Tank
Number Sample Type
Analysis Parameter Number of Samples Collected Sample Size
3P and 4P Treatment
Operational data (i.e., flow rate) Continuous measurement N/A
Water quality (i.e., pH, temperature, turbidity, dissolved oxygen, total chlorophyll,
specific conductivity, salinity)
1 time integrated whole water sample (i.e., measured using a YSI Multiparameter Water
Quality Sonde)
1 L
Total Suspended Solids/% Transmittance at 254 nm
3 whole water samples (2 or 3 discrete/1 time integrated)
1 L
Total Organic Carbon (as Non‐Purgeable Organic Carbon)/Dissolved Organic Carbon
3 whole water samples (2 or 3 discrete/1 time integrated)
125 mL
Organisms ≥ 50 µm 1 time integrated, concentrated and filtered
sample 1 L
Organisms ≥ 10 and < 50 µm 1 time integrated whole water sample 1 L
Organisms < 10 µm 2 time integrated whole water samples 1 L
Whole Effluent Toxicity 1 time integrated whole water sample 19 L (from Tank
4P only)
5P and 2P Control
Operational data (i.e., flow rate) Continuous measurement N/A
Water quality (i.e., pH, temperature, turbidity, dissolved oxygen, total chlorophyll,
specific conductivity, salinity)
1 time integrated whole water sample (i.e., measured using a YSI Multiparameter Water
Quality Sonde)
1 L
Total Suspended Solids/% Transmittance at 254 nm
3 whole water samples (2 discrete/1 time integrated)
1 L
Total Organic Carbon (as Non‐Purgeable Organic Carbon)/Dissolved Organic Carbon
3 whole water samples (2 discrete/1 time integrated)
125 mL
Organisms ≥ 50 µm 1 time integrated, concentrated and filtered
sample 1 L
Organisms ≥ 10 and < 50 µm 1 time integrated whole water sample 1 L
Organisms < 10 µm 2 time integrated whole water samples 1 L
Whole Effluent Toxicity 1 time integrated whole water sample 19 L (from Tank
2P only)
7.3. SampleAnalysis
7.3.1. OperationalData
Flow rate of water into and out of each of the four ballast tanks, as well as, of sample water into each sample collection tub was recorded automatically via a magnetic flux flow meter for the sample line and an ultrasonic flow meter for the ballast main and the logging function of the Programmable Logic Controller. Following completion of the intake or discharge operation, the data were exported to Microsoft Excel for subsequent analysis, and stored by AMI Consulting Engineers on a secure network. Files were also stored on the GSI SharePoint intranet website for additional archiving.

GSI/SB/F/TR/1 March 22, 2013
Page 28 of 53
7.3.3. WaterChemistry
7.2.3.1.TotalSuspendedSolids/%Transmittanceat254nm TSS analysis was conducted according to GSI/SOP/BS/RA/C/8– Procedure for Analyzing Total Suspended Solids (TSS). In this procedure, accurately measured sample volumes (± 1 %) were vacuum filtered through pre-washed, dried, and pre-weighed glass fiber filters (i.e. Whatman 934-AH). After each sample was filtered it was dried in an oven and brought to constant weight. TSS values were determined based on the weight of particulates collected on the filter and the volume of water filtered. Two aliquots of approximately 10 mL from each TSS sample (prior to filtration) collected were used to measure %T. Sample analysis was conducted according to GSI/SOP/BS/RA/C/4 – Procedure for Determining Percent Transmittance (%T) of Light in Water at 254 nm. For analysis of the filtered aliquot, an appropriate volume of sample was filtered through a glass fiber filter (i.e., Whatman 934-AH). A UV-Vis spectrophotometer was used to measure %T of the unfiltered and filtered sample aliquots. Deionized water was used as a reference to adjust the spectrophotometer to 100 %T, and then each unfiltered and filtered sample aliquot was analyzed in a pre-rinsed sample cuvette with a 1 cm path length.
7.2.3.2. Non‐PurgeableOrganicCarbon,DissolvedOrganicCarbon,ParticulateOrganicCarbon(POC),andMineralMatter(MM)
Sample analysis was conducted according to GSI/SOP/BS/RA/C/3– Procedures for Measuring Organic Carbon in Aqueous Samples. An aliquot of each 125 mL sample was filtered through a Whatman GF/F filter and acidified with HCl for analysis of DOC. The remaining portion of the sample was acidified with HCl and analyzed for NPOC. A Shimadzu Total Organic Carbon Analyzer (Model TOC-5050A) was employed for analysis of both NPOC and DOC. Concentrations of NPOC and DOC were determined based on a calibration curve developed on the Analyzer using organic carbon standards prepared from potassium hydrogen phthalate. POC concentrations were determined as the difference between the NPOC and DOC values for a given sample. MM concentrations were calculated for each water quality sample collected on intake following analysis of TSS and the determination of POC based on the NPOC and DOC concentrations as described above.
7.3.4. Biology
7.3.4.1.Organisms≥50µm For analysis of organisms ≥ 50 µm, analysis of intake samples took place in GSI’s mobile laboratory located approximately 110 miles from the port of Gary, IN, owing to an unexpected mechanical breakdown of the vehicle while en route to the vessel (i.e., in Mendota, Illinois). Samples were stored in coolers with ice packs immediately following collection, during transportation to the mobile laboratory, and until analysis occurred. Analysis of discharge samples took place in the LSRI taxonomy laboratory located on the UWS campus in Superior, WI, approximately two miles from the MV Indiana Harbor’s berth at Midwest Energy in
GSI/SB/F/TR/1 March 22, 2013
Page 29 of 53
Superior, WI. Samples were stored in coolers with ice packs immediately following collection, during transportation, and until analysis occurred. The analysis process followed GSI/SOP/LB/RA/SA/2 - Procedure for Zooplankton Sample Analysis. Microzooplankton (e.g., rotifers, copepod nauplii, and dreissenid veligers) and macrozooplankton (e.g., copepods, cladocerans, and other macroinvertebrates), all generally greater than 50 μm, were analyzed simultaneously by separate taxonomists. Microzooplankton subsamples were analyzed in a Sedgewick Rafter counting chamber by examination under a compound microscope at a magnification of 40X to 100X. Macrozooplankton were analyzed in a Ward’s Counting Wheel at a magnification of 20X to 30X using a dissecting microscope. Live zooplankton densities for the intake samples and for the control discharge samples were determined by first counting the number of dead organisms in a subsample and then killing the organisms in the subsample with 50 % (v/v) acetic acid solution and enumerating the total number of organisms on the slide. Subtracting the number of dead organisms from the number of total organisms led to an estimate of the number of live organisms in the sample. The macrozooplankton consisting of cladocerans and copepods, were analyzed separately from the microzooplankton, primarily rotifers and dreissenid mussel larvae. Several subsamples were enumerated for each sample. The percent live zooplankton present in each sample was calculated by dividing the density of live organisms by the total density. The density of live organisms in the treatment discharge samples was calculated by directly counting the number of live organisms found on each slide. This method allowed analysts to process a much larger proportion of the original sample.
7.3.4.2.Organisms≥10µmand<50µm
For analysis of organisms ≥ 10 µm and < 50 µm in intake samples, a temporary laboratory was set up at a hotel approximately 15 miles away from the docking area in Gary, Indiana. Analysis of discharge samples took place at the LSRI taxonomy laboratory on the UWS campus in Superior, WI, approximately two miles from the MV Indiana Harbor’s berth at Midwest Energy in Superior, WI. In both cases, samples were stored in coolers with ice packs immediately following collection, during transportation, and until analysis occurred. Prior to analysis the whole water samples were concentrated through 7 μm mesh plankton netting and stored in a 25 mL sample container. Sample analysis was conducted according to GSI/SOP/LB/RA/SA/1 - Procedure for Algae/Small Protozoan Sample Analysis. Briefly, a 1.5 mL subsample of the concentrated sample was transferred to a 2 mL sample container, with 5 μL of fluorescein diacetate (FDA) viability stain stock solution added. The subsample was then allowed to incubate in the dark for 5 minutes. The 1.5 mL incubated sample was mixed and 1.1 mL was immediately transferred to a Sedgwick-Rafter cell, covered and placed on the stage of a microscope that was set for simultaneous observation using brightfield and epifluorescence. Horizontal transects were counted to ensure at least 1.5 mL (control and intake samples) or 10 mL (treated samples) of original sample water were counted, aiming for at least 100 entities (i.e., unicellular organism, colony or filament). If protists were abundant in treated samples additional criteria were used to determine the number of transects needed (as outlined in GSI/SOP/LB/RA/SA/1 - Procedure for Algae/Small Protozoan Sample Analysis). If time permitted, additional transects were counted to increase statistical power. Single cell entities and
GSI/SB/F/TR/1 March 22, 2013
Page 30 of 53
cells comprising colonial and filamentous entities were characterized as follows: alive = cells showing obvious green fluorescence from cell contents; dead = cells showing no or very little evidence of green fluorescence from cell contents (not counted). Records were kept of transect lengths and widths so that the total counted area and volume analyzed could be calculated later. Entities less than 10 μm in all visible dimensions or greater than 50 μm in minimum visible dimension were not counted. Counting and measurement of all other entities followed standard procedures for individuals (length and width), colonies (e.g., number of cells, cell length and width) and filaments (e.g., number of cells, cell length and width or total filament length if cells could not be discerned). The remaining concentrated sample in the 25 mL bottle was archived using Lugol’s preservative for long-term storage.
7.3.4.3.Organisms<10µm
Sample analysis of organisms < 10 µm in control and treatment ballast discharge took place in the LSRI microbiology laboratory and involved analysis of total coliform bacteria, Escherichia coli, Enterococcus spp., and total heterotrophic bacteria. Samples were transported to the LSRI in a cooler with ice packs, stored in a refrigerator and analyzed within 24 hours of collection. Analysis of total coliform bacteria followed GSI/SOP/BS/RA/MA/4 - Procedure for the Detection and Enumeration of Total Coliforms and E. coli Using IDEXX's Colilert®, with densities determined using Quanti-Tray/2000® and Colilert®, which is based on IDEXX’s patented Defined Substrate Technology (DST®). Results were reported in MPN/100 mL which correlates well with cfu/100 mL. Please note that this is not an additional analysis step, but a second result given from the Colilert test conducted for E. coli analysis. The density of E. coli (GSI/SOP/BS/RA/MA/4 - Procedure for the Detection and Enumeration of Total Coliforms and E. coli Using IDEXX's Colilert®; Appendix 6) and Enterococci (GSI/SOP/BS/RA/MA/3 - Procedure for the Detection and Enumeration of Enterococcus using Enterolert™) were determined using Quanti-Tray/2000® and Colilert® or Enterolert™, respectively, which are both based on IDEXX’s patented Defined Substrate Technology (DST®). Results were reported in MPN/100 mL which correlates well with cfu/100 mL. Culturable, aerobic, heterotrophic bacteria were quantified following GSI/SOP/BS/RA/MA/1 – Procedure for Quantifying Heterotrophic Plate Counts (HPCs) using IDEXX’s SimPlate® for HPC Method, which is based on IDEXX Laboratories’ patented multiple enzyme technology (IDEXX Laboratories, Inc.; Westbrook, Maine). Two dilutions/volumes of sample were placed on a SimPlate. Media was added, and the SimPlate was swirled and incubated at 35 °C for 48-72 hours. Fluorescing wells were counted and most probable number (MPN) was calculated. Results are reported in MPN/mL, which correlates well with cfu/mL.
7.3.5. WholeEffluentToxicity(WET)
Whole water samples for WET testing were collected during ballast discharge only as detailed in Table 5. The residual toxicity of the whole effluent was determined using standard USEPA procedures (USEPA, 2002) and following the GSI SOPs detailed in Table 6.
GSI/SB/F/TR/1 March 22, 2013
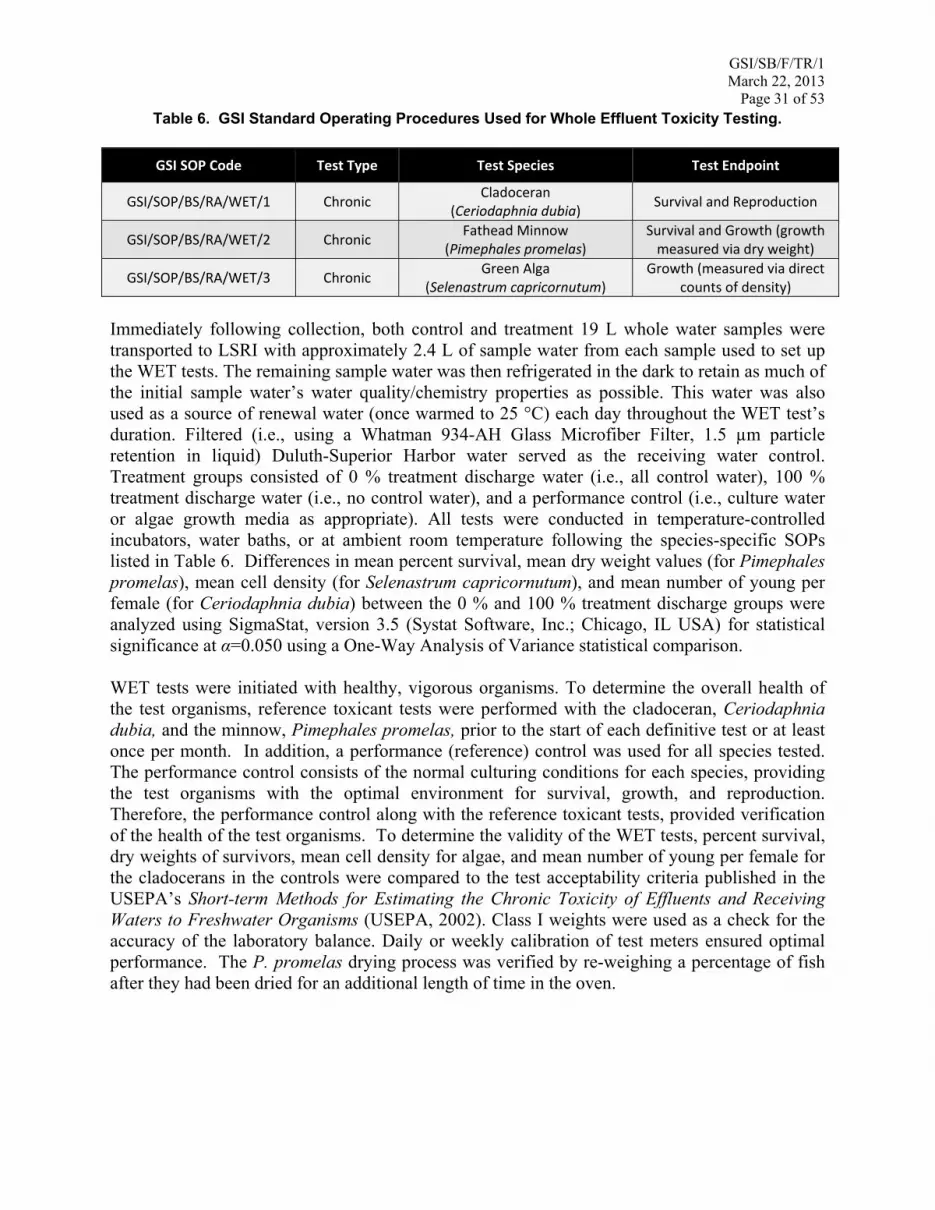
Page 31 of 53 Table 6. GSI Standard Operating Procedures Used for Whole Effluent Toxicity Testing.
GSI SOP Code Test Type Test Species Test Endpoint
GSI/SOP/BS/RA/WET/1 Chronic Cladoceran
(Ceriodaphnia dubia) Survival and Reproduction
GSI/SOP/BS/RA/WET/2 Chronic Fathead Minnow
(Pimephales promelas) Survival and Growth (growth measured via dry weight)
GSI/SOP/BS/RA/WET/3 Chronic Green Alga
(Selenastrum capricornutum) Growth (measured via direct
counts of density)
Immediately following collection, both control and treatment 19 L whole water samples were transported to LSRI with approximately 2.4 L of sample water from each sample used to set up the WET tests. The remaining sample water was then refrigerated in the dark to retain as much of the initial sample water’s water quality/chemistry properties as possible. This water was also used as a source of renewal water (once warmed to 25 °C) each day throughout the WET test’s duration. Filtered (i.e., using a Whatman 934-AH Glass Microfiber Filter, 1.5 µm particle retention in liquid) Duluth-Superior Harbor water served as the receiving water control. Treatment groups consisted of 0 % treatment discharge water (i.e., all control water), 100 % treatment discharge water (i.e., no control water), and a performance control (i.e., culture water or algae growth media as appropriate). All tests were conducted in temperature-controlled incubators, water baths, or at ambient room temperature following the species-specific SOPs listed in Table 6. Differences in mean percent survival, mean dry weight values (for Pimephales promelas), mean cell density (for Selenastrum capricornutum), and mean number of young per female (for Ceriodaphnia dubia) between the 0 % and 100 % treatment discharge groups were analyzed using SigmaStat, version 3.5 (Systat Software, Inc.; Chicago, IL USA) for statistical significance at α=0.050 using a One-Way Analysis of Variance statistical comparison. WET tests were initiated with healthy, vigorous organisms. To determine the overall health of the test organisms, reference toxicant tests were performed with the cladoceran, Ceriodaphnia dubia, and the minnow, Pimephales promelas, prior to the start of each definitive test or at least once per month. In addition, a performance (reference) control was used for all species tested. The performance control consists of the normal culturing conditions for each species, providing the test organisms with the optimal environment for survival, growth, and reproduction. Therefore, the performance control along with the reference toxicant tests, provided verification of the health of the test organisms. To determine the validity of the WET tests, percent survival, dry weights of survivors, mean cell density for algae, and mean number of young per female for the cladocerans in the controls were compared to the test acceptability criteria published in the USEPA’s Short-term Methods for Estimating the Chronic Toxicity of Effluents and Receiving Waters to Freshwater Organisms (USEPA, 2002). Class I weights were used as a check for the accuracy of the laboratory balance. Daily or weekly calibration of test meters ensured optimal performance. The P. promelas drying process was verified by re-weighing a percentage of fish after they had been dried for an additional length of time in the oven.
GSI/SB/F/TR/1 March 22, 2013
Page 32 of 53
7.4. DataManagementandAnalysis Water quality and biological sample collection and analysis data were recorded by hand (using indelible ink) on pre-printed data collection forms and/or in bound laboratory notebooks that were uniquely-identified (i.e., coded) and specific to the NaOH shipboard trial. Data collection forms and laboratory notebook pages were scanned and converted to electronic (.pdf) files as soon as possible after completion of the trial. Completed data collection forms were secured in uniquely-identified three ring binders, specific to the type of data and to the trials. Water quality and biological data that were recorded by hand were manually entered into a MS Excel Spreadsheet. Any cells containing formulas/calculations were locked to prevent the formula from being changed, as described in GSI/SOP/G/RA/DM/1 – Procedure for Data Entry, Data Quality Control, and Database Management. Files were stored on the LSRI’s secured Local Area Network (LAN) that can be accessed only by relevant GSI personnel and/or on the GSI’s internal SharePoint website. All other electronic data files, including electronic copies of completed data collection forms and laboratory notebook pages, were stored on the GSI’s internal SharePoint website. In addition, the GSI Senior QAQC Officer is responsible for archiving and storing all original raw data in a climate-controlled, secure archive room at LSRI for a period at least seven years following finalization of this verification report. A percentage of data recorded by hand and entered into MS Excel was verified against the original raw data by the GSI Senior QAQC Officer. This procedure also included verification of formulas/calculations (i.e., hand-calculation of data) done using MS Access or Excel. The percentage of verified raw data depended on the amount of raw data that generated, and ranged from 10 to 100 % of the original raw data. The statistical method used to analyze the data was dependent on the type of data (i.e., water quality, biological, operational, etc.) and the relationship being analyzed (i.e., intake versus discharge, control versus treatment). In all cases, appropriate and widely-used statistical software packages were used to generate and report mean values (± standard deviation or standard error of the mean) across groups.
8. QUALITYMANAGEMENT
GSI’s quality system is governed by a QMP (GSI, 2011c). The QMP details the structure and organization of GSI’s quality system and covers all aspects of GSI’s commitment to quality including policies and procedures; criteria for and areas of application; roles, responsibilities, and authorities; assessment and response; and quality improvement. It is the framework for planning, implementing, documenting, and assessing GSI’s QAQC activities. Copies of this document are available on request. SOPs are used to implement GSI activities at all scales of testing (i.e., bench-scale, land-based and onboard ship). This facilitates consistent conformance to technical and quality system
GSI/SB/F/TR/1 March 22, 2013
Page 33 of 53
requirements, and increases comparability if multiple trials are conducted on the same treatment system. The SOPs include both programmatic and technical processes and procedures such as organism culturing; sample collection, labeling, analysis and custody; and safety. GSI SOPs follow a common format and include specific QAQC procedures and metrics. They are grounded in published standard methods. They are also consistent with international and domestic guidelines where they exist. All GSI SOPs are subject to periodic review and revision to assure that the most up to date approaches are employed. Copies of SOPs are available for download from the GSI website: www.greatshipsinitiative.org.
9. RESULTS
9.1. ExperimentalConditions
9.1.1. OperationalCharacteristics Sample water operating characteristics measured continuously during intake and discharge ballast operations for all four experimental ballast tanks are detailed in Table 7. The length of time required to fill the four experimental tanks (i.e., two control and two treatment tanks) ranged from 1 hr 10 min to 1 hr 38 min (Table 7). In contrast, the length of time required to discharge the experimental ballast tanks ranged from 1 hr 28 min to 2 hr 1 min (Table 7). This increased length of time resulted in a higher total volume sampled on discharge compared to intake (Table 7). Still, flow rates on both intake and discharge were comparable (Tables 7).
9.1.1.1. BallastIntake At the beginning of the ballast intake operation for Tank 5P, the flow meter on the ballast main pipe stopped working correctly. The ballast main flow meter was reporting an incorrectly low flow rate, which caused the sample flow rate to be low (i.e., sample flow rate was set to sample a percentage of the main ballast flow). The mechanical failure of the flow meter on the ballast main pipe likely occurred because there was not enough straight pipe to allow for an accurate reading. Consequently, a constant flow rate sampling method (set at 2.6 m3/hr or 11.3 US gpm) was utilized for the ballast intake of the remaining tanks. The sample water during Tank 5P ballast intake operation appeared very cloudy, and was grey/black in color. In contrast, the sample water during Tank 4P ballast intake operation was much more translucent. This change in appearance during the course of ballasting may have been due to the ship stirring up the sediment and water during the docking process (see Table 7).
9.1.1.2. BallastDischarge At the beginning of Tank 3P ballast discharge operation (Table 7), the sample line flow meter stopped working correctly possibly due to air in the MV Indiana Harbor’s ballast line, which also limited the speed with which the ship could deballast. GSI substituted a continuous flow rate sampling method (2.5 m3/hr or 11.0 US gpm) for the remaining tanks. During the ballast discharge operation for each tank, the sample water appeared much more turbid and cloudy at the end of the operation (ballast operations ended when the tank height read “0 feet”).
GSI/SB/F/TR/1 March 22, 2013
Page 34 of 53
9.1.2. WaterQuality
Intake and discharge ballast water quality data for the four experimental ballast tanks appear in Table 8. Temperature, conductivity, salinity, pH, dissolved oxygen and total chlorophyll were similar across intake operations (Table 8). The turbidity was highest in Tank 5P (26.5 NTU; Table 8), which was ballasted first (Table 7) and decreased over the course of the intake operation across tanks to 4.4 NTU in Tank 4P (i.e., ballasted last see Tables 7 and 8). The higher turbidity measured in water loaded into tanks toward the beginning of the ship’s ballasting operation is consistent with observations made by GSI of the sample water collected during the intake sampling event, and is likely a result of vessel propeller agitation of the sediment and water during docking when the vessel was still heavily laden with cargo. Temperature, dissolved oxygen and total chlorophyll were also similar across control discharge operations (Table 8). As expected, several parameters were different between control and treatment ballast water during discharge. These included conductivity, salinity, and pH (Table 8).

GSI/SB/F/TR/1 March 22, 2013
Page 35 of 53 Table 7. Ballast Intake and Discharge Sample Collection Data from the Four Experimental Ballast Tanks Sampled during the Sodium
NaOH BWTS Shipboard Trial onboard the MV Indiana Harbor.
Ballast Operation
Ballast Tank
Control Method Control Variable
Sample Start Time (HH:MM)
Sample End Time (HH:MM)
Sample Duration (HH:MM)
Vol. Sampled in m3
(US Gal)
Avg. Flow Rate in m3/hr (US gpm)
Control Intake 5P
% and Continuous Flow Rate*
%, 1.1 m3/hr(5 US gpm)
16:09 17:47 01:38 2.0 (537) 1.2 (5.47)
2P Continuous Flow Rate 2.6 m3/hr
(11.3 US gpm) 17:47 18:57 01:10 3.0 (793) 2.6 (11.28)
Pre‐Treatment Intake
3P Continuous Flow Rate 2.6 m3/hr
(11.3 US gpm) 19:27 20:51 01:25 3.6 (956) 2.6 (11.30)
4P Continuous Flow Rate 2.6 m3/hr
(11.3 US gpm) 23:10 00:28 01:18 3.3 (875) 2.6 (11.27)
Treatment Discharge
3P Continuous Flow Rate** 2.5 m3/hr
(11.0 US gpm) 23:10 00:47 01:37 4.0 (1047) 2.5 (10.79)
4P Continuous Flow Rate 2.5 m3/hr
(11.0 US gpm) 00:53 02:39 01:46 4.4 (1172) 2.5 (11.10)
Control Discharge
5P Continuous Flow Rate 2.5 m3/hr
(11.0 US gpm) 02:46 04:47 02:01 5.1 (1352) 2.5 (11.17)
2P Continuous Flow Rate 2.5 m3/hr
(11.0 US gpm) 04:50 06:18 01:28 3.7 (980) 2.5 (11.14)
*At the beginning of Tank 5P Ballast Intake, the flow meter stopped working correctly. There was not enough straight pipe to allow for a good reading. Therefore, a continuous flow rate sampling method was utilized for the remaining tanks. **At the beginning of Tank 3P Ballast Discharge, the flow meter stopped working correctly due to a large amount of air in the MV Indiana Harbor’s ballast line (this issue also limited the speed with which the ship could deballast), therefore, a continuous flow rate sampling method was utilized for the remaining tanks.
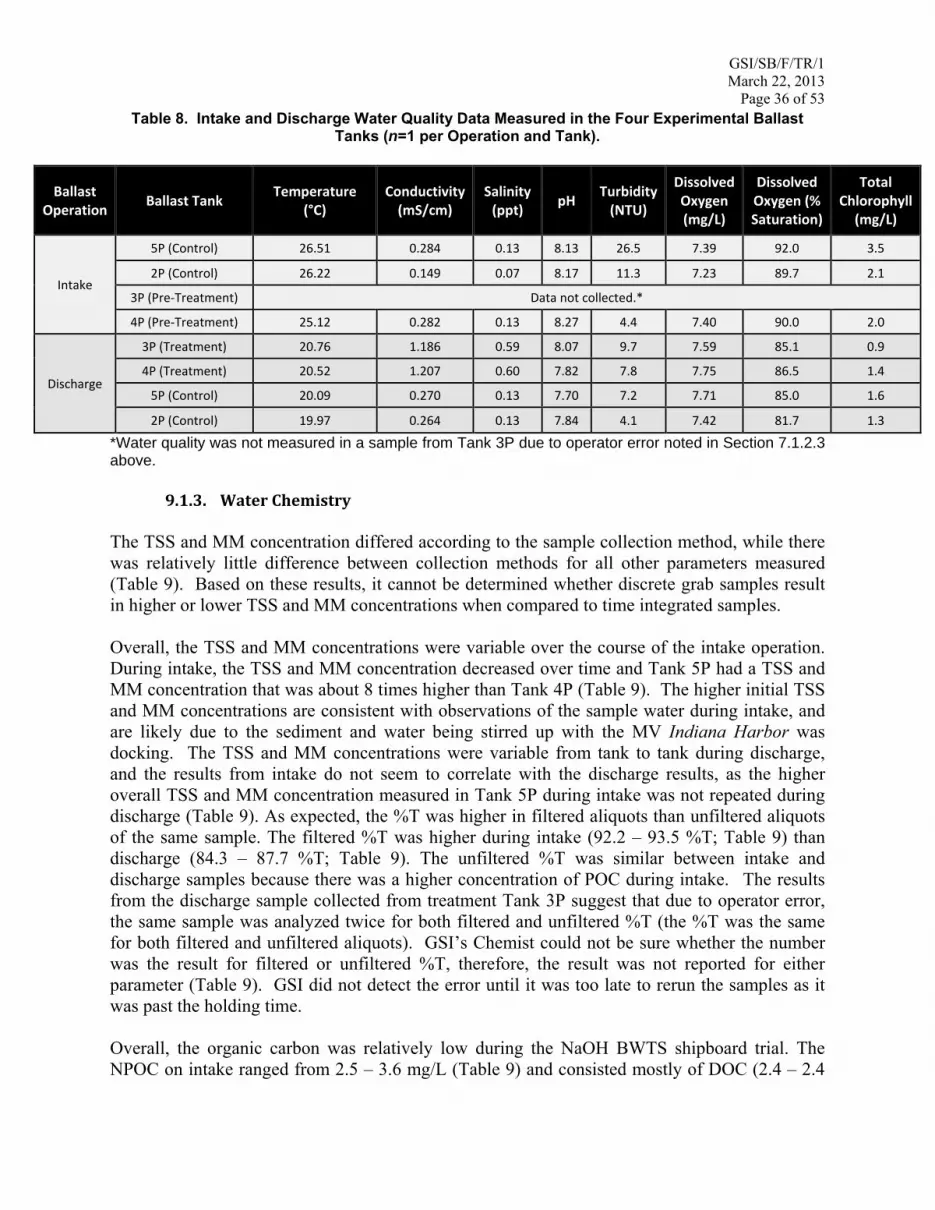
GSI/SB/F/TR/1 March 22, 2013
Page 36 of 53 Table 8. Intake and Discharge Water Quality Data Measured in the Four Experimental Ballast
Tanks (n=1 per Operation and Tank).
Ballast Operation
Ballast Tank Temperature
(°C) Conductivity (mS/cm)
Salinity (ppt)
pH Turbidity (NTU)
Dissolved Oxygen (mg/L)
Dissolved Oxygen (% Saturation)
Total Chlorophyll (mg/L)
Intake
5P (Control) 26.51 0.284 0.13 8.13 26.5 7.39 92.0 3.5
2P (Control) 26.22 0.149 0.07 8.17 11.3 7.23 89.7 2.1
3P (Pre‐Treatment) Data not collected.*
4P (Pre‐Treatment) 25.12 0.282 0.13 8.27 4.4 7.40 90.0 2.0
Discharge
3P (Treatment) 20.76 1.186 0.59 8.07 9.7 7.59 85.1 0.9
4P (Treatment) 20.52 1.207 0.60 7.82 7.8 7.75 86.5 1.4
5P (Control) 20.09 0.270 0.13 7.70 7.2 7.71 85.0 1.6
2P (Control) 19.97 0.264 0.13 7.84 4.1 7.42 81.7 1.3
*Water quality was not measured in a sample from Tank 3P due to operator error noted in Section 7.1.2.3 above.
9.1.3. WaterChemistry The TSS and MM concentration differed according to the sample collection method, while there was relatively little difference between collection methods for all other parameters measured (Table 9). Based on these results, it cannot be determined whether discrete grab samples result in higher or lower TSS and MM concentrations when compared to time integrated samples. Overall, the TSS and MM concentrations were variable over the course of the intake operation. During intake, the TSS and MM concentration decreased over time and Tank 5P had a TSS and MM concentration that was about 8 times higher than Tank 4P (Table 9). The higher initial TSS and MM concentrations are consistent with observations of the sample water during intake, and are likely due to the sediment and water being stirred up with the MV Indiana Harbor was docking. The TSS and MM concentrations were variable from tank to tank during discharge, and the results from intake do not seem to correlate with the discharge results, as the higher overall TSS and MM concentration measured in Tank 5P during intake was not repeated during discharge (Table 9). As expected, the %T was higher in filtered aliquots than unfiltered aliquots of the same sample. The filtered %T was higher during intake (92.2 – 93.5 %T; Table 9) than discharge (84.3 – 87.7 %T; Table 9). The unfiltered %T was similar between intake and discharge samples because there was a higher concentration of POC during intake. The results from the discharge sample collected from treatment Tank 3P suggest that due to operator error, the same sample was analyzed twice for both filtered and unfiltered %T (the %T was the same for both filtered and unfiltered aliquots). GSI’s Chemist could not be sure whether the number was the result for filtered or unfiltered %T, therefore, the result was not reported for either parameter (Table 9). GSI did not detect the error until it was too late to rerun the samples as it was past the holding time. Overall, the organic carbon was relatively low during the NaOH BWTS shipboard trial. The NPOC on intake ranged from 2.5 – 3.6 mg/L (Table 9) and consisted mostly of DOC (2.4 – 2.4

GSI/SB/F/TR/1 March 22, 2013
Page 37 of 53
mg/L; Table 9). The POC on intake ranged from 0.3 -1.6 mg/L (Table 9). The NPOC concentration was slightly higher in discharge samples than intake samples, and ranged from 3.2 – 4.9 mg/L (Table 9). There was very little POC measured in discharge samples (0.0 – 1.4 mg/L; Table 9); the organic carbon was mostly composed of DOC (2.7 – 3.7 mg/L; Table 9).

GSI/SB/F/TR/1 March 22, 2013
Page 38 of 53 Table 9. Concentration of Total Suspended Solids (TSS), Percent Transmittance (%T, Filtered and Unfiltered), Non-Purgeable Organic Carbon (NPOC), Dissolved Organic Carbon (DOC), Particulate Organic Carbon (POC), and Mineral Matter (MM) in Intake and Discharge
Ballast Water Sampled from the MV Indiana Harbor. Note: Where n>1 the mean value is reported.
Ballast Operation
Ballast Tank Collection Method
TSS (mg/L)
%T, Filtered
%T, Unfiltered
NPOC (mg/L)
DOC (mg/L)
POC (mg/L)
MM (mg/L)
Intake
5P (Control) Discrete Grab, n=1 33.6 93.5 73.4 3.6 2.1 1.6 32.0
Time Integrated, n=1 34.3 92.2 71.3 3.1 2.1 1.0 33.3
2P (Control) Discrete Grab, n=1 12.0 92.6 83.7 2.9 2.2 0.7 11.3
Time Integrated, n=1 13.5 92.3 82.8 2.6 2.0 0.6 12.9
3P (Pre‐Treatment) Discrete Grab, n=1 8.6 93.3 86.0 2.8 2.4 0.4 8.2
Time Integrated, n=1 7.5 93.2 86.7 2.5 2.2 0.3 7.3
4P (Pre‐Treatment) Discrete Grab, n=1 4.3 93.3 89.1 2.8 2.1 0.7 3.6
Time Integrated, n=1 3.9 93.4 88.9 2.8 2.1 0.7 3.2
Discharge
3P (Treatment) Discrete Grab, n=2 0.2 87.1 86.4 3.8 2.9 0.9 ‐0.8
Time Integrated, n=1 10.3 NR* NR* 4.4 3.7 0.7 9.6
4P (Treatment) Discrete Grab, n=3 25.6 84.3 80.8 3.6 3.3 0.2 25.4
Time Integrated, n=1 8.7 85.0 82.1 3.3 3.0 0.3 8.4
5P (Control) Discrete Grab, n=2 3.1 87.7 81.5 4.0 2.7 1.4 1.7
Time Integrated, n=1 4.0 86.2 80.0 3.2 3.2 0.0 4.0
2P (Control) Discrete Grab, n=2 1.8 86.7 83.2 3.7 3.4 0.3 1.5
Time Integrated, n=1 2.4 87.7 84.4 4.9 2.9 2.0 0.4
*The %T, filtered and unfiltered results are not reported (NR) due to operator error during sample analysis.

GSI/SB/F/TR/1 March 22, 2013
Page 39 of 53
9.1.4. BiotainPre‐Treatment/ControlIntakeandControlDischargeSamples
9.1.4.1.Organisms≥50µm According to GSI SOP GSI/SOP/LB/RA/SA/2 - Procedure for Zooplankton Sample Analysis, analysis of live organisms ≥ 50 µm should be completed within two hours of collection and concentration of the samples to prevent mortality of the organisms due to handling and storage. Unfortunately, mechanical problems with the GSI mobile laboratory resulted in the need to transport the ballast intake samples for this size class to the vehicle which had been disabled approximately two hours from the docked vessel in Gary, IN. All four samples for this size class (i.e., samples collected from the two control and two treatment ballast tanks) were transported simultaneously to the mobile laboratory. Approximately 5.5 hours elapsed between collection of the first intake sample (i.e., control tank 2P) and the last sample (i.e., treatment tank 4P, see Table 10). In keeping with the SOP, the concentrated samples were kept cool in a cooler with ice packs until they arrived at the mobile laboratory. Upon arrival at the disabled mobile laboratory, the two treatment samples were analyzed first and analyses of these samples was completed within two hours of receipt of the samples, but four to nine hours from sample collection (Table 10). The control samples were then analyzed and processing was completed approximately 12 to 13 hours after sample collection (Table 10). This delay in processing may have resulted in an underestimate of the actual density of live organisms in the intake samples due to deaths that may have occurred as a result of being held in a concentrated condition for an extended holding period. Still, live densities of organisms in the ≥ 50 m size class sampled during intake (i.e., pre-treatment) were well above prescribed threshold densities allowed by the IMO G8 Guidelines (IMO, 2008a; Table 11). Live organism densities in this size class ranged from 43,000/m3 to 235,000/m3 (Table 11).
Table 10. Ballast Intake and Discharge Sample Collection and Analysis Times for Organisms in the ≥ 50 m Size Class.
INTAKE SAMPLES
DISCHARGE SAMPLES
Control Pre‐
Treatment Control Treatment
Ballast Tank 2P 5P 3P 4P
2P 5P 3P 4P
Time sample collected 19:04 17:47 21:00 00:32 06:20 04:49 00:55 02:42
Time sample received by analysts 04:00 04:00 04:00 04:00 07:05 05:20 01:25 03:20
Time analysis completed 07:35 06:45 05:50 05:00 08:05 06:15 03:25 05:00
Total holding time before analysis completed 12:31 12:58 08:50 04:28 01:45 01:26 02:30 02:18
Volume of water collected (m3) 3.00 2.03 3.61 3.30 3.70 5.11 3.95 4.42
Equivalent Volume analyzed Macros (m3) 0.015 0.020 0.017 0.016 0.068 0.067 1.970 2.210
Equivalent Volume analyzed Micros (m3) 0.001 0.001 0.001 0.001 0.001 0.001 0.100 0.130

GSI/SB/F/TR/1 March 22, 2013
Page 40 of 53
The intake ballast water zooplankton community was dominated by dreissenid bivalve veligers (zebra and/or quagga mussels), loricate rotifers in the genus Keratella, and illoricate rotifers including Polyarthra, Synchaeta, and Conochilus (Table 11). In terms of GSI estimates of relative quantities of these taxa shown in Table 11, note that one live organism in the concentrated subsample corresponds to 1,000 live/m3 in the unconcentrated sample, based on the volume being analyzed. Therefore, the magnitude of difference in the reported live densities of organisms in Table 11 is quite small relative to the number of organisms counted (e.g., 3600 live nauplii per m3 in Tank 5P versus 0 live nauplii per m3 in Tank 4P corresponds to an average of 3.6 live nauplii counted in Tank 5P subsamples compared to 0 live nauplii counted in Tank 4P subsamples). Common crustacean zooplankton included the cladocerans Bosmina and a mixture of cyclopoid and calanoid copepods. In contrast to the intake samples, control discharge samples were analyzed within 1.5 to 2.5 hours of collection, i.e., consistent with GSI/SOP/LB/RA/SA/2. Live densities of organisms ≥ 50 m in control discharge samples ranged from 100,000/m3 to 167,000/ m3 (Table 11), and were well above prescribed discharge densities allowed by the IMO G8 Guidelines (IMO, 2008a). That these estimate values were higher than intake density estimates could relate to the shorter holding time of the discharge samples (less sample die-off post-collection), reproduction in the tanks, variability in the estimates, or a combination thereof. Consistent with intake samples, large numbers of dreissenid veligers and the rotifers Polyarthra and Keratella were found in the control discharge samples (Table 11).
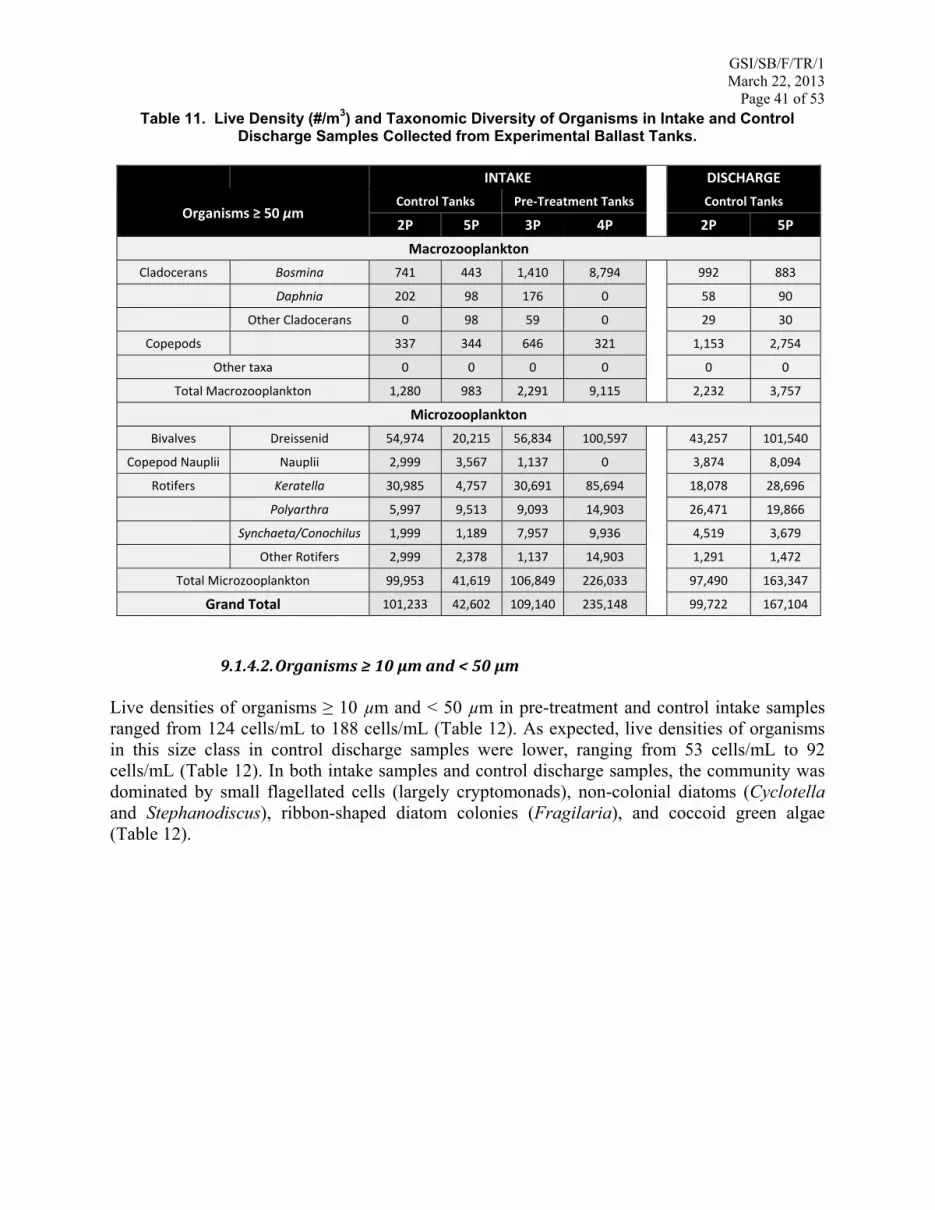
GSI/SB/F/TR/1 March 22, 2013
Page 41 of 53 Table 11. Live Density (#/m3) and Taxonomic Diversity of Organisms in Intake and Control
Discharge Samples Collected from Experimental Ballast Tanks.
INTAKE
DISCHARGE
Organisms ≥ 50 µm Control Tanks Pre‐Treatment Tanks Control Tanks
2P 5P 3P 4P 2P 5P
Macrozooplankton
Cladocerans Bosmina 741 443 1,410 8,794
992 883
Daphnia 202 98 176 0 58 90
Other Cladocerans 0 98 59 0 29 30
Copepods 337 344 646 321 1,153 2,754
Other taxa 0 0 0 0 0 0
Total Macrozooplankton 1,280 983 2,291 9,115 2,232 3,757
Microzooplankton
Bivalves Dreissenid 54,974 20,215 56,834 100,597
43,257 101,540
Copepod Nauplii Nauplii 2,999 3,567 1,137 0 3,874 8,094
Rotifers Keratella 30,985 4,757 30,691 85,694 18,078 28,696
Polyarthra 5,997 9,513 9,093 14,903 26,471 19,866
Synchaeta/Conochilus 1,999 1,189 7,957 9,936 4,519 3,679
Other Rotifers 2,999 2,378 1,137 14,903 1,291 1,472
Total Microzooplankton 99,953 41,619 106,849 226,033 97,490 163,347
Grand Total 101,233 42,602 109,140 235,148 99,722 167,104
9.1.4.2.Organisms≥10µmand<50µm
Live densities of organisms ≥ 10 µm and < 50 µm in pre-treatment and control intake samples ranged from 124 cells/mL to 188 cells/mL (Table 12). As expected, live densities of organisms in this size class in control discharge samples were lower, ranging from 53 cells/mL to 92 cells/mL (Table 12). In both intake samples and control discharge samples, the community was dominated by small flagellated cells (largely cryptomonads), non-colonial diatoms (Cyclotella and Stephanodiscus), ribbon-shaped diatom colonies (Fragilaria), and coccoid green algae (Table 12).
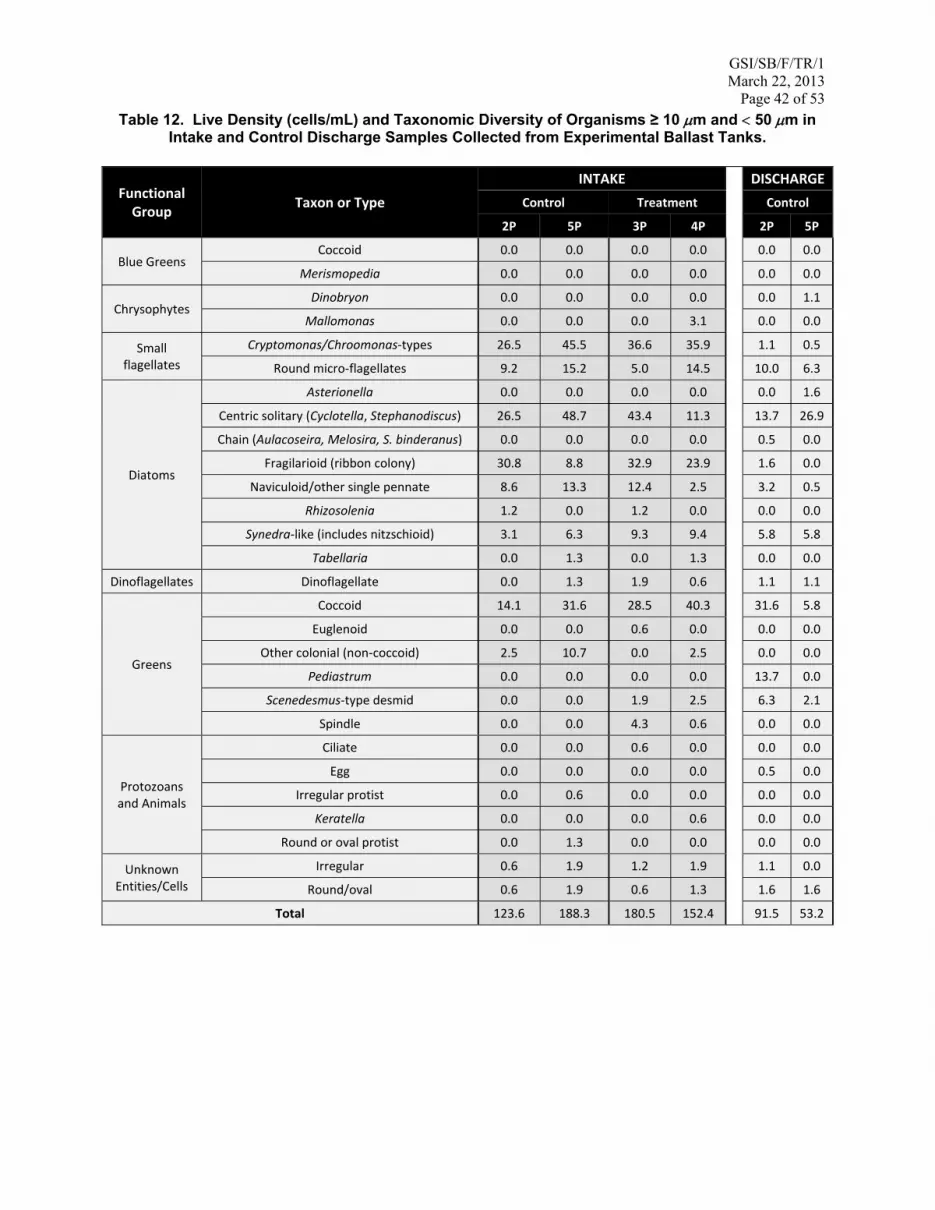
GSI/SB/F/TR/1 March 22, 2013
Page 42 of 53
Table 12. Live Density (cells/mL) and Taxonomic Diversity of Organisms ≥ 10 m and 50 m in Intake and Control Discharge Samples Collected from Experimental Ballast Tanks.
Functional Group
Taxon or Type
INTAKE
DISCHARGE
Control Treatment Control
2P 5P 3P 4P 2P 5P
Blue Greens Coccoid 0.0 0.0 0.0 0.0 0.0 0.0
Merismopedia 0.0 0.0 0.0 0.0 0.0 0.0
Chrysophytes Dinobryon 0.0 0.0 0.0 0.0 0.0 1.1
Mallomonas 0.0 0.0 0.0 3.1 0.0 0.0
Small flagellates
Cryptomonas/Chroomonas‐types 26.5 45.5 36.6 35.9 1.1 0.5
Round micro‐flagellates 9.2 15.2 5.0 14.5 10.0 6.3
Diatoms
Asterionella 0.0 0.0 0.0 0.0 0.0 1.6
Centric solitary (Cyclotella, Stephanodiscus) 26.5 48.7 43.4 11.3 13.7 26.9
Chain (Aulacoseira, Melosira, S. binderanus) 0.0 0.0 0.0 0.0 0.5 0.0
Fragilarioid (ribbon colony) 30.8 8.8 32.9 23.9 1.6 0.0
Naviculoid/other single pennate 8.6 13.3 12.4 2.5 3.2 0.5
Rhizosolenia 1.2 0.0 1.2 0.0 0.0 0.0
Synedra‐like (includes nitzschioid) 3.1 6.3 9.3 9.4 5.8 5.8
Tabellaria 0.0 1.3 0.0 1.3 0.0 0.0
Dinoflagellates Dinoflagellate 0.0 1.3 1.9 0.6 1.1 1.1
Greens
Coccoid 14.1 31.6 28.5 40.3 31.6 5.8
Euglenoid 0.0 0.0 0.6 0.0 0.0 0.0
Other colonial (non‐coccoid) 2.5 10.7 0.0 2.5 0.0 0.0
Pediastrum 0.0 0.0 0.0 0.0 13.7 0.0
Scenedesmus‐type desmid 0.0 0.0 1.9 2.5 6.3 2.1
Spindle 0.0 0.0 4.3 0.6 0.0 0.0
Protozoans and Animals
Ciliate 0.0 0.0 0.6 0.0 0.0 0.0
Egg 0.0 0.0 0.0 0.0 0.5 0.0
Irregular protist 0.0 0.6 0.0 0.0 0.0 0.0
Keratella 0.0 0.0 0.0 0.6 0.0 0.0
Round or oval protist 0.0 1.3 0.0 0.0 0.0 0.0
Unknown Entities/Cells
Irregular 0.6 1.9 1.2 1.9 1.1 0.0
Round/oval 0.6 1.9 0.6 1.3 1.6 1.6
Total 123.6 188.3 180.5 152.4 91.5 53.2
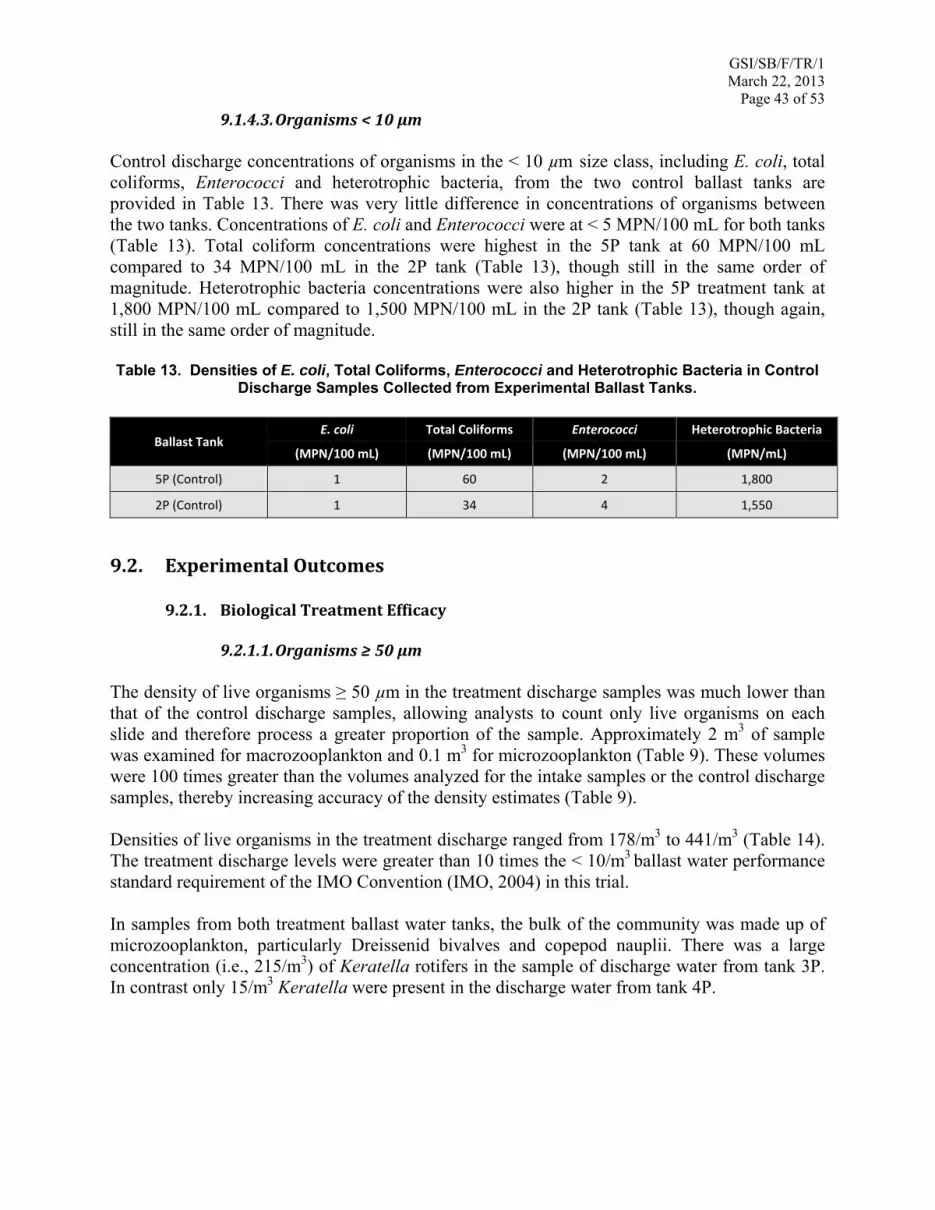
GSI/SB/F/TR/1 March 22, 2013
Page 43 of 53
9.1.4.3.Organisms<10µm Control discharge concentrations of organisms in the < 10 µm size class, including E. coli, total coliforms, Enterococci and heterotrophic bacteria, from the two control ballast tanks are provided in Table 13. There was very little difference in concentrations of organisms between the two tanks. Concentrations of E. coli and Enterococci were at < 5 MPN/100 mL for both tanks (Table 13). Total coliform concentrations were highest in the 5P tank at 60 MPN/100 mL compared to 34 MPN/100 mL in the 2P tank (Table 13), though still in the same order of magnitude. Heterotrophic bacteria concentrations were also higher in the 5P treatment tank at 1,800 MPN/100 mL compared to 1,500 MPN/100 mL in the 2P tank (Table 13), though again, still in the same order of magnitude. Table 13. Densities of E. coli, Total Coliforms, Enterococci and Heterotrophic Bacteria in Control
Discharge Samples Collected from Experimental Ballast Tanks.
Ballast Tank E. coli Total Coliforms Enterococci Heterotrophic Bacteria
(MPN/100 mL) (MPN/100 mL) (MPN/100 mL) (MPN/mL)
5P (Control) 1 60 2 1,800
2P (Control) 1 34 4 1,550
9.2. ExperimentalOutcomes
9.2.1. BiologicalTreatmentEfficacy
9.2.1.1.Organisms≥50µm The density of live organisms ≥ 50 µm in the treatment discharge samples was much lower than that of the control discharge samples, allowing analysts to count only live organisms on each slide and therefore process a greater proportion of the sample. Approximately 2 m3 of sample was examined for macrozooplankton and 0.1 m3 for microzooplankton (Table 9). These volumes were 100 times greater than the volumes analyzed for the intake samples or the control discharge samples, thereby increasing accuracy of the density estimates (Table 9). Densities of live organisms in the treatment discharge ranged from 178/m3 to 441/m3 (Table 14). The treatment discharge levels were greater than 10 times the < 10/m3 ballast water performance standard requirement of the IMO Convention (IMO, 2004) in this trial. In samples from both treatment ballast water tanks, the bulk of the community was made up of microzooplankton, particularly Dreissenid bivalves and copepod nauplii. There was a large concentration (i.e., 215/m3) of Keratella rotifers in the sample of discharge water from tank 3P. In contrast only 15/m3 Keratella were present in the discharge water from tank 4P.

GSI/SB/F/TR/1 March 22, 2013
Page 44 of 53
9.2.1.2.Organisms≥10and<50μm Densities of live organisms ≥ 10 and < 50 μm in the treatment discharge were few, ranging from 2 cells/mL (Tank 3P) to 8 cells/mL (Tank 4P, see Table 14). Blue-green algae and diatoms were the dominant taxa remaining in the samples. Treatment discharge densities were within the < 10/mL ballast water performance standard requirement of the IMO Convention for this size class of organisms (IMO, 2004).
9.2.1.3.Organisms<10µm Densities of heterotrophic bacteria in treated discharge samples ranged from 180,000 MPN/mL (Tank 3P) to 295,000 MPN/mL (Tank 4P) (Table 14). On average, there was a greater live heterotrophic bacteria density in the treatment discharge (237,500 MPN/.mL; Table 14) than the control discharge (1675 MPN/mL; Table 13). There were no intake samples collected for this size class, therefore, the discharge results cannot be compared to the initial densities in each tank. E. coli and Enterococcus spp. densities in both ballast tanks were near the limit of detection (LOD), i.e., < 1 MPN/100 mL, and well within the performance standard of the IMO Convention (IMO, 2004). However, the control discharge density of these two human pathogen indicators also was very low. The treatment discharge density of E. coli was not different from the control discharge density; all samples were 1 MPN/100 mL (Tables 13 and 14). The control discharge density of Enterococcus spp. averaged 3 MPN/100 mL (Table 13). The BWTS had no negative effect on the live density of total coliform bacteria. On average, there was a higher density of live total coliform bacteria in the treatment discharge (82 MPN/100 mL; Table 14) than in the control discharge (47 MPN/100 mL; Table 13). As with heterotrophic bacteria, there is no IMO benchmark against which to compare these levels of total coliform bacteria (Table 14). Table 14. Densities of Live Organisms by Size Class in Treated Discharge Samples Compared to
the IMO Ballast Water Performance Standard.
Size Class of Organisms Taxonomic Group IMO Standard Ballast Tank 3P Ballast Tank 4P
≥ 50 µm N/A < 10/m3 441/m3 178/m3
≥ 10 and < 50 µm N/A < 10/mL 2/mL 8/mL
< 10 µm
Heterotrophic bacteria N/A 180,000 MPN/mL 295,000 MPN/mL
Escherichia Coli < 250 CFU/100 mL 1 MPN/100 mL 1 MPN/100 mL
Total Coliforms N/A 37 MPN/100 mL 126 MPN/100 mL
Enterococci < 100 CFU/100 mL 1 MPN/100 mL 1 MPN/100 mL
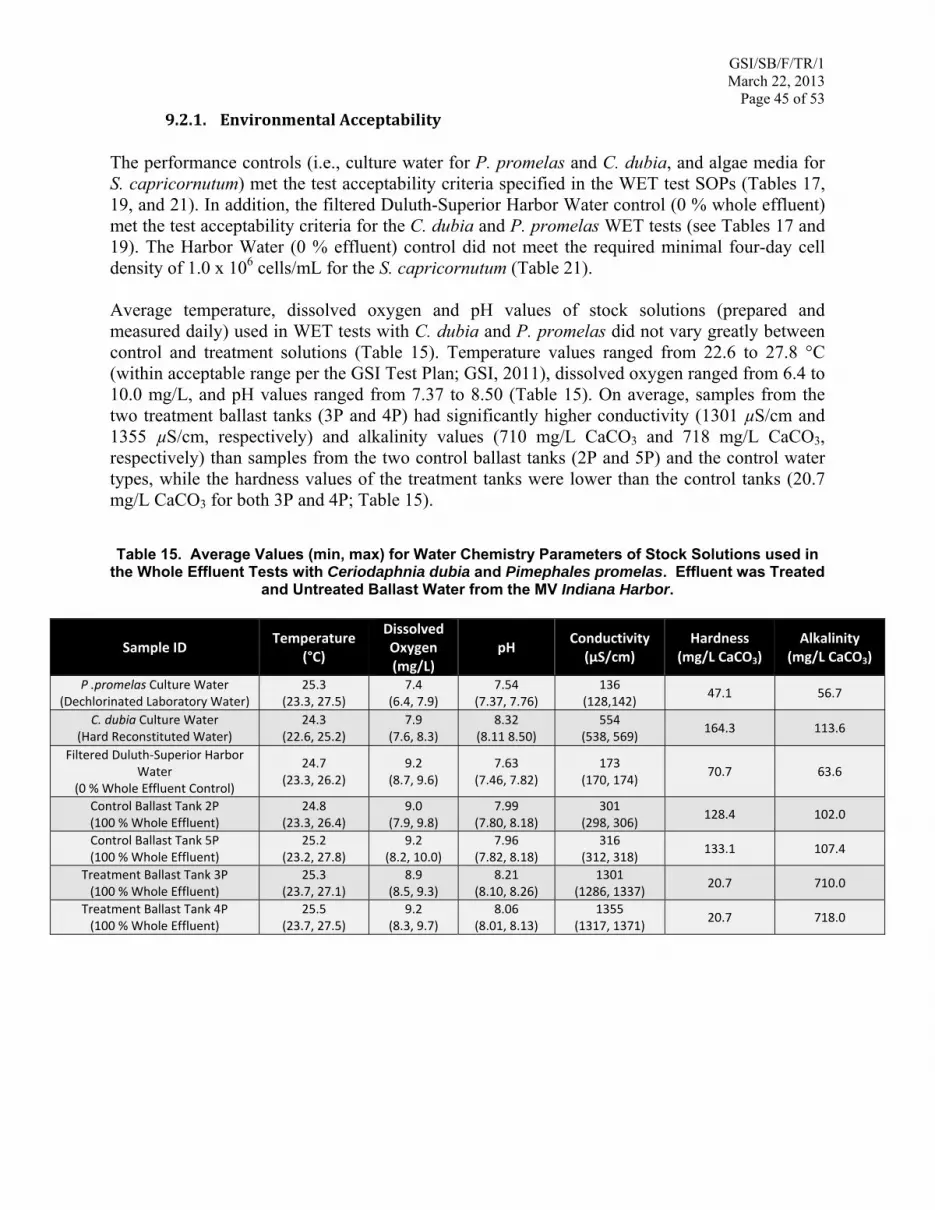
GSI/SB/F/TR/1 March 22, 2013
Page 45 of 53
9.2.1. EnvironmentalAcceptability
The performance controls (i.e., culture water for P. promelas and C. dubia, and algae media for S. capricornutum) met the test acceptability criteria specified in the WET test SOPs (Tables 17, 19, and 21). In addition, the filtered Duluth-Superior Harbor Water control (0 % whole effluent) met the test acceptability criteria for the C. dubia and P. promelas WET tests (see Tables 17 and 19). The Harbor Water (0 % effluent) control did not meet the required minimal four-day cell density of 1.0 x 10⁶ cells/mL for the S. capricornutum (Table 21). Average temperature, dissolved oxygen and pH values of stock solutions (prepared and measured daily) used in WET tests with C. dubia and P. promelas did not vary greatly between control and treatment solutions (Table 15). Temperature values ranged from 22.6 to 27.8 °C (within acceptable range per the GSI Test Plan; GSI, 2011), dissolved oxygen ranged from 6.4 to 10.0 mg/L, and pH values ranged from 7.37 to 8.50 (Table 15). On average, samples from the two treatment ballast tanks (3P and 4P) had significantly higher conductivity (1301 µS/cm and 1355 µS/cm, respectively) and alkalinity values (710 mg/L CaCO3 and 718 mg/L CaCO3, respectively) than samples from the two control ballast tanks (2P and 5P) and the control water types, while the hardness values of the treatment tanks were lower than the control tanks (20.7 mg/L CaCO3 for both 3P and 4P; Table 15). Table 15. Average Values (min, max) for Water Chemistry Parameters of Stock Solutions used in
the Whole Effluent Tests with Ceriodaphnia dubia and Pimephales promelas. Effluent was Treated and Untreated Ballast Water from the MV Indiana Harbor.
Sample ID Temperature
(°C)
Dissolved Oxygen (mg/L)
pH Conductivity (µS/cm)
Hardness (mg/L CaCO3)
Alkalinity (mg/L CaCO3)
P .promelas Culture Water (Dechlorinated Laboratory Water)
25.3 (23.3, 27.5)
7.4 (6.4, 7.9)
7.54 (7.37, 7.76)
136 (128,142)
47.1 56.7
C. dubia Culture Water (Hard Reconstituted Water)
24.3 (22.6, 25.2)
7.9 (7.6, 8.3)
8.32 (8.11 8.50)
554 (538, 569)
164.3 113.6
Filtered Duluth‐Superior Harbor Water
(0 % Whole Effluent Control)
24.7 (23.3, 26.2)
9.2 (8.7, 9.6)
7.63 (7.46, 7.82)
173 (170, 174)
70.7 63.6
Control Ballast Tank 2P (100 % Whole Effluent)
24.8 (23.3, 26.4)
9.0 (7.9, 9.8)
7.99 (7.80, 8.18)
301 (298, 306)
128.4 102.0
Control Ballast Tank 5P (100 % Whole Effluent)
25.2 (23.2, 27.8)
9.2 (8.2, 10.0)
7.96 (7.82, 8.18)
316 (312, 318)
133.1 107.4
Treatment Ballast Tank 3P (100 % Whole Effluent)
25.3 (23.7, 27.1)
8.9 (8.5, 9.3)
8.21 (8.10, 8.26)
1301 (1286, 1337)
20.7 710.0
Treatment Ballast Tank 4P (100 % Whole Effluent)
25.5 (23.7, 27.5)
9.2 (8.3, 9.7)
8.06 (8.01, 8.13)
1355 (1317, 1371)
20.7 718.0

GSI/SB/F/TR/1 March 22, 2013
Page 46 of 53
The water chemistry parameters measured in exposure vessels during the C. dubia WET test (Table 16) had similar results to the stock solutions. Among the treatment groups, there was a difference in the hardness and alkalinity; in particular the hardness of the 100 % whole effluent from the treatment tanks was substantially lower and the alkalinity was higher than the 100 % whole effluent from the control tanks (Table 16). The exposure solution temperatures ranged from 20.8 °C to 24.5 °C. The pH of exposure solutions ranged from 7.54 to 9.23, with the 100 % whole effluent from the treatment tanks pH 9.1 to 9.15, and the whole effluent for control tanks pH 8.4 – 8.41 (Table 16). Under these conditions, there was a statistically significant (p<0.001) reduction in mean survival and average number of young per female (reproduction) of C. dubia exposed to 100 % whole effluent from treatment tank 3P and 4P when compared to the filtered Duluth-Superior Harbor Water control (Table 16). There was no effect on C. dubia mean survival and reproduction in the 100 % whole effluent from control tank 2P or 5P (Table 16). Table 16. Average Values (min, max) for Water Chemistry Parameters of Exposure Solutions used in Whole Effluent Tests with C. dubia. Effluent was Treated and Untreated Ballast Water from the
MV Indiana Harbor.
Sample ID Temperature
(°C) pH
Hardness* (mg/L CaCO3)
Alkalinity*(mg/L CaCO3)
C. dubia Culture Water Performance Control (Hard Reconstituted Water)
23.3 (22.2, 24.2)
8.05 (7.54, 8.36)
174.0 128.0
Filtered Duluth‐Superior Harbor Water (0 % Whole Effluent Control)
23.2 (22.0, 24.2)
8.12 (8.03, 8.22)
78.0 68.0
Control Ballast Tank 2P (100 % Whole Effluent)
23.0 (21.1, 24.3)
8.40 (8.26, 8.58)
133.0 110.0
Control Ballast Tank 5P (100 % Whole Effluent)
23.3 (21.3, 24.5)
8.41 (8.33, 8.49)
136.0 118.0
Treatment Ballast Tank 3P (100 % Whole Effluent)
23.2 (21.3, 24.1)
9.10 (9.06, 9.15)
24.8 702.0
Treatment Ballast Tank 4P (100% Whole Effluent)
22.8 (20.8, 24.1)
9.15 (9.06, 9.23)
27.2 727.0
*Hardness and Alkalinity are measured only on Day 7 and do not have minimum and maximum values.
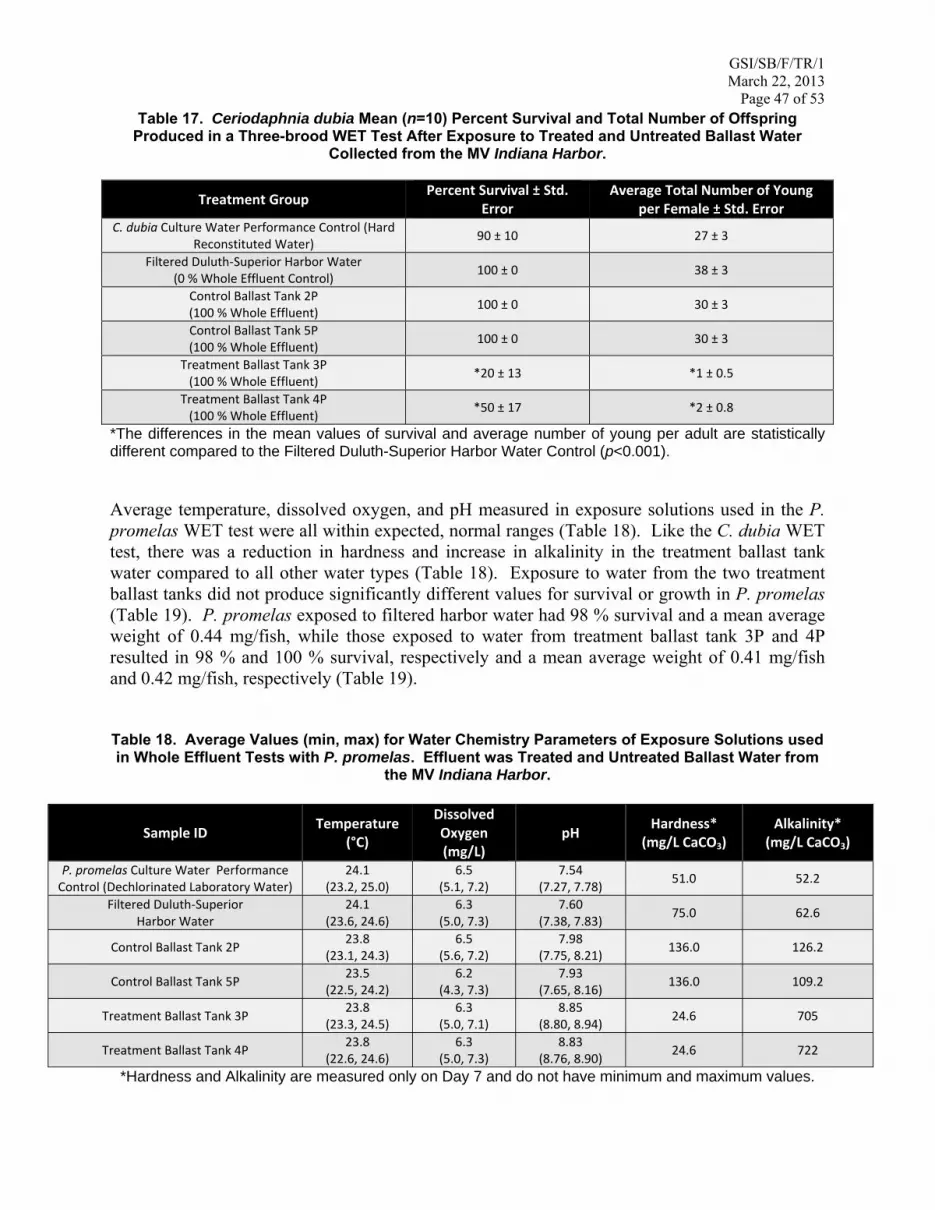
GSI/SB/F/TR/1 March 22, 2013
Page 47 of 53 Table 17. Ceriodaphnia dubia Mean (n=10) Percent Survival and Total Number of Offspring
Produced in a Three-brood WET Test After Exposure to Treated and Untreated Ballast Water Collected from the MV Indiana Harbor.
Treatment Group Percent Survival ± Std.
Error Average Total Number of Young
per Female ± Std. Error C. dubia Culture Water Performance Control (Hard
Reconstituted Water) 90 ± 10 27 ± 3
Filtered Duluth‐Superior Harbor Water (0 % Whole Effluent Control)
100 ± 0 38 ± 3
Control Ballast Tank 2P (100 % Whole Effluent)
100 ± 0 30 ± 3
Control Ballast Tank 5P (100 % Whole Effluent)
100 ± 0 30 ± 3
Treatment Ballast Tank 3P (100 % Whole Effluent)
*20 ± 13 *1 ± 0.5
Treatment Ballast Tank 4P (100 % Whole Effluent)
*50 ± 17 *2 ± 0.8
*The differences in the mean values of survival and average number of young per adult are statistically different compared to the Filtered Duluth-Superior Harbor Water Control (p<0.001). Average temperature, dissolved oxygen, and pH measured in exposure solutions used in the P. promelas WET test were all within expected, normal ranges (Table 18). Like the C. dubia WET test, there was a reduction in hardness and increase in alkalinity in the treatment ballast tank water compared to all other water types (Table 18). Exposure to water from the two treatment ballast tanks did not produce significantly different values for survival or growth in P. promelas (Table 19). P. promelas exposed to filtered harbor water had 98 % survival and a mean average weight of 0.44 mg/fish, while those exposed to water from treatment ballast tank 3P and 4P resulted in 98 % and 100 % survival, respectively and a mean average weight of 0.41 mg/fish and 0.42 mg/fish, respectively (Table 19). Table 18. Average Values (min, max) for Water Chemistry Parameters of Exposure Solutions used in Whole Effluent Tests with P. promelas. Effluent was Treated and Untreated Ballast Water from
the MV Indiana Harbor.
Sample ID Temperature
(°C)
Dissolved Oxygen (mg/L)
pH Hardness*
(mg/L CaCO3) Alkalinity*
(mg/L CaCO3)
P. promelas Culture Water Performance Control (Dechlorinated Laboratory Water)
24.1 (23.2, 25.0)
6.5 (5.1, 7.2)
7.54 (7.27, 7.78)
51.0 52.2
Filtered Duluth‐Superior Harbor Water
24.1 (23.6, 24.6)
6.3 (5.0, 7.3)
7.60 (7.38, 7.83)
75.0 62.6
Control Ballast Tank 2P 23.8
(23.1, 24.3) 6.5
(5.6, 7.2) 7.98
(7.75, 8.21) 136.0 126.2
Control Ballast Tank 5P 23.5
(22.5, 24.2) 6.2
(4.3, 7.3) 7.93
(7.65, 8.16) 136.0 109.2
Treatment Ballast Tank 3P 23.8
(23.3, 24.5) 6.3
(5.0, 7.1) 8.85
(8.80, 8.94) 24.6 705
Treatment Ballast Tank 4P 23.8
(22.6, 24.6) 6.3
(5.0, 7.3) 8.83
(8.76, 8.90) 24.6 722
*Hardness and Alkalinity are measured only on Day 7 and do not have minimum and maximum values.

GSI/SB/F/TR/1 March 22, 2013
Page 48 of 53 Table 19. Pimephales promelas Mean (n=4) Percent Survival and Average Weight per Individual
after Exposure to Treated and Untreated Ballast Water Collected from the MV Indiana Harbor.
Treatment Group Percent Survival ± Std.
Error Mean Average Weight/Fish (mg) ±
Std. Error P. promelas Culture Water Performance Control
(Dechlorinated Laboratory Water) 100 ± 0 0.42 ± 0.02
Filtered Duluth‐Superior Harbor Water (0 % Whole Effluent Control)
98 ± 7 0.44 ± 0.02
Control Ballast Tank 2P (100 % Whole Effluent)
100 ± 0 0.43 ± 0.01
Control Ballast Tank 5P (100 % Whole Effluent)
98 ± 7 0.45 ± 0.02
Treatment Ballast Tank 3P (100 % Whole Effluent)
98 ± 7 0.41 ± 0.02
Treatment Ballast Tank 4P (100 % Whole Effluent)
100 ± 0 0.42 ± 0.01
Average temperature, dissolved oxygen, and pH measured in exposure solutions used in the S. capricornutum WET test were all within expected, normal ranges specified in the SOP (Table 20). As with the C. dubia and P. promelas stock solutions and exposure solutions, there was an increase in conductivity, reduction in hardness, and increase in alkalinity in the treatment ballast tank water compared to all other water types (Table 20). Cell densities of S. capricornutum exposed to treated ballast water from tanks 3P and 4P were not significantly lower than S. capricornutum exposed to filtered Duluth-Superior harbor water (Table 21).
Table 20. Average Values (minimum, maximum) for Water Chemistry Parameters of Exposure Solutions used in Whole Effluent Tests with Selenastrum capricornutum. Effluent was Treated
and Untreated Ballast Water from the MV Indiana Harbor.
Sample ID Temperature
(°C)
Dissolved Oxygen (mg/L)
pH Conductivity*
(µS/cm) Hardness*
(mg/L CaCO3) Alkalinity*
(mg/L CaCO3)
Selenastrum Culture Water Performance Control (EPA Nutrient Media)
24.4 (23.5, 26.1)
7.2 7.74
(7.25, 8.32) 219 60.9 61.2
Filtered Duluth‐Superior Harbor Water (0 % Whole Effluent Control)
24.4 (23.4, 25.8)
8.8 7.96
(7.68, 8.28) 261 84.5 69.4
Control Ballast Tank 2P (100 % Whole Effluent)
24.4 (23.4, 25.4)
8.2 8.30
(8.10, 8.65) 283 142.5 112.2
Control Ballast Tank 5P (100 % Whole Effluent)
24.3 (23.6, 25.4)
8.3 8.31
(8.08, 8.63) 394 147.1 117.3
Treatment Ballast Tank 3P (100 % Whole Effluent)
24.5 (23.3, 25.6)
8.5 8.74
(8.19, 9.29) 1393 35.9 707.0
Treatment Ballast Tank 4P (100 % Whole Effluent)
24.8 (23.8, 25.6)
8.4 8.67
(8.08, 9.34) 1415 35.7 725.0
*Conductivity, Dissolved Oxygen, Hardness and Alkalinity are measured only on Day 0 and do not have minimum and maximum values.
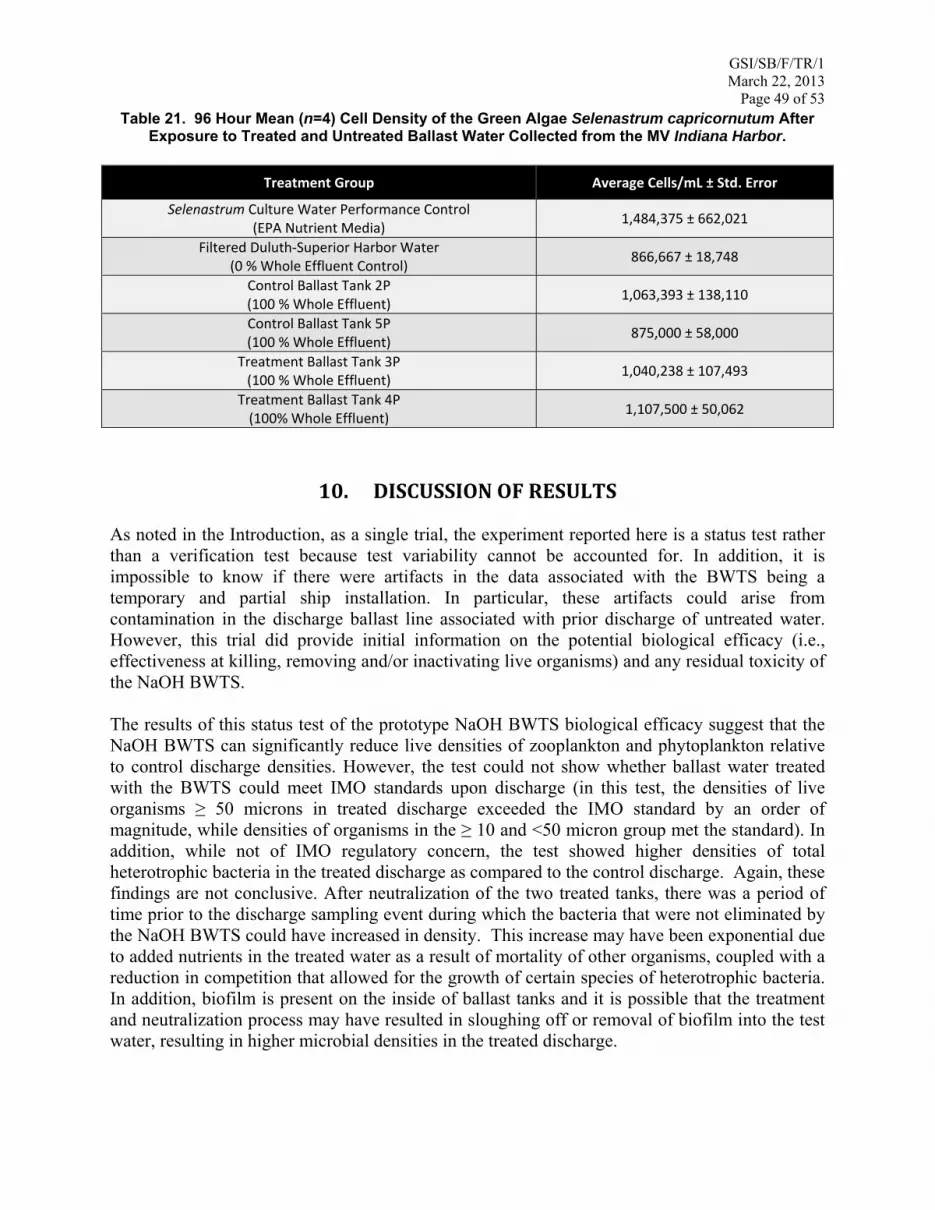
GSI/SB/F/TR/1 March 22, 2013
Page 49 of 53 Table 21. 96 Hour Mean (n=4) Cell Density of the Green Algae Selenastrum capricornutum After
Exposure to Treated and Untreated Ballast Water Collected from the MV Indiana Harbor.
Treatment Group Average Cells/mL ± Std. Error
Selenastrum Culture Water Performance Control(EPA Nutrient Media)
1,484,375 ± 662,021
Filtered Duluth‐Superior Harbor Water(0 % Whole Effluent Control)
866,667 ± 18,748
Control Ballast Tank 2P(100 % Whole Effluent)
1,063,393 ± 138,110
Control Ballast Tank 5P(100 % Whole Effluent)
875,000 ± 58,000
Treatment Ballast Tank 3P(100 % Whole Effluent)
1,040,238 ± 107,493
Treatment Ballast Tank 4P(100% Whole Effluent)
1,107,500 ± 50,062
10. DISCUSSIONOFRESULTS
As noted in the Introduction, as a single trial, the experiment reported here is a status test rather than a verification test because test variability cannot be accounted for. In addition, it is impossible to know if there were artifacts in the data associated with the BWTS being a temporary and partial ship installation. In particular, these artifacts could arise from contamination in the discharge ballast line associated with prior discharge of untreated water. However, this trial did provide initial information on the potential biological efficacy (i.e., effectiveness at killing, removing and/or inactivating live organisms) and any residual toxicity of the NaOH BWTS. The results of this status test of the prototype NaOH BWTS biological efficacy suggest that the NaOH BWTS can significantly reduce live densities of zooplankton and phytoplankton relative to control discharge densities. However, the test could not show whether ballast water treated with the BWTS could meet IMO standards upon discharge (in this test, the densities of live organisms ≥ 50 microns in treated discharge exceeded the IMO standard by an order of magnitude, while densities of organisms in the ≥ 10 and <50 micron group met the standard). In addition, while not of IMO regulatory concern, the test showed higher densities of total heterotrophic bacteria in the treated discharge as compared to the control discharge. Again, these findings are not conclusive. After neutralization of the two treated tanks, there was a period of time prior to the discharge sampling event during which the bacteria that were not eliminated by the NaOH BWTS could have increased in density. This increase may have been exponential due to added nutrients in the treated water as a result of mortality of other organisms, coupled with a reduction in competition that allowed for the growth of certain species of heterotrophic bacteria. In addition, biofilm is present on the inside of ballast tanks and it is possible that the treatment and neutralization process may have resulted in sloughing off or removal of biofilm into the test water, resulting in higher microbial densities in the treated discharge.
GSI/SB/F/TR/1 March 22, 2013
Page 50 of 53
The treated discharge met WIDNR requirements relative to pH levels of discharge (pH 6-9). WET results suggest that the treated ballast water would likely not cause significant changes in algal growth upon discharge to a receiving body of water, nor to larval fish. However, the GSI WET tests indicated a significant BWTS effect on both survival and reproduction of the daphnid C. dubia, indicating possible residual toxicity. The BWTS developer asserts (Appendix 1) that this toxicity could derive from artifactual pH-drift during the WET test (pH in exposure solutions gradually increased by a maximum of about one unit over the 24 hour period following each daily renewal). The GSI team did not control pH drift during the WET tests to avoid altering the natural properties (including conductivity) of the discharge water subject to toxicity testing.
11. CONCLUSION This single trial of the NaOH BWTS onboard the MV Indiana Harbor showed BWTS potential to reduce zooplankton and protist live organism densities relative to control discharge levels. Residual toxicity in this test of treated discharge warrants further analysis.
REFERENCES Great Ships Initiative (2011). GSI/QAQC/TP/NAOH – Biological Efficacy Test Plan for Sodium Hydroxide (NaOH) Shipboard Trial Onboard the M/V Indiana Harbor. August 9, 2011. Northeast-Midwest Institute, Washington, D.C. Great Ships Initiative (2011b). Final Report of the Land-Based, Freshwater Testing of the Lye (NaOH) Ballast Water Treatment System. May 13, 2011. Available at: http://www.nemw.org/GSI/GSI-LB-F-A-3.pdf Great Ships Initiative (2011c). Great Ships Initiative (GSI) Quality Management Plan (QMP), 2011. Northeast-Midwest Institute, Washington, D.C. IMO (2004). International Convention for the Control and Management of Ships Ballast Water and Sediments. As adopted by consensus at a Diplomatic Conference at IMO, London, England, February 13 2004. International Maritime Organization (2008a). Guidelines for Approval of Ballast Water Management Systems (G8), Resolution MEPC.174 (58). Adopted on 10 October 2008. International Maritime Organization (2008b). Procedure for Approval of Ballast Water Management Systems that Make use of Active Substances (G9), Resolution MEPC.169 (57). Adopted on 04 April 2008. Richard RV, Grant JF &. Lemieux EJ (2008). Analysis of Ballast Water Sampling Port Designs Using Computational Fluid Dynamics. Report No. CG-D-01-08. US Coast Guard Research and Development Center, Groton, CT.
GSI/SB/F/TR/1 March 22, 2013
Page 51 of 53
United States Environmental Protection Agency, Office of Water (2002). Short-term Methods for Estimating the Chronic Toxicity of Effluents and Receiving Waters to Freshwater Organisms, 4th Edition. Accessed from: http://www.epa.gov/waterscience/methods/wet/disk3/index.html. United States Environmental Protection Agency (2010). Environmental Technology Verification Program (ETV) Generic Protocol for the Verification of Ballast Water Treatment Technology, Version 5.1. Report number EPA/600/R-10/146. U.S. EPA ETV in cooperation with the U.S. Coast Guard Environmental Standards Division (CG-5224) and the U.S. Naval Research Laboratory. National Sanitation Foundation International, Ann Arbor, MI, 63 pp. + appendices.

GSI/SB/F/TR/1 March 22, 2013
Page 52 of 53
Appendix1–LetterfromJeffreyW.HenquinetoftheNationalParksofLakeSuperiorFoundation.
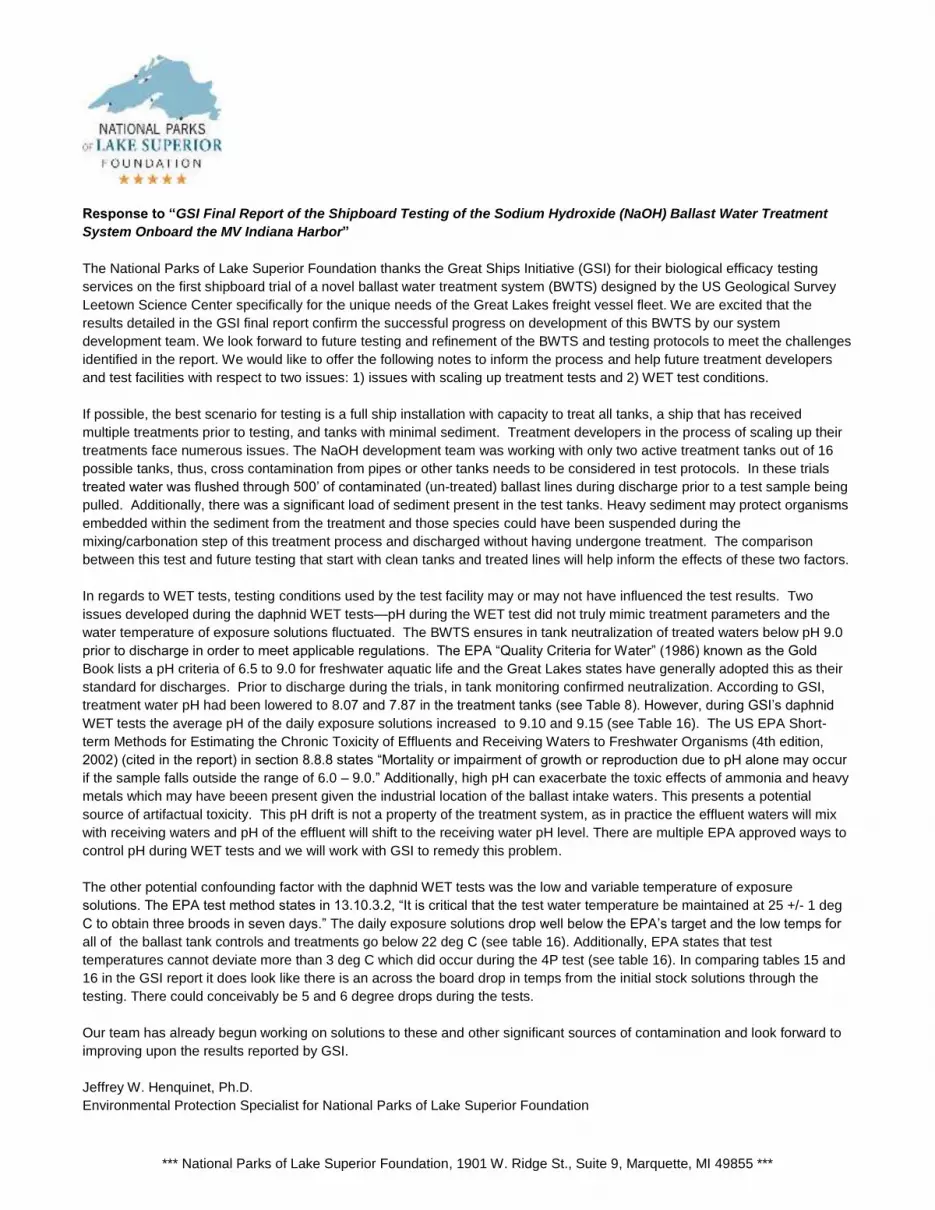
*** National Parks of Lake Superior Foundation, 1901 W. Ridge St., Suite 9, Marquette, MI 49855 ***
Response to “GSI Final Report of the Shipboard Testing of the Sodium Hydroxide (NaOH) Ballast Water Treatment
System Onboard the MV Indiana Harbor”
The National Parks of Lake Superior Foundation thanks the Great Ships Initiative (GSI) for their biological efficacy testing
services on the first shipboard trial of a novel ballast water treatment system (BWTS) designed by the US Geological Survey
Leetown Science Center specifically for the unique needs of the Great Lakes freight vessel fleet. We are excited that the
results detailed in the GSI final report confirm the successful progress on development of this BWTS by our system
development team. We look forward to future testing and refinement of the BWTS and testing protocols to meet the challenges
identified in the report. We would like to offer the following notes to inform the process and help future treatment developers
and test facilities with respect to two issues: 1) issues with scaling up treatment tests and 2) WET test conditions.
If possible, the best scenario for testing is a full ship installation with capacity to treat all tanks, a ship that has received
multiple treatments prior to testing, and tanks with minimal sediment. Treatment developers in the process of scaling up their
treatments face numerous issues. The NaOH development team was working with only two active treatment tanks out of 16
possible tanks, thus, cross contamination from pipes or other tanks needs to be considered in test protocols. In these trials
treated water was flushed through 500’ of contaminated (un-treated) ballast lines during discharge prior to a test sample being
pulled. Additionally, there was a significant load of sediment present in the test tanks. Heavy sediment may protect organisms
embedded within the sediment from the treatment and those species could have been suspended during the
mixing/carbonation step of this treatment process and discharged without having undergone treatment. The comparison
between this test and future testing that start with clean tanks and treated lines will help inform the effects of these two factors.
In regards to WET tests, testing conditions used by the test facility may or may not have influenced the test results. Two
issues developed during the daphnid WET tests—pH during the WET test did not truly mimic treatment parameters and the
water temperature of exposure solutions fluctuated. The BWTS ensures in tank neutralization of treated waters below pH 9.0
prior to discharge in order to meet applicable regulations. The EPA ―Quality Criteria for Water‖ (1986) known as the Gold
Book lists a pH criteria of 6.5 to 9.0 for freshwater aquatic life and the Great Lakes states have generally adopted this as their
standard for discharges. Prior to discharge during the trials, in tank monitoring confirmed neutralization. According to GSI,
treatment water pH had been lowered to 8.07 and 7.87 in the treatment tanks (see Table 8). However, during GSI’s daphnid
WET tests the average pH of the daily exposure solutions increased to 9.10 and 9.15 (see Table 16). The US EPA Short-
term Methods for Estimating the Chronic Toxicity of Effluents and Receiving Waters to Freshwater Organisms (4th edition,
2002) (cited in the report) in section 8.8.8 states ―Mortality or impairment of growth or reproduction due to pH alone may occur
if the sample falls outside the range of 6.0 – 9.0.‖ Additionally, high pH can exacerbate the toxic effects of ammonia and heavy
metals which may have beeen present given the industrial location of the ballast intake waters. This presents a potential
source of artifactual toxicity. This pH drift is not a property of the treatment system, as in practice the effluent waters will mix
with receiving waters and pH of the effluent will shift to the receiving water pH level. There are multiple EPA approved ways to
control pH during WET tests and we will work with GSI to remedy this problem.
The other potential confounding factor with the daphnid WET tests was the low and variable temperature of exposure
solutions. The EPA test method states in 13.10.3.2, ―It is critical that the test water temperature be maintained at 25 +/- 1 deg
C to obtain three broods in seven days.‖ The daily exposure solutions drop well below the EPA’s target and the low temps for
all of the ballast tank controls and treatments go below 22 deg C (see table 16). Additionally, EPA states that test
temperatures cannot deviate more than 3 deg C which did occur during the 4P test (see table 16). In comparing tables 15 and
16 in the GSI report it does look like there is an across the board drop in temps from the initial stock solutions through the
testing. There could conceivably be 5 and 6 degree drops during the tests.
Our team has already begun working on solutions to these and other significant sources of contamination and look forward to
improving upon the results reported by GSI.
Jeffrey W. Henquinet, Ph.D.
Environmental Protection Specialist for National Parks of Lake Superior Foundation