taking tests in the magnet: brain mapping standardized tests
TRANSCRIPT
Taking Tests in the Magnet: Brain MappingStandardized Tests
David C. Rubin ,1,2* Dawei Li,1 Shana A. Hall,1 Philip A. Kragel,3 andDorthe Berntsen2
1Department of Psychology & Neuroscience, Duke University, Durham, North Carolina2Center on Autobiographical Memory Research, Aarhus University, Denmark
3Institute of Cognitive Science, University of Colorado Boulder, Boulder, Colorado
r r
Abstract: Standardized psychometric tests are sophisticated, well-developed, and consequential instru-ments; test outcomes are taken as facts about people that impact their lives in important ways. As partof an initial demonstration that human brain mapping techniques can add converging neural-level evi-dence to understanding standardized tests, our participants completed items from standardized testsduring an fMRI scan. We compared tests for diagnosing posttraumatic stress disorder (PTSD) and thecorrelated measures of Neuroticism, Attachment, and Centrality of Event to a general-knowledge base-line test. Twenty-three trauma-exposed participants answered 20 items for each of our five tests ineach of the three runs for a total of 60 items per test. The tests engaged different neural processes;which test a participant was taking was accurately predicted from other participants’ brain activity.The novelty of the application precluded specific anatomical predictions; however, the interpretation ofactivated regions using meta-analyses produced encouraging results. For instance, items on the Attach-ment test engaged regions shown to be more active for tasks involving judgments of others than judg-ments of the self. The results are an initial demonstration of a theoretically and practically importanttest-taking neuroimaging paradigm and suggest specific neural processes in answering PTSD-relatedtests. Hum Brain Mapp 00:000–000, 2017. VC 2017 Wiley Periodicals, Inc.
Key words: cognition; psychological theory; psychology; applied; Theory of Mind; anxiety; personality
r r
INTRODUCTION
Standardized psychometric tests (STs) assume that peo-ple vary in fairly stable ways that can be assessed in abrief period of time on measures of their knowledge,
abilities, traits, opinions, and health. Great effort and sta-tistical sophistication go into the construction of thesetests; they are often either the operational definition of the
concept they measure or the best brief behavioral measure
of it. The results of such tests are more than numbers.
They are taken as facts about people that determine what
schools they can attend, what jobs they can obtain, and
what diagnoses they might be given. Among the standard
tools used to better understand the constructs that tests
measure are statistical analyses of test items, epidemiologi-
cal studies of how test scores vary over populations,
behavioral manipulations of the conditions under which
tests are taken, and correlations of the test scores with
behavior, neural structure, and neural function.A neglected source of information about STs is the neu-
roimaging of the neural systems active when such testsare being taken. Such data could be especially useful
Contract grant sponsor: NIMH; Contract grant number: R01-MH066079; Contract grant sponsor: Danish National ResearchFoundation; Contract grant number: DNRF89
*Correspondence to: David C. Rubin, Psychology and Neurosci-ence, Duke University, Durham, NC 27708-0086, USA. E-mail:[email protected]
Received for publication 3 January 2017; Revised 10 July 2017;Accepted 28 July 2017.
DOI: 10.1002/hbm.23761Published online 00 Month 2017 in Wiley Online Library(wileyonlinelibrary.com).
r Human Brain Mapping 00:00–00 (2017) r
VC 2017 Wiley Periodicals, Inc.
because we already have a good theoretical understandingof the neural localization of many of the cognitive andemotional processes that are relevant to the taking of tests.If a literature of neural studies of STs emerged, moresophisticated comparisons directly related to specific testsand the conditions under which they are taken wouldbecome available. Between- and within-subject manipula-tions are also possible. For instance, the effects on neuralprocesses of the stereotype manipulation of informingolder adults that an ST of a cognitive ability was a mea-sure of memory versus a measure of wisdom could beexamined to see which neural processes the manipulationaffected and which varied parametrically with perfor-mance on the ST. The existing knowledge from both thebehavioral and neural levels make STs an ideal topic tointegrate across these levels of analysis [Schwartz et al.,2016].
Because of the relevance of PTSD to many areas and ourprevious contributions to it [Rubin et al., 2008, 2014; St.Jacques et al., 2011, 2013], we chose four extensively stud-ied classes of STs that measure or are correlated withPTSD, including the Posttraumatic Stress Disorder CheckList (PCL-5) [Weathers et al., 2013], the Centrality ofEvents Scale (CES) [Berntsen and Rubin, 2006, 2007], Neu-roticism [Costa and McCrae, 2008; John et al., 1991], andAttachment [Mikulincer and Shaver, 2007]. The PCL-5 isone of the most commonly used screening tests for PTSD.Each of its 20 items closely follows the 20 symptoms of thediagnosis [American Psychiatric Association, 2013]. Whena licensed clinician determines that a minimum number ofthese 20 symptoms related to a negative event is presentin each of four categories, that they have serious effects onnormal functioning, and that the event is a trauma, aPTSD diagnosis is given. The categories include intrusionsymptoms related to recurrent intrusive memories ordreams and negative reactions to them, avoidance symp-toms involving effort to prevent such memories, negativealterations in cognition or mood, and increased arousal.The CES measures the extent to which individuals con-strue a stressful or traumatic event as a central componentof their narrative identity and sense of self. Items measurethe extent to which a traumatic event colors how otherevents are viewed, signals a major turning point in the lifestory, and has become a core component of identity. TheCES has strong empirical support in correlating withPTSD and symptoms of posttraumatic stress across avariety of participant samples and trauma types, evenafter controlling for other known risk factors of PTSDsymptoms, such as anxiety, depression, and dissociation[Berntsen and Rubin, 2007; Rubin et al., 2014].
Unlike the PCL and CES, Neuroticism and Attachmentare not about reactions to single events. Of the small set oftraits or dimensions commonly used to describe personalitywith STs [Costa and McCrae, 2008; John et al., 1991], Neu-roticism is the trait most often associated with psychologicaldisorders in general and shows consistent correlations with
PTSD [Rubin et al., 2014]. For instance, a review of 11 stud-ies totaling 1,415 individuals found Neuroticism had anaverage correlation of 0.43 with PTSD symptom severity[Rubin et al., 2008]. Attachment refers to systematic patternsof expectations, beliefs, and emotions about the availabilityand responsiveness of close others during times of distress.Attachment originated from theories of development ratherthan personality [Bowlby, 1969; Mikulincer and Shaver,2007]. Insecure attachment can include discomfort withclose interpersonal relationships, persistent fear of interper-sonal rejection or abandonment, and excessive concernsabout and desire for proximity to close others. It canincrease vulnerability to PTSD symptoms (Charuvastra andCloitre [2008] and Ogle et al. [2015] for a review).
To control for the general processes involved in test tak-ing, including reading, comprehension, decision-making,and responding, we included a test of General Knowledge.Participants agree or disagree with items such as “Sydneyis the capital of Australia.” We chose this task because itcontains general information that does not depend on thecontext in which it was learned and is not about the par-ticipant. In addition, the items have little relevance to thepsychopathology, personality, or the participant’s generalway of behaving. In terms of cognitive theory, it providesa semantic memory task to contrast with the STs, whichare more episodic.
We could not find systematic attempts to measure STsduring neuroimaging and therefore could not justify a pri-ori anatomically specific hypotheses. There are studiesanalyzing how neural activity exhibited by individuals,who vary on their scores on STs, varies across differenttasks. For STs such as the ones used here, these includetasks related to resting state [Brown et al., 2014], autobio-graphical memory, and PTSD. These studies will be usefulin forming hypotheses in future work once we can estab-lish some basic results here. However, these tasks bear nodirect relation to the neural processes involved in takingthe STs, and so using them to form hypotheses about theneural basis of test taking is hard to justify. We thereforeadopt the strategy of reporting our results with minimalspeculation, interpreting neural activity using meta-analyses of neural activity related to particular areas ortasks rather than individual studies. That is, we use statis-tically rigorous descriptions followed by theoretically andempirically informed interpretations, while trying to avoidreverse inferences.
We begin with a pattern classification analysis testingwhether differences in neural activity can be used to pre-dict which test a participant is taking based on the activityof other participants. This analysis requires no a prioriknowledge of the areas involved. Thus, we quantify theextent to which the STs engage different neural processesbefore proceeding with the more detailed analyses of acti-vation within individual areas. Together, these analysesaim to characterize unique and shared processes engagedwhen taking STs.
r Rubin et al. r
r 2 r
METHODS
Participants
At the final session for an fMRI study of involuntarymemory in PTSD, we recruited all participants who pro-vided data to obtain participants who were familiar andcomfortable with the fMRI environment. The study fromwhich we recruited is similar to one we recently published[Hall et al., 2014]. In it participants learned pairings ofenvironmental sound and pictures; in the scan they heardthe sound and decided if it came from left or right of mid-line, and after the scan they reported whether picturecame to mind during the scan. The new study followedthe same involuntary memory procedure except that itincluded participants with PTSD and negative and neutralpictures. The pictures were not selected to be relevant tothe participants’ traumas or to their intrusive memories.
Twenty-seven participants agreed to take part in this addi-tional study. They gave written informed consent for a pro-tocol approved by the Duke University Medical CenterInstitutional Review Board. All participants were trauma-exposed, right-handed, fluent English speakers, with normalor corrected-to-normal vision. We limited participants tothose who were trauma exposed because we were askingabout reactions to traumas; however, this should not makeour sample very different from the general adult USA popu-lation, which is 85% trauma exposed [Kilpatrick et al., 2013;Roberts et al., 2011]. Participants were excluded if they hadany contraindications to MRI (e.g., metallic implants), a headinjury with loss of consciousness, any psychiatric diagnosesother than PTSD, or were currently taking psychotropicmedication. The participants were all screened for PTSD bya staff member trained at the Veteran’s Administration Hos-pital to administer the Clinician Administered PTSD Scale(CAPS) [Blake et al., 1995], a standard test for determiningPTSD, for clinical and research purposes. The index traumasfor the CAPS for the participants with and without a result-ing PTSD diagnosis were: injury, illness, or accident (4, 4),sexual assault (3, 4), injury or death to a family member orfriend (2, 4), physical assault (4, 0), witnessed others death(0, 1), and abortion (0, 1).
Four participants were excluded due to excessive motion.Our criterion was any scan with >5 mm of motion or partici-pant with more than 5% of their total scans with between 3and 5 mm, though the four excluded participants actually hadmore than 10% of their total scans >5 mm of motion or morethan 30% of their total scans >3 mm of motion. The remainingparticipants had a mean age of 21.74 (SD 5 3.32, range 18–31).Twelve were male, 13 were White, 5 were Black, and 5 wereAsian. Their scores on the CAPS were (M 5 31.74, SD 5 21.74,range 0–79); 11 met the criteria for current PTSD.
Materials
To adapt the STs to our study, we formed modified Stan-dardized Tests (mSTs) in the following manner. We kept
items and response scales on all five questionnaires as closeas possible to the original sources, though more libertieswere taken with the General Knowledge questions, whichhad not been used as a standardized individual differencestest. All response scales were reduced to a four-point ratingscale to match the four response keys on the button boxused in the scanner. Most scales were initially five-pointscales and for these we removed the middle category. Thisleft the PCL with the four response options: not at all, a lit-tle bit, quite a bit, and extremely. For the CES, we addedlabels of disagree and agree to the existing extreme valuesof totally disagree and totally agree.
We included 20 items for each mST in each of threeruns in the scanner. Because there were only 60 items foreach mST, we did not attempt to divide the mSTs intosubscales. The PCL and CES each have 20 items, so ineach run participants responded to a different stressful ortraumatic event. Participants had nominated three nega-tive events during earlier testing, described in the begin-ning of the Participant section. The order of presentationof these events was randomized for each participant.
For Attachment and Neuroticism, we selected 60 itemsfrom multiple STs because no one standardized test hadenough items. For these, the items from each standardizedtest were given in the order they appeared in the standard-ized test, but items from the various tests were interspersedso that each run had an approximately equal number ofitems from each test. The 60 Neuroticism items included all48 Neuroticism items from the NEO Personality Inventory-Revised (NEO-PI-R) [Costa and McCrae, 2008], all 8 Neuroti-cism items from the Big-5 Inventory [John et al., 1991], andthe 4 items that had the least direct overlap with the othertwo tests from the Generalized Anxiety Disorder 7-item(GAD-7) scale [Spitzer et al., 2006]. Items from the latter twotests were changed to begin with statements such as “I amoften” or “I often feel” to match the NEO items in form. Par-ticipants responded on a scale of disagree strongly, disagreea little, agree a little, and agree strongly, modified from theNEO. The 60 Attachment items included all 36 items of theExperiences in Close Relationships Inventory (ECR) [Bren-nan et al., 1998] and the 24 of the 30 items of the Relation-ship Styles Questionnaire (RSQ) [Griffin and Bartholomew,1994] that had the least direct overlap. Participantsresponded on a scale of strongly disagree, slightly disagree,slightly agree, and strongly agree, which were scale items 1,3, 5, and 7 on the 7-point scale used by the ECR.
We devised the 60 General Knowledge items from exist-ing norms from a college student population [Tauberet al., 2013]. The response scale was wrong, probablywrong, probably right, and right, with approximately halfof the items changed to be incorrect using common errorspublished in the norms. As a way of increasing attentionto the task, we used a pseudorandom order for the items;several obviously incorrect items occurred early in the firstrun to alert the participants that not all items would becorrect.
r Taking Tests in the Magnet r
r 3 r
In each of the three runs, we used the same order ofGeneral Knowledge, Attachment, Neuroticism, CES, andPCL to stress to the participants that the same five typesof questions were being asked repeatedly. We started withthe control task which asked about the widest range ofinformation, then went to the two mSTs that asked aboutthe participants’ general tendencies in a wide range of sit-uations, before the two mSTs that asked about specificstressful events. We chose this order to minimize the chan-ces of the specific events affecting responses to questionsabout more general behavioral tendencies.
Procedure
Before entering the scanner, we asked participants tothink of the three most negative events they had experi-enced. They gave these events a short name and wrote aparagraph to describe the event. The names were usedlater to cue the memory about which the participantsanswered the PCL and the CES. We informed the partici-pants that they would be asked to respond to five types ofquestions and that these would repeat three times. Wethen gave instructions on the button box scales, providedinstructions for and examples of each question type, andexplained that for two scales, the event given would beselected from one of the negative experiences that theylisted previously. Participants were also informed thateach item would appear by itself for 5 s, then with a scalefor 1.5 s, and that they should try to respond while thescale was on the screen, but that they could also respondafter the scale disappeared.
In the scanner, the timing and instructions for each typeof question appeared at the beginning of each block of 20questions and a screen indicated the breaks between theruns. We blocked the items by questionnaire type to keepthe procedure as close as possible to the actual taking ofthe STs outside the scanner and to allow any effects lastingfor seconds after an item to carry over to items of thesame questionnaire type most of the time. For the PCLand CES, each run had the full mST; for Neuroticism andAttachment, the 20 items in each run were a reasonableapproximation of the number of items in the various testsused to measure these concepts.
We determined the timing of the presentations of theitems using pilot testing to ensure participants had enoughtime to answer each question. We did not allow responsesin the first 5 s to encourage participants to think abouteach question rather than simply guess and wait for thenext trial. The jittered 3 s break after each questionallowed a relaxed but not boring pace.
fMRI Acquisition and Analysis
Imaging, preprocessing, and basic analysis
Imaging was conducted on a 3 T GE MR750 MRI scan-ner (GE Healthcare, Waukesha, WI) with an eight-channel
head coil. Head motion was minimized with foam pads,and participants wore earplugs to reduce scanner noise.The imaging sequence included a 3D plane localizer, fol-lowed by a T1-weighted structural acquisition and 3 runsof T2*-weighted (functional) acquisition. There was also aresting state scan at the beginning and the end of the runlasting 360 s. The resting-state runs were analyzed sepa-rately and will not be discussed further. Slice orientationwas near-axial, parallel to the anterior–posterior commis-sure (AC–PC) plane. The T1-weighted anatomical imageswere 96 contiguous slices acquired with a high-3D fastinverse-recovery-prepared spoiled gradient recalled(SPGR) sequence, with repetition time (TR) 5 3.22 ms, echotime (TE) 5 8.2 ms, inversion recovery time (TI) 5 450 ms,field of view (FOV) 5 240 3 240 mm2, 1.9 mm slice thick-ness, flip angle 5 128, voxel size 5 0.9375 3 0.9375 3
1.9 mm, 256 3 256 matrix, and a parallel imaging with aselection factor of 2. The T2*-weighted echo-planar, func-tional images were sensitive to the blood oxygen leveldependent (BOLD) signal. These were 34 contiguous slicesacquired using a spiral-in sequence using sense imagingwith a SENSE factor of 2, with TR 5 2000 ms, TE 5 30 ms,FOV 5 240 3 240 mm2, 3.8 mm slice thickness, flipangle 5 708, and voxel size 5 3.75 3 3.75 3 3.8 mm.
Preprocessing and analyses of functional imaging datawere conducted with Statistical Parametric Mapping soft-ware (SPM12; Wellcome Department of Cognitive Neurol-ogy, London, UK), along with locally developed MATLAB(Mathworks, Natick, MA) scripts. The first 3 volumes ofeach run were discarded to focus analyses on volumesacquired during steady-state equilibrium. Images werecorrected for time difference of different slices in a vol-ume, spatially realigned to the first volume to correct formotion, spatially normalized to the Montreal NeurologicalInstitute (MNI) template using a 12-parameter affinemodel, and then spatially smoothed with an 8 mm full-width at half-maximum Gaussian kernel. A high-pass filterwas included in every model to correct for scanner drift.Participants with between 3 and 5 mm of movement in 5%or fewer of their total scans were corrected with ArtRepair(http://cibsr.stanford.edu/tools/ArtRepair/ArtRepair.htm).
A general linear model approach was used to analyzethe preprocessed data. In the first-level analysis, eachquestionnaire was modeled using a 6 s boxcar functionconvolved with a canonical hemodynamic response func-tion. The boxcar function begins at the onset of each trial.No global normalization was used. Serial correlationsbetween volumes due to noise and unmodelled neuralactivity were corrected using an autoregressive AR (1)model implemented in SPM12.
Separability of neural activity of the five tests
The separability of neural activity among the five ques-tionnaires was established using Partial Least Squares Dis-criminant analysis (PLS-DA), using the libPLS package toclassify whole-brain contrasts of each test versus baseline.
r Rubin et al. r
r 4 r
Classification models were assessed by performing leave-one-subject-out cross-validation (training on data from allbut one subject and testing on the five contrast images forthe left-out subject, repeating the procedure until all sub-jects are used for testing). This approach provides general-ized estimates of performance and prevents overfitting.Because the classification problem involved five classes, aone-vs-all approach was adopted, wherein a classificationmodel was developed for each of the five questionnairesand labels were assigned by identifying the model withthe highest score. The number of latent variables in thePLS models was determined by minimizing the fivefoldcross-validation error within the training folds (i.e., datafor all but one subject). A model was then fit using allavailable training data and evaluated on the five question-naires from the test subject. Inference on classifier perfor-mance was assessed across all contrasts using the observednumber of correctly predicted contrasts and the binomialdistribution B(115, .2), whereas inference on accuracy forindividual questionnaires was performed using a B(23, .2)distribution. This use of binomial tests on the averageleave-one-out classification accuracy is relatively unbiasedbecause classifiers are stable across folds [Kohavi, 1995].
To evaluate the relationship between the semantic infor-mation contained in the questionnaires and the perfor-mance of the brain-based classifier, we compared thedistribution of classification errors (across all unique com-bination of misclassification errors) to the semantic similar-ity of tests. Semantic textual similarity was computedbetween all pairs of test items using context-sensitivemethods [Han et al., 2013]. Next, the average similarity ofitems from the 10 unique test pairs was computed andcorrelated (Spearman’s rho) with the distribution of classi-fication errors across subjects. Confidence intervals wereestimated using bias accelerated bootstrapping. In this test,positive correlation coefficients indicate that tests withhigher semantic similarity are more easily confused by thepattern classifier.
To map where increased brain activity led to classifica-tions of each test type, bootstrap analysis was performed.In this procedure, the pool of contrasts was repeatedlyresampled with replacement 5,000 times, with a new set ofPLS models estimated on each iteration (with the numberof latent variables fixed at 5). This procedure yielded a dis-tribution of PLS regression coefficients at each voxel,which was converted to a z-score using normal approxi-mation. Pearson correlation coefficients were computed toestimate the similarity between these classifier weightmaps and univariate contrasts of each test versus baseline.
Comparisons of Attachment, Neuroticism, the PCL,and the CES to General Knowledge
Comparisons between each of the four questionnaires(Attachment, Neuroticism, PCL, and CES) versus GeneralKnowledge were assessed separately in a second-levelrandom-effect repeated-measure ANOVA. As visual and
motor processes should be matched across conditions, thiscontrast should reveal differences in neural activity relatedto cognitive processes involved in taking these STs. Theanalysis was confined to voxels showing positive activa-tion (P< 0.05, uncorrected) in the corresponding question-naire compared to baseline to ensure that any differencesreported were not driven only because of subtracting neg-ative activation in the General Knowledge questionnaire.We calculated statistical thresholds by estimating the falsepositive rate using Monte Carlo simulation [Forman et al.,1995]. A simulation of 1000 iterations for each regressionmodel produced a common threshold of cluster size 5 41with uncorrected threshold of P< 0.001 at each voxel tofulfill a corrected false positive rate of a< 0.05, usingAlphaSim implemented in the REST toolbox [Song et al.,2011, Updated September 2015]. Smoothness was esti-mated using the residuals from the ANOVA model.
To facilitate reverse inference of neuroimaging results,automated decoding was performed using the decodingtool on the Neurosynth website (http://neurosynth.org)[Yarkoni et al., 2011]. In this analysis, we computed thecorrelation between thresholded statistical maps for eachof the four mSTs compared against General Knowledgeand a series of automated meta-analytic maps for termsthat frequently appear in the neuroimaging literature.
We used MNI coordinates throughout. Coordinatesextracted from the literature in the Talairach space weretransformed into the MNI space [Lancaster et al., 2007].
RESULTS AND DISCUSSION
Behavioral Results
The means and standard deviations for the individualsubjects rating scales, which had response options of 1 to4, were: General Knowledge 2.8, 0.3; Attachment 2.3, 0.5;Neuroticism 2.4, 0.4; the CES 2.5, 0.6; and PCL 1.6, 0.5. Thereaction time differences in responding to the scales werenot significant, F(4, 110) 5 1.55, P 5 0.19. The correlationsamong the means are shown in Table I.
TABLE I. Correlations among the five modified
standardized tests
GeneralKnowledge Attachment Neuroticism CES
Attachment 0.26Neuroticism 0.25 0.76c
CES 0.04 0.41a 0.51b
PCL 20.01 0.48b 0.54b 0.67c
aP 5 0.05.bP< 0.05.cP< 0.001.
r Taking Tests in the Magnet r
r 5 r
Separability of Neural Activity Among the
Questionnaires
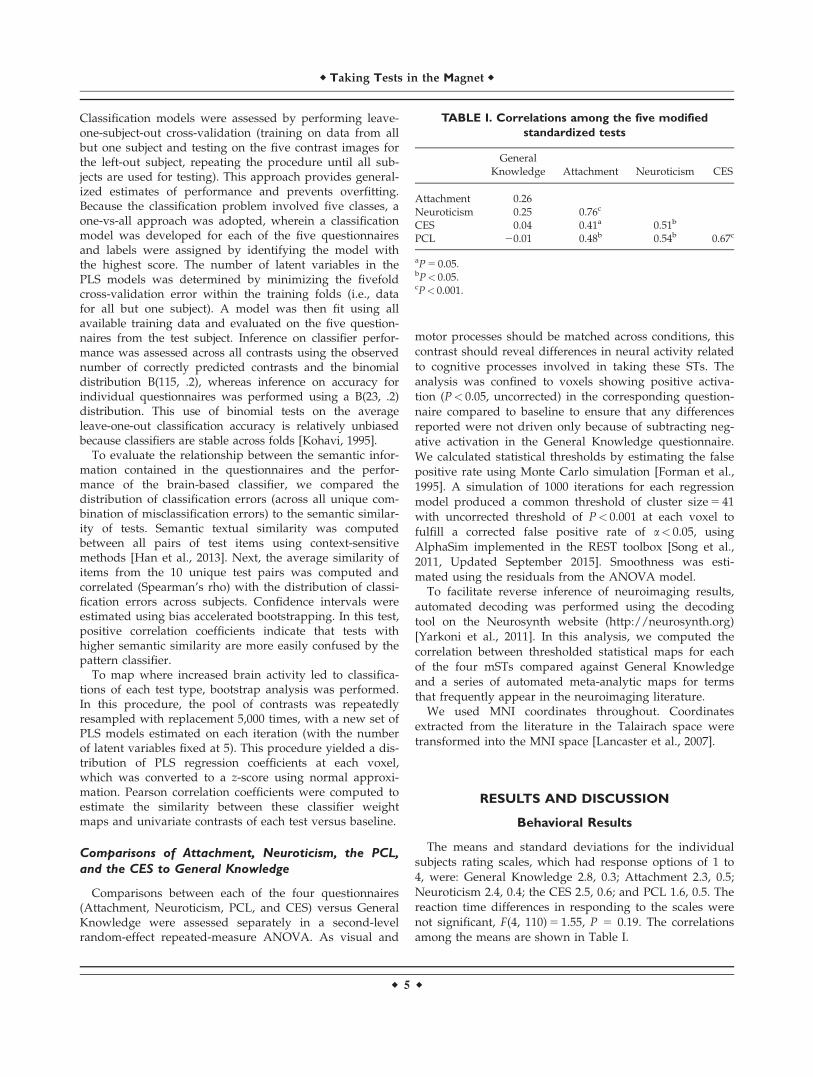
As shown in Figure 1a, the classifier performed welloverall. Based on the neural activity of 22 of our 23 partici-pants, we could classify correctly which of the five ques-tionnaires the remaining participant was answering withan accuracy of 65%, where 20% is chance (P< 0.0001, bino-mial test). General Knowledge was the easiest to classify(100%, 95% CI [85.18% 100%], P< 0.0001), followed byAttachment (69.57%, [47.08% 86.79%], P< 0.0001), the PCL(60.87%, [38.54% 80.29%], P< 0.0001), Neuroticism (52.17%,[30.59% 73.18%], P 5 0.0001), and the CES (43.48%, [23.19%65.51%], P 5 0.0025). There were no misclassification errorsfor General Knowledge and those for each of the fourmSTs were fairly uniform among the other mSTs with atendency for the PCL and Neuroticism and for the CESand Attachment to be more often misclassified with eachother.
The correlation between the distribution of classifica-tion errors and the semantic similarity of test items indi-cated a high degree of similarity: rho 5 0.7195, 95% CI[0.29 0.96] (Fig. 1b). These results confirm that the predic-tive information contained in patterns of neural activitywas largely associated with the semantics of the tests, asopposed to unrelated factors that could be opportunisti-cally leveraged in pattern classification. Given the separa-bility of the brain activation and the correlation betweenthe classification errors that did exist and the semanticsimilarity of the items, we turn to investigating how thefour mSTs differ from the General Knowledge compari-son task.
Activity of the Four mSTs Compared to General
Knowledge
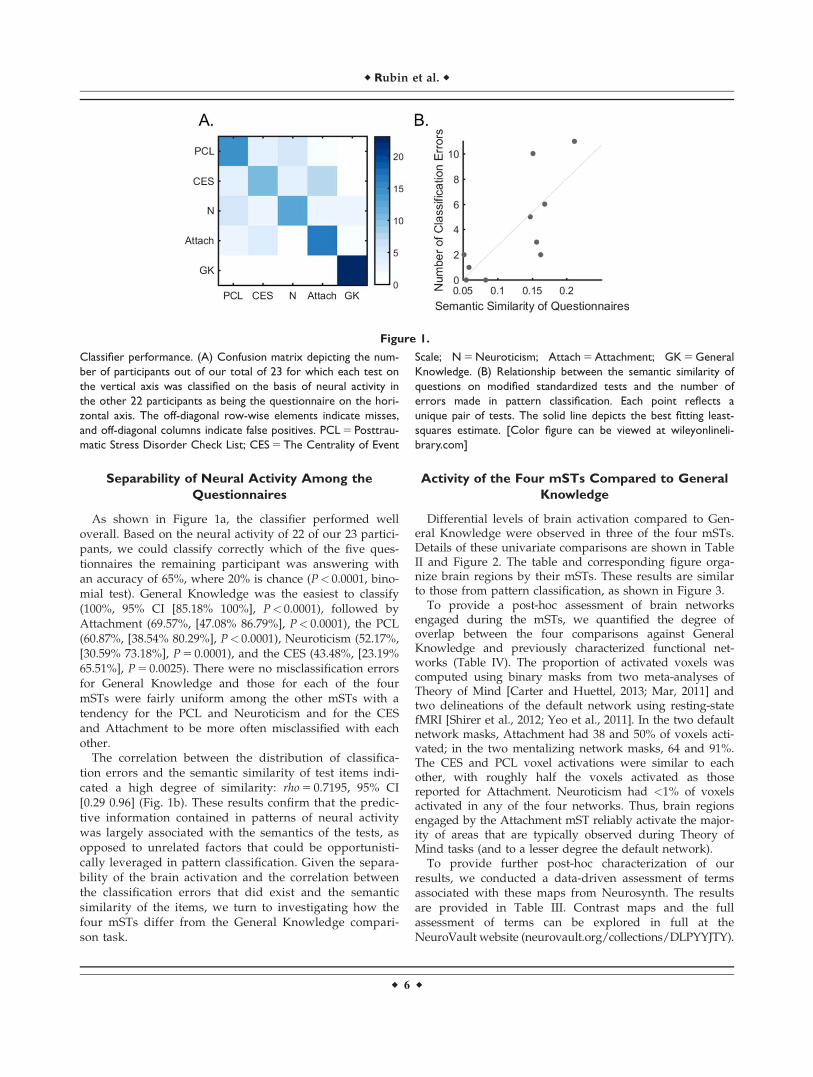
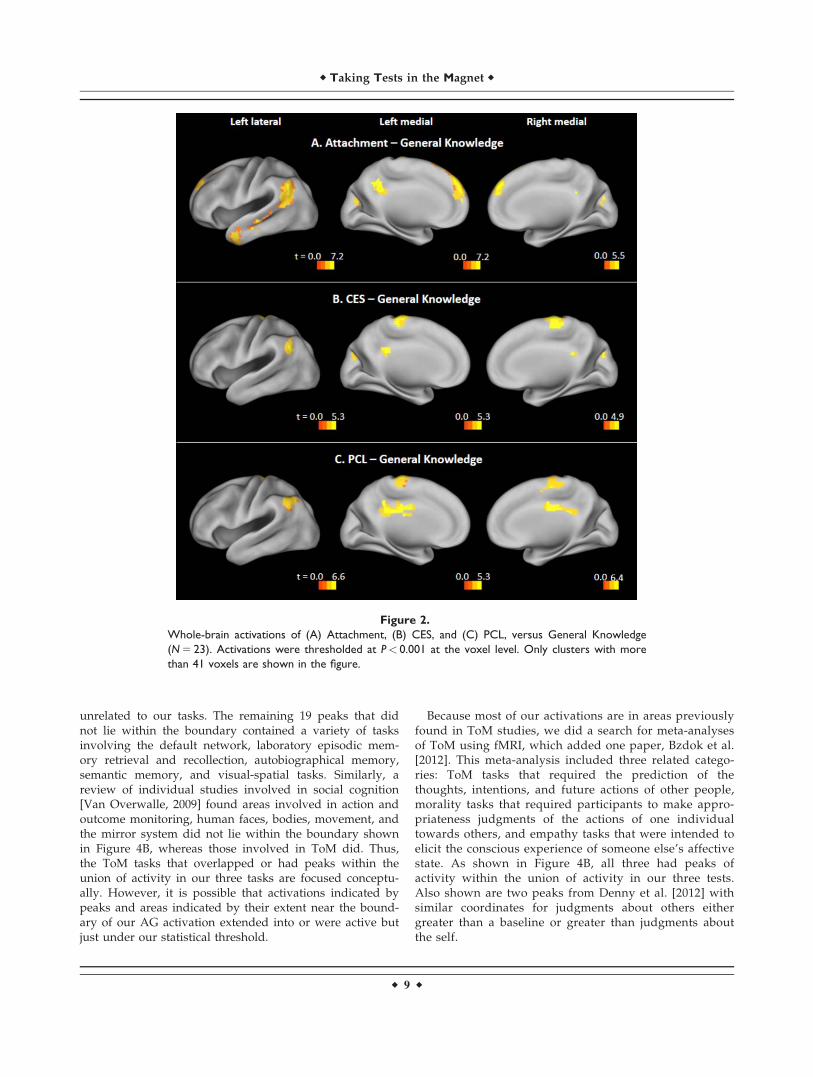
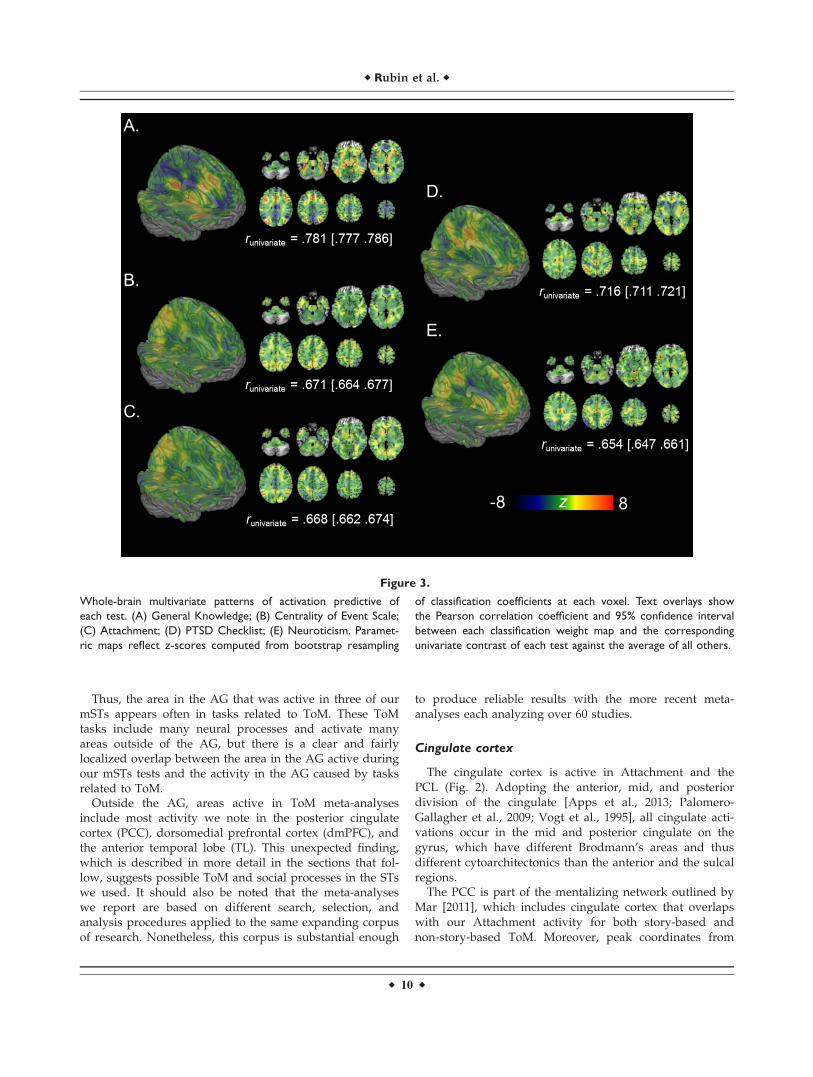
Differential levels of brain activation compared to Gen-eral Knowledge were observed in three of the four mSTs.Details of these univariate comparisons are shown in TableII and Figure 2. The table and corresponding figure orga-nize brain regions by their mSTs. These results are similarto those from pattern classification, as shown in Figure 3.
To provide a post-hoc assessment of brain networksengaged during the mSTs, we quantified the degree ofoverlap between the four comparisons against GeneralKnowledge and previously characterized functional net-works (Table IV). The proportion of activated voxels wascomputed using binary masks from two meta-analyses ofTheory of Mind [Carter and Huettel, 2013; Mar, 2011] andtwo delineations of the default network using resting-statefMRI [Shirer et al., 2012; Yeo et al., 2011]. In the two defaultnetwork masks, Attachment had 38 and 50% of voxels acti-vated; in the two mentalizing network masks, 64 and 91%.The CES and PCL voxel activations were similar to eachother, with roughly half the voxels activated as thosereported for Attachment. Neuroticism had <1% of voxelsactivated in any of the four networks. Thus, brain regionsengaged by the Attachment mST reliably activate the major-ity of areas that are typically observed during Theory ofMind tasks (and to a lesser degree the default network).
To provide further post-hoc characterization of ourresults, we conducted a data-driven assessment of termsassociated with these maps from Neurosynth. The resultsare provided in Table III. Contrast maps and the fullassessment of terms can be explored in full at theNeuroVault website (neurovault.org/collections/DLPYYJTY).
Figure 1.
Classifier performance. (A) Confusion matrix depicting the num-
ber of participants out of our total of 23 for which each test on
the vertical axis was classified on the basis of neural activity in
the other 22 participants as being the questionnaire on the hori-
zontal axis. The off-diagonal row-wise elements indicate misses,
and off-diagonal columns indicate false positives. PCL 5 Posttrau-
matic Stress Disorder Check List; CES 5 The Centrality of Event
Scale; N 5 Neuroticism; Attach 5 Attachment; GK 5 General
Knowledge. (B) Relationship between the semantic similarity of
questions on modified standardized tests and the number of
errors made in pattern classification. Each point reflects a
unique pair of tests. The solid line depicts the best fitting least-
squares estimate. [Color figure can be viewed at wileyonlineli-
brary.com]
r Rubin et al. r
r 6 r
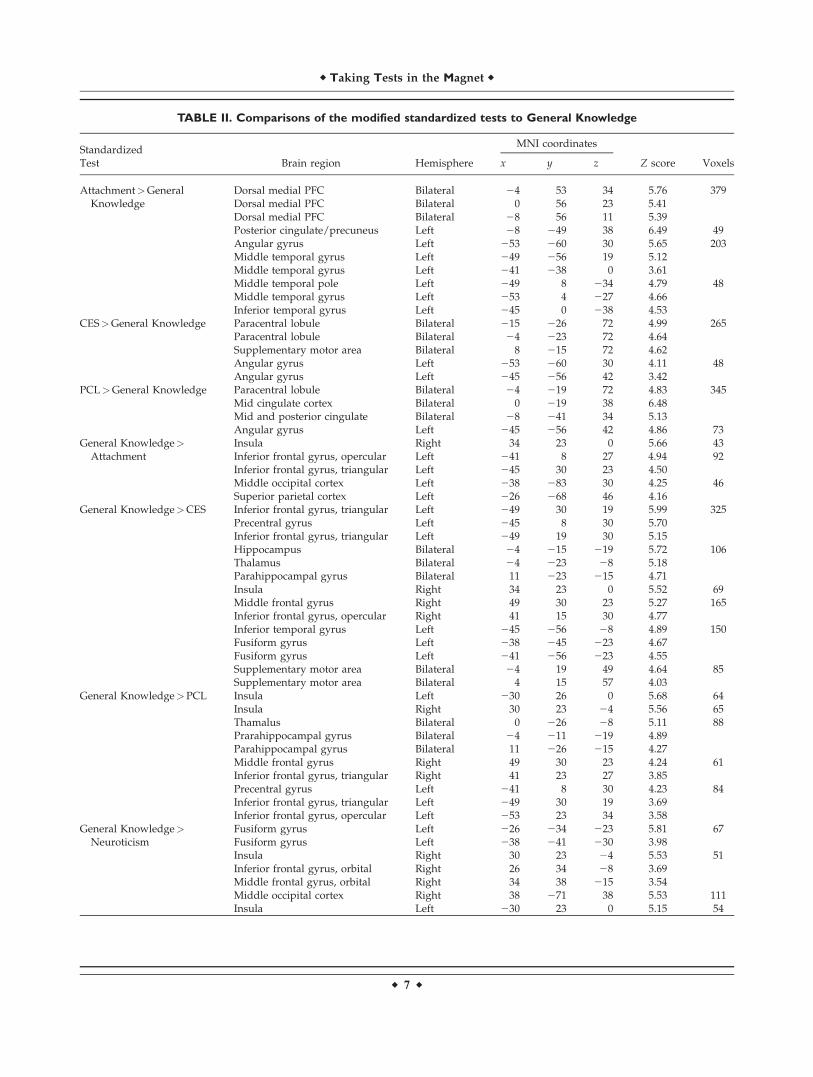
TABLE II. Comparisons of the modified standardized tests to General Knowledge
StandardizedMNI coordinates
Test Brain region Hemisphere x y z Z score Voxels
Attachment>GeneralKnowledge
Dorsal medial PFCDorsal medial PFC
BilateralBilateral
240
5356
3423
5.765.41
379
Dorsal medial PFC Bilateral 28 56 11 5.39Posterior cingulate/precuneus Left 28 249 38 6.49 49Angular gyrus Left 253 260 30 5.65 203Middle temporal gyrus Left 249 256 19 5.12Middle temporal gyrus Left 241 238 0 3.61Middle temporal pole Left 249 8 234 4.79 48Middle temporal gyrus Left 253 4 227 4.66Inferior temporal gyrus Left 245 0 238 4.53
CES>General Knowledge Paracentral lobule Bilateral 215 226 72 4.99 265Paracentral lobule Bilateral 24 223 72 4.64Supplementary motor area Bilateral 8 215 72 4.62Angular gyrus Left 253 260 30 4.11 48Angular gyrus Left 245 256 42 3.42
PCL>General Knowledge Paracentral lobule Bilateral 24 219 72 4.83 345Mid cingulate cortex Bilateral 0 219 38 6.48Mid and posterior cingulate Bilateral 28 241 34 5.13Angular gyrus Left 245 256 42 4.86 73
General Knowledge>Attachment
InsulaInferior frontal gyrus, opercular
RightLeft
34241
238
027
5.664.94
4392
Inferior frontal gyrus, triangular Left 245 30 23 4.50Middle occipital cortex Left 238 283 30 4.25 46Superior parietal cortex Left 226 268 46 4.16
General Knowledge>CES Inferior frontal gyrus, triangular Left 249 30 19 5.99 325Precentral gyrus Left 245 8 30 5.70Inferior frontal gyrus, triangular Left 249 19 30 5.15Hippocampus Bilateral 24 215 219 5.72 106Thalamus Bilateral 24 223 28 5.18Parahippocampal gyrus Bilateral 11 223 215 4.71Insula Right 34 23 0 5.52 69Middle frontal gyrus Right 49 30 23 5.27 165Inferior frontal gyrus, opercular Right 41 15 30 4.77Inferior temporal gyrus Left 245 256 28 4.89 150Fusiform gyrus Left 238 245 223 4.67Fusiform gyrus Left 241 256 223 4.55Supplementary motor area Bilateral 24 19 49 4.64 85Supplementary motor area Bilateral 4 15 57 4.03
General Knowledge>PCL Insula Left 230 26 0 5.68 64Insula Right 30 23 24 5.56 65Thamalus Bilateral 0 226 28 5.11 88Prarahippocampal gyrus Bilateral 24 211 219 4.89Parahippocampal gyrus Bilateral 11 226 215 4.27Middle frontal gyrus Right 49 30 23 4.24 61Inferior frontal gyrus, triangular Right 41 23 27 3.85Precentral gyrus Left 241 8 30 4.23 84Inferior frontal gyrus, triangular Left 249 30 19 3.69Inferior frontal gyrus, opercular Left 253 23 34 3.58
General Knowledge>Neuroticism
Fusiform gyrus Left 226 234 223 5.81 67Fusiform gyrus Left 238 241 230 3.98Insula Right 30 23 24 5.53 51Inferior frontal gyrus, orbital Right 26 34 28 3.69Middle frontal gyrus, orbital Right 34 38 215 3.54Middle occipital cortex Right 38 271 38 5.53 111Insula Left 230 23 0 5.15 54
r Taking Tests in the Magnet r
r 7 r
Several patterns are consistent with the results of activation inthe mentalizing and default networks, but from a very differ-ent form of analysis. The terms “theory of mind,”“mentalizing,” “mind,” and “mental states” appear only forAttachment. The terms “default mode,” “default,” “mode,”“mode network” appear for Attachment, the CES, and thePCL. Neuroticism does not contain any of these terms butdoes include terms that may be consistent with anxiety in thatthey focus on not acting including “inhibit,” “stop signal,”“cognitive control,” and “inhibitory.” The anatomical termsare generally consistent with the activity noted in Figure 2. Ingeneral, the terms associated with these contrast maps,though not specified a priori, are reasonable and do not pointto artifact-based explanations of our basic findings.
The next section is organized by individual brainregions, noting similarities and differences in each brainregion among the mSTs and interpreting activity in eachbrain region using meta-analyses of neural activity relatedto particular areas or tasks (see Table II for a list of clus-ters). We start with the angular gyrus (AG) because itsinterpretation led us to appreciate the importance of spe-cific Theory-of-Mind (ToM) processes that helped us tointerpret other regions.
Individual Areas Active for the Four mSTs
Compared to General Knowledge
Angular gyrus
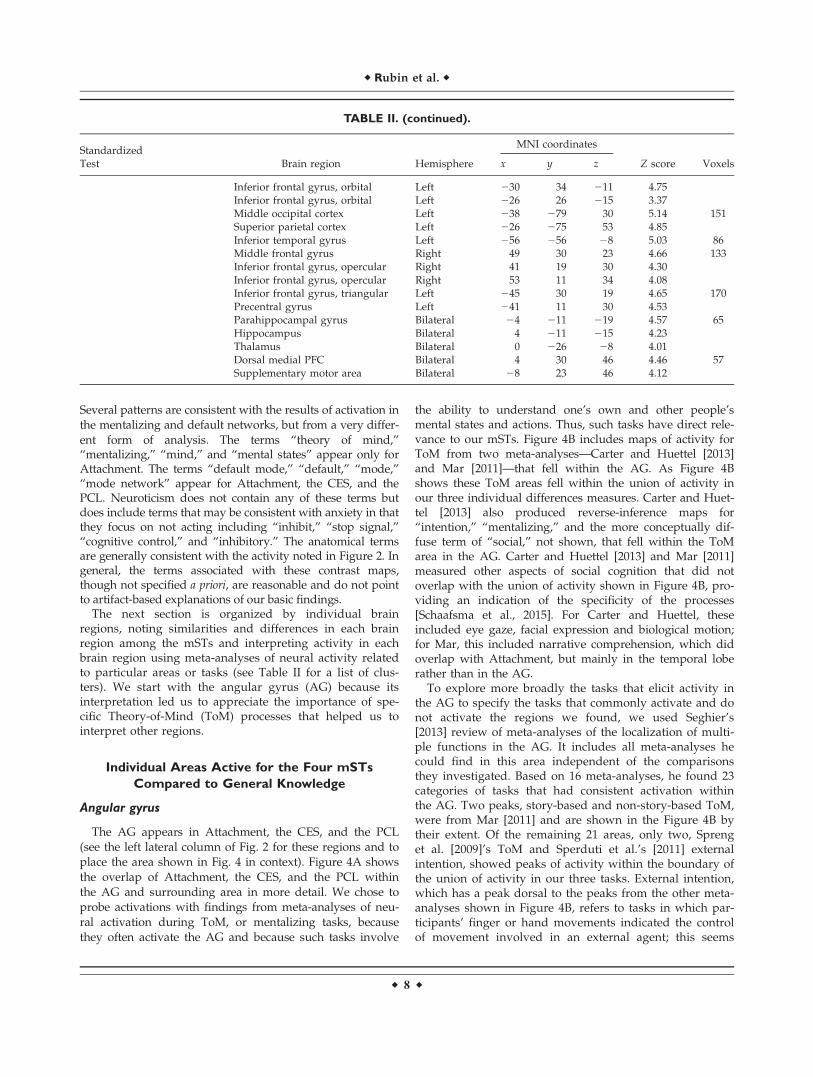
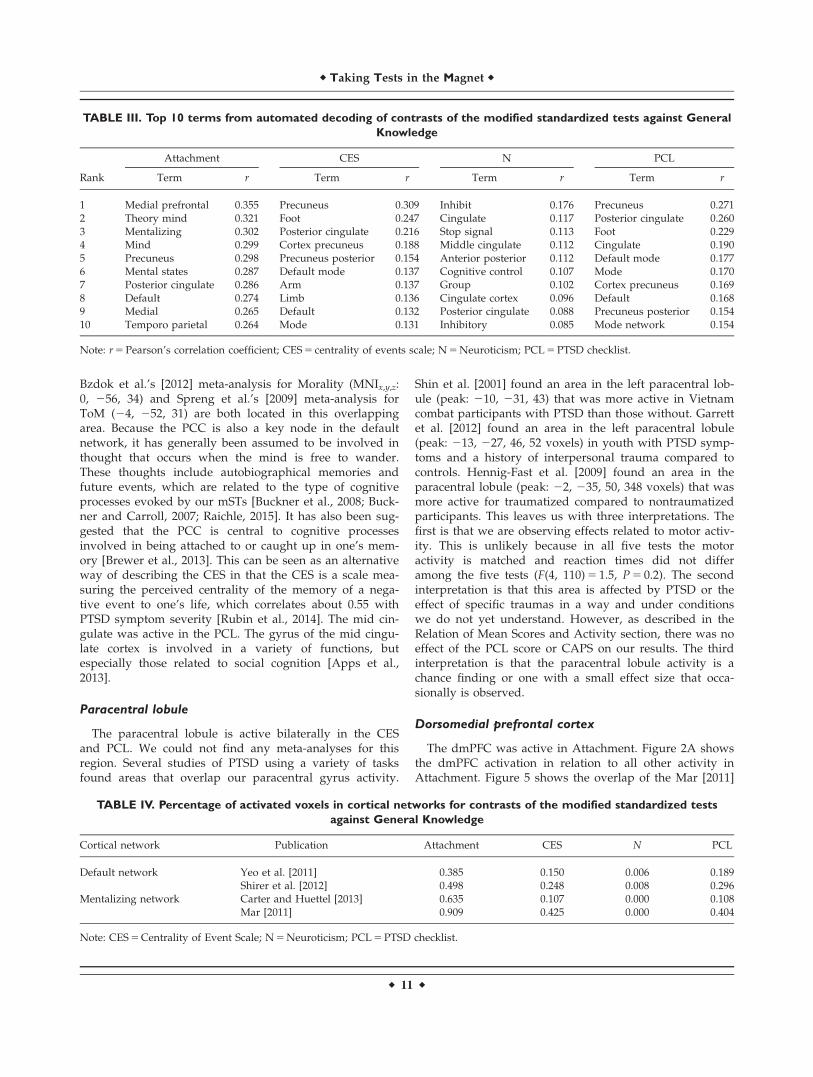
The AG appears in Attachment, the CES, and the PCL(see the left lateral column of Fig. 2 for these regions and toplace the area shown in Fig. 4 in context). Figure 4A showsthe overlap of Attachment, the CES, and the PCL withinthe AG and surrounding area in more detail. We chose toprobe activations with findings from meta-analyses of neu-ral activation during ToM, or mentalizing tasks, becausethey often activate the AG and because such tasks involve
the ability to understand one’s own and other people’smental states and actions. Thus, such tasks have direct rele-vance to our mSTs. Figure 4B includes maps of activity forToM from two meta-analyses—Carter and Huettel [2013]and Mar [2011]—that fell within the AG. As Figure 4Bshows these ToM areas fell within the union of activity inour three individual differences measures. Carter and Huet-tel [2013] also produced reverse-inference maps for“intention,” “mentalizing,” and the more conceptually dif-fuse term of “social,” not shown, that fell within the ToMarea in the AG. Carter and Huettel [2013] and Mar [2011]measured other aspects of social cognition that did notoverlap with the union of activity shown in Figure 4B, pro-viding an indication of the specificity of the processes[Schaafsma et al., 2015]. For Carter and Huettel, theseincluded eye gaze, facial expression and biological motion;for Mar, this included narrative comprehension, which didoverlap with Attachment, but mainly in the temporal loberather than in the AG.
To explore more broadly the tasks that elicit activity inthe AG to specify the tasks that commonly activate and donot activate the regions we found, we used Seghier’s[2013] review of meta-analyses of the localization of multi-ple functions in the AG. It includes all meta-analyses hecould find in this area independent of the comparisonsthey investigated. Based on 16 meta-analyses, he found 23categories of tasks that had consistent activation withinthe AG. Two peaks, story-based and non-story-based ToM,were from Mar [2011] and are shown in the Figure 4B bytheir extent. Of the remaining 21 areas, only two, Sprenget al. [2009]’s ToM and Sperduti et al.’s [2011] externalintention, showed peaks of activity within the boundary ofthe union of activity in our three tasks. External intention,which has a peak dorsal to the peaks from the other meta-analyses shown in Figure 4B, refers to tasks in which par-ticipants’ finger or hand movements indicated the controlof movement involved in an external agent; this seems
TABLE II. (continued).
StandardizedMNI coordinates
Test Brain region Hemisphere x y z Z score Voxels
Inferior frontal gyrus, orbital Left 230 34 211 4.75Inferior frontal gyrus, orbital Left 226 26 215 3.37Middle occipital cortex Left 238 279 30 5.14 151Superior parietal cortex Left 226 275 53 4.85Inferior temporal gyrus Left 256 256 28 5.03 86Middle frontal gyrus Right 49 30 23 4.66 133Inferior frontal gyrus, opercular Right 41 19 30 4.30Inferior frontal gyrus, opercular Right 53 11 34 4.08Inferior frontal gyrus, triangular Left 245 30 19 4.65 170Precentral gyrus Left 241 11 30 4.53Parahippocampal gyrus Bilateral 24 211 219 4.57 65Hippocampus Bilateral 4 211 215 4.23Thalamus Bilateral 0 226 28 4.01Dorsal medial PFC Bilateral 4 30 46 4.46 57Supplementary motor area Bilateral 28 23 46 4.12
r Rubin et al. r
r 8 r
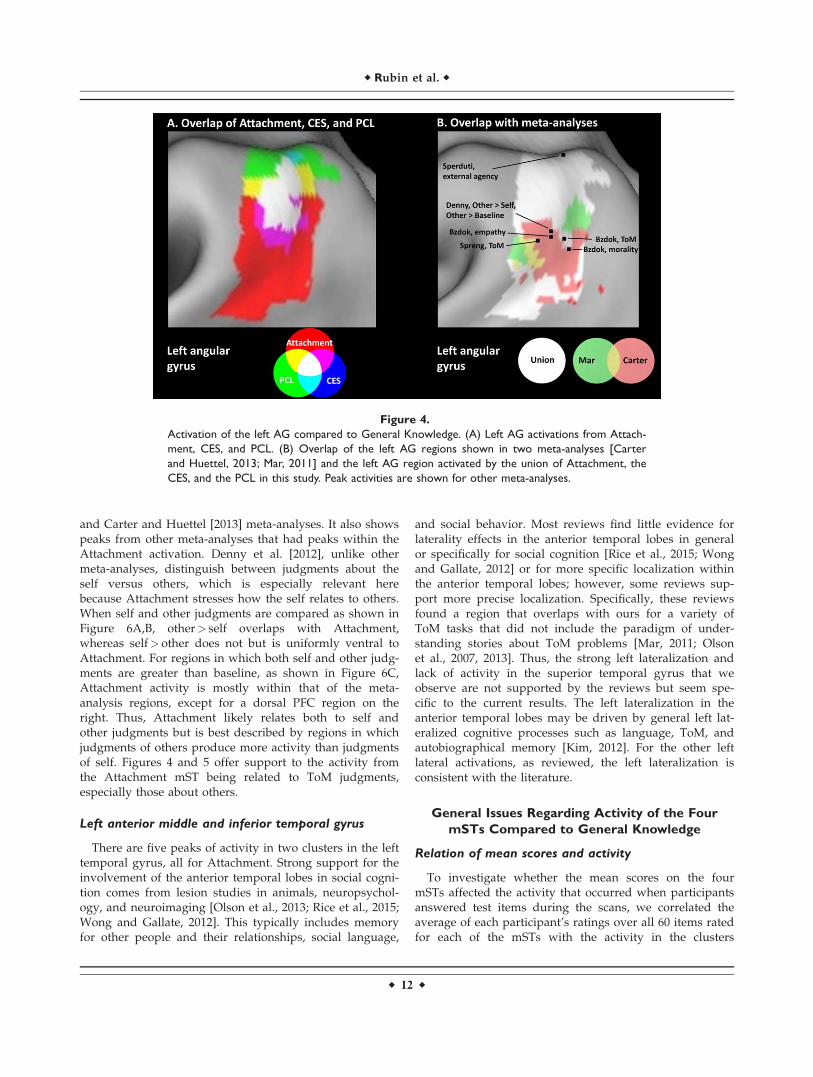
unrelated to our tasks. The remaining 19 peaks that didnot lie within the boundary contained a variety of tasksinvolving the default network, laboratory episodic mem-ory retrieval and recollection, autobiographical memory,semantic memory, and visual-spatial tasks. Similarly, areview of individual studies involved in social cognition[Van Overwalle, 2009] found areas involved in action andoutcome monitoring, human faces, bodies, movement, andthe mirror system did not lie within the boundary shownin Figure 4B, whereas those involved in ToM did. Thus,the ToM tasks that overlapped or had peaks within theunion of activity in our three tasks are focused conceptu-ally. However, it is possible that activations indicated bypeaks and areas indicated by their extent near the bound-ary of our AG activation extended into or were active butjust under our statistical threshold.
Because most of our activations are in areas previouslyfound in ToM studies, we did a search for meta-analysesof ToM using fMRI, which added one paper, Bzdok et al.[2012]. This meta-analysis included three related catego-ries: ToM tasks that required the prediction of thethoughts, intentions, and future actions of other people,morality tasks that required participants to make appro-priateness judgments of the actions of one individualtowards others, and empathy tasks that were intended toelicit the conscious experience of someone else’s affectivestate. As shown in Figure 4B, all three had peaks ofactivity within the union of activity in our three tests.Also shown are two peaks from Denny et al. [2012] withsimilar coordinates for judgments about others eithergreater than a baseline or greater than judgments aboutthe self.
Figure 2.
Whole-brain activations of (A) Attachment, (B) CES, and (C) PCL, versus General Knowledge
(N 5 23). Activations were thresholded at P< 0.001 at the voxel level. Only clusters with more
than 41 voxels are shown in the figure.
r Taking Tests in the Magnet r
r 9 r
Thus, the area in the AG that was active in three of ourmSTs appears often in tasks related to ToM. These ToMtasks include many neural processes and activate manyareas outside of the AG, but there is a clear and fairlylocalized overlap between the area in the AG active duringour mSTs tests and the activity in the AG caused by tasksrelated to ToM.
Outside the AG, areas active in ToM meta-analysesinclude most activity we note in the posterior cingulatecortex (PCC), dorsomedial prefrontal cortex (dmPFC), andthe anterior temporal lobe (TL). This unexpected finding,which is described in more detail in the sections that fol-low, suggests possible ToM and social processes in the STswe used. It should also be noted that the meta-analyseswe report are based on different search, selection, andanalysis procedures applied to the same expanding corpusof research. Nonetheless, this corpus is substantial enough
to produce reliable results with the more recent meta-analyses each analyzing over 60 studies.
Cingulate cortex
The cingulate cortex is active in Attachment and thePCL (Fig. 2). Adopting the anterior, mid, and posteriordivision of the cingulate [Apps et al., 2013; Palomero-Gallagher et al., 2009; Vogt et al., 1995], all cingulate acti-vations occur in the mid and posterior cingulate on thegyrus, which have different Brodmann’s areas and thusdifferent cytoarchitectonics than the anterior and the sulcalregions.
The PCC is part of the mentalizing network outlined byMar [2011], which includes cingulate cortex that overlapswith our Attachment activity for both story-based andnon-story-based ToM. Moreover, peak coordinates from
Figure 3.
Whole-brain multivariate patterns of activation predictive of
each test. (A) General Knowledge; (B) Centrality of Event Scale;
(C) Attachment; (D) PTSD Checklist; (E) Neuroticism. Paramet-
ric maps reflect z-scores computed from bootstrap resampling
of classification coefficients at each voxel. Text overlays show
the Pearson correlation coefficient and 95% confidence interval
between each classification weight map and the corresponding
univariate contrast of each test against the average of all others.
r Rubin et al. r
r 10 r
Bzdok et al.’s [2012] meta-analysis for Morality (MNIx,y,z:0, 256, 34) and Spreng et al.’s [2009] meta-analysis forToM (24, 252, 31) are both located in this overlappingarea. Because the PCC is also a key node in the defaultnetwork, it has generally been assumed to be involved inthought that occurs when the mind is free to wander.These thoughts include autobiographical memories andfuture events, which are related to the type of cognitiveprocesses evoked by our mSTs [Buckner et al., 2008; Buck-ner and Carroll, 2007; Raichle, 2015]. It has also been sug-gested that the PCC is central to cognitive processesinvolved in being attached to or caught up in one’s mem-ory [Brewer et al., 2013]. This can be seen as an alternativeway of describing the CES in that the CES is a scale mea-suring the perceived centrality of the memory of a nega-tive event to one’s life, which correlates about 0.55 withPTSD symptom severity [Rubin et al., 2014]. The mid cin-gulate was active in the PCL. The gyrus of the mid cingu-late cortex is involved in a variety of functions, butespecially those related to social cognition [Apps et al.,2013].
Paracentral lobule
The paracentral lobule is active bilaterally in the CESand PCL. We could not find any meta-analyses for thisregion. Several studies of PTSD using a variety of tasksfound areas that overlap our paracentral gyrus activity.
Shin et al. [2001] found an area in the left paracentral lob-ule (peak: 210, 231, 43) that was more active in Vietnamcombat participants with PTSD than those without. Garrettet al. [2012] found an area in the left paracentral lobule(peak: 213, 227, 46, 52 voxels) in youth with PTSD symp-toms and a history of interpersonal trauma compared tocontrols. Hennig-Fast et al. [2009] found an area in theparacentral lobule (peak: 22, 235, 50, 348 voxels) that wasmore active for traumatized compared to nontraumatizedparticipants. This leaves us with three interpretations. Thefirst is that we are observing effects related to motor activ-ity. This is unlikely because in all five tests the motoractivity is matched and reaction times did not differamong the five tests (F(4, 110) 5 1.5, P 5 0.2). The secondinterpretation is that this area is affected by PTSD or theeffect of specific traumas in a way and under conditionswe do not yet understand. However, as described in theRelation of Mean Scores and Activity section, there was noeffect of the PCL score or CAPS on our results. The thirdinterpretation is that the paracentral lobule activity is achance finding or one with a small effect size that occa-sionally is observed.
Dorsomedial prefrontal cortex
The dmPFC was active in Attachment. Figure 2A showsthe dmPFC activation in relation to all other activity inAttachment. Figure 5 shows the overlap of the Mar [2011]
TABLE IV. Percentage of activated voxels in cortical networks for contrasts of the modified standardized tests
against General Knowledge
Cortical network Publication Attachment CES N PCL
Default network Yeo et al. [2011] 0.385 0.150 0.006 0.189Shirer et al. [2012] 0.498 0.248 0.008 0.296
Mentalizing network Carter and Huettel [2013] 0.635 0.107 0.000 0.108Mar [2011] 0.909 0.425 0.000 0.404
Note: CES 5 Centrality of Event Scale; N 5 Neuroticism; PCL 5 PTSD checklist.
TABLE III. Top 10 terms from automated decoding of contrasts of the modified standardized tests against General
Knowledge
Attachment CES N PCL
Rank Term r Term r Term r Term r
1 Medial prefrontal 0.355 Precuneus 0.309 Inhibit 0.176 Precuneus 0.2712 Theory mind 0.321 Foot 0.247 Cingulate 0.117 Posterior cingulate 0.2603 Mentalizing 0.302 Posterior cingulate 0.216 Stop signal 0.113 Foot 0.2294 Mind 0.299 Cortex precuneus 0.188 Middle cingulate 0.112 Cingulate 0.1905 Precuneus 0.298 Precuneus posterior 0.154 Anterior posterior 0.112 Default mode 0.1776 Mental states 0.287 Default mode 0.137 Cognitive control 0.107 Mode 0.1707 Posterior cingulate 0.286 Arm 0.137 Group 0.102 Cortex precuneus 0.1698 Default 0.274 Limb 0.136 Cingulate cortex 0.096 Default 0.1689 Medial 0.265 Default 0.132 Posterior cingulate 0.088 Precuneus posterior 0.15410 Temporo parietal 0.264 Mode 0.131 Inhibitory 0.085 Mode network 0.154
Note: r 5 Pearson’s correlation coefficient; CES 5 centrality of events scale; N 5 Neuroticism; PCL 5 PTSD checklist.
r Taking Tests in the Magnet r
r 11 r
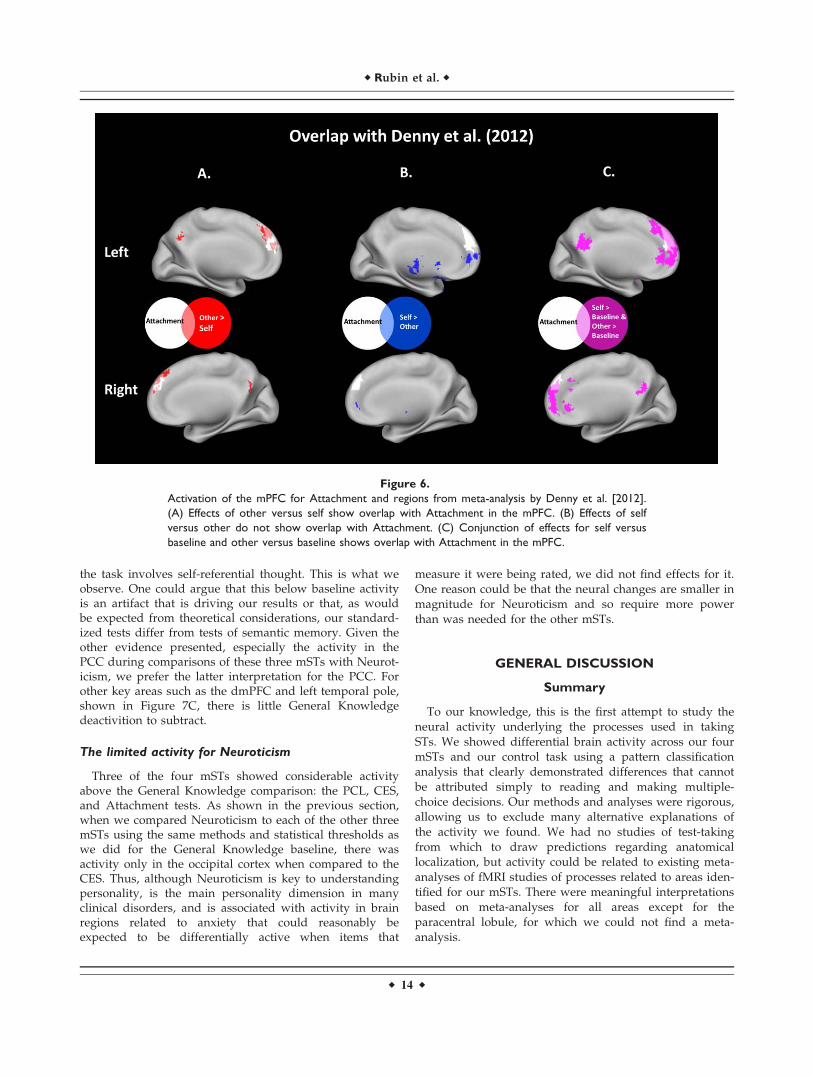
and Carter and Huettel [2013] meta-analyses. It also showspeaks from other meta-analyses that had peaks within theAttachment activation. Denny et al. [2012], unlike othermeta-analyses, distinguish between judgments about theself versus others, which is especially relevant herebecause Attachment stresses how the self relates to others.When self and other judgments are compared as shown inFigure 6A,B, other> self overlaps with Attachment,whereas self> other does not but is uniformly ventral toAttachment. For regions in which both self and other judg-ments are greater than baseline, as shown in Figure 6C,Attachment activity is mostly within that of the meta-analysis regions, except for a dorsal PFC region on theright. Thus, Attachment likely relates both to self andother judgments but is best described by regions in whichjudgments of others produce more activity than judgmentsof self. Figures 4 and 5 offer support to the activity fromthe Attachment mST being related to ToM judgments,especially those about others.
Left anterior middle and inferior temporal gyrus
There are five peaks of activity in two clusters in the lefttemporal gyrus, all for Attachment. Strong support for theinvolvement of the anterior temporal lobes in social cogni-tion comes from lesion studies in animals, neuropsychol-ogy, and neuroimaging [Olson et al., 2013; Rice et al., 2015;Wong and Gallate, 2012]. This typically includes memoryfor other people and their relationships, social language,
and social behavior. Most reviews find little evidence forlaterality effects in the anterior temporal lobes in generalor specifically for social cognition [Rice et al., 2015; Wongand Gallate, 2012] or for more specific localization withinthe anterior temporal lobes; however, some reviews sup-port more precise localization. Specifically, these reviewsfound a region that overlaps with ours for a variety ofToM tasks that did not include the paradigm of under-standing stories about ToM problems [Mar, 2011; Olsonet al., 2007, 2013]. Thus, the strong left lateralization andlack of activity in the superior temporal gyrus that weobserve are not supported by the reviews but seem spe-cific to the current results. The left lateralization in theanterior temporal lobes may be driven by general left lat-eralized cognitive processes such as language, ToM, andautobiographical memory [Kim, 2012]. For the other leftlateral activations, as reviewed, the left lateralization isconsistent with the literature.
General Issues Regarding Activity of the Four
mSTs Compared to General Knowledge
Relation of mean scores and activity
To investigate whether the mean scores on the fourmSTs affected the activity that occurred when participantsanswered test items during the scans, we correlated theaverage of each participant’s ratings over all 60 items ratedfor each of the mSTs with the activity in the clusters
Figure 4.
Activation of the left AG compared to General Knowledge. (A) Left AG activations from Attach-
ment, CES, and PCL. (B) Overlap of the left AG regions shown in two meta-analyses [Carter
and Huettel, 2013; Mar, 2011] and the left AG region activated by the union of Attachment, the
CES, and the PCL in this study. Peak activities are shown for other meta-analyses.
r Rubin et al. r
r 12 r
shown for that mST. Of the 8 clusters that have a mST >General Knowledge in Table II, two were significant at theuncorrected 0.05 level. To see if PTSD symptom severityaffected the activity shown, we correlated the participants’CAPS scores from prior to their scans with the activity ofeach of these 8 clusters. Again, two correlations were sig-nificant at the 0.05 level. None of these four clusters sur-vived correction for multiple comparisons. If the meanratings of any of the individual participants on any of thefour mSTs or the CAPS had effects on processes involvedin producing the clusters shown in Table II, the effectswere too small to observe here. Differences in neural pro-cesses might be observed with more statistical power, butthere is no a priori theoretical reason to assume that peo-ple who score at different levels on an ST use or do notuse different neural processes; they could be using eitherthe same or different processes to make differentresponses. In sum, to a first approximation, the neural cor-relates of the cognitive and affective processes involved incompleting the four mSTs are independent of scores theyproduce and of PTSD symptom severity.
Alternatives to the use of a single comparison task
After demonstrating that the different questionnaires eli-cited differentiable brain activation through pattern classifi-cation, all the remaining analyses reported, which describedand interpreted their activations, were based on compari-sons to the single comparison task of General Knowledge.For these analyses, we restricted the analysis to voxelsshowing positive activation (P< 0.05, uncorrected) in the
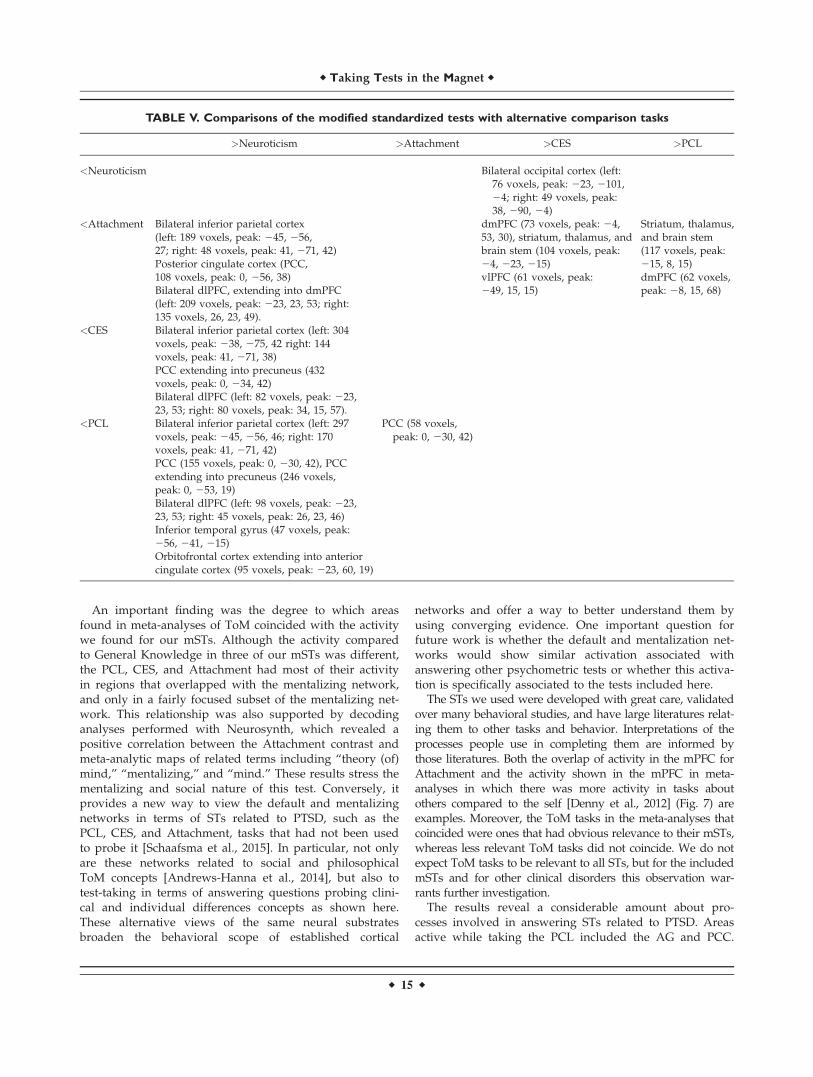
corresponding questionnaire compared to baseline. None-theless, given that this is the first study of its kind, wewanted to ensure the selection of this comparison task wasnot primarily responsible for our results. Therefore, in addi-tion to the qualitative observation that our four mSTs, whileoften overlapping, activated different neural regions, weconducted two additional lines of analysis. First, we com-pared our mSTs to each other rather than comparing eachmST to the same baseline. The purpose of these compari-sons is to show that differences occur using a variety ofbaselines, not to try to interpret or speculate about each ofthe differences. Table V includes these comparisonsgrouped by the less active baseline cluster. As shown inTable V, when our mSTs were compared to each otherinstead of General Knowledge, many areas showed differ-ential levels of activation; all mSTs had at least one areagreater than and at least one area less than another mST.These differences indicate that it is unlikely that our resultswere caused by using General Knowledge as the baseline.
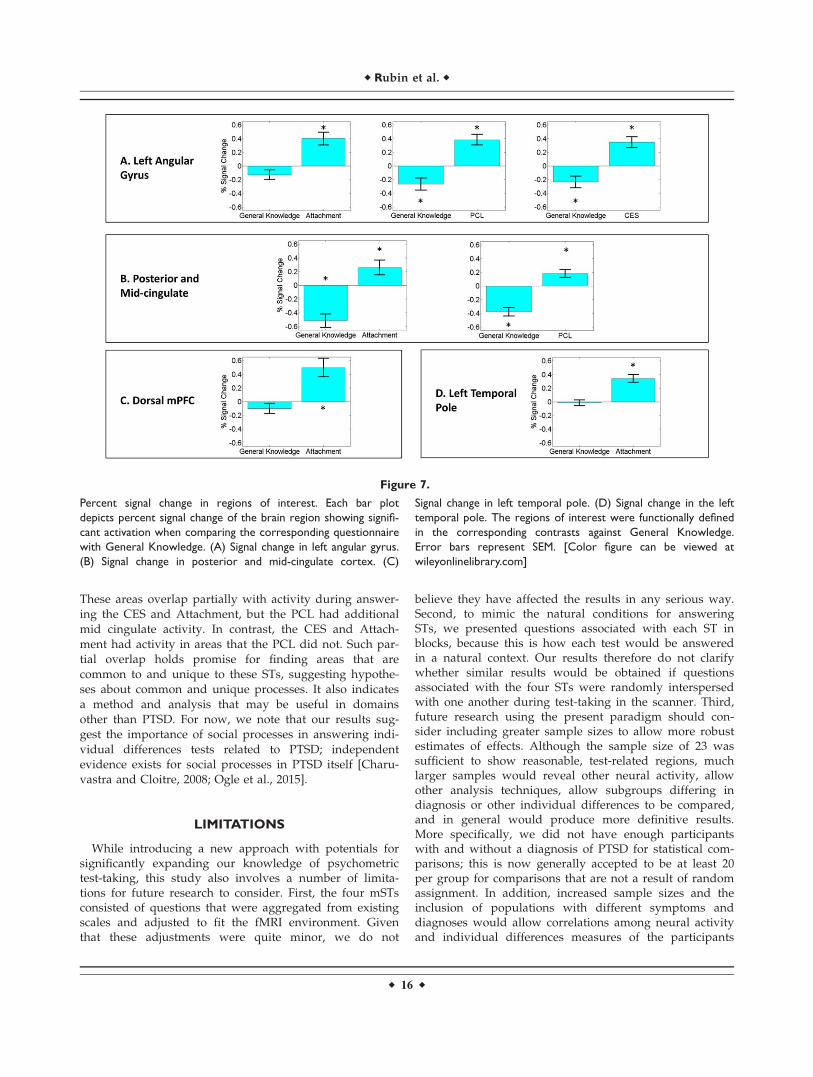
Second, we performed an analysis examining the direc-tion of the signal change in regions that exhibited differ-ences between mSTs and General Knowledge to determinewhether deactivation in General Knowledge was drivingthese findings. The left AG and the PCC are significantlyactive when comparing General Knowledge with Attach-ment, the PCL, and the CES as shown in Figure 7A,B.However, the PCC is a key node in the default network[Buckner et al., 2008] and so it is expected that it will bedeactivated in General Knowledge, a task involvingsemantic memory, because default mode network regionsare typically deactivated during task performance, unless
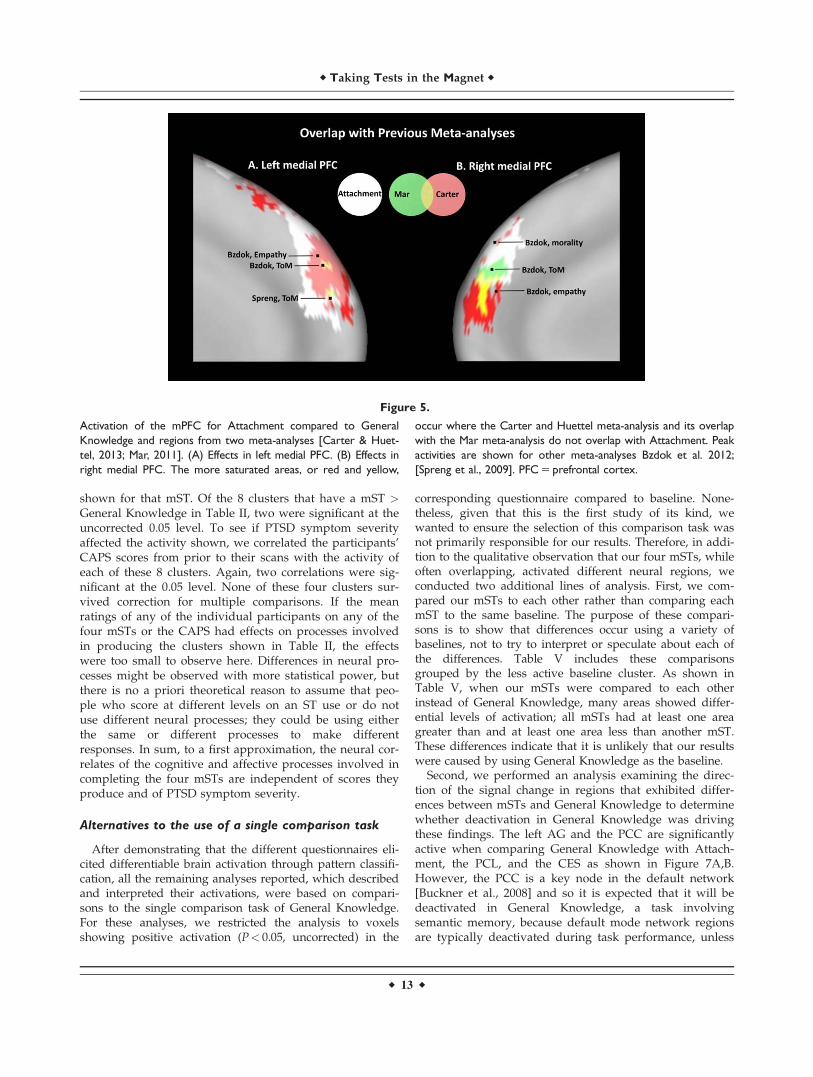
Figure 5.
Activation of the mPFC for Attachment compared to General
Knowledge and regions from two meta-analyses [Carter & Huet-
tel, 2013; Mar, 2011]. (A) Effects in left medial PFC. (B) Effects in
right medial PFC. The more saturated areas, or red and yellow,
occur where the Carter and Huettel meta-analysis and its overlap
with the Mar meta-analysis do not overlap with Attachment. Peak
activities are shown for other meta-analyses Bzdok et al. 2012;
[Spreng et al., 2009]. PFC 5 prefrontal cortex.
r Taking Tests in the Magnet r
r 13 r
the task involves self-referential thought. This is what weobserve. One could argue that this below baseline activityis an artifact that is driving our results or that, as wouldbe expected from theoretical considerations, our standard-ized tests differ from tests of semantic memory. Given theother evidence presented, especially the activity in thePCC during comparisons of these three mSTs with Neurot-icism, we prefer the latter interpretation for the PCC. Forother key areas such as the dmPFC and left temporal pole,shown in Figure 7C, there is little General Knowledgedeactivition to subtract.
The limited activity for Neuroticism
Three of the four mSTs showed considerable activityabove the General Knowledge comparison: the PCL, CES,and Attachment tests. As shown in the previous section,when we compared Neuroticism to each of the other threemSTs using the same methods and statistical thresholds aswe did for the General Knowledge baseline, there wasactivity only in the occipital cortex when compared to theCES. Thus, although Neuroticism is key to understandingpersonality, is the main personality dimension in manyclinical disorders, and is associated with activity in brainregions related to anxiety that could reasonably beexpected to be differentially active when items that
measure it were being rated, we did not find effects for it.One reason could be that the neural changes are smaller inmagnitude for Neuroticism and so require more powerthan was needed for the other mSTs.
GENERAL DISCUSSION
Summary
To our knowledge, this is the first attempt to study theneural activity underlying the processes used in takingSTs. We showed differential brain activity across our fourmSTs and our control task using a pattern classificationanalysis that clearly demonstrated differences that cannotbe attributed simply to reading and making multiple-choice decisions. Our methods and analyses were rigorous,allowing us to exclude many alternative explanations ofthe activity we found. We had no studies of test-takingfrom which to draw predictions regarding anatomicallocalization, but activity could be related to existing meta-analyses of fMRI studies of processes related to areas iden-tified for our mSTs. There were meaningful interpretationsbased on meta-analyses for all areas except for theparacentral lobule, for which we could not find a meta-analysis.
Figure 6.
Activation of the mPFC for Attachment and regions from meta-analysis by Denny et al. [2012].
(A) Effects of other versus self show overlap with Attachment in the mPFC. (B) Effects of self
versus other do not show overlap with Attachment. (C) Conjunction of effects for self versus
baseline and other versus baseline shows overlap with Attachment in the mPFC.
r Rubin et al. r
r 14 r
An important finding was the degree to which areasfound in meta-analyses of ToM coincided with the activitywe found for our mSTs. Although the activity comparedto General Knowledge in three of our mSTs was different,the PCL, CES, and Attachment had most of their activityin regions that overlapped with the mentalizing network,and only in a fairly focused subset of the mentalizing net-work. This relationship was also supported by decodinganalyses performed with Neurosynth, which revealed apositive correlation between the Attachment contrast andmeta-analytic maps of related terms including “theory (of)mind,” “mentalizing,” and “mind.” These results stress thementalizing and social nature of this test. Conversely, itprovides a new way to view the default and mentalizingnetworks in terms of STs related to PTSD, such as thePCL, CES, and Attachment, tasks that had not been usedto probe it [Schaafsma et al., 2015]. In particular, not onlyare these networks related to social and philosophicalToM concepts [Andrews-Hanna et al., 2014], but also totest-taking in terms of answering questions probing clini-cal and individual differences concepts as shown here.These alternative views of the same neural substratesbroaden the behavioral scope of established cortical
networks and offer a way to better understand them byusing converging evidence. One important question forfuture work is whether the default and mentalization net-works would show similar activation associated withanswering other psychometric tests or whether this activa-tion is specifically associated to the tests included here.
The STs we used were developed with great care, validatedover many behavioral studies, and have large literatures relat-ing them to other tasks and behavior. Interpretations of theprocesses people use in completing them are informed bythose literatures. Both the overlap of activity in the mPFC forAttachment and the activity shown in the mPFC in meta-analyses in which there was more activity in tasks aboutothers compared to the self [Denny et al., 2012] (Fig. 7) areexamples. Moreover, the ToM tasks in the meta-analyses thatcoincided were ones that had obvious relevance to their mSTs,whereas less relevant ToM tasks did not coincide. We do notexpect ToM tasks to be relevant to all STs, but for the includedmSTs and for other clinical disorders this observation war-rants further investigation.
The results reveal a considerable amount about pro-cesses involved in answering STs related to PTSD. Areasactive while taking the PCL included the AG and PCC.
TABLE V. Comparisons of the modified standardized tests with alternative comparison tasks
>Neuroticism >Attachment >CES >PCL
<Neuroticism Bilateral occipital cortex (left:76 voxels, peak: 223, 2101,24; right: 49 voxels, peak:38, 290, 24)
<Attachment Bilateral inferior parietal cortex(left: 189 voxels, peak: 245, 256,27; right: 48 voxels, peak: 41, 271, 42)Posterior cingulate cortex (PCC,108 voxels, peak: 0, 256, 38)Bilateral dlPFC, extending into dmPFC(left: 209 voxels, peak: 223, 23, 53; right:135 voxels, 26, 23, 49).
dmPFC (73 voxels, peak: 24,53, 30), striatum, thalamus, andbrain stem (104 voxels, peak:24, 223, 215)vlPFC (61 voxels, peak:249, 15, 15)
Striatum, thalamus,and brain stem(117 voxels, peak:215, 8, 15)dmPFC (62 voxels,peak: 28, 15, 68)
<CES Bilateral inferior parietal cortex (left: 304voxels, peak: 238, 275, 42 right: 144voxels, peak: 41, 271, 38)PCC extending into precuneus (432voxels, peak: 0, 234, 42)Bilateral dlPFC (left: 82 voxels, peak: 223,23, 53; right: 80 voxels, peak: 34, 15, 57).
<PCL Bilateral inferior parietal cortex (left: 297voxels, peak: 245, 256, 46; right: 170voxels, peak: 41, 271, 42)PCC (155 voxels, peak: 0, 230, 42), PCCextending into precuneus (246 voxels,peak: 0, 253, 19)Bilateral dlPFC (left: 98 voxels, peak: 223,23, 53; right: 45 voxels, peak: 26, 23, 46)Inferior temporal gyrus (47 voxels, peak:256, 241, 215)Orbitofrontal cortex extending into anteriorcingulate cortex (95 voxels, peak: 223, 60, 19)
PCC (58 voxels,peak: 0, 230, 42)
r Taking Tests in the Magnet r
r 15 r
These areas overlap partially with activity during answer-ing the CES and Attachment, but the PCL had additionalmid cingulate activity. In contrast, the CES and Attach-ment had activity in areas that the PCL did not. Such par-tial overlap holds promise for finding areas that arecommon to and unique to these STs, suggesting hypothe-ses about common and unique processes. It also indicatesa method and analysis that may be useful in domainsother than PTSD. For now, we note that our results sug-gest the importance of social processes in answering indi-vidual differences tests related to PTSD; independentevidence exists for social processes in PTSD itself [Charu-vastra and Cloitre, 2008; Ogle et al., 2015].
LIMITATIONS
While introducing a new approach with potentials forsignificantly expanding our knowledge of psychometrictest-taking, this study also involves a number of limita-tions for future research to consider. First, the four mSTsconsisted of questions that were aggregated from existingscales and adjusted to fit the fMRI environment. Giventhat these adjustments were quite minor, we do not
believe they have affected the results in any serious way.Second, to mimic the natural conditions for answeringSTs, we presented questions associated with each ST inblocks, because this is how each test would be answeredin a natural context. Our results therefore do not clarifywhether similar results would be obtained if questionsassociated with the four STs were randomly interspersedwith one another during test-taking in the scanner. Third,future research using the present paradigm should con-sider including greater sample sizes to allow more robustestimates of effects. Although the sample size of 23 wassufficient to show reasonable, test-related regions, muchlarger samples would reveal other neural activity, allowother analysis techniques, allow subgroups differing indiagnosis or other individual differences to be compared,and in general would produce more definitive results.More specifically, we did not have enough participantswith and without a diagnosis of PTSD for statistical com-parisons; this is now generally accepted to be at least 20per group for comparisons that are not a result of randomassignment. In addition, increased sample sizes and theinclusion of populations with different symptoms anddiagnoses would allow correlations among neural activityand individual differences measures of the participants
Figure 7.
Percent signal change in regions of interest. Each bar plot
depicts percent signal change of the brain region showing signifi-
cant activation when comparing the corresponding questionnaire
with General Knowledge. (A) Signal change in left angular gyrus.
(B) Signal change in posterior and mid-cingulate cortex. (C)
Signal change in left temporal pole. (D) Signal change in the left
temporal pole. The regions of interest were functionally defined
in the corresponding contrasts against General Knowledge.
Error bars represent SEM. [Color figure can be viewed at
wileyonlinelibrary.com]
r Rubin et al. r
r 16 r
taken outside of the imaging environment to be investi-gated more easily. Fourth, because brain imaging duringSTs is a new paradigm introduced here, we were limitedin the conclusions we could draw by a lack of studies ofSTs taken during neuroimaging from which specific activ-ity could be predicted. A future literature of brain imagingstudies of the processes involved in answering STs wouldextend the present work allowing specific predictions andtriangulation on the processes underlying STs. Although alack of prior research limited specific anatomical predic-tions, our study is an initial demonstration for lines ofresearch developing theoretically and practically importanttest-taking neuroimaging paradigms.
FUTURE DIRECTIONS
There is a wealth of possible extensions to this research;we list a few examples. First, our study is an example ofbridging levels of analysis related to mental health. In anattempt to understand psychopathology in terms of contin-uous differences in underlying processes as opposed todistinct diagnostic categories, the Research Domain Crite-ria (RDoC) system of integrating of levels of analysis hasbeen established. The levels are genes, molecules, cells, cir-cuits (the fMRI level we have been studying), physiology,behavior, self-reports (including STs), and paradigms(https://www.nimh.nih.gov/research-priorities/rdoc/con-structs/rdoc-matrix.shtml). Thus, both this study andthose we see as future studies are a direct analysis of self-report measures using the circuits level. Systematic exami-nation of STs in a large homogenous sample that includedparticipants with a range of disorders and comorbiditiesseems to be one obvious way to advance the goal of bridg-ing levels of analysis in mental health.
Second, one important finding from this study was thatthe default and mentalization networks were associated withanswering STs related to PTSD, that is, the PCL, CES, andAttachment. Future research should clarify the extent towhich this finding extends beyond these three tests. Forexample, will similar activations of the default and mentaliz-ing networks be seen in relation to answering other STsinvolving retrospective assessments of one’s own behaviorand mental states, such as STs addressing symptoms ofdepression, autobiographical memory, and mood states, orare these findings specific to the tests included in this study?
Third, related to the previous point, the findings stressthat taking our mSTs activates area common in a subset ofToM tasks. Many of these tasks are related to deficits inToM in PTSD including empathetic responding, recogniz-ing facial emotions, and answering questions about socialrelations that were implicit in videos; deficits that in thecontext of family situations have been related to interper-sonal violence, marital functioning, and intergenerationaltransmission of traumas [Lanius et al., 2014]. Thus,although we cannot claim that the activity in taking testsis directly related to having PTSD, the results draw
attention to ToM deficits that could serve to increase thefrequency of traumas and a decrease in social support thatwould help to alleviate symptoms. Similar deficits of ToMin major depressive disorder [Bora and Berk, 2016] andanxiety disorders [Washburn et al., 2016], which are oftencomorbid with PTSD, could have similar effects.
Fourth, studies varying both populations (e.g., ages, gen-der, clinical diagnosis, extremes of ability on the STs beinginvestigated), experimental manipulations (e.g., pharmaco-logical, mood change, sleep deprivation, and provocationstudies), and manipulations of the test material would allowinferences we could not make. For example, we know thatadolescents and older adults differ in the influences of theirsocial groups and in risk-taking in ways that are relevant tothe onset of addictions. Examining STs that measure theseconcepts while varying the age of the participant, eithercontinuously or between groups, might provide insightsinto the development of the cognitive and emotional neuralprocesses involved. However, it is also possible to includeexperimental manipulations that randomly assign partici-pants to conditions, in which their social group or riskybehavior is primed by the materials presented before oreven while the mSTs are being taken. Combining a range ofpopulations with experimental manipulations such as theseis standard for many fMRI studies. For STs, it would opena way to answer questions about underlying neural pro-cesses in test-taking in a novel and efficient manner.
Fifth, we have concentrated on paper-and-pencil typestandardized tests. However, this could be extended tostructured interviews, including interviews done by atrained clinician, such as the CAPS used here to diagnosePTSD. For the fMRI environment, head movement is anissue, but no verbal responses are needed from the partici-pant. Timing would be to the words spoken by the inter-viewer and manual responses of the participant to indicatea response or that they are finished thinking about whatthe interviewer said. Just as little is known about the neu-ral processes of taking of STs, little is known about theneural processes that underlie interviews. Given the find-ings of social areas being involved in the mSTs used here,the effects of having an actual person met before enteringthe scanner, and of systematic variation of the age, gender,race, ethnicity, professional status, or other aspects theinterviewer and how they match to the participant wouldbe especially relevant.
Sixth, given the longstanding and politically and practi-cally charged controversies over the meaning of test scoresin education and job selection, we could add another levelof analysis by examining whether participants withextreme scores recruit different patterns of neural activity.Observed differences in the neural processes could pro-vide insights into test-taking behavior and skills. Onlinefeedback using fMRI or electrical recordings might be ableto change these. For STs that measure abilities andachievements, we often have additional knowledge abouttheir neural substrates because the items are tasks that are
r Taking Tests in the Magnet r
r 17 r
often studied independent of their role in STs. Verbal andsubject-specific STs used in college and postgraduateadmissions, especially those that measure vocabulary, areexamples. For such ability and achievement tests, theadded knowledge from the task itself should make manyof the above manipulations easier to interpret. Forinstance, what we know about the neural basis of wordmeaning from neuroimaging and neuropsychology couldbe used to understand differences in the neural activity ofverbal ability and achievement STs. Variables not thoughtto be specific to the neural substrates of the ability andachievement STs being tested, such as those related tosleep deprivation or stereotype threat, could be manipu-lated to ask if neural activity decreases in task-relevantareas and increases in areas related to the manipulation.Because ability and achievement tests are among thosemost often involved in current political debates about test-ing, providing such neural- and behavioral-level evidencewould be timely and important.
Seventh, the methods used here also have the promiseof assessing when specific STs are inappropriate for spe-cific populations. For instance, it is well known that men-talization abilities are reduced in borderline personalitydisorder and in autistic populations. To the extent thatanswering specific psychometric tests recruits brain areasassociated with mentalization, this might suggest that suchtests may be less suitable for such populations or needmodification. Here the neuroimaging would suggest inves-tigations of causal relationships as the next step to addressthese issues. It may even be possible to inform when spe-cific STs are inappropriate for specific populations basedon the neural overlap of regions needed for the STs andareas that are damaged or that fail to function fully in apopulation. Decisions about the appropriateness of STsmade on such neural bases would require much moreneuroimaging evidence including neurally based normsestablished in an appropriate reference population. Forany practical use, the efficacy of the neural findings fordiagnosis and treatment would have to exceed that ofbehavioral measures. Nonetheless, this remains a potentialgoal for future research. In addition to the deficits in men-talization, other possible examples include concussions,early childhood deprivation leading to insecure attachmentor general cognitive loss, and neuropsychological diagno-ses. In all cases, the threshold for accepting evidence thataffects treatment is much higher than and involves moreethical issues than research aimed at scientific understand-ing; it is a much more ambitious and distant goal.
CONCLUSION
We provide what we believe is the first systematicattempt to study the neural activity underlying the pro-cesses used in taking STs, tests which are carefully devel-oped and tested behaviorally and which affect individuals’lives in important ways. The results provide an initial
demonstration that STs can be studied productively usingthe techniques of human brain mapping. In our study, apattern classification analysis classified correctly whichquestionnaire a participant was taking based on other par-ticipants’ neural activity. The correlation between the dis-tribution of classification errors and the semantic similarityof the test items indicated a high degree of similarity,demonstrating that the predictive information contained inpatterns of neural activity was largely associated with thesemantics of the tests, as opposed to unrelated factors thatcould be opportunistically leveraged in the pattern classifi-cation. Comparisons of our four mSTs to a General Knowl-edge baseline yielded systematic results that could beinterpreted in terms of existing meta-analyses of neuralactivity in similar tasks and activated regions.
Turning to the content of our findings, an importantresult was that nearly all the activity in our mSTs coin-cided with areas found in meta-analyses of ToM. Theactivity in the PCL, CES, and Attachment compared toGeneral Knowledge were different from each other, but allhad most of their activity in regions that overlapped withthe mentalizing network, and only in a fairly focused sub-set of the network that had obvious relevance to the par-ticular mST. This novel finding stresses the mentalizingnature of included tests. A second finding was that theneural correlates of the cognitive and affective processesinvolved in completing our mSTs were independent of thescores they produced and of the participant’s PTSD symp-tom severity. Thus, people who scored at different levelson the PTSD-related mSTs or who had different degrees ofsymptom severity did not vary on the neural processesthey used. Both findings provide novel, theoretically andpractically important information.
Our results point to many other areas where humanbrain mapping could make significant contributions. Byincluding both a range of participant populations andexperimental manipulations, standard procedures for fMRIresearch that we did not use in this first demonstrationstudy, many questions become tractable. Applications arepossible in probing the neural processes involved in STsrelated to academic and professional knowledge and abili-ties, personality and other traits, opinions and attitudes,health, and other areas. Applications are also possible tostudy how the neural processes are affected by individualdifferences factors related to the people taking the test, aswell as their training and test-taking conditions. Moreover,uncovering differences in neural processes associated withdifferent populations and different conditions would ren-der it possible to decide whether the test results acrosssuch factors are measuring similar neural processes andcan be fairly compared to each other.
AUTHOR CONTRIBUTIONS
All authors contributed to the study design, interpreta-tion of the results, the conceptual development of the
r Rubin et al. r
r 18 r
project throughout its progress, and commented on thelater drafts. D. C. Rubin developed the basic idea for thestudy and was responsible for drafting the nontechnicalsections and integrating the research and article. S. A. Hallwas in charge of the behavioral and fMRI data collection,and the quality control of the fMRI data. D. Li, P. A. Kra-gel, and S. A. Hall contributed to the data analysis andconsulted with each other as needed. P. A. Kragel per-formed the data analysis, drafted the manuscript sections,and constructed the figures for the separability and Neuro-synth analyses. D. Li performed the data analysis, draftedthe manuscript sections, and constructed the figures forthe rest of the article. All authors approved the final ver-sion of the manuscript for submission.
ACKNOWLEDGMENT
The authors thank Tobias Egner, Christin Ogle, and Kait-lyn Brodar for comments, and Kaitlyn Brodar’s help inrunning the study.
CONFLICT OF INTERESTS
We have no conflicts of interest.
REFERENCES
Andrews-Hanna JR, Saxe R, Yarkoni T (2014): Contributions of
episodic retrieval and mentalizing to autobiographical thought:
Evidence from functional neuroimaging, resting-state connec-
tivity, and fMRI meta-analyses. NeuroImage 91:324–335.Apps MA, Lockwood PL, Balsters JH (2013): The role of the mid-
cingulate cortex in monitoring others’ decisions. Front Neuro-
sci 7:251.Association AP (2013): Diagnostic and Statistical Manual of Men-
tal Disorders (DSM-5VR ). American Psychiatric Pub.Berntsen D, Rubin DC (2006): The centrality of event scale: A
measure of integrating a trauma into one’s identity and its
relation to post-traumatic stress disorder symptoms. Behav Res
Therapy 44:219–231.Berntsen D, Rubin DC (2007): When a trauma becomes a key to
identity: Enhanced integration of trauma memories predicts
posttraumatic stress disorder symptoms. Appl Cogn Psychol
21:417–431.Blake DD, Weathers FW, Nagy LM, Kaloupek DG, Gusman FD,
Charney DS, Keane TM (1995): The development of a
Clinician-Administered PTSD Scale. J Trauma Stress 8:75–90.Bora E, Berk M (2016): Theory of mind in major depressive disor-
der: A meta-analysis. J Affect Disord 191:49–55.Bowlby J (1969): Attachment and Loss: Attachment; John Bowlby.
Basic Books.Brennan KA, Clark CL, Shaver PR (1998): Self-report measurement
of adult attachment: An integrative overview.Brewer JA, Garrison KA, Whitfield-Gabrieli S (2013): What about
the “self” is processed in the posterior cingulate cortex?Brown VM, LaBar KS, Haswell CC, Gold AL, Beall SK, Van
Voorhees E, Marx CE, Calhoun PS, Fairbank JA, Green KT
(2014): Altered resting-state functional connectivity of
basolateral and centromedial amygdala complexes in posttrau-
matic stress disorder. Neuropsychopharmacology 39:361–369.Buckner RL, Andrews-Hanna JR, Schacter DL (2008): The brain’s
default network: Anatomy, function, and relevance to disease.
Ann N Y Acad Sci 1124:1–38.Buckner RL, Carroll DC (2007): Self-projection and the brain.
Trends Cogn Sci 11:49–57.Bzdok D, Schilbach L, Vogeley K, Schneider K, Laird AR, Langner
R, Eickhoff SB (2012): Parsing the neural correlates of moral
cognition: ALE meta-analysis on morality, theory of mind, and
empathy. Brain Struct Funct 217:783–796.Carter RM, Huettel SA (2013): A nexus model of the temporal-
parietal junction. Trends Cogn Sci 17:328–336.Charuvastra A, Cloitre M (2008): Social bonds and posttraumatic
stress disorder. Annu Rev Psychol 59:301–328.Costa PT, McCrae RR (2008): The revised NEO personality inven-
tory (NEO-PI-R). In: Boyle GJ, Matthews G, Saklofske DH, edi-
tors. The SAGE Handbook of Personality Theory and
Assessment London: Sage Publications Ltd, 2:179–198.Denny BT, Kober H, Wager TD, Ochsner KN (2012): A meta-
analysis of functional neuroimaging studies of self-and other
judgments reveals a spatial gradient for mentalizing in medial
prefrontal cortex. J Cogn Neurosci 24:1742–1752.Forman SD, Cohen JD, Fitzgerald M, Eddy WF, Mintun MA, Noll
DC (1995): Improved assessment of significant activation in
functional magnetic resonance imaging (fMRI): Use of a
cluster-size threshold. Magn Reson Med 33:636–647.Garrett AS, Carrion V, Kletter H, Karchemskiy A, Weems CF,
Reiss A (2012): Brain activation to facial expressions in youth
with PTSD symptoms. Depression Anxiety 29:449–459.Griffin DW, Bartholomew K (1994): The metaphysics of measure-
ment: The case of adult attachment.Hall SA, Rubin DC, Miles A, Davis SW, Wing EA, Cabeza R,
Berntsen D (2014): The neural basis of involuntary episodic
memories. J Cogn Neurosci 26:2385–2399.Han L, Kashyap A, Finin T, Mayfield J, Weese J (2013): UMBC
EBIQUITY-CORE: Semantic textual similarity systems. pp 44–52.Hennig-Fast K, Werner NS, Lermer R, Latscha K, Meister F,
Reiser M, Engel RR, Meindl T (2009): After facing traumatic
stress: Brain activation, cognition and stress coping in police-
men. J Psychiatr Res 43:1146–1155.John OP, Donahue EM, Kentle RL (1991): The Big Five Inven-
tory—Versions 4a and 54. Berkeley, CA: University of Califor-
nia, Berkeley, Institute of Personality and Social Research.Kilpatrick DG, Resnick HS, Milanak ME, Miller MW, Keyes KM,
Friedman MJ (2013): National estimates of exposure to trau-
matic events and PTSD prevalence using DSM-IV and DSM-5
criteria. J Trauma Stress 26:537–547.Kim H (2012): A dual-subsystem model of the brain’s default net-
work: Self-referential processing, memory retrieval processes,
and autobiographical memory retrieval. NeuroImage 61:
966–977.Kohavi R (1995): A study of cross-validation and bootstrap for
accuracy estimation and model selection. In Stanford, CA. pp
1137–1145.Lancaster JL, Tordesillas-Guti�errez D, Martinez M, Salinas F,
Evans A, Zilles K, Mazziotta JC, Fox PT (2007): Bias between
MNI and Talairach coordinates analyzed using the ICBM-152
brain template. Hum Brain Mapp 28:1194–1205.Lanius R, Frewen P, Nazarov A, McKinnon M (2014): A social-
cognitive–neuroscience approach to PTSD: Clinical and
research perspectives. Neurobiol Treat Trauma Dissoc 69–80.
r Taking Tests in the Magnet r
r 19 r
Mar RA (2011): The neural bases of social cognition and storycomprehension. Annu Rev Psychol 62:103–134.
Mikulincer M, Shaver PR (2007): Attachment in Adulthood: Struc-ture, Dynamics, and Change. Guilford Press.
Ogle CM, Rubin DC, Siegler IC (2015): The relation between inse-cure attachment and posttraumatic stress: Early life versusadulthood traumas. Psychol Trauma Theory Res Pract Policy7:324.
Olson IR, McCoy D, Klobusicky E, Ross LA (2013): Social cogni-tion and the anterior temporal lobes: A review and theoreticalframework. Soc Cogn Affect Neurosci 8:123–133.
Olson IR, Plotzker A, Ezzyat Y (2007): The enigmatic temporalpole: A review of findings on social and emotional processing.Brain 130:1718–1731.
Palomero-Gallagher N, Vogt BA, Schleicher A, Mayberg HS, ZillesK (2009): Receptor architecture of human cingulate cortex:Evaluation of the four-region neurobiological model. HumBrain Mapp 30:2336–2355.
Raichle ME (2015): The brain’s default mode network. Annu RevNeurosci 38:433–447.
Rice GE, Ralph MAL, Hoffman P (2015): The roles of left versusright anterior temporal lobes in conceptual knowledge: AnALE meta-analysis of 97 functional neuroimaging studies.Cereb Cortex bhv024.
Roberts AL, Gilman SE, Breslau J, Breslau N, Koenen KC (2011):Race/ethnic differences in exposure to traumatic events, devel-opment of post-traumatic stress disorder, and treatment-seeking for post-traumatic stress disorder in the United States.Psychol Med 41:71–83.
Rubin DC, Berntsen D, Bohni MK (2008): A memory-based modelof posttraumatic stress disorder: Evaluating basic assumptionsunderlying the PTSD diagnosis. Psychol Rev 115:985.
Rubin DC, Boals A, Hoyle RH (2014): Narrative centrality andnegative affectivity: Independent and interactive contributorsto stress reactions. J Exp Psychol Gen 143:1159.
Schaafsma SM, Pfaff DW, Spunt RP, Adolphs R (2015): Decon-structing and reconstructing theory of mind. Trends Cogn Sci19:65–72.
Schwartz SJ, Lilienfeld SO, Meca A, Sauvign�e KC (2016): The roleof neuroscience within psychology: A call for inclusivenessover exclusiveness. Am Psychol 71:52.
Seghier ML (2013): The angular gyrus multiple functions and mul-tiple subdivisions. The. Neuroscientist 19:43–61.
Shin LM, Whalen PJ, Pitman RK, Bush G, Macklin ML, Lasko NB,Orr SP, McInerney SC, Rauch SL (2001): An fMRI study ofanterior cingulate function in posttraumatic stress disorder.Biol Psychiat 50:932–942.
Shirer W, Ryali S, Rykhlevskaia E, Menon V, Greicius M (2012):Decoding subject-driven cognitive states with whole-brain con-nectivity patterns. Cereb Cortex 22:158–165.
Song X-W, Dong Z-Y, Long X-Y, Li S-F, Zuo X-N, Zhu C-Z, He Y,Yan C-G, Zang Y-F (2011): REST: A toolkit for resting-statefunctional magnetic resonance imaging data processing. PLoSOne 6:e25031.
Sperduti M, Delaveau P, Fossati P, Nadel J (2011): Different brainstructures related to self-and external-agency attribution: Abrief review and meta-analysis. Brain Struct Funct 216:151–157.
Spitzer RL, Kroenke K, Williams JB, L€owe B (2006): A brief mea-sure for assessing generalized anxiety disorder: The GAD-7.Arch Int Med 166:1092–1097.
Spreng RN, Mar RA, Kim AS (2009): The common neural basis ofautobiographical memory, prospection, navigation, theory ofmind, and the default mode: A quantitative meta-analysis.J Cogn Neurosci 21:489–510.
St. Jacques PLS, Botzung A, Miles A, Rubin DC (2011): Functionalneuroimaging of emotionally intense autobiographical memoriesin post-traumatic stress disorder. J Psychiatr Res 45:630–637.
St. Jacques PLS, Kragel PA, Rubin DC (2013): Neural networkssupporting autobiographical memory retrieval in posttraumaticstress disorder. Cogn Affect Behav Neurosci 13:554–566.
Tauber SK, Dunlosky J, Rawson KA, Rhodes MG, Sitzman DM (2013):General knowledge norms: Updated and expanded from the Nel-son and Narens (1980) norms. Behav Res Methods 45:1115–1143.
Van Overwalle F (2009): Social cognition and the brain: A meta-analysis. Hum Brain Mapp 30:829–858.
Vogt BA, Nimchinsky EA, Vogt LJ, Hof PR (1995): Human cingu-late cortex: Surface features, flat maps, and cytoarchitecture.J Comp Neurol 359:490–506.
Washburn D, Wilson G, Roes M, Rnic K, Harkness KL (2016):Theory of mind in social anxiety disorder, depression, andcomorbid conditions. J Anxiety Disord 37:71–77.
Weathers FW, Litz BT, TM K, Palmieri PA, Marx BP, Schnurr PP(2013): The PTSD Checklist for DSM-5 (PCL-5). Scale availablefrom the National Center for PTSD at www.ptsd.va.gov.
Wong C, Gallate J (2012): The function of the anterior temporallobe: A review of the empirical evidence. Brain Res 1449:94–116.
Yarkoni T, Poldrack RA, Nichols TE, Van Essen DC, Wager TD(2011): Large-scale automated synthesis of human functionalneuroimaging data. Nat Methods 8:665–670.
Yeo BT, Krienen FM, Sepulcre J, Sabuncu MR, Lashkari D,Hollinshead M, Roffman JL, Smoller JW, Zollei L, Polimeni JR,Fischl B, Liu H, Buckner RL (2011): The organization of thehuman cerebral cortex estimated by intrinsic functional con-nectivity. J Neurophysiol 106:1125–1165.
r Rubin et al. r
r 20 r