standardized precipitation measurements within icos - doi
TRANSCRIPT
Standardized precipitation measurements within ICOS: rain, snowfall and snow depth: a review
Sigrid Dengel1*, Alexander Graf 2, Thomas Grünwald 3, Markus Hehn3, Pasi Kolari4, Mikaell Ottosson Löfvenius5, Lutz Merbold 6,7, Giacomo Nicolini8, and Marian Pavelka 9
1Climate and Ecosystem Sciences Division, Lawrence Berkeley National Laboratory, Berkeley, CA, 94720, United States2Institute of Bio- and Geosciences, Agrosphere (IBG-3), Forschungszentrum Jülich, Wilhelm-Johnen-Straße, 52428, Jülich, Germany3Institute of Hydrology and Meteorology, Technische Universität Dresden, 01062 Dresden, Germany4Department of Physics, University of Helsinki, 00014 Helsinki, Finland5Department of Forest Ecology and Management, Swedish University of Agricultural Sciences, Skogsmarksgränd, SE-901 83 Umeå, Sweden6Department of Environmental Systems Science, Grassland Sciences Group, ETH Zürich, Universitätsstrasse 2, 8092 Zürich, Switzerland7Mazingira Centre, International Livestock Research Institute (ILRI), PO Box 30709, 00100 Nairobi, Kenya8Department of Innovation in Biological Agro-food and Forest Systems, University of Tuscia, Via San Camillo de Lellis, 01100 Viterbo, Italy9Department of Matters and Energy Fluxes, CzechGlobe, Global Change Research Institute CAS, 603 00 Brno, Czech Republic
Received January 26, 2018; accepted June 26, 2018
Int. Agrophys., 2018, 32, 607-617doi: 10.1515/intag-2017-0046
*Corresponding author e-mail: [email protected]
A b s t r a c t. Precipitation is one of the most important abiotic variables related to plant growth. Using standardised measure-ments improves the comparability and quality of precipitation data as well as all other data within the Integrated Carbon Observation System network. Despite the spatial and temporal variation of some types of precipitation, a single point measurement satis-fies the requirement as an ancillary variable for eddy covariance measurements. Here the term precipitation includes: rain, snow-fall (liquid water equivalent) and snow depth, with the latter two being of interest only where occurring. Weighing gauges defined as Integrated Carbon Observation System standard with the capacity of continuously measuring liquid and solid precipitation are installed free-standing, away from obstacles obstructing rain or snowfall. In order to minimise wind-induced errors, gauges are shielded either naturally or artificially to reduce the adverse effect of wind speed on the measurements. Following standard-ised methods strengthens the compatibility and comparability of data with other standardised environmental observation networks while opening the possibility for synthesis studies of different pre-cipitation measurement methodologies and types including a wide range of ecosystems and geolocations across Europe.
K e y w o r d s: ICOS, protocol, precipitation, rain, snow
INTRODUCTION
Precipitation is one of the most important abiotic varia- bles related to vegetation survival, and growth and thus gross primary production. Accurate measurements of pre-cipitation in its liquid and solid form are fundamental to acquire reliable knowledge on all facets of the hydrological cycle, representing a key component in ecosystem under-standing and hydro-meteorological and climate models. As a pan-European research infrastructure the Integrated Carbon Observation System (ICOS) is providing long-time series of harmonised and high-precision data, including data on carbon cycle, greenhouse gas budget and further associated meteorological variables including precipita-tion. Precipitation may interfere with other measurements such as radiation and eddy flux measurements as the accu-racy of sonic anemometers and open-path gas analysers decline under heavy rain or snowfall with the timing and intensity of precipitation being valuable indicators as part of the data quality control procedure.
© 2018 Institute of Agrophysics, Polish Academy of Sciences
Review
S. DENGEL et al.608
The World Meteorological Organization WMO (1992) defines precipitation as the liquid or solid products of the condensation of water vapour falling from clouds or depos-ited from air onto the ground. The main products are: rain, drizzle, hail, dew, fog and snow. The total amount of pre-cipitation reaching the surface is expressed in terms of the vertical depth of water (or what would be obtained by melt-ing the snow cover – referred to as snow water equivalent SWE) covering a horizontal surface. Whereas liquid pre-cipitation is represented by rainfall, solid precipitation is understood as snow, ice, sleet and hail. Snowfall is regarded as the accumulation of fresh snow since the last observa-tion, while snow depth is the total depth of snow including fresh snow and the already existing snow on the ground.
In addition to these precipitation types one has to distinguish between various precipitation components: throughfall, defined as the precipitation that passes directly through a plant canopy, and stemflow, classified as the pre-cipitation that drains from leaves, branches and twigs down along the stems of plants. Together they are classified as below-canopy precipitation. An excellent review is given in Levia and Frost (2003) and Levia et al. (2011). Lack of solid or liquid precipitation does not exclude the presence of dew or fog, as dew is water vapour that has condensed onto a surface, while fog is composed of tiny liquid water droplets suspended in the air.
The unit of precipitation is linear depth, usually pro-vided in mm (volume/area) for liquid precipitation, while snow depth is measured in cm (Table 1). Less than 0.2 cm of snow is generally called a trace. The depth of snow on the ground is measured daily in whole cm according to the WMO, but high resolution measurements are possible with optical sensors and the use of simple cameras.
The spatial variability of liquid and solid precipitation is dependent on the latitudinal and altitudinal location together with the local topography that has an effect on particular types of precipitation, but also affected by local and regional weather patterns. Depending on type, precipitation events can last from a few minutes to prolonged periods of time. In Nordic and alpine/high altitudinal regions, snowfall and snow cover can last several months and occur anytime throughout the year.
WMO (2010) standards on how and where to meas-ure precipitation, provide means for analysing the local conditions at ICOS ecosystem stations in relation to clima-tological standards and spatial distribution of precipitation based on existing WMO-stations in the region. Furthermore, available long-time series are useful for temporal analysis (extremes, frequencies, sequences, etc.). Even with respect to the high spatial and temporal variability of some types of precipitation (convective type) relative to the area of inter-est (eddy covariance (EC) system footprint), a single point measurement satisfies the requirement as an ancillary varia- ble for EC measurements within ICOS. The objectives of this paper are to provide the guidelines required to describe and report the amount of liquid and solid (where applica-ble) precipitation accounted for in a standardised manner at each ICOS ecosystem station.
METHODOLOGY
At ICOS ecosystem stations precipitation is measured in liquid and solid form: rain, sleet, graupel, hail, snow-fall (SWE) together with the total accumulated snow (snow depth), where occurring. All but snow depth are predomi-nantly measured with precipitation gauges (rain gauge if only liquid precipitation is measured). Precipitation measurements represent point measurements and are rep-resentative to a limited area, accompanied by errors and are very sensitive to exposure, and in particular to wind (Sevruk and Nespor, 1994; Groisman et al., 1999; WMO, 2010; Wolff et al., 2015; Kochendorfer et al., 2017a,b). Fog, dew, throughfall and stemflow are facultative meas-urements within ICOS at the moment, and therefore only briefly outlined in the section dealing with potential improvements in the future.
Rain and snow water content measurements: methodology and instrumentation
Precipitation gauges are the most common instru-ments used to measure liquid and solid precipitation. It has been agreed within the frame of ICOS that WMO rec-ommendations and guidelines are to be followed where possible (instrumentation and installation location) or adapted accordingly. Regarding precipitation gauges, there are more than 50 different types (Frumau et al., 2006; Nitu and Wong, 2010) being used in the world. The most com-monly used precipitation gauge recognised by the WMO (1984, 1989, 2010); Sevruk et al. (2009), Vuerich et al. (2009) consists of a funnel leading into a container where the accumulated water and melted snow are stored between observations. Two of the WMO (1984, 1989, 2008, 2010) standards are the weighing-recording type and the tipping-bucket type. The weighing-recording precipitation gauge has the capacity of measuring liquid (rain) as well as solid (hail and snow) precipitation, while the common tipping bucket rain gauge is only limited to measure rainfall.
Ta b l e 1. Measured variables and standard units within ICOS
Variable ICOS unitRainfall mmSnowfall mmSnow depth cmThroughfall mmStemflow mmDew kg m-2 or mm m-2
(nearest tenth of a mm)Fog l m-2
STANDARDIZED PRECIPITATION MEASUREMENTS WITHIN ICOS 609
The weighing-recording gauge was defined as ICOS standard, whereas the tipping-bucket rain gauge can only be used as additional sensor or as part of the back-up meteorological station. The underlying principle of weighing-recording gauges is the continuous recording of the weight of a container, together with the precipitation accumulated therein. Examples for such gauges are the OTT Pluvio2 (Pluvio series, OTT Hydromet, 2014) or the Geonor T-200B series (Geonor, Inc., 2016) (detailed information available from the manufacturers). The principle underlying tipping-bucket rain gauges is the collection of water in a container, divided into two compartments (buckets) balanced in unstable equilibrium about a horizontal axis. Although their application is simple and they are widely used, tipping-bucket rain gauges are not only accompanied by the same error sources (see respective section) as the weighing gauges but also suffer from additional sampling errors induced by tipping action in heavy rain. Moreover, the exact onset or end of precipitation events cannot be determined. Low intensity rain events (drizzle) can occur over a prolonged period of time before 0.2 mm have been accumulated and registered by the tipping bucket. Additionally, random tipping of the gauge leads to misreading of a rain event, its timing and its intensity. Though tipping bucket rain gauges have the possibility to be heated, they are not recommended for winter conditions. The reason for this is the delay in measuring snowfall or better snow water equivalent (possible delay of several hours). The longest delays should be expected for low density snow at very cold air temperatures. While out of point of view of biological effects (water availability), time resolution of precipitation measurements might not need to be very high, at the same time the momentary rain intensity affects water flow into the ground (surface flow vs. drainage) and so to some extent subsequently evaporation. As a consequence, tipping buckets are not compliant with ICOS standards.
In addition to these two measurement principles, optical precipitation sensors are used at many flux measurement sites and certainly at meteorological observation sites around the world. The WMO Commission for Instruments and Methods of Observation (CIMO) (Nitu and Wong, 2010) identified the following three types of optical measurements: (1) Sensor operating on the principle that a partially coherent infrared or visible light beam, when passed through an irregular medium, will have an altered frequency. In other words, when precipitation falls through an infrared beam it introduces frequencies in the beam that are a function of the size and speed of the particle. (2) Sensor measuring the extinction caused by the particle falling through a thin light sheet determining the size and velocity of the droplet from the amplitude and duration of the light extinction. (3) Instrument measuring the forward optical scattering by the particles and the water content of the precipitation using a rain sensor. Precipitation intensities
that are estimated from forward optical scattering and from the rain sensor jointly with an air temperature measurement allow for the identification of precipitation types (liquid or solid), amount, and intensity (Nitu and Wong, 2010).
Although it is expected that optical instruments per- form better than weighing gauges because of their advanced technological features, they generally suffer from lower accuracy. In contrast, they do not suffer from errors applicable to the collecting/recording precipitation gauges, and have the ability to measure individual droplet size and number. Nevertheless, they have the tendency to overestimate precipitation (e.g. Lanzinger et al., 2006; Lanza et al., 2010; Liu et al. 2013). One explanation of such a limitation is that two (or more) coincident particles in the light sheet can appear as one large particle (Lanzinger et al., 2006). On the other hand Liu et al. (2013) suggest that small raindrops tend to be omitted in larger size raindrops due to shadow effects of light. Furthermore, optical instruments are sensitive to orientation in regards to the prevailing wind direction as wind shading can possibly compromise the measurements. In addition, splashing effect of large raindrops off the sensor housing into the measurement volume contributes further to the uncertainty of such optical precipitation sensors. For these reasons the instruments are not compliant for precipitation measurements in ICOS. They can be used only if no appropriate location for the weighing gauge can be found or as additional sensors.
Measuring snow depth is mandatory in ICOS where snow occurs and can be done either automatically or manually (snow stake), depending on the frequency and intensity of snowfall at the site. The majority of the ultrasonic type snow depth sensors, e.g. SR50/SR50A Sonic Ranging Sensor (Campbell Sci., 2011), USH-8 Ultrasonic snow depth sensor (Sommer Messtechnik, 2015), 260-700 Ultrasonic Snow Depth Sensor (NovaLynx, 2015) are also known as sonic ranging depth sensors. Thereby the sensor determines the distance from the transmitter to the target (snow surface) by emitting ultrasonic pulses and listening to the returning echoes that are reflected by the target. The distance is deduced from the transmission time between the emission and the reception of the echo. The sensor detects the increase in snow depth after snowfall and the decrease during melting periods.
At sites that experience snow less frequent or for a few days a year only, a semi-automatic approach like digital (web) cameras pointing at a permanent fixed snow stake or a fully-manual approach measuring snow depth by means of a snow stick can be used. These two methods can be applied also in addition to the sonic sensor to further improve the information on snow cover distribution during e.g. snowmelt periods or in particular areas (e.g. below canopy).
Snow depth measurements are taken as long as there is snow on the ground. If half the exposed ground is without any snow and other areas are covered with snow, then snow
S. DENGEL et al.610
depth is reported as the average between the measured snow depth and the bare ground (WMO, 2008). Snow depth measurements should always be taken close to the precipitation gauge.
Sources of error for precipitation gauges
All types of precipitation measurements at ICOS eco-system stations are done with the aim to provide long-term high-quality continuous data. Precipitation gauges are accompanied by errors induced due to wind effects (system-atic wind field deformation above the gauge orifice) (Wolff et al., 2013; Colli, 2014) and the inhomogeneity introduced by the design of the measuring device (Sevruk and Nespor, 1994). Further errors include wetting losses (Sevruk, 1974a) and evaporation losses (Sevruk, 1974b; Leeper and Kochendorfer, 2015) inside the collection funnel, sampling errors due to weighing and tipping mechanisms (Sevruk and Chvíla, 2005) and in- and out-splashing effects due to device location, as well as random observational and instrumental errors. These errors and limitations have been recognised by the WMO (1984; 2008; 2010 and, specifi-cally for snow, 1998) and were highlighted in comparison studies carried out over the past decades (e.g. Fruman et al., 2006; Sevruk et al., 2009; Wolff et al., 2015; Buisán et al., 2017). The systematic error of solid precipitation meas-urements is commonly large as the results from the recent Solid Precipitation Intercomparison Experiment (SPICE) have shown (Rha et al., 2014; Wolff et al., 2013, 2015; Buisán et al., 2017; Kochendorfer et al., 2017a,b). Wind speed is the most important environmental factor contrib-uting to the under-catchment of solid precipitation as low wind speeds of 1.5 m s-1 already cause a loss of 30% in precipitation recorded with unshielded precipitation gauges and with increasing losses at higher wind speeds (Wolff et al., 2015). That said, studies by Buisán et al. (2017) and Kochendorfer et al. (2017a) point out that wind-shielded gauges show a lower bias than unshielded gauges.
Gauges are shielded either naturally (for example, for-est clearing, hedges) or artificially to minimise the adverse effect of wind speed on these measurements (Sevruk et al., 2009; Nitu and Wong, 2010; Rasmussen et al., 2012). The type of windshield configuration, as well as gauge type, will alter the relationship between wind speeds and catch efficiency, and have implications on data homogene-ity. Though the Tretyakov wind shield is a standard WMO recognised wind shield, for example, it has been shown not to be applicable in winter conditions as it is causing snow to accumulate and to enter the precipitation collector in windy conditions. The Alter wind shield (Alter, 1937; WMO, 2012), that is composed of loose hanging lamel-las without collecting snow, has been recommended by several Institutes, including the Finnish Meteorological Institute (pers. communication) and is thus ICOS standard. Although the standard off-the-shelf shield is connected to
the post of the gauge, it is strongly recommended that the shield is mounted independently of the post of the gauge to reduce the impact of wind vibration on the instrument.
Instrument setup
The geographical reach of ICOS ecosystem stations currently expands from Southern Europe to North of the Arctic circle. The network further includes stations in French Guiana. While some ICOS ecosystem stations experience precipitation in liquid form only, other stations are experiencing also solid precipitation during the winter and occasionally during the summer months. Standardised precipitation measurements therefore should consider this variability, delivering the most representative, accurate, reliable, and qualitatively best data possible.
WMO guidelines include information regarding the maximum terrain slope, description of obstacles and the minimum distance of obstacles as function of their height. Furthermore, the WMO (2010) handbook recommends positioning precipitation gauges in an area with homo- geneous and dense vegetation of the same height as the gauge orifice, or alternatively by simulating the effect of vegetation through the use of appropriate fence structures or the application of windshields around the gauge. That said, there are no strict rules on exact orifice height (most commonly used height varies between 0.5 and 1.5 m according to WMO, 1989), providing some flexibility and pointing towards the need of caution for sites with differing snow cover heights.
In ICOS, it has been decided that no precipitation measurements using a weighing gauge or tipping bucket are carried out on top of the tower, nor along the tower itself. Reasons for such a decision are wind and tower induced vibrations, obstruction through the tower itself as well as wind distortion induced errors. In case no appropriate open space is found near forest sites that fulfil the above properties, then the installation of an optical instrument on top of the tower is admissible as an exception.
Snow depth sensors are installed according to the instrument (model) manual at 1.5-2 m above ground (covered with artificial grass or other surface depending on instrument guidelines). At stations where a fixed snow stake and a digital camera are used, care has to be taken in orientating and installing (field of view of camera towards North to avoid glare) these providing visible and clear images of the snow stake and the snow depth reading. Furthermore, snow stakes have a metric gauge well visible to the human eye. Images are taken several times a day during daylight hours (or throughout the night if infrared (IR) light/camera is available). Implementing digital images at sites provides additional information on snow cover distribution during snowmelt season.
The nearest WMO standard or official station mea- suring precipitation is used as a reference station, and own measured values regularly compared and verified.
STANDARDIZED PRECIPITATION MEASUREMENTS WITHIN ICOS 611
Systematic discrepancies, such as consistently lower or higher readings over a prolonged period of time (be it months), are indicative of misplacement of instrument, over- or under-estimation or other random errors.
Spatial and temporal sampling design
Locations of gauges are chosen in places as open as possible and not further than the maximum allowed dis-tance of 1 km from the EC tower away where precipitation can be measured according to the site requirements out-lined above. Regarding snow depth, the measurement point is away from roofs, depressions, trees and snow dump-ing areas at all sites that encounter snowfall during winter months. Furthermore, these measurements are carried out in locations away from areas that are influenced by local turbulence snowdrifts but close to the precipitation gauge to represent roughly the same “collection” area (relevant to water storage in snow and water balance studies in the spring), but not obstructed herewith. Snow depth measure-ments below the forest canopy are undertaken using a fixed snow stake and a digital camera in locations where soil temperature and soil moisture are measured.
The minimum acquisition frequency for continuous measurements of precipitation and snow depth is 0.017 Hz (one measurement every 60 s). Depending on site setup, precipitation data can be automatically sampled at 10 s resolution and integrated over 1 min. With it, aver-aging fluctuations or noise caused by the vibrations of the weighing gauge mechanisms/wind pumping (Sevruk and Chvíla, 2005; WMO, 2010) are automatically removed. Nevertheless, high-resolution data output by weighing gauges offers further the possibility of investigating rain intensity of short intensive rain showers. Automatic snow depth measurements are recorded as 30-min average val-ues. At sites that experience snow only a few days per year, manual measurements are feasible and carried out once a day at a fixed time. When using a fixed snow stake and digital camera, pictures have to be taken several times a day during daylight hours or throughout the night if an IR camera or IR light is available. Images must be taken at minimum every four hours, starting at midnight.
Calibration and maintenance
Calibration of weighing precipitation gauges common-ly involves the use of a series of weights (50, 100, 500, and 1000 g) or by adding known amounts of water (50, 100, 500, and 1000 ml), which, when placed in the buck-et or catchment container, provide a predetermined value equivalent to a specific amount of precipitation. Calibration is done twice a year following manufacturer’s guidelines. Due to the impracticability of removing some precipita-tion gauges (typically mounted on a concrete grounding) calibration (and checks) can be carried out on a dry and calm day, before and after the winter season, when the col-lection container will be cleaned and filled with an exact
known amount of antifreeze liquid (to melt and to avoid further freezing of precipitation) or a known amount of oil, in order to avoid evaporation loss during the summer sea-son, respectively.
Sonic snow depth sensor calibration checks are done at least in the beginning and end of the snow season using a measuring stick. Additional checks during the season are recommended. Annual replacement of desiccant is also required. Cameras do not need calibrations, but are checked and cleaned on a regular basis in order to avoid accumulation of snow and ice on them. The lens and its focus are checked and cleaned prior to the winter or before the first snow is expected in order to avoid miss-orientated and blurry images and thus loss of information. Images and algorithms are frequently checked in order to guarantee an accurate snow depth reading where site instruments are not being checked and supervised on a daily basis.
Occasionally instruments need to be replaced depen- ding on exact use, material degradation, sensor drift, manufacturer guidelines, instruments taken down for service or calibration, lightning strike, damage caused by other natural forces (storm) or animals, mechanical damage or due to sensor malfunction. Is a replacement needed (not when replacement takes place due to instrument malfunc- tion), then if possible the new sensor should be operated at least for a period of one month alongside the existing one in order to capture a variety of precipitation events and intensities. In order to guarantee on-going measurement, replacement instruments are recommended to be purchased well in advance so that alongside comparison measurements can be made possible. Such comparisons are necessary for sensor drift correction calculations.
Auxiliary measurements
Another method in verifying precipitation events is the use of leaf/surface wetness sensors. They enable verifying whether or not a precipitation event has occurred should the gauge show anomalous readings or values. They also pro-vide non-quantitative information on the occurrence of fog and dew, both of which are relevant variables for canopy and hydrological processes (canopy conductance, vapour pressure deficit, etc.). These wetness sensors are resistor type sensors. When fog, dew or raindrops hit the wetness sensor surface, a contact is made between electrodes and a relay is cut through. There are different types of surface/leaf wetness sensors, some simple ones that only indicate existence of water on the sensor surface, e.g. the Skye sur-face wetness sensor (SKYE - SKLW 1900; Skye, 2007) and the Campbell Sci. - 237-L Leaf Wetness Sensor (Campbell Sci., 2010), or other more sophisticated ones, such as the Decagon Dielectric Leaf Wetness Sensor (Decagon – LWS; Decagon, 2016, now distributed by METER ENVIROMENT (METER Group, 2018)). Depending on the dielectric constant this LWS differentiates between dif-ferent types of deposition. For example, ice has a much
S. DENGEL et al.612
lower dielectric constant than liquid water, so the sensor output from frost is much lower than that from a similar amount of rain or dew.
Wind speed and ambient air temperature measurements are part of the standard measurement suite at ICOS eco- system stations with both variables measured as part of the eddy covariance setup and in addition as part of a back-up meteorological station. Air temperature and wind speed measurements (carried out at the orifice rim height or derived from higher located wind speed values) are used in wind-induced error correction procedures (Wolff et al., 2015 and Kochendorfer et al., 2017a,b).
Data quality control and calculationsThis section describes data quality procedures and
calculations needed to obtain the final 30-min total precipi-tation values from the raw output signal of the sensors. It is recommended for these to be carried out according to the specific instrument guidelines, algorithms and measure-ment recommendations therein.
Weighing gauges are sophisticated precipitation gauges and particular algorithms for accurate calculations must be applied to the raw measurements. As an example, the algorithm to calculate the precipitation during a specified period (30-min) is based on input data of one-minute mean values (10 s scan). The signal value from the vibrating strings (Hz) is already converted to mm (bucket weight). The algorithm then sequentially checks the every-minute values to find the lowest value after the highest is reached but not lower than the already approved corrected value from the previous period. The difference between the end and the start value then equals the amount of precipitation (change in bucket weight). By this, the algorithm corrects for eventual evaporation losses and the effect of gauge evaporation becomes negligible. The algorithm also filters out noise and checks for sudden excessive amounts, which may be correct if heating has been turned on and caused melting of ice that has recently fallen into the bucket, and are discarded otherwise. A wider range of quality control procedures are described in Reverdin et al. (2016) including a detailed flagging and work flow system and summarised in Kochendorfer et al. (2017a,b) but with emphasis on solid precipitation. Additional procedures that are applicable to all forms of precipitation are manual quality control measures, such as removal of data due to maintenance, bird droppings or other deposits (leaves or needles in forest ecosystems). Since wetness sensors are accompanying precipitation measurements their readings can be incorporated in quality control procedures as well.
Wind-induced errors can attribute up to 80% error/loss at high wind speeds (Wolff et al., 2015; Buisán et al., 2017) leading to an under-catch of true solid precipitation during winter months. This high loss is attributed to the fall velocity and size of snowflakes that get diverted around precipitation gauges in high winds. Wolff et al. (2015)
investigated changes in catch ratio (using 10-min running means and 60-min values) under various temperature scenarios and showed that for air temperatures above 2°C, where precipitation is mainly falling as rain, the catch was not significantly influenced by wind (data incorporated in the study originated from winter data only). Nevertheless, Wolff et al. (2015) recommend no wind corrections for temperatures above 3°C until further studies on summer precipitation are available. The algorithm developed by Wolff et al. (2015) has been simplified and introduced in Kochendorfer et al. (2017a,b) and is applicable to 30-min values and therefore implementable in ICOS data processing procedures. That said, this correction is applicable to data recorded using -2°C as a filtering threshold for solid precipitation. Implementation of the Kochendorfer et al. corrections requires air temperature and wind speed measurements at orifice rim height. For sites without such measurements potential wind speed can be determined based on the log wind profiles (Thom, 1975). Such vertical profile estimations are site specific though (use of roughness length, displacement height, etc.) and require further evaluations at sites with existing wind profile measurements.
Snow depth readings are required to be done to an accuracy of 1 cm, as recommended by the WMO (2008) guidelines. Snow depth values extracted from digital camera images are inspected and compared to manual readings carried out as frequently as possible and in particular at manned stations. There, manual readings are done on a daily basis so corrections and possible post processing of images, conducted by the Ecosystem Thematic Centre (ETC), and their verification and improvement of the image processing algorithm is possible.
Final datasetData originated from the precipitation gauge measuring
rain and snowfall are submitted by the ecosystem stations to the ETC at the frequency rate they were collected with quality control, calculations and corrections applied by the ETC. Is an optical snow depth device used at the site, 30-min average snow depth values are submitted. Images taken at an interval of four hours starting at midnight are also submitted to the ETC. The final dataset is then deli- vered as 30-min averages/totals along with accumulated amount of precipitation by the ETC. In addition to the actu-al precipitation measurements metadata included in Table 2 are submitted to the ETC and updated accordingly.
Potential improvements in the futureSome national station networks apply to some of their
precipitation data products post-corrections for wind-induced undercatch and other systematic errors like evaporation from funnels of tipping gauges. However, little is known yet about required adaptations of such cor-rections to the measurement set-up mandatory in ICOS,
STANDARDIZED PRECIPITATION MEASUREMENTS WITHIN ICOS 613
which aims at minimizing the underlying errors. All types of precipitation gauges (catching and non-catching) suf-fer from accuracy issues. A tipping bucket might have a measurement accuracy of 2% but has the highest sam-pling error (timing, random tipping, and delayed reporting when heated in the winter). Optical (non-catching) devices have the lowest measurement accuracy regarding precipita-tion amount but require the least maintenance. Weighing gauges have high measurement accuracy (0.1%), perform well when shielded under both summer and winter con-ditions, and do not exhibit readings since they measure precipitation as it falls. It is clear that, in order to achieve data compatibility when using different precipitation gauge types and shielding during all weather conditions, cor-rections to the actual measurements are necessary. In all cases where precipitation measurements are adjusted in an attempt to reduce errors, it is necessary that both, the measured and adjusted values, be published as part of the metadata. For the future, it is recommended to use addi-tional measurements at ICOS ecosystem stations, such as e.g. lysimeters, to collect evidence for possible future parameterisations of such a correction. A brief overview of existing approaches is given in the following.
Wagner (2009) summarised corrections (wind, wetting and evaporation loss; operational errors, etc.) applicable to precipitation gauges for the Bavarian Forest adminis-tration, Germany. These methods are described in detail in Richter (1995); Sevruk (2004) and WMO (2008). The
Richter (1995) correction, which is used by the German Weather Service (DWD) not in general but for hydrome-teorology products, does not explicitly include wind speed as a predictor variable since the rain gauge network has a higher density than the weather station network, leav-ing many rain gauges without wind speed data. This might introduce uncertainty into the precision of daily time series when comparing e.g. windy to calm days, but the result-ing long-term sums would be less affected and led e.g. to a good catchment water budget closure in a case study at the ICOS Associated Candidate station Wüstebach (Graf et al., 2014). Typically, the Richter (1995) correction is applied to daily sums and consists of a single non-linear equation with two parameters that depend on precipitation type and site geometry:
Pcorr = Praw + b Prawє,
with: Pcorr the corrected daily precipitation sum (mm), Praw the measured daily precipitation sum, b and є correction parameters which depend on precipitation type and mean horizon elevation angle. Typical values for є and b range between 0.4 to 0.8 and 0.2 to 0.7, respectively. The larg-est corrections are applied for snow, such that it is also an option to correct only solid precipitation.
Applying transfer functions in order to correct under-catch of solid precipitation at sites where wind speed is not measured at orifice rim height require estimated velocity values from log wind profile measurements (together with site specific roughness length and zero plane displacement
Ta b l e 2. The following metadata should be provided in addition to the actual measurements
Metadata precipitation gauge Metadata snow depthInstrument model and serial number Instrument model and serial number (sonic sensor)Instrument specific calibration coefficients Instrument specific calibration coefficients (if applicable)Collection height above ground Measurement height (sonic sensor) above ground Location and distance of precipitation gauge from flux station Location and distance of sonic sensor from flux stationDate of calibration (twice a year) Date of sonic sensor calibration (if appl. twice a year)Date of instrument replacement (if applicable) Date of sonic sensor replacement (if applicable)Name of nearest WMO reference station Name of nearest WMO reference stationDistance to nearest WMO reference station Distance to nearest WMO reference stationCoordinates of nearest WMO reference station Coordinates of nearest WMO reference stationInstrument used at the nearest WMO reference station Instrument used at the nearest WMO reference stationCorrelation coefficient between in situ data and ref station Correlation coefficient between in situ data and ref stationWind shielding method Size of field of view of optical sensorLocation and surface wetness sensor model used Camera model and serial number (if applicable)
Image format (if applicable)Timestamp of images (UTC, local, etc.)Distance of snow stake from flux siteDistance of camera from snow stakeTime of day of manual measurement (if applicable)
S. DENGEL et al.614
height values). Such estimates introduce further uncertain-ties, that can be tested at sites where wind speed is measured simultaneously at different heights and representative for correction and wind profile evaluation.
ICOS is a network including a wide range of ecosys-tems with different climatic properties. It is suggested to carry out validation/synthesis studies including sites that have independent measurements of rain, e.g. optical instru-ments, lysimeter or catchment budget measurements.
Further significant precipitation measurementsThere are several measurements relevant to the hydro-
logical cycle and hydrological modelling, which are not required, but recommended within the ICOS portfolio. These are below-canopy precipitation in forests as well as fog and dew. There is no classification of below-canopy precipitation done by the WMO, nor is there a standardised method for such measurements yet. As the name throughfall suggests, its collection is proving to be very complex with a small-scale representation. Furthermore, a reliable collection system does require many collection points to deliver a representative estimation of the actual throughfall amount. Depending on vegetation type, density and time of year throughfall amount can be up to 100% of the bulk precipitation. The most commonly used measurement method involves manual precipitation gauges set out in a random distribution along the forest floor, which require tens of gauges to become representative (Hansen, 1996; Levia and Frost, 2003; Keim et al., 2005; Fruman et al., 2006). Other methods involve individual throughfall gutters connected to precipitation gauges and set up in such a way that the water is draining off centrally into a precipitation gauge. Gauge types span from simple home-made low-cost gutters and gauges to sophisticated stainless steel gutters and recording precipitation gauges (Fig. 1).
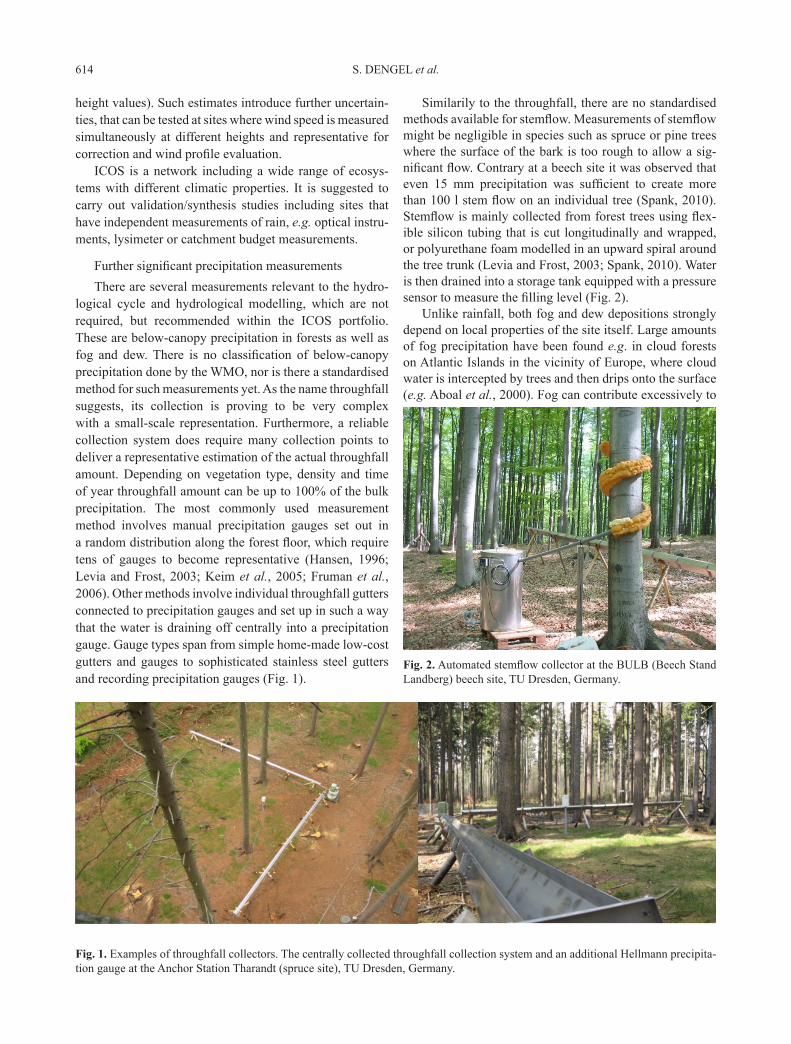
Similarily to the throughfall, there are no standardised methods available for stemflow. Measurements of stemflow might be negligible in species such as spruce or pine trees where the surface of the bark is too rough to allow a sig-nificant flow. Contrary at a beech site it was observed that even 15 mm precipitation was sufficient to create more than 100 l stem flow on an individual tree (Spank, 2010). Stemflow is mainly collected from forest trees using flex-ible silicon tubing that is cut longitudinally and wrapped, or polyurethane foam modelled in an upward spiral around the tree trunk (Levia and Frost, 2003; Spank, 2010). Water is then drained into a storage tank equipped with a pressure sensor to measure the filling level (Fig. 2).
Unlike rainfall, both fog and dew depositions strongly depend on local properties of the site itself. Large amounts of fog precipitation have been found e.g. in cloud forests on Atlantic Islands in the vicinity of Europe, where cloud water is intercepted by trees and then drips onto the surface (e.g. Aboal et al., 2000). Fog can contribute excessively to
Fig. 1. Examples of throughfall collectors. The centrally collected throughfall collection system and an additional Hellmann precipita-tion gauge at the Anchor Station Tharandt (spruce site), TU Dresden, Germany.
Fig. 2. Automated stemflow collector at the BULB (Beech Stand Landberg) beech site, TU Dresden, Germany.
STANDARDIZED PRECIPITATION MEASUREMENTS WITHIN ICOS 615
the water balance of an ecosystem and can be measured with various methods. According to the WMO (2010) the most widely used fog-measuring instrument consists of a vertical wire mesh cylinder which is centrally fixed on the top of a precipitation gauge in such a way that it is fully exposed to the free flow of the air.
The amount of dew depends on the physical properties of the collection surface, size, orientation and inclination. A theoretical upper limit is given by the heat removal enabled by nocturnal net radiation. This leads to values considerably below 1 mm per night, in good agreement with measured maxima around 0.5 mm (Monteith, 1963; Häckel, 1999; Graf et al., 2008). For the amount of dew, various automated weighing gauges/microlysimeters have been developed (e.g. Heusinkveld, 2006; Graf et al., 2008; Ucles et al., 2013; Price and Clark, 2014).
Regarding below canopy snow depth an alterna-tive method is the installation of an optical sensor along a motorised transect. Hereby an optical sensor drives along a transect below the canopy giving a rather detailed distri-bution of snow depth along the forest floor, a method that is more representative than a manual single point meas-urement. Further methods are laser scanners scanning the snow surface in several points and outputting an average of the respective snow depth. A forth method or option is the installation of several digital cameras and snow stakes.
CONCLUSIONS
1. Precipitation is one of the most important abiotic variables related to vegetation growth. Moreover, it is fun-damental to acquire reliable knowledge on all facets of the hydrological cycle. These measurements provide further a basis for climate classification as standardised meas-urements across Integrated Carbon Observation System ecosystem stations improve comparability and quality of the data.
2. It has been decided to implement weighing gauges, together with the classical Alter wind shield as the standard total precipitation gauge across ICOS ecosystem stations, while automatic snow depth measurements are mandatory at sites where regular prolonged snow cover occurs dur-ing winter months. Sites that rarely experience snowfall do manual measurements as long as there is snow on the ground.
3. Using the WMO standardisation, where possible, on how and where to measure provides means for analysing local and regional conditions in relation to climatological standards and nearby existing WMO-stations. Furthermore, following such standardized methods strengthens the com-patibility and comparability of data collected by the ICOS network with other standardised environmental observation networks in the world.
4. A standardisation across all ICOS ecosystem stations opens up the possibility for synthesis studies of diffe-rent precipitation measurement methodologies and types including a wide range of ecosystems and geolocations in Europe.
ACKNOWLEDGEMENTS
We acknowledge all active members of the ICOS ecosystem working groups and all other people who contributed to the development of the ICOS ecosys-tem domain and the measurement protocols. Funding for the lead author was provided through the AmeriFlux Management Project at Lawrence Berkeley Lab by the U.S. Department of Energy’s Office of Science under Contract No. DE-AC02-05CH11231.
Conflict of interest: The Authors declare no conflict of interest.
REFERENCES
Aboal J.R., Jiménez M.S., Morales D., and Gil P., 2000. Effects of thinning on throughfall in Canary Islands pine forest – the role of fog. J. Hydrology, 238, 218-230.
Alter J.C., 1937. Shielded storage precipitation gages. Monthly Weather Review, 65(7), 262-265.
Buisán S.T., Earle M.E., Collado J.L., Kochendorfer J., Alastrué J., Wolff M., ... López-Moreno J.I., 2017. Assessment of snowfall accumulation underestimation by tipping bucket gauges in the Spanish operational network. Atmospheric Measurement Techniques, 10(3), 1079.
Campbell Scientific, 2010. 237 Leaf Wetness Sensor. Instruction Manual.
Campbell Scientific, 2011. SR50A Sonic Ranging Sensor. Instruction Manual.
Colli M., 2014. Assessing the accuracy of precipitation gauges: a CFD approach to model wind induced errors (Ph.D. Thesis, Department of Civil, Chemical and Environmental Engineering, University of Genoa, Italy).
Decagon, 2016. LWS Dielectric Leaf Wetness Sensor. Instruction Manual.
Frumau K.F.A., Bruijnzeel L.A., and Tobon C., 2006. Hydrological measurement protocol for montane cloud for-est. Annex 2, Final Technical Report DFID-FRP Project R7991. Vrije Universiteit, Amsterdam, 105 pp.
Geonor A/S, 2016. Geonor T-200B – Series Precipitation Gauges. Instruction manual.
Graf A., Bogena H.R., Drüe C., Hardelauf H., Pütz T., Heinemann G., and Vereecken H., 2014. Spatiotemporal relations between water budget components and soil water content in a forested tributary catchment. Water Resources Research, 50, 4837-4857.
Graf A., Kuttler W., and Werner J., 2008. Mulching as a means of exploiting dew for arid agriculture? Atmospheric Research 87, 369-376.
Groisman P.Y., Peck E.L., et al., 1999. Intercomparison of Recording and Standard Nonrecording U.S. Gauges. J. Atmospheric and Oceanic Technology, 16(5): 602-609.
S. DENGEL et al.616
Hansen K., 1996. In-canopy throughfall measurements of ion fluxes in Norway spruce. Atmospheric Environment, 30(23), 4065-4076.
Häckel H., 1999. Meteorologie (in German). Ulmer, Stuttgart, 448, 132-133.
Heusinkveld B.G., Berkowicz S.M., Jacobs A.F.G., Holtslag A.A.M., and Hillen W.C.A.M., 2006. An automated microlysimeter to study dew formation and evaporation in arid and semiarid regions. J. Hydrometeorol., 7, 825-832.
Keim R.F., Skaugset A.E., et al., 2005. Temporal persistence of spatial patterns in throughfall. J. Hydrol., 314(1), 263-274.
Kochendorfer J., Nitu R., Wolff M., Mekis E., Rasmussen R., Baker B., ... Yang D., 2017a. Errors and adjustments for single-Alter shielded and unshielded weighing gauge pre-cipitation measurements from WMO-SPICE. Hydrol. Earth Syst. Sci. Discuss., http://dx. doi. org/10.5194/hess-2016-684, in review.
Kochendorfer J., Rasmussen R., Wolff M., Baker B., Hall M.E., Meyers T., ... Leeper R., 2017b. The quantification and correction of wind-induced precipitation measure- ment errors. Hydrol. Earth System Sci., 21(4), 1973-2017.
Lanza L.G., Vuerich E., and Gnecco I., 2010. Analysis of highly accurate rain intensity measurements from a field test site. Advances in Geosciences, 25, 37-44.
Lanzinger E., Theel M., and Windolph H., 2006. Rainfall amount and intensity measured by the Thies laser precipita-tion monitor. TECO-2006, Geneva, Switzerland, 4-6.
Leeper R.D. and Kochendorfer J., 2015. Evaporation from weighing precipitation gauges: impacts on automated gauge measurements and quality assurance methods. Atmospheric Measurement Techniques, 8(6), 2291-2300.
Levia D.F. and Frost E.E., 2003. A review and evaluation of stemflow literature in the hydrologic and biogeochemical cycles of forested and agricultural ecosystems. J. Hydrol., 274(1), 1-29.
Levia D.F., Keim R.F., et al., 2011. Throughfall and stemflow in wooded ecosystems. Forest Hydrol. Biogeochem., Ecol. Studies, 216, 425-443.
Liu X.C., Gao T.C., and Liu L., 2013. A comparison of rainfall measurements from multiple instruments. Atmospheric Measurement Techniques, 6(7), 1585.
Monteith J.L., 1963. Dew: facts and fallacies. In: The water rela-tions of plants (Eds A.J. Rutter, F.H. Whitehead). Blackwell, London, UK.
Nitu R. and Wong K., 2010. CIMO survey on national summa-ries of methods and instruments for solid precipitation measurement at automatic weather stations. WMO Instruments and Observing Methods Rep. 102, WMO/TD-1544, 57 pp.
NovaLynx Cooperation, 2015. 260-700 Ultrasonic Snow Depth Sensor. User manual.
OTT Hydromet, 2014. Precipitation Gauge OTT Pluvio2. Operating instructions.
Price J.D. and Clark R., 2014. On the measurement of dewfall and fog-droplet deposition. Boundary-Layer Meteorology, 152, 367-393.
Rasmussen R., Baker B., et al., 2012. How well are we measu-ring snow: The NOAA/FAA/NCAR winter precipitation test bed. Bulletin of the American Meteorological Society, 93(6), 811-829.
Reverdin A., Earle M., van den Heuvel F., Gaydos A., and Wolff M.A., 2016. Description of the Quality Control and Event Selection Procedures used within the WMO-SPICE project. Madrid, Spain, September.
Rha D-K., In H-J., Choi E-J., Kim H-L., Lee J-E., and Lee G-W., 2014. WMO Solid Precipitation Intercomparison Experiment (SPICE): Overview and results of Gochang site, WMO, IOM No. 116, TECO-2014
Richter D., 1995. Ergebnisse methodischer Untersuchungen zur Korrektur des systematischen Messfehlers des Hellmann-Niederschlagmessers. In: Berichte des Deutschen Wetter- dienstes, Offenbach am Main, Germany.
Sevruk B., 1974a. Correction for the wetting loss of a Hellmann precipitation gauge. Hydrological Sciences Bulletin, 19(4), 549-559.
Sevruk B., 1974b. Evaporation losses from containers of Hell- mann precipitation gauges. Hydrological Sciences Bulletin, 19(2), 231-236.
Sevruk B., 2004. Precipitation as the water cycle element. Theory and practice of precipitation measurement (in German). Institute for Atmosphere and Climate, ETH Zurich, Zurich- Nitra.
Sevruk B. and Chvíla B., 2005. Error sources of precipitation measurements using electronic weight systems. Atmosphe- ric Research, 77(1-4), 39-47.
Sevruk B. and Nespor V., 1994. The effect of dimensions and shape of precipitation gauges on the wind-induced error. In: Global precipitations and climate change. Springer, Berlin, Heidelberg.
Sevruk B. and Nespor V., 1998. Empirical and theoretical assess-ment of the wind induced error of rain measurement. Water Science and Technology, 37(11), 171-178.
Sevruk B., Ondrás M., et al., 2009. The WMO precipitation measurement intercomparisons. Atmospheric Research, 92(3), 376-380.
SKYE Instruments Ltd., 2007. Surface wetness sensor (User manual).
Sommer Messtechnik, 2015. USH-8 – Ultrasonic Snow Depth Sensor. User manual.
Spank U., 2010. Site Water Budget: Influences of Measurement Uncertainties on Measurement Results and Model Results. Ph.D. Thesis, TU Dresden, http://nbn-resolving.de/urn: nbn:de:bsz:14-qucosa-62557.
Thom A.S., 1975. Momentum, mass and heat exchange of plant communities. Vegetation and the Atmosphere, 57-109.
Ucles O., Villagarcia L., Canton Y., and Domingo F., 2013. Microlysimeter station for long term non-rainfall water input and evaporation studies. Agricultural and Forest Meteorology, 182, 13-20.
Vuerich E., Monesi C., Lanza L., Stagi L., and Lanzinger E., 2009. WMO field intercomparison of rainfall intensity gauges. Instruments and Observing Methods, WMO/TD No. 1504. World Meteorological Organization, WMO Geneva.
Wagner A., 2009. Literature study on the correction of precipita-tion measurements. FutMon C1-Met-29 (BY), Bavarian State Institute of Forestry, Freising, Germany.
Wolff M., Isaksen K., Brækkan R., Alfnes E., Petersen-Øverleir A., and Ruud E., 2013. Measurements of wind-induced loss of solid precipitation: description of a Norwegian field study. Hydrology Res., Feb 2013, 44(1) 35-43.

STANDARDIZED PRECIPITATION MEASUREMENTS WITHIN ICOS 617
Wolff M.A., Isaksen K., Petersen-Øverleir A., Ødemark K., Reitan T., and Brækkan R., 2015. Derivation of a new continuous adjustment function for correcting wind-induced loss of solid precipitation: results of a Norwegian field study. Hydrology Earth System Sci., 19(2), 951-967.
World Meteorological Organization, 1984. International Com- parison of National Precipitation Gauges with a Reference Pit Gauge (Eds B. Sevruk, W.R. Hamon). Instruments and Observing Methods Report No. 17, WMO/ TD-No. 38, Geneva.
World Meteorological Organization, 1989. Catalogue of National Standard Precipitation Gauges (B. Sevruk and S. Klemm). Instruments and Observing Methods Report No. 39, WMO/ TD-No. 313, Geneva.
World Meteorological Organization, 1992. International Meteo- rological Vocabulary. Geneva. ISBN 978-92-630-2182-3.
World Meteorological Organization, 1998. Solid Precipitation Measurement Intercomparison (1998, WMO/TD-No. 872, IOM No. 67, by B.E. Goodison, P.Y.T. Louie and D. Yang).
World Meteorological Organization, 2008. Guide to Hydrological Practices. WMO-No. 168, Vol. 1, Geneva.
World Meteorological Organization, 2010. Guide to Meteoro- logical Instruments and Methods of Observation. WMO-No. 8, Chapter 6, Geneva.
World Meteorological Organization (WMO-SPICE), 2012. Specifications for the WMO-SPICE Single Alter Shield Configuration.