supercapacitors based on carbons with tuned porosity derived from paper pulp mill sludge biowaste
TRANSCRIPT

C A R B O N 5 7 ( 2 0 1 3 ) 3 1 7 – 3 2 8
.sc ienced i rec t .com
Avai lab le a t wwwjournal homepage: www.elsevier .com/ locate /carbon
Supercapacitors based on carbons with tuned porosity derivedfrom paper pulp mill sludge biowaste
Huanlei Wang a,b, Zhi Li a,b,*, Jin Kwon Tak c, Chris M.B. Holt a,b, Xuehai Tan a,b,Zhanwei Xu a,b, Babak Shalchi Amirkhiz a,b, Don Harfield c, Anthony Anyia c,Tyler Stephenson a,b, David Mitlin a,b,*
a Chemical and Materials Engineering, University of Alberta, 9107 – 116 Street Edmonton, Alberta, Canada T6G 2V4b National Institute for Nanotechnology (NINT), National Research Council of Canada, 11421 Saskatchewan Drive,
Edmonton, Alberta, Canada T6G 2M9c Bioresource Technologies, Alberta Innovates – Technology Futures, P.O. Bag 4000, Vegreville, Alberta, Canada T9C 1T4
A R T I C L E I N F O
Article history:
Received 21 August 2012
Accepted 28 January 2013
Available online 8 February 2013
0008-6223/$ - see front matter � 2013 Elsevihttp://dx.doi.org/10.1016/j.carbon.2013.01.079
* Corresponding authors.E-mail addresses: [email protected] (Z.
A B S T R A C T
Hydrothermal carbonization followed by chemical activation is utilized to convert paper
pulp mill sludge biowaste into high surface area (up to 2980 m2 g�1) carbons. This synthesis
process employs an otherwise unusable byproduct of paper manufacturing that is gener-
ated in thousands of tons per year. The textural properties of the carbons are tunable by
the activation process, yielding controlled levels of micro and mesoporosity. The electro-
chemical results for the optimized carbon are very promising. An organic electrolyte yields
a maximum capacitance of 166 F g�1, and a Ragone curve with 30 W h kg�1 at 57 W kg�1 and
20 W h kg�1 at 5450 W kg�1. Two ionic liquid electrolytes result in maximum capacitances
of 180–190 F g�1 with up to 62% retention between 2 and 200 mV s�1. The ionic liquids
yielded energy density–power density combinations of 51 W h kg�1 at 375 W kg�1 and 26–
31 W h kg�1 at 6760–7000 W kg�1. After 5000 plus charge–discharge cycles the capacitance
retention is as high at 91%. The scan rate dependence of the surface area normalized
capacitance highlights the rich interplay of the electrolyte ions with pores of various sizes.
� 2013 Elsevier Ltd. All rights reserved.
1. Introduction
Electrochemical capacitors or supercapacitors are currently
targeted as possible auxiliary energy storage devices to be
used along with rechargeable batteries or fuel cells to allow
for short duration high power service. The advantages of sup-
ercapacitors include their ability to operate in a wide temper-
ature range, their long cycle-life, and the ability to deliver high
power densities [1,2]. Porous carbon materials are considered
as excellent electrode materials for electric double-layer
capacitors due to their high surface area, controllable pore
structure, excellent thermal and chemical stability, and low
cost [3]. Multiple factors affect the performance of carbon-
er Ltd. All rights reservedLi), [email protected] (
based supercapacitors, and the more important ones are the
surface chemistry and intrinsic pore characteristics [4–6]. In
2006, Gogotsi’s group and Beguin’s group have reported signif-
icantly increased specific capacitance in micropores [4,7],
which challenged the traditional theory, and demonstrated
that desolvated ions can form a monolayer or wire inside
slit-shaped or cylindrical micropores of carbon [8]. In addition
to micropores, mesopores are necessary for rapid ion trans-
port. This is the reason for the high capacitance retention at
high scan rate for ordered mesoporous carbons, 3D hierarchi-
cally porous carbons, carbon onions, CNTand graphene [9–11].
Several methods have been developed for controlling the
pore structure in carbon materials. For example, templated
.D. Mitlin).

318 C A R B O N 5 7 ( 2 0 1 3 ) 3 1 7 – 3 2 8
carbonization was utilized to prepare carbons with an or-
dered microporous structure, exhibiting excellent specific
capacitances and rate capability [12]. Another promising
way to produce carbon materials with controlled pore struc-
ture is the carbide-derived carbon (CDC) technique [4]. Recent
notable performance improvements have been achieved by
tuning the pore size distribution in CDCs [2,4]. However, the
surface areas and micropore volumes of CDCs are lower than
those of zeolite-templated carbons. In the last several years,
the traditional activation process has been revived in order
to tune the pore distributions in carbons [13,14]. Physical
and chemical activation are well-developed industrial meth-
ods that can produce carbons in large quantity and low cost.
Carbon materials can also be synthesized by hydrothermal
carbonization (HTC). The HTC processes are considered low-
energy due to their intrinsically low synthesis temperatures
(150–350 �C). Antonietti’s group has done extensive work on
the HTC process. Widely available precursors can be con-
verted into nanostructured carbon materials in a few environ-
mentally friendly steps [15]. The resulting carbons exhibited
high capacitances and good rate capability [16]. More recently,
carbon materials prepared from biowaste, such as seaweed
and eggshell membrane, have been recently employed for
supercapacitor applications [17,18].
The paper industry generates ‘‘Pulp Sludge’’ as a ubiqui-
tous solid byproduct of the manufacturing process. In 2012
a liquid byproduct of paper manufacturing, termed brown li-
quor, was successfully converted into promising cathode
material [19]. In North America alone thousands of tons of
pulp sludge waste are annually generated from paper pulp
mills. Currently there are no economical uses of this waste
material, though researchers are attempting to utilize it as
an agricultural soil enhancement additive [20]. Pulp sludge
is currently disposed of through incineration or placed into
landfills. The sludge releases CO2 into the atmosphere as
it either burns or decomposes. The scale of its availability
and negative cost make pulp sludge a very attractive feed-
stock for high surface area carbons. In the present work
we employ an environmentally friendly process of hydro-
thermal carbonization followed by chemical activation to
convert this otherwise unusable green house gas emitting
biowaste into a value added pulp sludge derived activated
carbon (PSDAC).
To ascertain the potential of these materials for superca-
pacitor applications, we assembled and tested commercial-
type 2032 battery button cells with opposing electrodes. Three
different electrolytes were employed: a popular organic elec-
trolyte (1.5 M tetraethylammonium tetrafluoroborate solution
in acetonitrile, TEABF4/AN) and two emerging ionic liquids (1-
ethyl-3-methylimidazolium bis(trifluoromethylsulfony)imide
(EMIM TFSI) and 1-butyl-1-methylpyrrolidinium bis(trifluo-
romethylsulfony)imide (BMPY TFSI)). We examine the three-
way interrelation between the pore size distributions, the
dimensions of the electrolyte ions, and the capacitances of
the electrodes, both on a gravimetric and a surface area nor-
malized basis. A rich interplay is demonstrated, with narrow
micropores having a key role in obtaining anomalously high
surface area normalized capacitance at low scan rates, and
pores larger than 1.2 nm (in organic electrolyte) and 2 nm
(in ionic liquid) being essential for achieving high power.
2. Experimental
2.1. Synthesis of hydrothermal carbon
The HTC process was carried out in a pressure reactor (1L,
Parr Instrument Company, Moline, Illinois, USA). Nitrogen
gas was supplied to the pressure reactor from a gas cylinder.
A PID controller was used to regulate the set temperature
within 1 �C accuracy. The pulp sludge (wet basis, 143.1 g,
60.22% water content) was dispersed in 266 mL distilled water
containing H2SO4 (0.6 g), and Fe2O3 (1.2 g). The mixture was
then loaded into the pressure reactor. The reaction parame-
ters were: pressure: 8.2 MPa, temperature: 225 �C, and reac-
tion time: 8 h. At the end of the reaction time, the pressure
reactor was cooled down to room temperature. KOH was
added to the HTC product to adjust the pH to 7 before the sep-
aration of the HTC-solids and HTC-liquids. The HTC-solids
were filtered and dried in an oven at 105 �C for 12 h.
2.2. Activation of HTC carbon
The hydrothermal carbon was chemically activated by heat-
ing a KOH–HTC mixture (weight ratio 1:1 or 3:1) under a nitro-
gen atmosphere in the temperature range of 700–800 �C. The
heating rate used was 3 �C min�1 with a ‘‘soak time’’ of 1 h
at the target temperature. After the activation process, the
mixture was recovered and washed several times with 2 M
HCl to remove any inorganic salts and then washed with suf-
ficient deionized water. The sample was then dried at 100 �Cin ambient overnight, followed by thermal annealing at
800 �C under argon for 1 h.
2.3. Material characterization
Scanning electron microscopy (SEM) analysis was performed
using a Hitachi S-4800 instrument. Transmission electron
microscopy (TEM) analysis was performed using a JEOL JEM-
2010, with an accelerating voltage of 200 kV. X-ray photoelec-
tron spectroscopy (XPS) measurements were performed using
an Axis Ultra spectrometer. The Raman spectra were recorded
with a confocal microprobe Raman system (Thermo Nicolet
Almega XR Raman Microscope). Nitrogen adsorption–
desorption isotherms and the textural properties of the car-
bons were determined with a Quantachrome Autosorb-1 at
77 K. Prior to the gas sorption measurements, the samples
were outgassed at 200 �C for 4 h under vacuum. The pore size
distributions were evaluated by a non-local density functional
theory (DFT) method using nitrogen adsorption data and
assuming slit-pore geometry. The weighted mean micropore
size (Dmean) was calculated from [21]:
Dmean ¼Pn
i¼1dimiPn
i¼1mið1Þ
where d and v are pore width and volume, respectively.
2.4. Electrochemical evaluation
Carbon electrodes were prepared by mixing 80 wt.% activated
carbon material, 10 wt.% carbon black, and 10 wt.%
poly(vinylidenedifluoride), using N-methyl pyrrolidone to

C A R B O N 5 7 ( 2 0 1 3 ) 3 1 7 – 3 2 8 319
form a slurry. The resulting composite was rolled onto Al foil.
After drying at 100 �C overnight, circular discs (�1.5 cm diam-
eter) were then punched out from the films. Stainless-steel
coin cells (2032 type) with two symmetrical carbon electrodes
separated by a porous polymeric separator were assembled
inside an Ar-filled glove box (<0.1 ppm of both oxygen and
H2O). Each electrode had a mass loading of �2.5 mg cm�2
after drying. The electrode thickness is in the range of 60–
100 lm.
Cyclic voltammetry (CV) curves were measured using a
Solartron 1470E Multichannel Potentiostat/Cell Test System
in the voltage range of 0–2.3/3 V and at scan rates from 2 to
200 mV s�1. The gravimetric capacitance, Cc (F g�1) was calcu-
lated according to
Cc ¼2ilm
ð2Þ
where i is the current (A), l is the scan rate (V s�1), and m is
the mass (g) of active material in each electrode.
Galvanostatic charge–discharge tests were also performed
using current densities between 0.1 and 10 A g�1. The gravi-
metric capacitance, Cg (F g�1), was calculated according to
Cg ¼2I
ðdV=dtÞm ð3Þ
where I is the current (A), dV/dt is the slope of the discharge
curve after the ohmic drop (V s�1), and m is the mass (g) of ac-
tive material in each electrode.
Electrochemical impedance spectroscopy measurements
were carried out using a VersaSTAT 3 potentiostat (Princeton
Applied Research, USA) in the frequency range from 1 MHz to
1 mHz at open circuit with a 5 mV ac amplitude. The capaci-
tance C(x) based on impedance measurements was calcu-
lated from
CðxÞ ¼ �ðZ00ðxÞ þ jZ0ðxÞÞxjZðxÞj2
ð4Þ
Z0ðxÞ2 þ Z00ðxÞ2 ¼ jZðxÞj2 ð5Þ
where x is the angular frequency, Z 0(x) and Z00(x) are the real
part and the imaginary part of the impedance, and |Z(x)|2 is
the modulus of the impedance Z 0(x) and Z00(x). Detailed infor-
mation can be found in reference [22]. The capacitance C(x)
can be defined as
CðxÞ ¼ C0ðxÞ � jC00ðxÞ ð6Þ
where C 0(x) is the real part of capacitance, C00(x) is the imagi-
nary part of capacitance. Then, the real part of capacitance,
C 0(x) (F), was calculated according to [22,23]
C0ðxÞ ¼ �Z00ðxÞxjZðxÞj2
ð7Þ
3. Results and discussion
3.1. Physicochemical characterization
After the pulp sludge was hydrothermally carbonized, it was
chemically activated. During chemical activation, the reaction
between KOH and the carbonaceous material is mainly de-
scribed as follows [24]:
6KOHþ 2C$ 2Kþ 3H2 þ 2K2CO3 ð8Þ
When the activation temperature is higher than 700 �C, the
decomposition of K2CO3 will contribute to additional physical
activation through site-specific gasification [25]. As can be
seen from Table 1, the HTC derived carbon utilized in this
study contains significant levels of oxygen (23.24 at.%). The
high oxygen functionalization and low degree of condensa-
tion makes hydrothermally synthesized carbons quite reac-
tive for KOH activation [26]. The pulp sludge derived
activated carbons thus synthesized were labeled as PSDAC-
T-n, where T is the activation temperature and n is the KOH/
HTC weight ratio. For comparison, a commercial activated
carbon (Norit) labeled as CAC was also analyzed.
Figs. 1a, b, c and S1 (in Supplementary material) show the
SEM images of the as-prepared activated carbons. Regardless
of the preparation conditions, the resulting activated carbon
particles were �1–40 lm in dimensions. When the mass ratio
of KOH/HTC is 1, the PSDAC materials consisted of vesicu-
lated particles. However, sample PSDAC-800–3, activated with
a high mass ratio of KOH/HTC, exhibited irregular shaped par-
ticles with sharp corners. High-resolution TEM micrograph of
PSDAC-800–3 revealed a predominantly disordered structure,
with contrast typical of highly micro and mesoporous materi-
als (Fig. 1d). Raman spectra of the activated carbons and of
the CAC are shown in Fig. S2 (in Supplementary material).
The D-band originating from the disordered and defective
portions of the carbon was at �1340 cm�1, while the G-band
originating from the graphitic portions of the carbon was at
�1590 cm�1. The integrated intensities of D and G bands (ID/
IG) are 1.80, 1.60 and 1.90 for PSDAC-700–1, PSDAC-800–1 and
PSDAC-800–3. Such ratios are typical for porous carbon with
high degree of structural disorder [27], confirming the TEM
results.
The surface chemical groups of the activated carbons were
characterized using XPS. As revealed in Table 1, an increase in
the activation temperature and in the KOH/HTC mass ratio
promoted higher surface oxygen content. This increase is as-
cribed to the KOH activation process, which introduces oxy-
gen-containing groups onto the carbon surfaces [28].
Although there are nitrogen functional groups in PSDAC-
700-1 and PSDAC-800-1, the content of nitrogen is miniscule
(<0.6 at.%). There is no detectable nitrogen in sample
PSDAC-800-3. This is due to the different gasification mecha-
nisms of carbon versus that of nitrogen, with the nitrogen
being gasified at higher activation temperatures and with
higher KOH/HTC mass ratios [29].
The nitrogen adsorption–desorption isotherms are shown
in Fig. 2a. All the adsorption curves contain a region of a well-
defined plateau (type I isotherm) indicating significant levels
of microporosity. The broadening of the knee in the low-pres-
sure range is attributable to mesoporosity, with PSDAC-700-1
containing the least and PSDAC-800-3 containing the most
mesopores. The pore size distributions are shown in Fig. 2b.
It is known that the existing DFT approach generates an arti-
ficial valley in the pore size distribution at around 0.9 nm [12].
The plots indicate that the porosity of the PSDAC-700-1 and
PSDAC-800-1 samples mostly consist of narrow micropores
(<1 nm) and wider micropores (1–2 nm). The PSDAC-700-1
specimen contains negligible levels of mesoporosity. The

Fig. 1 – (a) SEM micrograph of PSDAC-700-1 specimen. (b) SEM micrograph of PSDAC-800-1 specimen. (c) SEM micrograph of
PSDAC-800-3 specimen. (d) TEM micrograph with a high resolution insert of PSDAC-800-3.
1 2 3 4 50.00
0.03
0.06
0.09
0.12
0.15
Mesopores
Incr
emen
tal P
ore
Volu
me
(cm
3 g-1)
Pore Size (nm)
PSDAC-700-1 PSDAC-800-1 PSDAC-800-3CAC
Micropores
b
0.0 0.2 0.4 0.6 0.8 1.00
200
400
600
800
1000
1200a
Qua
ntity
Ads
orbe
d (c
m3 g
-1)
Relative Pressure (P/Po)
PSDAC-700-1 PSDAC-800-1 PSDAC-800-3 CAC
Fig. 2 – (a) Nitrogen adsorption–desorption isotherms of the activated carbons (solid: adsorption; hollow: desorption). (b)
Associated density functional theory pore size distributions.
Table 1 – Porosity parameters and element distribution obtained from nitrogen sorption isotherms and the XPS analysis.
Samples SBET (m2 g�1)a Vt (cm3 g�1)b Vmicro (cm3 g�1)c Vmicro/Vt Dmean (nm) CXPS (at.%) NXPS (at.%) OXPS (at.%)
HTC – – – – – 76.01 0.75 23.24PSDAC-700-1 1470 0.84 0.57 0.68 0.94 98.37 0.57 1.06PSDAC-800-1 2340 1.30 0.86 0.66 0.99 98.49 0.31 1.20PSDAC-800-3 2980 1.75 0.66 0.38 1.16 97.22 �0 2.78CAC 2050 1.17 0.65 0.55 1.14 95.35 �0 4.65
a Surface area was calculated with Brunauer–Emmett–Teller method, using a pressure range between 0.05 and 0.20.b The total pore volume was determined from the amount of nitrogen adsorbed at a relative pressure of 0.98.c The volume of micropores was obtained by the t-plot analysis.
320 C A R B O N 5 7 ( 2 0 1 3 ) 3 1 7 – 3 2 8
PSDAC-800-1 specimen contains minor levels of porosity in
the range of 2–3 nm. The PSDAC-800-3 specimen consists of
wider pores distributed in two well-defined pore systems:
micropores and small mesopores (2–4 nm).
The porosity characteristics of the PSDAC and CAC sam-
ples are listed in Table 1. It can be seen that the surface area
and pore volume increase with higher activation tempera-
tures and KOH/HTC mass ratios. The trend is from
1470 m2 g�1/0.84 cm3 g�1 for PSDAC-700-1, to 2340 m2 g�1/
1.30 cm3 g�1 for PSDAC-800-1, and 2980 m2 g�1/1.75 cm3 g�1
for PSDAC-800-3. Moreover, the mean micropore size also in-
creases with higher activation temperatures and KOH/HTC

C A R B O N 5 7 ( 2 0 1 3 ) 3 1 7 – 3 2 8 321
mass ratios. The mean diameter slightly increases from
0.94 nm for PSDAC-700-1, to 0.99 nm for PSDAC-800-1, and
1.16 nm for PSDAC-800-3. Importantly the fraction of mesop-
ores in the PSDAC-800-3 specimen is significantly higher than
in the others. Although CAC has a similar pore size distribu-
tion to PSDAC-800-3, its surface area and pore volume are sig-
nificantly lower. The surface area and pore volume of PSDAC-
800-3 is higher than what has been previously reported for
activated hydrothermal carbons and for carbons derived from
biowastes [16,18,26]. In fact the surface area of PSDAC-800-3
exceeds the theoretical surface area of graphene
(2630 m2 g�1). This can be attributed to the combination of
its highly defective structure with a large fraction of the car-
bon being amorphous and hence less densely arranged than
graphene, and the very high content of micro and
mesoporosity.
3.2. Capacitance, energy and power in organic electrolyte
The electrochemical performance of the activated carbon
materials was evaluated at room temperature in TEABF4/AN,
which is widely used in the commercial supercapacitors.
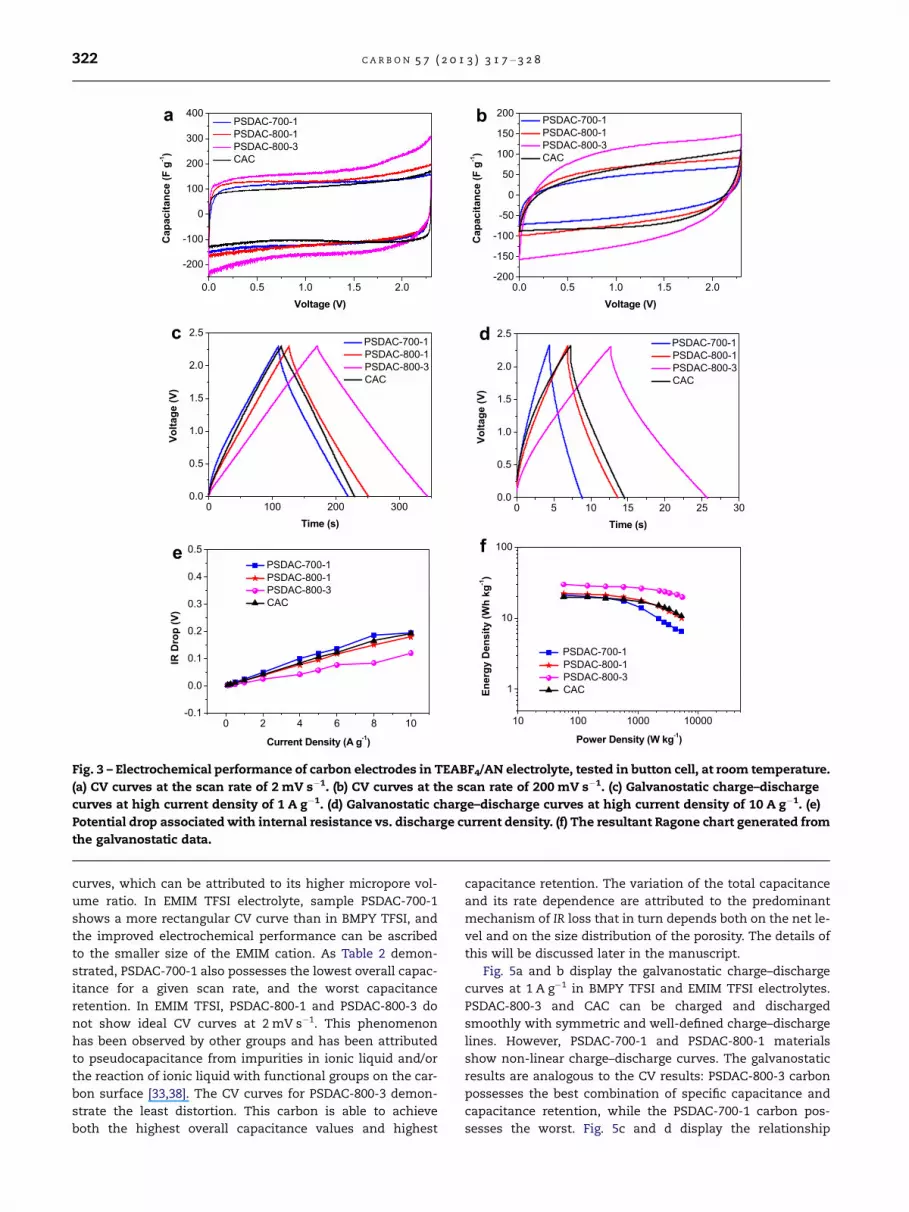
Fig. 3a and b exhibit the CV curves at 2 and 200 mV s�1. In this
voltage range all the samples demonstrate fairly rectangular
CV curves. Fig. 3c and d display the charge–discharge curves
of the activated carbons at a high current density of 1 and
10 A g�1. The curves are nearly symmetric with only a minor
voltage drop during discharge. The specific capacitance and
capacity retention of the activated carbons measured by both
cyclic voltammetry and charge–discharge techniques are
listed in Table 2. The reported capacitance is the typical aver-
aged value of three measurements. PSDAC-800-3, the sample
with highest surface area, demonstrates the highest capaci-
tance of 162.2 F g�1 at 0.1 A g�1. And the highest total and rel-
ative amount of mesoporosity of PSDAC-800-3 is beneficial for
increasing its accessible surface area. This value exceeds the
measured capacitance of commercial CAC by approximately
50%. The capacitance retention for PSDAC-800-3 is also quite
promising with the sample retaining 74% of its capacity over a
100 times increase in the current density (0.1–10 A g�1). The
capacitance values obtained here are compared with other
carbon materials reported in literature (Table S1 in Supple-
mentary material).
The high specific capacitance coupled with excellent
capacity retention of PSDAC-800-3 is comparable or even
superior to that of ordered/templated carbons that would nat-
urally be more expensive to synthesize in large quantities,
including zeolite-templated carbons; templated-carbide de-
rived carbons; 3D ordered macroporous carbon [12,30–32].
PSDAC-800-3 specimen also displays comparable perfor-
mance to metal–organic framework derived carbon, activated
graphene, carbide derived carbons, SWCNT, and chemically
modified graphene [4,14,33–35]. Recently, activated hydrother-
mal carbons prepared using cellulose, starch and wood saw-
dust precursors were reported to exhibit very high
capacitance values (145–235 F g�1) at low scan rates (1 mV s�1)
[23]. Compared with activated hydrothermal carbons, the
lower specific capacitance of PSDAC-800-3 at similarly slow
scan rates (2 mV s�1) may be ascribed to its lower content of
suitably sized micropores (the pore size – ion size interactions
leading to an optimum surface area normalized capacitance
will be discussed in Section 3.5) due to their similar surface
areas. However, PSDAC-800-3 demonstrates better capaci-
tance retention, and hence exhibits a comparable specific
capacitance at the higher scan rate of 200 mV s�1. This is
attributable to the higher total content of mesoporosity in
PSDAC-800-3, which facilitates fast ion diffusion kinetics.
Fig. 3e displays the relationship between the potential
drop and current density for the carbon electrodes. From
the linear fit of IR drop values, we can obtain the equation of
IR ¼ aþ bI ð9Þ
where a represents the difference between the 2.3 V applied
potential and the charged potential of the capacitor, b repre-
sents double the value of the internal resistance Rs, and I is
the discharge current density [34]. The behavior of the CAC,
PSDAC-700-1 and PSDAC-800-1 samples is similar in magni-
tude. However the PSDAC-800-3 specimen demonstrates not
only lower resistive loses at each current density, but weaker
current density dependence. The PSDAC-800-3 (IR
[V] = 0.000101 + 0.01161I) possesses the least internal resis-
tance, with the other specimens having the following behav-
ior: PSDAC-700-1 (IR [V] = 0.0061 + 0.02090I), PSDAC-800-1 (IR
[V] = 0.002 + 0.01835I) and CAC (IR [V] = 0.00198 + 0.01988I).
The maximum power density (Pmax) can be calculated using
the equation [34]
Pmax ¼V2
max
4Rs¼ ð2:3� aÞ2
2bð10Þ
The obtained maximum power density of PSDAC-800-3 is
228 kW kg�1 in organic electrolyte, which is much higher than
that of PSDAC-700-1 (126 kW kg�1), PSDAC-800-1
(144 kW kg�1) and CAC (133 kW kg�1).
The Ragone plot presented in Fig. 3f demonstrates that
PSDAC-800-3 exhibited the highest energy density of the car-
bons, being approximately 30 W h kg�1. It also exhibited the
best energy density retention with increasing current density.
This sample’s energy density–power density curve was the
flattest, with 30 W h kg�1 at 57 W kg�1 and 20 W h kg�1 at
5450 W kg�1. A power density of 5450 W kg�1 corresponds to
the coin cell being tested at a current density of 10 A g�1.
The optimum combination of energy and power density for
PSDAC-800-3 is related to its high capacitance and low IR drop
at very high current.
3.3. Capacitance, energy and power in ionic liquid
To further increase the operation potential window, electro-
chemical performance of carbons was also tested in two typ-
ical ionic liquids (EMIM TFSI and BMPY TFSI) at 60 �C. The two
ionic liquids have the same anion, with the maximum dimen-
sion being 0.79 nm [36]. The maximum dimension of the cat-
ion in EMIM TFSI and BMPY TFSI is 0.76 and 1.1 nm,
respectively [36,37]. The electrochemical performance of the
carbons was evaluated using cyclic voltammetry, at scan rates
ranging from 2 to 200 mV s�1.
Fig. 4 shows the lowest and the highest scan rate data. Ta-
ble 2 provides the associated values of capacitance and capac-
itance retention. Specimen PSDAC-700-1 demonstrates the
worst distortion in what would be ideally rectangular CV
0 5 10 15 20 25 300.0
0.5
1.0
1.5
2.0
2.5
Volta
ge (V
)
Time (s)
PSDAC-700-1 PSDAC-800-1 PSDAC-800-3 CAC
d
0.0 0.5 1.0 1.5 2.0
-200
-100
0
100
200
300
400
Cap
acita
nce
(F g
-1)
Voltage (V)
PSDAC-700-1 PSDAC-800-1 PSDAC-800-3 CAC
a
0.0 0.5 1.0 1.5 2.0-200
-150
-100
-50
0
50
100
150
200
Cap
acita
nce
(F g
-1)
Voltage (V)
PSDAC-700-1 PSDAC-800-1 PSDAC-800-3 CAC
b
0 100 200 3000.0
0.5
1.0
1.5
2.0
2.5
Volta
ge (V
)
Time (s)
PSDAC-700-1 PSDAC-800-1 PSDAC-800-3 CAC
c
0 2 4 6 8 10-0.1
0.0
0.1
0.2
0.3
0.4
0.5
IR D
rop
(V)
Current Density (A g-1)
PSDAC-700-1 PSDAC-800-1 PSDAC-800-3 CAC
e
10 100 1000 10000
1
10
100
Ener
gy D
ensi
ty (W
h kg
-1)
Power Density (W kg-1)
PSDAC-700-1 PSDAC-800-1 PSDAC-800-3 CAC
f
Fig. 3 – Electrochemical performance of carbon electrodes in TEABF4/AN electrolyte, tested in button cell, at room temperature.
(a) CV curves at the scan rate of 2 mV s�1. (b) CV curves at the scan rate of 200 mV s�1. (c) Galvanostatic charge–discharge
curves at high current density of 1 A g�1. (d) Galvanostatic charge–discharge curves at high current density of 10 A g�1. (e)
Potential drop associated with internal resistance vs. discharge current density. (f) The resultant Ragone chart generated from
the galvanostatic data.
322 C A R B O N 5 7 ( 2 0 1 3 ) 3 1 7 – 3 2 8
curves, which can be attributed to its higher micropore vol-
ume ratio. In EMIM TFSI electrolyte, sample PSDAC-700-1
shows a more rectangular CV curve than in BMPY TFSI, and
the improved electrochemical performance can be ascribed
to the smaller size of the EMIM cation. As Table 2 demon-
strated, PSDAC-700-1 also possesses the lowest overall capac-
itance for a given scan rate, and the worst capacitance
retention. In EMIM TFSI, PSDAC-800-1 and PSDAC-800-3 do
not show ideal CV curves at 2 mV s�1. This phenomenon
has been observed by other groups and has been attributed
to pseudocapacitance from impurities in ionic liquid and/or
the reaction of ionic liquid with functional groups on the car-
bon surface [33,38]. The CV curves for PSDAC-800-3 demon-
strate the least distortion. This carbon is able to achieve
both the highest overall capacitance values and highest
capacitance retention. The variation of the total capacitance
and its rate dependence are attributed to the predominant
mechanism of IR loss that in turn depends both on the net le-
vel and on the size distribution of the porosity. The details of
this will be discussed later in the manuscript.
Fig. 5a and b display the galvanostatic charge–discharge
curves at 1 A g�1 in BMPY TFSI and EMIM TFSI electrolytes.
PSDAC-800-3 and CAC can be charged and discharged
smoothly with symmetric and well-defined charge–discharge
lines. However, PSDAC-700-1 and PSDAC-800-1 materials
show non-linear charge–discharge curves. The galvanostatic
results are analogous to the CV results: PSDAC-800-3 carbon
possesses the best combination of specific capacitance and
capacitance retention, while the PSDAC-700-1 carbon pos-
sesses the worst. Fig. 5c and d display the relationship

Table 2 – Specific capacitance and capacity retention of the activated carbons measured in the organic and ionic liquidelectrolytes.
Electrolyte Samples Capacitance, CV (F g�1) Capacitance, charge–discharge (F g�1)
2 mV s�1 200 mV s�1 Retention (%) 0.1 A g�1 10 A g�1 Retention (%)
TEABF4/AN PSDAC-700-1 118.6 46.0 38.8 116.7 42.5 36.4PSDAC-800-1 128.1 64.1 50.0 121.7 64.3 52.8PSDAC-800-3 165.6 107.9 65.2 162.2 120.0 74.0CAC 111.6 66.5 59.6 108.4 69.7 64.3
BMPY TFSI PSDAC-700-1 85.7 18.1 21.1 82.4 8.0 9.7PSDAC-800-1 136.1 38.8 28.5 126.5 32.2 25.5PSDAC-800-3 180.1 111.3 61.8 163.3 121.7 74.5CAC 122.1 69.2 56.7 113.6 75.0 66.0
EMIM TFSI PSDAC-700-1 119.3 29.6 24.8 113.4 19.3 17.0PSDAC-800-1 149.4 49.9 33.4 140.7 43.6 29.3PSDAC-800-3 190.3 113.5 59.6 161.5 95.3 59.0CAC 123.4 75.5 61.2 114.4 85.6 74.8
0.0 0.5 1.0 1.5 2.0 2.5 3.0
-200
-100
0
100
200
300
400
Cap
acita
nce
(F g
-1)
Voltage (V)
PSDAC-700-1 PSDAC-800-1 PSDAC-800-3 CAC
a
0.0 0.5 1.0 1.5 2.0 2.5 3.0-200
-150
-100
-50
0
50
100
150
200
Cap
acita
nce
(F g
-1)
Voltage (V)
PSDAC-700-1 PSDAC-800-1 PSDAC-800-3 CAC
b
0.0 0.5 1.0 1.5 2.0 2.5 3.0
-200
-100
0
100
200
300
400
Cap
acita
nce
(F g
-1)
Voltage (V)
PSDAC-700-1 PSDAC-800-1 PSDAC-800-3 CAC
c
0.0 0.5 1.0 1.5 2.0 2.5 3.0-200
-150
-100
-50
0
50
100
150
200
Cap
acita
nce
(F g
-1)
Voltage (V)
PSDAC-700-1 PSDAC-800-1 PSDAC-800-3 CAC
d
Fig. 4 – CV curves of the carbons in BMPY TFSI electrolyte at a scan rate of (a) 2 mV s�1 and (b) 200 mV s�1. CV curves of the
carbons in EMIM TFSI electrolyte at (c) 2 mV s�1 and (d) 200 mV s�1.
C A R B O N 5 7 ( 2 0 1 3 ) 3 1 7 – 3 2 8 323
between potential drop and current density. The strongest IR
drop dependence on current density is observed for the
PSDAC-700-1 and PSDAC-800-1 carbons.
Fig. 5e shows the Ragone plot for the two ionic liquids, cal-
culated from the galvanostatic charge–discharge curves. The
PSDAC-800-3 sample yielded very promising energy-power
combinations in both ionic liquids: 51 W h kg�1 at 375 W kg�1
and 26–31 W h kg�1 at 6760–7000 W kg�1. Because the carbon
weight accounts for about 30 wt.% of the total mass of the
packaged commercial electrochemical capacitors, a practical
energy density of about 15 W h kg�1 for a packaged device is
expected, which is about three times higher than existing
activated carbon-based capacitors [33].
In both ionic liquids, PSDAC-800-3 exhibited excellent per-
formance in terms of high capacitance and capacitance reten-
tion. In fact this material performed on-par or even superior
to the potentially more expensive and less industrially scal-
able carbons such as mesoporous activated carbon fibers,
mesoporous carbons prepared from barium citrates, sucrose
derived carbons, carbide-derived carbons, templated car-
bide-derived carbons, activated graphene, reduced graphene
oxide, and CNT-activated carbon composites (see Table S1 in

0 100 200 300 400 5000.0
0.5
1.0
1.5
2.0
2.5
3.0
Volta
ge (V
)
Time (s)
PSDAC-700-1 PSDAC-800-1 PSDAC-800-3 CAC
b
0 100 200 300 400 5000.0
0.5
1.0
1.5
2.0
2.5
3.0
Volta
ge (V
)
Time (s)
PSDAC-700-1 PSDAC-800-1 PSDAC-800-3 CAC
a
0 2 4 6 8 10
0.0
0.5
1.0
1.5
2.0
IR D
rop
(V)
Current Density (A g-1)
PSDAC-700-1 PSDAC-800-1 PSDAC-800-3 CAC
c
0 2 4 6 8 10
0.0
0.5
1.0
1.5
2.0
IR D
rop
(V)
Current Density (A g-1)
PSDAC-700-1 PSDAC-800-1 PSDAC-800-3 CAC
d
10 100 1000 100000.1
1
10
100
EMIM TFSIBMPY TFSIEner
gy D
ensi
ty (W
h kg
-1)
Power Density (W kg-1)
PSDAC-700-1 PSDAC-800-1 PSDAC-800-3 CAC
e
Fig. 5 – Galvanostatic charge–discharge curves at 1 A g�1 in (a) BMPY TFSI and (b) EMIM TFSI electrolytes. Potential drop
associated with internal resistance vs. discharge current density in (c) BMPY TFSI and (d) EMIM TFSI electrolytes. (e) Resultant
Ragone plots utilizing BMPY TFSI and EMIM TFSI electrolytes. (f) Photo image of a commercial flashlight powered by
supercapacitor with pulp sludge derived activated carbon electrodes.
324 C A R B O N 5 7 ( 2 0 1 3 ) 3 1 7 – 3 2 8
Supplementary material) [27,33,36,37,39–43]. Recently, poly-
pyrrole derived activated carbon displayed the highest re-
ported capacitance of up to 300 F g�1 at 1 mV s�1 and
180 F g�1 at 100 mV s�1 [38]. The ultra-high surface area
(3432 m2 g�1) of these materials should be responsible for this
extraordinarily high capacitance. Though the surface area of
PSDAC-800-3 is lower, its capacitance at 100 mV s�1 is
140 F g�1, which is not very far off.
The cycling performance of PSDAC-800-3 over 5000 cycles
at 10 A g�1 is shown in Fig. S3 (in Supplementary material).
PSDAC-800-3 retains up to 91% capacity after 5000 cycles,
which indicates PSDAC-800-3 can be used for extended cy-
cling applications.
To show the practical applications of our supercapacitor
based on pulp sludge derived activated carbon, two 2032-type
button cells with 2.5 mg PSDAC-800-3 carbon on each elec-
trode operated in BMPY TFSI electrolyte (around 0.2 F per cell)
were used to power two light-emitting diode bulbs (0.06 W per
bulb) in a commercial mountaineering helmet-mounted
flashlight. Those two bulbs require a current of 20 mA at
6 V, equal to 8 A g�1 for each carbon electrode. As shown in
Fig. 5f, even at this high current density the supercapacitors
can power the bulbs at full intensity. After roughly 10 s the
bulbs begins to show signs of dimming due to the voltage
drop. However even after about 10 min, when the voltage
has dropped to 1.2 V, the bulbs still emit weak light.
3.4. Electrochemical impedance behavior
The electrochemical impedance data for the carbons in the
organic and in the two ionic liquid electrolytes are shown in
Fig. 6a–c. The Nyquist plots of the samples in all the electro-
lytes exhibit the typical features of porous electrodes with a
45� Warburg region at high-medium frequencies, and an al-
most vertical line at low frequencies, where the behavior be-
comes mainly capacitive [41]. The length of the 45� segment is
related to the resistance caused by ion diffusion into the bulk
of the electrode particles [44,45]. In the organic electrolyte,

0 200 400 600 800 1000 12000
300
600
900
1200
0 20 40 600
20
40
60
-Z'' (
ohm
)
Z' (ohm)
-Z''
(ohm
)
Z' (ohm)
PSDAC-700-1 PSDAC-800-1 PSDAC-800-3 CAC
a
0 500 1000 1500 20000
500
1000
1500
2000
0 50 1000
50
100
-Z'' (
ohm
)
Z' (ohm)
-Z''
(ohm
)
Z' (ohm)
PSDAC-700-1 PSDAC-800-1 PSDAC-800-3 CAC
b
10-3 10-2 10-1 100 101 102
0.0
0.2
0.4
0.6
0.8
1.0
Nor
mal
ized
Cap
acita
nce
(C/C
o)
Frequency (Hz)
PSDAC-700-1 PSDAC-800-1 PSDAC-800-3 CAC
d
0 500 1000 1500 20000
500
1000
1500
2000
0 50 1000
50
100
-Z'' (
ohm
)
Z' (ohm)
-Z''
(ohm
)
Z' (ohm)
PSDAC-700-1 PSDAC-800-1 PSDAC-800-3 CAC
c
10-3 10-2 10-1 100 101 102
0.0
0.2
0.4
0.6
0.8
1.0
Nor
mal
ized
Cap
acita
nce
(C/C
o)
Frequency (Hz)
PSDAC-700-1 PSDAC-800-1 PSDAC-800-3 CAC
e
10-3 10-2 10-1 100 101 102
0.0
0.2
0.4
0.6
0.8
1.0
Nor
mal
ized
Cap
acita
nce
(C/C
o)
Frequency (Hz)
PSDAC-700-1 PSDAC-800-1 PSDAC-800-3 CAC
f
Fig. 6 – Nyquist plots of the carbons in (a) TEABF4/AN, (b) BMPY TFSI, and (c) EMIM TFSI electrolytes. Frequency response of the
carbons in (d) TEABF4/AN, (e) BMPY TFSI, and (f) EMIM TFSI electrolytes.
C A R B O N 5 7 ( 2 0 1 3 ) 3 1 7 – 3 2 8 325
PSDAC-700-1 and PSDAC-800-1 possess a Warburg impedance
of similar magnitude, distinct from PSDAC-800-3 and CAC. In
the BMPY TFSI, the PSDAC-700-1 is distinct from the other
three. In EMIM TFSI, PSDAC-700-1 is also by far the most resis-
tive. An increased length of the Warburg segment indicates a
higher resistance faced by the ions during their transport into
the small micropores. Clearly the PSDAC-700-1 specimen with
its pore size distribution biased towards narrow micropores
provides the most tortuous diffusion path for the absorbing
ions. In the high frequency region all samples show a semicir-
cle of larger radius in the ionic liquids than in the organic
electrolyte, indicative of higher charge-transfer resistance in
the former. The very high frequency response of all the car-
bons in the three electrolytes is analogous, demonstrating
low equivalent series resistances (0.4–2.5 Ohms).
Fig. 6d–f shows the frequency response of the supercapac-
itors in organic and ionic liquid electrolytes. Specimen
PSDAC-800-3 shows the highest operating frequency (fre-
quency at which capacitance is 50% of max.) with 0.22 Hz in
organic electrolyte, and 0.032–0.050 Hz in ionic liquids. The
carbons can be ranked based on the operating frequency in
the following order: PSDAC-800-3 > CAC > PSDAC-800-
1 > PSDAC-700-1. Based on this criterion the electrolytes can
also be ranked: TEABF4/AN > EMIM TFSI > BMPY TFSI. We be-
lieve that the fastest response time observed in PSDAC-800-3
is directly related to its combined suitable micro and mesopo-
rosity. The performance in different electrolytes is related to
both the ion size and the viscosity of the electrolyte. Of the
two ionic liquids BMPY TFSI has the larger cation size (0.76
vs. 1.1 nm) and yields the slowest response.
3.5. Surface area normalized capacitance: ion size andpore size effects
Fig. 7a shows the relationship between the surface area nor-
malized capacitances and the scan rates in TEABF4/AN

0 50 100 150 2000
2
4
6
8
10
Nor
mal
ized
Cap
acita
nce
(µF
cm-2)
Scan Rate (mV s-1)
PSDAC-700-1 PSDAC-800-1 PSDAC-800-3 CAC
b
0 50 100 150 2000
2
4
6
8
10
Nor
mal
ized
Cap
acita
nce
( µF
cm-2)
Scan Rate (mV s-1)
PSDAC-700-1 PSDAC-800-1 PSDAC-800-3 CAC
c
0 50 100 150 2000
2
4
6
8
10
Nor
mal
ized
Cap
acita
nce
(µF
cm-2)
Scan Rate (mV s-1)
PSDAC-700-1 PSDAC-800-1 PSDAC-800-3 CAC
a
Fig. 7 – Surface area normalized capacitance of the carbons in (a) TEABF4/AN, (b) BMPY TFSI, and (c) EMIM TFSI electrolytes.
326 C A R B O N 5 7 ( 2 0 1 3 ) 3 1 7 – 3 2 8
electrolyte. At the lower scan rates the surface area normal-
ized capacitance for PSDAC-700-1 was significantly higher
than for the other carbons. The sizes of the solvated cation
and anion in TEABF4/AN electrolyte are 1.30 and 1.16 nm [46].
This is much larger than the mean micropore size of PSDAC-
700-1. In fact according to Fig. 2b the majority of the pores in
this specimen are significantly smaller than the solvated ion
dimensions. The uniquely enhanced capacitance for PSDAC-
700-1 at the low scan rates provides evidence that there must
be partial desolvation of the ions as to allow their penetration
into narrow micropores [46]. Since many more desolvated ions
can fit onto a given surface than could solvated ions, at slow
scan rates (i.e. low diffusional losses) a pore size distribution
biased towards the small micropores and ultramicropores
would store the most charge on a surface area normalized ba-
sis. The bare cation size of TEABF4/AN is 0.67 nm. The pore size
distribution for PSDAC-700-1 has an incremental pore volume
peak centered at 0.8 nm, which is well suited for cations of
TEA+. Although PSDAC-800-1 and PSDAC-700-1 possess similar
Vmicro/Vt ratio, the mean micropore size of PSDAC-700-1
(0.94 nm) is smaller than PSDAC-800-1 (0.99 nm), better corre-
lating to the size of the electrolyte-ions.
Examining the other carbons shows a trend that the rate
dependence of the surface area normalized capacitance be-
comes progressively weaker with increasing levels of meso-
porosity, with PSDAC-800-3 being superior at rates above
100 mV s�1. The optimum performance of PSDAC-800-3 at
high rates is expected since high relative levels of mesoporos-
ity (Table 1) reduce the diffusional losses associated with tor-
tuous narrow micropores [3,9].The surface area normalized
capacitances are relatively close to each other at the high
scan rates. This may be explained by the finding that in an or-
ganic electrolyte, large micropores (>1.2 nm), in addition to
mesopores, would allow for facile ion diffusion [12].
Fig. 7b and c shows the relationship between surface area
normalized capacitances and scan rates in BMPY TFSI and
EMIM TFSI electrolytes. The high surface area normalized
capacitance of PSDAC-700-1 in EMIM TFSI at the low scan
rates may be explained by the close correlation between the
mean pore size and the ion size. Recent experimental and
theoretical investigations highlight an anomalous increase
in capacitance when the pore size approaches the ionic
dimensions [36,47]. In both electrolytes the maximum dimen-
sion of the anion is 0.79 nm. The maximum dimension of the
cation in EMIM TFSI and BMPY TFSI is 0.76 and 1.1 nm,
respectively. The 0.8 nm distribution peak of PSDAC-700-1 is
almost ideally matched to the size of the EMIM+ ion. For the
case of the ionic liquid with the larger cation, BMPY TFSI,
such an enhancement is not observed. The larger ion size of
BMPY+ couldn’t fully utilize micropores smaller than 1 nm.
This scenario agrees with recent simulation results regarding
the role of sub-nanometer pores in improving the electrical
double layer capacitance [48]. In both ionic liquids, PSDAC-
800-3 displays the best surface area normalized capacitances
at the higher scan rates. This agrees with the diffusional loss
scenario and the need for mesopores in ionic liquid
electrolytes.
At high scan rates, PSDAC-700-1 and PSDAC-800-1 exhibit
higher surface area normalized capacitance in organic
electrolyte than in ionic liquid, and this observation further
indicates that pores larger than 1.2 nm contribute to fast
ion-transport in organic electrolyte and mesopores (>2 nm)
play a more important role in fast ion-transport in ionic liquid
electrolyte. Comparing PSDAC-800-3 with CAC, PSDAC-800-3
with higher mesopore proportion shows similar or a little
higher surface area normalized capacitance at high scan
rates, and this can be partially ascribed to the lower capaci-
tance contribution from mesopores and/or the pore connec-
tivity [4].
4. Conclusions
We demonstrate that paper pulp mill sludge, a widely avail-
able industrial biowaste, can be converted into a high-perfor-
mance carbon for electrochemical capacitor applications.
With the activation conditions optimized (PSDAC-800-3), the
material exhibits excellent specific capacitances and rate
capabilities in both organic and ionic liquid electrolytes. This
is a direct result of its high surface area, which actually ex-
ceeds that of graphene, combined with high levels of mesopo-
rosity. Given the large availability of paper pulp mill sludge
and the energy reduced nature of the hydrothermal carbon-
ization process, such carbons can be produced on large scales
at low environmental and economic costs.
Acknowledgement
The authors acknowledge financial support from ALMA/AB
Bio and NINT NRC.

C A R B O N 5 7 ( 2 0 1 3 ) 3 1 7 – 3 2 8 327
Appendix A. Supplementary data
Supplementary data associated with this article can be found,
in the online version, at http://dx.doi.org/10.1016/j.carbon.
2013.01.079.
R E F E R E N C E S
[1] Conway BE. Electrochemical supercapacitors: scientificfundamentals and technological applications. 1st ed. NewYork: Kluwer Academic/Plenum; 1999.
[2] Simon P, Gogotsi Y. Materials for electrochemical capacitors.Nat Mater 2008;7:845–54.
[3] Inagaki M, Konno H, Tanaike O. Carbon materials forelectrochemical capacitors. J Power Sources2010;195:7880–903.
[4] Chmiola J, Yushin G, Gogotsi Y, Portet C, Simon P, Taberna PL.Anomalous increase in carbon capacitance at pore sizes lessthan 1 nanometer. Science 2006;313:1760–2.
[5] Feng G, Qiao R, Huang J, Dai S, Sumpter BG, Meunier V. Theimportance of ion size and electrode curvature on electricaldouble layers in ionic liquids. Phys Chem Chem Phys2011;13:1152–61.
[6] Seredych M, Hulicova-Jurcakova D, Lu GQ, Bandosz TJ.Surface functional groups of carbons and the effects of theirchemical character, density and accessibility to ions onelectrochemical performance. Carbon 2008;46:1475–88.
[7] Raymundo-Pinero E, Kierzek K, Beguin F. Relationshipbetween the nanoporous texture of activated carbons andtheir capacitance properties in different electrolytes. Carbon2006;44:2498–507.
[8] Huang J, Sumpter BG, Meunier V. Theoretical model fornanoporous carbon supercapacitors. Angew Chem Int Ed2008;47:520–4.
[9] Liu C, Li F, Ma LP, Cheng HM. Advanced materials for energystorage. Adv Mater 2010;22:E28–62.
[10] Portet C, Yushin G, Gogotsi Y. Electrochemical performance ofcarbon onions, nanodiamonds, carbon black and multiwallednanotubes in electrical double layer capacitors. Carbon2007;45:2511–8.
[11] Dai L, Chang DW, Baek JB, Lu W. Carbon nanomaterials foradvanced energy conversion and storage. Small2012;8:1130–66.
[12] Nishihara H, Itoi H, Kogure T, Hou PX, Touhara H, Okino F,et al. Investigation of the ion storage/transfer behavior in anelectrical double-layer capacitor by using orderedmicroporous carbons as model materials. Chem Eur J2009;15:5355–63.
[13] Portet C, Lillo-Rodenas MA, Linares-Solano A, Gogotsi Y.Capacitance of KOH activated carbide-derived carbons. PhysChem Chem Phys 2009;11:4943–5.
[14] Hu J, Wang H, Gao Q, Guo H. Porous carbons prepared byusing metal-organic framework as the precursor forsupercapacitors. Carbon 2010;48:3599–606.
[15] Zhao L, Baccile N, Gross S, Zhang YJ, Wei W, Sun YH, et al.Sustainable nitrogen-doped carbonaceous materials frombiomass derivatives. Carbon 2010;48:3778–87.
[16] Zhao L, Fan LZ, Zhou MQ, Guan H, Qiao S, Antonietti M, et al.Nitrogen-containing hydrothermal carbons with superiorperformance in supercapacitors. Adv Mater 2010;22:5202–6.
[17] Bichat MP, Raymundo-Pinero E, Beguin F. High voltagesupercapacitor built with seaweed carbons in neutralaqueous electrolyte. Carbon 2010;48:4351–61.
[18] Li Z, Zhang L, Amirkhiz BS, Tan X, Xu Z, Wang H, et al.Carbonized chicken eggshell membranes with 3D
architectures as high-performance electrode materials forsupercapacitors. Adv Energy Mater 2012;2:431–7.
[19] Milczarek G, Inganas O. Renewable cathode materials frombiopolymer/conjugated polymer interpenetrating networks.Science 2012;335:1468–71.
[20] Macyk TM. Land application of mechanical pulp mill sludgesin Alberta: research and operational activities. Pulp Pap Can1999;100:34–7.
[21] Presser V, McDonough J, Yeon SH, Gogotsi Y. Effect of poresize on carbon dioxide sorption by carbide derived carbon.Energy Environ Sci 2011;4:3059–66.
[22] Taberna PL, Simon P, Fauvarque JF. Electrochemicalcharacteristics and impedance spectroscopy studies ofcarbon–carbon supercapacitors. J Electrochem Soc2003;150:A292–300.
[23] Wei L, Sevilla M, Fuertes AB, Mokaya R, Yushin G.Hydrothermal carbonization of abundant renewable naturalorganic chemicals for high-performance supercapacitorelectrodes. Adv Energy Mater 2011;1:356–61.
[24] Lillo-Rodenas MA, Juan-Juan J, Cazorla-Amoros D, Linares-Solano A. About reactions occurring during chemicalactivation with hydroxides. Carbon 2004;42:1371–5.
[25] Teng HS, Hsu LY. High-porosity carbons prepared frombituminous coal with potassium hydroxide activation. IndEng Chem Res 1999;38:2947–53.
[26] Sevilla M, Fuertes AB, Mokaya R. High density hydrogenstorage in superactivated carbons from hydrothermallycarbonized renewable organic materials. Energy Environ Sci2011;4:1400–10.
[27] Rose M, Korenblit Y, Kockrick E, Borchardt L, Oschatz M,Kaskel S, et al. Hierarchical micro- and mesoporous carbide-derived carbon as a high-performance electrode material insupercapacitors. Small 2011;7:1108–17.
[28] Bleda-Martınez MJ, Macia-Agullo JA, Lozano-Castello D,Morallon E, Cazorla-Amoros D, Linares-Solano A. Role ofsurface chemistry on electric double layer capacitance ofcarbon materials. Carbon 2005;43:2677–84.
[29] Wang H, Gao Q, Hu J. Preparation of porous doped carbonsand the high performance in electrochemical capacitors.Microporous Mesoporous Mater 2010;131:89–96.
[30] Zhou DD, Liu HJ, Wang YG, Wang CX, Xia YY. Orderedmesoporous/microporous carbon sphere arrays derived fromchlorination of mesoporous TiC/C composite and theirapplication for supercapacitors. J Mater Chem2012;22:1937–43.
[31] Portet C, Yang Z, Korenblit Y, Gogotsi Y, Mokaya R, Yushin G.Electrical double-layer capacitance of zeolite-templatedcarbon in organic electrolyte. J Electrochem Soc2009;156:A1–6.
[32] Woo SW, Dokko K, Nakano H, Kanamura K. Preparation ofthree dimensionally ordered macroporous carbon withmesoporous walls for electric double-layer capacitors. J MaterChem 2008;18:1674–80.
[33] Zhu Y, Murali S, Stoller MD, Ganesh KJ, Cai W, Ferreira PJ,et al. Carbon-based supercapacitors produced by activationof graphene. Science 2011;332:1537–41.
[34] Izadi-Najafabadi A, Yasuda S, Kobashi K, Yamada T, FutabaDN, Hatori H, et al. Extracting the full potential of single-walled carbon nanotubes as durable supercapacitorelectrodes operable at 4 V with high power and energydensity. Adv Mater 2010;22:E235–41.
[35] Stoller MD, Park S, Zhu Y, An J, Ruoff RS. Graphene-basedultracapacitors. Nano Lett 2008;8:3498–502.
[36] Largeot C, Portet C, Chmiola J, Taberna PL, Gogosti Y, Simon P.Relation between the ion size and pore size for an electricdouble-layer capacitor. J Am Chem Soc 2008;130:2730–1.
[37] Largeot C, Taberna PL, Gogotsi Y, Simon P. Microporouscarbon-based electrical double layer capacitor operating at
328 C A R B O N 5 7 ( 2 0 1 3 ) 3 1 7 – 3 2 8
high temperature in ionic liquid electrolyte. ElectrochemSolid-State Lett 2011;14:A174–6.
[38] Wei L, Sevilla M, Fuertes AB, Mokaya R, Yushin G. Polypyrrole-derived activated carbons for high-performance electricaldouble-layer capacitors with ionic liquid electrolyte. AdvFunct Mater 2012;22:827–34.
[39] Xu B, Wu F, Chen R, Cao G, Chen S, Yang Y. Mesoporousactivated carbon fiber as electrode material for high-performance electrochemical double layer capacitors withionic liquid electrolyte. J Power Sources 2010;195:2118–24.
[40] Zhou J, Yuan X, Xing W, Si W, Zhuo S. Capacitive performanceof mesoporous carbons derived from the citrates in ionicliquid. Carbon 2010;48:2765–72.
[41] Wei L, Yushin G. Electrical double layer capacitors withsucrose derived carbon electrodes in ionic liquid electrolytes.J Power Sources 2011;196:4072–9.
[42] Chen Y, Zhang X, Zhang D, Xu P, Ma Y. High performancesupercapacitors based on reduced graphene oxide inaqueous and ionic liquid electrolytes. Carbon 2011;49:573–80.
[43] Lu W, Hartman R, Qu L, Dai L. Nanocomposite electrodes forhigh-performance supercapacitors. J Phys Chem Lett2011;2:655–60.
[44] Lu W, Qu L, Henry K, Dai L. High performanceelectrochemical capacitors from aligned carbon nanotubeelectrodes and ionic liquid electrolytes. J Power Sources2009;189:1270–7.
[45] Gamby J, Taberna PL, Simon P, Fauvarque JF, Chesneau M.Studies and characterisations of various activated carbonsused for carbon/carbon supercapacitors. J Power Sources2001;101:109–16.
[46] Chmiola J, Largeot C, Taberna PL, Simon P, Gogosti Y.Desolvation of ions in subnanometer pores and its effect oncapacitance and double-layer theory. Angew Chem Int Ed2008;47:3392–5.
[47] Wu P, Huang J, Meunier V, Sumpter BG, Qiao R. Complexcapacitance scaling in ionic liquids-filled nanopores. ACSNano 2011;5:9044–51.
[48] Merlet C, Rotenberg B, Madden PA, Taberna PL, Simon P,Gogotsi Y, et al. On the molecular origin of supercapacitancein nanoporous carbon electrodes. Nat Mater 2012;11:306–10.