experimental and numerical study on tuned
TRANSCRIPT
EXPERIMENTAL AND NUMERICAL STUDY ON TUNED
MASS DAMPER IN CONTROLLING VIBRATION OF FRAME
STRUCTURES
A Thesis Submitted in partial fulfillment of the requirements for
the award of Degree of
MASTER OF TECHNOLOGY In
STRUCTURAL ENGINEERING
By
PADMABATI SAHOO
Roll No. 213CE2074
DEPARTMENT OF CIVIL ENGINEERING
NATIONAL INSTITUTE OF TECHNOLOGY
ROURKELA, ODISHA-769008
2015
EXPERIMENTAL AND NUMERICAL STUDY ON TUNED
MASS DAMPER IN CONTROLLING VIBRATION OF FRAME
STRUCTURES
A Thesis Submitted in partial fulfillment of the requirements for
the award of Degree of
MASTER OF TECHNOLOGY In
STRUCTURAL ENGINEERING
By
PADMABATI SAHOO
Roll No. 213CE2074
Under the guidance of
DR. K. C. BISWAL
DEPARTMENT OF CIVIL ENGINEERING
NATIONAL INSTITUTE OF TECHNOLOGY
ROURKELA, ODISHA-769008
2015
NATIONAL INSTITUTE OF TECHNOLOGY
ROURKELA
CERTIFICATE
This is to certify that the thesis entitled, “EXPERIMENTAL AND NUMERICAL STUDY
ON TUNED MASS DAMPER IN CONTROLLING VIBRATION OF FRAME
STRUCTURES” submitted by Padmabati Sahoo in partial fulfilment of the requirements for
the award of Master of Technology Degree in Civil Engineering with specialization in
“Structural Engineering” at National Institute of Technology, Rourkela is an authentic work
carried out by her under my supervision and guidance. To the best of my knowledge, the matter
embodied in this Project review report has not been submitted to any other university/ institute
for award of any Degree or Diploma.
Date: Prof K.C. Biswal
Dept. of Civil Engineering
National Institute of Technology,
Rourkela-769008

Dedicated to
My Parents, and to each and every
teacher , who taught us from alphabets
to whatever till date. And to friends
who have been there for us from genesis to
apocalypse.
i
ACKNOWLEDGEMENT
I am obliged to the Dept. of Civil Engineering, NIT ROURKELA, for giving me the
opportunity to carry out this project, which is an integral part of the curriculum in M. Tech
program at the National Institute of Technology, Rourkela. I would like to articulate my
profound gratitude and indebtedness to my project guide Prof.K.C.Biswal, for introducing the
present topic and for their inspiring guidance, constructive criticism and valuable suggestion
throughout this project work. I sincerely thank to our Director Prof. S. K. Sarangi, HOD of civil
engineering department Prof. S. K. Sahu and all the authorities of the institute for providing nice
academic environment and other facility in the NIT campus. I express my sincere thanks to Mr.
Debadatta Jena and Sandeep for all their help. I am also thankful to Lugun Bhaina and all the
staff members of Structural engineering Laboratory, for their assistance and co-operation during
the course of experimental works. I also thank all my batch mates who have directly or indirectly
helped me in my project work and shared the moments of joy and sorrow throughout the period
of project work. Finally, I would like to thank my Parents, who taught me the value of hard work
by their own example. I am deeply honored to present this thesis to this department and thank
them for their patience and support.
PADMABATI SAHOO
ii
ABSTRACT
Day by day, the numbers of taller and lighter structures are continuously increasing in the
construction industries which are flexible and having a very low damping value. Those structures
can easily fail under structural vibrations induced by earthquake and wind. Therefore several
techniques are available today to minimize the vibration of the structure, out of which concept of
using TMD is a newer one. There are large numbers of studies on theoretical investigation of
behaviour of buildings with tuned mass dampers under various impacts. However, the
experimental studies in this area are quite limited. In this thesis, a one-storey and a two-storey
building frame models are developed for shake table experiment under sinusoidal excitation to
observe the response of the structure with and without TMD. The TMD is tuned to the structural
frequency of the structure keeping the stiffness and damping constant. Various parameters such
as frequency ratio, mass ratio, tuning ratio etc. are considered to observe the effectiveness and
robustness of the TMD in terms of percentage reduction in amplitude of the structure. Then the
responses obtained are validated numerically using finite element method. From the study it is
observed that, TMD can be effectively used for vibration control of structures.
iii
TABLE OF CONTENTS
Contents
ACKNOWLEDGEMENT ............................................................................................................... i
ABSTRACT .................................................................................................................................... ii
LIST OF FIGURES ........................................................................................................................ v
LIST OF TABLES ....................................................................................................................... viii
1. INTRODUCTION .................................................................................................................. 1
1.1 Introduction: ..................................................................................................................... 1
1.1.1 Active control devices: ............................................................................................. 1
1.1.2. Passive control devices: ................................................................................................ 2
1.1.3. Semi-active control devices: ......................................................................................... 2
1.1.4. Hybrid control Devices: ................................................................................................ 2
1.2. Tuned mass damper: ............................................................................................................ 3
1.3. Practical implementation: .................................................................................................... 3
2. LITERATURE REVIEW ....................................................................................................... 7
2.1. Literature Review: ............................................................................................................... 7
2.2. Objective and scope of present work: ................................................................................ 12
3. METHODOLOGY ............................................................................................................... 13
3.1. Forced vibration analysis of a physical model:.................................................................. 13
3.2. Solution of forced vibration analysis by Newmark-Beta method: ..................................... 15
3.3. Step-by-step solution using Newmark integration method:............................................... 15
4. EXPERIMENTAL STUDY.................................................................................................. 17
4.1. Introduction: ....................................................................................................................... 17
4.2. Experimental set up: .......................................................................................................... 19
4.2.1. Unidirectional shake table: ......................................................................................... 20
4.2.2. Vibrating analyzer:...................................................................................................... 20
4.2.3. Accelerometer: ............................................................................................................ 20
4.2.4. Control panel:.............................................................................................................. 21
4.2.5. TMD structure model:................................................................................................. 21
4.3. Time-domain analysis for single storey frame: ................................................................. 23
4.3.1 Beating effect in structure mass damper system: ......................................................... 25
4.4. Frequency domain analysis for single storey frame: ......................................................... 27
iv
4.4.1 Effect of frequency ratio on structural amplitude response: ........................................ 28
4.4.2 Effect of mass ratio on structural response for single storey frame:............................ 32
4.4.3. Effect of tuning ratio on structural response for single storey frame: ........................ 33
4.5. Analysis of double storey frame: ....................................................................................... 35
4.6. Frequency domain analysis for double storey frame: ........................................................ 36
4.6.1 Effect of frequency ratio on displacement response: ................................................... 36
4.6.2. Effect of mass ratio on structural response of a double storey frame model: ............. 38
5. NUMERICAL STUDY ........................................................................................................ 40
5.1 Problem statement-1 ........................................................................................................... 40
5.2 Problem statement-2 ........................................................................................................... 45
5.3. Problem statement-3 .......................................................................................................... 47
5.3.1. Comparison of predicted frequency (Hz) obtained in FEM and STAAD Pro: ........... 48
5.3.2. Comparison Study on the top storey displacement of the 4-storey frame without and
with TMD: ............................................................................................................................ 48
5.4. Problem Statement-4 .......................................................................................................... 50
5.4.1. Comparison of predicted frequency (Hz) obtained in FEM and STAAD Pro.: .......... 50
5.4.2. Comparison Study on the top storey displacement of the 10-storey frame without and
with TMD: ............................................................................................................................ 51
5.4.3 Tuning of damper:........................................................................................................ 53
5.4.4 Effect of TMD on displacement response with variation of mass ratio: ..................... 54
5.4.5 Effect of TMD on Displacement response with variation of damping ratio: .............. 55
6. CONCLUSION ..................................................................................................................... 57
6.1. Conclusion: ........................................................................................................................ 57
6.2. Future scope for study: ................................................................................................... 58
REFERENCES ............................................................................................................................. 59
v
LIST OF FIGURES
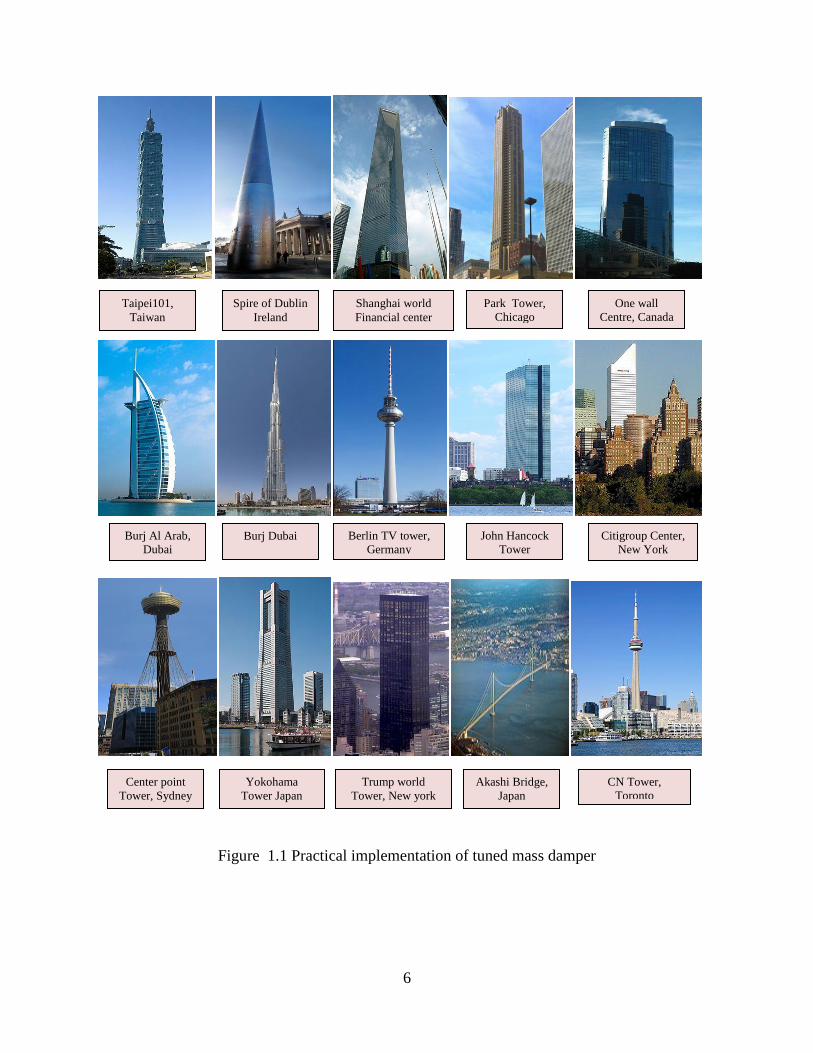
Figure 1.1 Practical implementation of tuned mass damper .......................................................... 6
Figure 4.1 Experimental set up .................................................................................................... 19
Figure 4.2 Test model-1 ............................................................................................................... 22
Figure 4.3 Time histories of structural displacement with and without TMD at frequency ratio =
0.8.................................................................................................................................................. 23
Figure 4.4 Time histories of structural acceleration with and without TMD at frequency ratio =
0.8.................................................................................................................................................. 23
Figure 4.5 Time histories of structural displacement with and without TMD at frequency ratio =
1.0.................................................................................................................................................. 24
Figure 4.6 Time histories of structural acceleration with and without TMD at frequency ratio =
1.0.................................................................................................................................................. 24
Figure 4.7 Time histories of displacement responses at a frequency ratio = 0.6 .......................... 26
Figure 4.8 Time histories of displacement responses at a frequency ratio = 0.8 .......................... 26
Figure 4.9 Time histories of displacement responses at a frequency ratio = 1.0 .......................... 27
Figure 4.10 Time histories of displacement responses at a frequency ratio = 1.3 ........................ 27
Figure 4.11 Displacement response of structure for varying frequency ratios without TMD ...... 28
Figure 4.12Displacement response of structure for varying frequency ratios with TMD at a mass
ratio of 0.25 ................................................................................................................................... 29
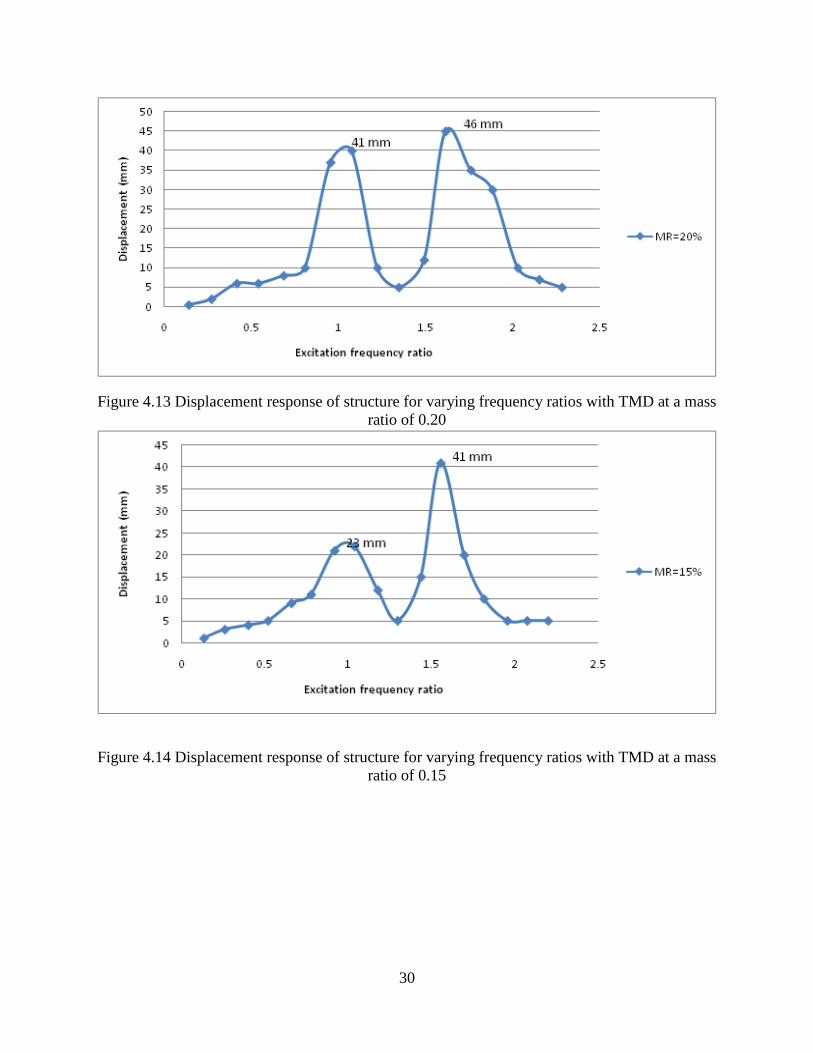
Figure 4.13 Displacement response of structure for varying frequency ratios with TMD at a mass
ratio of 0.20 ................................................................................................................................... 30
Figure 4.14 Displacement response of structure for varying frequency ratios with TMD at a mass
ratio of 0.15 ................................................................................................................................... 30
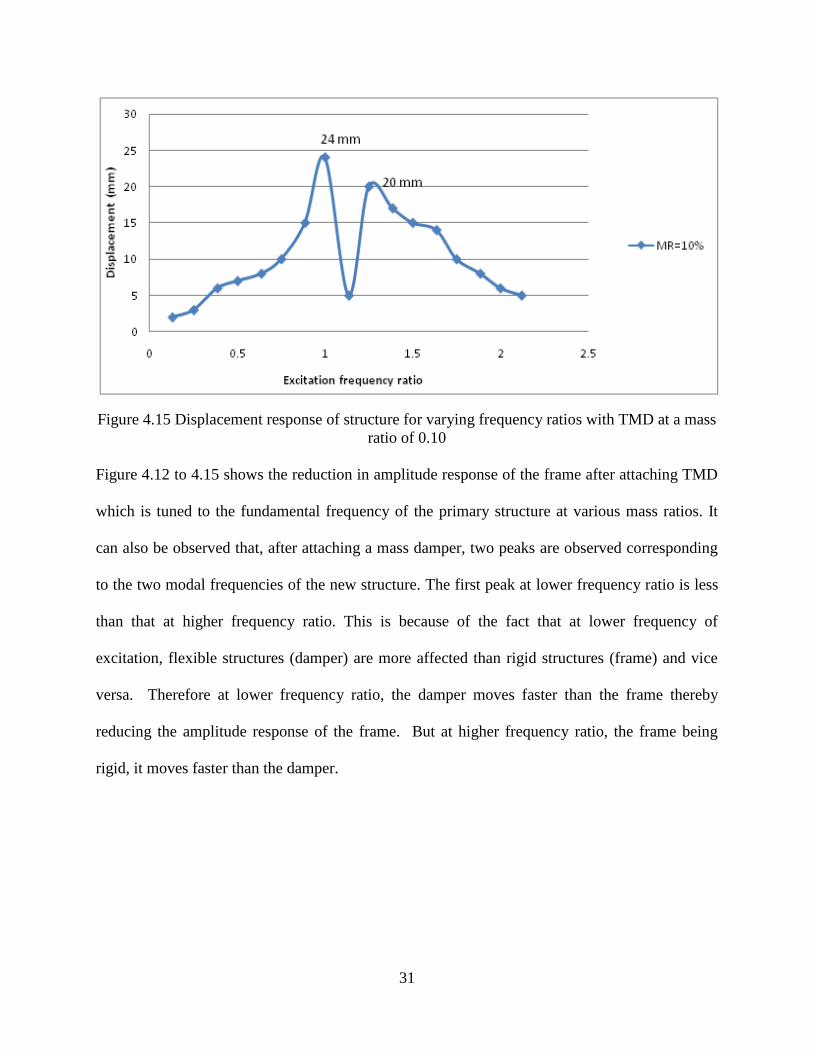
Figure 4.15 Displacement response of structure for varying frequency ratios with TMD at a mass
ratio of 0.10 ................................................................................................................................... 31
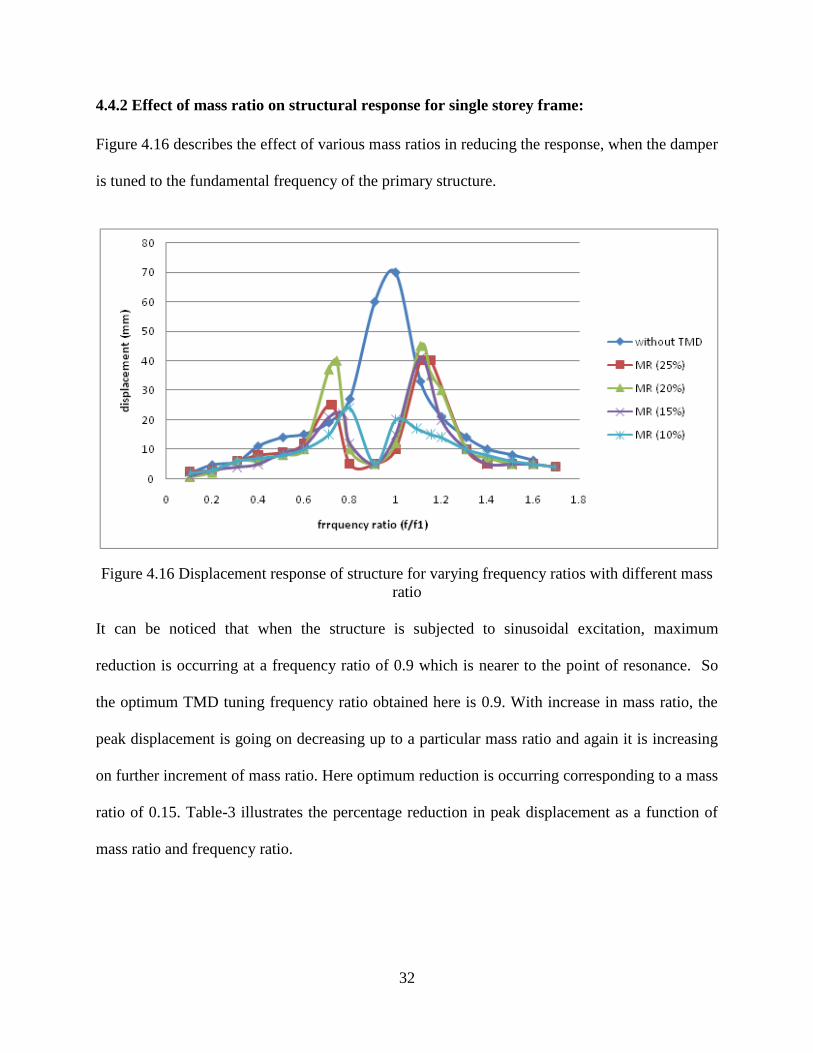
Figure 4.16 Displacement response of structure for varying frequency ratios with different mass
ratio ............................................................................................................................................... 32
Figure 4.17 Displacement response of structure for varying tuning ratio at a mass ratio of 0.15 34
Figure 4.18 Frame model-2........................................................................................................... 35
vi
Figure 4.19 Displacement response of two storey frame structure for varying frequency ratios
without TMD ................................................................................................................................ 36
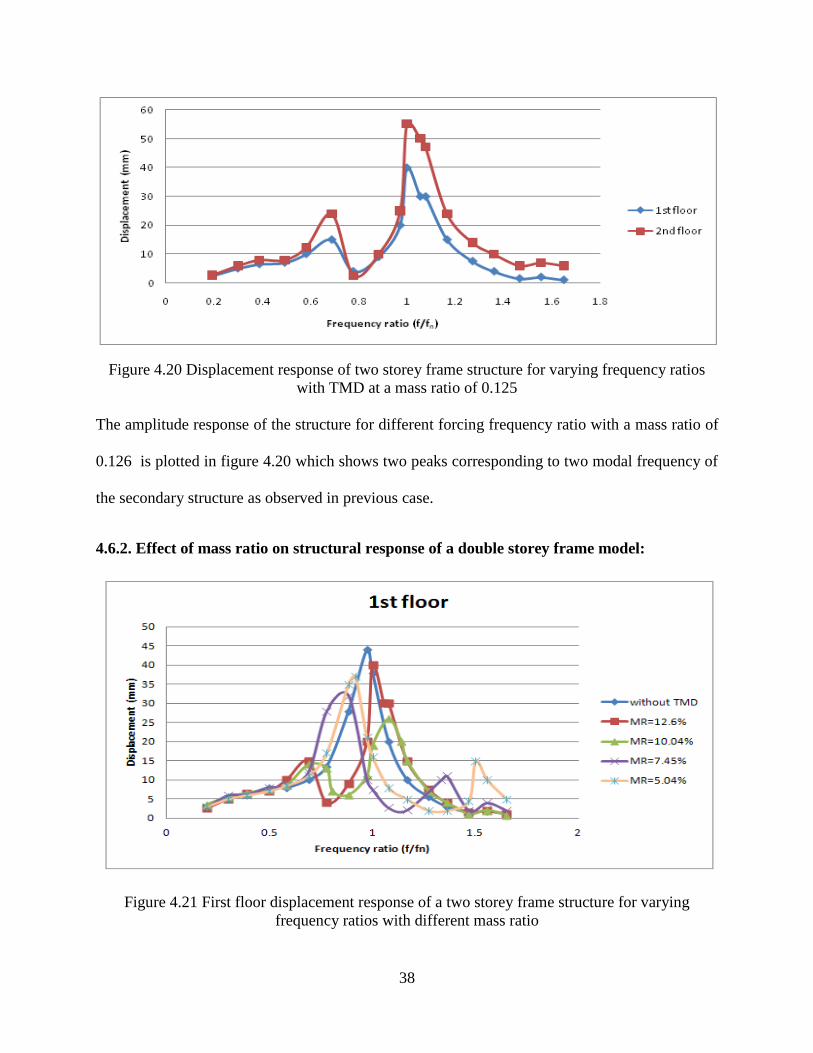
Figure 4.20 Displacement response of two storey frame structure for varying frequency ratios
with TMD at a mass ratio of 0.125 ............................................................................................... 38
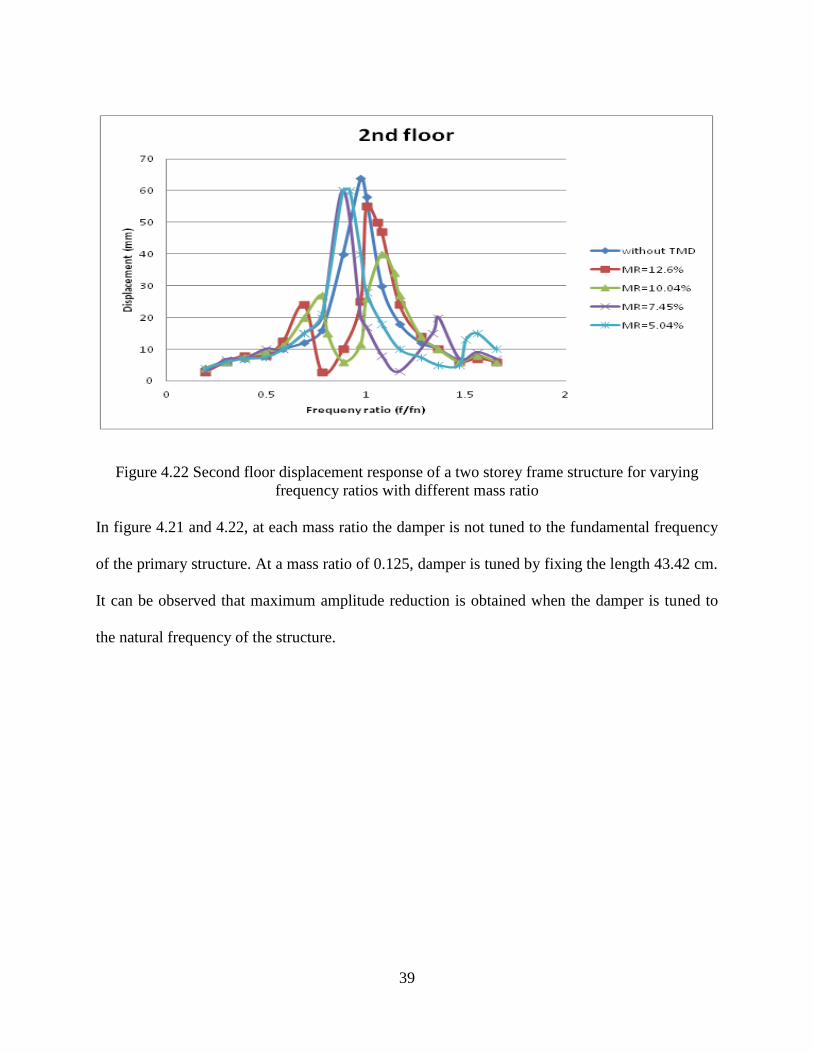
Figure 4.21 First floor displacement response of a two storey frame structure for varying
frequency ratios with different mass ratio .................................................................................... 38
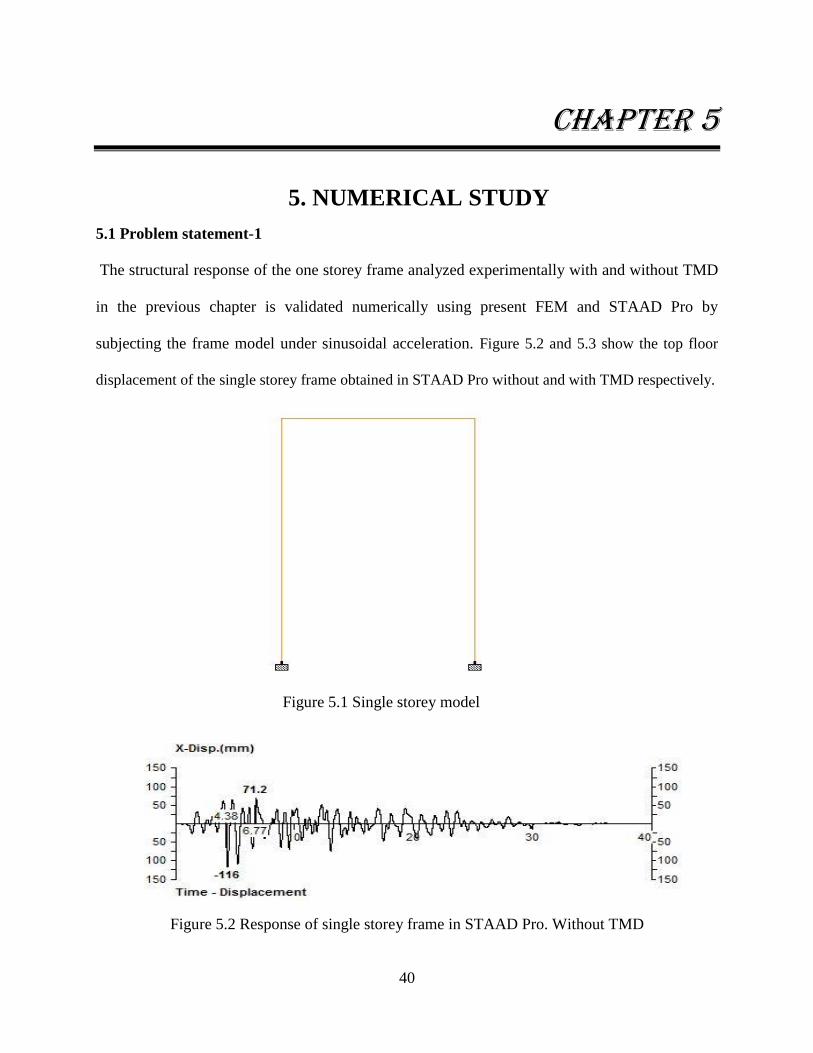
Figure 4.22 Second floor displacement response of a two storey frame structure for varying
frequency ratios with different mass ratio .................................................................................... 39
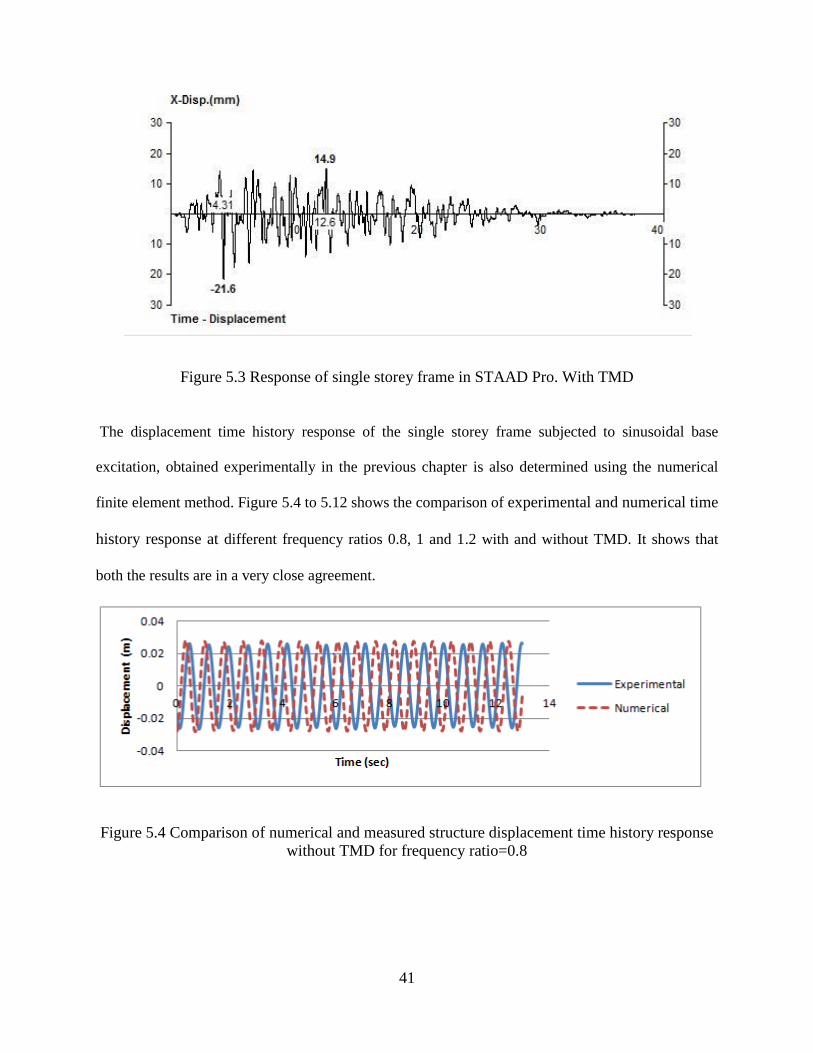
Figure 5.2 Response of single storey frame in STAAD Pro. Without TMD ................................ 40
Figure 5.1 Single storey model ..................................................................................................... 40
Figure 5.3 Response of single storey frame in STAAD Pro. With TMD ..................................... 41
Figure 5.4 Comparison of numerical and measured structure displacement time history response
without TMD for frequency ratio=0.8 .......................................................................................... 41
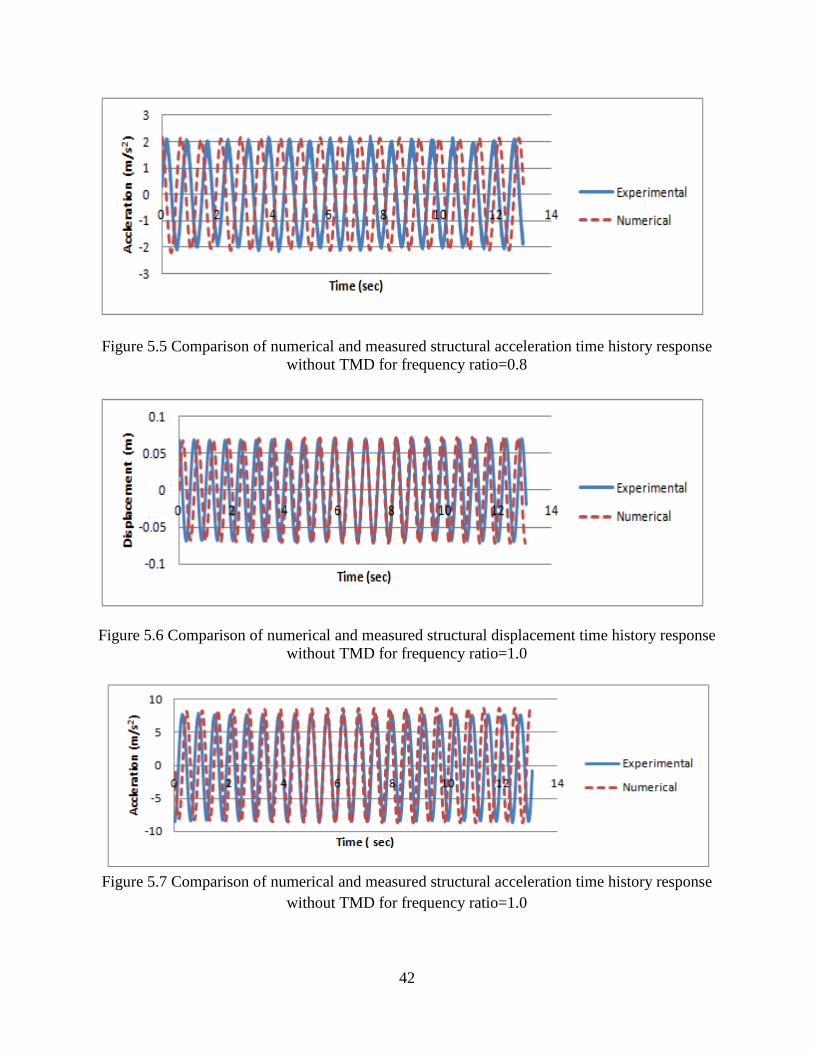
Figure 5.5 Comparison of numerical and measured structural acceleration time history response
without TMD for frequency ratio=0.8 .......................................................................................... 42
Figure 5.6 Comparison of numerical and measured structural displacement time history response
without TMD for frequency ratio=1.0 .......................................................................................... 42
Figure 5.7 Comparison of numerical and measured structural acceleration time history response
without TMD for frequency ratio=1.0 .......................................................................................... 42
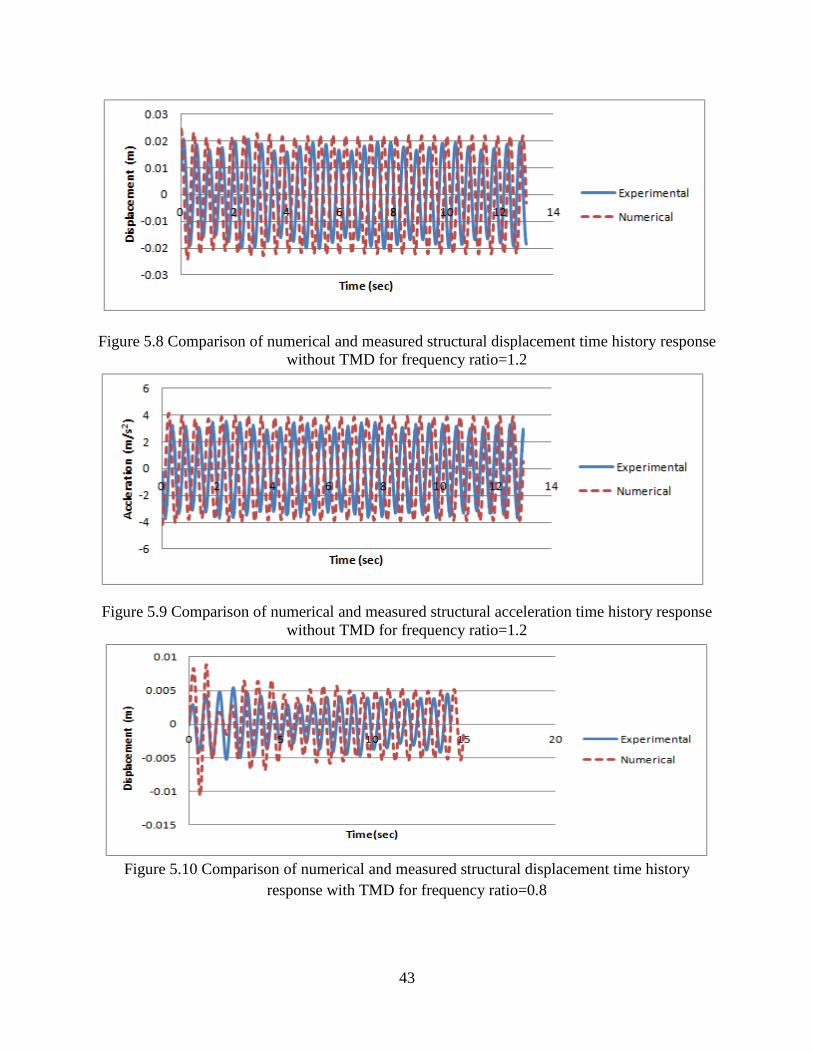
Figure 5.8 Comparison of numerical and measured structural displacement time history response
without TMD for frequency ratio=1.2 .......................................................................................... 43
Figure 5.9 Comparison of numerical and measured structural acceleration time history response
without TMD for frequency ratio=1.2 .......................................................................................... 43
Figure 5.10 Comparison of numerical and measured structural displacement time history
response with TMD for frequency ratio=0.8 ................................................................................ 43
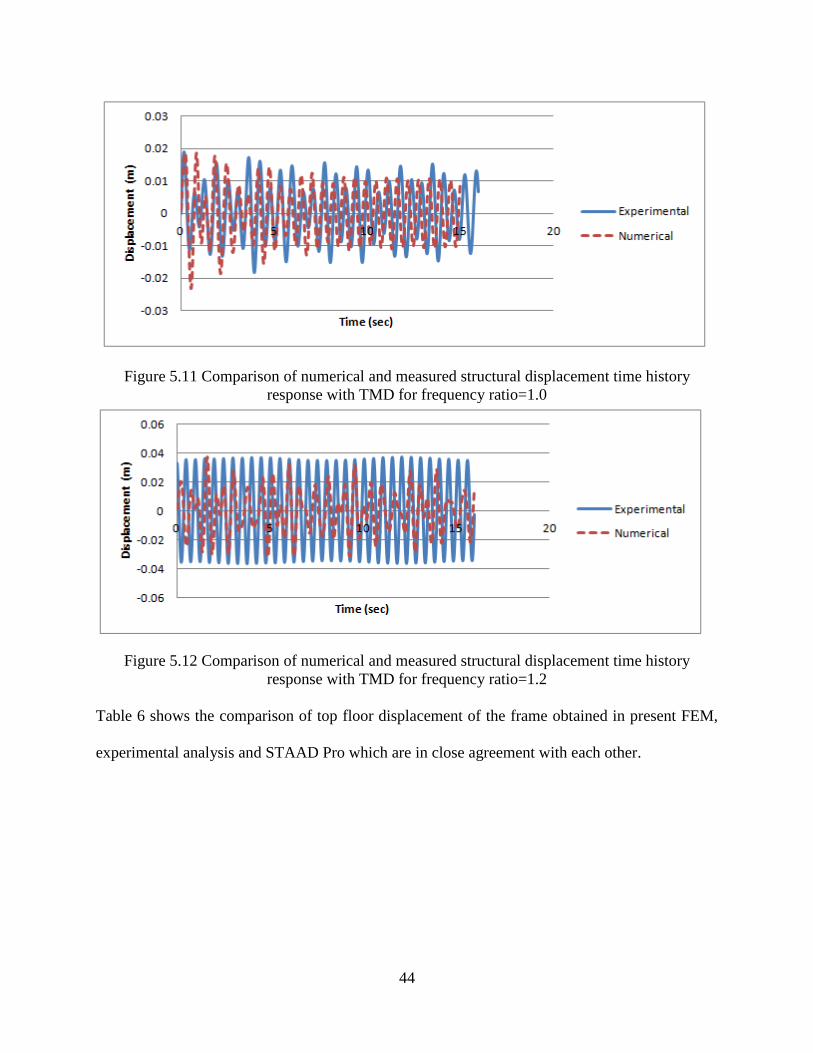
Figure 5.11 Comparison of numerical and measured structural displacement time history
response with TMD for frequency ratio=1.0 ................................................................................ 44
Figure 5.12 Comparison of numerical and measured structural displacement time history
response with TMD for frequency ratio=1.2 ................................................................................ 44
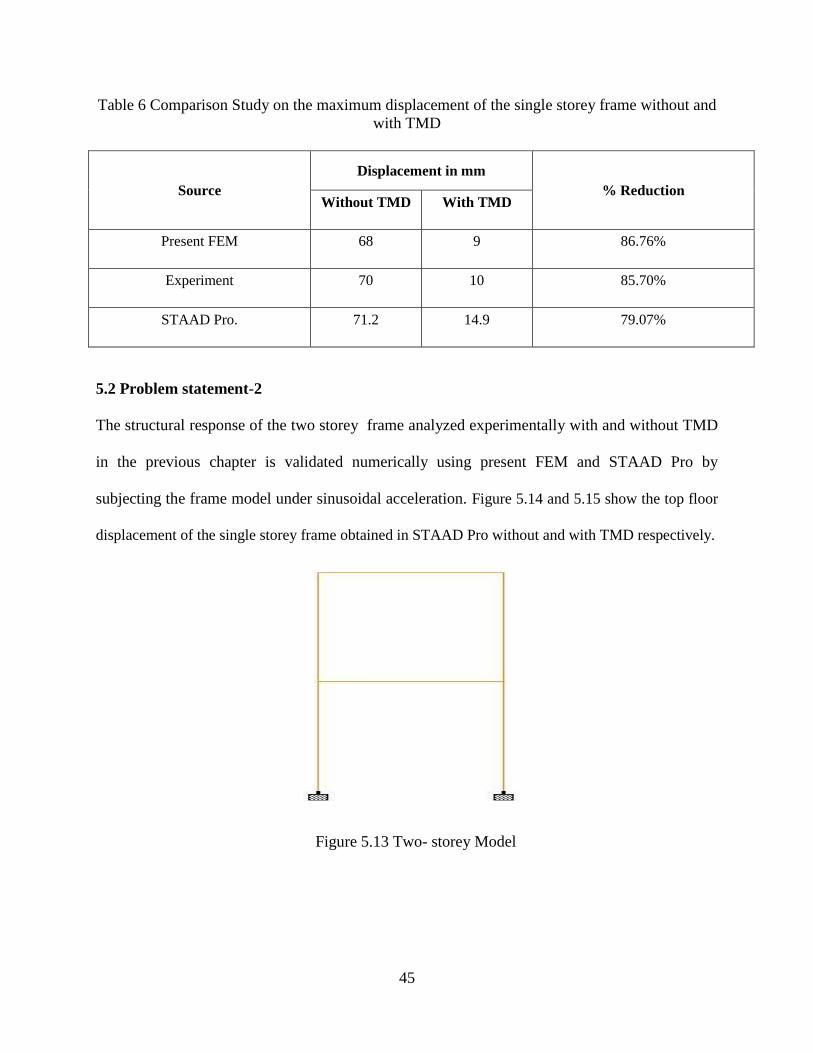
Figure 5.13 Two- storey Model .................................................................................................... 45
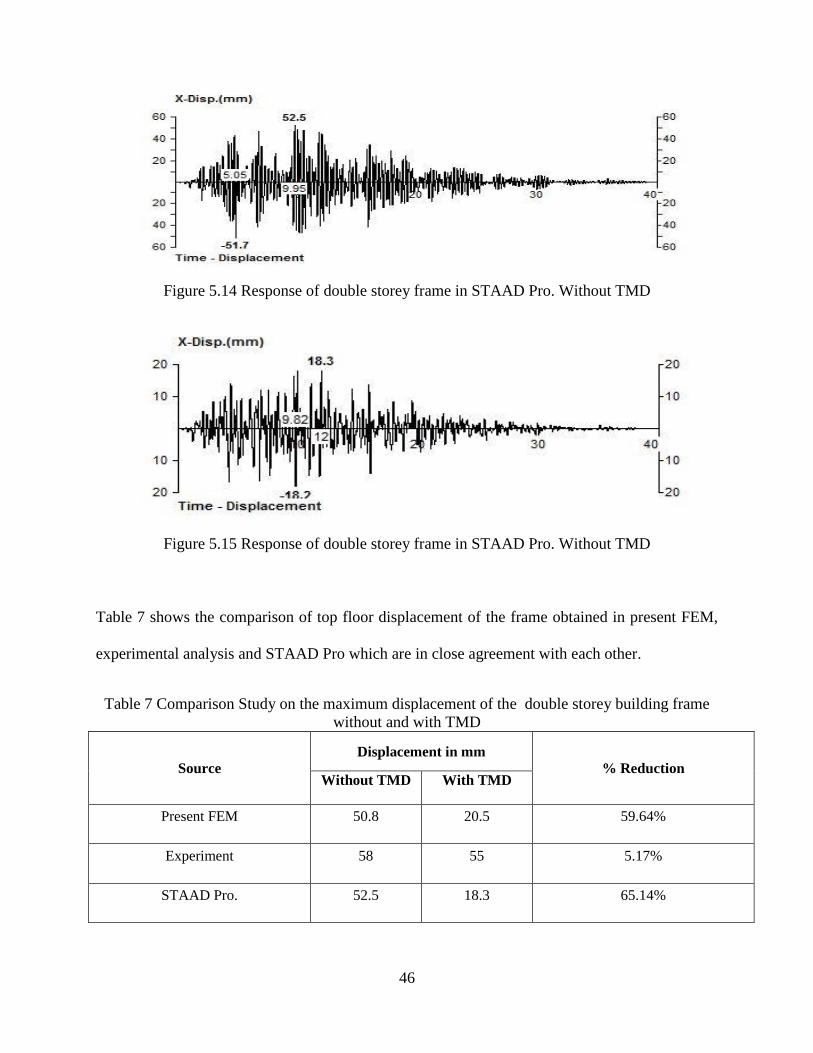
Figure 5.14 Response of double storey frame in STAAD Pro. Without TMD ............................ 46
vii
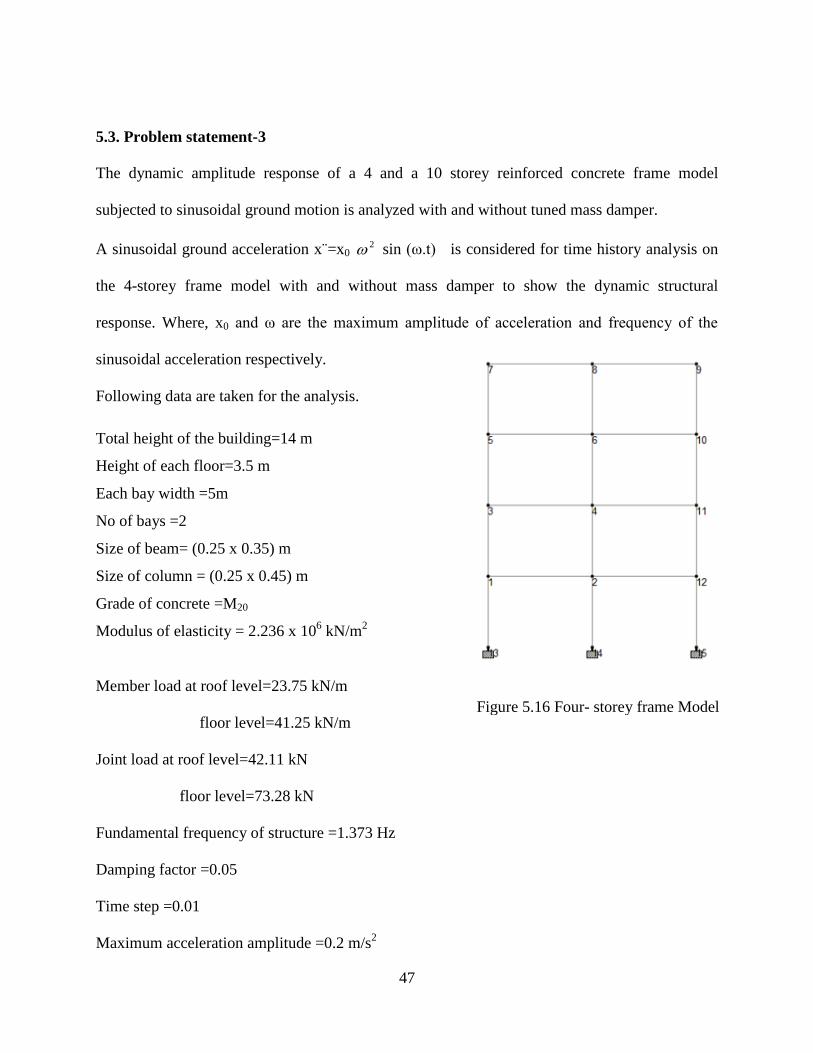
Figure 5.15 Response of double storey frame in STAAD Pro. Without TMD ............................ 46
Figure 5.16 Four- storey frame Model .......................................................................................... 47
Figure 5.17 Response of 4-storey RC frame in STAAD Pro. Without TMD ............................... 49
Figure 5.18 Response of 4 storey RC frame in Present FEM. Without TMD .............................. 49
Figure 5.19 Response of 4-storey RC frame in STAAD Pro. With TMD .................................... 49
Figure 5.20 Response of 4-storey RC frame in Present FEM. With TMD ................................... 49
Figure 5.21 Ten- storey frame Model ........................................................................................... 50
Figure 5.22 Response of 10-storey RC frame in Present FEM. without TMD ............................ 51
Figure 5.23 Response of 10-storey RC frame in STAAD Pro without TMD .............................. 51
Figure 5.24 Response of 10-storey RC frame in Present FEM with TMD................................... 52
Figure 5.25 Response of 10-storey RC frame in STAAD Pro. with TMD ................................... 52
Figure 5.26 Displacement time histories response of the 10 storey frame with and without TMD
at various mass ratio...................................................................................................................... 54
Figure 5.27 Variation of displacement response with mass ratio ................................................. 55
Figure 5.28 Variation of displacement response with damping ratio ........................................... 56
viii
LIST OF TABLES
Table 1 Parameters of beating phenomenon ................................................................................. 26
Table 2 Different parameters of single storey frame model with TMD ....................................... 29
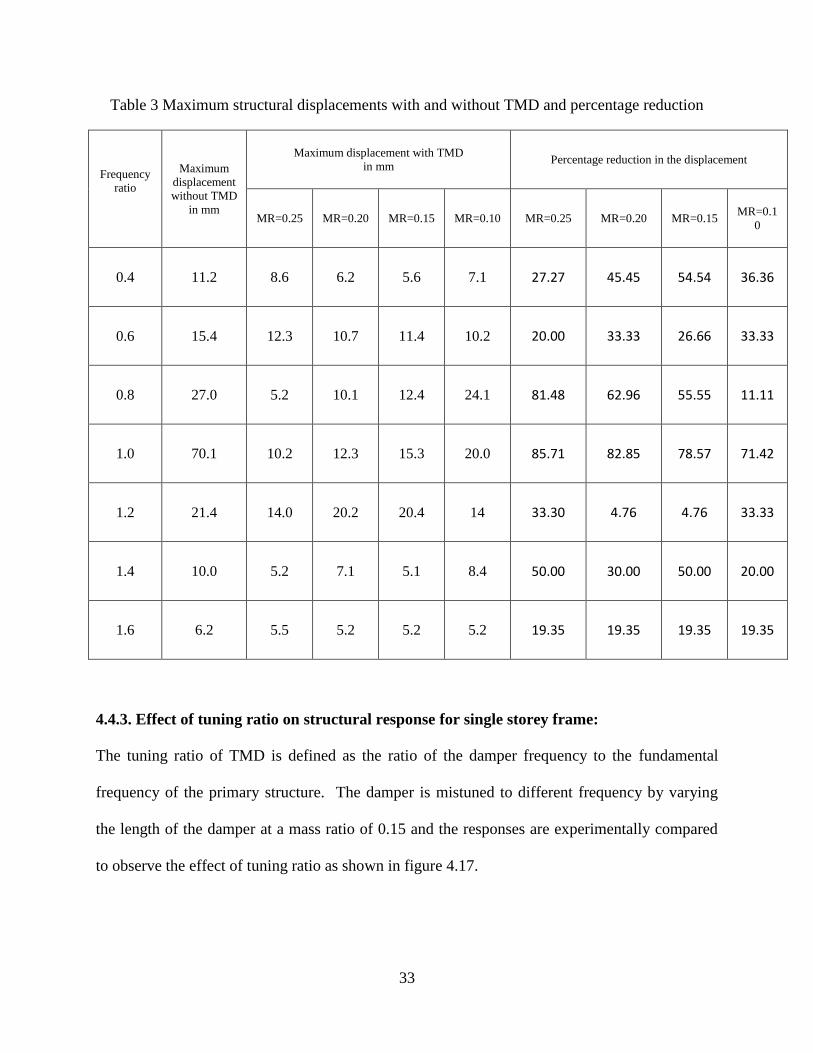
Table 3 Maximum structural displacements with and without TMD and percentage reduction .. 33
Table 4 Damper parameters at different tuning ratio .................................................................... 34
Table 5 Different parameters of single storey frame model ......................................................... 37
Table 6 Comparison Study on the maximum displacement of the single storey frame without and
with TMD...................................................................................................................................... 45
Table 7 Comparison Study on the maximum displacement of the double storey building frame
without and with TMD.................................................................................................................. 46
Table 8 Free vibration frequency of 4-storey frame without TMD ............................................. 48
Table 9 Comparison Study on the maximum displacement of the 4-storey frame without and with
TMD .............................................................................................................................................. 50
Table 10 Free vibration frequency of 10-storey frame without TMD .......................................... 51
Table 11 Comparison Study on the maximum displacement of the 2D 10-storey frame building
without and with TMD.................................................................................................................. 52
Table 12 Storey displacement when damper is tuned to different modal frequency .................... 53
Table 13 Response of the structure with TMD at various mass ratios ......................................... 55
1
Chapter 1
1. INTRODUCTION
1.1 Introduction:
Earthquake is a compartment of structural analysis which involves the computation of the
response of a structure subjected to earthquake excitation. This is required for carrying out the
structural design, structural assessment and retrofitting of the structures in the regions where
earthquakes are prevalent.
Now a day number of tall buildings are going on increasing which are quite flexible and having
very low damping value to minimize increasing space problems in urban areas. These structures
should be designed to oppose dynamic forces through a combination of strength, flexibility and
energy absorption such that it may deform beyond elastic limit when subjected to severe
earthquake motion. To make these structures free from earthquake and wind induced structural
vibration, various techniques has been adopted which can be broadly classified into 4 categories.
(i) Active control, (ii) Passive control, (iii) Semi-active control and (iv) Hybrid control.
1.1.1 Active control devices:
These devices use an external power source which operates control actuators to apply forces to
the structures. Some signals are sent to the actuators which are a function of responses of the
structure. Requirement of equipments are more in active control strategies than passive control
thereby increasing the cost and maintenance of such systems. Active tuned mass damper, active
tuned liquid column damper and active variable stiffness damper are some of the examples of
active control devices.Applications - AMD on Kyobashi Seiwa Building, Duox on ANDO
Nighikicho, Trigon on Shinjuku Tower.
2
1.1.2. Passive control devices:
It is a device which imparts forces that are developed in response to the motion of the structures.
By absorbing some of the input energy, it reduces the energy dissipation demand on the
structure. Therefore no external power source is required to add energy to the structural system.
Base isolation, tuned mass dampers (TMD), tuned liquid dampers (TLD), metallic yield
dampers, viscous fluid dampers are some of the examples of passive control devices.
Applications - city halls of Oakland, US Court of Appeals in San Francisco (Friction Pendulum),
NZ Parliament Building and the associated Assembly Library and the new Museum of NZ, USC
Teaching Hospital in Los Angeles, Matumura Research Institute building in Kobe.
1.1.3. Semi-active control devices:
It is a controllable passive control system where the external energy requirement is less than that
of active devices. It unites the optimistic aspects of passive and active control devices. These
devices generate forces as a result of the motion of the structure and cannot add energy to the
structural system. Variable orifice dampers, variable friction dampers, variable stiffness damper,
and controllable fluid dampers are some of the examples of semi active control devices.
Applications- Kajima Shizuoka Building in Shizuoka, Japan, Walnut Creek Bridge in Oklahoma,
11-storey building CEPCO Gifu Japan, Keio University School of Science and Technology
Tokyo in Japan. Dongting Lake Bridge in Hunan, China.
1.1.4. Hybrid control Devices:
These devices combine the passive, active or semi-active devices to achieve higher level of
performance. Since a portion of the control objective is accomplished by the passive system, less
active control effort, implying less power resource, is required. A side benefit of hybrid systems
is that, in the case of a power failure, the passive components of the control still offer some
3
degree of protection, unlike a fully active control system. Examples of hybrid control devices
include hybrid mass damper and hybrid base isolation.
Applications- Sendagaya INTES building in Tokyo
1.2. Tuned mass damper:
Tuned mass damper is a passive control device connected to the structure like a secondary mass
to reduce the dynamic response of the structure and increases the damping capacity. It has been
widely used for vibration control in many mechanical engineering systems. Recently many
theories have been adopted to reduce vibration in civil engineering structures because of its easy
and simple mechanism. To obtain optimum response the natural frequency of the secondary mass
is always tuned to that of primary structure such that when that particular frequency of the
structure get excited, the TMD will resonate out of phase with the structural motion. The excess
amount of energy built up in the structure is transformed to the secondary mass and dissipated
due to relative motion developed between them at a later stage.
1.3. Practical implementation:
Till date many tuned mass dampers has been installed worldwide. Centre point Tower in Sydney,
Australia is the first structure in which TMD was installed.
TMD is also installed in two buildings of United state. One is Citicorp Centre in New York City
with its height 279 m, placed on the 63rd
floor in topmost point of the structure, having a mass of
366 mg, with a linear damping from 8-14%, reducing the amplitude of the building by 50%.
Two dampers are installed in 60th
floor of John Hancock Tower , Boston to reduce wind reduce
structural vibration, each having its weight 2700 kN with a lead filled steel box 5.2 m square and
1m deep sliding on a 9m long steel plate.
4
Berlin TV tower, one of the tallest structures of Germany constructed between 1965 and 1969
with its height of 368 meters is installed with a tuned mass damper. The entrance of observation
deck is 6.25 m above ground with 2 kone lifts for transport of visitors. Weight of the sphere is
4800 tones and diameter is 32 m. There is a steel stairway with 986 steps.
Burj Al Arab, a luxury hotel in Dubai, is the 3rd
tallest hotel in the world is installed with 11
tuned mass damper. 39% of the total height is made up of non-occupiable space. There is helipad
210 m above sea level which provides an opportunity to arrive or depart from Burj Al Arab by
helicopter and admire the city from a different perspective.
Perk Tower, Chicago, 257 m tall with 70 floors is the eleventh tallest building in Chicago,
the 39th tallest building in the United States, and the eighty-third tallest in the world and the 1st
structure in United state to be designed with a tuned mass damper to counteract the wind effect
on the structure. It is a 300 ton massive steel pendulum damper hanging from 4 cables inside a
cage which stabilizes the building from swaying in the wind.
Taipai 101, Taiwan was the world’s tallest building from 2004 to 2010, consists of 101 floors
and 5 underground floor, equipped with a steel pendulum that serves as a tuned mass damper
suspended from the 92nd to the 87th floor. The pendulum sways to offset movements in the
building caused by strong gusts. It is the largest damper sphere in the world, consists of 41
circular steel plates of varying diameters, each 125 mm thick, welded together to form a 5.5 m
diameter sphere. Two additional tuned mass dampers, each weighing 6 tonnes (7 short tons), are
installed at the tip of the spire which help prevent damage to the structure due to strong wind
loads.
Spire of Dublin (Monument of Light), 121.2 m in height is the largest stainless steel monument
located in Dublin, Ireland. It has an elongated cone of diameter 3 m at the base and narrowing to
5
15 cm at the top. It is constructed from eight hollow tubes of stainless steel and equipped with
a tuned mass damper to counteract sway.
The Akashi Kaikyo Bridge (Pearl Bridge) located in Japan has had the longest span of any
suspension bridges in world. It has 3 spans with central span 1991 m and two others each 960 m
long, designed to allow the structure to withstand winds of 286 km/Hr and earthquake of
magnitude 8.5. A tuned mass damper is designed to operate at a resonance frequency of the
bridge to increase the damping value.
One wall centre (Sheraton Vancouver Wall Centre Hotel) with height 157.8 m, 48 storey hotel in
Canada is installed with tuned water damper at the highest point of the building consisting of two
water tanks and the tanks are designed to counteract the harmonic frequency of the building.
John Hancock tower (Hancock Place ) is a 60 storey tower in Boston equipped with two 300 ton
weight mass dampers on 58th floor made up of steel box, filled with lead. Both the weights are
rested on steel plates which are lubricated for free sliding of weights. But the weight is attached
to the steel frame of the building by means of springs and shock absorbers. When the Hancock
sways, the weight tends to remain still, allowing the floor to slide underneath it. Then, as the
springs and shocks take hold, they begin to tug the building back. The effect is like that of a
gyroscope, stabilizing the tower. The reason there are two weights, instead of one, is so they can
tug in opposite directions when the building twists. The cost of the damper was $3 million. The
dampers are free to move a few feet relative to the floor.
6
Figure 1.1 Practical implementation of tuned mass damper
Berlin TV tower,
Germany
CN Tower,
Toronto
Akashi Bridge,
Japan
Trump world
Tower, New york
Yokohama
Tower Japan
Center point
Tower, Sydney
Burj Al Arab,
Dubai Burj Dubai John Hancock
Tower
Citigroup Center,
New York
Taipei101,
Taiwan
Spire of Dublin
Ireland
Park Tower,
Chicago
Shanghai world
Financial center
One wall
Centre, Canada
7
Chapter 2
2. LITERATURE REVIEW
2.1. Literature Review:
Till date TMD has been studied by many researchers. The thought of TMD was first used by
Frahm in 1909 to diminish the undulating motion of ships as well as ship hull vibrations. Later
Hartog in 1940 developed analytical model for vibration controlling power of TMD. Later he
optimized TMDs parameter for sinusoidal excitations. Fahim et al. (1997) considered different
parameters like mass ratio, frequency ratio, damping ratio etc to obtain the optimum parameters
which are used to compute the response of various single degree of freedom and multi degree of
freedom structures with TMD at different earthquake excitation. The optimum parameters
obtained are helpful in reducing the displacement and acceleration response significantly.
Wu et al. (1999) considered soil structure interaction in seismic response of tuned mass damper
when fixed on a flexible based structure. A frequency independent model is used which covers a
wide range of soil and structural characteristics. A stationary excitation is given to the model
structure and the responses are used to measure the performance of TMD. It was observed that
strong soil structure interaction considerably defeats the seismic effectiveness of TMD systems.
Reduction in maximum response of the structure reduces with decrease in soil shear wave
velocity. For any structure over soft soil, TMD structure is less effective in reducing the response
due to high damping characteristics of soil structure system. The model is also subjected to NS
component of the 1940 El Centro, California earthquake to observe the effectiveness of TMD in
a realistic environment.
8
Nagashima et al. (2001) developed a hybrid mass damper (HMD) and applied it to a 36 storey
high rise building with a bi-axial eccentricity, located in Tokyo. The system uses a gear type
pendulum which make the natural period of the auxiliary mass relatively long minimizing the
height of the device and a linear actuator which ensures smooth and noiseless operation of the
system. Transverse torsion coupled vibration is controlled by two HMD systems and various
feedback control techniques has been developed to consume the capacity of HMD system for any
external excitation. Free vibration tests as well as control of wind vibrations of the building
induced by the Typhoon 9810 in 1998 were used to verify the performance of the control system.
It was observed that the acceleration responses of the building were reduced to 63 % and 47 % of
the corresponding uncontrolled accelerations. Setareh (2001) studied the application of semi-
active tuned mass dampers to base excitation systems. A single-degree-of-freedom system was
subjected to sinusoidal base excitations and a damper was used to reduce the vibration. A new
class of damper known as ground hook tuned mass damper (GHTMD) was used and optimum
design parameters were obtained based on the minimization of steady state amplitude response
of the main structure for different mass ratio and damping ratio. Frequency response was
compared with and without TMD. In this paper, a design guide was presented based on non
dimensional values to find optimum parameters of GHTMD.
Li and Liu (2002) manufactured an active multiple tuned mass damper (AMTMD) for structures
subjected to ground acceleration keeping the stiffness and damping constant and varying the
mass. Vibration in the structure is controlled by mode reduced order method. A numerical
searching technique is used to demarcate the effect of optimum dynamic parameters on the
strength of AMTMD. The parameters include the frequency spacing, damping ratio and
frequency ratio and acceleration feedback gain coefficient. They compare the results of MTMD
9
and AMTMD and concluded that it can effectively reduce the vibration of the structure under
ground acceleration. The AMTMD can also increase the performance of MTMD and more
effective than ATMD.
Samali et al. (2003) described a five storey model using an active tuned mass damper by Fuzzy
Logic Controller and linear quadratic regulator under earthquake excitation and a comparison is
made. The effect of mass ratio and frequency ratio is conducted using fuzzy controller because of
its ability to handle any non linear behavior of the structure. Chen and Wu (2003) numerically
observed the effect of multiple tuned mass damper (MTMD) and compared the results with tuned
mass damper (TMD). A three storey building frame was subjected to white noise excitation and
tested in shake table. The results observed that multiple tuned mass dampers are more effective
than tuned mass dampers in reducing the floor acceleration. The experimental and numerical
results are compared and dynamic properties of the structure are validated successfully.
Li (2003) numerically observed the performance of multiple active-passive tuned mass dampers
(MAPTMD) to prevent vibration of single degree of freedom structures subjected to ground
acceleration with a uniform distribution of natural frequency. The MAPTMD generates a
controlling force by keeping the displacement and velocity response gain and changing the
acceleration response gain. Conclusion has been made that maximum tuning frequency ratio of
MAPTMD decreases with increasing mass ratio and the effectiveness increases with the increase
in mass ratio.
Chen and Wu (2004) studied experimentally to reduce the seismic responses of a three-storey
building structure by using multiple tuned mass dampers. They identified various dynamic
properties of both structure and damper from free and forced vibration analysis. The structure
was analyzed numerically with and without dampers and tested on shake table under white noise
10
excitation. Damper parameters are studied. Ghosha and Basu (2004) observed the effect of soil
structure interaction and concluded that when the soil becomes stiff, it allows the foundation to
move relative to the surrounding soil which changes the soil foundation system from that of the
fixed base. In such a case a conventional TMD loses its effectiveness in controlling the response
of the structure to base excitation. So to avoid the effect of SSI, it is necessary to tune the damper
to the fundamental frequency of the structure–foundation system. It is also essential to provide
damping in the TMD greater than the critical damping to ensure response reduction of the
structure. Chouw (2004) studied the behavior of soil structure interaction with tuned mass
dampers during near source earthquake at two different places varying the natural frequency of
the dampers. They used the ground motions at the stations SCG and NRG of the 1994 Northridge
earthquake for their study and concluded that soil structure interaction and ground motion can
increase or decrease the effect of TMD.
Kwok and Samali (2006) carried out some experimental verifications of both active and passive
TMD and compare the results with parametric study which are very useful in selection of
optimal TMD parameters. 40-50% reduction in wind induced response & an additional damping
of 3-4% of critical damping by using passive system and 2/3rd
reduction in wind induced
response & an additional damping of 10% of critical damping by using active system was
obtained from their experimental investigation.
Saidi et al. (2007) developed a Tuned mass damper using viscoelastic material and concluded
that TMD is effective when tuned to the natural frequency over a narrow band. They also
describe the process of estimation of viscous damping of a damper made up of viscoelastic
material. For any given floor mass, damping and stiffness a damper can be an economical and
simple solution for retrofitting floors with excessive vibrations. Ueng et al.(2007) studied the
11
practical design issues of tuned mass dampers for torsionally coupled buildings under earthquake
loadings and determined the optimal PTMD system parameters by minimizing the mean square
displacement response ratio on the top floor of buildings with and without PTMDs.
Wong (2008) studied dissipation of seismic energy in inelastic structures with tuned mass
dampers. By using the force analogy method, an inelastic structure is modeled which is chosen
as the base of plastic energy dissipation analysis in the structure. Energy response reduction after
using TMD is also studied by using plastic energy spectra for various levels of structural
yielding. The use of TMD increases the capacity of the structure to accumulate huge amounts of
energy inside the TMD that will be released afterward in the form of damping energy. It reduces
the plastic energy dissipation and increases the damping energy dissipation.
Alexander and Schilder (2009) proposed the performance of nonlinear tuned mass damper. A
two degree of freedom system with a cubic nonlinearity is modeled. The nonlinearity is
originated from geometric arrangement of two pairs of springs. One pair helps in providing
linear stiffness whereas the other pair rotates as they extend and helps in hardening spring
stiffness. In this paper a software AUTO has been used to study numerically the periodic
response of a nonlinear tuned mass damper and the optimum design parameters has been
observed. Lourenco et al.(2009) performed some experimental work taking a pendulum tuned
mass damper with advantageous over conventional TMD. They did some simulation study
considering the three dimensional behavior of pendulum mass and found that the frequency can
be re tuned by changing the cable length.
Lin et al.(2010) studied the vibration control of seismic structures using semi-active friction
multiple tuned mass dampers. In this paper a semi active friction type multiple tuned mass
damper (SAF-MTMD) is developed to control vibration in seismic structures. Since a friction
12
type mass damper is same as a conventional mass damper if the static frictional force inactivates
the mass damper. Various friction mechanisms have been used to activate all the mass units of
friction type multiple tuned mass damper during earthquake. A comparison study is made with a
passive friction type multiple tuned mass dampers and concluded that SAF-MTMD effectively
reduces the seismic motion particularly at a larger intensity. Islam and Ahsan (2012) optimized
Tuned mass damper parameters using evolutionary operation algorithm and determined the
optimum parameters of TMD in reducing the top storey response of the structure by using an
evolutionary algorithm. They used El Centro NS earthquake to develop a computer program and
found a higher percentage of reduction on the roof of a ten storey structure using TMD with the
application of EVOP.
2.2. Objective and scope of present work:
The objective of the present work is to study experimentally and numerically the application of
TMD to control vibration of both single and multi storey frame structure under sinusoidal
excitation.
The scope of the work includes experimental modeling and analysis of single and multi-storey
building frame under horizontal excitation with and without TMD considering different
parameters like mass ratio, frequency ratio, tuning ratio. Linear time history analysis is carried
out using finite element method and STAAD Pro with and without TMD under sinusoidal
ground acceleration. The Newmark Beta method is used to solve the dynamic equations for the
structure-TMD system.
13
Chapter 3
3. METHODOLOGY
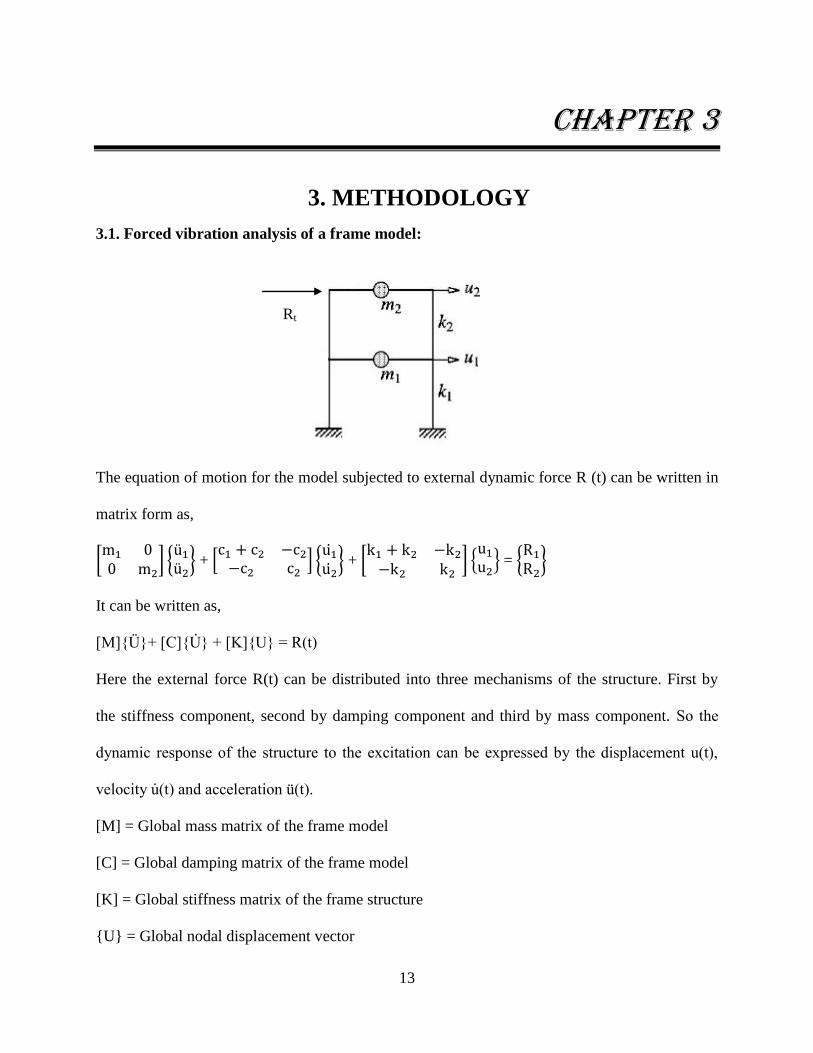
3.1. Forced vibration analysis of a frame model:
The equation of motion for the model subjected to external dynamic force R (t) can be written in
matrix form as,
[
] {
} + [
] {
} + [
] {
} = {
}
It can be written as,
{ C { { t
Here the external force R(t) can be distributed into three mechanisms of the structure. First by
the stiffness component, second by damping component and third by mass component. o t
dyn m r spons o t stru tur to t x t t on n xpr ss d y t d spl m nt u t
v lo ty u t nd l r t on t
[M] = Global mass matrix of the frame model
[C] = Global damping matrix of the frame model
[K] = Global stiffness matrix of the frame structure
{U} = Global nodal displacement vector
Rt
14
{ = Global nodal velocity vector
{Ü}= Global nodal acceleration vector
R(t) = Applied external force
A static analysis can be done using a simple linear equation [A]{x}={B}. Because in such a
analysis time does not play any role. But dynamic analysis follows a complex governing
equation like { C { { t which depends on time.
Therefore, when a single degree of freedom system is subjected to a ground acceleration which
varies arbitrarily with time, analytical solution of the equation of motion is usually not possible.
Such problems can be solved by numerical time steeping methods to integrate the differential
equations. It can be done by two approaches.
(i) Implicit integration
(ii) Explicit integration
Implicit solution is one in which the calculation of current quantities in one time step are based
on the quantities calculated in the previous time step. This is called Euler Time Intergration
Scheme. In this scheme even if large time steps are taken, the solution remains stable. This is
also called an unconditionally stable scheme. This algorithm requires the calculation of inverse
of stiffness matrix, since in this method we are directly solving for {U} vector and calculation of
an inverse is a computationally intensive step. It is used in Newmarks beta method.
In an explicit analysis, instead of solving for {U}, we go for solving {U"}. Thus we bypass the
inversion of the complex stiffness matrix, and we just have to invert the mass matrix [M]. In case
lower order elements are used, which an explicit analysis always prefers, the mass matrix is also
a lumped matrix, or a diagonal matrix, whose inversion is a single step process of just making
the diagonal elements reciprocal. Hence this is very easily done. But disadvantage is that the
15
Euler Time integration scheme is not used in this, and hence it is not unconditionally stable. So
we need to use very small time steps. It is used in Wilson-theta method
3.2. Solution of forced vibration analysis by Newmark-Beta method:
Newmark-Beta method is an unconditionally stable time stepping implicit method primarily used
for analysis of structural dynamics problems based on the following two equations. It is also
known as constant average acceleration method.
t ∆t t + [(1-δ t δ t ∆t ∆t………………………………………………………… .(1)
U t ∆t = Ut t) ∆t 0 5-α) Üt + (α) Ü t ∆t ∆t2………………………………………… … 2
T two p r m t rs δ nd α r t r z t l ration variation over a time step and verify
the stability and integration accuracy characteristics of the method.
δ 0 5 α 0 25 or onst nt v r g l r t on m t od
M t ∆t Ü + C t ∆t t ∆t U = R t ∆t…………………………………………………… … 3
Equation (2) is solved for Ü t ∆t in terms of U t ∆t and substituted in equation (1) to get equations
for Ü t ∆t nd t ∆t in terms of unknown U t ∆t After putting these two equations in equation (3) ,
we can obtain U t ∆t using which t ∆t and Ü t ∆t can be calculated.
An implicit integration scheme solution is obtained using the equation,
K t+∆t U = R t+∆t
3.3. Step-by-step solution using Newmark integration method:
1. Formation of stiffness matrix K, mass matrix M and damping matrix C whichever is required.
2. Selection of time steps ∆t
16
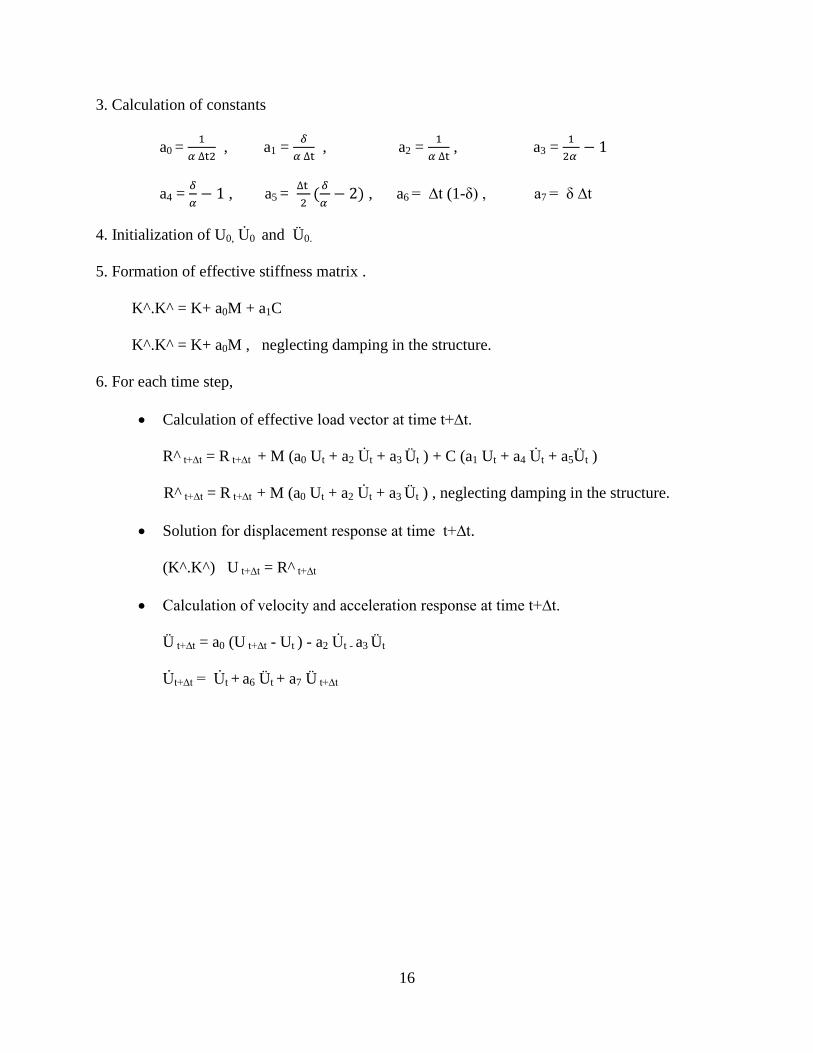
3. Calculation of constants
a0 =
, a1 =
, a2 =
, a3 =
a4 =
, a5 =
, a6 ∆t (1-δ 7 δ ∆t
4. Initialization of U0, 0 and Ü0.
5. Formation of effective stiffness matrix .
K^.K^ = K+ a0M + a1C
K^.K^ = K+ a0M , neglecting damping in the structure.
6. For each time step,
Calculation of effective lo d v tor t t m t ∆t
R^ t ∆t = R t ∆t + M (a0 Ut + a2 t + a3 Üt ) + C (a1 Ut + a4 t + a5Üt )
R^ t ∆t = R t ∆t + M (a0 Ut + a2 t + a3 Üt ) , neglecting damping in the structure.
Solution or d spl m nt r spons t t m t ∆t.
(K^.K^) U t ∆t = R^ t ∆t
C l ul t on o v lo ty nd l r t on r spons t t m t ∆t
Ü t ∆t = a0 (U t ∆t - Ut ) - a2 t - a3 Üt
t ∆t t + a6 Üt + a7 Ü t ∆t
17
Chapter 4
4. EXPERIMENTAL STUDY
4.1. Introduction:
Tuned mass damper is a low cost seismic protection technique which is implemented in many
tall building and tower in the world without interrupting the use of the building. Thus till now
various research works have been conducted to discover the effect of TMD to reduce the seismic
shaking of the structure numerically. But experimental works under this field is quite limited.
The motive of this study is to reduce the response by attaching a tuned mass damper to the
structure under sinusoidal loading and also to obtain the effect of various parameters such as
mass ratio, frequency ratio, tuning ratio etc. on response of the structure. Ratio of damper mass
to the mass of the structure is known as mass ratio, ratio of excitation frequency to the
fundamental frequency of the structure is known as frequency ratio and the ratio of damper
tuning frequency to structural frequency is known as tuning ratio.
For this experiment, shaking table test is conducted to study the dynamic behavior of a single
and a double frame structure with and without TMD where it is subjected to sinusoidal ground
motion. The structure is rigidly attached to the shaking table platform. The weight of the
structure may be regarded as concentrated at the roof level. Since a sinusoidal motion consists of
a single frequency, it will provide a better understanding of the behavior of TMD-structure
system. The fundamental frequency of the structure is determined from free vibration analysis.
18
Force vibration analysis is carried out by exciting the frame at various frequencies and the
response is recorded.
Signal study is usually divided into time and frequency domains; each domain gives a different
outlook and insight into the nature of the vibration.
Time domain analysis starts by analyzing the signal as a function of time. A signal analyzer can
be used to develop the signal. The time history analysis plots give information that helps describe
the behavior of the structure. Its behavior can be characterized by measuring the maximum
vibration level.
Frequency analysis also provides valuable information about structural vibration. Any time
history signal can be transformed into the frequency domain. The most common mathematical
technique for transforming time signals into the frequency domain is called the Fourier
Transform. Fourier Transform theory says that any periodic signal can be represented by a series
of pure sine tones. In structural analysis, usually time waveforms are measured and their Fourier
Transforms are computed. The Fast Fourier Transform (FFT) is a computationally optimized
version of the Fourier Transform. With test experience, one can gain the ability to understand
structural vibration by studying frequency data.
19
4.2. Experimental set up:
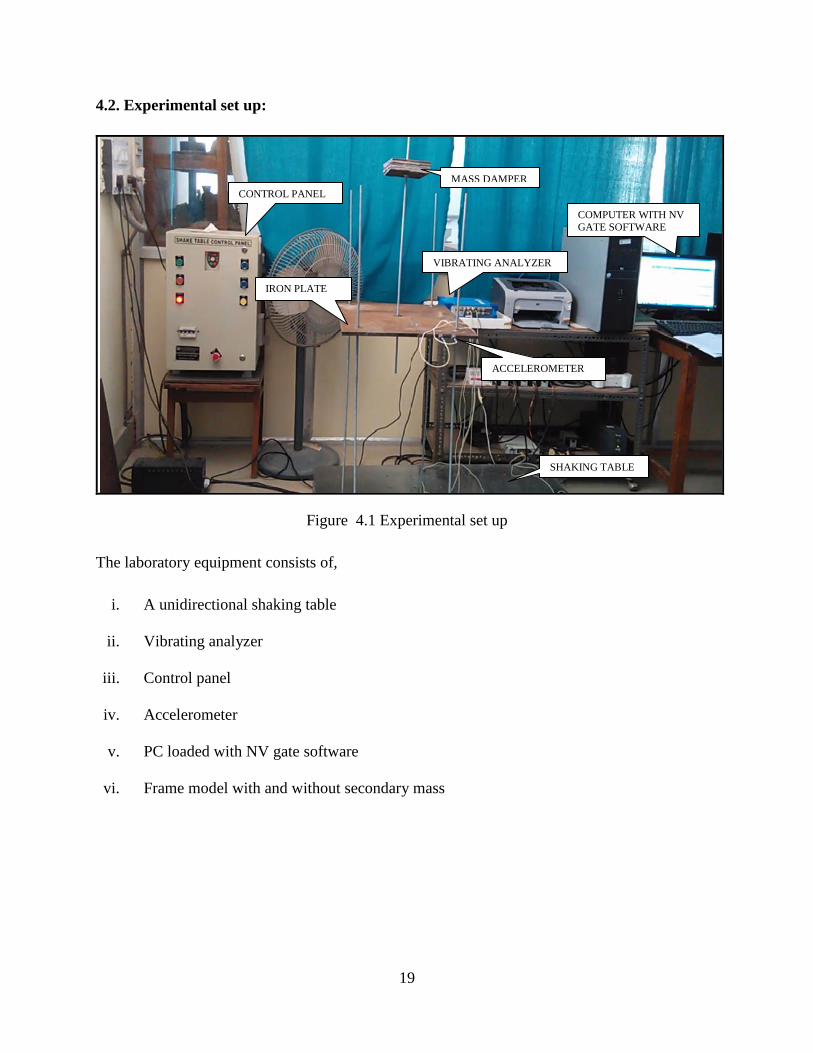
Figure 4.1 Experimental set up
The laboratory equipment consists of,
i. A unidirectional shaking table
ii. Vibrating analyzer
iii. Control panel
iv. Accelerometer
v. PC loaded with NV gate software
vi. Frame model with and without secondary mass
COMPUTER WITH NV
GATE SOFTWARE
VIBRATING ANALYZER
ACCELEROMETER
SHAKING TABLE
CONTROL PANEL
MASS DAMPER
IRON PLATE
20
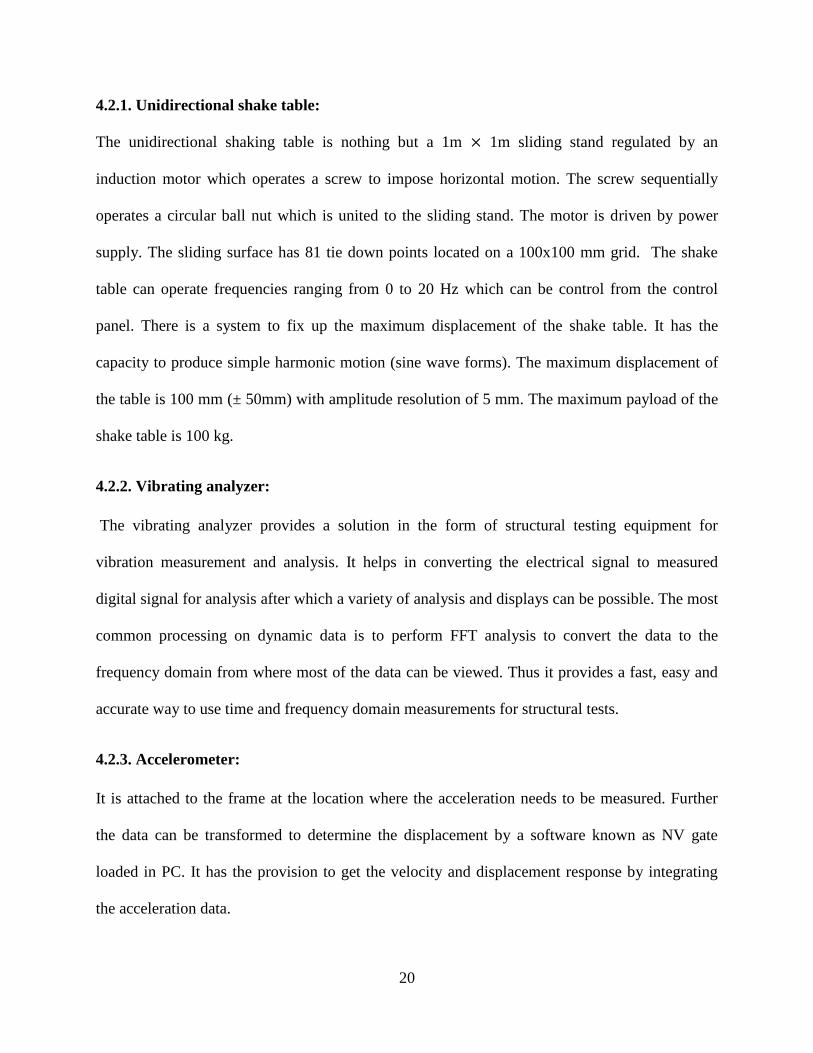
4.2.1. Unidirectional shake table:
The unidirectional shaking table is nothing but a 1m 1m sliding stand regulated by an
induction motor which operates a screw to impose horizontal motion. The screw sequentially
operates a circular ball nut which is united to the sliding stand. The motor is driven by power
supply. The sliding surface has 81 tie down points located on a 100x100 mm grid. The shake
table can operate frequencies ranging from 0 to 20 Hz which can be control from the control
panel. There is a system to fix up the maximum displacement of the shake table. It has the
capacity to produce simple harmonic motion (sine wave forms). The maximum displacement of
the table is 100 mm (± 50mm) with amplitude resolution of 5 mm. The maximum payload of the
shake table is 100 kg.
4.2.2. Vibrating analyzer:
The vibrating analyzer provides a solution in the form of structural testing equipment for
vibration measurement and analysis. It helps in converting the electrical signal to measured
digital signal for analysis after which a variety of analysis and displays can be possible. The most
common processing on dynamic data is to perform FFT analysis to convert the data to the
frequency domain from where most of the data can be viewed. Thus it provides a fast, easy and
accurate way to use time and frequency domain measurements for structural tests.
4.2.3. Accelerometer:
It is attached to the frame at the location where the acceleration needs to be measured. Further
the data can be transformed to determine the displacement by a software known as NV gate
loaded in PC. It has the provision to get the velocity and displacement response by integrating
the acceleration data.
21
4.2.4. Control panel:
The control panel is managed by an input voltage of 440 volts. It can control the excitation
frequency of the shake table ranging from 0- 20 Hz.
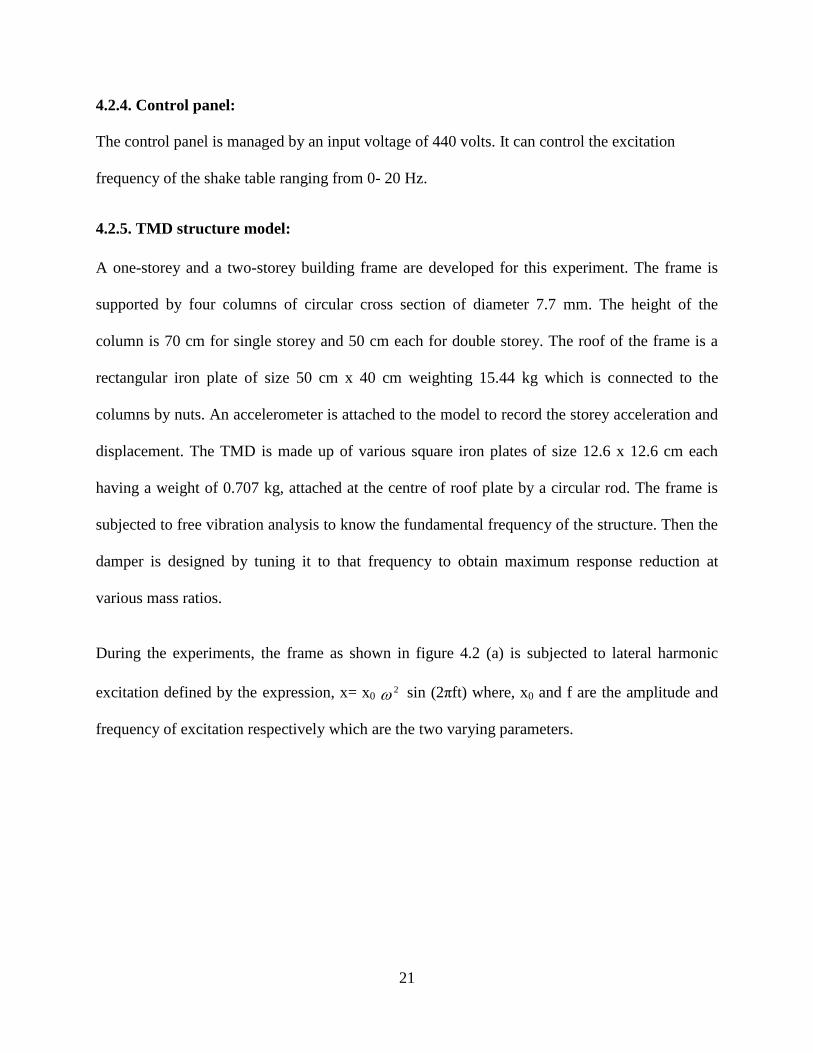
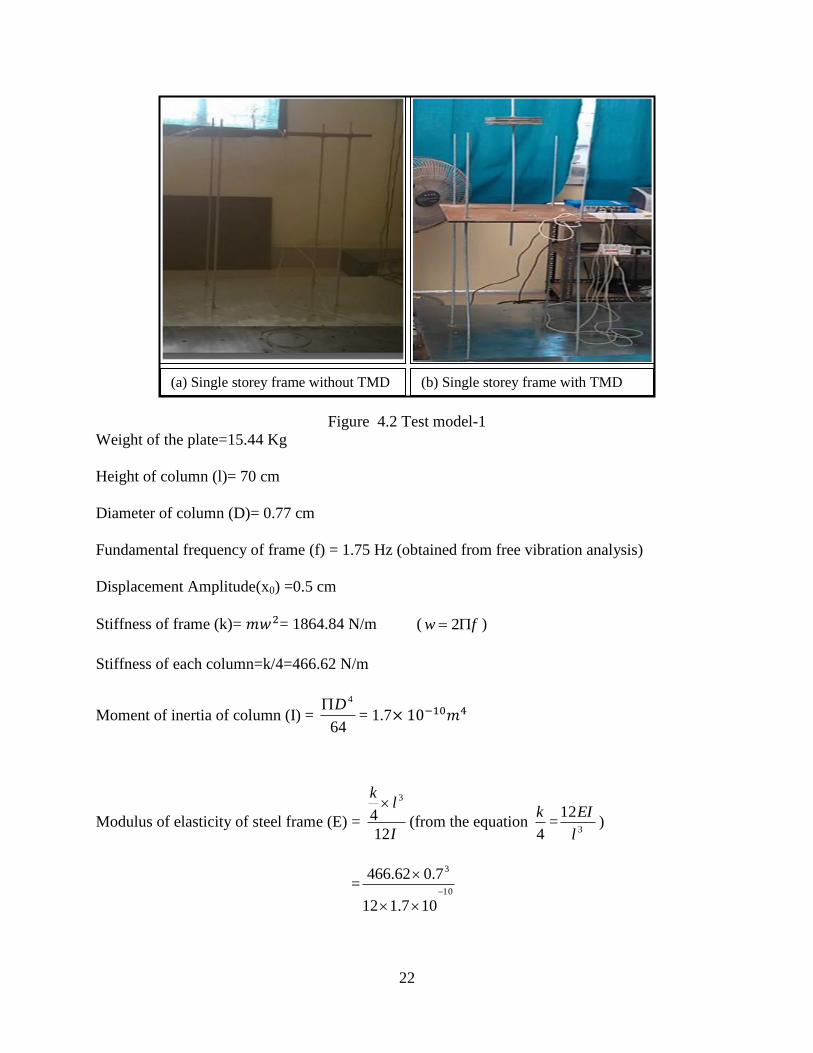
4.2.5. TMD structure model:
A one-storey and a two-storey building frame are developed for this experiment. The frame is
supported by four columns of circular cross section of diameter 7.7 mm. The height of the
column is 70 cm for single storey and 50 cm each for double storey. The roof of the frame is a
rectangular iron plate of size 50 cm x 40 cm weighting 15.44 kg which is connected to the
columns by nuts. An accelerometer is attached to the model to record the storey acceleration and
displacement. The TMD is made up of various square iron plates of size 12.6 x 12.6 cm each
having a weight of 0.707 kg, attached at the centre of roof plate by a circular rod. The frame is
subjected to free vibration analysis to know the fundamental frequency of the structure. Then the
damper is designed by tuning it to that frequency to obtain maximum response reduction at
various mass ratios.
During the experiments, the frame as shown in figure 4.2 (a) is subjected to lateral harmonic
excitation defined by the expression, x= x0 2 sin (2πft) where, x0 and f are the amplitude and
frequency of excitation respectively which are the two varying parameters.
22
Figure 4.2 Test model-1
Weight of the plate=15.44 Kg
Height of column (l)= 70 cm
Diameter of column (D)= 0.77 cm
Fundamental frequency of frame (f) = 1.75 Hz (obtained from free vibration analysis)
Displacement Amplitude(x0) =0.5 cm
Stiffness of frame (k)= = 1864.84 N/m ( fw 2 )
Stiffness of each column=k/4=466.62 N/m
Moment of inertia of column (I) = 64
4D= 1.7
Modulus of elasticity of steel frame (E) = I
lk
12
4
3
(from the equation 4
k=
3
12
l
EI)
=10
3
107.112
7.062.466
(a) Single storey frame without TMD (b) Single storey frame with TMD
23
=7.82
1010m
N
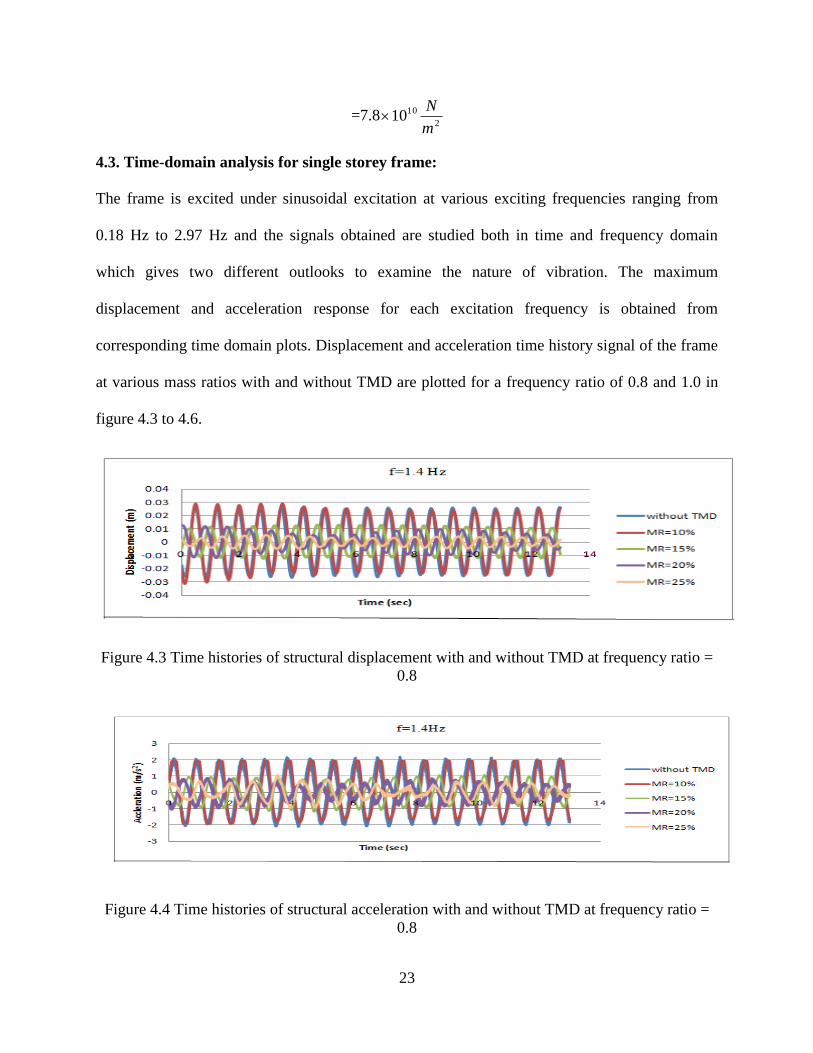
4.3. Time-domain analysis for single storey frame:
The frame is excited under sinusoidal excitation at various exciting frequencies ranging from
0.18 Hz to 2.97 Hz and the signals obtained are studied both in time and frequency domain
which gives two different outlooks to examine the nature of vibration. The maximum
displacement and acceleration response for each excitation frequency is obtained from
corresponding time domain plots. Displacement and acceleration time history signal of the frame
at various mass ratios with and without TMD are plotted for a frequency ratio of 0.8 and 1.0 in
figure 4.3 to 4.6.
Figure 4.3 Time histories of structural displacement with and without TMD at frequency ratio =
0.8
Figure 4.4 Time histories of structural acceleration with and without TMD at frequency ratio =
0.8
24
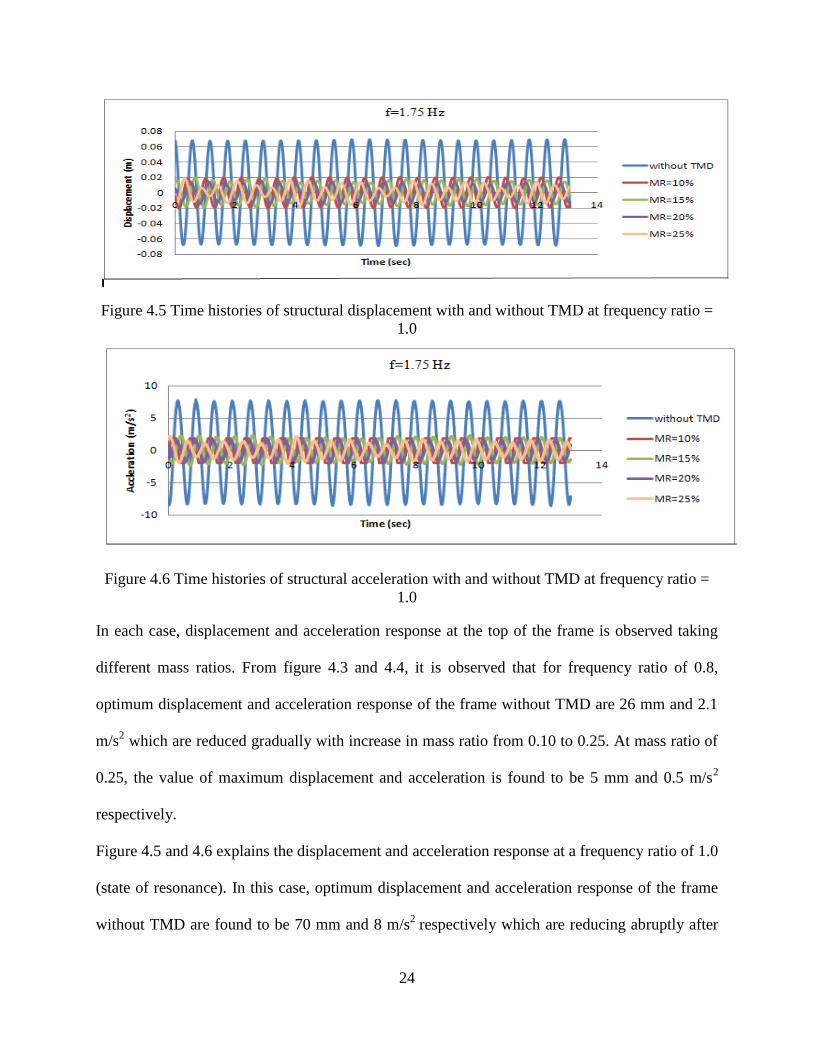
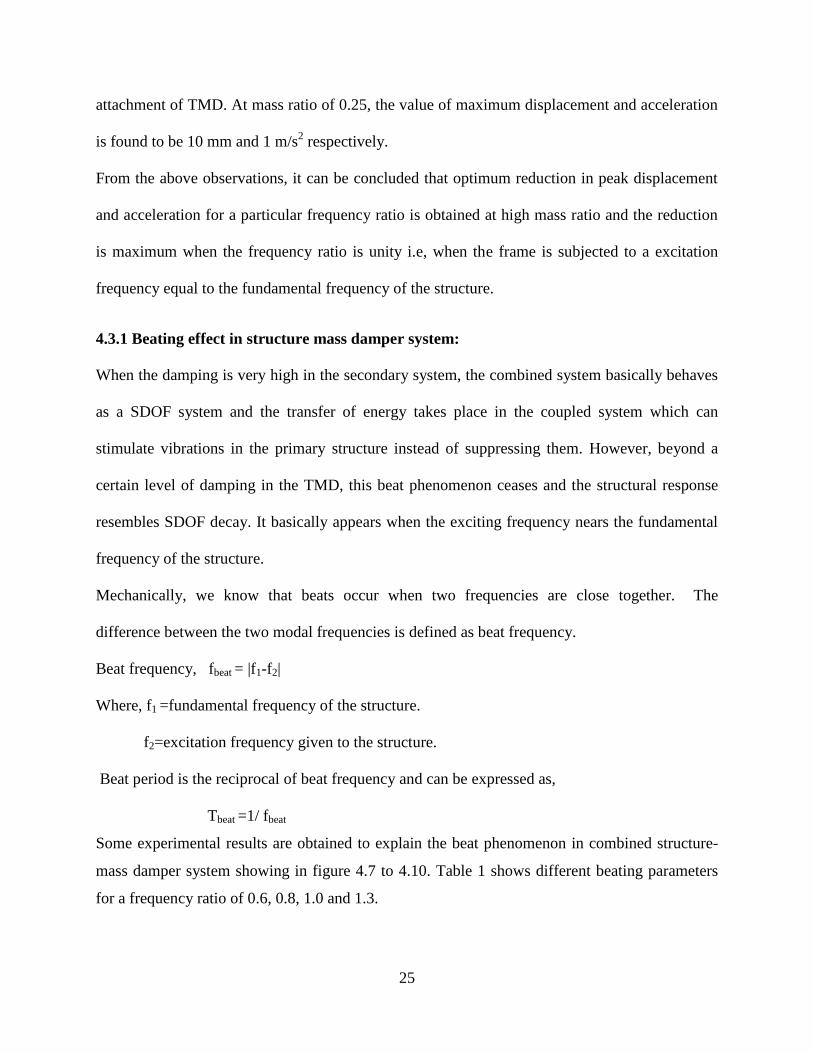
Figure 4.5 Time histories of structural displacement with and without TMD at frequency ratio =
1.0
Figure 4.6 Time histories of structural acceleration with and without TMD at frequency ratio =
1.0
In each case, displacement and acceleration response at the top of the frame is observed taking
different mass ratios. From figure 4.3 and 4.4, it is observed that for frequency ratio of 0.8,
optimum displacement and acceleration response of the frame without TMD are 26 mm and 2.1
m/s2 which are reduced gradually with increase in mass ratio from 0.10 to 0.25. At mass ratio of
0.25, the value of maximum displacement and acceleration is found to be 5 mm and 0.5 m/s2
respectively.
Figure 4.5 and 4.6 explains the displacement and acceleration response at a frequency ratio of 1.0
(state of resonance). In this case, optimum displacement and acceleration response of the frame
without TMD are found to be 70 mm and 8 m/s2
respectively which are reducing abruptly after
25
attachment of TMD. At mass ratio of 0.25, the value of maximum displacement and acceleration
is found to be 10 mm and 1 m/s2 respectively.
From the above observations, it can be concluded that optimum reduction in peak displacement
and acceleration for a particular frequency ratio is obtained at high mass ratio and the reduction
is maximum when the frequency ratio is unity i.e, when the frame is subjected to a excitation
frequency equal to the fundamental frequency of the structure.
4.3.1 Beating effect in structure mass damper system:
When the damping is very high in the secondary system, the combined system basically behaves
as a SDOF system and the transfer of energy takes place in the coupled system which can
stimulate vibrations in the primary structure instead of suppressing them. However, beyond a
certain level of damping in the TMD, this beat phenomenon ceases and the structural response
resembles SDOF decay. It basically appears when the exciting frequency nears the fundamental
frequency of the structure.
Mechanically, we know that beats occur when two frequencies are close together. The
difference between the two modal frequencies is defined as beat frequency.
Beat frequency, fbeat = |f1-f2|
Where, f1 =fundamental frequency of the structure.
f2=excitation frequency given to the structure.
Beat period is the reciprocal of beat frequency and can be expressed as,
Tbeat =1/ fbeat
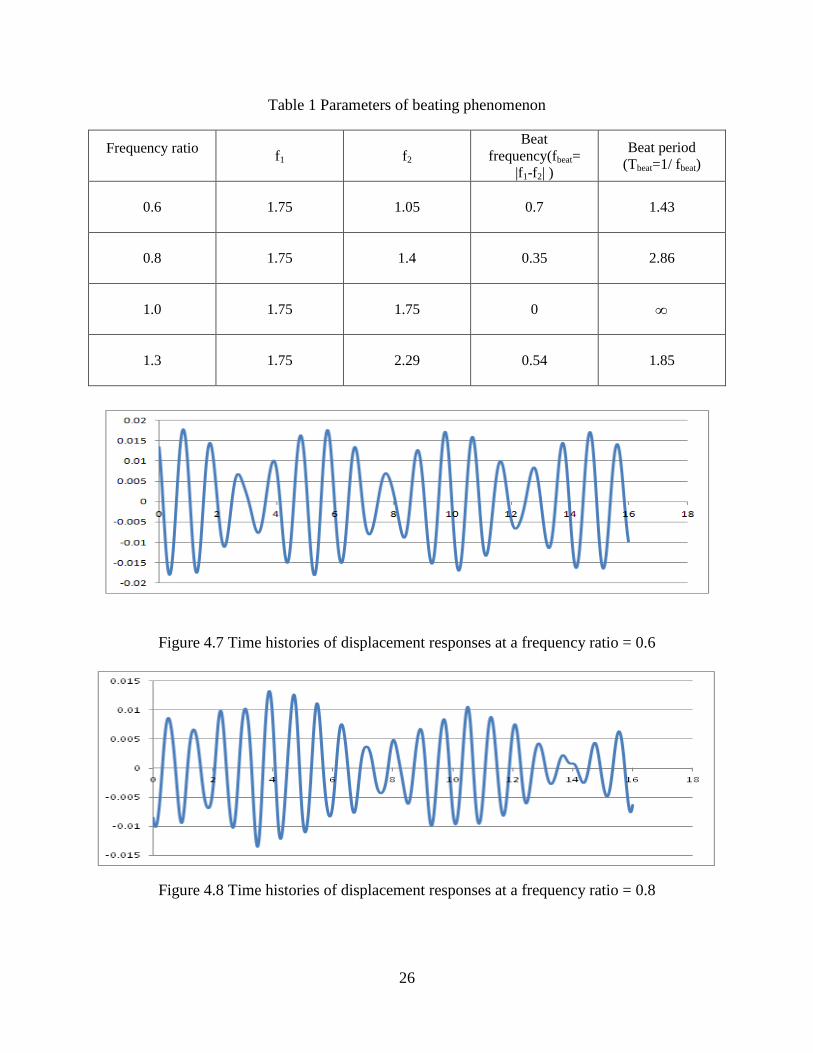
Some experimental results are obtained to explain the beat phenomenon in combined structure-
mass damper system showing in figure 4.7 to 4.10. Table 1 shows different beating parameters
for a frequency ratio of 0.6, 0.8, 1.0 and 1.3.
26
Table 1 Parameters of beating phenomenon
Frequency ratio f1 f2
Beat
frequency(fbeat=
|f1-f2| )
Beat period
(Tbeat=1/ fbeat)
0.6 1.75 1.05 0.7 1.43
0.8 1.75 1.4 0.35 2.86
1.0 1.75 1.75 0
1.3 1.75 2.29 0.54 1.85
Figure 4.7 Time histories of displacement responses at a frequency ratio = 0.6
Figure 4.8 Time histories of displacement responses at a frequency ratio = 0.8
27
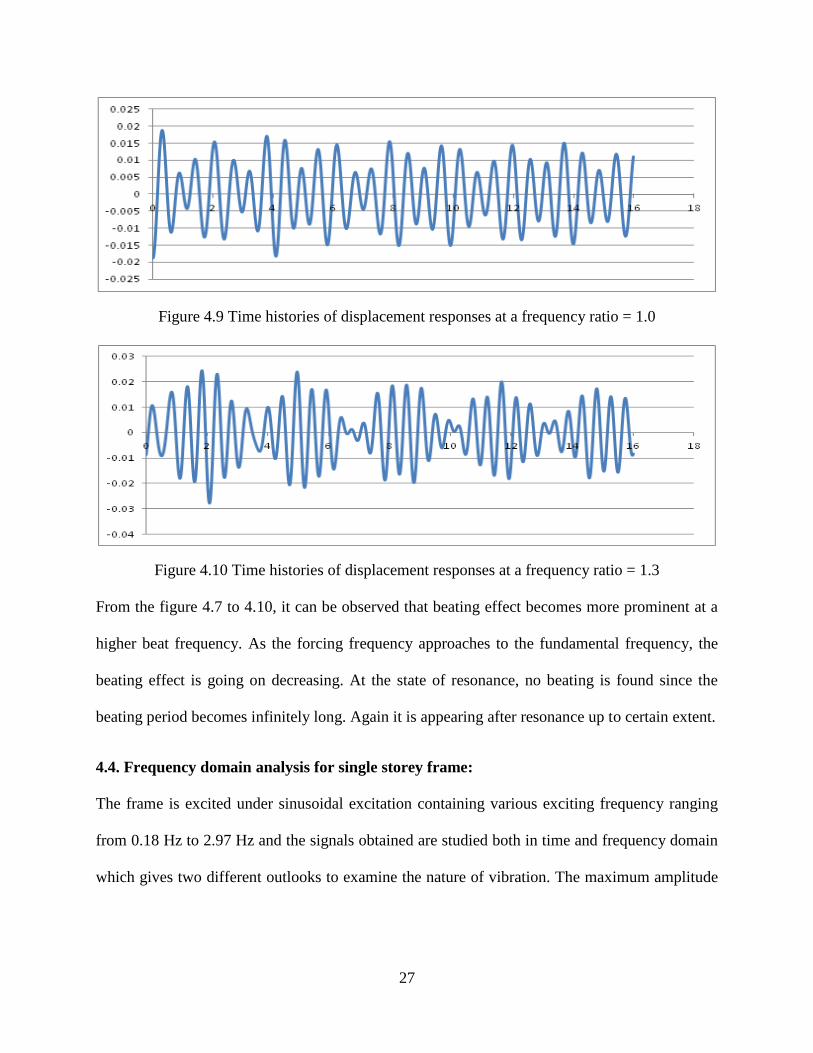
Figure 4.9 Time histories of displacement responses at a frequency ratio = 1.0
Figure 4.10 Time histories of displacement responses at a frequency ratio = 1.3
From the figure 4.7 to 4.10, it can be observed that beating effect becomes more prominent at a
higher beat frequency. As the forcing frequency approaches to the fundamental frequency, the
beating effect is going on decreasing. At the state of resonance, no beating is found since the
beating period becomes infinitely long. Again it is appearing after resonance up to certain extent.
4.4. Frequency domain analysis for single storey frame:
The frame is excited under sinusoidal excitation containing various exciting frequency ranging
from 0.18 Hz to 2.97 Hz and the signals obtained are studied both in time and frequency domain
which gives two different outlooks to examine the nature of vibration. The maximum amplitude
28
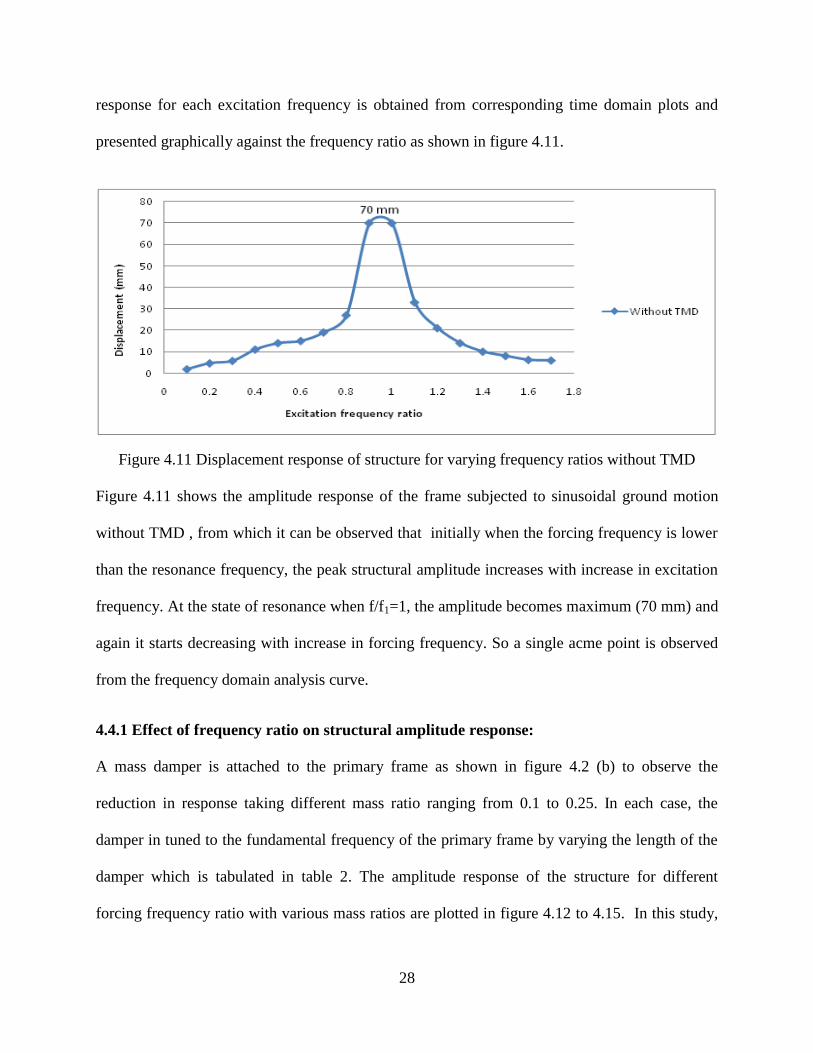
response for each excitation frequency is obtained from corresponding time domain plots and
presented graphically against the frequency ratio as shown in figure 4.11.
Figure 4.11 Displacement response of structure for varying frequency ratios without TMD
Figure 4.11 shows the amplitude response of the frame subjected to sinusoidal ground motion
without TMD , from which it can be observed that initially when the forcing frequency is lower
than the resonance frequency, the peak structural amplitude increases with increase in excitation
frequency. At the state of resonance when f/f1=1, the amplitude becomes maximum (70 mm) and
again it starts decreasing with increase in forcing frequency. So a single acme point is observed
from the frequency domain analysis curve.
4.4.1 Effect of frequency ratio on structural amplitude response:
A mass damper is attached to the primary frame as shown in figure 4.2 (b) to observe the
reduction in response taking different mass ratio ranging from 0.1 to 0.25. In each case, the
damper in tuned to the fundamental frequency of the primary frame by varying the length of the
damper which is tabulated in table 2. The amplitude response of the structure for different
forcing frequency ratio with various mass ratios are plotted in figure 4.12 to 4.15. In this study,
29
various frequency ratios starting from 0.1 to 1.7 and mass ratio ranging from 0.1 to 0.25 are
considered and the corresponding amplitude responses are observed
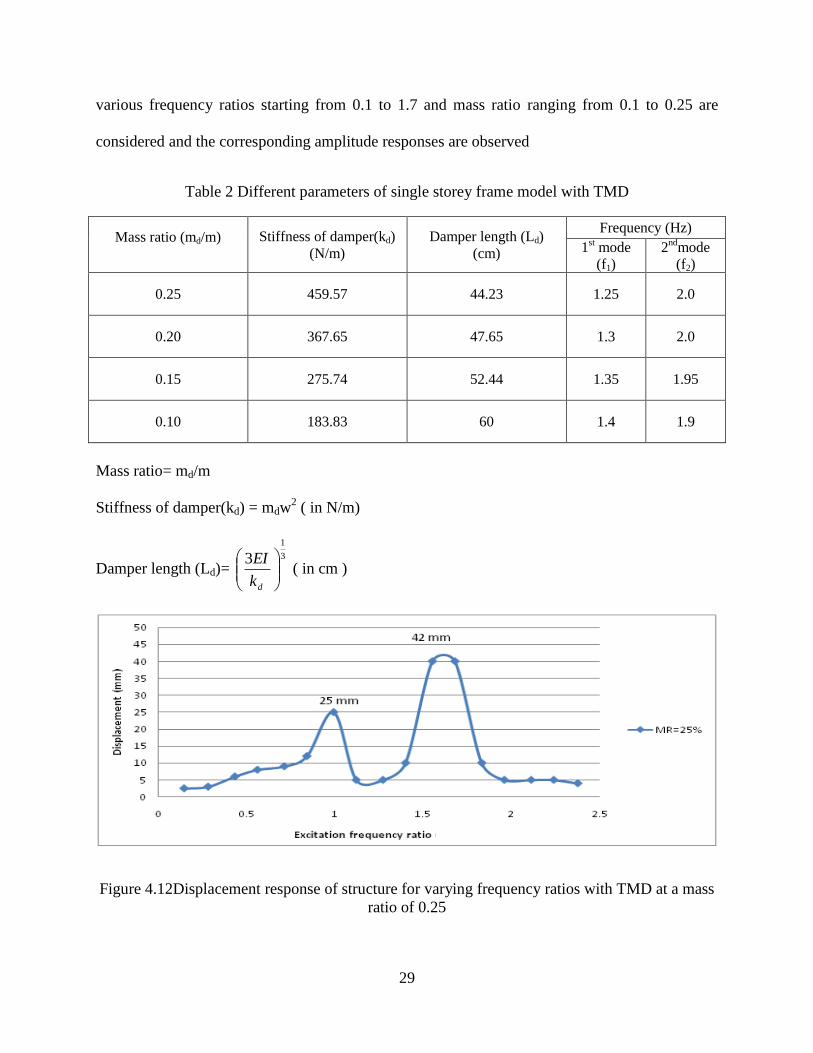
Table 2 Different parameters of single storey frame model with TMD
Mass ratio (md/m) Stiffness of damper(kd)
(N/m)
Damper length (Ld)
(cm)
Frequency (Hz)
1st mode
(f1)
2nd
mode
(f2)
0.25 459.57 44.23 1.25 2.0
0.20 367.65 47.65 1.3 2.0
0.15 275.74 52.44 1.35 1.95
0.10 183.83 60 1.4 1.9
Mass ratio= md/m
Stiffness of damper(kd) = mdw2 ( in N/m)
Damper length (Ld)= 3
1
3
dk
EI ( in cm )
Figure 4.12Displacement response of structure for varying frequency ratios with TMD at a mass
ratio of 0.25
30
Figure 4.13 Displacement response of structure for varying frequency ratios with TMD at a mass
ratio of 0.20
Figure 4.14 Displacement response of structure for varying frequency ratios with TMD at a mass
ratio of 0.15
31
Figure 4.15 Displacement response of structure for varying frequency ratios with TMD at a mass
ratio of 0.10
Figure 4.12 to 4.15 shows the reduction in amplitude response of the frame after attaching TMD
which is tuned to the fundamental frequency of the primary structure at various mass ratios. It
can also be observed that, after attaching a mass damper, two peaks are observed corresponding
to the two modal frequencies of the new structure. The first peak at lower frequency ratio is less
than that at higher frequency ratio. This is because of the fact that at lower frequency of
excitation, flexible structures (damper) are more affected than rigid structures (frame) and vice
versa. Therefore at lower frequency ratio, the damper moves faster than the frame thereby
reducing the amplitude response of the frame. But at higher frequency ratio, the frame being
rigid, it moves faster than the damper.
32
4.4.2 Effect of mass ratio on structural response for single storey frame:
Figure 4.16 describes the effect of various mass ratios in reducing the response, when the damper
is tuned to the fundamental frequency of the primary structure.
Figure 4.16 Displacement response of structure for varying frequency ratios with different mass
ratio
It can be noticed that when the structure is subjected to sinusoidal excitation, maximum
reduction is occurring at a frequency ratio of 0.9 which is nearer to the point of resonance. So
the optimum TMD tuning frequency ratio obtained here is 0.9. With increase in mass ratio, the
peak displacement is going on decreasing up to a particular mass ratio and again it is increasing
on further increment of mass ratio. Here optimum reduction is occurring corresponding to a mass
ratio of 0.15. Table-3 illustrates the percentage reduction in peak displacement as a function of
mass ratio and frequency ratio.
33
Table 3 Maximum structural displacements with and without TMD and percentage reduction
Frequency
ratio
Maximum
displacement
without TMD
in mm
Maximum displacement with TMD
in mm Percentage reduction in the displacement
MR=0.25 MR=0.20 MR=0.15 MR=0.10 MR=0.25 MR=0.20 MR=0.15 MR=0.1
0
0.4 11.2 8.6 6.2 5.6 7.1 27.27 45.45 54.54 36.36
0.6 15.4 12.3 10.7 11.4 10.2 20.00 33.33 26.66 33.33
0.8 27.0 5.2 10.1 12.4 24.1 81.48 62.96 55.55 11.11
1.0 70.1 10.2 12.3 15.3 20.0 85.71 82.85 78.57 71.42
1.2 21.4 14.0 20.2 20.4 14 33.30 4.76 4.76 33.33
1.4 10.0 5.2 7.1 5.1 8.4 50.00 30.00 50.00 20.00
1.6 6.2 5.5 5.2 5.2 5.2 19.35 19.35 19.35 19.35
4.4.3. Effect of tuning ratio on structural response for single storey frame:
The tuning ratio of TMD is defined as the ratio of the damper frequency to the fundamental
frequency of the primary structure. The damper is mistuned to different frequency by varying
the length of the damper at a mass ratio of 0.15 and the responses are experimentally compared
to observe the effect of tuning ratio as shown in figure 4.17.
34
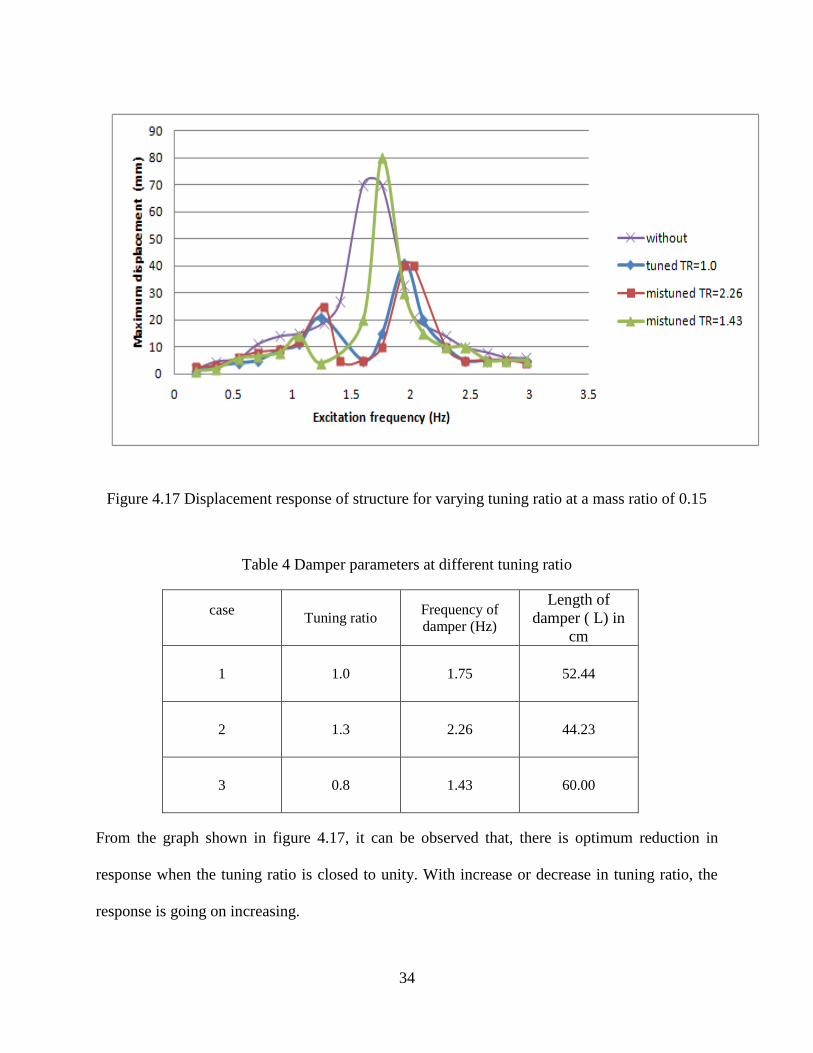
Figure 4.17 Displacement response of structure for varying tuning ratio at a mass ratio of 0.15
Table 4 Damper parameters at different tuning ratio
case Tuning ratio
Frequency of
damper (Hz)
Length of
damper ( L) in
cm
1 1.0 1.75 52.44
2 1.3 2.26 44.23
3 0.8 1.43 60.00
From the graph shown in figure 4.17, it can be observed that, there is optimum reduction in
response when the tuning ratio is closed to unity. With increase or decrease in tuning ratio, the
response is going on increasing.
35
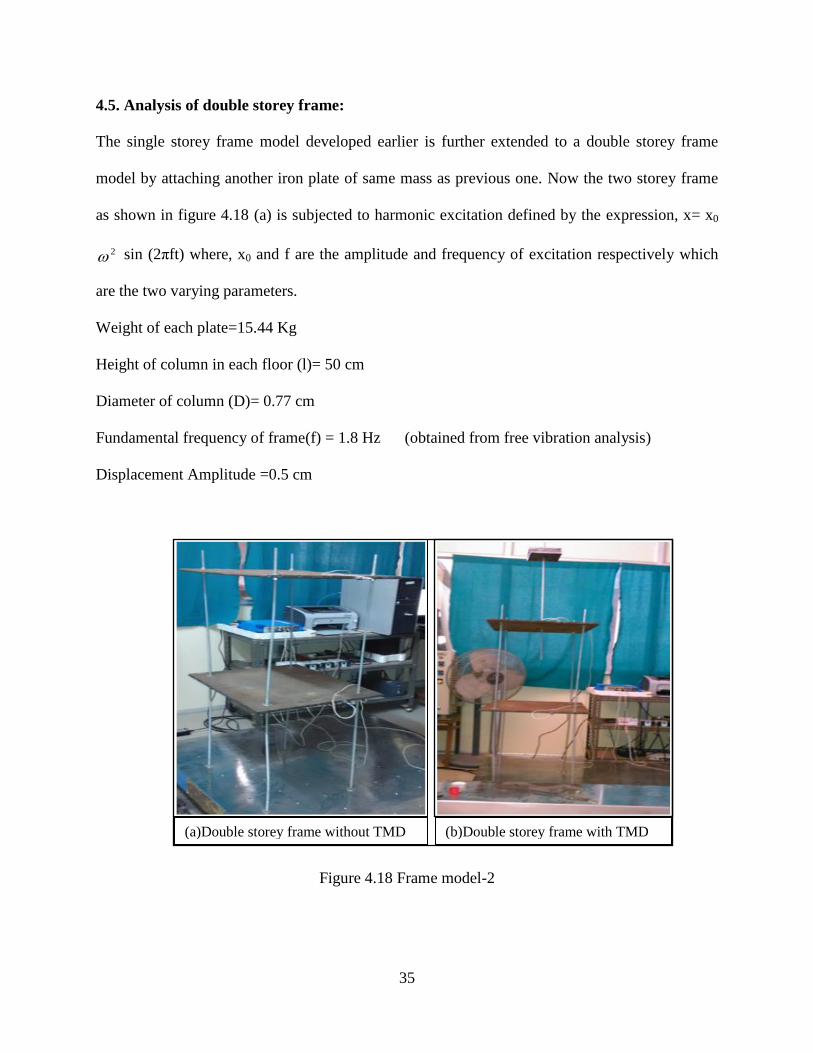
4.5. Analysis of double storey frame:
The single storey frame model developed earlier is further extended to a double storey frame
model by attaching another iron plate of same mass as previous one. Now the two storey frame
as shown in figure 4.18 (a) is subjected to harmonic excitation defined by the expression, x= x0
2 sin (2πft) where, x0 and f are the amplitude and frequency of excitation respectively which
are the two varying parameters.
Weight of each plate=15.44 Kg
Height of column in each floor (l)= 50 cm
Diameter of column (D)= 0.77 cm
Fundamental frequency of frame(f) = 1.8 Hz (obtained from free vibration analysis)
Displacement Amplitude =0.5 cm
Figure 4.18 Frame model-2
(a)Double storey frame without TMD
(b)Double storey frame with TMD
36
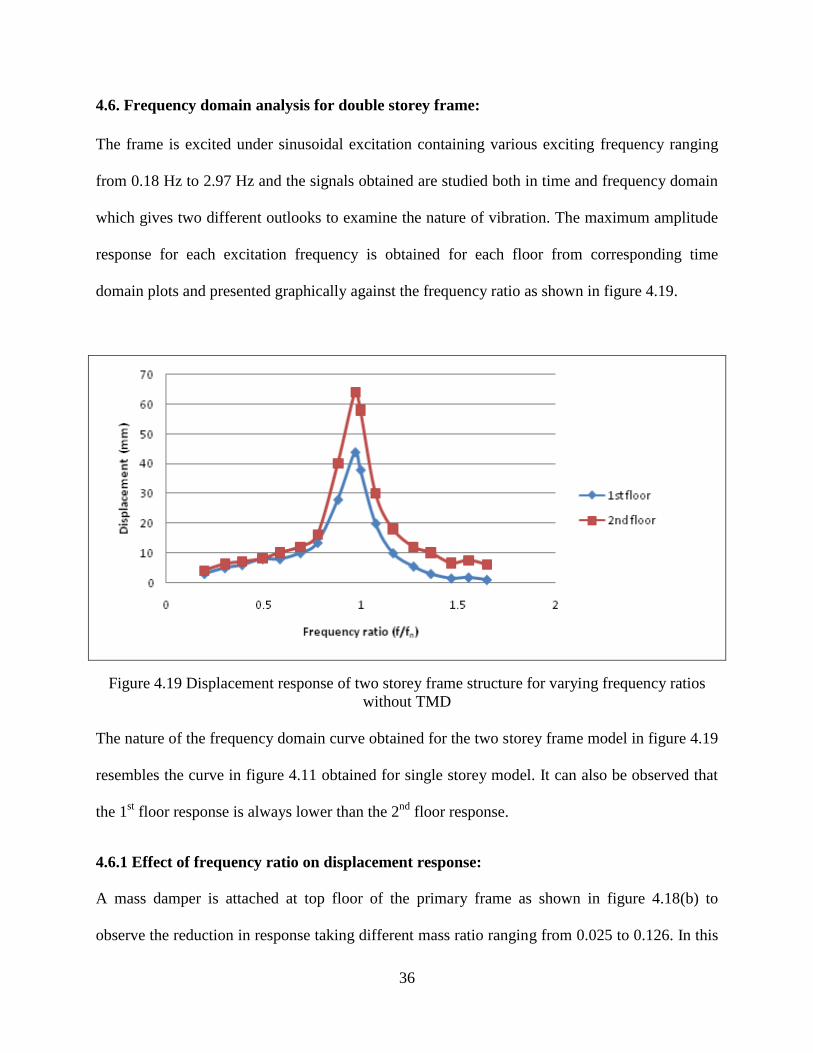
4.6. Frequency domain analysis for double storey frame:
The frame is excited under sinusoidal excitation containing various exciting frequency ranging
from 0.18 Hz to 2.97 Hz and the signals obtained are studied both in time and frequency domain
which gives two different outlooks to examine the nature of vibration. The maximum amplitude
response for each excitation frequency is obtained for each floor from corresponding time
domain plots and presented graphically against the frequency ratio as shown in figure 4.19.
Figure 4.19 Displacement response of two storey frame structure for varying frequency ratios
without TMD
The nature of the frequency domain curve obtained for the two storey frame model in figure 4.19
resembles the curve in figure 4.11 obtained for single storey model. It can also be observed that
the 1st floor response is always lower than the 2
nd floor response.
4.6.1 Effect of frequency ratio on displacement response:
A mass damper is attached at top floor of the primary frame as shown in figure 4.18(b) to
observe the reduction in response taking different mass ratio ranging from 0.025 to 0.126. In this
37
study, various frequency ratios starting from 0.1 to 1.7 and mass ratio ranging from 0.025 to
0.126 are considered and the corresponding displacement responses are observed. At each mass
ratio the damper is not tuned to the fundamental frequency of the primary structure.
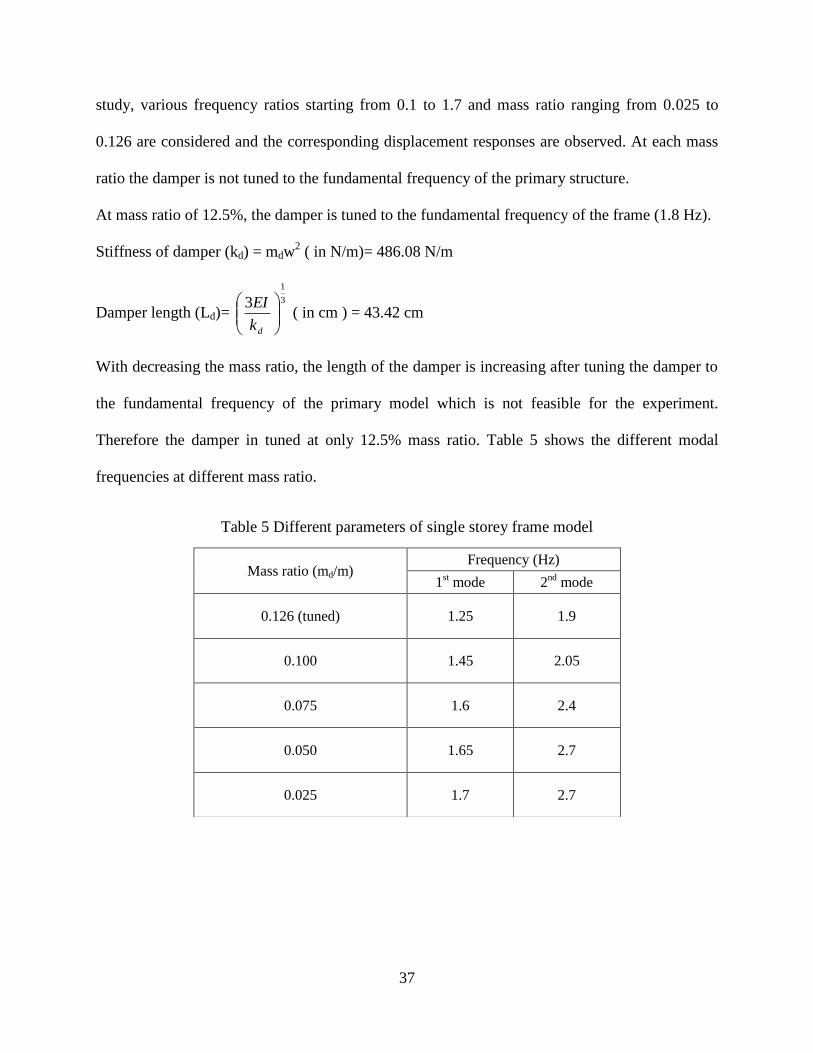
At mass ratio of 12.5%, the damper is tuned to the fundamental frequency of the frame (1.8 Hz).
Stiffness of damper (kd) = mdw2 ( in N/m)= 486.08 N/m
Damper length (Ld)= 3
1
3
dk
EI ( in cm ) = 43.42 cm
With decreasing the mass ratio, the length of the damper is increasing after tuning the damper to
the fundamental frequency of the primary model which is not feasible for the experiment.
Therefore the damper in tuned at only 12.5% mass ratio. Table 5 shows the different modal
frequencies at different mass ratio.
Table 5 Different parameters of single storey frame model
Mass ratio (md/m) Frequency (Hz)
1st mode 2
nd mode
0.126 (tuned) 1.25 1.9
0.100 1.45 2.05
0.075 1.6 2.4
0.050 1.65 2.7
0.025 1.7 2.7
38
Figure 4.20 Displacement response of two storey frame structure for varying frequency ratios
with TMD at a mass ratio of 0.125
The amplitude response of the structure for different forcing frequency ratio with a mass ratio of
0.126 is plotted in figure 4.20 which shows two peaks corresponding to two modal frequency of
the secondary structure as observed in previous case.
4.6.2. Effect of mass ratio on structural response of a double storey frame model:
Figure 4.21 First floor displacement response of a two storey frame structure for varying
frequency ratios with different mass ratio
39
Figure 4.22 Second floor displacement response of a two storey frame structure for varying
frequency ratios with different mass ratio
In figure 4.21 and 4.22, at each mass ratio the damper is not tuned to the fundamental frequency
of the primary structure. At a mass ratio of 0.125, damper is tuned by fixing the length 43.42 cm.
It can be observed that maximum amplitude reduction is obtained when the damper is tuned to
the natural frequency of the structure.
40
Chapter 5
5. NUMERICAL STUDY
5.1 Problem statement-1
The structural response of the one storey frame analyzed experimentally with and without TMD
in the previous chapter is validated numerically using present FEM and STAAD Pro by
subjecting the frame model under sinusoidal acceleration. Figure 5.2 and 5.3 show the top floor
displacement of the single storey frame obtained in STAAD Pro without and with TMD respectively.
Figure 5.2 Response of single storey frame in STAAD Pro. Without TMD
Figure 5.1 Single storey model
41
Figure 5.3 Response of single storey frame in STAAD Pro. With TMD
The displacement time history response of the single storey frame subjected to sinusoidal base
excitation, obtained experimentally in the previous chapter is also determined using the numerical
finite element method. Figure 5.4 to 5.12 shows the comparison of experimental and numerical time
history response at different frequency ratios 0.8, 1 and 1.2 with and without TMD. It shows that
both the results are in a very close agreement.
Figure 5.4 Comparison of numerical and measured structure displacement time history response
without TMD for frequency ratio=0.8
42
Figure 5.5 Comparison of numerical and measured structural acceleration time history response
without TMD for frequency ratio=0.8
Figure 5.6 Comparison of numerical and measured structural displacement time history response
without TMD for frequency ratio=1.0
Figure 5.7 Comparison of numerical and measured structural acceleration time history response
without TMD for frequency ratio=1.0
43
Figure 5.8 Comparison of numerical and measured structural displacement time history response
without TMD for frequency ratio=1.2
Figure 5.9 Comparison of numerical and measured structural acceleration time history response
without TMD for frequency ratio=1.2
Figure 5.10 Comparison of numerical and measured structural displacement time history
response with TMD for frequency ratio=0.8
44
Figure 5.11 Comparison of numerical and measured structural displacement time history
response with TMD for frequency ratio=1.0
Figure 5.12 Comparison of numerical and measured structural displacement time history
response with TMD for frequency ratio=1.2
Table 6 shows the comparison of top floor displacement of the frame obtained in present FEM,
experimental analysis and STAAD Pro which are in close agreement with each other.
45
Table 6 Comparison Study on the maximum displacement of the single storey frame without and
with TMD
Source
Displacement in mm
% Reduction Without TMD With TMD
Present FEM 68 9 86.76%
Experiment 70 10 85.70%
STAAD Pro. 71.2 14.9 79.07%
5.2 Problem statement-2
The structural response of the two storey frame analyzed experimentally with and without TMD
in the previous chapter is validated numerically using present FEM and STAAD Pro by
subjecting the frame model under sinusoidal acceleration. Figure 5.14 and 5.15 show the top floor
displacement of the single storey frame obtained in STAAD Pro without and with TMD respectively.
Figure 5.13 Two- storey Model
46
Figure 5.14 Response of double storey frame in STAAD Pro. Without TMD
Figure 5.15 Response of double storey frame in STAAD Pro. Without TMD
Table 7 shows the comparison of top floor displacement of the frame obtained in present FEM,
experimental analysis and STAAD Pro which are in close agreement with each other.
Table 7 Comparison Study on the maximum displacement of the double storey building frame
without and with TMD
Source
Displacement in mm
% Reduction Without TMD With TMD
Present FEM 50.8 20.5 59.64%
Experiment 58 55 5.17%
STAAD Pro. 52.5 18.3 65.14%
47
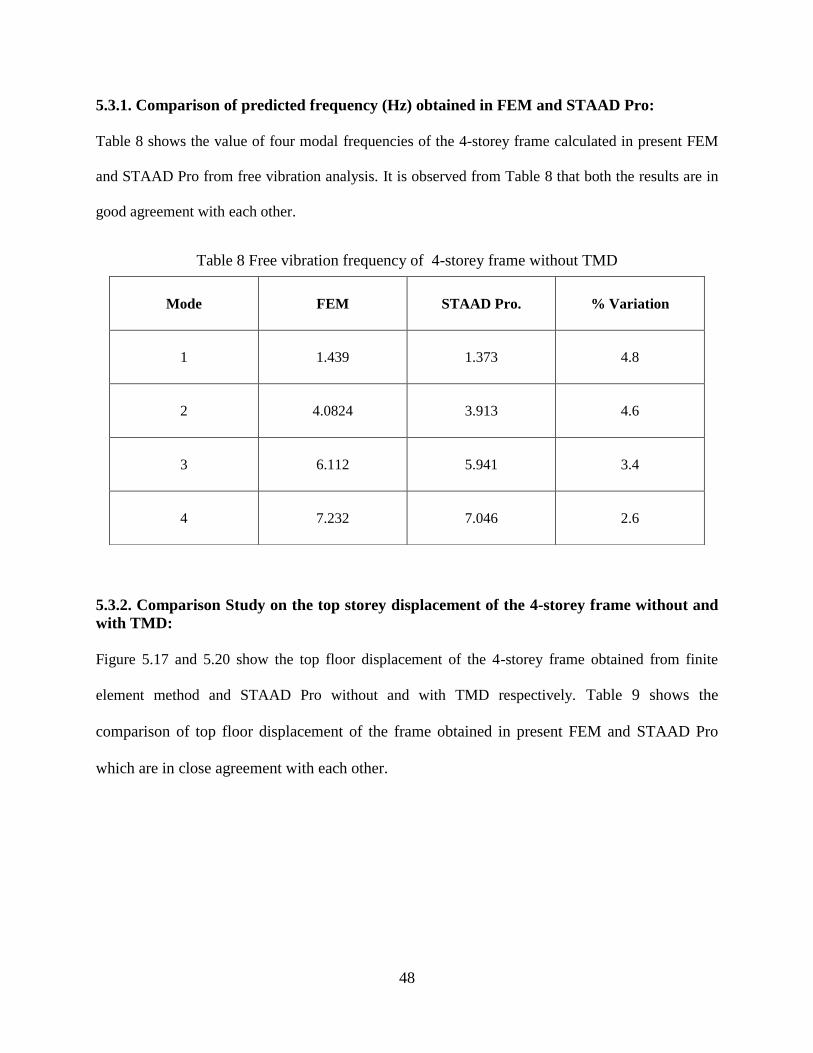
5.3. Problem statement-3
The dynamic amplitude response of a 4 and a 10 storey reinforced concrete frame model
subjected to sinusoidal ground motion is analyzed with and without tuned mass damper.
A sinusoidal ground acceleration x¨=x0 2 sin ω t is considered for time history analysis on
the 4-storey frame model with and without mass damper to show the dynamic structural
response. Where, x0 nd ω r t m x mum mpl tud o l r t on nd r qu n y o t
sinusoidal acceleration respectively.
Following data are taken for the analysis.
Total height of the building=14 m
Height of each floor=3.5 m
Each bay width =5m
No of bays =2
Size of beam= (0.25 x 0.35) m
Size of column = (0.25 x 0.45) m
Grade of concrete =M20
Modulus of elasticity = 2.236 x 10⁶ kN/m
2
Member load at roof level=23.75 kN/m
floor level=41.25 kN/m
Joint load at roof level=42.11 kN
floor level=73.28 kN
Fundamental frequency of structure =1.373 Hz
Damping factor =0.05
Time step =0.01
Maximum acceleration amplitude =0.2 m/s2
Figure 5.16 Four- storey frame Model
48
5.3.1. Comparison of predicted frequency (Hz) obtained in FEM and STAAD Pro:
Table 8 shows the value of four modal frequencies of the 4-storey frame calculated in present FEM
and STAAD Pro from free vibration analysis. It is observed from Table 8 that both the results are in
good agreement with each other.
Table 8 Free vibration frequency of 4-storey frame without TMD
5.3.2. Comparison Study on the top storey displacement of the 4-storey frame without and
with TMD:
Figure 5.17 and 5.20 show the top floor displacement of the 4-storey frame obtained from finite
element method and STAAD Pro without and with TMD respectively. Table 9 shows the
comparison of top floor displacement of the frame obtained in present FEM and STAAD Pro
which are in close agreement with each other.
Mode FEM STAAD Pro. % Variation
1 1.439 1.373 4.8
2 4.0824 3.913 4.6
3 6.112 5.941 3.4
4 7.232 7.046 2.6
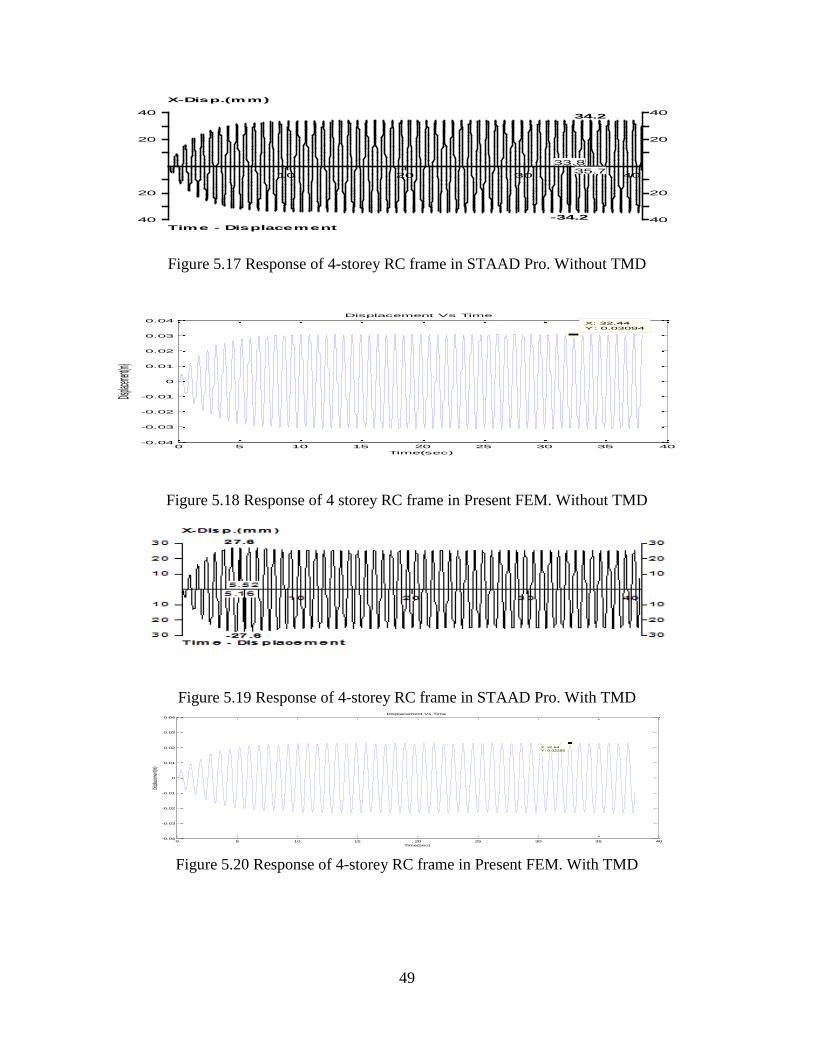
49
Figure 5.17 Response of 4-storey RC frame in STAAD Pro. Without TMD
Figure 5.18 Response of 4 storey RC frame in Present FEM. Without TMD
Figure 5.19 Response of 4-storey RC frame in STAAD Pro. With TMD
Figure 5.20 Response of 4-storey RC frame in Present FEM. With TMD
20
20
20
20
40
40
40
40
10 20 30 40
34.2
35.7
-34.2
33.8
X-Disp.(mm)
Time - Displacement
0 5 10 15 20 25 30 35 40-0.04
-0.03
-0.02
-0.01
0
0.01
0.02
0.03
0.04X: 32.44
Y: 0.03094
Time(sec)
Displace
ment(m)
Displacement Vs Time
0 5 10 15 20 25 30 35 40-0.04
-0.03
-0.02
-0.01
0
0.01
0.02
0.03
0.04
X: 32.64
Y: 0.02285
Time(sec)
Disp
lacem
ent(m
)
Displacement Vs Time
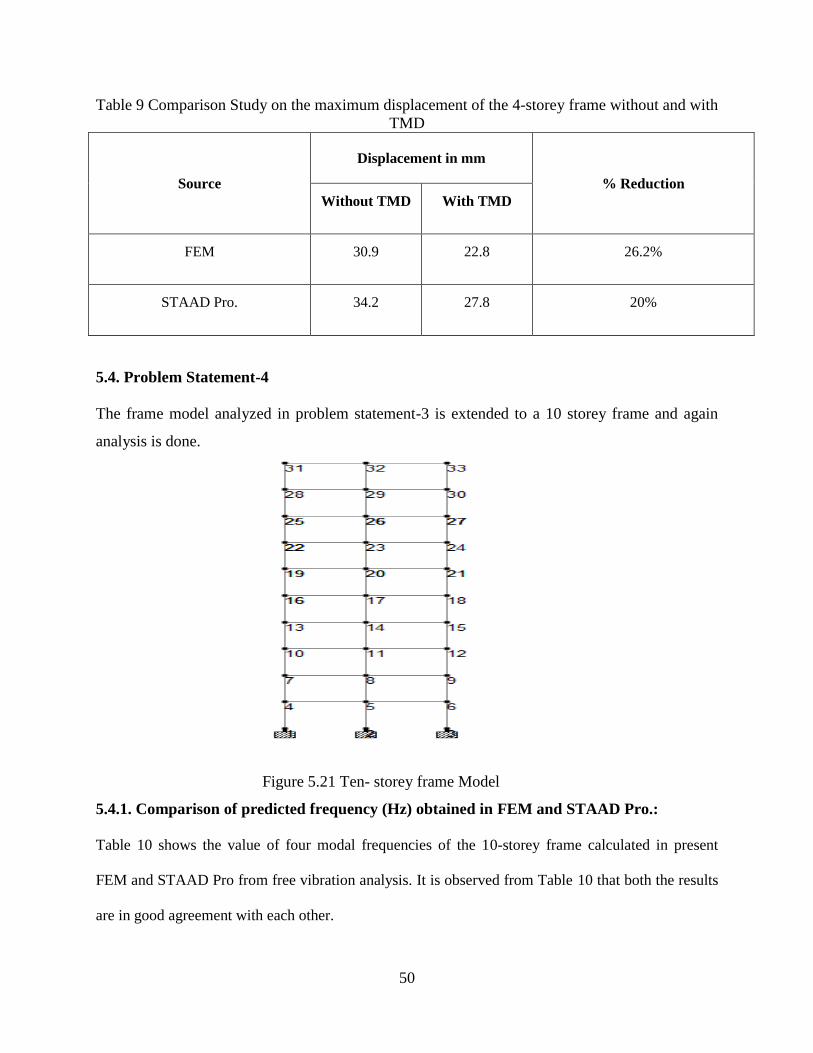
50
Table 9 Comparison Study on the maximum displacement of the 4-storey frame without and with
TMD
Source
Displacement in mm
% Reduction
Without TMD With TMD
FEM 30.9 22.8 26.2%
STAAD Pro. 34.2 27.8 20%
5.4. Problem Statement-4
The frame model analyzed in problem statement-3 is extended to a 10 storey frame and again
analysis is done.
5.4.1. Comparison of predicted frequency (Hz) obtained in FEM and STAAD Pro.:
Table 10 shows the value of four modal frequencies of the 10-storey frame calculated in present
FEM and STAAD Pro from free vibration analysis. It is observed from Table 10 that both the results
are in good agreement with each other.
Figure 5.21 Ten- storey frame Model
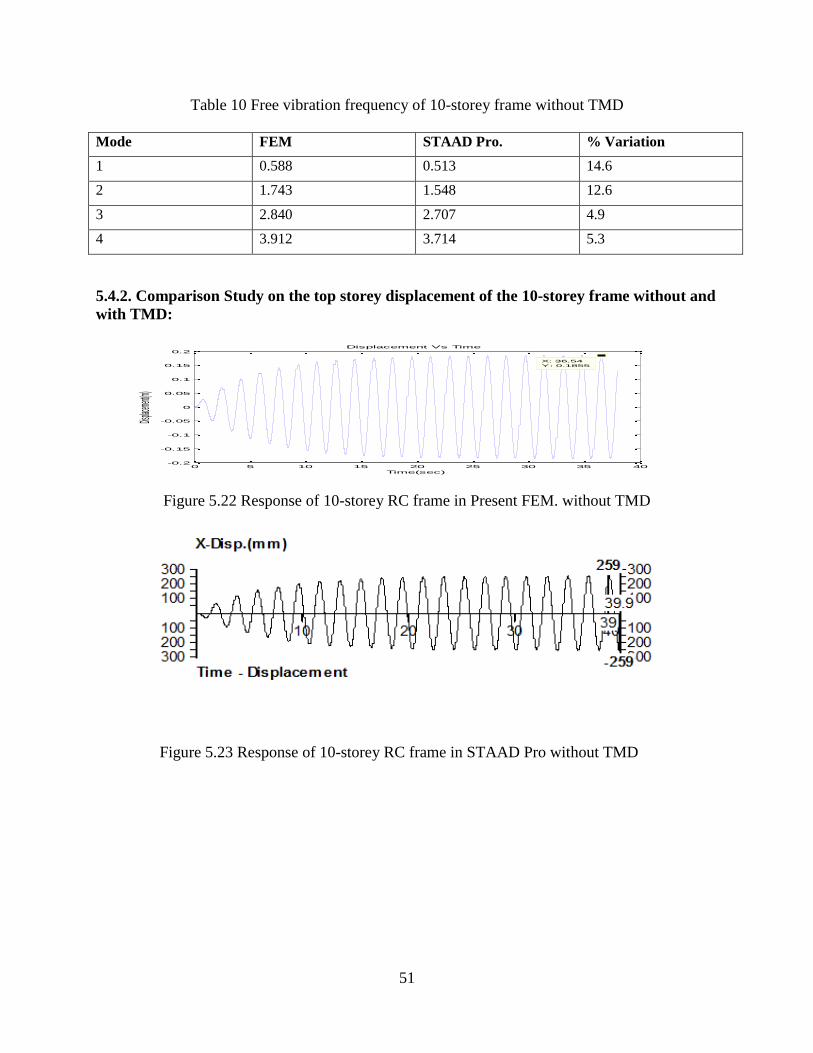
51
Table 10 Free vibration frequency of 10-storey frame without TMD
Mode FEM STAAD Pro. % Variation
1 0.588 0.513 14.6
2 1.743 1.548 12.6
3 2.840 2.707 4.9
4 3.912 3.714 5.3
5.4.2. Comparison Study on the top storey displacement of the 10-storey frame without and
with TMD:
Figure 5.22 Response of 10-storey RC frame in Present FEM. without TMD
Figure 5.23 Response of 10-storey RC frame in STAAD Pro without TMD
0 5 10 15 20 25 30 35 40-0.2
-0.15
-0.1
-0.05
0
0.05
0.1
0.15
0.2
X: 36.54
Y: 0.1855
Time(sec)
Displace
ment(m)
Displacement Vs Time
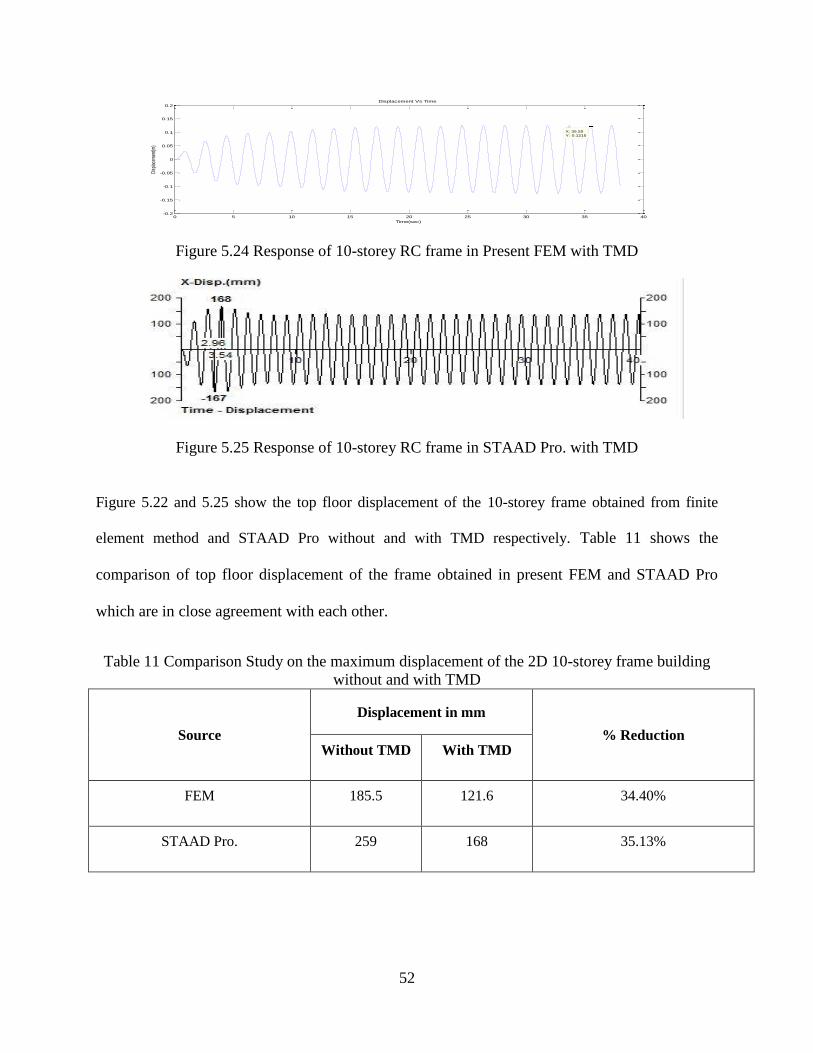
52
Figure 5.24 Response of 10-storey RC frame in Present FEM with TMD
Figure 5.25 Response of 10-storey RC frame in STAAD Pro. with TMD
Figure 5.22 and 5.25 show the top floor displacement of the 10-storey frame obtained from finite
element method and STAAD Pro without and with TMD respectively. Table 11 shows the
comparison of top floor displacement of the frame obtained in present FEM and STAAD Pro
which are in close agreement with each other.
Table 11 Comparison Study on the maximum displacement of the 2D 10-storey frame building
without and with TMD
Source
Displacement in mm
% Reduction Without TMD With TMD
FEM 185.5 121.6 34.40%
STAAD Pro. 259 168 35.13%
0 5 10 15 20 25 30 35 40-0.2
-0.15
-0.1
-0.05
0
0.05
0.1
0.15
0.2
X: 35.55
Y: 0.1215
Time(sec)
Disp
lace
men
t(m)
Displacement Vs Time
53
5.4.3 Tuning of damper:
To know the effect of tuning in reducing the structural response, the mass damper attached to the
10-storey frame is tuned to different modal frequencies obtained from analysis. Table 12 shows
the storey displacement at various mass ratios when the damper is tuned to different modal
frequencies.
Table 12 Storey displacement when damper is tuned to different modal frequency
Mass ratio (%)
Storey displacement(mm)
fd=f1 fd=f2 fd=f3 fd=f4
1 121.6 188 187 185
2 125.6 192 189 192
5 142.4 201 201 201
fd = frequency of damper in Hz.
f1, f2, f3 & f4 = structural frequency at different mode in Hz.
= 0.588, 1.734, 2.84 & 83.91 Hz respectively.
From the table 12 shown above it can be concluded that frequency of the damper has to be
tuned to the fundamental frequency of the structure to obtain maximum response reduction.
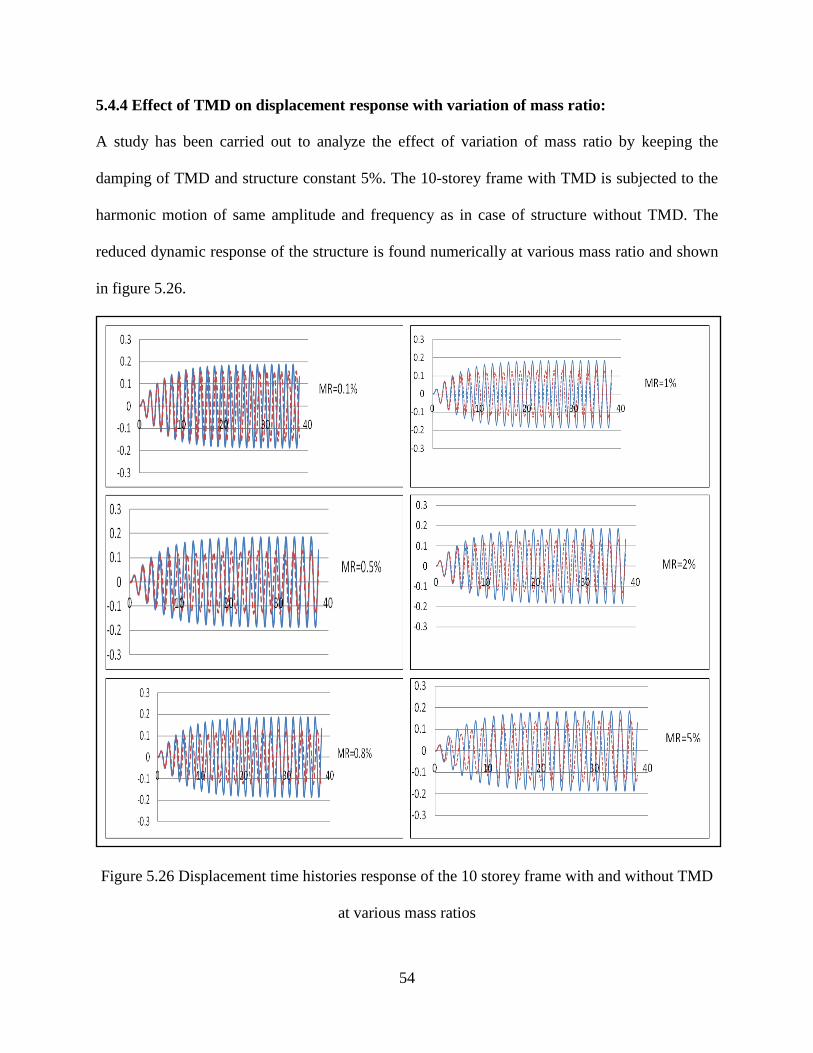
54
5.4.4 Effect of TMD on displacement response with variation of mass ratio:
A study has been carried out to analyze the effect of variation of mass ratio by keeping the
damping of TMD and structure constant 5%. The 10-storey frame with TMD is subjected to the
harmonic motion of same amplitude and frequency as in case of structure without TMD. The
reduced dynamic response of the structure is found numerically at various mass ratio and shown
in figure 5.26.
Figure 5.26 Displacement time histories response of the 10 storey frame with and without TMD
at various mass ratios
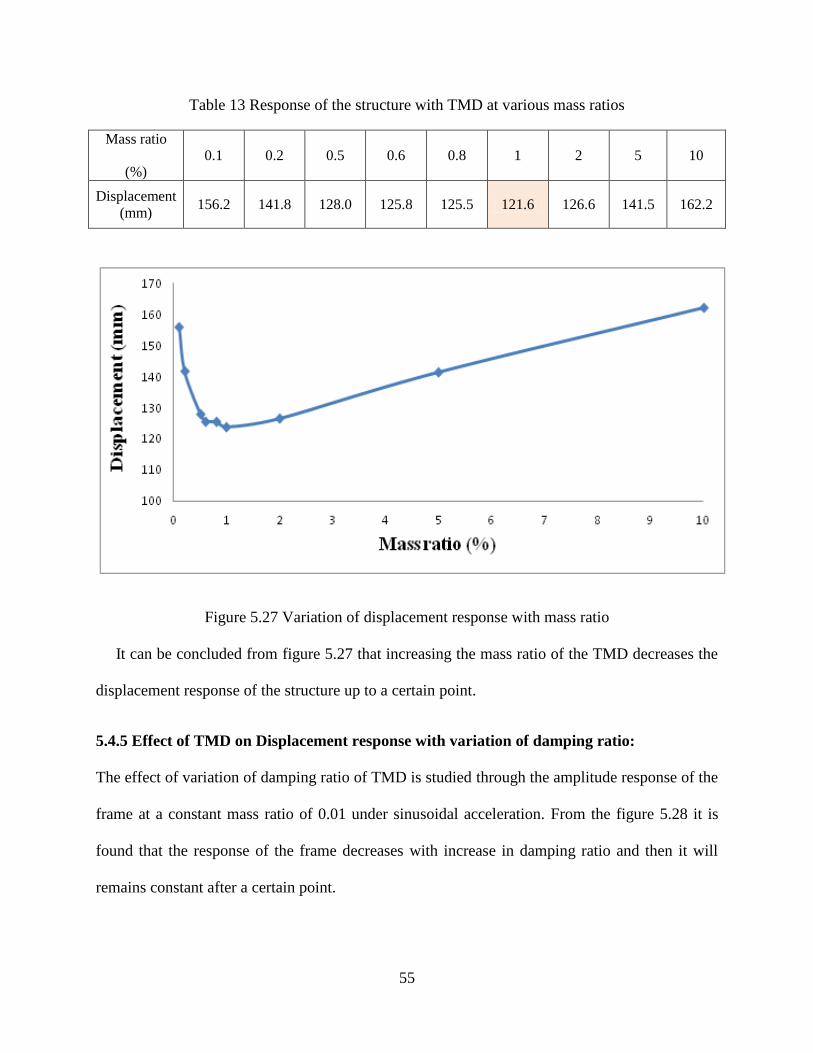
55
Table 13 Response of the structure with TMD at various mass ratios
Mass ratio
(%) 0.1 0.2 0.5 0.6 0.8 1 2 5 10
Displacement
(mm) 156.2 141.8 128.0 125.8 125.5 121.6 126.6 141.5 162.2
Figure 5.27 Variation of displacement response with mass ratio
It can be concluded from figure 5.27 that increasing the mass ratio of the TMD decreases the
displacement response of the structure up to a certain point.
5.4.5 Effect of TMD on Displacement response with variation of damping ratio:
The effect of variation of damping ratio of TMD is studied through the amplitude response of the
frame at a constant mass ratio of 0.01 under sinusoidal acceleration. From the figure 5.28 it is
found that the response of the frame decreases with increase in damping ratio and then it will
remains constant after a certain point.
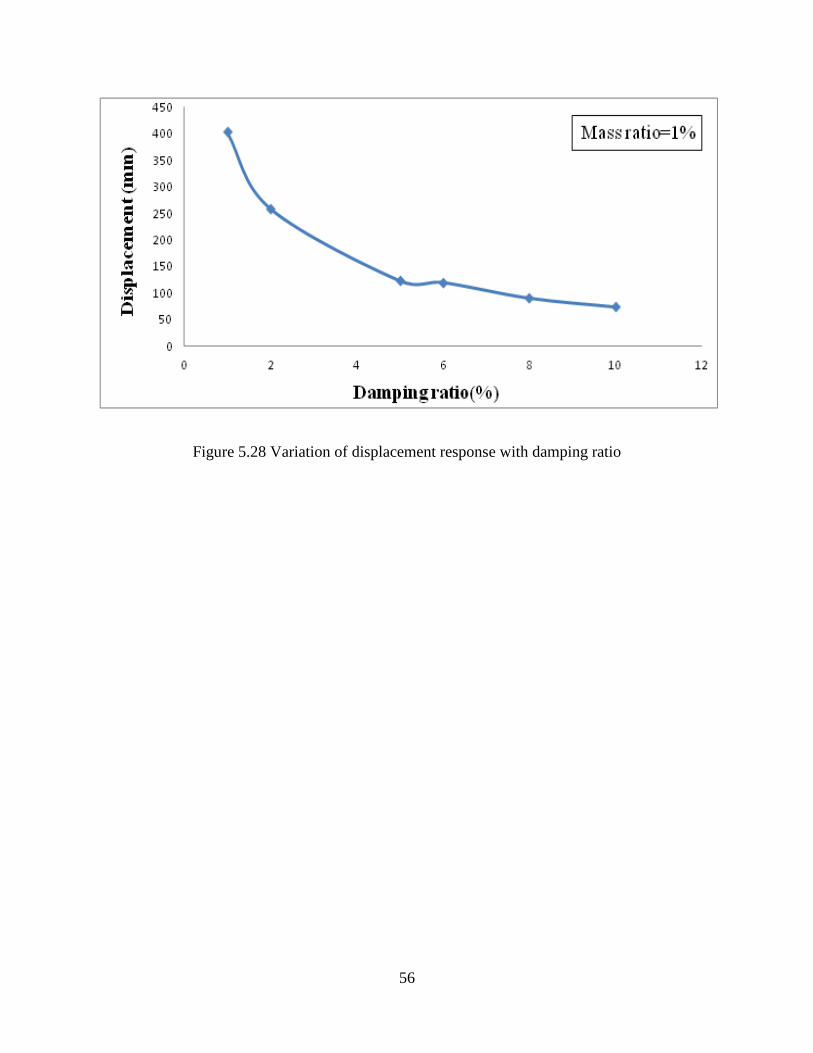
56
Figure 5.28 Variation of displacement response with damping ratio
57
Chapter 6
6. CONCLUSION
6.1. Conclusion:
The present study focuses on the capability of TMD in reducing the structural vibration induced
due to earthquake. A single and a double storey frame model are examined experimentally with
and without TMD to determine the structural response and presented in graphical and tabular
forms. Effect of various parameters such as frequency ratio, mass ratio, damping ratio on the
amplitude response has been studied with TMD. The results obtained are validated numerically
using finite method. Further a four storey and a ten storey RC frame models are studied using
Finite element method and STAAD Pro considering various parameters. The experimental and
numerical investigation of various frame models under sinusoidal ground motion confirms that
the structural response can be considerably reduced to a large extent by a properly designed
TMD.
The following conclusions are made from the study.
When the frame is subjected to sinusoidal ground motion without TMD, amplitude
becomes maximum at the point of resonance.
From the experimental study, it is observed that, after using damper optimum
reduction is occurring at a frequency ratio nearer to the point of resonance. That is
when the frequency ratio becomes nearer to unity.
With increase in mass ratio, the peak displacement is going on decreasing up to a
particular mass ratio and again it is increasing on further increment of mass ratio.
58
It is more effective in reducing the displacement responses of structures when tuned to
fundamental (1st mode) frequency of the structure.
It is more effective to use high damping ratio.
At a higher beat frequency, beating effect is prominent which diminishes as the
forcing frequency approaches to the fundamental frequency and no beating effect is
observed at the state of resonance.
From this study, it can be concluded that properly designed TMD with efficient design
parameters such as tuning ratio, frequency ratio and mass ratio is considered to be a
very effective device to reduce the structural response.
6.2.Future scope for study:
1. A linear model is considered in the experimental study. This can be studied by
considering a non-linear model.
2. In current study the damper mass is placed at the top of the frame model and the
reduction in response is observed. A further study can be carried out by placing the
damper mass at different floors of the frame structure.
3. Effect of mass damper on response reduction can be studied by designing the damper
mass in a pendulum shape.
4. The study can be further extended by using multiple tuned mass damper (MTMD)
tuned with various modal frequencies at different levels.
5. A future study can be done with active multiple tuned mass damp.
59
REFERENCES
1) Alexander Nicholas A, Schilder Frank(2009). “Explor ng t p r orm n o nonl n r
tun d m ss d mp r” Journal of Sound and Vibration 319 pp 445–462
2) C ouw N w w 2004 “B v our o so l-structure system with tuned mass dampers
during near-sour rt qu k s” 13th World Conference on Earthquake
Engineering,Vancouver, B.C., Canada,August 1-6, 2004,Paper No. 1353.
3) G os A nd B su B 2004 “E ct of soil interaction on the performance of tuned
m ss d mp rs or s sm ppl t ons” Journal of Sound and Vibration 274 (2004)
1079–1090.
4) wok C nd m l B 2006 “P r orm n o tun d m ss d mp rs und r w nd
lo ds” Engineering Structures, Vol. 17, No. 9, pp. 655~67, 1995.
5) Islam ,B. and Ahsan ,R. (2012). “Optimization of Tuned Mass Damper
Parameters Using Evolutionary Operation algorithm” 15 wcee, losboa 2012
6) Jingning Wu , Genda Chen nd ngl n Lou 1999 “ eismic effectiveness of tuned
mass dampers considering soil structure interaction” Earthquake engineering and
structural dynamics earthquake engng. struct. dyn. 28, 1219}1233 (1999)
7) L C unx ng nd L u Y nx 2002 “A t v mult pl tun d m ss d mp rs or
structures under the ground l r t on” Earthquake engineering and structural
dynamics earthquake engng struct. dyn. 2002; 31:1041–1052 (doi: 10.1002/eqe.136)
8) Lin, Chi-Chang, et al. "Vibration control of seismic structures using semi-active friction
multiple tuned mass dampers." Engineering Structures 32.10 (2010): 3404-3417.
60
9) Lourenco,R. , Roffel A J nd N r s m n 2009 “Ad pt v p ndulum m ss
d mp r or t ontrol o stru tur l v r t ons” Cansmart 2009 international workshop
smart materials and structures 22 - 23 october 2009, montreal, quebec, Canada
10) Nagashima Ichiro, Maseki Ryota, As m Yut k nd H r Jun 2001 “Performance of
hybrid mass damper system applied to a 36-storey high-r s u ld ng” Earthquake
engineering and structural dynamics earthquake engng struct. dyn. 2001; 30:1615–1637
(doi: 10.1002/eqe.84)
11) d k F m t l 1997 ”A m t od o st m t ng t p r m t rs o tun d m ss d mp rs
or s sm ppl t ons” Earthquake engineering and structural dynamics, vol. 26,
617ð635
12) Saidi, I . ,Mohammed, A. D. and Gad E F 2007 “Optimum Design for Passive
Tuned Mass Dampers Using Viscoelastic Materials” Australian Earthquake Engineering
Society 2007 Conference
13) Samali, Bijan and Al-D wod o mm d 2003 “P r orm n o v -storey
ben m rk mod l us ng n t v tun d m ss d mp r nd uzzy ontroll r”
Engineering Structures 25 (2003) 1597–1610.
14) t r d 2001 “Application of semi-active tuned mass dampers to base-excited
syst ms” Earthquake engineering and structural dynamics earthquake engng struct. dyn.
30:449{462
15) Wong K.K.F(2008) “Seismic Energy Dissipation of Inelastic Structures with Tuned Mass
D mp rs”Journal of Engineering Mechanics, Vol. 134, No. 2 77)
61
16) Wu, J., and Chen, G. 2000 “Opt m z t on o mult pl tun d m ss d mp rs or s sm
r spons r du t on ” Proceedings of the American Control Conference, 0-7803-5519-
523/00.
17) IS: 13920, (1993), Indian Standard Code of Practice for Ductile Detailing of Reinforced
Concrete Structures Subjected to Seismic Forces, Bureau of Indian Standards, New Delhi
18) IS: 1893, (Part1), (2002), Indian Standard Criteria for Earthquake Resistant Design of
Structures, Bureau of Indian Standards, New Delhi
19) IS: 456, (2000), Indian Standard Code of Practice for Plain and Reinforced Concrete,
Bureau of Indian Standards, New Delhi
20) REIH, (2008), Structural Analysis And Design. Pro (STAAD). Pro, Version 8i, Research
Engineers. Intl. Headquarters, USA
21) Wikipedia, 2013, http://en.wikipedia.org/wiki/Earthquake