structure and internal dynamics of a side chain liquid crystalline polymer in various phases by...
TRANSCRIPT
Structure and internal dynamics of a side chain liquid crystalline polymerin various phases by molecular dynamics simulations: A step towardscoarse graining
Jaroslav M. Ilnytskyia� and Dieter NeherInstitute for Physics, University of Potsdam, Am Neuen Palais 10, 14469 Potsdam, Germany
�Received 6 September 2006; accepted 5 February 2007; published online 4 May 2007�
Side chain liquid crystalline polymer with relatively long spacer was modeled on a semiatomisticlevel and studied in different liquid crystalline phases with the aid of molecular dynamicssimulations. Well equilibrated isotropic, polydomain smectic and monodomain smectic phases werestudied for their structural and dynamic properties. Particular emphasis was given to the analysis ona coarse-grained level, where backbones, side chains, and mesogens were considered in terms oftheir equivalent ellipsoids. The authors found that the liquid crystalline phase had a minor influenceon the metrics of these objects but affected essentially their translational and orientational order. Inthe monodomain smectic phase, mesogens, backbones, and side chains are confined spatially. Theirdiffusion and shape dynamics are frozen along the mesogen director �the one-dimensionalsolidification� and the reorientation times increase by one to one-and-half orders of magnitude. Inthis phase, besides obvious orientational order of mesogens and side chains, a stable detectable orderof the backbones was also observed. The backbone director is confined in the plane perpendicularto the mesogen director and constantly changes its orientation within this plane. The backbonediffusion in these planes is of the same range as in the polydomain smectic phase at the sametemperature. A detailed analysis of the process of field-induced growth of the smectic phase wasperformed. The study revealed properties of liquid crystalline polymers that may enable their futurefully coarse-grained modeling © 2007 American Institute of Physics. �DOI: 10.1063/1.2712438�
I. INTRODUCTION
Side chain liquid crystalline polymers �SCLCPs� werefirst synthesized in 1978 �Ref. 1� and have attracted muchattention of physicists and chemists since then.2 As the nameimplies, each molecule consists of the backbone and sidechains, each terminated by the mesogen unit. Using polymerterminology, the side chains can be considered as spacersthat link the mesogens to the backbone. The unrestrainedbackbones would have a tendency to coil, while the me-sogens favor liquid crystalline �LC� mesophases. The com-petition of these two tendencies defines the phase diagram ofSCLCP. The latter will depend on the backbone’s rigidity,spacer length, steric properties of the chains, the strength ofthe LC interaction, etc.3 SCLCP with highly flexible back-bones �e.g., methacrylate based� and a short spacer typicallyhas a glass-transition temperature of Tg�100–120 °C. Athigher temperatures, the nematic and isotropic phases arefound. The same polymer with a longer spacer �of six to tenhydrocarbons� will have a much reduced Tg and instead of anematic phase, a lamellar smectic phase is found.3
Even well above Tg, in the smectic or nematic phase, theSCLCP melt is found to be quite viscous.4 The slow reorien-tational dynamics is indicated by electric field poling5 anddielectric relaxation6 experiments. Due to a slow response inexternal electric or magnetic fields, the SCLCPs have not
found many applications in traditional LC display technolo-gies. However, these polymers have been used for pyroelec-tric applications,7 such as optical storage media8 and for theall-optical fabrication of diffractive elements based on sur-face relief gratings.9 In this context, understanding of mor-phology, dynamics, and self-organization in SCLCPs is ofgreat fundamental and technological interest.
A number of experimental studies using various tech-niques provided insight into the phase diagrams, atomicstructure, and dielectric relaxation in SCLCPs.5,6,10 Theoret-ical studies are based on the hydrodynamics, classical rheol-ogy, and the Rouse theory.11 The adequate description ofthese systems is faced with a number of difficulties, namely,the complexity of its highly branched architecture and theexistence of polymer-mesogen coupling. Computer simula-tions proved to be a powerful tool, providing the link be-tween microscopical and macroscopical properties.12,13 In apioneering study, Stimson and Wilson performed the firstextensive simulations of the SCLCPs based on the pseudo-atomic model.14 A number of properties have been studiedincluding the phase diagram, the structure, phase separation,and diffusion coefficients of SCLCPs in various LC phases.Our work is motivated both by this study and by the need tounderstand better the morphology changes in azobenzene-containing SCLCPs under illumination.15
In this study, we used the united-atom force field modelsimilar to the one of Ref. 14 with Gay-Berne mesogens.16
This kind of modeling has been proven to be efficient in a
a�Also at Institute for Condensed Matter Physics, National Academy of Sci-ences of Ukraine, 1 Svientsitskii Str., 79011 Lviv, Ukraine. Electronicmail: [email protected]
THE JOURNAL OF CHEMICAL PHYSICS 126, 174905 �2007�
0021-9606/2007/126�17�/174905/12/$23.00 © 2007 American Institute of Physics126, 174905-1
Downloaded 07 May 2007 to 141.89.177.170. Redistribution subject to AIP license or copyright, see http://jcp.aip.org/jcp/copyright.jsp
number of simulations of polymer LCs.14,17,18 The moleculardynamics �MD� simulations are performed with the aid ofthe GBMOLDD program.19,20 Each component of the diagonalpressure tensor is controlled independently using three sepa-rate barostats. Due to the existent studies on the phase mor-phology on a pseudoatomic level,14 we were able to concen-trate on the coarse-grained behavior of the SCLCP. At eachtime instant, the SCLCP melt is split into three subsystems,the backbones, the side chains, and the mesogens. Each poly-atomic object is coarse grained into its equivalent ellipsoid,and the ensemble of these is studied with respect to theirshape, arrangement, diffusion, and reorientational dynamics.The emphasis is put on the peculiarities of these properties invarious LC phases.
The outline of this study is as follows. In Sec. II weprovide details on the modeling and simulation techniqueapplied. In Sec. III the approximate phase boundaries for theLC phases are evaluated and a set of well equilibrated phasesis prepared. In Secs. IV and V the set of phases is studiedwith focus on the structural and dynamical properties, re-spectively. In Sec. VI we perform an analysis of the field-induced growth of the smectic phase and suggest possiblemicroscopic mechanisms of this growth. Section VII containconclusions.
II. MODEL AND SIMULATIONAL TECHNIQUE
The model used in this study is a hybrid of sphericallysymmetrical and anisometric sites.14,17,18 Hydrocarbongroups of the polymer are described via united-atom formal-ism using force field parameters of Vlugt et al. for branchedalkanes.21 The mesogens are considered to be rigid anisomet-ric objects that interact via Gay-Berne potential.16
The bonded interactions include bond stretching Vb,bond angle bending Va, pseudobond angle bending Vz, andtorsional Vt energy terms given by the following expressions:
Vb = − �i=1
Nb�1�
kb
2�li − l�1��2 − �
i=1
Nb�2�
kb
2�li − l�2��2, �1�
Va = − �i=1
Na�1�
ka
2��i − ��1��2 − �
i=1
Na�2�
ka
2��i − ��2��2, �2�
Vz = − �i=1
Nz kz
2��i − �0�2, �3�
Vt = �i=1
Nt�1�
�n=1
3
Cn�1� cosn �i + �
i=1
Nt�2�
�n=1
3
Cn�2� cosn �i, �4�
where li, ai, �i, and �i denote the ith bond length, bond angle,pseudobond angle, and torsion angle, respectively. We con-sider the following types of pseudoatoms, CH3, CH2, andCH, the branching sites are of CH type. Then, l�1� and l�2� inEq. �1� are the reference bond lengths for the CHx–CHy andCHx-mesogen bonds, respectively. ��1� and ��2� in Eq. �2� arethe reference angles for the nonbranched �X–CH2–X� andbranched �X–CH–X� bond angles, respectively. The tor-
sional energy �Eq. �4�� has a Ryckaert-Bellemans form22
with different sets of constants, Cn�1�, Cn
�2� for the non-branched �X–CH2–CH2–X� and branched�X–CH2–CH–X� torsional angles �the torsional angle �=0corresponds to the trans arrangement�. The pseudobondangle �i was introduced in Ref. 17. It is measured betweenthe long axis of the mesogen and the direction of the bondthat connects it to the pseudoatom �here the value �0=0 isused�. This term prevents the mesogen from unphysical ro-tations with respect to the last atom in the side chain �formore details, see Ref. 17�. The total numbers of bonds,angles, pseudobond angles, and torsion angles are Nb, Na, Nz,and Nt, respectively. The complete set of force constants forthe bonded interactions is presented in Table I.
The nonbonded interactions include the Lennard-JonesVa−a, Gay-Berne Vm−m, and mixed Va−m contributions calcu-lated as the sum of appropriate pairwise interactions:
Va−a = ��ij�aiaj
rij12 −
cicj
rij6 , �5�
where rij is the distance between the ith and the jth pseudoa-toms and ai, ci are factorized Lennard-Jones energy param-eters.
Vm−m = ��ij�
4�ij���ij�12 − ��ij�6� , �6�
where �ij and �ij are effective energy and reduced distanceparameters, respectively, and both are the functions of themesogen orientations ei, e j and their interconnecting vectorrij. Complete expressions can be found elsewhere.16 In thisstudy we used the following parametrization for the Gay-Berne potential; �=1, �=2, length/breadth ratio �=3, side-
TABLE I. Force field parameters used in this study.
Force field constant Numerical value
Mass, pseudoatoms CH3, CH2, CH 0.232 47610−25 kgEnergy parameter ai for CH3 2112.1910−10 �JEnergy parameter ci for CH3 39.419 310−10 �JEnergy parameter ai for CH2 1877.0510−10 �JEnergy parameter ci for CH2 30.920 210−10 �JEnergy parameter ai for CH 1222.8310−10 �JEnergy parameter ci for CH 17.742 510−10 �JMass, mesogens 0.375 28210−24 kgMoment of inertia, mesogens 0.469 10310−23 kgAtom-atom bond length l�1� 1.540 ÅAtom-mesogen bond length l�2� 7.075 ÅBond stretch energy constant, kb 361.29110−20 J /Å2
Nonbranched angle ��1� 1.989 7 radBranched angle ��2� 1.954 8 radBond angle energy constant, ka 86.29110−20 J / rad2
Nonbranched torsion energy, C0�1� 1.394 110−20 J
Nonbranched torsion energy, C1�1� 2.786 810−20 J
Nonbranched torsion energy, C2�1� 0.188 2410−20 J
Nonbranched torsion energy, C3�1� −4.369 110−20 J
Branched torsion energy, C0�2� 0.515 0510−20 J
Branched torsion energy, C1�2� 1.268 910−20 J
Branched torsion energy, C2�2� 0.370 2210−20 J
Branched torsion energy, C3�2� −2.398 410−20 J
174905-2 J. M. Ilnytskyi and D. Neher J. Chem. Phys. 126, 174905 �2007�
Downloaded 07 May 2007 to 141.89.177.170. Redistribution subject to AIP license or copyright, see http://jcp.aip.org/jcp/copyright.jsp

to-side/end-to-end well depth ratio ��=5, and the length andenergy scale parameters are 0=5 Å and �0=0.561 2710−20 J. Similar expressions can be derived for the mixedinteractions between the ith pseudoatom and the jth mesogenusing extended Gay-Berne potential:23
Va−m = ��ij�
4�ij� ���ij� �12 − ��ij� �6� . �7�
The meaning of �ij� and �ij� is similar to that for �ij and �ij,more details can be found elsewhere.17,19 The Lennard-Jonesinteractions are cut at rc=9.8 Å and the long-range correc-tion to the potential energy and the virial are evaluated,12
while the Gay-Berne and mixed interactions are cut at rc�=18.9 Å and rc�=16.5 Å, respectively, and shifted in a waythat Vm−m�rc��=Va−m�rc��=0. The complete set of force con-stants for the nonbonded interactions is presented in Table I.Topologically, each polymer chain consists of a backbone of39 pseudoatoms and 10 side chains attached to it in a syn-diotactic way. As shown in Fig. 1, each side chain containsten pseudoatoms and is terminated by the mesogen.
The MD simulations were performed with the aid of theparallel program GBMOLDD.19,20 We employed the NPT en-semble with the temperature control performed by the Nóse-Hoover thermostat24 and the pressure components controlledby three separate barostats �anisotropic Hoover-typebarostat�. The equations of motion can be derived from thefollowing scaled Lagrangian:
LL = �i=1
Na+Nm mi
2�LTi�2 + �
i=1
Nm Ii
2�ei�2 − U��Lsi ,�ei �
+Q
2�2 − kBTfixg� +
Qp
2TrXp
2 − Pfix det L , �8�
which is written for a system of Na pseudoatoms and Nm
mesogens with masses mi and moment of inertia �for themesogens only� Ii. The Lagrangian is formulated in terms ofscaled coordinates si, where ri=Lsi �here ri are real, non-scaled coordinates�. L is the diagonal tensor which containsthe box dimensions on its diagonal. Here and thereafter weassume the expressions of AB and Ax to be matrix products,where A and B are matrices and x is a column vector. Thethermostat of mass Q maintains fixed temperature Tfix whilethree barostats of equal mass Qp each are used to constraineach component of the pressure tensor �defined below� withthe trace Pfix. U is the potential energy, tensor Xp is defined
as Xp=L−1L, g=3�Na+Nm�−3+2Nm is the number of de-grees of freedom, � is the integral thermostat variable, and
kB is the Boltzmann constant. The Lagrangian �8� generatesthe following equations of motion:
vi = fi�r� − �vi − Xpvi,
ui = gi� − �ui − iei,
ri = vi + Xpri,
ei = ui,
�9�
� =1
Q�2K − gkBTfixI� ,
� = � ,
Xp =3V
QpP −
Pfix
3I ,
L = LXp,
where vi are fictitious velocities introduced for the sake of
convenience �the real velocities are ri=Lsi+ Lsi�vi+Xpri�and ui are the time derivatives of mesogen orientationsei. fi
�r�=Fi�r� /mi are reduced forces acting on the ith atom.
The forces Fi�r� are evaluated with respect to the real coordi-
nates r. Rotational force g� is given by the expression g�
= �Gi− �Gi ·ei�ei� / Ii, where the gorque Gi is evaluated as agradient of the potential energy relative to ei.
12 i is theLagrange multiplier which is calculated iteratively at eachMD step �for more detail, see Ref. 20�. I is the unit matrix,and P=1/3V�2K+3W� is the diagonal pressure tensor de-fined in a usual way via the kinetic energy K and the virial Wdiagonal tensors12
K�,� = �i=1
Na+Nm mi�vi,��2
2, W�,� = �
i=1
Na+Nm ri,�Fi,�
3. �10�
The volume V can be expressed as det L.One should mention that the thermostat effect works rea-
sonably well in the equilibrium only, where relatively smallfluctuations of the temperature take place. In a course of fastheating/cooling runs, long-lasting temperature oscillationsmay occur. Therefore, during the quenching and coolingruns, described later in this study, we used a more robust�albeit not thermodynamically exact� method of velocity res-caling for the temperature control. All the production runs inequilibrium in this study were performed using this thermo-stat technique. The thermostat and barostat masses were es-timated according to
Q � �Ntr + Nrot�kBT�2, Qp � NtrkBT�2,
where Ntr=3�Na+Nm�, Nrot=2Nm are the number of transla-tional and rotational degrees of freedom and the time con-stant � is chosen to be 1 ps.
For the integration of the equations of motion �9� weused the leapfrog algorithm, the RATTLE constraint has beenapplied for the integration of mesogen rotation �see Ref. 20�.The time step �t=2 fs was found to be acceptable for all
FIG. 1. Schematic representation of a model SCLCP chain.
174905-3 Side chain liquid crystalline polymer J. Chem. Phys. 126, 174905 �2007�
Downloaded 07 May 2007 to 141.89.177.170. Redistribution subject to AIP license or copyright, see http://jcp.aip.org/jcp/copyright.jsp

production runs. Furthermore, the extended Hamiltoniandrift was found not to exceed 1%–2% for the simulations runwith durations of tens of nanoseconds.
III. THE APPROXIMATE PHASE DIAGRAMAND PREPARATION OF THE PHASES
The chemical structure is crucial to the phase diagram ofa real SCLCP. The factors to mention are backbone rigidity,spacer length, transient dipole, spatial symmetry of the me-sogenic unit, etc.3 The use of the force field model will in-evitably neglect or coarse grain some of these chemical de-tails. Other simulation-specific factors that influence thephase diagram are the cutoff radii and a finite system size.Therefore, the exact relationship between the model and thereal phase diagrams is not known.
To estimate the phase boundaries of our model SCLCP,preliminary “melting” runs were done. The initial configura-tion, referred to as O, was built with 64 SCLCP molecules ina regular double-layered lamellar arrangement. To avoid ar-tifacts on box edges, the backbones were initially brokenacross box boundaries and the periodic boundary conditionswere applied. The melting runs were undertaken for up to16 ns. The simulations were performed in an anisotropicNPT ensemble at atmospheric pressure and at a set of tem-peratures ranging from 450 to 600 K �using velocity rescal-ing�. The model SCLCP preserves stable smectic order at T=485 K and below and melts quickly into the isotropic phaseat T�520 K. At intermediate temperatures, T=490–495 K,slow melting is observed. The plot in Fig. 2 shows only theorientational order parameter of the mesogens. It is defined
in the standard way as S2= �P2�cos�e ,nˆ ���,25 where e is themesogen orientation vector, n is the nematic director, andP2�x�=1/2�3x2−1� is the second Legendre polynomial. Theintermediate phases can be identified as polydomain smectic�or, “polysmectic,” similar to the polycrystalline phases insolids� with different degrees of “memory” of the initiallamellar structure. Stability of the phases is consideredwithin the time “window” of the simulations, which is in theorder of tens of nanoseconds.
We estimated the smectic to isotropic �SI� transition tem-perature to be TSI�490 K. No evidence for the nematicphase was found, in agreement with the phase diagrams ofreal SCLCPs with a long �six to ten hydrocarbons� spacerand syndiotactic structure.3
Utilizing these runs, the phases obtained can be used asan input for the production runs. However, due to the slowrelaxation of the SCLCPs, the morphological genuinity ofthe smectic phase obtained by the equilibration of the O
phase at T=485 K may be questioned. A genuine smecticphase should be grown out of the isotropic phase. It is knownfrom both the experiment26 and computer simulations14 thatthe growth of the monodomain smectic phase should be as-sisted by some external aligning field. In Ref. 14 this wasdone by applying such a field and cooling the system fromT=500 down to T=200 K in 50 K steps. In our study, weattempted to prepare different phases at temperatures as closeas possible to minimize their thermal differences. Therefore,the smectic phase is grown at some constant temperature T�TSI�490 K. In addition, the formation of a lamellar struc-ture requires massive rearrangement of the polymer chains.This can be done more efficiently at T�Tg�200–300 K,while at T�Tg the long-living entanglements and conforma-tional traps can occur.
The external field which aligns the mesogens is intro-duced via an extra rotational energy term
Uifield = − F · P2�cos��i�� , �11�
where F�0 is the field strength and �i is the angle betweenthe long axis of the ith mesogen and the direction of the field.We will also use the reduced field strength f , where F= f10−20 J.
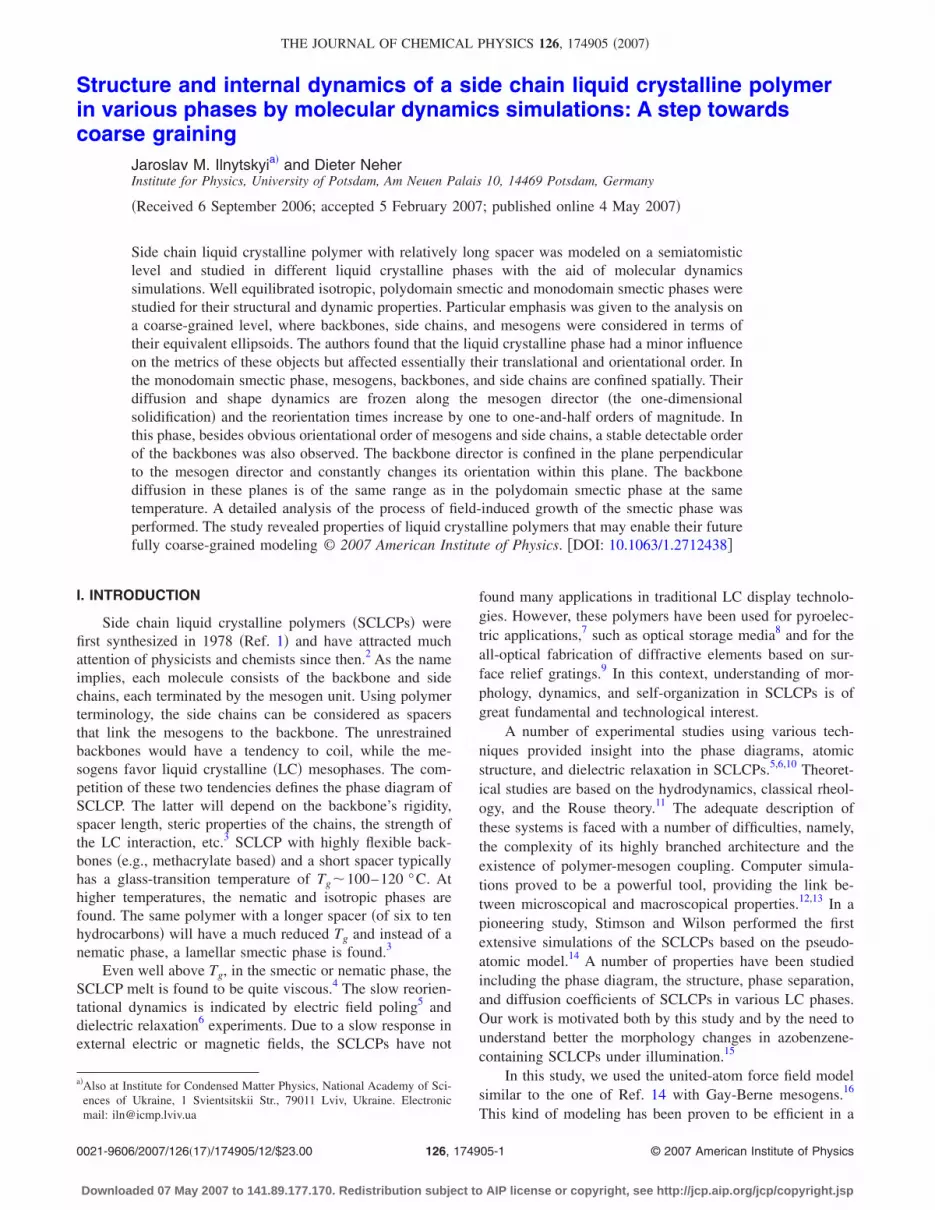
We have confirmed previous observations14 that the useof a relatively large field strength f �0.5 leads to a quicklygrown smectic phase, but the phase is unstable when the fieldis turned off. This path can be used for growing the polys-mectic phases �see Table II�. More details about growing amonodomain smectic phase can be found in Sec. VI. Inshort, the most successful attempt was using the fieldstrength f =0.2 at the temperature T=490 K. After 11 ns,when the order parameter stabilizes firmly, the system iscooled down to T=485 K and equilibrated further for an-other 16 ns with no field �the phase Sgrw in Table II�. Theevolution of the mesogen order parameter during this run isshown in Fig. 3. The snapshots for some of the phases arepresented in Fig. 4 for illustrational purposes. The completeset of phases with the details of their preparation is presentedin Table II.
FIG. 2. The order parameter S2 while performing “melting” runs of the Oconfiguration at various temperatures.
TABLE II. Phases of the model SCLCP and the details of their preparation.The initial O phase was built geometrically following a double-layeredlamellar arrangement.
Phase Details of preparation
I600 Isotropic, O melted for 4 ns at T=600 KI520 Isotropic, O melted for 4 ns at T=520 KP495 Polysmectic, O melted for 18 ns at T=495 KP490�1� Polysmectic, I600 cooled down to T=485 K
in f =0.5 field for �7 ns, then equilibratedwith no field at T=490 K for �11 ns
P490�2� Polysmectic, I600 quenched down to T=485 Kin f =0.2 for �12 ns, then equilibratedwith no field at T=490 K for �15 ns
P485 Polysmectic, I600 quenched at T=485 K for 4 nsSmlt Smectic, O equilibrated at T=485 K for 13 nsSgrw Smectic, I600 quenched down to T=490 K
in f =0.2 field for �11 ns, then equilibratedwith no field at T=485 K for �16 ns
174905-4 J. M. Ilnytskyi and D. Neher J. Chem. Phys. 126, 174905 �2007�
Downloaded 07 May 2007 to 141.89.177.170. Redistribution subject to AIP license or copyright, see http://jcp.aip.org/jcp/copyright.jsp
Basically, the use of a number of similar phases thatdiffer in their preparation history can be seen as a simpleform of configurational averaging.
IV. STRUCTURE OF THE PHASES
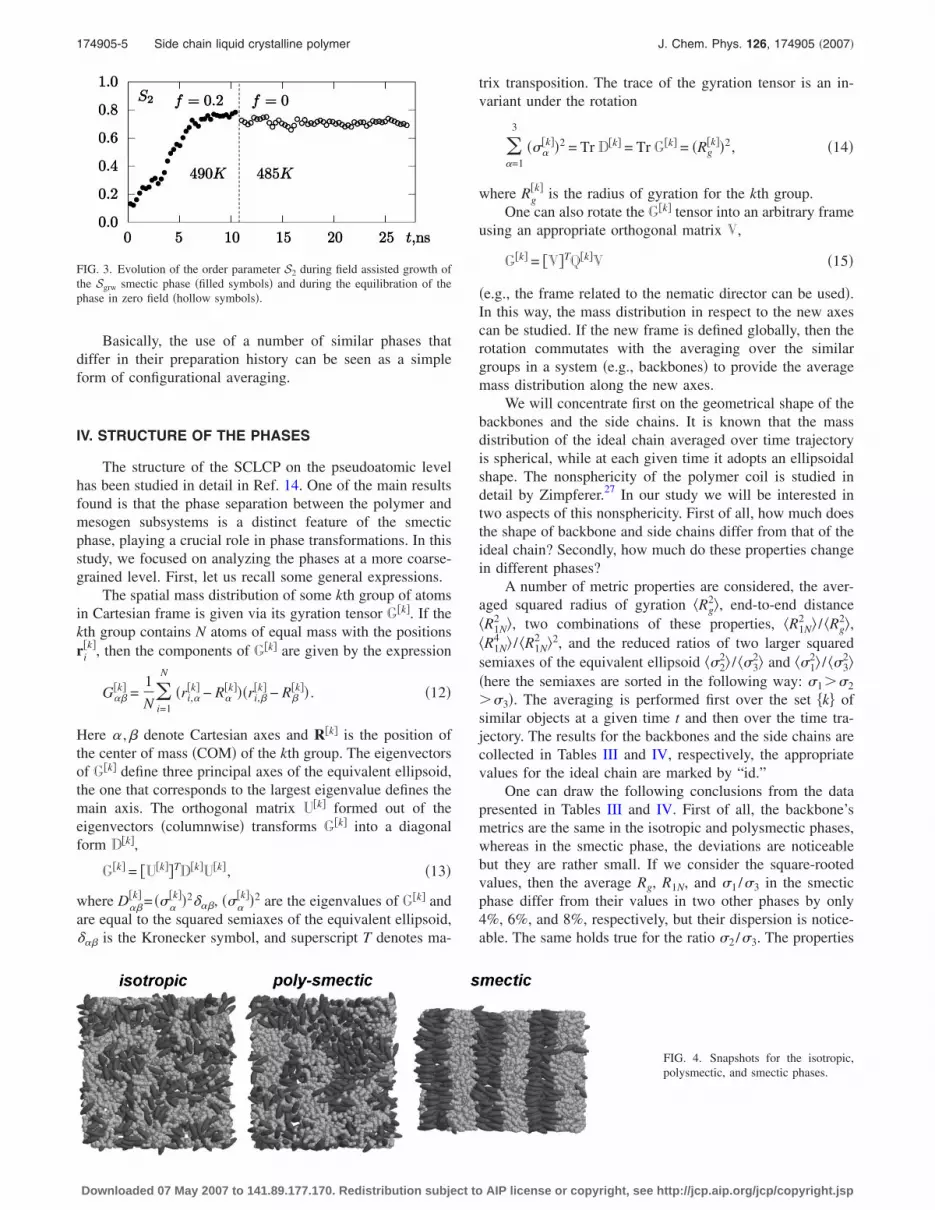
The structure of the SCLCP on the pseudoatomic levelhas been studied in detail in Ref. 14. One of the main resultsfound is that the phase separation between the polymer andmesogen subsystems is a distinct feature of the smecticphase, playing a crucial role in phase transformations. In thisstudy, we focused on analyzing the phases at a more coarse-grained level. First, let us recall some general expressions.
The spatial mass distribution of some kth group of atomsin Cartesian frame is given via its gyration tensor G�k�. If thekth group contains N atoms of equal mass with the positionsri
�k�, then the components of G�k� are given by the expression
G���k� =
1
N�i=1
N
�ri,��k� − R�
�k���ri,��k� − R�
�k�� . �12�
Here � ,� denote Cartesian axes and R�k� is the position ofthe center of mass �COM� of the kth group. The eigenvectorsof G�k� define three principal axes of the equivalent ellipsoid,the one that corresponds to the largest eigenvalue defines themain axis. The orthogonal matrix U�k� formed out of theeigenvectors �columnwise� transforms G�k� into a diagonalform D�k�,
G�k� = �U�k��TD�k�U�k�, �13�
where D���k� = ��
�k��2���, ���k��2 are the eigenvalues of G�k� and
are equal to the squared semiaxes of the equivalent ellipsoid,��� is the Kronecker symbol, and superscript T denotes ma-
trix transposition. The trace of the gyration tensor is an in-variant under the rotation
��=1
3
���k��2 = Tr D�k� = Tr G�k� = �Rg
�k��2, �14�
where Rg�k� is the radius of gyration for the kth group.
One can also rotate the G�k� tensor into an arbitrary frameusing an appropriate orthogonal matrix V,
G�k� = �V�TQ�k�V �15�
�e.g., the frame related to the nematic director can be used�.In this way, the mass distribution in respect to the new axescan be studied. If the new frame is defined globally, then therotation commutates with the averaging over the similargroups in a system �e.g., backbones� to provide the averagemass distribution along the new axes.
We will concentrate first on the geometrical shape of thebackbones and the side chains. It is known that the massdistribution of the ideal chain averaged over time trajectoryis spherical, while at each given time it adopts an ellipsoidalshape. The nonsphericity of the polymer coil is studied indetail by Zimpferer.27 In our study we will be interested intwo aspects of this nonsphericity. First of all, how much doesthe shape of backbone and side chains differ from that of theideal chain? Secondly, how much do these properties changein different phases?
A number of metric properties are considered, the aver-aged squared radius of gyration �Rg
2�, end-to-end distance�R1N
2 �, two combinations of these properties, �R1N2 � / �Rg
2�,�R1N
4 � / �R1N2 �2, and the reduced ratios of two larger squared
semiaxes of the equivalent ellipsoid �22� / �3
2� and �12� / �3
2��here the semiaxes are sorted in the following way: 1�2
�3�. The averaging is performed first over the set �k ofsimilar objects at a given time t and then over the time tra-jectory. The results for the backbones and the side chains arecollected in Tables III and IV, respectively, the appropriatevalues for the ideal chain are marked by “id.”
One can draw the following conclusions from the datapresented in Tables III and IV. First of all, the backbone’smetrics are the same in the isotropic and polysmectic phases,whereas in the smectic phase, the deviations are noticeablebut they are rather small. If we consider the square-rootedvalues, then the average Rg, R1N, and 1 /3 in the smecticphase differ from their values in two other phases by only4%, 6%, and 8%, respectively, but their dispersion is notice-able. The same holds true for the ratio 2 /3. The properties
FIG. 3. Evolution of the order parameter S2 during field assisted growth ofthe Sgrw smectic phase �filled symbols� and during the equilibration of thephase in zero field �hollow symbols�.
FIG. 4. Snapshots for the isotropic,polysmectic, and smectic phases.
174905-5 Side chain liquid crystalline polymer J. Chem. Phys. 126, 174905 �2007�
Downloaded 07 May 2007 to 141.89.177.170. Redistribution subject to AIP license or copyright, see http://jcp.aip.org/jcp/copyright.jsp

of the side chains are even less sensible to the SCLCP phase;the changes of the average Rg, R1N, 1 /3, and 2 /3 in thesmectic and polysmectic phases are 1.2%, 2%, 4%, and−3%, respectively, but their distributions are much narrower,too. Gradual increase of 1 /3 for the side chains in thepolysmectic and smectic phases �as compared to the isotro-pic one� indicates their gradual stretching. However, the ef-fect is surprisingly small. Backbones and, to a much greaterextent, the side chains adopt the conformations that deviatefrom that of the ideal chain. This effect can be explained byspecific topological constraints in the SCLCP structure. Spe-cifically, the side chains are grafted to the backbone on oneend and have a massive mesogen unit attached on the other.Clearly, this restricts their conformational freedom.
Given the minor differences between phases in terms ofbackbones and side chains conformations, one may look forsome peculiarities in their spatial arrangement. First we willconcentrate on the positional order of the COMs, which canbe studied via the appropriate radial distribution functions�RDFs�. The RDFs for the mesogens gm−m�r� and side chainsgc−c�r� almost coincide in the isotropic and polysmecticphases, but in the smectic phase gc−c�r� has smaller valuesand shows less structure at r�10 Å �see Fig. 5�. This can beattributed to the side chain flexibility. A certain degree of theside chain COM positional order, even at T=600 K, can beexplained by the way the side chains are connected to thebackbone. With a decrease in temperature and entering thepolysmectic phase, the order grows monotonically and thenexperiences a pronounced jump in the smectic phase.
On the contrary, the positional order of the backboneCOMs is absent at T=600 K. With decreasing temperature, itgrows rather monotonically until the maximum values arereached in the smectic phase �see Fig. 6�. One would con-clude that the positional order of the backbone COMs is
driven more by the temperature, while the one for the me-sogens and the side chains depends more on the intramolecu-lar connectivity and the SCLCP phase.
At T�600 K, the maximum of gb−b�r� is achieved at thedistances comparable to the radius of gyration Rg �see TableIII�, which is to be expected. One should also note that thebackbones’ COM RDFs for the two smectic phases are dif-ferent in a way that the short-range fluctuations are absent forthe Smlt phase, which can be attributed to the different his-tory of both samples. One should emphasize that the differ-ence was not observed for any other property studied above.
Now we will concentrate on the peculiarities in the spa-tial orientations of the backbones and the side chains. First ofall, we will analyze their averaged mass distribution given bythe components of the gyration tensor �12�. In the smecticphase, we are interested in the anisotropy of the mass distri-bution with respect to the mesogen director. To this end, ateach time t, the gyration tensor G�k� is averaged over the set�k of similar objects �e.g., the backbones�. Then, it is rotatedinto the reference frame related to the instantaneous mesogendirector, yielding Q�t�= �V�t��G�k���k�V�t��T. The Q�t� tensoris then averaged over the time trajectory, Q= ��Q�t���t. Thesquared radius of gyration can be written as Rg
2= �Qxx+Qyy�+Qzz=R�
2 +R�2, where R�
2 is the component perpendicular tothe mesogen director and R�
2 is its perpendicular counterpart.Both quantities can be measured experimentally.28 The datafor Q�� are shown in Tables V and VI.
TABLE III. Metrics parameters of the backbones, see explanations in thetext, the data in each phase are averaged over the available configurations.
Phase Isotropic Polysmectic Smectic id
�Rg2� 62±4 61±3 66±3
�R1N2 � 410±30 400±30 460±30
�R1N2 � / �Rg
2� 6.7±0.3 6.6±0.3 6.9±0.3 6�R1N
4 � / �R1N2 �2 1.4±0.1 1.5±0.1 1.5±0.1 5/3
�22� / �3
2� 3.5±0.3 3.5±0.3 3.7±0.3 2.5�1
2� / �32� 18±2 17±2 20±2 11.8
TABLE IV. Metrics parameters of the side chains, see explanations in thetext, the data in each phase are averaged over the available configurations.
Phase Isotropic Polysmectic Smectic id
�Rg2� 10.4±0.1 10.7±0.1 10.9±0.1
�R1N2 � 86±2 90±1 94±1
�R1N2 � / �Rg
2� 8.27±0.07 8.41±0.04 8.58±0.04 6�R1N
4 � / �R1N2 �2 1.06±0.01 1.05±0.01 1.04±0.01 5/3
�22� / �3
2� 4.3±0.1 4.3±0.1 4.1±0.1 2.5�1
2� / �32� 48±2 53±1 57±2 11.8
FIG. 5. Mesogen gm−m�r� and side chain gc−c�r� COM-COM radial distribu-tion functions. The curves from the bottom to the top are I600 K, I520 K,polysmectic phases, and smectic phases.
FIG. 6. Backbone COM-COM radial distribution functions gb−b�r�, see no-tations in the plot.
174905-6 J. M. Ilnytskyi and D. Neher J. Chem. Phys. 126, 174905 �2007�
Downloaded 07 May 2007 to 141.89.177.170. Redistribution subject to AIP license or copyright, see http://jcp.aip.org/jcp/copyright.jsp

As one can see, the mass distributions of the backbonesand side chains in the smectic phases are markedly differentfrom that in the other phases. The mass distribution of theside chains follows the mesogen director, extending alongthe Z axis, while that for the backbones is distributed pre-dominantly perpendicular to it. That is expected due to thephase separation in the lamellar structure of this phase.14,28
Since the shapes of the backbones and the side chains arefound earlier to be mostly unchanged, a strong anisotropy intheir mass distribution indicates an essential degree in theirorientational order in the smectic phase.
To address this problem further, we introduce order pa-rameters and directors for the backbones and side chain sub-systems. These are evaluated according to the orientations oftheir equivalent ellipsoids similar to the same properties ofthe mesogens. In general, the instantaneous orientation of themain axis of the kth group of atoms can be characterized bythe eigenvector E1
�k� that corresponds to the largest eigen-value 1
2 of its gyration tensor G�k�. An ensemble of suchgroups can be characterized by an instantaneous orderingdirector n and the corresponding orientational order param-eter S2 is
S2 = �P2�cos�E1�k�,nˆ ��� . �16�
In this study we define three orientational order parametersS2,b, S2,c, and S2,m and three directors nb, nc, and nm for thebackbone, the side chain, and the mesogen subsystems, re-spectively. As expected, the order parameters S2,b and S2,c
�alongside with that for the mesogens S2,m� are close to zeroin the isotropic and polysmectic phases. In the smectic phase,however, all subsystems demonstrate a stable orientationalorder of different degrees, with S2,b�0.28, S2,c�0.40, andS2,m�0.70.
The stable, albeit not as strong as for the other sub-systems, orientational order of the backbones is rather sur-prising. The evolution of the backbone director nb in timeindicates that the latter is confined to the X ,Y plane, where itconstantly changes its orientation. This plane is perpendicu-lar to the mesogen director nm �see Fig. 7�. To avoid any
misunderstanding, it should be known that we defined thebackbone order parameter S2,b in a “nematic way,” i.e., inrespect to spontaneously emerging orientational order in thissubsystem and not in respect to the mesogen director of themesogens �in the latter case S2,b would be close to −0.5�.
The order parameters are characterizing a global orien-tational order in each subsystem, while it is also interestingto determine the amount of local orientational order. This canbe done via the orientational pair correlation function�OPCF� px−x�r�, which measures the correlation between theorientations of two elongated objects of type x at a givendistance r.29 When r is large, the OPCF coincides with thesquared order parameter �S2,x�2. We have found the mesogen-mesogen OPCF pm−m�r� to have a standard form found innematic and smectic phases of liquid crystals.3 The sidechain OPCF pc−c�r� closely follows the same shape, but theamplitudes are smaller �see Fig. 8�. The first peak at r�6 Å corresponds to the separation between the neighboringside chains from one molecule attached to the same side ofthe backbone. The well at r�3.5 Å indicates mostly a per-pendicular arrangement of the side chains from differentmolecules, if their centers happen to come close.
We should remark that local orientational order growsmonotonously with the temperature decrease from T=600 K in isotropic phase down to T=485 K in polysmectic
TABLE V. Averaged diagonal components of the backbone mass distribu-tion tensor in director frame in different phases. The data in each phase areaveraged over the available configurations.
Phase Isotropic Polysmectic Smectic
Qxx 20±2 19±2 28±2Qyy 21±2 21±3 31±3Qzz 21±2 21±2 7±1
TABLE VI. Averaged diagonal components of the side chain mass distribu-tion tensor in director frame in different phases. The data in each phase areaveraged over the available configurations.
Phase Isotropic Polysmectic Smectic
Qxx 3.5±0.2 3.8±0.3 2.3±0.1Qyy 3.4±0.1 3.4±0.2 2.3±0.1Qzz 3.5±0.1 3.4±0.2 6.2±0.1
FIG. 7. Time evolution of backbone director nb components with time in theSgrw phase. nb,x �lines� and nb,z �asterisks� components are shown only as faras nb is of unit length.
FIG. 8. Orientational pair correlation function for the mesogen pm−m�r� andfor the side chain pc−c�r� in different phases. The curves from the bottom tothe top are I600 K, I520 K, polysmectic phases, and smectic phases.
174905-7 Side chain liquid crystalline polymer J. Chem. Phys. 126, 174905 �2007�
Downloaded 07 May 2007 to 141.89.177.170. Redistribution subject to AIP license or copyright, see http://jcp.aip.org/jcp/copyright.jsp

phase. In this respect no real difference and no phase transi-tion are detected between these two phases. The nonvanish-ing local orientational order at T=600 K is attributed to theSCLCP molecular topology. On further cooling of the polys-mectic phase down to about T=250 K the local order is get-ting much enhanced and more long ranged.14
The backbone OPCF pb−b�r� demonstrates quite differentbehavior. There is almost no local orientational order in theisotropic and polysmectic phases �as the backbones are notchemically connected�, while it increases rapidly in thesmectic phase �see Fig. 9�. The OPCF pb−b�r� has a maxi-mum at r�9 Å, the distance comparable to the radius ofgyration of the backbones in this phase �see Table III�. Atlonger distances, the OPCF pb−b�r� declines faster than thatfor the mesogens, reflecting a lower value for the backboneorder parameter S2,b�0.28.
V. DYNAMICAL PROPERTIES OF THE PHASES
In this section we will concentrate on the dynamic prop-erties of the SCLCP. At first, the diffusion of the COMs willbe considered. The mean-square displacement �MSD� of theCOM of some kth group of atoms can be defined in thefollowing way:
g3�t� = ��R�k��t� − R�k��0��2� , �17�
where R�k��t�= �Xi�k��t� ,Yi
�k��t� ,Zi�k��t� is the COM position of
this kth group at time t. In the smectic phase one can also beinterested in the parallel and perpendicular �to the mesogendirector� contributions:
g3�t� = g3��t� + g3
� �t� ,
g3��t� = ��Xi
�k��t� − Xi�k��0��2 + �Yi
�k��t� − Yi�k��0��2� , �18�
g3� �t� = ��Zi
�k��t� − Zi�k��0��2� .
The MSDs will be marked by symbols b, c, and m for thebackbones, side chains, and mesogens, respectively.
On a long time scale the macromolecules behavediffusively:30
limt→�
g3�t� = 6Dt , �19�
where D is the diffusion coefficient. D can be further writtenas the sum of parallel and perpendicular components D� andD�,
D = D� + D�, D� = limt→�
g3��t�6t
, D� = limt→�
g3� �t�6t
. �20�
The diffusive regime for the macromolecule should also ap-ply to all of its subsystems.
First of all, we should note that the analysis of the MSDg3�t� for each SCLCP subsystem revealed no intermediatetime slowing-down regimes.30 The diffusive regime isquickly entered in accordance with the fact that the tempera-tures T=485–600 K are much higher than the typical glass-transition temperature Tg for this kind of polymer.
To estimate the diffusion coefficient D for various sub-systems, we used a linear fit to the MSD g3�t� according toEq. �19�. The last third of the time interval was discarded dueto poor statistics at the largest times. Typically, the workinginterval for the fit was about 5–6 ns. As an illustration, theplot for the backbone COM MSD g3�t� is presented in Fig.10.
As one can see, there is a pronounced difference be-tween the diffusion coefficients in the isotropic and polys-mectic phases. It can be explained by the following consid-erations. As is already known for some time, the dynamicalproperties of the SCLCP differ from both that for the lowmolecular weight liquid crystals and for the nonliquid crys-talline side chain polymers.31,32 The effect is attributed to theexistence of a transient network created by dynamic associa-tion of the mesogenic groups belonging to different chains�mesogen-mesogen cross-linking�.32 Further strengthening ofthis network in the smectic phase has a much lesser impacton the diffusion coefficient �Fig. 10�. Concerning differentsubsystems of the SCLCP, we found diffusion to be exactlythe same in all of them, except that in the smectic phase, seeTable VII.
In the smectic phase Sgrw, the diffusion is severely ham-pered along the mesogen director. D� is one to three orderssmaller than D� �see last two columns of Table VII�. D� isfound to be almost the same as in the polysmectic phase atthe same temperature. Hence, all polymer subsystems arestill very “lively” in the planes perpendicular to the director.
The internal dynamics �shape “breezing”� of the SCLCPmolecules can be characterized by an intramolecular MSD:
g2�t� = ��ri�t� − R�k��t� − �ri�0� − R�k��0���2� , �21�
where R�k��t� is the position of the COM at time t for the kthobject to which the ith pseudoatom belongs. Similar to g3�t�,
FIG. 9. Orientational pair correlation function for the backbones in differentphases, see notations in the plot.
FIG. 10. MSD g3�t� for the backbone COMs in different phases �see nota-tions in a figure�. In the smectic phase the contributions perpendicular andparallel to the director are shown only; the sum of both �not shown� overlapswith the perpendicular contribution.
174905-8 J. M. Ilnytskyi and D. Neher J. Chem. Phys. 126, 174905 �2007�
Downloaded 07 May 2007 to 141.89.177.170. Redistribution subject to AIP license or copyright, see http://jcp.aip.org/jcp/copyright.jsp

one can also consider parallel and perpendicular �to the di-rector� contributions.
For the linear polymer chain, g2�t� saturates at a large tto the value proportional to �Rg
2�.33 We found that the relationlimt→�g2�t�=2�Rg
2� holds well for both backbones and sidechains in the isotropic and polysmectic phases. In the case ofthe smectic phase, saturation of g2�t� is not reached withinthe simulation time.
Similar to the COM diffusion, the shape dynamics isalso found to be much different in the smectic phase. How-ever, it is found to be much reduced even in the planes per-pendicular to the mesogen director �in contrary to the COMdiffusion�. One can conclude that in the smectic phase boththe backbones and the side chains tend to be more rigid.However, as previously shown, they are free to diffuse in theX ,Y plane at the same rate as in the polysmectic phase.
In contrary to the COM MSD g3�t�, there is a slowing-down regime for g2�t� at intermediate times. In general, onecan write
g2�t� = At�, �22�
where A=const and � is a characteristic exponent. Accordingto the reptation theory for the linear chains, �=1/4 in areptation regime and �=1/2 in a Rouse regime �which takesplace at times larger than disentanglement time�.30,33 Modecoupling theory34 leads to values similar to the ones in areptation regime. In real systems one might expect � to be acontinuous function of t. In a log-log plots for g2�t� we founda linear dependence �see Fig. 11� with similar values of � inall phases and temperatures considered. The values are �=0.4–0.45 for the backbones and �=0.23–0.26 for the sidechains. Note how these values are close to the Rouse andreptation regime values, respectively. Hence, the backbonesare found to change their shape with the power law whichresembles an ideal coil. On the contrary, the side chains aregrafted to the backbones and are much more topologicallyconstrained. This should be the reason why their shape dy-namics is found to be closer to that of reptating chains.
Secondly, we would like to address the rotational dy-namics in various phases. As was shown in the previoussection, the orientational distribution of various SCLCP sub-systems depends crucially on the specific phase. In particu-lar, in the smectic phase, stable orientational order exists todifferent extent in all subsystems considered �backbones,side chains and mesogens�. The reorientational dynamics isinteresting for both compared with the dielectric relaxationexperiments and for the possible technological applications�especially that for the mesogens�. According to the linear-response theory, the relaxation process can be studied eitherby applying a small perturbation to the system �e.g., weakexternal field� or by observing small fluctuations in the equi-librium state. Following the second path in the MD simula-tions, a number of correlation functions can be evaluated.For the orientational relaxations, consider the director reori-entation correlation function
C�n,t� = �n�t� · n�0�� , �23�
where n is the orientational director for some subsystem�e.g., the backbones�. The averaging is performed over thetime trajectory. The time integral of C�n , t� is related to therotational viscosity. It is important to note that the definitionof the director n is meaningful in the nematic or smecticphase only. We found the time dynamics of the correlationfunction �23� in the smectic phase to be extremely slow.Extracting any meaningful data would require much longersimulation runs. In other phases, the director does not reflectthe reorientation processes, but rather the fluctuations of in-stant anisotropy.
Alternative to this approach, consider the average mo-lecular reorientational correlation function
C�E,t� = ��E�k��t� · E�k��0���k, �24�
where E�k��t� is a unit vector that defines the orientation ofthe kth molecule. Additional averaging is performed hereover all the kth molecules. The time integral over C�E , t�defines the integral relaxation time for the molecular reori-entation. When t is large, the C�E , t� can be expressed as asum of several Debye processes
C�E,t� � �m
Am exp�−t
�m� , �25�
with the apction can be fitted very well by the double Debyeform. The fast process can be attributed to the vibrations andis of lesser interest. Therefore, the relaxation times for theslow process are listed only �see Table VIII�. The resultsshow dramatic slowing down of the reorientation dynamicsin the smectic phase as compared to the other phases. How-ever, we would like to stress that the values for �b, �c, and �m
TABLE VII. Diffusion coefficients Dm, Db, and Dc for the mesogens, backbone, and side chain COMs, respec-tively, in various phases. The parallel and perpendicular contributions are evaluated for the smectic phase Sgrw.
I600 I520 P495 P485 Sgrw� Sgrw�
Dm 194±6 159±7 48±2 36±2 27±2 1.92±0.02Dc 194±7 158±7 47±4 30±2 27±2 0.31±0.09Db 195±8 157±8 46±4 26±3 25±3 0.02±0.01
FIG. 11. Log-log plot of g2�t� for the pseudoatoms in the backbones invarious phases, the notations are similar to those in Fig. 10.
174905-9 Side chain liquid crystalline polymer J. Chem. Phys. 126, 174905 �2007�
Downloaded 07 May 2007 to 141.89.177.170. Redistribution subject to AIP license or copyright, see http://jcp.aip.org/jcp/copyright.jsp

being presented are very model dependent and make senseonly for the comparison of different phases or between them-selves.
VI. ANALYSIS OF SMECTIC PHASE GROWTH
In this section, some analysis of the field-induced growthof the smectic phase will be performed. The aligning fieldhas been introduced in the form of extra rotational energy ofthe mesogens �11�. Their reorientations may lead to variousreactions of the polymer subsystem, e.g., conformationalchanges, excessive stress, diffusion anomalies, etc. These ef-fects may be the ones responsible for different scenarios ofpolymer behavior when the field is switched off. For in-stance, it was observed that in some cases, the newly devel-oped smectic phase either remains stable or transforms into apolysmectic phase.
The field strength f basically defines the reorientationrate of the mesogens and is found to have a profound effecton the dynamics of the smectic phase growth. When f =0.2,the orientational order in the mesogenic, the side chain, andthe backbone subsystems is found to grow simultaneously�Fig. 12, top�. After the field is switched off, the smecticorder is stable in all subsystems. In contrast, for a largervalue f =0.5 the mesogens complete their ordering ahead ofthe other subsystems �Fig. 12, bottom�. When the field isswitched off, this is likely to be a reason why the smecticorder disappears again. We presume that in this case, thequickly grown mesogen order is not “fixed” appropriately byside chain and backbone rearrangements.
The process of lamellar structure formation will requiresome amount of diffusion anisotropy. To verify this, we per-formed an analysis of the diffusion coefficient componentsduring the field assisted growth of the smectic phase. Onecan observe that at the initial stage of this process, the orderparameter growth was linear �see Fig. 3�. Therefore, one canassume that the diffusion is more or less constant at thisstage. We choose a cutoff time of 6 ns and linear fits to theMSDs �18� on the time interval t� �1,4� ns have been ap-plied. The appropriate components of the diffusion �20� havebeen calculated and are presented in the middle row of TableIX. Also, the appropriate values are given in polysmecticP485 and Sgrw smectic phases. One should note that the per-pendicular component D� should be approximately twice aslarge as the parallel one D� in the isotropic phase. Given theerrors for the values, this is the case for the P485 phase.During the field assisted growth of the smectic phase, en-hancement of the parallel component and suppression of theperpendicular one are observed. This coincides with thequalitative picture of the polymer being restructured inten-sively along the aligning field. As the process is isothermic,the total diffusion coefficient does not change in comparisonwith the value in the P485 phase, while only the values of thecomponents are redistributed. After the completion of thegrowth, the reverse redistribution of the component takesplace, and the diffusion along the field is severely hampered�see Table IX�.
To study the stability issue for the field-induced smecticphase in more detail we considered the changes in each po-tential energy term �1�–�7� separately, Fig. 13. No visiblechanges are observed for bonded interactions at all fieldstrengths, f =0.2–1.0. One can deduce that neither growthnor equilibration of the smectic phase involves detectable
TABLE VIII. The principal relaxation times �b, �c, and �m for the reorientation dynamics of the backbones, sidechains, and mesogens in various phases.
Phase I600 I520 P495 P485 Sgrw
�b 0.31±0.03 0.81±0.08 1.32±0.09 2.7±0.3 11±1�c 0.15±0.02 0.45±0.05 0.84±0.07 1.2±0.2 30±3�m 0.14±0.02 0.50±0.06 0.81±0.06 1.3±0.3 43±5
FIG. 12. Evolution of the orientational order parameters for the mesogens�m�, side chains �c�, and backbones �b� during the field-induced growth ofthe smectic phase �filled symbols� and at the relaxation with no field�opened symbols�. The field strength f is marked on each plot.
TABLE IX. Diffusion coefficient anisotropy for the COMs of the mesogens,side chains, and the backbones �indicated by m, c, and b, respectively� inequilibrated polysmectic phase �P485�, during field assisted growth of thesmectic phase �middle row� and in equilibrated smectic phase �Sgrw�.
P485
Isotropic→smecticin f =0.2 field Sgrw
Dm� 26±4 18±4 27±5
Dm� 10±2 19±3 1.9±0.03
Dm 36±6 37±7 29±5Dc
� 21±4 16±4 27±5Dc
� 8.6±2 14±3 0.3±0.03Dc 30±6 30±7 27±5Db
� 18±4 13±4 24±5Db
� 7.5±2 12±3 0.03±0.01Db 26±6 25±7 24±5
174905-10 J. M. Ilnytskyi and D. Neher J. Chem. Phys. 126, 174905 �2007�
Downloaded 07 May 2007 to 141.89.177.170. Redistribution subject to AIP license or copyright, see http://jcp.aip.org/jcp/copyright.jsp

conformational tension. However, we observed essential en-hancement of both atom-atom and mesogen-mesogen vander Waals attractions �Va−a and Vm−m terms decrease signifi-cantly� in the smectic phase. This is attributed to the phaseseparation between the mesogen and polymer subsystemsand can be considered as a main stabilizing factor for thestability of the smectic phase.
Hence, one can conclude the following scenario. Theexternal field defined via Eq. �11� acts on rotational degreesof freedom of the mesogens and promotes their orientationalordering. This, in turn, stimulates chain diffusion along thedirection of the field �see Table IX� until the mesogen andpolymer subsystems phase separate and lamellar mon-odomain phase is developed. The van der Waals attraction inboth polymer and mesogen layers is found to be much en-hanced �Fig. 13�. Then, by switching the field off, the lamel-lar monodomain either stays stable or splits into a polydo-main sample depending on the growth history. There is anevidence that two factors are important. Firstly, the rates forthe orientational order growth in mesogen and backbone sub-systems should match; this ensures that the reorientation ofthe mesogens takes place on the same time scale as the re-arrangements in the polymer. Secondly, switching the fieldoff should have a minimal impact on the mesogen order inthe layers. In more detail, in stronger fields, this order canstill be much aided by the field and not by the proper rear-rangement of the polymer. Hence, after removal of this aid,the layers can be destroyed by thermal fluctuations. Bothrequirements mentioned above are satisfied for the moderatefield strengths. This also supports previous findings.14
VII. CONCLUSIONS
In this study, we performed MD simulations of a modelSCLCP system in various phases. The model is based on aunited-atom force field description. Simulations were per-formed at atmospheric pressure and at various temperatures.Three phases were found relevant to the liquid crystallinity:isotropic, polysmectic, and smectic. The phases were wellequilibrated and productive runs of 8–12 ns at constant pres-sure and constant temperature have been performed. Depend-
ing on the growth conditions, the polysmectic and smecticphases exist at the same temperature; this helps to eliminatethe effect of the temperature.
The analysis of the structure and the dynamics of variousphases are performed on the coarse-grained level. The latterimplies replacing the backbones and the side chains withtheir equivalent ellipsoids and studying their arrangement,orientation, diffusion, and reorientational dynamics along-side with these for the mesogens. Based on this analysis, wefound two sets of features. The phase-dependent features areinherent to the smectic phase only and include
• backbone “sandwiching” in the planes perpendicular tothe mesogen director,
• increased rigidity of backbones and side chains,
• pronounced orientational order in the mesogenic, theside chain, and the backbone subsystems �the backbonedirector is perpendicular to the mesogen one�,
• strongly suppressed diffusion along the mesogen direc-tor while preserving the same rate of diffusion perpen-dicular to it �the one-dimensional “solidification”�, and
• pronounced increase of the averaged reorientation timesin all subsystems �one to one-and-half orders ofmagnitude�.
The temperature-dependent features depend only on the tem-perature and not on the phase of SCLCP, which include
• gradual increase of the local translational order for thebackbone centers of mass with the decrease of the tem-perature and
• gradual decrease of the total diffusion coefficient withthe temperature decrease �however, becoming highlyanisotropic in the smectic phase�.
Unexpectedly, we also found that the geometrical met-rics of backbones and side chains demonstrate only minorchanges in all the phases being studied. The shape dynamicsexponent for the backbones is found to be close to that of theRouse regime, while this exponent for the side chains is nearto the reptation regime value. We conclude that the primarydifference between the isotropic and the smectic phases �re-lated to this model� is the rearrangement and orientationalorder in all subsystems and not the specific conformationalchanges. The polysmectic phase demonstrates more similar-ity to the isotropic case, but its properties depend on theamount of smectic preorder, hence, on the history of thesample.
The field-induced growth of the smectic phase is charac-terized by the diffusion much enhanced in the direction par-allel to the aligning field. After the layers are formed, thediffusion in this direction is strongly suppressed. The lamel-lar structure is characterized by strong phase separation andenhanced van der Waals attraction in each layer. There is anevidence that the successful growth of the stable smecticphase �in the proximity of the smectic-isotropic phase tran-sition� is subject to several conditions. One condition is thesynchronicity in the reorientation of mesogens with the rear-
FIG. 13. Potential energy contributions �in 10−20 J� during the successfulgrowth of the phase Sgrw.
174905-11 Side chain liquid crystalline polymer J. Chem. Phys. 126, 174905 �2007�
Downloaded 07 May 2007 to 141.89.177.170. Redistribution subject to AIP license or copyright, see http://jcp.aip.org/jcp/copyright.jsp
rangement of side chains and backbones. Another conditionconcerns minimization of the effect of thermal fluctuationswhen switching the field off. Both conditions are met thebest for relatively weak aligning field. Otherwise, the lamel-lar structure is found to be unstable and splits into the poly-domains.
The study reveals some new properties of the SCLCPsystems in various liquid crystalline phases. The results ofthis study are highly relevant for developing fully coarse-grained models for these systems that can be simulated byeither MD or dissipative particle dynamics and for develop-ing effective coarse-grained Monte Carlo moves.
ACKNOWLEDGMENTS
The authors acknowledge financial support under DFGGrant No. NE410/8-1 and computer time offered by ICMP,Lviv, Ukraine. They would also like to thank Marina Saph-iannikova for useful comments and John and Susan Washin-sky for reading the manuscript.
1 H. Finkelmann, H. Ringsdorf, and J. H. Wendorff, Makromol. Chem.179, 273 �1978�.
2 C. B. McArdle, Side Chain Liquid Crystal Polymers �Springer, NewYork, 1990�.
3 P. J. Collings and M. Hird, Introduction to Liquid Crystals �Taylor &Francis, London, 2001�.
4 D. Gu, S. R. Smith, A. M. Jamieson, M. Lee, and V. Percec, J. Phys. II 3,937 �1993�; J. L. Gallani, L. Hilliou, P. Martinoty, and P. Keller, Phys.Rev. Lett. 72, 2109 �1994�.
5 F. Michelotti, E. Toussaere, R. Levenson, J. Liang, and J. Zyss, J. Appl.Phys. 80, 1773 �1996�.
6 A. García-Bernabé and R. Díaz-Calleja, Polym. Int. 50, 165 �2001�.7 G. H. Mehl, I. Nordmann, D. Lacey, J. W. Goodby, J. H. C. Hogg, and D.K. Das-Gupta, Polym. Eng. Sci. 36, 1032 �1996�.
8 M. S. Ho, A. Natansohn, and P. Rochon, Macromolecules 29, 44 �1996�;X. Meng, A. Natansohn, C. Barrett, and P. Rochon, ibid. 29, 946 �1996�;S. Hvilsted, F. Andruzzi, C. Kulinna, H. W. Siesler, and P. S. Ramanujam,ibid. 28, 2172 �1995�.
9 N. K. Viswanathan, D. Y. Kim, S. Bian, J. Williams, W. Liu, L. Li, L.Samuelson, J. Kumar, and S. K. Tripathy, J. Mater. Chem. 9, 1941�1999�.
10 J. F. D’Allest, P. Maïssa, A. ten Bosch, P. Sixou, A. Blumstein, R. Blum-stein, J. Teixeira, and L. M. Noirez, Phys. Rev. Lett. 61, 2562 �1988�; K.Devanand, A. M. Jamieson, C. Rosenblatt, D. Tomazos, and V. Percec,Proc. Am. Chem. Soc., Div. Poly. Mat.: Sci. Eng. 61, 11 �1989�; P.
Davidson and A. Levelut, Liq. Cryst. 11, 469 �1992�; R. J. Sarna, G. P.Simon, G. Day, H.-J. Kim, and W. R. Jackson, Macromolecules 27, 1603�1994�; L. Noirez and A. Lapp, Phys. Rev. E 53, 6115 �1996�; I. Hamley,J. Fairclough, S. King, J. Pedersen, R. Richardson, c. Imrie, and A. Craig,Liq. Cryst. 22, 679 �1997�; P. Holstein, J. Rauchfuß, M. Winkler, G.Klotzsche, and D. Geschke, Solid State Nucl. Magn. Reson. 10, 225�1998�..
11 H. Pleiner and H. R. Brand, Macromolecules 25, 895 �1992�; V.Fourmaux-Demange, A. Brûlet, J. P. Cotton, L. Hilliou, P. Martinoty, P.Keller, and F. Boué, ibid. 31, 7445 �1998�; D. Long and D. C. Morse, J.Rheol. 46, 49 �2002�.
12 M. P. Allen and D. J. Tildesley, Computer Simulation of Liquids �Clar-endon, Oxford, 1987�.
13 D. Frenkel and B. Smit, Understanding Molecular Simulation: From Al-gorithms to Applications �Academic, San Diego, 1996�.
14 L. M. Stimson and M. R. Wilson, J. Chem. Phys. 123, 034908 �2005�.15 J. Ilnytskyi, M. Saphiannikova, and D. Neher, Condens. Matter Phys. 9,
87 �2006�.16 J. G. Gay and B. J. Berne, J. Chem. Phys. 74, 3316 �1981�.17 M. R. Wilson, J. Chem. Phys. 107, 8654 �1997�.18 C. McBride and M. R. Wilson, Mol. Phys. 97, 511 �1999�; M. R. Wilson,
J. M. Ilnytskyi, and L. M. Stimson, J. Chem. Phys. 119, 3509 �2003�; M.R. Wilson, J. M. Ilnytskyi, L. M. Stimson, and Z. E. Hughes, in Com-puter Simulations of Liquid Crystals and Polymers, edited by P. Pasini, C.Zannoni, and S. Zumer, �Kluwer, Dordrecht, 2004�, p. 57.
19 J. Ilnytskyi and M. R. Wilson, Comput. Phys. Commun. 134, 23 �2001�.20 J. Ilnytskyi and M. R. Wilson, Comput. Phys. Commun. 148, 43 �2002�.21 T. J. H. Vlugt, R. Krishna, and B. Smit, J. Phys. Chem. B 103, 1102
�1999�.22 J. P. Ryckaert and A. Bellemans, Chem. Phys. Lett. 30, 123 �1990�.23 D. J. Cleaver, C. M. Care, M. P. Allen, and M. P. Neal, Phys. Rev. E 54,
559 �1996�.24 S. Nosé, J. Chem. Phys. 81, 511 �1984�; W. G. Hoover, Phys. Rev. A 31,
1695 �1985�.25 P. G. de Gennes and J. Prost, The Physics of Liquid Crystals, 2nd ed.
�Oxford University Press, Oxford, 1995�.26 M. I. Boamfa, K. Viertler, A. Wewerka, F. Stelzer, P. C. M. Christensen,
and J. C. Mann, Phys. Rev. E 67, 050701�R� �2003�.27 G. Zimpferer, Macromol. Theory Simul. 8, 433 �1999�.28 A. Dimitrova, Ph.D. thesis, University of Halle, Germany, 2000.29 U. Fabbri and C. Zannoni, Mol. Phys. 58, 763 �1986�.30 M. Doi and S. F. Edwards, The Theory of Polymer Dynamics �Clarendon,
Oxford, 1986�.31 V. Reys, Y. Dormoy, J. L. Gallani, P. Martinoty, P. Le Barny, and J. C.
Dubois, Phys. Rev. Lett. 61, 2340 �1988�.32 J. L. Gallani, L. Hilliou, P. Martinoty, and P. Keller, Phys. Rev. Lett. 72,
2109 �1994�.33 K. Kremer and G. S. Grest, J. Chem. Phys. 92, 5057 �1990�.34 K. S. Schweizer, J. Chem. Phys. 91, 5802 �1989�; 91, 5822 �1989�.
174905-12 J. M. Ilnytskyi and D. Neher J. Chem. Phys. 126, 174905 �2007�
Downloaded 07 May 2007 to 141.89.177.170. Redistribution subject to AIP license or copyright, see http://jcp.aip.org/jcp/copyright.jsp