coarse atmospheric aerosol: size distributions of trace elements
TRANSCRIPT

Atmospheric Environment 35 (2001) 5321–5330
Coarse atmospheric aerosol: size distributions of trace elements
K. Eleftheriadisa, I. Colbeckb,*aNCSR ‘‘Demokritos’’, 15310 Ag Paraskevi, Attiki, Greece
bDepartment of Biological Sciences, University of Essex, Colchester, Essex CO4 3SQ, UK
Received 26 September 2000; received in revised form 20 May 2001; accepted 29 May 2001
Abstract
A sampler, employing nine single stage impactors placed in parallel within a portable wind tunnel, has been used todetermine the metal content of coarse atmospheric aerosol. The wind tunnel maintains a constant flow environment for
the collectors housed inside it, so that representative sampling conditions are achieved compared to the varied ambientwind conditions. At a flow rate of 8m s�1 the 50% cut-off diameters of the impactors ranged from 7.8 to 38.8 mm.Measurements were conducted at a rural and urban site near Colchester in south east England. The samplers were
analysed by PIXE for P, K, Ca, Fe, Ti, Mn, Cu, V, Co, Cr, Br, Zn, Ni, Sc and Pb. It is found that the sampler can beemployed to quantitatively characterise the elemental mass size distribution for aerosol larger than 10mm. The resultsindicate that a small fraction of the above earth and trace elements’ metal mass is present in particles greater than
10mm. This fraction for earth metals (Ca, K, Ti) is comparatively greater in the rural site than the urban site, while fortrace metals (Mn, V, Cu, Cr) this fraction constitutes a more significant part of the coarse mass at the urban site. Traceelement concentrations were of a similar order of magnitude to earlier literature reports. Although the number ofmeasurements was limited it can be concluded that the size distributions obtained were characteristic of an unpolluted
area. r 2001 Elsevier Science Ltd. All rights reserved.
Keywords: Coarse aerosol; Trace elements; Tunnel sampler; Single stage impactor; Size distribution
1. Introduction
A balance between sources, chemical transformationsin the atmosphere, long-range transport effects and
removal processes influences the composition of atmo-spheric particles. Elements associated with naturalsources are typically found within the coarse mode
(aerodynamic diameter >2.5 mm), whilst elementsemitted from anthropogenic sources are associated withthe fine mode (aerodynamic diameter o2.5mm). Metalsare present from both natural and anthropogenicsources. By measuring metal concentrations as afunction of particle size, information may be obtained
concerning their source. There has been a number oftrace metal sampling programmes in the UK rangingfrom small scale research projects to national samplingcampaigns (QUARG, 1996). The latter have the
advantage of covering a number of sites with astandardised analytical method and strict quality con-trol procedures. Salmon et al. (1978) analysed data on
trace element concentrations in atmospheric aerosol,collected between 1957 and 1974, at a rural site in centralsouthern England. Measurements of atmospheric con-
centrations of trace metals have been made in severalurban areas of the UK since 1974 (Lee et al., 1994;Cawse et al., 1994) whilst a multi-element survey has
been in operation since 1976. Urban concentrations weretypically between 3 and 10 times higher than those atrural sites. The elements, which showed significantseasonal variability, were generally from anthropogenic
and marine sources i.e. Br, Pb, Zn, V, Cl and Na. None
*Corresponding author. Tel: +44-1206-872203; Fax: +44-
1206-872592.
E-mail addresses: [email protected] (K. Elefther-
iadis), [email protected] (I. Colbeck).
1352-2310/01/$ - see front matter r 2001 Elsevier Science Ltd. All rights reserved.
PII: S 1 3 5 2 - 2 3 1 0 ( 0 1 ) 0 0 3 0 4 - 1

of these measurements provided information on the sizedistribution. It was assumed that since they were made
in urban areas most of the trace metals would be presentin the fine mode. Additionally the sampling design wassuch that under typical varying wind conditions, only
particles of less than a few mirometres diameter werelikely to be collected with high efficiency (Lee et al.,1994).Previous studies of the size distribution of individual
elements in the atmospheric aerosol have typically beenlimited to particle sizes up to 20 mm (Davidson andOsborne, 1987). These studies show a sharp decline in
the metal mass concentration for sizes larger than 10mm.There are limited data about the chemical speciation oflarge particles (Noll et al., 1990). This is not only due to
the relative unimportance of these particles to longrange aerosol transport studies and human lung deposi-tion, but also to the great difficulties involved in their
representative sampling from the atmosphere. Theircontribution to atmospheric deposition and the overallchemical balance in the ambient aerosol should beinvestigated. For instance atmospheric deposition is an
important pathway for the transfer of pollutants fromthe atmosphere to land and water. Deposition of toxicmaterials such as heavy metals, PCBs and PAHs can
result in significant ecological damage (Shaw, 1987).Several workers have shown that large particles areresponsible for a large proportion of the deposition flux
(Shahin et al., 2000; Paode et al., 1998, 1999; Tai et al.,1999; Zufall et al., 1998). Tai et al. (1999) found thatparticles larger than 10mm contributed up to 90% ofthe aerosol dry deposited mass even at non-urban
locations. The purpose of this study is to demonstratethe ability of novel instrumentation to yield size resolvedelemental concentrations in coarse and larger ambient
aerosol.
2. Instrumentation
Recently we have described a wind tunnel sampler,employing single stage impactors, for the collection andsize fractionation of ambient aerosols (Eleftheriadis and
Colbeck, 2000). The tunnel sampler satisfies the criteriafor representative sampling (aspiration efficiency10075%, Vincent, 1989) for particles up to 60mm inaerodynamic diameter and for ambient wind speeds in
the range 0.5–10m s�1. Nine impactor strips each with adifferent cut-off diameter and made of heavy dutystainless steel foil tensioned between two support rods
were installed in parallel within the tunnel (Fig. 1). A fanat the tunnel outlet provided a constant air flow withinthe tunnel, with the flow velocity set at 8m s�1, while iso-
axial sampling was achieved by a wind vane mounted onthe tunnel. A thermistor anemometer is placed in frontof the strips to monitor the flow velocity within the
sampler. Depending on ambient wind speed the voltagesupplied to the fan is regulated, so that the flow velocityis maintained close to 8m s�1. The size fractionationcharacteristics of the impaction strips (widths equal to 1,
1.5, 2, 3, 5, 7, 9, 12 and 25mm) were determinedexperimentally (Eleftheriadis and Colbeck, 1992). At aflow rate of 8m s�1 the 50% cut-off diameter of the
strips ranged from 7.8 to 38.8 mm.Although well defined and reliable in terms of
aerodynamic diameter the efficiency curves did not
match the sharp cut-off behaviour of conventionalcascade impactors. However samples collected onimpaction strips offer the advantages of easy handling,excellent means of particle examination by optical or
electron microscopy and quantitative chemical specia-tion. The main disadvantage arises from overloadingwhich limits the sampling time and consequently the
aerosol mass collected. The true size distribution can be
Fig. 1. Schematic diagram of the tunnel sampler.
K. Eleftheriadis, I. Colbeck / Atmospheric Environment 35 (2001) 5321–53305322

extracted from a set of strip samples when an inversionmethod is applied on the results where the strip
collection efficiency curves are used as Kernel functions(Ramachandran and Kandlikar, 1996; Kandlikar andRamachandran, 1999).
3. Field experiments and analysis
The ambient aerosol measurements obtained by theWind Tunnel Sampler were conducted around the town
of Colchester (population 157,000) in the South East ofEngland. The area is characterised by flat land with nomajor industrial activity involving stack emissions,
except agriculture. Colchester is a relatively small townand with the exception of motor vehicle traffic it is notexpected to contribute high aerosol emissions to the
surrounding area (Colchester Borough Council, 2000).Other aerosol inputs to this area may result from theLondon Metropolitan area and the North Sea, whenthe prevailing winds favour transport from these two
areas.In view of the above topography and environment,
two sites thought to reflect some specific conditions were
selected for sampling. A map of the region including thetwo sites is shown in Fig. 2. The first sampling location
was considered as one directly affected by a local aerosolsource. This was a Civic Amenity site (refuse landfill)
situated at the edge of Colchester. The sampler wasoperating at a distance of around 500m away from anopen tipping area but only during the early evening
hours when the site was not active. The above conditionswere thought to provide moderate aerosol generation bynatural processes such as resuspension by the ambientwind. A small tarmac works area, 1 km to the south,
may also contribute some aerosol.The second sampling site was located in a rural area
12 km due west of the first site. It was surrounded by
open cultivated land with no major agriculture activitiestaking place during the sampling period.Four measurements were obtained on each site.
Sampling took place at almost weekly intervals duringa two month summer period. The sampling time wasaround 4 h. The sampler was placed on a platform so
that the tunnel mouth was 2m above ground. Atmo-spheric conditions were characterised by dry warmweather with very light winds at the refuse site, whilemoderate winds were predominant at the rural site. One
measurement taken at the latter location involved verystrong winds (around 10m s�1).The measurements described above were performed in
a manner suitable for PIXE analysis. Polycarbonate
Fig. 2. Location of the sampling sites (1) rural site, (2) civic amenity site.
K. Eleftheriadis, I. Colbeck / Atmospheric Environment 35 (2001) 5321–5330 5323

filter membranes were cut to the size of the strips andattached on them after they had been immersed in a
solution of L-Apiezon grease. The latter was used inorder to reduce particle bounce from the strips. Both thefilter and grease materials are relatively X-ray emission
free. After sampling the filters together with controlblanks were kept in airtight containers and lateranalysed in the PIXE facilities of the University ofBirmingham. Due to limited analysis time only six strips
per measurement were analysed. These were the 2, 3, 5,7, 12 and 25mm samples, thought to be adequate toproduce the elemental size distributions. Analysis was
performed for a wide range of elements such as P, Si, Cl,S, K, Ca, Fe, Ti, Mn, Cu, V, Co, Cr, Br, Zn, Ni, Sc andPb.
The results showed consistent concentrations for mostearth elements and some trace elements. The massesdetected for Br, Zn, Ni, Sc and Pb were frequently lower
than the analytical detection limits or the values fromthe respective blank samples. Moreover, these elementsdid not appear consistently in all measurements andtherefore they were excluded from any further study.
Silicon was also excluded due to the erratic natureof the respective measurements probably due to thearbitrary collection of giant sand particles on the
samples.
4. Size distributions of elemental concentrations
The aerosol mass concentrations were calculated for
the remaining earth elements and trace metals. Thearithmetic mean of the concentration for every elementat each site was determined. One measurement from therural site involving very high ambient wind conditions
was excluded from the average as it was found to haveelemental concentrations not compatible with thepredominant aerosol mass found in the other three
measurements.The extreme value estimation (EVE) deconvolution
method (Hopke and Paatero, 1994; Aalto et al., 1990;
Tapper and Paatero, 1990; Paatero et al., 1988) wasapplied on the two sites elemental concentrationaverages in order to produce the individual size
distributions for each element. The EVE calculationsare described in detail by Eleftheriadis (1993) and Aaltoet al. (1990). The error estimates required in thecalculations were derived from flow rate fluctuations
recorded during sampling and ranged between 15% and20%. The EVE method was applied over a size rangebetween 1 and 100 mm. The standard deviation of themodel guassians selected were between 1.4 and 2. Thestrips used for sampling here have their size collectioncharacteristics separated by very narrow size intervals.
Small standard deviations around 1.4 enhance the finemass differences between the strip stages and give
solutions, which often reveal important features of theindividual distributions. However, these narrow model
gaussians may also produce unnaturally shaped dis-tributions with sharp peaks. On the other hand when alarge standard deviation was employed, any fine
structure was removed from the resulting distributions.The final solution selected for each elemental distribu-tion was a compromise between the above extremesituations with the chi-square value also used as a
criterion. Each solution of the inverted size distributionsby EVE is given as a family of solutions with a minimumand maximum concentration with respect to any size.
The solutions presented here correspond to the arith-metic mean of the family solutions. The size distributionof the atmospheric concentration for each element
measured at the two sites are displayed in Fig. 3. Thepart of the distribution lying to the left of the main peaktowards the small sizes is characteristic of an ideal
situation where the concentration approaches zero ataround 1mm. This is due to the characteristic collectionefficiency function of the strips rather than the true sizedistribution of the elemental mass. The results have been
normalised with respect to the total concentrationcalculated from the EVE results. Due to the uncertaintyinvolved with the EVE calculations between 1–2 mm,where the collection efficiency function approaches zero,results are presented for the range between 2–100 mm.The lower size also coincides with the generally accepted
dividing line between coarse and fine size fractions of theatmospheric aerosol (Whitby, 1978). However, this is acharacteristic of the total aerosol mass and does notalways describe individual elements discussed here. It is
well known (Milford and Davidson, 1985) that mostelemental distributions shown here, like those of sometrace elements, have a large part of their mass
distributed over the accumulation size mode (0.1–1 mm).The size distributions presented here for the two sites
show that most crustal elements (Fe, Ca, K and Ti)
display a peak in their mass concentration between 3and 7 mm. Despite the quantitative difference in the totalmass concentration of the above elements at the two
sites the shape of their respective size distributions isgenerally similar. The only exception is potassium,which displays a clear second mode at around 10 mmat the rural location. P was detected only at the civic
amenity site and shows a maximum at around 6 mm.These results rather contradict the general idea thatcoarse aerosol is accumulated in a mode with a peak at
around 10mm (Whitby, 1978). Instead, the generalpicture emerging shows that the above elements,although characteristic of the soil dusts which are the
dominant source of coarse aerosol, are not necessarilythe greatest portion of its mass at sizes greater than10 mm. A better picture could be formed if the
concentrations of Al and Si together with that ofbiogenic aerosol were also determined.
K. Eleftheriadis, I. Colbeck / Atmospheric Environment 35 (2001) 5321–53305324
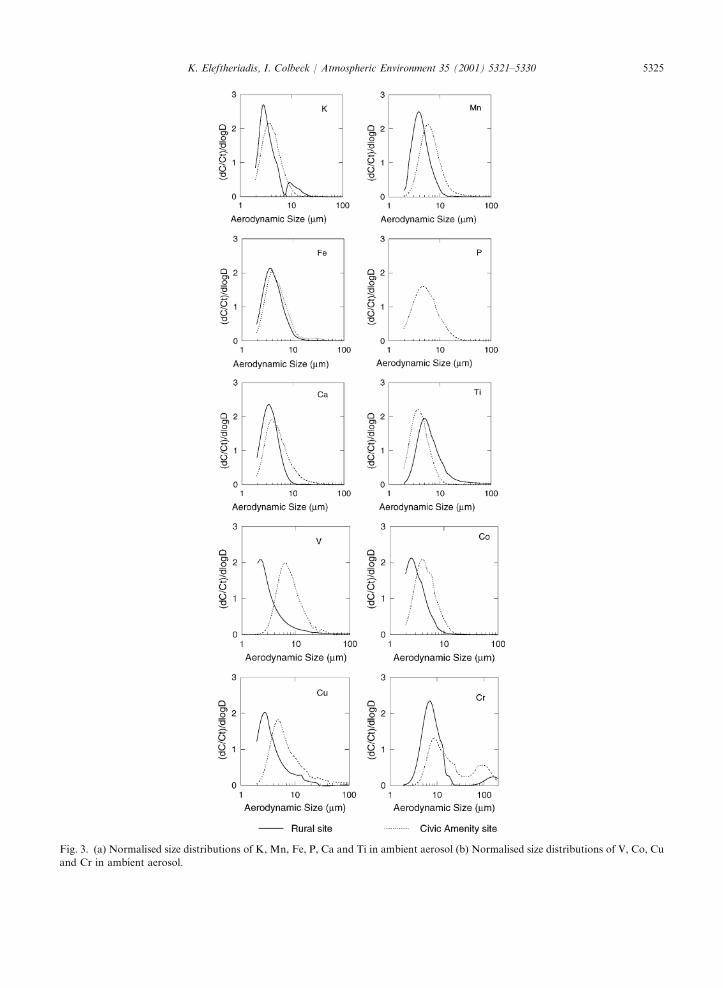
Fig. 3. (a) Normalised size distributions of K, Mn, Fe, P, Ca and Ti in ambient aerosol (b) Normalised size distributions of V, Co, Cu
and Cr in ambient aerosol.
K. Eleftheriadis, I. Colbeck / Atmospheric Environment 35 (2001) 5321–5330 5325

A greater variation on the characteristics of their sizedistribution can be observed for the trace metals studied
here. A clear distinction between the two sites is evident.All these elements (Co, V, Mn and Cu), excluding Cr,appear to have their ambient concentrations maximising
between 2 and 3mm at the rural site and between 4 and6mm at the refuse site. Chromium displays a surprisingbimodal distribution with a first peak similar to those ofthe other metals and a second peak at around 80mm.The phenomenon is consistent for both sites, althoughthe magnitude of the second peak is greater at the civicamenity site.
The total concentration above 2 mm calculated byEVE for each element is displayed in Table 1. Themaximum degree of uncertainty on these values is
similar to the respective error estimates used inthe EVE calculations and equal to around 20%. Themeasure of the uncertainty is assumed to be the
maximum residual value resulting from the deviationbetween the strip measurements and the best fitcalculated by EVE. The concentration of the largeparticles (>10 mm) is also reported in Table 1 for bothsites. An interesting picture emerges by comparing theaverage concentrations of the two size fractions at thetwo sampling sites. First, the earth elements (Ca, Fe, Ti
and K) are present at the refuse site with concen-trations a great deal higher than those at the rural site.However, the large particle fraction (>10mm) of theseelements does not share the same features. Only irondisplays a lower concentration at the rural site while theremaining elements have similar or higher mass con-centrations compared to those at the civic amenity site.
The total coarse fraction concentrations of the tracemetals are higher at the rural site with the exceptionof Co.
Several questions can be raised about the nature of theelemental distributions at the two sites. The atmosphericconditions during sampling and the area surrounding
the sites play an important role. Dry warm weatherduring the measurements at the civic amenity site
indicate heavy aerosol load in the area. The low windspeeds (o2m s�1) recorded coupled with the time of theday (early evening) that sampling was performed,
indicate that the aerosol produced mechanically duringthe day at the site or the nearby town had its small sizefraction still suspended over the area, while the largerparticles had settled. This may be the reason for the
absence of large particles among the earth elementsand the fact that the concentrations of trace metals islower than those found at the rural site. Refuse is not
known to be a substantial source of such metals(Pacyna, 1985). The type of soil in the area andvegetation cover are also critical of the resulting size
distributions. Higher wind speeds (4–7m s�1) prevailedduring sampling at the rural site, favouring increasedresuspension of soil dust. This may explain the higher
ratio of larger (>10 mm) to total coarse (>2mm)concentration observed for the soil dust derived earthmetals (Ca, K, Ti) at the rural site, compared to that atthe civic amenity site.
Some explanation for the decline of metal concentra-tions in the large atmospheric aerosol can be found instudies dealing with erodible soils, the major source of
coarse aerosol. It is understood that metals exist in rocksand soils in a form of various species like SiO2, TiO2,Al2O3, Fe2O3, FeO, CaO, K2O, P2O5 and MnO.
(Mason, 1966; Stelson and Seinfeld, 1981). Schutz andRahn (1982) studied the variation of elemental concen-tration with particle size in dust and soils at remoteareas. It was found that the relative concentration of
most earth metals in the 2–400mm particle size range,normalised with respect to the concentration of largersoil grains (160–400mm), show a sharp decrease of oneto two orders of magnitude for particle sizes greater than20 mm, while Si was the only element that displayedincreasing concentrations with increasing particle size.
This phenomenon has been attributed to the lack ofmineral species like clay minerals in very large particles.Although soil composition in the above studies is not of
the same composition as the one found in SoutheastEngland, the size distributions for the earth metalspresented here display a similar trend.Vegetative cover in the area where the measurements
were conducted may also play an important role inresuspension of dust from the ground. The two sitesdiscussed here, were located at areas with different
vegetation characteristics with the rural site richer invegetation. Wu et al. (1992) found that leaves reduceresuspension rates of particles from their surface. Field
studies though, (Sehmel, 1980) did not reveal a cleardecrease between for example grass and asphaltsurfaces. It is clear though that the Civic Amenity
site was adjacent to larger areas covered with loosesoil.
Table 1
Mean ambient concentrations (ng/m3)
Element Civic amenity site Rural site
>2mm >10mm >2mm >10mm
Fe 2530 123 833 26
Ca 3900 432 2022 414
K 1550 40 1083 98
P 108 15 F FTi 317 5 76 14
Mn 38 6 45 1
V 3 1 9 2
Cu 10 3 18 2
Cr 5 3 5 1
Co 10 1 6 *
K. Eleftheriadis, I. Colbeck / Atmospheric Environment 35 (2001) 5321–53305326
5. Comparison with other studies
Measurements of the chemical speciation of very largeatmospheric aerosol are sparse. The only studiesindicating the presence of most of the above elements
in large aerosol are those by Noll et al. (1985, 1990).However, these measurements are based on the 50% cutoff sizes of impaction strips similar to the ones used inthis study. This method for calculating the size distribu-
tion has been found to be misleading. Most informationabout the size distribution of metal species in theatmospheric aerosol is available from studies employing
cascade impactors for sampling. Most investigationshave been on urban areas (Horvath et al., 1996; Infanteand Acosta, 1991; Anderson et al., 1988; Orsini et al.,
1986; Spengler and Thurston, 1983; Zoller et al., 1974),whilst those in rural areas are lacking (Horvath et al.,1996; Injuk et al., 1992; Adams et al., 1983; El-
Shobokshy, 1984). Other studies focusing on theimportance of large particles were conducted during
the Lake Michigan Mass Balance Study (Shahin et al.,2000), where the deposition flux of earth and trace
metals was investigated. Short term measurements wereconducted with the Noll Rotary Impactor (Paode et al.,1999). It was found that very large particles, despite their
small mass concentration contribute greatly to deposi-tion fluxes due to their high deposition velocity. The aimhere is to identify any universal characteristics of theelemental distributions in the measurements conducted
during this study. The size distributions from measure-ments at the rural site were considered more suitable forthis exercise. This was due to the clear influence of
specific conditions on the results at the civic amenity site.It is clear that comparisons with data from studiesconducted in Britain would be more suitable for credible
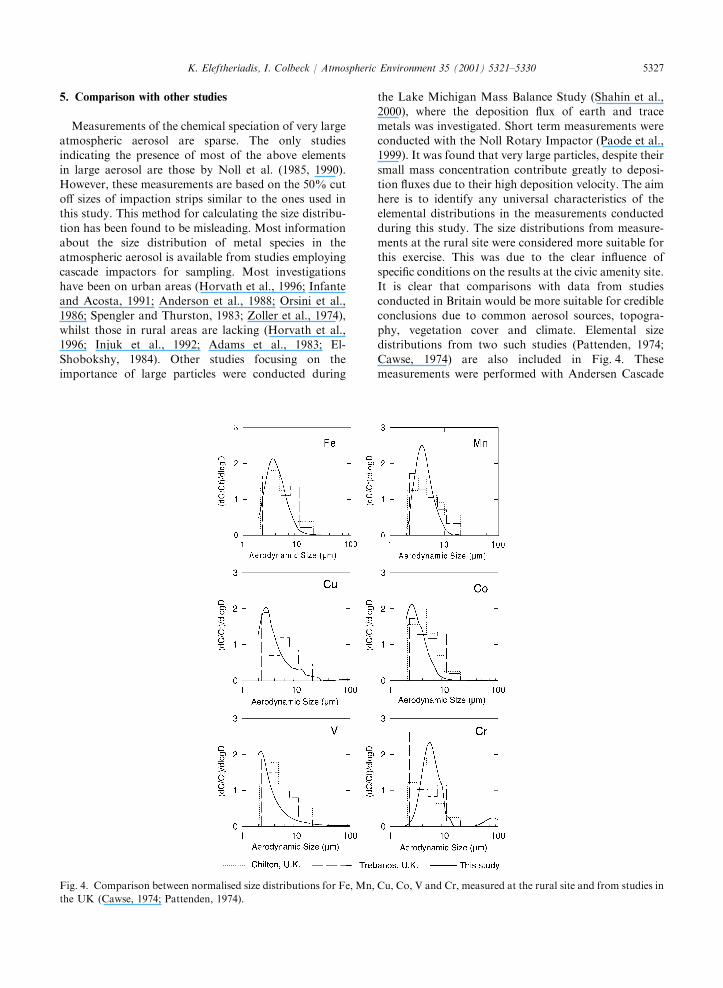
conclusions due to common aerosol sources, topogra-phy, vegetation cover and climate. Elemental sizedistributions from two such studies (Pattenden, 1974;
Cawse, 1974) are also included in Fig. 4. Thesemeasurements were performed with Andersen Cascade
Fig. 4. Comparison between normalised size distributions for Fe, Mn, Cu, Co, V and Cr, measured at the rural site and from studies in
the UK (Cawse, 1974; Pattenden, 1974).
K. Eleftheriadis, I. Colbeck / Atmospheric Environment 35 (2001) 5321–5330 5327
impactors at Chilton (England) and Trebanos (Wales).Chilton is a rural site, in central southern England,
whilst Trebanos is just on the outer limit of an industrialzone, which includes oil refining, steelworks and a nickelsmelter.
The elemental size distributions for Fe, Mn and Crmeasured here, show very good agreement with therespective results from Chilton and partial agreementwith those at Trebanos. There is also partial agreement
for Co with both reference distributions. The distribu-tion determined here for V seems to follow the trendobserved at Trebanos. Data for Cu were available only
at Trebanos. There is also general similarities in trendhere. The agreement with the rural site at Chiltonconfirms expected similarities in elemental size distribu-
tions between areas with common characteristics. Thesize distributions at Trebanos are often bimodal. Takinginto account. the industrial sources present in the
vicinity of this site the large particle mode absent fromthe other two sites can be attributed to such sources. Ithas to be noted that the characteristics of the metal sizedistributions determined here are also consistent with
findings in other regional studies around the world(Keronen et al., 1991; Kasahara et al., 1992).Finally, direct quantitative comparisons between the
mass concentration of metals measured here and inother studies in the U.K is difficult due to the lack ofmeasurements for the coarse fraction alone as it was
determined in the present study. However, an attemptwas made here to extract information from the datagiven in Table 2. The results from two long term studiesof the total mass concentration of certain metals are
displayed. The values are averages over five and tenyears sampling periods from measurements at rural andurban sites throughout Britain. At first the concentra-
tions determined here for many of these metals seemexcessively high compared to the rural and even urbanvalues in the other studies. It is evident that the greatest
difference exists for the earth elements (Fe and Ti) whichhave most of their mass distributed across the coarseparticle size range and the comparison between the
results is more meaningful. The concentrations of thetrace elements with more than 50% of their mass present
at small sizes (Cawse, 1974) are more difficult to compare.It has to be noted that credible conclusions from these
comparisons are hampered by several conflicting factors.
First these averages incorporate various atmosphericconditions with widely different aerosol masses, whilethe measurements in these study were performed duringa specific situation of heavy atmospheric aerosol load.
The measurements used for reference span over manyyears during which a decline in metal concentrations wasobserved across Britain (Lee et al., 1994). The sampling
methods used include filter holders sampling at 901 withrespect to the wind (Pattenden, 1974). The collectionefficiency of such devices for large particles is far from
ideal (Vrins et al., 1984) and leads to underestimation ofthe aerosol mass in the coarse size-range.It can be concluded from Table 2 that the concen-
trations are of the same magnitude. The distribu-tions found for the trace elements V, Co and Cu at therural site display maximum concentrations at around2 mm. Taking into account the limitations of this studyat the above size range it can be concluded that themajority of the mass is found in much smaller sizes. Thisis expected for these elements which are usually released
in the atmosphere by anthropogenic industrial sources(Pacyna, 1985). Their concentration, though, does notdrop as sharply with size as it is thought. The above
characteristic is not visible in the distributions of thesame elements measured at the industrial site, probablydisguised by aerosol released in the air by the materialsoriginating from the site.
6. Conclusions
The tunnel sampler employing single stage impactorsis found to be a useful instrument for representative
sampling of coarse aerosol. Elemental analysis of sizefractionated samples can be performed and the sizedistribution in the range of 2–100mm can be calculatedfor each element. The high volume intake of the samplerallows the collection of adequate mass for analysis oversampling periods of a few hours (3–5) in suburban areas
of the U.K. Results from measurements in two U.K.sites for a number of common earth and trace metalsshow that their concentration in the coarse aerosolfraction peaks at around 3–7 mm. The mass concentra-tion of the fraction >10mm is found to be between10–15% of the total coarse mass for most elements.
Acknowledgements
We would like to thank Dr Lakhumal Luhana forperforming the PIXE analysis.
Table 2
Ambient concentrations (ngm�3) from studies in the UK
Element Urban (total)a
1985–89
Rural (total)a
1972–81
Rural (>2mm)this study
Fe 1000 390 833
Ti 4.8b 28 76
Mn 34 34 45
V 25 11 9
Cu 30 24 18
Cr 11 7 5
Co 1.5b 0.4 6
aData quoted in QUARG (1993).bConcentrations at or below detection limits.
K. Eleftheriadis, I. Colbeck / Atmospheric Environment 35 (2001) 5321–53305328
References
Aalto, P., Tapper, U., Paatero, P., Raunemaa, T., 1990.
Deconvolution of particle-size distributions by means of
extreme value estimation method. Journal of Aerosol
Science 21, S159–S162.
Adams, F., van Espen, P., Maenhaut, W., 1983. Aerosol
composition at Chacaltaya, Bolivia, as determined by size-
fractionated sampling. Atmospheric Environment 17, 1521–
1536.
Anderson, J.R., Agget, F.J., Buseck, P.R., Germani, M.S.,
Shattuck, T., 1988. Chemistry of individual aerosol particles
from Chandler, Arizona, an arid urban environment.
Environmental Science and Technology 22, 811–818.
Cawse, P.A., 1974. A survey of atmospheric trace elements in
the UK. AERE Report 7669, Harwell, UK.
Cawse, P.A., Baker, S.J., Law, D.V., 1994. A survey of
atmospheric trace elements in Great Britain, 1972–1991.
Report No: AEA/CS/18358008/REMA-039, AEA Technol-
ogy, National Environmental Technology Centre, Culham
Laboratory, Oxfordshire.
Colchester Borough Council, 2000. Report on the review and
assessment of air quality in the Borough of Colchester.
Environmental Services.
Davidson, C.I., Osborne, J.F., 1987. The sizes of airborne trace
metal containing particles. In: Nriagu, J.O., Davidson, C.I.
(Eds.), Toxic Metals in the Atmosphere. Wiley, New York.
Eleftheriadis, K., 1993. Ph.D. Thesis, Essex University.
Eleftheriadis, K., Colbeck, I., 1992. The impaction collection
efficiency of rectangular strips. Journal of Aerosol Science
23, S35–S38.
Eleftheriadis, K., Colbeck, I., 2000. The fractionation of
atmospheric coarse aerosol by a tunnel sampler employing
single stage impactors. Journal of Aerosol Science 31,
321–334.
El-Shobokshy, M.S., 1984. A preliminary analysis of the
inhalable particulate lead in the ambient atmosphere of
the city of Riyadh, Saudi Arabia. Atmospheric Environ-
ment 18, 2125–2130.
Hopke, P.K., Paatero, P., 1994. Extreme-value estimation
applied to aerosol-size distributions and related environ-
mental-problems. Journal of Research and National In-
stitite of Standard Technology 99, 361–367.
Horvath, H., Kasahara, M., Pesava, P., 1996. The size
distribution and composition of the atmospheric aerosol
at a rural and nearby urban location. Journal of Aerosol
Science 27, 417–435.
Infante, R., Acosta, I.L., 1991. Size distribution of trace metals
in Ponce, Puerto Rico air particulate matter. Atmospheric
Environment 25B, 121–131.
Injuk, J., Otten, Ph., Laane, R., Maenhaut, W., van Grieken,
R., 1992. Atmospheric concentrations and size distributions
of aircraft-sampled Cd, Cu, Pb and Zn over the southern
bight of the North Sea. Atmospheric Environment 26A,
2499–2508.
Kandlikar, M., Ramachandran, G., 1999. Inverse methods for
analysing aerosol spectrometer measurements: a critical
review. Journal of Aerosol Science 30, 413–437.
Kasahara, M., Takahashi, K., Reischl, G.P., Preining, O., 1992.
Elemental compositions of atmospheric aerosols classified
into 10 size fractions. Journal of Aerosol Science 23, S695–
S698.
Keronen, P., Hillamo, P.E., Pakkanen, T., 1991. Inorganic ions
in the atmospheric aerosol: size distributions and dry
deposition velocities. Journal of Aerosol Science 22,
S657–S660.
Lee, D.S., Garland, J.A., Fox, A.A., 1994. Atmospheric
concentrations of trace elements in urban areas of the
United Kingdom. Atmospheric Environment 28, 2691–
2713.
Mason, B., 1966. Principles of Geochemistry. Wiley, Chiche-
ster, UK.
Milford, J.B., Davidson, C.I., 1985. The sizes of particulate
trace elements in the atmosphereFa review. Journal of the
Air Pollution and Control Association 35, 1249–1260.
Noll, K.E., Pontius, A., Frey, R., Gould, M., 1985. Compar-
ison of atmospheric coarse particles at an urban and non-
urban site. Atmospheric Environment 19, 1931–1943.
Noll, K.E., Yuen, P.F., Fang, K.Y.P., 1990. Atmospheric
coarse particulate concentrations and dry deposition fluxes
for ten metals in two urban environments. Atmospheric
Environment 24A, 903–908.
Orsini, C.Q., Tabacniks, M.H., Artaxo, O., Andrade, M.F.,
Kerr, A.S., 1986. Characteristics of fine and coarse particles
of natural and urban aerosols of Brazil. Atmospheric
Environment 20, 2259–2270.
Paatero, P., Raunemaa, T., Dod, R.L., 1988. Composition
characteristics of carbonaceous particle samples, analyzed
by EVE deconvolution method. Journal of Aerosol Science
19, 1223–1226.
Pacyna, J.M., 1985. Atmospheric trace elements from natural
and anthropogenic sources. In: Nriago, J.O., Davidson, C.I.
(Eds.), Toxic Metals in the Atmosphere. Wiley, New York.
Paode, R.D., Sofuoglu, S.C., Sivadechathep, J., Noll, K.E.,
Holsen, T.M., Keeler, G.J., 1998. Dry deposition fluxes and
mass size distributions of Pb, Cu, and Zn measured in
Southern Lake Michigan during AEOLOS. Environmental
Science and Technology 32, 1629–1635.
Paode, R.D., Shahin, U.M, Sivadechathep, J., Holsen, T.M.,
Franek, W.J., 1999. Source apportionment of dry deposited
and airborne coarse particles collected in the Chicago area.
Aerosol Science and Technology 31, 473–486.
Pattenden, N.J., 1974. Atmospheric concentrations and deposi-
tion rates of some trace elements measured in the Swansea/
Neath/Port Talbot area. AERE Report 7729, Harwell, UK.
QUARG, 1993. Urban air Quality in the United Kingdom.
First Report of the Quality of Urban Air Review Group,
The Department of the Environment.
QUARG, 1996. Airborne particulate matter in the United
Kingdom. Third Report of the Quality of Urban Air
Review Group, The Department of the Environment.
Ramachandran, G., Kandlikar, M., 1996. Bayesian analysis for
inversion of aerosol size distribution data. Journal of
Aerosol Science 27, 1099–1112.
Salmon, L., Atkins, D.H.F., Fisher, E.M.R., Healy, C., Law,
D.V., 1978. Retrospective trend analysis of the content of
U.K. particulate material 1957–1974. Science of the Total
Environment 9, 161–200.
Schutz, L., Rahn, K.A., 1982. Trace element concentrations in
erodible soils. Atmospheric Environment 16, 171–176.
K. Eleftheriadis, I. Colbeck / Atmospheric Environment 35 (2001) 5321–5330 5329
Sehmel, G.A., 1980. Particle and dry gas deposition. A review.
Atmospheric Environment 14, 983–1011.
Shahin, U., Yi, S.M., Paode, R.D., Holsen, T.M., 2000. Long-
term elemental dry deposition fluxes measured around Lake
Michigan with an automated dry deposition sampler.
Environmental Science and Technology 34, 1887–1892.
Shaw, R.W., 1987. Air pollution by particles. Scientific
American 257, 96–103.
Spengler, J.D., Thurston, G.D., 1983. Mass and elemental
composition of fine and coarse particles in 6 United-States
cities. Jounal of the Air Pollution Control Association 33,
1162–1171.
Stelson, A.W., Seinfeld, J.H., 1981. Chemical mass accounting
of urban aerosol. Environmental Science and Technology
15, 671–679.
Tai, H.S., Lin, J.J., Noll, K.E., 1999. Characterization of
atmospheric dry deposited particles at urban and non-urban
locations. Journal of Aerosol Science 30, 1057–1068.
Tapper, U., Paatero, P., 1990. Application of the EVE
deconvolution method to the analysis of PIXE spectra.
Nuclear Instruments and Methods in Physics Research
Section BFBeam Interactive Materials 49, 132–137.
Vincent, J.H., 1989. Aerosol Sampling; Science and Practice.
Wiley, Chichester, UK.
Vrins, E., Hofschreuder, P., ter Kuile, W.M., van Nieuwland,
R., Oeseburg, F., 1984. Sampling efficiency of aerosol
samplers for large windborne particles. In: Liu, B.Y.H., Pui,
D.Y.H., Fissan, H.J. (Eds.), Aerosols: Science, Technology
and Industrial Applications of Airborne Particles. Elsevier,
New York.
Whitby, K.T., 1978. The physical characteristics of sulfur
aerosol. Atmospheric Environment 12, 135–159.
Wu, Y.L., Davidson, C.I., Russell, A.G., 1992. Controlled
wind-tunnel experiments for particle bounceoff and
resuspension. Aerosol Science and Technology 17,
245–262.
Zoller, W.H., Glatney, E.S., Duce, R.A., 1974. Atmospheric
concentration and sources of trace metals in the South Pole.
Science 183, 198–200.
Zufall, M.J., Davidson, C.I., Caffrey, P.F., Ondov, J.M., 1998.
Airborne concentrations and dry deposition fluxes of
particulate species to surrogate surfaces deployed in South-
ern lake Michigan. Environmental Science and Technology
32, 1623–1628.
K. Eleftheriadis, I. Colbeck / Atmospheric Environment 35 (2001) 5321–53305330