statistik sumber daya laut dan pesisir - neliti
TRANSCRIPT
http://www.bps.go.id

http://www.bps.go.id
STATISTIK SUMBER DAYA LAUT DAN PESISIR
STATISTICS OF MARINE AND COASTAL RESOURCES
2012http://www.bps.go.id
STATISTIK SUMBER DAYA LAUT DAN PESISIR 2012
STATISTICS OF MARINE AND COASTAL RESOURCES 2012
ISSN : 2086-2806
No. Publikasi / Publication Number : 04320.1202
Katalog BPS / BPS Catalogue : 3312002
Ukuran Buku / Book Size : 17,6 cm X 25 cm
Jumlah Halaman / Number of Pages : 257 halaman / pages
Naskah / Script :
Sub Direktorat Statistik Lingkungan Hidup
Sub Directorate of Environment Statistics
Penyunting / Editor :
Sub Direktorat Statistik Lingkungan Hidup
Sub Directorate of Environment Statistics
Gambar Kulit / Cover Design:
Sub Direktorat Statistik Lingkungan Hidup
Sub Directorate of Environment Statistics
Diterbitkan oleh / Published by:
Badan Pusat Statistik, Jakarta-Indonesia
BPS – Statistics Indonesia
Dicetak oleh / Printed by :
Badan Pusat Statistik, Jakarta-Indonesia
BPS – Statistics Indonesia
Boleh dikutip dengan menyebutkan sumbernya
May be cited with reference to the source
http://www.bps.go.id
S t a t i s t i c s o f M a r i n e a n d C o a s t a l R e s o u r c e s 2 0 1 2 iii
KATA PENGANTAR
Sebagai negara kepulauan terbesar di dunia, Indonesia memiliki potensi sumber daya laut dan pesisir yang
sangat besar. Sumber daya laut dan pesisir merupakan sumber kehidupan sebagian masyarakat dan mempunyai
peran yang strategis bagi pengembangan ekonomi nasional. Dalam pengelolaan sumber daya wilayah laut dan
pesisir diharapkan dapat menerapkan pembangunan berkelanjutan. Publikasi Statistik Sumberdaya Laut dan Pesisir
(SDLP) 2012 ini merupakan publikasi kedelapan yang diterbitkan oleh Badan Pusat Statistik sejak tahun 2004 yang
harapannya dapat berperan sebagai peta dan kompas dalam upaya untuk memaksimalkan pemanfaatan sumber
daya laut dan pesisir. Data yang dipublikasikan ini adalah hasil kompilasi data sekunder yang berasal dari Badan
Pusat Statistik dan instansi terkait baik di pusat maupun daerah.
Publikasi ini diharapkan dapat memberikan masukan kepada para pemangku kepentingan dalam
merumuskan kebijakan pengelolaan sumber daya laut dan pembangunan wilayah pesisir. Publikasi ini juga
diharapkan bermanfaat bagi kalangan akademisi dan pemerhati masalah laut dan pesisir.
Disadari sepenuhnya bahwa publikasi ini masih belum sempurna. Hal ini dikarenakan belum tersedianya
data atau belum optimalnya sistem pencatatan yang berkaitan dengan lingkungan laut dan pesisir pada berbagai
instansi terkait. Oleh karena itu, saran dan masukan untuk perbaikan publikasi ini pada penerbitan selanjutnya
sangat diharapkan. Kepada semua pihak yang telah berpartisipasi dalam publikasi ini disampaikan penghargaan
dan ucapan terimakasih.
Jakarta, Oktober 2012 Kepala Badan Pusat Statistik
Dr. Suryamin, M.Sc
http://www.bps.go.id
S t a t i s t i k S u m b e r D a y a L a u t d a n P e s i s i r 2 0 1 2iv
PREFACE
As the world’s largest archipelago country, Indonesia is bestowed with enormous marine and coastal
resources. Marine and coastal resources serve as the main livelihood for certain community and have a strategic
role in the national economic development. The management of marine and coastal resources are expected in
accordance and adopt the way of sustainable development management. The Statistical of Marine and Coastal
Resources (SMCR) 2012 is the eighth publication issued by BPS-Statistics Indonesia since 2004 which is hopefully
act as map and compass to fully utilized the marine and coastal resources. Published data is the result from
compilation of secondary data from the Statistics Indonesia and other related official agencies either national or
regional levels.
This publication is expected to provide an input to the stakeholders in formulating the policies of marine
resources management and coastal areas development. This publication is also expected to be useful for academics
and observers of marine and coastal issues.
Fully aware that the publication is not perfect. This is due to the unavailability of data or not optimal data
recording system relating to marine and coastal environments at various related institutions. Therefore, input and
suggestions for publication improvement is expected for the next publication. Appreciation and gratitude to all of
those who have participated in this publication.
Jakarta, October 2012
BPS-Statistics Indonesia
Dr. Suryamin, M.Sc
Chief Statistician
http://www.bps.go.id
S t a t i s t i c s o f M a r i n e a n d C o a s t a l R e s o u r c e s 2 0 1 2 v
DAFTAR ISI / CONTENTS
Kata Pengantar / Preface ................................................................................................................................. iii
Daftar Isi / Contents ..................................................................................................................................... v
Daftar Tabel / List of Tables ............................................................................................................................. vii
Daftar Gambar / List of Figures ........................................................................................................................ xv
Penjelasan Umum / Explanatory Notes ............................................................................................................ xvi
I. PENDAHULUAN / INTRODUCTION ...................................................................................................... 1
1.1. Latar Belakang / Background ...................................................................................................... 3
1.2. Tujuan / Objectives ..................................................................................................................... 4
1.3. Ruang Lingkup / Coverage ......................................................................................................... 5
II. METODOLOGI / METHODOLOGY ........................................................................................................ 7
2.1. Sumber Data / Data Sources ...................................................................................................... 9
2.2. Metode Penyajian / Method of Dissemination ............................................................................. 9
2.3. Konsep dan Definisi / Concept and Definition ............................................................................. 10
III. STATISTIK SUMBER DAYA LAUT DAN PESISIR
STATISTICS OF MARINE AND COASTAL RESOURCES .................................................................... 23
3.1. Gambaran Umum Wilayah Laut dan Pesisir
General Overview of Marine and Coastal Region ....................................................................... 25
3.2. Mangrove, Terumbu Karang dan Padang Lamun
Mangroves, Coral Reefs and Seagrass ...................................................................................... 29
3.2.1. Mangrove / Mangroves ................................................................................................ 30
3.2.2. Terumbu Karang / Coral Reefs .................................................................................... 36
3.2.3. Padang Lamun / Seagrass .......................................................................................... 38
3.3. Potensi dan Produksi Perikanan / Potency and Production of Fisheries .................................... 40
3.3.1. Perikanan Tangkap / Capture Fisheries ...................................................................... 40
3.3.2. Perikanan Budidaya / Aquaculture Fisheries ............................................................... 47
3.4. Perdagangan Perikanan / Fishery Trade .................................................................................... 55
3.4.1. Ekspor Perikanan / Fishery Exports ............................................................................ 57
3.4.2. Impor Perikanan / Fishery Imports............................................................................... 59
3.5. Konsumsi Perikanan / Fish Consumption ................................................................................... 62
3.6. Sarana dan Prasarana Transportasi Laut
Marine Transportation Infrastructure ........................................................................................... 65
3.7. RumahTangga Perikanan dan Perusahaan Perikanan
Fisheries Household and Establishments ................................................................................... 70
3.8. Mineral / Mineral ......................................................................................................................... 72
http://www.bps.go.id
S t a t i s t i k S u m b e r D a y a L a u t d a n P e s i s i r 2 0 1 2vi
3.9. Kawasan Konservasi Laut / Marine Conservation Area .............................................................. 74
3.10. Kualitas Air Laut / Sea Water Quality .......................................................................................... 75
3.11. Tindak Pidana dan Pengawasan Kelautan Perikanan
Fisheries Violation and Marine Affairs and Fisheries Surveillance ............................................. 77
3.12. Sarana dan Prasarana Pendidikan / Education Facilities and Infrastructure .............................. 78
3.13 Sarana dan Prasarana Sosial Ekonomi di Desa Pesisir
Socio-Economic Infrastructure in Coastal Village ....................................................................... 80
3.14. Nilai Tukar Petani Subsektor Perikanan (NTN)
Fishery Farmer Terms of Trade (NTN) ....................................................................................... 85
Daftar Pustaka / References ............................................................................................................................ 87
Lampiran / Appendix ..................................................................................................................................... 91
http://www.bps.go.id
S t a t i s t i c s o f M a r i n e a n d C o a s t a l R e s o u r c e s 2 0 1 2 vii
DAFTAR TABEL / LIST OF TABLES
1 Status Tingkat Eksploitasi Sumber Daya Ikan di Masing-masing WPP-RI
Exploitation Level Status of Fish Resources in each of the WPP-RI ........................................ 42
2 Volume Produksi Perikanan (ribu ton), 2005-2010
Production Volume of Fisheries (thousand tons), 2005–2010 .................................................. 44
3 Nilai Produksi Perikanan (miliar rupiah), 2005-2010
Production Value of Fisheries (billion rupiahs), 2005-2010 ...................................................... 45
4 Potensi, Tingkat Pemanfaatan serta Peluang Pengembangan Lahan Tambak dan
Budidaya Laut di Indonesia (ha), 2009
Potency, Usage Level and Developing Opportunity of Backishwater Pond and Marine
Culture in Indonesia (ha), 2009 ................................................................................................. 48
5 Volume dan Nilai Ekspor Udang, 2005-2011
Volume and Value of Export Shrimp, 2005-2011 ...................................................................... 50
6 Pengeluaran Rata-Rata per Kapita Sebulan untuk Ikan dan Persentasenya terhadap Total
Pengeluaran menurut Tipe Daerah, 2009-2010
Monthly Average Expenditure per Capita for Fish and Percentage to Total Expenditure by
Type of Region, 2009-2010 ...................................................................................................... 63
7 Klasifikasi Pelabuhan Perikanan di Indonesia Classification of Fishing Port in Indonesia ................................................................................ 67
3.1 Luas Daratan, Jumlah Wilayah Admisnitrasi dan Panjang Garis Pantai menurut Provinsi, 2011
Land Area, Number of Administration Area and Length of Coastline by Province, 2011 ......... 93
3.2 Jumlah dan Persentase Desa menurut Provinsi dan Letak Geografis, 2011 Number and Percentage of Village by Province and Geographical Location, 2011 ................. 94
3.3 Jumlah Desa Pesisir menurut Provinsi dan Panjang Garis Pantai, 2008
Number of Coastal Villages by Province and Length of Coastline, 2008 ................................. 95
3.4 Jumlah Pulau yang Telah Disurvei dan Diverifikasi menurut Provinsi, 2010 Number of Survey and Verified Islands by Province, 2010 ...................................................... 96
3.5 Jumlah Pulau yang telah Terprofilkan menurut Provinsi, 2011 Number of Profiled Islands by Province, 2011 ......................................................................... 97
3.6 Pulau-pulau Kecil Terluar di Indonesia menurut Provinsi, 2008
Small Outer Islands of Indonesia by Province, 2008 ............................................................... 98
3.7 Luas dan Kondisi Hutan Mangrove menurut Provinsi, 2011
Area and Condition of Mangrove Forest by Province, 2011 ..................................................... 101
3.8 Penanaman/Rehabilitasi Hutan Mangrove menurut Provinsi, 2006 -2010
Mangrove Forest Plantation/Rehabilitation by Province, 2006 -2010 ....................................... 102
http://www.bps.go.id
S t a t i s t i k S u m b e r D a y a L a u t d a n P e s i s i r 2 0 1 2viii
3.9 Jumlah Lokasi dan Persentase Kondisi Terumbu Karang menurut Wilayah,2007 -2011
Number of Coral Reef Location and Percentage of Condition by Area, 2007 -2011 ................ 103
3.10 Luas dan Kondisi Terumbu Karang menurut Provinsi, 2011
Area and Condition of Coral Reef by Province, 2011 ............................................................... 104
3.11 Luas dan Kondisi Padang Lamun menurut Provinsi, 2011
Area and Condition of Sea Grass by Province, 2011 ............................................................... 105
3.12 Produksi Perikanan Laut menurut Jenis Ikan, 2007 - 2010
Marine Fisheries Products by Type of Fish, 2007–2010 ........................................................... 106
3.13 Nilai Produksi Perikanan Laut menurut Jenis Ikan, 2007 - 2010
Production Value of Marine Fisheries by Type of Fish, 2007 -2010 ......................................... 108
3.14a Produksi Perikanan Laut menurut Jenis Ikan di Barat Sumatera, 2007-2010
Production of Marine Fisheries by Type of Fish in Western Sumatra, 2007–2010 ................... 110
3.14b Produksi Perikanan Laut menurut Jenis Ikan di Timur Sumatera, 2007-2010
Production of Marine Fisheries by Type of Fish in Eastern Sumatra, 2007–2010 .................... 112
3.14c Produksi Perikanan Laut menurut Jenis Ikan di Utara Jawa, 2007-2010
Production of Marine Fisheries by Type of Fish in Northern Java, 2007–2010 ........................ 114
3.14d Produksi Perikanan Laut menurut Jenis Ikan di Selatan Jawa, 2007-2010.
Production of Marine Fisheries by Type of Fish in Southern Java, 2007–2010 ........................ 116
3.14e Produksi Perikanan Laut menurut Jenis Ikan di Bali-Nusa Tenggara, 2007-2010
Production of Marine Fisheries by Type of Fish in Bali–Nusa Tenggara, 2007-2010 ............... 118
3.14f Produksi Perikanan Laut menurut Jenis Ikan di Selat Malaka, 2007-2010
Production of Marine Fisheries by Type of Fish in Malacca Strait, 2007–2010 ........................ 120
3.14g Produksi Perikanan Laut menurut Jenis Ikan di Selatan/Barat Kalimantan, 2007-2010
Production of Marine Fisheries by Type of Fish in Southern/Western Kalimantan, 2007–2010 122
3.14h Produksi Perikanan Laut menurut Jenis Ikan di Timur Kalimantan, 2007-2010
Production of Marine Fisheries by Type of Fish in Eastern Kalimantan, 2007–2010 ............... 124
3.14i Produksi Perikanan Laut menurut Jenis Ikan di Utara Sulawesi, 2007-2010
Production of Marine Fisheries by Type of Northern Sulawesi, 2007–2010 ............................. 126
3.14j Produksi Perikanan Laut menurut Jenis Ikan di Selatan Sulawesi, 2007-2010
Production of Marine Fisheries by Type of Southern Sulawesi, 2007–2010 ............................ 128
3.14k Produksi Perikanan Laut menurut Jenis Ikan di Maluku dan Papua, 2007-2010
Production of Marine Fisheries by Type of Fish in Maluku and Papua, 2007–2010 ................. 130
3.15a Nilai Produksi Perikanan Laut menurut Jenis Ikan di Barat Sumatera, 2007-2010
Production Value of Marine Fisheries by Type of Fish in Western Sumatra, 2007-2010 ........ 132
3.15b Nilai Produksi Perikanan Laut menurut Jenis Ikan di Timur Sumatera, 2007-2010
Production Value of Marine Fisheries by Type of Fish in Eastern Sumatra, 2007-2010 .......... 134
3.15c Nilai Produksi Perikanan Laut menurut Jenis Ikan di Utara Jawa, 2007-2010
Production Value of Marine Fisheries by Type of Fish in Northern Java, 2007-2010 ............... 136
http://www.bps.go.id
S t a t i s t i c s o f M a r i n e a n d C o a s t a l R e s o u r c e s 2 0 1 2 ix
3.15d Nilai Produksi Perikanan Laut menurut Jenis Ikan di Selatan Jawa, 2007-2010
Production Value of Marine Fisheries by Type of Fish in Southern Java, 2007-2010 .............. 138
3.15e Nilai Produksi Perikanan Laut menurut Jenis Ikan di Bali & Nusa Tenggara, 2007-2010 .......
Production Value of Marine Fisheries by Type of Fish in Bali & Nusa Tenggara, 2007-2010 .. 140
3.15f Nilai Produksi Perikanan Laut menurut Jenis Ikan di Selat Malaka, 2007-2010
Production Value of Marine Fisheries by Type of Fish in Malacca Strait, 2007–2010 .............. 142
3.15g Nilai Produksi Perikanan Laut menurut Jenis Ikan di Selatan/Barat Kalimantan, 2007-2010
Production Value of Marine Fisheries by Type of Fish in Southern/ Western Kalimantan,
2007–2010 ................................................................................................................................ 144
3.15h Nilai Produksi Perikanan Laut menurut Jenis Ikan di Timur Kalimantan, 2007-2010
Production Value of Marine Fisheries by Type of Fish in Eastern Kalimantan, 2007–2010 ..... 146
3.15i Nilai Produksi Perikanan Laut menurut Jenis Ikan di Utara Sulawesi, 2007-2010
Production Value of Marine Fisheries by Type of Northern Sulawesi, 2007–2010 ................... 148
3.15j Nilai Produksi Perikanan Laut menurut Jenis Ikan di Selatan Sulawesi, 2007-2010 ................
Production Value of Marine Fisheries by Type of Southern Sulawesi, 2007–2010 .................. 150
3.15k Nilai Produksi Perikanan Laut menurut Jenis Ikan di Maluku dan Papua, 2007-2010
Production Value of Marine Fisheries by Type of Fish in Maluku and Papua, 2007-2010 ....... 152
3.16 Produksi Perikanan Tangkap Udang menurut Jenis Udang dan Provinsi, 2010
Production of Marine Shrimp Capture Fisheries by Type of Shrimp and Province, 2010 ......... 154
3.17 Nilai Produksi Perikanan Tangkap Udang menurut Jenis Udang dan Provinsi, 2010
Production Value of MarineShrimp Capture Fisheries by Type of Shrimp and Province, 2010 156
3.18 Produksi Perikanan Tangkap Udang di Laut menurut Daerah Perairan dan Jenis Udang,
2008-2010
Production of Marine Shrimp Capture Fisheries by Territorial Waters and Type of Shrimp,
2008- 2010 ................................................................................................................................ 158
3.19 Nilai Produksi Perikanan Tangkap Udang di Laut menurut Daerah Perairan dan Jenis Udang,
2008-2010
Production Value of Marine Shrimp Capture Fisheries by Territorial Waters and Type of Shrimp,
2008-2010 ................................................................................................................................. 162
3.20 Potensi Lahan Tambak dan Budidaya Laut serta Realisasinya menurut Provinsi, 2010
Potency of Brackishwater Pond and Marine Culture and Realization by Province, 2010 ......... 166
3.21 Luas Usaha dan Produksi BudidayaTambak dan Laut menurut Provinsi, 2010
Area and Production of Brackishwater Pond and Marine Culture by Province, 2010 ............... 167
3.22 Produksi Budidaya Perikanan Tambak menurut Provinsi, 2006-2010
Production of Brackishwater Pond Culture by Province, 2006-2010 ........................................ 168
3.23 Produksi Budidaya Perikanan Laut menurut Provinsi, 2006-2010
Production of Marine Culture by Province, 2006–2010 ............................................................ 169
http://www.bps.go.id
S t a t i s t i k S u m b e r D a y a L a u t d a n P e s i s i r 2 0 1 2x
3.24 Nilai Produksi Budidaya Perikanan Tambak menurut Provinsi, 2006-2010
Production Value of Brackishwater Pond Culture by Province, 2006–2010 ............................. 170
3.25 Nilai Produksi Budidaya Perikanan Laut menurut Provinsi, 2006-2010
Production Value of Marine Culture by Province, 2006-2010 ................................................... 171
3.26 Produksi Budidaya Udang menurut Jenis Udang dan Provinsi, 2010
Production of Shrimp Culture by Type of Shrimp and Province, 2010 ...................................... 172
3.27 Nilai Produksi Budidaya Udang menurut Provinsi dan Jenis Udang, 2010
Production Value of Shrimp Culture by Province and Type of Shrimp, 2010 ........................... 173
3.28 Produksi Budidaya Udang Windu menurut Provinsi, 2006-2010
Production of Black Tiger Shrimp Culture by Province, 2006-2010 .......................................... 174
3.29 Produksi Budidaya Udang Putih menurut Provinsi, 2006-2010
Production of White Tiger Shrimp Culture by Province, 2006-2010 ......................................... 175
3.30 Produksi Budidaya Udang Vaname menurut Provinsi, 2006-2010
Production of Vaname Shrimp Culture by Province, 2006-2010 .............................................. 176
3.31 Produksi Budidaya Rumput Laut menurut Provinsi, 2006-2010
Production of Seaweed Culture by Province, 2006-2010 ......................................................... 177
3.32 Persentase Kontribusi Perikanan Terhadap Produk Domestik Regional Bruto Atas Dasar
Harga Berlaku menurut Provinsi, 2007–2011
Percentage of Fishery Contribution to Gross Regional Domestic Product at Current
Market Prices by Provinces, 2007-2011 ................................................................................... 178
3.33 Volume Ekspor Hasil Perikanan menurut Provinsi, 2006–2010
Volume of Export on Fishery Products by Province, 2006–2010 .............................................. 179
3.34 Nilai Ekspor Hasil Perikanan menurut Provinsi, 2006–2010
Value of Export on Fishery Products by Province, 2006 –2010 ................................................ 180
3.35 Persentase Nilai Ekspor Hasil Perikanan terhadap Total Nilai Eksport menurut Provinsi,
2009-2010
Percentage of Export Value on Fishery Products to Total of Export Value by Province,
2009-2010 ................................................................................................................................. 181
3.36 Volume dan Nilai Ekspor menurut Kelompok Komoditi Perikanan, 2009-2010
Volume and Value of Export by Fishery Commodity Group, 2009-2010 .................................. 182
3.37 Volume Impor Hasil Perikanan menurut Provinsi, 2006–2010
Volume of Import on Fishery Products by Province, 2006–2010 .............................................. 183
3.38 Nilai Impor Hasil Perikanan menurut Provinsi, 2006–2010
Value of Import on Fishery Products by Province, 2006–2010 ................................................. 184
3.39 Persentase Nilai Impor Hasil Perikanan terhadap Total Nilai Impor menurut Provinsi,
2009-2010
Percentage of Import Value of Fishery Product to Total of Import value by Province,
2009-2010 ................................................................................................................................. 185
http://www.bps.go.id
S t a t i s t i c s o f M a r i n e a n d C o a s t a l R e s o u r c e s 2 0 1 2 xi
3.40 Volume dan Nilai Impor menurut Kelompok Komoditi Perikanan, 2009-2010
Volume and Value of Import by Fishery Commodity Group, 2009-2010 .................................. 186
3.41 Rata-Rata Konsumsi Kalori per Kapita Sehari dari Ikan menurut Provinsi dan Tipe Daerah,
2010-2011
Average Daily per Capita Consumption of Calorie from Fish by Province and Type of Region,
2010-2011 ................................................................................................................................. 187
3.42 Rata-Rata Konsumsi Protein per Kapita Sehari dari Ikan menurut Provinsi dan Tipe Daerah,
2010-2011
Average Daily per Capita Consumption of Protein from Fish by Province and Type of Region,
2010-2011 ................................................................................................................................. 188
3.43 Jumlah Pelabuhan menurut Jenis Pelabuhan Perikanan dan Provinsi, 2011
Number and Port by Type Fishing Port and Province, 2011 ..................................................... 189
3.44 Jumlah Perahu/Kapal Penangkap Ikan di Perairan Laut menurut Provinsi dan Jenis Kapal
yang Digunakan, 2009-2010
Number of Marine Fishing Boats by Province and Type of Fishing Boat, 2009-2010 .............. 190
3.45 Jumlah Alat Penangkap Ikan Laut menurut Jenis Alat Penangkap, 2006-2010
Number of Marine Fishing Gear by Type of Fishing Gear, 2006-2010 ..................................... 191
3.46 Jumlah Nelayan di Laut menurut Provinsi dan Kategori Nelayan, 2010
Number of Marine Fishers by Province and Category of Fishers, 2010 ................................... 193
3.47 Jumlah Nelayan di Laut menurut Provinsi, 2006-2010
Number of Marine Fishermen by Province, 2006-2010 ............................................................ 194
3.48 Jumlah Rumah Tangga/Perusahan Perikanan Tangkap (RTP/PP) di Laut menurut Provinsi
dan Jenis Perahu yang Digunakan, 2010
Number of Marine Household/Fishing Company by Province and Type of Fishing Boat, 2010 195
3.49 Jumlah Rumah Tangga /Perusahan Perikanan Tangkap (RTP/PP) di Laut menurut Provinsi,
2006-2010
Number of Marine Capture Fisheries Household/ Establishments by Province, 2006-2010 .... 196
3.50 Jumlah Rumah Tangga Perikanan Budidaya Laut dan Tambak serta Pembudidaya Ikan
menurut Provinsi, 2010
Number of Marine and Brackishwater Pond Culture Household and Fish Farmer
by Province, 2010 ..................................................................................................................... 197
3.51 Jumlah Desa Pesisir menurut Provinsi dan Sumber Penghasilan Utama Sebagian Besar
Penduduk, 2011
Number of Coastal Villages by Province and Main Income Source of Major Population, 2011 198
3.52 Pulau Kecil yang Berpotensi Mengandung Mineral di Beberapa Provinsi dan Jenis Potensi, 2011
Potency of Mineral on Several Small Islands in Several Province and Potential Type, 2011 ... 200
3.53 Jumlah dan Luas Kawasan Konservasi Laut menurut Provinsi, 2011
Number and Area of Marine Conservation by Province, 2011 .................................................. 202
http://www.bps.go.id
S t a t i s t i k S u m b e r D a y a L a u t d a n P e s i s i r 2 0 1 2xii
3.54 Daftar Jenis-Jenis Ikan yang Dilindungi Berdasarkan PP No. 7/1999
List of Fish Species That are Protected by PP No. 7/1999 ....................................................... 205
3.55 Jumlah Pengunjung Taman Wisata Alam Laut di Beberapa Provinsi, 2006-2010
Number of Visitors to Marine Nature Recreational Park in Several Province, 2006-2010 ........ 207
3.56 Kejadian Tumpahan Minyak di Perairan Indonesia, 1997-2012
Occurrence of Oil Spill in Indonesia Waters, 1997-2012 .......................................................... 209
3.57 Kualitas Air Laut di Sekitar Pantai di Indonesia, 2011
Quality of Sea Water around Port in Indonesia, 2011 ............................................................... 210
3.58 Jumlah dan Nama Kapal Pengawas menurut Provinsi, 2011
Number and Name of Surveillance Vessel by Province, 2011 ................................................. 212
3.59 Jumlah Awak Kapal Pengawas, 2007-2011
Number of Surveillance Vessel’s Crews, 2007-2011 ................................................................ 213
3.60 Jumlah Tindak Pidana Perikanan menurut Provinsi, 2006-2010
Number of Fisheries Violation by Province, 2006-2010 ............................................................ 214
3.61 Jumlah Tindak Pidana Perikanan menurut Jenis Tindak Pidana, 2006-2010
Number of Fisheries Violation by Type of Violation, 2006-2010 ............................................... 215
3.62 Hasil Operasi Kapal Pengawas, 2007-2011
Operation of Surveillance Vessels, 2007-2011 ......................................................................... 216
3.63 Jumlah Sekolah Pelayaran menurut Provinsi, 2010
Number of Marine School by Province, 2010 ........................................................................... 217
3.64 Jumlah Lulusan Sekolah Perikanan Lingkup Kementerian Kelautan dan Perikanan menurut
Provinsi dan Nama Sekolah, 2007-2011......................................................
Number of Fishery School Alumni in Ministry of Marine Affairs and Fisheries by Province
and Name of School, 2007-2011 .............................................................................................. 218
3.65 Jumlah Penyuluhan Perikanan menurut Provinsi 2007-2011
Distribution of Fishery Information Agent by Province, 2007-2011 ........................................... 219
3.66 Jumlah Desa Pesisir yang Mempunyai Fasilitas Pendidikan menurut Provinsi dan
Tingkat Pendidikan, 2011.………………………………………………………………….
Number of Coastal Villages Having Education Facility by Province and Type of
Education Level, 2011 .............................................................................................................. 220
3.67 Jumlah Desa Pesisir yang Mempunyai Sarana Kesehatan menurut Provinsi dan Jenis
Sarana Kesehatan, 2011.……………………………………………………..........
Number of Coastal Villages Having Health Facility by Province and Type of Health Facility, 2011 221
3.68 Jumlah Desa Pesisir yang Mempunyai Sarana Perdagangan dan Hotel menurut Provinsi, 2011
Number of Coastal Villages Having Trade Facility and Hotel by Province, 2011 ..................... 223
3.69 Jumlah Desa Pesisir yang Mempunyai Sarana Koperasi menurut Provinsi, 2011
Number of Coastal Villages Having Cooperative Facility by Province, 2011 ............................ 224
http://www.bps.go.id
S t a t i s t i c s o f M a r i n e a n d C o a s t a l R e s o u r c e s 2 0 1 2 xiii
3.70 Jumlah Desa Pesisir yang Menerima Dana Modal Usaha Pertanian untuk
Program Pemberdayaan Masyarakat menurut Provinsi dan Sumber Dana, 2011
Number of Coastal Villages that Received Argicultural Capital Funds through the Community
Empowerment Program by Province and Type of Funding Sources, 2011 .............................. 225
3.71 Jumlah Desa Pesisir yang Menerima Dana Modal Usaha Non-Pertanian untuk Program
Pemberdayaan Masyarakat menurut Provinsi dan Sumber Dana, 2011
Number of Coastal Villages that Received Non-Agricultural Capital Fund through
the Community Empowerment Program by Province and Type of Funding Sources, 2011 ..... 226
3.72 Jumlah Desa Pesisir yang Menerima Dana Hibah Usaha Produktif untuk Program
Pemberdayaan Masyarakat menurut Provinsi dan Sumber Dana, 2011
Number of Coastal Villages that Received Productive Business Grants through
the Community Empowerment Program by Province and Type of Funding Sources, 2011 ..... 227
3.73 Jumlah Desa Pesisir yang Memperoleh Program Pembangunan/Perbaikan Transportasi
untuk Program Pemberdayaan Masyarakat menurut Provinsi dan Sumber Dana, 2011
Number of Coastal Villages that Received Program Development/Improvement on Transportation
through the Community Empowerment Program by Province and Type of Funding Sources, 2011 228
3.74 Jumlah Desa Pesisir yang Memperoleh Program Pembangunan/Perbaikan Sarana
Pendidikan untuk Program Pemberdayaan Masyarakat menurut Provinsi dan Sumber Dana, 2011
Number of Coastal Villages that Received Program Development/Improvement on Educational
Facilities through the Community Empowerment Program by Province and Type of
Funding Sources, 2011 ............................................................................................................. 229
3.75 Jumlah Desa Pesisir yang Memperoleh Program Pembangunan/Perbaikan Pemukiman dan
Kesehatan untuk Program Pemberdayaan Masyarakat menurut Provinsi dan Sumber Dana, 2011
Number of Coastal Villages that Received Program Development/Improvement on Housing Health
through the Community Empowerment Program by Province and Type of Funding Sources, 2011 230
3.76 Jumlah Desa Pesisir yang Memperoleh Program Pembangunan/Perbaikan Sarana Perekonomian
untuk Program Pemberdayaan Masyarakat menurut Provinsi dan Sumber Dana, 2011
Number of Coastal Villages that Received Program Development/Improvement on Economic
Infrastructure through the Community Empowerment Program by Province and Type of
Funding Sources, 2011 ............................................................................................................. 231
3.77 Jumlah Desa Pesisir yang Memperoleh Program Peningkatan Keterampilan Produksi untuk
Program Pemberdayaan Masyarakat menurut Provinsi dan Sumber Dana, 2011
Number of Coastal Villages that have Production Skill Enhancement Program through the
Community Empowerment Program by Province and Type of Funding Sources, 2011 ........... 232
3.78 Jumlah Desa Pesisir yang Memperoleh Program Peningkatan Keterampilan Pemasaran untuk
Program Pemberdayaan Masyarakat menurut Provinsi dan Sumber Dana, 2011
Number of Coastal Villages that have Marketing Skill Enhancement Program through the
Community Empowerment Program by Province and Type of Funding Sources, 2011 ........... 233
http://www.bps.go.id
S t a t i s t i k S u m b e r D a y a L a u t d a n P e s i s i r 2 0 1 2xiv
3.79 Jumlah Desa Pesisir yang Memperoleh Program Penguatan Kelembagaan Sosial
untuk Program Pemberdayaan Masyarakat menurut Provinsi dan Sumber Dana, 2011
Number of Coastal Villages that Received Program for Strengthening Social Institutional through
the Community Empowerment Program by Province and Type of Funding Sources, 2011 ..... 234
3.80 Jumlah Dana Block Grant I Program Pemberdayaan Ekonomi Masyarakat Pesisir menurut Provinsi,
2005–2009
The Amount of Block Grant I of Economic Coastal Community Empowerment Program by Province,
2005–2009 ................................................................................................................................ 235
3.81 Indeks Harga yang Diterima Petani (lt), Indeks Harga yang Dibayar Petani (lb) dan
Nilai Tukar Petani Sub Sektor Perikanan (NTN) menurut Provinsi, 2010
Prive Received by Farmers Indices (lt), Price Paid by Farmers Indices (lb) and Farmer’s Terms
of Trade of Fishery Sub Sector (NTN) by Province, 2010 ........................................................ 236
3.82 Indeks Harga yang Diterima Petani (lt), Indeks Harga yang Dibayar Petani (lb) dan
Nilai Tukar Petani Sub Sektor Perikanan (NTN) menurut Provinsi, 2011
Prive Received by Farmers Indices (lt), Price Paid by Farmers Indices (lb) and Farmer’s Terms
of Trade of Fishery Sub Sector (NTN) by Province, 2011 ........................................................ 237
3.83 Indeks Harga yang Diterima Petani (lt), Indeks Harga yang Dibayar Petani Ikan (lb) dan
Nilai Tukar Petani Sub Sektor Perikanan (NTN) menurut Provinsi, 2012
Prive Received by Farmers Fish Indices (lt), Price Paid by Farmers Fish Indices (lb), and
Farmer’s Terms of Trade of Fishery Sub Sector (NTN) by Province, 2012 .............................. 238
http://www.bps.go.id
S t a t i s t i c s o f M a r i n e a n d C o a s t a l R e s o u r c e s 2 0 1 2 xv
DAFTAR GAMBAR / LIST OF FIGURES
1. Sebaran Luas Hutan Mangrove Dunia, 2005
Distribution of World’s Mangrove Forests, 2005 ....................................................................... 32
2. Produksi Budidaya Rumput Laut (ribu ton), 2006-2010
Seaweed Production in Marine Culture (thousand tons), 2006-2010 ....................................... 54
3. Kontribusi Perikanan terhadap PDB atas Dasar Harga Berlaku (%), 2004-2011
Fishery Contribution to GDP at Current Market Prices (%), 2004-2011 ................................... 56
4. Volume Ekspor dan Impor Hasil Perikanan (ton), 2005-2010
Exports and Imports Volume of Fishery Product (tons), 2005-2010 ......................................... 60
5. Nilai Ekspor dan Impor Hasil Perikanan (juta US$), 2005-2010
Exports and ImportsValue of Fishery Product (million US$), 2005-2010 .................................. 61
6. Jumlah Pengunjung Taman Wisata Alam Laut, 2006-2010
Number of Visitors to Marine Nature Recreational Park, 2006-2010 ........................................ 75
7. Jumlah Dana Block Grant Program Pengembangan Ekonomi Masyarakat Pesisir
(miliar rupiah), 2002-2009
Amount of Block Grant Fund of Coastal Community Economic Empowerment Program
(billion rupiahs), 2002-2009 ...................................................................................................... 84
http://www.bps.go.id
S t a t i s t i k S u m b e r D a y a L a u t d a n P e s i s i r 2 0 1 2xvi
PENJELASAN UMUM / EXPLANATORY NOTES
TANDA-TANDA / SYMBOLS:
Data belum tersedia / Data not yet available : ... Data tidak tersedia atau dapat diabaikan / Data not available or negligible : - Data kurang dari setengah satuan yang digunakan / Data less than half of the unit used : 0 Data/angka sementara / Preliminary figures : x) Data/angka sangat sementara / Very preliminary figures : xx) Data/angka diperbaiki / Revised figures : r) Data/angka perkiraan / Estimation figures : e) Tidak Terdeteksi / Undetected : tt Tidak Terpantau / Not Monitored : tp
SATUAN / UNITS:
Liter (untuk beras) / Litre (for rice) : 0,80 kg Barrel : 158,99 litre = 1/6,2898 m3. mscf : 1/35,3 m3. Long ton : 1.016,50 kg. Metric ton (m. ton) : 0,98421 long ton = 1.000 kg.
http://www.bps.go.id
http://www.bps.go.id

http://www.bps.go.id
I N T R O D U C T I O N
S t a t i s t i c s o f M a r i n e a n d C o a s t a l R e s o u r c e s 2 0 1 2 3
1.1. Latar Belakang
Indonesia merupakan negara maritim dan
kepulauan terbesar di dunia. Luas laut Indonesia
mencapai 5,8 juta kilo meter persegi atau lebih dari tiga
kali lipat luas daratannya yaitu 1,9 juta kilo meter persegi.
Luas laut tersebut terdiri dari 2,3 juta kilo meter persegi
perairan kepulauan, 0,8 juta kilo meter persegi perairan
teritorial, dan 2,7 juta kilo meter persegi perairan Zona
Ekonomi Eksklusif (ZEE). Indonesia sebagai negara
kepulauan memiliki 17.504 pulau. Pulau yang sudah
berhasil di identifikasi terdiri dari 8.651 pulau sudah
bernama dan 8.853 pulau belum bernama. Potensi
tersebut masih ditambah lagi dengan panjang garis
pantai Indonesia sepanjang 95.181 kilo meter. Potensi
lainnya adalah lahan budidaya laut seluas 8,36 juta
hektar. (Kelautan dan Perikanan Dalam Angka, 2009).
Potensi lahan budidaya laut tersebut belum
dimanfaatkan secara optimal, karena baru dimanfaatkan
87,47 hektar untuk kegiatan budidaya laut atau hanya
sekitar satu persen. Realisasi produksi perikanan
Indonesia 8,79 juta ton, sama dengan 5,25 persen
produksi perikanan dunia, menempati urutan kedua
negara penghasil ikan di dunia setelah Cina (Statistik
Kelautan dan Perikanan, 2009).
Sumber daya laut dari sektor perikanan
merupakan salah satu tumpuan utama dan sumber
pertumbuhan ekonomi baru Indonesia yang dapat
dikembangkan secara berkelanjutan. Menurut Dahuri
(2009), sedikitnya ada 11 sektor ekonomi yang dapat
dikembangkan, seperti perikanan tangkap, perikanan
budidaya, industri pengolahan hasil perikanan, industri
bioteknologi kelautan, pertambangan dan energi,
1.1. Background
Indonesia is a maritime country and the biggest
archipelago country in the world. Indonesian sea area
of 5.8 million square kilo meters or more than three
times the land area of 1.9 million square kilo meters.
Sea area consists of 2.3 million square kilo meters of
archipelagic waters, 0.8 million square kilo meters of
territorial waters, and 2.7 million square kilo meters
of the waters of the Exclusive Economic Zone (EEZ).
Indonesian archipelago has 17,504 islands. The island
has been successful in the identification consists of
8,651 islands has been named yet and 8,853 the island.
The potential is still coupled with a long coastline along
Indonesia 95,181 kilo meters. Another is the potential
cultivation area of 8.36 million hectares of sea. (Marine
and Fisheries in Figures, 2009).
Potential aquaculture land has not been used
optimally, having 87.47 acres used for aquaculture
activities or only about one percent. Actual production
of fishery Indonesia 8.79 million tonnes, equal to 5.25
percent of world fisheries production, took second place
fish producing country in the world after China (Marine
and Fishery Statistics, 2009).
Marine resources of the fisheries sector is one of
the main pedestal and new sources of economic growth
in Indonesia that can be developed in a sustainable
manner. According to Dahuri (2009), at least there
are 11 economic sectors can be developed, such as
capture fisheries, aquaculture fisheries, fish processing
industry, marine biotechnology industry, mining and
energy, marine tourism, forestry, sea transportation,
http://www.bps.go.id
P E N D A H U L U A N
S t a t i s t i k S u m b e r D a y a L a u t d a n P e s i s i r 2 0 1 24
pariwisata bahari, kehutanan, perhubungan laut, sumber
daya pulau-pulau kecil, industri dan jasa maritim, serta
sumber daya alam nonkonvensional. Oleh karena itu,
sumberdaya laut dan pesisir perlu dikelola dengan
bijak, sehingga dapat menjadi tumpuan pembangunan
dan sumber pertumbuhan baru bagi pembangunan
ekonomi Indonesia secara berkelanjutan.
Dalam rangka mendukung pembangunan
daerah pesisir dan pulau-pulau kecil yang berkelanjutan,
diperlukan data statistik sumber daya laut dan pesisir.
Data tersebut diperlukan untuk perencanaan, monitoring
dan evaluasi pembangunan. BPS sebagai instansi
yang bertanggung jawab dalam penyediaan data dan
informasi statistik, berupaya menyajikan data terkait
laut dan pesisir dalam bentuk publikasi yaitu publikasi
Statistik Sumber Daya Laut dan Pesisir (SDLP).
SDLP tahun 2012 merupakan edisi kedelapan yang
merupakan hasil perkembangan dan penyempurnaan
dari edisi-edisi sebelumnya.
1.2. Tujuan
Secara umum, publikasi ini bertujuan
menyajikan data dan informasi tentang laut dan pesisir
di Indonesia sebagai masukan bagi para pengambil
kebijakan dalam merencanakan, mengevaluasi dan
menentukan program terkait laut dan pesisir. Publikasi
ini juga dimaksudkan sebagai sumber data dan informasi
bagi masyarakat luas. Secara khusus, publikasi SDLP
bermaksud menyajikan isu terkait laut dan pesisir,
kondisi fisik, sumber daya yang dapat diperbaharui
maupun yang tidak dapat diperbaharui, jasa kelautan
dan keadaan sosial ekonomi masyarakat pesisir.
small islands resources, maritime industry and
services, as well as unconventional natural resources.
Therefore, marine and coastal resources should be
managed wisely, so that can become the foundation
and development of new sources of growth for the
sustainable economic development of Indonesia.
In order to support the development of coastal
region and small island, the regional statistics of coastal
region and marine should be provided. The data are
needed to plan, monitor, and evaluate the development.
As an institution which responsible in providing statistical
data and information, BPS–Statistics Indonesia efforts
to compile data and information related to marine and
coastal resources into a publication, named Statistics
of Marine and Coastal Resources (SMCR). The 2012
SMCR publication is the eight publication, which is a
result of previous editions improvement.
1.2. Objectives
In general, the purpose of SMCR is to present
data and information for decision makers. This
publication is also as data source and information for
wide society. Specifically, the purpose of this publication
is to present the issues linked with marine and coastal
resources, its physical condition, renewable and non-
renewable resources, marine services, and socio
economic condition of population in coastal region.
http://www.bps.go.id
I N T R O D U C T I O N
S t a t i s t i c s o f M a r i n e a n d C o a s t a l R e s o u r c e s 2 0 1 2 5
1.3. Coverage
SMCR publication presents data and
information of marine and coastal resources that comes
from various surveys and census conducted by BPS-
Statistics Indonesia and from related institutions. In
general, data in this publication present the central and
provincial level with coverage up to year 2012.
1.3. Ruang Lingkup
Publikasi SDLP menyajikan data dan informasi
terkait wilayah laut dan pesisir yang bersumber dari
berbagai survei dan sensus yang dilakukan BPS serta
data dari instansi lain. Secara umum, data dalam
publikasi disajikan hingga level provinsi dan nasional
dengan cakupan tahun data sampai dengan tahun
2012.
http://www.bps.go.id

http://www.bps.go.id
http://www.bps.go.id

http://www.bps.go.id
M E T H O D O L O G Y
S t a t i s t i c s o f M a r i n e a n d C o a s t a l R e s o u r c e s 2 0 1 2 9
2.1. Sumber Data
Statistik Sumber Daya Laut dan Pesisir tahun
2012 di susun menggunakan data primer dan sekunder.
Data primer diperoleh dari hasil survei dan sensus yang
dilakukan BPS, sedangkan data sekunder diperoleh
dari hasil kompilasi data beberapa instansi/unit terkait
pembangunan wilayah laut dan pesisir baik di pusat
maupun daerah.
BPS mengumpulkan dan mengkompilasikan
data di instansi/unit antara lain: Kementerian
Kelautan dan Perikanan, Kementerian Dalam Negeri,
Kementerian Kehutanan, Badan Koordinasi Survei
dan Pemetaan Nasional, Lembaga Ilmu Pengetahuan
Indonesia, Kementerian Energi dan Sumber Daya
Mineral, Kementerian Perhubungan, Kementerian
Lingkungan Hidup, dan Kementerian Pendidikan dan
Kebudayaan.
2.2. Metode Penyajian
Publikasi SDLP tahun 2012 ini merupakan
edisi kedelapan dan merupakan pengembangan dari
publikasi-publikasi sebelumnya. Publikasi ini ditujukan
untuk memenuhi kebutuhan pengguna data, terutama
kebutuhan data bagi para pengambil kebijakan dan
kegiatan ilmiah lainnya.
Data dan informasi terkait sumber daya laut dan
pesisir disajikan menurut level nasional dan provinsi.
Data dan informasi dibagi dalam 14 pokok bahasan yaitu
Gambaran Umum Wilayah Laut dan Pesisir, Mangrove,
Terumbu Karang dan Padang Lamun, Potensi dan
Produksi Perikanan, Perdagangan Perikanan, Konsumsi
2.1. Data Sources
Statistics of Marine and Coastal Resources in
2012 is a compilation of primary and secondary data.
The primary data are taken from surveys and censuses
conducted by BPS-Statistics Indonesia; while the
secondary data are taken from central and regional
institutions related to development of marine and
coastal region.
BPS-Statistics Indonesia collecting and compile
the data in some institutions, they are Ministry of
Marine Affairs and Fisheries, Ministry of Home Affairs,
Ministry of Forestry,National Coordination Agency for
Survey and Mapping, Indonesian Institute of Sciences,
Ministry of Energy and Mineral Resource, Ministry of
Transportation, Ministry of Environment, and Ministry of
Education and Culture.
2.2. Method of Dissemination
The 2012 SMCR is eighth edition which
is improvement from previous publications. This
publication is aimed to fulfill the needs of data user,
specifically the needs of statistical data and information
for decision makers and others scientific activities.
Data and information related to marine and
coastal resources are presented at national and
provincial level. This publication is divided into 14 main
topics, that is General Overview of Marine and Coastal
Region, Mangroves, Coral Reefs and Seagrass,
Potency and Production of Fisheries, Fishery Trade,
http://www.bps.go.id
M E T O D O L O G I
S t a t i s t i k S u m b e r D a y a L a u t d a n P e s i s i r 2 0 1 210
Perikanan, Sarana dan Prasarana Transportasi Laut,
Rumah Tangga Perikanan dan Perusahaan Perikanan,
Mineral, Kawasan Konservasi Laut, Kualitas Air Laut,
Tindak Pidana dan Pengawasan Kelautan Perikanan,
Sarana dan Prasaranan Pendidikan, Sarana dan
Prasarana Sosial Ekonomi di Desa Pesisir, serta Nilai
Tukar Petani Subsektor Perikanan.
2.3. Konsep dan Definisi
Konsep dan definisi dalam publikasi ini berasal
dari berbagai sumber. Sumber utama adalah UU No. 27
Tahun 2007 tentang Pengelolaan Wilayah Pesisir dan
Pulau-Pulau Kecil, dan UU No. 45 Tahun 2009 tentang
Perikanan.
1. Abrasi adalah proses pengikisan yang terjadi akibat
ombak/gelombang pantai atau yang juga disebabkan
oleh aktivitas manusia di sekitar wilayah pantai.
2. Baku mutu air laut adalah ukuran batas atau kadar
makhluk hidup, zat, energi atau komponen yang
ada atau harus ada dan/atau unsur pencemar yang
ditenggang keberadaannya di dalam air laut.
3. Biota adalah tumbuhan dan satwa di suatu
kawasan.
4. Budidaya laut adalah cara pemeliharaan hewan
dan tumbuhan laut seperti berbagai jenis ikan
laut, udang-udangan, kerang-kerangan dan
berbagai jenis rumput laut, di suatu tempat dengan
menggunakan metode tertentu.
5. Cadangan mineral adalah konsentrasi komoditi
mineral yang dapat di manfaatkan, serta secara
ekonomis dan hukumiah dapat diproduksi.
Fish Consumption, Marine Transportation Infrastructure,
Fisheries Household and Establishments, Mineral,
Marine Conservation Area, Sea Water Quality, Fisheries
Violation and Marine Affairs and Fisheries Surveillance,
Education Facilities and Infrastructure, Socio-Economic
Infrastructure in Coastal Village, and Fishery Farmer
Terms of Trade.
2.3. Concept and Definition
Concept and definition used in this publication
are taken from several sources. The main source is the
Law of the Republic Indonesia Number 27 year 2007
about Coastal Region and Small Islands Management,
and the Law of the Republic Indonesia Number 45 Year
2009 about Fishery.
1. Abrasion is an eroding process that happened due
to effect of waves or due to human being activities
around coastal region.
2. Seawater quality standardis a parameter of the
limit or degree of creature substances, energy,
or component which exist or must be exist and/or
pollutants whose existence is tolerable in seawater.
3. Biotas are animals and plants that living in an area.
4. Marine culture is a preservation of plants and animals
such as various types of fish, shrimp, crustacean,
and various types of seaweed in some places by
using certain method.
5. Mineral reserve is the concentration of mineral
commodities that can be utilized and can be
produced economically and legally.
http://www.bps.go.id
M E T H O D O L O G Y
S t a t i s t i c s o f M a r i n e a n d C o a s t a l R e s o u r c e s 2 0 1 2 11
6. Proved reserve is a measured mineral resource
which based on mining feasibility study that all
relevant factors have been fulfilled therefore mining
can be done economically.
7. Natural conservation in waters is a natural
preservation area in waters that has specific biota
with its ecosystem, or specific ecosystem that
requires protection.
8. Ebb-tide area (tidal flat) is an area between the
highest tide and the lowest ebb.
9. Marine protected area is a coastal and marine area
covering coral of rock, forest of mangrove, ponder,
or other habitat that has beenprotected part or the
entire enclosed environment by law.
10. Ecosystem is community unity of flora, fauna,
organism, and other non-organism as well as
process that connecting in the form of balance,
stability, and productivity.
11. Mangrove ecosystem is the only one of high level
crop types that very succeeding to inhabit the
intertidal area that is the meeting between sea and
land. Forest of mangrove specifically predominate
seaboard in tropical coastwise until sub-tropics
(Clough, 1982). Mangrove ecosystem have good
function not only from the aspect or ecology value,
environmental, but also social economics, like
maintaining the quality of water in coastal area;
protecting coast through decreasing the affect of
storm, waving, and floods; functioning as area to
stand on place and eat various types of fish (local
6. Cadangan terbukti adalah sumber daya mineral
terukur yang berdasarkan studi kelayakan tambang
semua faktor yang terkait telah terpenuhi, sehingga
penambangan dapat dilakukan secara ekonomik.
7. Cagar alam di perairan adalah kawasan suaka
alam di perairan yang karena keadaan alamnya
mempunyai kekhasan biota tertentu dengan
ekosistemnya, atau ekosistem tertentu yang perlu
dilindungi.
8. Dataran pasang surut adalah daerah yang terletak
diantara pasang tertinggi dan surut terendah.
9. Daerah perlindungan laut adalah daerah pesisir
dan laut yang meliputi terumbu karang, hutan
mangrove, lamun, atau habitat lainnya yang secara
hukum dilindungi sebagian atau semua lingkungan
disekitarnya.
10. Ekosistem adalah kesatuan komunitas tumbuh-
tumbuhan, hewan, organisme dan non organisme
lain serta proses yang menghubungkannya
dalam membentuk keseimbangan, stabilitas, dan
produktivitas.
11. Ekosistem mangrove adalah satu-satunya jenis
tanaman tingkat tinggi yang sangat berhasil
mendiami daerah intertidal yang merupakan
pertemuan antara daratan dan lautan. Hutan
mangrove secara spesifik mendominasi daerah
pesisir di sepanjang pantai tropis sampai sub-tropis
(Clough, 1982). Ekosistem mangrove memiliki
fungsi signifikan baik dilihat dari aspek atau nilai
ekologi, lingkungan, maupun sosial ekonomi, seperti
mempertahan-kan kualitas air di kawasan pantai;
melindungi pantai dengan mengurangi dampak dari
badai, gelombang, dan banjir; berfungsi sebagai
http://www.bps.go.id
M E T O D O L O G I
S t a t i s t i k S u m b e r D a y a L a u t d a n P e s i s i r 2 0 1 212
daerah pemijahan dan tempat makan berbagai
jenis ikan (komersial dan lokal);merupakan tempat
makan berbagai hewan-hewan laut baik yang
bersifat identik maupun pelagis serta berbagai jenis
burung; dan dapat berfungsi sebagai sumber bahan
atau produksi kayu (English et. al., 1997).
12. Garis pantai adalah garis yang dibentuk perpotongan
garis air surut dengan daratan pantai yang dipakai
untuk menetapkan titik terluar di pantai wilayah
laut.
13. Habitat adalah lingkungan fisik, kimia dan biologis
dengan ciri-ciri khusus yang mendukung spesies
atau komunitas biologis tertentu.
14. Ikan adalah segala jenis organisme yang seluruh
atau sebagian dari siklus hidupnya berada di dalam
lingkungan perairan.
15. Jasa lingkungan adalah jasa yang memanfaatkan
fungsi sumber daya pesisir untuk tempat rekreasi
dan pariwisata serta sebagai media transportasi
dan sumber energi gelombang dan lain-lain.
16. Kapal penangkap ikan adalah perahu/kapal yang
digunakan dalam operasi penangkapan ikan/
binatang air lainnya/tanaman air. Kapal pengangkut
tidak termasuk kapal penangkap. Tetapi perahu/
kapal yang digunakan untuk mengangkut nelayan,
alat-alat penangkap dan hasil penangkapan dalam
rangka penangkapan termasuk kapal penangkap
ikan.
17. Kapal penangkap ikan untuk penangkapan di laut
diklasifikasikan sebagai berikut :
(i) Perahu tidak bermotor
a. Jukung
b. Perahu papan
and commercial); is a place to eat various of sea
animals identically or pelagis and also various types
of birds; and can be functioned as materials source
or wood production (English. et.al., 1997).
12. Coastline is line formed by line intersection of low
tide line with coastal land, which used to specify the
outsides point of sea territorial.
13. Habitat is the physical, chemical and biological
environment whose specific characteristics to
support certain species or biological communities.
14. Fish is all kinds of organisms that all or some part of
its life cycle in the water.
15. Environmental service is a service through utilizing
coastal resource’s function for tourism and recreation
as well as a transportation media and source of
waving energy, and others.
16. Capturing fish vessel is a boat/ship used in capturing
fish/other aquatic animals/aquatic plants. Freighter
vessel is not included as capturing fish vessel, but
a vessel that used to carry fishermen, fishing tools,
and capturing result is included as capturing fish
vessels.
17. Capturing fish vessels for capturing fish in the sea
are classified as follows:
(i) Non powered boat
a. Jukung
b. Board boat
http://www.bps.go.id
M E T H O D O L O G Y
S t a t i s t i c s o f M a r i n e a n d C o a s t a l R e s o u r c e s 2 0 1 2 13
• small (the largest boat length less than 7
meters)
• medium (the largest boat length from 7 to 10
meters)
• big (the largest boat length is 10 meters or
more)
(ii) Outboard motor
(iii) Motorboat
• < 5 GT • 100-200 GT
• 50-10 GT • 200-300 GT
• 10-20 GT • 300-500 GT
• 20-30 GT • 500-1000 GT
• 30-50 GT • 1000 GT and above
• 50-100 GT
18. Coral is a coelenterate animal that able or disable to
form chalk frame.
19. Region or area is a part of the coastal and small
islands region which has a specific function based
on criteria of physical, biological, social, and
economic characte-ristics, and needs to maintain
their existence.
20. Culture area is a specified area with main function for
the activity of culture for certain type of biota based
on potency and condition of natural resources,human
resources, and man-made resources.
21. Conservation area is a part of coastal areas and
small islands that has a particular characteristic as
a whole sustainable protected, preserved and/or
utilized ecosystem in order to achieve sustainable
management of coastal areas and small islands.
• kecil (perahu yang terbesar panjangnya
kurang dari 7 meter)
• sedang (perahu yang terbesar panjangnya
dari 7 - 10 meter)
• besar (perahu yang terbesar panjangnya 10
meter atau lebih)
(ii) Perahu motor tempel
(iii) Kapal motor
• < 5 GT • 100 – 200 GT
• 5 – 10 GT • 200 – 300 GT
• 10 – 20 GT • 300 – 500 GT
• 20 – 30 GT • 500 – 1000 GT
• 30 – 50 GT • 1000 GT ke atas
• 50 – 100 GT
18. Karang/Corals adalah termasuk hewan coelenterata
yang dapat atau tidak dapat membentuk rangka
kapur.
19. Kawasan adalah bagian wilayah pesisir dan pulau-
pulau kecil yang memiliki fungsi tertentu yang
ditetapkan berdasarkan kriteria karakteristik fisik,
biologi, sosial, dan ekonomi untuk dipertahankan
keberadaannya.
20. Kawasan budidaya adalah kawasan yang ditetapkan
dengan fungsi utama untuk kegiatan budidaya dari
jenis biota tertentu atas dasar kondisi dan potensi
sumber daya alam, sumber daya manusia, dan
sumber daya buatan.
21. Kawasan konservasi adalah bagian wilayah pesisir
dan pulau-pulau kecil yang mempunyai ciri khas
tertentu sebagai satu kesatuan ekosistem yang
dilindungi, dilestarikan dan/atau dimanfaatkan
secara berkelanjutan untuk mewujudkan penge-
lolaan wilayah pesisir dan pulau-pulau kecil secara
berkelanjutan.
http://www.bps.go.id
M E T O D O L O G I
S t a t i s t i k S u m b e r D a y a L a u t d a n P e s i s i r 2 0 1 214
22. Kawasan lindung adalah kawasan yang ditetapkan
dengan fungsi utama melindungi kelestarian
lingkungan hidup yang mencakup sumber daya
alam dan sumber daya buatan.
23. Kawasan pesisir adalah daerah peralihan antara
ekosistem darat dan laut yang dipengaruhi oleh
perubahan di darat dan laut. Menurut Bengen
(2001), dari batas wilayah pesisir ke daerah laut
adalah daerah-daerah yang masih dipengaruhi oleh
proses-proses alami di daratan seperti sedimentasi
dan aliran air tawar ke laut serta wilayah laut yang
masih dipengaruhi oleh kegiatan-kegiatan manusia
di daratan. Sedangkan dari batas wilayah pesisir
ke arah daratan meliputi daerah-daerah yang
tergenang air atau yang masih dipengaruhi oleh
proses-proses laut seperti pasang surut, angin laut
dan intrusi air laut.
24. Kepulauan adalah gugusan pulau, termasuk bagian
pulau, perairan diantaranya, dan wujud alamiah
lainnya yang satu sama lainnya mempunyai
hubungan erat, satu kesatuan geografis, ekonomis,
dan politis yang hakiki, dan secara historis dianggap
demikian.
25. Konservasi laut adalah pengelolaan sumber daya
alam hayati laut yang pemanfaatannya dilakukan
secara bijaksana untuk menjamin kesinambungan
persediaannya dengan tetap memelihara dan
meningkatkan kualitas keanekaragaman dan
nilainya, serta merehabilitasi sumber daya alam laut
yang rusak.
26. Laut lepas adalah bagian dari laut yang tidak
termasuk dalam Zona Ekonomi Ekslusif Indonesia
(ZEEI), laut teritorial Indonesia, perairan kepulauan
22. Protected area is a specified area with main function
to keep the environment sustainably that included
natural resources and man-made resources.
23. Coastal area is a transition area between land and
ocean ecosystem that affected by changes in land
and ocean. According to Bengen (2001), from the
boundary of coastal area towards the sea are the
areas which are still influenced by natural processes
in land such as sedimentation and the stream of
fresh water to the sea, and the sea area which are
still influenced by human activities in the land. While,
from the boundary of coastal area towards the land
are the areas which filled by water or still influenced
by sea processes like ebb-tide, sea breeze and sea-
water intrusion.
24. Archipelago is a group of islands, including part
of island, territorial water surroundings, and other
natural form which one to another have a close
relationship; one geographical unity, economic, and
authentic political, and historically assumed that
way.
25. Marine conservation is a management of marine
natural resources which the exploitation is conducted
wisely to guarantee the continuity of its supply by
keeping preserve and improve the quality of diversity
and its value, also rehabilitate the damage of marine
natural resources.
26. Open sea is a part of the sea that is not included
in Exclusive Economic Zone of Indonesia (ZEEI),
territorial sea of Indonesia, archipelagic waters of
http://www.bps.go.id
M E T H O D O L O G Y
S t a t i s t i c s o f M a r i n e a n d C o a s t a l R e s o u r c e s 2 0 1 2 15
Indonesia, dan perairan pedalaman Indonesia.
27. Laut teritorial Indonesia adalah jalur laut selebar 12
(dua belas) mil laut yang diukur dari garis pangkal
kepulauan Indonesia.
28. Lingkungan hidup adalah kesatuan ruang dengan
semua benda, daya, keadaan, dan makhluk
hidup termasuk manusia dan perilakunya yang
mempengaruhi alam itu sendiri, kelangsungan
perikehidupan, dan kesejahteraan manusia serta
makhluk hidup lain.
29. Nelayan adalah orang yang mata pencahariannya
melakukan penangkapan ikan.
30. Nelayan kecil adalah orang yang mata
pencahariannya melakukan penangkapan ikan
untuk memenuhi kebutuhan hidup sehari-hari
dengan menggunakan kapal perikanan berukuran
paling besar 5 (lima) gross ton (GT).
31. Nelayan penuh adalah nelayan yang seluruh waktu
kerjanya digunakan untuk melakukan pekerjaan
operasi penangkapan ikan/binatang air lainnya/
tanaman air .
32. Nelayan sambilan utama adalah nelayan yang
sebagian besar waktu kerjanya digunakan untuk
melakukan pekerjaan operasi penangkapan ikan/
binatang air lainnya/tanaman air. Di samping
melakukan pekerjaan penangkapan, nelayan
kategori ini dapat pula mempunyai pekerjaan lain.
33. Nelayan sambilan tambahan adalah nelayan yang
sebagian kecil waktu kerjanya digunakan untuk
melakukan pekerjaan penangkapan ikan.
34. Padang lamun ditemukan hidup pada perairan
dangkal, perairan pantai bersubstrat lunak dan
terlindung pada daerah estuaria. Padang lamun
Indonesia, and depth waters of Indonesia.
27. Territorial sea of Indonesia is the sea-lane with 12
(twelve) nautical miles width measured from the
baseline of the Indonesian archipelago.
28. Environment is space unity with all things, energy,
condition and creature including human and
their behavior that influences the human-being
sustainability and other creature’s welfare.
29. Fishersare the person whose livelihood is fishing.
30. Small fishers are a person whose livelihood is
fishing to meet the daily life’s needs. He uses the
vessel with the largest size around 5 (five) gross
tons (GT).
31. Full time fishers arefishers who use whole work time
to catch fish/other aquatic animals/aquatic plants.
32. Major part time fishersare fishers who uses most of
his work time to catch fish/other aquatic animals/
aquatic plants. This fishers type may have other
jobs.
33. Minor part time fishersare fisherswho uses small of
his work time to catch fish.
34. Seagrass are founded live in shallow water,
coastal water with soft substrate and protected in
an estuarial area. Seagrass has an important role
http://www.bps.go.id
M E T O D O L O G I
S t a t i s t i k S u m b e r D a y a L a u t d a n P e s i s i r 2 0 1 216
memiliki peranan penting dalam ekosistem pantai,
selain berfungsi sebagai tempat berlindungnya
larva ikan dan biota laut lainnya, juga sebagai
daerah mencari makanan ikan dan udang (den
Hartog, 1970; Stevenson, 1988). Padang lamun
juga berperan dalam melindungi pantai dan abrasi,
karena daun dan batang tumbuhan ini dapat
meredam ombak dan memperlambat aliran arus
(Scoffin, 1970; Fonseca et.al., 1982).
35. Partisipasi masyarakat adalah keterlibatan
masyarakat lokal dalam kegiatan pengelolaan
sumber daya wilayah pesisir.
36. Pelabuhan adalah tempat yang terdiri dari daratan
dan perairan di sekitarnya dengan batas-batas
tertentu sebagai tempat kegiatan pemerintahan
dan kegiatan ekonomi yang dipergunakan
sebagai tempat kapal bersandar, berlabuh, naik
turun penumpang dan atau bongkar muat barang
yang dilengkapi dengan fasilitas keselamatan
pelayaran dan kegiatan penunjang pelabuhan serta
sebagai tempat perpindahan intra dan antar moda
transportasi.
37. Pelabuhan perikanan adalah tempat yang terdiri
atas daratan dan perairan di sekitarnya dengan
batas-batas tertentu sebagai tempat kegiatan
pemerintahan dan kegiatan sistem bisnis perikanan
yang digunakan sebagai tempat kapal perikanan
bersandar, berlabuh, dan/atau bongkar muat ikan
yang dilengkapi dengan fasilitas keselamatan
pelayaran dan kegiatan penunjang perikanan.
38. Pelabuhan perikanan tipe A atau Pelabuhan
Perikanan Samudera (PPS) adalah pelabuhan
perikanan yang diperuntukkan terutama bagi
in coastal ecosystem, besides functioning as the
shelter place of fish larva and other biota of sea,
also as an area to look for fish food and prawn (den
Hartog, 1970; Stevenson, 1988). Sea-grass is also
protecting coastal from abrasion, because the stem
and leaf of this plant can weaken wave and slow
down current stream (Scoffin, 1970; Fonseca et.al.,
1982).
35. Community participation is an involvement of local
community in activity for managing coastal area
resources.
36. Port is a place that consists of the mainland and
surrounding waters with certain limits as a place of
government activity and economic activity which is
used as a shipping dock, docked, load and unload
passengers and goods and equipped with safety
facilities, and have port supporting activities. The
port is also a place for transferring intra and inter-
transportation device
37. Fishing port is a place that consists of land and
surrounding waters with certain limits as a place of
government activity and the activities of fisheries
business system that is used as a place fishing
boats to dock, anchor, and or loading and unloading
of fish that are equipped with facilities supporting
the safety of shipping and fishing activities.
38. Fishing port type A or ocean fishing port(PPS) is a
fishing port which is intended primarily for fishing
vessels operating in Indian waters, commonly
http://www.bps.go.id
M E T H O D O L O G Y
S t a t i s t i c s o f M a r i n e a n d C o a s t a l R e s o u r c e s 2 0 1 2 17
kapal-kapal perikanan yang beroperasi di perairan
Samudera yang lazim digolongkan ke dalam
armada perikanan jarak jauh sampai perairan
Zona Ekonomi Ekslusif Indonesia dan perairan
internasional, mempunyai perlengkapan untuk
menangani dan mengolah sumber daya ikan sesuai
dengan kapasitasnya yaitu jumlah hasil ikan yang
didaratkan.
39. Pelabuhan perikanan tipe B atau Pelabuhan
Perikanan Nusantara (PPN) adalah pelabuhan
perikan-an yang diperuntukkan bagi kapal-kapal
perikanan yang beroperasi di perairan Nusantara
yang lazim digolongkan ke dalam armada perikanan
jarak jauh sampai perairan Zona Ekonomi Ekslusif
Indonesia, mempunyai perlengkapan untuk
menangani dan atau mengolah ikan sesuai
dengan kapasitasnya yaitu jumlah hasil ikan yang
didaratkan.
40. Pelabuhan perikanan tipe C atau Pelabuhan
Perikanan Pantai (PPP) adalah pelabuhan
perikanan yang diperuntukkan yang beroperasi di
perairan pantai, mempunyai perlengkapan untuk
menangani dan atau mengolah ikan sesuai dengan
kapasitasnya.
41. Pelabuhan perikanan tipe D atau Pangkalan
Pendaratan Ikan (PPI) adalah pangkalan untuk
pendaratan ikan hasil tangkapan nelayan berskala
lebih kecil daripada pelabuhan perikanan pantai
ditinjau dari kapasitas penanganan jumlah produksi
ikan, maupun fasilitas dasar dan perlengkapannya.
PPI dimaksudkan sebagai prasarana pendaratan
ikan yang dapat menangani produksi ikan sampai
dengan 5 ton per hari.
classified into long-distance fishing fleet until
Exclusive Economic Zone of Indonesia and
international waters, have the equipment to handle
and process the fish resources in accordance with
its capacity is number of fish landed.
39. Fishing port type B or nusantara fishery port (PPN)
is a fishing port which is applied to fishing vessels
operating in waters of the archipelago are commonly
classified into long-distance fishing fleet until the
waters Exclusive Economic Zone of Indonesia, has
the equipment to handle and/or fish processing
capacity in accordance with the number of fish
landed.
40. Fishing port type C or coastal fishery port (PPP) is
a dedicated fisheries operating in coastal waters,
have the equipment to handle and process the fish
or in accordance with its capacity.
41. Fishing port type D or fish landing (PPI) is the base
for the landing of the fish-scale fishermen smaller
than observed from shore fishery port handling
capacity of fish production, and basic facilities
and equipment. PPI is meant as a fish landing
infrastructure that can handle the production of fish
up to 5 tons per day.
http://www.bps.go.id
M E T O D O L O G I
S t a t i s t i k S u m b e r D a y a L a u t d a n P e s i s i r 2 0 1 218
42. Fish aquaculture farmer is a person who actively
engaged in cultivation of fishes/other aquatic
animals/aquatic plants.
43. Capture is an activity to catch or collect fishes/other
aquatic animals/aquatic plants that grow naturally in
inland openwater/marineareas and no belong to the
property of any person.
44. Coastal pollution is an entry of living things, matter,
energy, and or other components into the coastal
environment caused by human activities, and it
makes the quality of coastal down to a certain level
which causes the coastal environment cannot be
functioned as its purpose.
45. Fisheries management is all the efforts, including
an integrated process of information collection,
analysis, planning, consultation, decision making,
allocation of fish resources, and imple-mentation
and legislation enforcement in the field of fisheries,
conducted by the government or other authority
which is aimed at achieving sustainable productivity
of aquatic biological resources and the agreed
objectives.
46. Management of coastal zones and small islands
is a process of planning, utilization, supervision
and control of coastal resources and small
islands inter sector between the government
and local government, between terrestrial and
marine ecosystems, as well as between science
and management to improve the welfare of the
community.
47. The average expenditure per capita is the cost
42. Pembudidaya ikan adalah orang yang secara aktif
melakukan pekerjaan dalam kegiatan budidaya
ikan/binatang air lainnya/tanaman air.
43. Penangkapan adalah kegiatan menangkap atau
mengumpulkan ikan/binatang air lainnya/tanaman
air yang hidup di laut/perairan umum secara bebas
dan bukan milik perseorangan.
44. Pencemaran pesisir adalah masuknya atau
dimasukkannya makhluk hidup, zat, energi, dan/
atau komponen lain ke dalam lingkungan pesisir
akibat adanya kegiatan manusia sehingga kualitas
pesisir turun sampai ke tingkat tertentu yang
menyebabkan lingkungan pesisir tidak dapat
berfungsi sesuai dengan peruntukannya.
45. Pengelolaan perikanan adalah semua upaya,
termasuk proses yang terintegrasi dalam
pengumpulan informasi, analisis, perencanaan,
konsultasi, pembuatan keputusan, alokasi sumber
daya ikan, dan implementasi serta penegakan
hukum dari peraturan perundang-undangan di
bidang perikanan, yang dilakukan oleh pemerintah
atau otoritas lain yang diarahkan untuk mencapai
kelangsungan produktivitas sumber daya hayati
perairan dan tujuan yang telah disepakati.
46. Pengelolaan wilayah pesisir dan pulau-pulau kecil
adalah suatu proses perencanaan, pemanfaatan,
pengawasan, dan pengendalian sumber daya
pesisir dan pulau-pulau kecil antar sektor, antara
pemerintah dan pemerintah daerah, antara
ekosistem darat dan laut, serta antara ilmu
pengetahuan dan manajemen untuk meningkatkan
kesejahteraan masyarakat.
47. Pengeluaran rata-rata per kapita adalah biaya yang
http://www.bps.go.id
M E T H O D O L O G Y
S t a t i s t i c s o f M a r i n e a n d C o a s t a l R e s o u r c e s 2 0 1 2 19
dikeluarkan untuk konsumsi semua anggota rumah
tangga selama sebulan dibagi dengan banyaknya
anggota rumah tangga. Pengeluaran untuk
konsumsi makanan dihitung selama seminggu
yang lalu selanjutnya dikonversikan ke dalam
pengeluaran rata-rata sebulan.
48. Perikanan adalah semua kegiatan yang berhubungan
dengan pengelolaan dan pemanfaatan sumber daya
ikan dan lingkungannya mulai dari praproduksi,
produksi, pengolahan sampai dengan pemasaran
yang dilaksanakan dalam suatu sistem bisnis
perikanan.
49. Perikanan budidaya adalah kegiatan ekonomi
dalam bidang budidaya ikan/binatang air lainnya/
tanaman air.
50. Perusahaan perikanan budidaya adalah unit
ekonomi berbadan hukum yang melakukan kegiatan
budidaya ikan/binatang air lainnya/tanaman air
dengan tujuan sebagian/seluruh hasilnya untuk
dijual.
51. Perusahaan perikanan tangkap adalah unit ekonomi
berbadan hukum yang melakukan kegiatan
penangkapan ikan/binatang air lainnya/tanaman
air dengan tujuan sebagian/seluruh hasilnya untuk
dijual.
52. Pulau adalah daerah daratan yang terbentuk secara
alamiah yang dikelilingi air.
53. Pulau kecil adalah pulau dengan luas lebih kecil
atau sama dengan 2.000 km2 beserta kesatuan
ekosistemnya.
54. Rehabilitasi adalah kegiatan untuk memperbaiki
kondisi yang rusak kepada keadaan semula.
55. Rumah tangga perikanan budidaya adalah rumah
incurred for the consumption of all household
members during the month divided by the number
of household mem-bers. Expenditures for food
consumption is calculated over a week ago then
converted into an average monthly expenditure.
48. Fisheries is all activities related to the management
and utilization of fish resources and its environment
from preproduction, production, processing up to
marketing which conducted in a fisheries business
systems.
49. Aquaculture is an economic activity on cultivating
fish/other aquatic animals/ aquatic plants.
50. Culture fisheriescompany is an economy unit under
the laws which conducts cultivate fishes/other
aquatic animals/aquatic plants, and some part or all
the results is to be sold.
51. Capturefisheries companyis an economy unit under
the law that conductscatching fishes/other aquatic
animals/aquatic plants, and some part or all the
results are to be sold.
52. The island is an area of land that formed naturally
and surrounded by water.
53. Small island is an island with an area less than
or equal to 2,000 square km along with the
ecosystem.
54. Rehabilitation is an activity to repair damage
condition back to the original situation.
55. Marine culture fisheries households are households
http://www.bps.go.id
M E T O D O L O G I
S t a t i s t i k S u m b e r D a y a L a u t d a n P e s i s i r 2 0 1 220
engaged in aquaculture/other aquatic animals/
aquatic plants activity, and sell some or all of its
results.
56. Marine capture fisheries households are households
engaged in capturing fish/ aquatic animals/aquatic
plants activity and sell some or all of its results. This
activity can be done by the household alone, by
members of the household and its worker, or by the
worker alone. Therefore fishery household is also an
economic unit as well as fisheries company. Both of
those economic units are often written as one form
i.e. households fisheries/fisheries company(RTP/
PP).
57. Sanitation is a process to maintain the environment
to be clean and hygiene.
58. Border coastal is the land of a width proportional
to the shape and physical condition of the beach,
at least 100 meters from the highest tide point
landward.
59. Coastal resources are natural resources, man-
made resources, and environmental services in the
coastal area. Natural resources consist of biological
resources and non-biological resources. Biological
resources, for example are fish, seaweed, lamun
field, mangrove, and coral, territorial water biota;
while non biological resources is consist of sand
farm, surface of the water, resources in water, and
in sea base like gas and oil, sand, tin, and other
minerals.
60. Afish carrier vessel permit (SIKPI) is a written
permission that must be owned by a fishing vessel
to carry fish.
tangga yang melakukan kegiatan budidaya ikan/
binatang air lainnya/tanaman air dengan tujuan
sebagian/seluruh hasilnya untuk dijual.
56. Rumah tangga perikanan tangkap adalah rumah
tangga yang melakukan kegiatan penangkapan
ikan/binatang air lainnya/tanaman air dengan tujuan
sebagian/seluruh hasilnya untuk dijual. Kegiatan ini
dapat dilakukan oleh rumah tangga tersebut saja,
oleh anggota rumah tangga tersebut bersama-
sama tenaga buruh, atau oleh tenaga buruh saja.
Jadi rumah tangga perikanan adalah unit ekonomi.
Oleh karena itu dalam penulisannya kedua bentuk
unit ekonomi tersebut sering disatukan menjadi
rumah tangga perikanan/perusahaan per-ikanan
(RTP/PP).
57. Sanitasi adalah proses yang dilakukan untuk
menjaga agar lingkungan tetap bersih dan sehat.
58. Sempadan pantai adalah daratan sepanjang tepian
yang lebarnya proporsional dengan bentuk dan
kondisi fisik pantai, minimal 100 meter dari titik
pasang tertinggi ke arah darat.
59. Sumber daya pesisir adalah sumber daya alam,
sumber daya buatan, dan jasa-jasa lingkungan yang
terdapat di wilayah pesisir. Sumber daya alam terdiri
atas sumber daya hayati dan non hayati. Sumber
daya hayati antara lain ikan, rumput laut, padang
lamun, hutan mangrove, dan terumbu karang, biota
perairan; sedangkan sumber daya non hayati terdiri
dari lahan pasir, permukaan air, sumber daya di
airnya, dan di dasar laut seperti minyak dan gas,
pasir, timah, dan mineral lainnya.
60. Surat Izin Kapal Pengangkut Ikan (SIKPI) adalah izin
tertulis yang harus dimiliki setiap kapal perikanan
untuk melakukan pengangkutan ikan.
http://www.bps.go.id
M E T H O D O L O G Y
S t a t i s t i c s o f M a r i n e a n d C o a s t a l R e s o u r c e s 2 0 1 2 21
61. A fishing permit (SIPI) is a written permission that
must be owned by a fishing vessel to catching fish,
and its an integral part of SIUP.
62. Fisheries business license (SIUP) is a written
permission that must be owned by fishing companies
to conduct fishing operations using production
facilities specified in the license.
63. Coral reef is an aragonite structures produced
by living organism, which is an erosion-resistant
marine. Coral reef is found in shallow and tropical
marine.
64. Exclusive Economic Zone of Indonesia is a point
beyond and adjacent to the territorial sea of
Indonesia as defined under the applicable laws
concerning Indonesian waters which include the
seabed, subsoil, and water with the outer boundary
200 nautical miles measured from the Indonesian
territorial sea baseline.
61. Surat Izin Penangkapan Ikan (SIPI) adalah izin
tertulis yang harus dimiliki setiap kapal perikanan
untuk melakukan penangkapan ikan yang
merupakan bagian tidak terpisahkan dari SIUP.
62. Surat Izin Usaha Perikanan (SIUP) adalah izin
tertulis yang harus dimiliki perusahaan perikanan
untuk melakukan usaha perikanan dengan
menggunakan sarana produksi yang tercantum
dalam izin tersebut.
63. Terumbu karang adalah struktur yang mengandung
mineral carbon, yang di produksi oleh biota laut dan
tahan terhadap gempuran ombak. Terumbu karang
ditemukan di laut dangkal di daerah tropis.
64. Zona Ekonomi Eksklusif Indonesia (ZEEI) adalah
jalur di luar dan berbatasan dengan laut teritorial
Indonesia sebagaimana ditetapkan berdasarkan
undang-undang yang berlaku tentang perairan
Indonesia yang meliputi dasar laut, tanah di
bawahnya, dan air di atasnya dengan batas terluar
200 mil laut yang diukur dari garis pangkal laut
teritorial Indonesia
http://www.bps.go.id

http://www.bps.go.id
http://www.bps.go.id

http://www.bps.go.id
S TAT I S T I C S O F M A R I N E A N D C O A S TA L R E S O U R C E S
S t a t i s t i c s o f M a r i n e a n d C o a s t a l R e s o u r c e s 2 0 1 2 25
3.1. Gambaran Umum Wilayah Laut dan Pesisir
Indonesia adalah negara kepulauan yang
dipersatukan oleh wilayah lautan. Secara geografis,
Indonesia terletak di sekitar garis khatulistiwa antara
94°45´ BT – 141°01´ BT dan 06°08´ LU – 11°05´ LS.
Luas seluruh wilayah teritorial Indonesia adalah 7,7
juta km2. Luas wilayah perairan mencapai 5,8 juta km2
atau sama dengan ¾ dari luas wilayah Indonesia. Luas
perairan tersebut terdiri dari Zona Ekonomi Eksklusif
(ZEE) 2,7 juta km2, laut nusantara 2,3 juta km2 dan
perairan territorial 0,8 juta km2. Luas wilayah perairan
Indonesia tersebut telah diakui oleh United Nation
Convention of The Sea (UNCLOS, 1982).
Pesisir adalah daerah pertemuan antara daratan
dan lautan; ke arah darat wilayah pesisir meliputi bagian
daratan, baik kering maupun terendam air yang masih
dipengaruhi sifat-sifat laut seperti pasang surut, angin
laut, dan perembesan air asin; ke arah laut wilayah
pesisir mencakup bagian laut yang masih dipengaruhi
oleh proses-proses alami yang terjadi di daratan
seperti sedimentasi dan aliran air tawar, maupun yang
disebabkan oleh kegiatan manusia. Dalam konteks
ekologis wilayah pesisir dapat mencakup daerah
pedalaman pesisir, daerah rendah, perairan pesisir, dan
laut dalam sampai dengan Zona Ekonomi Eksklusif yang
diantaranya mempunyai hubungan saling keterkaitan
satu dengan lainnya (Afifi, 2000).
Wilayah pesisir memiliki arti penting dan
strategis bagi Indonesia, baik dari segi ekologis,
3.1. General Overview of Marine and Coastal
Region
Indonesia is an archipelago country which
united by the oceans. Geographically, Indonesia
is located around the equator line, from 94°45´to
141°01´east longitude and from 06°08´north latitude
to 11°05´ south latitude.Territorial area of Indonesia is
7.7 million square kilometers (km2). The oceanwaters
area approximately 5.8 million km2 or equal to ¾ of
the total area of Indonesia. Ocean waters area consist
of 2.7 million km2 of Exclusive Economic Zone (EEZ),
2.3 million km2 of archipelagic waters and 0.8 million
km2 of territorial waters. The total area of Indonesian
ocean region has been recognized by the United Nation
Convention of The Sea (UNCLOS, 1982).
The coastal area is defined as the meeting
area between land and sea; landward coastal areas
include parts of the mainland, either dry or submerged
in water, which is still influenced by the properties of the
sea like tides, sea wind and salt water infiltration; in the
direction of coastal marine includes part of the sea that
is still influenced by the natural processes that occur
on the mainland such as sedimentation and freshwater
streams, as well as those caused by human activities.
In the ecological context, coastal areas includes coastal
inland areas, low areas, coastal waters, and sea through
the Exclusive Economic Zone, which includes related
interplay with one another (Afifi, 2000).
Coastal areas have strategic and important
role for Indonesia, in the term of ecological, food
http://www.bps.go.id
S TAT I S T I K S U M B E R D AYA L A U T D A N P E S I S I R
S t a t i s t i k S u m b e r D a y a L a u t d a n P e s i s i r 2 0 1 226
ketahanan pangan, ekonomi, keanekaragaman biologi,
sosial budaya maupun keindahan alamnya, serta
pencegahan terhadap erosi/abrasi, gelombang laut
dan badai. Hanya saja, wilayah pesisir dan pulau-pulau
kecil di Indonesia dewasa ini sangat rentan terhadap
perubahan alam, baik karena alam itu sendiri maupun
akibat ulah manusia (man-made disasters).
Perairan di Indonesia terkenal dengan kekayaan
dan keanekaragaman sumber daya alamnya, seperti
perikanan, hutan mangrove, terumbu karang, minyak
dan gas bumi, serta bahan tambang lainnya. Secara
ekologis, Indonesia memiliki kekayaan keanekaragaman
hayati yang tinggi dan unik yang tidak dimiliki negara
lain. Kondisi ini memberikan konsekuensi agar kita
mengelola kekayaan alam ini dengan lebih bijaksana
karena keanekaragaman hayati sangat rentan terhadap
perubahan lingkungan, baik yang terjadi di wilayah
daratan maupun wilayah lautan.
Sebagai negara kepulauan terbesar di dunia,
Indonesia memiliki potensi sumber daya perairan dan
kelautan yang melimpah. Wilayah Indonesia terdiri atas
lima pulau besar yaitu Sumatera, Jawa, Kalimantan,
Sulawesi dan Papua. Indonesia memiliki kurang lebih
17.504 pulau dengan luas daratan sekitar 1,9 juta km2.
Wilayah tersebut dibagi menjadi 78.609 desa, 6.771
kecamatan, 497 kabupaten, dan 33 provinsi (Tabel 3.1).
Menurut koreksi PBB tahun 2008, Indonesia merupakan
negara berpantai terpanjang keempat di dunia setelah
Amerika Serikat (AS), Kanada, dan Rusia. Panjang
garis pantai Indonesia tercatat sebesar 95.181 km.
Desa pesisir adalah desa yang memiliki batas
langsung dengan laut atau desa yang memiliki pantai.
security, economics, biological diversity, socio-cultural
and natural beauty, as well as prevention of erosion/
abrasion, wave and storm. However, coastal areas
and small islands in Indonesia nowadays are in very
vulnerable condition due to natural change which cause
by natural process or due to human activities (man-
made disasters).
Indonesian waters are famous for its richness
and diversity for natural resources, such as fisheries,
mangroves, coral reefs, oil and gas, and other mining
material. Ecologically, Indonesia poses a unique and
rich of biodiversity resources compare to other country.
This condition gives us the consequences for managing
this natural wealth more wisely. Biodiversity is very
vulnerable to environmental changes, whether in the
mainland or in the sea.
As the world’s largest archipelago nation,
Indonesia also poses a huge potential of aquatic and
marine resources. The Indonesian territory had five
major islands, that are Sumatera, Java, Kalimantan,
Sulawesi, and Irian Jaya. Indonesia approximately had
17,504 islands. Total of land area approximately 1.9
million km2. The region is divided into 78,609 villages,
6,771 sub-district, 497 districts, and 33 provinces (Table
3.1). According to the 2008 United Nations correction,
Indonesia is also a country with a long coastline of the
fourth in the world after United States, Canada, and
Russia. Long coastline of Indonesia was recorded at
95,181 km.
Coastal village is the village that have a direct
border with ocean or villages that have a beach.
http://www.bps.go.id
S TAT I S T I C S O F M A R I N E A N D C O A S TA L R E S O U R C E S
S t a t i s t i c s o f M a r i n e a n d C o a s t a l R e s o u r c e s 2 0 1 2 27
According to BPS PODES, from 78,609 village in 2011,
about 11,884 villages or 15.12 percen from the total
villages is coastal villages. Province of Kepulauan Riau
has the most percentage of the coastal villages of 353
villages in the province, 84.70 percent were coastal
villages. The province with the lowest percentage of the
coastal village located in province of Sumatera Selatan
about 1.07 percent (Table 3.2).
According to Ministry of Marine Affairs and
Fisheries, there are currently 17,504 islands. While
according to Ministrial of Home Affairs, the number of
island in 2003 was 17,508 islands. Reduced number of
these islands because there are 4 islands became a part
of other countries, i.e. Sigitan Island, Sipadan Island,
Kambing Island (Atauro Island), and Yako Island. For
identification purpose, the island was named nationally.
Up to 2010, the number of islands that had been given
named reaches 7,870 while 9,634 other islands have
not been given a name. Actually, all of the islands
already had a local name (Table 3.4).
The existence of small outlying islands
(PPKT) are vital role within the framework of national
sovereignty. Based on Table 3.6, there are 92 PPKT
in Indonesia that are spread in 18 provinces. From 92
PPKT, there are 9 PPKT has borderline with the seas
and 83 PPKT has borderline with neighboring countries,
there are : Malaysia (20), Malaysia and Singapura (4),
Malaysia and Vietnam (1), Singapura (2), Vietnam (1),
Australia (25), Australia and Timor Leste (1), Timor
Leste (6), India (3), India and Thailand (1), Filipina (11)
and Palau (8).
Berdasarkan data dari PODES BPS, dari 78.609 desa
pada tahun 2011, 11.884 desa atau sekitar 15,12
persen merupakan desa pesisir. Provinsi Kepulauan
Riau mempunyai persentase desa pesisir paling
banyak yaitu dari 353 desa di provinsi tersebut, 84,70
persennya merupakan desa pesisir. Provinsi dengan
persentase desa pesisir terendah terdapat di Provinsi
Sumatera Selatan sebesar 1,07 persen (Tabel 3.2).
Berdasarkan data dari Kementerian Kelautan
dan Perikanan, jumlah pulau di Indonesia tercatat
sebesar 17.504 pulau. Menurut Kementerian Dalam
Negeri, jumlah pulau pada tahun 2003 adalah 17.508
pulau. Berkurangnya jumlah pulau ini, karena ada 4
pulau yang menjadi wilayah negara lain yaitu Pulau
Sigitan, Pulau Sipadan, Pulau Kambing (Pulau Atauro),
dan Pulau Yako. Untuk identifikasi pulau, maka pulau-
pulau itu diberi nama secara nasional. Sampai dengan
tahun 2010, hanya 7.870 pulau sudah mempunyai
nama, sedangkan 9.634 pulau lainnya belum memiliki
nama. Walaupun sebenarnya semua pulau sudah
mempunyai nama lokal (Tabel 3.4).
Keberadaan Pulau-Pulau Kecil Terluar (PPKT)
sangat vital dalam kerangka kedaulatan negara.
Berdasarkan Tabel 3.6, terdapat 92 PPKT di Indonesia
yang tersebar di 18 provinsi. Dari 92 PPKT tersebut,
9 PPKT berbatasan dengan laut lepas dan 83 PPKT
berbatasan langsung dengan negara tetangga yaitu:
Malaysia (20), Malaysia dan Singapura (4), Malaysia
dan Vietnam (1), Singapura (2), Vietnam (1), Australia
(25), Australia dan Timor Leste (1), Timor Leste (6),
India (3), India dan Thailand (1), Filipina (11) dan Palau
(8).
http://www.bps.go.id
S TAT I S T I K S U M B E R D AYA L A U T D A N P E S I S I R
S t a t i s t i k S u m b e r D a y a L a u t d a n P e s i s i r 2 0 1 228
Menurut Kepala Dinas Penerangan TNI AL
(Kadispenal), terdapat 12 PPKT yang memerlukan
perhatian khusus karena rawan memicu konflik
perbatasan dengan negara tetangga. Potensi ini
disebabkan karena masih adanya beberapa masalah di
wilayah perbatasan, seperti belum ditetapkannya batas
wilayah tiap negara di antara Indonesia dengan negara
tetangga. Disamping rawan memicu konflik, pulau-
pulau tersebut juga berfungsi sebagai titik referensi
untuk penetapan dasar pada penarikan batas wilayah
Indonesia dengan negara lain. Kedua belas pulau
tersebut adalah Pulau Rondo, Berhala, Nipa, Sekatung,
Marore, Marampit, Miangas, Fanildo, Bras, Fani, Batek
dan Rote.
Terbatasnya sumber daya manusia, infrastuktur
sosial, ekonomi dan komunikasi serta ketimpangan
perekonomian masyarakat lokal dengan negara
tetangga menyebabkan pulau-pulau tersebut menjadi
daerah tertinggal. Bahkan, untuk memenuhi kebutuhan
pokok dan kebutuhan rumah tangga, penduduk di
PPKT lebih memilih membeli di negara tetangga. Hal
ini disebabkan akses ke negara tetangga lebih mudah.
Ikatan emosional warga yang terjalin karena hubungan
personal secara kontinu dengan negara tetangga
berpotensi terhadap degradasi idiologi. Oleh kerena
itu, upaya pengelolaan untuk meningkatkan keadaan
sosial, budaya, dan ekonomi masyarakat yang tinggal
di pulau tersebut perlu dilakukan demi keberlangsungan
kedaulatan negara.
According to Navy Chief Information Office
(Kadispenal), 12 PPKT required special concern
because it susceptible to trigger a border conflict
with neighboring countries. The threat is due to latent
problems in border region, such as the absence of
agreement regarding the borderline between Indonesia
and neighboring countries. Besides triggering the border
conflict, these islands also serve as a reference point for
basis determining in establishing boundaries between
Indonesia region and other countries. The twelve islands
are Rondo, Berhala, Nipa, Sekatung, Marore, Marampit,
Miangas, Fanildo, Bras, Batek and Rote.
The limited of human resources, social,
economy and communication infrastructures as well as
local community economic disparity with neighboring
countries led to the islands into disadvantage areas.
Even, to meet household’s basic need, residents of
PPKT prefer to buy in neighboring countries because
access to the neighboring countries easier than
own country. The emotional bond that exists due to
continuously personal relationship with neighboring
countries has the potential to degradation ideology.
Therefore, management efforts to improve the social,
cultural, and economic communities who live on the
PPKT are necessary for the continuation of state
sovereignty.
http://www.bps.go.id
S TAT I S T I C S O F M A R I N E A N D C O A S TA L R E S O U R C E S
S t a t i s t i c s o f M a r i n e a n d C o a s t a l R e s o u r c e s 2 0 1 2 29
3.2. Mangroves, Coral Reefs and Seagrass
Indonesia has a huge potential of coastal
resources, both biological and non-biological, because it
has a long coastline of 95,181 km. Major ecosystems in
the coastal areas are mangrove ecosystems, seagrass
ecosystems, and coral reef ecosystems. These three
ecosystems are not always found, however, when all
of the three ecosystems met, then there is a linkage
between all of them. Each of ecosystems has its own
function.
Mangrove ecosystems are producer of detritus,
nutrient sources, and organic material that taken to the
seagrass ecosystems by ocean current. Meanwhile,
seagrass ecosystems have function as an organic
material and nutrient producer which were taken
to the coral reef ecosystems. Moreover, mangrove
ecosystems and seagrass ecosystems also have
function as a sediment trap so that sediment does not
interfere with the life of coral reefs. Furthermore, the
coral reef ecosystems can serve as a coast protection
from the blow of waves and from ocean currents.
Mangrove ecosystems also serve as habitat, feeding
ground, and nursery ground, spawning ground for the
organisms that live in seagrass or coral reefs (Kaswadji,
2001).
3.2. Mangrove, Terumbu Karang dan Padang
Lamun
Indonesia memiliki potensi sumberdaya pesisir
yang sangat besar, baik hayati maupun non hayati
karena memiliki panjang garis pantai 95.181 km.
Ekosistem utama di daerah pesisir adalah ekosistem
mangrove, ekosistem lamun, dan ekosistem terumbu
karang. Ketiga ekosistem tersebut tidak selalu dijumpai,
namun demikian apabila ketiganya dijumpai maka
terdapat keterkaitan antara ketiganya. Masing-masing
ekosistem mempunyai fungsi sendiri-sendiri.
Ekosistem mangrove merupakan penghasil
detritus, sumber nutrien, dan bahan organik yang dibawa
ke ekosistem padang lamun oleh arus laut. Sedangkan
ekosistem lamun berfungsi sebagai penghasil bahan
organik dan nutrien yang akan dibawa ke ekositem
terumbu karang. Selain itu, ekosistem mangrove dan
ekosistem padang lamun juga berfungsi sebagai
penjebak sedimen (sediment trap) sehingga sedimen
tersebut tidak mengganggu kehidupan terumbu karang.
Selanjutnya ekosistem terumbu karang dapat berfungsi
sebagai pelindung pantai dari hempasan ombak
(gelombang) dan arus laut. Ekosistem mangrove juga
berperan sebagai habitat (tempat tinggal), tempat
mencari makan (feeding ground), tempat asuhan dan
pembesaran (nursery ground), tempat pemijahan
(spawning ground) bagi organisme yang hidup di
padang lamun ataupun terumbu karang (Kaswadji,
2001).
http://www.bps.go.id
S TAT I S T I K S U M B E R D AYA L A U T D A N P E S I S I R
S t a t i s t i k S u m b e r D a y a L a u t d a n P e s i s i r 2 0 1 230
3.2.1. Mangrove
Hutan mangrove adalah hutan yang tumbuh
di suatu daerah pasang surut seperti pantai, laguna,
dan muara sungai. Hutan tersebut selalu atau secara
teratur tergenang air laut dan terpengaruh oleh pasang
surut air laut. Tumbuhan yang hidup di ekosistem
mangrove adalah tumbuhan yang bersifat halophyte
atau mempunyai toleransi yang tinggi terhadap tingkat
keasinan (salinity) air laut. Untuk adaptasi dengan kadar
garam yang tinggi, tumbuhan mangrove memiliki sel-sel
khusus dalam daun yang berfungsi untuk menyimpan
garam; memiliki daun yang kuat, tebal, dan banyak
mengandung air untuk mengatur keseimbangan garam;
dan daunnya memiliki struktur stomata khusus untuk
mengurangi penguapan (Begen, 2001).
Tumbuhan mangrove bersifat unik karena
merupakan gabungan dari ciri-ciri tumbuhan yang hidup
di darat dan di laut. Umumnya mangrove mempunyai
sistem perakaran yang khas bertipe cakar ayam yang
disebut akar nafas (pneumatofor). Sistem perakaran
ini merupakan suatu cara adaptasi terhadap keadaan
tanah yang miskin oksigen atau bahkan anaerob.
Jenis-jenis tumbuhan hutan mangrove bereaksi
berbeda terhadap variasi lingkungan fisik, sehingga
memunculkan zona-zona vegetasi tertentu. Beberapa
faktor lingkungan fisik tersebut adalah: jenis tanah,
terpaan ombak, dan genangan air pasang. Menurut
Bengen (2001), salah satu tipe zonasi hutan mangrove
di Indonesia yang dipengaruhi oleh berbagai faktor
lingkungan diatas adalah daerah yang paling dekat
dengan laut, dengan substrat agak berpasir sering
ditumbuhi oleh Avicennia spp (api-api). Pada zona
3.2.1. Mangroves
The mangrove forest is forest that grows in tidal
areas such as coastal, lagoons and estuaries. This forest
always or regularly inundated by seawater and affected
by tides. Plants that live in the mangrove ecosystems
are halophyte plant that has high tolerance for salinity
of seawater. For adaptation to high salinity, mangroves
has special cells in leaves that function to store the salt,
has strong and thick leaves that contain lots of water for
regulate salt balance and leaves that have specialized
stomata structure to reduce evaporation (Begen, 2001).
Mangrove is unique plant because it combination
of traits of plant that lived on land and sea. Generally,
mangroves root system has distinctive type of scrawl,
called the root of breath (pneumatofor). This root system
is adaptation in poor soil conditions of oxygen or even
anaerobic.
The types of mangroves are reacting differently
in physical environment variations, which raise particular
vegetation zones. Some of the physical environmental
factors are soil type, exposure waves and tidal
inundation. According to Bengen (2001), one type of
mangroves zoning in Indonesia which influenced by
various environmental factors is the area closest to the
sea, with sandy substrate often covered by Avicennia
spp. This zone commonly associated with Sonneratia
spp that dominant growing on mud that is rich with
http://www.bps.go.id
S TAT I S T I C S O F M A R I N E A N D C O A S TA L R E S O U R C E S
S t a t i s t i c s o f M a r i n e a n d C o a s t a l R e s o u r c e s 2 0 1 2 31
ini biasa berasosiasi Sonneratia spp (pidada) yang
dominan tumbuh pada lumpur dalam yang kaya bahan
organik. Lebih ke arah darat, hutan mangrove umumnya
didominasi oleh Rhizophora spp (bakau). Di zona ini
juga dijumpai Bruguiera spp (kendeka) dan Xylocarpus
spp (nirih). Zona berikutnya didominasi oleh Bruguiera
spp (kendeka). Zona transisi antara hutan mangrove
dengan hutan daratan rendah biasa ditumbuhi oleh
Nypa fruticans (nipah), dan beberapa spesies palem
lainnya.
Hutan mangrove adalah vegetasi hutan yang
hanya dapat tumbuh dan berkembang dengan baik
di daerah tropis, seperti Indonesia. Menurut Bengen
(2000), vegetasi hutan mangrove di Indonesia memiliki
keanekaragaman jenis yang tinggi, namun demikian
hanya terdapat sekitar 47 jenis tumbuhan yang spesifik
hutan mangrove. Di dalam hutan mangrove paling tidak
terdapat salah satu jenis tumbuhan dominan yang
termasuk ke dalam empat famili, yaitu Rhizophoraceae
(Rhizophora, Bruguiera dan Ceriops), Sonneratiaceae
(Sonneratia), Avicen-niaceae (Avicennia) dan
Meliaceae (Xylocarpus). Mangrove sangat penting
artinya dalam pengelolaan sumber daya di sebagian
besar wilayah Indonesia. Ekosistem hutan mangrove
bermanfaat secara ekologis dan ekonomis.
Secara ekologis hutan mangrove berfungsi
sebagai pelindung garis pantai dari abrasi, mempercepat
perluasan pantai melalui pengendapan, mencegah
intrusi air laut ke daratan, tempat berpijah aneka biota
laut, tempat berlindung dan berkembang biak berbagai
jenis burung, mamalia, reptile, dan serangga, serta
sebagai pengatur iklim mikro (Santoso & H.W. Arifin,
1998). Hasil penelitian terbaru menunjukkan bahwa
organic material. Toward to the land, mangrove forests
are dominated by Rhizophora spp. Bruguiera spp and
Xylocarpus spp are also found in this zone. The next
zone dominated by Bruguiera spp. Transition zone
between mangrove forests and land forests is usually
covered by Nypa fruticans and other palm species.
The mangrove forest is forest vegetation
that can only grow and thrive in the tropics, such as
Indonesia. According to Bengen (2000), vegetation of
mangrove forests in Indonesia poses a high species
diversity, however there are only approximately 47 of
specific species of mangrove forest. In the mangrove
forests there is a dominant plant species belonging
to four families, i.e. Rhizophoraceae (Rhizophora,
Bruguiera and Ceriops), Sonneratiaceae (Sonneratia),
Avicenniaceae (Avicennia) and Meliaceae (Xylocarpus).
Mangroves are very important in the management
of resources in most areas of Indonesia. Mangrove
forest ecosystems are ecologically and econo-mically
beneficial.
Ecologically, the mangrove forests serve as the
protector of the coastline from abrasion, accelerating
the expansion of coastal through the deposition,
preventing seawater intrusion into the land, spawning
ground for variety of marine life, breeding ground
for various species of birds, mammals, reptiles, and
insects as well as a regulator microclimate (Santoso
& H.W. Arifin, 1998). Recent research results indicate
http://www.bps.go.id
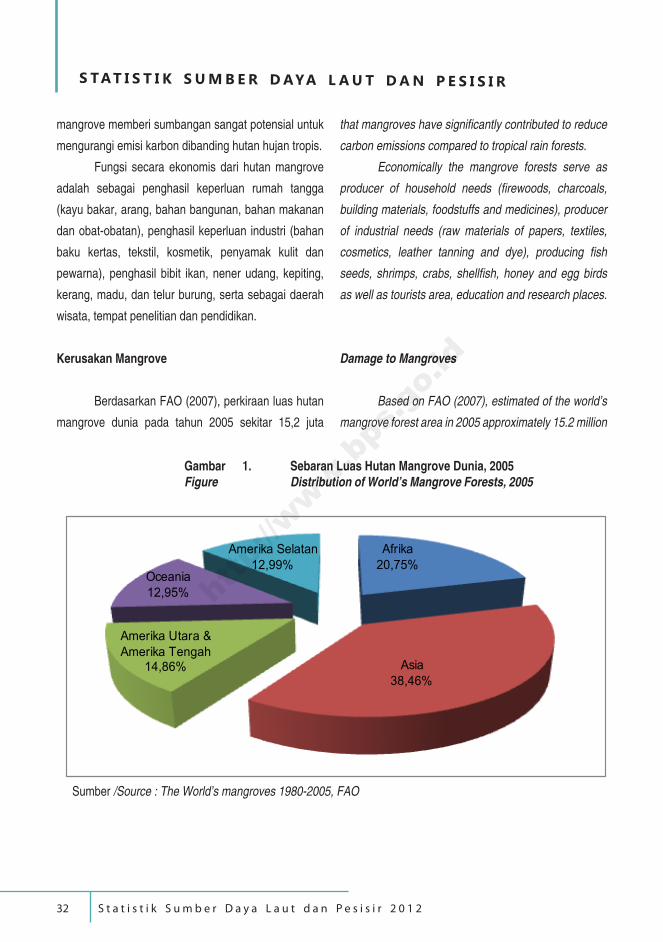
S TAT I S T I K S U M B E R D AYA L A U T D A N P E S I S I R
S t a t i s t i k S u m b e r D a y a L a u t d a n P e s i s i r 2 0 1 232
mangrove memberi sumbangan sangat potensial untuk
mengurangi emisi karbon dibanding hutan hujan tropis.
Fungsi secara ekonomis dari hutan mangrove
adalah sebagai penghasil keperluan rumah tangga
(kayu bakar, arang, bahan bangunan, bahan makanan
dan obat-obatan), penghasil keperluan industri (bahan
baku kertas, tekstil, kosmetik, penyamak kulit dan
pewarna), penghasil bibit ikan, nener udang, kepiting,
kerang, madu, dan telur burung, serta sebagai daerah
wisata, tempat penelitian dan pendidikan.
Kerusakan Mangrove
Berdasarkan FAO (2007), perkiraan luas hutan
mangrove dunia pada tahun 2005 sekitar 15,2 juta
that mangroves have significantly contributed to reduce
carbon emissions compared to tropical rain forests.
Economically the mangrove forests serve as
producer of household needs (firewoods, charcoals,
building materials, foodstuffs and medicines), producer
of industrial needs (raw materials of papers, textiles,
cosmetics, leather tanning and dye), producing fish
seeds, shrimps, crabs, shellfish, honey and egg birds
as well as tourists area, education and research places.
Damage to Mangroves
Based on FAO (2007), estimated of the world’s
mangrove forest area in 2005 approximately 15.2 million
Gambar 1. Sebaran Luas Hutan Mangrove Dunia, 2005Figure Distribution of World’s Mangrove Forests, 2005
Afrika20,75%
Asia38,46%
Amerika Utara & Amerika Tengah
14,86%
Oceania12,95%
Amerika Selatan12,99%
Sumber /Source : The World’s mangroves 1980-2005, FAO
http://www.bps.go.id
S TAT I S T I C S O F M A R I N E A N D C O A S TA L R E S O U R C E S
S t a t i s t i c s o f M a r i n e a n d C o a s t a l R e s o u r c e s 2 0 1 2 33
hektar. Asia mempunyai ekosistem mangrove terluas
dengan luas sekitar 5,86 juta ha, diikuti Afrika (3,16 juta
ha), Amerika Utara dan Amerika Tengah (2,26 juta ha),
Amerika Selatan (1,98 juta ha), dan Oceania (1,97 juta
ha). Proporsi sebaran hutan mangrove menurut benua
dapat dilihat pada Gambar 1.
Indonesia merupakan negara yang memiliki
hutan mangrove paling luas. Menurut data FAO (2007),
luas hutan mangrove di Indonesia pada tahun 2005
sekitar 3,06 juta ha atau 19 persen dari hutan mangrove
di dunia. Empat negara yang memiliki luas hutan
mangrove terbesar setelah Indonesia adalah Australia
(10 persen), Brazil (7 persen), Nigeria (7 persen) dan
Meksiko (5 persen). Luas mangrove di lima negara
tersebut mencapai 48 persen dari total luas mangrove
dunia. Sebanyak 65 persen luas mangrove dunia berada
di 10 negara, sisanya sebanyak 35 persen tersebar di
114 negara. Untuk kawasan Asia, negara-negara selain
Indonesia yang memiliki luas mangrove yang signifikan
adalah Malaysia, Myanmar, Bangladesh, dan India.
Keadaan hutan mangrove Indonesia telah
banyak yang rusak sampai dengan 71 persen, menurut
Menteri Lingkungan Hidup Indonesia, Gusti Muhammad
Hatta. Indonesia memiliki sekitar 9,36 hektar jutaan
hutan mangrove, 48 persen diantaranya dalam keadaan
”rusak sedang” dan 23 persen dalam keadaan ”rusak
parah”. (The Jakarta Post, 7 Agustus 2011).
Pulau Papua memiliki hutan mangrove terluas di
Indonesia, yaitu sekitar 1,86 juta ha atau 34,79 persen
dari luas hutan mangrove di Indonesia. Sedangkan
Pulau Bali dan Nusa Tenggara memiliki luas hutan
mangrove paling kecil yaitu hanya 0,67 persen dari
luas hutan mangrove di Indonesia. Persebaran hutan
mangrove menurut provinsi dapat dilihat pada Tabel
3.7.
hectares. Asia has the largest mangrove ecosystem is
about 5.86 million hectares, followed by Afrika (3.16
milliom hectares), North and Central America (2.26
million hectares), South America (1.98 million hectares),
and Oceania (1.97 million hectares). The proportion of
mangrove forest by continentcan be seen in Figure 1.
Indonesia is a country that has the largest
mangrove forests. According to FAO data (2007),
Indonesian mangrove forest area in 2005 approximately
3.06 million hectares or 19 percent of the total mangrove
in the world. Four countries with largest mangrove
forests after Indonesia are Australia (10 percent),
Brazil (7 percent), Nigeria (7 percent), and Mexico (5
percent). The mangroves area in five countries reaches
48 percent of the total mangroves area in the world.
About 65 percent of the total mangroves area is located
in 10 countries, the remaining 35 percent spread over
114 countries.In Asian region, other countries except
Indonesia, which have significant mangroves area, are
Malaysia, Myanmar, Bangladesh, and India.
Up to 71 percent of mangrove forests in
Indonesia have been damaged, Environment Minister
Gusti Muhammad Hatta. Indonesia had about 9.36
million hectares of mangrove forests; 48 percent of
which are “moderately damaged” and 23 percent “badly
damaged”. (The Jakarta Post, , August 07 2011).
Papua Island has the largest mangroves
forest in Indonesia which reached about 1.86 million
hectares or 34.79 percent of the total mangroves area in
Indonesia. Meanwhile, Bali and Nusa Tenggara Island
has the smallest of mangroves area about 0.67 percent
of the total mangroves area in Indonesia. Distribution of
mangrove forests by province can be seen inTable 3.7.
http://www.bps.go.id
S TAT I S T I K S U M B E R D AYA L A U T D A N P E S I S I R
S t a t i s t i k S u m b e r D a y a L a u t d a n P e s i s i r 2 0 1 234
Development in fisheries, agriculture,
infrastructure and tourism give a high pressure on
coastal ecosystems and already destroy mangrove
ecosystems. More than 90 percent of mangroves
destruction in Asian is caused by change in using of
mangroves area. Countries that suffered major damage
are Indonesia, Pakistan, Vietnam, Malaysia, and India.
The main cause of the loss of mangroves in Indonesia
are land conversion used for shrimp ponds (Jawa Timur,
Sulawesi and Sumatera), excessive logging and land
conversion used for agriculture or salt ponds (Jawa and
Sulawesi). Whereas in Kalimantan Timur, mangroves
has decreased caused by oil spills and pollution.
According to KIARA (2010), in The Royal
Society study explained that the damaged of mangroves
caused by the ponds expansion not comparable with
the welfare of coastal communities. For example in
Thailand, each hectares of pond area only gave profit of
US$9,632. Few people only own this profit. In the other
hand, the Thailand government should bear the cost of
pollution around US$1,000, the cost of the ecological
function loss around US$12,392, and the government
should gave subsidies to affected communities around
US$8,412. Not only that, the government must allocate
additional funds of US$9,318 for the rehabilitation of
mangroves. The experience of Thailand government
should provide guidance for our government not to
release random policies related to important and critical
ecosystems exploitation such as mangrove ecosystems.
Pembangunan bidang perikanan, pertanian,
infrastruktur dan pariwisata memberikan tekanan yang
tinggi pada ekosistem pesisir dan sudah merusak
ekosistem mangrove. Lebih dari 90 persen kerusakan
mangrove di Asia disebabkan oleh perubahan
penggunaan kawasan mangrove. Negara yang
mengalami kerusakan yang besar adalah Indonesia,
Pakistan, Vietnam, Malaysia, dan India. Penyebab
utama hilangnya mangrove di Indonesia adalah konversi
tanah yang dipergunakan untuk tambak udang (Jawa
Timur, Sulawesi dan Sumatera), penebangan berle-
bihan, dan konversi lahan yang dipergunakan untuk
pertanian atau tambak garam (Jawa dan Sulawesi).
Sedangkan di Kalimantan Timur, mangrove telah
mengalami penurunan yang disebabkan oleh tumpahan
minyak dan polusi.
Menurut Koalisi Rakyat untuk Keadilan
Perikanan/KIARA (2010), dalam studinya The Royal
Society memaparkan bahwa kerusakan mangrove
akibat perluasan tambak tak sebanding dengan
kesejahteraan masyarakat pesisir. Di Thailand
misalnya, setiap hektar luas tambak hanya memberikan
keuntungan sebesar US$9.632. Keuntungan ini hanya
dinikmati oleh segelintir orang. Sebaliknya, pemerintah
Thailand harus menanggung biaya polusi sebesar
US$1.000, biaya hilangnya fungsi-fungsi ekologis
sebesar US$12.392, dan pemerintah harus memberi
subsidi kepada masyarakat korban senilai US$8.412.
Tak hanya itu, pemerintah juga harus mengalokasikan
dana tambahan sebesar US$9.318 untuk merehabilitasi
mangrove. Pengalaman di Thailand hendaknya
memberikan panduan bagi pemerintah untuk tidak
sembarangan mengeluarkan kebijakan terkait
http://www.bps.go.id
S TAT I S T I C S O F M A R I N E A N D C O A S TA L R E S O U R C E S
S t a t i s t i c s o f M a r i n e a n d C o a s t a l R e s o u r c e s 2 0 1 2 35
eksploitasi ekosistem penting dan genting seperti
ekosistem mangrove.
Jika dilihat menurut kondisinya, dari 1,97 juta
ha hutan mangrove yang sudah diklasifikasikan pada
tahun 2010, sekitar 58,79 persen kondisinya baik, 19,47
persen kondisi sedang, dan 21,73 persen kondisinya
rusak (Tabel 3.7). Dari data tersebut terlihat bahwa
sekitar 41 persen mangrove dalam kondisi yang tidak
baik. Saat ini banyak orang yang menganggap bahwa
hutan mangrove sebagai tambang uang. Para nelayan
berlomba untuk mengeksploitasi mangrove sebagai
lahan bisnis dengan cara membuat hutan mangrove
menjadi tambak. Mereka tidak sadar akan arti penting
mangrove yang harus dijaga kelestariannya.
Untuk mencegah kerusakan yang lebih parah
dan menjaga kelestarian mangrove, maka harus
dilakukan tindakan nyata seperti penanaman kembali
hutan mangrove yang sudah rusak. Selama periode
2003-2009, untuk rehabilitasi dan mitigasi wilayah
mangrove telah dilakukan penanaman mangrove
sebanyak 1,4 juta batang pohon, yang terdiri dari 1,15
juta batang untuk rehabilitasi kawasan pesisir dan 263,5
ribu batang untuk mitigasi wilayah pesisir (Republika,
21 Maret 2010).
Rehabilitasi hutan mangrove dilakukan hampir di
semua provinsi pada tahun 2010. Menurut data statistik
kehutanan 2010, luas rehabilitasi hutan mangrove
di Indonesia mencapai 69 ribu ha. Angka tersebut
mengalami peningkatan dibanding tahun sebelumnya
yang hanya merehabilitasi hutan mangrove seluas
27,25 ribu ha. Provinsi Nusa Tenggara Barat merupakan
provinsi yang melakukan rehabilitasi mangrove paling
luas, yaitu mencapai 65,05 ribu ha atau 94,26 persen
The mangrove forests condition in 2010 show
that from 1.97 million hectares of mangrove forests
that have been classified, about 58.79 percent in
good condition, 19.47 percent in moderate condition,
and 21.73 percent in damaged condition (Table 3.7).
From that data can be seen that about 41 percent of
mangroves in bad condition. Nowadays many people
consider mangrove forests as money mines. The
fishermen competing to exploit mangroves as a business
area by making the mangrove forests into ponds. They
are not aware of the importance of mangroves which
must be preserved.
To prevent further damage and preserve the
mangroves should be done concrete actions. One of
the actions is replant mangroves forests that had been
damaged. During the period 2003-2009, rehabilitation
and mitigation of mangroves area were done by planting
around 1.4 million of trees, i.e. 1.15 million of trees for
rehabilitation the coastal area and 263.5 thousand
of trees for mitigation the coastal area (Republika, 21
March 2010).
The rehabilitation of mangroves forests is almost
done in all provinces in 2010. According to 2010 forestry
statistics, area of mangroves rehabilitation in Indonesia
reached 69 thousand hectares. It experience increased
compared the previous year, which only rehabilitates
27.25 thousand hectaresof mangrove forests. Province
of Nusa Tenggara Barat is the province with the most
extensive mangrove rehabilitation program that reached
the total area of 16.05 thousand hectares or 94.26
http://www.bps.go.id
S TAT I S T I K S U M B E R D AYA L A U T D A N P E S I S I R
S t a t i s t i k S u m b e r D a y a L a u t d a n P e s i s i r 2 0 1 236
percent from the total rehabilitation mangrove forests
area in Indonesia (Table 3.8).
3.2.2. Coral Reefs
Coral reefs are bunch of coral animals which
symbiosis with a type of algae called zooxanhellae.
Coral animals have peculiar shape, resembling stone
and have color and various shape. There are two types
of coral reefs i.e. hard coral and soft coral. Hard coral
(like brain coral and elkhorn coral) is hard limestone
coral that form coral reefs. Soft coral such sea fingers
and sea whips can not form corals.
Coral reefs can be called as tropical forest of
marine ecosystems. These ecosystems located in warm
and clean shallow seas and as an important ecosystem,
also have high biodiversity. The largest coral reefs is
Great Barier Reef located in off the north-east coast
Australia with the length about 2,000 kilometres. Coral
reefs are food and medicine sources and also protect
the coast from erosion due to sea waves (Setiawan,
2005).
World marine biodiversity center, especially
coral reefs located in the coral triangle that includes
Indonesia, Philippines, Malaysia, Timor Leste, Papua
New Guinea and Solomon Islands. If the boundary
line is drawn surrounding the coral reefs area in that
six countries then it will resemble a triangle. That’s why
the area is called as the coral triangle. The total area
dari total luas rehabilitasi hutan mangrove di Indonesia
(Tabel 3.8).
3.2.2. Terumbu Karang
Terumbu karang adalah sekumpulan hewan
karang yang bersimbiosis dengan sejenis tumbuhan
alga yang disebut zooxanhellae. Hewan karang
bentuknya aneh, menyerupai batu dan mempunyai
warna dan bentuk beraneka rupa. Ada dua jenis
terumbu karang yaitu terumbu karang keras (hard coral)
dan terumbu karang lunak (soft coral). Terumbu karang
keras (seperti brain coral dan elkhorn coral) merupakan
karang batu kapur yang keras yang membentuk terumbu
karang. Terumbu karang lunak (seperti sea fingers dan
sea whips) tidak membentuk karang.
Terumbu karang bisa dikatakan sebagai hutan
tropis ekosistem laut. Ekosistem ini terdapat di laut
dangkal yang hangat dan bersih,merupakan ekosistem
yang sangat penting dan memiliki keanekaragaman
hayati yang sangat tinggi. Terumbu karang terbesar
adalah Great Barier Reef di lepas pantai timur laut
Australia dengan panjang sekitar 2.000 km. Terumbu
karang merupakan sumber makanan dan obat-obatan
dan melindungi pantai dari erosi akibat gelombang laut
(Setiawan, 2005).
Pusat keanekaragaman hayati laut dunia,
terutama terumbu karang terletak di kawasan segitiga
karang yang meliputi Indonesia, Filipina, Malaysia,
Timor Leste, Papua New Guinea dan Kepulauan
Salomon. Jika ditarik garis batas yang melingkupi
wilayah terumbu karang di ke-6 negara tersebut maka
akan menyerupai segitiga, sehingga dinamakan segitiga
http://www.bps.go.id
S TAT I S T I C S O F M A R I N E A N D C O A S TA L R E S O U R C E S
S t a t i s t i c s o f M a r i n e a n d C o a s t a l R e s o u r c e s 2 0 1 2 37
of coral reefs in the coral triangle is about 75,000 km2.
Indonesia has the total of coral reefs area
approximately 51,000 km2 that contributes about 18
percent of the world’s coral reefs. Raja Ampat Islands
in Papua Barat Province is the islands with highest
number of coral reefs species in the world. Based on an
ecological study led by The Nature Conservancy (TNC)
in 2002, the species number of coral reefs and fish in
Raja Ampat Islands was found respectively about 537
species and 1,074 species (Welly, 2008).
Damage to Coral Reefs
Coral reefs are very fragile ecosystems in the
world. Although it looks strong and sturdy, but coral
reefs are fragile, easily destroyed and very vulnerable
to environmental changes. Increasing sea water
temperatures about 1° up to 2° C can lead the coral reefs
become stress and eliminate microscosmic organisms
called zooxanthellae which is the tissue dye and basic
nutriens provider. If zooxanthellae do not return, the
coral reefs will die (Setiawan, 2005).
Sedimentation in the sea is one of the main
causes of destruction of coral reefs in Indonesia. In
addition, using bomb trawling and poison as potassium
by fishermen to catch fish, urban development,
industrialisation, and waste from agricultural process
that run to the sea are some factrors contribute is
also a cause of damage to coral reefs. Nature can
also contributed to the destruction of coral reefs such
karang dunia (coral triangle). Total luas terumbu karang
di kawasan segitiga karang sekitar 75.000 km2.
Indonesia memiliki luas terumbu karang sekitar
51.000 km2 atau 18 persen dari total luas terumbu karang
dunia. Kepulauan Raja Ampat di Provinsi Papua Barat
merupakan kepulauan dengan jumlah jenis terumbu
karang tertinggi di dunia. Berdasarkan sebuah kajian
ekologi yang dipimpin oleh The Nature Conservancy
(TNC) pada tahun 2002, ditemukan sekitar 537 jenis
karang dan 1.074 jenis ikan di Kepulauan Raja Ampat
(Welly, 2008).
Kerusakan Terumbu Karang
Terumbu karang merupakan ekosistem yang
sangat rentan di dunia. Walaupun terlihat sangat
kuat dan kokoh, karang sebenarnya sangat rapuh,
mudah hancur dan sangat rentan terhadap perubahan
lingkungan. Kenaikan temperatur air laut sebesar 1°-2°
C dapat menyebabkan terumbu karang menjadi stres
dan menghilangkan organisme miskroskopis yang
bernama zooxanthellae yang merupakan pewarna
jaringan dan penyedia nutrient-nutrien dasar. Jika
zooxanthellae tidak kembali, maka terumbu karang
tersebut akan mati (Setiawan, 2005).
Sedimentasi di laut merupakan salah satu
penyebab terjadinya kerusakan terumbu karang di
Indonesia. Selain itu, penggunaan bom dan racun
seperti potasium, penggunaan pukat harimau untuk
menangkap ikan, pembangunan perkotaan, industri,
dan pertanian yang limbahnya dibuang ke laut juga
merupakan penyebab terjadinya kerusakan terumbu
karang. Kerusakan secara alami bisa terjadi karena
http://www.bps.go.id
S TAT I S T I K S U M B E R D AYA L A U T D A N P E S I S I R
S t a t i s t i k S u m b e r D a y a L a u t d a n P e s i s i r 2 0 1 238
as earthquakes, epidemics, or global warming, which
causes an increasing temperature in water that there
algae that live in the polyp tissue become a white rock.
It was called coral bleaching which is the indication that
coral reefs will be vanished (Mohammad Kasim, LIPI).
Based on studies of Oceanographic Research
Center of Indonesian Institute of Sciences (LIPI) in
1,076 coral reef locations in 2011showed that about
30.76 percent of coral reefs in damaged condition (the
living surface of coral reef around 0-24 percent), 36.90
percent in moderate condition (the living surface of
coral reef around 25-49 percent), 26.95 percentin good
condition (the living surface of coral reef around 50-74
percent), 5.58 percent in very good condition (the living
surface of coral reef around 75-100 percent). The most
severe damaged of coral reefs had happened in eastern
Indonesia, 39.34 percent of 305 locations in damaged
condition (Table 3.9).
3.2.3. Seagrass
Seagrass is the only flowering plants
(angiospermae) which has rhizoma, leaves and real
roots that live submerged in the sea. Seagrass colonized
an area through the deployment of fruit (propagule) with
sexually produced (dioecious) (Mann, 2000). Further-
more, generally seagrass make extensive seagrass
beds on the seafloor that still can be reached by sufficient
sunlight for its grow. Seagrass are still unknown widely if
compare with other ecosystems such as coral reefs and
mangrove ecosystems.
gempa bumi, wabah, atau pemanasan global yang
menyebabkan peningkatan suhu air sehingga ada
alga yang hidup pada jaringan polip dan menjadi
karang berwarna putih atau disebut coralbleaching
yang merupakan indikasi terumbu karang itu akan mati
(Mohammad Kasim, LIPI).
Hasil penelitian Pusat Penelitian Oseanografi
Lembaga Ilmu Pengetahuan Indonesia (LIPI) pada
tahun 2011 di 1.076 lokasi kawasan terumbu karang
di Indonesia menunjukan sekitar 30,76 persen dalam
kondisi rusak berat (tutupan karang hidup 0-24 persen),
36,90 persen mengalami kerusakan dengan kondisi
sedang (tutupan karang hidup 25-49 persen), 26,95
persen masih dalam kondisi baik (tutupan karang
hidup 50-74 persen), dan hanya tinggal 5,58 persen
dalam kondisi sangat baik (tutupan karang hidup 75-
100 persen). Kerusakan terumbu karang paling parah
terjadi di Indonesia bagian timur yaitu dari 305 lokasi
39,34 persen dalam kondisi rusak berat (Tabel 3.9).
3.2.3. Padang Lamun
Lamun (seagrass) merupakan satu-satunya
tumbuhan berbunga (angiospermae) yang memiliki
rhizoma, daun dan akar sejati yang hidup terendam
dalam laut. Lamun mengkolonisasi suatu daerah
melalui penyebaran buah (propagule) yang dihasilkan
secara seksual (dioecious) (Mann, 2000). Lamun
umumnya membentuk padang lamun yang luas di dasar
laut yang masih dapat dijangkau oleh cahaya matahari
yang memadai bagi pertumbuhannya. Lamun hidup
di perairan yang dangkal dan jernih pada kedalaman
berkisar antara 2 sampai 12 meter dengan sirkulasi air
http://www.bps.go.id
S TAT I S T I C S O F M A R I N E A N D C O A S TA L R E S O U R C E S
S t a t i s t i c s o f M a r i n e a n d C o a s t a l R e s o u r c e s 2 0 1 2 39
Ecologicaly, seagrass has several important
function to coastal areas, i.e. (1) producer of detritus
and nutriens; (2) binder of sedimen and stabilizer of soft
substrate with dense and crossing root systems; (3) as
a shelter ground, feeding ground, growing and spawing
ground for several types of marine biota, especialy for
marine biota that pass their adult life in this environment;
and (4) as protective cap which protects the occupants
seagrass from sunburn (Bengen, 2002).
The seagrasses had been known for its high
economic value, as in medical products and in marine
aquaculture. Some countries have made use of seagrass
for fertilizer, bedding materials, food, beach stabilizers,
waste filter, material for paper mills, chemicals, and so
forth. The physical role of seagrass in shallow marine
waters is reducing energy waves and currents, sediment
filter which dissolved in the water and stabilize sediment
basis (Kiswara and Winardi, 1999).
Sea also acts as a binder of carbon (carbon
blue) which has the same role as the forest land (green
carbon). Across the sea there were plants that can absorb
carbon from the atmosphere through photosynthesis,
either in the form of microscopic plankton that form
and plants that live on the coast like mangrove forests,
seagrass, or salt marsh. Although coastal vegetation
(mangroves, seagrass and salt marsh) area is less than
half a percent of the whole sea, itcan lock more than
yang baik. Padang lamun masih belum banyak dikenal,
jika dibandingkan dengan ekosistem lain seperti
ekosistem terumbu karang dan ekosistem mangrove.
Secara ekologi padang lamun mempunyai
beberapa fungsi penting bagi wilayah pesisir, yaitu: (1)
produsen detritus dan zat hara; (2) mengikat sedimen
dan menstabilkan substrat yang lunak dengan sistem
perakaran yang padat dan saling menyilang; (3) sebagai
tempat berlindung, mencari makan, tumbuh besar dan
memijah bagi beberapa jenis biota laut, terutama yang
melewati masa dewasanya di lingkungan ini; dan (4)
sebagai tudung pelindung yang melindungi penghuni
padang lamun dari sengatan matahari (Bengen, 2002).
Padang lamun mempunyai nilai ekonomis
sangat tinggi, yaitu sebagai produk obat-obatan dan
budidaya laut. Beberapa negara telah memanfaatkan
lamun untuk pupuk, bahan kasur, makanan, stabilisator
pantai, penyaring limbah, bahan untuk pabrik kertas,
bahan kimia, dan sebagainya. Peranan padang lamun
secara fisik di perairan laut dangkal adalah membantu
mengurangi tenaga gelombang dan arus, menyaring
sedimen yang terlarut dalam air dan menstabilkan
dasar sedimen (Kiswara dan Winardi, 1999).
Laut juga ikut berperan sebagai pengikat karbon
(blue carbon) sama seperti peranan hutan daratan
(green carbon). Di seluruh laut terdapat tumbuhan yang
dapat menyerap karbon dari atmosfer lewat fotosintesis,
baik berupa plankton yang mikroskopis maupun yang
berupa tumbuhan yang hanya hidup di pantai seperti di
hutan mangrove, padang lamun, ataupun rawa payau
(salt marsh). Meskipun tumbuhan pantai (mangrove,
padang lamun, dan rawa payau) luasnya kurang dari
http://www.bps.go.id
S TAT I S T I K S U M B E R D AYA L A U T D A N P E S I S I R
S t a t i s t i k S u m b e r D a y a L a u t d a n P e s i s i r 2 0 1 240
setengah persen dari luas seluruh laut, ketiganya dapat
mengunci lebih dari separuh karbon laut ke sedimen
dasar laut. Keseluruhan tumbuhan mangrove, padang
lamun, dan rawa payau dapat mengikat 235-450 juta
ton karbon per tahun, setara hampir setengah dari emisi
karbon lewat transportasi di seluruh dunia (LIPI, 2010).
Tabel 3.11 menyajikan data mengenai luas
dan kondisi padang lamun tahun 2010. Provinsi Papua
Barat memiliki padang lamun terluas yaitu 621,9 ribu
ha. Sedangkan provinsi yang memiliki padang lamun
paling kecil adalah Provinsi Jawa Tengah yaitu seluas
9,02 ha.
3.3. Potensi dan Produksi Perikanan
3.3.1. Perikanan Tangkap
Indonesia sebagai negara kepulauan terbesar
dengan luas perairan sekitar tiga per empat dari seluruh
luas wilayah, menduduki posisi ke-3 setelah China
dan Peru sebagai negara yang mempunyai produksi
perikanan tangkap tertinggi di dunia. Berdasarkan
Keputusan Menteri Kelautan dan Perikanan Nomor
KEP.45/MEN/2011, potensi lestari sumber daya ikan
di Indonesia saat ini adalah 6,5 juta ton/tahun yang
tersebar di sebelas wilayah pengelolaan perikanan.
Potensi tersebut terdiri dari ikan pelagis besar 1,15 juta
ton, ikan pelagis kecil 3,65 juta ton, ikan demersal 1,45
juta ton, ikan karang 145 ribu ton, udang paneid 98,3
ribu ton, ikan karang konsumsi 145,3 ribu ton, lobster
4,8 ribu ton dan cumi-cumi 28,3 ribu ton.
Total produksi perikanan tangkap di laut
pada tahun 2010 mencapai 5,04 juta ton. Jumlah
half of carbon produce by marine ecosystem into the
seabed sediment. Overall mangroves, seagrass and
salt marshes bound the total number of 235-450 million
tonnes of carbon per year or equivalent to nearly half of
carbon emissions produced by transportation sector in
the world (LIPI, 2010).
Table 3.11 presented the area and condition of
seagrass in 2010. Province of Papua Barat has largest
area of seagrass which reached 621.9 thousands
hectares. While the province with the smallest number
of seagrass is Jawa Tengah Province (9.02 hectares).
3.3. Potencyand Production ofFisheries
3.3.1. Capture Fisheries
As the largest archipelago country with an
area of ocean around three-fourths from the total area.
Indonesia ranked 3rd after China and Peru as a country
with the highest production of fisheries capture in the
world. Based on the Decree of the Minister of Marine
Affairs and Fisheries Number KEP.45/MEN/2011, the
sustainable potential of fish resources in Indonesia
reaches 6.5 million tons/years which spread in eleven
areas of fisheries management. The potential consists
of 1.15 million tons of large pelagic fish, 3.65 million
tons of small pelagicfish, 1.45 million tons of demersal
fish, 145 thousand tons of reef fish, 98.3 thousand
tons of paneid shrimp, 145.3 thousand tons of reef fish
consumption, 4.8 thousand tons of lobster, and 28.3
thousand tons of squid.
Total production of marine capture fisheries
in 2010 reached 5.04 million tons. That production
http://www.bps.go.id
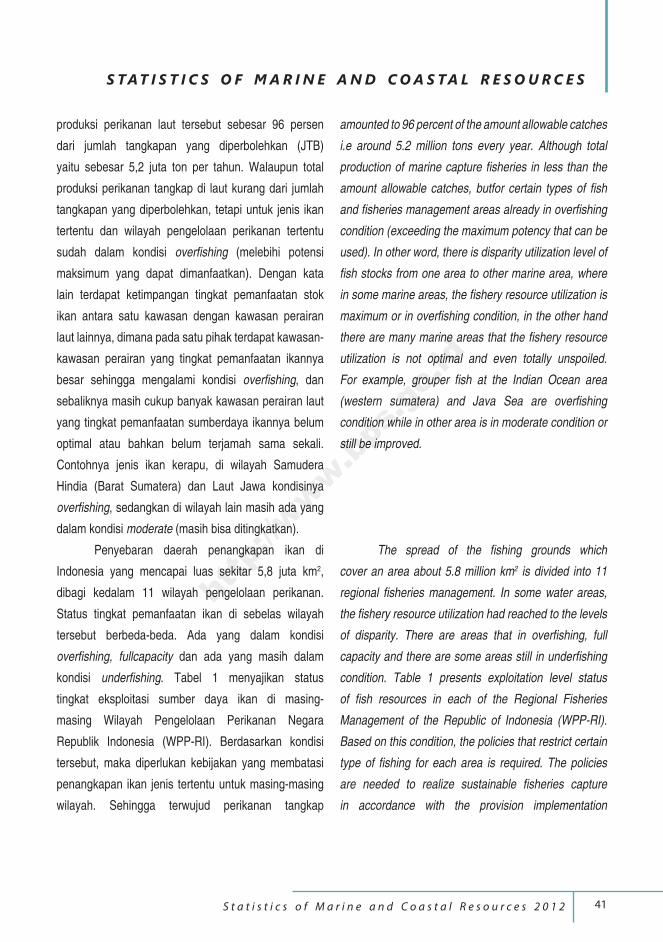
S TAT I S T I C S O F M A R I N E A N D C O A S TA L R E S O U R C E S
S t a t i s t i c s o f M a r i n e a n d C o a s t a l R e s o u r c e s 2 0 1 2 41
produksi perikanan laut tersebut sebesar 96 persen
dari jumlah tangkapan yang diperbolehkan (JTB)
yaitu sebesar 5,2 juta ton per tahun. Walaupun total
produksi perikanan tangkap di laut kurang dari jumlah
tangkapan yang diperbolehkan, tetapi untuk jenis ikan
tertentu dan wilayah pengelolaan perikanan tertentu
sudah dalam kondisi overfishing (melebihi potensi
maksimum yang dapat dimanfaatkan). Dengan kata
lain terdapat ketimpangan tingkat pemanfaatan stok
ikan antara satu kawasan dengan kawasan perairan
laut lainnya, dimana pada satu pihak terdapat kawasan-
kawasan perairan yang tingkat pemanfaatan ikannya
besar sehingga mengalami kondisi overfishing, dan
sebaliknya masih cukup banyak kawasan perairan laut
yang tingkat pemanfaatan sumberdaya ikannya belum
optimal atau bahkan belum terjamah sama sekali.
Contohnya jenis ikan kerapu, di wilayah Samudera
Hindia (Barat Sumatera) dan Laut Jawa kondisinya
overfishing, sedangkan di wilayah lain masih ada yang
dalam kondisi moderate (masih bisa ditingkatkan).
Penyebaran daerah penangkapan ikan di
Indonesia yang mencapai luas sekitar 5,8 juta km2,
dibagi kedalam 11 wilayah pengelolaan perikanan.
Status tingkat pemanfaatan ikan di sebelas wilayah
tersebut berbeda-beda. Ada yang dalam kondisi
overfishing, fullcapacity dan ada yang masih dalam
kondisi underfishing. Tabel 1 menyajikan status
tingkat eksploitasi sumber daya ikan di masing-
masing Wilayah Pengelolaan Perikanan Negara
Republik Indonesia (WPP-RI). Berdasarkan kondisi
tersebut, maka diperlukan kebijakan yang membatasi
penangkapan ikan jenis tertentu untuk masing-masing
wilayah. Sehingga terwujud perikanan tangkap
amounted to 96 percent of the amount allowable catches
i.e around 5.2 million tons every year. Although total
production of marine capture fisheries in less than the
amount allowable catches, butfor certain types of fish
and fisheries management areas already in overfishing
condition (exceeding the maximum potency that can be
used). In other word, there is disparity utilization level of
fish stocks from one area to other marine area, where
in some marine areas, the fishery resource utilization is
maximum or in overfishing condition, in the other hand
there are many marine areas that the fishery resource
utilization is not optimal and even totally unspoiled.
For example, grouper fish at the Indian Ocean area
(western sumatera) and Java Sea are overfishing
condition while in other area is in moderate condition or
still be improved.
The spread of the fishing grounds which
cover an area about 5.8 million km2 is divided into 11
regional fisheries management. In some water areas,
the fishery resource utilization had reached to the levels
of disparity. There are areas that in overfishing, full
capacity and there are some areas still in underfishing
condition. Table 1 presents exploitation level status
of fish resources in each of the Regional Fisheries
Management of the Republic of Indonesia (WPP-RI).
Based on this condition, the policies that restrict certain
type of fishing for each area is required. The policies
are needed to realize sustainable fisheries capture
in accordance with the provision implementation
http://www.bps.go.id
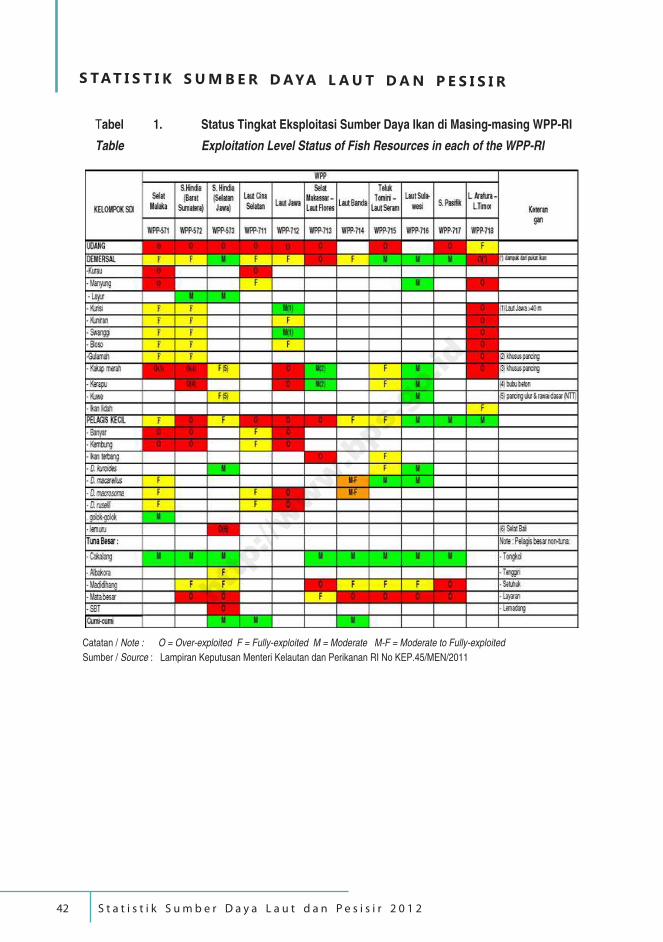
S TAT I S T I K S U M B E R D AYA L A U T D A N P E S I S I R
S t a t i s t i k S u m b e r D a y a L a u t d a n P e s i s i r 2 0 1 242
Tabel 1. Status Tingkat Eksploitasi Sumber Daya Ikan di Masing-masing WPP-RI
Table Exploitation Level Status of Fish Resources in each of the WPP-RI
Catatan / Note : O = Over-exploited F = Fully-exploited M = Moderate M-F = Moderate to Fully-exploited
Sumber / Source : Lampiran Keputusan Menteri Kelautan dan Perikanan RI No KEP.45/MEN/2011
http://www.bps.go.id
S TAT I S T I C S O F M A R I N E A N D C O A S TA L R E S O U R C E S
S t a t i s t i c s o f M a r i n e a n d C o a s t a l R e s o u r c e s 2 0 1 2 43
of responsible fisheries (FAO Code of Conduct for
Responsible Fisheries / CCRF).
Indonesian fishery production from 2005-2010
experienced an average annual increasing of 11.23
percent, from 6,869.5 thousand tons in 2005 to 11,662.3
thousand tons in 2010. Its production including fish and
non-fish such as shrimps, sea cucumbers, and others
and include capture fisheries and aquaculture.
In 2005, capture fisheries dominated the fishery
production in Indonesia, especially in marine capture
fisheries that reached 64.17 percent or 4.4 million tons.
But the contribution of fishery production decreased
to 43.21 percent or 5 million tonsin 2010 Decreasing
of the contribution was not caused by decreasing in
capture fisheries production, but because increasing in
aquaculture production that relative high. An average
annual increasing of aquaculture production from 2005
until 2010 is 23.84 percent annualy. While, an average
annual increasing of capture fisheries in same period is
only 2.76 percent annualy (Table 2).
Indonesia poses a huge marine fisheries
resources, both in quantity and variety. The production
of marine fisheries according to the type of fish during
2007-2010 period increased by an average of 2.39
percent annually, the original number of 4.23 million
tons in 2007 and rose steadily to 4.54 million tons in
2010 (Table 3.12). The most common types of fish
which is caught and widely consumed by many people
includes: skipjack tuna, red snappers, scads, indian
yang berkelanjutan (sustainable fisheries capture)
sesuai dengan ketentuan pelaksanaan perikanan
yang bertanggung jawab (FAO Code of Conduct for
Responsible Fisheries / CCRF).
Produksi perikanan Indonesia tahun 2005-2010
mengalami kenaikan rata-rata pertahun sebesar 11,23
persen, yakni dari 6.869,5 ribu ton pada tahun 2005
menjadi 11.662,3 ribu ton pada tahun 2010. Produksi
perikanan ini mencakup ikan dan non ikan seperti
udang, teripang, dan lain-lain, serta meliputi perikanan
tangkap dan perikanan budidaya.
Pada tahun 2005, perikanan tangkap sangat
mendominasi produksi perikanan di Indonesia,
terutama perikanan tangkap di laut yang mencapai
64,17 persen atau 4,4 juta ton. Namun pada tahun
2010 kontribusi perikanan tangkap turun menjadi 43,21
persen atau 5,0 juta ton. Penurunan kontribusi ini bukan
disebabkan penurunan produksi perikanan tangkap,
melainkan disebabkan peningkatan produksi perikanan
budidaya yang relatif tinggi. Kenaikan rata-rata produksi
perikanan budidaya dari tahun 2005 sampai tahun 2010
sebesar 23,84 persen per tahun. Sedangkan kenaikan
rata-rata produksi perikanan tangkap pada periode
yang sama hanya 2,76 persen per tahun (Tabel 2).
Indonesia sesungguhnya memiliki potensi
sumber daya perikanan laut yang cukup besar, baik
dari segi kuantitas maupun diversitas. Jumlah produksi
penangkapan ikan di laut menurut jenis ikan pada
periode 2007-2010 mengalami pertumbuhan sebesar
2,39 persen per tahun, yaitu dari 4,23 juta ton pada
tahun 2007 menjadi 4,54 juta ton pada tahun 2010
(Tabel 3.12). Jenis ikan yang paling banyak ditangkap
dan dikonsumsi masyarakat antara lain: cakalang,
http://www.bps.go.id
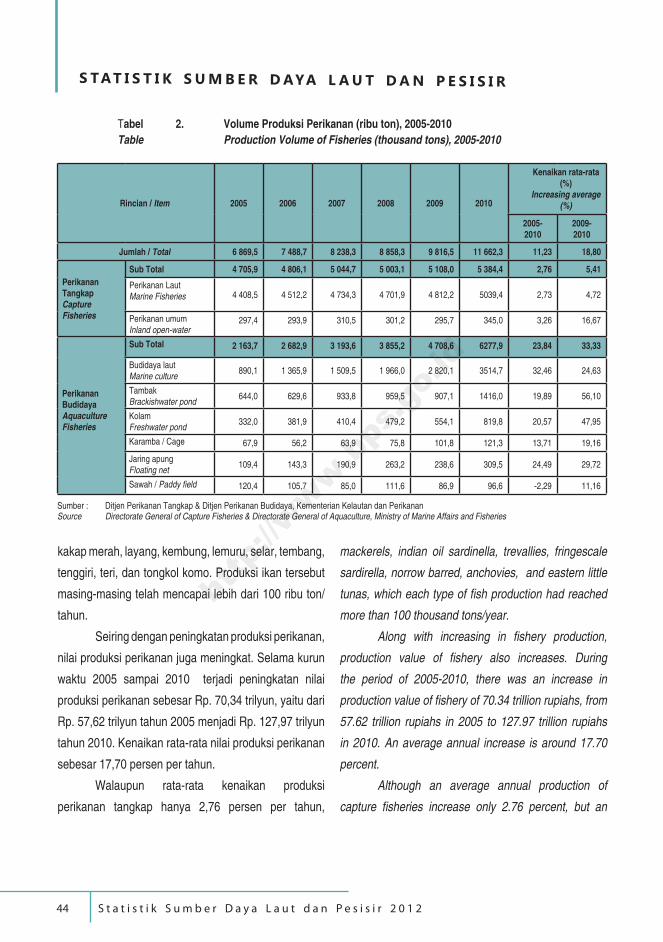
S TAT I S T I K S U M B E R D AYA L A U T D A N P E S I S I R
S t a t i s t i k S u m b e r D a y a L a u t d a n P e s i s i r 2 0 1 244
kakap merah, layang, kembung, lemuru, selar, tembang,
tenggiri, teri, dan tongkol komo. Produksi ikan tersebut
masing-masing telah mencapai lebih dari 100 ribu ton/
tahun.
Seiring dengan peningkatan produksi perikanan,
nilai produksi perikanan juga meningkat. Selama kurun
waktu 2005 sampai 2010 terjadi peningkatan nilai
produksi perikanan sebesar Rp. 70,34 trilyun, yaitu dari
Rp. 57,62 trilyun tahun 2005 menjadi Rp. 127,97 trilyun
tahun 2010. Kenaikan rata-rata nilai produksi perikanan
sebesar 17,70 persen per tahun.
Walaupun rata-rata kenaikan produksi
perikanan tangkap hanya 2,76 persen per tahun,
mackerels, indian oil sardinella, trevallies, fringescale
sardirella, norrow barred, anchovies, and eastern little
tunas, which each type of fish production had reached
more than 100 thousand tons/year.
Along with increasing in fishery production,
production value of fishery also increases. During
the period of 2005-2010, there was an increase in
production value of fishery of 70.34 trillion rupiahs, from
57.62 trillion rupiahs in 2005 to 127.97 trillion rupiahs
in 2010. An average annual increase is around 17.70
percent.
Although an average annual production of
capture fisheries increase only 2.76 percent, but an
Tabel 2. Volume Produksi Perikanan (ribu ton), 2005-2010
Table Production Volume of Fisheries (thousand tons), 2005-2010
Rincian / Item 2005 2006 2007 2008 2009 2010
Kenaikan rata-rata (%)
Increasing average (%)
2005-2010
2009-2010
Jumlah / Total 6 869,5 7 488,7 8 238,3 8 858,3 9 816,5 11 662,3 11,23 18,80
Perikanan TangkapCapture Fisheries
Sub Total 4 705,9 4 806,1 5 044,7 5 003,1 5 108,0 5 384,4 2,76 5,41
Perikanan Laut Marine Fisheries 4 408,5 4 512,2 4 734,3 4 701,9 4 812,2 5039,4 2,73 4,72
Perikanan umumInland open-water
297,4 293,9 310,5 301,2 295,7 345,0 3,26 16,67
Perikanan BudidayaAquaculture Fisheries
Sub Total 2 163,7 2 682,9 3 193,6 3 855,2 4 708,6 6277,9 23,84 33,33
Budidaya laut Marine culture
890,1 1 365,9 1 509,5 1 966,0 2 820,1 3514,7 32,46 24,63
Tambak Brackishwater pond
644,0 629,6 933,8 959,5 907,1 1416,0 19,89 56,10
Kolam Freshwater pond
332,0 381,9 410,4 479,2 554,1 819,8 20,57 47,95
Karamba / Cage 67,9 56,2 63,9 75,8 101,8 121,3 13,71 19,16
Jaring apung Floating net
109,4 143,3 190,9 263,2 238,6 309,5 24,49 29,72
Sawah / Paddy field 120,4 105,7 85,0 111,6 86,9 96,6 -2,29 11,16
Sumber : Ditjen Perikanan Tangkap & Ditjen Perikanan Budidaya, Kementerian Kelautan dan PerikananSource Directorate General of Capture Fisheries & Directorate General of Aquaculture, Ministry of Marine Affairs and Fisheries
http://www.bps.go.id
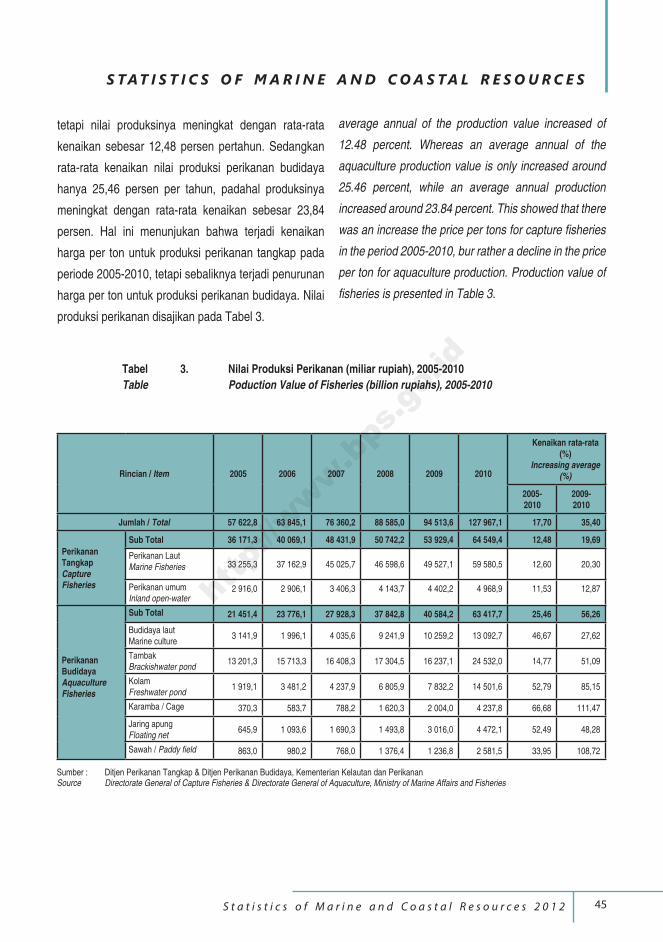
S TAT I S T I C S O F M A R I N E A N D C O A S TA L R E S O U R C E S
S t a t i s t i c s o f M a r i n e a n d C o a s t a l R e s o u r c e s 2 0 1 2 45
tetapi nilai produksinya meningkat dengan rata-rata
kenaikan sebesar 12,48 persen pertahun. Sedangkan
rata-rata kenaikan nilai produksi perikanan budidaya
hanya 25,46 persen per tahun, padahal produksinya
meningkat dengan rata-rata kenaikan sebesar 23,84
persen. Hal ini menunjukan bahwa terjadi kenaikan
harga per ton untuk produksi perikanan tangkap pada
periode 2005-2010, tetapi sebaliknya terjadi penurunan
harga per ton untuk produksi perikanan budidaya. Nilai
produksi perikanan disajikan pada Tabel 3.
average annual of the production value increased of
12.48 percent. Whereas an average annual of the
aquaculture production value is only increased around
25.46 percent, while an average annual production
increased around 23.84 percent. This showed that there
was an increase the price per tons for capture fisheries
in the period 2005-2010, bur rather a decline in the price
per ton for aquaculture production. Production value of
fisheries is presented in Table 3.
Rincian / Item 2005 2006 2007 2008 2009 2010
Kenaikan rata-rata (%)
Increasing average (%)
2005-2010
2009-2010
Jumlah / Total 57 622,8 63 845,1 76 360,2 88 585,0 94 513,6 127 967,1 17,70 35,40
Perikanan TangkapCapture Fisheries
Sub Total 36 171,3 40 069,1 48 431,9 50 742,2 53 929,4 64 549,4 12,48 19,69
Perikanan Laut Marine Fisheries 33 255,3 37 162,9 45 025,7 46 598,6 49 527,1 59 580,5 12,60 20,30
Perikanan umumInland open-water
2 916,0 2 906,1 3 406,3 4 143,7 4 402,2 4 968,9 11,53 12,87
Perikanan BudidayaAquaculture Fisheries
Sub Total 21 451,4 23 776,1 27 928,3 37 842,8 40 584,2 63 417,7 25,46 56,26
Budidaya laut Marine culture
3 141,9 1 996,1 4 035,6 9 241,9 10 259,2 13 092,7 46,67 27,62
Tambak Brackishwater pond
13 201,3 15 713,3 16 408,3 17 304,5 16 237,1 24 532,0 14,77 51,09
Kolam Freshwater pond
1 919,1 3 481,2 4 237,9 6 805,9 7 832,2 14 501,6 52,79 85,15
Karamba / Cage 370,3 583,7 788,2 1 620,3 2 004,0 4 237,8 66,68 111,47
Jaring apung Floating net
645,9 1 093,6 1 690,3 1 493,8 3 016,0 4 472,1 52,49 48,28
Sawah / Paddy field 863,0 980,2 768,0 1 376,4 1 236,8 2 581,5 33,95 108,72
Tabel 3. Nilai Produksi Perikanan (miliar rupiah), 2005-2010
Table Poduction Value of Fisheries (billion rupiahs), 2005-2010
Sumber : Ditjen Perikanan Tangkap & Ditjen Perikanan Budidaya, Kementerian Kelautan dan PerikananSource Directorate General of Capture Fisheries & Directorate General of Aquaculture, Ministry of Marine Affairs and Fisheries
http://www.bps.go.id
S TAT I S T I K S U M B E R D AYA L A U T D A N P E S I S I R
S t a t i s t i k S u m b e r D a y a L a u t d a n P e s i s i r 2 0 1 246
Nilai produksi perikanan tangkap di laut
menurut jenis ikan pada periode 2007-2010 mengalami
peningkatan (Tabel 3.13). Pada tahun 2007 nilai
produksinya mencapai 34,5 trilyun rupiah, meningkat
menjadi 48,8 trilyun rupiah pada tahun 2010. Kontribusi
nilai produksi perikanan tangkap di laut menurut jenis
ikan, selain dipengaruhi volume produksinya juga
sangat dipengaruhi nilai jual menurut jenis ikan.
Tabel 3.14 dan 3.15 menyajikan produksi dan
nilai produksi perikanan pada 11 wilayah pengelolaan
perikanan tahun 2007-2010. Pada tahun 2010, volume
dan nilai produksi paling tinggi di wilayah Maluku dan
Papua yaitu sebesar 1.028.438 ton dan senilai Rp. 9,9
trilyun. Sedangkan volume produksi yang paling rendah
adalah di wilayah Timur Kalimantan dan nilai produksi
yang paling rendah adalah di wilayah Selatan Jawa.
Untuk melaksanakan tatacara perikanan
yang bertanggung jawab, pemerintah perlu secara
cepat mengembangkan metode penangkapan yang
tidak merusak lingkungan. Hal ini berguna untuk
menyelamatkan sumber daya perikanan di wilayah
perairan Indonesia. Apalagi adanya tuntutan dan
kecaman dunia internasional yang akan memboikot
ekspor dari negara yang sistem penangkapan ikannya
masih merusak lingkungan.
Perikanan Tangkap Udang Di Laut
Selain ikan, produksi perikanan tangkap di
laut termasuk binatang kulit keras seperti udang. Jenis
udang yang biasanya ditangkap di laut adalah udang
dongol, udang putih, udang krosok, udang ratu/raja,
udang windu, dan udang barong/udang karang. Dari
The production value of capture fisheries by the
type of fish during 2007 to 2010 has increased (Table
3.13). In 2007, the production value reached 34.5 trillion
rupiahs increased to 48.8 trillion rupiahs in 2010. The
contribution of capture fisheries production value by the
type of fish, was influenced by the volume of production,
moreover it was greatly influenced by the sale price of
the type of fish.
Table 3.14 and 3.15 present volume and
value of fisheries production in 11 areas of fisheries
management from 2007-2010. In 2010, the highest
volume and production value was in Maluku and Papua
about 1,028,438 ton and 9.9 trillion rupiahs. While the
lowest production volume was in Eastern Kalimantan
and the lowest production value was in Southern Java.
To carry out the responsible fisheries procedure,
government needs to develop fishing methods which do
not damage the environment. It is useful to save fishery
resources in Indonesia waters. Moreover, the demands
and critism from international communities that would
boycott the export from countries that the fish catching
system is still damage the environment.
Sea Shrimp Fishery
Besides fish, the productions of marine capture
fisheries include crustacean such as shrimp. The usual
type of shrimp which is caught in sea are Endeavour
prawn/Shrimp blue tail endeavour prawn/Shrimp red
greasikback, Jerbung banana prawn/white shrimp/
http://www.bps.go.id
S TAT I S T I C S O F M A R I N E A N D C O A S TA L R E S O U R C E S
S t a t i s t i c s o f M a r i n e a n d C o a s t a l R e s o u r c e s 2 0 1 2 47
jenis udang tersebut yang paling banyak ditangkap
adalah jenis udang putih. Udang putih ini banyak
ditangkap di perairan Selat Malaka, Utara Jawa dan
Timur Sumatera. Sementara udang ratu/raja merupakan
udang yang paling sedikit ditangkap. Produksi dan nilai
produksi penangkapan udang menurut provinsi tahun
2010 dapat dilihat pada Tabel 3.16 dan 3.17. Sedangkan
Tabel 3.18 dan 3.19 menyajikan data produksi dan nilai
produksi perikanan tangkap udang di laut berdasarkan
11 wilayah pengelolaan perikanan.
3.3.2. Perikanan Budidaya
A. Budidaya Perikanan
Selama kurun waktu 2005–2010 produksi
perikanan budidaya meningkat pesat. Seperti
ditampilkan pada Tabel 2 diatas, produksi perikanan
budidaya tahun 2010 adalah 6,3 juta ton atau hampir
dua kali lebih banyak daripada tahun 2007 yang hanya
3,2 juta ton. Peran perikanan budidaya sangat strategis
karena menjadi andalan untuk menjaga ketersediaan
protein hewani, selain untuk menjaga kelestarian
perikanan tangkap.
Dalam publikasi ini, perikanan budidaya dibagi
menjadi dua yaitu budidaya tambak dan budidaya laut.
Pada tahun 2010, potensi luas lahan budidaya secara
keseluruhan sebesar 15,51 juta ha, yang terdiri dari
perikanan budidaya tambak sebesar 2,96 juta ha dan
budidaya laut sebesar 12,55 juta ha. Potensi yang
sangat besar tersebut baru termanfaatkan 4,68 persen
Indian banana, Tiger cat/Rainbow shrimp, King prawn/
Blue legged, Jumbo/Giant/Blue/Brown tiger prawn and
Spiny lobsters. From the above types of shrimp, the
Jerbung banana prawn/white shrimp/Indian banana
type is dominated the production of caught shrimp. This
Jerbung banana prawn/white shrimp/Indian banana are
caught in the Strait Malacca waters, north of Javaand
east of Sumatra. While the King prawn/Blue legged is
the least of shrimp caught in sea. Production number
and value of capture shrimp can be seen in Table
3.16 and 3.17. While Table 3.18 and 3.19 present the
production and value of shrimp fishery production on the
ocean according to the 11 regions management area.
3.3.2. Aquaculture Fisheries
A. Aquaculture
During the period of 2005-2010, aquaculture
production increased rapidly. As showed in Table 2
above, aquaculture production in 2010 was around 6.3
million tons or two times more than in 2007 that was only
3.2 million tons. The role of aquaculture is very strategic
since it become a basis for maintaining the availability
of animal protein, beside maintaining the sustainability
of capture fisheries.
In this publication, aquaculture is consist of two
types, namely brackishwater pond and marine culture. In
2010, the potential area for cultivation of land constitute
an area of 15.51 million hectares, brackishwater ponds
covered an area of 2.96 million hectares and the marine
culture covered an area of 12.55 million hectares. The
utilization was only 4.68 percent. The area that was used
http://www.bps.go.id
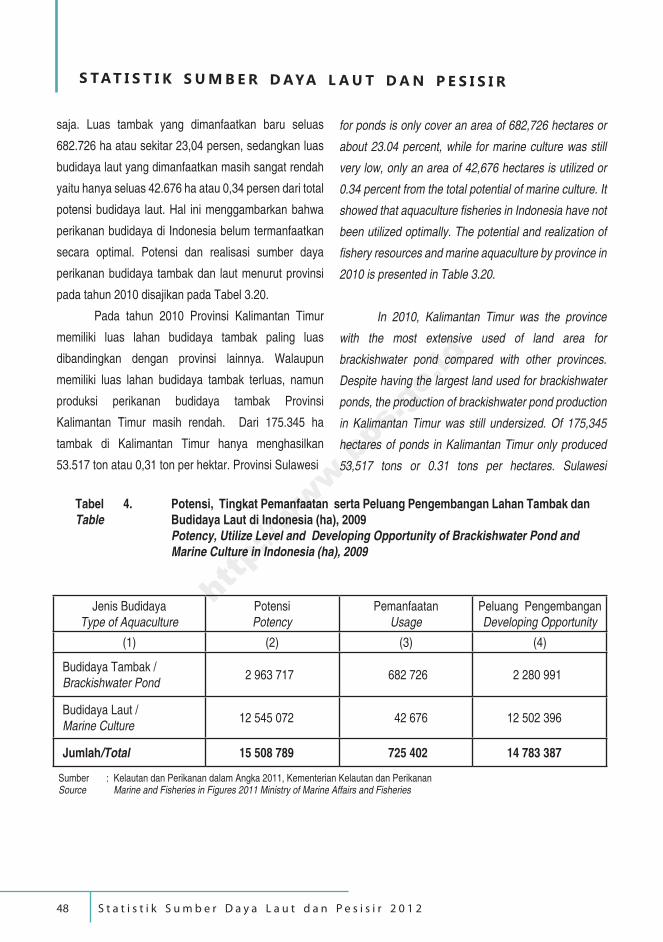
S TAT I S T I K S U M B E R D AYA L A U T D A N P E S I S I R
S t a t i s t i k S u m b e r D a y a L a u t d a n P e s i s i r 2 0 1 248
saja. Luas tambak yang dimanfaatkan baru seluas
682.726 ha atau sekitar 23,04 persen, sedangkan luas
budidaya laut yang dimanfaatkan masih sangat rendah
yaitu hanya seluas 42.676 ha atau 0,34 persen dari total
potensi budidaya laut. Hal ini menggambarkan bahwa
perikanan budidaya di Indonesia belum termanfaatkan
secara optimal. Potensi dan realisasi sumber daya
perikanan budidaya tambak dan laut menurut provinsi
pada tahun 2010 disajikan pada Tabel 3.20.
Pada tahun 2010 Provinsi Kalimantan Timur
memiliki luas lahan budidaya tambak paling luas
dibandingkan dengan provinsi lainnya. Walaupun
memiliki luas lahan budidaya tambak terluas, namun
produksi perikanan budidaya tambak Provinsi
Kalimantan Timur masih rendah. Dari 175.345 ha
tambak di Kalimantan Timur hanya menghasilkan
53.517 ton atau 0,31 ton per hektar. Provinsi Sulawesi
Tabel 4. Potensi, Tingkat Pemanfaatan serta Peluang Pengembangan Lahan Tambak dan Table Budidaya Laut di Indonesia (ha), 2009
Potency, Utilize Level and Developing Opportunity of Brackishwater Pond and Marine Culture in Indonesia (ha), 2009
Jenis Budidaya Type of Aquaculture
Potensi Potency
Pemanfaatan Usage
Peluang Pengembangan Developing Opportunity
(1) (2) (3) (4)
Budidaya Tambak / Brackishwater Pond
2 963 717 682 726 2 280 991
Budidaya Laut /Marine Culture
12 545 072 42 676 12 502 396
Jumlah/Total 15 508 789 725 402 14 783 387
Sumber : Kelautan dan Perikanan dalam Angka 2011, Kementerian Kelautan dan PerikananSource Marine and Fisheries in Figures 2011 Ministry of Marine Affairs and Fisheries
for ponds is only cover an area of 682,726 hectares or
about 23.04 percent, while for marine culture was still
very low, only an area of 42,676 hectares is utilized or
0.34 percent from the total potential of marine culture. It
showed that aquaculture fisheries in Indonesia have not
been utilized optimally. The potential and realization of
fishery resources and marine aquaculture by province in
2010 is presented in Table 3.20.
In 2010, Kalimantan Timur was the province
with the most extensive used of land area for
brackishwater pond compared with other provinces.
Despite having the largest land used for brackishwater
ponds, the production of brackishwater pond production
in Kalimantan Timur was still undersized. Of 175,345
hectares of ponds in Kalimantan Timur only produced
53,517 tons or 0.31 tons per hectares. Sulawesi
http://www.bps.go.id
S TAT I S T I C S O F M A R I N E A N D C O A S TA L R E S O U R C E S
S t a t i s t i c s o f M a r i n e a n d C o a s t a l R e s o u r c e s 2 0 1 2 49
Selatan merupakan provinsi yang paling tinggi produksi
perikanan budidaya tambaknya. Dari 105.859 ha tambak
di Provinsi Sulawesi Selatan dapat menghasilkan
534.456 ton atau 5.05 ton per hektar. Luas lahan
budidaya tambak dan laut beserta produksinya dapat
dilihat pada Tabel 3.21.
Tabel 4 diatas menjelaskan potensi,
pemanfaatan, serta peluang pengembangan lahan
tambak dan budidaya laut di Indonesia pada tahun
2009.
Pada Tabel 3.22 dan 3.23 menyajikan data
produksi perikanan budidaya tambak dan laut. Selama
periode tahun 2006-2010, produksi perikanan budidaya
tambak meningkat sebesar 55,54 persen. Pada tahun
2006 produksi perikanan budidaya tambak sebesar
629,6 ribu ton, sedangkan pada tahun 2010 naik
menjadi 1.416,1 ribu ton. Jika dibandingkan tahun
2008, produksi budidaya tambak pada tahun 2009
mengalami penurunan produksi sebesar 52,4 ribu ton
atau sekitar 5,46 persen. Produksi perikanan budidaya
laut juga mengalami peningkatan pada periode 2006-
2010. Pertumbuhan produksi perikanan budidaya laut
sebesar 157,54 persen per tahun, yaitu dari 1.364,7ribu
ton tahun 2006 menjadi 3.514,7 ribu ton pada tahun
2010.
Seiring dengan peningkatan produksinya, nilai
produksi perikanan budidaya tambak dan budidaya laut
juga mengalami peningkatan. Nilai produksi budidaya
tambak mengalami pertumbuhan sebesar 11,78
persen per tahun, sedangkan nilai produksi budidaya
laut mengalami pertumbuhan sebesar 60,03 persen
pertahun. Nilai produksi budidaya tambak dan budidaya
laut menurut provinsi tahun 2006-2010 disajikan pada
Tabel 3.24 dan 3.25.
Selatan was a province with the highest production of
brackishwater ponds,from 105,859 hectares of ponds in
Sulawesi Selatan could produce 534,456 tons or 5.05
tons per hectares. The area of brackishwater pond and
marine culture and its production is presented in Table
3.21.
Table 4 above describes potency, utilize level,
and developing opportunity of brackishwater ponds and
marin culture in Indonesia in 2009.
Table 3.22 and 3.23 present the production of
brackishwater ponds and marine culture.During the
period of 2006-2010, the production of brackishwater
ponds was increased by 55.54 percent. In 2006, the
production of brackishwater ponds reached the total
number of 629.6 thousand tons, while in 2010 the
production rose to 1,416.1thousand tons. Compared with
the production in 2008, the production of brackishwater
ponds in 2009 decreased around 52.4 thousand tons
or about 5.46 percent. The production of marine culture
also increased in the period of 2006-2010. The growth of
marine culture production was157.54 percent annually,
from 1,364.7 thousand tons in 2006 to 3,514.7 thousand
tons in 2010.
Along with increased production, production
value of brackishwater ponds and marine culture also
increased. Production value of brackishwater ponds
grew around 11.78 percent annually, while production
value of marine culture grew around 60.03 percent
annually. Production value of brackishwater ponds and
marine culture by province in 2006-2010 are presented
in Table 3.24 and 3.25.
http://www.bps.go.id
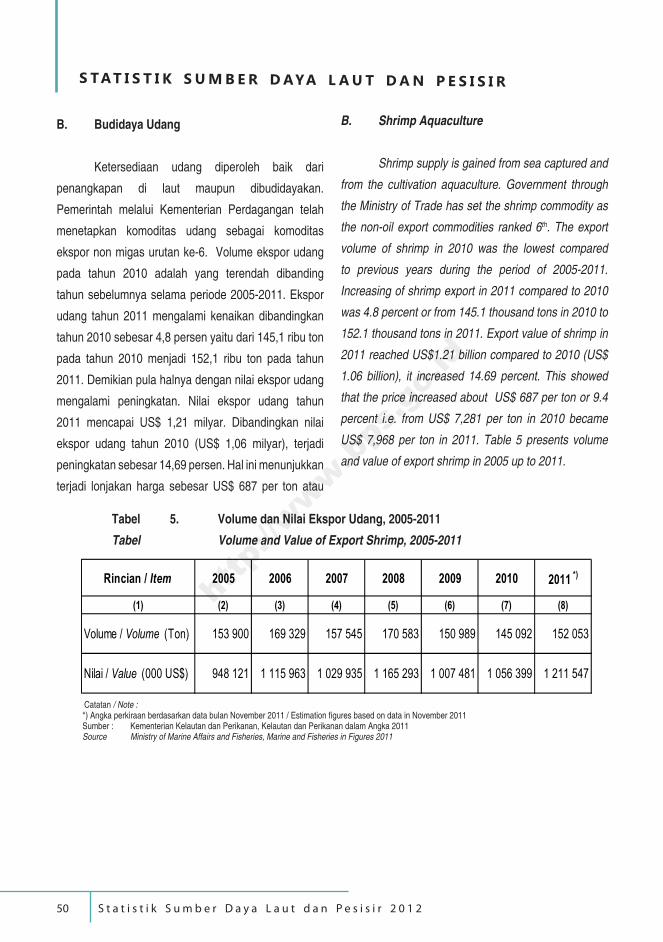
S TAT I S T I K S U M B E R D AYA L A U T D A N P E S I S I R
S t a t i s t i k S u m b e r D a y a L a u t d a n P e s i s i r 2 0 1 250
B. Budidaya Udang
Ketersediaan udang diperoleh baik dari
penangkapan di laut maupun dibudidayakan.
Pemerintah melalui Kementerian Perdagangan telah
menetapkan komoditas udang sebagai komoditas
ekspor non migas urutan ke-6. Volume ekspor udang
pada tahun 2010 adalah yang terendah dibanding
tahun sebelumnya selama periode 2005-2011. Ekspor
udang tahun 2011 mengalami kenaikan dibandingkan
tahun 2010 sebesar 4,8 persen yaitu dari 145,1 ribu ton
pada tahun 2010 menjadi 152,1 ribu ton pada tahun
2011. Demikian pula halnya dengan nilai ekspor udang
mengalami peningkatan. Nilai ekspor udang tahun
2011 mencapai US$ 1,21 milyar. Dibandingkan nilai
ekspor udang tahun 2010 (US$ 1,06 milyar), terjadi
peningkatan sebesar 14,69 persen. Hal ini menunjukkan
terjadi lonjakan harga sebesar US$ 687 per ton atau
Tabel 5. Volume dan Nilai Ekspor Udang, 2005-2011
Tabel Volume and Value of Export Shrimp, 2005-2011
Rincian / Item 2005 2006 2007 2008 2009 2010 2011 *)
(1) (2) (3) (4) (5) (6) (7) (8)
Volume / Volume (Ton) 153 900 169 329 157 545 170 583 150 989 145 092 152 053
Nilai / Value (000 US$) 948 121 1 115 963 1 029 935 1 165 293 1 007 481 1 056 399 1 211 547
Catatan / Note :*) Angka perkiraan berdasarkan data bulan November 2011 / Estimation figures based on data in November 2011Sumber : Kementerian Kelautan dan Perikanan, Kelautan dan Perikanan dalam Angka 2011Source Ministry of Marine Affairs and Fisheries, Marine and Fisheries in Figures 2011
B. Shrimp Aquaculture
Shrimp supply is gained from sea captured and
from the cultivation aquaculture. Government through
the Ministry of Trade has set the shrimp commodity as
the non-oil export commodities ranked 6th. The export
volume of shrimp in 2010 was the lowest compared
to previous years during the period of 2005-2011.
Increasing of shrimp export in 2011 compared to 2010
was 4.8 percent or from 145.1 thousand tons in 2010 to
152.1 thousand tons in 2011. Export value of shrimp in
2011 reached US$1.21 billion compared to 2010 (US$
1.06 billion), it increased 14.69 percent. This showed
that the price increased about US$ 687 per ton or 9.4
percent i.e. from US$ 7,281 per ton in 2010 became
US$ 7,968 per ton in 2011. Table 5 presents volume
and value of export shrimp in 2005 up to 2011.
http://www.bps.go.id
S TAT I S T I C S O F M A R I N E A N D C O A S TA L R E S O U R C E S
S t a t i s t i c s o f M a r i n e a n d C o a s t a l R e s o u r c e s 2 0 1 2 51
sebesar 9,4 persen, yaitu dari US$ 7.281 per ton tahun
2010 menjadi US$ 7.968 per ton tahun 2011. Tabel 5
menyajikan volume dan nilai ekspor udang tahun 2005
sampai dengan 2011.
Saat ini komoditas udang yang dibudidayakan
di Indonesia adalah jenis udang windu, udang vaname,
dan udang putih. Udang putih sangat jarang diminati
untuk dibudidayakan karena permintaan pasar lebih
condong ke udang windu dan udang vaname. Udang
windu masih dibudidayakan dengan menggunakan
teknologi sederhana atau tradisional, sedangkan
udang vaname telah berhasil dibudidayakan dengan
menerapkan teknologi intensif.
Pada tahun 2010, Provinsi Sumatera Selatan
merupakan provinsi yang menghasilkan produksi
budidaya udang paling tinggi diantara provinsi lainnnya
yaitu menyumbang sebesar 16,83 persen produksi
budidaya udang nasional. Jenis udang vaname adalah
jenis udang yang paling banyak diproduksi. Tercatat
sebesar 206,6 ribu ton atau 54,46 persen dari total
produksi budidaya udang tahun 2010 merupakan
jenis vaname. Niilai produksi jenis ikan vaname juga
mempunyai nilai produksi lebih tinggi. Nilai produksi
budidaya udang vaname tahun 2010 mencapai Rp.
8,18 trilyun. Produksi dan nilai budidaya udang tahun
2010 menurut provinsi dan jenis udang disajikan pada
Tabel 3.26 dan 3.27.
1). Udang Windu
Udang windu merupakan udang asli Indonesia,
memiliki pertumbuhan yang cepat dan dapat mencapai
ukuran yang besar. Baru-baru ini udang windu mendapat
perhatian khusus dari konsumen di Eropa sebagai
The current commodity of shrimp that is grown
in Indonesia is the type of black tiger shrimp, vaname
shrimp, and white shrimp. The white shrimp are rarely
desirable to cultivated, this is due to the market demand
which prefer black tiger shrimp and vaname shrimp.
Black tiger shrimp cultivaton is still using a convensional
or traditional technology, while vaname shrimp
been successfully cultivated by applying intensive
technologies.
In 2010, Sumatera Selatan was a province that
produces the highest shrimp aquaculture production
among the provinces which contributed about 16.83
percent of national shrimp aquaculture production.
Vaname shrimp was the most produced shrimp type.
Vaname shrimp production in 2010 was about 206.6
thousand tons or 54.46 percent of the total production of
shrimp aquaculture. Production values vaname shrimp
typr also has higher production value. Production value
of black tiger shrimp in 2010 reached 8.18 trillion rupiahs.
Production and value of shrimp in 2010 by province and
type of shrimp are presented in Table 3.26 and 3.27.
1). Black tiger shrimp
Black tiger shrimp is the native of Indonesian
shrimp, grow quickly and can reach a large sizes.
Recently, black tiger shrimp gain special attention
from consumers in Europe as the quality in compete
http://www.bps.go.id
S TAT I S T I K S U M B E R D AYA L A U T D A N P E S I S I R
S t a t i s t i k S u m b e r D a y a L a u t d a n P e s i s i r 2 0 1 252
udang ekstensif yang kualitasnya mendekati udang
organik. Oleh karena itu, pengembangan budidaya
udang windu menjadi sangat penting meskipun dengan
teknologi sederhana atau ekstensif. Hasil penelitian
menunjukkan bahwa tingkat keberhasilannya akan
lebih tinggi apabila dilaksanakan secara polikultur, yaitu
budidaya campuran antara udang dengan bandeng
dan rumput laut. Budidaya udang secara polikultur ini
dinilai cukup bagus karena menghasilkan sekaligus
tiga komoditas ekspor. Pada umumnya, masyarakat
menerapkan budidaya udang windu secara tradisional,
berupa penggunaan induk hasil tangkapan, pakan
alami, dan tidak diberi obat-obatan maupun antibiotik.
Saat ini, budidaya udang windu mengalami
keterpurukkan, karena sulit diperoleh bibit (benur)
unggulan. Induk udang yang umumnya diperoleh dari
hasil tangkapan, banyak yang terinfeksi penyakit,
seperti penyakit white spot dan Monodon Baculo Virus
(MBV). Penyakit ini sebagai akibat tingginya tingkat
pencemaran limbah di laut. Hal ini menjadikan salah
satu alasan bagi Jepang untuk mengalihkan impor
udang windu mereka dari Indonesia ke Vietnam.
Perkembangan jumlah produksi budidaya
udang windu sejak lima tahun terakhir berfluktuatif.
Pada tahun 2007 dan 2009 mengalami penurunan,
produksi budidaya udang windu mencapai 133,1 ribu
ton di tahun 2007 dan 124,6 ribu ton di tahun 2009. Di
tahun 2008 dan 2010 mengalami kenaikan produksi
yaitu sebesar 134,9 ribu ton di tahun 2008 sedangkan
pada tahun 2010 naik menjadi 125,5 ribu ton. Tabel 3.28
menyajikan produksi udang windu tahun 2006–2010.
with the organic shrimp. Therefore, the development
of black tiger shrimp farming becomes very important
even though its application with a simple technology
or extensive. The results showed that the success
rate will be higher when cultivation using polyculture
is implemented in, the polyculture is the cultivation by
mixing shrimp with milkfish and seaweed. Cultivating
shrimp in polyculture is considered beneficial due to
the production of three export commodities at the same
time. In general, people applying traditional shrimp
farming, they use the holding catches, feed with natural
food, and not given drugs or antibiotics.
Currently, black tiger shrimp farming has been
experiencing an obscurity, this is due to the difficulty to
find a good seed. Parent shrimp which caughtare already
infected by many diseases. The disease, among others,
is a white spot and Monodon Baculo Virus (MBV). The
disease is due to the high level of waste pollution at
sea. This is one reason for Japan to divert their shrimp
imports from Indonesia to Vietnam.
The number of black tiger shrimp production
since the last five years fluctuated. In 2007 and 2009,
decreased, black tiger shrimp production reached 133.1
thousand tons in 2007 and 124.6 thousand tons in 2009.
In 2008 and 2010 the production increased by 134.9
thousand tons in 2008, whereas in 2010 became 125.5
thousand tons.Table 3.28 present the black tiger shrimp
production in 2006-2010.
http://www.bps.go.id
S TAT I S T I C S O F M A R I N E A N D C O A S TA L R E S O U R C E S
S t a t i s t i c s o f M a r i n e a n d C o a s t a l R e s o u r c e s 2 0 1 2 53
2). Udang Vaname
Udang Vaname adalah udang yang memiliki
karakteristik kultur yang unggul, dan mempunyai
toleransi salinitas yang lebar (2-40 ppt). Rasa dari
udang vaname dipengaruhi oleh tingkat asam amino
bebas dalam otot. Udang vaname sangat cocok hidup
pada suhu hangat, temperatur yang sesuai adalah
23-30 0C. Udang yang dijadikan induk sebaiknya
bersifat Specific Pathogen Free (SPF) karena memiliki
keunggulan tahan terhadap beberapa penyakit yang
biasa menyerang udang seperti white spot (KKP, 2009).
Produksi budidaya udang vaname dari tahun
ke tahun cenderung mengalami peningkatan. Produksi
udang vaname pada tahun 2006 baru mencapai 141,7
ribu ton. Pada tahun 2010 sudah mencapai 206,5 ribu
ton atau mengalami pertumbuhan sebesar 9,88 persen
per tahun. Data produksi budidaya udang vaname
selama kurun waktu 2006-2010 disajikan pada Tabel
3.30.
C. Budidaya Rumput Laut
Produk rumput laut yang dihasilkan dari
sekitar 90 persen total pesisir di seluruh Indonesia,
menjadikan Indonesia sebagai penghasil rumput laut
terbesar di dunia. Dari rumput laut, Indonesia mampu
menghasilkan 500 jenis produk akhir di seluruh industri
dunia. Di antaranya kosmetik, farmasi, pangan, hingga
kertas dan biofuel (Nurifah, 2010).
Kebutuhan rumput laut dari tahun ke tahun
selalu meningkat. Peningkatan ini disebabkan adanya
permintaan pasar dari dalam dan luar negeri. Produksi
budidaya rumput laut di Indonesia selama kurun waktu
2). Vaname Shrimp
Vaname shrimp has a superior characteristic for
aquaculture and have a great tolerance of salinity (2-
40 ppt). Taste of vaname shrimp is influenced by the
level of free amino acids in its muscle. Vaname shrimp
is living in warm temperture, the suitable temperatures
is 23-30 degrees Celsius. Parent shrimp should hold
the Specific Pathogen Free (SPF) for its resistance
to diseases that usually attacked such as white spot
shrimp (KKP, 2009).
The production of vaname shrimp is increased
from year to year. Vaname shrimp production in 2006
reached 141.7 thousand tons. In 2010, the vaname
shrimp production rose to 206.5 thousand tons or
growth 9.88 percent annually. During the period 2006-
2010,the production data of vaname shrimp aquaculture
is presented in Table 3.30.
C. Seaweed Cultivation
Seaweed products produced from about 90
percent of total coastal areas around Indonesia, make
Indonesia as the largest seaweed producer in the world.
From seaweed, Indonesia is able to produce 500 types
of final products throughout the world industry, including
cosmetics, pharmaceutical, food, until paper and biofuel
(Nurifah, 2010).
The demand for seaweed from year to year
is always increasing. The increase is due to market
demand for domestic and abroad. Seaweed production
in Indonesia during the period 2006-2010 increased
http://www.bps.go.id
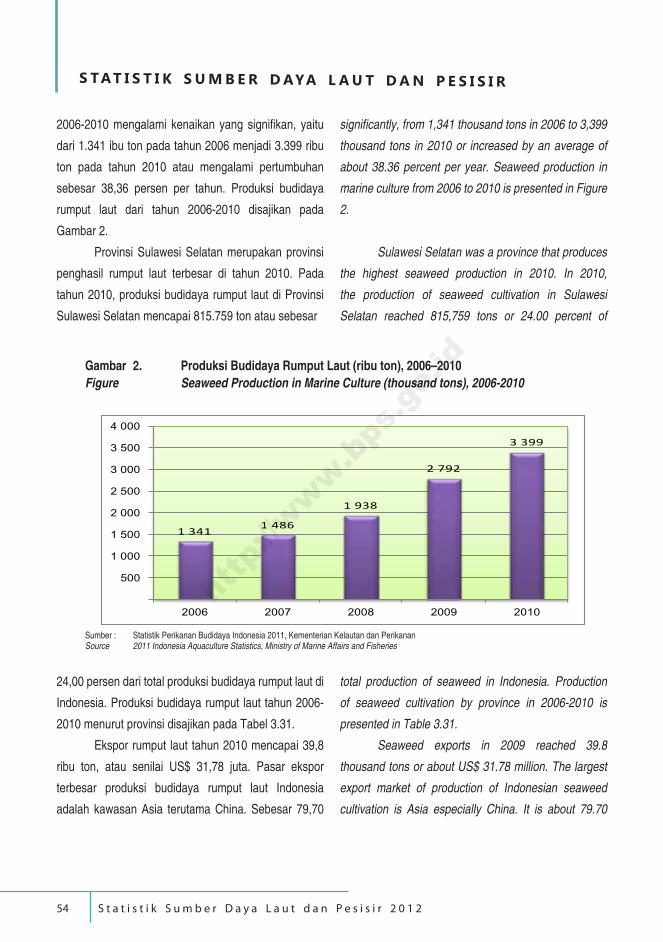
S TAT I S T I K S U M B E R D AYA L A U T D A N P E S I S I R
S t a t i s t i k S u m b e r D a y a L a u t d a n P e s i s i r 2 0 1 254
2006-2010 mengalami kenaikan yang signifikan, yaitu
dari 1.341 ibu ton pada tahun 2006 menjadi 3.399 ribu
ton pada tahun 2010 atau mengalami pertumbuhan
sebesar 38,36 persen per tahun. Produksi budidaya
rumput laut dari tahun 2006-2010 disajikan pada
Gambar 2.
Provinsi Sulawesi Selatan merupakan provinsi
penghasil rumput laut terbesar di tahun 2010. Pada
tahun 2010, produksi budidaya rumput laut di Provinsi
Sulawesi Selatan mencapai 815.759 ton atau sebesar
Gambar 2. Produksi Budidaya Rumput Laut (ribu ton), 2006–2010
Figure Seaweed Production in Marine Culture (thousand tons), 2006-2010
Sumber : Statistik Perikanan Budidaya Indonesia 2011, Kementerian Kelautan dan PerikananSource 2011 Indonesia Aquaculture Statistics, Ministry of Marine Affairs and Fisheries
1 3411 486
1 938
2 792
3 399
500
1 000
1 500
2 000
2 500
3 000
3 500
4 000
2006 2007 2008 2009 2010
24,00 persen dari total produksi budidaya rumput laut di
Indonesia. Produksi budidaya rumput laut tahun 2006-
2010 menurut provinsi disajikan pada Tabel 3.31.
Ekspor rumput laut tahun 2010 mencapai 39,8
ribu ton, atau senilai US$ 31,78 juta. Pasar ekspor
terbesar produksi budidaya rumput laut Indonesia
adalah kawasan Asia terutama China. Sebesar 79,70
total production of seaweed in Indonesia. Production
of seaweed cultivation by province in 2006-2010 is
presented in Table 3.31.
Seaweed exports in 2009 reached 39.8
thousand tons or about US$ 31.78 million. The largest
export market of production of Indonesian seaweed
cultivation is Asia especially China. It is about 79.70
significantly, from 1,341 thousand tons in 2006 to 3,399
thousand tons in 2010 or increased by an average of
about 38.36 percent per year. Seaweed production in
marine culture from 2006 to 2010 is presented in Figure
2.
Sulawesi Selatan was a province that produces
the highest seaweed production in 2010. In 2010,
the production of seaweed cultivation in Sulawesi
Selatan reached 815,759 tons or 24.00 percent of
http://www.bps.go.id
S TAT I S T I C S O F M A R I N E A N D C O A S TA L R E S O U R C E S
S t a t i s t i c s o f M a r i n e a n d C o a s t a l R e s o u r c e s 2 0 1 2 55
persen produksi rumput laut Indonesia diekspor ke
kawasan Asia, dilanjutkan kawasan Eropa 12,42
persen, Amerika 7,34 persen, Australia 0,36 persen dan
Afrika 0,18 persen.
Potensi sumber daya rumput laut di
Indonesia masih melimpah hampir di seluruh perairan
pantai di pulau besar dan kecil. Namun demikian,
pemanfaatannya masih terbatas di perairan pantai
yang terjangkau oleh para nelayan pencari rumput
laut, sedangkan di pulau-pulau terpencil masih
banyak yang belum terjamah. Kendala utama adalah
karena mahalnya biaya transportasi antar pulau, yang
belum diimbangi harga jual produksi rumput laut yang
memadai.
Saat ini terdapat 23 perusahaan yang bergerak
di industri pengolahan rumput laut, baik sebagai
penghasil produk agar-agar maupun kerajinan.
Sayangnya semua perusahaan tersebut hanya mampu
sebagai penghasil bahan baku. Sebanyak 80 persen
ekspor merupakan produk rumput laut kering sehingga
kurang memberi nilai tambah bagi Indonesia.
Ekspor rumput laut ke China tahun 2009
mencapai 16.329 ton atau sebesar 41 persen dari total
ekspor rumput laut. Menurut Nurifah (2010), sebagian
ekspor ke China tersebut diolah kembali di sana di
mana 75 persen hasil olahannya diekspor ke Eropa.
Seharusnya Indonesia mempunyai industri sendiri
sehingga bisa lebih memberi nilai tambah.
3.4. Perdagangan Perikanan
Produk Domestik Bruto (PDB) subsektor
perikanan berperan strategis dalam memberikan
percent of Indonesia seaweed production was exported
to Asia region, 12.42 percent was exported to Europe
region, 7.34 percent to America, 0.36 percent to
Australia and 0.18 percent to Africa.
The potential of seaweed resources in
Indonesia are still in an abundant in almost all coastal
waters in large and small islands. However, the
utilization is still limited in coastal waters covered by the
seaweedfishermen, while the outlying islands are still
much untapped. The main obstacle is the high costs of
transportation between islands, which have not been
balanced by an adequate selling price of seaweed.
Currently, there are 23 companies specializing
in seaweed processing industry, both as producer of
gelatin products and crafts. Unfortunately, all these
companies are only able as the producer of raw
materials. As many as 80 percent of exports are dried
seaweed so that give less contribution of adding value
to Indonesia.
Seaweed exports to China in 2009 reached
16,329 tons or 41 percent of total seaweed exports.
According to Nurifah (2010), most of these exports to
China processed again in there, which 75 percent of
their processed products were exported to Europe.
Indonesia should have its own industry so they can give
more adding value.
3.4. Fishery Trade
Gross Domestic Product (GDP) from the
fisheries sub-sector contributes a strategic role to
http://www.bps.go.id
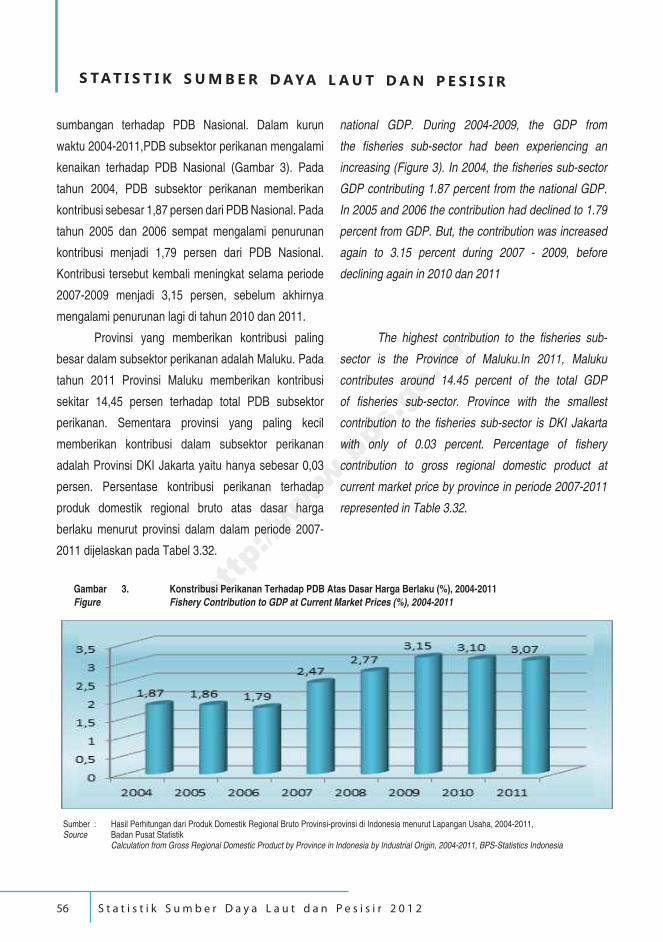
S TAT I S T I K S U M B E R D AYA L A U T D A N P E S I S I R
S t a t i s t i k S u m b e r D a y a L a u t d a n P e s i s i r 2 0 1 256
sumbangan terhadap PDB Nasional. Dalam kurun
waktu 2004-2011,PDB subsektor perikanan mengalami
kenaikan terhadap PDB Nasional (Gambar 3). Pada
tahun 2004, PDB subsektor perikanan memberikan
kontribusi sebesar 1,87 persen dari PDB Nasional. Pada
tahun 2005 dan 2006 sempat mengalami penurunan
kontribusi menjadi 1,79 persen dari PDB Nasional.
Kontribusi tersebut kembali meningkat selama periode
2007-2009 menjadi 3,15 persen, sebelum akhirnya
mengalami penurunan lagi di tahun 2010 dan 2011.
Provinsi yang memberikan kontribusi paling
besar dalam subsektor perikanan adalah Maluku. Pada
tahun 2011 Provinsi Maluku memberikan kontribusi
sekitar 14,45 persen terhadap total PDB subsektor
perikanan. Sementara provinsi yang paling kecil
memberikan kontribusi dalam subsektor perikanan
adalah Provinsi DKI Jakarta yaitu hanya sebesar 0,03
persen. Persentase kontribusi perikanan terhadap
produk domestik regional bruto atas dasar harga
berlaku menurut provinsi dalam dalam periode 2007-
2011 dijelaskan pada Tabel 3.32.
national GDP. During 2004-2009, the GDP from
the fisheries sub-sector had been experiencing an
increasing (Figure 3). In 2004, the fisheries sub-sector
GDP contributing 1.87 percent from the national GDP.
In 2005 and 2006 the contribution had declined to 1.79
percent from GDP. But, the contribution was increased
again to 3.15 percent during 2007 - 2009, before
declining again in 2010 dan 2011
The highest contribution to the fisheries sub-
sector is the Province of Maluku.In 2011, Maluku
contributes around 14.45 percent of the total GDP
of fisheries sub-sector. Province with the smallest
contribution to the fisheries sub-sector is DKI Jakarta
with only of 0.03 percent. Percentage of fishery
contribution to gross regional domestic product at
current market price by province in periode 2007-2011
represented in Table 3.32.
Gambar 3. Konstribusi Perikanan Terhadap PDB Atas Dasar Harga Berlaku (%), 2004-2011
Figure Fishery Contribution to GDP at Current Market Prices (%), 2004-2011
Sumber : Hasil Perhitungan dari Produk Domestik Regional Bruto Provinsi-provinsi di Indonesia menurut Lapangan Usaha, 2004-2011, Source Badan Pusat Statistik Calculation from Gross Regional Domestic Product by Province in Indonesia by Industrial Origin, 2004-2011, BPS-Statistics Indonesia
http://www.bps.go.id
S TAT I S T I C S O F M A R I N E A N D C O A S TA L R E S O U R C E S
S t a t i s t i c s o f M a r i n e a n d C o a s t a l R e s o u r c e s 2 0 1 2 57
3.4.1. Fishery Exports
The exports volume of fishery in the period 2005-
2009 was fluctuatively. The exports volume of fishery in
2006 reached 926.5 thousand tons or increased 8.01
percent compared to the exports volume of fishery in
2005 (857.8 thousand tons). Futhermore, decreasing
in the exports volume of fishery in 2007 amounted to
7.79 percent, then increased again by 6.71 percent in
2008 and decreased around 3.32 percent in 2009. Then
increased to 25.21 percent in 2010 (Figure 4).
Jawa Timur was a province that produce the
highest exports volume of fishery product. In 2010,
the exports volume of fishery product in Jawa Timur
amounted to 343.0 thousand tons or approximately 31.1
percent of the total exports volume of fishery in Indonesia
which reached 1,103.6 thousand tons. Volume of export
on fishery products by province in 2006-2010 can be
seen di Table 3.33.
The exports value of fishery product tend to
increased during the period 2006-2010. The exports
value of fishery in 2006 reached US$ 2.1 billion,
increased to US$ 2.9 billion in 2010. During that period
there was an increasing of US$ 760 million with an
average growth of 8.02 percent per year. The export
value of fishery products in 2010 increased compared
to the value of exports in 2009 which is an increase of
US$ 398 million or up to 3.81 percent.
Java Island, especially Jawa Timur Province
greatly contributed to the exports value of fishery
3.4.1. Ekspor Perikanan
Volume ekspor hasil perikanan pada periode
2005–2010 mengalami fluktuasi. Volume ekspor
hasil perikanan tahun 2006 mencapai 926,5 ribu ton
atau meningkat 8,01 persen dibandingkan volume
ekspor hasil perikanan tahun 2005 (857,8 ribu ton).
Selanjutnya, terjadi penurunan volume ekspor hasil
perikanan tahun 2007 sebesar 7,79 persen, kemudian
meningkat kembali sebesar 6,71 persen pada tahun
2008 dan mengalami penurunan sebesar 3,32 persen
tahun 2009. Selanjutnya di tahun 2010 mengalami
peningkatan sebesar 25,21 persen (Gambar 4).
Provinsi Jawa Timur merupakan provinsi yang
volume ekspor hasil perikanannya terbesar. Pada tahun
2010, volume ekspor hasil perikanan di Jawa Timur
sebesar 343,0 ribu ton atau sekitar 31,1 persen dari total
ekspor perikanan di Indonesia yang mencapai 1.103,6
ribu ton. Volume ekspor hasil perikanan menurut
provinsi tahun 2006-2010 dapat dilihat di Tabel 3.33.
Nilai ekspor hasil perikanan cenderung
meningkat selama kurun waktu 2006-2010. Nilai ekspor
hasil perikanan tahun 2006 mencapai US$ 2,1 miliar,
meningkat menjadi US$ 2,9 miliar pada tahun 2010.
Selama periode tersebut terjadi kenaikan sebesar US$
760 juta dengan rata-rata pertumbuhan sebesar 8,02
persen per tahun. Nilai ekspor hasil perikanan tahun
2010 meningkat dibandingkan nilai ekspor tahun 2009
yaitu terjadi kenaikan sebesar US$ 398 juta atau naik
menjadi 3,81 persen.
Pulau Jawa terutama Provinsi Jawa Timur
memberikan kontribusi yang besar terhadap nilai ekspor
http://www.bps.go.id
S TAT I S T I K S U M B E R D AYA L A U T D A N P E S I S I R
S t a t i s t i k S u m b e r D a y a L a u t d a n P e s i s i r 2 0 1 258
hasil perikanan nasional. Total ekspor hasil perikanan
dari Pulau Jawa tahun 2010 mencapai US$ 1,83 miliar
atau sebesar 63,9 persen. Nilai ekspor hasil perikanan
menurut provinsi tahun 2006-2010 selengkapnya dapat
dilihat pada Tabel 3.34.
Kontribusi nilai ekspor hasil perikanan tahun
2010 mengalami penurunan dibanding tahun 2009.
Pada tahun 2010 kontribusi nilai ekspor dari hasil
perikanan mencapai 1,82 persen, sedangkan tahun
2009 sebesar 2,12 persen. Total nilai ekspor tahun
2010 mencapai US$ 157,8 miliar, sedangkan tahun
2009 mencapai US$ 116,5 miliar. Kontribusi nilai ekspor
tahun 2009 dan 2010 menurut provinsi disajikan pada
Tabel 3.35.
Prospek sektor perikanan Indonesia untuk
ekspor sangat cerah karena permintaan dan kebutuhan
ikan dunia terus meningkat dari tahun ke tahun.
Selain peluang pasar yang sangat besar, ekspor hasil
perikanan Indonesia juga mengalami beberapa kendala.
Salah satunya adalah sertifikasi sebagai syarat ekspor
yang diwajibkan pasar Uni Eropa. Hasil perikanan yang
ditangkap dari laut harus memiliki sertifikasi tangkap
serta kriteria mengenai aturan-aturan pengelolaan yang
baik dan ramah lingkungan (Bisnis Bali, 2010).
Selain sertifikasi, kendala lain yang dihadapi
Indonesia adalah adanya penolakan produk perikanan
di kawasan Uni Eropa. Penolakan produk perikanan dari
Indonesia biasanya dikarenakan adanya kontaminasi
logam berat dan zat kimia (antibiotik). Berdasarkan
data dari RASFF (Rapert Alert System for Food and
Feed), sebuah lembaga di Uni Eropa yang mengurus
keamanan komoditas pangan kawasan itu, Indonesia
berada di posisi ke-18 pada tahun 2010 dengan 11
product. Total exports value of fishery product from
Java Island in 2010 reached US$ 1.83 billion or about
63.9 percent. Value of exports on fishery product by
province in 2006-2010 can be seen in Table 3.34.
Contribution of exports value of fishery product
in 2010 has decreased compare to 2009. In 2010, the
contribution of exports value of fishery product reached
1.82 percent, while in 2009 reached 2.12 percent. Total
exports value in 2010 reached US$ 157.8 billion, while
in 2009 reached US$ 116.5 billion. The contribution
of exports value in 2009 and 2010 by province are
presented in Table 3.35.
Prospects of Indonesia fishery exports
are prospective because world’s fish demand is
increasing from year to year. Beside have large market
opportunities, exports of Indonesian fishery is also
have some problems. One of these problems is the
certification required as a condition of exports market
of European Union. Fishery products that are caught
from the sea must have a catch certification and the
criteria regarding the rules of good management and
environmentally friendly (Bisnis Bali, 2010).
Besides certification, other constraint that is
faced by Indonesia is the prohibition of fishery products
in European Union region. The prohibiton of Indonesian
fishery products due to suspects of contamination of
heavy metals and chemicals (antibiotics) substances.
Based on data from RASFF (Rapert Alert System
for Food and Feed),an institution inthe European
Union which administersthe region’s security offood
commodities, Indonesia was in18th positionin 2010
http://www.bps.go.id
S TAT I S T I C S O F M A R I N E A N D C O A S TA L R E S O U R C E S
S t a t i s t i c s o f M a r i n e a n d C o a s t a l R e s o u r c e s 2 0 1 2 59
kasus penolakan komoditas hasil perikanan oleh Uni
Eropa. Badan Karantina Ikan dan Pengendalian Mutu
(BKIPM) KKP bertekad untuk meminimalkan jumlah
penolakan komoditas hasil perikanan Indonesia yang
dikirim ke Uni Eropa bahkan hingga mencapai nol atau
tidak ada kasus (http://medanbisnisdaily.com diakses
15 september 2011).
Tabel 3.36 menyajikan volume dan nilai ekspor
hasil perikanan menurut kelompok komoditi. Pada
tahun 2010, produk ikan (hidup atau mati) segar atau
beku merupakan kelompok komoditi dengan volume
ekspor terbesar, sedangkan untuk nilai ekspor terbesar
adalah komoditi binatang berkulit keras dan lunak,
hidup, segar, dingin, beku, kering, asin dalam air garam
3.4.2. Impor Perikanan
Walaupun Indonesia memiliki potensi perikanan
yang besar, namun kenyataannya Indonesia masih
mengimpor ikan dari negara lain. Volume impor
hasil perikanan Indonesia setiap tahun cenderung
meningkat, namun nilainya masih dibawah nilai ekspor
hasil perikanan Indonesia.
Pada tahun 2005, impor hasil perikanan
mencapai 151,0 ribu ton, sedangkan pada tahun 2010
mencapai 369,3 ribu ton (Gambar 4). Pada periode
tersebut terjadi kenaikan dengan pertumbuhan sebesar
19,59 persen per tahun. Selama periode tahun 2005-
2010, volume impor hasil perikanan meningkat tiap
tahun kecuali di tahun 2007 yang mengalami penurunan
dibanding tahun sebelumnya. Provinsi DKI Jakarta
merupakan provinsi yang paling banyak melakukan
with 11 cases ofrejectionof fishery commodities by the
European Union. Fish Quarantine and Quality Control
(BKIPM) Ministry of Marine Affairs and Fisheries
determined to minimize the amount of rejection of
Indonesianf ishery commodities that aresent tothe
European Union until it reaches zero or even no cases
(http://medanbisnisdaily.com accessed on September
15, 2011).
Table 3.36 presents volume and value of
exports by fishery commodity groups. In 2010, the
product of fish (dead or alive) chilled or frozen was a
commodity group with the highest exports volume, while
for the highest exports value was crustaceans and
mollucs fresh, chilled, frozen, not frozen, dried, salted
commodity.
3.4.2. Fishery Imports
Although Indonesia has an abundant of fisheries
resources, Indonesia still importing fishery product
from other countries. The import volume of Indonesian
fishery product are continues to increase every year, but
the value is still below theexports value of Indonesian
fishery products.
The imports of fishery products in 2005 reached
151.0 thousand tons(Figure 4), whereas in 2010
reached 369.3 thousand tons. In that period, there
was an increasing with a growth rate of 19.59 percent
per year. During period 2005-2010, imports volume of
fishery products increased every year except in 2007
that has decreased compared to previous year. DKI
Jakarta Province is the largest consument of fishery
product imports in 2010 that reached 200.5 thousand
http://www.bps.go.id
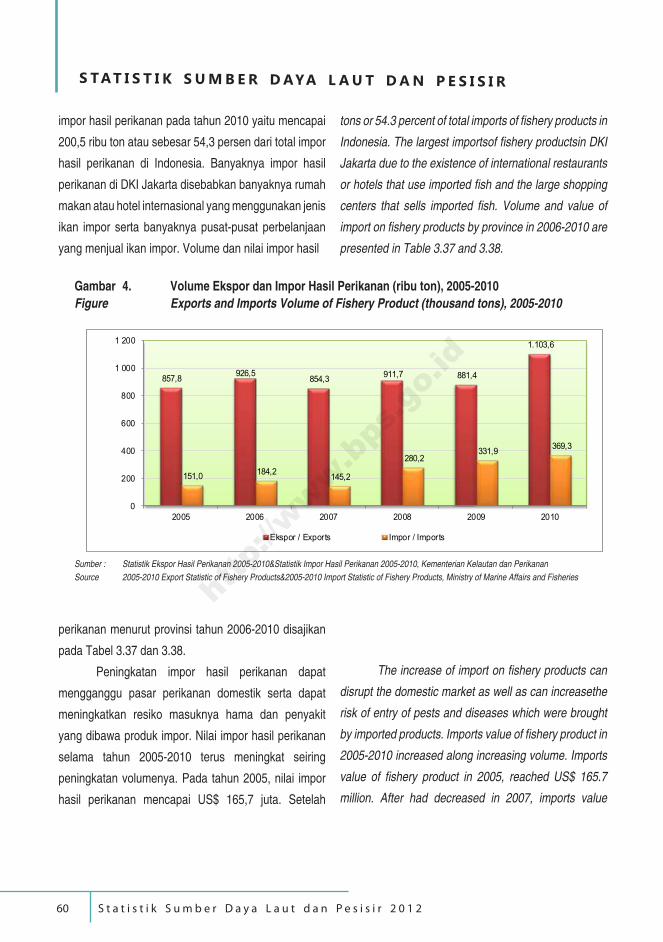
S TAT I S T I K S U M B E R D AYA L A U T D A N P E S I S I R
S t a t i s t i k S u m b e r D a y a L a u t d a n P e s i s i r 2 0 1 260
impor hasil perikanan pada tahun 2010 yaitu mencapai
200,5 ribu ton atau sebesar 54,3 persen dari total impor
hasil perikanan di Indonesia. Banyaknya impor hasil
perikanan di DKI Jakarta disebabkan banyaknya rumah
makan atau hotel internasional yang menggunakan jenis
ikan impor serta banyaknya pusat-pusat perbelanjaan
yang menjual ikan impor. Volume dan nilai impor hasil
tons or 54.3 percent of total imports of fishery products in
Indonesia. The largest importsof fishery productsin DKI
Jakarta due to the existence of international restaurants
or hotels that use imported fish and the large shopping
centers that sells imported fish. Volume and value of
import on fishery products by province in 2006-2010 are
presented in Table 3.37 and 3.38.
Gambar 4. Volume Ekspor dan Impor Hasil Perikanan (ribu ton), 2005-2010
Figure Exports and Imports Volume of Fishery Product (thousand tons), 2005-2010
857,8 926,5
854,3 911,7 881,4
1.103,6
151,0 184,2
145,2
280,2 331,9
369,3
0
200
400
600
800
1 000
1 200
2005 2006 2007 2008 2009 2010
Ekspor / Exports Impor / Imports
Sumber : Statistik Ekspor Hasil Perikanan 2005-2010&Statistik Impor Hasil Perikanan 2005-2010, Kementerian Kelautan dan Perikanan
Source 2005-2010 Export Statistic of Fishery Products&2005-2010 Import Statistic of Fishery Products, Ministry of Marine Affairs and Fisheries
perikanan menurut provinsi tahun 2006-2010 disajikan
pada Tabel 3.37 dan 3.38.
Peningkatan impor hasil perikanan dapat
mengganggu pasar perikanan domestik serta dapat
meningkatkan resiko masuknya hama dan penyakit
yang dibawa produk impor. Nilai impor hasil perikanan
selama tahun 2005-2010 terus meningkat seiring
peningkatan volumenya. Pada tahun 2005, nilai impor
hasil perikanan mencapai US$ 165,7 juta. Setelah
The increase of import on fishery products can
disrupt the domestic market as well as can increasethe
risk of entry of pests and diseases which were brought
by imported products. Imports value of fishery product in
2005-2010 increased along increasing volume. Imports
value of fishery product in 2005, reached US$ 165.7
million. After had decreased in 2007, imports value
http://www.bps.go.id
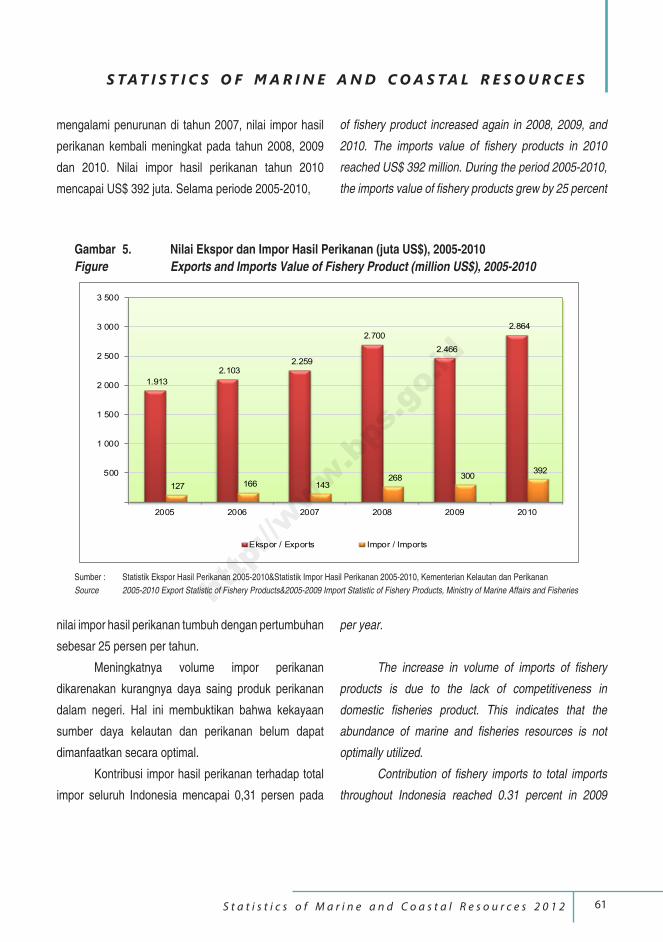
S TAT I S T I C S O F M A R I N E A N D C O A S TA L R E S O U R C E S
S t a t i s t i c s o f M a r i n e a n d C o a s t a l R e s o u r c e s 2 0 1 2 61
mengalami penurunan di tahun 2007, nilai impor hasil
perikanan kembali meningkat pada tahun 2008, 2009
dan 2010. Nilai impor hasil perikanan tahun 2010
mencapai US$ 392 juta. Selama periode 2005-2010,
of fishery product increased again in 2008, 2009, and
2010. The imports value of fishery products in 2010
reached US$ 392 million. During the period 2005-2010,
the imports value of fishery products grew by 25 percent
Gambar 5. Nilai Ekspor dan Impor Hasil Perikanan (juta US$), 2005-2010
Figure Exports and Imports Value of Fishery Product (million US$), 2005-2010
1.913
2.1032.259
2.700
2.466
2.864
127 166 143268 300
392 500
1 000
1 500
2 000
2 500
3 000
3 500
2005 2006 2007 2008 2009 2010
Ekspor / Exports Impor / Imports
Sumber : Statistik Ekspor Hasil Perikanan 2005-2010&Statistik Impor Hasil Perikanan 2005-2010, Kementerian Kelautan dan PerikananSource 2005-2010 Export Statistic of Fishery Products&2005-2009 Import Statistic of Fishery Products, Ministry of Marine Affairs and Fisheries
nilai impor hasil perikanan tumbuh dengan pertumbuhan
sebesar 25 persen per tahun.
Meningkatnya volume impor perikanan
dikarenakan kurangnya daya saing produk perikanan
dalam negeri. Hal ini membuktikan bahwa kekayaan
sumber daya kelautan dan perikanan belum dapat
dimanfaatkan secara optimal.
Kontribusi impor hasil perikanan terhadap total
impor seluruh Indonesia mencapai 0,31 persen pada
per year.
The increase in volume of imports of fishery
products is due to the lack of competitiveness in
domestic fisheries product. This indicates that the
abundance of marine and fisheries resources is not
optimally utilized.
Contribution of fishery imports to total imports
throughout Indonesia reached 0.31 percent in 2009
http://www.bps.go.id
S TAT I S T I K S U M B E R D AYA L A U T D A N P E S I S I R
S t a t i s t i k S u m b e r D a y a L a u t d a n P e s i s i r 2 0 1 262
tahun 2009 dan mengalami penurunan menjadi 0,29
persen pada tahun 2010. Persentase nilai impor hasil
perikanan tahun 2009-2010 menurut provinsi disajikan
pada Tabel 3.39. Pada tahun 2010, impor komoditi ikan
(hidup atau mati) segar atau beku merupakan komoditi
terbesar, baik dari volume maupun nilainya. Volume dan
nilai impor hasil perikanan menurut komoditi disajikan
pada Tabel 3.40.
3.5. Konsumsi Perikanan
Berdasarkan data Susenas (Survei Sosial
Ekonomi Nasional) Panel Maret 2011, rata-rata
konsumsi ikan segar dan udang/hewan air segar
perkapita per hari sebesar 5,42 gram. Sedangkan rata-
rata konsumsi ikan diawetkan dan udang/hewan air
yang diawetkan sebesar 2,61 gram per kapita per hari.
Jadi setiap orang rata-rata mengkonsumsi ikan sebesar
8,03 gram per hari. Dengan penduduk mencapai 237,56
juta jiwa pada tahun 2010, total konsumsi ikan pada
tahun 2010 mencapai 3,86 juta ton, atau sebesar 39,34
persen terhadap produksi perikanan di Indonesia.
Pada tahun 2010, nilai konsumsi ikan perkapita
per bulan sebesar Rp. 21.467 meningkat menjadi Rp.
25.369 pada tahun 2011. Nilai konsumsi ikan di daerah
perkotaan lebih tinggi dibanding daerah perdesaan
di tahun 2010, sedangkan di tahun 2011 berlaku
sebaliknya nilai konsumsi di daerah perdesaan lebih
tingi dibanding perkotaan. Persentase konsumsi ikan
terhadap total konsumsi hanya sebesar 4,34 persen
pada tahun 2010 dan tahun 2011 mengalami penurunan
menjadi 4,27 persen (Tabel 6). Di daerah perdesaan,
persentase terhadap total konsumsinya lebih besar
daripada daerah perkotaan.
and decreased to 0.29 in 2010. Percentage of imports
value on fishery products by province in 2009-2010 is
presented in Table 3.39. In 2010, the largest import
of fishery commodity was import of fish (dead or live)
chilled or frozen was the largest commodity in the term
of both volume and value. Volume and value of imports
of fishery products by commodity is presented in Table
3.40.
3.5. Fish Consumption
Based on National Social Economic Survey
(Susenas) Panel data in March 2011, the average
consumption per capita per day for fresh fish and
shrimp/fresh water animals was 5.42 gram. Whereas the
average consumption per capita per day for preserved
fish and shrimp/preserved water animals was 2.61
gram. Therefore, each person consumes an average of
8.03 gram fish per day. With population reached 237.56
million people in 2010, total of fish consumption in 2010
reached 3.86 million tons or 39.34 percent of fishery
production in Indonesia.
In 2010, value of fish consumption around
21,467 rupiahs percapita per month, increased to
25,369 rupiahs percapita per month in 2011. Value of
fish consumption in urban region is higher than in rural
region in 2010, whereas in 2011 to reverse the value
of fish consumption in rural region is higher than in
urban region. Percentage of fish consumption to total
consumption was only 4.34 percent in 2010 and in 2011
has decreased to 4.27 percent (Table 6). In rural region,
the percentage to total consumption higher than urban
region.
http://www.bps.go.id
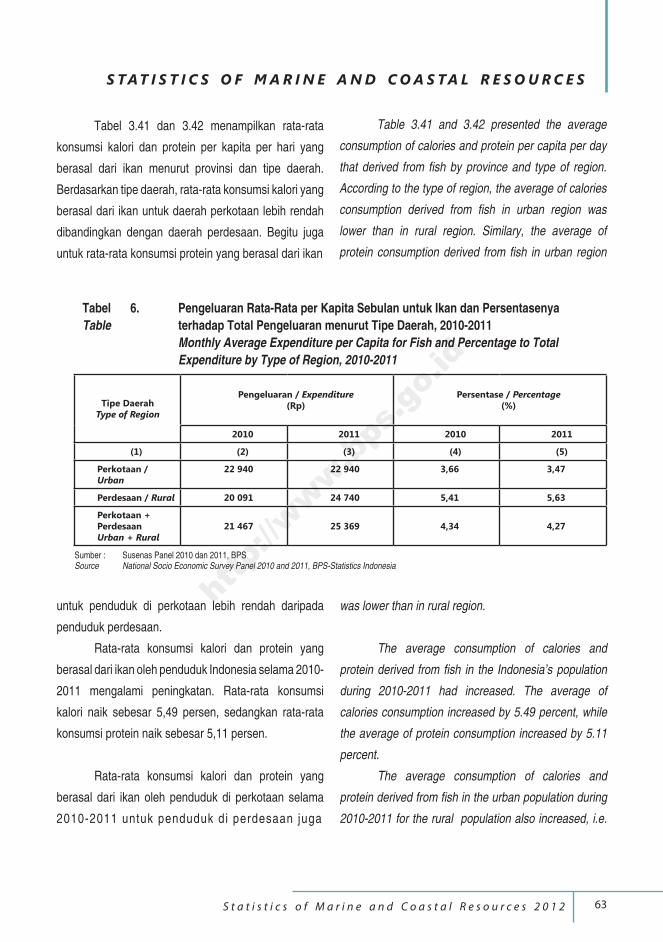
S TAT I S T I C S O F M A R I N E A N D C O A S TA L R E S O U R C E S
S t a t i s t i c s o f M a r i n e a n d C o a s t a l R e s o u r c e s 2 0 1 2 63
Tabel 3.41 dan 3.42 menampilkan rata-rata
konsumsi kalori dan protein per kapita per hari yang
berasal dari ikan menurut provinsi dan tipe daerah.
Berdasarkan tipe daerah, rata-rata konsumsi kalori yang
berasal dari ikan untuk daerah perkotaan lebih rendah
dibandingkan dengan daerah perdesaan. Begitu juga
untuk rata-rata konsumsi protein yang berasal dari ikan
Table 3.41 and 3.42 presented the average
consumption of calories and protein per capita per day
that derived from fish by province and type of region.
According to the type of region, the average of calories
consumption derived from fish in urban region was
lower than in rural region. Similary, the average of
protein consumption derived from fish in urban region
Tabel 6. Pengeluaran Rata-Rata per Kapita Sebulan untuk Ikan dan Persentasenya
Table terhadap Total Pengeluaran menurut Tipe Daerah, 2010-2011
Monthly Average Expenditure per Capita for Fish and Percentage to Total
Expenditure by Type of Region, 2010-2011
Tipe DaerahType of Region
Pengeluaran / Expenditure (Rp)
Persentase / Percentage(%)
2010 2011 2010 2011
(1) (2) (3) (4) (5)
Perkotaan / Urban
22 940 22 940 3,66 3,47
Perdesaan / Rural 20 091 24 740 5,41 5,63
Perkotaan + Perdesaan Urban + Rural
21 467 25 369 4,34 4,27
Sumber : Susenas Panel 2010 dan 2011, BPSSource National Socio Economic Survey Panel 2010 and 2011, BPS-Statistics Indonesia
untuk penduduk di perkotaan lebih rendah daripada
penduduk perdesaan.
Rata-rata konsumsi kalori dan protein yang
berasal dari ikan oleh penduduk Indonesia selama 2010-
2011 mengalami peningkatan. Rata-rata konsumsi
kalori naik sebesar 5,49 persen, sedangkan rata-rata
konsumsi protein naik sebesar 5,11 persen.
Rata-rata konsumsi kalori dan protein yang
berasal dari ikan oleh penduduk di perkotaan selama
2010-2011 untuk penduduk di perdesaan juga
was lower than in rural region.
The average consumption of calories and
protein derived from fish in the Indonesia’s population
during 2010-2011 had increased. The average of
calories consumption increased by 5.49 percent, while
the average of protein consumption increased by 5.11
percent.
The average consumption of calories and
protein derived from fish in the urban population during
2010-2011 for the rural population also increased, i.e.
http://www.bps.go.id
S TAT I S T I K S U M B E R D AYA L A U T D A N P E S I S I R
S t a t i s t i k S u m b e r D a y a L a u t d a n P e s i s i r 2 0 1 264
mengalami peningkatan yaitu sebesar 5,57 persen
untuk kalori dan 5,41 persen untuk protein.
Provinsi Maluku merupakan provinsi yang
memiliki rata-rata konsumsi kalori perkapita per hari
dari ikan tertinggi, sedangkan Provinsi DI Yogyakarta
merupakan provinsi yang memiliki rata-rata konsumsi
kalori dan protein per kapita per hari dari ikan
terendah dibandingkan provinsi lain di tahun 2011.
Konsumsi kalori perkapita perhari dari ikan di Provinsi
DI Yogyakarta sebesar 13,89 KKal atau hanya 13,46
persen dari konsumsi kalori perkapita perhari di Provinsi
Maluku. Sedangkan konsumsi protein yang berasal dari
ikan perkapita perhari di Provinsi DI Yogyakarta sebesar
2,1 gram atau hanya 12,94 persen dari konsumsi protein
perkapita perhari di Provinsi Maluku.
Tingkat konsumsi ikan di Indonesia masih
rendah jika dibandingkan dengan negara tetangga
seperti Malaysia dan Singapura. Rendahnya
konsumsi ikan di dalam negeri karena kurangnya
informasi mengenai pentingnya konsumsi ikan. Untuk
meningkatkan konsumsi ikan nasional, pemerintah
melalui KKP melakukan beberapa upaya, antara lain
membentuk tim nasional untuk melaksanakan program
percepatan peningkatan konsumsi ikan dan membuka
pasar di dalam negeri yang mempunyai potensi yang
sangat besar. Untuk meningkatkan produksi perikanan
nasional, dilakukan program restocking atau penebaran
ikan. Penebaran benih ini juga diperlukan untuk
menjaga ketersediaan stok ikan, pelestarian sumber
daya ikan di perairan umum, dan untuk meningkatkan
keanekaragaman jenis ikan. Selain itu, peningkatan
stok diperlukan agar dapat menjaga populasi ikan di
danau, sehingga masyarakat yang tinggal di sekitar
danau akan bisa selalu menangkap ikan.
5.57 percent for calories and 5.41 percent for protein.
Maluku is a province that has the highest average
consumption of calories per capita per day derived from
fish, while DI Yogyakarta Province haslowest average
consumption of calories and protein per capita per day
derived from fish in 2011. The calories consumption
per capita per day derived from fish in DI Yogyakarta
Province was 13.89 KCal or only 13.46 percent of the
calories consumption per capita per day in Maluku
Province. While the protein consumption per capita per
day derived from fish in DI Yogyakarta Province was 2.1
grams or only 12.94 percent of the protein consumption
per capita per day in Maluku Province.
Level of fish consumption in Indonesia is still
lower than neighboring countries such as Malaysia and
Singapore. The low consumption of fish in the country is
due to the lack of information about the importance of fish
consumption.To improve the national fish consumption,
the government through KKP makes some effort.
Among others was forming a national team to implement
the accelerated program of increasing consumption of
fish, opening the domestic market that posses huge
potential.To improve national fishery production a
restocking fish program is conducted.Restocking fish is
necessary to maintain the fish stocks, to conserve fish
resources in public waters, and to increase the diversity
of fish species. In addition, increasing stock is required
in order to maintain fish populations in the lake, hence
the people who live around the lake will be able to
always catch fish.
http://www.bps.go.id
S TAT I S T I C S O F M A R I N E A N D C O A S TA L R E S O U R C E S
S t a t i s t i c s o f M a r i n e a n d C o a s t a l R e s o u r c e s 2 0 1 2 65
3.6. Sarana dan Prasarana Transportasi Laut
Indonesia sebagai negara kepulauan
membutuhkan sistem pengangkutan laut yang efisien
dan terkelola dengan baik. Hal ini merupakan faktor
yang sangat penting dalam persaingan ekonomi.
Perdagangan luar negeri Indonesia yang
diangkut melalui transportasi laut sekitar 90 persen.
Indonesia tidak memiliki pelabuhan pindah muat
(trans-shipment) yang mampu mengakomodasi
kebutuhan kapal-kapal besar antar benua (large trans-
oceanic vessels). Kapal-kapal yang lebih besar akan
membutuhkan kedalaman air minimum yang diperlukan
agar kapal dapat mengapung, jalur yang lebih panjang,
basin yang dalam, mesin derek yang lebih besar dan
lebih cepat serta penanganan kargo yang baik.
Jasa pelayaran dan pelabuhan di Indonesia
relatif masih kalah dibandingkan dengan negara lain
di wilayah ASEAN. Hal ini dikarenakan sebagian
besar pelabuhan di Indonesia tidak bisa menjaga
tingkat kedalaman lautnya sampai 14 meter atau lebih
sehingga tidak dapat memenuhi kriteria deep sea port.
Akibatnya, pelabuhan-pelabuhan di Indonesia hanya
menjadi pengumpan bagi pelabuhan milik beberapa
negara tetangga. Hal ini mengakibatkan Indonesia
kehilangan potensi pemasukan devisa miliaran rupiah.
Kondisi yang sama terjadi di berbagai pelabuhan di
Indonesia dalam hal teknologi konstruksi dan fasilitas
gerak kapal maupun pengangkutan peti kemas yang
juga masih tertinggal.(http://pksplipb.or.id, diakses pada
19 September 2011).
Salah satu penyebab rendahnya kualitas
infrastruktur karena kurangnya biaya perawatan. Oleh
karena itu, diperlukan kesadaran agar semua pihak ikut
3.6. Marine Transportation Infrastructure
As an archipelago country, Indonesia needs a
well managed and an efficient marine transportation
system, due to its play a very important factor for
economic competitiveness.
Indonesia’s foreign trade, which is transported
using sea freight, reaches the percentage of 90
percent. Indonesia does not have a trans-shipment,
which accommodate the needs for large trans-oceanic
vessels. The bigger ships require a minimum depth of
water to float, the longer channels, deeper basin, larger
and faster cranes and an efficient cargo handling.
The shipping and port service in Indonesia
is relatively left behind compare to other countries
in ASEAN region. This is due to most ports unable to
maintain the level of the sea depths over 14 meters
to meet the criteria for deep sea port. Thus impact on
Indonesia’s ports only act as the feeders ports belonging
to neighboring countries. The potential lost of revenue
from foreign exchange reached the amount of billions
rupiah. The same condition is also happened in various
port in Indonesia in the term of construction technology
and facilities as well as containers freight ships which
are still left behind. (http://pksplipb.or.id, accessed on
September 19, 2011).
The low quality of infrastructure is due to
inadequate maintenance costs. Therefore, the
awareness and involvement of all parties for maintaning
http://www.bps.go.id
S TAT I S T I K S U M B E R D AYA L A U T D A N P E S I S I R
S t a t i s t i k S u m b e r D a y a L a u t d a n P e s i s i r 2 0 1 266
the existing infrastructure is need to be increased.
The Law of Shipping 2008 provides the foundation for
comprehensive reform of ports in Indonesia. The laws
eliminates the government monopoly over the port
sector and open up opportunities for participation of
private sector. Based on the Global Competitiveness
Report (GCR) surveyed in 2006, Indonesia ranked
98 from 121 countries on port infrastructure quality
surveyed and this was less 5 ratings on 2001.
Geographical factors such as lack of deep-sea
port and inlands ports located on rivers that require
a constant excavation are some major obstacle to
the port performance. If excavation is not possible to
be conducted ships often had to wait until high tide
occurred before entering the port, which will consume a
lot of time.The physical geography factor also become
obstacle to the port performance such as the densely
population and industrial area in northen coast of Java.
Generally, the major ports in Indonesian are
located near big cities with access passing through the
crowd city roads.The traffic problems are compounded
by the arrival of passenger ships at same terminal
location, since only a few regional ports that have
separate facilities for cargo and passenger terminal. For
the port with the same terminal location for passengers
and cargo, it cause more delays and increase in turn
around freight time.
merawat infrastruktur yang sudah ada. UU Pelayaran
tahun 2008 memberikan fondasi untuk reformasi
sistem pelabuhan di Indonesia yang komprehensif. UU
pelayaran tersebut menghapus monopoli pemerintah
atas sektor pelabuhan dan membuka kesempatan
bagi partisipasi sektor swasta. Berdasarkan Laporan
Persaingan Global (Global Competitiveness Report/
GCR) tahun 2006, peringkat kualitas infrastruktur
pelabuhan Indonesia berada pada peringkat 98 dari
121 negara yang disurvei dan turun 5 peringkat sejak
tahun 2001.
Faktor-faktor geografis seperti kurangnya
pilihan pelabuhan air dalam (deep-sea port) dan
banyaknya pelabuhan pedalaman yang berlokasi di
sungai-sungai dan memerlukan pengerukan terus-
menerus merupakan halangan utama terhadap kinerja
pelabuhan. Apabila pengerukan tidak dilakukan, kapal
seringkali harus menunggu sampai air pasang sebelum
memasuki pelabuhan, yang menyebabkan lebih banyak
waktu yang terbuang. Faktor geografi juga menjadi
penghambat kinerja pelabuhan seperti wilayah padat
penduduk dan wilayah industri di pantai utara Jawa.
Pelabuhan besar Indonesia umumnya berlokasi
dekat dengan kota-kota besar dengan akses menuju
pelabuhan melalui jalan-jalan raya kota yang padat.
Masalah kemacetan seringkali diperparah dengan
kedatangan penumpang di terminal yang tidak terpisah,
karena hanya beberapa pelabuhan regional yang
memiliki sarana terpisah untuk kapal barang dan
penumpang. Di pelabuhan yang lokasi terminal kapal
penumpang dan barang tidak terpisah, menyebabkan
lebih banyak keterlambatan dan memperlama waktu
persiapan perjalanan pulang kapal barang.
http://www.bps.go.id
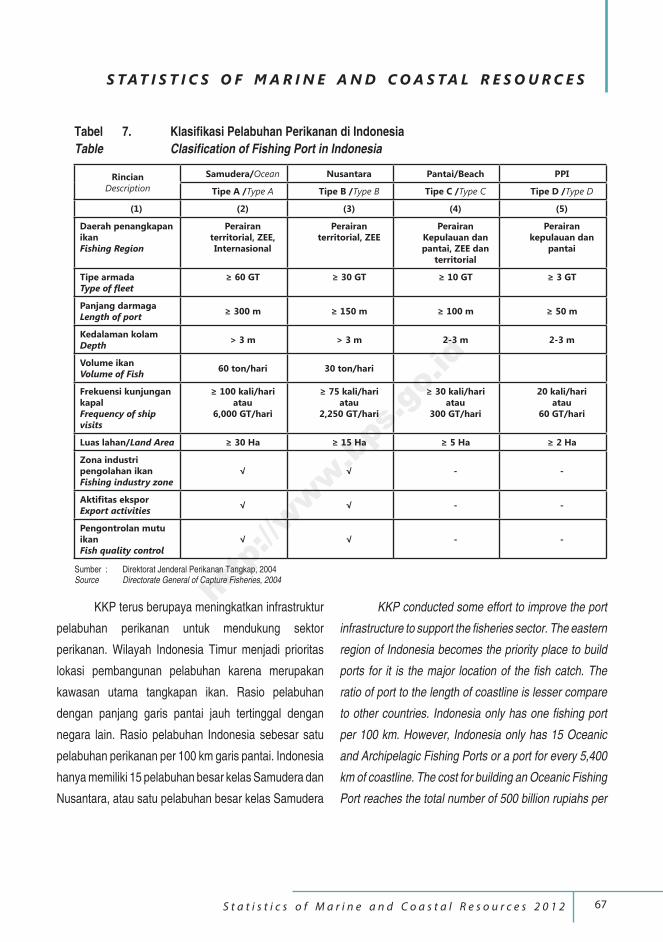
S TAT I S T I C S O F M A R I N E A N D C O A S TA L R E S O U R C E S
S t a t i s t i c s o f M a r i n e a n d C o a s t a l R e s o u r c e s 2 0 1 2 67
Tabel 7. Klasifikasi Pelabuhan Perikanan di IndonesiaTable Clasification of Fishing Port in Indonesia
RincianDescription
Samudera/Ocean Nusantara Pantai/Beach PPI
Tipe A /Type A Tipe B /Type B Tipe C /Type C Tipe D /Type D
(1) (2) (3) (4) (5)
Daerah penangkapan ikanFishing Region
Perairan territorial, ZEE, Internasional
Perairan territorial, ZEE
Perairan Kepulauan dan pantai, ZEE dan
territorial
Perairan kepulauan dan
pantai
Tipe armadaType of fleet
≥ 60 GT ≥ 30 GT ≥ 10 GT ≥ 3 GT
Panjang darmagaLength of port
≥ 300 m ≥ 150 m ≥ 100 m ≥ 50 m
Kedalaman kolamDepth
> 3 m > 3 m 2-3 m 2-3 m
Volume ikanVolume of Fish
60 ton/hari 30 ton/hari
Frekuensi kunjungan kapalFrequency of ship visits
≥ 100 kali/hari atau
6,000 GT/hari
≥ 75 kali/hari atau
2,250 GT/hari
≥ 30 kali/hari atau
300 GT/hari
20 kali/hari atau
60 GT/hari
Luas lahan/Land Area ≥ 30 Ha ≥ 15 Ha ≥ 5 Ha ≥ 2 Ha
Zona industri pengolahan ikanFishing industry zone
√ √ - -
Aktifitas eksporExport activities
√ √ - -
Pengontrolan mutu ikanFish quality control
√ √ - -
Sumber : Direktorat Jenderal Perikanan Tangkap, 2004Source Directorate General of Capture Fisheries, 2004
KKP terus berupaya meningkatkan infrastruktur
pelabuhan perikanan untuk mendukung sektor
perikanan. Wilayah Indonesia Timur menjadi prioritas
lokasi pembangunan pelabuhan karena merupakan
kawasan utama tangkapan ikan. Rasio pelabuhan
dengan panjang garis pantai jauh tertinggal dengan
negara lain. Rasio pelabuhan Indonesia sebesar satu
pelabuhan perikanan per 100 km garis pantai. Indonesia
hanya memiliki 15 pelabuhan besar kelas Samudera dan
Nusantara, atau satu pelabuhan besar kelas Samudera
KKP conducted some effort to improve the port
infrastructure to support the fisheries sector. The eastern
region of Indonesia becomes the priority place to build
ports for it is the major location of the fish catch. The
ratio of port to the length of coastline is lesser compare
to other countries. Indonesia only has one fishing port
per 100 km. However, Indonesia only has 15 Oceanic
and Archipelagic Fishing Ports or a port for every 5,400
km of coastline. The cost for building an Oceanic Fishing
Port reaches the total number of 500 billion rupiahs per
http://www.bps.go.id
S TAT I S T I K S U M B E R D AYA L A U T D A N P E S I S I R
S t a t i s t i k S u m b e r D a y a L a u t d a n P e s i s i r 2 0 1 268
dan Nusantara setiap 5.400 km garis pantai. Dana yang
dibutuhkan untuk membangun Pelabuhan Perikanan
Samudera sebesar Rp. 500 miliar per pelabuhan,
sedangkan untuk membangun Pelabuhan Perikanan
Nusantara sebesar Rp. 300 miliar per pelabuhan (KKP,
2007). Jumlah dan jenis pelabuhan perikanan disajikan
pada Tabel 3.43. Pelabuhan di Indonesia dibagi menjadi
4 tipe pelabuhan (Tabel 7).
Untuk menangkap ikan di laut, digunakan
perahu/kapal baik yang menggunakan motor
maupun tanpa motor. Perahu tanpa motor biasanya
dipergunakan oleh para nelayan kecil. Secara nasional,
terjadi penurunan jumlah perahu/kapal penangkap ikan
pada tahun 2010 dibanding tahun 2009 (Tabel 3.44).
Pada tahun 2009, jumlah perahu/kapal penangkap ikan
sebesar 590.352 buah, turun menjadi 570.827 tahun
2010. Walaupun terjadi penurunan jumlah perahu/
kapal penangkap ikan, tetapi terjadi peningkatan jumlah
perahu/kapal motor pada periode tersebut.
Selain perahu/kapal, alat penting lainnya yang
diperlukan untuk menangkap ikan di laut adalah pukat,
jaring, perangkap, pancing, dan lain-lainnya. Jumlah
alat penangkap ikan yang digunakan cenderung
menurun selama periode 2006-2010. Pada tahun 2006,
jumlah alat penangkap ikan di laut tercatat sebanyak
1,16 juta buah, turun menjadi 0,95 juta buah tahun 2010
(Tabel 3.45).
Lumbung ikan nasional yang diperjuangkan
pemerintah daerah selama ini tidak dalam bentuk sentra
program di satu kementerian, tapi masuk dalam proyek
Master Plan Percepatan dan Perluasan Pembangunan
Ekonomi Indonesia (MP3EI). Infrastruktur dasar
yang dibangun pemerintah melalui program MP3EI
port, while for building an Archipelagic Fishery Port cost
300 billion rupiahs per port (DKP, 2007). Table 3.44
present the number and type of fishing port. Port in
Indonesia is divided into 4 types of port (Table 7).
Boats is used to capture sea fish using both
motorized or non motorized boat. The non-motorized
boat is usually used by small fishermen. Nationally,
there are declining in the number of fishing boats in
2010 compared to 2009 (Table 3.44). In 2009, number
of fishing boatwas 590,352 fell to 570,827 in 2010.
Despite there are declining in the number of fishing boat
but increasing happen in numberof motorboat at that
period.
In addition to boats used to catch fish in the
sea, another equipment for catching fish are trawler,
nets, traps, fishing rods, and others. Number of fishing
equipment tended to decrease from 2006 to 2010. In
2006, number of marine fishing equipment was 1.16
million fell to 0.95 million in 2010 (Table 3.45).
National fish barn championed local
governments have not in a program at the ministry
center, but in the project Master Plan for the Acceleration
and Expansion of Indonesia’s Economic Development
(MP3EI). Basic infrastructure built by the government
through MP3EI program includes roads, bridges, and
http://www.bps.go.id
S TAT I S T I C S O F M A R I N E A N D C O A S TA L R E S O U R C E S
S t a t i s t i c s o f M a r i n e a n d C o a s t a l R e s o u r c e s 2 0 1 2 69
ini meliputi jalan, jembatan, dan sarana pendukung
lainnya di bidang kelautan dan perikanan (http://ambon.
antaranews.com diakses 26 September 2012).
Industri Maritim
Wilayah Indonesia didominasi lautan. Sekitar
5,8 juta km2 luas wilayah Indonesia adalah lautan
dan 1,9 juta km2 sisanya adalah wilayah daratan. Hal
ini menyebabkan perlunya industri maritim yang kuat.
Pembangunan industri pembuatan kapal beserta
perawatannya sangat diperlukan, salah satunya
sebagai alat transportasi antar pulau.
Peluang Indonesia dalam industri dan
perdagangan antar Negara sebetulnya sangat besar.
Namun, kontribusi sektor ini masih terbilang kecil.
Sesuai dengan Inpres No.5 Tahun 2005 tentang
Pemberdayaan Industri Pelayaran Nasional yang
diprakarsai Badan Perencanaan Pembangunan
Nasional (Bappenas), Kementrian Perhubungan, dan
stakeholders lain telah memberikan kontribusi yang
signifikan. Kapal berbendera Indonesia telah bertambah
sebanyak 2.300 kapal baik dalam ukuran besar maupun
kecil, dan nilai investasinya tidak kurang dari Rp. 80
triliun sejak Inpres ini ditetapkan. Untuk lima tahun ke
depan (2009-2014), diupayakan kapal berbendera
Indonesia dapat berkontribusi melayani angkutan
ekspor-impor, sekurang-kurangnya 20 persen dan
lima tahun berikutnya (2014-2019) menjadi 40 persen
(Bappenas, 2009).
Kondisi kapal-kapal di Indonesia sudah banyak
yang harus diperbaiki dan jumlahnya masih sangat
kurang. Di sisi lain jumlah galangan kapal di Indonesia
tidak akan cukup untuk melaksanakan perbaikan kapal
other supporting facilities in the field of marine and
fisheries (http://ambon.antaranews.com accessed 26
September 2012).
Maritime Industry
Indonesian geographical condition is dominated
by ocean. Approximately 5.8 million km2 of Indonesian
region is ocean and the rest which cover of 1.9 million
km2 is land area. Therefore, the strong maritime industry
is needed. Development a ship building industry and
its maintenance areurgently needed due to ship as a
vehicle of inter island transportation.
Indonesian opportunities in industry and trade
among nations are tremendous opportunity. However,
the contribution from this sector is still relatively
small. In accordance to The Presidential Instruction
Number 5 Year 2005 regarding the National Sailing
Industry Empowerment which is initiated by National
Development Planning Agency (Bappenas), the
Ministry of Transportation and other stakeholders had
contributed significantly. The Indonesian-flagged ship
has increased by 2,300 vessels in both large and
small size, and its investment value not less than 80
trillion rupiahs since the Presidential Instruction was
issued. The target for the next five years (2009-2014),
it is expected that the Indonesian-flagged ships can
contribute to serve the transportation of export-import,
at least 20 percent and the next five years (2014-2019)
to 40 percent (Bappenas, 2009).
Many Indonesia ships need to be repaired. On
the other hand, the number of shipyards in Indonesia
will not be enough to carry out ship repairs even to
make new ships. Number of shipyard in Indonesia is
http://www.bps.go.id
S TAT I S T I K S U M B E R D AYA L A U T D A N P E S I S I R
S t a t i s t i k S u m b e r D a y a L a u t d a n P e s i s i r 2 0 1 270
relative small, despite the infrastructure and facilities in
each shipyard have been insufficient, such as the sea
is shallow and the access to the shipyard is difficult.
An effort to repair of ship is needed to prevent ship
accident, moreover most of the ship is unworth sailing.
The government has built an integrated maritime
industrial in Lamongan, Jawa Timur. Lamongan is
chosen as the area of integrated maritime industry
due to the possesion of deep-sea coast. There are 4
companies that conduct a shipyard business on land
which is provided by the Regional Government of
Lamongan. The new industry of shipyard in Lamongan
will be ready to serve, especially for repairing old ships
and also making new ships.
3.7. Fisheries Household and Establishments
Fishers refer to person whose work actually
engaged fishing. Based on the working time, the fishers
are classified as full-time fishers, major part-time fishers,
and minor part-time fishers.The number of fishermenin
2010 was 2,162.4 thousand people (Table 3.46). Of
these fishermen, about 50.1 percent was full-time
fishermen, 35.7 percent was major part-time fishermen
and 14.1 percent was minor part-time fishermen. This
indicated that most fishermen only have one job that is
fishermen.
apalagi membuat kapal-kapal baru. Selain jumlahnya
yang kecil, banyak infrastruktur dan fasilitas di masing-
masing galangan kapal sudah tidak memadai, seperti
lautnya sudah dangkal dan juga akses masuk ke
galangan kapal tersebut sulit. Padahal perbaikan perlu
dilakukan untuk mencegah terjadinya kecelakaan kapal
laut, apalagi sebagian besar kapal sudah tidak layak
berlayar.
Untuk mengatasi hal tersebut, pemerintah
membangun kawasan industri maritim terpadu di
Lamongan, Jawa Timur. Daerah Lamongan dipilih
sebagai kawasan industri maritim terpadu karena
mempunyai pantai dengan laut yang relatif dalam.
Terdapat 4 perusahaan yang membuka usaha galangan
kapal di lahan yang disediakan Pemerintah Kabupaten
Lamongan. Galangan-galangan kapal baru ini akan
siap menjadi industri baru di Lamongan, khususnya
untuk memperbaiki kapal-kapal lama dan juga membuat
kapal-kapal baru.
3.7. Rumah Tangga Perikanan dan Perusahaan
Perikanan
Nelayan adalah orang yang secara aktif
melakukan pekerjaan dalam operasi penangkapan
ikan/binatang air lainnya/tanaman air. Berdasarkan
waktu yang digunakan untuk melakukan operasi
penangkapan ikan, nelayan diklasifikasikan menjadi
nelayan penuh, nelayan sambilan utama, dan nelayan
sambilan tambahan. Jumlah nelayan pada tahun 2010
sebanyak 2.162,4 ribu orang (Tabel 3.46). Dari jumlah
tersebut, sebanyak 50,1 persen nelayan penuh, 35,7
persen nelayan sambilan utama dan sisanya sebesar
http://www.bps.go.id
S TAT I S T I C S O F M A R I N E A N D C O A S TA L R E S O U R C E S
S t a t i s t i c s o f M a r i n e a n d C o a s t a l R e s o u r c e s 2 0 1 2 71
14,1 persen nelayan sambilan tambahan. Hal ini
menunjukan bahwa sebagian besar nelayan hanya
mempunyai satu pekerjaan yaitu sebagai nelayan.
Selama periode tahun 2006-2010, jumlah
nelayan di Indonesia berfluktuasi dimana jumlah nelayan
sampai dengan tahun 2008 mengalami kenaikan
namun di tahun 2009 dan 2010 mengalami penurunan.
Provinsi Jawa Timur memiliki jumlah nelayan paling
banyak yaitu 250.881 orang atau sebesar 12 persen
dari nelayan di Indonesia di tahun 2010 (Tabel 3.47).
Tabel 3.48 menyajikan data jumlah rumah
tangga perikanan/perusahaan perikanan (RTP/PP)
tangkap di laut menurut provinsi dan jenis perahu yang
digunakan. Pada tahun 2010, terdapat 37,04 persen
RTP/PP menggunakan perahu motor tempel, 26,82
persen menggunakan perahu tanpa motor, 25,8 persen
menggunakan kapal motor dan 10,35 persen tanpa
perahu.
Jumlah RTP/PP di Indonesia pada tahun 2010
adalah 577.656 (Tabel 3.49). Jumlah tersebut lebih kecil
jika dibandingkan dengan empat tahun sebelumnya.
Jumlah RTP/PP di laut yang paling besar pada tahun
2010 adalah Provinsi Jawa Timur. Sementara data
jumlah rumah tangga budidaya menurut jenis budidaya
disajikan pada Tabel 3.50.Dari tabel tersebut terlihat
bahwa jumlah pembudidaya tambak lebih tinggi
dibandingkan dengan jumlah pembudidaya laut. Begitu
juga dengan jumlah rumah tangga budidaya tambak
lebih tinggi dibandingkan dengan jumlah rumah tangga
laut.
During period 2006-2010, the number of
fishermen in Indonesia fluctuated where the number
of fishermen through 2008 increased but in 2009 and
2010 decreased. Jawa Timur Province has the largest
amount of fishermen that was 250.881 people or about
12 percent of fishermen in Indonesia in 2010 (Table
3.47).
Table 3.48 presents the number of households
fishery/fishery companies (RTP/PP) by province and
type of fishing boats used. In 2010, there was 37.04
percent of RTP/PP that caught fish using outboard
motorboat, 26.82 percent using non powered boat,
25.82 percent using motorboat and 10.35 percent
without boat.
Number of RTP/PP in Indonesia in 2010
was 577,656 (Table 3.49). The amount was smaller
compared with the previous four years. The greatest
number of RTP/PP in the marine capture fisheries in 2010
was Jawa Timur Province. While the number of RTP/
PP aquaculture according to the type of aquacultureis
presented in Table 3.50. From this table can be seen
that the number of pond fish farmer higher compared
with the number of marine fish farmer. Similarly,the
number of ponds household higher compared with the
number of marine households.
http://www.bps.go.id
S TAT I S T I K S U M B E R D AYA L A U T D A N P E S I S I R
S t a t i s t i k S u m b e r D a y a L a u t d a n P e s i s i r 2 0 1 272
3.8. Mineral
The Indonesian waters geographically is located
in the route of international ship traffic. Geologically,
the Indonesian water is the meeting between several
tectonic plates that posses an abundant source of
petroleum, natural gas and minerals. This had made
Indonesia as a major of oil producing countries in the
world.
The coastal area in Indonesia is the location
of an abundant reserved areas for oil, gas, minerals
and others mining materials. The coastal and oceans
areas contribute around 70 percent of the oil and gas
production. From 60 basins that has a big potentially
reserved of oil and gas, 40 basins located in the
offshore, 14 basins on the coast, and only 6 basins on
the mainland. The estimation number of oil and natural
gas in the entire basins reach the number of 11.3 billion
barrels. The natural gas reserves estimated at 101.7
trillion cubic feet (TCF). This area is also rich of various
types of mines and minerals, like gold, silver, tin, iron
ore and heavy minerals. The new type of energy in the
form of biogenic and hydrate gas as the substituted
for fuel oil was recently discovered in off coast region
of western Sumatera and southern Jawa Barat and
northern of Makassar Strait with tremendous potential,
beyond all the potential oil and gas (Richardson, 2008).
Based on marine geological and geophysical
surveys which was conducted by Assessment and
Application of Technology Agency (BPPT) in 2009, it
was discovered a huge oil and gas reserves in the waters
of northeast island of Simeulue,Aceh. If the reserve
3.8. Mineral
Wilayah perairan Indonesia secara geografis
merupakan jalur lalu lintas kapal internasional. Secara
geologis, wilayah perairan Indonesia merupakan
pertemuan antara beberapa lempeng tektonis yang
merupakan sumber minyak bumi, gas bumi dan mineral
yang sangat besar. Hal ini menjadikan Indonesia
sebagai salah satu negara penghasil minyak bumi di
dunia.
Wilayah pesisir laut Indonesia mengandung
cadangan minyak,gas, mineral dan bahan tambang
yang besar. Kawasan pesisir dan lautan menghasilkan
sekitar 70 persen produksi minyak dan gas bumi. Dari
60 cekungan yang potensial mengandung migas,
40 cekungan terdapat di lepas pantai, 14 di pesisir,
dan hanya 6 yang di daratan. Dari seluruh cekungan
tersebut, potensi minyak bumi diperkirakan sebesar
11,3 miliar barel. Cadangan gas bumi diperkirakan
sebesar 101,7 triliun kaki kubik. Kawasan ini juga
kaya akan berbagai jenis bahan tambang dan mineral,
seperti emas, perak, timah, bijih besi dan mineral berat.
Belum lama ini ditemukan jenis energi baru pengganti
bahan bakar minyak berupa gas hidrat dan gas biogenik
di lepas pantai Barat Sumatera dan Selatan Jawa Barat
serta bagian Utara Selat Makassar dengan potensi
yang sangat besar, melebihi seluruh potensi minyak
dan gas bumi (Richardson, 2008).
Berdasarkan survei geologi dan geofisika
kelautan yang dilakukan oleh Badan Pengkajian dan
Penerapan Teknologi (BPPT) tahun 2009, ditemukan
cadangan migas yang amat besar di perairan timur
laut Pulau Simeulue, Aceh. Apabila cadangan minyak
http://www.bps.go.id
S TAT I S T I C S O F M A R I N E A N D C O A S TA L R E S O U R C E S
S t a t i s t i c s o f M a r i n e a n d C o a s t a l R e s o u r c e s 2 0 1 2 73
ini memang terbukti, maka diperkirakan cadangan ini
mencapai 320,79 miliar barel. Sebagai perbandingan,
jumlah cadangan terbukti untuk Arab Saudi sebesar
264,21 miliar barel dan jumlah cadangan untuk
lapangan Banyu Urip, Cepu adalah sekitar 450 juta
barel. Lapangan migas dapat dikategorikan sebagai
lapangan raksasa apabila volume cadangan terhitung
mencapai 500 juta barel (www.lintasberita.com, diakses
17 April 2009).
Menurut Kementerian ESDM pada tahun 2008,
Indonesia diperkirakan memiliki potensi cadangan gas
sebesar 170 Tera Standard Cubic Feed (TSCF). Potensi
cadangan ini diperkirakan masih bisa dipergunakan
hingga 59 tahun ke depan. Hal ini dikarenakan produksi
gas di Indonesia setiap tahunnya hanya sebesar 2,87
TSCF.
Lautan merupakan gudang terbesar yang
mengandung sekitar 50.000 triliun ton berbagai logam
dan garam mineral, termasuk emas, mangan, lithium,
bromium, fosfor, sulfur, borium, sodium klorida,
magnesium klorida, magnesium sulfat, kalsium
sulfat dan potassium sulfat. Setiap mil kubik air laut
mengandung 4 juta ton magnesium, emas senilai
US$ 93 juta, dan perak senilai US$ 8,5 juta (Dahuri,
2009). Selain itu, menurut Carson (1973) di lautan
juga terdapat sekitar 10 triliun ton deuterium, sejenis
isotop hidrogen yang mudah dipisahkan dari air laut
dan merupakan bahan bakar utama reaktor pembangkit
energi sistem nuklir fusion, yang lebih aman ketimbang
sistem nuklir fision. Dengan teknologi nuklir yang relatif
aman ini, lautan dapat mencukupi kebutuhan energi
umat manusia di dunia secara berkelanjutan.
is proven, the oil reserves is 320.79 billion barrels.
For comparison, the proven reserves of Saudi Arabia
reachs the number of 264.21 billion barrels and total
reserves for the field Banyu Urip, Cepu is approximately
450 million barrels. Oil and gas fields are categorized
as a giant field when the number reached around 500
million barrels (www.lintasberita.com, accessed on 17
April 2009).
According to the Ministry of Energy and Mineral
Resources in 2008, Indonesia estimated has the
potential of gas reserves reached 170 Tera Standard
Cubic Feed (TSCF). The potential reserves is estimated
can be used for 59 years. This is due to the production
of gas in Indonesia each year only reached the total
number of 2.87 TSCF.
Ocean is the location of the largest warehouse,
which is containing around 50,000 trillion tons of various
metals and mineral salts, including gold, manganese,
lithium, bromium, phosphorus, sulfur, borium, sodium
chloride, magnesium chloride, magnesium sulfate,
calcium sulfate and potassium sulfate. Each cubic mile
of sea water containing 4 million tons of magnesium,
US$ 93 million worth of gold, and silver US$ 8.5
million (Dahuri, 2009). In addition, according to Carson
(1973) the ocean also consist about 10 trillion tons of
deuterium, a hydrogen isotope is easily separated from
the sea water and is the main fuel reactor of nuclear
fusion energy generation system, which is more secure
than fision nuclear system. With the relatively safe of
nuclear energy, the ocean can meet the energy needs
for human kind in a sustainable world.
http://www.bps.go.id
S TAT I S T I K S U M B E R D AYA L A U T D A N P E S I S I R
S t a t i s t i k S u m b e r D a y a L a u t d a n P e s i s i r 2 0 1 274
The potential wealth of mining in the seabed
has not yet been properly identified, the advanced
technology needed to develop its potential. Several
smaller islands with potentially contain minerals by
province and type is presented in Table 3.52.
3.9. Marine Conservation Area
Indonesia consists of many types of marine
conservation areas, among others marine national park,
marine ecotourism park, marine nature recreation park,
marine sanctuary, marine natural preservation and
district marine conservation area. The most numerous
and most widespread marine conservation is the district
marine conservation area. Table 3.53 present the
number, areaand type of marine conservation areas.
The abundance of fishery resources in
Indonesia is not followed by extensive utilization. Table
3.55 shows a the types of animals which is protected
according to Government Regulation Number 7 of 1999
concerning the Preservation of Plants and Animals.
Through the Law Number 31 2004 the government
regulates the type of trade restrictions, which are in line
or contrary to the Convention on International Trade in
Endangered Species (CITES) of Wild Fauna and Flora
(KKP, 2008).
Nowadays, the marine-based tourism (marine
tourism) has become internationally attractive as a
tourism product. The Natural wealth which is owned
by Indonesia in the form of a beautiful beach and sea,
the diversity of flora and fauna such as coral reefs and
various kinds of ornamental fish, which is estimated
Potensi kekayaan tambang dasar laut sampai
sekarang belum teridentifikasi dengan baik sehingga
diperlukan teknologi yang maju untuk mengembangkan
potensi tersebut. Beberapa pulau kecil yang berpotensi
mengandung mineral menurut provinsi dan jenis potensi
mineralnya disajikan pada Table 3.52.
3.9. Kawasan Konservasi Laut
Ada berbagai macam jenis kawasan konservasi
laut di Indonesia, antara lain taman nasional laut,
taman wisata alam laut, taman wisata perairan,
suaka margasatwa laut, cagar alam laut dan kawasan
konservasi laut daerah. Jumlah kawasan yang paling
banyak dan paling luas adalah kawasan konservasi laut
daerah. Tabel 3.53 menyajikan jumlah, luas, dan jenis
kawasan konservasi laut.
Melimpahnya sumber daya perikanan di
Indonesia tidak serta merta dapat dimanfaatkan
seluruhnya. Tabel 3.54 menampilkan daftar jenis-jenis
satwa yang dilindungi sesuai Peraturan Pemerintah
Nomor 7 tahun 1999 tentang Pengawetan Jenis
Tumbuhan dan Satwa. Melalui UU Nomor 31 Tahun 2004
pemerintah mengatur tentang jenis larangan-larangan
perdagangan, yang sejalan atau bertentangan dengan
Convention on International Trade in Endangered
Spesies (CITES) of Wild Fauna and Flora (KKP, 2008).
Dewasa ini pariwisata berbasis kelautan (wisata
bahari) telah menjadi salah satu produk pariwisata
yang menarik dunia internasional. Kekayaan alam
yang dimiliki Indonesia berupa pantai dan laut yang
indah, serta keragaman flora dan fauna seperti terumbu
karang dan berbagai jenis ikan hias yang diperkirakan
http://www.bps.go.id
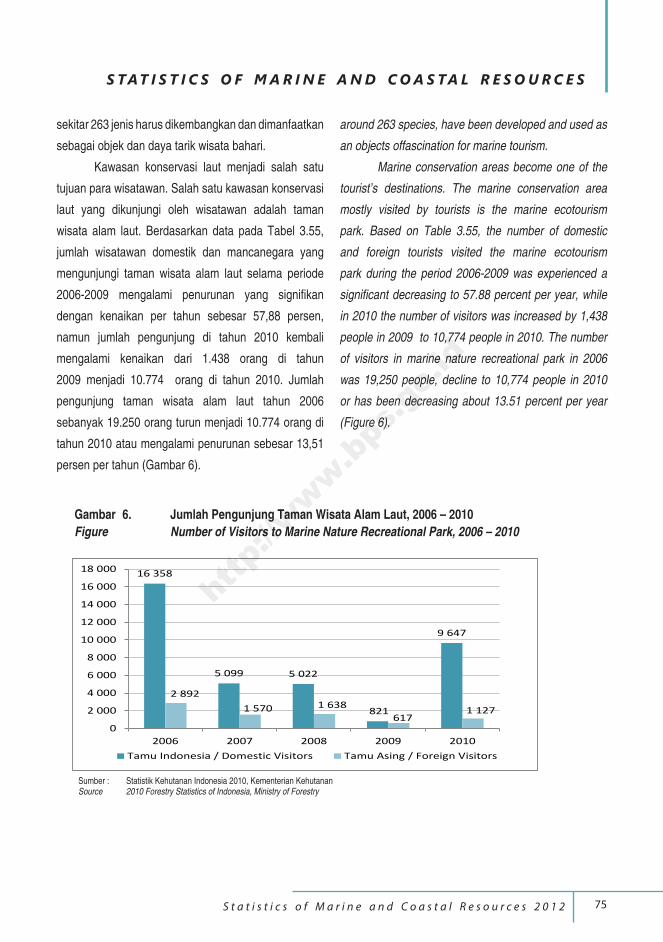
S TAT I S T I C S O F M A R I N E A N D C O A S TA L R E S O U R C E S
S t a t i s t i c s o f M a r i n e a n d C o a s t a l R e s o u r c e s 2 0 1 2 75
sekitar 263 jenis harus dikembangkan dan dimanfaatkan
sebagai objek dan daya tarik wisata bahari.
Kawasan konservasi laut menjadi salah satu
tujuan para wisatawan. Salah satu kawasan konservasi
laut yang dikunjungi oleh wisatawan adalah taman
wisata alam laut. Berdasarkan data pada Tabel 3.55,
jumlah wisatawan domestik dan mancanegara yang
mengunjungi taman wisata alam laut selama periode
2006-2009 mengalami penurunan yang signifikan
dengan kenaikan per tahun sebesar 57,88 persen,
namun jumlah pengunjung di tahun 2010 kembali
mengalami kenaikan dari 1.438 orang di tahun
2009 menjadi 10.774 orang di tahun 2010. Jumlah
pengunjung taman wisata alam laut tahun 2006
sebanyak 19.250 orang turun menjadi 10.774 orang di
tahun 2010 atau mengalami penurunan sebesar 13,51
persen per tahun (Gambar 6).
around 263 species, have been developed and used as
an objects offascination for marine tourism.
Marine conservation areas become one of the
tourist’s destinations. The marine conservation area
mostly visited by tourists is the marine ecotourism
park. Based on Table 3.55, the number of domestic
and foreign tourists visited the marine ecotourism
park during the period 2006-2009 was experienced a
significant decreasing to 57.88 percent per year, while
in 2010 the number of visitors was increased by 1,438
people in 2009 to 10,774 people in 2010. The number
of visitors in marine nature recreational park in 2006
was 19,250 people, decline to 10,774 people in 2010
or has been decreasing about 13.51 percent per year
(Figure 6).
Gambar 6. Jumlah Pengunjung Taman Wisata Alam Laut, 2006 – 2010
Figure Number of Visitors to Marine Nature Recreational Park, 2006 – 2010
Sumber : Statistik Kehutanan Indonesia 2010, Kementerian KehutananSource 2010 Forestry Statistics of Indonesia, Ministry of Forestry
16 358
5 099 5 022
821
9 647
2 892
1 570 1 638
6171 127
0
2 000
4 000
6 000
8 000
10 000
12 000
14 000
16 000
18 000
2006 2007 2008 2009 2010
Tamu Indonesia / Domestic Visitors Tamu Asing / Foreign Visitors
http://www.bps.go.id
S TAT I S T I K S U M B E R D AYA L A U T D A N P E S I S I R
S t a t i s t i k S u m b e r D a y a L a u t d a n P e s i s i r 2 0 1 276
3.10. Sea Water Quality
The development of marine and coastal
resources in Indonesia should pay attention to the quality
and adequacy for the needs of future generations. The
quality of marine and coastal resources is important,
especially for ecosystem and people who live around
the site and generally for the waters around Indonesia.
Some Indonesian waters vulnerable to oil pollution.
During 1997-2012, there have been 36 cases of oil spills
in the waters of Indonesia (Table 3.56).
Oil pollution at sea comes from several sources,
which are oil spills due to fuel consumption of petroleum
products/routine operations of ships and ship accidents,
down the drain, up in smoke, offshore oil drilling, oil
refining, oil transportation pipelines, tank cleaning, and
natural seeps.
The oil spills have an impact on non-biological
resources and biological resources or marine
organisms. The impact on nonbiological resources
are in the seawater, air, sediment and soil as well as
archaeological objects that sank in the ocean. Sea are
polluted by oil spills will also bring negative effects for a
variety of biological resources or marine organisms. As
various kinds of fish, marine mammals, plankton, and
jeopardize the ecosystem of coral reefs, mangroves,
seagrass, seaweed and other underwater vegetation.
This of course will affect the fishing and environment
that ultimately affect the lives of all socio-economic
communities in coastal areas and oceans. Oil spills
3.10. Kualitas Air Laut
Pembangunan sumber daya laut dan pesisir
di Indonesia saat ini harus memperhatikan kualitas
dan kecukupan untuk kebutuhan generasi yang akan
datang. Kualitas sumber daya laut dan pesisir sangat
penting untuk keberlangsungan hidup khususnya bagi
ekosistem dan masyarakat yang berada disekitar lokasi
dan umumnya bagi perairan di seluruh Indonesia.
Beberapa wilayah perairan Indonesia rentan akan
pencemaran minyak. Dalam kurun waktu 1997-2012,
telah terjadi 36 kasus tumpahan minyak di perairan
Indonesia (Tabel 3.56).
Pencemaran minyak di laut berasal dari
beberapa sumber, yaitu: tumpahan minyak karena
pemakaian bahan bakar produk minyak bumi/operasional
rutin kapal dan kecelakaan kapal, transportasi minyak
dari darat, terbawa asap, pengeboran minyak lepas
pantai, pengilangan minyak, pipa transportasi minyak,
tank cleaning, dan perembesan alami.
Tumpahan minyak ini memberikan dampak
terhadap sumber daya non hayati dan sumber daya
hayati atau organisme laut. Dampak terhadap sumber
daya non hayati yaitu pencemaran air laut, udara,
sedimen dan tanah serta benda purbakala yang
tenggelam di lautan. Laut yang tercemar oleh tumpahan
minyak juga akan membawa pengaruh negatif bagi
berbagai sumber daya hayati atau organisme laut,
seperti berbagai jenis ikan, mamalia laut, plankton
serta membahayakan ekosistem terumbu karang,
mangrove, padang lamun, rumput laut dan vegetasi
bawah air lainnya. Hal ini tentunya akan berdampak
terhadap daerah penangkapan ikan dan lingkungannya
http://www.bps.go.id
S TAT I S T I C S O F M A R I N E A N D C O A S TA L R E S O U R C E S
S t a t i s t i c s o f M a r i n e a n d C o a s t a l R e s o u r c e s 2 0 1 2 77
yang akhirnya berdampak pula terhadap kehidupan
sosial ekonomi masyarakat di kawasan pesisir dan
lautan. Tumpahan minyak juga berdampak terhadap
pariwisata bahari, kawasan wisata akan mengalami
kerusakan, penurunan jumlah pengunjung serta
penurunan kualitas lingkungan di sekitar kawasan
wisata. Tumpahan minyak juga akan menghambat atau
mengurangi transmisi cahaya matahari ke dalam air laut
karena terhalang oleh minyak dan dipantulkan kembali
ke udara.
3.11. Tindak Pidana dan Pengawasan Kelautan
Perikanan
Indonesia sebagai negara yang kaya akan
sumber daya alam, yaitu laut dan perikanan harus
melindungi setiap jengkal wilayahya dengan berbagai
sumber daya manusia yang ada. Sumber daya tersebut
adalah nelayan, dan masyarakat sekitar. Selain itu
pemerintah juga berperan dalam pengaturan dan
pengawasan masalah perikanan di Indonesia.
Indonesia memiliki potensi produksi lestari
(Maximum Sustainable Yield/MSY) ikan laut 6,5 juta ton
per tahun, salah satu negara dengan potensi ikan laut
terbesar di dunia atau sekitar 7,2 persen ikan laut dunia
terdapat di Indonesia. (Dahuri, 2012).
Indonesia rawan kasus pencurian ikan ilegal.
Kasus pencurian ikan oleh armada kapal ikan asing
adalah yang paling merugikan negara. Pencurian ini
diperkirakan mencapai 1 juta ton atau Rp 30 triliun per
tahun sejak pertengahan 1980-an (FAO, 2008 dalam
Dahuri, 2012).
also affect the marine tourism, the tourist areas will be
damaged, decreasing the number of visitors as well as
environmental degradation around the area of tourism.
Oil spills also inhibit or reduce the transmission of
sunlight into the seawater due to blocked by the oil and
reflected back into the air.
3.11. Fisheries Violation and Marine Affairs and
Fisheries Surveillance
Indonesia as a country rich in natural resources,
the marine and fishery must protect every inch area
with existing human resources. These resources are
fishermen, and the surrounding community. Besides,
the government also plays a role in the regulation and
supervision of fisheries issues in Indonesia.
Indonesia has the Maximum Sustainable Yield
(MSY) 6.5 million tonnes of fish per year, one of the
countries with the greatest potential for marine fish in
the world, or about 7.2 percent of the world’s marine fish
found in Indonesia. (Dahuri, 2012).
Indonesia is prone illegal fishing. Cases of illegal
fishing by foreign fishing fleets are the most detrimental
to the state. This is estimated at 1 million tons or Rp
30 trillion per year since the mid-1980s (FAO, 2008 in
Dahuri, 2012).
http://www.bps.go.id
S TAT I S T I K S U M B E R D AYA L A U T D A N P E S I S I R
S t a t i s t i k S u m b e r D a y a L a u t d a n P e s i s i r 2 0 1 278
Permasalahannya, saat ini Indonesia baru
punya 25 kapal patroli perikanan di bawah pengelolaan
Kementerian Kelautan dan Perikanan. Dari jumlah itu,
hanya enam kapal patroli yang mampu beroperasi
di ZEEI dan laut dalam. Padahal, untuk mengawasi
wilayah laut Indonesia yang sangat luas (5,8 juta
kilometer persegi), dibutuhkan 90 kapal patroli (Dahuri,
2012).
Data kapal patroli (pengawas) disajikan pada
Tabel 3.58. Data tersebut menunjukkan bahwa jumlah
kapal pengawas 89 unit, hampir sesuai dengan jumlah
ideal yang disarankan. Sebaran kapal pengawas di
Pulau Sumatera terdapat 13 unit, dan Kepulauan Riau
sebagai provinsi dengan kapal pengawas terbanyak (6
unit). Pulau Jawa terdapat 21 unit kapal pengawas, dan
DKI Jakarta sebagai provinsi dengan kapal pengawas
terbanyak (18 unit). Pulau Bali dan Nusa Tenggara
terdapat 5 unit kapal pengawas. Pulau Kalimantan
terdapat 11 unit kapal pengawas dan Kalimantan Barat
sebagai provinsi dengan kapal pengawas terbanyak (5
unit). Pulau Sulawesi terdapat 19 unit kapal pengawas
dan Sulawesi Utara sebagai provinsi dengan kapal
pengawas terbanyak (10 unit). Sementara untuk
Kepulauan Maluku dan Papua jumlahnya 20 unit kapal
pengawas dan Papua sebagai provinsi dengan kapal
pengawas terbanyak (10 unit).
3.12. Sarana dan Prasarana Pendidikan
Sumber daya manusia Indonesia dibidang
perikanan akan semakin maju jika pemerintah, dalam
hal ini KKP sebagai instansi yang berwenang serius
menggarap sarana dan prasarana pendidikan kelautan
The problem is, now Indonesia has had 25
ships under the management of fisheries patrol Ministry
of Maritime Affairs and Fisheries. Of that total, only six
patrol vessels capable of operating in ZEEI and deep
sea. In fact, Indonesia’s marine territory to oversee a
very wide (5.8 million square kilometers), it takes 90
patrol boats (Dahuri, 2012).
Patrol boats data are presented in Table 3.58.
The data shows that the number of patrol ship 89 units,
almost in accordance with the ideal amount suggested.
Distribution of a patrol ship in the island of Sumatra,
there were 13 units, and the Kepulauan Riau province
with the largest patrol ship (6 units). Java, there are 21
units patrol ship, and Jakarta as the province with the
largest patrol ship (18 units). Bali and Lombok are 5
units patrol ship. Borneo Island there are 11 ships as
supervisors and Kalimantan Barat provinces with the
largest patrol ship (5 units). Sulawesi Island there are
19 ships as supervisors and Sulawesi Utara province
with the largest patrol ship (10 units). Moreover, for the
islands of Maluku and Papua number of 20 units patrol
ship and Papua as a province with a patrol ship most
(10 units).
3.12. Education Facilities and Infrastructure
Indonesia’s human resources in fisheries will
be more advanced if the government, in this case
the competent authority KKP seriously working on
educational facilities and marine fisheries. There are
http://www.bps.go.id
S TAT I S T I C S O F M A R I N E A N D C O A S TA L R E S O U R C E S
S t a t i s t i c s o f M a r i n e a n d C o a s t a l R e s o u r c e s 2 0 1 2 79
dan perikanan. KKP hingga saat ini menaungi 12
sekolah perikanan. Sekolah perikanan ini terbagi
menjadi 8 Sekolah Usaha Perikanan Menengah
(SUPM), 3 Akademi Perikanan dan 1 Sekolah Tinggi
Perikanan (STP).
Bahkan untuk meningkatkan daya saing sumber
daya manusia dibidang perikanan, STP ditingkatkan
statusnya menjadi Institut Kelautan dan Perikanan
Nasional (IKPN) Karawang agar memiliki kompetensi
dan memenuhi standar sertifikasi dunia industri, serta
untuk menopang keberhasilan industrialisasi kelautan
dan perikanan (www.antaranews.com, 2012). Pada
Tabel 3.64 disajikan jumlah lulusan sekolah-sekolah
tersebut. Pada kurun waktu 2007-2011, jumlah
lulusannya telah mencapai 6.426 siswa.
Sarana dan prasarana pelayanan dasar
pendidikan dan kesehatan yang terdapat di daerah
pesisir juga perlu mendapat perhatian khusus, agar
sumber daya manusianya mengalami peningkatan ilmu
dan kualitas hidup untuk memajukan sektor kelautan
dan perikanan. Data tersebut didekati dengan data
sarana dan prasarana yang ada di desa pesisir dari
hasil publikasi Statistik Potensi Desa tahun 2011.
Jumlah desa pesisir yang mempunyai fasilitas
pendidikan menurut provinsi dan tingkat pendidikan
berdasarkan data Statistik Potensi Desa 2011 dapat
dilihat pada Tabel 3.66. Terdapat 56,12 persen desa
pesisir yang sudah mempunyai TK, 89,36 persen desa
pesisir yang mempunyai SD, 43,74 persen desa pesisir
yang mempunyai SLTP, 17,33 persen desa pesisir yang
mempunyai SMU, dan 7,46 persen desa pesisir yang
mempunyai SMK.
Selain menyediakan fasilitas sekolah,
pemerintah telah menyebarkan petugas penyuluh
12 fisheries school under the auspices of KKP. They
are divided into 8 Fisheries High School (SUPM), 3
Academy and 1 Institut of Fisheries (STP).
Even, to enhance the competitiveness of human
resources in fisheries, STP upgraded to National
Institute of Marine and Fisheries (IKPN) Karawang
in order to have the competence and certification of
industry standards, as well as to sustain the success
of the industrialization of marine and fisheries (www.
antaranews.com, 2012). The number of graduate
schools presented by Table 3.64. In the period of 2007-
2011, the number of graduates has reached 6426
students.
Facilities and infrastructure of basic services of
education and health are contained in the coastal areas
also need special attention, so that human resources
have increased knowledge and advance the quality of
life for marine and fisheries sector. Infrastructures data
were approximated by the data of the 2011 Village
Potential Census.
The numbers of coastal villages have education
facilities by province and level of education based on
data from the 2011 Village Potential Census in Table
3.66. Among all coastal villages, 56.12 percent villages
already have kindergarten, 89.36 percent villages have
elementary school, 43.74 percent villages have junior
high school, 17.33 per cent villages have senior high
school, and 7.46 percent villages have vocational high
school.
In addition to providing school facilities, the
government also has distributed the fishery information
http://www.bps.go.id
S TAT I S T I K S U M B E R D AYA L A U T D A N P E S I S I R
S t a t i s t i k S u m b e r D a y a L a u t d a n P e s i s i r 2 0 1 280
perikanan ke seluruh provinsi. Jumlah penyuluh
perikanan selama kurun waktu 2007-2011 mengalami
kenaikan rata-rata 32,65 persen per tahun (Tabel 3.65).
3.13. Sarana dan Prasarana Sosial Ekonomi di
Desa Pesisir
Indonesia harus memperhatikan masalah
sosial ekonomi daerah pesisir karena sangat penting
untuk pembangunan sumberdaya laut dan pesisir
yang berkelanjutan. Masalah sosial ekonomi tersebut
diantaranya ketersediaan pelayanan dari sarana
kesehatan, perdagangan dan hotel, lembaga ekonomi
seperti koperasi, lembaga swadaya masyarakat untuk
pemberdayaan penduduk lokal, dan pengentasan
kemiskinan penduduk wilayah pesisir.
Tabel 3.67 menyajikan banyaknya desa pesisir
yang mempunyai fasilitas kesehatan pada tahun 2011.
Terdapat sekitar 17,92 persen desa pesisir yang
memiliki polindes, 25,19 persen desa pesisir yang
memiliki poskesdes, 32,20 persen desa pesisir yang
memiliki puskesmas pembantu dan 95,51 persen desa
pesisir yang memiliki posyandu.
Sarana perdagangan dan hotel akan
mendorong dan meningkatkan roda perekonomian
masyarakat pesisir. Tabel 3.68 menyajikan jumlah
desa pesisir yang mempunyai fasilitas ekonomi pada
tahun 2011. Terdapat sekitar 5,75 persen desa pesisir
yang mempunyai hotel, 8,08 persen desa pesisir
yang mempunyai penginapan, dan 8,84 persen desa
pesisir yang mempunyai restoran. Tersedianya fasilitas
tersebut akan membantu dalam peningkatan wisata
bahari.
agent to all provinces. The number of the fishery
information agent during 2007-2011 has increased an
average of 32.65 percent per year (Table 3.65).
3.13 Socio-Economic Infrastructure in Coastal
Village
Indonesia should pay attention to socio-
economic problems of coastal areas, as it is very
important for the development of marine resources and
coastal development. Such as the availability of services
from the health, trade and hotel, financial institutions
such as cooperatives, non-government organizations to
empower local residents, and poverty reduction for the
coastal area population.
Table 3.67 presents the number of coastal
villages that had health facility in 2011. There were
about 17.92 percent villages had village maternity post,
25.19 percent villages had village’s health post, 32.20
percent villages had subsidiary public health centre, and
95.51 percent villages had integrated health post.
Trade facilities and hotel will support and
increase the economy of coastal communities. Table
3.68 presents the number of coastal villages with
economic facilities in 2011. There are about 5.75
percent coastal villages that had a hotel, 8.08 percent
villages that had an inn, while 8.84 percent villages that
have a restaurant. The availability of these facilities will
also increase the marine tourism.
http://www.bps.go.id
S TAT I S T I C S O F M A R I N E A N D C O A S TA L R E S O U R C E S
S t a t i s t i c s o f M a r i n e a n d C o a s t a l R e s o u r c e s 2 0 1 2 81
Koperasi merupakan lembaga yang dibentuk
untuk mendorong usaha perikanan agar mampu
meningkatkan pendapatan anggotanya, terutama
nelayan. Persentase keberadaan koperasi di desa
pesisir berdasarkan jenis koperasi dari yang terbesar
berturut-turut; Koperasi Simpan Pinjam 16,80 persen,
Koperasi Lainnya 11,29 persen, Koperasi Unit Desa
(KUD) 9,02 persen, dan Koperasi Industri Kecil dan
Kerajinan Rakyat 0,98 persen (Tabel 3.70).
Terdapat tiga program yang secara sistimatis
bertujuan meningkatkan kesejahteraan masyarakat
pesisir. Program tersebut adalah Program Solar Packed
Dealer untuk Nelayan (SPDN)/Stasiun Pengisian Bahan
Bakar Minyak untuk Nelayan (SPBN), Pembangunan
Kedai Pesisir, dan Program Penguatan Modal bagi
masyarakat pesisir yang bekerjasama dengan
lembaga keuangan. Program SPDN/SPBN bertujuan
untuk mengantisipasi dampak kenaikan harga BBM
dengan menghadirkan SPDN/SPBN yang diharapkan
memberikan pelayanan kepada masyarakat pesisir
akan kebutuhan BBM dengan harga terbaik sesuai
ketetapan pemerintah. Melalui program ini beban hidup
masyarakat pesisir diharapkan mampu ditekan sampai
pada tingkat yang signifikan.
Khusus bagi nelayan skala usaha mikro dan
kecil, BBM merupakan elemen sangat penting dalam
menjalankan kegiatannya, karena komponen biaya
BBM berkisar antara 40-60 persen dari seluruh biaya
operasional penangkapan ikan. Hal tersebut juga
berpengaruh pada usaha perikanan budidaya, karena
semakin meningkatnya penggunaan BBM sebagai
bahan bakar genset untuk pompa air, kincir air dan
penerangan. Budidaya udang misalnya, biaya BBM
mencapai 13-16 persen dari biaya produksi (KKP,
2008).
Cooperative is an institution established to
encourage fishing effort in order to increase the income
of its members, especially the fishermen. The coastal
village cooperatives percentage based on the type of
the largest cooperatives; Saving and Loan Cooperative
16.80 percent, Other Cooperatives 11.29 percent,
Village Cooperatives Unit (KUD) 9.02 percent, and the
Cooperatives of Small and Folk Crafts 0.98 percent
(table 3.70).
Three programs systematically aimed at
improving the welfare of coastal communities. They
are the Solar Program Packed Dealer for Fishermen
(SPDN)/Fuel Filling Station for the Fisherman (SPBN),
Store Coastal Development, and Capital Strengthening
Program for coastal communities, that collaborate
with financial institutions.Program SPDN/SPBN aims
to anticipate the impact of increased fuel prices by
presenting SPDN/SPBN expected to provide services to
coastal communities who need fuel with the best price
according to government assessments. Through this
program, the live load pressure is expected to decrease
at a significant level in coastal communities.
Fuel is an important element for the micro-scale
and small fishermen to carry out their activities. The
fuel cost component ranges between 40-60 percent
from the total operational costs of fishing activities. Fuel
also affects on the aquaculture business, because of
the increasing use of petroleum as fuel generator for
water pump, windmill water and lighting. For example
shrimp culture, the fuel cost reached 13-16 percent of
production costs (KKP, 2008).
http://www.bps.go.id
S TAT I S T I K S U M B E R D AYA L A U T D A N P E S I S I R
S t a t i s t i k S u m b e r D a y a L a u t d a n P e s i s i r 2 0 1 282
Lembaga Keuangan Mikro (LKM) disiapkan
sebagai lembaga keuangan alternatif non perbankan
khusus melayani masyarakat pesisir yang dapat
diakses dengan mudah sehingga nantinya bisa
mempercepat pertumbuhan perekonomian. Tujuan
untuk melayani kebutuhan modal di masyarakat pesisir
khususnya usaha kecil dan mikro. Kerjasama dengan
institusi perbankan berdasarkan tehnologi perbankan
baik online atau offline. LKM yang ada dalam bentuk
LKM Swamitra Mina,Unit Simpan Pinjam (USP) dan
Bank Perkreditan Rakyat (BPR) Pesisir.
Selain SPDN dan LKM, terdapat juga kedai
pesisir. Kedai pesisir bertujuan untuk membantu
masyarakat pesisir dalam mendapatkan aneka jenis
barang kebutuhan hidup sehari-hari dan kebutuhan
melaut bagi nelayan dengan harga yang relatif lebih
murah dengan waktu yang lebih cepat sebagai
bagian dari pemberdayaan masyarakat pesisir (KKP,
2008). Diperkirakan bahwa masyarakat pesisir dalam
memenuhi kebutuhan sehari-hari dan kebutuhan melaut
dibelinya dengan harga lebih tinggi 30-40 persen dari
harga selayaknya (KKP, 2009). Jumlah kedai pesisir
setiap tahun bertambah dan telah mencapai 195 kedai
pesisir pada tahun 2009. Program pemerintah yang
ditujukan untuk pemberdayaan masyarakat dapat
dilihat pada Tabel 3.70-3.79.
Sejak tahun 2009 seluruh kegiatan
Pemberdayaan Ekonomi Masyarakat Pesisir (PEMP)
dirubah menjadi Program Nasional Pemberdayaan
Masyarakat Kelautan dan Perikanan (PNPM-KP).
PNPM-KP secara umum bertujuan untuk mening-
katkan kesejahteraan dan kesempatan kerja kelompok
masyarakat miskin bidang kelautan dan perikanan.
Microfinance Institutions (LKM) was prepared
as an alternative non-banking financial institutions
specifically serving the coastal communities that
are easily accessible so that later can accelerate the
economic growth. The Microfinance institution aim
to serve the capital needs in coastal communities,
especially small and micro enterprises. Cooperation
with banking institutions based banking technology
either online or offline is in the form of Swamitra Mina,
Unit Savings and Loans (USP) and Rural Bank (BPR)
Coastal.
Besides SPDN and LKM, there are also
store coast. The store coast aims to assist coastal
communities in obtaining various types of daily needs
and sea supplies for fishermen with cheaper price and
faster time as part of coastal community empowerment
(KKP, 2008). It is estimated that the coastal communities
bought their daily needs and their sea supplies at a price
30-40 percent higher than the reasonable price (KKP,
2009). The number of stores coastareincreasesevery
year and reach 195 stores coastin 2009. Government
programs thataimed for community empowerment can
be seen in Table 3.70-3.79.
Since 2009, all Economic Empowerment
of the Coastal Community (PEMP) activities have
been changed into National Program for Community
Empowerment Marine Affairs and Fisheries(PNPM-
KP). Generally, PNPM-KP aimed to improve welfare
and employment opportunities of marine and fisheries
poor communities. In the implementation, PNPM-
http://www.bps.go.id
S TAT I S T I C S O F M A R I N E A N D C O A S TA L R E S O U R C E S
S t a t i s t i c s o f M a r i n e a n d C o a s t a l R e s o u r c e s 2 0 1 2 83
Dalam pelaksanaannya PNPM-KP tidak serta merta
menghilangkan program yang sudah berjalan.
Pendekatan program yang digunakan sepenuhnya
bottom up, masyarakat sendiri yang merencanakan
program, melaksanakan dan melakukan monitoring
serta evaluasi sesuai dengan mekanisme yang
ditentukan.
Tahap pemberdayaan yang dikembangkan
dalam PNPM-KP adalah tahap inisiasi, tahap
penguatan, dan tahap peningkatan kemandirian. Tahap
inisiasi yaitu masyarakat melalui kelompok-kelompok
masyarakat dibina, dilatih berbagai ketrampilan dan
diberikan pendampingan. Tahap penguatan yaitu
kelompok masyarakat terbina dilatih untuk mampu
memanfaatkan skema kredit dan usaha mikro, kecil
dan menengah, diberikan pendampingan dan bantuan
pemasaran serta peningkatan kualitas produk.
Sedangkan tahap peningkatan kemandirian yaitu
kelompok masyarakat yang diperkuat ditingkatkan
kapasitas dan kemampuannya sehingga mampu
mengakses kredit perbankan, difasilitasi dengan
pendampingan serta penguatan kemitraan ekonomi
dan sosial (KKP, 2010).
Di tahun 2011, PNPM-KP dilaksanakan
melalui dua komponen yaitu Pengembangan Usaha
Mina Perdesaan (PUMP) dan Pemberdayaan Usaha
Garam Rakyat (PUGAR) dalam rangka pengentasan
kemiskinan melalui peningkatan kemampuan dan
pendapatan masyarakat serta penumbuhan wirausaha
kelautan dan perikanan. PUMP dan PUGAR merupakan
upaya kegiatan pemberdayaan antara lain melalui
fasilitasi bantuan pengembangan usaha bagi nelayan,
pembudidaya, pengolah/pemasar ikan dan petambak
KP did not eliminate the programs that are running.
Approaching program that used iscompletely bottom up,
the communities planning the program, implementing
and monitoring as well as evaluation in accordance with
determined mechanism bythemselves.
Developed stage of empowerment in
PNPM-KP is initiatonstage,strengthenstage, and
autonomyimprovementstage. Initiation stage is the
communities through community groups are nurtured,
trained with various skills, and given assistance.
Strengthen stage is the nurture community groups
trained to be able utilized credit scheme and micro,
small and medium enterprises, provided mentoring and
marketing assistance and also improvement of product
quality. Whereas, autonomy improvement stage is the
strengthed community groups are enhanced in capacity
and ability so they can access bank credits facilitated by
the assistance and the social and economic strengthen
partnership (KKP, 2010).
In 2011, PNPM-KP is implemented through
two components, there are Rural Fishery Development
Program (PUMP) and Community Empowerment for
Salt Production (PUGAR) in the context of poverty
alleviation through capacity building and increasing
communities income and also fisheries and marine
entrepreneur growth. PUMP and PUGAR are effort
empowerment activities, through the facilitation of
business development aid for fishermen, fish farmers,
fish processors/ marketers and salt farmers in Marine
http://www.bps.go.id
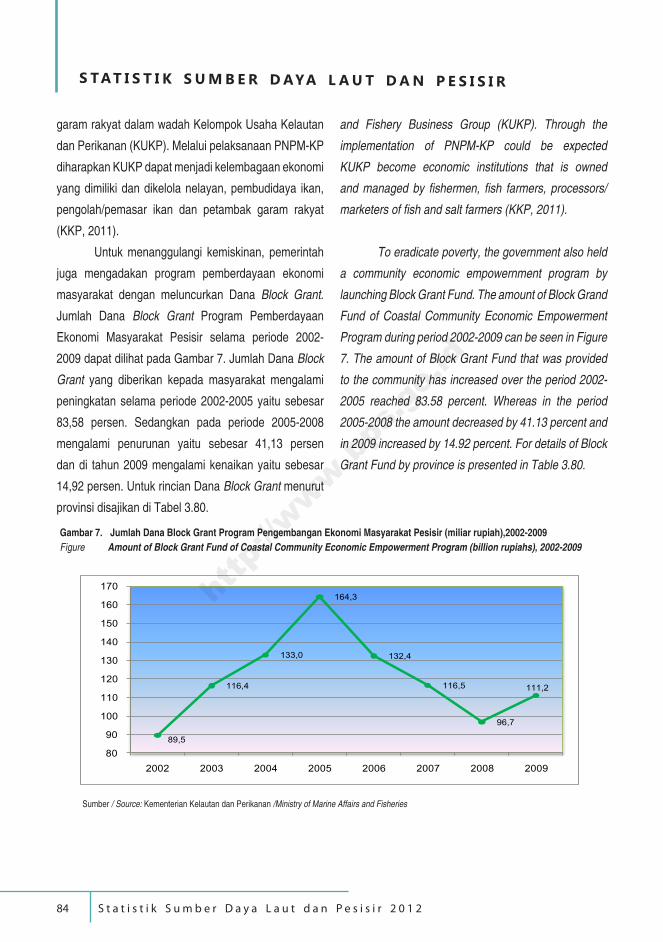
S TAT I S T I K S U M B E R D AYA L A U T D A N P E S I S I R
S t a t i s t i k S u m b e r D a y a L a u t d a n P e s i s i r 2 0 1 284
garam rakyat dalam wadah Kelompok Usaha Kelautan
dan Perikanan (KUKP). Melalui pelaksanaan PNPM-KP
diharapkan KUKP dapat menjadi kelembagaan ekonomi
yang dimiliki dan dikelola nelayan, pembudidaya ikan,
pengolah/pemasar ikan dan petambak garam rakyat
(KKP, 2011).
Untuk menanggulangi kemiskinan, pemerintah
juga mengadakan program pemberdayaan ekonomi
masyarakat dengan meluncurkan Dana Block Grant.
Jumlah Dana Block Grant Program Pemberdayaan
Ekonomi Masyarakat Pesisir selama periode 2002-
2009 dapat dilihat pada Gambar 7. Jumlah Dana Block
Grant yang diberikan kepada masyarakat mengalami
peningkatan selama periode 2002-2005 yaitu sebesar
83,58 persen. Sedangkan pada periode 2005-2008
mengalami penurunan yaitu sebesar 41,13 persen
dan di tahun 2009 mengalami kenaikan yaitu sebesar
14,92 persen. Untuk rincian Dana Block Grant menurut
provinsi disajikan di Tabel 3.80.
and Fishery Business Group (KUKP). Through the
implementation of PNPM-KP could be expected
KUKP become economic institutions that is owned
and managed by fishermen, fish farmers, processors/
marketers of fish and salt farmers (KKP, 2011).
To eradicate poverty, the government also held
a community economic empowernment program by
launching Block Grant Fund. The amount of Block Grand
Fund of Coastal Community Economic Empowerment
Program during period 2002-2009 can be seen in Figure
7. The amount of Block Grant Fund that was provided
to the community has increased over the period 2002-
2005 reached 83.58 percent. Whereas in the period
2005-2008 the amount decreased by 41.13 percent and
in 2009 increased by 14.92 percent. For details of Block
Grant Fund by province is presented in Table 3.80.
Gambar 7. Jumlah Dana Block Grant Program Pengembangan Ekonomi Masyarakat Pesisir (miliar rupiah),2002-2009
Figure Amount of Block Grant Fund of Coastal Community Economic Empowerment Program (billion rupiahs), 2002-2009
89,5
116,4
133,0
164,3
132,4
116,5
96,7
111,2
80
90
100
110
120
130
140
150
160
170
2002 2003 2004 2005 2006 2007 2008 2009
Sumber / Source: Kementerian Kelautan dan Perikanan /Ministry of Marine Affairs and Fisheries
http://www.bps.go.id
S TAT I S T I C S O F M A R I N E A N D C O A S TA L R E S O U R C E S
S t a t i s t i c s o f M a r i n e a n d C o a s t a l R e s o u r c e s 2 0 1 2 85
3.14. Nilai Tukar Petani Subsektor Perikanan
(NTN)
Nilai Tukar Petani Subsektor Perikanan atau
disebut juga Nilai Tukar Nelayan (NTN) merupakan
salah satu indikator yang berguna untuk mengukur
tingkat kesejahteraan petani subsektor perikanan,
karena mengukur kemampuan tukar produk (komoditas)
yang dihasilkan/dijual petani subsektor perikanan
dibandingkan dengan produk yang dibutuhkan petani
subsektor perikanan baik untuk proses produksi
(usaha) maupun untuk konsumsi rumah tangga petani
subsektor perikanan. Dalam hal ini Petani subsektor
perikanan sebagai produsen dan konsumen. Dalam
kapasitas petani subsektor perikanan sebagai produsen
dinyatakan sebagai klasifikasi indeks yang diterima
nelayan (It) dan kapasitas petani subsektor perikanan
sebagai konsumen dinyatakan dalam indeks yang
dibayar nelayan (Ib).
It berasal dari indeks yang diterima petani
subsektor perikanan sebagai penangkap ikan dan
sebagai pembudidaya ikan. Sedangkan Ib dibagi
ke dalam dua sektor, yaitu indeks konsumsi rumah
tangga yang terdiri dari indeks kelompok makanan,
perumahan, pakaian, dan aneka barang dan jasa, serta
indeks biaya produksi dan penambahan barang modal
yang meliputi indeks kelompok non faktor produksi,
faktor produksi, upah, lainnya, dan penambahan barang
modal. Metode penghitungan It dan Ib menggunakan
formula Laspeyres yang telah dimodifikasi (BPS, 2009).
Nilai Tukar Nelayan (NTN) adalah perbandingan
3.14. Fishery Farmer Terms of Trade (NTN)
Fishery Farmer Terms of Trade known as
NTN. NTN is a useful indicator to measure the level of
fishery farmers welfare, because it measures the ability
to exchange products (commodities) produced or sold
by fishery farmers compared with the products needed
by fishery farmers for production process (business)
as well as for household consumption.Here the fishery
farmers in the capacity as a producer and consumer. In
the capacity of fishery farmers as producer declared a
classification index which is received byfishery farmers
(It) and the capacity of fishery farmers as consumers
expressed in an index that paid by fishery farmers (Ib).
It, comes from the index received by fishery
farmers as a catcher of fish and as the fish farmers. While
Ib divided consits of two sectors: household consumption
index, which consists of index of food, housing, clothing,
and miscellaneous goods and services; and index of
cost of production and capital formationwhich includes
index of non factors of production, factors of production,
wages, others, and capital formation. It and Ib was
calculated using modified Laspeyres formula method
(BPS, 2009).
Fishery Farmer Terms of Trade (NTN) is the
NTN= It / Ib x 100
http://www.bps.go.id
S TAT I S T I K S U M B E R D AYA L A U T D A N P E S I S I R
S t a t i s t i k S u m b e r D a y a L a u t d a n P e s i s i r 2 0 1 286
antara indeks harga yang diterima (It) dan dibayar (Ib)
petani subsektor perikanan. Jika NTN lebih besar dari
100 maka dapat diartikan kemampuan daya beli petani
subsektor perikanan periode tersebut relatif lebih baik
dibandingkan dengan periode tahun dasar, sebaliknya
jika NTN lebih kecil atau dibawah 100 berarti terjadi
penurunan daya beli petani subsektor perikanan (BPS,
2009). NTN di atas 100 dapat juga diartikan petani sub
sektor perikanan mengalami surplus. Harga produksi
naik lebih besar dari kenaikan harga konsumsinya atau
pendapatan petani subsektor perikanan naik.
Setiap provinsi memiliki NTN masing-masing
yang dapat dihitung setiap tahun. Perkembangan
NTN provinsi dari tahun 2010 sampai 2011, relatif
tidak mengalami perkembangan yang signifikan.
Berbeda jika dilihat perkembangan NTN provinsi 2011-
2012, terlihat bahwa beberapa provinsi mengalami
peningkatan diantaranya adalah Provinsi Sumatera
Utara, Riau Jambi, Banten, Bali, Nusa Tenggara Barat,
Kalimantan Selatan, Kalimantan Timur, Sulawesi Utara,
Maluku Utara, Papua Barat, dan Papua. Tabel 3.82 dan
3.83 menyajikan data tabel indeks harga yang diterima
petani subsektor perikanan, indeks harga yang dibayar
petani subsektor perikanan dan NTN menurut provinsi
tahun 2011-2012.
ratio between prices received index (It) and paid price
by fishery farmers (Ib). If the NTN greater than 100, it
means the purchasing power of fishery farmers in the
time period is better than the base year period, otherwise
if the NTN smaller or below 100 means there is a
declining in the purchasing power of the fishery farmers
(BPS, 2009). NTN above 100 can also be indicates
that fishery farmers have a surplus. Production prices
increase faster than consumption prices or fishery
farmer’s income increase.
Each province has its NTN, which calculated
every year. Growth of NTN provincial from 2010 to
2011, did not growth significantly. Contrast when
viewed growth NTN in 2011-2012, shows that some
provinces have increased include Sumatera Utara, Riau
Jambi, Banten, Bali, Nusa Tenggara Barat, Kalimantan
Selatan, Kalimantan Timur, Sulawesi Utara, Maluku
Utara, Papua Barat, dan Papua. Table 3.82 and Table
3.83 present the index of prices received by fishery
farmers and prices paid by fishery farmers and NTN by
province during 2011-2012.
http://www.bps.go.id
R E F E R E N C E S
S t a t i s t i c s o f M a r i n e a n d C o a s t a l R e s o u r c e s 2 0 1 2 87
DAFTAR PUSTAKA / REFERENCES
Afifi, M. 2000. Pengelolaan Sumber Daya Wilayah Pesisir Dan Lautan Secara Terpadu Dan Berkelanjutan. Makalah
disajikan dalam dalam lokakarya bidang lingkungan dengan tema, “Menuju Eksplorasi Laut dan Pesisir
Pantai yang Berkelanjutan” Institute for Science and Technology Studies ISTECS Europa, Hamburg, 15
Juli 2000.
Ambon Antara. 2012. Lumbung Ikan Nasional Masuk MP3EI. 21 Agustus 2012. (http://www.ambon.antaranews.
com).
Anonim. Eropa 11 Kali Tolak Ekspor Ikan Indonesia. 15 September 2011. (http://www.medanbisnis.com)
Bappenas.2007. Diprioritaskan Pelabuhan Perikanan Indonesia Timur; 16 Juli 2007.(els.bappenas.go.id/.../
Diprioritaskan%20pelabuhan%20 perikanan.pdf).
Bengen, D.G. 2000. Pengenalan dan Pengelolaan Ekosistem Mangrove. Pusat Kajian Sumberdaya Pesisir dan
Lautan, Institut Pertanian Bogor.
__________.2001. Sinopsis Ekosistem dan Sumberdaya Alam Pesisir dan Laut. Pusat Kajian Sumberdaya Pesisir
dan Lautan, Institut Pertanian Bogor.
__________. 2002. Keterkaitan Antar Ekosistem Pesisir. Materi Kuliah pada Program Studi Pengelolaan
Sumberdaya Pesisir dan Lautan, Institut Pertanian Bogor.
Clough, B.F. editor, 1982: Mangrove ecosystems in Australia: structure, function and management. Canberra:
Australian National University Press in association with the Australian Institute of Marine Science.
Clough, B. F., Attiwell, P. M. (1980). Primary production of Zostera muelleri Irmisch. ex Aschers. in Western Port
Bay (Victoria, Australia). Aquat. Bot. 9: 1-13.
Dahuri, R., et al. (1996). Pengelolaan Sumberdaya Wilayah Pesisir dan Lautan Secara Terpadu. Jakarta: Pradnya
Paramita.
Dahuri R, Rais J, Sapta P.G., Sitepu M. 2001. Pengelolaan Sumberdaya Wilayah Pesisir dan Lautan Secara
terpadu (EdisiRevisi). Jakarta: Saptodadi.
Dahuri, D. 2002. Membangun Kembali Perekonomian Indonesia Melalui Sektor Perikanan dan Kelautan. LISPI
Jakarta.
__________. 2009. Pembangunan Berbasis Kelautan dan Kepulauan. 1 Agustus 2009. (http://rokhmindahuri.
wordpress.com/).
http://www.bps.go.id
D A F TA R P U S TA K A
S t a t i s t i k S u m b e r D a y a L a u t d a n P e s i s i r 2 0 1 288
__________. 2012. Anatomi Pencurian Ikan. 7 Juni 2012. (http://indomarine.or.id/).
Damanik, M Riza. 2011. Sepertiga Hutan Mangrove Dunia Hancur. 15 Agustus 2011. (http://kiara.or.id).
Den Hartog, C. 1970. The Seagrasses of The World. North Holland Publ., Amsterdam
English, S., C. Wilkinson and V. Basker, 1997. Survey Manual for Tropical Marine Resources (2nd Ed). Australian
Institute of Mar. Sci.. Townsville, pp.119-195.
FAO. 2006a. Global Forest Resources Assessment 2005 – progress towards sustainable.
FAO. 2007. The World’s Mangroves 1980–2005. Forest Resources Assessment Working Paper No. 153. Food and
Agriculture Organization of The United Nations. Rome.
FAO. 1994. Mangrove Forest Management Guidelines. FAO Forestry Paper 117, Rome.
Fonseca MS, Fisher JS, Zieman JC, Thayer GW.1982.Influence of the Seagrass, Zostera Marina, on Current Flow.
Estuar Coast Shelf Sci 15:351–364.
Kadi, A. 2004. Rumput Laut Ekonomis dan Budidayanya. Pusat Penelitian Oseanografi-LLPI Jakarta: 61 hal.
Kementerian Dalam Negeri. 2008. Direktorat Jenderal Pemerintahan Umum
Kementerian Energi dan Sumber Daya Mineral. 2006.Direktur Jenderal Geologi Sumber daya Mineral. Jakarta
Kementerian Kehutanan. Pusat Informasi Mangrove 2007. Bali
KepMen Lingkungan Hidup Nomor 51 tahun 2004.
KepMen Lingkungan Hidup Nomor 174 tahun 2004 tentang ralat Keputusan Menteri Negara Lingkungan Hidup
Nomor 51 Tahun 2004 mengatur tentang baku mutu air laut.
Kiswara, W. dan Winardi. 1999. Sebaran Lamun di Teluk Kuta dan Teluk Gerupuk, Lombok. Hal. 11-25. Jakarta
:Puslitbang Oseanologi LIPI.
Meiviana, A., D.R. Sulistiowati dan M.H. Soejachmoen. 2004. Bumi Makin Panas: Ancaman Perubahan Iklim di
Indonesia. Yayasan Pelangi. Jakarta
Mubarak, H. Et al. 1990. Petunjuk Teknis Budidaya Rumput Laut. Departemen Pusat Penelitian dan Pengembangan
Perikanan. Jakarta.
Mubarak, H. Sulistijo, Djamali A, dan Sumadiharga OK, 1998. Sumberdaya Rumput Laut Potensi dan Penyebaran
Sumberdaya Ikan Laut di Perairan Indonesia. Hal 226-241. Komisi Nasional Pengkajian Stock
Sumberdaya Ikan LIPI.
http://www.bps.go.id
R E F E R E N C E S
S t a t i s t i c s o f M a r i n e a n d C o a s t a l R e s o u r c e s 2 0 1 2 89
Paulus, Chaterina Agusta. 2011. Gambaran Umum Wilayah Pesisir Indonesia. Jakarta.
Republika. 2010. 70 Persen Hutan Mangrove Indonesia Rusak. 21 Maret 2010. (http://www.republika.co.id/).
Republika. 2009. Pemanasan Global Ancam 900 Spesies Terumbu Karang. 2 Maret 2009. (http://www.oseanografi.
lipi.go.id/id/component/content/article).
Roessig, J. M., C. M. Woodley, J. J. Cech, Jr., and L. J. Hansen. 2004. Effects of Global Climate Change on Marine
and Estuarine Fishes and Fisheries. Reviews in Fish Biology and Fisheries 14: 251-275.
Robertson, A. I., Mann, K. H. (1984). Disturbanceby ice and history adaptations of the seagrass Zostera manna.
Mar. Biol. 80. 131-141.
Saifullah, Muhammad. 12 Pulau Terluar Indonesia Rawan Picu Konflik. 9 Agustus 2011. (http://okezone.com).
Scoffin, TP. 1970. The Trapping and Binding of Subtidal Carbonate Sediments by Marine Vegetation in Bimini
Lagoon. Bahamas. J Sediment Petrol 40:249–273.
Susuwongi. 2011. Indonesia Miliki 13.466 Pulau. 15 Juli 2011. (http://www.niasonline.com).
Supriharyono. 2007. Konservasi Ekosistem Sumberdaya Hayati di Wilayah Pesisir dan Laut Tropis. Jakarta:
Penerbit Pustaka Pelajar.
Stevenson, J C.1988. Comparative Ecology of Submerged Grass Beds In Freshwater, Estuanne, and Marine
Environments. Llmnol. Oceanogr. 33: 867-893.
The Jakarta Post. 2011. 71% of Indonesian mangrove forests damaged: minister. 7Agustus 2011. (http://www.
thejakartapost.com)
Wood, E.J.F., W.E. Odum & J.C. Zieman 1969. The Influence of Seagrass on Productifity of Coastal lagoons. In
Memoirs Symposium International Costeras (UNAM-UNESCO) Nov. 28-30, 1967. P 495-502.http://www.bps.go.id

http://www.bps.go.id
http://www.bps.go.id

http://www.bps.go.id
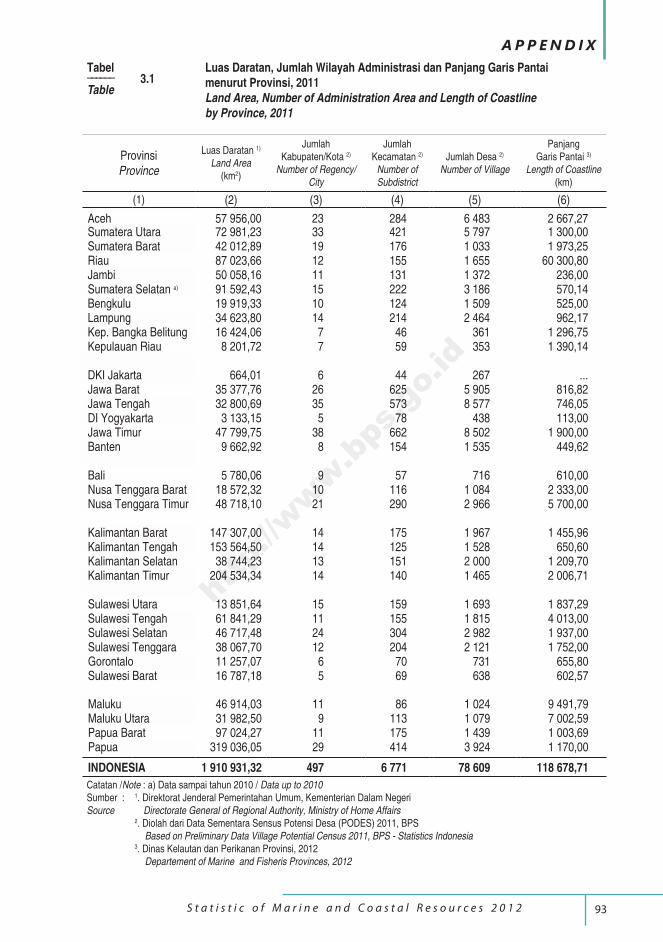
93 S t a t i s t i c o f M a r i n e a n d C o a s t a l R e s o u r c e s 2 0 1 2
A P P E N D I X
ProvinsiProvince
Luas Daratan 1)
Land Area (km2)
JumlahKabupaten/Kota 2)
Number of Regency/City
Jumlah Kecamatan 2)
Number of Subdistrict
Jumlah Desa 2)
Number of Village
PanjangGaris Pantai 3)
Length of Coastline (km)
(1) (2) (3) (4) (5) (6)
Aceh 57 956,00 23 284 6 483 2 667,27Sumatera Utara 72 981,23 33 421 5 797 1 300,00Sumatera Barat 42 012,89 19 176 1 033 1 973,25Riau 87 023,66 12 155 1 655 60 300,80Jambi 50 058,16 11 131 1 372 236,00Sumatera Selatan a) 91 592,43 15 222 3 186 570,14Bengkulu 19 919,33 10 124 1 509 525,00Lampung 34 623,80 14 214 2 464 962,17Kep. Bangka Belitung 16 424,06 7 46 361 1 296,75Kepulauan Riau 8 201,72 7 59 353 1 390,14
DKI Jakarta 664,01 6 44 267 ...Jawa Barat 35 377,76 26 625 5 905 816,82Jawa Tengah 32 800,69 35 573 8 577 746,05DI Yogyakarta 3 133,15 5 78 438 113,00Jawa Timur 47 799,75 38 662 8 502 1 900,00Banten 9 662,92 8 154 1 535 449,62
Bali 5 780,06 9 57 716 610,00Nusa Tenggara Barat 18 572,32 10 116 1 084 2 333,00Nusa Tenggara Timur 48 718,10 21 290 2 966 5 700,00
Kalimantan Barat 147 307,00 14 175 1 967 1 455,96Kalimantan Tengah 153 564,50 14 125 1 528 650,60Kalimantan Selatan 38 744,23 13 151 2 000 1 209,70Kalimantan Timur 204 534,34 14 140 1 465 2 006,71
Sulawesi Utara 13 851,64 15 159 1 693 1 837,29Sulawesi Tengah 61 841,29 11 155 1 815 4 013,00Sulawesi Selatan 46 717,48 24 304 2 982 1 937,00Sulawesi Tenggara 38 067,70 12 204 2 121 1 752,00Gorontalo 11 257,07 6 70 731 655,80Sulawesi Barat 16 787,18 5 69 638 602,57
Maluku 46 914,03 11 86 1 024 9 491,79Maluku Utara 31 982,50 9 113 1 079 7 002,59Papua Barat 97 024,27 11 175 1 439 1 003,69Papua 319 036,05 29 414 3 924 1 170,00
INDONESIA 1 910 931,32 497 6 771 78 609 118 678,71
Tabel –––––– 3.1Table
Luas Daratan, Jumlah Wilayah Administrasi dan Panjang Garis Pantai menurut Provinsi, 2011Land Area, Number of Administration Area and Length of Coastlineby Province, 2011
Catatan /Note : a) Data sampai tahun 2010 / Data up to 2010Sumber : 1. Direktorat Jenderal Pemerintahan Umum, Kementerian Dalam NegeriSource Directorate General of Regional Authority, Ministry of Home Affairs 2. Diolah dari Data Sementara Sensus Potensi Desa (PODES) 2011, BPS Based on Preliminary Data Village Potential Census 2011, BPS - Statistics Indonesia 3. Dinas Kelautan dan Perikanan Provinsi, 2012 Departement of Marine and Fisheris Provinces, 2012
http://www.bps.go.id
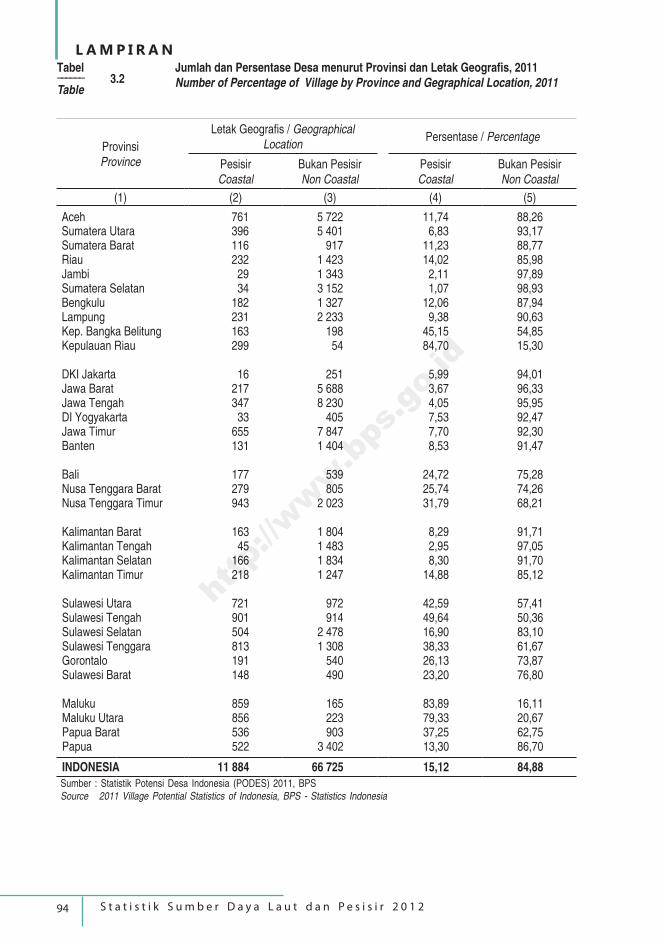
94 S t a t i s t i k S u m b e r D a y a L a u t d a n P e s i s i r 2 0 1 2
L A M P I R A N
ProvinsiProvince
Letak Geografis / Geographical Location
Persentase / Percentage
PesisirCoastal
Bukan PesisirNon Coastal
PesisirCoastal
Bukan PesisirNon Coastal
(1) (2) (3) (4) (5)
Aceh 761 5 722 11,74 88,26Sumatera Utara 396 5 401 6,83 93,17Sumatera Barat 116 917 11,23 88,77Riau 232 1 423 14,02 85,98Jambi 29 1 343 2,11 97,89Sumatera Selatan 34 3 152 1,07 98,93Bengkulu 182 1 327 12,06 87,94Lampung 231 2 233 9,38 90,63Kep. Bangka Belitung 163 198 45,15 54,85Kepulauan Riau 299 54 84,70 15,30
DKI Jakarta 16 251 5,99 94,01Jawa Barat 217 5 688 3,67 96,33Jawa Tengah 347 8 230 4,05 95,95DI Yogyakarta 33 405 7,53 92,47Jawa Timur 655 7 847 7,70 92,30Banten 131 1 404 8,53 91,47
Bali 177 539 24,72 75,28Nusa Tenggara Barat 279 805 25,74 74,26Nusa Tenggara Timur 943 2 023 31,79 68,21
Kalimantan Barat 163 1 804 8,29 91,71Kalimantan Tengah 45 1 483 2,95 97,05Kalimantan Selatan 166 1 834 8,30 91,70Kalimantan Timur 218 1 247 14,88 85,12
Sulawesi Utara 721 972 42,59 57,41Sulawesi Tengah 901 914 49,64 50,36Sulawesi Selatan 504 2 478 16,90 83,10Sulawesi Tenggara 813 1 308 38,33 61,67Gorontalo 191 540 26,13 73,87Sulawesi Barat 148 490 23,20 76,80
Maluku 859 165 83,89 16,11Maluku Utara 856 223 79,33 20,67Papua Barat 536 903 37,25 62,75Papua 522 3 402 13,30 86,70
INDONESIA 11 884 66 725 15,12 84,88
Tabel –––––– 3.2Table
Jumlah dan Persentase Desa menurut Provinsi dan Letak Geografis, 2011Number of Percentage of Village by Province and Gegraphical Location, 2011
Sumber : Statistik Potensi Desa Indonesia (PODES) 2011, BPSSource 2011 Village Potential Statistics of Indonesia, BPS - Statistics Indonesia
http://www.bps.go.id
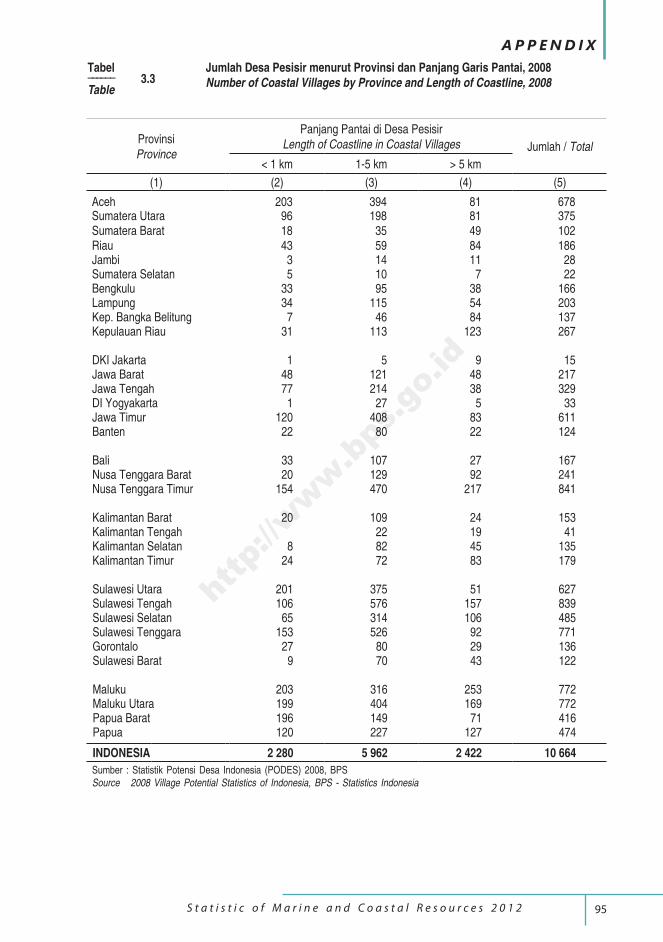
95 S t a t i s t i c o f M a r i n e a n d C o a s t a l R e s o u r c e s 2 0 1 2
A P P E N D I X
ProvinsiProvince
Panjang Pantai di Desa PesisirLength of Coastline in Coastal Villages Jumlah / Total
< 1 km 1-5 km > 5 km
(1) (2) (3) (4) (5)
Aceh 203 394 81 678Sumatera Utara 96 198 81 375Sumatera Barat 18 35 49 102Riau 43 59 84 186Jambi 3 14 11 28Sumatera Selatan 5 10 7 22Bengkulu 33 95 38 166Lampung 34 115 54 203Kep. Bangka Belitung 7 46 84 137Kepulauan Riau 31 113 123 267
DKI Jakarta 1 5 9 15Jawa Barat 48 121 48 217Jawa Tengah 77 214 38 329DI Yogyakarta 1 27 5 33Jawa Timur 120 408 83 611Banten 22 80 22 124
Bali 33 107 27 167Nusa Tenggara Barat 20 129 92 241Nusa Tenggara Timur 154 470 217 841
Kalimantan Barat 20 109 24 153Kalimantan Tengah 22 19 41Kalimantan Selatan 8 82 45 135Kalimantan Timur 24 72 83 179
Sulawesi Utara 201 375 51 627Sulawesi Tengah 106 576 157 839Sulawesi Selatan 65 314 106 485Sulawesi Tenggara 153 526 92 771Gorontalo 27 80 29 136Sulawesi Barat 9 70 43 122
Maluku 203 316 253 772Maluku Utara 199 404 169 772Papua Barat 196 149 71 416Papua 120 227 127 474
INDONESIA 2 280 5 962 2 422 10 664
Tabel –––––– 3.3Table
Jumlah Desa Pesisir menurut Provinsi dan Panjang Garis Pantai, 2008Number of Coastal Villages by Province and Length of Coastline, 2008
Sumber : Statistik Potensi Desa Indonesia (PODES) 2008, BPSSource 2008 Village Potential Statistics of Indonesia, BPS - Statistics Indonesia
http://www.bps.go.id
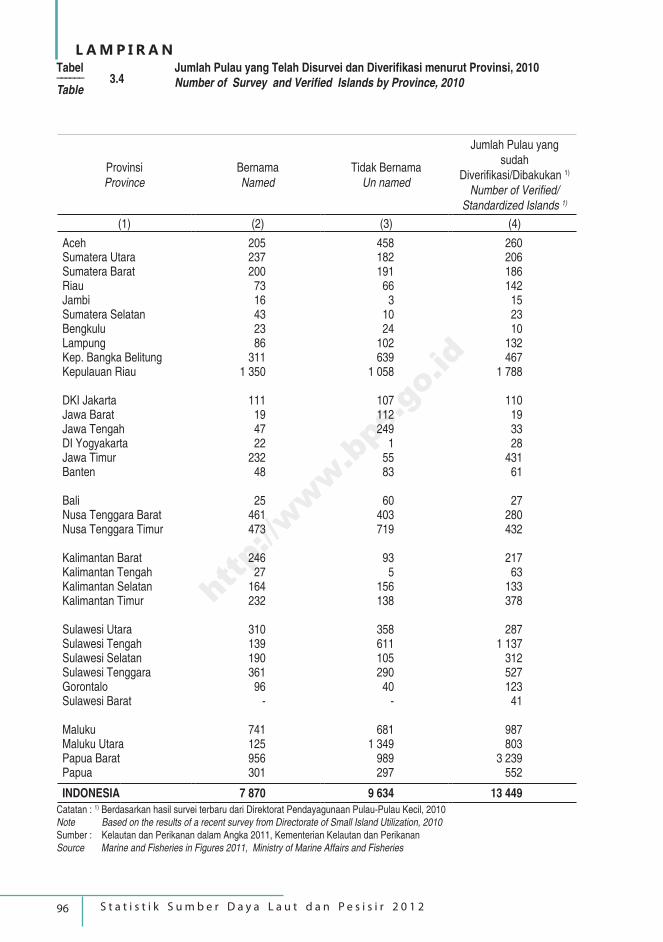
96 S t a t i s t i k S u m b e r D a y a L a u t d a n P e s i s i r 2 0 1 2
L A M P I R A N
ProvinsiProvince
BernamaNamed
Tidak BernamaUn named
Jumlah Pulau yang sudah
Diverifikasi/Dibakukan 1)
Number of Verified/Standardized Islands 1)
(1) (2) (3) (4)
Aceh 205 458 260Sumatera Utara 237 182 206Sumatera Barat 200 191 186Riau 73 66 142Jambi 16 3 15Sumatera Selatan 43 10 23Bengkulu 23 24 10Lampung 86 102 132Kep. Bangka Belitung 311 639 467Kepulauan Riau 1 350 1 058 1 788
DKI Jakarta 111 107 110Jawa Barat 19 112 19Jawa Tengah 47 249 33DI Yogyakarta 22 1 28Jawa Timur 232 55 431Banten 48 83 61
Bali 25 60 27Nusa Tenggara Barat 461 403 280Nusa Tenggara Timur 473 719 432
Kalimantan Barat 246 93 217Kalimantan Tengah 27 5 63Kalimantan Selatan 164 156 133Kalimantan Timur 232 138 378
Sulawesi Utara 310 358 287Sulawesi Tengah 139 611 1 137Sulawesi Selatan 190 105 312Sulawesi Tenggara 361 290 527Gorontalo 96 40 123Sulawesi Barat - - 41
Maluku 741 681 987Maluku Utara 125 1 349 803Papua Barat 956 989 3 239Papua 301 297 552
INDONESIA 7 870 9 634 13 449
Tabel –––––– 3.4Table
Jumlah Pulau yang Telah Disurvei dan Diverifikasi menurut Provinsi, 2010Number of Survey and Verified Islands by Province, 2010
Catatan : 1) Berdasarkan hasil survei terbaru dari Direktorat Pendayagunaan Pulau-Pulau Kecil, 2010Note Based on the results of a recent survey from Directorate of Small Island Utilization, 2010Sumber : Kelautan dan Perikanan dalam Angka 2011, Kementerian Kelautan dan PerikananSource Marine and Fisheries in Figures 2011, Ministry of Marine Affairs and Fisheries
http://www.bps.go.id
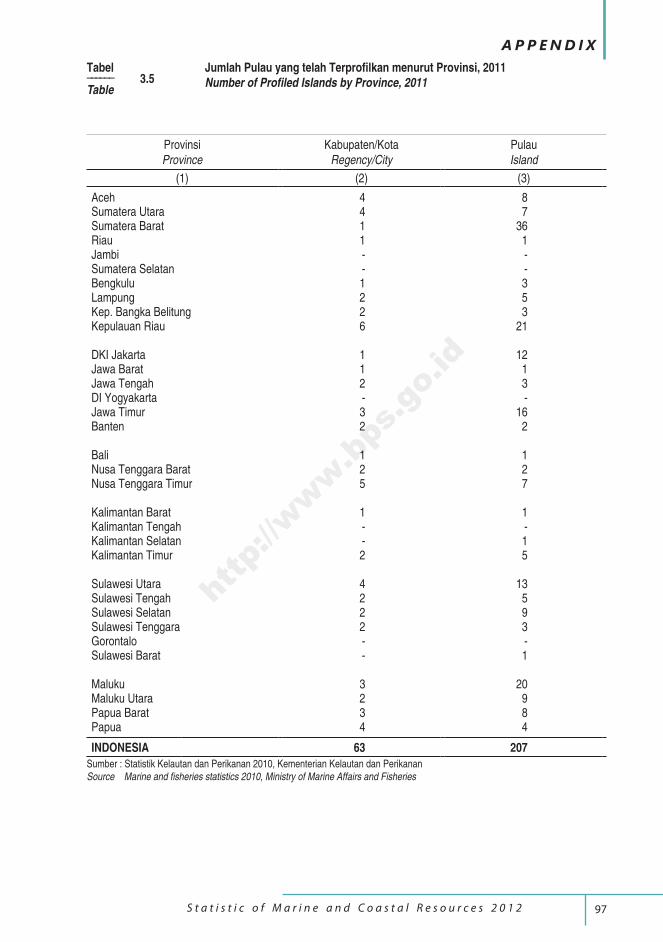
97 S t a t i s t i c o f M a r i n e a n d C o a s t a l R e s o u r c e s 2 0 1 2
A P P E N D I X
ProvinsiProvince
Kabupaten/KotaRegency/City
PulauIsland
(1) (2) (3)
Aceh 4 8Sumatera Utara 4 7Sumatera Barat 1 36Riau 1 1Jambi - -Sumatera Selatan - -Bengkulu 1 3Lampung 2 5Kep. Bangka Belitung 2 3Kepulauan Riau 6 21
DKI Jakarta 1 12Jawa Barat 1 1Jawa Tengah 2 3DI Yogyakarta - -Jawa Timur 3 16Banten 2 2
Bali 1 1Nusa Tenggara Barat 2 2Nusa Tenggara Timur 5 7
Kalimantan Barat 1 1Kalimantan Tengah - -Kalimantan Selatan - 1Kalimantan Timur 2 5
Sulawesi Utara 4 13Sulawesi Tengah 2 5Sulawesi Selatan 2 9Sulawesi Tenggara 2 3Gorontalo - -Sulawesi Barat - 1
Maluku 3 20Maluku Utara 2 9Papua Barat 3 8Papua 4 4
INDONESIA 63 207
Tabel –––––– 3.5Table
Jumlah Pulau yang telah Terprofilkan menurut Provinsi, 2011Number of Profiled Islands by Province, 2011
Sumber : Statistik Kelautan dan Perikanan 2010, Kementerian Kelautan dan PerikananSource Marine and fisheries statistics 2010, Ministry of Marine Affairs and Fisheries
http://www.bps.go.id
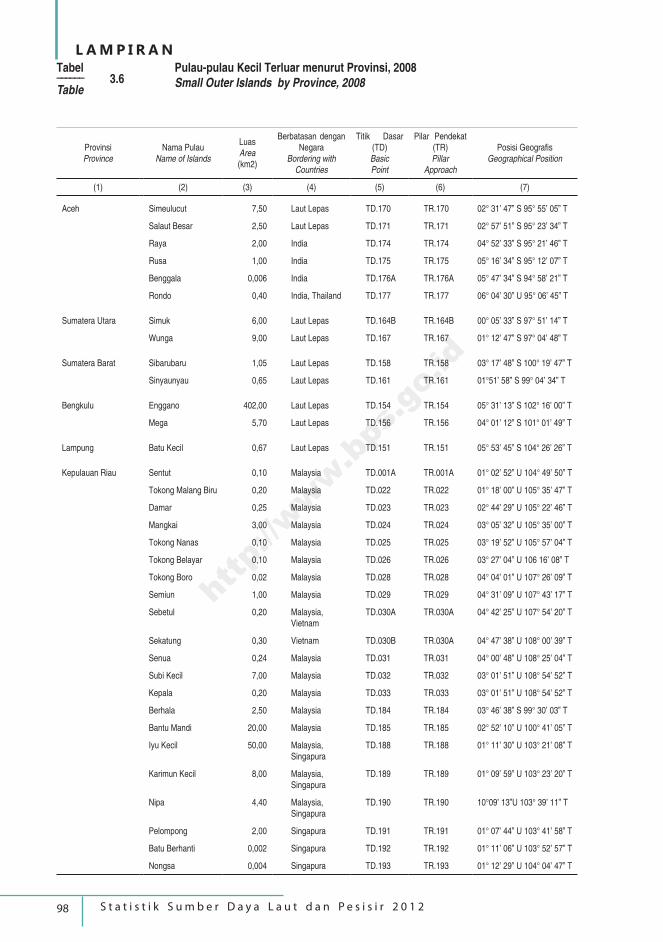
98 S t a t i s t i k S u m b e r D a y a L a u t d a n P e s i s i r 2 0 1 2
L A M P I R A N
ProvinsiProvince
Nama PulauName of Islands
LuasArea(km2)
Berbatasan dengan Negara
Bordering withCountries
Titik Dasar (TD)BasicPoint
Pilar Pendekat (TR) Pillar
Approach
Posisi GeografisGeographical Position
(1) (2) (3) (4) (5) (6) (7)
Aceh Simeulucut 7,50 Laut Lepas TD.170 TR.170 02° 31’ 47” S 95° 55’ 05” T
Salaut Besar 2,50 Laut Lepas TD.171 TR.171 02° 57’ 51” S 95° 23’ 34” T
Raya 2,00 India TD.174 TR.174 04° 52’ 33” S 95° 21’ 46” T
Rusa 1,00 India TD.175 TR.175 05° 16’ 34” S 95° 12’ 07” T
Benggala 0,006 India TD.176A TR.176A 05° 47’ 34” S 94° 58’ 21” T
Rondo 0,40 India, Thailand TD.177 TR.177 06° 04’ 30” U 95° 06’ 45” T
Sumatera Utara Simuk 6,00 Laut Lepas TD.164B TR.164B 00° 05’ 33” S 97° 51’ 14” T
Wunga 9,00 Laut Lepas TD.167 TR.167 01° 12’ 47” S 97° 04’ 48” T
Sumatera Barat Sibarubaru 1,05 Laut Lepas TD.158 TR.158 03° 17’ 48” S 100° 19’ 47” T
Sinyaunyau 0,65 Laut Lepas TD.161 TR.161 01°51’ 58” S 99° 04’ 34” T
Bengkulu Enggano 402,00 Laut Lepas TD.154 TR.154 05° 31’ 13” S 102° 16’ 00” T
Mega 5,70 Laut Lepas TD.156 TR.156 04° 01’ 12” S 101° 01’ 49” T
Lampung Batu Kecil 0,67 Laut Lepas TD.151 TR.151 05° 53’ 45” S 104° 26’ 26” T
Kepulauan Riau Sentut 0,10 Malaysia TD.001A TR.001A 01° 02’ 52” U 104° 49’ 50” T
Tokong Malang Biru 0,20 Malaysia TD.022 TR.022 01° 18’ 00” U 105° 35’ 47” T
Damar 0,25 Malaysia TD.023 TR.023 02° 44’ 29” U 105° 22’ 46” T
Mangkai 3,00 Malaysia TD.024 TR.024 03° 05’ 32” U 105° 35’ 00” T
Tokong Nanas 0,10 Malaysia TD.025 TR.025 03° 19’ 52” U 105° 57’ 04” T
Tokong Belayar 0,10 Malaysia TD.026 TR.026 03° 27’ 04” U 106 16’ 08” T
Tokong Boro 0,02 Malaysia TD.028 TR.028 04° 04’ 01” U 107° 26’ 09” T
Semiun 1,00 Malaysia TD.029 TR.029 04° 31’ 09” U 107° 43’ 17” T
Sebetul 0,20 Malaysia, Vietnam
TD.030A TR.030A 04° 42’ 25” U 107° 54’ 20” T
Sekatung 0,30 Vietnam TD.030B TR.030A 04° 47’ 38” U 108° 00’ 39” T
Senua 0,24 Malaysia TD.031 TR.031 04° 00’ 48” U 108° 25’ 04” T
Subi Kecil 7,00 Malaysia TD.032 TR.032 03° 01’ 51” U 108° 54’ 52” T
Kepala 0,20 Malaysia TD.033 TR.033 03° 01’ 51” U 108° 54’ 52” T
Berhala 2,50 Malaysia TD.184 TR.184 03° 46’ 38” S 99° 30’ 03” T
Bantu Mandi 20,00 Malaysia TD.185 TR.185 02° 52’ 10” U 100° 41’ 05” T
Iyu Kecil 50,00 Malaysia,Singapura
TD.188 TR.188 01° 11’ 30” U 103° 21’ 08” T
Karimun Kecil 8,00 Malaysia, Singapura
TD.189 TR.189 01° 09’ 59” U 103° 23’ 20” T
Nipa 4,40 Malaysia, Singapura
TD.190 TR.190 10°09’ 13”U 103° 39’ 11” T
Pelompong 2,00 Singapura TD.191 TR.191 01° 07’ 44” U 103° 41’ 58” T
Batu Berhanti 0,002 Singapura TD.192 TR.192 01° 11’ 06” U 103° 52’ 57” T
Nongsa 0,004 Singapura TD.193 TR.193 01° 12’ 29” U 104° 04’ 47” T
Tabel –––––– 3.6Table
Pulau-pulau Kecil Terluar menurut Provinsi, 2008Small Outer Islands by Province, 2008
http://www.bps.go.id
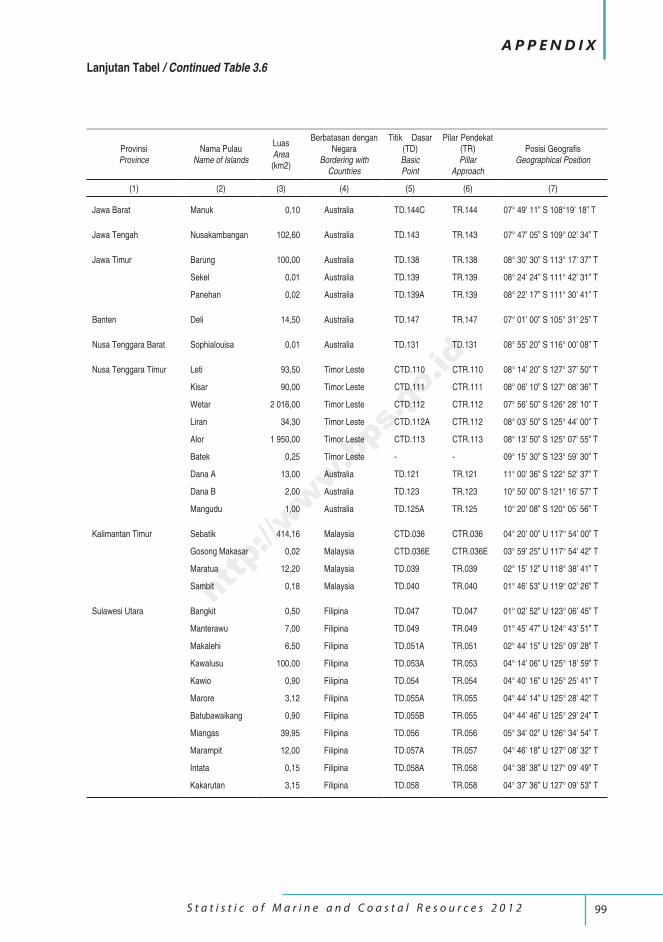
99 S t a t i s t i c o f M a r i n e a n d C o a s t a l R e s o u r c e s 2 0 1 2
A P P E N D I X
ProvinsiProvince
Nama PulauName of Islands
LuasArea(km2)
Berbatasan dengan Negara
Bordering withCountries
Titik Dasar (TD)BasicPoint
Pilar Pendekat (TR) Pillar
Approach
Posisi GeografisGeographical Position
(1) (2) (3) (4) (5) (6) (7)
Jawa Barat Manuk 0,10 Australia TD.144C TR.144 07° 49’ 11” S 108°19’ 18” T
Jawa Tengah Nusakambangan 102,60 Australia TD.143 TR.143 07° 47’ 05” S 109° 02’ 34” T
Jawa Timur Barung 100,00 Australia TD.138 TR.138 08° 30’ 30” S 113° 17’ 37” T
Sekel 0,01 Australia TD.139 TR.139 08° 24’ 24” S 111° 42’ 31” T
Panehan 0,02 Australia TD.139A TR.139 08° 22’ 17” S 111° 30’ 41” T
Banten Deli 14,50 Australia TD.147 TR.147 07° 01’ 00” S 105° 31’ 25” T
Nusa Tenggara Barat Sophialouisa 0,01 Australia TD.131 TD.131 08° 55’ 20” S 116° 00’ 08” T
Nusa Tenggara Timur Leti 93,50 Timor Leste CTD.110 CTR.110 08° 14’ 20” S 127° 37’ 50” T
Kisar 90,00 Timor Leste CTD.111 CTR.111 08° 06’ 10” S 127° 08’ 36” T
Wetar 2 016,00 Timor Leste CTD.112 CTR.112 07° 56’ 50” S 126° 28’ 10” T
Liran 34,30 Timor Leste CTD.112A CTR.112 08° 03’ 50” S 125° 44’ 00” T
Alor 1 950,00 Timor Leste CTD.113 CTR.113 08° 13’ 50” S 125° 07’ 55” T
Batek 0,25 Timor Leste - - 09° 15’ 30” S 123° 59’ 30” T
Dana A 13,00 Australia TD.121 TR.121 11° 00’ 36” S 122° 52’ 37” T
Dana B 2,00 Australia TD.123 TR.123 10° 50’ 00” S 121° 16’ 57” T
Mangudu 1,00 Australia TD.125A TR.125 10° 20’ 08” S 120° 05’ 56” T
Kalimantan Timur Sebatik 414,16 Malaysia CTD.036 CTR.036 04° 20’ 00” U 117° 54’ 00” T
Gosong Makasar 0,02 Malaysia CTD.036E CTR.036E 03° 59’ 25” U 117° 54’ 42” T
Maratua 12,20 Malaysia TD.039 TR.039 02° 15’ 12” U 118° 38’ 41” T
Sambit 0,18 Malaysia TD.040 TR.040 01° 46’ 53” U 119° 02’ 26” T
Sulawesi Utara Bangkit 0,50 Filipina TD.047 TD.047 01° 02’ 52” U 123° 06’ 45” T
Manterawu 7,00 Filipina TD.049 TR.049 01° 45’ 47” U 124° 43’ 51” T
Makalehi 6,50 Filipina TD.051A TR.051 02° 44’ 15” U 125° 09’ 28” T
Kawalusu 100,00 Filipina TD.053A TR.053 04° 14’ 06” U 125° 18’ 59” T
Kawio 0,90 Filipina TD.054 TR.054 04° 40’ 16” U 125° 25’ 41” T
Marore 3,12 Filipina TD.055A TR.055 04° 44’ 14” U 125° 28’ 42” T
Batubawaikang 0,90 Filipina TD.055B TR.055 04° 44’ 46” U 125° 29’ 24” T
Miangas 39,95 Filipina TD.056 TR.056 05° 34’ 02” U 126° 34’ 54” T
Marampit 12,00 Filipina TD.057A TR.057 04° 46’ 18” U 127° 08’ 32” T
Intata 0,15 Filipina TD.058A TR.058 04° 38’ 38” U 127° 09’ 49” T
Kakarutan 3,15 Filipina TD.058 TR.058 04° 37’ 36” U 127° 09’ 53” T
Lanjutan Tabel / Continued Table 3.6
http://www.bps.go.id
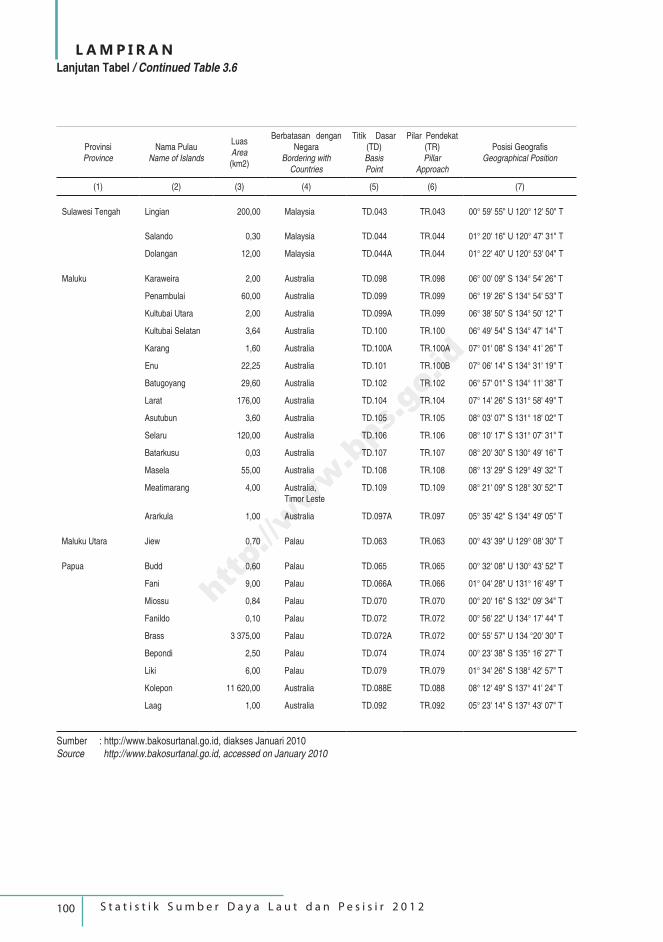
100 S t a t i s t i k S u m b e r D a y a L a u t d a n P e s i s i r 2 0 1 2
L A M P I R A N
ProvinsiProvince
Nama PulauName of Islands
LuasArea(km2)
Berbatasan dengan Negara
Bordering withCountries
Titik Dasar (TD)BasisPoint
Pilar Pendekat (TR) Pillar
Approach
Posisi GeografisGeographical Position
(1) (2) (3) (4) (5) (6) (7)
Sulawesi Tengah Lingian 200,00 Malaysia TD.043 TR.043 00° 59' 55" U 120° 12' 50" T
Salando 0,30 Malaysia TD.044 TR.044 01° 20' 16" U 120° 47' 31" T
Dolangan 12,00 Malaysia TD.044A TR.044 01° 22' 40" U 120° 53' 04" T
Maluku Karaweira 2,00 Australia TD.098 TR.098 06° 00' 09" S 134° 54' 26" T
Penambulai 60,00 Australia TD.099 TR.099 06° 19' 26" S 134° 54' 53" T
Kultubai Utara 2,00 Australia TD.099A TR.099 06° 38' 50" S 134° 50' 12" T
Kultubai Selatan 3,64 Australia TD.100 TR.100 06° 49' 54" S 134° 47' 14" T
Karang 1,60 Australia TD.100A TR.100A 07° 01' 08" S 134° 41' 26" T
Enu 22,25 Australia TD.101 TR.100B 07° 06' 14" S 134° 31' 19" T
Batugoyang 29,60 Australia TD.102 TR.102 06° 57' 01" S 134° 11' 38" T
Larat 176,00 Australia TD.104 TR.104 07° 14' 26" S 131° 58' 49" T
Asutubun 3,60 Australia TD.105 TR.105 08° 03' 07" S 131° 18' 02" T
Selaru 120,00 Australia TD.106 TR.106 08° 10' 17" S 131° 07' 31" T
Batarkusu 0,03 Australia TD.107 TR.107 08° 20' 30" S 130° 49' 16" T
Masela 55,00 Australia TD.108 TR.108 08° 13' 29" S 129° 49' 32" T
Meatimarang 4,00 Australia, Timor Leste
TD.109 TD.109 08° 21' 09" S 128° 30' 52" T
Ararkula 1,00 Australia TD.097A TR.097 05° 35' 42" S 134° 49' 05" T
Maluku Utara Jiew 0,70 Palau TD.063 TR.063 00° 43' 39" U 129° 08' 30" T
Papua Budd 0,60 Palau TD.065 TR.065 00° 32' 08" U 130° 43' 52" T
Fani 9,00 Palau TD.066A TR.066 01° 04' 28" U 131° 16' 49" T
Miossu 0,84 Palau TD.070 TR.070 00° 20' 16" S 132° 09' 34" T
Fanildo 0,10 Palau TD.072 TR.072 00° 56' 22" U 134° 17' 44" T
Brass 3 375,00 Palau TD.072A TR.072 00° 55' 57" U 134 °20' 30" T
Bepondi 2,50 Palau TD.074 TR.074 00° 23' 38" S 135° 16' 27" T
Liki 6,00 Palau TD.079 TR.079 01° 34' 26" S 138° 42' 57" T
Kolepon 11 620,00 Australia TD.088E TD.088 08° 12' 49" S 137° 41' 24" T
Laag 1,00 Australia TD.092 TR.092 05° 23' 14" S 137° 43' 07" T
Lanjutan Tabel / Continued Table 3.6
Sumber : http://www.bakosurtanal.go.id, diakses Januari 2010Source http://www.bakosurtanal.go.id, accessed on January 2010
http://www.bps.go.id
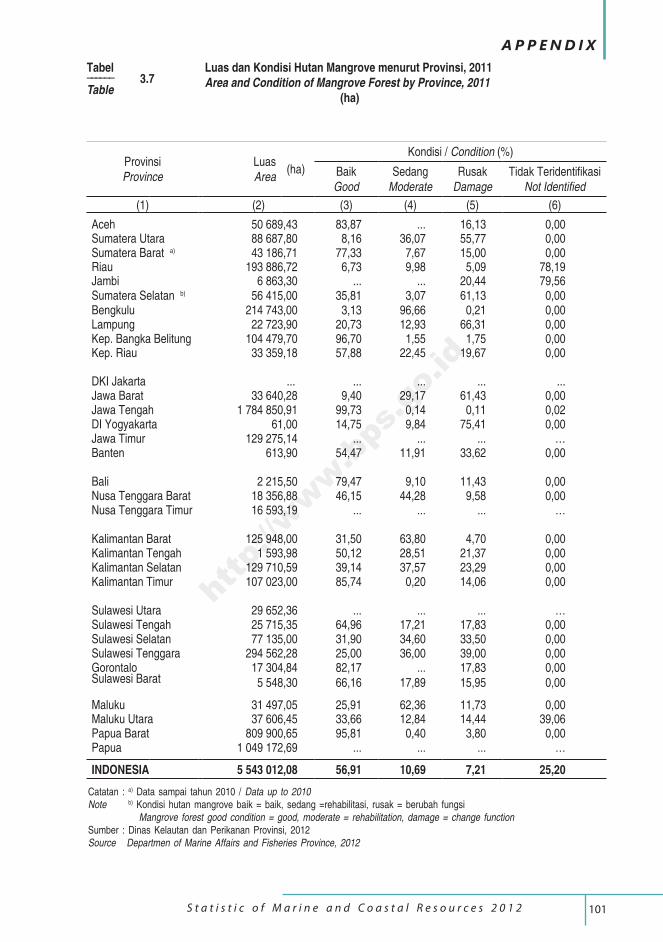
101 S t a t i s t i c o f M a r i n e a n d C o a s t a l R e s o u r c e s 2 0 1 2
A P P E N D I X
ProvinsiProvince
Luas Area
(ha)
Kondisi / Condition (%)
BaikGood
SedangModerate
RusakDamage
Tidak TeridentifikasiNot Identified
(1) (2) (3) (4) (5) (6)
Aceh 50 689,43 83,87 ... 16,13 0,00Sumatera Utara 88 687,80 8,16 36,07 55,77 0,00Sumatera Barat a) 43 186,71 77,33 7,67 15,00 0,00Riau 193 886,72 6,73 9,98 5,09 78,19Jambi 6 863,30 ... ... 20,44 79,56Sumatera Selatan b) 56 415,00 35,81 3,07 61,13 0,00Bengkulu 214 743,00 3,13 96,66 0,21 0,00Lampung 22 723,90 20,73 12,93 66,31 0,00Kep. Bangka Belitung 104 479,70 96,70 1,55 1,75 0,00Kep. Riau 33 359,18 57,88 22,45 19,67 0,00
DKI Jakarta ... ... ... ... ...Jawa Barat 33 640,28 9,40 29,17 61,43 0,00Jawa Tengah 1 784 850,91 99,73 0,14 0,11 0,02DI Yogyakarta 61,00 14,75 9,84 75,41 0,00Jawa Timur 129 275,14 ... ... ... …Banten 613,90 54,47 11,91 33,62 0,00
Bali 2 215,50 79,47 9,10 11,43 0,00Nusa Tenggara Barat 18 356,88 46,15 44,28 9,58 0,00Nusa Tenggara Timur 16 593,19 ... ... ... …
Kalimantan Barat 125 948,00 31,50 63,80 4,70 0,00Kalimantan Tengah 1 593,98 50,12 28,51 21,37 0,00Kalimantan Selatan 129 710,59 39,14 37,57 23,29 0,00Kalimantan Timur 107 023,00 85,74 0,20 14,06 0,00
Sulawesi Utara 29 652,36 ... ... ... …Sulawesi Tengah 25 715,35 64,96 17,21 17,83 0,00Sulawesi Selatan 77 135,00 31,90 34,60 33,50 0,00Sulawesi Tenggara 294 562,28 25,00 36,00 39,00 0,00Gorontalo 17 304,84 82,17 ... 17,83 0,00Sulawesi Barat 5 548,30 66,16 17,89 15,95 0,00
Maluku 31 497,05 25,91 62,36 11,73 0,00Maluku Utara 37 606,45 33,66 12,84 14,44 39,06Papua Barat 809 900,65 95,81 0,40 3,80 0,00Papua 1 049 172,69 ... ... ... …
INDONESIA 5 543 012,08 56,91 10,69 7,21 25,20
Tabel –––––– 3.7Table
Luas dan Kondisi Hutan Mangrove menurut Provinsi, 2011Area and Condition of Mangrove Forest by Province, 2011 (ha)
Catatan : a) Data sampai tahun 2010 / Data up to 2010Note b) Kondisi hutan mangrove baik = baik, sedang =rehabilitasi, rusak = berubah fungsi Mangrove forest good condition = good, moderate = rehabilitation, damage = change functionSumber : Dinas Kelautan dan Perikanan Provinsi, 2012Source Departmen of Marine Affairs and Fisheries Province, 2012
http://www.bps.go.id
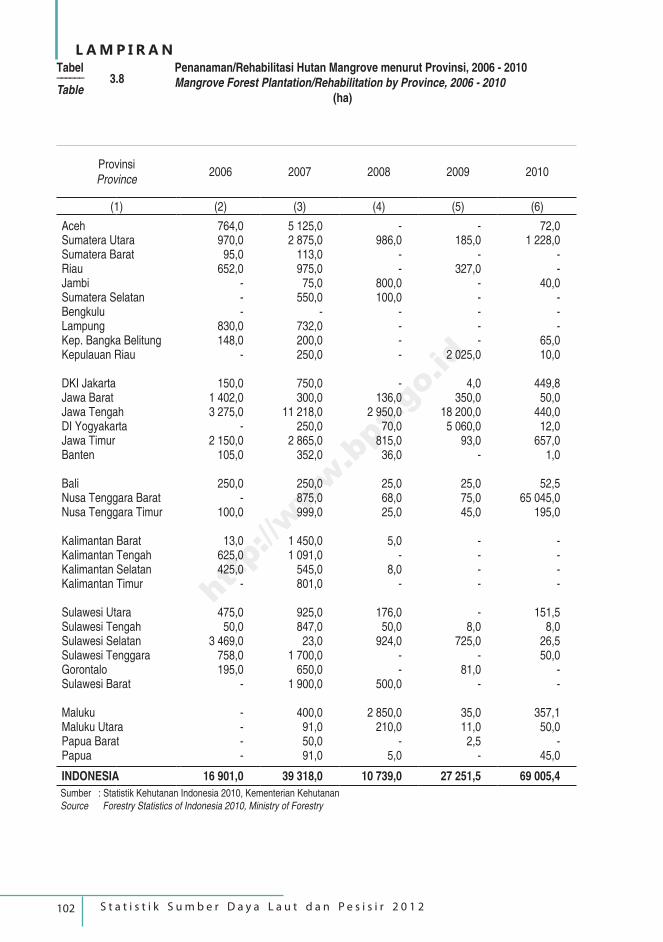
102 S t a t i s t i k S u m b e r D a y a L a u t d a n P e s i s i r 2 0 1 2
L A M P I R A N
ProvinsiProvince
2006 2007 2008 2009 2010
(1) (2) (3) (4) (5) (6)
Aceh 764,0 5 125,0 - - 72,0Sumatera Utara 970,0 2 875,0 986,0 185,0 1 228,0Sumatera Barat 95,0 113,0 - - -Riau 652,0 975,0 - 327,0 -Jambi - 75,0 800,0 - 40,0Sumatera Selatan - 550,0 100,0 - -Bengkulu - - - - -Lampung 830,0 732,0 - - -Kep. Bangka Belitung 148,0 200,0 - - 65,0Kepulauan Riau - 250,0 - 2 025,0 10,0
DKI Jakarta 150,0 750,0 - 4,0 449,8Jawa Barat 1 402,0 300,0 136,0 350,0 50,0Jawa Tengah 3 275,0 11 218,0 2 950,0 18 200,0 440,0DI Yogyakarta - 250,0 70,0 5 060,0 12,0Jawa Timur 2 150,0 2 865,0 815,0 93,0 657,0Banten 105,0 352,0 36,0 - 1,0
Bali 250,0 250,0 25,0 25,0 52,5Nusa Tenggara Barat - 875,0 68,0 75,0 65 045,0Nusa Tenggara Timur 100,0 999,0 25,0 45,0 195,0
Kalimantan Barat 13,0 1 450,0 5,0 - -Kalimantan Tengah 625,0 1 091,0 - - -Kalimantan Selatan 425,0 545,0 8,0 - -Kalimantan Timur - 801,0 - - -
Sulawesi Utara 475,0 925,0 176,0 - 151,5Sulawesi Tengah 50,0 847,0 50,0 8,0 8,0Sulawesi Selatan 3 469,0 23,0 924,0 725,0 26,5Sulawesi Tenggara 758,0 1 700,0 - - 50,0Gorontalo 195,0 650,0 - 81,0 -Sulawesi Barat - 1 900,0 500,0 - -
Maluku - 400,0 2 850,0 35,0 357,1Maluku Utara - 91,0 210,0 11,0 50,0Papua Barat - 50,0 - 2,5 -Papua - 91,0 5,0 - 45,0
INDONESIA 16 901,0 39 318,0 10 739,0 27 251,5 69 005,4
Tabel –––––– 3.8Table
Penanaman/Rehabilitasi Hutan Mangrove menurut Provinsi, 2006 - 2010Mangrove Forest Plantation/Rehabilitation by Province, 2006 - 2010 (ha)
Sumber : Statistik Kehutanan Indonesia 2010, Kementerian KehutananSource Forestry Statistics of Indonesia 2010, Ministry of Forestry
http://www.bps.go.id
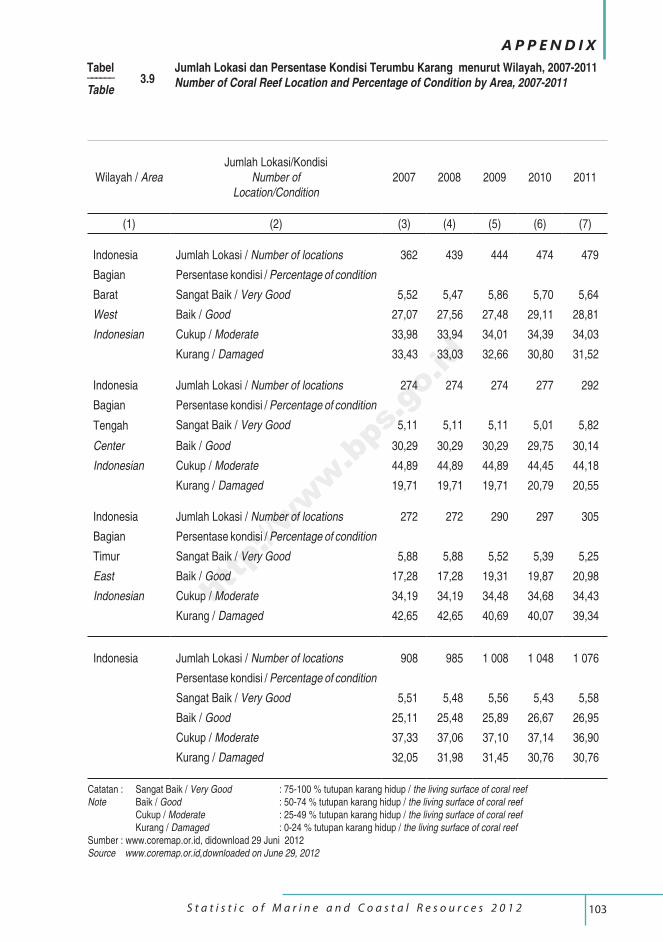
103 S t a t i s t i c o f M a r i n e a n d C o a s t a l R e s o u r c e s 2 0 1 2
A P P E N D I X
Wilayah / AreaJumlah Lokasi/Kondisi
Number ofLocation/Condition
2007 2008 2009 2010 2011
(1) (2) (3) (4) (5) (6) (7)
Indonesia Jumlah Lokasi / Number of locations 362 439 444 474 479
Bagian Persentase kondisi / Percentage of condition
Barat Sangat Baik / Very Good 5,52 5,47 5,86 5,70 5,64
West Baik / Good 27,07 27,56 27,48 29,11 28,81
Indonesian Cukup / Moderate 33,98 33,94 34,01 34,39 34,03
Kurang / Damaged 33,43 33,03 32,66 30,80 31,52
Indonesia Jumlah Lokasi / Number of locations 274 274 274 277 292
Bagian Persentase kondisi / Percentage of condition
Tengah Sangat Baik / Very Good 5,11 5,11 5,11 5,01 5,82
Center Baik / Good 30,29 30,29 30,29 29,75 30,14
Indonesian Cukup / Moderate 44,89 44,89 44,89 44,45 44,18
Kurang / Damaged 19,71 19,71 19,71 20,79 20,55
Indonesia Jumlah Lokasi / Number of locations 272 272 290 297 305
Bagian Persentase kondisi / Percentage of condition
Timur Sangat Baik / Very Good 5,88 5,88 5,52 5,39 5,25
East Baik / Good 17,28 17,28 19,31 19,87 20,98
Indonesian Cukup / Moderate 34,19 34,19 34,48 34,68 34,43
Kurang / Damaged 42,65 42,65 40,69 40,07 39,34
Indonesia Jumlah Lokasi / Number of locations 908 985 1 008 1 048 1 076
Persentase kondisi / Percentage of condition
Sangat Baik / Very Good 5,51 5,48 5,56 5,43 5,58
Baik / Good 25,11 25,48 25,89 26,67 26,95
Cukup / Moderate 37,33 37,06 37,10 37,14 36,90
Kurang / Damaged 32,05 31,98 31,45 30,76 30,76
Jumlah Lokasi dan Persentase Kondisi Terumbu Karang menurut Wilayah, 2007-2011 Number of Coral Reef Location and Percentage of Condition by Area, 2007-2011
Tabel –––––– 3.9Table
Catatan : Sangat Baik / Very Good : 75-100 % tutupan karang hidup / the living surface of coral reefNote Baik / Good : 50-74 % tutupan karang hidup / the living surface of coral reef Cukup / Moderate : 25-49 % tutupan karang hidup / the living surface of coral reef Kurang / Damaged : 0-24 % tutupan karang hidup / the living surface of coral reefSumber : www.coremap.or.id, didownload 29 Juni 2012Source www.coremap.or.id,downloaded on June 29, 2012
http://www.bps.go.id
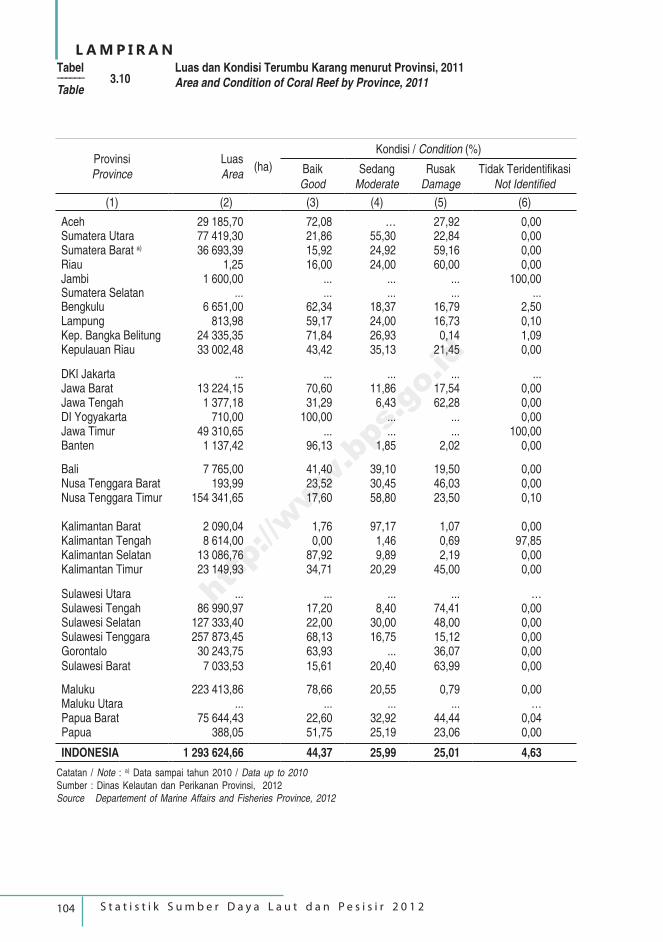
104 S t a t i s t i k S u m b e r D a y a L a u t d a n P e s i s i r 2 0 1 2
L A M P I R A N
ProvinsiProvince
Luas Area
(ha)
Kondisi / Condition (%)
BaikGood
SedangModerate
RusakDamage
Tidak TeridentifikasiNot Identified
(1) (2) (3) (4) (5) (6)
Aceh 29 185,70 72,08 … 27,92 0,00Sumatera Utara 77 419,30 21,86 55,30 22,84 0,00Sumatera Barat a) 36 693,39 15,92 24,92 59,16 0,00Riau 1,25 16,00 24,00 60,00 0,00Jambi 1 600,00 ... ... ... 100,00Sumatera Selatan ... ... ... ... ...Bengkulu 6 651,00 62,34 18,37 16,79 2,50Lampung 813,98 59,17 24,00 16,73 0,10Kep. Bangka Belitung 24 335,35 71,84 26,93 0,14 1,09Kepulauan Riau 33 002,48 43,42 35,13 21,45 0,00
DKI Jakarta ... ... ... ... ...Jawa Barat 13 224,15 70,60 11,86 17,54 0,00Jawa Tengah 1 377,18 31,29 6,43 62,28 0,00DI Yogyakarta 710,00 100,00 ... ... 0,00Jawa Timur 49 310,65 ... ... ... 100,00Banten 1 137,42 96,13 1,85 2,02 0,00
Bali 7 765,00 41,40 39,10 19,50 0,00Nusa Tenggara Barat 193,99 23,52 30,45 46,03 0,00Nusa Tenggara Timur 154 341,65 17,60 58,80 23,50 0,10
Kalimantan Barat 2 090,04 1,76 97,17 1,07 0,00Kalimantan Tengah 8 614,00 0,00 1,46 0,69 97,85Kalimantan Selatan 13 086,76 87,92 9,89 2,19 0,00Kalimantan Timur 23 149,93 34,71 20,29 45,00 0,00
Sulawesi Utara ... ... ... ... …Sulawesi Tengah 86 990,97 17,20 8,40 74,41 0,00Sulawesi Selatan 127 333,40 22,00 30,00 48,00 0,00Sulawesi Tenggara 257 873,45 68,13 16,75 15,12 0,00Gorontalo 30 243,75 63,93 ... 36,07 0,00Sulawesi Barat 7 033,53 15,61 20,40 63,99 0,00
Maluku 223 413,86 78,66 20,55 0,79 0,00Maluku Utara ... ... ... ... …Papua Barat 75 644,43 22,60 32,92 44,44 0,04Papua 388,05 51,75 25,19 23,06 0,00
INDONESIA 1 293 624,66 44,37 25,99 25,01 4,63
Tabel –––––– 3.10Table
Luas dan Kondisi Terumbu Karang menurut Provinsi, 2011Area and Condition of Coral Reef by Province, 2011
Catatan / Note : a) Data sampai tahun 2010 / Data up to 2010Sumber : Dinas Kelautan dan Perikanan Provinsi, 2012Source Departement of Marine Affairs and Fisheries Province, 2012
http://www.bps.go.id
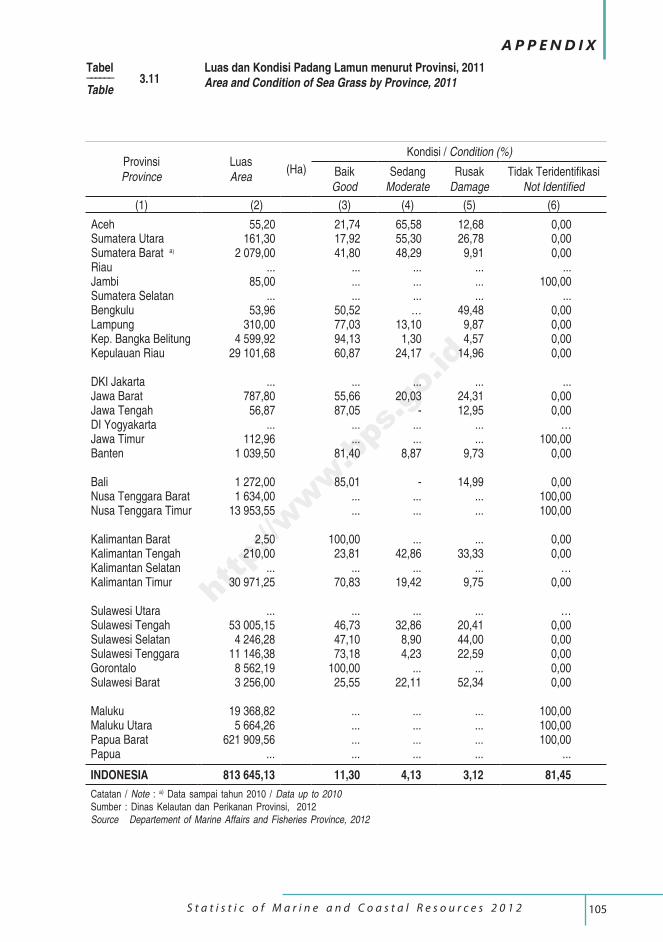
105 S t a t i s t i c o f M a r i n e a n d C o a s t a l R e s o u r c e s 2 0 1 2
A P P E N D I X
ProvinsiProvince
Luas Area
(Ha)
Kondisi / Condition (%)
BaikGood
SedangModerate
RusakDamage
Tidak TeridentifikasiNot Identified
(1) (2) (3) (4) (5) (6)
Aceh 55,20 21,74 65,58 12,68 0,00Sumatera Utara 161,30 17,92 55,30 26,78 0,00Sumatera Barat a) 2 079,00 41,80 48,29 9,91 0,00Riau ... ... ... ... ...Jambi 85,00 ... ... ... 100,00Sumatera Selatan ... ... ... ... ...Bengkulu 53,96 50,52 … 49,48 0,00Lampung 310,00 77,03 13,10 9,87 0,00Kep. Bangka Belitung 4 599,92 94,13 1,30 4,57 0,00Kepulauan Riau 29 101,68 60,87 24,17 14,96 0,00
DKI Jakarta ... ... ... ... ...Jawa Barat 787,80 55,66 20,03 24,31 0,00Jawa Tengah 56,87 87,05 - 12,95 0,00DI Yogyakarta ... ... ... ... …Jawa Timur 112,96 ... ... ... 100,00Banten 1 039,50 81,40 8,87 9,73 0,00
Bali 1 272,00 85,01 - 14,99 0,00Nusa Tenggara Barat 1 634,00 ... ... ... 100,00Nusa Tenggara Timur 13 953,55 ... ... ... 100,00
Kalimantan Barat 2,50 100,00 ... ... 0,00Kalimantan Tengah 210,00 23,81 42,86 33,33 0,00Kalimantan Selatan ... ... ... ... …Kalimantan Timur 30 971,25 70,83 19,42 9,75 0,00
Sulawesi Utara ... ... ... ... …Sulawesi Tengah 53 005,15 46,73 32,86 20,41 0,00Sulawesi Selatan 4 246,28 47,10 8,90 44,00 0,00Sulawesi Tenggara 11 146,38 73,18 4,23 22,59 0,00Gorontalo 8 562,19 100,00 ... ... 0,00Sulawesi Barat 3 256,00 25,55 22,11 52,34 0,00
Maluku 19 368,82 ... ... ... 100,00Maluku Utara 5 664,26 ... ... ... 100,00Papua Barat 621 909,56 ... ... ... 100,00Papua ... ... ... ... ...
INDONESIA 813 645,13 11,30 4,13 3,12 81,45
Tabel –––––– 3.11Table
Luas dan Kondisi Padang Lamun menurut Provinsi, 2011Area and Condition of Sea Grass by Province, 2011
Catatan / Note : a) Data sampai tahun 2010 / Data up to 2010Sumber : Dinas Kelautan dan Perikanan Provinsi, 2012Source Departement of Marine Affairs and Fisheries Province, 2012
http://www.bps.go.id
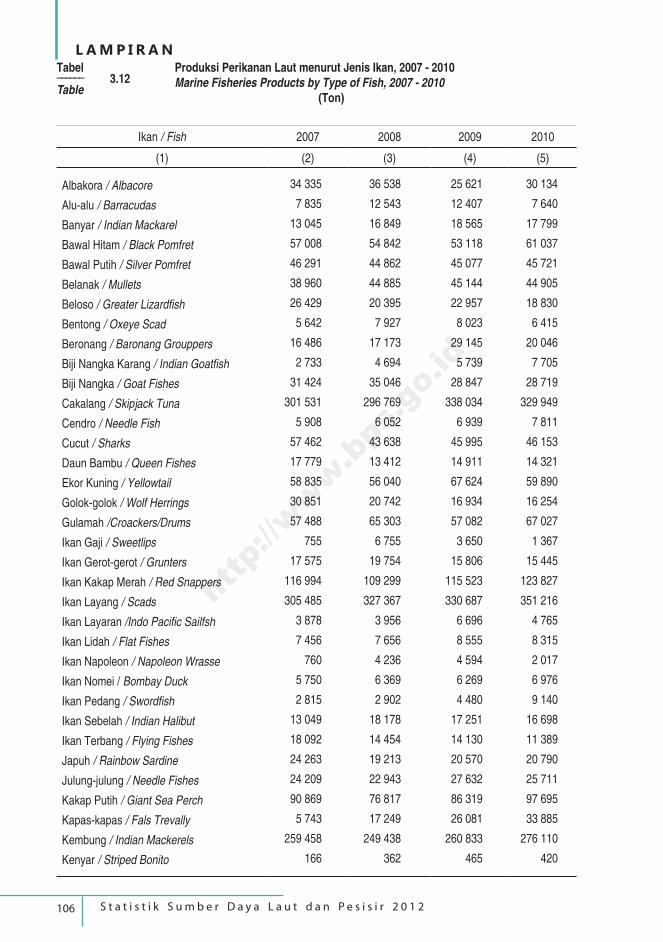
106 S t a t i s t i k S u m b e r D a y a L a u t d a n P e s i s i r 2 0 1 2
L A M P I R A N
Ikan / Fish 2007 2008 2009 2010
(1) (2) (3) (4) (5)
Albakora / Albacore 34 335 36 538 25 621 30 134
Alu-alu / Barracudas 7 835 12 543 12 407 7 640
Banyar / Indian Mackarel 13 045 16 849 18 565 17 799
Bawal Hitam / Black Pomfret 57 008 54 842 53 118 61 037
Bawal Putih / Silver Pomfret 46 291 44 862 45 077 45 721
Belanak / Mullets 38 960 44 885 45 144 44 905
Beloso / Greater Lizardfish 26 429 20 395 22 957 18 830
Bentong / Oxeye Scad 5 642 7 927 8 023 6 415
Beronang / Baronang Grouppers 16 486 17 173 29 145 20 046
Biji Nangka Karang / Indian Goatfish 2 733 4 694 5 739 7 705
Biji Nangka / Goat Fishes 31 424 35 046 28 847 28 719
Cakalang / Skipjack Tuna 301 531 296 769 338 034 329 949
Cendro / Needle Fish 5 908 6 052 6 939 7 811
Cucut / Sharks 57 462 43 638 45 995 46 153
Daun Bambu / Queen Fishes 17 779 13 412 14 911 14 321
Ekor Kuning / Yellowtail 58 835 56 040 67 624 59 890
Golok-golok / Wolf Herrings 30 851 20 742 16 934 16 254
Gulamah /Croackers/Drums 57 488 65 303 57 082 67 027
Ikan Gaji / Sweetlips 755 6 755 3 650 1 367
Ikan Gerot-gerot / Grunters 17 575 19 754 15 806 15 445
Ikan Kakap Merah / Red Snappers 116 994 109 299 115 523 123 827
Ikan Layang / Scads 305 485 327 367 330 687 351 216
Ikan Layaran /Indo Pacific Sailfsh 3 878 3 956 6 696 4 765
Ikan Lidah / Flat Fishes 7 456 7 656 8 555 8 315
Ikan Napoleon / Napoleon Wrasse 760 4 236 4 594 2 017
Ikan Nomei / Bombay Duck 5 750 6 369 6 269 6 976
Ikan Pedang / Swordfish 2 815 2 902 4 480 9 140
Ikan Sebelah / Indian Halibut 13 049 18 178 17 251 16 698
Ikan Terbang / Flying Fishes 18 092 14 454 14 130 11 389
Japuh / Rainbow Sardine 24 263 19 213 20 570 20 790
Julung-julung / Needle Fishes 24 209 22 943 27 632 25 711
Kakap Putih / Giant Sea Perch 90 869 76 817 86 319 97 695
Kapas-kapas / Fals Trevally 5 743 17 249 26 081 33 885
Kembung / Indian Mackerels 259 458 249 438 260 833 276 110
Kenyar / Striped Bonito 166 362 465 420
Tabel –––––– 3.12Table
Produksi Perikanan Laut menurut Jenis Ikan, 2007 - 2010Marine Fisheries Products by Type of Fish, 2007 - 2010 (Ton)
http://www.bps.go.id
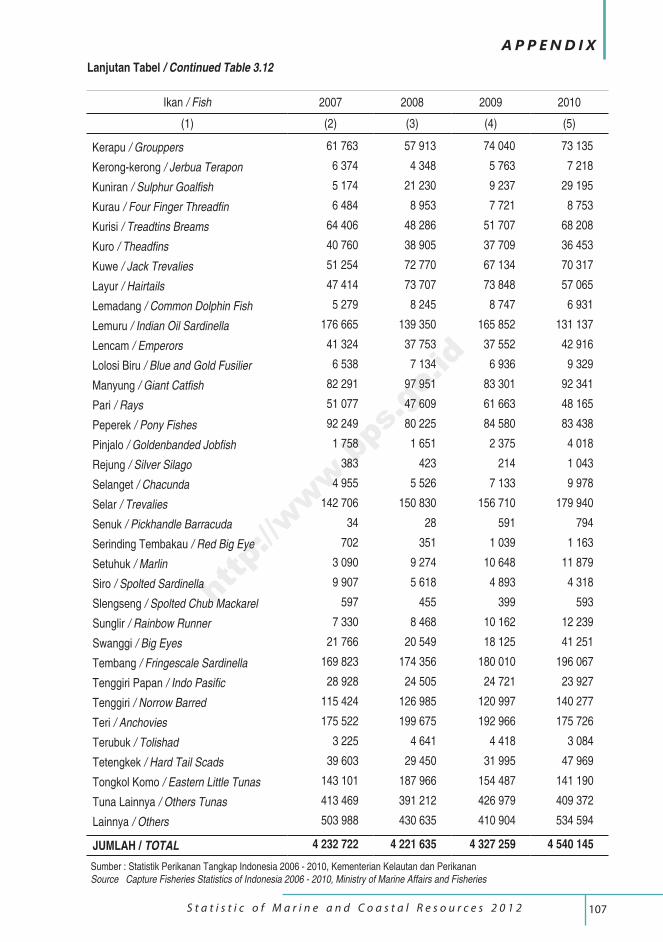
107 S t a t i s t i c o f M a r i n e a n d C o a s t a l R e s o u r c e s 2 0 1 2
A P P E N D I X
Ikan / Fish 2007 2008 2009 2010
(1) (2) (3) (4) (5)
Kerapu / Grouppers 61 763 57 913 74 040 73 135
Kerong-kerong / Jerbua Terapon 6 374 4 348 5 763 7 218
Kuniran / Sulphur Goalfish 5 174 21 230 9 237 29 195
Kurau / Four Finger Threadfin 6 484 8 953 7 721 8 753
Kurisi / Treadtins Breams 64 406 48 286 51 707 68 208
Kuro / Theadfins 40 760 38 905 37 709 36 453
Kuwe / Jack Trevalies 51 254 72 770 67 134 70 317
Layur / Hairtails 47 414 73 707 73 848 57 065
Lemadang / Common Dolphin Fish 5 279 8 245 8 747 6 931
Lemuru / Indian Oil Sardinella 176 665 139 350 165 852 131 137
Lencam / Emperors 41 324 37 753 37 552 42 916
Lolosi Biru / Blue and Gold Fusilier 6 538 7 134 6 936 9 329
Manyung / Giant Catfish 82 291 97 951 83 301 92 341
Pari / Rays 51 077 47 609 61 663 48 165
Peperek / Pony Fishes 92 249 80 225 84 580 83 438
Pinjalo / Goldenbanded Jobfish 1 758 1 651 2 375 4 018
Rejung / Silver Silago 383 423 214 1 043
Selanget / Chacunda 4 955 5 526 7 133 9 978
Selar / Trevalies 142 706 150 830 156 710 179 940
Senuk / Pickhandle Barracuda 34 28 591 794
Serinding Tembakau / Red Big Eye 702 351 1 039 1 163
Setuhuk / Marlin 3 090 9 274 10 648 11 879
Siro / Spolted Sardinella 9 907 5 618 4 893 4 318
Slengseng / Spolted Chub Mackarel 597 455 399 593
Sunglir / Rainbow Runner 7 330 8 468 10 162 12 239
Swanggi / Big Eyes 21 766 20 549 18 125 41 251
Tembang / Fringescale Sardinella 169 823 174 356 180 010 196 067
Tenggiri Papan / Indo Pasific 28 928 24 505 24 721 23 927
Tenggiri / Norrow Barred 115 424 126 985 120 997 140 277
Teri / Anchovies 175 522 199 675 192 966 175 726
Terubuk / Tolishad 3 225 4 641 4 418 3 084
Tetengkek / Hard Tail Scads 39 603 29 450 31 995 47 969
Tongkol Komo / Eastern Little Tunas 143 101 187 966 154 487 141 190
Tuna Lainnya / Others Tunas 413 469 391 212 426 979 409 372
Lainnya / Others 503 988 430 635 410 904 534 594
JUMLAH / TOTAL 4 232 722 4 221 635 4 327 259 4 540 145
Lanjutan Tabel / Continued Table 3.12
Sumber : Statistik Perikanan Tangkap Indonesia 2006 - 2010, Kementerian Kelautan dan PerikananSource Capture Fisheries Statistics of Indonesia 2006 - 2010, Ministry of Marine Affairs and Fisheries
http://www.bps.go.id
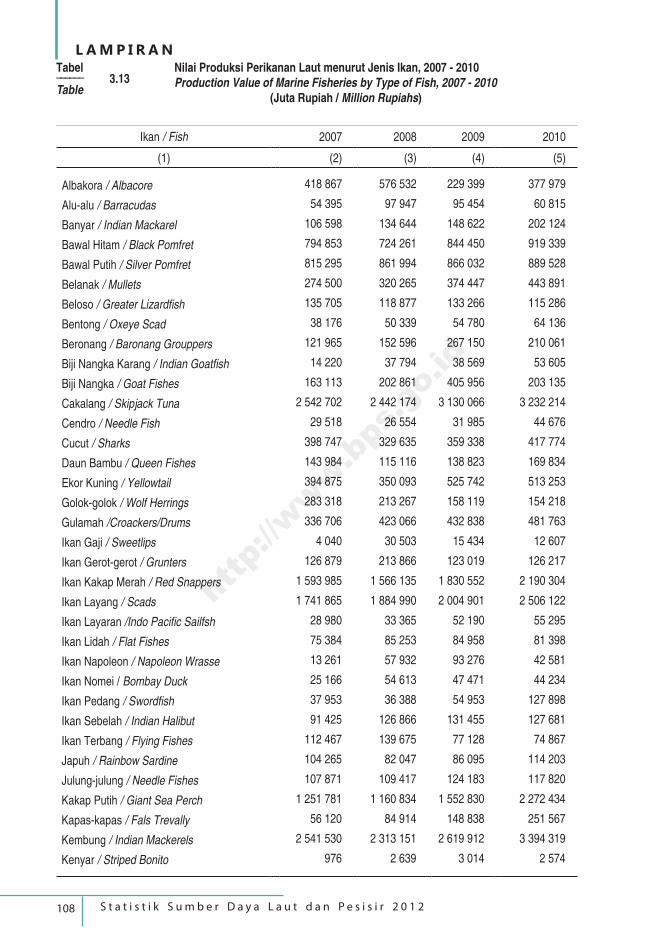
108 S t a t i s t i k S u m b e r D a y a L a u t d a n P e s i s i r 2 0 1 2
L A M P I R A N
Ikan / Fish 2007 2008 2009 2010
(1) (2) (3) (4) (5)
Albakora / Albacore 418 867 576 532 229 399 377 979
Alu-alu / Barracudas 54 395 97 947 95 454 60 815
Banyar / Indian Mackarel 106 598 134 644 148 622 202 124
Bawal Hitam / Black Pomfret 794 853 724 261 844 450 919 339
Bawal Putih / Silver Pomfret 815 295 861 994 866 032 889 528
Belanak / Mullets 274 500 320 265 374 447 443 891
Beloso / Greater Lizardfish 135 705 118 877 133 266 115 286
Bentong / Oxeye Scad 38 176 50 339 54 780 64 136
Beronang / Baronang Grouppers 121 965 152 596 267 150 210 061
Biji Nangka Karang / Indian Goatfish 14 220 37 794 38 569 53 605
Biji Nangka / Goat Fishes 163 113 202 861 405 956 203 135
Cakalang / Skipjack Tuna 2 542 702 2 442 174 3 130 066 3 232 214
Cendro / Needle Fish 29 518 26 554 31 985 44 676
Cucut / Sharks 398 747 329 635 359 338 417 774
Daun Bambu / Queen Fishes 143 984 115 116 138 823 169 834
Ekor Kuning / Yellowtail 394 875 350 093 525 742 513 253
Golok-golok / Wolf Herrings 283 318 213 267 158 119 154 218
Gulamah /Croackers/Drums 336 706 423 066 432 838 481 763
Ikan Gaji / Sweetlips 4 040 30 503 15 434 12 607
Ikan Gerot-gerot / Grunters 126 879 213 866 123 019 126 217
Ikan Kakap Merah / Red Snappers 1 593 985 1 566 135 1 830 552 2 190 304
Ikan Layang / Scads 1 741 865 1 884 990 2 004 901 2 506 122
Ikan Layaran /Indo Pacific Sailfsh 28 980 33 365 52 190 55 295
Ikan Lidah / Flat Fishes 75 384 85 253 84 958 81 398
Ikan Napoleon / Napoleon Wrasse 13 261 57 932 93 276 42 581
Ikan Nomei / Bombay Duck 25 166 54 613 47 471 44 234
Ikan Pedang / Swordfish 37 953 36 388 54 953 127 898
Ikan Sebelah / Indian Halibut 91 425 126 866 131 455 127 681
Ikan Terbang / Flying Fishes 112 467 139 675 77 128 74 867
Japuh / Rainbow Sardine 104 265 82 047 86 095 114 203
Julung-julung / Needle Fishes 107 871 109 417 124 183 117 820
Kakap Putih / Giant Sea Perch 1 251 781 1 160 834 1 552 830 2 272 434
Kapas-kapas / Fals Trevally 56 120 84 914 148 838 251 567
Kembung / Indian Mackerels 2 541 530 2 313 151 2 619 912 3 394 319
Kenyar / Striped Bonito 976 2 639 3 014 2 574
Tabel –––––– 3.13Table
Nilai Produksi Perikanan Laut menurut Jenis Ikan, 2007 - 2010Production Value of Marine Fisheries by Type of Fish, 2007 - 2010 (Juta Rupiah / Million Rupiahs)
http://www.bps.go.id
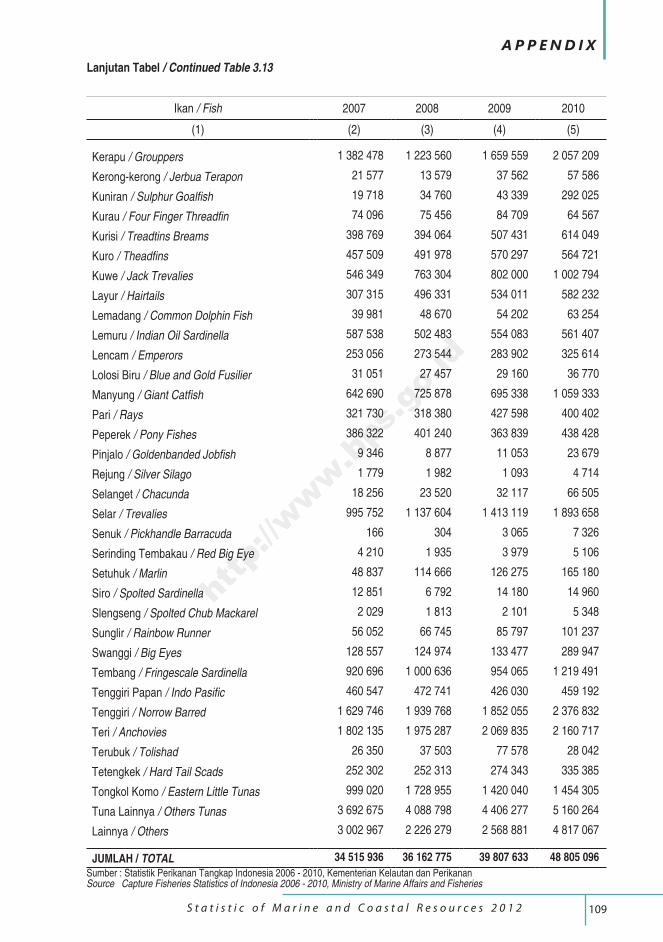
109 S t a t i s t i c o f M a r i n e a n d C o a s t a l R e s o u r c e s 2 0 1 2
A P P E N D I X
Ikan / Fish 2007 2008 2009 2010
(1) (2) (3) (4) (5)
Kerapu / Grouppers 1 382 478 1 223 560 1 659 559 2 057 209
Kerong-kerong / Jerbua Terapon 21 577 13 579 37 562 57 586
Kuniran / Sulphur Goalfish 19 718 34 760 43 339 292 025
Kurau / Four Finger Threadfin 74 096 75 456 84 709 64 567
Kurisi / Treadtins Breams 398 769 394 064 507 431 614 049
Kuro / Theadfins 457 509 491 978 570 297 564 721
Kuwe / Jack Trevalies 546 349 763 304 802 000 1 002 794
Layur / Hairtails 307 315 496 331 534 011 582 232
Lemadang / Common Dolphin Fish 39 981 48 670 54 202 63 254
Lemuru / Indian Oil Sardinella 587 538 502 483 554 083 561 407
Lencam / Emperors 253 056 273 544 283 902 325 614
Lolosi Biru / Blue and Gold Fusilier 31 051 27 457 29 160 36 770
Manyung / Giant Catfish 642 690 725 878 695 338 1 059 333
Pari / Rays 321 730 318 380 427 598 400 402
Peperek / Pony Fishes 386 322 401 240 363 839 438 428
Pinjalo / Goldenbanded Jobfish 9 346 8 877 11 053 23 679
Rejung / Silver Silago 1 779 1 982 1 093 4 714
Selanget / Chacunda 18 256 23 520 32 117 66 505
Selar / Trevalies 995 752 1 137 604 1 413 119 1 893 658
Senuk / Pickhandle Barracuda 166 304 3 065 7 326
Serinding Tembakau / Red Big Eye 4 210 1 935 3 979 5 106
Setuhuk / Marlin 48 837 114 666 126 275 165 180
Siro / Spolted Sardinella 12 851 6 792 14 180 14 960
Slengseng / Spolted Chub Mackarel 2 029 1 813 2 101 5 348
Sunglir / Rainbow Runner 56 052 66 745 85 797 101 237
Swanggi / Big Eyes 128 557 124 974 133 477 289 947
Tembang / Fringescale Sardinella 920 696 1 000 636 954 065 1 219 491
Tenggiri Papan / Indo Pasific 460 547 472 741 426 030 459 192
Tenggiri / Norrow Barred 1 629 746 1 939 768 1 852 055 2 376 832
Teri / Anchovies 1 802 135 1 975 287 2 069 835 2 160 717
Terubuk / Tolishad 26 350 37 503 77 578 28 042
Tetengkek / Hard Tail Scads 252 302 252 313 274 343 335 385
Tongkol Komo / Eastern Little Tunas 999 020 1 728 955 1 420 040 1 454 305
Tuna Lainnya / Others Tunas 3 692 675 4 088 798 4 406 277 5 160 264
Lainnya / Others 3 002 967 2 226 279 2 568 881 4 817 067
JUMLAH / TOTAL 34 515 936 36 162 775 39 807 633 48 805 096
Lanjutan Tabel / Continued Table 3.13
Sumber : Statistik Perikanan Tangkap Indonesia 2006 - 2010, Kementerian Kelautan dan PerikananSource Capture Fisheries Statistics of Indonesia 2006 - 2010, Ministry of Marine Affairs and Fisheries
http://www.bps.go.id
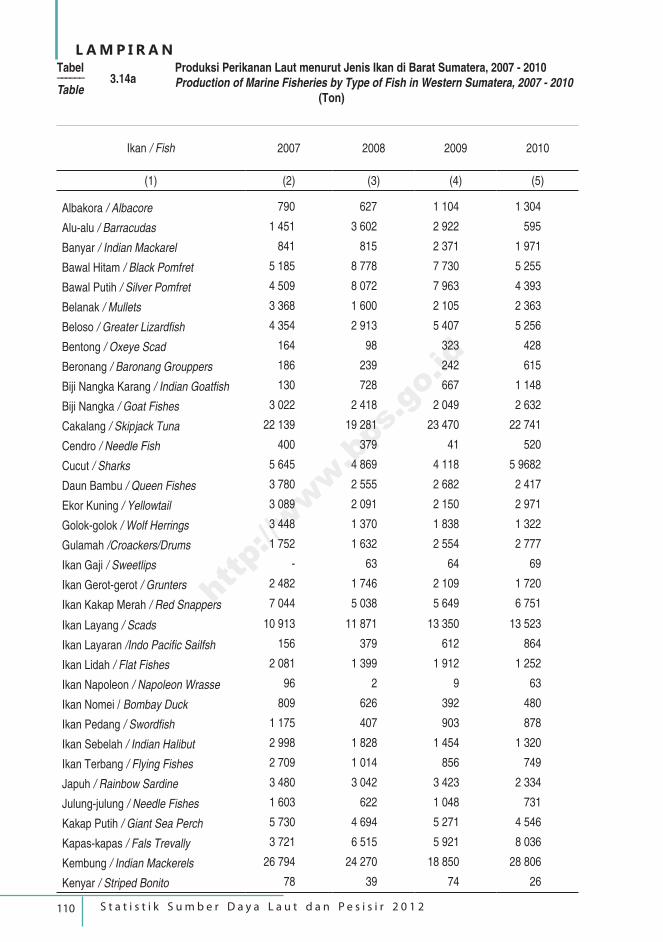
110 S t a t i s t i k S u m b e r D a y a L a u t d a n P e s i s i r 2 0 1 2
L A M P I R A N
Ikan / Fish 2007 2008 2009 2010
(1) (2) (3) (4) (5)
Albakora / Albacore 790 627 1 104 1 304
Alu-alu / Barracudas 1 451 3 602 2 922 595
Banyar / Indian Mackarel 841 815 2 371 1 971
Bawal Hitam / Black Pomfret 5 185 8 778 7 730 5 255
Bawal Putih / Silver Pomfret 4 509 8 072 7 963 4 393
Belanak / Mullets 3 368 1 600 2 105 2 363
Beloso / Greater Lizardfish 4 354 2 913 5 407 5 256
Bentong / Oxeye Scad 164 98 323 428
Beronang / Baronang Grouppers 186 239 242 615
Biji Nangka Karang / Indian Goatfish 130 728 667 1 148
Biji Nangka / Goat Fishes 3 022 2 418 2 049 2 632
Cakalang / Skipjack Tuna 22 139 19 281 23 470 22 741
Cendro / Needle Fish 400 379 41 520
Cucut / Sharks 5 645 4 869 4 118 5 9682
Daun Bambu / Queen Fishes 3 780 2 555 2 682 2 417
Ekor Kuning / Yellowtail 3 089 2 091 2 150 2 971
Golok-golok / Wolf Herrings 3 448 1 370 1 838 1 322
Gulamah /Croackers/Drums 1 752 1 632 2 554 2 777
Ikan Gaji / Sweetlips - 63 64 69
Ikan Gerot-gerot / Grunters 2 482 1 746 2 109 1 720
Ikan Kakap Merah / Red Snappers 7 044 5 038 5 649 6 751
Ikan Layang / Scads 10 913 11 871 13 350 13 523
Ikan Layaran /Indo Pacific Sailfsh 156 379 612 864
Ikan Lidah / Flat Fishes 2 081 1 399 1 912 1 252
Ikan Napoleon / Napoleon Wrasse 96 2 9 63
Ikan Nomei / Bombay Duck 809 626 392 480
Ikan Pedang / Swordfish 1 175 407 903 878
Ikan Sebelah / Indian Halibut 2 998 1 828 1 454 1 320
Ikan Terbang / Flying Fishes 2 709 1 014 856 749
Japuh / Rainbow Sardine 3 480 3 042 3 423 2 334
Julung-julung / Needle Fishes 1 603 622 1 048 731
Kakap Putih / Giant Sea Perch 5 730 4 694 5 271 4 546
Kapas-kapas / Fals Trevally 3 721 6 515 5 921 8 036
Kembung / Indian Mackerels 26 794 24 270 18 850 28 806
Kenyar / Striped Bonito 78 39 74 26
Tabel –––––– 3.14aTable
Produksi Perikanan Laut menurut Jenis Ikan di Barat Sumatera, 2007 - 2010Production of Marine Fisheries by Type of Fish in Western Sumatera, 2007 - 2010 (Ton)
http://www.bps.go.id

111 S t a t i s t i c o f M a r i n e a n d C o a s t a l R e s o u r c e s 2 0 1 2
A P P E N D I X
Ikan / Fish 2007 2008 2009 2010
(1) (2) (3) (4) (5)
Kerapu / Grouppers 8 575 4 986 8 314 7 305
Kerong-kerong / Jerbua Terapon 726 598 2 178 3 093
Kuniran / Sulphur Goalfish 275 437 613 781
Kurau / Four Finger Threadfin 134 134 15 490
Kurisi / Treadtins Breams 2 255 2 218 3 235 2 984
Kuro / Theadfins 5 204 2 510 3 030 3 043
Kuwe / Jack Trevalies 9 626 16 564 14 015 15 921
Layur / Hairtails 9 427 5 914 6 399 5 871
Lemadang / Common Dolphin Fish 888 548 1 102 1 031
Lemuru / Indian Oil Sardinella 6 840 5 345 6 243 9 107
Lencam / Emperors 3 542 2 989 3 056 3 278
Lolosi Biru / Blue and Gold Fusilier 37 25 163 349
Manyung / Giant Catfish 7 455 8 081 8 011 5 508
Pari / Rays 3 347 3 149 3 332 2 702
Peperek / Pony Fishes 8 237 5 420 5 849 5 260
Pinjalo / Goldenbanded Jobfish 210 88 40 263
Rejung / Silver Silago 7 - 117 164
Selanget / Chacunda 25 20 426 860
Selar / Trevalies 15 755 24 193 23 329 25 921
Senuk / Pickhandle Barracuda - - - 86
Serinding Tembakau / Red Big Eye 142 137 451 543
Setuhuk / Marlin 1 085 3 106 3 190 3 724
Siro / Spolted Sardinella - - 303 134
Slengseng / Spolted Chub Mackarel 69 - 5 52
Sunglir / Rainbow Runner 1 009 1 920 2 219 2 110
Swanggi / Big Eyes 3 314 2 742 4 530 4 354
Tembang / Fringescale Sardinella 25 630 23 755 18 954 17 236
Tenggiri Papan / Indo Pasific 9 220 8 010 7 916 7 444
Tenggiri / Norrow Barred 7 676 7 351 7 507 7 923
Teri / Anchovies 22 081 24 137 31 028 27 589
Terubuk / Tolishad 159 218 582 542
Tetengkek / Hard Tail Scads 6 078 7 025 7 384 11 867
Tongkol Komo / Eastern Little Tunas 8 599 29 380 15 894 13 840
Tuna Lainnya / Others Tunas 43 324 41 812 46 008 49 363
Lainnya / Others 13 914 18 017 18 841 19 787
JUMLAH / TOTAL 360 987 376 451 385 912 397 349
Lanjutan Tabel / Continued Table 3.14a
Sumber : Statistik Perikanan Tangkap Indonesia 2007 - 2010, Kementerian Kelautan dan PerikananSource Capture Fisheries Statistics of Indonesia 2007 - 2010, Ministry of Marine Affairs and Fisheries
http://www.bps.go.id

112 S t a t i s t i k S u m b e r D a y a L a u t d a n P e s i s i r 2 0 1 2
L A M P I R A N
Ikan / Fish 2007 2008 2009 2010
(1) (2) (3) (4) (5)
Albakora / Albacore - - - -
Alu-alu / Barracudas 718 363 824 870
Banyar / Indian Mackarel 1 306 2 141 2 148 1 882
Bawal Hitam / Black Pomfret 11 032 14 091 13 830 10 803
Bawal Putih / Silver Pomfret 8 759 13 646 13 872 7 779
Belanak / Mullets 5 382 9 955 12 564 13 731
Beloso / Greater Lizardfish 562 934 1 272 360
Bentong / Oxeye Scad 912 1 394 2 666 1 154
Beronang / Baronang Grouppers 1 210 6 014 6 282 2 977
Biji Nangka Karang / Indian Goatfish - 462 1 079 1 424
Biji Nangka / Goat Fishes 2 115 2 471 1 263 1 486
Cakalang / Skipjack Tuna 90 76 167 495
Cendro / Needle Fish 464 719 684 1 187
Cucut / Sharks 6 445 6 238 7 631 4 460
Daun Bambu / Queen Fishes 2 014 1 302 1 647 1 122
Ekor Kuning / Yellowtail 5 644 13 977 12 455 9 688
Golok-golok / Wolf Herrings 7 259 6 134 5 757 6 970
Gulamah /Croackers/Drums 6 535 6 716 6 665 7 381
Ikan Gaji / Sweetlips - 211 250 567
Ikan Gerot-gerot / Grunters 2 963 4 711 3 393 3 841
Ikan Kakap Merah / Red Snappers 6 030 14 944 14 558 12 672
Ikan Layang / Scads 7 209 3 093 5 647 2 564
Ikan Layaran /Indo Pacific Sailfsh 475 455 321 161
Ikan Lidah / Flat Fishes 90 364 448 442
Ikan Napoleon / Napoleon Wrasse - 1 329 1 368 -
Ikan Nomei / Bombay Duck 1 648 3 089 2 945 4 397
Ikan Pedang / Swordfish - 269 283 -
Ikan Sebelah / Indian Halibut 2 880 5 206 3 048 4 238
Ikan Terbang / Flying Fishes - 274 292 -
Japuh / Rainbow Sardine 3 720 2 552 3 116 3 739
Julung-julung / Needle Fishes 1 948 2 997 2 484 1 560
Kakap Putih / Giant Sea Perch 5 990 9 893 9 939 9 372
Kapas-kapas / Fals Trevally - 289 1 599 1 487
Kembung / Indian Mackerels 19 636 31 162 38 793 32 885
Kenyar / Striped Bonito - 117 135 -
Tabel –––––– 3.14bTable
Produksi Perikanan Laut menurut Jenis Ikan di Timur Sumatera, 2007 - 2010Production of Marine Fisheries by Type of Fish in Eastern Sumatera, 2007 - 2010 (Ton)
http://www.bps.go.id
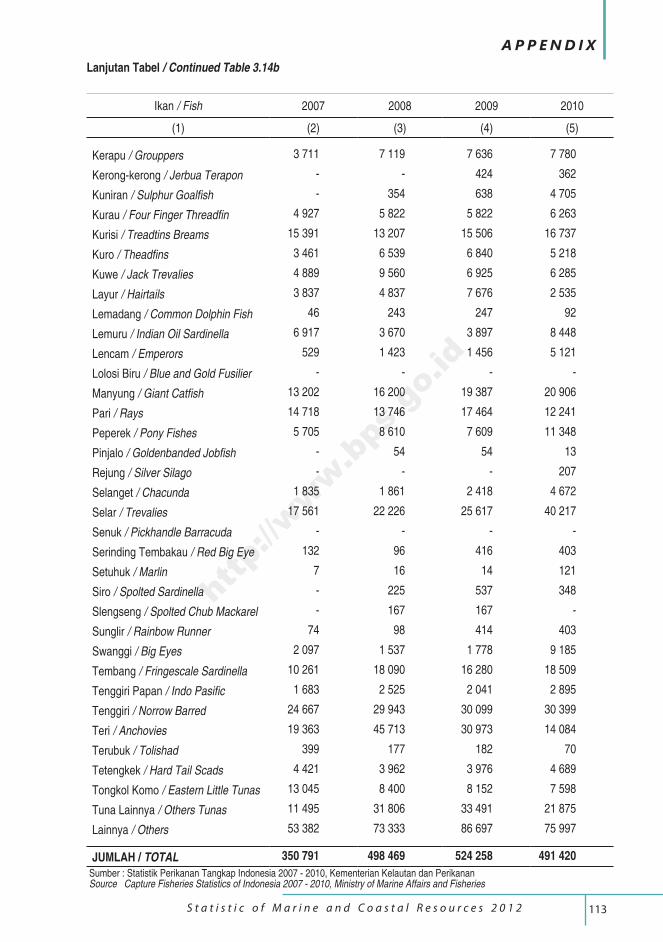
113 S t a t i s t i c o f M a r i n e a n d C o a s t a l R e s o u r c e s 2 0 1 2
A P P E N D I X
Ikan / Fish 2007 2008 2009 2010
(1) (2) (3) (4) (5)
Kerapu / Grouppers 3 711 7 119 7 636 7 780
Kerong-kerong / Jerbua Terapon - - 424 362
Kuniran / Sulphur Goalfish - 354 638 4 705
Kurau / Four Finger Threadfin 4 927 5 822 5 822 6 263
Kurisi / Treadtins Breams 15 391 13 207 15 506 16 737
Kuro / Theadfins 3 461 6 539 6 840 5 218
Kuwe / Jack Trevalies 4 889 9 560 6 925 6 285
Layur / Hairtails 3 837 4 837 7 676 2 535
Lemadang / Common Dolphin Fish 46 243 247 92
Lemuru / Indian Oil Sardinella 6 917 3 670 3 897 8 448
Lencam / Emperors 529 1 423 1 456 5 121
Lolosi Biru / Blue and Gold Fusilier - - - -
Manyung / Giant Catfish 13 202 16 200 19 387 20 906
Pari / Rays 14 718 13 746 17 464 12 241
Peperek / Pony Fishes 5 705 8 610 7 609 11 348
Pinjalo / Goldenbanded Jobfish - 54 54 13
Rejung / Silver Silago - - - 207
Selanget / Chacunda 1 835 1 861 2 418 4 672
Selar / Trevalies 17 561 22 226 25 617 40 217
Senuk / Pickhandle Barracuda - - - -
Serinding Tembakau / Red Big Eye 132 96 416 403
Setuhuk / Marlin 7 16 14 121
Siro / Spolted Sardinella - 225 537 348
Slengseng / Spolted Chub Mackarel - 167 167 -
Sunglir / Rainbow Runner 74 98 414 403
Swanggi / Big Eyes 2 097 1 537 1 778 9 185
Tembang / Fringescale Sardinella 10 261 18 090 16 280 18 509
Tenggiri Papan / Indo Pasific 1 683 2 525 2 041 2 895
Tenggiri / Norrow Barred 24 667 29 943 30 099 30 399
Teri / Anchovies 19 363 45 713 30 973 14 084
Terubuk / Tolishad 399 177 182 70
Tetengkek / Hard Tail Scads 4 421 3 962 3 976 4 689
Tongkol Komo / Eastern Little Tunas 13 045 8 400 8 152 7 598
Tuna Lainnya / Others Tunas 11 495 31 806 33 491 21 875
Lainnya / Others 53 382 73 333 86 697 75 997
JUMLAH / TOTAL 350 791 498 469 524 258 491 420
Lanjutan Tabel / Continued Table 3.14b
Sumber : Statistik Perikanan Tangkap Indonesia 2007 - 2010, Kementerian Kelautan dan PerikananSource Capture Fisheries Statistics of Indonesia 2007 - 2010, Ministry of Marine Affairs and Fisheries
http://www.bps.go.id
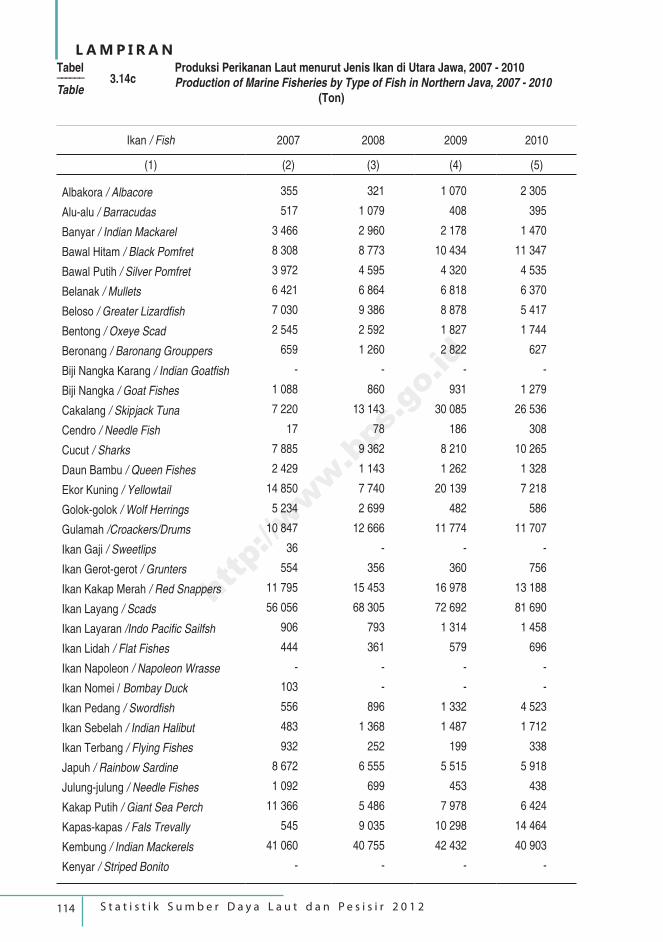
114 S t a t i s t i k S u m b e r D a y a L a u t d a n P e s i s i r 2 0 1 2
L A M P I R A N
Ikan / Fish 2007 2008 2009 2010
(1) (2) (3) (4) (5)
Albakora / Albacore 355 321 1 070 2 305
Alu-alu / Barracudas 517 1 079 408 395
Banyar / Indian Mackarel 3 466 2 960 2 178 1 470
Bawal Hitam / Black Pomfret 8 308 8 773 10 434 11 347
Bawal Putih / Silver Pomfret 3 972 4 595 4 320 4 535
Belanak / Mullets 6 421 6 864 6 818 6 370
Beloso / Greater Lizardfish 7 030 9 386 8 878 5 417
Bentong / Oxeye Scad 2 545 2 592 1 827 1 744
Beronang / Baronang Grouppers 659 1 260 2 822 627
Biji Nangka Karang / Indian Goatfish - - - -
Biji Nangka / Goat Fishes 1 088 860 931 1 279
Cakalang / Skipjack Tuna 7 220 13 143 30 085 26 536
Cendro / Needle Fish 17 78 186 308
Cucut / Sharks 7 885 9 362 8 210 10 265
Daun Bambu / Queen Fishes 2 429 1 143 1 262 1 328
Ekor Kuning / Yellowtail 14 850 7 740 20 139 7 218
Golok-golok / Wolf Herrings 5 234 2 699 482 586
Gulamah /Croackers/Drums 10 847 12 666 11 774 11 707
Ikan Gaji / Sweetlips 36 - - -
Ikan Gerot-gerot / Grunters 554 356 360 756
Ikan Kakap Merah / Red Snappers 11 795 15 453 16 978 13 188
Ikan Layang / Scads 56 056 68 305 72 692 81 690
Ikan Layaran /Indo Pacific Sailfsh 906 793 1 314 1 458
Ikan Lidah / Flat Fishes 444 361 579 696
Ikan Napoleon / Napoleon Wrasse - - - -
Ikan Nomei / Bombay Duck 103 - - -
Ikan Pedang / Swordfish 556 896 1 332 4 523
Ikan Sebelah / Indian Halibut 483 1 368 1 487 1 712
Ikan Terbang / Flying Fishes 932 252 199 338
Japuh / Rainbow Sardine 8 672 6 555 5 515 5 918
Julung-julung / Needle Fishes 1 092 699 453 438
Kakap Putih / Giant Sea Perch 11 366 5 486 7 978 6 424
Kapas-kapas / Fals Trevally 545 9 035 10 298 14 464
Kembung / Indian Mackerels 41 060 40 755 42 432 40 903
Kenyar / Striped Bonito - - - -
Tabel –––––– 3.14cTable
Produksi Perikanan Laut menurut Jenis Ikan di Utara Jawa, 2007 - 2010Production of Marine Fisheries by Type of Fish in Northern Java, 2007 - 2010 (Ton)
http://www.bps.go.id
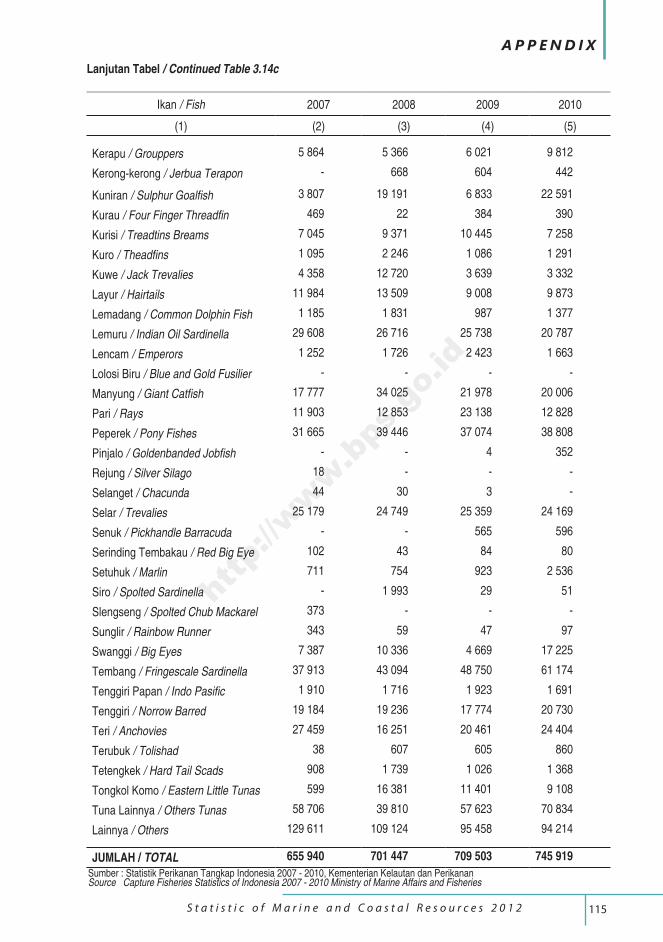
115 S t a t i s t i c o f M a r i n e a n d C o a s t a l R e s o u r c e s 2 0 1 2
A P P E N D I X
Ikan / Fish 2007 2008 2009 2010
(1) (2) (3) (4) (5)
Kerapu / Grouppers 5 864 5 366 6 021 9 812
Kerong-kerong / Jerbua Terapon - 668 604 442
Kuniran / Sulphur Goalfish 3 807 19 191 6 833 22 591
Kurau / Four Finger Threadfin 469 22 384 390
Kurisi / Treadtins Breams 7 045 9 371 10 445 7 258
Kuro / Theadfins 1 095 2 246 1 086 1 291
Kuwe / Jack Trevalies 4 358 12 720 3 639 3 332
Layur / Hairtails 11 984 13 509 9 008 9 873
Lemadang / Common Dolphin Fish 1 185 1 831 987 1 377
Lemuru / Indian Oil Sardinella 29 608 26 716 25 738 20 787
Lencam / Emperors 1 252 1 726 2 423 1 663
Lolosi Biru / Blue and Gold Fusilier - - - -
Manyung / Giant Catfish 17 777 34 025 21 978 20 006
Pari / Rays 11 903 12 853 23 138 12 828
Peperek / Pony Fishes 31 665 39 446 37 074 38 808
Pinjalo / Goldenbanded Jobfish - - 4 352
Rejung / Silver Silago 18 - - -
Selanget / Chacunda 44 30 3 -
Selar / Trevalies 25 179 24 749 25 359 24 169
Senuk / Pickhandle Barracuda - - 565 596
Serinding Tembakau / Red Big Eye 102 43 84 80
Setuhuk / Marlin 711 754 923 2 536
Siro / Spolted Sardinella - 1 993 29 51
Slengseng / Spolted Chub Mackarel 373 - - -
Sunglir / Rainbow Runner 343 59 47 97
Swanggi / Big Eyes 7 387 10 336 4 669 17 225
Tembang / Fringescale Sardinella 37 913 43 094 48 750 61 174
Tenggiri Papan / Indo Pasific 1 910 1 716 1 923 1 691
Tenggiri / Norrow Barred 19 184 19 236 17 774 20 730
Teri / Anchovies 27 459 16 251 20 461 24 404
Terubuk / Tolishad 38 607 605 860
Tetengkek / Hard Tail Scads 908 1 739 1 026 1 368
Tongkol Komo / Eastern Little Tunas 599 16 381 11 401 9 108
Tuna Lainnya / Others Tunas 58 706 39 810 57 623 70 834
Lainnya / Others 129 611 109 124 95 458 94 214
JUMLAH / TOTAL 655 940 701 447 709 503 745 919
Lanjutan Tabel / Continued Table 3.14c
Sumber : Statistik Perikanan Tangkap Indonesia 2007 - 2010, Kementerian Kelautan dan PerikananSource Capture Fisheries Statistics of Indonesia 2007 - 2010 Ministry of Marine Affairs and Fisheries
http://www.bps.go.id
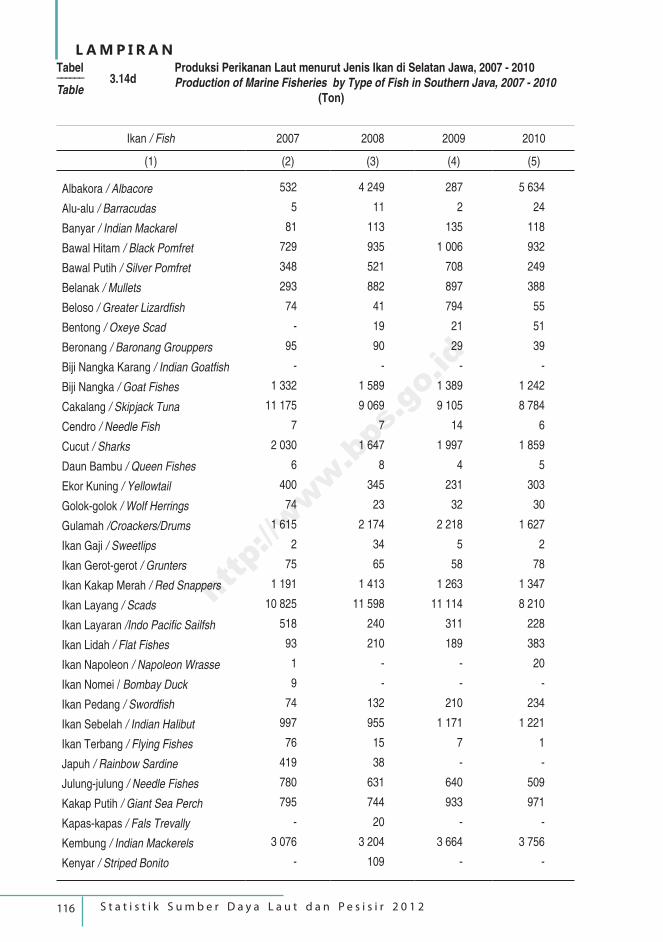
116 S t a t i s t i k S u m b e r D a y a L a u t d a n P e s i s i r 2 0 1 2
L A M P I R A N
Ikan / Fish 2007 2008 2009 2010
(1) (2) (3) (4) (5)
Albakora / Albacore 532 4 249 287 5 634
Alu-alu / Barracudas 5 11 2 24
Banyar / Indian Mackarel 81 113 135 118
Bawal Hitam / Black Pomfret 729 935 1 006 932
Bawal Putih / Silver Pomfret 348 521 708 249
Belanak / Mullets 293 882 897 388
Beloso / Greater Lizardfish 74 41 794 55
Bentong / Oxeye Scad - 19 21 51
Beronang / Baronang Grouppers 95 90 29 39
Biji Nangka Karang / Indian Goatfish - - - -
Biji Nangka / Goat Fishes 1 332 1 589 1 389 1 242
Cakalang / Skipjack Tuna 11 175 9 069 9 105 8 784
Cendro / Needle Fish 7 7 14 6
Cucut / Sharks 2 030 1 647 1 997 1 859
Daun Bambu / Queen Fishes 6 8 4 5
Ekor Kuning / Yellowtail 400 345 231 303
Golok-golok / Wolf Herrings 74 23 32 30
Gulamah /Croackers/Drums 1 615 2 174 2 218 1 627
Ikan Gaji / Sweetlips 2 34 5 2
Ikan Gerot-gerot / Grunters 75 65 58 78
Ikan Kakap Merah / Red Snappers 1 191 1 413 1 263 1 347
Ikan Layang / Scads 10 825 11 598 11 114 8 210
Ikan Layaran /Indo Pacific Sailfsh 518 240 311 228
Ikan Lidah / Flat Fishes 93 210 189 383
Ikan Napoleon / Napoleon Wrasse 1 - - 20
Ikan Nomei / Bombay Duck 9 - - -
Ikan Pedang / Swordfish 74 132 210 234
Ikan Sebelah / Indian Halibut 997 955 1 171 1 221
Ikan Terbang / Flying Fishes 76 15 7 1
Japuh / Rainbow Sardine 419 38 - -
Julung-julung / Needle Fishes 780 631 640 509
Kakap Putih / Giant Sea Perch 795 744 933 971
Kapas-kapas / Fals Trevally - 20 - -
Kembung / Indian Mackerels 3 076 3 204 3 664 3 756
Kenyar / Striped Bonito - 109 - -
Tabel –––––– 3.14dTable
Produksi Perikanan Laut menurut Jenis Ikan di Selatan Jawa, 2007 - 2010Production of Marine Fisheries by Type of Fish in Southern Java, 2007 - 2010 (Ton)
http://www.bps.go.id
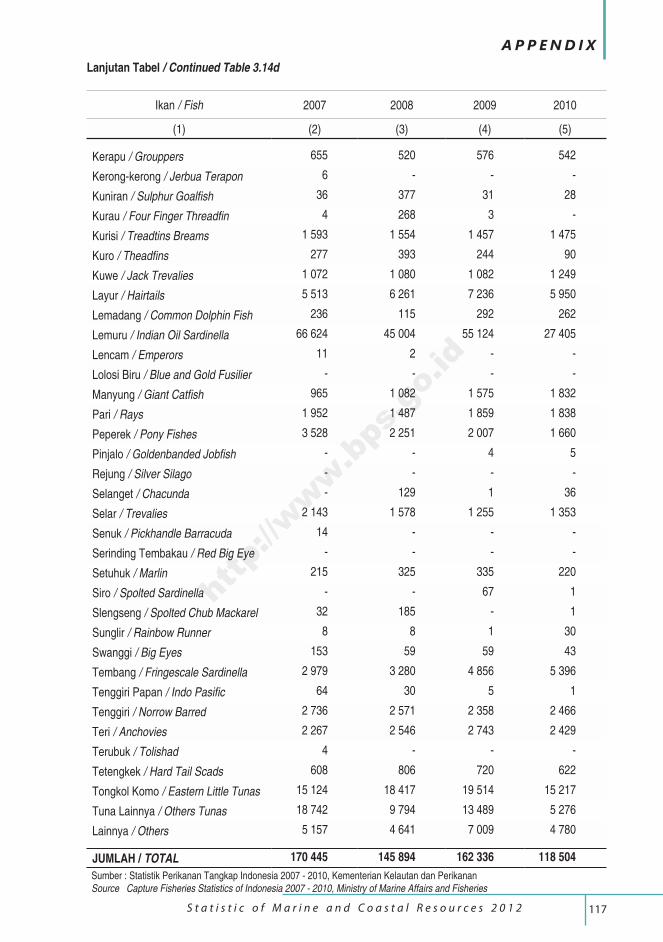
117 S t a t i s t i c o f M a r i n e a n d C o a s t a l R e s o u r c e s 2 0 1 2
A P P E N D I X
Ikan / Fish 2007 2008 2009 2010
(1) (2) (3) (4) (5)
Kerapu / Grouppers 655 520 576 542
Kerong-kerong / Jerbua Terapon 6 - - -
Kuniran / Sulphur Goalfish 36 377 31 28
Kurau / Four Finger Threadfin 4 268 3 -
Kurisi / Treadtins Breams 1 593 1 554 1 457 1 475
Kuro / Theadfins 277 393 244 90
Kuwe / Jack Trevalies 1 072 1 080 1 082 1 249
Layur / Hairtails 5 513 6 261 7 236 5 950
Lemadang / Common Dolphin Fish 236 115 292 262
Lemuru / Indian Oil Sardinella 66 624 45 004 55 124 27 405
Lencam / Emperors 11 2 - -
Lolosi Biru / Blue and Gold Fusilier - - - -
Manyung / Giant Catfish 965 1 082 1 575 1 832
Pari / Rays 1 952 1 487 1 859 1 838
Peperek / Pony Fishes 3 528 2 251 2 007 1 660
Pinjalo / Goldenbanded Jobfish - - 4 5
Rejung / Silver Silago - - - -
Selanget / Chacunda - 129 1 36
Selar / Trevalies 2 143 1 578 1 255 1 353
Senuk / Pickhandle Barracuda 14 - - -
Serinding Tembakau / Red Big Eye - - - -
Setuhuk / Marlin 215 325 335 220
Siro / Spolted Sardinella - - 67 1
Slengseng / Spolted Chub Mackarel 32 185 - 1
Sunglir / Rainbow Runner 8 8 1 30
Swanggi / Big Eyes 153 59 59 43
Tembang / Fringescale Sardinella 2 979 3 280 4 856 5 396
Tenggiri Papan / Indo Pasific 64 30 5 1
Tenggiri / Norrow Barred 2 736 2 571 2 358 2 466
Teri / Anchovies 2 267 2 546 2 743 2 429
Terubuk / Tolishad 4 - - -
Tetengkek / Hard Tail Scads 608 806 720 622
Tongkol Komo / Eastern Little Tunas 15 124 18 417 19 514 15 217
Tuna Lainnya / Others Tunas 18 742 9 794 13 489 5 276
Lainnya / Others 5 157 4 641 7 009 4 780
JUMLAH / TOTAL 170 445 145 894 162 336 118 504
Lanjutan Tabel / Continued Table 3.14d
Sumber : Statistik Perikanan Tangkap Indonesia 2007 - 2010, Kementerian Kelautan dan PerikananSource Capture Fisheries Statistics of Indonesia 2007 - 2010, Ministry of Marine Affairs and Fisheries
http://www.bps.go.id
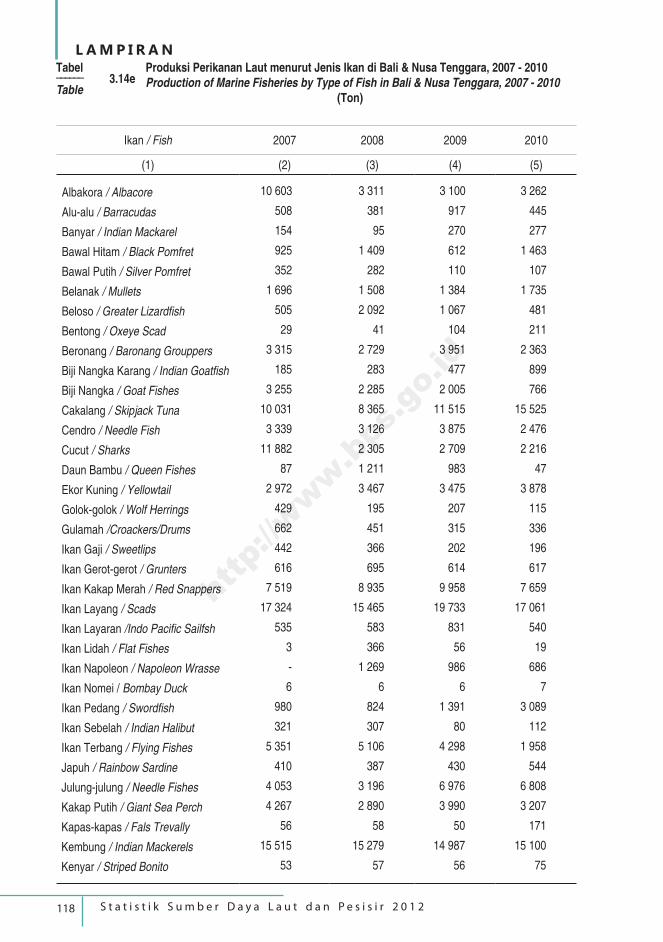
118 S t a t i s t i k S u m b e r D a y a L a u t d a n P e s i s i r 2 0 1 2
L A M P I R A N
Ikan / Fish 2007 2008 2009 2010
(1) (2) (3) (4) (5)
Albakora / Albacore 10 603 3 311 3 100 3 262
Alu-alu / Barracudas 508 381 917 445
Banyar / Indian Mackarel 154 95 270 277
Bawal Hitam / Black Pomfret 925 1 409 612 1 463
Bawal Putih / Silver Pomfret 352 282 110 107
Belanak / Mullets 1 696 1 508 1 384 1 735
Beloso / Greater Lizardfish 505 2 092 1 067 481
Bentong / Oxeye Scad 29 41 104 211
Beronang / Baronang Grouppers 3 315 2 729 3 951 2 363
Biji Nangka Karang / Indian Goatfish 185 283 477 899
Biji Nangka / Goat Fishes 3 255 2 285 2 005 766
Cakalang / Skipjack Tuna 10 031 8 365 11 515 15 525
Cendro / Needle Fish 3 339 3 126 3 875 2 476
Cucut / Sharks 11 882 2 305 2 709 2 216
Daun Bambu / Queen Fishes 87 1 211 983 47
Ekor Kuning / Yellowtail 2 972 3 467 3 475 3 878
Golok-golok / Wolf Herrings 429 195 207 115
Gulamah /Croackers/Drums 662 451 315 336
Ikan Gaji / Sweetlips 442 366 202 196
Ikan Gerot-gerot / Grunters 616 695 614 617
Ikan Kakap Merah / Red Snappers 7 519 8 935 9 958 7 659
Ikan Layang / Scads 17 324 15 465 19 733 17 061
Ikan Layaran /Indo Pacific Sailfsh 535 583 831 540
Ikan Lidah / Flat Fishes 3 366 56 19
Ikan Napoleon / Napoleon Wrasse - 1 269 986 686
Ikan Nomei / Bombay Duck 6 6 6 7
Ikan Pedang / Swordfish 980 824 1 391 3 089
Ikan Sebelah / Indian Halibut 321 307 80 112
Ikan Terbang / Flying Fishes 5 351 5 106 4 298 1 958
Japuh / Rainbow Sardine 410 387 430 544
Julung-julung / Needle Fishes 4 053 3 196 6 976 6 808
Kakap Putih / Giant Sea Perch 4 267 2 890 3 990 3 207
Kapas-kapas / Fals Trevally 56 58 50 171
Kembung / Indian Mackerels 15 515 15 279 14 987 15 100
Kenyar / Striped Bonito 53 57 56 75
Tabel –––––– 3.14eTable
Produksi Perikanan Laut menurut Jenis Ikan di Bali & Nusa Tenggara, 2007 - 2010Production of Marine Fisheries by Type of Fish in Bali & Nusa Tenggara, 2007 - 2010 (Ton)
http://www.bps.go.id
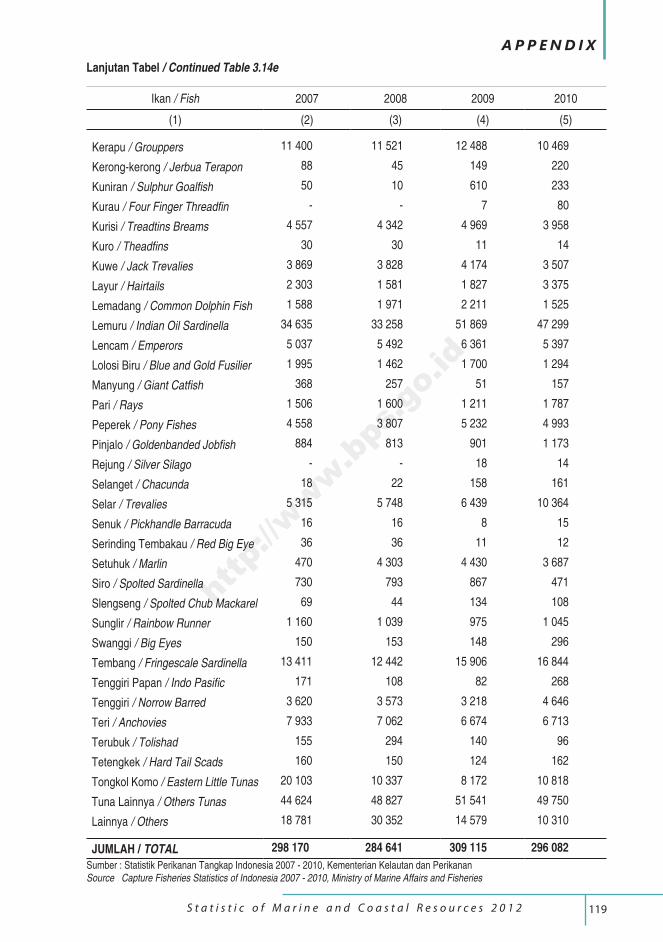
119 S t a t i s t i c o f M a r i n e a n d C o a s t a l R e s o u r c e s 2 0 1 2
A P P E N D I X
Ikan / Fish 2007 2008 2009 2010
(1) (2) (3) (4) (5)
Kerapu / Grouppers 11 400 11 521 12 488 10 469
Kerong-kerong / Jerbua Terapon 88 45 149 220
Kuniran / Sulphur Goalfish 50 10 610 233
Kurau / Four Finger Threadfin - - 7 80
Kurisi / Treadtins Breams 4 557 4 342 4 969 3 958
Kuro / Theadfins 30 30 11 14
Kuwe / Jack Trevalies 3 869 3 828 4 174 3 507
Layur / Hairtails 2 303 1 581 1 827 3 375
Lemadang / Common Dolphin Fish 1 588 1 971 2 211 1 525
Lemuru / Indian Oil Sardinella 34 635 33 258 51 869 47 299
Lencam / Emperors 5 037 5 492 6 361 5 397
Lolosi Biru / Blue and Gold Fusilier 1 995 1 462 1 700 1 294
Manyung / Giant Catfish 368 257 51 157
Pari / Rays 1 506 1 600 1 211 1 787
Peperek / Pony Fishes 4 558 3 807 5 232 4 993
Pinjalo / Goldenbanded Jobfish 884 813 901 1 173
Rejung / Silver Silago - - 18 14
Selanget / Chacunda 18 22 158 161
Selar / Trevalies 5 315 5 748 6 439 10 364
Senuk / Pickhandle Barracuda 16 16 8 15
Serinding Tembakau / Red Big Eye 36 36 11 12
Setuhuk / Marlin 470 4 303 4 430 3 687
Siro / Spolted Sardinella 730 793 867 471
Slengseng / Spolted Chub Mackarel 69 44 134 108
Sunglir / Rainbow Runner 1 160 1 039 975 1 045
Swanggi / Big Eyes 150 153 148 296
Tembang / Fringescale Sardinella 13 411 12 442 15 906 16 844
Tenggiri Papan / Indo Pasific 171 108 82 268
Tenggiri / Norrow Barred 3 620 3 573 3 218 4 646
Teri / Anchovies 7 933 7 062 6 674 6 713
Terubuk / Tolishad 155 294 140 96
Tetengkek / Hard Tail Scads 160 150 124 162
Tongkol Komo / Eastern Little Tunas 20 103 10 337 8 172 10 818
Tuna Lainnya / Others Tunas 44 624 48 827 51 541 49 750
Lainnya / Others 18 781 30 352 14 579 10 310
JUMLAH / TOTAL 298 170 284 641 309 115 296 082
Lanjutan Tabel / Continued Table 3.14e
Sumber : Statistik Perikanan Tangkap Indonesia 2007 - 2010, Kementerian Kelautan dan PerikananSource Capture Fisheries Statistics of Indonesia 2007 - 2010, Ministry of Marine Affairs and Fisheries
http://www.bps.go.id
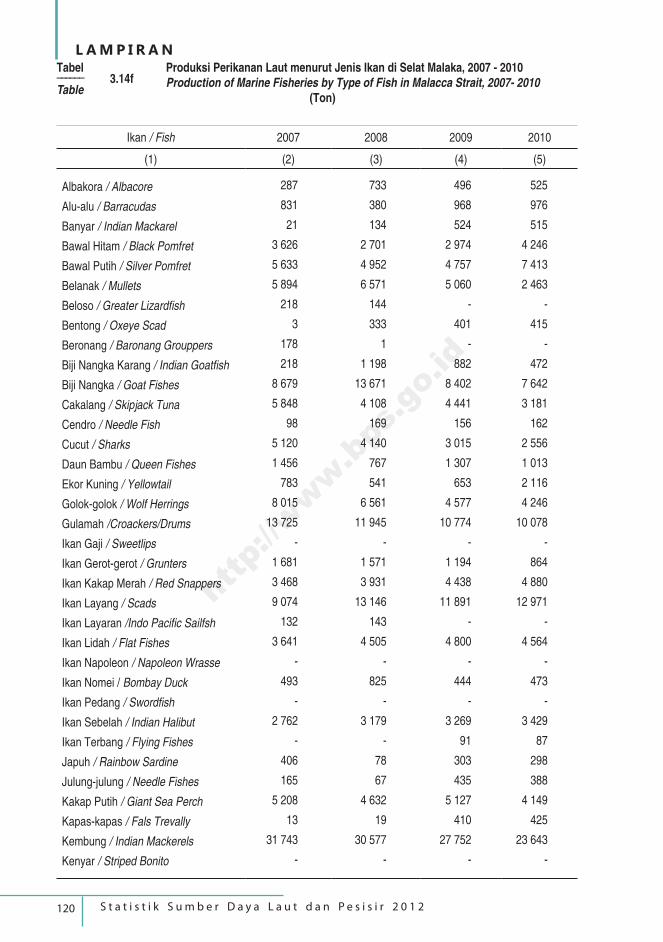
120 S t a t i s t i k S u m b e r D a y a L a u t d a n P e s i s i r 2 0 1 2
L A M P I R A N
Ikan / Fish 2007 2008 2009 2010
(1) (2) (3) (4) (5)
Albakora / Albacore 287 733 496 525
Alu-alu / Barracudas 831 380 968 976
Banyar / Indian Mackarel 21 134 524 515
Bawal Hitam / Black Pomfret 3 626 2 701 2 974 4 246
Bawal Putih / Silver Pomfret 5 633 4 952 4 757 7 413
Belanak / Mullets 5 894 6 571 5 060 2 463
Beloso / Greater Lizardfish 218 144 - -
Bentong / Oxeye Scad 3 333 401 415
Beronang / Baronang Grouppers 178 1 - -
Biji Nangka Karang / Indian Goatfish 218 1 198 882 472
Biji Nangka / Goat Fishes 8 679 13 671 8 402 7 642
Cakalang / Skipjack Tuna 5 848 4 108 4 441 3 181
Cendro / Needle Fish 98 169 156 162
Cucut / Sharks 5 120 4 140 3 015 2 556
Daun Bambu / Queen Fishes 1 456 767 1 307 1 013
Ekor Kuning / Yellowtail 783 541 653 2 116
Golok-golok / Wolf Herrings 8 015 6 561 4 577 4 246
Gulamah /Croackers/Drums 13 725 11 945 10 774 10 078
Ikan Gaji / Sweetlips - - - -
Ikan Gerot-gerot / Grunters 1 681 1 571 1 194 864
Ikan Kakap Merah / Red Snappers 3 468 3 931 4 438 4 880
Ikan Layang / Scads 9 074 13 146 11 891 12 971
Ikan Layaran /Indo Pacific Sailfsh 132 143 - -
Ikan Lidah / Flat Fishes 3 641 4 505 4 800 4 564
Ikan Napoleon / Napoleon Wrasse - - - -
Ikan Nomei / Bombay Duck 493 825 444 473
Ikan Pedang / Swordfish - - - -
Ikan Sebelah / Indian Halibut 2 762 3 179 3 269 3 429
Ikan Terbang / Flying Fishes - - 91 87
Japuh / Rainbow Sardine 406 78 303 298
Julung-julung / Needle Fishes 165 67 435 388
Kakap Putih / Giant Sea Perch 5 208 4 632 5 127 4 149
Kapas-kapas / Fals Trevally 13 19 410 425
Kembung / Indian Mackerels 31 743 30 577 27 752 23 643
Kenyar / Striped Bonito - - - -
Tabel –––––– 3.14fTable
Produksi Perikanan Laut menurut Jenis Ikan di Selat Malaka, 2007 - 2010Production of Marine Fisheries by Type of Fish in Malacca Strait, 2007- 2010 (Ton)
http://www.bps.go.id
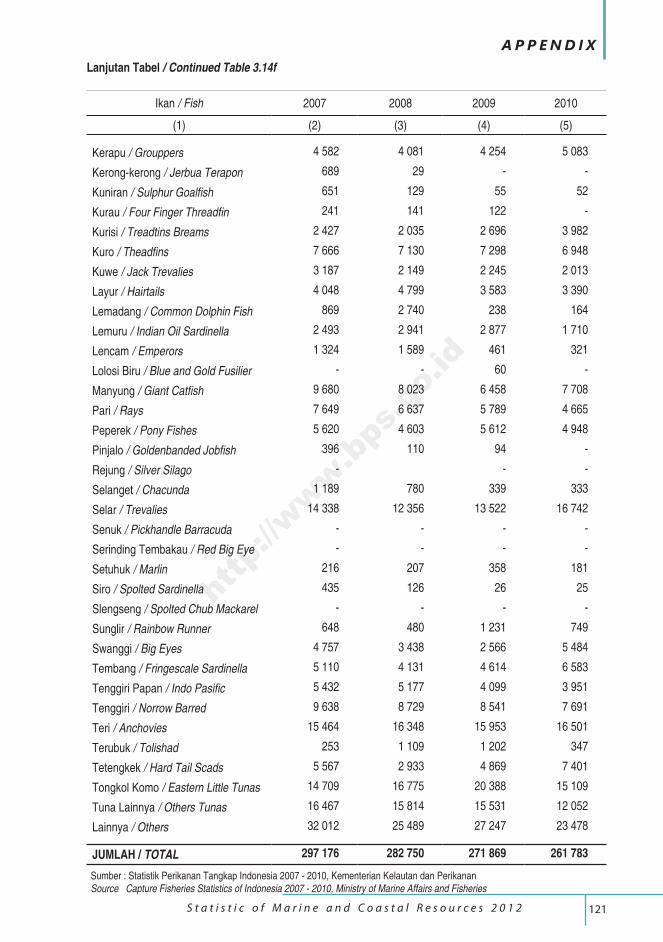
121 S t a t i s t i c o f M a r i n e a n d C o a s t a l R e s o u r c e s 2 0 1 2
A P P E N D I X
Ikan / Fish 2007 2008 2009 2010
(1) (2) (3) (4) (5)
Kerapu / Grouppers 4 582 4 081 4 254 5 083
Kerong-kerong / Jerbua Terapon 689 29 - -
Kuniran / Sulphur Goalfish 651 129 55 52
Kurau / Four Finger Threadfin 241 141 122 -
Kurisi / Treadtins Breams 2 427 2 035 2 696 3 982
Kuro / Theadfins 7 666 7 130 7 298 6 948
Kuwe / Jack Trevalies 3 187 2 149 2 245 2 013
Layur / Hairtails 4 048 4 799 3 583 3 390
Lemadang / Common Dolphin Fish 869 2 740 238 164
Lemuru / Indian Oil Sardinella 2 493 2 941 2 877 1 710
Lencam / Emperors 1 324 1 589 461 321
Lolosi Biru / Blue and Gold Fusilier - - 60 -
Manyung / Giant Catfish 9 680 8 023 6 458 7 708
Pari / Rays 7 649 6 637 5 789 4 665
Peperek / Pony Fishes 5 620 4 603 5 612 4 948
Pinjalo / Goldenbanded Jobfish 396 110 94 -
Rejung / Silver Silago - - -
Selanget / Chacunda 1 189 780 339 333
Selar / Trevalies 14 338 12 356 13 522 16 742
Senuk / Pickhandle Barracuda - - - -
Serinding Tembakau / Red Big Eye - - - -
Setuhuk / Marlin 216 207 358 181
Siro / Spolted Sardinella 435 126 26 25
Slengseng / Spolted Chub Mackarel - - - -
Sunglir / Rainbow Runner 648 480 1 231 749
Swanggi / Big Eyes 4 757 3 438 2 566 5 484
Tembang / Fringescale Sardinella 5 110 4 131 4 614 6 583
Tenggiri Papan / Indo Pasific 5 432 5 177 4 099 3 951
Tenggiri / Norrow Barred 9 638 8 729 8 541 7 691
Teri / Anchovies 15 464 16 348 15 953 16 501
Terubuk / Tolishad 253 1 109 1 202 347
Tetengkek / Hard Tail Scads 5 567 2 933 4 869 7 401
Tongkol Komo / Eastern Little Tunas 14 709 16 775 20 388 15 109
Tuna Lainnya / Others Tunas 16 467 15 814 15 531 12 052
Lainnya / Others 32 012 25 489 27 247 23 478
JUMLAH / TOTAL 297 176 282 750 271 869 261 783
Lanjutan Tabel / Continued Table 3.14f
Sumber : Statistik Perikanan Tangkap Indonesia 2007 - 2010, Kementerian Kelautan dan PerikananSource Capture Fisheries Statistics of Indonesia 2007 - 2010, Ministry of Marine Affairs and Fisheries
http://www.bps.go.id
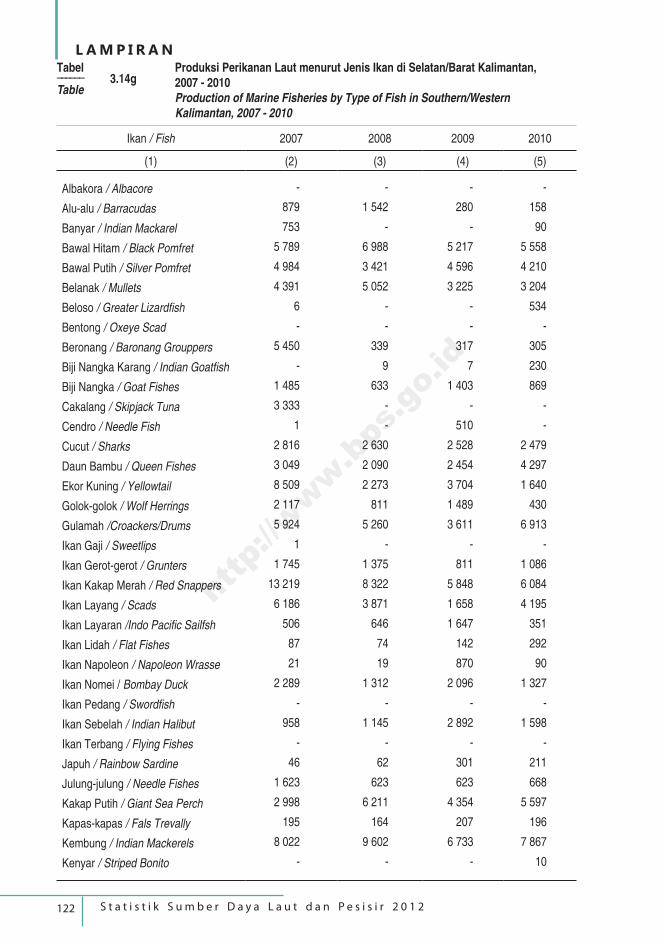
122 S t a t i s t i k S u m b e r D a y a L a u t d a n P e s i s i r 2 0 1 2
L A M P I R A N
Ikan / Fish 2007 2008 2009 2010
(1) (2) (3) (4) (5)
Albakora / Albacore - - - -
Alu-alu / Barracudas 879 1 542 280 158
Banyar / Indian Mackarel 753 - - 90
Bawal Hitam / Black Pomfret 5 789 6 988 5 217 5 558
Bawal Putih / Silver Pomfret 4 984 3 421 4 596 4 210
Belanak / Mullets 4 391 5 052 3 225 3 204
Beloso / Greater Lizardfish 6 - - 534
Bentong / Oxeye Scad - - - -
Beronang / Baronang Grouppers 5 450 339 317 305
Biji Nangka Karang / Indian Goatfish - 9 7 230
Biji Nangka / Goat Fishes 1 485 633 1 403 869
Cakalang / Skipjack Tuna 3 333 - - -
Cendro / Needle Fish 1 - 510 -
Cucut / Sharks 2 816 2 630 2 528 2 479
Daun Bambu / Queen Fishes 3 049 2 090 2 454 4 297
Ekor Kuning / Yellowtail 8 509 2 273 3 704 1 640
Golok-golok / Wolf Herrings 2 117 811 1 489 430
Gulamah /Croackers/Drums 5 924 5 260 3 611 6 913
Ikan Gaji / Sweetlips 1 - - -
Ikan Gerot-gerot / Grunters 1 745 1 375 811 1 086
Ikan Kakap Merah / Red Snappers 13 219 8 322 5 848 6 084
Ikan Layang / Scads 6 186 3 871 1 658 4 195
Ikan Layaran /Indo Pacific Sailfsh 506 646 1 647 351
Ikan Lidah / Flat Fishes 87 74 142 292
Ikan Napoleon / Napoleon Wrasse 21 19 870 90
Ikan Nomei / Bombay Duck 2 289 1 312 2 096 1 327
Ikan Pedang / Swordfish - - - -
Ikan Sebelah / Indian Halibut 958 1 145 2 892 1 598
Ikan Terbang / Flying Fishes - - - -
Japuh / Rainbow Sardine 46 62 301 211
Julung-julung / Needle Fishes 1 623 623 623 668
Kakap Putih / Giant Sea Perch 2 998 6 211 4 354 5 597
Kapas-kapas / Fals Trevally 195 164 207 196
Kembung / Indian Mackerels 8 022 9 602 6 733 7 867
Kenyar / Striped Bonito - - - 10
Tabel –––––– 3.14gTable
Produksi Perikanan Laut menurut Jenis Ikan di Selatan/Barat Kalimantan, 2007 - 2010Production of Marine Fisheries by Type of Fish in Southern/WesternKalimantan, 2007 - 2010
http://www.bps.go.id

123 S t a t i s t i c o f M a r i n e a n d C o a s t a l R e s o u r c e s 2 0 1 2
A P P E N D I X
Ikan / Fish 2007 2008 2009 2010
(1) (2) (3) (4) (5)
Kerapu / Grouppers 6 451 1 325 1 995 2 063
Kerong-kerong / Jerbua Terapon 76 62 355 135
Kuniran / Sulphur Goalfish 3 8 20 13
Kurau / Four Finger Threadfin 17 47 155 344
Kurisi / Treadtins Breams 3 656 1 844 912 1 158
Kuro / Theadfins 7 060 5 772 5 873 4 971
Kuwe / Jack Trevalies 2 438 924 1 104 1 089
Layur / Hairtails 1 615 892 1 228 1 965
Lemadang / Common Dolphin Fish - - - -
Lemuru / Indian Oil Sardinella 1 272 153 2 066 227
Lencam / Emperors 2 808 902 1 087 1 516
Lolosi Biru / Blue and Gold Fusilier 12 - - -
Manyung / Giant Catfish 7 659 12 998 10 013 10 993
Pari / Rays 3 311 3 658 3 266 5 704
Peperek / Pony Fishes 4 704 2 138 6 619 2 734
Pinjalo / Goldenbanded Jobfish - - - -
Rejung / Silver Silago - - - -
Selanget / Chacunda 348 479 173 690
Selar / Trevalies 10 011 5 829 5 146 7 891
Senuk / Pickhandle Barracuda - - - -
Serinding Tembakau / Red Big Eye 1 - - 14
Setuhuk / Marlin 45 60 478 120
Siro / Spolted Sardinella - - - 52
Slengseng / Spolted Chub Mackarel - - - 25
Sunglir / Rainbow Runner - - - -
Swanggi / Big Eyes 252 290 1 927 2 546
Tembang / Fringescale Sardinella 9 319 1 600 1 080 2 597
Tenggiri Papan / Indo Pasific 5 519 3 092 2 799 4 321
Tenggiri / Norrow Barred 11 934 14 823 13 112 13 628
Teri / Anchovies 9 656 6 939 3 355 2 494
Terubuk / Tolishad - 114 301 184
Tetengkek / Hard Tail Scads 843 1 031 1 109 1 097
Tongkol Komo / Eastern Little Tunas 3 614 5 909 2 570 3 218
Tuna Lainnya / Others Tunas 22 749 9 409 11 796 9 826
Lainnya / Others 43 056 30 247 38 238 37 979
JUMLAH / TOTAL 245 811 175 019 174 300 180 083
Lanjutan Tabel / Continued Table 3.14g
Sumber : Statistik Perikanan Tangkap Indonesia 2007 - 2010, Kementerian Kelautan dan PerikananSource Capture Fisheries Statistics of Indonesia 2007 - 2010, Ministry of Marine Affairs and Fisheries
http://www.bps.go.id
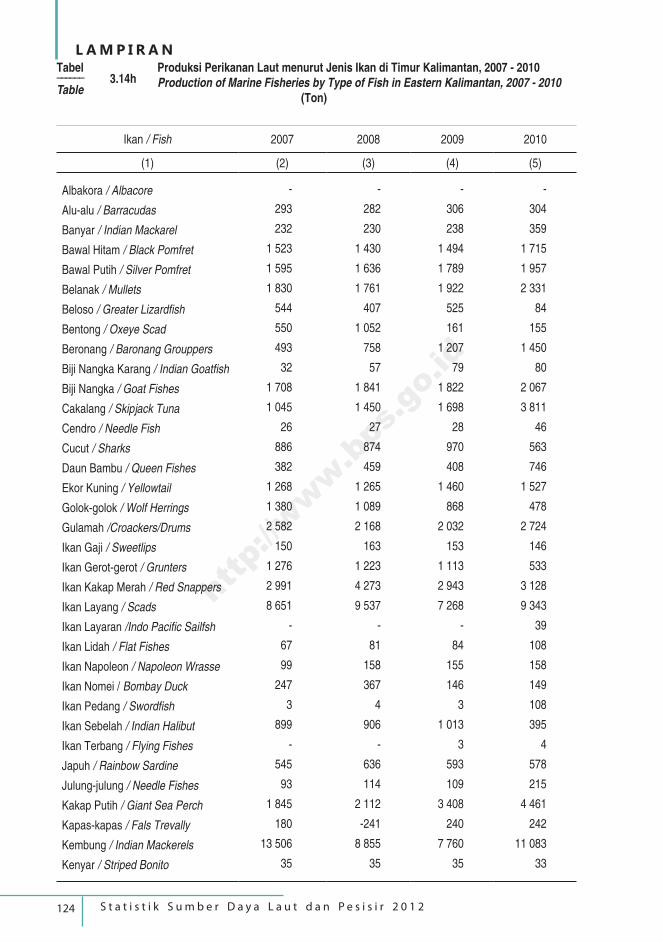
124 S t a t i s t i k S u m b e r D a y a L a u t d a n P e s i s i r 2 0 1 2
L A M P I R A N
Ikan / Fish 2007 2008 2009 2010
(1) (2) (3) (4) (5)
Albakora / Albacore - - - -
Alu-alu / Barracudas 293 282 306 304
Banyar / Indian Mackarel 232 230 238 359
Bawal Hitam / Black Pomfret 1 523 1 430 1 494 1 715
Bawal Putih / Silver Pomfret 1 595 1 636 1 789 1 957
Belanak / Mullets 1 830 1 761 1 922 2 331
Beloso / Greater Lizardfish 544 407 525 84
Bentong / Oxeye Scad 550 1 052 161 155
Beronang / Baronang Grouppers 493 758 1 207 1 450
Biji Nangka Karang / Indian Goatfish 32 57 79 80
Biji Nangka / Goat Fishes 1 708 1 841 1 822 2 067
Cakalang / Skipjack Tuna 1 045 1 450 1 698 3 811
Cendro / Needle Fish 26 27 28 46
Cucut / Sharks 886 874 970 563
Daun Bambu / Queen Fishes 382 459 408 746
Ekor Kuning / Yellowtail 1 268 1 265 1 460 1 527
Golok-golok / Wolf Herrings 1 380 1 089 868 478
Gulamah /Croackers/Drums 2 582 2 168 2 032 2 724
Ikan Gaji / Sweetlips 150 163 153 146
Ikan Gerot-gerot / Grunters 1 276 1 223 1 113 533
Ikan Kakap Merah / Red Snappers 2 991 4 273 2 943 3 128
Ikan Layang / Scads 8 651 9 537 7 268 9 343
Ikan Layaran /Indo Pacific Sailfsh - - - 39
Ikan Lidah / Flat Fishes 67 81 84 108
Ikan Napoleon / Napoleon Wrasse 99 158 155 158
Ikan Nomei / Bombay Duck 247 367 146 149
Ikan Pedang / Swordfish 3 4 3 108
Ikan Sebelah / Indian Halibut 899 906 1 013 395
Ikan Terbang / Flying Fishes - - 3 4
Japuh / Rainbow Sardine 545 636 593 578
Julung-julung / Needle Fishes 93 114 109 215
Kakap Putih / Giant Sea Perch 1 845 2 112 3 408 4 461
Kapas-kapas / Fals Trevally 180 -241 240 242
Kembung / Indian Mackerels 13 506 8 855 7 760 11 083
Kenyar / Striped Bonito 35 35 35 33
Tabel –––––– 3.14hTable
Produksi Perikanan Laut menurut Jenis Ikan di Timur Kalimantan, 2007 - 2010Production of Marine Fisheries by Type of Fish in Eastern Kalimantan, 2007 - 2010 (Ton)
http://www.bps.go.id

125 S t a t i s t i c o f M a r i n e a n d C o a s t a l R e s o u r c e s 2 0 1 2
A P P E N D I X
Ikan / Fish 2007 2008 2009 2010
(1) (2) (3) (4) (5)
Kerapu / Grouppers 2 048 2 197 3 985 4 877
Kerong-kerong / Jerbua Terapon 25 49 80 108
Kuniran / Sulphur Goalfish 108 151 112 104
Kurau / Four Finger Threadfin 340 104 225 454
Kurisi / Treadtins Breams 3 370 2 277 934 2 053
Kuro / Theadfins 1 210 1 414 1 294 1 901
Kuwe / Jack Trevalies 2 376 2 397 2 450 2 457
Layur / Hairtails 277 290 439 609
Lemadang / Common Dolphin Fish - - - 159
Lemuru / Indian Oil Sardinella 580 640 673 717
Lencam / Emperors 111 140 112 225
Lolosi Biru / Blue and Gold Fusilier - - - -
Manyung / Giant Catfish 1 975 2 206 2 394 1 972
Pari / Rays 1 443 1 125 1 220 1 448
Peperek / Pony Fishes 1 407 856 440 209
Pinjalo / Goldenbanded Jobfish - - - -
Rejung / Silver Silago - - - -
Selanget / Chacunda 657 901 851 1 323
Selar / Trevalies 1 912 1 968 1 644 1 522
Senuk / Pickhandle Barracuda - - - 81
Serinding Tembakau / Red Big Eye 8 8 8 8
Setuhuk / Marlin 185 188 193 177
Siro / Spolted Sardinella 14 15 16 52
Slengseng / Spolted Chub Mackarel - - - -
Sunglir / Rainbow Runner 76 130 54 47
Swanggi / Big Eyes 315 315 336 277
Tembang / Fringescale Sardinella 5 435 5 041 4 907 3 572
Tenggiri Papan / Indo Pasific 1 001 996 1 192 677
Tenggiri / Norrow Barred 3 582 8 656 3 868 6 825
Teri / Anchovies 3 692 5 324 3 261 9 705
Terubuk / Tolishad 183 207 254 183
Tetengkek / Hard Tail Scads 492 511 524 287
Tongkol Komo / Eastern Little Tunas 4 999 6 227 5 035 7 327
Tuna Lainnya / Others Tunas 4 347 2 311 2 715 2 693
Lainnya / Others 5 902 10 141 17 148 11 770
JUMLAH / TOTAL 95 026 102 276 98 397 114 876
Lanjutan Tabel / Continued Table 3.14h
Sumber : Statistik Perikanan Tangkap Indonesia 2007 - 2010, Kementerian Kelautan dan PerikananSource Capture Fisheries Statistics of Indonesia 2007 - 2010, Ministry of Marine Affairs and Fisheries
http://www.bps.go.id
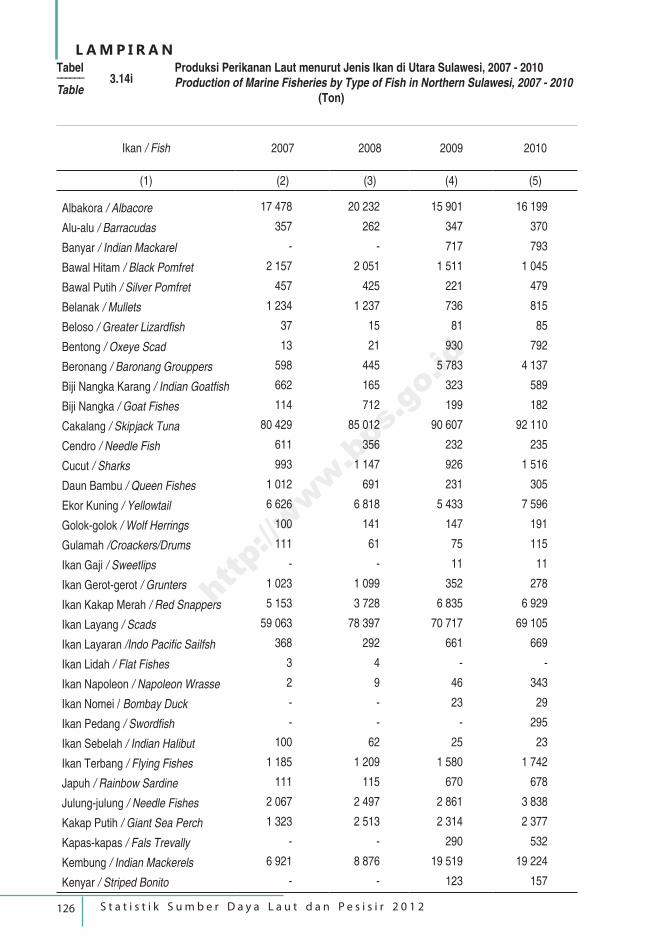
126 S t a t i s t i k S u m b e r D a y a L a u t d a n P e s i s i r 2 0 1 2
L A M P I R A N
Ikan / Fish 2007 2008 2009 2010
(1) (2) (3) (4) (5)
Albakora / Albacore 17 478 20 232 15 901 16 199
Alu-alu / Barracudas 357 262 347 370
Banyar / Indian Mackarel - - 717 793
Bawal Hitam / Black Pomfret 2 157 2 051 1 511 1 045
Bawal Putih / Silver Pomfret 457 425 221 479
Belanak / Mullets 1 234 1 237 736 815
Beloso / Greater Lizardfish 37 15 81 85
Bentong / Oxeye Scad 13 21 930 792
Beronang / Baronang Grouppers 598 445 5 783 4 137
Biji Nangka Karang / Indian Goatfish 662 165 323 589
Biji Nangka / Goat Fishes 114 712 199 182
Cakalang / Skipjack Tuna 80 429 85 012 90 607 92 110
Cendro / Needle Fish 611 356 232 235
Cucut / Sharks 993 1 147 926 1 516
Daun Bambu / Queen Fishes 1 012 691 231 305
Ekor Kuning / Yellowtail 6 626 6 818 5 433 7 596
Golok-golok / Wolf Herrings 100 141 147 191
Gulamah /Croackers/Drums 111 61 75 115
Ikan Gaji / Sweetlips - - 11 11
Ikan Gerot-gerot / Grunters 1 023 1 099 352 278
Ikan Kakap Merah / Red Snappers 5 153 3 728 6 835 6 929
Ikan Layang / Scads 59 063 78 397 70 717 69 105
Ikan Layaran /Indo Pacific Sailfsh 368 292 661 669
Ikan Lidah / Flat Fishes 3 4 - -
Ikan Napoleon / Napoleon Wrasse 2 9 46 343
Ikan Nomei / Bombay Duck - - 23 29
Ikan Pedang / Swordfish - - - 295
Ikan Sebelah / Indian Halibut 100 62 25 23
Ikan Terbang / Flying Fishes 1 185 1 209 1 580 1 742
Japuh / Rainbow Sardine 111 115 670 678
Julung-julung / Needle Fishes 2 067 2 497 2 861 3 838
Kakap Putih / Giant Sea Perch 1 323 2 513 2 314 2 377
Kapas-kapas / Fals Trevally - - 290 532
Kembung / Indian Mackerels 6 921 8 876 19 519 19 224
Kenyar / Striped Bonito - - 123 157
Tabel –––––– 3.14iTable
Produksi Perikanan Laut menurut Jenis Ikan di Utara Sulawesi, 2007 - 2010Production of Marine Fisheries by Type of Fish in Northern Sulawesi, 2007 - 2010 (Ton)
http://www.bps.go.id
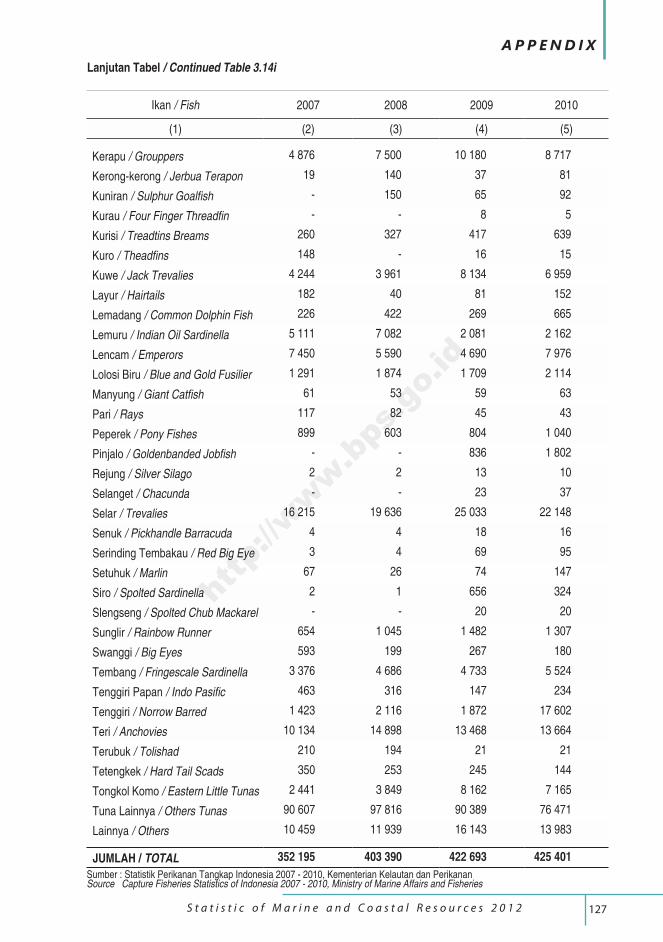
127 S t a t i s t i c o f M a r i n e a n d C o a s t a l R e s o u r c e s 2 0 1 2
A P P E N D I X
Ikan / Fish 2007 2008 2009 2010
(1) (2) (3) (4) (5)
Kerapu / Grouppers 4 876 7 500 10 180 8 717
Kerong-kerong / Jerbua Terapon 19 140 37 81
Kuniran / Sulphur Goalfish - 150 65 92
Kurau / Four Finger Threadfin - - 8 5
Kurisi / Treadtins Breams 260 327 417 639
Kuro / Theadfins 148 - 16 15
Kuwe / Jack Trevalies 4 244 3 961 8 134 6 959
Layur / Hairtails 182 40 81 152
Lemadang / Common Dolphin Fish 226 422 269 665
Lemuru / Indian Oil Sardinella 5 111 7 082 2 081 2 162
Lencam / Emperors 7 450 5 590 4 690 7 976
Lolosi Biru / Blue and Gold Fusilier 1 291 1 874 1 709 2 114
Manyung / Giant Catfish 61 53 59 63
Pari / Rays 117 82 45 43
Peperek / Pony Fishes 899 603 804 1 040
Pinjalo / Goldenbanded Jobfish - - 836 1 802
Rejung / Silver Silago 2 2 13 10
Selanget / Chacunda - - 23 37
Selar / Trevalies 16 215 19 636 25 033 22 148
Senuk / Pickhandle Barracuda 4 4 18 16
Serinding Tembakau / Red Big Eye 3 4 69 95
Setuhuk / Marlin 67 26 74 147
Siro / Spolted Sardinella 2 1 656 324
Slengseng / Spolted Chub Mackarel - - 20 20
Sunglir / Rainbow Runner 654 1 045 1 482 1 307
Swanggi / Big Eyes 593 199 267 180
Tembang / Fringescale Sardinella 3 376 4 686 4 733 5 524
Tenggiri Papan / Indo Pasific 463 316 147 234
Tenggiri / Norrow Barred 1 423 2 116 1 872 17 602
Teri / Anchovies 10 134 14 898 13 468 13 664
Terubuk / Tolishad 210 194 21 21
Tetengkek / Hard Tail Scads 350 253 245 144
Tongkol Komo / Eastern Little Tunas 2 441 3 849 8 162 7 165
Tuna Lainnya / Others Tunas 90 607 97 816 90 389 76 471
Lainnya / Others 10 459 11 939 16 143 13 983
JUMLAH / TOTAL 352 195 403 390 422 693 425 401
Lanjutan Tabel / Continued Table 3.14i
Sumber : Statistik Perikanan Tangkap Indonesia 2007 - 2010, Kementerian Kelautan dan PerikananSource Capture Fisheries Statistics of Indonesia 2007 - 2010, Ministry of Marine Affairs and Fisheries
http://www.bps.go.id
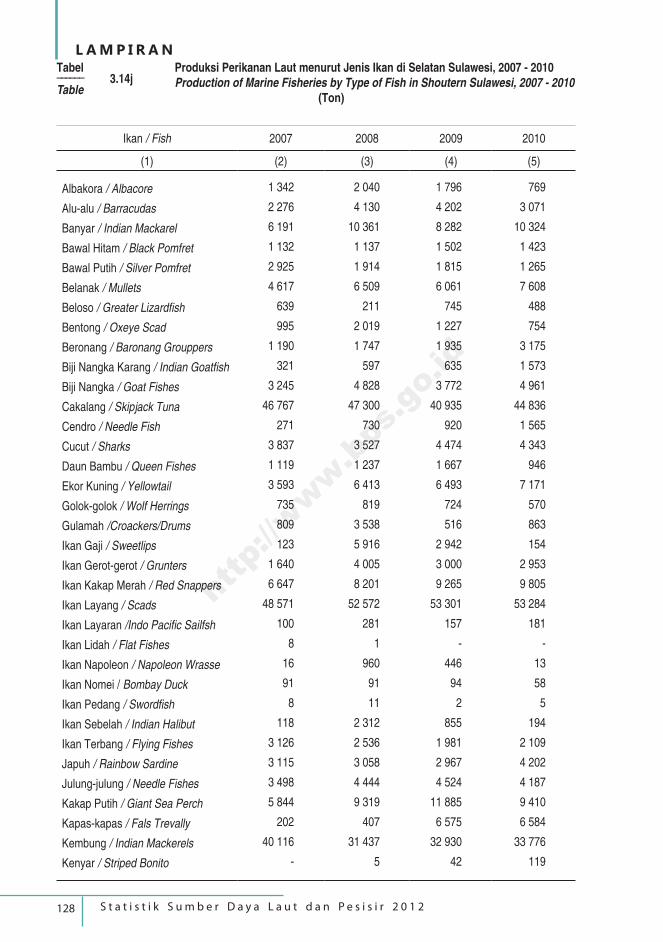
128 S t a t i s t i k S u m b e r D a y a L a u t d a n P e s i s i r 2 0 1 2
L A M P I R A N
Ikan / Fish 2007 2008 2009 2010
(1) (2) (3) (4) (5)
Albakora / Albacore 1 342 2 040 1 796 769
Alu-alu / Barracudas 2 276 4 130 4 202 3 071
Banyar / Indian Mackarel 6 191 10 361 8 282 10 324
Bawal Hitam / Black Pomfret 1 132 1 137 1 502 1 423
Bawal Putih / Silver Pomfret 2 925 1 914 1 815 1 265
Belanak / Mullets 4 617 6 509 6 061 7 608
Beloso / Greater Lizardfish 639 211 745 488
Bentong / Oxeye Scad 995 2 019 1 227 754
Beronang / Baronang Grouppers 1 190 1 747 1 935 3 175
Biji Nangka Karang / Indian Goatfish 321 597 635 1 573
Biji Nangka / Goat Fishes 3 245 4 828 3 772 4 961
Cakalang / Skipjack Tuna 46 767 47 300 40 935 44 836
Cendro / Needle Fish 271 730 920 1 565
Cucut / Sharks 3 837 3 527 4 474 4 343
Daun Bambu / Queen Fishes 1 119 1 237 1 667 946
Ekor Kuning / Yellowtail 3 593 6 413 6 493 7 171
Golok-golok / Wolf Herrings 735 819 724 570
Gulamah /Croackers/Drums 809 3 538 516 863
Ikan Gaji / Sweetlips 123 5 916 2 942 154
Ikan Gerot-gerot / Grunters 1 640 4 005 3 000 2 953
Ikan Kakap Merah / Red Snappers 6 647 8 201 9 265 9 805
Ikan Layang / Scads 48 571 52 572 53 301 53 284
Ikan Layaran /Indo Pacific Sailfsh 100 281 157 181
Ikan Lidah / Flat Fishes 8 1 - -
Ikan Napoleon / Napoleon Wrasse 16 960 446 13
Ikan Nomei / Bombay Duck 91 91 94 58
Ikan Pedang / Swordfish 8 11 2 5
Ikan Sebelah / Indian Halibut 118 2 312 855 194
Ikan Terbang / Flying Fishes 3 126 2 536 1 981 2 109
Japuh / Rainbow Sardine 3 115 3 058 2 967 4 202
Julung-julung / Needle Fishes 3 498 4 444 4 524 4 187
Kakap Putih / Giant Sea Perch 5 844 9 319 11 885 9 410
Kapas-kapas / Fals Trevally 202 407 6 575 6 584
Kembung / Indian Mackerels 40 116 31 437 32 930 33 776
Kenyar / Striped Bonito - 5 42 119
Tabel –––––– 3.14jTable
Produksi Perikanan Laut menurut Jenis Ikan di Selatan Sulawesi, 2007 - 2010Production of Marine Fisheries by Type of Fish in Shoutern Sulawesi, 2007 - 2010 (Ton)
http://www.bps.go.id
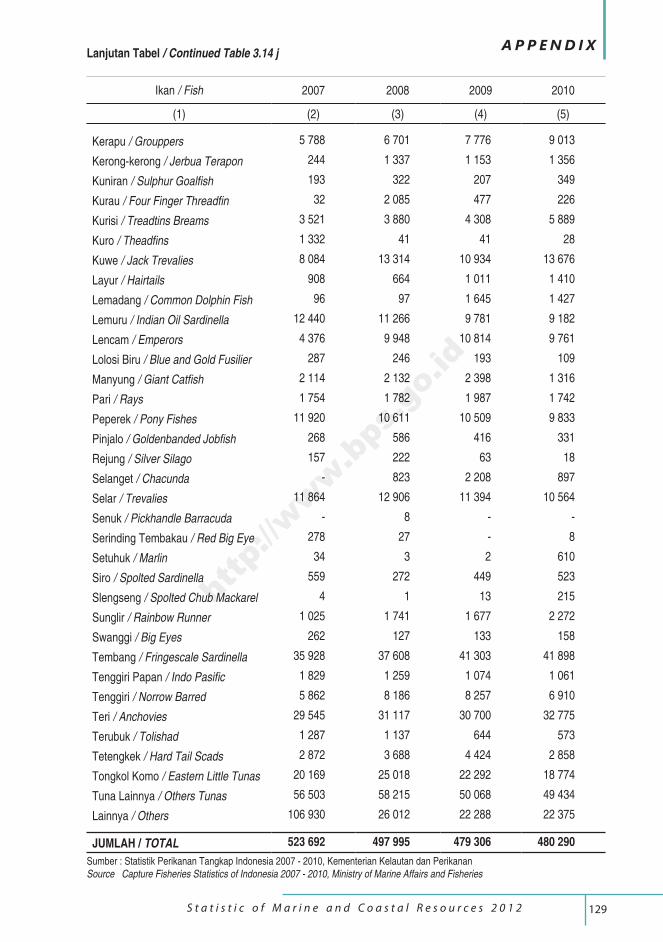
129 S t a t i s t i c o f M a r i n e a n d C o a s t a l R e s o u r c e s 2 0 1 2
A P P E N D I X
Ikan / Fish 2007 2008 2009 2010
(1) (2) (3) (4) (5)
Kerapu / Grouppers 5 788 6 701 7 776 9 013
Kerong-kerong / Jerbua Terapon 244 1 337 1 153 1 356
Kuniran / Sulphur Goalfish 193 322 207 349
Kurau / Four Finger Threadfin 32 2 085 477 226
Kurisi / Treadtins Breams 3 521 3 880 4 308 5 889
Kuro / Theadfins 1 332 41 41 28
Kuwe / Jack Trevalies 8 084 13 314 10 934 13 676
Layur / Hairtails 908 664 1 011 1 410
Lemadang / Common Dolphin Fish 96 97 1 645 1 427
Lemuru / Indian Oil Sardinella 12 440 11 266 9 781 9 182
Lencam / Emperors 4 376 9 948 10 814 9 761
Lolosi Biru / Blue and Gold Fusilier 287 246 193 109
Manyung / Giant Catfish 2 114 2 132 2 398 1 316
Pari / Rays 1 754 1 782 1 987 1 742
Peperek / Pony Fishes 11 920 10 611 10 509 9 833
Pinjalo / Goldenbanded Jobfish 268 586 416 331
Rejung / Silver Silago 157 222 63 18
Selanget / Chacunda - 823 2 208 897
Selar / Trevalies 11 864 12 906 11 394 10 564
Senuk / Pickhandle Barracuda - 8 - -
Serinding Tembakau / Red Big Eye 278 27 - 8
Setuhuk / Marlin 34 3 2 610
Siro / Spolted Sardinella 559 272 449 523
Slengseng / Spolted Chub Mackarel 4 1 13 215
Sunglir / Rainbow Runner 1 025 1 741 1 677 2 272
Swanggi / Big Eyes 262 127 133 158
Tembang / Fringescale Sardinella 35 928 37 608 41 303 41 898
Tenggiri Papan / Indo Pasific 1 829 1 259 1 074 1 061
Tenggiri / Norrow Barred 5 862 8 186 8 257 6 910
Teri / Anchovies 29 545 31 117 30 700 32 775
Terubuk / Tolishad 1 287 1 137 644 573
Tetengkek / Hard Tail Scads 2 872 3 688 4 424 2 858
Tongkol Komo / Eastern Little Tunas 20 169 25 018 22 292 18 774
Tuna Lainnya / Others Tunas 56 503 58 215 50 068 49 434
Lainnya / Others 106 930 26 012 22 288 22 375
JUMLAH / TOTAL 523 692 497 995 479 306 480 290
Lanjutan Tabel / Continued Table 3.14 j
Sumber : Statistik Perikanan Tangkap Indonesia 2007 - 2010, Kementerian Kelautan dan PerikananSource Capture Fisheries Statistics of Indonesia 2007 - 2010, Ministry of Marine Affairs and Fisheries
http://www.bps.go.id
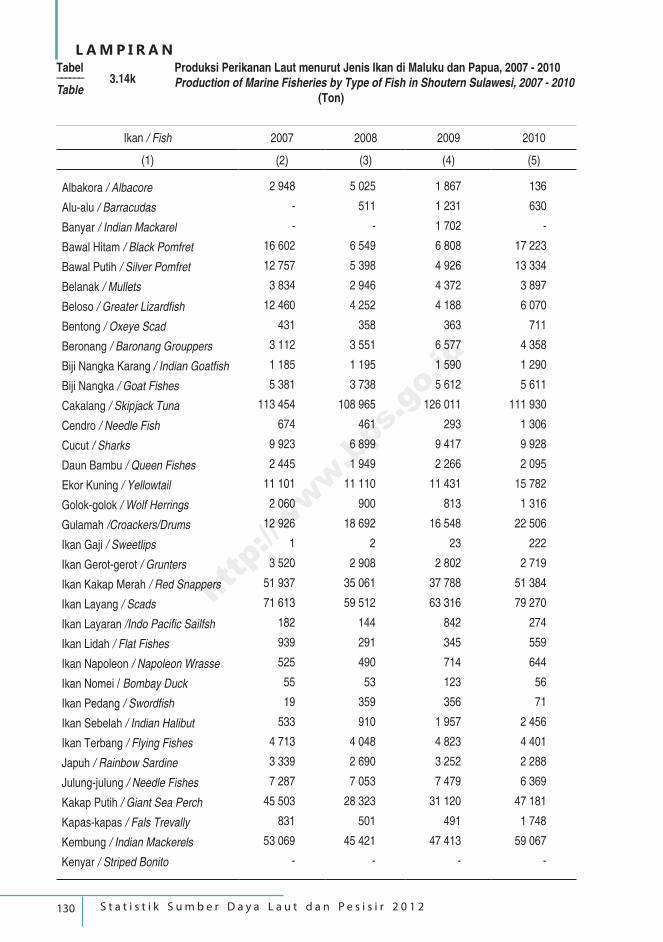
130 S t a t i s t i k S u m b e r D a y a L a u t d a n P e s i s i r 2 0 1 2
L A M P I R A N
Ikan / Fish 2007 2008 2009 2010
(1) (2) (3) (4) (5)
Albakora / Albacore 2 948 5 025 1 867 136
Alu-alu / Barracudas - 511 1 231 630
Banyar / Indian Mackarel - - 1 702 -
Bawal Hitam / Black Pomfret 16 602 6 549 6 808 17 223
Bawal Putih / Silver Pomfret 12 757 5 398 4 926 13 334
Belanak / Mullets 3 834 2 946 4 372 3 897
Beloso / Greater Lizardfish 12 460 4 252 4 188 6 070
Bentong / Oxeye Scad 431 358 363 711
Beronang / Baronang Grouppers 3 112 3 551 6 577 4 358
Biji Nangka Karang / Indian Goatfish 1 185 1 195 1 590 1 290
Biji Nangka / Goat Fishes 5 381 3 738 5 612 5 611
Cakalang / Skipjack Tuna 113 454 108 965 126 011 111 930
Cendro / Needle Fish 674 461 293 1 306
Cucut / Sharks 9 923 6 899 9 417 9 928
Daun Bambu / Queen Fishes 2 445 1 949 2 266 2 095
Ekor Kuning / Yellowtail 11 101 11 110 11 431 15 782
Golok-golok / Wolf Herrings 2 060 900 813 1 316
Gulamah /Croackers/Drums 12 926 18 692 16 548 22 506
Ikan Gaji / Sweetlips 1 2 23 222
Ikan Gerot-gerot / Grunters 3 520 2 908 2 802 2 719
Ikan Kakap Merah / Red Snappers 51 937 35 061 37 788 51 384
Ikan Layang / Scads 71 613 59 512 63 316 79 270
Ikan Layaran /Indo Pacific Sailfsh 182 144 842 274
Ikan Lidah / Flat Fishes 939 291 345 559
Ikan Napoleon / Napoleon Wrasse 525 490 714 644
Ikan Nomei / Bombay Duck 55 53 123 56
Ikan Pedang / Swordfish 19 359 356 71
Ikan Sebelah / Indian Halibut 533 910 1 957 2 456
Ikan Terbang / Flying Fishes 4 713 4 048 4 823 4 401
Japuh / Rainbow Sardine 3 339 2 690 3 252 2 288
Julung-julung / Needle Fishes 7 287 7 053 7 479 6 369
Kakap Putih / Giant Sea Perch 45 503 28 323 31 120 47 181
Kapas-kapas / Fals Trevally 831 501 491 1 748
Kembung / Indian Mackerels 53 069 45 421 47 413 59 067
Kenyar / Striped Bonito - - - -
Tabel –––––– 3.14kTable
Produksi Perikanan Laut menurut Jenis Ikan di Maluku dan Papua, 2007 - 2010Production of Marine Fisheries by Type of Fish in Shoutern Sulawesi, 2007 - 2010 (Ton)
http://www.bps.go.id
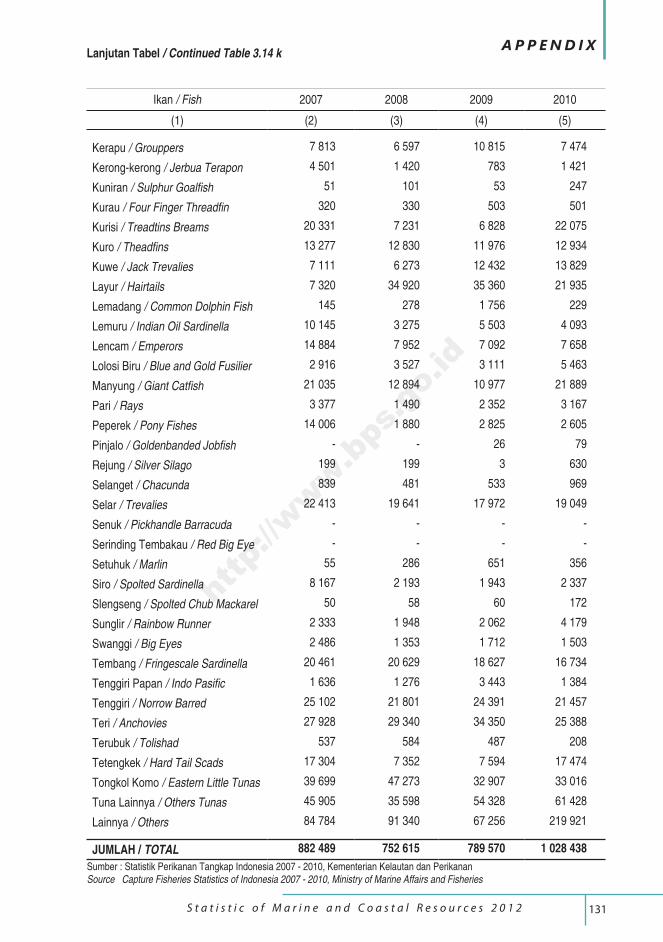
131 S t a t i s t i c o f M a r i n e a n d C o a s t a l R e s o u r c e s 2 0 1 2
A P P E N D I X
Ikan / Fish 2007 2008 2009 2010
(1) (2) (3) (4) (5)
Kerapu / Grouppers 7 813 6 597 10 815 7 474
Kerong-kerong / Jerbua Terapon 4 501 1 420 783 1 421
Kuniran / Sulphur Goalfish 51 101 53 247
Kurau / Four Finger Threadfin 320 330 503 501
Kurisi / Treadtins Breams 20 331 7 231 6 828 22 075
Kuro / Theadfins 13 277 12 830 11 976 12 934
Kuwe / Jack Trevalies 7 111 6 273 12 432 13 829
Layur / Hairtails 7 320 34 920 35 360 21 935
Lemadang / Common Dolphin Fish 145 278 1 756 229
Lemuru / Indian Oil Sardinella 10 145 3 275 5 503 4 093
Lencam / Emperors 14 884 7 952 7 092 7 658
Lolosi Biru / Blue and Gold Fusilier 2 916 3 527 3 111 5 463
Manyung / Giant Catfish 21 035 12 894 10 977 21 889
Pari / Rays 3 377 1 490 2 352 3 167
Peperek / Pony Fishes 14 006 1 880 2 825 2 605
Pinjalo / Goldenbanded Jobfish - - 26 79
Rejung / Silver Silago 199 199 3 630
Selanget / Chacunda 839 481 533 969
Selar / Trevalies 22 413 19 641 17 972 19 049
Senuk / Pickhandle Barracuda - - - -
Serinding Tembakau / Red Big Eye - - - -
Setuhuk / Marlin 55 286 651 356
Siro / Spolted Sardinella 8 167 2 193 1 943 2 337
Slengseng / Spolted Chub Mackarel 50 58 60 172
Sunglir / Rainbow Runner 2 333 1 948 2 062 4 179
Swanggi / Big Eyes 2 486 1 353 1 712 1 503
Tembang / Fringescale Sardinella 20 461 20 629 18 627 16 734
Tenggiri Papan / Indo Pasific 1 636 1 276 3 443 1 384
Tenggiri / Norrow Barred 25 102 21 801 24 391 21 457
Teri / Anchovies 27 928 29 340 34 350 25 388
Terubuk / Tolishad 537 584 487 208
Tetengkek / Hard Tail Scads 17 304 7 352 7 594 17 474
Tongkol Komo / Eastern Little Tunas 39 699 47 273 32 907 33 016
Tuna Lainnya / Others Tunas 45 905 35 598 54 328 61 428
Lainnya / Others 84 784 91 340 67 256 219 921
JUMLAH / TOTAL 882 489 752 615 789 570 1 028 438
Lanjutan Tabel / Continued Table 3.14 k
Sumber : Statistik Perikanan Tangkap Indonesia 2007 - 2010, Kementerian Kelautan dan PerikananSource Capture Fisheries Statistics of Indonesia 2007 - 2010, Ministry of Marine Affairs and Fisheries
http://www.bps.go.id
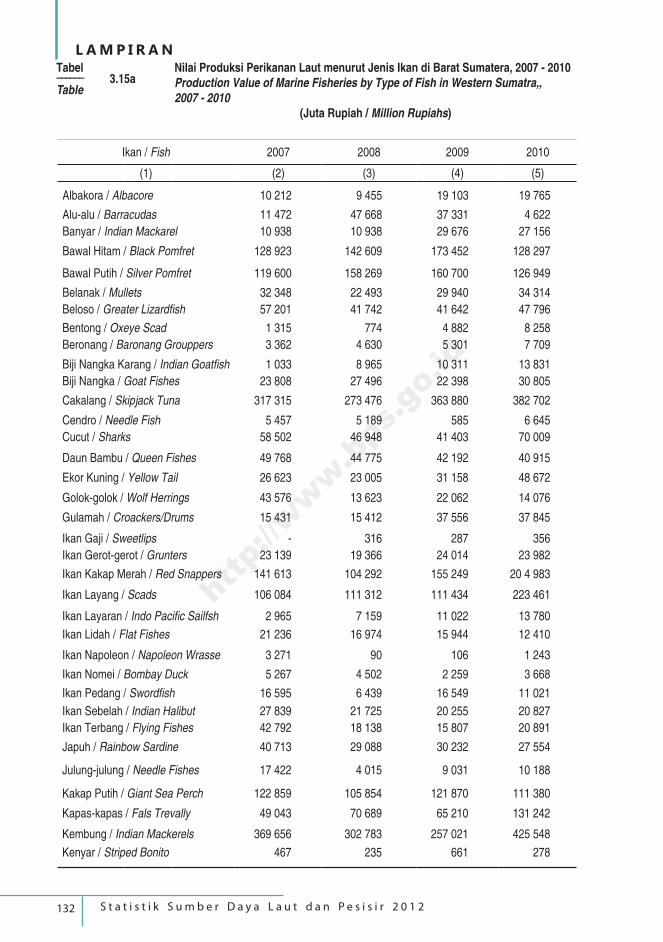
132 S t a t i s t i k S u m b e r D a y a L a u t d a n P e s i s i r 2 0 1 2
L A M P I R A N
Ikan / Fish 2007 2008 2009 2010
(1) (2) (3) (4) (5)
Albakora / Albacore 10 212 9 455 19 103 19 765
Alu-alu / Barracudas 11 472 47 668 37 331 4 622
Banyar / Indian Mackarel 10 938 10 938 29 676 27 156
Bawal Hitam / Black Pomfret 128 923 142 609 173 452 128 297
Bawal Putih / Silver Pomfret 119 600 158 269 160 700 126 949
Belanak / Mullets 32 348 22 493 29 940 34 314
Beloso / Greater Lizardfish 57 201 41 742 41 642 47 796
Bentong / Oxeye Scad 1 315 774 4 882 8 258
Beronang / Baronang Grouppers 3 362 4 630 5 301 7 709
Biji Nangka Karang / Indian Goatfish 1 033 8 965 10 311 13 831
Biji Nangka / Goat Fishes 23 808 27 496 22 398 30 805
Cakalang / Skipjack Tuna 317 315 273 476 363 880 382 702
Cendro / Needle Fish 5 457 5 189 585 6 645
Cucut / Sharks 58 502 46 948 41 403 70 009
Daun Bambu / Queen Fishes 49 768 44 775 42 192 40 915
Ekor Kuning / Yellow Tail 26 623 23 005 31 158 48 672
Golok-golok / Wolf Herrings 43 576 13 623 22 062 14 076
Gulamah / Croackers/Drums 15 431 15 412 37 556 37 845
Ikan Gaji / Sweetlips - 316 287 356
Ikan Gerot-gerot / Grunters 23 139 19 366 24 014 23 982
Ikan Kakap Merah / Red Snappers 141 613 104 292 155 249 20 4 983
Ikan Layang / Scads 106 084 111 312 111 434 223 461
Ikan Layaran / Indo Pacific Sailfsh 2 965 7 159 11 022 13 780
Ikan Lidah / Flat Fishes 21 236 16 974 15 944 12 410
Ikan Napoleon / Napoleon Wrasse 3 271 90 106 1 243
Ikan Nomei / Bombay Duck 5 267 4 502 2 259 3 668
Ikan Pedang / Swordfish 16 595 6 439 16 549 11 021
Ikan Sebelah / Indian Halibut 27 839 21 725 20 255 20 827
Ikan Terbang / Flying Fishes 42 792 18 138 15 807 20 891
Japuh / Rainbow Sardine 40 713 29 088 30 232 27 554
Julung-julung / Needle Fishes 17 422 4 015 9 031 10 188
Kakap Putih / Giant Sea Perch 122 859 105 854 121 870 111 380
Kapas-kapas / Fals Trevally 49 043 70 689 65 210 131 242
Kembung / Indian Mackerels 369 656 302 783 257 021 425 548
Kenyar / Striped Bonito 467 235 661 278
Tabel –––––– 3.15aTable
Nilai Produksi Perikanan Laut menurut Jenis Ikan di Barat Sumatera, 2007 - 2010Production Value of Marine Fisheries by Type of Fish in Western Sumatra,,2007 - 2010
(Juta Rupiah / Million Rupiahs)
http://www.bps.go.id
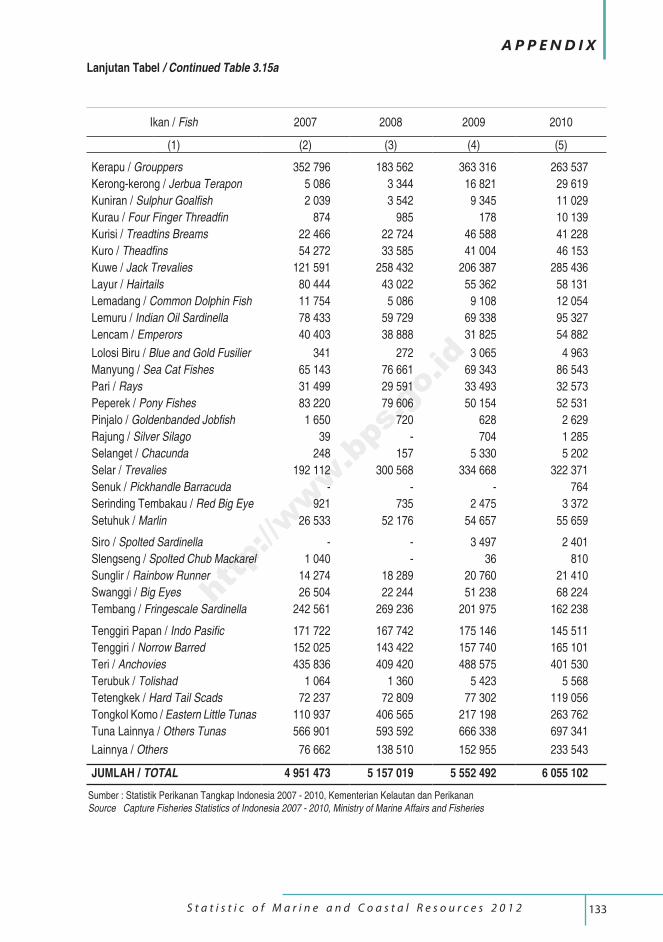
133 S t a t i s t i c o f M a r i n e a n d C o a s t a l R e s o u r c e s 2 0 1 2
A P P E N D I X
Ikan / Fish 2007 2008 2009 2010
(1) (2) (3) (4) (5)
Kerapu / Grouppers 352 796 183 562 363 316 263 537
Kerong-kerong / Jerbua Terapon 5 086 3 344 16 821 29 619
Kuniran / Sulphur Goalfish 2 039 3 542 9 345 11 029
Kurau / Four Finger Threadfin 874 985 178 10 139
Kurisi / Treadtins Breams 22 466 22 724 46 588 41 228
Kuro / Theadfins 54 272 33 585 41 004 46 153
Kuwe / Jack Trevalies 121 591 258 432 206 387 285 436
Layur / Hairtails 80 444 43 022 55 362 58 131
Lemadang / Common Dolphin Fish 11 754 5 086 9 108 12 054
Lemuru / Indian Oil Sardinella 78 433 59 729 69 338 95 327
Lencam / Emperors 40 403 38 888 31 825 54 882
Lolosi Biru / Blue and Gold Fusilier 341 272 3 065 4 963
Manyung / Sea Cat Fishes 65 143 76 661 69 343 86 543
Pari / Rays 31 499 29 591 33 493 32 573
Peperek / Pony Fishes 83 220 79 606 50 154 52 531
Pinjalo / Goldenbanded Jobfish 1 650 720 628 2 629
Rajung / Silver Silago 39 - 704 1 285
Selanget / Chacunda 248 157 5 330 5 202
Selar / Trevalies 192 112 300 568 334 668 322 371
Senuk / Pickhandle Barracuda - - - 764
Serinding Tembakau / Red Big Eye 921 735 2 475 3 372
Setuhuk / Marlin 26 533 52 176 54 657 55 659
Siro / Spolted Sardinella - - 3 497 2 401
Slengseng / Spolted Chub Mackarel 1 040 - 36 810
Sunglir / Rainbow Runner 14 274 18 289 20 760 21 410
Swanggi / Big Eyes 26 504 22 244 51 238 68 224
Tembang / Fringescale Sardinella 242 561 269 236 201 975 162 238
Tenggiri Papan / Indo Pasific 171 722 167 742 175 146 145 511
Tenggiri / Norrow Barred 152 025 143 422 157 740 165 101
Teri / Anchovies 435 836 409 420 488 575 401 530
Terubuk / Tolishad 1 064 1 360 5 423 5 568
Tetengkek / Hard Tail Scads 72 237 72 809 77 302 119 056
Tongkol Komo / Eastern Little Tunas 110 937 406 565 217 198 263 762
Tuna Lainnya / Others Tunas 566 901 593 592 666 338 697 341
Lainnya / Others 76 662 138 510 152 955 233 543
JUMLAH / TOTAL 4 951 473 5 157 019 5 552 492 6 055 102
Lanjutan Tabel / Continued Table 3.15a
Sumber : Statistik Perikanan Tangkap Indonesia 2007 - 2010, Kementerian Kelautan dan PerikananSource Capture Fisheries Statistics of Indonesia 2007 - 2010, Ministry of Marine Affairs and Fisheries
http://www.bps.go.id
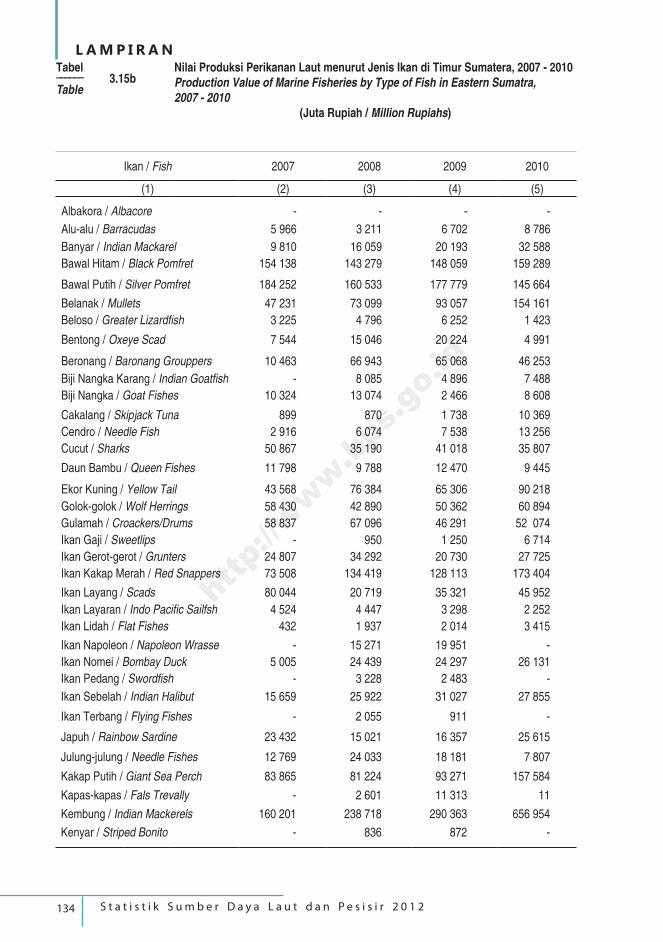
134 S t a t i s t i k S u m b e r D a y a L a u t d a n P e s i s i r 2 0 1 2
L A M P I R A N
Ikan / Fish 2007 2008 2009 2010
(1) (2) (3) (4) (5)
Albakora / Albacore - - - -
Alu-alu / Barracudas 5 966 3 211 6 702 8 786
Banyar / Indian Mackarel 9 810 16 059 20 193 32 588
Bawal Hitam / Black Pomfret 154 138 143 279 148 059 159 289
Bawal Putih / Silver Pomfret 184 252 160 533 177 779 145 664
Belanak / Mullets 47 231 73 099 93 057 154 161
Beloso / Greater Lizardfish 3 225 4 796 6 252 1 423
Bentong / Oxeye Scad 7 544 15 046 20 224 4 991
Beronang / Baronang Grouppers 10 463 66 943 65 068 46 253
Biji Nangka Karang / Indian Goatfish - 8 085 4 896 7 488
Biji Nangka / Goat Fishes 10 324 13 074 2 466 8 608
Cakalang / Skipjack Tuna 899 870 1 738 10 369
Cendro / Needle Fish 2 916 6 074 7 538 13 256
Cucut / Sharks 50 867 35 190 41 018 35 807
Daun Bambu / Queen Fishes 11 798 9 788 12 470 9 445
Ekor Kuning / Yellow Tail 43 568 76 384 65 306 90 218
Golok-golok / Wolf Herrings 58 430 42 890 50 362 60 894
Gulamah / Croackers/Drums 58 837 67 096 46 291 52 074
Ikan Gaji / Sweetlips - 950 1 250 6 714
Ikan Gerot-gerot / Grunters 24 807 34 292 20 730 27 725
Ikan Kakap Merah / Red Snappers 73 508 134 419 128 113 173 404
Ikan Layang / Scads 80 044 20 719 35 321 45 952
Ikan Layaran / Indo Pacific Sailfsh 4 524 4 447 3 298 2 252
Ikan Lidah / Flat Fishes 432 1 937 2 014 3 415
Ikan Napoleon / Napoleon Wrasse - 15 271 19 951 -
Ikan Nomei / Bombay Duck 5 005 24 439 24 297 26 131
Ikan Pedang / Swordfish - 3 228 2 483 -
Ikan Sebelah / Indian Halibut 15 659 25 922 31 027 27 855
Ikan Terbang / Flying Fishes - 2 055 911 -
Japuh / Rainbow Sardine 23 432 15 021 16 357 25 615
Julung-julung / Needle Fishes 12 769 24 033 18 181 7 807
Kakap Putih / Giant Sea Perch 83 865 81 224 93 271 157 584
Kapas-kapas / Fals Trevally - 2 601 11 313 11
Kembung / Indian Mackerels 160 201 238 718 290 363 656 954
Kenyar / Striped Bonito - 836 872 -
Tabel –––––– 3.15bTable
Nilai Produksi Perikanan Laut menurut Jenis Ikan di Timur Sumatera, 2007 - 2010Production Value of Marine Fisheries by Type of Fish in Eastern Sumatra,2007 - 2010
(Juta Rupiah / Million Rupiahs)
http://www.bps.go.id
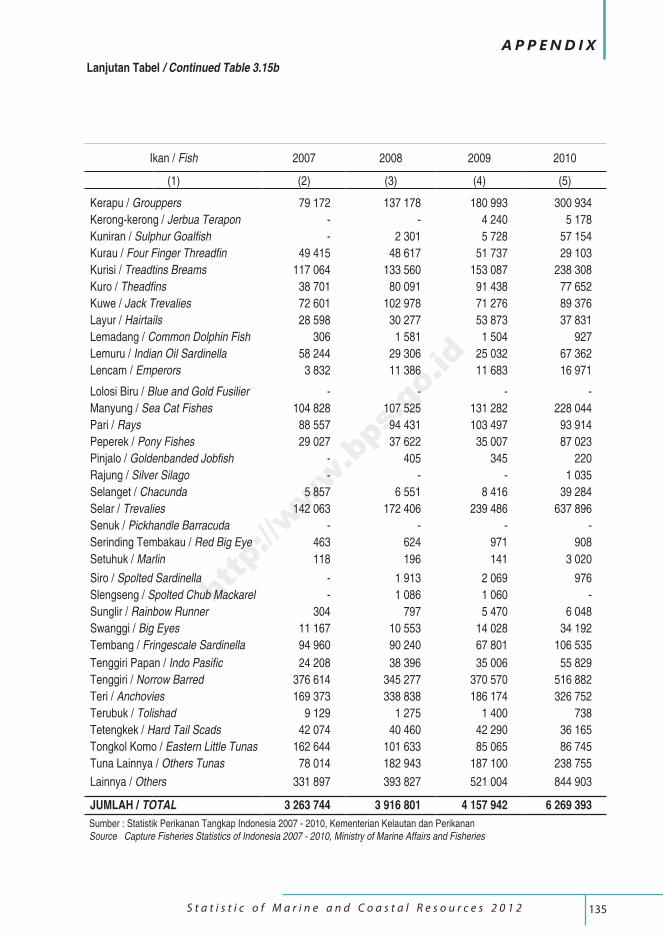
135 S t a t i s t i c o f M a r i n e a n d C o a s t a l R e s o u r c e s 2 0 1 2
A P P E N D I X
Ikan / Fish 2007 2008 2009 2010
(1) (2) (3) (4) (5)
Kerapu / Grouppers 79 172 137 178 180 993 300 934
Kerong-kerong / Jerbua Terapon - - 4 240 5 178
Kuniran / Sulphur Goalfish - 2 301 5 728 57 154
Kurau / Four Finger Threadfin 49 415 48 617 51 737 29 103
Kurisi / Treadtins Breams 117 064 133 560 153 087 238 308
Kuro / Theadfins 38 701 80 091 91 438 77 652
Kuwe / Jack Trevalies 72 601 102 978 71 276 89 376
Layur / Hairtails 28 598 30 277 53 873 37 831
Lemadang / Common Dolphin Fish 306 1 581 1 504 927
Lemuru / Indian Oil Sardinella 58 244 29 306 25 032 67 362
Lencam / Emperors 3 832 11 386 11 683 16 971
Lolosi Biru / Blue and Gold Fusilier - - - -
Manyung / Sea Cat Fishes 104 828 107 525 131 282 228 044
Pari / Rays 88 557 94 431 103 497 93 914
Peperek / Pony Fishes 29 027 37 622 35 007 87 023
Pinjalo / Goldenbanded Jobfish - 405 345 220
Rajung / Silver Silago - - - 1 035
Selanget / Chacunda 5 857 6 551 8 416 39 284
Selar / Trevalies 142 063 172 406 239 486 637 896
Senuk / Pickhandle Barracuda - - - -
Serinding Tembakau / Red Big Eye 463 624 971 908
Setuhuk / Marlin 118 196 141 3 020
Siro / Spolted Sardinella - 1 913 2 069 976
Slengseng / Spolted Chub Mackarel - 1 086 1 060 -
Sunglir / Rainbow Runner 304 797 5 470 6 048
Swanggi / Big Eyes 11 167 10 553 14 028 34 192
Tembang / Fringescale Sardinella 94 960 90 240 67 801 106 535
Tenggiri Papan / Indo Pasific 24 208 38 396 35 006 55 829
Tenggiri / Norrow Barred 376 614 345 277 370 570 516 882
Teri / Anchovies 169 373 338 838 186 174 326 752
Terubuk / Tolishad 9 129 1 275 1 400 738
Tetengkek / Hard Tail Scads 42 074 40 460 42 290 36 165
Tongkol Komo / Eastern Little Tunas 162 644 101 633 85 065 86 745
Tuna Lainnya / Others Tunas 78 014 182 943 187 100 238 755
Lainnya / Others 331 897 393 827 521 004 844 903
JUMLAH / TOTAL 3 263 744 3 916 801 4 157 942 6 269 393
Lanjutan Tabel / Continued Table 3.15b
Sumber : Statistik Perikanan Tangkap Indonesia 2007 - 2010, Kementerian Kelautan dan PerikananSource Capture Fisheries Statistics of Indonesia 2007 - 2010, Ministry of Marine Affairs and Fisheries
http://www.bps.go.id
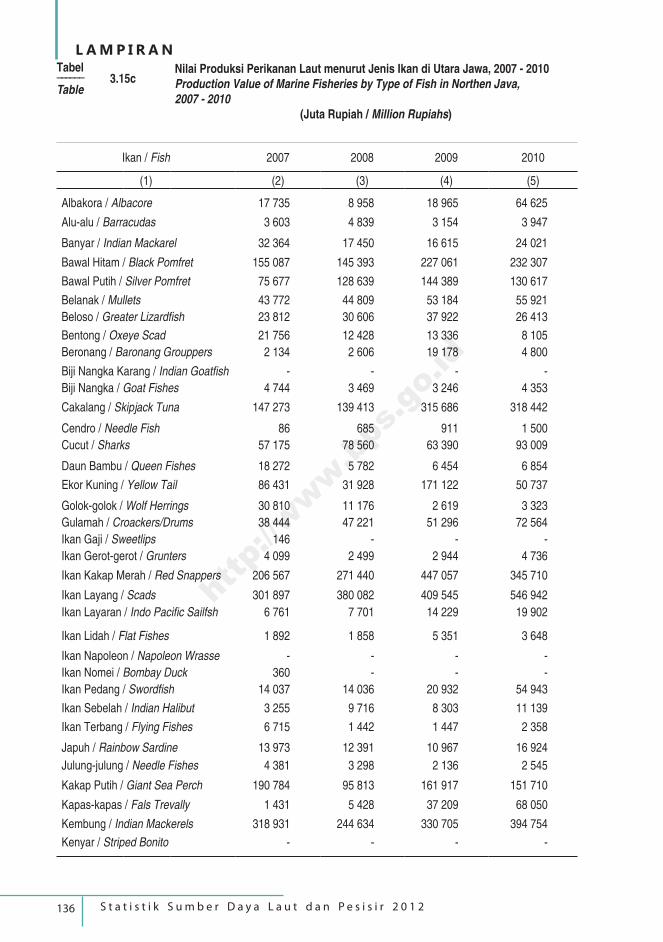
136 S t a t i s t i k S u m b e r D a y a L a u t d a n P e s i s i r 2 0 1 2
L A M P I R A N
Ikan / Fish 2007 2008 2009 2010
(1) (2) (3) (4) (5)
Albakora / Albacore 17 735 8 958 18 965 64 625
Alu-alu / Barracudas 3 603 4 839 3 154 3 947
Banyar / Indian Mackarel 32 364 17 450 16 615 24 021
Bawal Hitam / Black Pomfret 155 087 145 393 227 061 232 307
Bawal Putih / Silver Pomfret 75 677 128 639 144 389 130 617
Belanak / Mullets 43 772 44 809 53 184 55 921
Beloso / Greater Lizardfish 23 812 30 606 37 922 26 413
Bentong / Oxeye Scad 21 756 12 428 13 336 8 105
Beronang / Baronang Grouppers 2 134 2 606 19 178 4 800
Biji Nangka Karang / Indian Goatfish - - - -
Biji Nangka / Goat Fishes 4 744 3 469 3 246 4 353
Cakalang / Skipjack Tuna 147 273 139 413 315 686 318 442
Cendro / Needle Fish 86 685 911 1 500
Cucut / Sharks 57 175 78 560 63 390 93 009
Daun Bambu / Queen Fishes 18 272 5 782 6 454 6 854
Ekor Kuning / Yellow Tail 86 431 31 928 171 122 50 737
Golok-golok / Wolf Herrings 30 810 11 176 2 619 3 323
Gulamah / Croackers/Drums 38 444 47 221 51 296 72 564
Ikan Gaji / Sweetlips 146 - - -
Ikan Gerot-gerot / Grunters 4 099 2 499 2 944 4 736
Ikan Kakap Merah / Red Snappers 206 567 271 440 447 057 345 710
Ikan Layang / Scads 301 897 380 082 409 545 546 942
Ikan Layaran / Indo Pacific Sailfsh 6 761 7 701 14 229 19 902
Ikan Lidah / Flat Fishes 1 892 1 858 5 351 3 648
Ikan Napoleon / Napoleon Wrasse - - - -
Ikan Nomei / Bombay Duck 360 - - -
Ikan Pedang / Swordfish 14 037 14 036 20 932 54 943
Ikan Sebelah / Indian Halibut 3 255 9 716 8 303 11 139
Ikan Terbang / Flying Fishes 6 715 1 442 1 447 2 358
Japuh / Rainbow Sardine 13 973 12 391 10 967 16 924
Julung-julung / Needle Fishes 4 381 3 298 2 136 2 545
Kakap Putih / Giant Sea Perch 190 784 95 813 161 917 151 710
Kapas-kapas / Fals Trevally 1 431 5 428 37 209 68 050
Kembung / Indian Mackerels 318 931 244 634 330 705 394 754
Kenyar / Striped Bonito - - - -
Tabel –––––– 3.15cTable
Nilai Produksi Perikanan Laut menurut Jenis Ikan di Utara Jawa, 2007 - 2010Production Value of Marine Fisheries by Type of Fish in Northen Java,2007 - 2010
(Juta Rupiah / Million Rupiahs)
http://www.bps.go.id
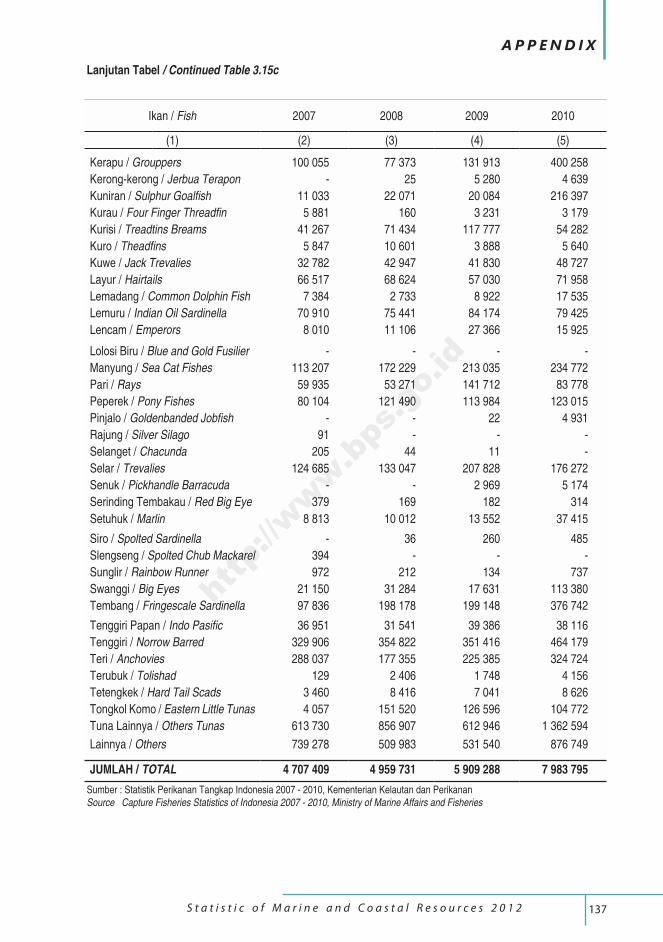
137 S t a t i s t i c o f M a r i n e a n d C o a s t a l R e s o u r c e s 2 0 1 2
A P P E N D I X
Ikan / Fish 2007 2008 2009 2010
(1) (2) (3) (4) (5)
Kerapu / Grouppers 100 055 77 373 131 913 400 258
Kerong-kerong / Jerbua Terapon - 25 5 280 4 639
Kuniran / Sulphur Goalfish 11 033 22 071 20 084 216 397
Kurau / Four Finger Threadfin 5 881 160 3 231 3 179
Kurisi / Treadtins Breams 41 267 71 434 117 777 54 282
Kuro / Theadfins 5 847 10 601 3 888 5 640
Kuwe / Jack Trevalies 32 782 42 947 41 830 48 727
Layur / Hairtails 66 517 68 624 57 030 71 958
Lemadang / Common Dolphin Fish 7 384 2 733 8 922 17 535
Lemuru / Indian Oil Sardinella 70 910 75 441 84 174 79 425
Lencam / Emperors 8 010 11 106 27 366 15 925
Lolosi Biru / Blue and Gold Fusilier - - - -
Manyung / Sea Cat Fishes 113 207 172 229 213 035 234 772
Pari / Rays 59 935 53 271 141 712 83 778
Peperek / Pony Fishes 80 104 121 490 113 984 123 015
Pinjalo / Goldenbanded Jobfish - - 22 4 931
Rajung / Silver Silago 91 - - -
Selanget / Chacunda 205 44 11 -
Selar / Trevalies 124 685 133 047 207 828 176 272
Senuk / Pickhandle Barracuda - - 2 969 5 174
Serinding Tembakau / Red Big Eye 379 169 182 314
Setuhuk / Marlin 8 813 10 012 13 552 37 415
Siro / Spolted Sardinella - 36 260 485
Slengseng / Spolted Chub Mackarel 394 - - -
Sunglir / Rainbow Runner 972 212 134 737
Swanggi / Big Eyes 21 150 31 284 17 631 113 380
Tembang / Fringescale Sardinella 97 836 198 178 199 148 376 742
Tenggiri Papan / Indo Pasific 36 951 31 541 39 386 38 116
Tenggiri / Norrow Barred 329 906 354 822 351 416 464 179
Teri / Anchovies 288 037 177 355 225 385 324 724
Terubuk / Tolishad 129 2 406 1 748 4 156
Tetengkek / Hard Tail Scads 3 460 8 416 7 041 8 626
Tongkol Komo / Eastern Little Tunas 4 057 151 520 126 596 104 772
Tuna Lainnya / Others Tunas 613 730 856 907 612 946 1 362 594
Lainnya / Others 739 278 509 983 531 540 876 749
JUMLAH / TOTAL 4 707 409 4 959 731 5 909 288 7 983 795
Lanjutan Tabel / Continued Table 3.15c
Sumber : Statistik Perikanan Tangkap Indonesia 2007 - 2010, Kementerian Kelautan dan PerikananSource Capture Fisheries Statistics of Indonesia 2007 - 2010, Ministry of Marine Affairs and Fisheries
http://www.bps.go.id
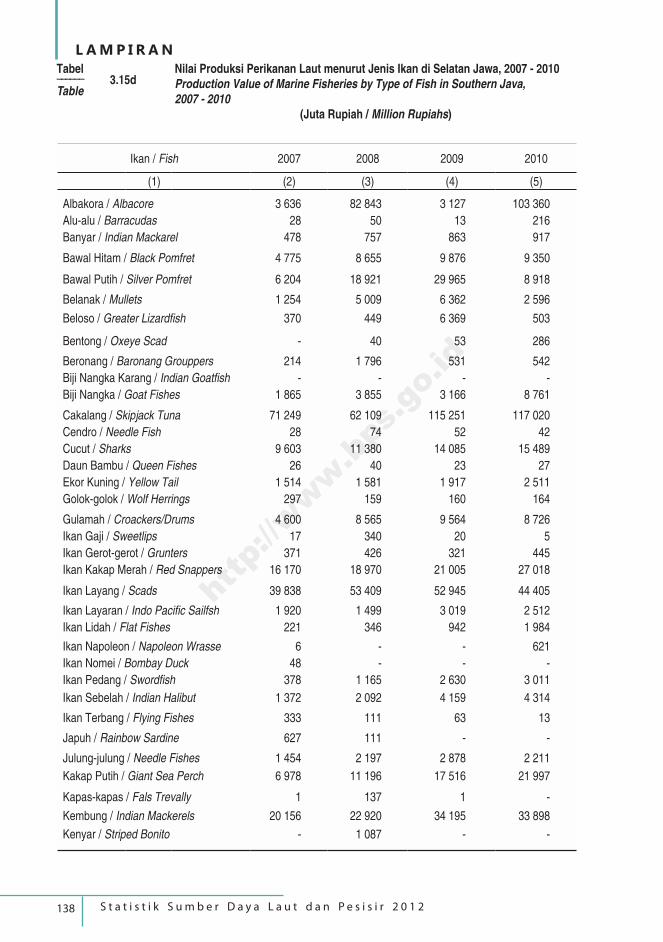
138 S t a t i s t i k S u m b e r D a y a L a u t d a n P e s i s i r 2 0 1 2
L A M P I R A N
Ikan / Fish 2007 2008 2009 2010
(1) (2) (3) (4) (5)
Albakora / Albacore 3 636 82 843 3 127 103 360
Alu-alu / Barracudas 28 50 13 216
Banyar / Indian Mackarel 478 757 863 917
Bawal Hitam / Black Pomfret 4 775 8 655 9 876 9 350
Bawal Putih / Silver Pomfret 6 204 18 921 29 965 8 918
Belanak / Mullets 1 254 5 009 6 362 2 596
Beloso / Greater Lizardfish 370 449 6 369 503
Bentong / Oxeye Scad - 40 53 286
Beronang / Baronang Grouppers 214 1 796 531 542
Biji Nangka Karang / Indian Goatfish - - - -
Biji Nangka / Goat Fishes 1 865 3 855 3 166 8 761
Cakalang / Skipjack Tuna 71 249 62 109 115 251 117 020
Cendro / Needle Fish 28 74 52 42
Cucut / Sharks 9 603 11 380 14 085 15 489
Daun Bambu / Queen Fishes 26 40 23 27
Ekor Kuning / Yellow Tail 1 514 1 581 1 917 2 511
Golok-golok / Wolf Herrings 297 159 160 164
Gulamah / Croackers/Drums 4 600 8 565 9 564 8 726
Ikan Gaji / Sweetlips 17 340 20 5
Ikan Gerot-gerot / Grunters 371 426 321 445
Ikan Kakap Merah / Red Snappers 16 170 18 970 21 005 27 018
Ikan Layang / Scads 39 838 53 409 52 945 44 405
Ikan Layaran / Indo Pacific Sailfsh 1 920 1 499 3 019 2 512
Ikan Lidah / Flat Fishes 221 346 942 1 984
Ikan Napoleon / Napoleon Wrasse 6 - - 621
Ikan Nomei / Bombay Duck 48 - - -
Ikan Pedang / Swordfish 378 1 165 2 630 3 011
Ikan Sebelah / Indian Halibut 1 372 2 092 4 159 4 314
Ikan Terbang / Flying Fishes 333 111 63 13
Japuh / Rainbow Sardine 627 111 - -
Julung-julung / Needle Fishes 1 454 2 197 2 878 2 211
Kakap Putih / Giant Sea Perch 6 978 11 196 17 516 21 997
Kapas-kapas / Fals Trevally 1 137 1 -
Kembung / Indian Mackerels 20 156 22 920 34 195 33 898
Kenyar / Striped Bonito - 1 087 - -
Tabel –––––– 3.15dTable
Nilai Produksi Perikanan Laut menurut Jenis Ikan di Selatan Jawa, 2007 - 2010Production Value of Marine Fisheries by Type of Fish in Southern Java,2007 - 2010
(Juta Rupiah / Million Rupiahs)
http://www.bps.go.id
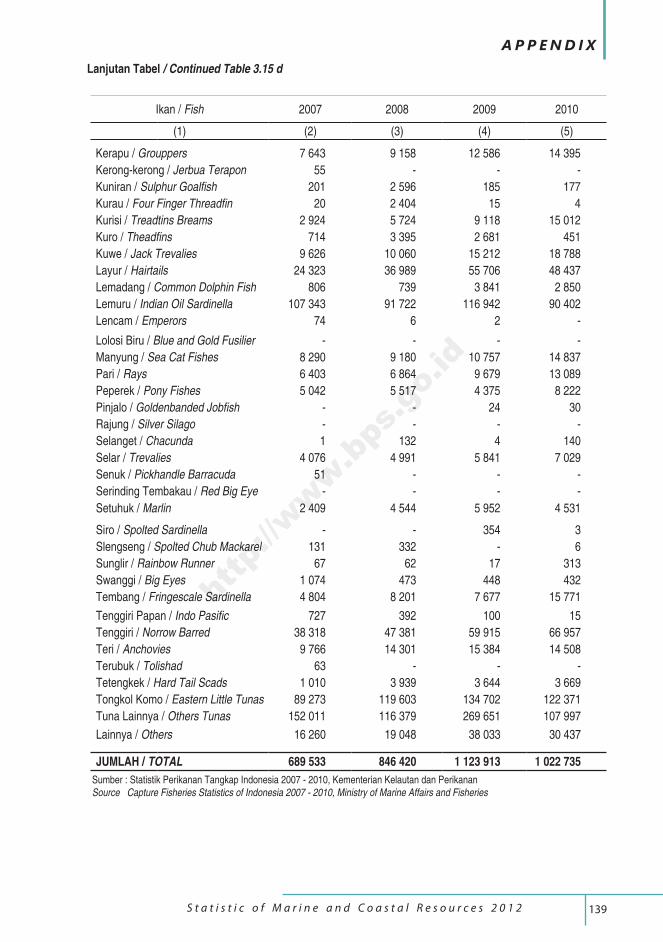
139 S t a t i s t i c o f M a r i n e a n d C o a s t a l R e s o u r c e s 2 0 1 2
A P P E N D I X
Ikan / Fish 2007 2008 2009 2010
(1) (2) (3) (4) (5)
Kerapu / Grouppers 7 643 9 158 12 586 14 395
Kerong-kerong / Jerbua Terapon 55 - - -
Kuniran / Sulphur Goalfish 201 2 596 185 177
Kurau / Four Finger Threadfin 20 2 404 15 4
Kurisi / Treadtins Breams 2 924 5 724 9 118 15 012
Kuro / Theadfins 714 3 395 2 681 451
Kuwe / Jack Trevalies 9 626 10 060 15 212 18 788
Layur / Hairtails 24 323 36 989 55 706 48 437
Lemadang / Common Dolphin Fish 806 739 3 841 2 850
Lemuru / Indian Oil Sardinella 107 343 91 722 116 942 90 402
Lencam / Emperors 74 6 2 -
Lolosi Biru / Blue and Gold Fusilier - - - -
Manyung / Sea Cat Fishes 8 290 9 180 10 757 14 837
Pari / Rays 6 403 6 864 9 679 13 089
Peperek / Pony Fishes 5 042 5 517 4 375 8 222
Pinjalo / Goldenbanded Jobfish - - 24 30
Rajung / Silver Silago - - - -
Selanget / Chacunda 1 132 4 140
Selar / Trevalies 4 076 4 991 5 841 7 029
Senuk / Pickhandle Barracuda 51 - - -
Serinding Tembakau / Red Big Eye - - - -
Setuhuk / Marlin 2 409 4 544 5 952 4 531
Siro / Spolted Sardinella - - 354 3
Slengseng / Spolted Chub Mackarel 131 332 - 6
Sunglir / Rainbow Runner 67 62 17 313
Swanggi / Big Eyes 1 074 473 448 432
Tembang / Fringescale Sardinella 4 804 8 201 7 677 15 771
Tenggiri Papan / Indo Pasific 727 392 100 15
Tenggiri / Norrow Barred 38 318 47 381 59 915 66 957
Teri / Anchovies 9 766 14 301 15 384 14 508
Terubuk / Tolishad 63 - - -
Tetengkek / Hard Tail Scads 1 010 3 939 3 644 3 669
Tongkol Komo / Eastern Little Tunas 89 273 119 603 134 702 122 371
Tuna Lainnya / Others Tunas 152 011 116 379 269 651 107 997
Lainnya / Others 16 260 19 048 38 033 30 437
JUMLAH / TOTAL 689 533 846 420 1 123 913 1 022 735
Lanjutan Tabel / Continued Table 3.15 d
Sumber : Statistik Perikanan Tangkap Indonesia 2007 - 2010, Kementerian Kelautan dan PerikananSource Capture Fisheries Statistics of Indonesia 2007 - 2010, Ministry of Marine Affairs and Fisheries
http://www.bps.go.id
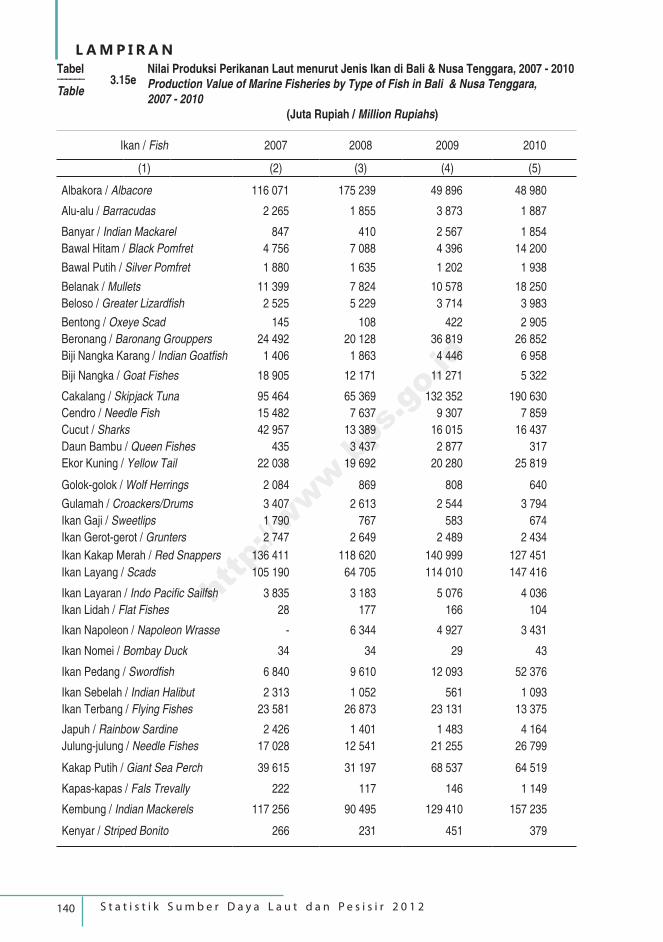
140 S t a t i s t i k S u m b e r D a y a L a u t d a n P e s i s i r 2 0 1 2
L A M P I R A N
Ikan / Fish 2007 2008 2009 2010
(1) (2) (3) (4) (5)
Albakora / Albacore 116 071 175 239 49 896 48 980
Alu-alu / Barracudas 2 265 1 855 3 873 1 887
Banyar / Indian Mackarel 847 410 2 567 1 854
Bawal Hitam / Black Pomfret 4 756 7 088 4 396 14 200
Bawal Putih / Silver Pomfret 1 880 1 635 1 202 1 938
Belanak / Mullets 11 399 7 824 10 578 18 250
Beloso / Greater Lizardfish 2 525 5 229 3 714 3 983
Bentong / Oxeye Scad 145 108 422 2 905
Beronang / Baronang Grouppers 24 492 20 128 36 819 26 852
Biji Nangka Karang / Indian Goatfish 1 406 1 863 4 446 6 958
Biji Nangka / Goat Fishes 18 905 12 171 11 271 5 322
Cakalang / Skipjack Tuna 95 464 65 369 132 352 190 630
Cendro / Needle Fish 15 482 7 637 9 307 7 859
Cucut / Sharks 42 957 13 389 16 015 16 437
Daun Bambu / Queen Fishes 435 3 437 2 877 317
Ekor Kuning / Yellow Tail 22 038 19 692 20 280 25 819
Golok-golok / Wolf Herrings 2 084 869 808 640
Gulamah / Croackers/Drums 3 407 2 613 2 544 3 794
Ikan Gaji / Sweetlips 1 790 767 583 674
Ikan Gerot-gerot / Grunters 2 747 2 649 2 489 2 434
Ikan Kakap Merah / Red Snappers 136 411 118 620 140 999 127 451
Ikan Layang / Scads 105 190 64 705 114 010 147 416
Ikan Layaran / Indo Pacific Sailfsh 3 835 3 183 5 076 4 036
Ikan Lidah / Flat Fishes 28 177 166 104
Ikan Napoleon / Napoleon Wrasse - 6 344 4 927 3 431
Ikan Nomei / Bombay Duck 34 34 29 43
Ikan Pedang / Swordfish 6 840 9 610 12 093 52 376
Ikan Sebelah / Indian Halibut 2 313 1 052 561 1 093
Ikan Terbang / Flying Fishes 23 581 26 873 23 131 13 375
Japuh / Rainbow Sardine 2 426 1 401 1 483 4 164
Julung-julung / Needle Fishes 17 028 12 541 21 255 26 799
Kakap Putih / Giant Sea Perch 39 615 31 197 68 537 64 519
Kapas-kapas / Fals Trevally 222 117 146 1 149
Kembung / Indian Mackerels 117 256 90 495 129 410 157 235
Kenyar / Striped Bonito 266 231 451 379
Tabel –––––– 3.15eTable
Nilai Produksi Perikanan Laut menurut Jenis Ikan di Bali & Nusa Tenggara, 2007 - 2010Production Value of Marine Fisheries by Type of Fish in Bali & Nusa Tenggara, 2007 - 2010
(Juta Rupiah / Million Rupiahs)
http://www.bps.go.id
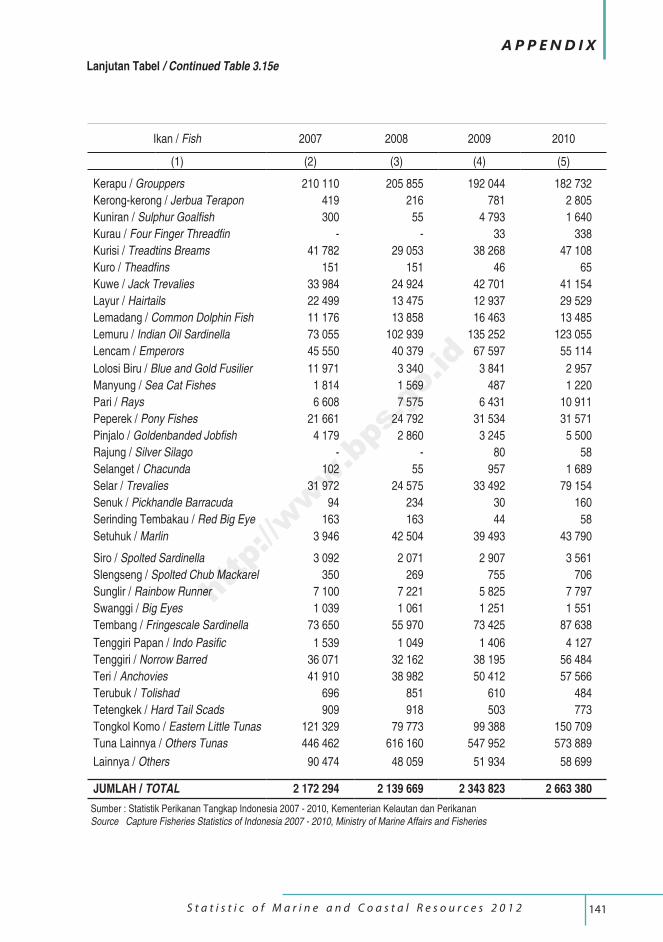
141 S t a t i s t i c o f M a r i n e a n d C o a s t a l R e s o u r c e s 2 0 1 2
A P P E N D I X
Ikan / Fish 2007 2008 2009 2010
(1) (2) (3) (4) (5)
Kerapu / Grouppers 210 110 205 855 192 044 182 732
Kerong-kerong / Jerbua Terapon 419 216 781 2 805
Kuniran / Sulphur Goalfish 300 55 4 793 1 640
Kurau / Four Finger Threadfin - - 33 338
Kurisi / Treadtins Breams 41 782 29 053 38 268 47 108
Kuro / Theadfins 151 151 46 65
Kuwe / Jack Trevalies 33 984 24 924 42 701 41 154
Layur / Hairtails 22 499 13 475 12 937 29 529
Lemadang / Common Dolphin Fish 11 176 13 858 16 463 13 485
Lemuru / Indian Oil Sardinella 73 055 102 939 135 252 123 055
Lencam / Emperors 45 550 40 379 67 597 55 114
Lolosi Biru / Blue and Gold Fusilier 11 971 3 340 3 841 2 957
Manyung / Sea Cat Fishes 1 814 1 569 487 1 220
Pari / Rays 6 608 7 575 6 431 10 911
Peperek / Pony Fishes 21 661 24 792 31 534 31 571
Pinjalo / Goldenbanded Jobfish 4 179 2 860 3 245 5 500
Rajung / Silver Silago - - 80 58
Selanget / Chacunda 102 55 957 1 689
Selar / Trevalies 31 972 24 575 33 492 79 154
Senuk / Pickhandle Barracuda 94 234 30 160
Serinding Tembakau / Red Big Eye 163 163 44 58
Setuhuk / Marlin 3 946 42 504 39 493 43 790
Siro / Spolted Sardinella 3 092 2 071 2 907 3 561
Slengseng / Spolted Chub Mackarel 350 269 755 706
Sunglir / Rainbow Runner 7 100 7 221 5 825 7 797
Swanggi / Big Eyes 1 039 1 061 1 251 1 551
Tembang / Fringescale Sardinella 73 650 55 970 73 425 87 638
Tenggiri Papan / Indo Pasific 1 539 1 049 1 406 4 127
Tenggiri / Norrow Barred 36 071 32 162 38 195 56 484
Teri / Anchovies 41 910 38 982 50 412 57 566
Terubuk / Tolishad 696 851 610 484
Tetengkek / Hard Tail Scads 909 918 503 773
Tongkol Komo / Eastern Little Tunas 121 329 79 773 99 388 150 709
Tuna Lainnya / Others Tunas 446 462 616 160 547 952 573 889
Lainnya / Others 90 474 48 059 51 934 58 699
JUMLAH / TOTAL 2 172 294 2 139 669 2 343 823 2 663 380
Lanjutan Tabel / Continued Table 3.15e
Sumber : Statistik Perikanan Tangkap Indonesia 2007 - 2010, Kementerian Kelautan dan PerikananSource Capture Fisheries Statistics of Indonesia 2007 - 2010, Ministry of Marine Affairs and Fisheries
http://www.bps.go.id
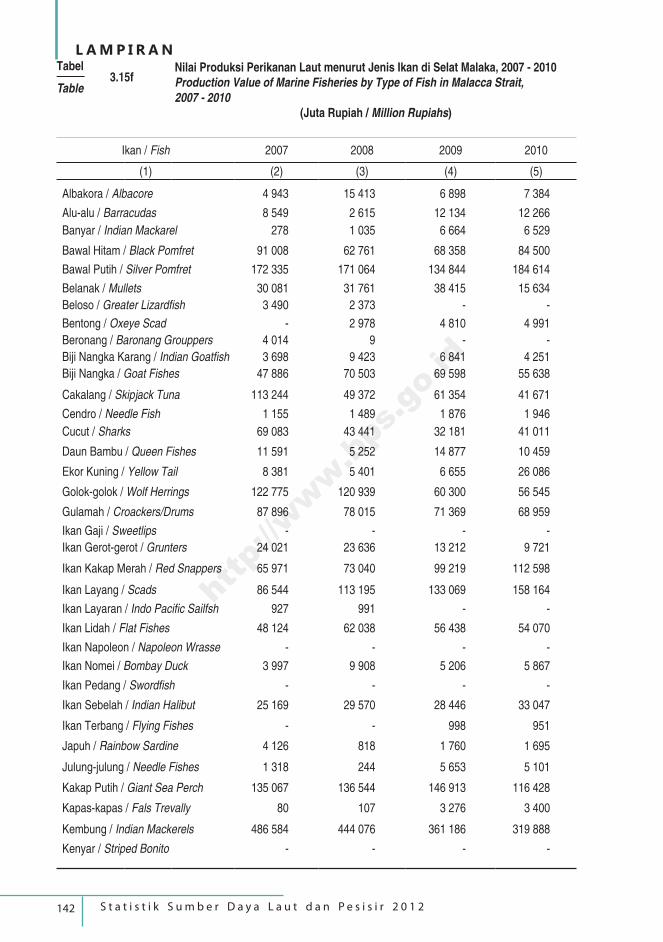
142 S t a t i s t i k S u m b e r D a y a L a u t d a n P e s i s i r 2 0 1 2
L A M P I R A N
Ikan / Fish 2007 2008 2009 2010
(1) (2) (3) (4) (5)
Albakora / Albacore 4 943 15 413 6 898 7 384
Alu-alu / Barracudas 8 549 2 615 12 134 12 266
Banyar / Indian Mackarel 278 1 035 6 664 6 529
Bawal Hitam / Black Pomfret 91 008 62 761 68 358 84 500
Bawal Putih / Silver Pomfret 172 335 171 064 134 844 184 614
Belanak / Mullets 30 081 31 761 38 415 15 634
Beloso / Greater Lizardfish 3 490 2 373 - -
Bentong / Oxeye Scad - 2 978 4 810 4 991
Beronang / Baronang Grouppers 4 014 9 - -
Biji Nangka Karang / Indian Goatfish 3 698 9 423 6 841 4 251
Biji Nangka / Goat Fishes 47 886 70 503 69 598 55 638
Cakalang / Skipjack Tuna 113 244 49 372 61 354 41 671
Cendro / Needle Fish 1 155 1 489 1 876 1 946
Cucut / Sharks 69 083 43 441 32 181 41 011
Daun Bambu / Queen Fishes 11 591 5 252 14 877 10 459
Ekor Kuning / Yellow Tail 8 381 5 401 6 655 26 086
Golok-golok / Wolf Herrings 122 775 120 939 60 300 56 545
Gulamah / Croackers/Drums 87 896 78 015 71 369 68 959
Ikan Gaji / Sweetlips - - - -
Ikan Gerot-gerot / Grunters 24 021 23 636 13 212 9 721
Ikan Kakap Merah / Red Snappers 65 971 73 040 99 219 112 598
Ikan Layang / Scads 86 544 113 195 133 069 158 164
Ikan Layaran / Indo Pacific Sailfsh 927 991 - -
Ikan Lidah / Flat Fishes 48 124 62 038 56 438 54 070
Ikan Napoleon / Napoleon Wrasse - - - -
Ikan Nomei / Bombay Duck 3 997 9 908 5 206 5 867
Ikan Pedang / Swordfish - - - -
Ikan Sebelah / Indian Halibut 25 169 29 570 28 446 33 047
Ikan Terbang / Flying Fishes - - 998 951
Japuh / Rainbow Sardine 4 126 818 1 760 1 695
Julung-julung / Needle Fishes 1 318 244 5 653 5 101
Kakap Putih / Giant Sea Perch 135 067 136 544 146 913 116 428
Kapas-kapas / Fals Trevally 80 107 3 276 3 400
Kembung / Indian Mackerels 486 584 444 076 361 186 319 888
Kenyar / Striped Bonito - - - -
Tabel –––––– 3.15fTable
Nilai Produksi Perikanan Laut menurut Jenis Ikan di Selat Malaka, 2007 - 2010Production Value of Marine Fisheries by Type of Fish in Malacca Strait,2007 - 2010
(Juta Rupiah / Million Rupiahs)
http://www.bps.go.id
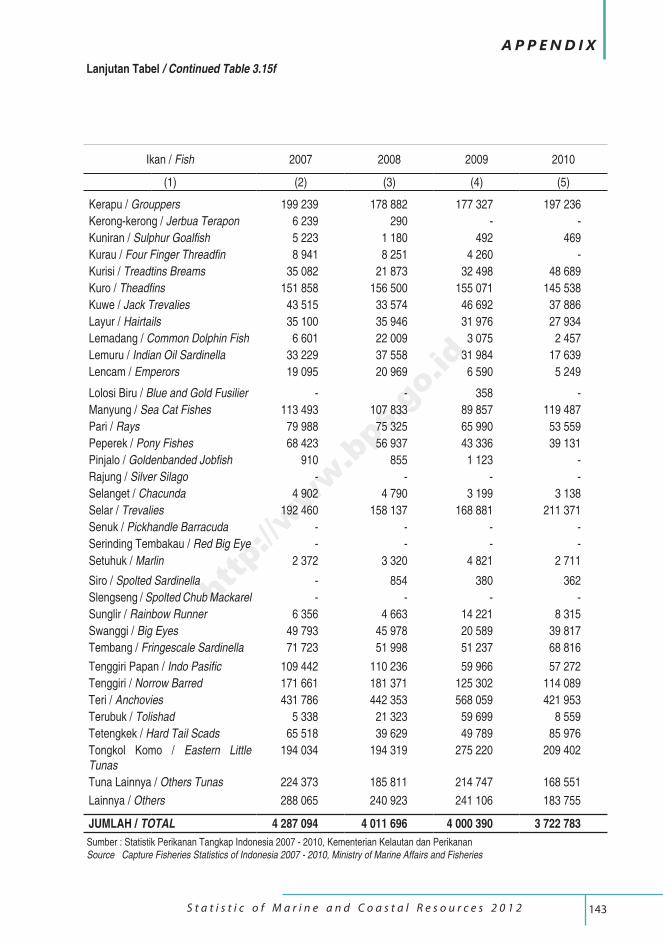
143 S t a t i s t i c o f M a r i n e a n d C o a s t a l R e s o u r c e s 2 0 1 2
A P P E N D I X
Ikan / Fish 2007 2008 2009 2010
(1) (2) (3) (4) (5)
Kerapu / Grouppers 199 239 178 882 177 327 197 236
Kerong-kerong / Jerbua Terapon 6 239 290 - -
Kuniran / Sulphur Goalfish 5 223 1 180 492 469
Kurau / Four Finger Threadfin 8 941 8 251 4 260 -
Kurisi / Treadtins Breams 35 082 21 873 32 498 48 689
Kuro / Theadfins 151 858 156 500 155 071 145 538
Kuwe / Jack Trevalies 43 515 33 574 46 692 37 886
Layur / Hairtails 35 100 35 946 31 976 27 934
Lemadang / Common Dolphin Fish 6 601 22 009 3 075 2 457
Lemuru / Indian Oil Sardinella 33 229 37 558 31 984 17 639
Lencam / Emperors 19 095 20 969 6 590 5 249
Lolosi Biru / Blue and Gold Fusilier - - 358 -
Manyung / Sea Cat Fishes 113 493 107 833 89 857 119 487
Pari / Rays 79 988 75 325 65 990 53 559
Peperek / Pony Fishes 68 423 56 937 43 336 39 131
Pinjalo / Goldenbanded Jobfish 910 855 1 123 -
Rajung / Silver Silago - - - -
Selanget / Chacunda 4 902 4 790 3 199 3 138
Selar / Trevalies 192 460 158 137 168 881 211 371
Senuk / Pickhandle Barracuda - - - -
Serinding Tembakau / Red Big Eye - - - -
Setuhuk / Marlin 2 372 3 320 4 821 2 711
Siro / Spolted Sardinella - 854 380 362
Slengseng / Spolted Chub Mackarel - - - -
Sunglir / Rainbow Runner 6 356 4 663 14 221 8 315
Swanggi / Big Eyes 49 793 45 978 20 589 39 817
Tembang / Fringescale Sardinella 71 723 51 998 51 237 68 816
Tenggiri Papan / Indo Pasific 109 442 110 236 59 966 57 272
Tenggiri / Norrow Barred 171 661 181 371 125 302 114 089
Teri / Anchovies 431 786 442 353 568 059 421 953
Terubuk / Tolishad 5 338 21 323 59 699 8 559
Tetengkek / Hard Tail Scads 65 518 39 629 49 789 85 976
Tongkol Komo / Eastern Little Tunas
194 034 194 319 275 220 209 402
Tuna Lainnya / Others Tunas 224 373 185 811 214 747 168 551
Lainnya / Others 288 065 240 923 241 106 183 755
JUMLAH / TOTAL 4 287 094 4 011 696 4 000 390 3 722 783
Lanjutan Tabel / Continued Table 3.15f
Sumber : Statistik Perikanan Tangkap Indonesia 2007 - 2010, Kementerian Kelautan dan PerikananSource Capture Fisheries Statistics of Indonesia 2007 - 2010, Ministry of Marine Affairs and Fisheries
http://www.bps.go.id
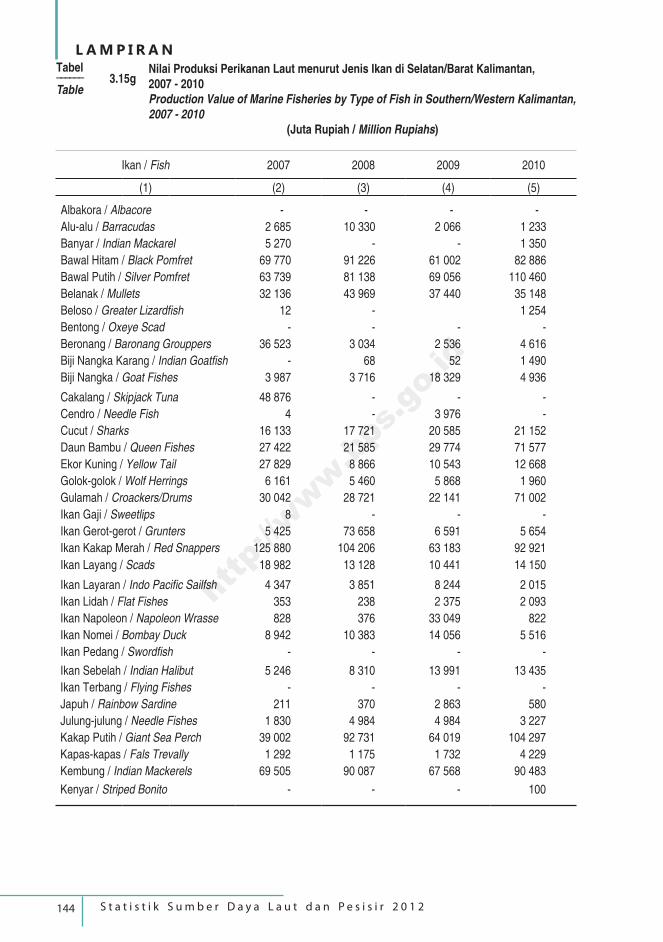
144 S t a t i s t i k S u m b e r D a y a L a u t d a n P e s i s i r 2 0 1 2
L A M P I R A N
Ikan / Fish 2007 2008 2009 2010
(1) (2) (3) (4) (5)
Albakora / Albacore - - - -
Alu-alu / Barracudas 2 685 10 330 2 066 1 233
Banyar / Indian Mackarel 5 270 - - 1 350
Bawal Hitam / Black Pomfret 69 770 91 226 61 002 82 886
Bawal Putih / Silver Pomfret 63 739 81 138 69 056 110 460
Belanak / Mullets 32 136 43 969 37 440 35 148
Beloso / Greater Lizardfish 12 - 1 254
Bentong / Oxeye Scad - - - -
Beronang / Baronang Grouppers 36 523 3 034 2 536 4 616
Biji Nangka Karang / Indian Goatfish - 68 52 1 490
Biji Nangka / Goat Fishes 3 987 3 716 18 329 4 936
Cakalang / Skipjack Tuna 48 876 - - -
Cendro / Needle Fish 4 - 3 976 -
Cucut / Sharks 16 133 17 721 20 585 21 152
Daun Bambu / Queen Fishes 27 422 21 585 29 774 71 577
Ekor Kuning / Yellow Tail 27 829 8 866 10 543 12 668
Golok-golok / Wolf Herrings 6 161 5 460 5 868 1 960
Gulamah / Croackers/Drums 30 042 28 721 22 141 71 002
Ikan Gaji / Sweetlips 8 - - -
Ikan Gerot-gerot / Grunters 5 425 73 658 6 591 5 654
Ikan Kakap Merah / Red Snappers 125 880 104 206 63 183 92 921
Ikan Layang / Scads 18 982 13 128 10 441 14 150
Ikan Layaran / Indo Pacific Sailfsh 4 347 3 851 8 244 2 015
Ikan Lidah / Flat Fishes 353 238 2 375 2 093
Ikan Napoleon / Napoleon Wrasse 828 376 33 049 822
Ikan Nomei / Bombay Duck 8 942 10 383 14 056 5 516
Ikan Pedang / Swordfish - - - -
Ikan Sebelah / Indian Halibut 5 246 8 310 13 991 13 435
Ikan Terbang / Flying Fishes - - - -
Japuh / Rainbow Sardine 211 370 2 863 580
Julung-julung / Needle Fishes 1 830 4 984 4 984 3 227
Kakap Putih / Giant Sea Perch 39 002 92 731 64 019 104 297
Kapas-kapas / Fals Trevally 1 292 1 175 1 732 4 229
Kembung / Indian Mackerels 69 505 90 087 67 568 90 483
Kenyar / Striped Bonito - - - 100
Tabel –––––– 3.15gTable
Nilai Produksi Perikanan Laut menurut Jenis Ikan di Selatan/Barat Kalimantan, 2007 - 2010Production Value of Marine Fisheries by Type of Fish in Southern/Western Kalimantan,2007 - 2010
(Juta Rupiah / Million Rupiahs)
http://www.bps.go.id
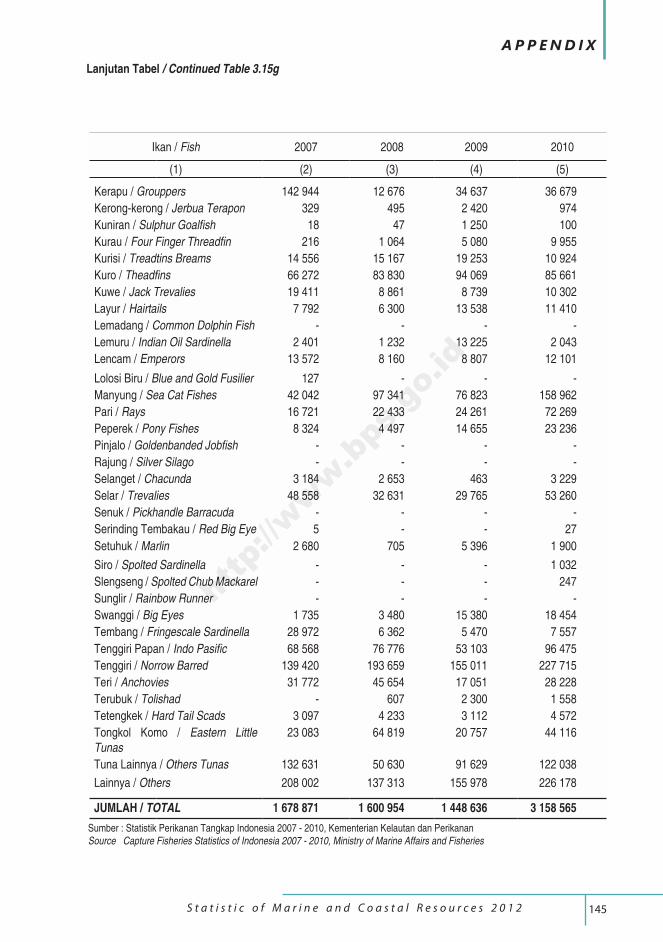
145 S t a t i s t i c o f M a r i n e a n d C o a s t a l R e s o u r c e s 2 0 1 2
A P P E N D I X
Ikan / Fish 2007 2008 2009 2010
(1) (2) (3) (4) (5)
Kerapu / Grouppers 142 944 12 676 34 637 36 679
Kerong-kerong / Jerbua Terapon 329 495 2 420 974
Kuniran / Sulphur Goalfish 18 47 1 250 100
Kurau / Four Finger Threadfin 216 1 064 5 080 9 955
Kurisi / Treadtins Breams 14 556 15 167 19 253 10 924
Kuro / Theadfins 66 272 83 830 94 069 85 661
Kuwe / Jack Trevalies 19 411 8 861 8 739 10 302
Layur / Hairtails 7 792 6 300 13 538 11 410
Lemadang / Common Dolphin Fish - - - -
Lemuru / Indian Oil Sardinella 2 401 1 232 13 225 2 043
Lencam / Emperors 13 572 8 160 8 807 12 101
Lolosi Biru / Blue and Gold Fusilier 127 - - -
Manyung / Sea Cat Fishes 42 042 97 341 76 823 158 962
Pari / Rays 16 721 22 433 24 261 72 269
Peperek / Pony Fishes 8 324 4 497 14 655 23 236
Pinjalo / Goldenbanded Jobfish - - - -
Rajung / Silver Silago - - - -
Selanget / Chacunda 3 184 2 653 463 3 229
Selar / Trevalies 48 558 32 631 29 765 53 260
Senuk / Pickhandle Barracuda - - - -
Serinding Tembakau / Red Big Eye 5 - - 27
Setuhuk / Marlin 2 680 705 5 396 1 900
Siro / Spolted Sardinella - - - 1 032
Slengseng / Spolted Chub Mackarel - - - 247
Sunglir / Rainbow Runner - - - -
Swanggi / Big Eyes 1 735 3 480 15 380 18 454
Tembang / Fringescale Sardinella 28 972 6 362 5 470 7 557
Tenggiri Papan / Indo Pasific 68 568 76 776 53 103 96 475
Tenggiri / Norrow Barred 139 420 193 659 155 011 227 715
Teri / Anchovies 31 772 45 654 17 051 28 228
Terubuk / Tolishad - 607 2 300 1 558
Tetengkek / Hard Tail Scads 3 097 4 233 3 112 4 572
Tongkol Komo / Eastern Little Tunas
23 083 64 819 20 757 44 116
Tuna Lainnya / Others Tunas 132 631 50 630 91 629 122 038
Lainnya / Others 208 002 137 313 155 978 226 178
JUMLAH / TOTAL 1 678 871 1 600 954 1 448 636 3 158 565
Lanjutan Tabel / Continued Table 3.15g
Sumber : Statistik Perikanan Tangkap Indonesia 2007 - 2010, Kementerian Kelautan dan PerikananSource Capture Fisheries Statistics of Indonesia 2007 - 2010, Ministry of Marine Affairs and Fisheries
http://www.bps.go.id
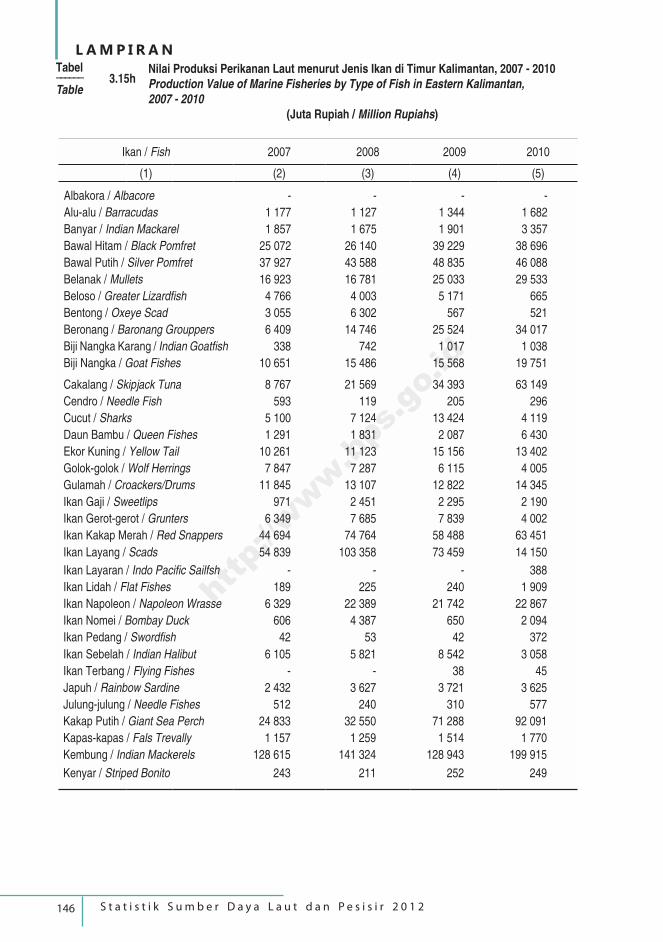
146 S t a t i s t i k S u m b e r D a y a L a u t d a n P e s i s i r 2 0 1 2
L A M P I R A N
Ikan / Fish 2007 2008 2009 2010
(1) (2) (3) (4) (5)
Albakora / Albacore - - - -
Alu-alu / Barracudas 1 177 1 127 1 344 1 682
Banyar / Indian Mackarel 1 857 1 675 1 901 3 357
Bawal Hitam / Black Pomfret 25 072 26 140 39 229 38 696
Bawal Putih / Silver Pomfret 37 927 43 588 48 835 46 088
Belanak / Mullets 16 923 16 781 25 033 29 533
Beloso / Greater Lizardfish 4 766 4 003 5 171 665
Bentong / Oxeye Scad 3 055 6 302 567 521
Beronang / Baronang Grouppers 6 409 14 746 25 524 34 017
Biji Nangka Karang / Indian Goatfish 338 742 1 017 1 038
Biji Nangka / Goat Fishes 10 651 15 486 15 568 19 751
Cakalang / Skipjack Tuna 8 767 21 569 34 393 63 149
Cendro / Needle Fish 593 119 205 296
Cucut / Sharks 5 100 7 124 13 424 4 119
Daun Bambu / Queen Fishes 1 291 1 831 2 087 6 430
Ekor Kuning / Yellow Tail 10 261 11 123 15 156 13 402
Golok-golok / Wolf Herrings 7 847 7 287 6 115 4 005
Gulamah / Croackers/Drums 11 845 13 107 12 822 14 345
Ikan Gaji / Sweetlips 971 2 451 2 295 2 190
Ikan Gerot-gerot / Grunters 6 349 7 685 7 839 4 002
Ikan Kakap Merah / Red Snappers 44 694 74 764 58 488 63 451
Ikan Layang / Scads 54 839 103 358 73 459 14 150
Ikan Layaran / Indo Pacific Sailfsh - - - 388
Ikan Lidah / Flat Fishes 189 225 240 1 909
Ikan Napoleon / Napoleon Wrasse 6 329 22 389 21 742 22 867
Ikan Nomei / Bombay Duck 606 4 387 650 2 094
Ikan Pedang / Swordfish 42 53 42 372
Ikan Sebelah / Indian Halibut 6 105 5 821 8 542 3 058
Ikan Terbang / Flying Fishes - - 38 45
Japuh / Rainbow Sardine 2 432 3 627 3 721 3 625
Julung-julung / Needle Fishes 512 240 310 577
Kakap Putih / Giant Sea Perch 24 833 32 550 71 288 92 091
Kapas-kapas / Fals Trevally 1 157 1 259 1 514 1 770
Kembung / Indian Mackerels 128 615 141 324 128 943 199 915
Kenyar / Striped Bonito 243 211 252 249
Tabel –––––– 3.15hTable
Nilai Produksi Perikanan Laut menurut Jenis Ikan di Timur Kalimantan, 2007 - 2010Production Value of Marine Fisheries by Type of Fish in Eastern Kalimantan,2007 - 2010
(Juta Rupiah / Million Rupiahs)
http://www.bps.go.id
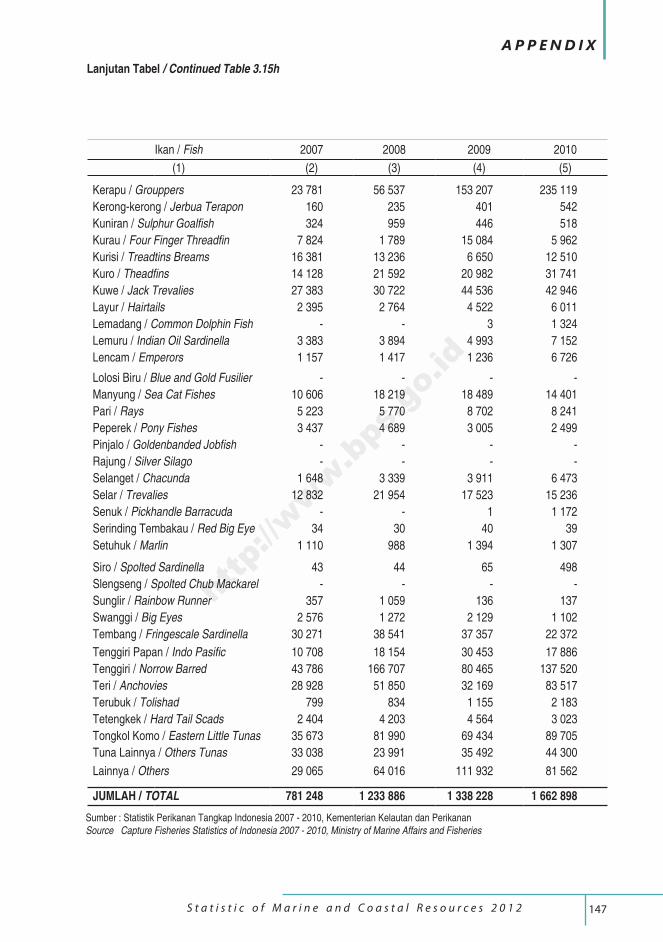
147 S t a t i s t i c o f M a r i n e a n d C o a s t a l R e s o u r c e s 2 0 1 2
A P P E N D I X
Ikan / Fish 2007 2008 2009 2010
(1) (2) (3) (4) (5)
Kerapu / Grouppers 23 781 56 537 153 207 235 119
Kerong-kerong / Jerbua Terapon 160 235 401 542
Kuniran / Sulphur Goalfish 324 959 446 518
Kurau / Four Finger Threadfin 7 824 1 789 15 084 5 962
Kurisi / Treadtins Breams 16 381 13 236 6 650 12 510
Kuro / Theadfins 14 128 21 592 20 982 31 741
Kuwe / Jack Trevalies 27 383 30 722 44 536 42 946
Layur / Hairtails 2 395 2 764 4 522 6 011
Lemadang / Common Dolphin Fish - - 3 1 324
Lemuru / Indian Oil Sardinella 3 383 3 894 4 993 7 152
Lencam / Emperors 1 157 1 417 1 236 6 726
Lolosi Biru / Blue and Gold Fusilier - - - -
Manyung / Sea Cat Fishes 10 606 18 219 18 489 14 401
Pari / Rays 5 223 5 770 8 702 8 241
Peperek / Pony Fishes 3 437 4 689 3 005 2 499
Pinjalo / Goldenbanded Jobfish - - - -
Rajung / Silver Silago - - - -
Selanget / Chacunda 1 648 3 339 3 911 6 473
Selar / Trevalies 12 832 21 954 17 523 15 236
Senuk / Pickhandle Barracuda - - 1 1 172
Serinding Tembakau / Red Big Eye 34 30 40 39
Setuhuk / Marlin 1 110 988 1 394 1 307
Siro / Spolted Sardinella 43 44 65 498
Slengseng / Spolted Chub Mackarel - - - -
Sunglir / Rainbow Runner 357 1 059 136 137
Swanggi / Big Eyes 2 576 1 272 2 129 1 102
Tembang / Fringescale Sardinella 30 271 38 541 37 357 22 372
Tenggiri Papan / Indo Pasific 10 708 18 154 30 453 17 886
Tenggiri / Norrow Barred 43 786 166 707 80 465 137 520
Teri / Anchovies 28 928 51 850 32 169 83 517
Terubuk / Tolishad 799 834 1 155 2 183
Tetengkek / Hard Tail Scads 2 404 4 203 4 564 3 023
Tongkol Komo / Eastern Little Tunas 35 673 81 990 69 434 89 705
Tuna Lainnya / Others Tunas 33 038 23 991 35 492 44 300
Lainnya / Others 29 065 64 016 111 932 81 562
JUMLAH / TOTAL 781 248 1 233 886 1 338 228 1 662 898
Lanjutan Tabel / Continued Table 3.15h
Sumber : Statistik Perikanan Tangkap Indonesia 2007 - 2010, Kementerian Kelautan dan PerikananSource Capture Fisheries Statistics of Indonesia 2007 - 2010, Ministry of Marine Affairs and Fisheries
http://www.bps.go.id
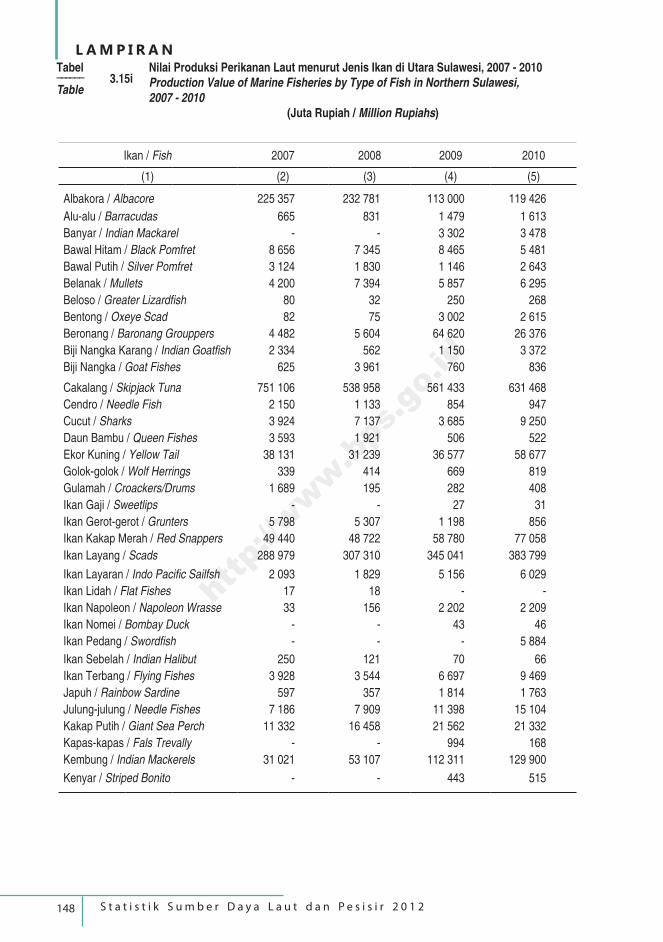
148 S t a t i s t i k S u m b e r D a y a L a u t d a n P e s i s i r 2 0 1 2
L A M P I R A N
Ikan / Fish 2007 2008 2009 2010
(1) (2) (3) (4) (5)
Albakora / Albacore 225 357 232 781 113 000 119 426
Alu-alu / Barracudas 665 831 1 479 1 613
Banyar / Indian Mackarel - - 3 302 3 478
Bawal Hitam / Black Pomfret 8 656 7 345 8 465 5 481
Bawal Putih / Silver Pomfret 3 124 1 830 1 146 2 643
Belanak / Mullets 4 200 7 394 5 857 6 295
Beloso / Greater Lizardfish 80 32 250 268
Bentong / Oxeye Scad 82 75 3 002 2 615
Beronang / Baronang Grouppers 4 482 5 604 64 620 26 376
Biji Nangka Karang / Indian Goatfish 2 334 562 1 150 3 372
Biji Nangka / Goat Fishes 625 3 961 760 836
Cakalang / Skipjack Tuna 751 106 538 958 561 433 631 468
Cendro / Needle Fish 2 150 1 133 854 947
Cucut / Sharks 3 924 7 137 3 685 9 250
Daun Bambu / Queen Fishes 3 593 1 921 506 522
Ekor Kuning / Yellow Tail 38 131 31 239 36 577 58 677
Golok-golok / Wolf Herrings 339 414 669 819
Gulamah / Croackers/Drums 1 689 195 282 408
Ikan Gaji / Sweetlips - - 27 31
Ikan Gerot-gerot / Grunters 5 798 5 307 1 198 856
Ikan Kakap Merah / Red Snappers 49 440 48 722 58 780 77 058
Ikan Layang / Scads 288 979 307 310 345 041 383 799
Ikan Layaran / Indo Pacific Sailfsh 2 093 1 829 5 156 6 029
Ikan Lidah / Flat Fishes 17 18 - -
Ikan Napoleon / Napoleon Wrasse 33 156 2 202 2 209
Ikan Nomei / Bombay Duck - - 43 46
Ikan Pedang / Swordfish - - - 5 884
Ikan Sebelah / Indian Halibut 250 121 70 66
Ikan Terbang / Flying Fishes 3 928 3 544 6 697 9 469
Japuh / Rainbow Sardine 597 357 1 814 1 763
Julung-julung / Needle Fishes 7 186 7 909 11 398 15 104
Kakap Putih / Giant Sea Perch 11 332 16 458 21 562 21 332
Kapas-kapas / Fals Trevally - - 994 168
Kembung / Indian Mackerels 31 021 53 107 112 311 129 900
Kenyar / Striped Bonito - - 443 515
Tabel –––––– 3.15iTable
Nilai Produksi Perikanan Laut menurut Jenis Ikan di Utara Sulawesi, 2007 - 2010Production Value of Marine Fisheries by Type of Fish in Northern Sulawesi,2007 - 2010
(Juta Rupiah / Million Rupiahs)
http://www.bps.go.id
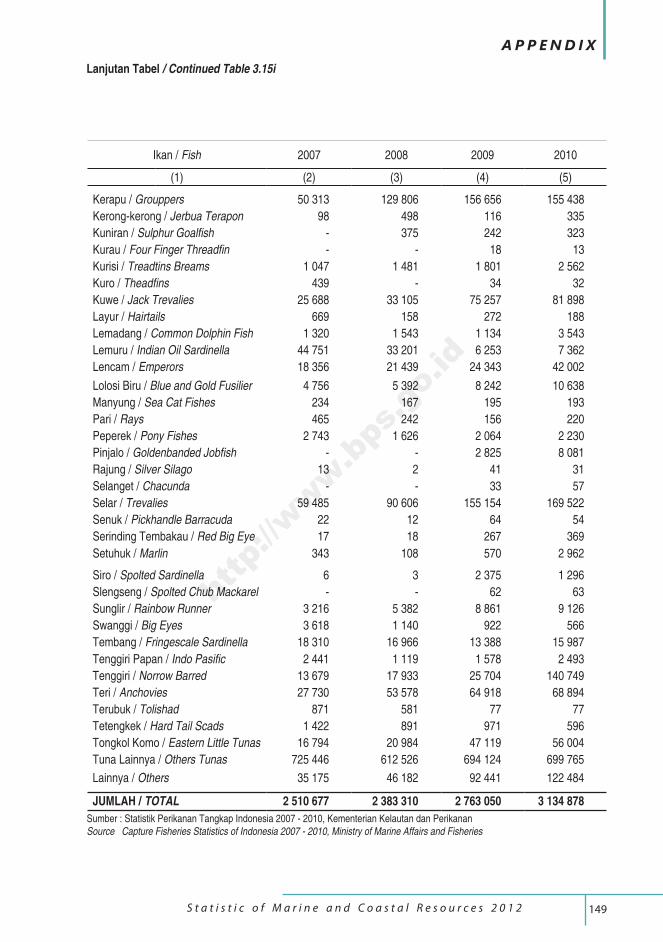
149 S t a t i s t i c o f M a r i n e a n d C o a s t a l R e s o u r c e s 2 0 1 2
A P P E N D I X
Ikan / Fish 2007 2008 2009 2010
(1) (2) (3) (4) (5)
Kerapu / Grouppers 50 313 129 806 156 656 155 438
Kerong-kerong / Jerbua Terapon 98 498 116 335
Kuniran / Sulphur Goalfish - 375 242 323
Kurau / Four Finger Threadfin - - 18 13
Kurisi / Treadtins Breams 1 047 1 481 1 801 2 562
Kuro / Theadfins 439 - 34 32
Kuwe / Jack Trevalies 25 688 33 105 75 257 81 898
Layur / Hairtails 669 158 272 188
Lemadang / Common Dolphin Fish 1 320 1 543 1 134 3 543
Lemuru / Indian Oil Sardinella 44 751 33 201 6 253 7 362
Lencam / Emperors 18 356 21 439 24 343 42 002
Lolosi Biru / Blue and Gold Fusilier 4 756 5 392 8 242 10 638
Manyung / Sea Cat Fishes 234 167 195 193
Pari / Rays 465 242 156 220
Peperek / Pony Fishes 2 743 1 626 2 064 2 230
Pinjalo / Goldenbanded Jobfish - - 2 825 8 081
Rajung / Silver Silago 13 2 41 31
Selanget / Chacunda - - 33 57
Selar / Trevalies 59 485 90 606 155 154 169 522
Senuk / Pickhandle Barracuda 22 12 64 54
Serinding Tembakau / Red Big Eye 17 18 267 369
Setuhuk / Marlin 343 108 570 2 962
Siro / Spolted Sardinella 6 3 2 375 1 296
Slengseng / Spolted Chub Mackarel - - 62 63
Sunglir / Rainbow Runner 3 216 5 382 8 861 9 126
Swanggi / Big Eyes 3 618 1 140 922 566
Tembang / Fringescale Sardinella 18 310 16 966 13 388 15 987
Tenggiri Papan / Indo Pasific 2 441 1 119 1 578 2 493
Tenggiri / Norrow Barred 13 679 17 933 25 704 140 749
Teri / Anchovies 27 730 53 578 64 918 68 894
Terubuk / Tolishad 871 581 77 77
Tetengkek / Hard Tail Scads 1 422 891 971 596
Tongkol Komo / Eastern Little Tunas 16 794 20 984 47 119 56 004
Tuna Lainnya / Others Tunas 725 446 612 526 694 124 699 765
Lainnya / Others 35 175 46 182 92 441 122 484
JUMLAH / TOTAL 2 510 677 2 383 310 2 763 050 3 134 878
Lanjutan Tabel / Continued Table 3.15i
Sumber : Statistik Perikanan Tangkap Indonesia 2007 - 2010, Kementerian Kelautan dan PerikananSource Capture Fisheries Statistics of Indonesia 2007 - 2010, Ministry of Marine Affairs and Fisheries
http://www.bps.go.id
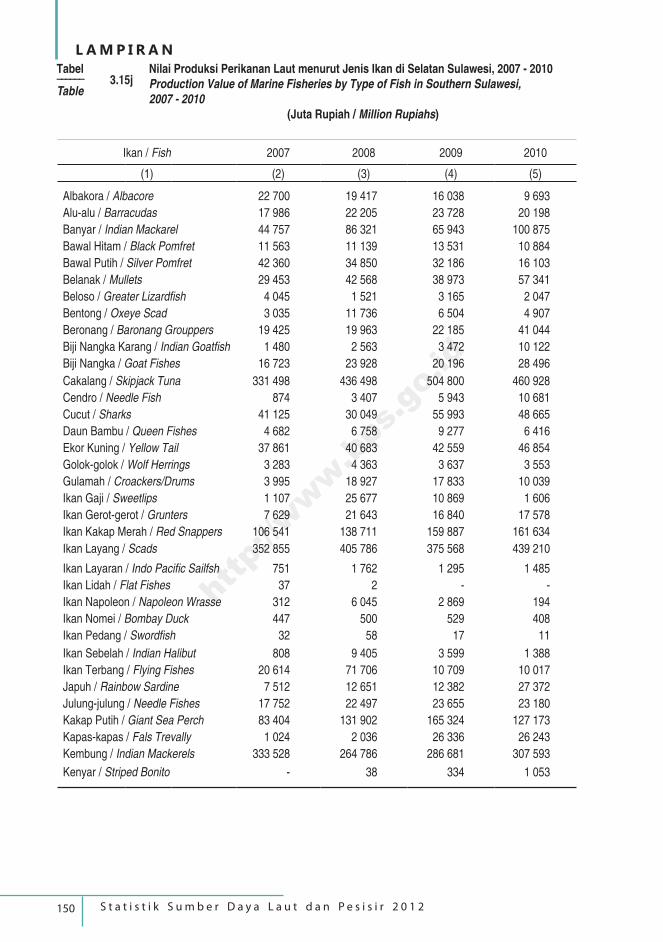
150 S t a t i s t i k S u m b e r D a y a L a u t d a n P e s i s i r 2 0 1 2
L A M P I R A N
Ikan / Fish 2007 2008 2009 2010
(1) (2) (3) (4) (5)
Albakora / Albacore 22 700 19 417 16 038 9 693
Alu-alu / Barracudas 17 986 22 205 23 728 20 198
Banyar / Indian Mackarel 44 757 86 321 65 943 100 875
Bawal Hitam / Black Pomfret 11 563 11 139 13 531 10 884
Bawal Putih / Silver Pomfret 42 360 34 850 32 186 16 103
Belanak / Mullets 29 453 42 568 38 973 57 341
Beloso / Greater Lizardfish 4 045 1 521 3 165 2 047
Bentong / Oxeye Scad 3 035 11 736 6 504 4 907
Beronang / Baronang Grouppers 19 425 19 963 22 185 41 044
Biji Nangka Karang / Indian Goatfish 1 480 2 563 3 472 10 122
Biji Nangka / Goat Fishes 16 723 23 928 20 196 28 496
Cakalang / Skipjack Tuna 331 498 436 498 504 800 460 928
Cendro / Needle Fish 874 3 407 5 943 10 681
Cucut / Sharks 41 125 30 049 55 993 48 665
Daun Bambu / Queen Fishes 4 682 6 758 9 277 6 416
Ekor Kuning / Yellow Tail 37 861 40 683 42 559 46 854
Golok-golok / Wolf Herrings 3 283 4 363 3 637 3 553
Gulamah / Croackers/Drums 3 995 18 927 17 833 10 039
Ikan Gaji / Sweetlips 1 107 25 677 10 869 1 606
Ikan Gerot-gerot / Grunters 7 629 21 643 16 840 17 578
Ikan Kakap Merah / Red Snappers 106 541 138 711 159 887 161 634
Ikan Layang / Scads 352 855 405 786 375 568 439 210
Ikan Layaran / Indo Pacific Sailfsh 751 1 762 1 295 1 485
Ikan Lidah / Flat Fishes 37 2 - -
Ikan Napoleon / Napoleon Wrasse 312 6 045 2 869 194
Ikan Nomei / Bombay Duck 447 500 529 408
Ikan Pedang / Swordfish 32 58 17 11
Ikan Sebelah / Indian Halibut 808 9 405 3 599 1 388
Ikan Terbang / Flying Fishes 20 614 71 706 10 709 10 017
Japuh / Rainbow Sardine 7 512 12 651 12 382 27 372
Julung-julung / Needle Fishes 17 752 22 497 23 655 23 180
Kakap Putih / Giant Sea Perch 83 404 131 902 165 324 127 173
Kapas-kapas / Fals Trevally 1 024 2 036 26 336 26 243
Kembung / Indian Mackerels 333 528 264 786 286 681 307 593
Kenyar / Striped Bonito - 38 334 1 053
Tabel –––––– 3.15jTable
Nilai Produksi Perikanan Laut menurut Jenis Ikan di Selatan Sulawesi, 2007 - 2010Production Value of Marine Fisheries by Type of Fish in Southern Sulawesi,2007 - 2010
(Juta Rupiah / Million Rupiahs)
http://www.bps.go.id
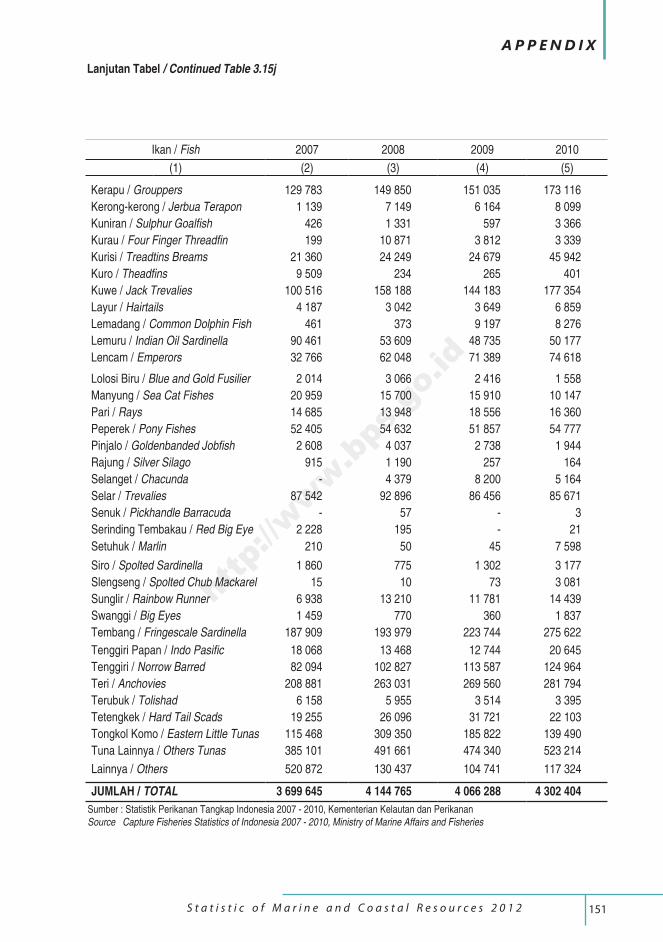
151 S t a t i s t i c o f M a r i n e a n d C o a s t a l R e s o u r c e s 2 0 1 2
A P P E N D I X
Ikan / Fish 2007 2008 2009 2010
(1) (2) (3) (4) (5)
Kerapu / Grouppers 129 783 149 850 151 035 173 116
Kerong-kerong / Jerbua Terapon 1 139 7 149 6 164 8 099
Kuniran / Sulphur Goalfish 426 1 331 597 3 366
Kurau / Four Finger Threadfin 199 10 871 3 812 3 339
Kurisi / Treadtins Breams 21 360 24 249 24 679 45 942
Kuro / Theadfins 9 509 234 265 401
Kuwe / Jack Trevalies 100 516 158 188 144 183 177 354
Layur / Hairtails 4 187 3 042 3 649 6 859
Lemadang / Common Dolphin Fish 461 373 9 197 8 276
Lemuru / Indian Oil Sardinella 90 461 53 609 48 735 50 177
Lencam / Emperors 32 766 62 048 71 389 74 618
Lolosi Biru / Blue and Gold Fusilier 2 014 3 066 2 416 1 558
Manyung / Sea Cat Fishes 20 959 15 700 15 910 10 147
Pari / Rays 14 685 13 948 18 556 16 360
Peperek / Pony Fishes 52 405 54 632 51 857 54 777
Pinjalo / Goldenbanded Jobfish 2 608 4 037 2 738 1 944
Rajung / Silver Silago 915 1 190 257 164
Selanget / Chacunda - 4 379 8 200 5 164
Selar / Trevalies 87 542 92 896 86 456 85 671
Senuk / Pickhandle Barracuda - 57 - 3
Serinding Tembakau / Red Big Eye 2 228 195 - 21
Setuhuk / Marlin 210 50 45 7 598
Siro / Spolted Sardinella 1 860 775 1 302 3 177
Slengseng / Spolted Chub Mackarel 15 10 73 3 081
Sunglir / Rainbow Runner 6 938 13 210 11 781 14 439
Swanggi / Big Eyes 1 459 770 360 1 837
Tembang / Fringescale Sardinella 187 909 193 979 223 744 275 622
Tenggiri Papan / Indo Pasific 18 068 13 468 12 744 20 645
Tenggiri / Norrow Barred 82 094 102 827 113 587 124 964
Teri / Anchovies 208 881 263 031 269 560 281 794
Terubuk / Tolishad 6 158 5 955 3 514 3 395
Tetengkek / Hard Tail Scads 19 255 26 096 31 721 22 103
Tongkol Komo / Eastern Little Tunas 115 468 309 350 185 822 139 490
Tuna Lainnya / Others Tunas 385 101 491 661 474 340 523 214
Lainnya / Others 520 872 130 437 104 741 117 324
JUMLAH / TOTAL 3 699 645 4 144 765 4 066 288 4 302 404
Lanjutan Tabel / Continued Table 3.15j
Sumber : Statistik Perikanan Tangkap Indonesia 2007 - 2010, Kementerian Kelautan dan PerikananSource Capture Fisheries Statistics of Indonesia 2007 - 2010, Ministry of Marine Affairs and Fisheries
http://www.bps.go.id
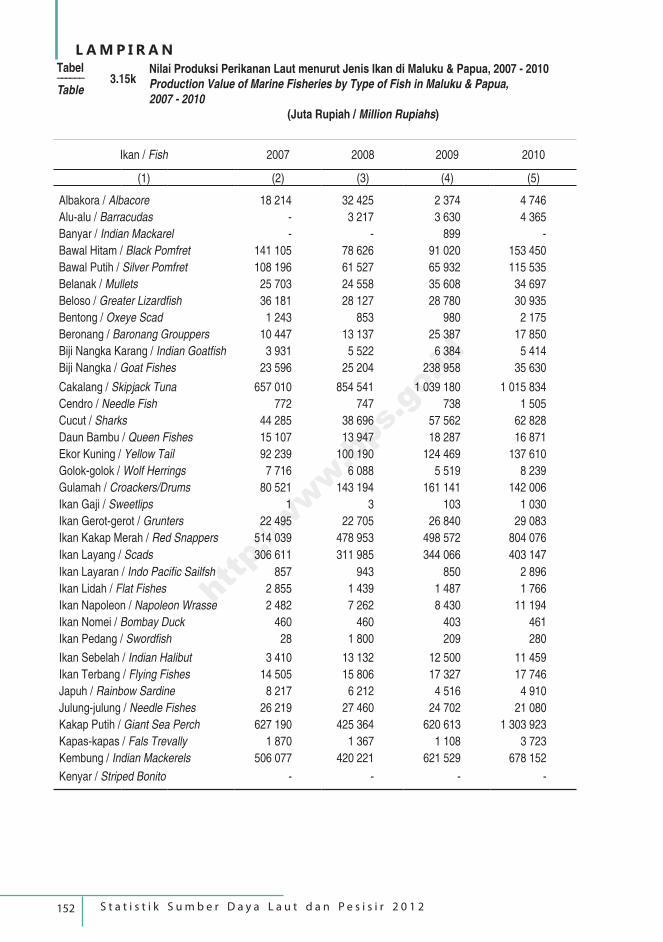
152 S t a t i s t i k S u m b e r D a y a L a u t d a n P e s i s i r 2 0 1 2
L A M P I R A N
Ikan / Fish 2007 2008 2009 2010
(1) (2) (3) (4) (5)
Albakora / Albacore 18 214 32 425 2 374 4 746
Alu-alu / Barracudas - 3 217 3 630 4 365
Banyar / Indian Mackarel - - 899 -
Bawal Hitam / Black Pomfret 141 105 78 626 91 020 153 450
Bawal Putih / Silver Pomfret 108 196 61 527 65 932 115 535
Belanak / Mullets 25 703 24 558 35 608 34 697
Beloso / Greater Lizardfish 36 181 28 127 28 780 30 935
Bentong / Oxeye Scad 1 243 853 980 2 175
Beronang / Baronang Grouppers 10 447 13 137 25 387 17 850
Biji Nangka Karang / Indian Goatfish 3 931 5 522 6 384 5 414
Biji Nangka / Goat Fishes 23 596 25 204 238 958 35 630
Cakalang / Skipjack Tuna 657 010 854 541 1 039 180 1 015 834
Cendro / Needle Fish 772 747 738 1 505
Cucut / Sharks 44 285 38 696 57 562 62 828
Daun Bambu / Queen Fishes 15 107 13 947 18 287 16 871
Ekor Kuning / Yellow Tail 92 239 100 190 124 469 137 610
Golok-golok / Wolf Herrings 7 716 6 088 5 519 8 239
Gulamah / Croackers/Drums 80 521 143 194 161 141 142 006
Ikan Gaji / Sweetlips 1 3 103 1 030
Ikan Gerot-gerot / Grunters 22 495 22 705 26 840 29 083
Ikan Kakap Merah / Red Snappers 514 039 478 953 498 572 804 076
Ikan Layang / Scads 306 611 311 985 344 066 403 147
Ikan Layaran / Indo Pacific Sailfsh 857 943 850 2 896
Ikan Lidah / Flat Fishes 2 855 1 439 1 487 1 766
Ikan Napoleon / Napoleon Wrasse 2 482 7 262 8 430 11 194
Ikan Nomei / Bombay Duck 460 460 403 461
Ikan Pedang / Swordfish 28 1 800 209 280
Ikan Sebelah / Indian Halibut 3 410 13 132 12 500 11 459
Ikan Terbang / Flying Fishes 14 505 15 806 17 327 17 746
Japuh / Rainbow Sardine 8 217 6 212 4 516 4 910
Julung-julung / Needle Fishes 26 219 27 460 24 702 21 080
Kakap Putih / Giant Sea Perch 627 190 425 364 620 613 1 303 923
Kapas-kapas / Fals Trevally 1 870 1 367 1 108 3 723
Kembung / Indian Mackerels 506 077 420 221 621 529 678 152
Kenyar / Striped Bonito - - - -
Tabel –––––– 3.15kTable
Nilai Produksi Perikanan Laut menurut Jenis Ikan di Maluku & Papua, 2007 - 2010Production Value of Marine Fisheries by Type of Fish in Maluku & Papua,2007 - 2010
(Juta Rupiah / Million Rupiahs)
http://www.bps.go.id
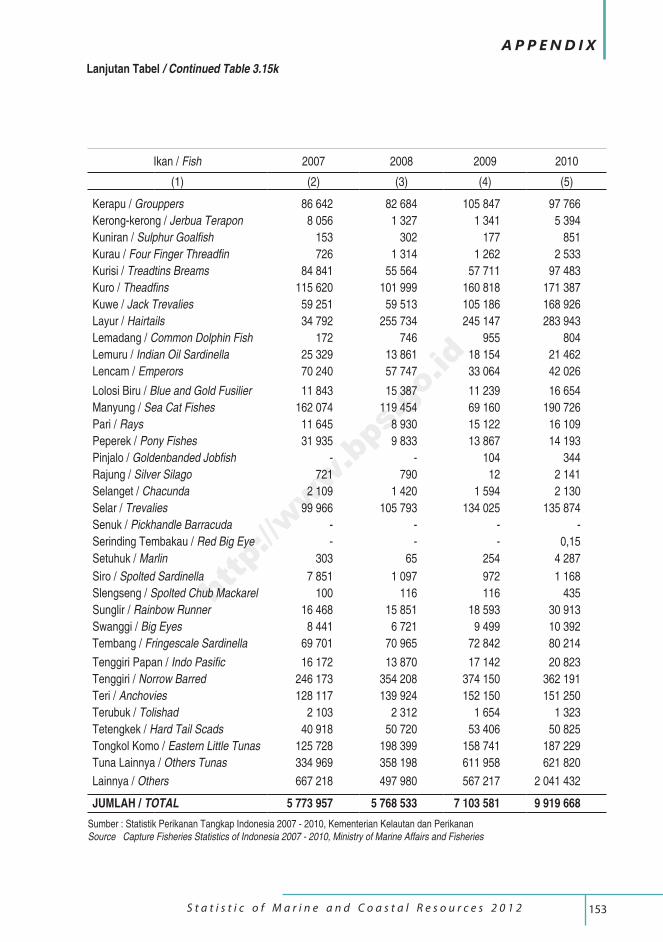
153 S t a t i s t i c o f M a r i n e a n d C o a s t a l R e s o u r c e s 2 0 1 2
A P P E N D I X
Ikan / Fish 2007 2008 2009 2010
(1) (2) (3) (4) (5)
Kerapu / Grouppers 86 642 82 684 105 847 97 766
Kerong-kerong / Jerbua Terapon 8 056 1 327 1 341 5 394
Kuniran / Sulphur Goalfish 153 302 177 851
Kurau / Four Finger Threadfin 726 1 314 1 262 2 533
Kurisi / Treadtins Breams 84 841 55 564 57 711 97 483
Kuro / Theadfins 115 620 101 999 160 818 171 387
Kuwe / Jack Trevalies 59 251 59 513 105 186 168 926
Layur / Hairtails 34 792 255 734 245 147 283 943
Lemadang / Common Dolphin Fish 172 746 955 804
Lemuru / Indian Oil Sardinella 25 329 13 861 18 154 21 462
Lencam / Emperors 70 240 57 747 33 064 42 026
Lolosi Biru / Blue and Gold Fusilier 11 843 15 387 11 239 16 654
Manyung / Sea Cat Fishes 162 074 119 454 69 160 190 726
Pari / Rays 11 645 8 930 15 122 16 109
Peperek / Pony Fishes 31 935 9 833 13 867 14 193
Pinjalo / Goldenbanded Jobfish - - 104 344
Rajung / Silver Silago 721 790 12 2 141
Selanget / Chacunda 2 109 1 420 1 594 2 130
Selar / Trevalies 99 966 105 793 134 025 135 874
Senuk / Pickhandle Barracuda - - - -
Serinding Tembakau / Red Big Eye - - - 0,15
Setuhuk / Marlin 303 65 254 4 287
Siro / Spolted Sardinella 7 851 1 097 972 1 168
Slengseng / Spolted Chub Mackarel 100 116 116 435
Sunglir / Rainbow Runner 16 468 15 851 18 593 30 913
Swanggi / Big Eyes 8 441 6 721 9 499 10 392
Tembang / Fringescale Sardinella 69 701 70 965 72 842 80 214
Tenggiri Papan / Indo Pasific 16 172 13 870 17 142 20 823
Tenggiri / Norrow Barred 246 173 354 208 374 150 362 191
Teri / Anchovies 128 117 139 924 152 150 151 250
Terubuk / Tolishad 2 103 2 312 1 654 1 323
Tetengkek / Hard Tail Scads 40 918 50 720 53 406 50 825
Tongkol Komo / Eastern Little Tunas 125 728 198 399 158 741 187 229
Tuna Lainnya / Others Tunas 334 969 358 198 611 958 621 820
Lainnya / Others 667 218 497 980 567 217 2 041 432
JUMLAH / TOTAL 5 773 957 5 768 533 7 103 581 9 919 668
Lanjutan Tabel / Continued Table 3.15k
Sumber : Statistik Perikanan Tangkap Indonesia 2007 - 2010, Kementerian Kelautan dan PerikananSource Capture Fisheries Statistics of Indonesia 2007 - 2010, Ministry of Marine Affairs and Fisheries
http://www.bps.go.id
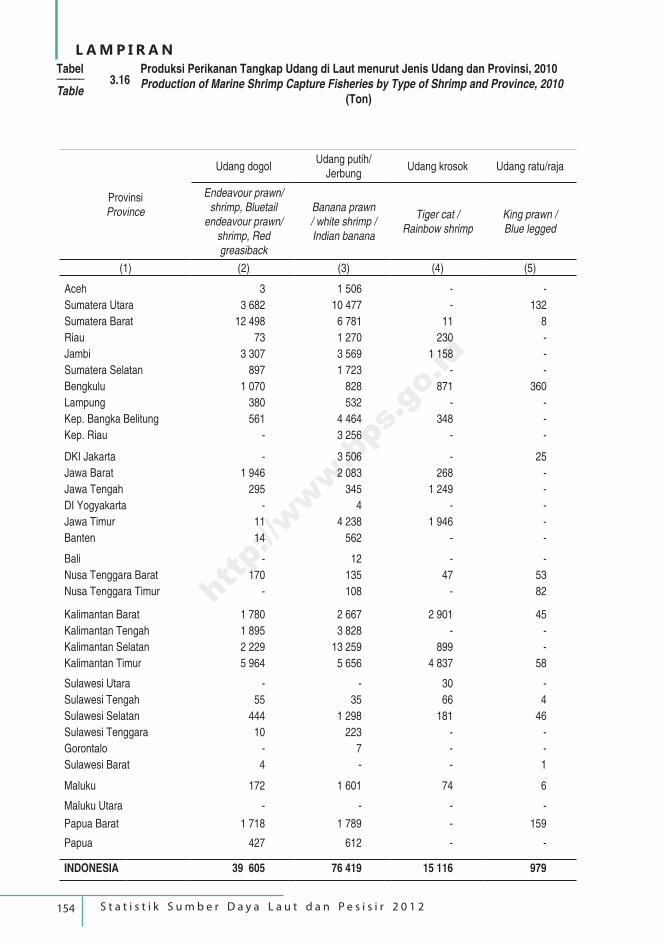
154 S t a t i s t i k S u m b e r D a y a L a u t d a n P e s i s i r 2 0 1 2
L A M P I R A N
Provinsi Province
Udang dogol Udang putih/
JerbungUdang krosok Udang ratu/raja
Endeavour prawn/ shrimp, Bluetail
endeavour prawn/ shrimp, Red greasiback
Banana prawn / white shrimp / Indian banana
Tiger cat / Rainbow shrimp
King prawn / Blue legged
(1) (2) (3) (4) (5)
Aceh 3 1 506 - -
Sumatera Utara 3 682 10 477 - 132
Sumatera Barat 12 498 6 781 11 8
Riau 73 1 270 230 -
Jambi 3 307 3 569 1 158 -
Sumatera Selatan 897 1 723 - -
Bengkulu 1 070 828 871 360
Lampung 380 532 - -
Kep. Bangka Belitung 561 4 464 348 -
Kep. Riau - 3 256 - -
DKI Jakarta - 3 506 - 25
Jawa Barat 1 946 2 083 268 -
Jawa Tengah 295 345 1 249 -
DI Yogyakarta - 4 - -
Jawa Timur 11 4 238 1 946 -
Banten 14 562 - -
Bali - 12 - -
Nusa Tenggara Barat 170 135 47 53
Nusa Tenggara Timur - 108 - 82
Kalimantan Barat 1 780 2 667 2 901 45
Kalimantan Tengah 1 895 3 828 - -
Kalimantan Selatan 2 229 13 259 899 -
Kalimantan Timur 5 964 5 656 4 837 58
Sulawesi Utara - - 30 -
Sulawesi Tengah 55 35 66 4
Sulawesi Selatan 444 1 298 181 46
Sulawesi Tenggara 10 223 - -
Gorontalo - 7 - -
Sulawesi Barat 4 - - 1
Maluku 172 1 601 74 6
Maluku Utara - - - -
Papua Barat 1 718 1 789 - 159
Papua 427 612 - -
INDONESIA 39 605 76 419 15 116 979
Tabel –––––– 3.16Table
Produksi Perikanan Tangkap Udang di Laut menurut Jenis Udang dan Provinsi, 2010 Production of Marine Shrimp Capture Fisheries by Type of Shrimp and Province, 2010
(Ton)
http://www.bps.go.id
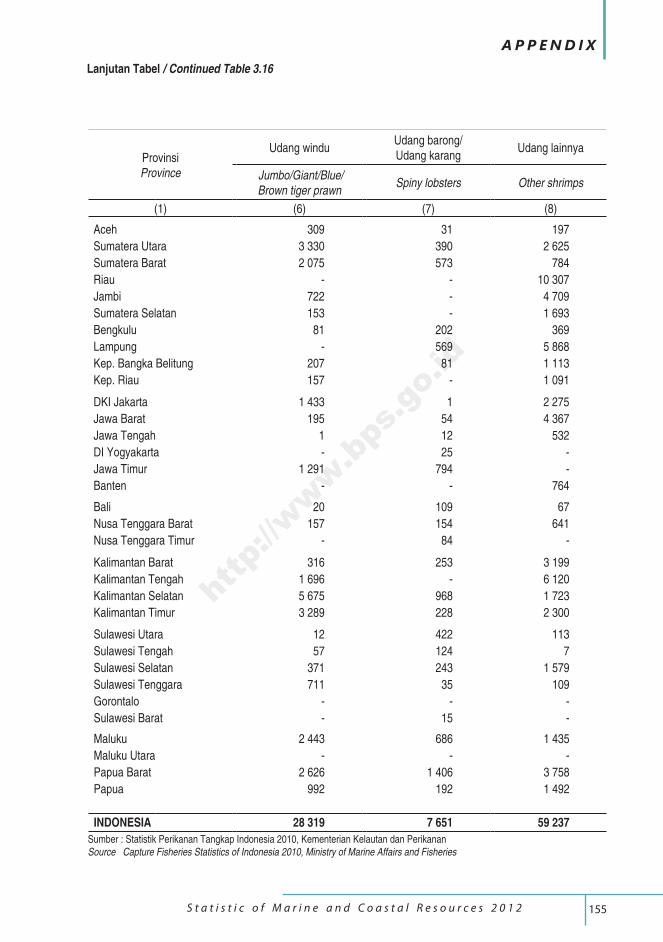
155 S t a t i s t i c o f M a r i n e a n d C o a s t a l R e s o u r c e s 2 0 1 2
A P P E N D I X
ProvinsiProvince
Udang windu Udang barong/ Udang karang
Udang lainnya
Jumbo/Giant/Blue/ Brown tiger prawn
Spiny lobsters Other shrimps
(1) (6) (7) (8)
Aceh 309 31 197
Sumatera Utara 3 330 390 2 625
Sumatera Barat 2 075 573 784
Riau - - 10 307
Jambi 722 - 4 709
Sumatera Selatan 153 - 1 693
Bengkulu 81 202 369
Lampung - 569 5 868
Kep. Bangka Belitung 207 81 1 113
Kep. Riau 157 - 1 091
DKI Jakarta 1 433 1 2 275
Jawa Barat 195 54 4 367
Jawa Tengah 1 12 532
DI Yogyakarta - 25 -
Jawa Timur 1 291 794 -
Banten - - 764
Bali 20 109 67
Nusa Tenggara Barat 157 154 641
Nusa Tenggara Timur - 84 -
Kalimantan Barat 316 253 3 199
Kalimantan Tengah 1 696 - 6 120
Kalimantan Selatan 5 675 968 1 723
Kalimantan Timur 3 289 228 2 300
Sulawesi Utara 12 422 113
Sulawesi Tengah 57 124 7
Sulawesi Selatan 371 243 1 579
Sulawesi Tenggara 711 35 109
Gorontalo - - -
Sulawesi Barat - 15 -
Maluku 2 443 686 1 435
Maluku Utara - - -
Papua Barat 2 626 1 406 3 758
Papua 992 192 1 492
INDONESIA 28 319 7 651 59 237
Lanjutan Tabel / Continued Table 3.16
Sumber : Statistik Perikanan Tangkap Indonesia 2010, Kementerian Kelautan dan PerikananSource Capture Fisheries Statistics of Indonesia 2010, Ministry of Marine Affairs and Fisheries
http://www.bps.go.id
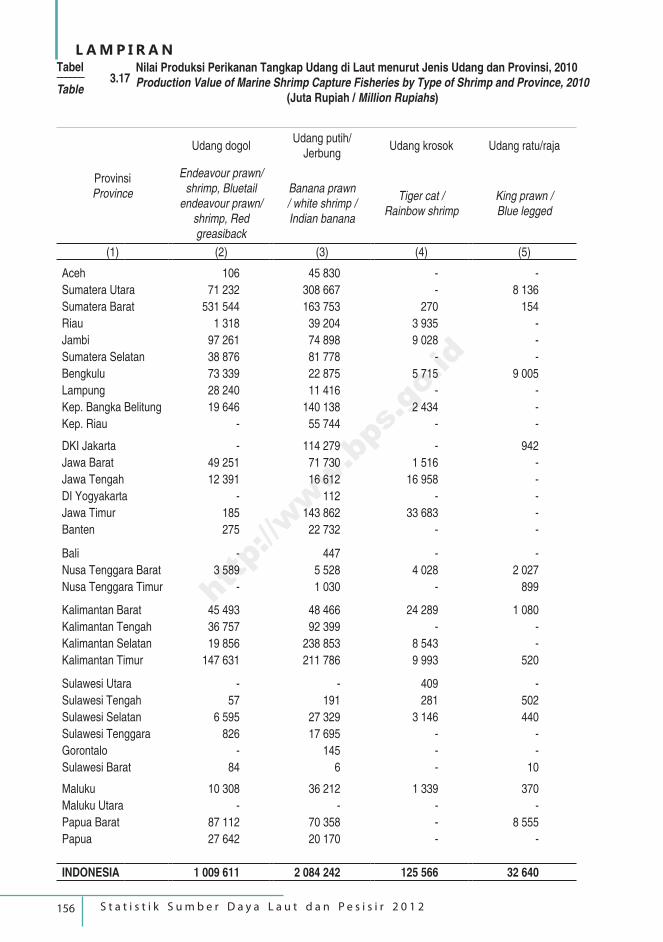
156 S t a t i s t i k S u m b e r D a y a L a u t d a n P e s i s i r 2 0 1 2
L A M P I R A N
Provinsi Province
Udang dogol Udang putih/
JerbungUdang krosok Udang ratu/raja
Endeavour prawn/ shrimp, Bluetail
endeavour prawn/ shrimp, Red greasiback
Banana prawn / white shrimp / Indian banana
Tiger cat / Rainbow shrimp
King prawn / Blue legged
(1) (2) (3) (4) (5)
Aceh 106 45 830 - -
Sumatera Utara 71 232 308 667 - 8 136
Sumatera Barat 531 544 163 753 270 154
Riau 1 318 39 204 3 935 -
Jambi 97 261 74 898 9 028 -
Sumatera Selatan 38 876 81 778 - -
Bengkulu 73 339 22 875 5 715 9 005
Lampung 28 240 11 416 - -
Kep. Bangka Belitung 19 646 140 138 2 434 -
Kep. Riau - 55 744 - -
DKI Jakarta - 114 279 - 942
Jawa Barat 49 251 71 730 1 516 -
Jawa Tengah 12 391 16 612 16 958 -
DI Yogyakarta - 112 - -
Jawa Timur 185 143 862 33 683 -
Banten 275 22 732 - -
Bali - 447 - -
Nusa Tenggara Barat 3 589 5 528 4 028 2 027
Nusa Tenggara Timur - 1 030 - 899
Kalimantan Barat 45 493 48 466 24 289 1 080
Kalimantan Tengah 36 757 92 399 - -
Kalimantan Selatan 19 856 238 853 8 543 -
Kalimantan Timur 147 631 211 786 9 993 520
Sulawesi Utara - - 409 -
Sulawesi Tengah 57 191 281 502
Sulawesi Selatan 6 595 27 329 3 146 440
Sulawesi Tenggara 826 17 695 - -
Gorontalo - 145 - -
Sulawesi Barat 84 6 - 10
Maluku 10 308 36 212 1 339 370
Maluku Utara - - - -
Papua Barat 87 112 70 358 - 8 555
Papua 27 642 20 170 - -
INDONESIA 1 009 611 2 084 242 125 566 32 640
Tabel –––––– 3.17Table
Nilai Produksi Perikanan Tangkap Udang di Laut menurut Jenis Udang dan Provinsi, 2010 Production Value of Marine Shrimp Capture Fisheries by Type of Shrimp and Province, 2010
(Juta Rupiah / Million Rupiahs)
http://www.bps.go.id
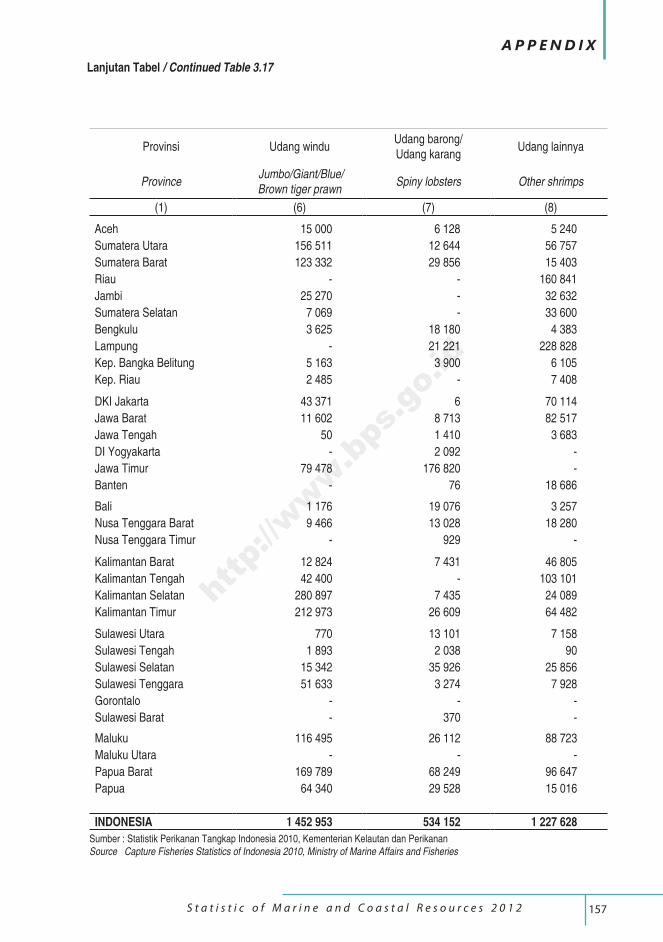
157 S t a t i s t i c o f M a r i n e a n d C o a s t a l R e s o u r c e s 2 0 1 2
A P P E N D I X
Provinsi Udang windu Udang barong/ Udang karang
Udang lainnya
Province Jumbo/Giant/Blue/ Brown tiger prawn
Spiny lobsters Other shrimps
(1) (6) (7) (8)
Aceh 15 000 6 128 5 240
Sumatera Utara 156 511 12 644 56 757
Sumatera Barat 123 332 29 856 15 403
Riau - - 160 841
Jambi 25 270 - 32 632
Sumatera Selatan 7 069 - 33 600
Bengkulu 3 625 18 180 4 383
Lampung - 21 221 228 828
Kep. Bangka Belitung 5 163 3 900 6 105
Kep. Riau 2 485 - 7 408
DKI Jakarta 43 371 6 70 114
Jawa Barat 11 602 8 713 82 517
Jawa Tengah 50 1 410 3 683
DI Yogyakarta - 2 092 -
Jawa Timur 79 478 176 820 -
Banten - 76 18 686
Bali 1 176 19 076 3 257
Nusa Tenggara Barat 9 466 13 028 18 280
Nusa Tenggara Timur - 929 -
Kalimantan Barat 12 824 7 431 46 805
Kalimantan Tengah 42 400 - 103 101
Kalimantan Selatan 280 897 7 435 24 089
Kalimantan Timur 212 973 26 609 64 482
Sulawesi Utara 770 13 101 7 158
Sulawesi Tengah 1 893 2 038 90
Sulawesi Selatan 15 342 35 926 25 856
Sulawesi Tenggara 51 633 3 274 7 928
Gorontalo - - -
Sulawesi Barat - 370 -
Maluku 116 495 26 112 88 723
Maluku Utara - - -
Papua Barat 169 789 68 249 96 647
Papua 64 340 29 528 15 016
INDONESIA 1 452 953 534 152 1 227 628
Lanjutan Tabel / Continued Table 3.17
Sumber : Statistik Perikanan Tangkap Indonesia 2010, Kementerian Kelautan dan PerikananSource Capture Fisheries Statistics of Indonesia 2010, Ministry of Marine Affairs and Fisheries
http://www.bps.go.id

158 S t a t i s t i k S u m b e r D a y a L a u t d a n P e s i s i r 2 0 1 2
L A M P I R A N
Daerah Perairan Territorial Waters
Udang dogol Udang putih/Jerbung
Endeavour prawn/shrimp, Bluetail endeavour prawn/shrimp, Red
greasiback
Banana prawn/White shrimp/Indian banana
2008 2009 2010 2008 2009 2010
(1) (2) (3) (4) (5) (6) (7)
Barat Sumatera 6 661 10 019 13 896 6 050 7 838 8 500
Western Sumatera
Timur Sumatera 4 854 4 908 5 145 11 938 12 016 12 704
Eastern Sumatera
Selatan Jawa 76 57 45 516 803 225
Southern Java
Utara Jawa 4 673 1 688 2 221 16 943 13 031 10 558
Northern Java
Bali-Nusa Tenggara 71 545 170 108 157 255
Bali-Nusa Tenggara
Selat Malaka 8 976 8 741 3 430 18 536 13 058 12 362
Malacca Strait
Selatan/Barat Kalimantan 4 343 15 891 5 352 10 714 9 990 15 803
Southern/Western Kalimantan
Timur Kalimantan 2 659 3 158 6 516 4 782 6 799 10 447
East Kalimantan
Selatan Sulawesi 516 906 458 1 733 1 538 1 521
Southern Sulawesi
Utara Sulawesi - 4 55 16 166 42
Northern Sulawesi
Maluku-Papua 1 889 823 2 317 2 534 6 597 4 002
Maluku-Papua
INDONESIA 34 718 46 740 39 605 73 870 71 993 76 419
Tabel –––––– 3.18Table
Produksi Perikanan Tangkap Udang di Laut menurut Daerah Perairandan Jenis Udang, 2008 - 2010 Production of Marine Shrimp Capture Fisheries by Territorial Watersand Type of Shrimp, 2008 - 2010
(Ton)
http://www.bps.go.id
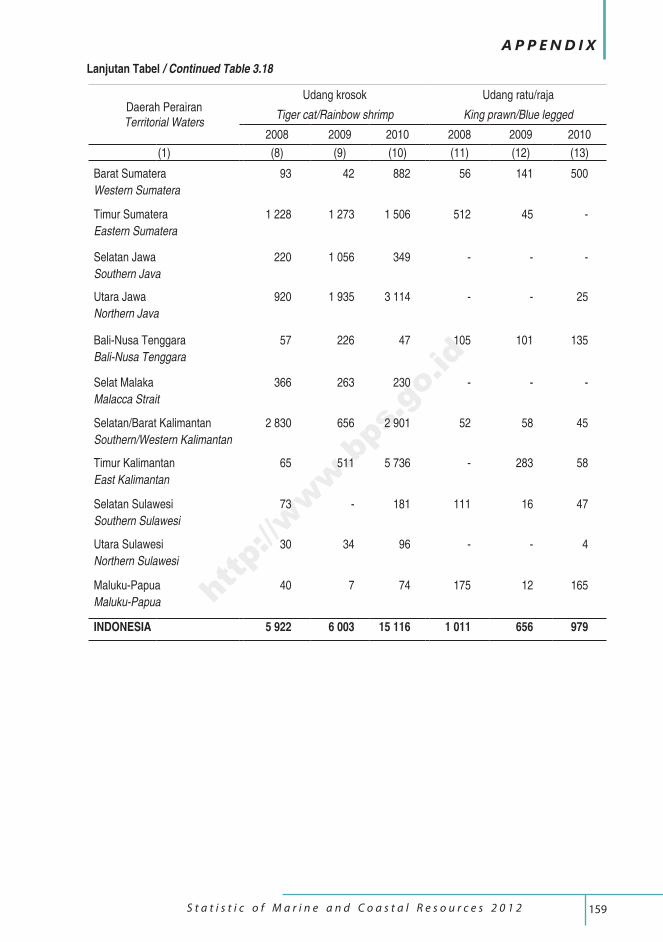
159 S t a t i s t i c o f M a r i n e a n d C o a s t a l R e s o u r c e s 2 0 1 2
A P P E N D I X
Daerah Perairan Territorial Waters
Udang krosok Udang ratu/raja
Tiger cat/Rainbow shrimp King prawn/Blue legged
2008 2009 2010 2008 2009 2010
(1) (8) (9) (10) (11) (12) (13)
Barat Sumatera 93 42 882 56 141 500
Western Sumatera
Timur Sumatera 1 228 1 273 1 506 512 45 -
Eastern Sumatera
Selatan Jawa 220 1 056 349 - - -
Southern Java
Utara Jawa 920 1 935 3 114 - - 25
Northern Java
Bali-Nusa Tenggara 57 226 47 105 101 135
Bali-Nusa Tenggara
Selat Malaka 366 263 230 - - -
Malacca Strait
Selatan/Barat Kalimantan 2 830 656 2 901 52 58 45
Southern/Western Kalimantan
Timur Kalimantan 65 511 5 736 - 283 58
East Kalimantan
Selatan Sulawesi 73 - 181 111 16 47
Southern Sulawesi
Utara Sulawesi 30 34 96 - - 4
Northern Sulawesi
Maluku-Papua 40 7 74 175 12 165
Maluku-Papua
INDONESIA 5 922 6 003 15 116 1 011 656 979
Lanjutan Tabel / Continued Table 3.18
http://www.bps.go.id
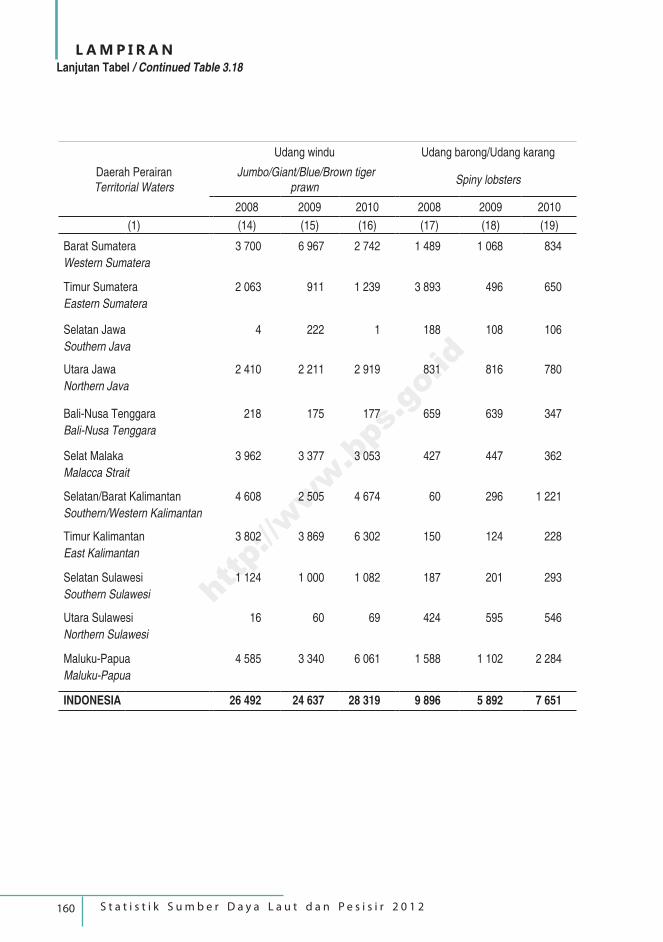
160 S t a t i s t i k S u m b e r D a y a L a u t d a n P e s i s i r 2 0 1 2
L A M P I R A N
Daerah Perairan Territorial Waters
Udang windu Udang barong/Udang karang
Jumbo/Giant/Blue/Brown tiger prawn
Spiny lobsters
2008 2009 2010 2008 2009 2010
(1) (14) (15) (16) (17) (18) (19)
Barat Sumatera 3 700 6 967 2 742 1 489 1 068 834
Western Sumatera
Timur Sumatera 2 063 911 1 239 3 893 496 650
Eastern Sumatera
Selatan Jawa 4 222 1 188 108 106
Southern Java
Utara Jawa 2 410 2 211 2 919 831 816 780
Northern Java
Bali-Nusa Tenggara 218 175 177 659 639 347
Bali-Nusa Tenggara
Selat Malaka 3 962 3 377 3 053 427 447 362
Malacca Strait
Selatan/Barat Kalimantan 4 608 2 505 4 674 60 296 1 221
Southern/Western Kalimantan
Timur Kalimantan 3 802 3 869 6 302 150 124 228
East Kalimantan
Selatan Sulawesi 1 124 1 000 1 082 187 201 293
Southern Sulawesi
Utara Sulawesi 16 60 69 424 595 546
Northern Sulawesi
Maluku-Papua 4 585 3 340 6 061 1 588 1 102 2 284
Maluku-Papua
INDONESIA 26 492 24 637 28 319 9 896 5 892 7 651
Lanjutan Tabel / Continued Table 3.18
http://www.bps.go.id
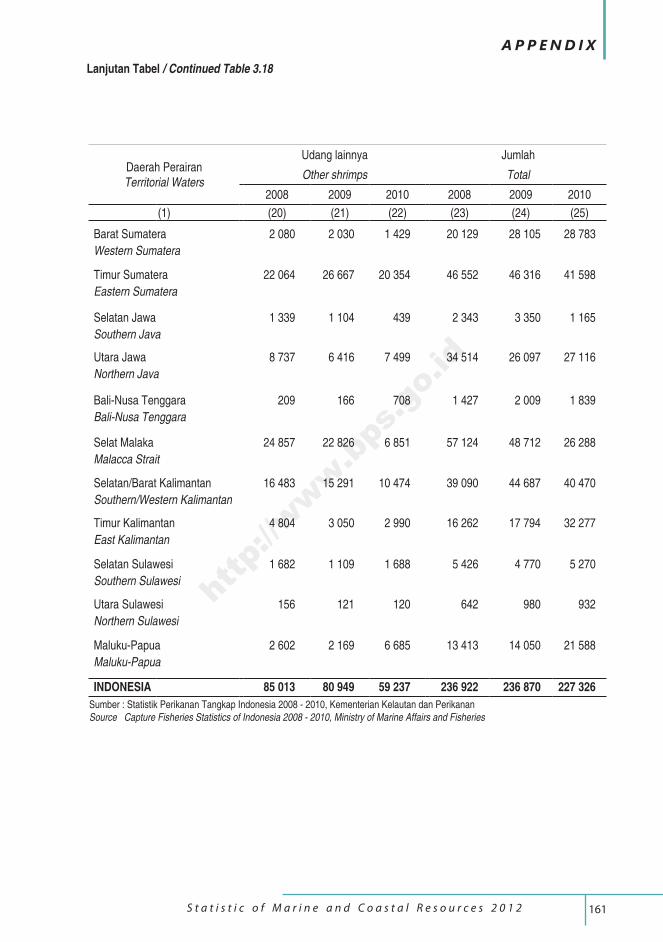
161 S t a t i s t i c o f M a r i n e a n d C o a s t a l R e s o u r c e s 2 0 1 2
A P P E N D I X
Daerah Perairan Territorial Waters
Udang lainnya Jumlah
Other shrimps Total
2008 2009 2010 2008 2009 2010
(1) (20) (21) (22) (23) (24) (25)
Barat Sumatera 2 080 2 030 1 429 20 129 28 105 28 783
Western Sumatera
Timur Sumatera 22 064 26 667 20 354 46 552 46 316 41 598
Eastern Sumatera
Selatan Jawa 1 339 1 104 439 2 343 3 350 1 165
Southern Java
Utara Jawa 8 737 6 416 7 499 34 514 26 097 27 116
Northern Java
Bali-Nusa Tenggara 209 166 708 1 427 2 009 1 839
Bali-Nusa Tenggara
Selat Malaka 24 857 22 826 6 851 57 124 48 712 26 288
Malacca Strait
Selatan/Barat Kalimantan 16 483 15 291 10 474 39 090 44 687 40 470
Southern/Western Kalimantan
Timur Kalimantan 4 804 3 050 2 990 16 262 17 794 32 277
East Kalimantan
Selatan Sulawesi 1 682 1 109 1 688 5 426 4 770 5 270
Southern Sulawesi
Utara Sulawesi 156 121 120 642 980 932
Northern Sulawesi
Maluku-Papua 2 602 2 169 6 685 13 413 14 050 21 588
Maluku-Papua
INDONESIA 85 013 80 949 59 237 236 922 236 870 227 326
Lanjutan Tabel / Continued Table 3.18
Sumber : Statistik Perikanan Tangkap Indonesia 2008 - 2010, Kementerian Kelautan dan PerikananSource Capture Fisheries Statistics of Indonesia 2008 - 2010, Ministry of Marine Affairs and Fisheries
http://www.bps.go.id
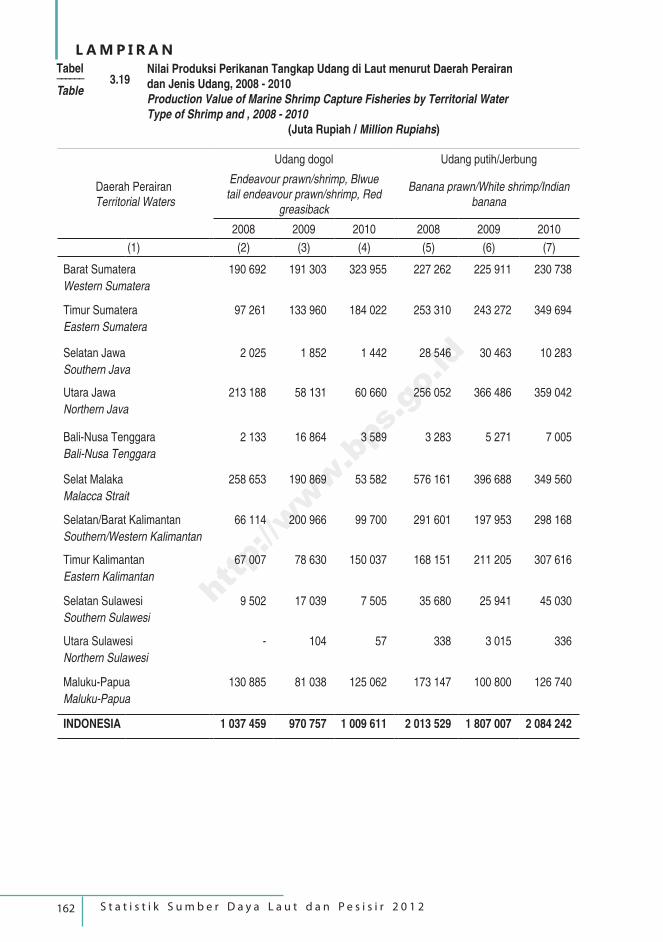
162 S t a t i s t i k S u m b e r D a y a L a u t d a n P e s i s i r 2 0 1 2
L A M P I R A N
Daerah Perairan Territorial Waters
Udang dogol Udang putih/Jerbung
Endeavour prawn/shrimp, Blwue tail endeavour prawn/shrimp, Red
greasiback
Banana prawn/White shrimp/Indian banana
2008 2009 2010 2008 2009 2010
(1) (2) (3) (4) (5) (6) (7)
Barat Sumatera 190 692 191 303 323 955 227 262 225 911 230 738
Western Sumatera
Timur Sumatera 97 261 133 960 184 022 253 310 243 272 349 694
Eastern Sumatera
Selatan Jawa 2 025 1 852 1 442 28 546 30 463 10 283
Southern Java
Utara Jawa 213 188 58 131 60 660 256 052 366 486 359 042
Northern Java
Bali-Nusa Tenggara 2 133 16 864 3 589 3 283 5 271 7 005
Bali-Nusa Tenggara
Selat Malaka 258 653 190 869 53 582 576 161 396 688 349 560
Malacca Strait
Selatan/Barat Kalimantan 66 114 200 966 99 700 291 601 197 953 298 168
Southern/Western Kalimantan
Timur Kalimantan 67 007 78 630 150 037 168 151 211 205 307 616
Eastern Kalimantan
Selatan Sulawesi 9 502 17 039 7 505 35 680 25 941 45 030
Southern Sulawesi
Utara Sulawesi - 104 57 338 3 015 336
Northern Sulawesi
Maluku-Papua 130 885 81 038 125 062 173 147 100 800 126 740
Maluku-Papua
INDONESIA 1 037 459 970 757 1 009 611 2 013 529 1 807 007 2 084 242
Tabel –––––– 3.19Table
Nilai Produksi Perikanan Tangkap Udang di Laut menurut Daerah Perairandan Jenis Udang, 2008 - 2010Production Value of Marine Shrimp Capture Fisheries by Territorial WaterType of Shrimp and , 2008 - 2010
(Juta Rupiah / Million Rupiahs)
http://www.bps.go.id
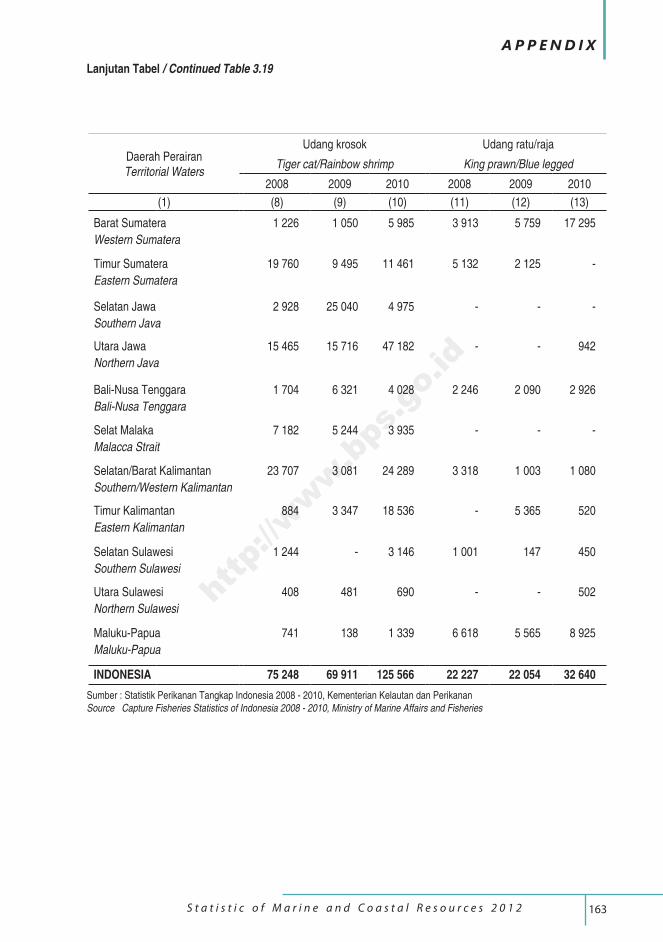
163 S t a t i s t i c o f M a r i n e a n d C o a s t a l R e s o u r c e s 2 0 1 2
A P P E N D I X
Daerah Perairan Territorial Waters
Udang krosok Udang ratu/raja
Tiger cat/Rainbow shrimp King prawn/Blue legged
2008 2009 2010 2008 2009 2010
(1) (8) (9) (10) (11) (12) (13)
Barat Sumatera 1 226 1 050 5 985 3 913 5 759 17 295
Western Sumatera
Timur Sumatera 19 760 9 495 11 461 5 132 2 125 -
Eastern Sumatera
Selatan Jawa 2 928 25 040 4 975 - - -
Southern Java
Utara Jawa 15 465 15 716 47 182 - - 942
Northern Java
Bali-Nusa Tenggara 1 704 6 321 4 028 2 246 2 090 2 926
Bali-Nusa Tenggara
Selat Malaka 7 182 5 244 3 935 - - -
Malacca Strait
Selatan/Barat Kalimantan 23 707 3 081 24 289 3 318 1 003 1 080
Southern/Western Kalimantan
Timur Kalimantan 884 3 347 18 536 - 5 365 520
Eastern Kalimantan
Selatan Sulawesi 1 244 - 3 146 1 001 147 450
Southern Sulawesi
Utara Sulawesi 408 481 690 - - 502
Northern Sulawesi
Maluku-Papua 741 138 1 339 6 618 5 565 8 925
Maluku-Papua
INDONESIA 75 248 69 911 125 566 22 227 22 054 32 640
Lanjutan Tabel / Continued Table 3.19
Sumber : Statistik Perikanan Tangkap Indonesia 2008 - 2010, Kementerian Kelautan dan PerikananSource Capture Fisheries Statistics of Indonesia 2008 - 2010, Ministry of Marine Affairs and Fisheries
http://www.bps.go.id
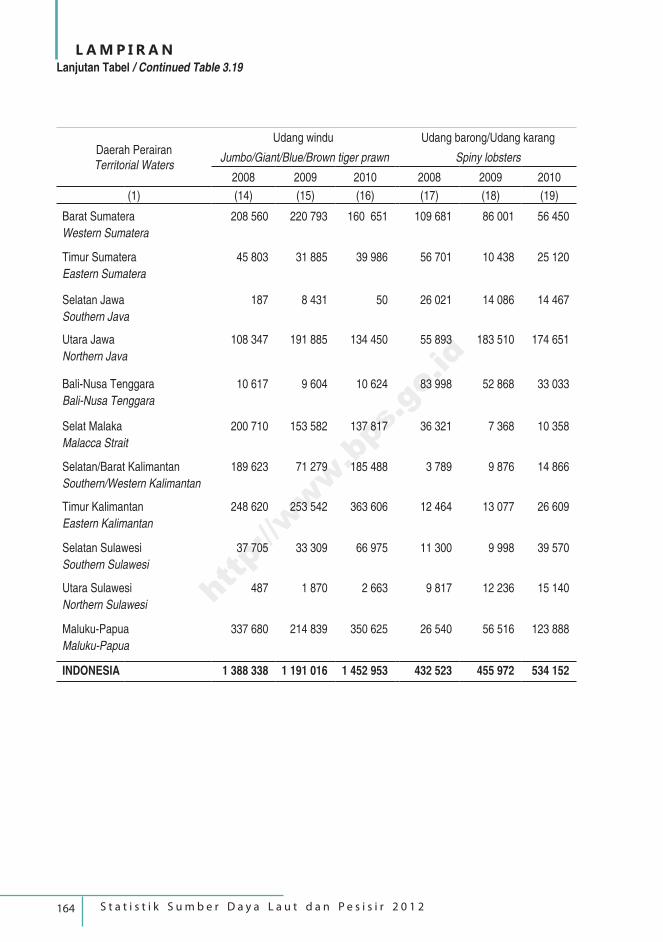
164 S t a t i s t i k S u m b e r D a y a L a u t d a n P e s i s i r 2 0 1 2
L A M P I R A N
Daerah Perairan Territorial Waters
Udang windu Udang barong/Udang karang
Jumbo/Giant/Blue/Brown tiger prawn Spiny lobsters
2008 2009 2010 2008 2009 2010
(1) (14) (15) (16) (17) (18) (19)
Barat Sumatera 208 560 220 793 160 651 109 681 86 001 56 450
Western Sumatera
Timur Sumatera 45 803 31 885 39 986 56 701 10 438 25 120
Eastern Sumatera
Selatan Jawa 187 8 431 50 26 021 14 086 14 467
Southern Java
Utara Jawa 108 347 191 885 134 450 55 893 183 510 174 651
Northern Java
Bali-Nusa Tenggara 10 617 9 604 10 624 83 998 52 868 33 033
Bali-Nusa Tenggara
Selat Malaka 200 710 153 582 137 817 36 321 7 368 10 358
Malacca Strait
Selatan/Barat Kalimantan 189 623 71 279 185 488 3 789 9 876 14 866
Southern/Western Kalimantan
Timur Kalimantan 248 620 253 542 363 606 12 464 13 077 26 609
Eastern Kalimantan
Selatan Sulawesi 37 705 33 309 66 975 11 300 9 998 39 570
Southern Sulawesi
Utara Sulawesi 487 1 870 2 663 9 817 12 236 15 140
Northern Sulawesi
Maluku-Papua 337 680 214 839 350 625 26 540 56 516 123 888
Maluku-Papua
INDONESIA 1 388 338 1 191 016 1 452 953 432 523 455 972 534 152
Lanjutan Tabel / Continued Table 3.19
http://www.bps.go.id
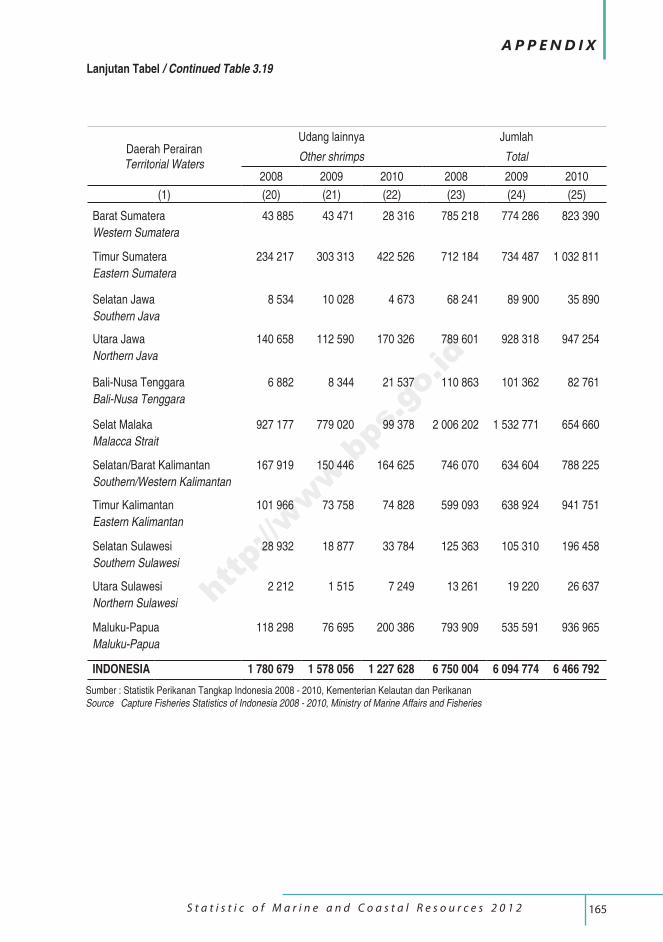
165 S t a t i s t i c o f M a r i n e a n d C o a s t a l R e s o u r c e s 2 0 1 2
A P P E N D I X
Daerah Perairan Territorial Waters
Udang lainnya Jumlah
Other shrimps Total
2008 2009 2010 2008 2009 2010
(1) (20) (21) (22) (23) (24) (25)
Barat Sumatera 43 885 43 471 28 316 785 218 774 286 823 390
Western Sumatera
Timur Sumatera 234 217 303 313 422 526 712 184 734 487 1 032 811
Eastern Sumatera
Selatan Jawa 8 534 10 028 4 673 68 241 89 900 35 890
Southern Java
Utara Jawa 140 658 112 590 170 326 789 601 928 318 947 254
Northern Java
Bali-Nusa Tenggara 6 882 8 344 21 537 110 863 101 362 82 761
Bali-Nusa Tenggara
Selat Malaka 927 177 779 020 99 378 2 006 202 1 532 771 654 660
Malacca Strait
Selatan/Barat Kalimantan 167 919 150 446 164 625 746 070 634 604 788 225
Southern/Western Kalimantan
Timur Kalimantan 101 966 73 758 74 828 599 093 638 924 941 751
Eastern Kalimantan
Selatan Sulawesi 28 932 18 877 33 784 125 363 105 310 196 458
Southern Sulawesi
Utara Sulawesi 2 212 1 515 7 249 13 261 19 220 26 637
Northern Sulawesi
Maluku-Papua 118 298 76 695 200 386 793 909 535 591 936 965
Maluku-Papua
INDONESIA 1 780 679 1 578 056 1 227 628 6 750 004 6 094 774 6 466 792
Lanjutan Tabel / Continued Table 3.19
Sumber : Statistik Perikanan Tangkap Indonesia 2008 - 2010, Kementerian Kelautan dan PerikananSource Capture Fisheries Statistics of Indonesia 2008 - 2010, Ministry of Marine Affairs and Fisheries
http://www.bps.go.id
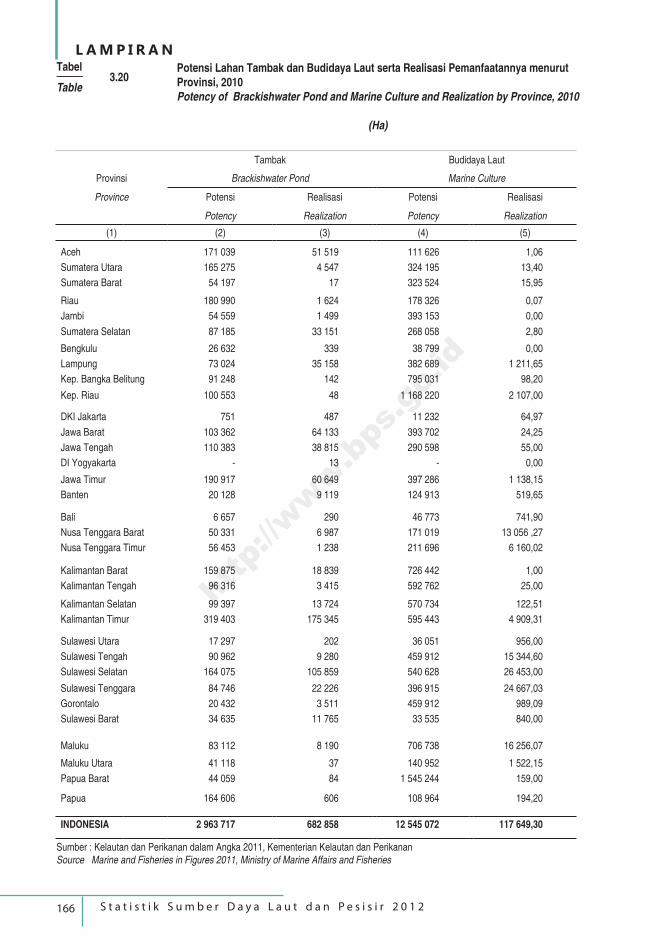
166 S t a t i s t i k S u m b e r D a y a L a u t d a n P e s i s i r 2 0 1 2
L A M P I R A N
Tambak Budidaya Laut
Provinsi Brackishwater Pond Marine Culture
Province Potensi Realisasi Potensi Realisasi
Potency Realization Potency Realization
(1) (2) (3) (4) (5)
Aceh 171 039 51 519 111 626 1,06
Sumatera Utara 165 275 4 547 324 195 13,40
Sumatera Barat 54 197 17 323 524 15,95
Riau 180 990 1 624 178 326 0,07
Jambi 54 559 1 499 393 153 0,00
Sumatera Selatan 87 185 33 151 268 058 2,80
Bengkulu 26 632 339 38 799 0,00
Lampung 73 024 35 158 382 689 1 211,65
Kep. Bangka Belitung 91 248 142 795 031 98,20
Kep. Riau 100 553 48 1 168 220 2 107,00
DKI Jakarta 751 487 11 232 64,97
Jawa Barat 103 362 64 133 393 702 24,25
Jawa Tengah 110 383 38 815 290 598 55,00
DI Yogyakarta - 13 - 0,00
Jawa Timur 190 917 60 649 397 286 1 138,15
Banten 20 128 9 119 124 913 519,65
Bali 6 657 290 46 773 741,90
Nusa Tenggara Barat 50 331 6 987 171 019 13 056 ,27
Nusa Tenggara Timur 56 453 1 238 211 696 6 160,02
Kalimantan Barat 159 875 18 839 726 442 1,00
Kalimantan Tengah 96 316 3 415 592 762 25,00
Kalimantan Selatan 99 397 13 724 570 734 122,51
Kalimantan Timur 319 403 175 345 595 443 4 909,31
Sulawesi Utara 17 297 202 36 051 956,00
Sulawesi Tengah 90 962 9 280 459 912 15 344,60
Sulawesi Selatan 164 075 105 859 540 628 26 453,00
Sulawesi Tenggara 84 746 22 226 396 915 24 667,03
Gorontalo 20 432 3 511 459 912 989,09
Sulawesi Barat 34 635 11 765 33 535 840,00
Maluku 83 112 8 190 706 738 16 256,07
Maluku Utara 41 118 37 140 952 1 522,15
Papua Barat 44 059 84 1 545 244 159,00
Papua 164 606 606 108 964 194,20
INDONESIA 2 963 717 682 858 12 545 072 117 649,30
Sumber : Kelautan dan Perikanan dalam Angka 2011, Kementerian Kelautan dan PerikananSource Marine and Fisheries in Figures 2011, Ministry of Marine Affairs and Fisheries
Tabel –––––– 3.20Table
Potensi Lahan Tambak dan Budidaya Laut serta Realisasi Pemanfaatannya menurut Provinsi, 2010Potency of Brackishwater Pond and Marine Culture and Realization by Province, 2010
(Ha)
http://www.bps.go.id
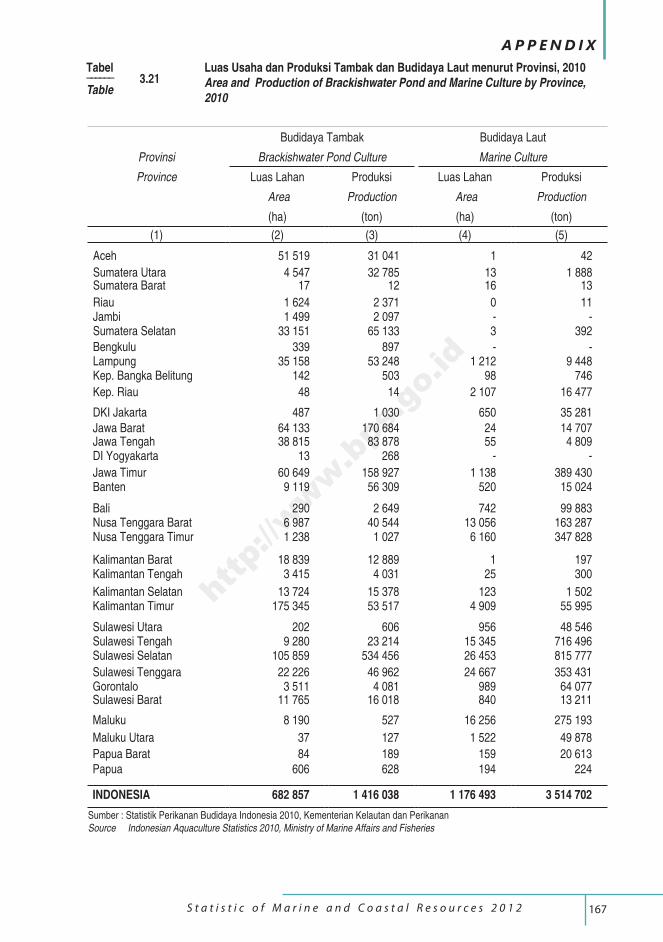
167 S t a t i s t i c o f M a r i n e a n d C o a s t a l R e s o u r c e s 2 0 1 2
A P P E N D I X
Budidaya Tambak Budidaya Laut
Provinsi Brackishwater Pond Culture Marine Culture
Province Luas Lahan Produksi Luas Lahan Produksi
Area Production Area Production
(ha) (ton) (ha) (ton)
(1) (2) (3) (4) (5)
Aceh 51 519 31 041 1 42
Sumatera Utara 4 547 32 785 13 1 888Sumatera Barat 17 12 16 13
Riau 1 624 2 371 0 11Jambi 1 499 2 097 - -Sumatera Selatan 33 151 65 133 3 392
Bengkulu 339 897 - -Lampung 35 158 53 248 1 212 9 448Kep. Bangka Belitung 142 503 98 746
Kep. Riau 48 14 2 107 16 477
DKI Jakarta 487 1 030 650 35 281Jawa Barat 64 133 170 684 24 14 707Jawa Tengah 38 815 83 878 55 4 809DI Yogyakarta 13 268 - -
Jawa Timur 60 649 158 927 1 138 389 430Banten 9 119 56 309 520 15 024
Bali 290 2 649 742 99 883Nusa Tenggara Barat 6 987 40 544 13 056 163 287Nusa Tenggara Timur 1 238 1 027 6 160 347 828
Kalimantan Barat 18 839 12 889 1 197Kalimantan Tengah 3 415 4 031 25 300
Kalimantan Selatan 13 724 15 378 123 1 502Kalimantan Timur 175 345 53 517 4 909 55 995
Sulawesi Utara 202 606 956 48 546Sulawesi Tengah 9 280 23 214 15 345 716 496Sulawesi Selatan 105 859 534 456 26 453 815 777
Sulawesi Tenggara 22 226 46 962 24 667 353 431Gorontalo 3 511 4 081 989 64 077Sulawesi Barat 11 765 16 018 840 13 211
Maluku 8 190 527 16 256 275 193
Maluku Utara 37 127 1 522 49 878
Papua Barat 84 189 159 20 613Papua 606 628 194 224
INDONESIA 682 857 1 416 038 1 176 493 3 514 702
Tabel –––––– 3.21Table
Luas Usaha dan Produksi Tambak dan Budidaya Laut menurut Provinsi, 2010Area and Production of Brackishwater Pond and Marine Culture by Province, 2010
Sumber : Statistik Perikanan Budidaya Indonesia 2010, Kementerian Kelautan dan PerikananSource Indonesian Aquaculture Statistics 2010, Ministry of Marine Affairs and Fisheries
http://www.bps.go.id
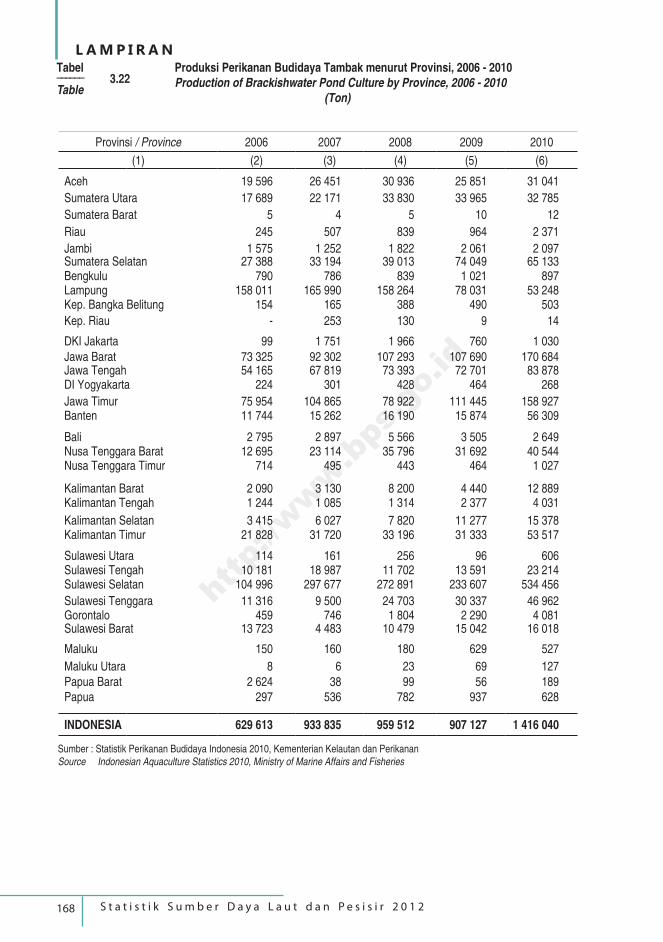
168 S t a t i s t i k S u m b e r D a y a L a u t d a n P e s i s i r 2 0 1 2
L A M P I R A N
Provinsi / Province 2006 2007 2008 2009 2010
(1) (2) (3) (4) (5) (6)
Aceh 19 596 26 451 30 936 25 851 31 041
Sumatera Utara 17 689 22 171 33 830 33 965 32 785
Sumatera Barat 5 4 5 10 12
Riau 245 507 839 964 2 371
Jambi 1 575 1 252 1 822 2 061 2 097Sumatera Selatan 27 388 33 194 39 013 74 049 65 133Bengkulu 790 786 839 1 021 897Lampung 158 011 165 990 158 264 78 031 53 248Kep. Bangka Belitung 154 165 388 490 503
Kep. Riau - 253 130 9 14
DKI Jakarta 99 1 751 1 966 760 1 030Jawa Barat 73 325 92 302 107 293 107 690 170 684Jawa Tengah 54 165 67 819 73 393 72 701 83 878DI Yogyakarta 224 301 428 464 268
Jawa Timur 75 954 104 865 78 922 111 445 158 927Banten 11 744 15 262 16 190 15 874 56 309
Bali 2 795 2 897 5 566 3 505 2 649Nusa Tenggara Barat 12 695 23 114 35 796 31 692 40 544Nusa Tenggara Timur 714 495 443 464 1 027
Kalimantan Barat 2 090 3 130 8 200 4 440 12 889Kalimantan Tengah 1 244 1 085 1 314 2 377 4 031
Kalimantan Selatan 3 415 6 027 7 820 11 277 15 378Kalimantan Timur 21 828 31 720 33 196 31 333 53 517
Sulawesi Utara 114 161 256 96 606Sulawesi Tengah 10 181 18 987 11 702 13 591 23 214Sulawesi Selatan 104 996 297 677 272 891 233 607 534 456
Sulawesi Tenggara 11 316 9 500 24 703 30 337 46 962Gorontalo 459 746 1 804 2 290 4 081Sulawesi Barat 13 723 4 483 10 479 15 042 16 018
Maluku 150 160 180 629 527
Maluku Utara 8 6 23 69 127Papua Barat 2 624 38 99 56 189Papua 297 536 782 937 628
INDONESIA 629 613 933 835 959 512 907 127 1 416 040
Tabel –––––– 3.22Table
Produksi Perikanan Budidaya Tambak menurut Provinsi, 2006 - 2010Production of Brackishwater Pond Culture by Province, 2006 - 2010 (Ton)
Sumber : Statistik Perikanan Budidaya Indonesia 2010, Kementerian Kelautan dan PerikananSource Indonesian Aquaculture Statistics 2010, Ministry of Marine Affairs and Fisheries
http://www.bps.go.id
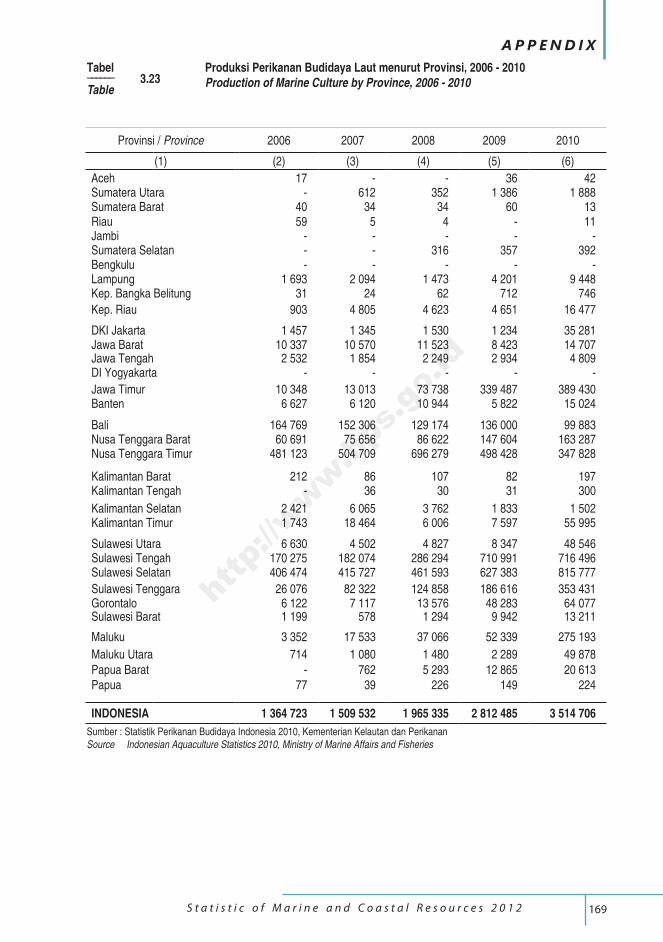
169 S t a t i s t i c o f M a r i n e a n d C o a s t a l R e s o u r c e s 2 0 1 2
A P P E N D I X
Provinsi / Province 2006 2007 2008 2009 2010
(1) (2) (3) (4) (5) (6)
Aceh 17 - - 36 42Sumatera Utara - 612 352 1 386 1 888Sumatera Barat 40 34 34 60 13Riau 59 5 4 - 11Jambi - - - - -Sumatera Selatan - - 316 357 392Bengkulu - - - - -Lampung 1 693 2 094 1 473 4 201 9 448Kep. Bangka Belitung 31 24 62 712 746
Kep. Riau 903 4 805 4 623 4 651 16 477
DKI Jakarta 1 457 1 345 1 530 1 234 35 281Jawa Barat 10 337 10 570 11 523 8 423 14 707Jawa Tengah 2 532 1 854 2 249 2 934 4 809DI Yogyakarta - - - - -
Jawa Timur 10 348 13 013 73 738 339 487 389 430Banten 6 627 6 120 10 944 5 822 15 024
Bali 164 769 152 306 129 174 136 000 99 883Nusa Tenggara Barat 60 691 75 656 86 622 147 604 163 287Nusa Tenggara Timur 481 123 504 709 696 279 498 428 347 828
Kalimantan Barat 212 86 107 82 197Kalimantan Tengah - 36 30 31 300
Kalimantan Selatan 2 421 6 065 3 762 1 833 1 502Kalimantan Timur 1 743 18 464 6 006 7 597 55 995
Sulawesi Utara 6 630 4 502 4 827 8 347 48 546Sulawesi Tengah 170 275 182 074 286 294 710 991 716 496Sulawesi Selatan 406 474 415 727 461 593 627 383 815 777
Sulawesi Tenggara 26 076 82 322 124 858 186 616 353 431Gorontalo 6 122 7 117 13 576 48 283 64 077Sulawesi Barat 1 199 578 1 294 9 942 13 211
Maluku 3 352 17 533 37 066 52 339 275 193
Maluku Utara 714 1 080 1 480 2 289 49 878Papua Barat - 762 5 293 12 865 20 613Papua 77 39 226 149 224
INDONESIA 1 364 723 1 509 532 1 965 335 2 812 485 3 514 706
Tabel –––––– 3.23Table
Produksi Perikanan Budidaya Laut menurut Provinsi, 2006 - 2010Production of Marine Culture by Province, 2006 - 2010
Sumber : Statistik Perikanan Budidaya Indonesia 2010, Kementerian Kelautan dan PerikananSource Indonesian Aquaculture Statistics 2010, Ministry of Marine Affairs and Fisheries
http://www.bps.go.id
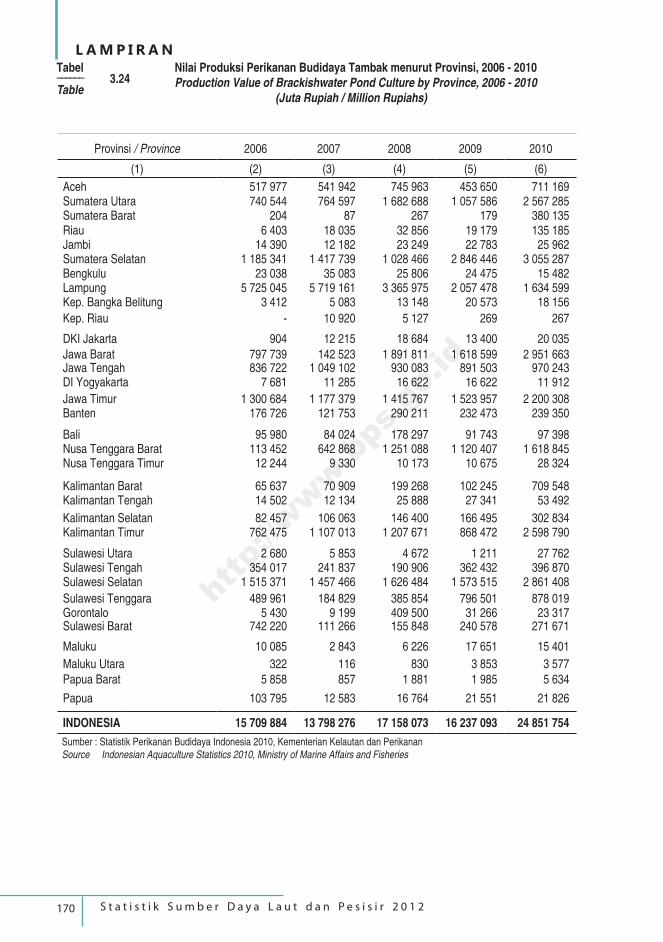
170 S t a t i s t i k S u m b e r D a y a L a u t d a n P e s i s i r 2 0 1 2
L A M P I R A N
Provinsi / Province 2006 2007 2008 2009 2010
(1) (2) (3) (4) (5) (6)
Aceh 517 977 541 942 745 963 453 650 711 169Sumatera Utara 740 544 764 597 1 682 688 1 057 586 2 567 285Sumatera Barat 204 87 267 179 380 135Riau 6 403 18 035 32 856 19 179 135 185Jambi 14 390 12 182 23 249 22 783 25 962Sumatera Selatan 1 185 341 1 417 739 1 028 466 2 846 446 3 055 287Bengkulu 23 038 35 083 25 806 24 475 15 482Lampung 5 725 045 5 719 161 3 365 975 2 057 478 1 634 599Kep. Bangka Belitung 3 412 5 083 13 148 20 573 18 156
Kep. Riau - 10 920 5 127 269 267
DKI Jakarta 904 12 215 18 684 13 400 20 035Jawa Barat 797 739 142 523 1 891 811 1 618 599 2 951 663Jawa Tengah 836 722 1 049 102 930 083 891 503 970 243DI Yogyakarta 7 681 11 285 16 622 16 622 11 912
Jawa Timur 1 300 684 1 177 379 1 415 767 1 523 957 2 200 308Banten 176 726 121 753 290 211 232 473 239 350
Bali 95 980 84 024 178 297 91 743 97 398Nusa Tenggara Barat 113 452 642 868 1 251 088 1 120 407 1 618 845Nusa Tenggara Timur 12 244 9 330 10 173 10 675 28 324
Kalimantan Barat 65 637 70 909 199 268 102 245 709 548Kalimantan Tengah 14 502 12 134 25 888 27 341 53 492
Kalimantan Selatan 82 457 106 063 146 400 166 495 302 834Kalimantan Timur 762 475 1 107 013 1 207 671 868 472 2 598 790
Sulawesi Utara 2 680 5 853 4 672 1 211 27 762Sulawesi Tengah 354 017 241 837 190 906 362 432 396 870Sulawesi Selatan 1 515 371 1 457 466 1 626 484 1 573 515 2 861 408
Sulawesi Tenggara 489 961 184 829 385 854 796 501 878 019Gorontalo 5 430 9 199 409 500 31 266 23 317Sulawesi Barat 742 220 111 266 155 848 240 578 271 671
Maluku 10 085 2 843 6 226 17 651 15 401
Maluku Utara 322 116 830 3 853 3 577Papua Barat 5 858 857 1 881 1 985 5 634
Papua 103 795 12 583 16 764 21 551 21 826
INDONESIA 15 709 884 13 798 276 17 158 073 16 237 093 24 851 754
Tabel –––––– 3.24Table
Nilai Produksi Perikanan Budidaya Tambak menurut Provinsi, 2006 - 2010Production Value of Brackishwater Pond Culture by Province, 2006 - 2010 (Juta Rupiah / Million Rupiahs)
Sumber : Statistik Perikanan Budidaya Indonesia 2010, Kementerian Kelautan dan PerikananSource Indonesian Aquaculture Statistics 2010, Ministry of Marine Affairs and Fisheries
http://www.bps.go.id
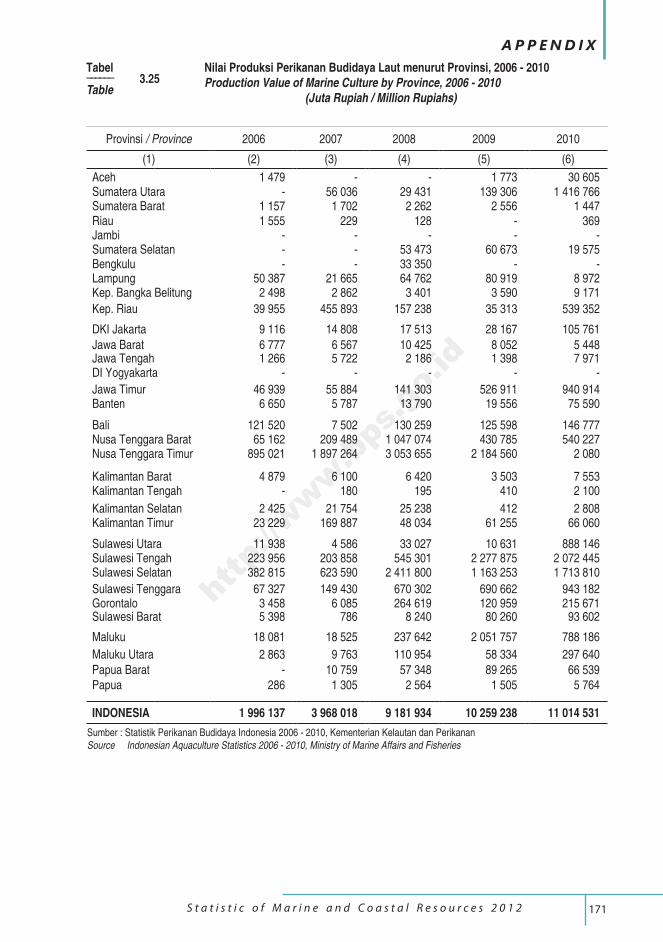
171 S t a t i s t i c o f M a r i n e a n d C o a s t a l R e s o u r c e s 2 0 1 2
A P P E N D I X
Provinsi / Province 2006 2007 2008 2009 2010
(1) (2) (3) (4) (5) (6)
Aceh 1 479 - - 1 773 30 605Sumatera Utara - 56 036 29 431 139 306 1 416 766 Sumatera Barat 1 157 1 702 2 262 2 556 1 447Riau 1 555 229 128 - 369Jambi - - - - -Sumatera Selatan - - 53 473 60 673 19 575Bengkulu - - 33 350 - -Lampung 50 387 21 665 64 762 80 919 8 972Kep. Bangka Belitung 2 498 2 862 3 401 3 590 9 171
Kep. Riau 39 955 455 893 157 238 35 313 539 352
DKI Jakarta 9 116 14 808 17 513 28 167 105 761Jawa Barat 6 777 6 567 10 425 8 052 5 448Jawa Tengah 1 266 5 722 2 186 1 398 7 971DI Yogyakarta - - - - -
Jawa Timur 46 939 55 884 141 303 526 911 940 914Banten 6 650 5 787 13 790 19 556 75 590
Bali 121 520 7 502 130 259 125 598 146 777Nusa Tenggara Barat 65 162 209 489 1 047 074 430 785 540 227Nusa Tenggara Timur 895 021 1 897 264 3 053 655 2 184 560 2 080
Kalimantan Barat 4 879 6 100 6 420 3 503 7 553Kalimantan Tengah - 180 195 410 2 100
Kalimantan Selatan 2 425 21 754 25 238 412 2 808Kalimantan Timur 23 229 169 887 48 034 61 255 66 060
Sulawesi Utara 11 938 4 586 33 027 10 631 888 146 Sulawesi Tengah 223 956 203 858 545 301 2 277 875 2 072 445Sulawesi Selatan 382 815 623 590 2 411 800 1 163 253 1 713 810
Sulawesi Tenggara 67 327 149 430 670 302 690 662 943 182Gorontalo 3 458 6 085 264 619 120 959 215 671Sulawesi Barat 5 398 786 8 240 80 260 93 602
Maluku 18 081 18 525 237 642 2 051 757 788 186
Maluku Utara 2 863 9 763 110 954 58 334 297 640Papua Barat - 10 759 57 348 89 265 66 539Papua 286 1 305 2 564 1 505 5 764
INDONESIA 1 996 137 3 968 018 9 181 934 10 259 238 11 014 531
Tabel –––––– 3.25Table
Nilai Produksi Perikanan Budidaya Laut menurut Provinsi, 2006 - 2010Production Value of Marine Culture by Province, 2006 - 2010 (Juta Rupiah / Million Rupiahs)
Sumber : Statistik Perikanan Budidaya Indonesia 2006 - 2010, Kementerian Kelautan dan PerikananSource Indonesian Aquaculture Statistics 2006 - 2010, Ministry of Marine Affairs and Fisheries
http://www.bps.go.id
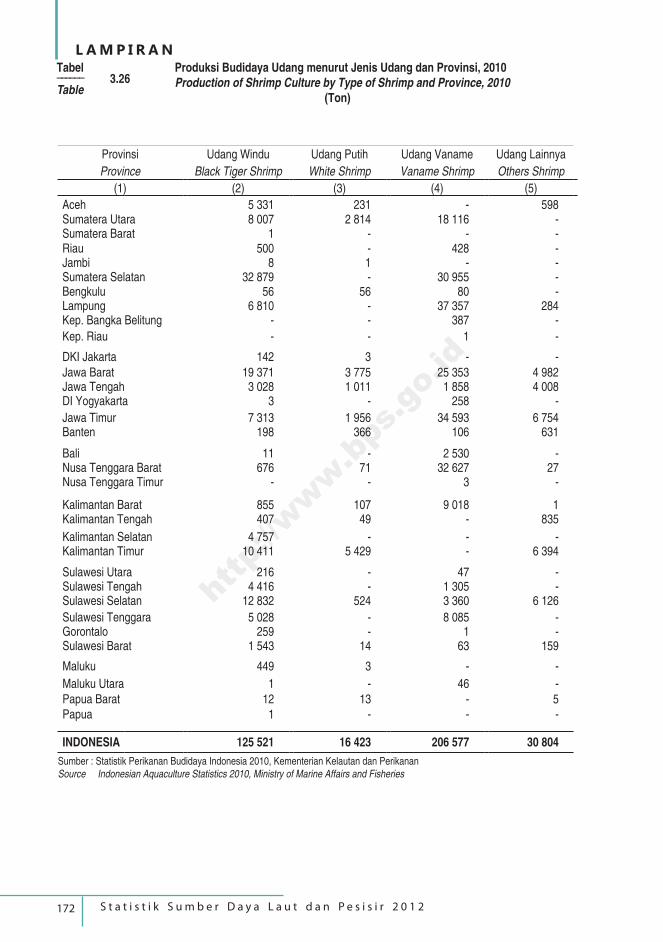
172 S t a t i s t i k S u m b e r D a y a L a u t d a n P e s i s i r 2 0 1 2
L A M P I R A N
Provinsi Udang Windu Udang Putih Udang Vaname Udang Lainnya
Province Black Tiger Shrimp White Shrimp Vaname Shrimp Others Shrimp
(1) (2) (3) (4) (5)
Aceh 5 331 231 - 598Sumatera Utara 8 007 2 814 18 116 -Sumatera Barat 1 - - -Riau 500 - 428 -Jambi 8 1 - -Sumatera Selatan 32 879 - 30 955 -Bengkulu 56 56 80 -Lampung 6 810 - 37 357 284Kep. Bangka Belitung - - 387 -
Kep. Riau - - 1 -
DKI Jakarta 142 3 - -Jawa Barat 19 371 3 775 25 353 4 982Jawa Tengah 3 028 1 011 1 858 4 008DI Yogyakarta 3 - 258 -
Jawa Timur 7 313 1 956 34 593 6 754Banten 198 366 106 631
Bali 11 - 2 530 -Nusa Tenggara Barat 676 71 32 627 27Nusa Tenggara Timur - - 3 -
Kalimantan Barat 855 107 9 018 1Kalimantan Tengah 407 49 - 835
Kalimantan Selatan 4 757 - - -Kalimantan Timur 10 411 5 429 - 6 394
Sulawesi Utara 216 - 47 -Sulawesi Tengah 4 416 - 1 305 -Sulawesi Selatan 12 832 524 3 360 6 126
Sulawesi Tenggara 5 028 - 8 085 -Gorontalo 259 - 1 -Sulawesi Barat 1 543 14 63 159
Maluku 449 3 - -
Maluku Utara 1 - 46 -Papua Barat 12 13 - 5Papua 1 - - -
INDONESIA 125 521 16 423 206 577 30 804
Tabel –––––– 3.26Table
Produksi Budidaya Udang menurut Jenis Udang dan Provinsi, 2010Production of Shrimp Culture by Type of Shrimp and Province, 2010 (Ton)
Sumber : Statistik Perikanan Budidaya Indonesia 2010, Kementerian Kelautan dan PerikananSource Indonesian Aquaculture Statistics 2010, Ministry of Marine Affairs and Fisheries
http://www.bps.go.id
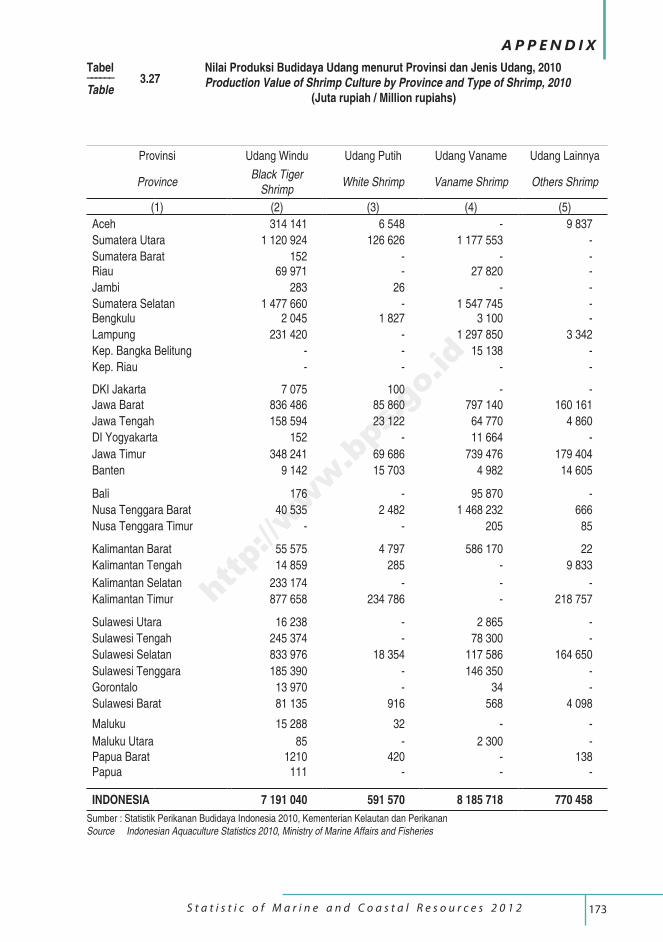
173 S t a t i s t i c o f M a r i n e a n d C o a s t a l R e s o u r c e s 2 0 1 2
A P P E N D I X
Provinsi Udang Windu Udang Putih Udang Vaname Udang Lainnya
ProvinceBlack Tiger
ShrimpWhite Shrimp Vaname Shrimp Others Shrimp
(1) (2) (3) (4) (5)
Aceh 314 141 6 548 - 9 837
Sumatera Utara 1 120 924 126 626 1 177 553 -
Sumatera Barat 152 - - -Riau 69 971 - 27 820 -
Jambi 283 26 - -
Sumatera Selatan 1 477 660 - 1 547 745 -Bengkulu 2 045 1 827 3 100 -
Lampung 231 420 - 1 297 850 3 342
Kep. Bangka Belitung - - 15 138 -
Kep. Riau - - - -
DKI Jakarta 7 075 100 - -Jawa Barat 836 486 85 860 797 140 160 161
Jawa Tengah 158 594 23 122 64 770 4 860
DI Yogyakarta 152 - 11 664 -
Jawa Timur 348 241 69 686 739 476 179 404
Banten 9 142 15 703 4 982 14 605
Bali 176 - 95 870 -
Nusa Tenggara Barat 40 535 2 482 1 468 232 666
Nusa Tenggara Timur - - 205 85
Kalimantan Barat 55 575 4 797 586 170 22
Kalimantan Tengah 14 859 285 - 9 833
Kalimantan Selatan 233 174 - - -
Kalimantan Timur 877 658 234 786 - 218 757
Sulawesi Utara 16 238 - 2 865 -
Sulawesi Tengah 245 374 - 78 300 -
Sulawesi Selatan 833 976 18 354 117 586 164 650
Sulawesi Tenggara 185 390 - 146 350 -
Gorontalo 13 970 - 34 -
Sulawesi Barat 81 135 916 568 4 098
Maluku 15 288 32 - -
Maluku Utara 85 - 2 300 -Papua Barat 1210 420 - 138Papua 111 - - -
INDONESIA 7 191 040 591 570 8 185 718 770 458
Tabel –––––– 3.27Table
Nilai Produksi Budidaya Udang menurut Provinsi dan Jenis Udang, 2010Production Value of Shrimp Culture by Province and Type of Shrimp, 2010 (Juta rupiah / Million rupiahs)
Sumber : Statistik Perikanan Budidaya Indonesia 2010, Kementerian Kelautan dan PerikananSource Indonesian Aquaculture Statistics 2010, Ministry of Marine Affairs and Fisheries
http://www.bps.go.id
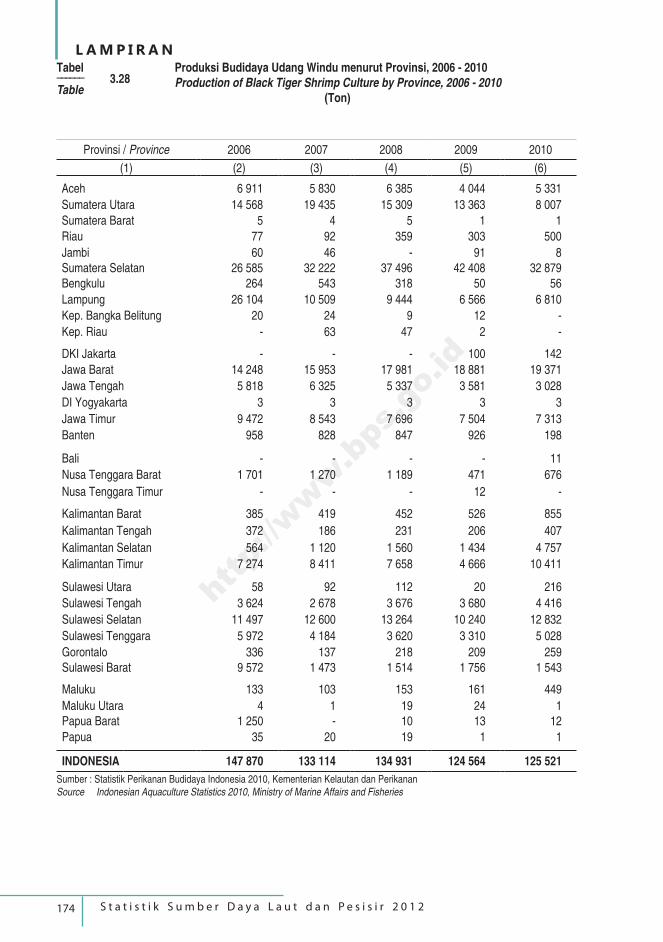
174 S t a t i s t i k S u m b e r D a y a L a u t d a n P e s i s i r 2 0 1 2
L A M P I R A N
Provinsi / Province 2006 2007 2008 2009 2010
(1) (2) (3) (4) (5) (6)
Aceh 6 911 5 830 6 385 4 044 5 331
Sumatera Utara 14 568 19 435 15 309 13 363 8 007
Sumatera Barat 5 4 5 1 1
Riau 77 92 359 303 500
Jambi 60 46 - 91 8Sumatera Selatan 26 585 32 222 37 496 42 408 32 879Bengkulu 264 543 318 50 56
Lampung 26 104 10 509 9 444 6 566 6 810
Kep. Bangka Belitung 20 24 9 12 -
Kep. Riau - 63 47 2 -
DKI Jakarta - - - 100 142
Jawa Barat 14 248 15 953 17 981 18 881 19 371
Jawa Tengah 5 818 6 325 5 337 3 581 3 028
DI Yogyakarta 3 3 3 3 3
Jawa Timur 9 472 8 543 7 696 7 504 7 313
Banten 958 828 847 926 198
Bali - - - - 11
Nusa Tenggara Barat 1 701 1 270 1 189 471 676
Nusa Tenggara Timur - - - 12 -
Kalimantan Barat 385 419 452 526 855
Kalimantan Tengah 372 186 231 206 407
Kalimantan Selatan 564 1 120 1 560 1 434 4 757
Kalimantan Timur 7 274 8 411 7 658 4 666 10 411
Sulawesi Utara 58 92 112 20 216
Sulawesi Tengah 3 624 2 678 3 676 3 680 4 416
Sulawesi Selatan 11 497 12 600 13 264 10 240 12 832
Sulawesi Tenggara 5 972 4 184 3 620 3 310 5 028
Gorontalo 336 137 218 209 259Sulawesi Barat 9 572 1 473 1 514 1 756 1 543
Maluku 133 103 153 161 449
Maluku Utara 4 1 19 24 1Papua Barat 1 250 - 10 13 12
Papua 35 20 19 1 1
INDONESIA 147 870 133 114 134 931 124 564 125 521
Tabel –––––– 3.28Table
Produksi Budidaya Udang Windu menurut Provinsi, 2006 - 2010Production of Black Tiger Shrimp Culture by Province, 2006 - 2010 (Ton)
Sumber : Statistik Perikanan Budidaya Indonesia 2010, Kementerian Kelautan dan PerikananSource Indonesian Aquaculture Statistics 2010, Ministry of Marine Affairs and Fisheries
http://www.bps.go.id
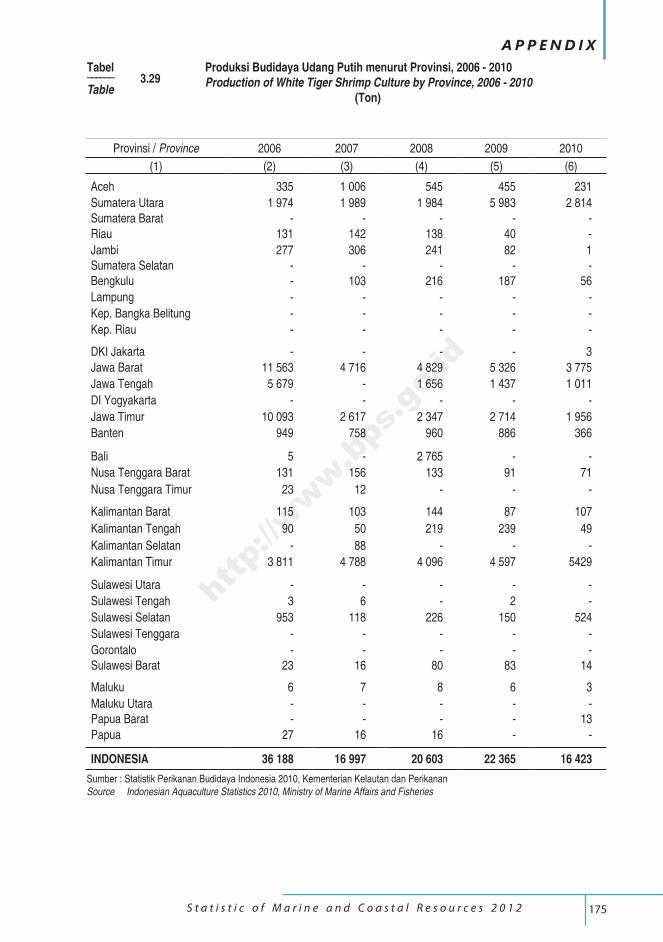
175 S t a t i s t i c o f M a r i n e a n d C o a s t a l R e s o u r c e s 2 0 1 2
A P P E N D I X
Provinsi / Province 2006 2007 2008 2009 2010
(1) (2) (3) (4) (5) (6)
Aceh 335 1 006 545 455 231
Sumatera Utara 1 974 1 989 1 984 5 983 2 814Sumatera Barat - - - - -Riau 131 142 138 40 -
Jambi 277 306 241 82 1Sumatera Selatan - - - - -Bengkulu - 103 216 187 56
Lampung - - - - -
Kep. Bangka Belitung - - - - -
Kep. Riau - - - - -
DKI Jakarta - - - - 3
Jawa Barat 11 563 4 716 4 829 5 326 3 775
Jawa Tengah 5 679 - 1 656 1 437 1 011
DI Yogyakarta - - - - -
Jawa Timur 10 093 2 617 2 347 2 714 1 956
Banten 949 758 960 886 366
Bali 5 - 2 765 - -
Nusa Tenggara Barat 131 156 133 91 71
Nusa Tenggara Timur 23 12 - - -
Kalimantan Barat 115 103 144 87 107
Kalimantan Tengah 90 50 219 239 49
Kalimantan Selatan - 88 - - -
Kalimantan Timur 3 811 4 788 4 096 4 597 5429
Sulawesi Utara - - - - -
Sulawesi Tengah 3 6 - 2 -
Sulawesi Selatan 953 118 226 150 524
Sulawesi Tenggara - - - - -
Gorontalo - - - - -Sulawesi Barat 23 16 80 83 14
Maluku 6 7 8 6 3
Maluku Utara - - - - -Papua Barat - - - - 13
Papua 27 16 16 - -
INDONESIA 36 188 16 997 20 603 22 365 16 423
Tabel –––––– 3.29Table
Produksi Budidaya Udang Putih menurut Provinsi, 2006 - 2010Production of White Tiger Shrimp Culture by Province, 2006 - 2010 (Ton)
Sumber : Statistik Perikanan Budidaya Indonesia 2010, Kementerian Kelautan dan PerikananSource Indonesian Aquaculture Statistics 2010, Ministry of Marine Affairs and Fisheries
http://www.bps.go.id
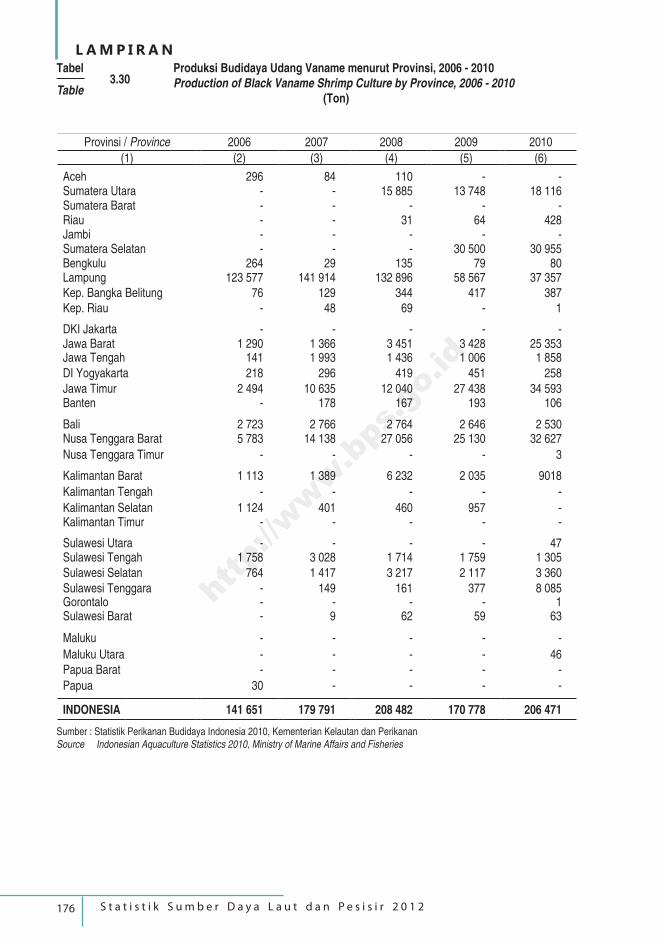
176 S t a t i s t i k S u m b e r D a y a L a u t d a n P e s i s i r 2 0 1 2
L A M P I R A N
Provinsi / Province 2006 2007 2008 2009 2010
(1) (2) (3) (4) (5) (6)
Aceh 296 84 110 - -Sumatera Utara - - 15 885 13 748 18 116Sumatera Barat - - - - -Riau - - 31 64 428Jambi - - - - -Sumatera Selatan - - - 30 500 30 955Bengkulu 264 29 135 79 80Lampung 123 577 141 914 132 896 58 567 37 357Kep. Bangka Belitung 76 129 344 417 387Kep. Riau - 48 69 - 1
DKI Jakarta - - - - -Jawa Barat 1 290 1 366 3 451 3 428 25 353Jawa Tengah 141 1 993 1 436 1 006 1 858DI Yogyakarta 218 296 419 451 258Jawa Timur 2 494 10 635 12 040 27 438 34 593Banten - 178 167 193 106
Bali 2 723 2 766 2 764 2 646 2 530Nusa Tenggara Barat 5 783 14 138 27 056 25 130 32 627
Nusa Tenggara Timur - - - - 3
Kalimantan Barat 1 113 1 389 6 232 2 035 9018
Kalimantan Tengah - - - - -
Kalimantan Selatan 1 124 401 460 957 -Kalimantan Timur - - - - -
Sulawesi Utara - - - - 47Sulawesi Tengah 1 758 3 028 1 714 1 759 1 305Sulawesi Selatan 764 1 417 3 217 2 117 3 360Sulawesi Tenggara - 149 161 377 8 085Gorontalo - - - - 1Sulawesi Barat - 9 62 59 63
Maluku - - - - -
Maluku Utara - - - - 46Papua Barat - - - - -
Papua 30 - - - -
INDONESIA 141 651 179 791 208 482 170 778 206 471
Tabel –––––– 3.30Table
Produksi Budidaya Udang Vaname menurut Provinsi, 2006 - 2010Production of Black Vaname Shrimp Culture by Province, 2006 - 2010 (Ton)
Sumber : Statistik Perikanan Budidaya Indonesia 2010, Kementerian Kelautan dan PerikananSource Indonesian Aquaculture Statistics 2010, Ministry of Marine Affairs and Fisheries
http://www.bps.go.id
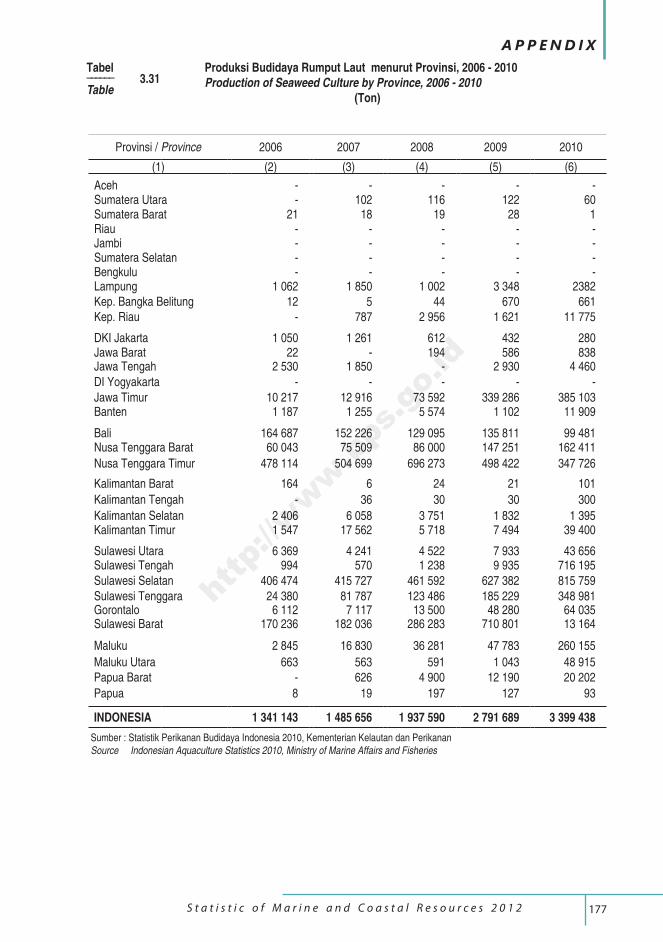
177 S t a t i s t i c o f M a r i n e a n d C o a s t a l R e s o u r c e s 2 0 1 2
A P P E N D I X
Provinsi / Province 2006 2007 2008 2009 2010
(1) (2) (3) (4) (5) (6)
Aceh - - - - -Sumatera Utara - 102 116 122 60Sumatera Barat 21 18 19 28 1Riau - - - - -Jambi - - - - -Sumatera Selatan - - - - -Bengkulu - - - - -Lampung 1 062 1 850 1 002 3 348 2382Kep. Bangka Belitung 12 5 44 670 661Kep. Riau - 787 2 956 1 621 11 775
DKI Jakarta 1 050 1 261 612 432 280Jawa Barat 22 - 194 586 838Jawa Tengah 2 530 1 850 - 2 930 4 460DI Yogyakarta - - - - -Jawa Timur 10 217 12 916 73 592 339 286 385 103Banten 1 187 1 255 5 574 1 102 11 909
Bali 164 687 152 226 129 095 135 811 99 481Nusa Tenggara Barat 60 043 75 509 86 000 147 251 162 411
Nusa Tenggara Timur 478 114 504 699 696 273 498 422 347 726
Kalimantan Barat 164 6 24 21 101
Kalimantan Tengah - 36 30 30 300
Kalimantan Selatan 2 406 6 058 3 751 1 832 1 395Kalimantan Timur 1 547 17 562 5 718 7 494 39 400
Sulawesi Utara 6 369 4 241 4 522 7 933 43 656Sulawesi Tengah 994 570 1 238 9 935 716 195Sulawesi Selatan 406 474 415 727 461 592 627 382 815 759Sulawesi Tenggara 24 380 81 787 123 486 185 229 348 981Gorontalo 6 112 7 117 13 500 48 280 64 035Sulawesi Barat 170 236 182 036 286 283 710 801 13 164
Maluku 2 845 16 830 36 281 47 783 260 155
Maluku Utara 663 563 591 1 043 48 915Papua Barat - 626 4 900 12 190 20 202
Papua 8 19 197 127 93
INDONESIA 1 341 143 1 485 656 1 937 590 2 791 689 3 399 438
Tabel –––––– 3.31Table
Produksi Budidaya Rumput Laut menurut Provinsi, 2006 - 2010Production of Seaweed Culture by Province, 2006 - 2010 (Ton)
Sumber : Statistik Perikanan Budidaya Indonesia 2010, Kementerian Kelautan dan PerikananSource Indonesian Aquaculture Statistics 2010, Ministry of Marine Affairs and Fisheries
http://www.bps.go.id
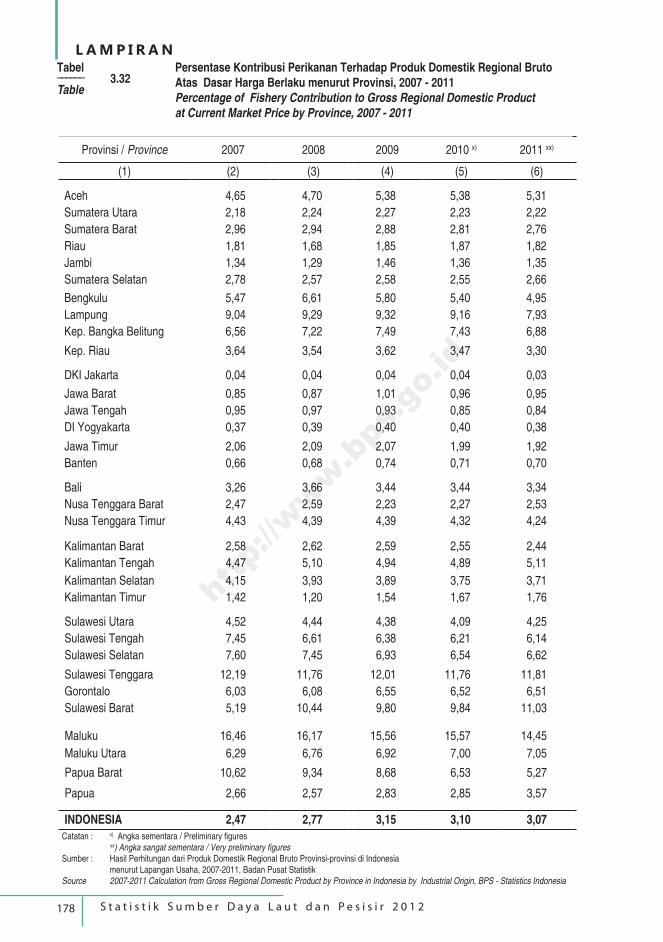
178 S t a t i s t i k S u m b e r D a y a L a u t d a n P e s i s i r 2 0 1 2
L A M P I R A N
Provinsi / Province 2007 2008 2009 2010 x) 2011 xx)
(1) (2) (3) (4) (5) (6)
Aceh 4,65 4,70 5,38 5,38 5,31
Sumatera Utara 2,18 2,24 2,27 2,23 2,22
Sumatera Barat 2,96 2,94 2,88 2,81 2,76
Riau 1,81 1,68 1,85 1,87 1,82
Jambi 1,34 1,29 1,46 1,36 1,35
Sumatera Selatan 2,78 2,57 2,58 2,55 2,66
Bengkulu 5,47 6,61 5,80 5,40 4,95
Lampung 9,04 9,29 9,32 9,16 7,93
Kep. Bangka Belitung 6,56 7,22 7,49 7,43 6,88
Kep. Riau 3,64 3,54 3,62 3,47 3,30
DKI Jakarta 0,04 0,04 0,04 0,04 0,03
Jawa Barat 0,85 0,87 1,01 0,96 0,95
Jawa Tengah 0,95 0,97 0,93 0,85 0,84
DI Yogyakarta 0,37 0,39 0,40 0,40 0,38
Jawa Timur 2,06 2,09 2,07 1,99 1,92
Banten 0,66 0,68 0,74 0,71 0,70
Bali 3,26 3,66 3,44 3,44 3,34
Nusa Tenggara Barat 2,47 2,59 2,23 2,27 2,53
Nusa Tenggara Timur 4,43 4,39 4,39 4,32 4,24
Kalimantan Barat 2,58 2,62 2,59 2,55 2,44
Kalimantan Tengah 4,47 5,10 4,94 4,89 5,11
Kalimantan Selatan 4,15 3,93 3,89 3,75 3,71
Kalimantan Timur 1,42 1,20 1,54 1,67 1,76
Sulawesi Utara 4,52 4,44 4,38 4,09 4,25
Sulawesi Tengah 7,45 6,61 6,38 6,21 6,14
Sulawesi Selatan 7,60 7,45 6,93 6,54 6,62
Sulawesi Tenggara 12,19 11,76 12,01 11,76 11,81
Gorontalo 6,03 6,08 6,55 6,52 6,51
Sulawesi Barat 5,19 10,44 9,80 9,84 11,03
Maluku 16,46 16,17 15,56 15,57 14,45
Maluku Utara 6,29 6,76 6,92 7,00 7,05
Papua Barat 10,62 9,34 8,68 6,53 5,27
Papua 2,66 2,57 2,83 2,85 3,57
INDONESIA 2,47 2,77 3,15 3,10 3,07
Tabel –––––– 3.32Table
Persentase Kontribusi Perikanan Terhadap Produk Domestik Regional Bruto Atas Dasar Harga Berlaku menurut Provinsi, 2007 - 2011Percentage of Fishery Contribution to Gross Regional Domestic Productat Current Market Price by Province, 2007 - 2011
Catatan : x) Angka sementara / Preliminary figures xx) Angka sangat sementara / Very preliminary figuresSumber : Hasil Perhitungan dari Produk Domestik Regional Bruto Provinsi-provinsi di Indonesia menurut Lapangan Usaha, 2007-2011, Badan Pusat StatistikSource 2007-2011 Calculation from Gross Regional Domestic Product by Province in Indonesia by Industrial Origin, BPS - Statistics Indonesia
http://www.bps.go.id
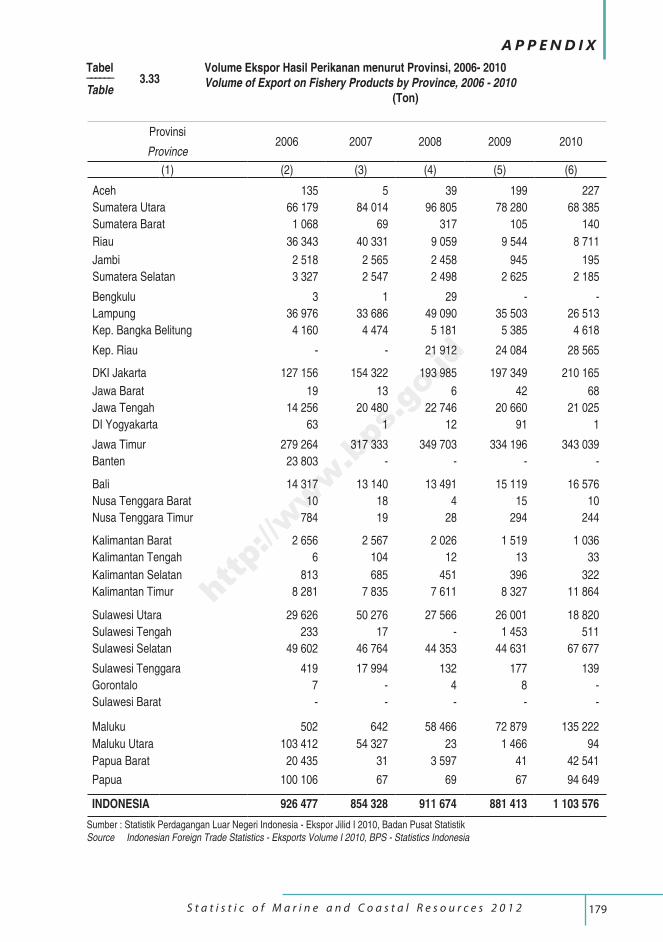
179 S t a t i s t i c o f M a r i n e a n d C o a s t a l R e s o u r c e s 2 0 1 2
A P P E N D I X
Provinsi 2006 2007 2008 2009 2010
Province
(1) (2) (3) (4) (5) (6)
Aceh 135 5 39 199 227
Sumatera Utara 66 179 84 014 96 805 78 280 68 385
Sumatera Barat 1 068 69 317 105 140
Riau 36 343 40 331 9 059 9 544 8 711
Jambi 2 518 2 565 2 458 945 195
Sumatera Selatan 3 327 2 547 2 498 2 625 2 185
Bengkulu 3 1 29 - -
Lampung 36 976 33 686 49 090 35 503 26 513
Kep. Bangka Belitung 4 160 4 474 5 181 5 385 4 618
Kep. Riau - - 21 912 24 084 28 565
DKI Jakarta 127 156 154 322 193 985 197 349 210 165
Jawa Barat 19 13 6 42 68
Jawa Tengah 14 256 20 480 22 746 20 660 21 025
DI Yogyakarta 63 1 12 91 1
Jawa Timur 279 264 317 333 349 703 334 196 343 039
Banten 23 803 - - - -
Bali 14 317 13 140 13 491 15 119 16 576
Nusa Tenggara Barat 10 18 4 15 10
Nusa Tenggara Timur 784 19 28 294 244
Kalimantan Barat 2 656 2 567 2 026 1 519 1 036
Kalimantan Tengah 6 104 12 13 33
Kalimantan Selatan 813 685 451 396 322
Kalimantan Timur 8 281 7 835 7 611 8 327 11 864
Sulawesi Utara 29 626 50 276 27 566 26 001 18 820
Sulawesi Tengah 233 17 - 1 453 511
Sulawesi Selatan 49 602 46 764 44 353 44 631 67 677
Sulawesi Tenggara 419 17 994 132 177 139
Gorontalo 7 - 4 8 -
Sulawesi Barat - - - - -
Maluku 502 642 58 466 72 879 135 222
Maluku Utara 103 412 54 327 23 1 466 94
Papua Barat 20 435 31 3 597 41 42 541
Papua 100 106 67 69 67 94 649
INDONESIA 926 477 854 328 911 674 881 413 1 103 576
Tabel –––––– 3.33Table
Volume Ekspor Hasil Perikanan menurut Provinsi, 2006- 2010Volume of Export on Fishery Products by Province, 2006 - 2010
(Ton)
Sumber : Statistik Perdagangan Luar Negeri Indonesia - Ekspor Jilid I 2010, Badan Pusat StatistikSource Indonesian Foreign Trade Statistics - Eksports Volume I 2010, BPS - Statistics Indonesia
http://www.bps.go.id
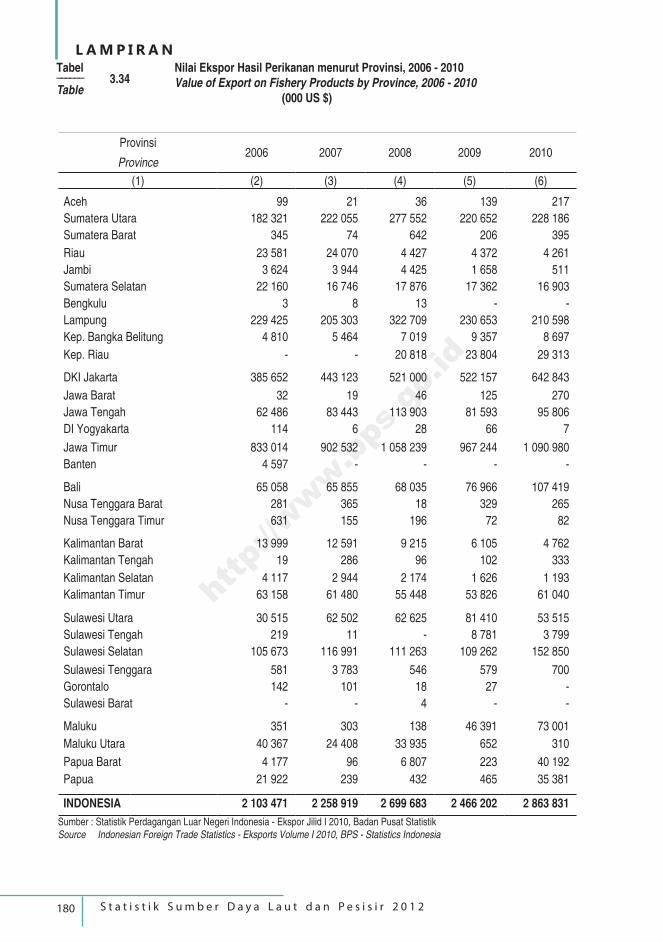
180 S t a t i s t i k S u m b e r D a y a L a u t d a n P e s i s i r 2 0 1 2
L A M P I R A N
Provinsi 2006 2007 2008 2009 2010
Province
(1) (2) (3) (4) (5) (6)
Aceh 99 21 36 139 217
Sumatera Utara 182 321 222 055 277 552 220 652 228 186
Sumatera Barat 345 74 642 206 395
Riau 23 581 24 070 4 427 4 372 4 261
Jambi 3 624 3 944 4 425 1 658 511
Sumatera Selatan 22 160 16 746 17 876 17 362 16 903
Bengkulu 3 8 13 - -
Lampung 229 425 205 303 322 709 230 653 210 598
Kep. Bangka Belitung 4 810 5 464 7 019 9 357 8 697
Kep. Riau - - 20 818 23 804 29 313
DKI Jakarta 385 652 443 123 521 000 522 157 642 843
Jawa Barat 32 19 46 125 270
Jawa Tengah 62 486 83 443 113 903 81 593 95 806
DI Yogyakarta 114 6 28 66 7
Jawa Timur 833 014 902 532 1 058 239 967 244 1 090 980
Banten 4 597 - - - -
Bali 65 058 65 855 68 035 76 966 107 419
Nusa Tenggara Barat 281 365 18 329 265
Nusa Tenggara Timur 631 155 196 72 82
Kalimantan Barat 13 999 12 591 9 215 6 105 4 762
Kalimantan Tengah 19 286 96 102 333
Kalimantan Selatan 4 117 2 944 2 174 1 626 1 193
Kalimantan Timur 63 158 61 480 55 448 53 826 61 040
Sulawesi Utara 30 515 62 502 62 625 81 410 53 515
Sulawesi Tengah 219 11 - 8 781 3 799
Sulawesi Selatan 105 673 116 991 111 263 109 262 152 850
Sulawesi Tenggara 581 3 783 546 579 700
Gorontalo 142 101 18 27 -
Sulawesi Barat - - 4 - -
Maluku 351 303 138 46 391 73 001
Maluku Utara 40 367 24 408 33 935 652 310
Papua Barat 4 177 96 6 807 223 40 192
Papua 21 922 239 432 465 35 381
INDONESIA 2 103 471 2 258 919 2 699 683 2 466 202 2 863 831
Tabel –––––– 3.34Table
Nilai Ekspor Hasil Perikanan menurut Provinsi, 2006 - 2010Value of Export on Fishery Products by Province, 2006 - 2010 (000 US $)
Sumber : Statistik Perdagangan Luar Negeri Indonesia - Ekspor Jilid I 2010, Badan Pusat StatistikSource Indonesian Foreign Trade Statistics - Eksports Volume I 2010, BPS - Statistics Indonesia
http://www.bps.go.id
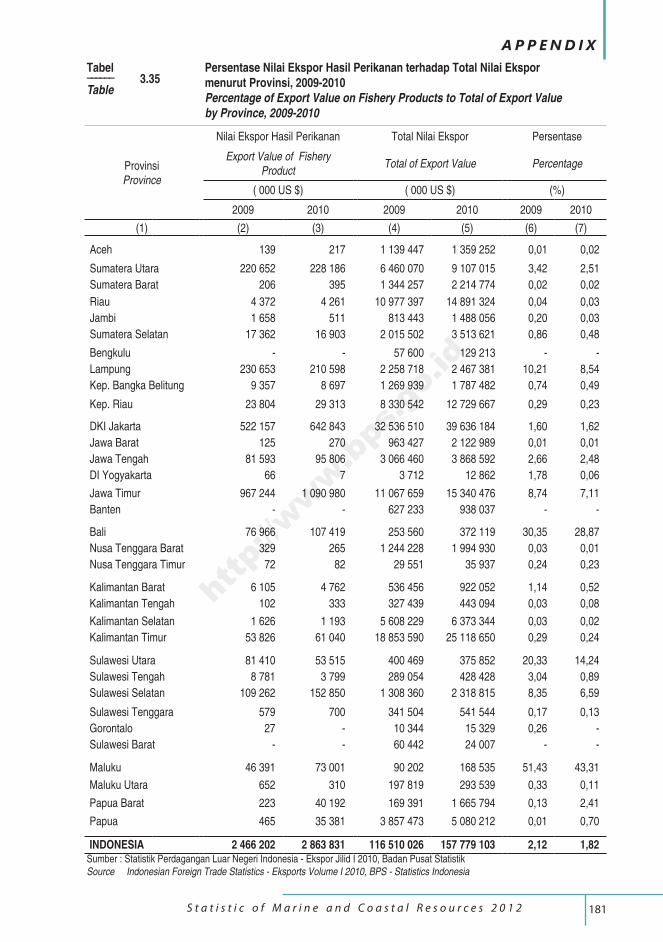
181 S t a t i s t i c o f M a r i n e a n d C o a s t a l R e s o u r c e s 2 0 1 2
A P P E N D I X
ProvinsiProvince
Nilai Ekspor Hasil Perikanan Total Nilai Ekspor Persentase
Export Value of Fishery Product
Total of Export Value Percentage
( 000 US $) ( 000 US $) (%)
2009 2010 2009 2010 2009 2010
(1) (2) (3) (4) (5) (6) (7)
Aceh 139 217 1 139 447 1 359 252 0,01 0,02
Sumatera Utara 220 652 228 186 6 460 070 9 107 015 3,42 2,51
Sumatera Barat 206 395 1 344 257 2 214 774 0,02 0,02
Riau 4 372 4 261 10 977 397 14 891 324 0,04 0,03
Jambi 1 658 511 813 443 1 488 056 0,20 0,03
Sumatera Selatan 17 362 16 903 2 015 502 3 513 621 0,86 0,48
Bengkulu - - 57 600 129 213 - -
Lampung 230 653 210 598 2 258 718 2 467 381 10,21 8,54
Kep. Bangka Belitung 9 357 8 697 1 269 939 1 787 482 0,74 0,49
Kep. Riau 23 804 29 313 8 330 542 12 729 667 0,29 0,23
DKI Jakarta 522 157 642 843 32 536 510 39 636 184 1,60 1,62
Jawa Barat 125 270 963 427 2 122 989 0,01 0,01
Jawa Tengah 81 593 95 806 3 066 460 3 868 592 2,66 2,48
DI Yogyakarta 66 7 3 712 12 862 1,78 0,06
Jawa Timur 967 244 1 090 980 11 067 659 15 340 476 8,74 7,11
Banten - - 627 233 938 037 - -
Bali 76 966 107 419 253 560 372 119 30,35 28,87
Nusa Tenggara Barat 329 265 1 244 228 1 994 930 0,03 0,01
Nusa Tenggara Timur 72 82 29 551 35 937 0,24 0,23
Kalimantan Barat 6 105 4 762 536 456 922 052 1,14 0,52
Kalimantan Tengah 102 333 327 439 443 094 0,03 0,08
Kalimantan Selatan 1 626 1 193 5 608 229 6 373 344 0,03 0,02
Kalimantan Timur 53 826 61 040 18 853 590 25 118 650 0,29 0,24
Sulawesi Utara 81 410 53 515 400 469 375 852 20,33 14,24
Sulawesi Tengah 8 781 3 799 289 054 428 428 3,04 0,89
Sulawesi Selatan 109 262 152 850 1 308 360 2 318 815 8,35 6,59
Sulawesi Tenggara 579 700 341 504 541 544 0,17 0,13
Gorontalo 27 - 10 344 15 329 0,26 -
Sulawesi Barat - - 60 442 24 007 - -
Maluku 46 391 73 001 90 202 168 535 51,43 43,31
Maluku Utara 652 310 197 819 293 539 0,33 0,11
Papua Barat 223 40 192 169 391 1 665 794 0,13 2,41
Papua 465 35 381 3 857 473 5 080 212 0,01 0,70
INDONESIA 2 466 202 2 863 831 116 510 026 157 779 103 2,12 1,82
Tabel –––––– 3.35Table
Persentase Nilai Ekspor Hasil Perikanan terhadap Total Nilai Ekspormenurut Provinsi, 2009-2010Percentage of Export Value on Fishery Products to Total of Export Valueby Province, 2009-2010
Sumber : Statistik Perdagangan Luar Negeri Indonesia - Ekspor Jilid I 2010, Badan Pusat StatistikSource Indonesian Foreign Trade Statistics - Eksports Volume I 2010, BPS - Statistics Indonesia
http://www.bps.go.id
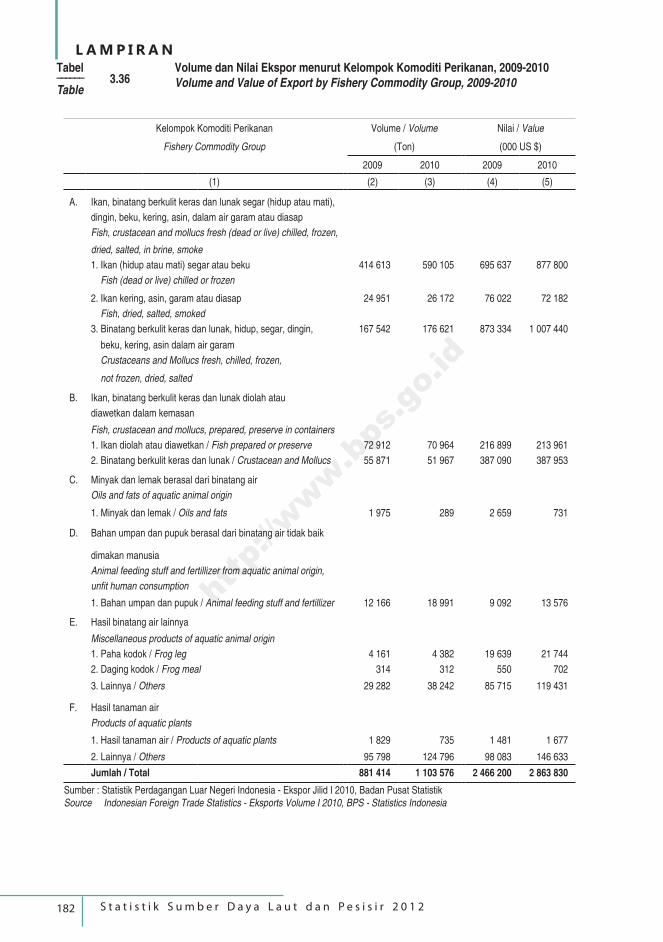
182 S t a t i s t i k S u m b e r D a y a L a u t d a n P e s i s i r 2 0 1 2
L A M P I R A N
Kelompok Komoditi Perikanan Volume / Volume Nilai / Value
Fishery Commodity Group (Ton) (000 US $)
2009 2010 2009 2010
(1) (2) (3) (4) (5)
A. Ikan, binatang berkulit keras dan lunak segar (hidup atau mati),
dingin, beku, kering, asin, dalam air garam atau diasap
Fish, crustacean and mollucs fresh (dead or live) chilled, frozen,
dried, salted, in brine, smoke
1. Ikan (hidup atau mati) segar atau beku 414 613 590 105 695 637 877 800
Fish (dead or live) chilled or frozen
2. Ikan kering, asin, garam atau diasap 24 951 26 172 76 022 72 182
Fish, dried, salted, smoked
3. Binatang berkulit keras dan lunak, hidup, segar, dingin, 167 542 176 621 873 334 1 007 440
beku, kering, asin dalam air garam
Crustaceans and Mollucs fresh, chilled, frozen,
not frozen, dried, salted
B. Ikan, binatang berkulit keras dan lunak diolah atau
diawetkan dalam kemasan
Fish, crustacean and mollucs, prepared, preserve in containers
1. Ikan diolah atau diawetkan / Fish prepared or preserve 72 912 70 964 216 899 213 961
2. Binatang berkulit keras dan lunak / Crustacean and Mollucs 55 871 51 967 387 090 387 953
C. Minyak dan lemak berasal dari binatang air
Oils and fats of aquatic animal origin
1. Minyak dan lemak / Oils and fats 1 975 289 2 659 731
D. Bahan umpan dan pupuk berasal dari binatang air tidak baik
dimakan manusia
Animal feeding stuff and fertillizer from aquatic animal origin,
unfit human consumption
1. Bahan umpan dan pupuk / Animal feeding stuff and fertillizer 12 166 18 991 9 092 13 576
E. Hasil binatang air lainnya
Miscellaneous products of aquatic animal origin
1. Paha kodok / Frog leg 4 161 4 382 19 639 21 744
2. Daging kodok / Frog meal 314 312 550 702
3. Lainnya / Others 29 282 38 242 85 715 119 431
F. Hasil tanaman air
Products of aquatic plants
1. Hasil tanaman air / Products of aquatic plants 1 829 735 1 481 1 677
2. Lainnya / Others 95 798 124 796 98 083 146 633
Jumlah / Total 881 414 1 103 576 2 466 200 2 863 830
Tabel –––––– 3.36Table
Volume dan Nilai Ekspor menurut Kelompok Komoditi Perikanan, 2009-2010Volume and Value of Export by Fishery Commodity Group, 2009-2010
Sumber : Statistik Perdagangan Luar Negeri Indonesia - Ekspor Jilid I 2010, Badan Pusat StatistikSource Indonesian Foreign Trade Statistics - Eksports Volume I 2010, BPS - Statistics Indonesia
http://www.bps.go.id
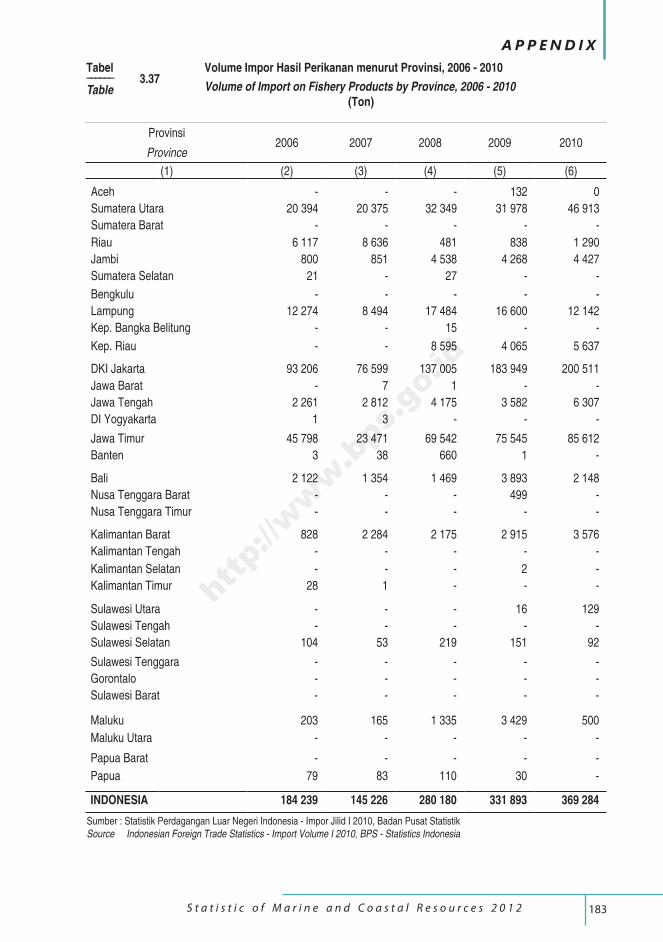
183 S t a t i s t i c o f M a r i n e a n d C o a s t a l R e s o u r c e s 2 0 1 2
A P P E N D I X
Provinsi 2006 2007 2008 2009 2010
Province
(1) (2) (3) (4) (5) (6)
Aceh - - - 132 0
Sumatera Utara 20 394 20 375 32 349 31 978 46 913
Sumatera Barat - - - - -
Riau 6 117 8 636 481 838 1 290
Jambi 800 851 4 538 4 268 4 427
Sumatera Selatan 21 - 27 - -
Bengkulu - - - - -
Lampung 12 274 8 494 17 484 16 600 12 142
Kep. Bangka Belitung - - 15 - -
Kep. Riau - - 8 595 4 065 5 637
DKI Jakarta 93 206 76 599 137 005 183 949 200 511
Jawa Barat - 7 1 - -
Jawa Tengah 2 261 2 812 4 175 3 582 6 307
DI Yogyakarta 1 3 - - -
Jawa Timur 45 798 23 471 69 542 75 545 85 612
Banten 3 38 660 1 -
Bali 2 122 1 354 1 469 3 893 2 148
Nusa Tenggara Barat - - - 499 -
Nusa Tenggara Timur - - - - -
Kalimantan Barat 828 2 284 2 175 2 915 3 576
Kalimantan Tengah - - - - -
Kalimantan Selatan - - - 2 -
Kalimantan Timur 28 1 - - -
Sulawesi Utara - - - 16 129
Sulawesi Tengah - - - - -
Sulawesi Selatan 104 53 219 151 92
Sulawesi Tenggara - - - - -
Gorontalo - - - - -
Sulawesi Barat - - - - -
Maluku 203 165 1 335 3 429 500
Maluku Utara - - - - -
Papua Barat - - - - -
Papua 79 83 110 30 -
INDONESIA 184 239 145 226 280 180 331 893 369 284
Tabel –––––– 3.37Table
Volume Impor Hasil Perikanan menurut Provinsi, 2006 - 2010
Volume of Import on Fishery Products by Province, 2006 - 2010 (Ton)
Sumber : Statistik Perdagangan Luar Negeri Indonesia - Impor Jilid I 2010, Badan Pusat StatistikSource Indonesian Foreign Trade Statistics - Import Volume I 2010, BPS - Statistics Indonesia
http://www.bps.go.id
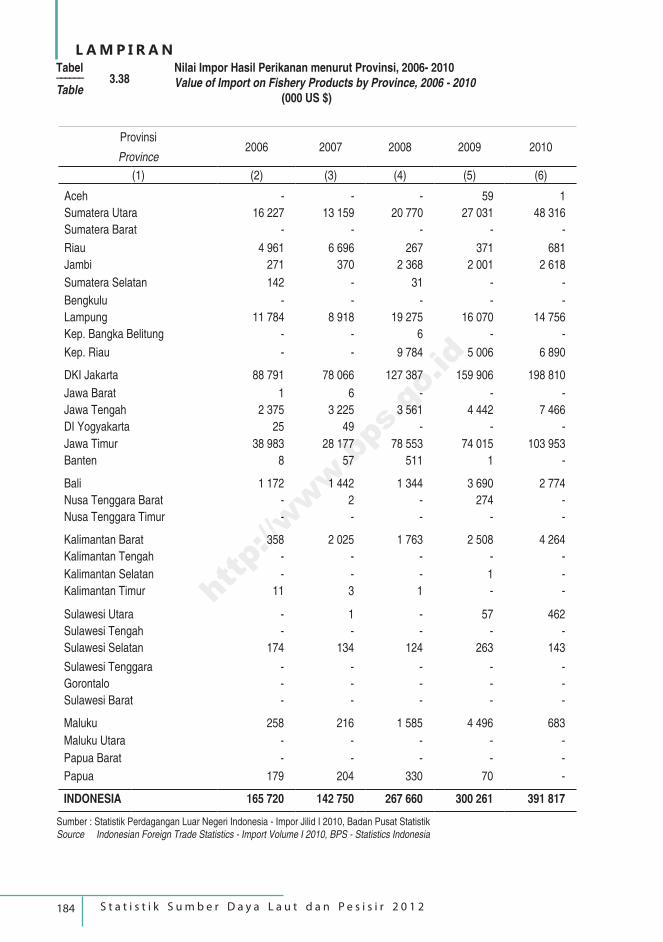
184 S t a t i s t i k S u m b e r D a y a L a u t d a n P e s i s i r 2 0 1 2
L A M P I R A N
Provinsi 2006 2007 2008 2009 2010
Province
(1) (2) (3) (4) (5) (6)
Aceh - - - 59 1
Sumatera Utara 16 227 13 159 20 770 27 031 48 316
Sumatera Barat - - - - -
Riau 4 961 6 696 267 371 681
Jambi 271 370 2 368 2 001 2 618
Sumatera Selatan 142 - 31 - -
Bengkulu - - - - -
Lampung 11 784 8 918 19 275 16 070 14 756
Kep. Bangka Belitung - - 6 - -
Kep. Riau - - 9 784 5 006 6 890
DKI Jakarta 88 791 78 066 127 387 159 906 198 810
Jawa Barat 1 6 - - -
Jawa Tengah 2 375 3 225 3 561 4 442 7 466
DI Yogyakarta 25 49 - - -
Jawa Timur 38 983 28 177 78 553 74 015 103 953
Banten 8 57 511 1 -
Bali 1 172 1 442 1 344 3 690 2 774
Nusa Tenggara Barat - 2 - 274 -
Nusa Tenggara Timur - - - - -
Kalimantan Barat 358 2 025 1 763 2 508 4 264
Kalimantan Tengah - - - - -
Kalimantan Selatan - - - 1 -
Kalimantan Timur 11 3 1 - -
Sulawesi Utara - 1 - 57 462
Sulawesi Tengah - - - - -
Sulawesi Selatan 174 134 124 263 143
Sulawesi Tenggara - - - - -
Gorontalo - - - - -
Sulawesi Barat - - - - -
Maluku 258 216 1 585 4 496 683
Maluku Utara - - - - -
Papua Barat - - - - -
Papua 179 204 330 70 -
INDONESIA 165 720 142 750 267 660 300 261 391 817
Tabel –––––– 3.38Table
Nilai Impor Hasil Perikanan menurut Provinsi, 2006- 2010Value of Import on Fishery Products by Province, 2006 - 2010 (000 US $)
Sumber : Statistik Perdagangan Luar Negeri Indonesia - Impor Jilid I 2010, Badan Pusat StatistikSource Indonesian Foreign Trade Statistics - Import Volume I 2010, BPS - Statistics Indonesia
http://www.bps.go.id
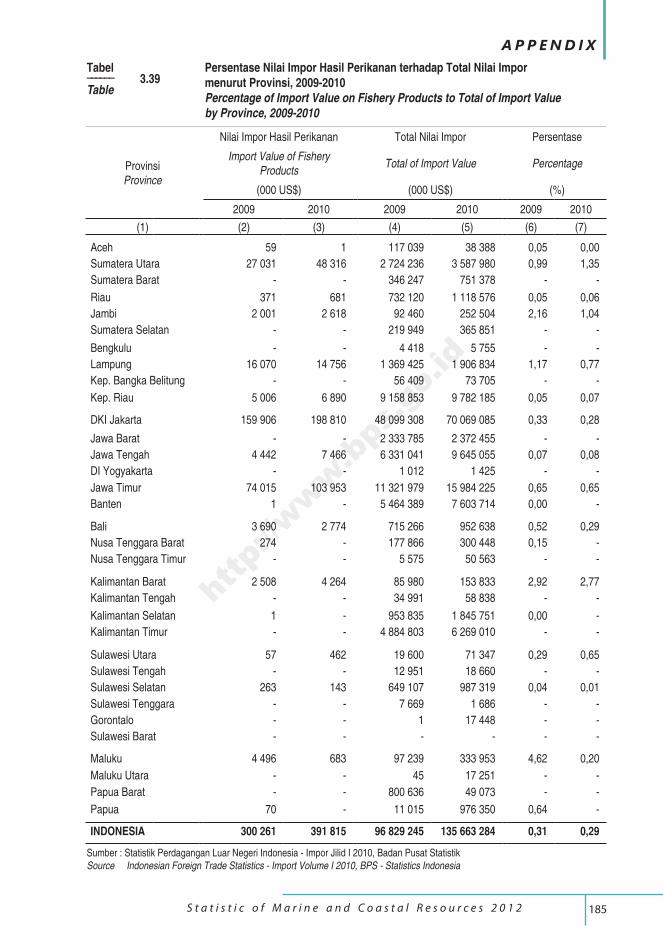
185 S t a t i s t i c o f M a r i n e a n d C o a s t a l R e s o u r c e s 2 0 1 2
A P P E N D I X
ProvinsiProvince
Nilai Impor Hasil Perikanan Total Nilai Impor Persentase
Import Value of Fishery Products
Total of Import Value Percentage
(000 US$) (000 US$) (%)
2009 2010 2009 2010 2009 2010
(1) (2) (3) (4) (5) (6) (7)
Aceh 59 1 117 039 38 388 0,05 0,00
Sumatera Utara 27 031 48 316 2 724 236 3 587 980 0,99 1,35
Sumatera Barat - - 346 247 751 378 - -
Riau 371 681 732 120 1 118 576 0,05 0,06
Jambi 2 001 2 618 92 460 252 504 2,16 1,04
Sumatera Selatan - - 219 949 365 851 - -
Bengkulu - - 4 418 5 755 - -
Lampung 16 070 14 756 1 369 425 1 906 834 1,17 0,77
Kep. Bangka Belitung - - 56 409 73 705 - -
Kep. Riau 5 006 6 890 9 158 853 9 782 185 0,05 0,07
DKI Jakarta 159 906 198 810 48 099 308 70 069 085 0,33 0,28
Jawa Barat - - 2 333 785 2 372 455 - -
Jawa Tengah 4 442 7 466 6 331 041 9 645 055 0,07 0,08
DI Yogyakarta - - 1 012 1 425 - -
Jawa Timur 74 015 103 953 11 321 979 15 984 225 0,65 0,65
Banten 1 - 5 464 389 7 603 714 0,00 -
Bali 3 690 2 774 715 266 952 638 0,52 0,29
Nusa Tenggara Barat 274 - 177 866 300 448 0,15 -
Nusa Tenggara Timur - - 5 575 50 563 - -
Kalimantan Barat 2 508 4 264 85 980 153 833 2,92 2,77
Kalimantan Tengah - - 34 991 58 838 - -
Kalimantan Selatan 1 - 953 835 1 845 751 0,00 -
Kalimantan Timur - - 4 884 803 6 269 010 - -
Sulawesi Utara 57 462 19 600 71 347 0,29 0,65
Sulawesi Tengah - - 12 951 18 660 - -
Sulawesi Selatan 263 143 649 107 987 319 0,04 0,01
Sulawesi Tenggara - - 7 669 1 686 - -
Gorontalo - - 1 17 448 - -
Sulawesi Barat - - - - - -
Maluku 4 496 683 97 239 333 953 4,62 0,20
Maluku Utara - - 45 17 251 - -
Papua Barat - - 800 636 49 073 - -
Papua 70 - 11 015 976 350 0,64 -
INDONESIA 300 261 391 815 96 829 245 135 663 284 0,31 0,29
Tabel –––––– 3.39Table
Persentase Nilai Impor Hasil Perikanan terhadap Total Nilai Impormenurut Provinsi, 2009-2010Percentage of Import Value on Fishery Products to Total of Import Valueby Province, 2009-2010
Sumber : Statistik Perdagangan Luar Negeri Indonesia - Impor Jilid I 2010, Badan Pusat StatistikSource Indonesian Foreign Trade Statistics - Import Volume I 2010, BPS - Statistics Indonesia
http://www.bps.go.id
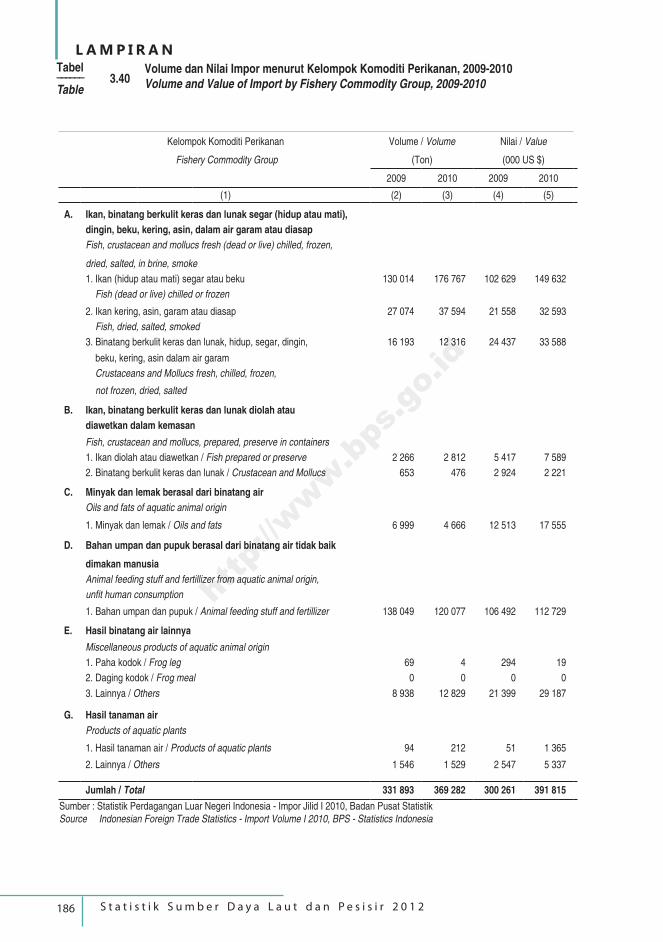
186 S t a t i s t i k S u m b e r D a y a L a u t d a n P e s i s i r 2 0 1 2
L A M P I R A N
Kelompok Komoditi Perikanan Volume / Volume Nilai / Value
Fishery Commodity Group (Ton) (000 US $)
2009 2010 2009 2010
(1) (2) (3) (4) (5)
A. Ikan, binatang berkulit keras dan lunak segar (hidup atau mati),
dingin, beku, kering, asin, dalam air garam atau diasap
Fish, crustacean and mollucs fresh (dead or live) chilled, frozen,
dried, salted, in brine, smoke
1. Ikan (hidup atau mati) segar atau beku 130 014 176 767 102 629 149 632
Fish (dead or live) chilled or frozen
2. Ikan kering, asin, garam atau diasap 27 074 37 594 21 558 32 593
Fish, dried, salted, smoked
3. Binatang berkulit keras dan lunak, hidup, segar, dingin, 16 193 12 316 24 437 33 588
beku, kering, asin dalam air garam
Crustaceans and Mollucs fresh, chilled, frozen,
not frozen, dried, salted
B. Ikan, binatang berkulit keras dan lunak diolah atau
diawetkan dalam kemasan
Fish, crustacean and mollucs, prepared, preserve in containers
1. Ikan diolah atau diawetkan / Fish prepared or preserve 2 266 2 812 5 417 7 589
2. Binatang berkulit keras dan lunak / Crustacean and Mollucs 653 476 2 924 2 221
C. Minyak dan lemak berasal dari binatang air
Oils and fats of aquatic animal origin
1. Minyak dan lemak / Oils and fats 6 999 4 666 12 513 17 555
D. Bahan umpan dan pupuk berasal dari binatang air tidak baik
dimakan manusia
Animal feeding stuff and fertillizer from aquatic animal origin,
unfit human consumption
1. Bahan umpan dan pupuk / Animal feeding stuff and fertillizer 138 049 120 077 106 492 112 729
E. Hasil binatang air lainnya
Miscellaneous products of aquatic animal origin
1. Paha kodok / Frog leg 69 4 294 19
2. Daging kodok / Frog meal 0 0 0 0
3. Lainnya / Others 8 938 12 829 21 399 29 187
G. Hasil tanaman air
Products of aquatic plants
1. Hasil tanaman air / Products of aquatic plants 94 212 51 1 365
2. Lainnya / Others 1 546 1 529 2 547 5 337
Jumlah / Total 331 893 369 282 300 261 391 815
Tabel –––––– 3.40Table
Volume dan Nilai Impor menurut Kelompok Komoditi Perikanan, 2009-2010Volume and Value of Import by Fishery Commodity Group, 2009-2010
Sumber : Statistik Perdagangan Luar Negeri Indonesia - Impor Jilid I 2010, Badan Pusat StatistikSource Indonesian Foreign Trade Statistics - Import Volume I 2010, BPS - Statistics Indonesia
http://www.bps.go.id
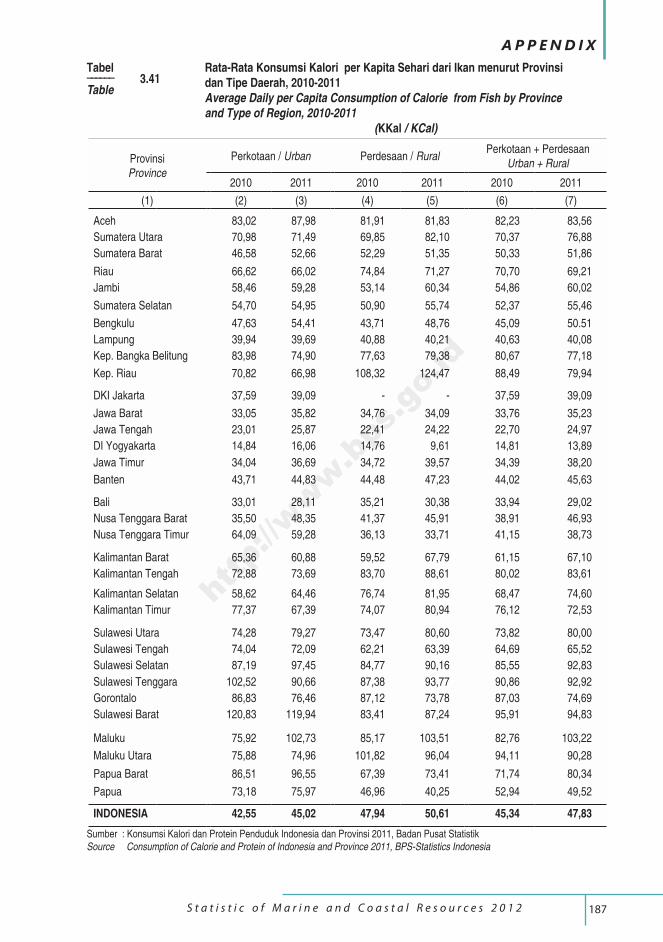
187 S t a t i s t i c o f M a r i n e a n d C o a s t a l R e s o u r c e s 2 0 1 2
A P P E N D I X
ProvinsiProvince
Perkotaan / Urban Perdesaan / RuralPerkotaan + Perdesaan
Urban + Rural
2010 2011 2010 2011 2010 2011
(1) (2) (3) (4) (5) (6) (7)
Aceh 83,02 87,98 81,91 81,83 82,23 83,56
Sumatera Utara 70,98 71,49 69,85 82,10 70,37 76,88
Sumatera Barat 46,58 52,66 52,29 51,35 50,33 51,86
Riau 66,62 66,02 74,84 71,27 70,70 69,21
Jambi 58,46 59,28 53,14 60,34 54,86 60,02
Sumatera Selatan 54,70 54,95 50,90 55,74 52,37 55,46
Bengkulu 47,63 54,41 43,71 48,76 45,09 50.51
Lampung 39,94 39,69 40,88 40,21 40,63 40,08
Kep. Bangka Belitung 83,98 74,90 77,63 79,38 80,67 77,18
Kep. Riau 70,82 66,98 108,32 124,47 88,49 79,94
DKI Jakarta 37,59 39,09 - - 37,59 39,09
Jawa Barat 33,05 35,82 34,76 34,09 33,76 35,23
Jawa Tengah 23,01 25,87 22,41 24,22 22,70 24,97
DI Yogyakarta 14,84 16,06 14,76 9,61 14,81 13,89
Jawa Timur 34,04 36,69 34,72 39,57 34,39 38,20
Banten 43,71 44,83 44,48 47,23 44,02 45,63
Bali 33,01 28,11 35,21 30,38 33,94 29,02
Nusa Tenggara Barat 35,50 48,35 41,37 45,91 38,91 46,93
Nusa Tenggara Timur 64,09 59,28 36,13 33,71 41,15 38,73
Kalimantan Barat 65,36 60,88 59,52 67,79 61,15 67,10
Kalimantan Tengah 72,88 73,69 83,70 88,61 80,02 83,61
Kalimantan Selatan 58,62 64,46 76,74 81,95 68,47 74,60
Kalimantan Timur 77,37 67,39 74,07 80,94 76,12 72,53
Sulawesi Utara 74,28 79,27 73,47 80,60 73,82 80,00
Sulawesi Tengah 74,04 72,09 62,21 63,39 64,69 65,52
Sulawesi Selatan 87,19 97,45 84,77 90,16 85,55 92,83
Sulawesi Tenggara 102,52 90,66 87,38 93,77 90,86 92,92
Gorontalo 86,83 76,46 87,12 73,78 87,03 74,69
Sulawesi Barat 120,83 119,94 83,41 87,24 95,91 94,83
Maluku 75,92 102,73 85,17 103,51 82,76 103,22
Maluku Utara 75,88 74,96 101,82 96,04 94,11 90,28
Papua Barat 86,51 96,55 67,39 73,41 71,74 80,34
Papua 73,18 75,97 46,96 40,25 52,94 49,52
INDONESIA 42,55 45,02 47,94 50,61 45,34 47,83
Tabel –––––– 3.41Table
Rata-Rata Konsumsi Kalori per Kapita Sehari dari Ikan menurut Provinsidan Tipe Daerah, 2010-2011Average Daily per Capita Consumption of Calorie from Fish by Provinceand Type of Region, 2010-2011
(KKal / KCal)
Sumber : Konsumsi Kalori dan Protein Penduduk Indonesia dan Provinsi 2011, Badan Pusat StatistikSource Consumption of Calorie and Protein of Indonesia and Province 2011, BPS-Statistics Indonesia
http://www.bps.go.id
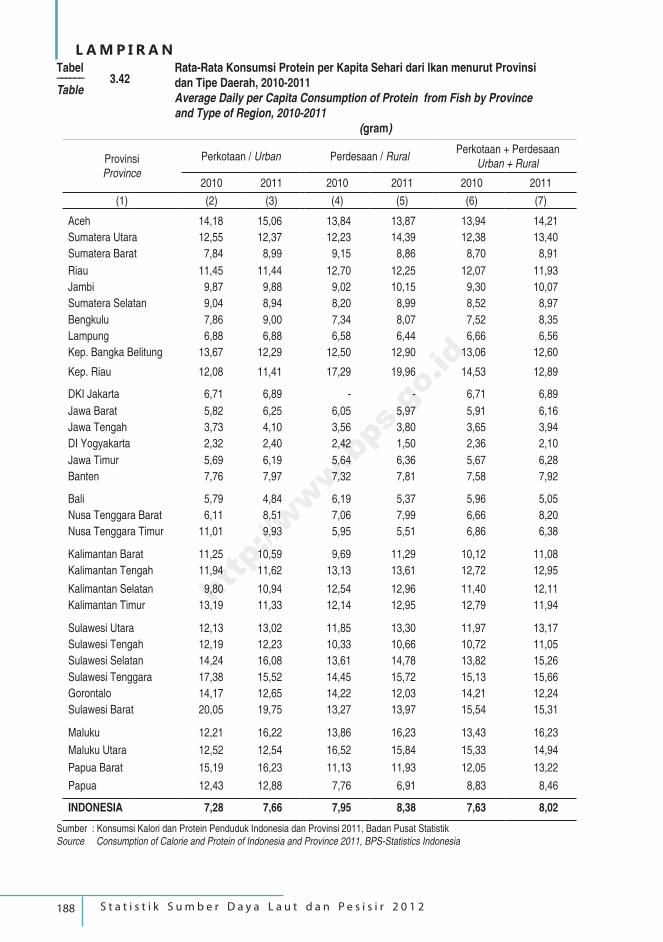
188 S t a t i s t i k S u m b e r D a y a L a u t d a n P e s i s i r 2 0 1 2
L A M P I R A N
ProvinsiProvince
Perkotaan / Urban Perdesaan / RuralPerkotaan + Perdesaan
Urban + Rural
2010 2011 2010 2011 2010 2011
(1) (2) (3) (4) (5) (6) (7)
Aceh 14,18 15,06 13,84 13,87 13,94 14,21
Sumatera Utara 12,55 12,37 12,23 14,39 12,38 13,40
Sumatera Barat 7,84 8,99 9,15 8,86 8,70 8,91
Riau 11,45 11,44 12,70 12,25 12,07 11,93
Jambi 9,87 9,88 9,02 10,15 9,30 10,07
Sumatera Selatan 9,04 8,94 8,20 8,99 8,52 8,97
Bengkulu 7,86 9,00 7,34 8,07 7,52 8,35
Lampung 6,88 6,88 6,58 6,44 6,66 6,56
Kep. Bangka Belitung 13,67 12,29 12,50 12,90 13,06 12,60
Kep. Riau 12,08 11,41 17,29 19,96 14,53 12,89
DKI Jakarta 6,71 6,89 - - 6,71 6,89
Jawa Barat 5,82 6,25 6,05 5,97 5,91 6,16
Jawa Tengah 3,73 4,10 3,56 3,80 3,65 3,94
DI Yogyakarta 2,32 2,40 2,42 1,50 2,36 2,10
Jawa Timur 5,69 6,19 5,64 6,36 5,67 6,28
Banten 7,76 7,97 7,32 7,81 7,58 7,92
Bali 5,79 4,84 6,19 5,37 5,96 5,05
Nusa Tenggara Barat 6,11 8,51 7,06 7,99 6,66 8,20
Nusa Tenggara Timur 11,01 9,93 5,95 5,51 6,86 6,38
Kalimantan Barat 11,25 10,59 9,69 11,29 10,12 11,08
Kalimantan Tengah 11,94 11,62 13,13 13,61 12,72 12,95
Kalimantan Selatan 9,80 10,94 12,54 12,96 11,40 12,11
Kalimantan Timur 13,19 11,33 12,14 12,95 12,79 11,94
Sulawesi Utara 12,13 13,02 11,85 13,30 11,97 13,17
Sulawesi Tengah 12,19 12,23 10,33 10,66 10,72 11,05
Sulawesi Selatan 14,24 16,08 13,61 14,78 13,82 15,26
Sulawesi Tenggara 17,38 15,52 14,45 15,72 15,13 15,66
Gorontalo 14,17 12,65 14,22 12,03 14,21 12,24
Sulawesi Barat 20,05 19,75 13,27 13,97 15,54 15,31
Maluku 12,21 16,22 13,86 16,23 13,43 16,23
Maluku Utara 12,52 12,54 16,52 15,84 15,33 14,94
Papua Barat 15,19 16,23 11,13 11,93 12,05 13,22
Papua 12,43 12,88 7,76 6,91 8,83 8,46
INDONESIA 7,28 7,66 7,95 8,38 7,63 8,02
Tabel –––––– 3.42Table
Rata-Rata Konsumsi Protein per Kapita Sehari dari Ikan menurut Provinsidan Tipe Daerah, 2010-2011Average Daily per Capita Consumption of Protein from Fish by Provinceand Type of Region, 2010-2011
(gram)
Sumber : Konsumsi Kalori dan Protein Penduduk Indonesia dan Provinsi 2011, Badan Pusat StatistikSource Consumption of Calorie and Protein of Indonesia and Province 2011, BPS-Statistics Indonesia
http://www.bps.go.id
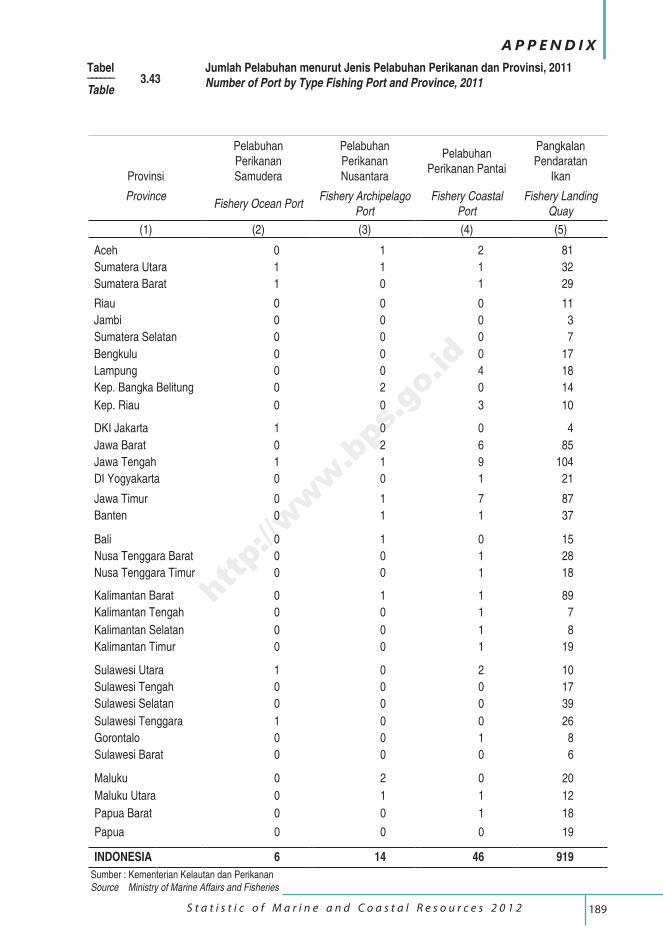
189 S t a t i s t i c o f M a r i n e a n d C o a s t a l R e s o u r c e s 2 0 1 2
A P P E N D I X
Provinsi
Pelabuhan Perikanan Samudera
Pelabuhan Perikanan Nusantara
Pelabuhan Perikanan Pantai
Pangkalan Pendaratan
Ikan
ProvinceFishery Ocean Port
Fishery Archipelago Port
Fishery Coastal Port
Fishery Landing Quay
(1) (2) (3) (4) (5)
Aceh 0 1 2 81
Sumatera Utara 1 1 1 32
Sumatera Barat 1 0 1 29
Riau 0 0 0 11
Jambi 0 0 0 3
Sumatera Selatan 0 0 0 7
Bengkulu 0 0 0 17
Lampung 0 0 4 18
Kep. Bangka Belitung 0 2 0 14
Kep. Riau 0 0 3 10
DKI Jakarta 1 0 0 4
Jawa Barat 0 2 6 85
Jawa Tengah 1 1 9 104
DI Yogyakarta 0 0 1 21
Jawa Timur 0 1 7 87
Banten 0 1 1 37
Bali 0 1 0 15
Nusa Tenggara Barat 0 0 1 28
Nusa Tenggara Timur 0 0 1 18
Kalimantan Barat 0 1 1 89
Kalimantan Tengah 0 0 1 7
Kalimantan Selatan 0 0 1 8
Kalimantan Timur 0 0 1 19
Sulawesi Utara 1 0 2 10
Sulawesi Tengah 0 0 0 17
Sulawesi Selatan 0 0 0 39
Sulawesi Tenggara 1 0 0 26
Gorontalo 0 0 1 8
Sulawesi Barat 0 0 0 6
Maluku 0 2 0 20
Maluku Utara 0 1 1 12
Papua Barat 0 0 1 18
Papua 0 0 0 19
INDONESIA 6 14 46 919
Tabel –––––– 3.43Table
Jumlah Pelabuhan menurut Jenis Pelabuhan Perikanan dan Provinsi, 2011Number of Port by Type Fishing Port and Province, 2011
Sumber : Kementerian Kelautan dan PerikananSource Ministry of Marine Affairs and Fisheries
http://www.bps.go.id
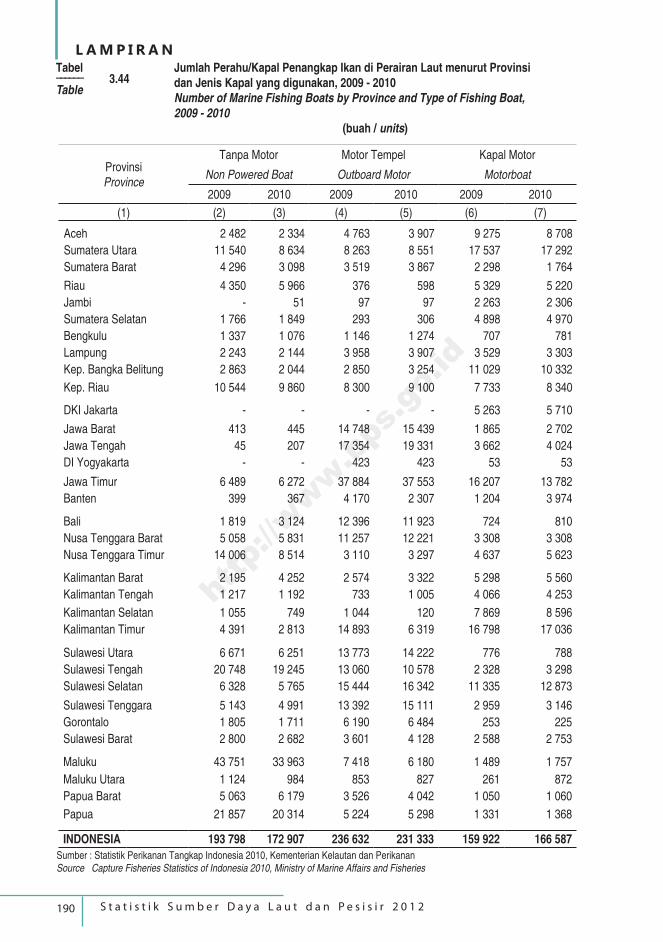
190 S t a t i s t i k S u m b e r D a y a L a u t d a n P e s i s i r 2 0 1 2
L A M P I R A N
ProvinsiProvince
Tanpa Motor Motor Tempel Kapal Motor
Non Powered Boat Outboard Motor Motorboat
2009 2010 2009 2010 2009 2010
(1) (2) (3) (4) (5) (6) (7)
Aceh 2 482 2 334 4 763 3 907 9 275 8 708
Sumatera Utara 11 540 8 634 8 263 8 551 17 537 17 292
Sumatera Barat 4 296 3 098 3 519 3 867 2 298 1 764
Riau 4 350 5 966 376 598 5 329 5 220
Jambi - 51 97 97 2 263 2 306
Sumatera Selatan 1 766 1 849 293 306 4 898 4 970
Bengkulu 1 337 1 076 1 146 1 274 707 781
Lampung 2 243 2 144 3 958 3 907 3 529 3 303
Kep. Bangka Belitung 2 863 2 044 2 850 3 254 11 029 10 332
Kep. Riau 10 544 9 860 8 300 9 100 7 733 8 340
DKI Jakarta - - - - 5 263 5 710
Jawa Barat 413 445 14 748 15 439 1 865 2 702
Jawa Tengah 45 207 17 354 19 331 3 662 4 024
DI Yogyakarta - - 423 423 53 53
Jawa Timur 6 489 6 272 37 884 37 553 16 207 13 782
Banten 399 367 4 170 2 307 1 204 3 974
Bali 1 819 3 124 12 396 11 923 724 810
Nusa Tenggara Barat 5 058 5 831 11 257 12 221 3 308 3 308
Nusa Tenggara Timur 14 006 8 514 3 110 3 297 4 637 5 623
Kalimantan Barat 2 195 4 252 2 574 3 322 5 298 5 560
Kalimantan Tengah 1 217 1 192 733 1 005 4 066 4 253
Kalimantan Selatan 1 055 749 1 044 120 7 869 8 596
Kalimantan Timur 4 391 2 813 14 893 6 319 16 798 17 036
Sulawesi Utara 6 671 6 251 13 773 14 222 776 788
Sulawesi Tengah 20 748 19 245 13 060 10 578 2 328 3 298
Sulawesi Selatan 6 328 5 765 15 444 16 342 11 335 12 873
Sulawesi Tenggara 5 143 4 991 13 392 15 111 2 959 3 146
Gorontalo 1 805 1 711 6 190 6 484 253 225
Sulawesi Barat 2 800 2 682 3 601 4 128 2 588 2 753
Maluku 43 751 33 963 7 418 6 180 1 489 1 757
Maluku Utara 1 124 984 853 827 261 872
Papua Barat 5 063 6 179 3 526 4 042 1 050 1 060
Papua 21 857 20 314 5 224 5 298 1 331 1 368
INDONESIA 193 798 172 907 236 632 231 333 159 922 166 587
Tabel –––––– 3.44Table
Jumlah Perahu/Kapal Penangkap Ikan di Perairan Laut menurut Provinsidan Jenis Kapal yang digunakan, 2009 - 2010Number of Marine Fishing Boats by Province and Type of Fishing Boat,2009 - 2010
(buah / units)
Sumber : Statistik Perikanan Tangkap Indonesia 2010, Kementerian Kelautan dan PerikananSource Capture Fisheries Statistics of Indonesia 2010, Ministry of Marine Affairs and Fisheries
http://www.bps.go.id
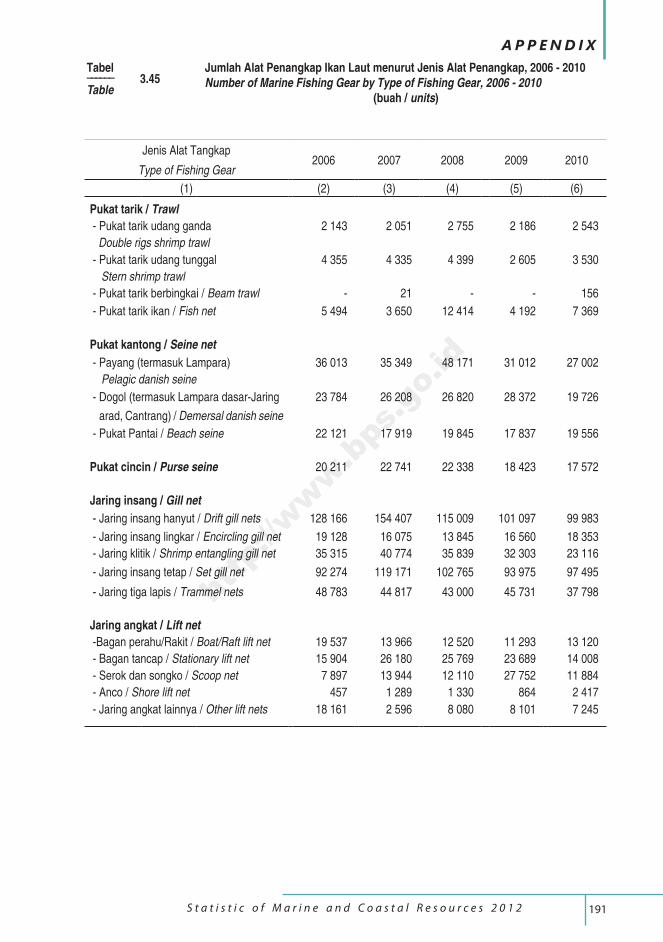
191 S t a t i s t i c o f M a r i n e a n d C o a s t a l R e s o u r c e s 2 0 1 2
A P P E N D I X
Jenis Alat Tangkap2006 2007 2008 2009 2010
Type of Fishing Gear
(1) (2) (3) (4) (5) (6)
Pukat tarik / Trawl
- Pukat tarik udang ganda 2 143 2 051 2 755 2 186 2 543
Double rigs shrimp trawl
- Pukat tarik udang tunggal 4 355 4 335 4 399 2 605 3 530
Stern shrimp trawl
- Pukat tarik berbingkai / Beam trawl - 21 - - 156
- Pukat tarik ikan / Fish net 5 494 3 650 12 414 4 192 7 369
Pukat kantong / Seine net
- Payang (termasuk Lampara) 36 013 35 349 48 171 31 012 27 002
Pelagic danish seine
- Dogol (termasuk Lampara dasar-Jaring 23 784 26 208 26 820 28 372 19 726
arad, Cantrang) / Demersal danish seine
- Pukat Pantai / Beach seine 22 121 17 919 19 845 17 837 19 556
Pukat cincin / Purse seine 20 211 22 741 22 338 18 423 17 572
Jaring insang / Gill net
- Jaring insang hanyut / Drift gill nets 128 166 154 407 115 009 101 097 99 983
- Jaring insang lingkar / Encircling gill net 19 128 16 075 13 845 16 560 18 353
- Jaring klitik / Shrimp entangling gill net 35 315 40 774 35 839 32 303 23 116
- Jaring insang tetap / Set gill net 92 274 119 171 102 765 93 975 97 495
- Jaring tiga lapis / Trammel nets 48 783 44 817 43 000 45 731 37 798
Jaring angkat / Lift net
-Bagan perahu/Rakit / Boat/Raft lift net 19 537 13 966 12 520 11 293 13 120
- Bagan tancap / Stationary lift net 15 904 26 180 25 769 23 689 14 008
- Serok dan songko / Scoop net 7 897 13 944 12 110 27 752 11 884
- Anco / Shore lift net 457 1 289 1 330 864 2 417
- Jaring angkat lainnya / Other lift nets 18 161 2 596 8 080 8 101 7 245
Tabel –––––– 3.45Table
Jumlah Alat Penangkap Ikan Laut menurut Jenis Alat Penangkap, 2006 - 2010Number of Marine Fishing Gear by Type of Fishing Gear, 2006 - 2010
(buah / units)
http://www.bps.go.id
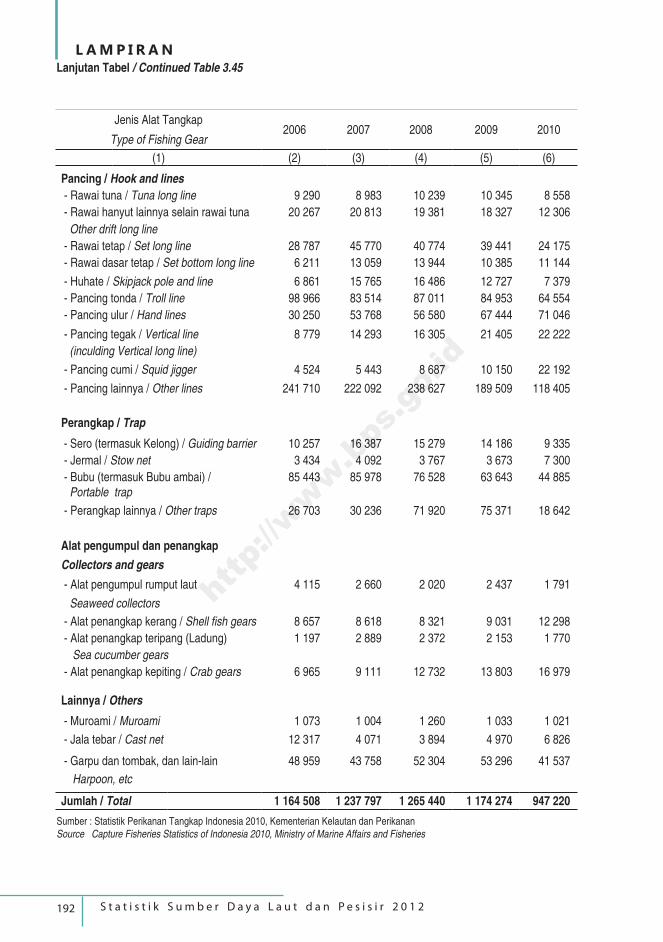
192 S t a t i s t i k S u m b e r D a y a L a u t d a n P e s i s i r 2 0 1 2
L A M P I R A N
Jenis Alat Tangkap2006 2007 2008 2009 2010
Type of Fishing Gear
(1) (2) (3) (4) (5) (6)
Pancing / Hook and lines
- Rawai tuna / Tuna long line 9 290 8 983 10 239 10 345 8 558
- Rawai hanyut lainnya selain rawai tuna 20 267 20 813 19 381 18 327 12 306
Other drift long line
- Rawai tetap / Set long line 28 787 45 770 40 774 39 441 24 175
- Rawai dasar tetap / Set bottom long line 6 211 13 059 13 944 10 385 11 144
- Huhate / Skipjack pole and line 6 861 15 765 16 486 12 727 7 379
- Pancing tonda / Troll line 98 966 83 514 87 011 84 953 64 554
- Pancing ulur / Hand lines 30 250 53 768 56 580 67 444 71 046
- Pancing tegak / Vertical line 8 779 14 293 16 305 21 405 22 222
(inculding Vertical long line)
- Pancing cumi / Squid jigger 4 524 5 443 8 687 10 150 22 192
- Pancing lainnya / Other lines 241 710 222 092 238 627 189 509 118 405
Perangkap / Trap
- Sero (termasuk Kelong) / Guiding barrier 10 257 16 387 15 279 14 186 9 335
- Jermal / Stow net 3 434 4 092 3 767 3 673 7 300
- Bubu (termasuk Bubu ambai) / Portable trap
85 443 85 978 76 528 63 643 44 885
- Perangkap lainnya / Other traps 26 703 30 236 71 920 75 371 18 642
Alat pengumpul dan penangkap
Collectors and gears
- Alat pengumpul rumput laut 4 115 2 660 2 020 2 437 1 791
Seaweed collectors
- Alat penangkap kerang / Shell fish gears 8 657 8 618 8 321 9 031 12 298
- Alat penangkap teripang (Ladung) 1 197 2 889 2 372 2 153 1 770
Sea cucumber gears
- Alat penangkap kepiting / Crab gears 6 965 9 111 12 732 13 803 16 979
Lainnya / Others
- Muroami / Muroami 1 073 1 004 1 260 1 033 1 021
- Jala tebar / Cast net 12 317 4 071 3 894 4 970 6 826
- Garpu dan tombak, dan lain-lain 48 959 43 758 52 304 53 296 41 537
Harpoon, etc
Jumlah / Total 1 164 508 1 237 797 1 265 440 1 174 274 947 220
Lanjutan Tabel / Continued Table 3.45
Sumber : Statistik Perikanan Tangkap Indonesia 2010, Kementerian Kelautan dan PerikananSource Capture Fisheries Statistics of Indonesia 2010, Ministry of Marine Affairs and Fisheries
http://www.bps.go.id
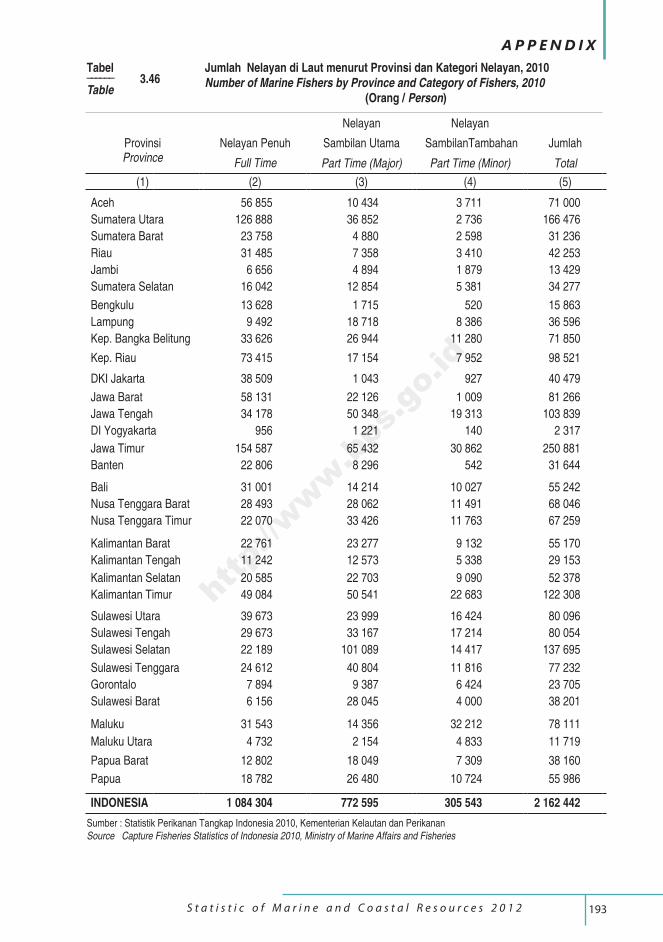
193 S t a t i s t i c o f M a r i n e a n d C o a s t a l R e s o u r c e s 2 0 1 2
A P P E N D I X
Nelayan Nelayan
Provinsi Nelayan Penuh Sambilan Utama SambilanTambahan JumlahProvince Full Time Part Time (Major) Part Time (Minor) Total
(1) (2) (3) (4) (5)
Aceh 56 855 10 434 3 711 71 000
Sumatera Utara 126 888 36 852 2 736 166 476
Sumatera Barat 23 758 4 880 2 598 31 236
Riau 31 485 7 358 3 410 42 253
Jambi 6 656 4 894 1 879 13 429
Sumatera Selatan 16 042 12 854 5 381 34 277
Bengkulu 13 628 1 715 520 15 863
Lampung 9 492 18 718 8 386 36 596
Kep. Bangka Belitung 33 626 26 944 11 280 71 850
Kep. Riau 73 415 17 154 7 952 98 521
DKI Jakarta 38 509 1 043 927 40 479
Jawa Barat 58 131 22 126 1 009 81 266
Jawa Tengah 34 178 50 348 19 313 103 839
DI Yogyakarta 956 1 221 140 2 317
Jawa Timur 154 587 65 432 30 862 250 881
Banten 22 806 8 296 542 31 644
Bali 31 001 14 214 10 027 55 242
Nusa Tenggara Barat 28 493 28 062 11 491 68 046
Nusa Tenggara Timur 22 070 33 426 11 763 67 259
Kalimantan Barat 22 761 23 277 9 132 55 170
Kalimantan Tengah 11 242 12 573 5 338 29 153
Kalimantan Selatan 20 585 22 703 9 090 52 378
Kalimantan Timur 49 084 50 541 22 683 122 308
Sulawesi Utara 39 673 23 999 16 424 80 096
Sulawesi Tengah 29 673 33 167 17 214 80 054
Sulawesi Selatan 22 189 101 089 14 417 137 695
Sulawesi Tenggara 24 612 40 804 11 816 77 232
Gorontalo 7 894 9 387 6 424 23 705
Sulawesi Barat 6 156 28 045 4 000 38 201
Maluku 31 543 14 356 32 212 78 111
Maluku Utara 4 732 2 154 4 833 11 719
Papua Barat 12 802 18 049 7 309 38 160
Papua 18 782 26 480 10 724 55 986
INDONESIA 1 084 304 772 595 305 543 2 162 442
Tabel –––––– 3.46Table
Jumlah Nelayan di Laut menurut Provinsi dan Kategori Nelayan, 2010Number of Marine Fishers by Province and Category of Fishers, 2010
(Orang / Person)
Sumber : Statistik Perikanan Tangkap Indonesia 2010, Kementerian Kelautan dan PerikananSource Capture Fisheries Statistics of Indonesia 2010, Ministry of Marine Affairs and Fisheries
http://www.bps.go.id
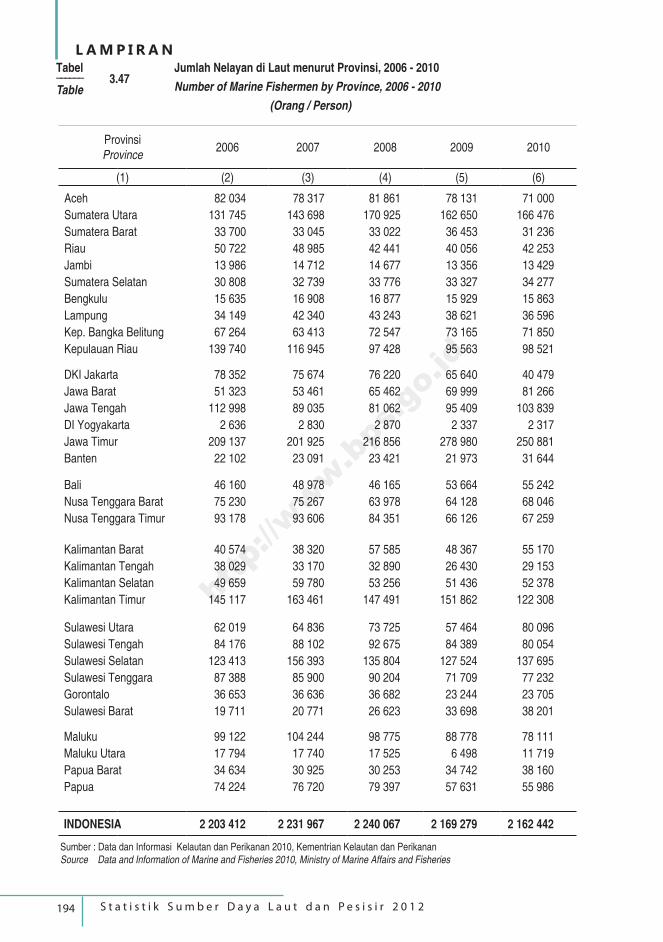
194 S t a t i s t i k S u m b e r D a y a L a u t d a n P e s i s i r 2 0 1 2
L A M P I R A N
ProvinsiProvince
2006 2007 2008 2009 2010
(1) (2) (3) (4) (5) (6)
Aceh 82 034 78 317 81 861 78 131 71 000
Sumatera Utara 131 745 143 698 170 925 162 650 166 476
Sumatera Barat 33 700 33 045 33 022 36 453 31 236
Riau 50 722 48 985 42 441 40 056 42 253
Jambi 13 986 14 712 14 677 13 356 13 429
Sumatera Selatan 30 808 32 739 33 776 33 327 34 277
Bengkulu 15 635 16 908 16 877 15 929 15 863
Lampung 34 149 42 340 43 243 38 621 36 596
Kep. Bangka Belitung 67 264 63 413 72 547 73 165 71 850
Kepulauan Riau 139 740 116 945 97 428 95 563 98 521
DKI Jakarta 78 352 75 674 76 220 65 640 40 479
Jawa Barat 51 323 53 461 65 462 69 999 81 266
Jawa Tengah 112 998 89 035 81 062 95 409 103 839
DI Yogyakarta 2 636 2 830 2 870 2 337 2 317
Jawa Timur 209 137 201 925 216 856 278 980 250 881
Banten 22 102 23 091 23 421 21 973 31 644
Bali 46 160 48 978 46 165 53 664 55 242
Nusa Tenggara Barat 75 230 75 267 63 978 64 128 68 046
Nusa Tenggara Timur 93 178 93 606 84 351 66 126 67 259
Kalimantan Barat 40 574 38 320 57 585 48 367 55 170
Kalimantan Tengah 38 029 33 170 32 890 26 430 29 153
Kalimantan Selatan 49 659 59 780 53 256 51 436 52 378
Kalimantan Timur 145 117 163 461 147 491 151 862 122 308
Sulawesi Utara 62 019 64 836 73 725 57 464 80 096
Sulawesi Tengah 84 176 88 102 92 675 84 389 80 054
Sulawesi Selatan 123 413 156 393 135 804 127 524 137 695
Sulawesi Tenggara 87 388 85 900 90 204 71 709 77 232
Gorontalo 36 653 36 636 36 682 23 244 23 705
Sulawesi Barat 19 711 20 771 26 623 33 698 38 201
Maluku 99 122 104 244 98 775 88 778 78 111
Maluku Utara 17 794 17 740 17 525 6 498 11 719
Papua Barat 34 634 30 925 30 253 34 742 38 160
Papua 74 224 76 720 79 397 57 631 55 986
INDONESIA 2 203 412 2 231 967 2 240 067 2 169 279 2 162 442
Tabel –––––– 3.47Table
Jumlah Nelayan di Laut menurut Provinsi, 2006 - 2010
Number of Marine Fishermen by Province, 2006 - 2010
(Orang / Person)
Sumber : Data dan Informasi Kelautan dan Perikanan 2010, Kementrian Kelautan dan PerikananSource Data and Information of Marine and Fisheries 2010, Ministry of Marine Affairs and Fisheries
http://www.bps.go.id
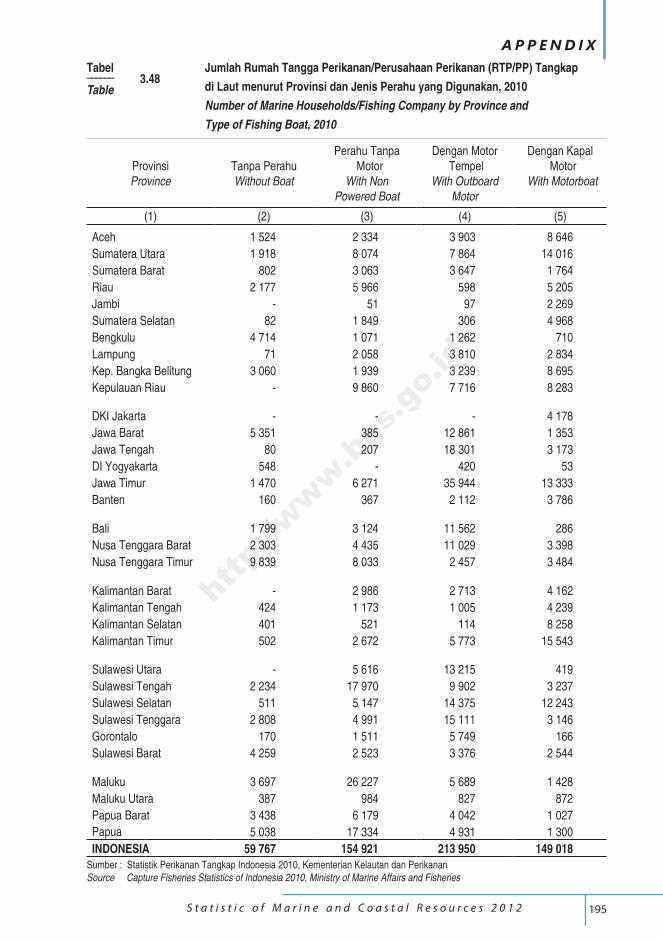
195 S t a t i s t i c o f M a r i n e a n d C o a s t a l R e s o u r c e s 2 0 1 2
A P P E N D I X
ProvinsiProvince
Tanpa PerahuWithout Boat
Perahu Tanpa Motor
With Non Powered Boat
Dengan Motor Tempel
With Outboard Motor
Dengan Kapal Motor
With Motorboat
(1) (2) (3) (4) (5)
Aceh 1 524 2 334 3 903 8 646
Sumatera Utara 1 918 8 074 7 864 14 016
Sumatera Barat 802 3 063 3 647 1 764
Riau 2 177 5 966 598 5 205
Jambi - 51 97 2 269
Sumatera Selatan 82 1 849 306 4 968
Bengkulu 4 714 1 071 1 262 710
Lampung 71 2 058 3 810 2 834
Kep. Bangka Belitung 3 060 1 939 3 239 8 695
Kepulauan Riau - 9 860 7 716 8 283
DKI Jakarta - - - 4 178
Jawa Barat 5 351 385 12 861 1 353
Jawa Tengah 80 207 18 301 3 173
DI Yogyakarta 548 - 420 53
Jawa Timur 1 470 6 271 35 944 13 333
Banten 160 367 2 112 3 786
Bali 1 799 3 124 11 562 286
Nusa Tenggara Barat 2 303 4 435 11 029 3 398
Nusa Tenggara Timur 9 839 8 033 2 457 3 484
Kalimantan Barat - 2 986 2 713 4 162
Kalimantan Tengah 424 1 173 1 005 4 239
Kalimantan Selatan 401 521 114 8 258
Kalimantan Timur 502 2 672 5 773 15 543
Sulawesi Utara - 5 616 13 215 419
Sulawesi Tengah 2 234 17 970 9 902 3 237
Sulawesi Selatan 511 5 147 14 375 12 243
Sulawesi Tenggara 2 808 4 991 15 111 3 146
Gorontalo 170 1 511 5 749 166
Sulawesi Barat 4 259 2 523 3 376 2 544
Maluku 3 697 26 227 5 689 1 428
Maluku Utara 387 984 827 872
Papua Barat 3 438 6 179 4 042 1 027
Papua 5 038 17 334 4 931 1 300
INDONESIA 59 767 154 921 213 950 149 018
Tabel –––––– 3.48Table
Jumlah Rumah Tangga Perikanan/Perusahaan Perikanan (RTP/PP) Tangkap
di Laut menurut Provinsi dan Jenis Perahu yang Digunakan, 2010
Number of Marine Households/Fishing Company by Province and
Type of Fishing Boat, 2010
Sumber : Statistik Perikanan Tangkap Indonesia 2010, Kementerian Kelautan dan PerikananSource Capture Fisheries Statistics of Indonesia 2010, Ministry of Marine Affairs and Fisheries
http://www.bps.go.id
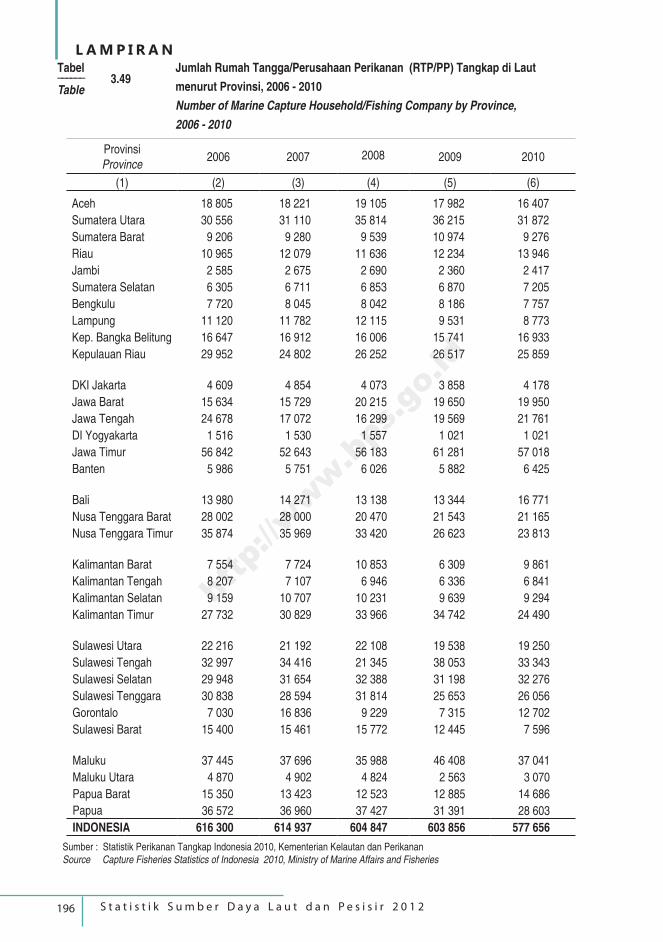
196 S t a t i s t i k S u m b e r D a y a L a u t d a n P e s i s i r 2 0 1 2
L A M P I R A N
ProvinsiProvince
2006 2007 2008 2009 2010
(1) (2) (3) (4) (5) (6)
Aceh 18 805 18 221 19 105 17 982 16 407
Sumatera Utara 30 556 31 110 35 814 36 215 31 872
Sumatera Barat 9 206 9 280 9 539 10 974 9 276
Riau 10 965 12 079 11 636 12 234 13 946
Jambi 2 585 2 675 2 690 2 360 2 417
Sumatera Selatan 6 305 6 711 6 853 6 870 7 205
Bengkulu 7 720 8 045 8 042 8 186 7 757
Lampung 11 120 11 782 12 115 9 531 8 773
Kep. Bangka Belitung 16 647 16 912 16 006 15 741 16 933
Kepulauan Riau 29 952 24 802 26 252 26 517 25 859
DKI Jakarta 4 609 4 854 4 073 3 858 4 178
Jawa Barat 15 634 15 729 20 215 19 650 19 950
Jawa Tengah 24 678 17 072 16 299 19 569 21 761
DI Yogyakarta 1 516 1 530 1 557 1 021 1 021
Jawa Timur 56 842 52 643 56 183 61 281 57 018
Banten 5 986 5 751 6 026 5 882 6 425
Bali 13 980 14 271 13 138 13 344 16 771
Nusa Tenggara Barat 28 002 28 000 20 470 21 543 21 165
Nusa Tenggara Timur 35 874 35 969 33 420 26 623 23 813
Kalimantan Barat 7 554 7 724 10 853 6 309 9 861
Kalimantan Tengah 8 207 7 107 6 946 6 336 6 841
Kalimantan Selatan 9 159 10 707 10 231 9 639 9 294
Kalimantan Timur 27 732 30 829 33 966 34 742 24 490
Sulawesi Utara 22 216 21 192 22 108 19 538 19 250
Sulawesi Tengah 32 997 34 416 21 345 38 053 33 343
Sulawesi Selatan 29 948 31 654 32 388 31 198 32 276
Sulawesi Tenggara 30 838 28 594 31 814 25 653 26 056
Gorontalo 7 030 16 836 9 229 7 315 12 702
Sulawesi Barat 15 400 15 461 15 772 12 445 7 596
Maluku 37 445 37 696 35 988 46 408 37 041
Maluku Utara 4 870 4 902 4 824 2 563 3 070
Papua Barat 15 350 13 423 12 523 12 885 14 686
Papua 36 572 36 960 37 427 31 391 28 603
INDONESIA 616 300 614 937 604 847 603 856 577 656
Tabel –––––– 3.49Table
Jumlah Rumah Tangga/Perusahaan Perikanan (RTP/PP) Tangkap di Laut
menurut Provinsi, 2006 - 2010
Number of Marine Capture Household/Fishing Company by Province,
2006 - 2010
Sumber : Statistik Perikanan Tangkap Indonesia 2010, Kementerian Kelautan dan PerikananSource Capture Fisheries Statistics of Indonesia 2010, Ministry of Marine Affairs and Fisheries
http://www.bps.go.id
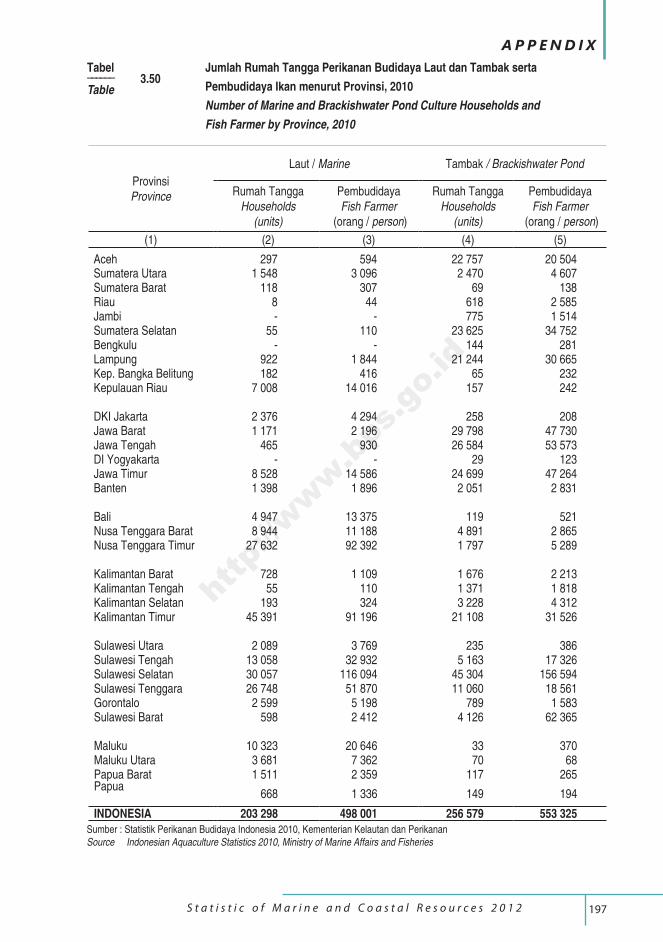
197 S t a t i s t i c o f M a r i n e a n d C o a s t a l R e s o u r c e s 2 0 1 2
A P P E N D I X
ProvinsiProvince
Laut / Marine Tambak / Brackishwater Pond
Rumah TanggaHouseholds
(units)
PembudidayaFish Farmer
(orang / person)
Rumah TanggaHouseholds
(units)
PembudidayaFish Farmer
(orang / person)
(1) (2) (3) (4) (5)
Aceh 297 594 22 757 20 504Sumatera Utara 1 548 3 096 2 470 4 607Sumatera Barat 118 307 69 138Riau 8 44 618 2 585Jambi - - 775 1 514Sumatera Selatan 55 110 23 625 34 752Bengkulu - - 144 281Lampung 922 1 844 21 244 30 665Kep. Bangka Belitung 182 416 65 232Kepulauan Riau 7 008 14 016 157 242
DKI Jakarta 2 376 4 294 258 208Jawa Barat 1 171 2 196 29 798 47 730Jawa Tengah 465 930 26 584 53 573DI Yogyakarta - - 29 123Jawa Timur 8 528 14 586 24 699 47 264Banten 1 398 1 896 2 051 2 831
Bali 4 947 13 375 119 521Nusa Tenggara Barat 8 944 11 188 4 891 2 865Nusa Tenggara Timur 27 632 92 392 1 797 5 289
Kalimantan Barat 728 1 109 1 676 2 213Kalimantan Tengah 55 110 1 371 1 818Kalimantan Selatan 193 324 3 228 4 312Kalimantan Timur 45 391 91 196 21 108 31 526
Sulawesi Utara 2 089 3 769 235 386Sulawesi Tengah 13 058 32 932 5 163 17 326Sulawesi Selatan 30 057 116 094 45 304 156 594Sulawesi Tenggara 26 748 51 870 11 060 18 561Gorontalo 2 599 5 198 789 1 583Sulawesi Barat 598 2 412 4 126 62 365
Maluku 10 323 20 646 33 370Maluku Utara 3 681 7 362 70 68Papua Barat 1 511 2 359 117 265Papua
668 1 336 149 194
INDONESIA 203 298 498 001 256 579 553 325
Tabel –––––– 3.50Table
Jumlah Rumah Tangga Perikanan Budidaya Laut dan Tambak serta
Pembudidaya Ikan menurut Provinsi, 2010
Number of Marine and Brackishwater Pond Culture Households and
Fish Farmer by Province, 2010
Sumber : Statistik Perikanan Budidaya Indonesia 2010, Kementerian Kelautan dan PerikananSource Indonesian Aquaculture Statistics 2010, Ministry of Marine Affairs and Fisheries
http://www.bps.go.id
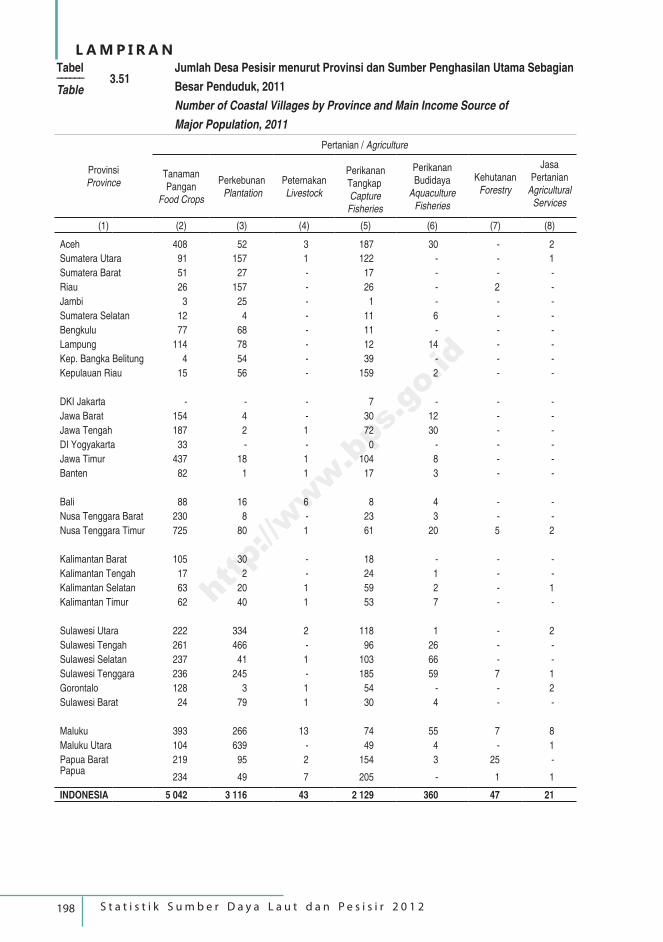
198 S t a t i s t i k S u m b e r D a y a L a u t d a n P e s i s i r 2 0 1 2
L A M P I R A N
ProvinsiProvince
Pertanian / Agriculture
Tanaman Pangan
Food Crops
Perkebunan Plantation
PeternakanLivestock
Perikanan Tangkap Capture Fisheries
Perikanan Budidaya
Aquaculture Fisheries
Kehutanan
Forestry
JasaPertanian
Agricultural Services
(1) (2) (3) (4) (5) (6) (7) (8)
Aceh 408 52 3 187 30 - 2
Sumatera Utara 91 157 1 122 - - 1
Sumatera Barat 51 27 - 17 - - -
Riau 26 157 - 26 - 2 -
Jambi 3 25 - 1 - - -
Sumatera Selatan 12 4 - 11 6 - -
Bengkulu 77 68 - 11 - - -
Lampung 114 78 - 12 14 - -
Kep. Bangka Belitung 4 54 - 39 - - -
Kepulauan Riau 15 56 - 159 2 - -
DKI Jakarta - - - 7 - - -
Jawa Barat 154 4 - 30 12 - -
Jawa Tengah 187 2 1 72 30 - -
DI Yogyakarta 33 - - 0 - - -
Jawa Timur 437 18 1 104 8 - -
Banten 82 1 1 17 3 - -
Bali 88 16 6 8 4 - -
Nusa Tenggara Barat 230 8 - 23 3 - -
Nusa Tenggara Timur 725 80 1 61 20 5 2
Kalimantan Barat 105 30 - 18 - - -
Kalimantan Tengah 17 2 - 24 1 - -
Kalimantan Selatan 63 20 1 59 2 - 1
Kalimantan Timur 62 40 1 53 7 - -
Sulawesi Utara 222 334 2 118 1 - 2
Sulawesi Tengah 261 466 - 96 26 - -
Sulawesi Selatan 237 41 1 103 66 - -
Sulawesi Tenggara 236 245 - 185 59 7 1
Gorontalo 128 3 1 54 - - 2
Sulawesi Barat 24 79 1 30 4 - -
Maluku 393 266 13 74 55 7 8
Maluku Utara 104 639 - 49 4 - 1
Papua Barat 219 95 2 154 3 25 -Papua
234 49 7 205 - 1 1
INDONESIA 5 042 3 116 43 2 129 360 47 21
Tabel –––––– 3.51Table
Jumlah Desa Pesisir menurut Provinsi dan Sumber Penghasilan Utama Sebagian
Besar Penduduk, 2011
Number of Coastal Villages by Province and Main Income Source of Major Population, 2011
http://www.bps.go.id
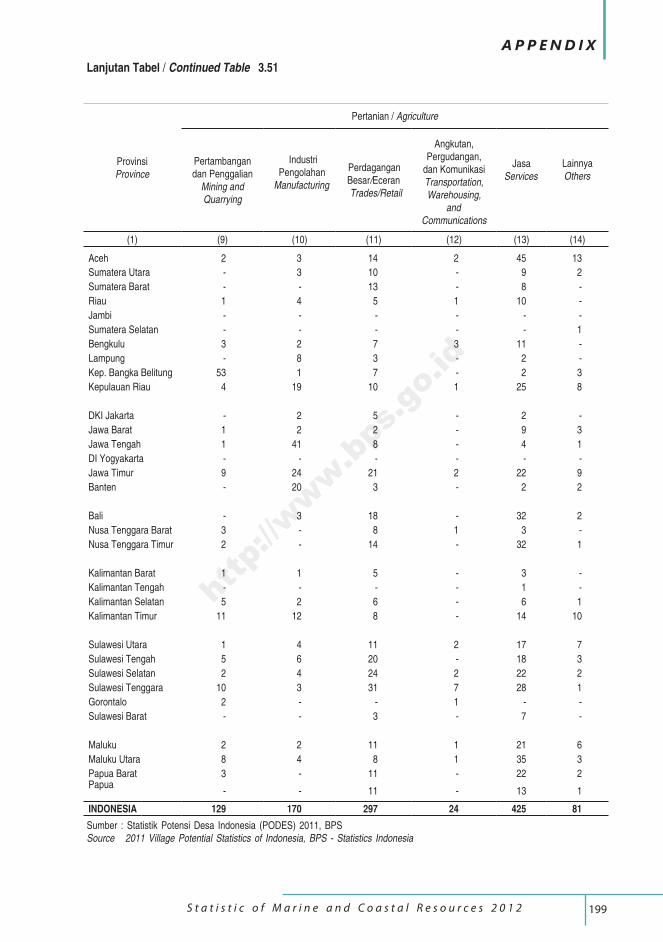
199 S t a t i s t i c o f M a r i n e a n d C o a s t a l R e s o u r c e s 2 0 1 2
A P P E N D I X
ProvinsiProvince
Pertanian / Agriculture
Pertambangandan Penggalian
Mining andQuarrying
Industri Pengolahan
Manufacturing
Perdagangan Besar/Eceran Trades/Retail
Angkutan, Pergudangan,
dan KomunikasiTransportation, Warehousing,
and Communications
Jasa Services
Lainnya Others
(1) (9) (10) (11) (12) (13) (14)
Aceh 2 3 14 2 45 13
Sumatera Utara - 3 10 - 9 2
Sumatera Barat - - 13 - 8 -
Riau 1 4 5 1 10 -
Jambi - - - - - -
Sumatera Selatan - - - - - 1
Bengkulu 3 2 7 3 11 -
Lampung - 8 3 - 2 -
Kep. Bangka Belitung 53 1 7 - 2 3
Kepulauan Riau 4 19 10 1 25 8
DKI Jakarta - 2 5 - 2 -
Jawa Barat 1 2 2 - 9 3
Jawa Tengah 1 41 8 - 4 1
DI Yogyakarta - - - - - -
Jawa Timur 9 24 21 2 22 9
Banten - 20 3 - 2 2
Bali - 3 18 - 32 2
Nusa Tenggara Barat 3 - 8 1 3 -
Nusa Tenggara Timur 2 - 14 - 32 1
Kalimantan Barat 1 1 5 - 3 -
Kalimantan Tengah - - - - 1 -
Kalimantan Selatan 5 2 6 - 6 1
Kalimantan Timur 11 12 8 - 14 10
Sulawesi Utara 1 4 11 2 17 7
Sulawesi Tengah 5 6 20 - 18 3
Sulawesi Selatan 2 4 24 2 22 2
Sulawesi Tenggara 10 3 31 7 28 1
Gorontalo 2 - - 1 - -
Sulawesi Barat - - 3 - 7 -
Maluku 2 2 11 1 21 6
Maluku Utara 8 4 8 1 35 3
Papua Barat 3 - 11 - 22 2Papua
- - 11 - 13 1
INDONESIA 129 170 297 24 425 81
Lanjutan Tabel / Continued Table 3.51
Sumber : Statistik Potensi Desa Indonesia (PODES) 2011, BPSSource 2011 Village Potential Statistics of Indonesia, BPS - Statistics Indonesia
http://www.bps.go.id
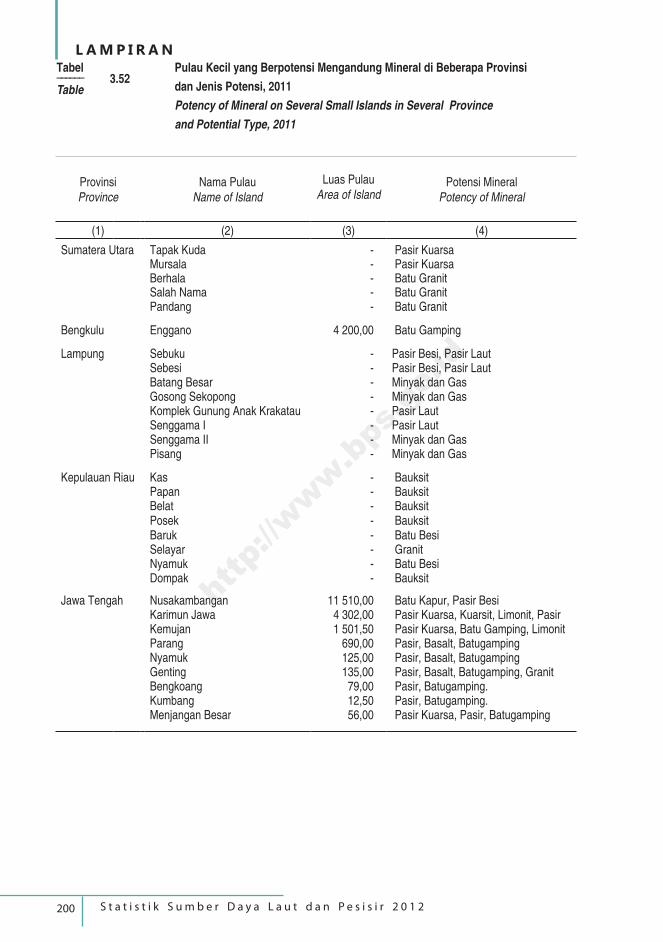
200 S t a t i s t i k S u m b e r D a y a L a u t d a n P e s i s i r 2 0 1 2
L A M P I R A N
ProvinsiProvince
Nama PulauName of Island
Luas Pulau Area of Island
Potensi MineralPotency of Mineral
(1) (2) (3) (4)
Sumatera Utara Tapak Kuda - Pasir Kuarsa Mursala - Pasir Kuarsa Berhala - Batu Granit Salah Nama - Batu Granit Pandang - Batu Granit
Bengkulu Enggano 4 200,00 Batu Gamping
Lampung Sebuku - Pasir Besi, Pasir LautSebesi - Pasir Besi, Pasir LautBatang Besar - Minyak dan GasGosong Sekopong - Minyak dan GasKomplek Gunung Anak Krakatau - Pasir LautSenggama I - Pasir LautSenggama II - Minyak dan GasPisang - Minyak dan Gas
Kepulauan Riau Kas - Bauksit Papan - Bauksit Belat - Bauksit Posek - Bauksit Baruk - Batu Besi Selayar - Granit Nyamuk - Batu Besi Dompak - Bauksit
Jawa Tengah Nusakambangan 11 510,00 Batu Kapur, Pasir Besi Karimun Jawa 4 302,00 Pasir Kuarsa, Kuarsit, Limonit, Pasir Kemujan 1 501,50 Pasir Kuarsa, Batu Gamping, Limonit Parang 690,00 Pasir, Basalt, Batugamping Nyamuk 125,00 Pasir, Basalt, Batugamping Genting 135,00 Pasir, Basalt, Batugamping, Granit Bengkoang 79,00 Pasir, Batugamping. Kumbang 12,50 Pasir, Batugamping. Menjangan Besar 56,00 Pasir Kuarsa, Pasir, Batugamping
Tabel –––––– 3.52Table
Pulau Kecil yang Berpotensi Mengandung Mineral di Beberapa Provinsi
dan Jenis Potensi, 2011
Potency of Mineral on Several Small Islands in Several Province and Potential Type, 2011
http://www.bps.go.id
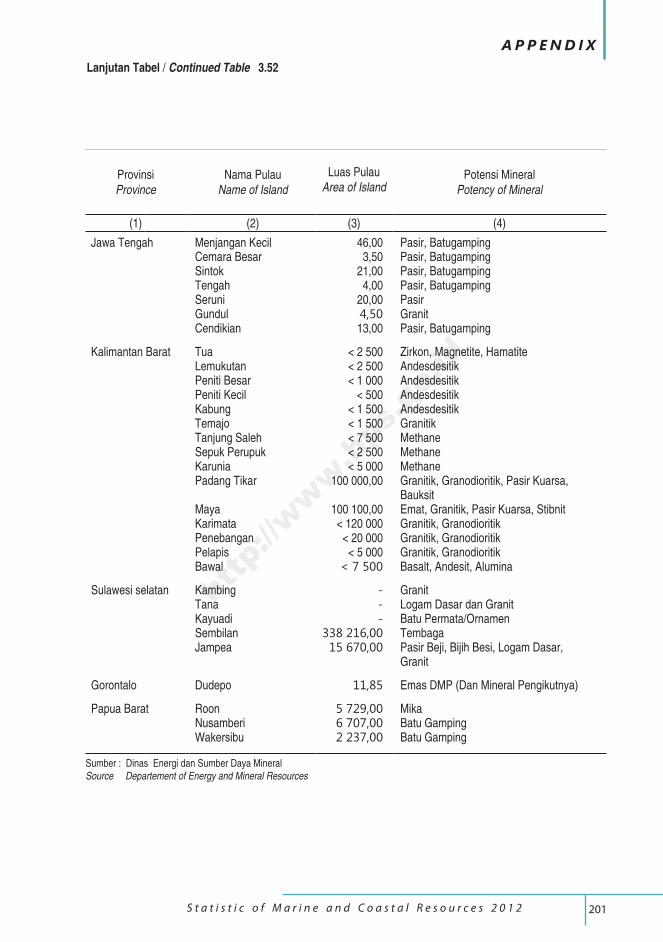
201 S t a t i s t i c o f M a r i n e a n d C o a s t a l R e s o u r c e s 2 0 1 2
A P P E N D I X
Lanjutan Tabel / Continued Table 3.52
ProvinsiProvince
Nama PulauName of Island
Luas Pulau Area of Island
Potensi MineralPotency of Mineral
(1) (2) (3) (4)
Jawa Tengah Menjangan Kecil 46,00 Pasir, Batugamping Cemara Besar 3,50 Pasir, Batugamping Sintok 21,00 Pasir, Batugamping Tengah 4,00 Pasir, Batugamping Seruni 20,00 Pasir Gundul 4,50 Granit Cendikian 13,00 Pasir, Batugamping
Kalimantan Barat Tua < 2 500 Zirkon, Magnetite, Hamatite Lemukutan < 2 500 Andesdesitik Peniti Besar < 1 000 Andesdesitik Peniti Kecil < 500 Andesdesitik Kabung < 1 500 Andesdesitik Temajo < 1 500 Granitik Tanjung Saleh < 7 500 Methane Sepuk Perupuk < 2 500 Methane Karunia < 5 000 Methane Padang Tikar 100 000,00 Granitik, Granodioritik, Pasir Kuarsa,
Bauksit Maya 100 100,00 Emat, Granitik, Pasir Kuarsa, Stibnit Karimata < 120 000 Granitik, Granodioritik Penebangan < 20 000 Granitik, Granodioritik Pelapis < 5 000 Granitik, Granodioritik Bawal < 7 500 Basalt, Andesit, Alumina
Sulawesi selatan Kambing - Granit Tana - Logam Dasar dan Granit Kayuadi - Batu Permata/Ornamen Sembilan 338 216,00 Tembaga Jampea 15 670,00 Pasir Beji, Bijih Besi, Logam Dasar,
Granit
Gorontalo Dudepo 11,85 Emas DMP (Dan Mineral Pengikutnya)
Papua Barat Roon 5 729,00 Mika Nusamberi 6 707,00 Batu Gamping Wakersibu 2 237,00 Batu Gamping
Sumber : Dinas Energi dan Sumber Daya MineralSource Departement of Energy and Mineral Resources
http://www.bps.go.id
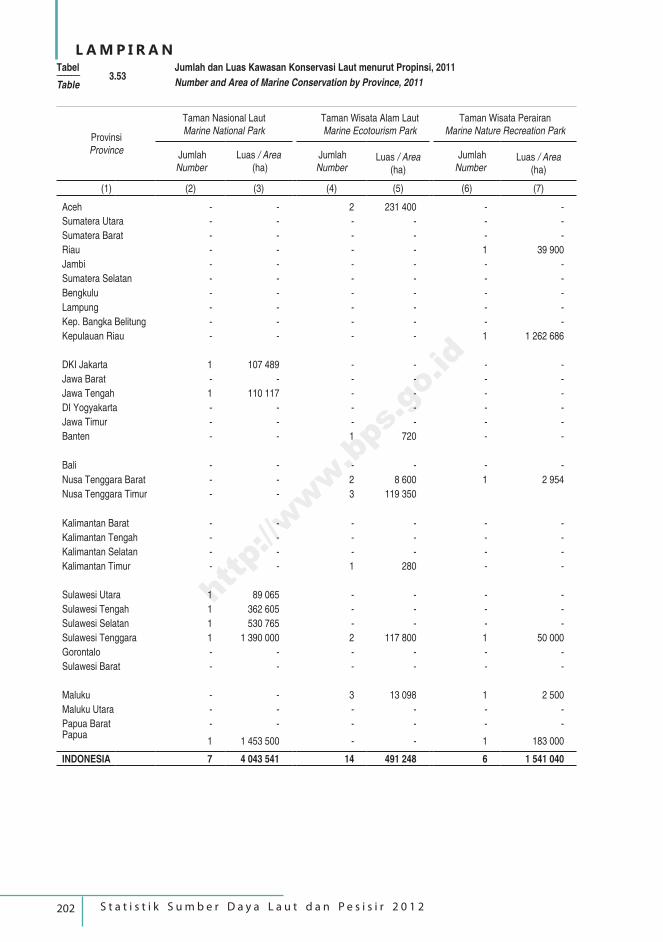
202 S t a t i s t i k S u m b e r D a y a L a u t d a n P e s i s i r 2 0 1 2
L A M P I R A N
ProvinsiProvince
Taman Nasional LautMarine National Park
Taman Wisata Alam Laut Marine Ecotourism Park
Taman Wisata PerairanMarine Nature Recreation Park
Jumlah Number
Luas / Area (ha)
Jumlah Number
Luas / Area (ha)
Jumlah Number
Luas / Area (ha)
(1) (2) (3) (4) (5) (6) (7)
Aceh - - 2 231 400 - -
Sumatera Utara - - - - - -
Sumatera Barat - - - - - -
Riau - - - - 1 39 900
Jambi - - - - - -
Sumatera Selatan - - - - - -
Bengkulu - - - - - -
Lampung - - - - - -
Kep. Bangka Belitung - - - - - -
Kepulauan Riau - - - - 1 1 262 686
DKI Jakarta 1 107 489 - - - -
Jawa Barat - - - - - -
Jawa Tengah 1 110 117 - - - -
DI Yogyakarta - - - - - -
Jawa Timur - - - - - -
Banten - - 1 720 - -
Bali - - - - - -
Nusa Tenggara Barat - - 2 8 600 1 2 954
Nusa Tenggara Timur - - 3 119 350
Kalimantan Barat - - - - - -
Kalimantan Tengah - - - - - -
Kalimantan Selatan - - - - - -
Kalimantan Timur - - 1 280 - -
Sulawesi Utara 1 89 065 - - - -
Sulawesi Tengah 1 362 605 - - - -
Sulawesi Selatan 1 530 765 - - - -
Sulawesi Tenggara 1 1 390 000 2 117 800 1 50 000
Gorontalo - - - - - -
Sulawesi Barat - - - - - -
Maluku - - 3 13 098 1 2 500
Maluku Utara - - - - - -
Papua Barat - - - - - -Papua
1 1 453 500 - - 1 183 000
INDONESIA 7 4 043 541 14 491 248 6 1 541 040
Tabel –––––– 3.53Table
Jumlah dan Luas Kawasan Konservasi Laut menurut Propinsi, 2011
Number and Area of Marine Conservation by Province, 2011
http://www.bps.go.id
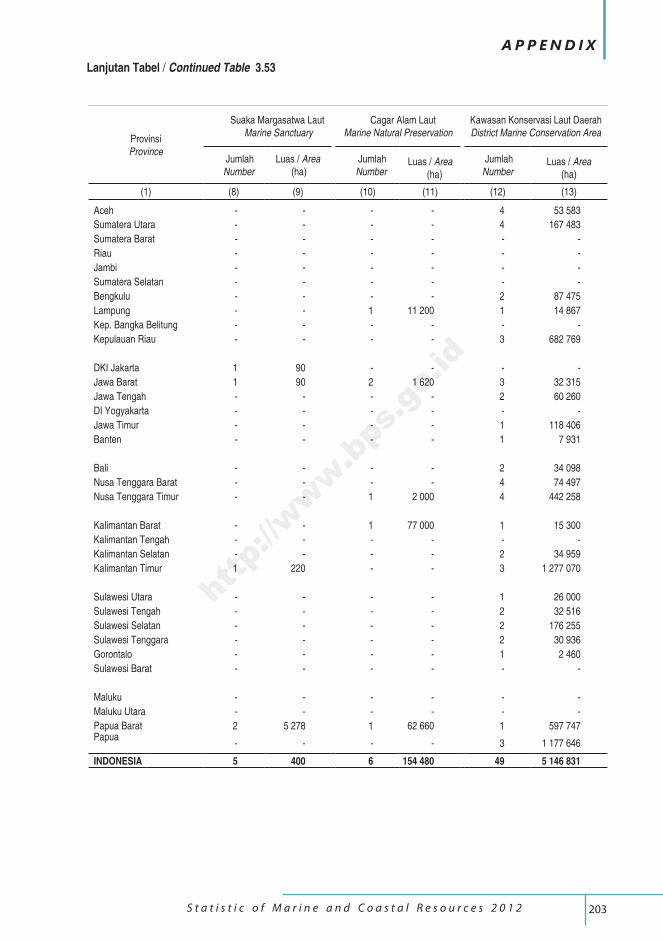
203 S t a t i s t i c o f M a r i n e a n d C o a s t a l R e s o u r c e s 2 0 1 2
A P P E N D I X
ProvinsiProvince
Suaka Margasatwa Laut Marine Sanctuary
Cagar Alam LautMarine Natural Preservation
Kawasan Konservasi Laut DaerahDistrict Marine Conservation Area
Jumlah Number
Luas / Area (ha)
Jumlah Number
Luas / Area (ha)
Jumlah Number
Luas / Area (ha)
(1) (8) (9) (10) (11) (12) (13)
Aceh - - - - 4 53 583
Sumatera Utara - - - - 4 167 483
Sumatera Barat - - - - - -
Riau - - - - - -
Jambi - - - - - -
Sumatera Selatan - - - - - -
Bengkulu - - - - 2 87 475
Lampung - - 1 11 200 1 14 867
Kep. Bangka Belitung - - - - - -
Kepulauan Riau - - - - 3 682 769
DKI Jakarta 1 90 - - - -
Jawa Barat 1 90 2 1 620 3 32 315
Jawa Tengah - - - - 2 60 260
DI Yogyakarta - - - - - -
Jawa Timur - - - - 1 118 406
Banten - - - - 1 7 931
Bali - - - - 2 34 098
Nusa Tenggara Barat - - - - 4 74 497
Nusa Tenggara Timur - - 1 2 000 4 442 258
Kalimantan Barat - - 1 77 000 1 15 300
Kalimantan Tengah - - - - - -
Kalimantan Selatan - - - - 2 34 959
Kalimantan Timur 1 220 - - 3 1 277 070
Sulawesi Utara - - - - 1 26 000
Sulawesi Tengah - - - - 2 32 516
Sulawesi Selatan - - - - 2 176 255
Sulawesi Tenggara - - - - 2 30 936
Gorontalo - - - - 1 2 460
Sulawesi Barat - - - - - -
Maluku - - - - - -
Maluku Utara - - - - - -
Papua Barat 2 5 278 1 62 660 1 597 747Papua
- - - - 3 1 177 646
INDONESIA 5 400 6 154 480 49 5 146 831
Lanjutan Tabel / Continued Table 3.53
http://www.bps.go.id
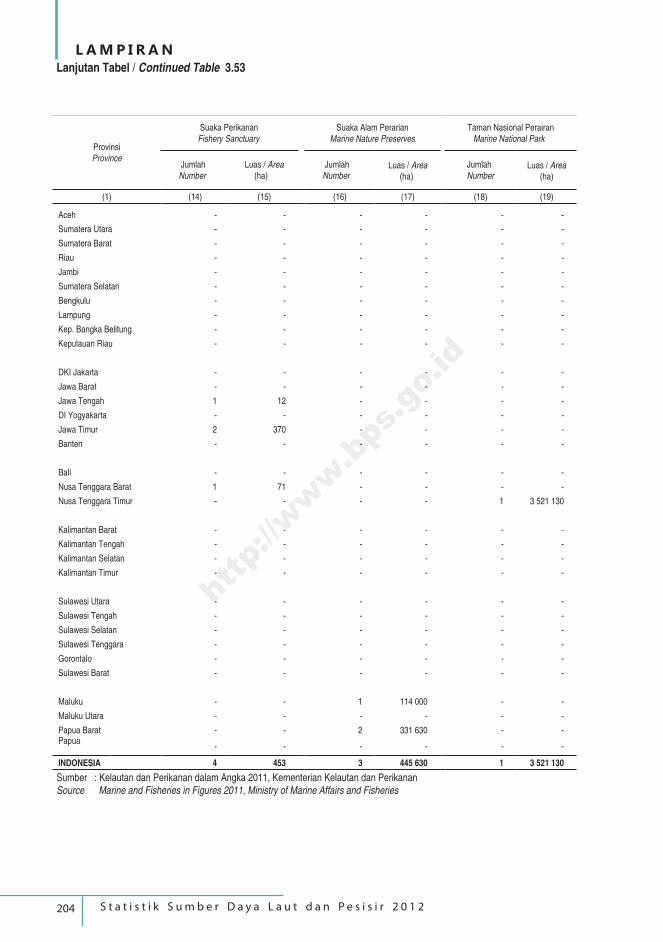
204 S t a t i s t i k S u m b e r D a y a L a u t d a n P e s i s i r 2 0 1 2
L A M P I R A N
ProvinsiProvince
Suaka Perikanan Fishery Sanctuary
Suaka Alam PerarianMarine Nature Preserves
Taman Nasional Perairan Marine National Park
Jumlah Number
Luas / Area (ha)
Jumlah Number
Luas / Area (ha)
Jumlah Number
Luas / Area (ha)
(1) (14) (15) (16) (17) (18) (19)
Aceh - - - - - -
Sumatera Utara - - - - - -
Sumatera Barat - - - - - -
Riau - - - - - -
Jambi - - - - - -
Sumatera Selatan - - - - - -
Bengkulu - - - - - -
Lampung - - - - - -
Kep. Bangka Belitung - - - - - -
Kepulauan Riau - - - - - -
DKI Jakarta - - - - - -
Jawa Barat - - - - - -
Jawa Tengah 1 12 - - - -
DI Yogyakarta - - - - - -
Jawa Timur 2 370 - - - -
Banten - - - - - -
Bali - - - - - -
Nusa Tenggara Barat 1 71 - - - -
Nusa Tenggara Timur - - - - 1 3 521 130
Kalimantan Barat - - - - - -
Kalimantan Tengah - - - - - -
Kalimantan Selatan - - - - - -
Kalimantan Timur - - - - - -
Sulawesi Utara - - - - - -
Sulawesi Tengah - - - - - -
Sulawesi Selatan - - - - - -
Sulawesi Tenggara - - - - - -
Gorontalo - - - - - -
Sulawesi Barat - - - - - -
Maluku - - 1 114 000 - -
Maluku Utara - - - - - -
Papua Barat - - 2 331 630 - -Papua
- - - - - -
INDONESIA 4 453 3 445 630 1 3 521 130
Lanjutan Tabel / Continued Table 3.53
Sumber : Kelautan dan Perikanan dalam Angka 2011, Kementerian Kelautan dan PerikananSource Marine and Fisheries in Figures 2011, Ministry of Marine Affairs and Fisheries
http://www.bps.go.id
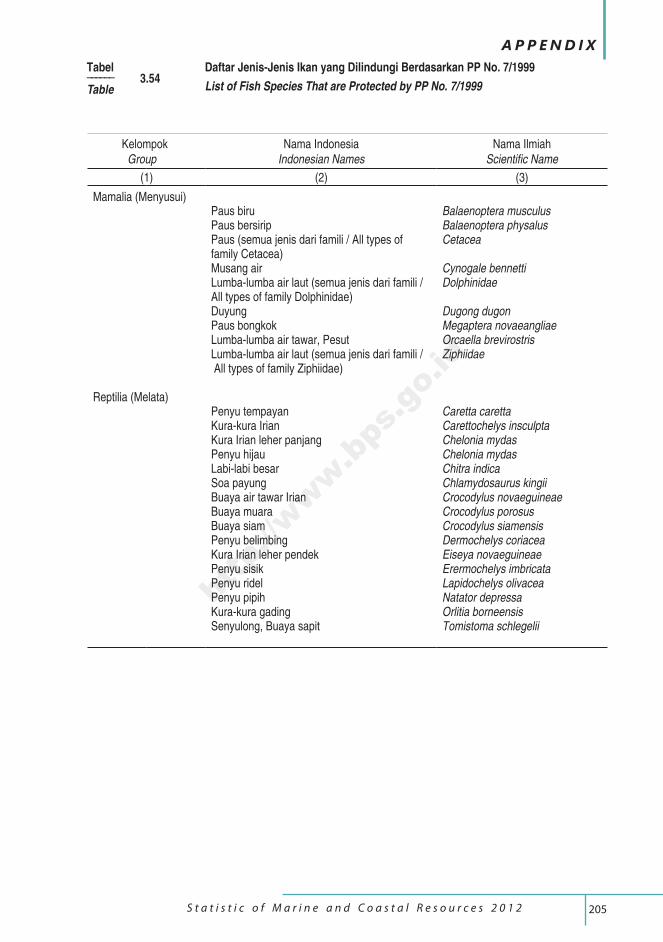
205 S t a t i s t i c o f M a r i n e a n d C o a s t a l R e s o u r c e s 2 0 1 2
A P P E N D I X
Kelompok Group
Nama IndonesiaIndonesian Names
Nama IlmiahScientific Name
(1) (2) (3)
Mamalia (Menyusui)Paus biru Balaenoptera musculusPaus bersirip Balaenoptera physalusPaus (semua jenis dari famili / All types of Cetaceafamily Cetacea)Musang air Cynogale bennettiLumba-lumba air laut (semua jenis dari famili / DolphinidaeAll types of family Dolphinidae)Duyung Dugong dugonPaus bongkok Megaptera novaeangliaeLumba-lumba air tawar, Pesut Orcaella brevirostrisLumba-lumba air laut (semua jenis dari famili / Ziphiidae All types of family Ziphiidae)
Reptilia (Melata)Penyu tempayan Caretta carettaKura-kura Irian Carettochelys insculptaKura Irian leher panjang Chelonia mydasPenyu hijau Chelonia mydasLabi-labi besar Chitra indicaSoa payung Chlamydosaurus kingiiBuaya air tawar Irian Crocodylus novaeguineaeBuaya muara Crocodylus porosusBuaya siam Crocodylus siamensisPenyu belimbing Dermochelys coriaceaKura Irian leher pendek Eiseya novaeguineaePenyu sisik Erermochelys imbricataPenyu ridel Lapidochelys olivaceaPenyu pipih Natator depressaKura-kura gading Orlitia borneensisSenyulong, Buaya sapit Tomistoma schlegelii
Tabel –––––– 3.54Table
Daftar Jenis-Jenis Ikan yang Dilindungi Berdasarkan PP No. 7/1999
List of Fish Species That are Protected by PP No. 7/1999
http://www.bps.go.id
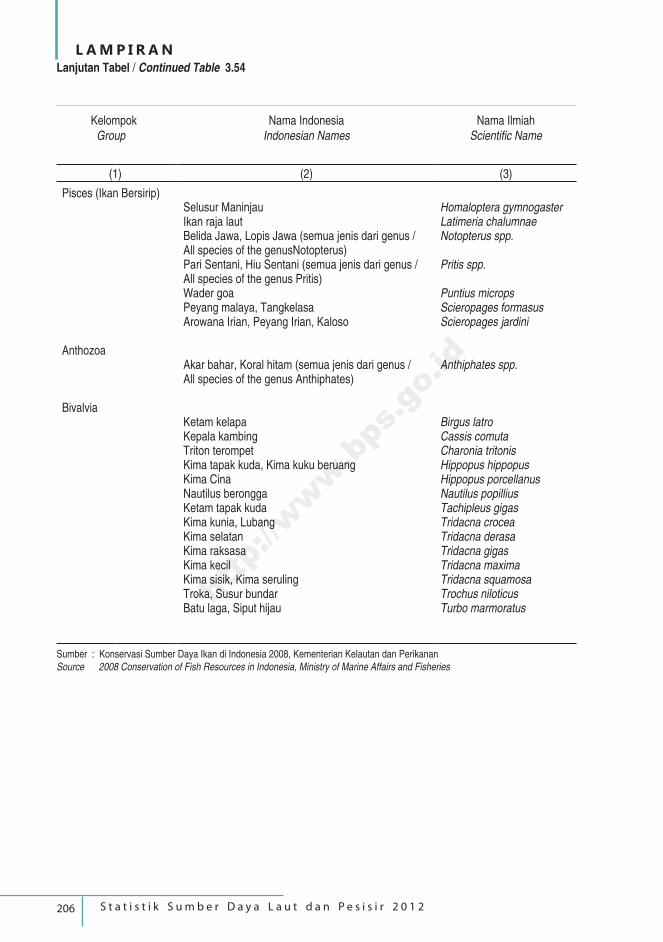
206 S t a t i s t i k S u m b e r D a y a L a u t d a n P e s i s i r 2 0 1 2
L A M P I R A NLanjutan Tabel / Continued Table 3.54
Kelompok Group
Nama IndonesiaIndonesian Names
Nama IlmiahScientific Name
(1) (2) (3)
Pisces (Ikan Bersirip)Selusur Maninjau Homaloptera gymnogasterIkan raja laut Latimeria chalumnaeBelida Jawa, Lopis Jawa (semua jenis dari genus / Notopterus spp.All species of the genusNotopterus)Pari Sentani, Hiu Sentani (semua jenis dari genus / Pritis spp.All species of the genus Pritis)Wader goa Puntius micropsPeyang malaya, Tangkelasa Scieropages formasusArowana Irian, Peyang Irian, Kaloso Scieropages jardini
AnthozoaAkar bahar, Koral hitam (semua jenis dari genus / Anthiphates spp.All species of the genus Anthiphates)
BivalviaKetam kelapa Birgus latroKepala kambing Cassis comutaTriton terompet Charonia tritonisKima tapak kuda, Kima kuku beruang Hippopus hippopusKima Cina Hippopus porcellanusNautilus berongga Nautilus popilliusKetam tapak kuda Tachipleus gigasKima kunia, Lubang Tridacna croceaKima selatan Tridacna derasaKima raksasa Tridacna gigasKima kecil Tridacna maximaKima sisik, Kima seruling Tridacna squamosaTroka, Susur bundar Trochus niloticusBatu laga, Siput hijau Turbo marmoratus
Sumber : Konservasi Sumber Daya Ikan di Indonesia 2008, Kementerian Kelautan dan PerikananSource 2008 Conservation of Fish Resources in Indonesia, Ministry of Marine Affairs and Fisheries
http://www.bps.go.id
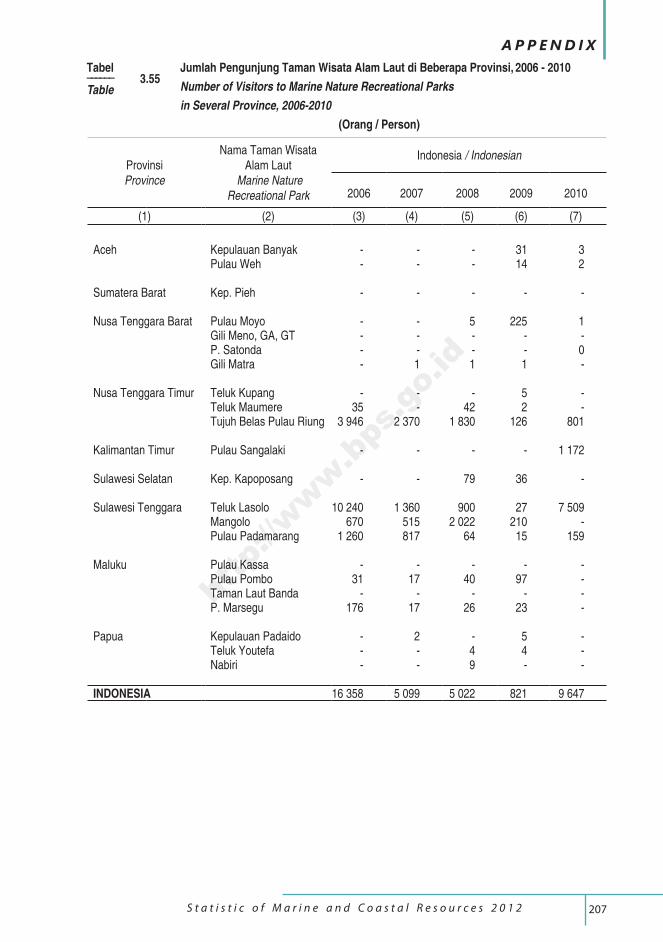
207 S t a t i s t i c o f M a r i n e a n d C o a s t a l R e s o u r c e s 2 0 1 2
A P P E N D I X
ProvinsiProvince
Nama Taman Wisata Alam Laut
Marine Nature Recreational Park
Indonesia / Indonesian
2006 2007 2008 2009 2010
(1) (2) (3) (4) (5) (6) (7)
Aceh Kepulauan Banyak - - - 31 3Pulau Weh - - - 14 2
Sumatera Barat Kep. Pieh - - - - -
Nusa Tenggara Barat Pulau Moyo - - 5 225 1Gili Meno, GA, GT - - - - -P. Satonda - - - - 0Gili Matra - 1 1 1 -
Nusa Tenggara Timur Teluk Kupang - - - 5 -Teluk Maumere 35 - 42 2 -Tujuh Belas Pulau Riung 3 946 2 370 1 830 126 801
Kalimantan Timur Pulau Sangalaki - - - - 1 172
Sulawesi Selatan Kep. Kapoposang - - 79 36 -
Sulawesi Tenggara Teluk Lasolo 10 240 1 360 900 27 7 509Mangolo 670 515 2 022 210 -Pulau Padamarang 1 260 817 64 15 159
Maluku Pulau Kassa - - - - -Pulau Pombo 31 17 40 97 -Taman Laut Banda - - - - -P. Marsegu 176 17 26 23 -
Papua Kepulauan Padaido - 2 - 5 -Teluk Youtefa - - 4 4 -Nabiri - - 9 - -
INDONESIA 16 358 5 099 5 022 821 9 647
Tabel –––––– 3.55Table
Jumlah Pengunjung Taman Wisata Alam Laut di Beberapa Provinsi, 2006 - 2010
Number of Visitors to Marine Nature Recreational Parks
in Several Province, 2006-2010
(Orang / Person)
http://www.bps.go.id
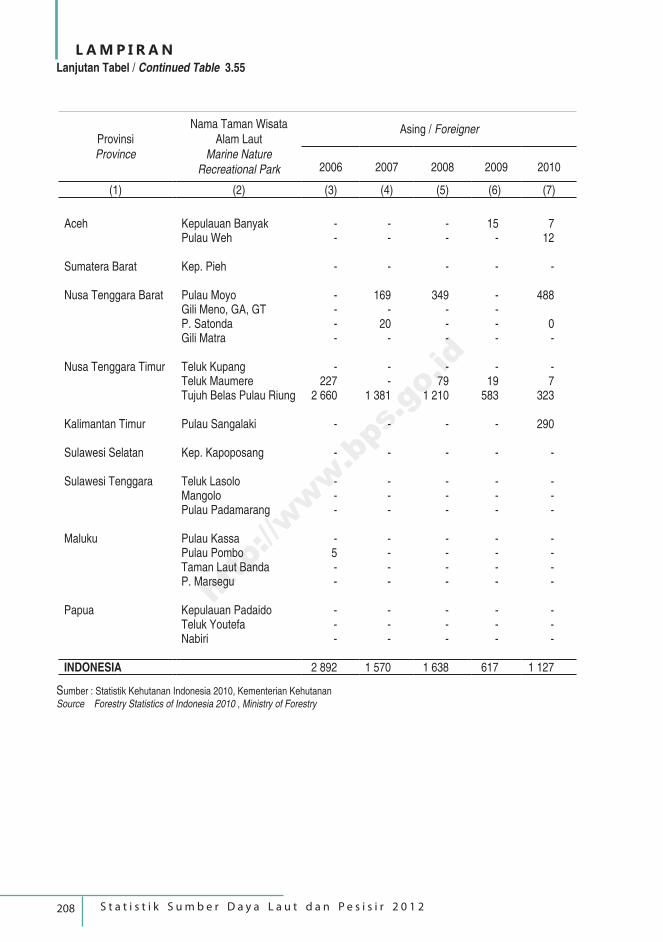
208 S t a t i s t i k S u m b e r D a y a L a u t d a n P e s i s i r 2 0 1 2
L A M P I R A N
ProvinsiProvince
Nama Taman Wisata Alam Laut
Marine Nature Recreational Park
Asing / Foreigner
2006 2007 2008 2009 2010
(1) (2) (3) (4) (5) (6) (7)
Aceh Kepulauan Banyak - - - 15 7Pulau Weh - - - - 12
Sumatera Barat Kep. Pieh - - - - -
Nusa Tenggara Barat Pulau Moyo - 169 349 - 488Gili Meno, GA, GT - - - -P. Satonda - 20 - - 0Gili Matra - - - - -
Nusa Tenggara Timur Teluk Kupang - - - - -Teluk Maumere 227 - 79 19 7Tujuh Belas Pulau Riung 2 660 1 381 1 210 583 323
Kalimantan Timur Pulau Sangalaki - - - - 290
Sulawesi Selatan Kep. Kapoposang - - - - -
Sulawesi Tenggara Teluk Lasolo - - - - -Mangolo - - - - -Pulau Padamarang - - - - -
Maluku Pulau Kassa - - - - -Pulau Pombo 5 - - - -Taman Laut Banda - - - - -P. Marsegu - - - - -
Papua Kepulauan Padaido - - - - -Teluk Youtefa - - - - -Nabiri - - - - -
INDONESIA 2 892 1 570 1 638 617 1 127
Lanjutan Tabel / Continued Table 3.55
Sumber : Statistik Kehutanan Indonesia 2010, Kementerian KehutananSource Forestry Statistics of Indonesia 2010 , Ministry of Forestry
http://www.bps.go.id
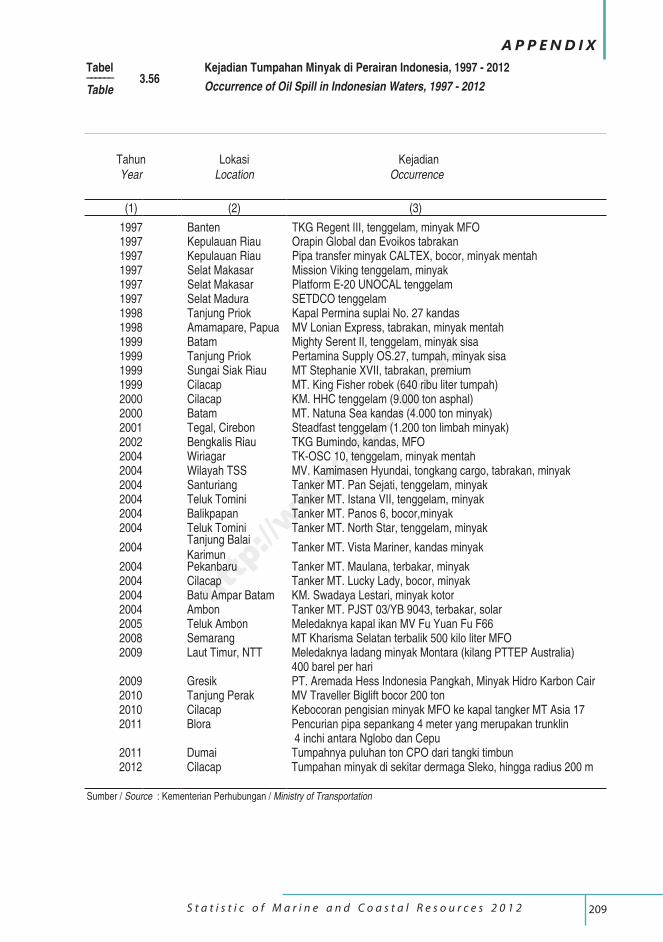
209 S t a t i s t i c o f M a r i n e a n d C o a s t a l R e s o u r c e s 2 0 1 2
A P P E N D I X
TahunYear
LokasiLocation
Kejadian Occurrence
(1) (2) (3)
1997 Banten TKG Regent III, tenggelam, minyak MFO1997 Kepulauan Riau Orapin Global dan Evoikos tabrakan1997 Kepulauan Riau Pipa transfer minyak CALTEX, bocor, minyak mentah 1997 Selat Makasar Mission Viking tenggelam, minyak1997 Selat Makasar Platform E-20 UNOCAL tenggelam1997 Selat Madura SETDCO tenggelam 1998 Tanjung Priok Kapal Permina suplai No. 27 kandas 1998 Amamapare, Papua MV Lonian Express, tabrakan, minyak mentah1999 Batam Mighty Serent II, tenggelam, minyak sisa1999 Tanjung Priok Pertamina Supply OS.27, tumpah, minyak sisa1999 Sungai Siak Riau MT Stephanie XVII, tabrakan, premium1999 Cilacap MT. King Fisher robek (640 ribu liter tumpah) 2000 Cilacap KM. HHC tenggelam (9.000 ton asphal)2000 Batam MT. Natuna Sea kandas (4.000 ton minyak) 2001 Tegal, Cirebon Steadfast tenggelam (1.200 ton limbah minyak)2002 Bengkalis Riau TKG Bumindo, kandas, MFO2004 Wiriagar TK-OSC 10, tenggelam, minyak mentah2004 Wilayah TSS MV. Kamimasen Hyundai, tongkang cargo, tabrakan, minyak2004 Santuriang Tanker MT. Pan Sejati, tenggelam, minyak2004 Teluk Tomini Tanker MT. Istana VII, tenggelam, minyak2004 Balikpapan Tanker MT. Panos 6, bocor,minyak2004 Teluk Tomini Tanker MT. North Star, tenggelam, minyak
2004Tanjung Balai Karimun
Tanker MT. Vista Mariner, kandas minyak
2004 Pekanbaru Tanker MT. Maulana, terbakar, minyak2004 Cilacap Tanker MT. Lucky Lady, bocor, minyak2004 Batu Ampar Batam KM. Swadaya Lestari, minyak kotor2004 Ambon Tanker MT. PJST 03/YB 9043, terbakar, solar2005 Teluk Ambon Meledaknya kapal ikan MV Fu Yuan Fu F66 2008 Semarang MT Kharisma Selatan terbalik 500 kilo liter MFO2009 Laut Timur, NTT Meledaknya ladang minyak Montara (kilang PTTEP Australia)
400 barel per hari2009 Gresik PT. Aremada Hess Indonesia Pangkah, Minyak Hidro Karbon Cair2010 Tanjung Perak MV Traveller Biglift bocor 200 ton 2010 Cilacap Kebocoran pengisian minyak MFO ke kapal tangker MT Asia 172011 Blora Pencurian pipa sepankang 4 meter yang merupakan trunklin
4 inchi antara Nglobo dan Cepu2011 Dumai Tumpahnya puluhan ton CPO dari tangki timbun2012 Cilacap Tumpahan minyak di sekitar dermaga Sleko, hingga radius 200 m
Tabel –––––– 3.56Table
Kejadian Tumpahan Minyak di Perairan Indonesia, 1997 - 2012
Occurrence of Oil Spill in Indonesian Waters, 1997 - 2012
Sumber / Source : Kementerian Perhubungan / Ministry of Transportation
http://www.bps.go.id
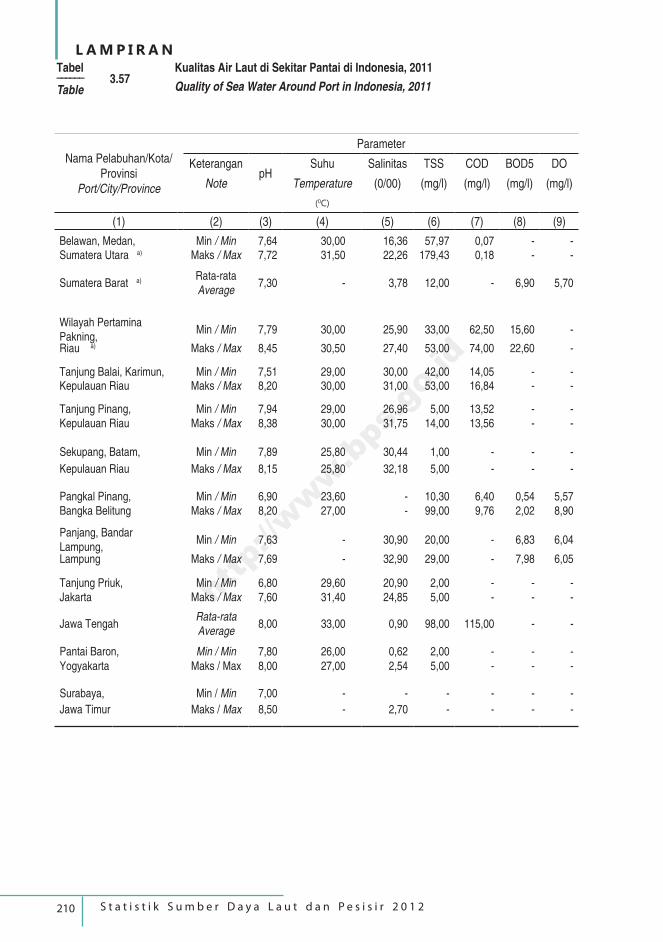
210 S t a t i s t i k S u m b e r D a y a L a u t d a n P e s i s i r 2 0 1 2
L A M P I R A N
Nama Pelabuhan/Kota/Provinsi
Port/City/Province
Parameter
KeteranganpH
Suhu Salinitas TSS COD BOD5 DO
Note Temperature (0/00) (mg/l) (mg/l) (mg/l) (mg/l)
(0C)
(1) (2) (3) (4) (5) (6) (7) (8) (9)
Belawan, Medan, Min / Min 7,64 30,00 16,36 57,97 0,07 - -Sumatera Utara a) Maks / Max 7,72 31,50 22,26 179,43 0,18 - -
Sumatera Barat a) Rata-rata Average
7,30 - 3,78 12,00 - 6,90 5,70
Wilayah Pertamina Pakning,
Min / Min 7,79 30,00 25,90 33,00 62,50 15,60 -
Riau a) Maks / Max 8,45 30,50 27,40 53,00 74,00 22,60 -
Tanjung Balai, Karimun, Min / Min 7,51 29,00 30,00 42,00 14,05 - -Kepulauan Riau Maks / Max 8,20 30,00 31,00 53,00 16,84 - -
Tanjung Pinang, Min / Min 7,94 29,00 26,96 5,00 13,52 - -Kepulauan Riau Maks / Max 8,38 30,00 31,75 14,00 13,56 - -
Sekupang, Batam, Min / Min 7,89 25,80 30,44 1,00 - - -
Kepulauan Riau Maks / Max 8,15 25,80 32,18 5,00 - - -
Pangkal Pinang, Min / Min 6,90 23,60 - 10,30 6,40 0,54 5,57Bangka Belitung Maks / Max 8,20 27,00 - 99,00 9,76 2,02 8,90
Panjang, Bandar Lampung,
Min / Min 7,63 - 30,90 20,00 - 6,83 6,04
Lampung Maks / Max 7,69 - 32,90 29,00 - 7,98 6,05
Tanjung Priuk, Min / Min 6,80 29,60 20,90 2,00 - - -Jakarta Maks / Max 7,60 31,40 24,85 5,00 - - -
Jawa TengahRata-rata Average
8,00 33,00 0,90 98,00 115,00 - -
Pantai Baron, Min / Min 7,80 26,00 0,62 2,00 - - -Yogyakarta Maks / Max 8,00 27,00 2,54 5,00 - - -
Surabaya, Min / Min 7,00 - - - - - -
Jawa Timur Maks / Max 8,50 - 2,70 - - - -
Tabel –––––– 3.57Table
Kualitas Air Laut di Sekitar Pantai di Indonesia, 2011
Quality of Sea Water Around Port in Indonesia, 2011
http://www.bps.go.id
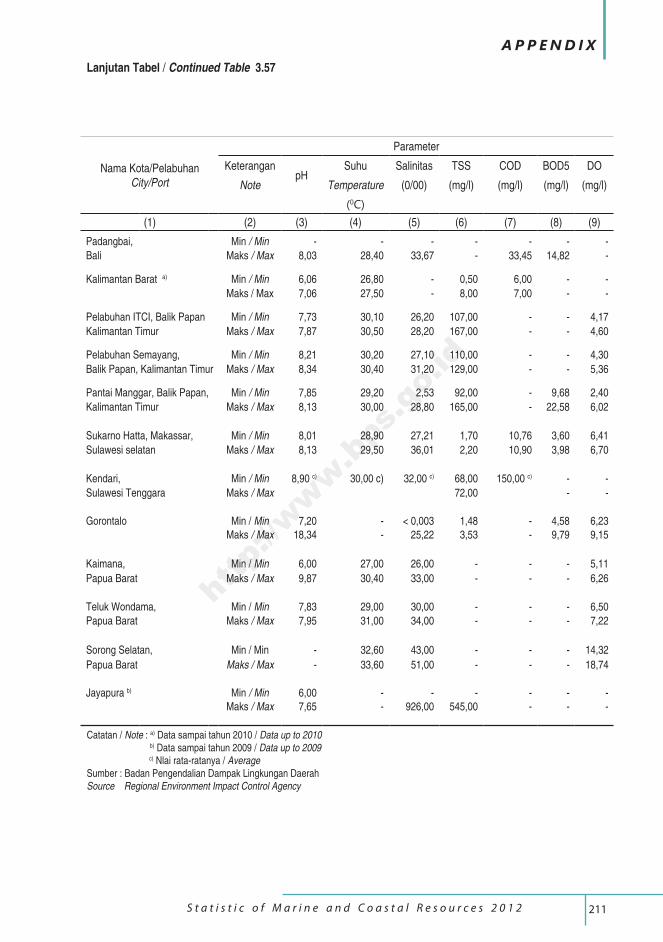
211 S t a t i s t i c o f M a r i n e a n d C o a s t a l R e s o u r c e s 2 0 1 2
A P P E N D I X
Lanjutan Tabel / Continued Table 3.57
Nama Kota/PelabuhanCity/Port
Parameter
KeteranganpH
Suhu Salinitas TSS COD BOD5 DO
Note Temperature (0/00) (mg/l) (mg/l) (mg/l) (mg/l)
(0C)
(1) (2) (3) (4) (5) (6) (7) (8) (9)
Padangbai, Min / Min - - - - - - -
Bali Maks / Max 8,03 28,40 33,67 - 33,45 14,82 -
Kalimantan Barat a) Min / Min 6,06 26,80 - 0,50 6,00 - -
Maks / Max 7,06 27,50 - 8,00 7,00 - -
Pelabuhan ITCI, Balik Papan Min / Min 7,73 30,10 26,20 107,00 - - 4,17
Kalimantan Timur Maks / Max 7,87 30,50 28,20 167,00 - - 4,60
Pelabuhan Semayang, Min / Min 8,21 30,20 27,10 110,00 - - 4,30
Balik Papan, Kalimantan Timur Maks / Max 8,34 30,40 31,20 129,00 - - 5,36
Pantai Manggar, Balik Papan, Min / Min 7,85 29,20 2,53 92,00 - 9,68 2,40
Kalimantan Timur Maks / Max 8,13 30,00 28,80 165,00 - 22,58 6,02
Sukarno Hatta, Makassar, Min / Min 8,01 28,90 27,21 1,70 10,76 3,60 6,41
Sulawesi selatan Maks / Max 8,13 29,50 36,01 2,20 10,90 3,98 6,70
Kendari, Min / Min 8,90 c) 30,00 c) 32,00 c) 68,00 150,00 c) - -
Sulawesi Tenggara Maks / Max 72,00 - -
Gorontalo Min / Min 7,20 - < 0,003 1,48 - 4,58 6,23Maks / Max 18,34 - 25,22 3,53 - 9,79 9,15
Kaimana, Min / Min 6,00 27,00 26,00 - - - 5,11
Papua Barat Maks / Max 9,87 30,40 33,00 - - - 6,26
Teluk Wondama, Min / Min 7,83 29,00 30,00 - - - 6,50
Papua Barat Maks / Max 7,95 31,00 34,00 - - - 7,22
Sorong Selatan, Min / Min - 32,60 43,00 - - - 14,32
Papua Barat Maks / Max - 33,60 51,00 - - - 18,74
Jayapura b) Min / Min 6,00 - - - - - -Maks / Max 7,65 - 926,00 545,00 - - -
Catatan / Note : a) Data sampai tahun 2010 / Data up to 2010 b) Data sampai tahun 2009 / Data up to 2009 c) Nlai rata-ratanya / Average Sumber : Badan Pengendalian Dampak Lingkungan DaerahSource Regional Environment Impact Control Agency
http://www.bps.go.id
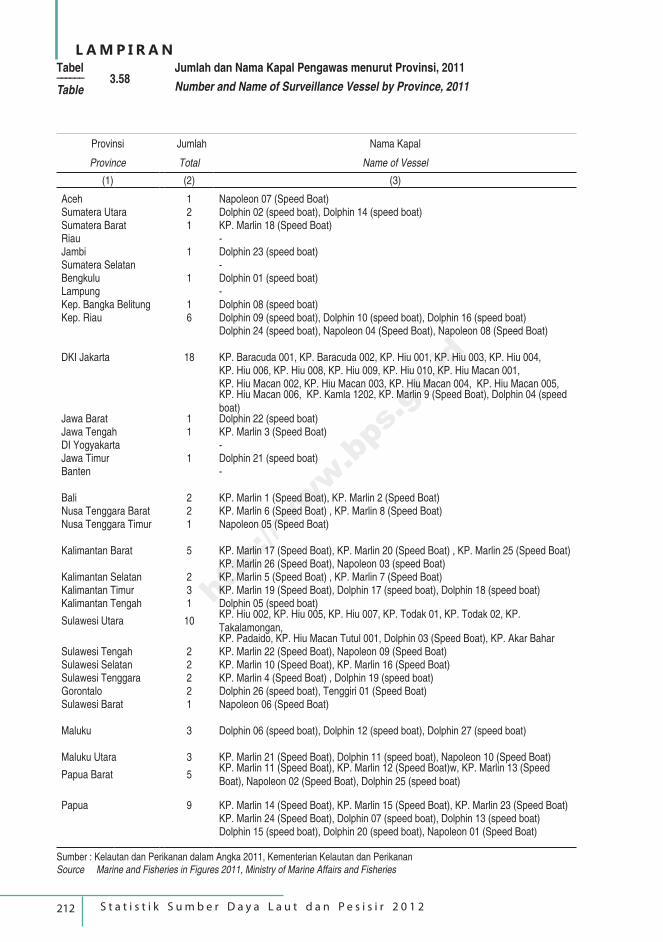
212 S t a t i s t i k S u m b e r D a y a L a u t d a n P e s i s i r 2 0 1 2
L A M P I R A N
Provinsi Jumlah Nama Kapal
Province Total Name of Vessel
(1) (2) (3)
Aceh 1 Napoleon 07 (Speed Boat)Sumatera Utara 2 Dolphin 02 (speed boat), Dolphin 14 (speed boat)Sumatera Barat 1 KP. Marlin 18 (Speed Boat)Riau -Jambi 1 Dolphin 23 (speed boat)Sumatera Selatan -Bengkulu 1 Dolphin 01 (speed boat)Lampung -Kep. Bangka Belitung 1 Dolphin 08 (speed boat)Kep. Riau 6 Dolphin 09 (speed boat), Dolphin 10 (speed boat), Dolphin 16 (speed boat)
Dolphin 24 (speed boat), Napoleon 04 (Speed Boat), Napoleon 08 (Speed Boat)
DKI Jakarta 18 KP. Baracuda 001, KP. Baracuda 002, KP. Hiu 001, KP. Hiu 003, KP. Hiu 004,KP. Hiu 006, KP. Hiu 008, KP. Hiu 009, KP. Hiu 010, KP. Hiu Macan 001,KP. Hiu Macan 002, KP. Hiu Macan 003, KP. Hiu Macan 004, KP. Hiu Macan 005,KP. Hiu Macan 006, KP. Kamla 1202, KP. Marlin 9 (Speed Boat), Dolphin 04 (speed boat)
Jawa Barat 1 Dolphin 22 (speed boat)Jawa Tengah 1 KP. Marlin 3 (Speed Boat)DI Yogyakarta -Jawa Timur 1 Dolphin 21 (speed boat)Banten -
Bali 2 KP. Marlin 1 (Speed Boat), KP. Marlin 2 (Speed Boat)Nusa Tenggara Barat 2 KP. Marlin 6 (Speed Boat) , KP. Marlin 8 (Speed Boat) Nusa Tenggara Timur 1 Napoleon 05 (Speed Boat)
Kalimantan Barat 5 KP. Marlin 17 (Speed Boat), KP. Marlin 20 (Speed Boat) , KP. Marlin 25 (Speed Boat)KP. Marlin 26 (Speed Boat), Napoleon 03 (speed Boat)
Kalimantan Selatan 2 KP. Marlin 5 (Speed Boat) , KP. Marlin 7 (Speed Boat) Kalimantan Timur 3 KP. Marlin 19 (Speed Boat), Dolphin 17 (speed boat), Dolphin 18 (speed boat)Kalimantan Tengah 1 Dolphin 05 (speed boat)
Sulawesi Utara 10KP. Hiu 002, KP. Hiu 005, KP. Hiu 007, KP. Todak 01, KP. Todak 02, KP. Takalamongan,KP. Padaido, KP. Hiu Macan Tutul 001, Dolphin 03 (Speed Boat), KP. Akar Bahar
Sulawesi Tengah 2 KP. Marlin 22 (Speed Boat), Napoleon 09 (Speed Boat)Sulawesi Selatan 2 KP. Marlin 10 (Speed Boat), KP. Marlin 16 (Speed Boat) Sulawesi Tenggara 2 KP. Marlin 4 (Speed Boat) , Dolphin 19 (speed boat)Gorontalo 2 Dolphin 26 (speed boat), Tenggiri 01 (Speed Boat)Sulawesi Barat 1 Napoleon 06 (Speed Boat)
Maluku 3 Dolphin 06 (speed boat), Dolphin 12 (speed boat), Dolphin 27 (speed boat)
Maluku Utara 3 KP. Marlin 21 (Speed Boat), Dolphin 11 (speed boat), Napoleon 10 (Speed Boat)
Papua Barat 5KP. Marlin 11 (Speed Boat), KP. Marlin 12 (Speed Boat)w, KP. Marlin 13 (Speed Boat), Napoleon 02 (Speed Boat), Dolphin 25 (speed boat)
Papua 9 KP. Marlin 14 (Speed Boat), KP. Marlin 15 (Speed Boat), KP. Marlin 23 (Speed Boat)KP. Marlin 24 (Speed Boat), Dolphin 07 (speed boat), Dolphin 13 (speed boat)Dolphin 15 (speed boat), Dolphin 20 (speed boat), Napoleon 01 (Speed Boat)
Tabel –––––– 3.58Table
Jumlah dan Nama Kapal Pengawas menurut Provinsi, 2011
Number and Name of Surveillance Vessel by Province, 2011
Sumber : Kelautan dan Perikanan dalam Angka 2011, Kementerian Kelautan dan PerikananSource Marine and Fisheries in Figures 2011, Ministry of Marine Affairs and Fisheries
http://www.bps.go.id
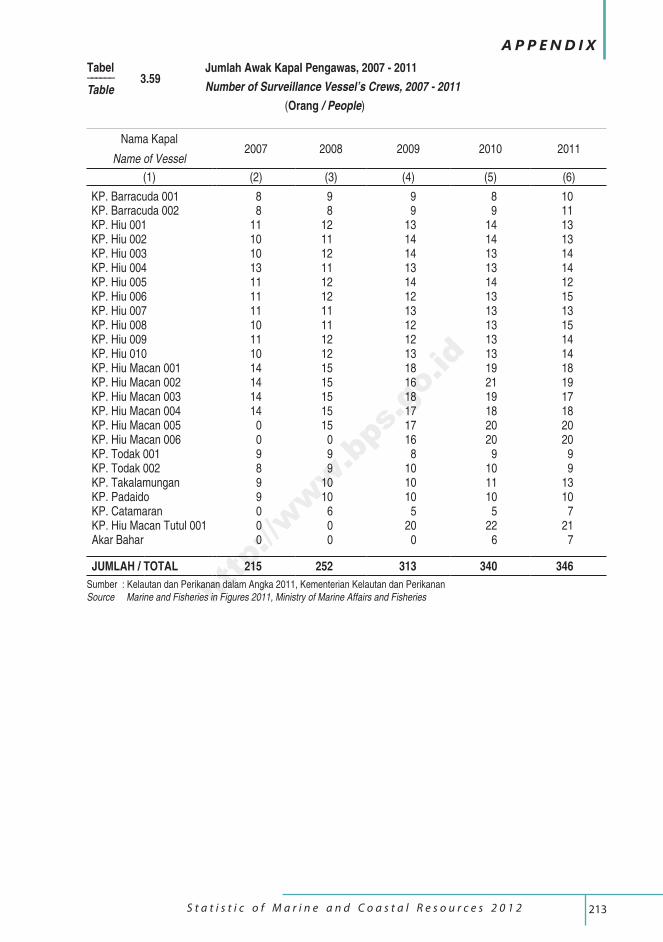
213 S t a t i s t i c o f M a r i n e a n d C o a s t a l R e s o u r c e s 2 0 1 2
A P P E N D I X
Nama Kapal 2007 2008 2009 2010 2011
Name of Vessel
(1) (2) (3) (4) (5) (6)
KP. Barracuda 001 8 9 9 8 10KP. Barracuda 002 8 8 9 9 11KP. Hiu 001 11 12 13 14 13KP. Hiu 002 10 11 14 14 13KP. Hiu 003 10 12 14 13 14KP. Hiu 004 13 11 13 13 14KP. Hiu 005 11 12 14 14 12KP. Hiu 006 11 12 12 13 15KP. Hiu 007 11 11 13 13 13KP. Hiu 008 10 11 12 13 15KP. Hiu 009 11 12 12 13 14KP. Hiu 010 10 12 13 13 14KP. Hiu Macan 001 14 15 18 19 18KP. Hiu Macan 002 14 15 16 21 19KP. Hiu Macan 003 14 15 18 19 17KP. Hiu Macan 004 14 15 17 18 18KP. Hiu Macan 005 0 15 17 20 20KP. Hiu Macan 006 0 0 16 20 20KP. Todak 001 9 9 8 9 9KP. Todak 002 8 9 10 10 9KP. Takalamungan 9 10 10 11 13KP. Padaido 9 10 10 10 10KP. Catamaran 0 6 5 5 7KP. Hiu Macan Tutul 001 0 0 20 22 21Akar Bahar 0 0 0 6 7
JUMLAH / TOTAL 215 252 313 340 346
Tabel –––––– 3.59Table
Jumlah Awak KapaI Pengawas, 2007 - 2011
Number of Surveillance Vessel’s Crews, 2007 - 2011
(Orang / People)
Sumber : Kelautan dan Perikanan dalam Angka 2011, Kementerian Kelautan dan PerikananSource Marine and Fisheries in Figures 2011, Ministry of Marine Affairs and Fisheriesh
ttp://www.bps.go.id
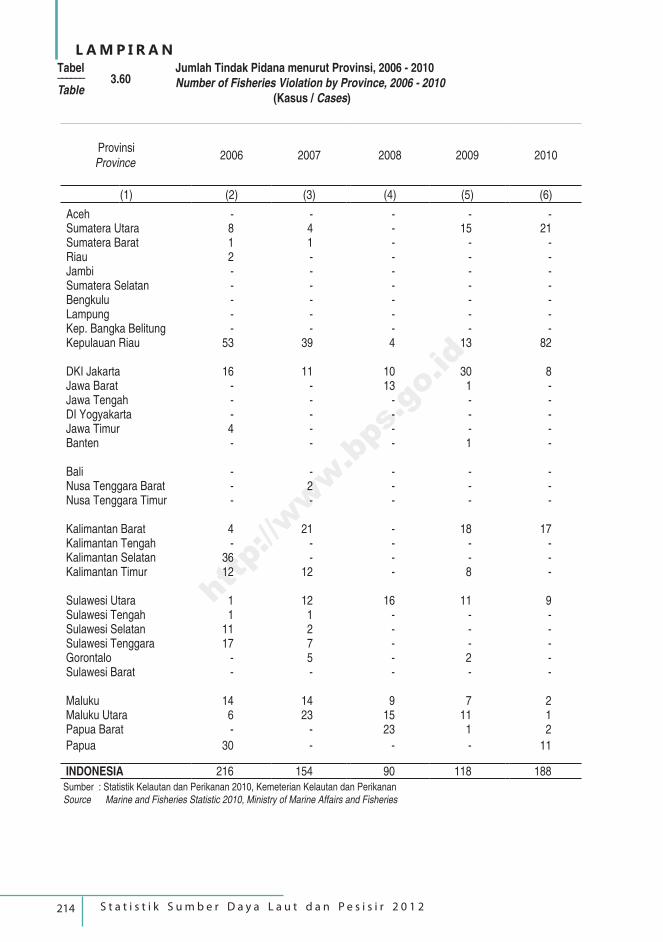
214 S t a t i s t i k S u m b e r D a y a L a u t d a n P e s i s i r 2 0 1 2
L A M P I R A N
Sumber : Statistik Kelautan dan Perikanan 2010, Kemeterian Kelautan dan PerikananSource Marine and Fisheries Statistic 2010, Ministry of Marine Affairs and Fisheries
Provinsi Province
2006 2007 2008 2009 2010
(1) (2) (3) (4) (5) (6)
Aceh - - - - - Sumatera Utara 8 4 - 15 21 Sumatera Barat 1 1 - - - Riau 2 - - - - Jambi - - - - - Sumatera Selatan - - - - - Bengkulu - - - - - Lampung - - - - - Kep. Bangka Belitung - - - - - Kepulauan Riau 53 39 4 13 82
DKI Jakarta 16 11 10 30 8 Jawa Barat - - 13 1 - Jawa Tengah - - - - - DI Yogyakarta - - - - - Jawa Timur 4 - - - - Banten - - - 1 -
Bali - - - - - Nusa Tenggara Barat - 2 - - - Nusa Tenggara Timur - - - - -
Kalimantan Barat 4 21 - 18 17 Kalimantan Tengah - - - - - Kalimantan Selatan 36 - - - - Kalimantan Timur 12 12 - 8 -
Sulawesi Utara 1 12 16 11 9Sulawesi Tengah 1 1 - - - Sulawesi Selatan 11 2 - - - Sulawesi Tenggara 17 7 - - - Gorontalo - 5 - 2 - Sulawesi Barat - - - - -
Maluku 14 14 9 7 2 Maluku Utara 6 23 15 11 1 Papua Barat - - 23 1 2
Papua 30 - - - 11
INDONESIA 216 154 90 118 188
Tabel –––––– 3.60Table
Jumlah Tindak Pidana menurut Provinsi, 2006 - 2010Number of Fisheries Violation by Province, 2006 - 2010 (Kasus / Cases)
http://www.bps.go.id
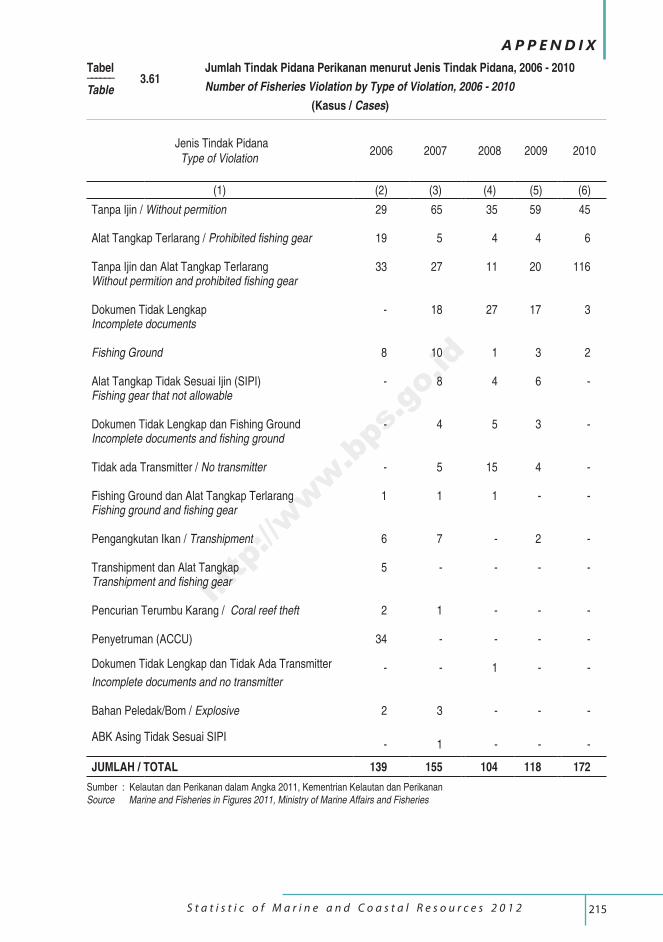
215 S t a t i s t i c o f M a r i n e a n d C o a s t a l R e s o u r c e s 2 0 1 2
A P P E N D I X
Sumber : Kelautan dan Perikanan dalam Angka 2011, Kementrian Kelautan dan PerikananSource Marine and Fisheries in Figures 2011, Ministry of Marine Affairs and Fisheries
Jenis Tindak Pidana Type of Violation
2006 2007 2008 2009 2010
(1) (2) (3) (4) (5) (6)
Tanpa Ijin / Without permition 29 65 35 59 45
Alat Tangkap Terlarang / Prohibited fishing gear 19 5 4 4 6
Tanpa Ijin dan Alat Tangkap Terlarang 33 27 11 20 116 Without permition and prohibited fishing gear
Dokumen Tidak Lengkap - 18 27 17 3 Incomplete documents
Fishing Ground 8 10 1 3 2
Alat Tangkap Tidak Sesuai Ijin (SIPI) - 8 4 6 - Fishing gear that not allowable
Dokumen Tidak Lengkap dan Fishing Ground - 4 5 3 - Incomplete documents and fishing ground
Tidak ada Transmitter / No transmitter - 5 15 4 -
Fishing Ground dan Alat Tangkap Terlarang 1 1 1 - - Fishing ground and fishing gear
Pengangkutan Ikan / Transhipment 6 7 - 2 -
Transhipment dan Alat Tangkap 5 - - - -Transhipment and fishing gear
Pencurian Terumbu Karang / Coral reef theft 2 1 - - -
Penyetruman (ACCU) 34 - - - -
Dokumen Tidak Lengkap dan Tidak Ada Transmitter - - 1 - -Incomplete documents and no transmitter
Bahan Peledak/Bom / Explosive 2 3 - - -
ABK Asing Tidak Sesuai SIPI - 1 - - -
JUMLAH / TOTAL 139 155 104 118 172
Tabel –––––– 3.61Table
Jumlah Tindak Pidana Perikanan menurut Jenis Tindak Pidana, 2006 - 2010
Number of Fisheries Violation by Type of Violation, 2006 - 2010
(Kasus / Cases)
http://www.bps.go.id
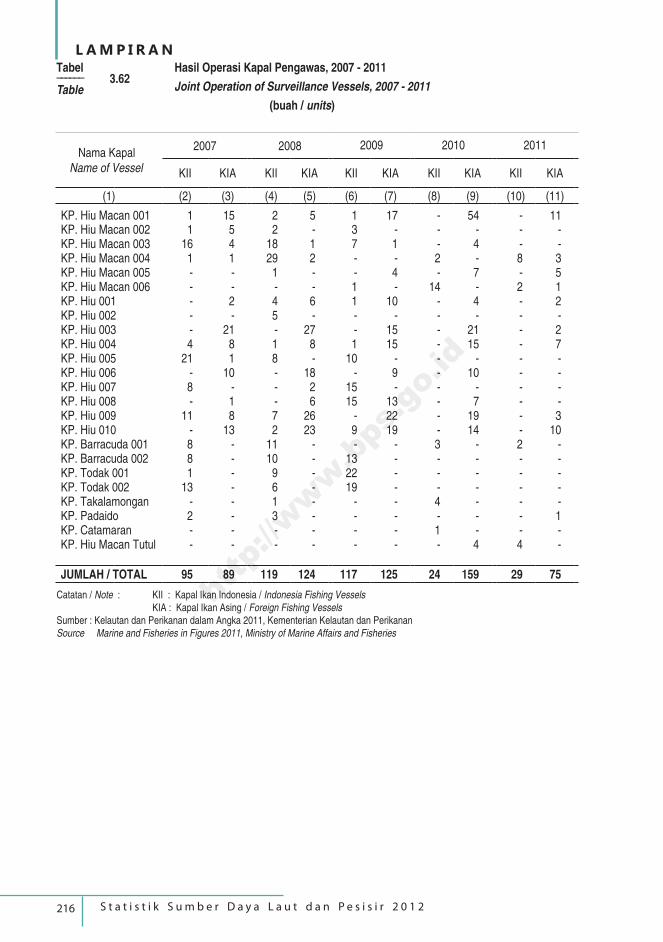
216 S t a t i s t i k S u m b e r D a y a L a u t d a n P e s i s i r 2 0 1 2
L A M P I R A N
Nama Kapal Name of Vessel
2007 2008 2009 2010 2011
KII KIA KII KIA KII KIA KII KIA KII KIA
(1) (2) (3) (4) (5) (6) (7) (8) (9) (10) (11)
KP. Hiu Macan 001 1 15 2 5 1 17 - 54 - 11KP. Hiu Macan 002 1 5 2 - 3 - - - - -KP. Hiu Macan 003 16 4 18 1 7 1 - 4 - -KP. Hiu Macan 004 1 1 29 2 - - 2 - 8 3KP. Hiu Macan 005 - - 1 - - 4 - 7 - 5KP. Hiu Macan 006 - - - - 1 - 14 - 2 1KP. Hiu 001 - 2 4 6 1 10 - 4 - 2KP. Hiu 002 - - 5 - - - - - - -KP. Hiu 003 - 21 - 27 - 15 - 21 - 2KP. Hiu 004 4 8 1 8 1 15 - 15 - 7KP. Hiu 005 21 1 8 - 10 - - - - -KP. Hiu 006 - 10 - 18 - 9 - 10 - -KP. Hiu 007 8 - - 2 15 - - - - -KP. Hiu 008 - 1 - 6 15 13 - 7 - -KP. Hiu 009 11 8 7 26 - 22 - 19 - 3KP. Hiu 010 - 13 2 23 9 19 - 14 - 10KP. Barracuda 001 8 - 11 - - - 3 - 2 -KP. Barracuda 002 8 - 10 - 13 - - - - -KP. Todak 001 1 - 9 - 22 - - - - -KP. Todak 002 13 - 6 - 19 - - - - -KP. Takalamongan - - 1 - - - 4 - - -KP. Padaido 2 - 3 - - - - - - 1KP. Catamaran - - - - - - 1 - - -KP. Hiu Macan Tutul - - - - - - - 4 4 -
JUMLAH / TOTAL 95 89 119 124 117 125 24 159 29 75
Tabel –––––– 3.62Table
Hasil Operasi Kapal Pengawas, 2007 - 2011
Joint Operation of Surveillance Vessels, 2007 - 2011
(buah / units)
Catatan / Note : KII : Kapal Ikan Indonesia / Indonesia Fishing Vessels KIA : Kapal Ikan Asing / Foreign Fishing VesselsSumber : Kelautan dan Perikanan dalam Angka 2011, Kementerian Kelautan dan PerikananSource Marine and Fisheries in Figures 2011, Ministry of Marine Affairs and Fisheries
http://www.bps.go.id
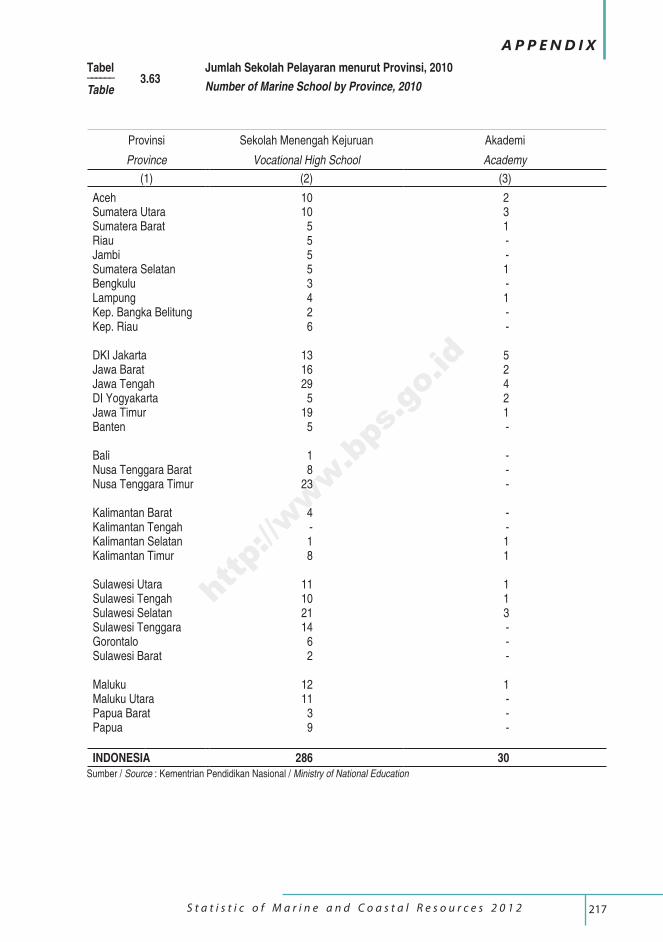
217 S t a t i s t i c o f M a r i n e a n d C o a s t a l R e s o u r c e s 2 0 1 2
A P P E N D I X
Provinsi Sekolah Menengah Kejuruan Akademi
Province Vocational High School Academy
(1) (2) (3)
Aceh 10 2Sumatera Utara 10 3Sumatera Barat 5 1Riau 5 -Jambi 5 -Sumatera Selatan 5 1Bengkulu 3 -Lampung 4 1Kep. Bangka Belitung 2 -Kep. Riau 6 -
DKI Jakarta 13 5Jawa Barat 16 2Jawa Tengah 29 4DI Yogyakarta 5 2Jawa Timur 19 1Banten 5 -
Bali 1 -Nusa Tenggara Barat 8 -Nusa Tenggara Timur 23 -
Kalimantan Barat 4 -Kalimantan Tengah - -Kalimantan Selatan 1 1Kalimantan Timur 8 1
Sulawesi Utara 11 1Sulawesi Tengah 10 1Sulawesi Selatan 21 3Sulawesi Tenggara 14 -Gorontalo 6 -Sulawesi Barat 2 -
Maluku 12 1Maluku Utara 11 -Papua Barat 3 -Papua 9 -
INDONESIA 286 30
Tabel –––––– 3.63Table
Jumlah Sekolah Pelayaran menurut Provinsi, 2010
Number of Marine School by Province, 2010
Sumber / Source : Kementrian Pendidikan Nasional / Ministry of National Education
http://www.bps.go.id
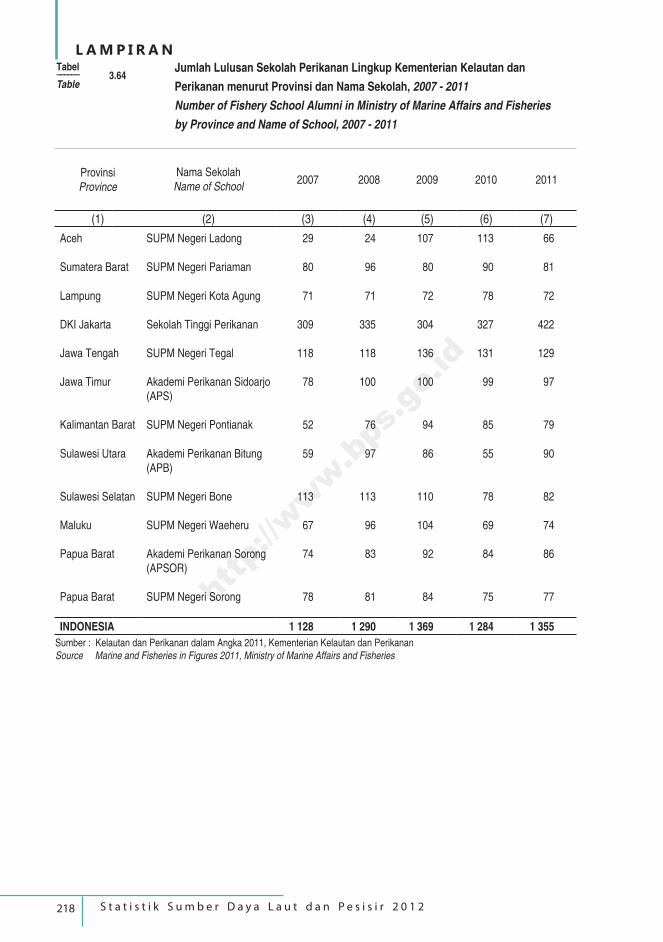
218 S t a t i s t i k S u m b e r D a y a L a u t d a n P e s i s i r 2 0 1 2
L A M P I R A N
Provinsi Province
Nama SekolahName of School
2007 2008 2009 2010 2011
(1) (2) (3) (4) (5) (6) (7)
Aceh SUPM Negeri Ladong 29 24 107 113 66
Sumatera Barat SUPM Negeri Pariaman 80 96 80 90 81
Lampung SUPM Negeri Kota Agung 71 71 72 78 72
DKI Jakarta Sekolah Tinggi Perikanan 309 335 304 327 422
Jawa Tengah SUPM Negeri Tegal 118 118 136 131 129
Jawa Timur Akademi Perikanan Sidoarjo 78 100 100 99 97(APS)
Kalimantan Barat SUPM Negeri Pontianak 52 76 94 85 79
Sulawesi Utara Akademi Perikanan Bitung 59 97 86 55 90(APB)
Sulawesi Selatan SUPM Negeri Bone 113 113 110 78 82
Maluku SUPM Negeri Waeheru 67 96 104 69 74
Papua Barat Akademi Perikanan Sorong 74 83 92 84 86(APSOR)
Papua Barat SUPM Negeri Sorong 78 81 84 75 77
INDONESIA 1 128 1 290 1 369 1 284 1 355
Tabel –––––– 3.64Table
Jumlah Lulusan Sekolah Perikanan Lingkup Kementerian Kelautan dan
Perikanan menurut Provinsi dan Nama Sekolah, 2007 - 2011
Number of Fishery School Alumni in Ministry of Marine Affairs and Fisheries
by Province and Name of School, 2007 - 2011
Sumber : Kelautan dan Perikanan dalam Angka 2011, Kementerian Kelautan dan PerikananSource Marine and Fisheries in Figures 2011, Ministry of Marine Affairs and Fisheries
http://www.bps.go.id
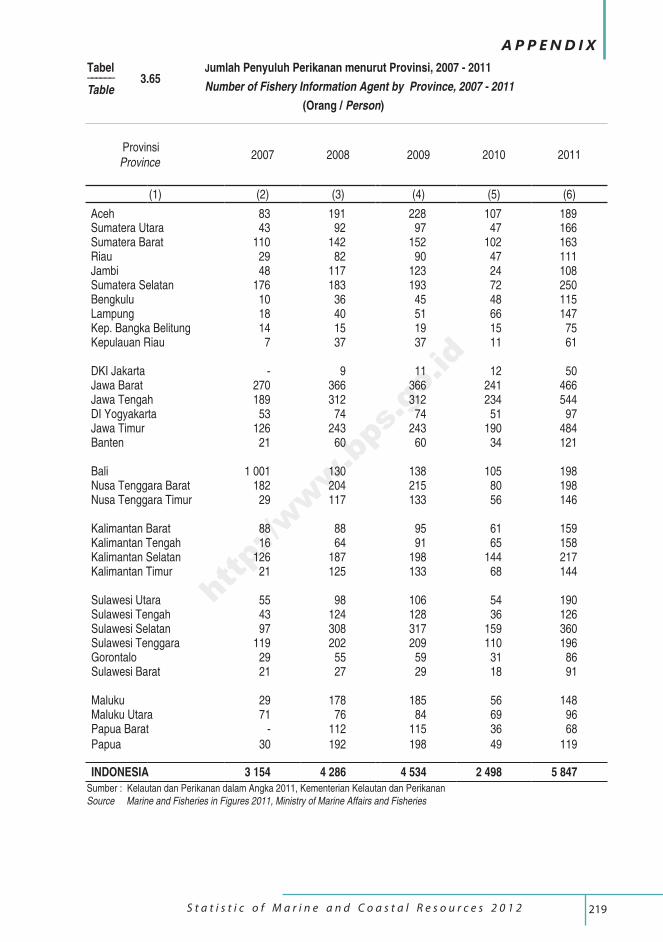
219 S t a t i s t i c o f M a r i n e a n d C o a s t a l R e s o u r c e s 2 0 1 2
A P P E N D I X
Provinsi Province
2007 2008 2009 2010 2011
(1) (2) (3) (4) (5) (6)
Aceh 83 191 228 107 189Sumatera Utara 43 92 97 47 166Sumatera Barat 110 142 152 102 163Riau 29 82 90 47 111Jambi 48 117 123 24 108Sumatera Selatan 176 183 193 72 250Bengkulu 10 36 45 48 115Lampung 18 40 51 66 147Kep. Bangka Belitung 14 15 19 15 75Kepulauan Riau 7 37 37 11 61
DKI Jakarta - 9 11 12 50Jawa Barat 270 366 366 241 466Jawa Tengah 189 312 312 234 544DI Yogyakarta 53 74 74 51 97Jawa Timur 126 243 243 190 484Banten 21 60 60 34 121
Bali 1 001 130 138 105 198Nusa Tenggara Barat 182 204 215 80 198Nusa Tenggara Timur 29 117 133 56 146
Kalimantan Barat 88 88 95 61 159Kalimantan Tengah 16 64 91 65 158Kalimantan Selatan 126 187 198 144 217Kalimantan Timur 21 125 133 68 144
Sulawesi Utara 55 98 106 54 190Sulawesi Tengah 43 124 128 36 126Sulawesi Selatan 97 308 317 159 360Sulawesi Tenggara 119 202 209 110 196Gorontalo 29 55 59 31 86Sulawesi Barat 21 27 29 18 91
Maluku 29 178 185 56 148Maluku Utara 71 76 84 69 96Papua Barat - 112 115 36 68Papua 30 192 198 49 119
INDONESIA 3 154 4 286 4 534 2 498 5 847
Tabel –––––– 3.65Table
Jumlah Penyuluh Perikanan menurut Provinsi, 2007 - 2011
Number of Fishery Information Agent by Province, 2007 - 2011 (Orang / Person)
Sumber : Kelautan dan Perikanan dalam Angka 2011, Kementerian Kelautan dan PerikananSource Marine and Fisheries in Figures 2011, Ministry of Marine Affairs and Fisheries
http://www.bps.go.id
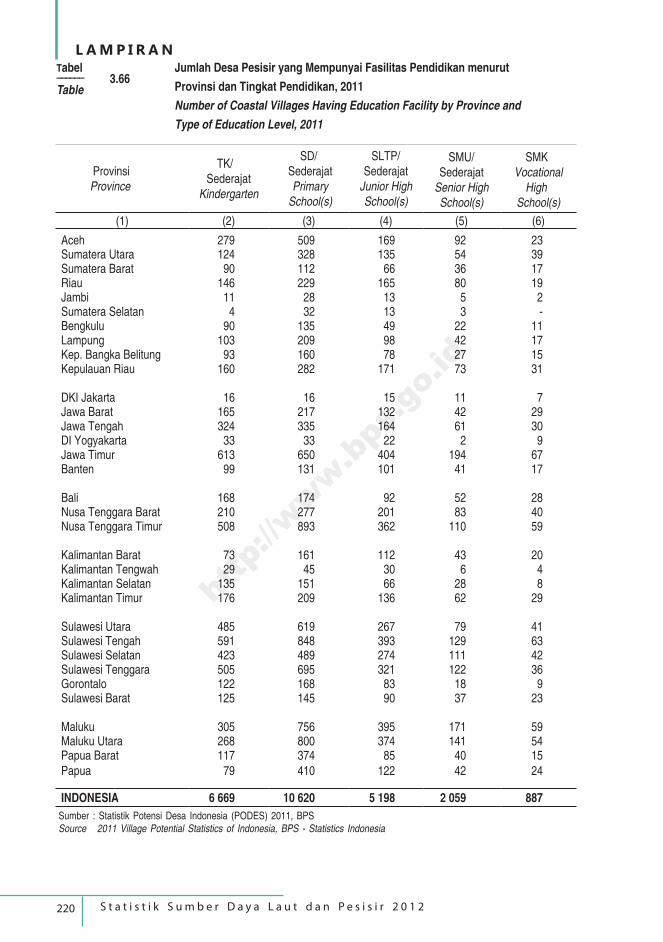
220 S t a t i s t i k S u m b e r D a y a L a u t d a n P e s i s i r 2 0 1 2
L A M P I R A N
Provinsi Province
TK/ Sederajat
Kindergarten
SD/ Sederajat Primary
School(s)
SLTP/ Sederajat
Junior HighSchool(s)
SMU/ Sederajat
Senior HighSchool(s)
SMK Vocational
High School(s)
(1) (2) (3) (4) (5) (6)
Aceh 279 509 169 92 23Sumatera Utara 124 328 135 54 39Sumatera Barat 90 112 66 36 17Riau 146 229 165 80 19Jambi 11 28 13 5 2Sumatera Selatan 4 32 13 3 -Bengkulu 90 135 49 22 11Lampung 103 209 98 42 17Kep. Bangka Belitung 93 160 78 27 15Kepulauan Riau 160 282 171 73 31
DKI Jakarta 16 16 15 11 7Jawa Barat 165 217 132 42 29Jawa Tengah 324 335 164 61 30DI Yogyakarta 33 33 22 2 9Jawa Timur 613 650 404 194 67Banten 99 131 101 41 17
Bali 168 174 92 52 28Nusa Tenggara Barat 210 277 201 83 40Nusa Tenggara Timur 508 893 362 110 59
Kalimantan Barat 73 161 112 43 20Kalimantan Tengwah 29 45 30 6 4Kalimantan Selatan 135 151 66 28 8Kalimantan Timur 176 209 136 62 29
Sulawesi Utara 485 619 267 79 41Sulawesi Tengah 591 848 393 129 63Sulawesi Selatan 423 489 274 111 42Sulawesi Tenggara 505 695 321 122 36Gorontalo 122 168 83 18 9Sulawesi Barat 125 145 90 37 23
Maluku 305 756 395 171 59Maluku Utara 268 800 374 141 54Papua Barat 117 374 85 40 15Papua 79 410 122 42 24
INDONESIA 6 669 10 620 5 198 2 059 887
Tabel –––––– 3.66Table
Jumlah Desa Pesisir yang Mempunyai Fasilitas Pendidikan menurut
Provinsi dan Tingkat Pendidikan, 2011
Number of Coastal Villages Having Education Facility by Province and
Type of Education Level, 2011
Sumber : Statistik Potensi Desa Indonesia (PODES) 2011, BPSSource 2011 Village Potential Statistics of Indonesia, BPS - Statistics Indonesia
http://www.bps.go.id
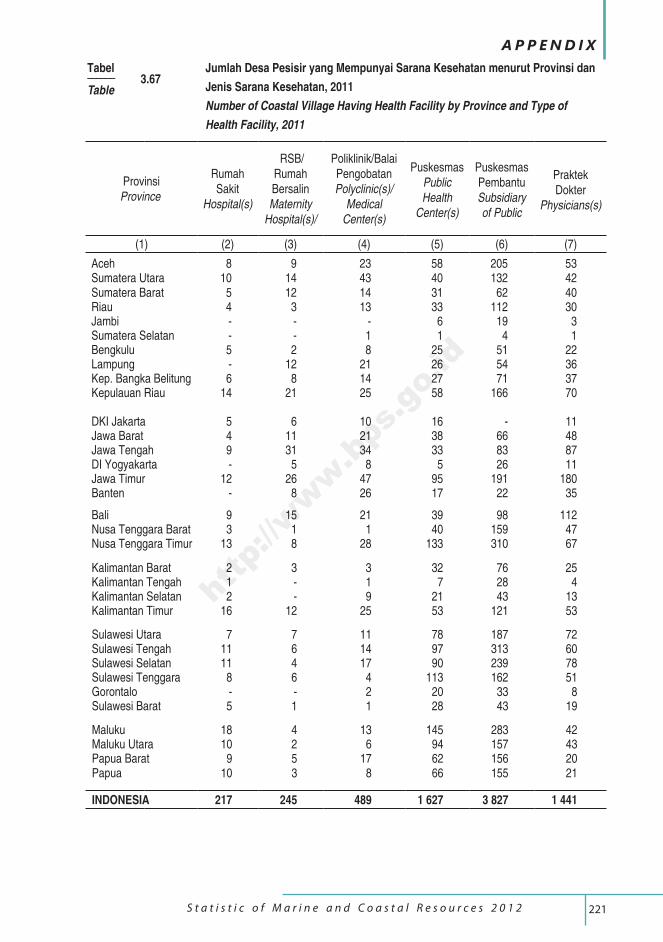
221 S t a t i s t i c o f M a r i n e a n d C o a s t a l R e s o u r c e s 2 0 1 2
A P P E N D I X
Provinsi Province
Rumah Sakit
Hospital(s)
RSB/ Rumah Bersalin Maternity
Hospital(s)/
Poliklinik/Balai Pengobatan Polyclinic(s)/
Medical Center(s)
Puskesmas Public Health
Center(s)
Puskesmas Pembantu Subsidiary of Public
Praktek Dokter
Physicians(s)
(1) (2) (3) (4) (5) (6) (7)
Aceh 8 9 23 58 205 53 Sumatera Utara 10 14 43 40 132 42 Sumatera Barat 5 12 14 31 62 40 Riau 4 3 13 33 112 30 Jambi - - - 6 19 3 Sumatera Selatan - - 1 1 4 1 Bengkulu 5 2 8 25 51 22 Lampung - 12 21 26 54 36 Kep. Bangka Belitung 6 8 14 27 71 37 Kepulauan Riau 14 21 25 58 166 70
DKI Jakarta 5 6 10 16 - 11 Jawa Barat 4 11 21 38 66 48 Jawa Tengah 9 31 34 33 83 87 DI Yogyakarta - 5 8 5 26 11 Jawa Timur 12 26 47 95 191 180 Banten - 8 26 17 22 35
Bali 9 15 21 39 98 112 Nusa Tenggara Barat 3 1 1 40 159 47 Nusa Tenggara Timur 13 8 28 133 310 67
Kalimantan Barat 2 3 3 32 76 25Kalimantan Tengah 1 - 1 7 28 4 Kalimantan Selatan 2 - 9 21 43 13 Kalimantan Timur 16 12 25 53 121 53
Sulawesi Utara 7 7 11 78 187 72 Sulawesi Tengah 11 6 14 97 313 60 Sulawesi Selatan 11 4 17 90 239 78 Sulawesi Tenggara 8 6 4 113 162 51 Gorontalo - - 2 20 33 8 Sulawesi Barat 5 1 1 28 43 19
Maluku 18 4 13 145 283 42 Maluku Utara 10 2 6 94 157 43 Papua Barat 9 5 17 62 156 20 Papua 10 3 8 66 155 21
INDONESIA 217 245 489 1 627 3 827 1 441
Tabel –––––– 3.67Table
Jumlah Desa Pesisir yang Mempunyai Sarana Kesehatan menurut Provinsi dan
Jenis Sarana Kesehatan, 2011
Number of Coastal Village Having Health Facility by Province and Type of
Health Facility, 2011
http://www.bps.go.id
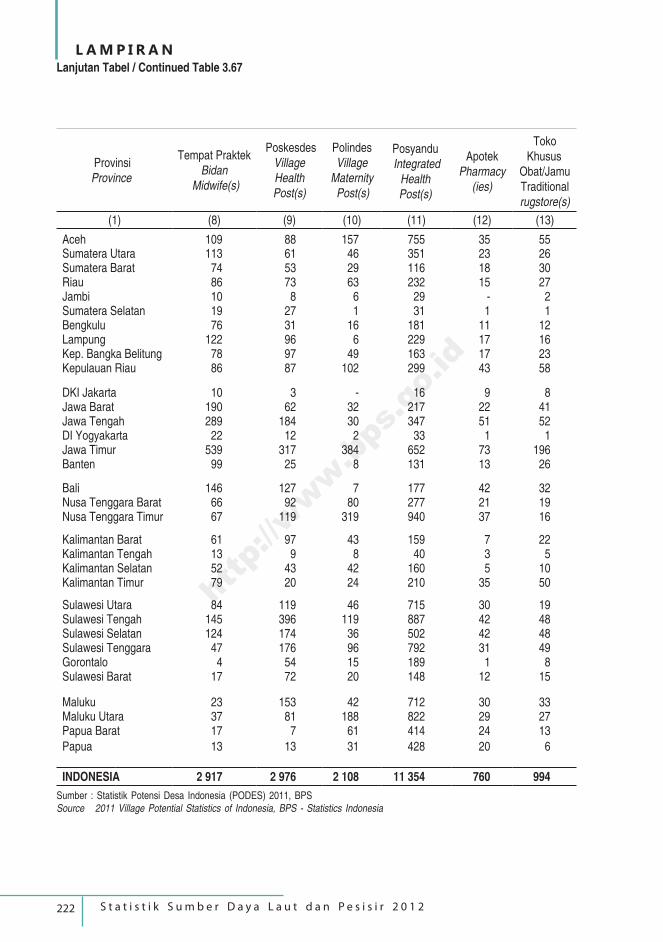
222 S t a t i s t i k S u m b e r D a y a L a u t d a n P e s i s i r 2 0 1 2
L A M P I R A N
Provinsi Province
Tempat Praktek Bidan
Midwife(s)
PoskesdesVillageHealth Post(s)
Polindes Village Maternity
Post(s)
Posyandu Integrated
Health Post(s)
ApotekPharmacy
(ies)
Toko Khusus Obat/JamuTraditional rugstore(s)
(1) (8) (9) (10) (11) (12) (13)
Aceh 109 88 157 755 35 55 Sumatera Utara 113 61 46 351 23 26 Sumatera Barat 74 53 29 116 18 30 Riau 86 73 63 232 15 27 Jambi 10 8 6 29 - 2 Sumatera Selatan 19 27 1 31 1 1 Bengkulu 76 31 16 181 11 12 Lampung 122 96 6 229 17 16 Kep. Bangka Belitung 78 97 49 163 17 23 Kepulauan Riau 86 87 102 299 43 58
DKI Jakarta 10 3 - 16 9 8 Jawa Barat 190 62 32 217 22 41 Jawa Tengah 289 184 30 347 51 52 DI Yogyakarta 22 12 2 33 1 1 Jawa Timur 539 317 384 652 73 196 Banten 99 25 8 131 13 26
Bali 146 127 7 177 42 32 Nusa Tenggara Barat 66 92 80 277 21 19 Nusa Tenggara Timur 67 119 319 940 37 16
Kalimantan Barat 61 97 43 159 7 22 Kalimantan Tengah 13 9 8 40 3 5 Kalimantan Selatan 52 43 42 160 5 10 Kalimantan Timur 79 20 24 210 35 50
Sulawesi Utara 84 119 46 715 30 19 Sulawesi Tengah 145 396 119 887 42 48 Sulawesi Selatan 124 174 36 502 42 48 Sulawesi Tenggara 47 176 96 792 31 49 Gorontalo 4 54 15 189 1 8 Sulawesi Barat 17 72 20 148 12 15
Maluku 23 153 42 712 30 33 Maluku Utara 37 81 188 822 29 27 Papua Barat 17 7 61 414 24 13 Papua 13 13 31 428 20 6
INDONESIA 2 917 2 976 2 108 11 354 760 994
Lanjutan Tabel / Continued Table 3.67
Sumber : Statistik Potensi Desa Indonesia (PODES) 2011, BPSSource 2011 Village Potential Statistics of Indonesia, BPS - Statistics Indonesia
http://www.bps.go.id
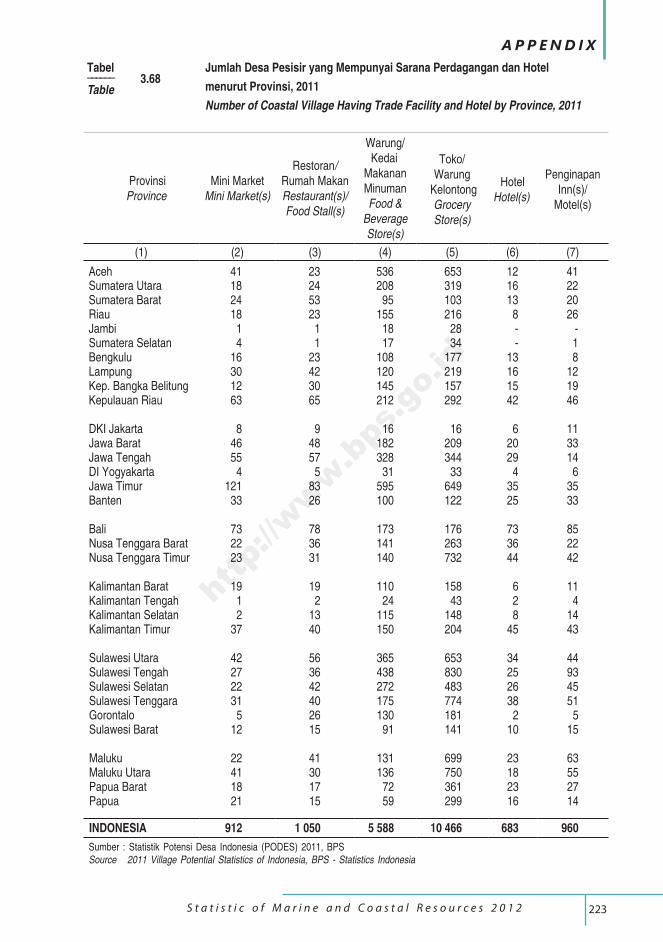
223 S t a t i s t i c o f M a r i n e a n d C o a s t a l R e s o u r c e s 2 0 1 2
A P P E N D I X
Provinsi Province
Mini MarketMini Market(s)
Restoran/Rumah MakanRestaurant(s)/Food Stall(s)
Warung/ Kedai Makanan MinumanFood &
BeverageStore(s)
Toko/Warung
KelontongGrocery Store(s)
Hotel Hotel(s)
PenginapanInn(s)/
Motel(s)
(1) (2) (3) (4) (5) (6) (7)
Aceh 41 23 536 653 12 41Sumatera Utara 18 24 208 319 16 22Sumatera Barat 24 53 95 103 13 20Riau 18 23 155 216 8 26Jambi 1 1 18 28 - -Sumatera Selatan 4 1 17 34 - 1Bengkulu 16 23 108 177 13 8Lampung 30 42 120 219 16 12Kep. Bangka Belitung 12 30 145 157 15 19Kepulauan Riau 63 65 212 292 42 46
DKI Jakarta 8 9 16 16 6 11Jawa Barat 46 48 182 209 20 33Jawa Tengah 55 57 328 344 29 14DI Yogyakarta 4 5 31 33 4 6Jawa Timur 121 83 595 649 35 35Banten 33 26 100 122 25 33
Bali 73 78 173 176 73 85Nusa Tenggara Barat 22 36 141 263 36 22Nusa Tenggara Timur 23 31 140 732 44 42
Kalimantan Barat 19 19 110 158 6 11Kalimantan Tengah 1 2 24 43 2 4Kalimantan Selatan 2 13 115 148 8 14Kalimantan Timur 37 40 150 204 45 43
Sulawesi Utara 42 56 365 653 34 44Sulawesi Tengah 27 36 438 830 25 93Sulawesi Selatan 22 42 272 483 26 45Sulawesi Tenggara 31 40 175 774 38 51Gorontalo 5 26 130 181 2 5Sulawesi Barat 12 15 91 141 10 15
Maluku 22 41 131 699 23 63Maluku Utara 41 30 136 750 18 55Papua Barat 18 17 72 361 23 27Papua 21 15 59 299 16 14
INDONESIA 912 1 050 5 588 10 466 683 960
Tabel –––––– 3.68Table
Jumlah Desa Pesisir yang Mempunyai Sarana Perdagangan dan Hotel
menurut Provinsi, 2011
Number of Coastal Village Having Trade Facility and Hotel by Province, 2011
Sumber : Statistik Potensi Desa Indonesia (PODES) 2011, BPSSource 2011 Village Potential Statistics of Indonesia, BPS - Statistics Indonesia
http://www.bps.go.id
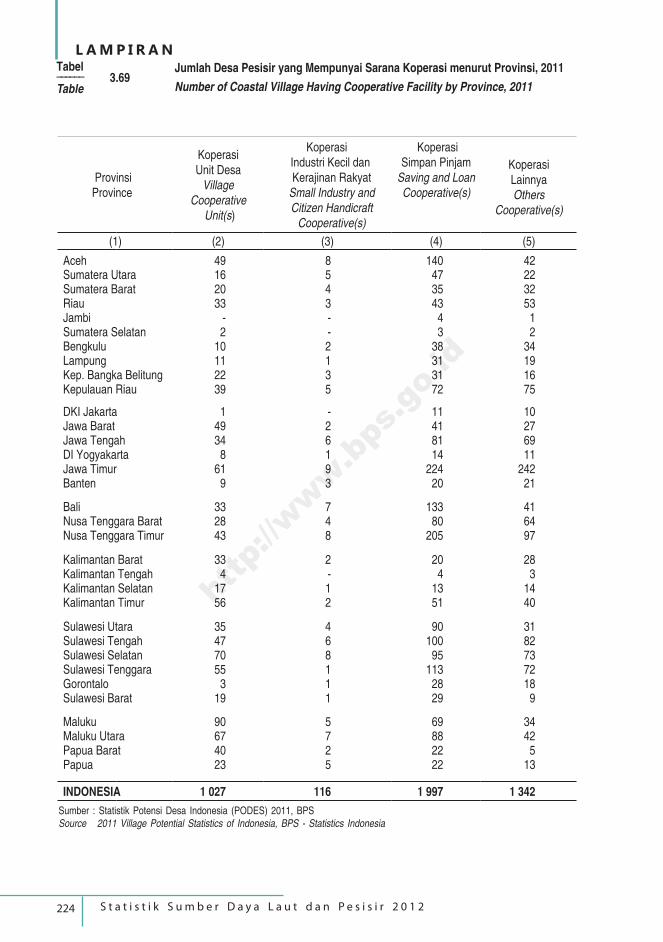
224 S t a t i s t i k S u m b e r D a y a L a u t d a n P e s i s i r 2 0 1 2
L A M P I R A N
Provinsi Province
KoperasiUnit Desa
Village Cooperative
Unit(s)
Koperasi Industri Kecil dan Kerajinan Rakyat
Small Industry and Citizen Handicraft
Cooperative(s)
Koperasi Simpan Pinjam
Saving and Loan Cooperative(s)
Koperasi LainnyaOthers
Cooperative(s)
(1) (2) (3) (4) (5)
Aceh 49 8 140 42Sumatera Utara 16 5 47 22Sumatera Barat 20 4 35 32Riau 33 3 43 53Jambi - - 4 1Sumatera Selatan 2 - 3 2Bengkulu 10 2 38 34Lampung 11 1 31 19Kep. Bangka Belitung 22 3 31 16Kepulauan Riau 39 5 72 75
DKI Jakarta 1 - 11 10Jawa Barat 49 2 41 27Jawa Tengah 34 6 81 69DI Yogyakarta 8 1 14 11Jawa Timur 61 9 224 242Banten 9 3 20 21
Bali 33 7 133 41Nusa Tenggara Barat 28 4 80 64Nusa Tenggara Timur 43 8 205 97
Kalimantan Barat 33 2 20 28Kalimantan Tengah 4 - 4 3Kalimantan Selatan 17 1 13 14Kalimantan Timur 56 2 51 40
Sulawesi Utara 35 4 90 31Sulawesi Tengah 47 6 100 82Sulawesi Selatan 70 8 95 73Sulawesi Tenggara 55 1 113 72Gorontalo 3 1 28 18Sulawesi Barat 19 1 29 9
Maluku 90 5 69 34Maluku Utara 67 7 88 42Papua Barat 40 2 22 5Papua 23 5 22 13
INDONESIA 1 027 116 1 997 1 342
Tabel –––––– 3.69Table
Jumlah Desa Pesisir yang Mempunyai Sarana Koperasi menurut Provinsi, 2011
Number of Coastal Village Having Cooperative Facility by Province, 2011
Sumber : Statistik Potensi Desa Indonesia (PODES) 2011, BPSSource 2011 Village Potential Statistics of Indonesia, BPS - Statistics Indonesia
http://www.bps.go.id
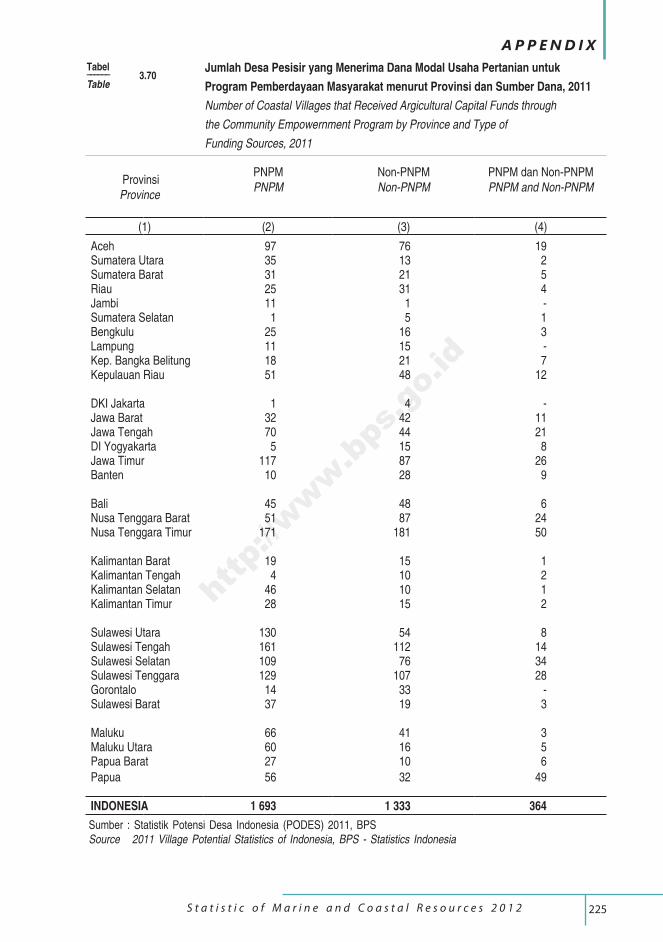
225 S t a t i s t i c o f M a r i n e a n d C o a s t a l R e s o u r c e s 2 0 1 2
A P P E N D I X
Tabel –––––– 3.70Table
Jumlah Desa Pesisir yang Menerima Dana Modal Usaha Pertanian untuk
Program Pemberdayaan Masyarakat menurut Provinsi dan Sumber Dana, 2011
Number of Coastal Villages that Received Argicultural Capital Funds through
the Community Empowernment Program by Province and Type of
Funding Sources, 2011
Provinsi Province
PNPMPNPM
Non-PNPMNon-PNPM
PNPM dan Non-PNPMPNPM and Non-PNPM
(1) (2) (3) (4)
Aceh 97 76 19Sumatera Utara 35 13 2Sumatera Barat 31 21 5Riau 25 31 4Jambi 11 1 -Sumatera Selatan 1 5 1Bengkulu 25 16 3Lampung 11 15 -Kep. Bangka Belitung 18 21 7Kepulauan Riau 51 48 12
DKI Jakarta 1 4 -Jawa Barat 32 42 11Jawa Tengah 70 44 21DI Yogyakarta 5 15 8Jawa Timur 117 87 26Banten 10 28 9
Bali 45 48 6Nusa Tenggara Barat 51 87 24Nusa Tenggara Timur 171 181 50
Kalimantan Barat 19 15 1Kalimantan Tengah 4 10 2Kalimantan Selatan 46 10 1Kalimantan Timur 28 15 2
Sulawesi Utara 130 54 8Sulawesi Tengah 161 112 14Sulawesi Selatan 109 76 34Sulawesi Tenggara 129 107 28Gorontalo 14 33 -Sulawesi Barat 37 19 3
Maluku 66 41 3Maluku Utara 60 16 5Papua Barat 27 10 6
Papua 56 32 49
INDONESIA 1 693 1 333 364
Sumber : Statistik Potensi Desa Indonesia (PODES) 2011, BPSSource 2011 Village Potential Statistics of Indonesia, BPS - Statistics Indonesia
http://www.bps.go.id
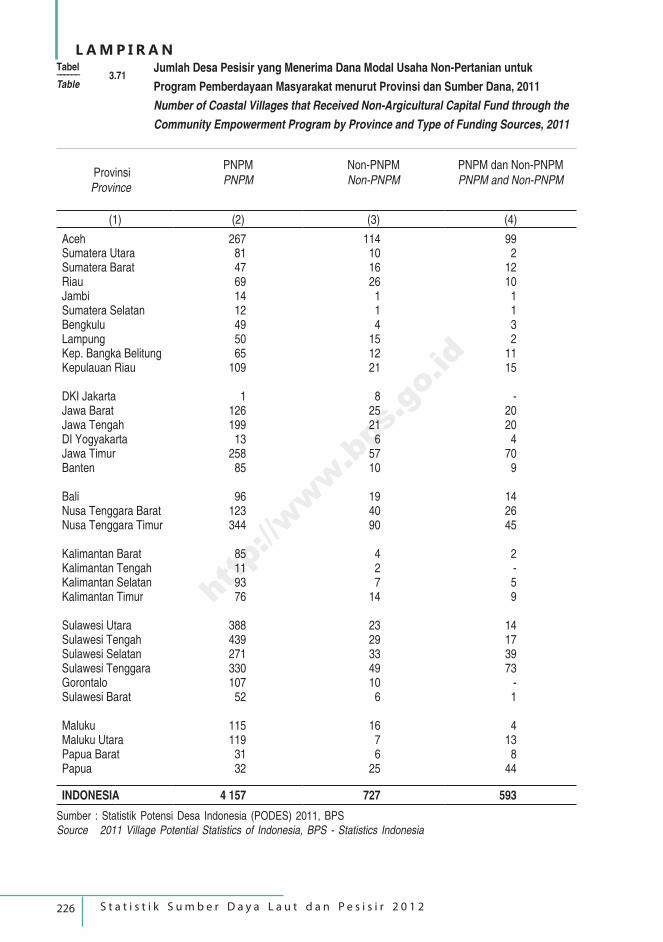
226 S t a t i s t i k S u m b e r D a y a L a u t d a n P e s i s i r 2 0 1 2
L A M P I R A N
Provinsi Province
PNPMPNPM
Non-PNPMNon-PNPM
PNPM dan Non-PNPMPNPM and Non-PNPM
(1) (2) (3) (4)
Aceh 267 114 99Sumatera Utara 81 10 2Sumatera Barat 47 16 12Riau 69 26 10Jambi 14 1 1Sumatera Selatan 12 1 1Bengkulu 49 4 3Lampung 50 15 2Kep. Bangka Belitung 65 12 11Kepulauan Riau 109 21 15
DKI Jakarta 1 8 -Jawa Barat 126 25 20Jawa Tengah 199 21 20DI Yogyakarta 13 6 4Jawa Timur 258 57 70Banten 85 10 9
Bali 96 19 14Nusa Tenggara Barat 123 40 26Nusa Tenggara Timur 344 90 45
Kalimantan Barat 85 4 2Kalimantan Tengah 11 2 -Kalimantan Selatan 93 7 5Kalimantan Timur 76 14 9
Sulawesi Utara 388 23 14Sulawesi Tengah 439 29 17Sulawesi Selatan 271 33 39Sulawesi Tenggara 330 49 73Gorontalo 107 10 -Sulawesi Barat 52 6 1
Maluku 115 16 4Maluku Utara 119 7 13Papua Barat 31 6 8Papua 32 25 44
INDONESIA 4 157 727 593
Tabel –––––– 3.71Table
Jumlah Desa Pesisir yang Menerima Dana Modal Usaha Non-Pertanian untuk
Program Pemberdayaan Masyarakat menurut Provinsi dan Sumber Dana, 2011
Number of Coastal Villages that Received Non-Argicultural Capital Fund through the
Community Empowerment Program by Province and Type of Funding Sources, 2011
Sumber : Statistik Potensi Desa Indonesia (PODES) 2011, BPSSource 2011 Village Potential Statistics of Indonesia, BPS - Statistics Indonesia
http://www.bps.go.id
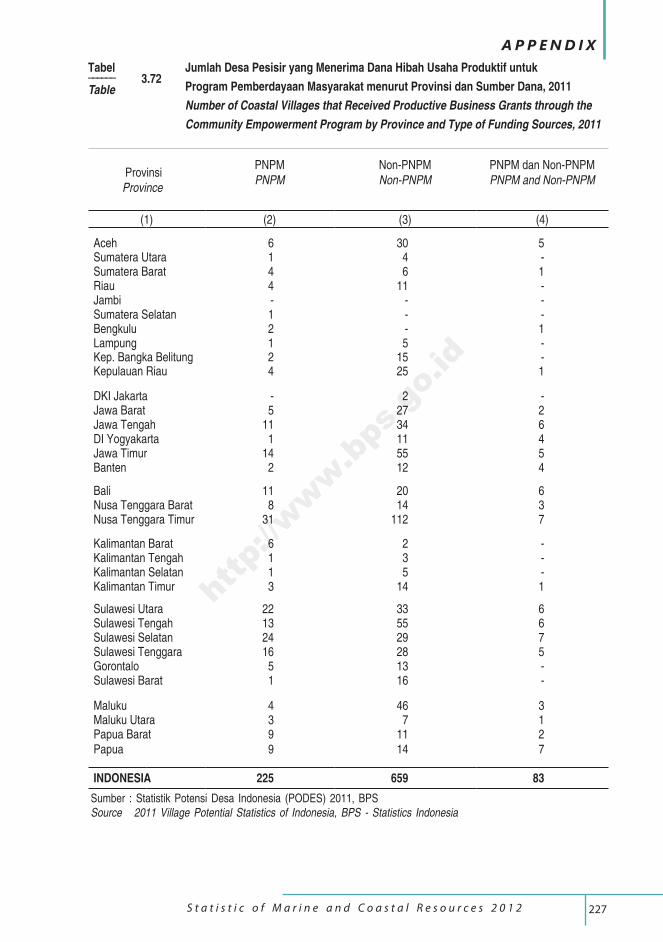
227 S t a t i s t i c o f M a r i n e a n d C o a s t a l R e s o u r c e s 2 0 1 2
A P P E N D I X
Provinsi Province
PNPMPNPM
Non-PNPMNon-PNPM
PNPM dan Non-PNPMPNPM and Non-PNPM
(1) (2) (3) (4)
Aceh 6 30 5Sumatera Utara 1 4 -Sumatera Barat 4 6 1Riau 4 11 -Jambi - - -Sumatera Selatan 1 - -Bengkulu 2 - 1Lampung 1 5 -Kep. Bangka Belitung 2 15 -Kepulauan Riau 4 25 1
DKI Jakarta - 2 -Jawa Barat 5 27 2Jawa Tengah 11 34 6DI Yogyakarta 1 11 4Jawa Timur 14 55 5Banten 2 12 4
Bali 11 20 6Nusa Tenggara Barat 8 14 3Nusa Tenggara Timur 31 112 7
Kalimantan Barat 6 2 -Kalimantan Tengah 1 3 -Kalimantan Selatan 1 5 -Kalimantan Timur 3 14 1
Sulawesi Utara 22 33 6Sulawesi Tengah 13 55 6Sulawesi Selatan 24 29 7Sulawesi Tenggara 16 28 5Gorontalo 5 13 -Sulawesi Barat 1 16 -
Maluku 4 46 3Maluku Utara 3 7 1Papua Barat 9 11 2Papua 9 14 7
INDONESIA 225 659 83
Tabel –––––– 3.72Table
Jumlah Desa Pesisir yang Menerima Dana Hibah Usaha Produktif untuk
Program Pemberdayaan Masyarakat menurut Provinsi dan Sumber Dana, 2011
Number of Coastal Villages that Received Productive Business Grants through the
Community Empowerment Program by Province and Type of Funding Sources, 2011
Sumber : Statistik Potensi Desa Indonesia (PODES) 2011, BPSSource 2011 Village Potential Statistics of Indonesia, BPS - Statistics Indonesia
http://www.bps.go.id
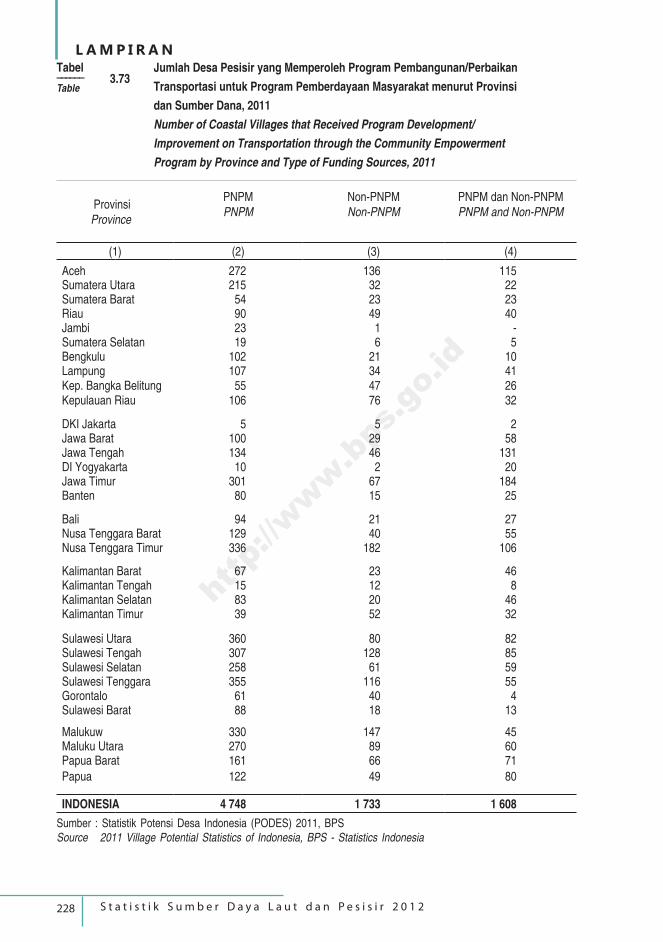
228 S t a t i s t i k S u m b e r D a y a L a u t d a n P e s i s i r 2 0 1 2
L A M P I R A N
Provinsi Province
PNPMPNPM
Non-PNPMNon-PNPM
PNPM dan Non-PNPMPNPM and Non-PNPM
(1) (2) (3) (4)
Aceh 272 136 115Sumatera Utara 215 32 22Sumatera Barat 54 23 23Riau 90 49 40Jambi 23 1 -Sumatera Selatan 19 6 5Bengkulu 102 21 10Lampung 107 34 41Kep. Bangka Belitung 55 47 26Kepulauan Riau 106 76 32
DKI Jakarta 5 5 2Jawa Barat 100 29 58Jawa Tengah 134 46 131DI Yogyakarta 10 2 20Jawa Timur 301 67 184Banten 80 15 25
Bali 94 21 27Nusa Tenggara Barat 129 40 55Nusa Tenggara Timur 336 182 106
Kalimantan Barat 67 23 46Kalimantan Tengah 15 12 8Kalimantan Selatan 83 20 46Kalimantan Timur 39 52 32
Sulawesi Utara 360 80 82Sulawesi Tengah 307 128 85Sulawesi Selatan 258 61 59Sulawesi Tenggara 355 116 55Gorontalo 61 40 4Sulawesi Barat 88 18 13
Malukuw 330 147 45Maluku Utara 270 89 60Papua Barat 161 66 71
Papua 122 49 80
INDONESIA 4 748 1 733 1 608
Tabel –––––– 3.73Table
Jumlah Desa Pesisir yang Memperoleh Program Pembangunan/Perbaikan
Transportasi untuk Program Pemberdayaan Masyarakat menurut Provinsi
dan Sumber Dana, 2011
Number of Coastal Villages that Received Program Development/
Improvement on Transportation through the Community Empowerment Program by Province and Type of Funding Sources, 2011
Sumber : Statistik Potensi Desa Indonesia (PODES) 2011, BPSSource 2011 Village Potential Statistics of Indonesia, BPS - Statistics Indonesia
http://www.bps.go.id
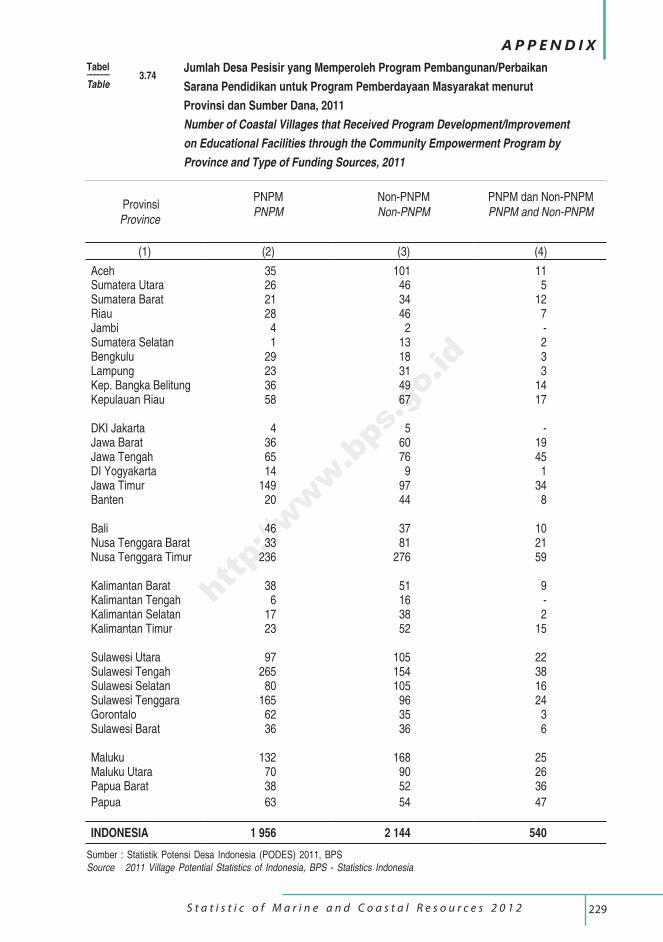
229 S t a t i s t i c o f M a r i n e a n d C o a s t a l R e s o u r c e s 2 0 1 2
A P P E N D I X
Provinsi Province
PNPMPNPM
Non-PNPMNon-PNPM
PNPM dan Non-PNPMPNPM and Non-PNPM
(1) (2) (3) (4)
Aceh 35 101 11Sumatera Utara 26 46 5Sumatera Barat 21 34 12Riau 28 46 7Jambi 4 2 -Sumatera Selatan 1 13 2Bengkulu 29 18 3Lampung 23 31 3Kep. Bangka Belitung 36 49 14Kepulauan Riau 58 67 17
DKI Jakarta 4 5 -Jawa Barat 36 60 19Jawa Tengah 65 76 45DI Yogyakarta 14 9 1Jawa Timur 149 97 34Banten 20 44 8
Bali 46 37 10Nusa Tenggara Barat 33 81 21Nusa Tenggara Timur 236 276 59
Kalimantan Barat 38 51 9Kalimantan Tengah 6 16 -Kalimantan Selatan 17 38 2Kalimantan Timur 23 52 15
Sulawesi Utara 97 105 22Sulawesi Tengah 265 154 38Sulawesi Selatan 80 105 16Sulawesi Tenggara 165 96 24Gorontalo 62 35 3Sulawesi Barat 36 36 6
Maluku 132 168 25Maluku Utara 70 90 26Papua Barat 38 52 36
Papua 63 54 47
INDONESIA 1 956 2 144 540
Tabel –––––– 3.74Table
Jumlah Desa Pesisir yang Memperoleh Program Pembangunan/Perbaikan
Sarana Pendidikan untuk Program Pemberdayaan Masyarakat menurut
Provinsi dan Sumber Dana, 2011
Number of Coastal Villages that Received Program Development/Improvement on Educational Facilities through the Community Empowerment Program by
Province and Type of Funding Sources, 2011
Sumber : Statistik Potensi Desa Indonesia (PODES) 2011, BPSSource 2011 Village Potential Statistics of Indonesia, BPS - Statistics Indonesia
http://www.bps.go.id
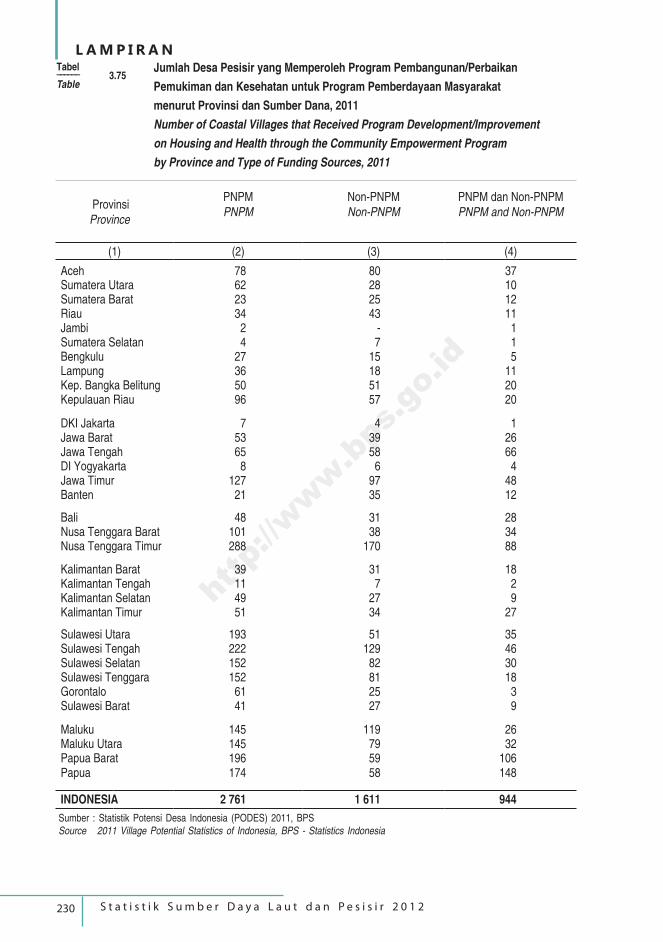
230 S t a t i s t i k S u m b e r D a y a L a u t d a n P e s i s i r 2 0 1 2
L A M P I R A N
Provinsi Province
PNPMPNPM
Non-PNPMNon-PNPM
PNPM dan Non-PNPMPNPM and Non-PNPM
(1) (2) (3) (4)
Aceh 78 80 37Sumatera Utara 62 28 10Sumatera Barat 23 25 12Riau 34 43 11Jambi 2 - 1Sumatera Selatan 4 7 1Bengkulu 27 15 5Lampung 36 18 11Kep. Bangka Belitung 50 51 20Kepulauan Riau 96 57 20
DKI Jakarta 7 4 1Jawa Barat 53 39 26Jawa Tengah 65 58 66DI Yogyakarta 8 6 4Jawa Timur 127 97 48Banten 21 35 12
Bali 48 31 28Nusa Tenggara Barat 101 38 34Nusa Tenggara Timur 288 170 88
Kalimantan Barat 39 31 18Kalimantan Tengah 11 7 2Kalimantan Selatan 49 27 9Kalimantan Timur 51 34 27
Sulawesi Utara 193 51 35Sulawesi Tengah 222 129 46Sulawesi Selatan 152 82 30Sulawesi Tenggara 152 81 18Gorontalo 61 25 3Sulawesi Barat 41 27 9
Maluku 145 119 26Maluku Utara 145 79 32Papua Barat 196 59 106Papua 174 58 148
INDONESIA 2 761 1 611 944
Tabel –––––– 3.75Table
Jumlah Desa Pesisir yang Memperoleh Program Pembangunan/Perbaikan
Pemukiman dan Kesehatan untuk Program Pemberdayaan Masyarakat
menurut Provinsi dan Sumber Dana, 2011
Number of Coastal Villages that Received Program Development/Improvementon Housing and Health through the Community Empowerment Program
by Province and Type of Funding Sources, 2011
Sumber : Statistik Potensi Desa Indonesia (PODES) 2011, BPSSource 2011 Village Potential Statistics of Indonesia, BPS - Statistics Indonesia
http://www.bps.go.id
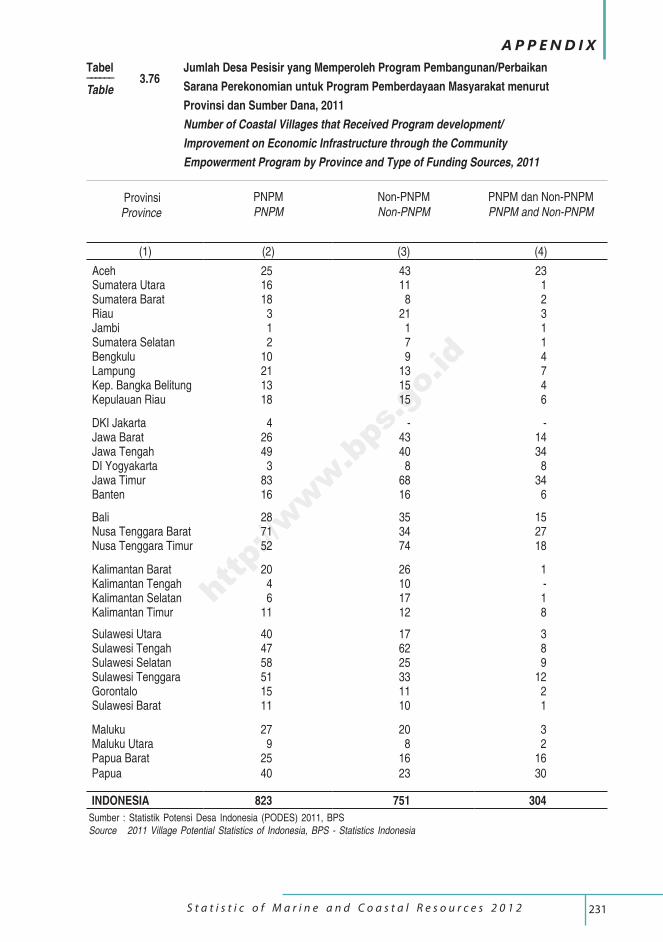
231 S t a t i s t i c o f M a r i n e a n d C o a s t a l R e s o u r c e s 2 0 1 2
A P P E N D I X
Provinsi Province
PNPMPNPM
Non-PNPMNon-PNPM
PNPM dan Non-PNPMPNPM and Non-PNPM
(1) (2) (3) (4)
Aceh 25 43 23Sumatera Utara 16 11 1Sumatera Barat 18 8 2Riau 3 21 3Jambi 1 1 1Sumatera Selatan 2 7 1Bengkulu 10 9 4Lampung 21 13 7Kep. Bangka Belitung 13 15 4Kepulauan Riau 18 15 6
DKI Jakarta 4 - -Jawa Barat 26 43 14Jawa Tengah 49 40 34DI Yogyakarta 3 8 8Jawa Timur 83 68 34Banten 16 16 6
Bali 28 35 15Nusa Tenggara Barat 71 34 27Nusa Tenggara Timur 52 74 18
Kalimantan Barat 20 26 1Kalimantan Tengah 4 10 -Kalimantan Selatan 6 17 1Kalimantan Timur 11 12 8
Sulawesi Utara 40 17 3Sulawesi Tengah 47 62 8Sulawesi Selatan 58 25 9Sulawesi Tenggara 51 33 12Gorontalo 15 11 2Sulawesi Barat 11 10 1
Maluku 27 20 3Maluku Utara 9 8 2Papua Barat 25 16 16Papua 40 23 30
INDONESIA 823 751 304
Tabel –––––– 3.76Table
Jumlah Desa Pesisir yang Memperoleh Program Pembangunan/Perbaikan
Sarana Perekonomian untuk Program Pemberdayaan Masyarakat menurut
Provinsi dan Sumber Dana, 2011
Number of Coastal Villages that Received Program development/
Improvement on Economic Infrastructure through the Community Empowerment Program by Province and Type of Funding Sources, 2011
Sumber : Statistik Potensi Desa Indonesia (PODES) 2011, BPSSource 2011 Village Potential Statistics of Indonesia, BPS - Statistics Indonesia
http://www.bps.go.id
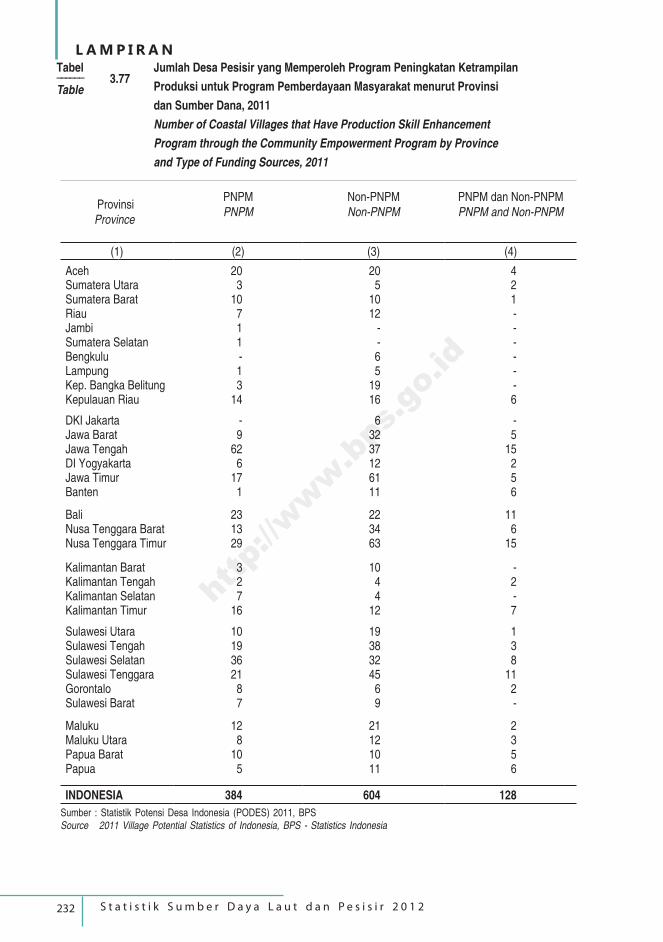
232 S t a t i s t i k S u m b e r D a y a L a u t d a n P e s i s i r 2 0 1 2
L A M P I R A N
Provinsi Province
PNPMPNPM
Non-PNPMNon-PNPM
PNPM dan Non-PNPMPNPM and Non-PNPM
(1) (2) (3) (4)
Aceh 20 20 4Sumatera Utara 3 5 2Sumatera Barat 10 10 1Riau 7 12 -Jambi 1 - -Sumatera Selatan 1 - -Bengkulu - 6 -Lampung 1 5 -Kep. Bangka Belitung 3 19 -Kepulauan Riau 14 16 6
DKI Jakarta - 6 -Jawa Barat 9 32 5Jawa Tengah 62 37 15DI Yogyakarta 6 12 2Jawa Timur 17 61 5Banten 1 11 6
Bali 23 22 11Nusa Tenggara Barat 13 34 6Nusa Tenggara Timur 29 63 15
Kalimantan Barat 3 10 -Kalimantan Tengah 2 4 2Kalimantan Selatan 7 4 -Kalimantan Timur 16 12 7
Sulawesi Utara 10 19 1Sulawesi Tengah 19 38 3Sulawesi Selatan 36 32 8Sulawesi Tenggara 21 45 11Gorontalo 8 6 2Sulawesi Barat 7 9 -
Maluku 12 21 2Maluku Utara 8 12 3Papua Barat 10 10 5Papua 5 11 6
INDONESIA 384 604 128
Tabel –––––– 3.77Table
Jumlah Desa Pesisir yang Memperoleh Program Peningkatan Ketrampilan
Produksi untuk Program Pemberdayaan Masyarakat menurut Provinsi
dan Sumber Dana, 2011
Number of Coastal Villages that Have Production Skill Enhancement
Program through the Community Empowerment Program by Province
and Type of Funding Sources, 2011
Sumber : Statistik Potensi Desa Indonesia (PODES) 2011, BPSSource 2011 Village Potential Statistics of Indonesia, BPS - Statistics Indonesia
http://www.bps.go.id
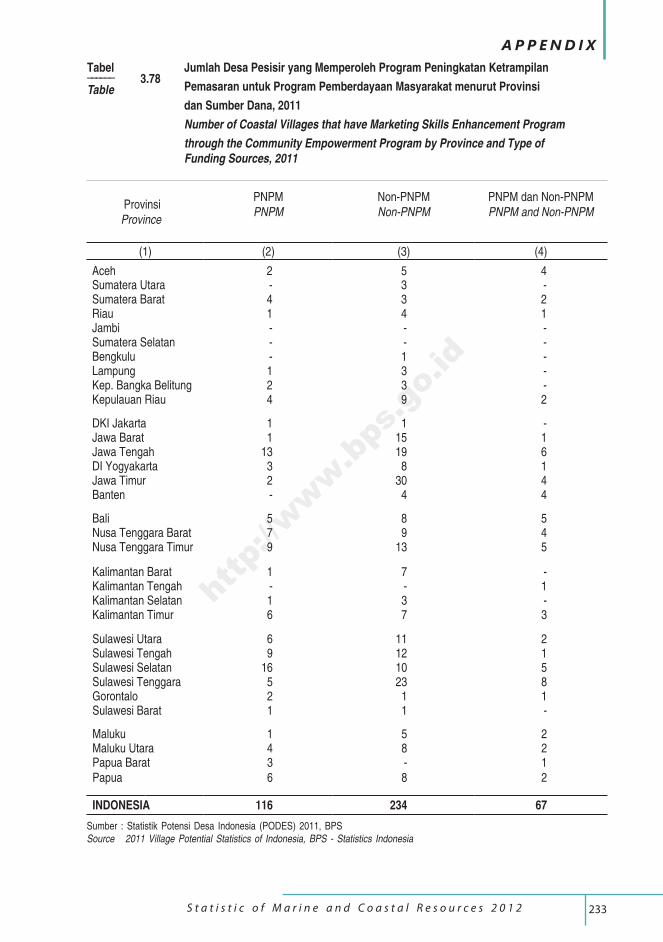
233 S t a t i s t i c o f M a r i n e a n d C o a s t a l R e s o u r c e s 2 0 1 2
A P P E N D I X
Provinsi Province
PNPMPNPM
Non-PNPMNon-PNPM
PNPM dan Non-PNPMPNPM and Non-PNPM
(1) (2) (3) (4)
Aceh 2 5 4Sumatera Utara - 3 -Sumatera Barat 4 3 2Riau 1 4 1Jambi - - -Sumatera Selatan - - -Bengkulu - 1 -Lampung 1 3 -Kep. Bangka Belitung 2 3 -Kepulauan Riau 4 9 2
DKI Jakarta 1 1 -Jawa Barat 1 15 1Jawa Tengah 13 19 6DI Yogyakarta 3 8 1Jawa Timur 2 30 4Banten - 4 4
Bali 5 8 5Nusa Tenggara Barat 7 9 4Nusa Tenggara Timur 9 13 5
Kalimantan Barat 1 7 -Kalimantan Tengah - - 1Kalimantan Selatan 1 3 -Kalimantan Timur 6 7 3
Sulawesi Utara 6 11 2Sulawesi Tengah 9 12 1Sulawesi Selatan 16 10 5Sulawesi Tenggara 5 23 8Gorontalo 2 1 1Sulawesi Barat 1 1 -
Maluku 1 5 2Maluku Utara 4 8 2Papua Barat 3 - 1Papua 6 8 2
INDONESIA 116 234 67
Tabel –––––– 3.78Table
Jumlah Desa Pesisir yang Memperoleh Program Peningkatan Ketrampilan
Pemasaran untuk Program Pemberdayaan Masyarakat menurut Provinsi
dan Sumber Dana, 2011
Number of Coastal Villages that have Marketing Skills Enhancement Program
through the Community Empowerment Program by Province and Type of Funding Sources, 2011
Sumber : Statistik Potensi Desa Indonesia (PODES) 2011, BPSSource 2011 Village Potential Statistics of Indonesia, BPS - Statistics Indonesia
http://www.bps.go.id
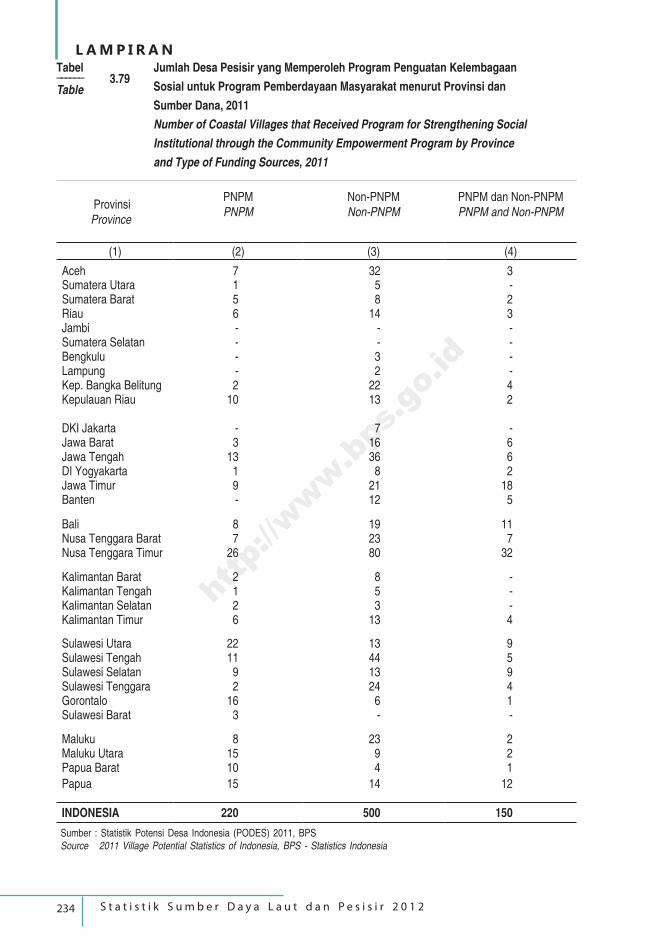
234 S t a t i s t i k S u m b e r D a y a L a u t d a n P e s i s i r 2 0 1 2
L A M P I R A N
Provinsi Province
PNPMPNPM
Non-PNPMNon-PNPM
PNPM dan Non-PNPMPNPM and Non-PNPM
(1) (2) (3) (4)
Aceh 7 32 3Sumatera Utara 1 5 -Sumatera Barat 5 8 2Riau 6 14 3Jambi - - -Sumatera Selatan - - -Bengkulu - 3 -Lampung - 2 -Kep. Bangka Belitung 2 22 4Kepulauan Riau 10 13 2
DKI Jakarta - 7 -Jawa Barat 3 16 6Jawa Tengah 13 36 6DI Yogyakarta 1 8 2Jawa Timur 9 21 18Banten - 12 5
Bali 8 19 11Nusa Tenggara Barat 7 23 7Nusa Tenggara Timur 26 80 32
Kalimantan Barat 2 8 -Kalimantan Tengah 1 5 -Kalimantan Selatan 2 3 -Kalimantan Timur 6 13 4
Sulawesi Utara 22 13 9Sulawesi Tengah 11 44 5Sulawesi Selatan 9 13 9Sulawesi Tenggara 2 24 4Gorontalo 16 6 1Sulawesi Barat 3 - -
Maluku 8 23 2Maluku Utara 15 9 2Papua Barat 10 4 1
Papua 15 14 12
INDONESIA 220 500 150
Tabel –––––– 3.79Table
Jumlah Desa Pesisir yang Memperoleh Program Penguatan Kelembagaan
Sosial untuk Program Pemberdayaan Masyarakat menurut Provinsi dan
Sumber Dana, 2011
Number of Coastal Villages that Received Program for Strengthening Social
Institutional through the Community Empowerment Program by Province and Type of Funding Sources, 2011
Sumber : Statistik Potensi Desa Indonesia (PODES) 2011, BPSSource 2011 Village Potential Statistics of Indonesia, BPS - Statistics Indonesia
http://www.bps.go.id
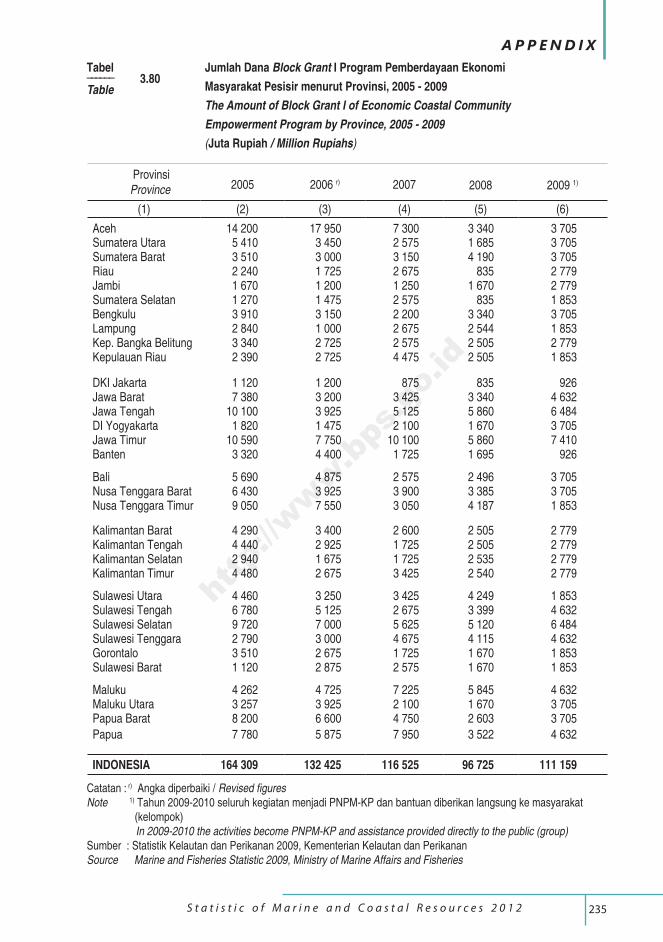
235 S t a t i s t i c o f M a r i n e a n d C o a s t a l R e s o u r c e s 2 0 1 2
A P P E N D I X
Provinsi Province 2005 2006 r) 2007 2008 2009 1)
(1) (2) (3) (4) (5) (6)
Aceh 14 200 17 950 7 300 3 340 3 705Sumatera Utara 5 410 3 450 2 575 1 685 3 705Sumatera Barat 3 510 3 000 3 150 4 190 3 705Riau 2 240 1 725 2 675 835 2 779Jambi 1 670 1 200 1 250 1 670 2 779Sumatera Selatan 1 270 1 475 2 575 835 1 853Bengkulu 3 910 3 150 2 200 3 340 3 705Lampung 2 840 1 000 2 675 2 544 1 853Kep. Bangka Belitung 3 340 2 725 2 575 2 505 2 779Kepulauan Riau 2 390 2 725 4 475 2 505 1 853
DKI Jakarta 1 120 1 200 875 835 926Jawa Barat 7 380 3 200 3 425 3 340 4 632Jawa Tengah 10 100 3 925 5 125 5 860 6 484DI Yogyakarta 1 820 1 475 2 100 1 670 3 705Jawa Timur 10 590 7 750 10 100 5 860 7 410Banten 3 320 4 400 1 725 1 695 926
Bali 5 690 4 875 2 575 2 496 3 705Nusa Tenggara Barat 6 430 3 925 3 900 3 385 3 705Nusa Tenggara Timur 9 050 7 550 3 050 4 187 1 853
Kalimantan Barat 4 290 3 400 2 600 2 505 2 779Kalimantan Tengah 4 440 2 925 1 725 2 505 2 779Kalimantan Selatan 2 940 1 675 1 725 2 535 2 779Kalimantan Timur 4 480 2 675 3 425 2 540 2 779
Sulawesi Utara 4 460 3 250 3 425 4 249 1 853Sulawesi Tengah 6 780 5 125 2 675 3 399 4 632Sulawesi Selatan 9 720 7 000 5 625 5 120 6 484Sulawesi Tenggara 2 790 3 000 4 675 4 115 4 632Gorontalo 3 510 2 675 1 725 1 670 1 853Sulawesi Barat 1 120 2 875 2 575 1 670 1 853
Maluku 4 262 4 725 7 225 5 845 4 632Maluku Utara 3 257 3 925 2 100 1 670 3 705Papua Barat 8 200 6 600 4 750 2 603 3 705
Papua 7 780 5 875 7 950 3 522 4 632
INDONESIA 164 309 132 425 116 525 96 725 111 159
Tabel –––––– 3.80Table
Jumlah Dana Block Grant I Program Pemberdayaan Ekonomi
Masyarakat Pesisir menurut Provinsi, 2005 - 2009
The Amount of Block Grant I of Economic Coastal Community Empowerment Program by Province, 2005 - 2009
(Juta Rupiah / Million Rupiahs)
Catatan : r) Angka diperbaiki / Revised figuresNote 1) Tahun 2009-2010 seluruh kegiatan menjadi PNPM-KP dan bantuan diberikan langsung ke masyarakat (kelompok) In 2009-2010 the activities become PNPM-KP and assistance provided directly to the public (group)Sumber : Statistik Kelautan dan Perikanan 2009, Kementerian Kelautan dan PerikananSource Marine and Fisheries Statistic 2009, Ministry of Marine Affairs and Fisheries
http://www.bps.go.id
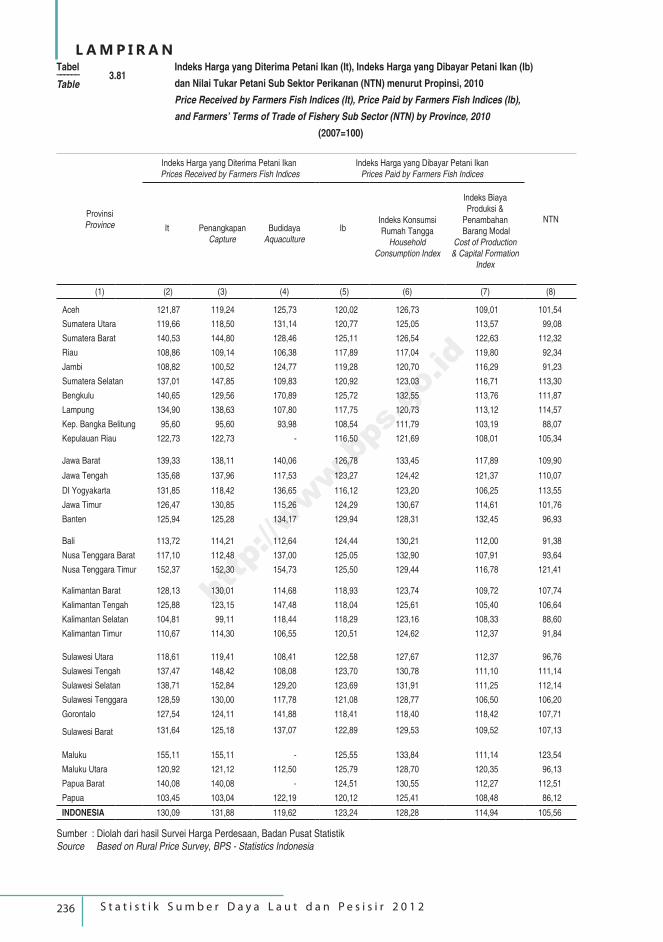
236 S t a t i s t i k S u m b e r D a y a L a u t d a n P e s i s i r 2 0 1 2
L A M P I R A N
ProvinsiProvince
Indeks Harga yang Diterima Petani Ikan Prices Received by Farmers Fish Indices
Indeks Harga yang Dibayar Petani IkanPrices Paid by Farmers Fish Indices
NTN It Penangkapan
CaptureBudidaya
Aquaculture
Ib
Indeks Konsumsi Rumah Tangga
Household Consumption Index
Indeks Biaya Produksi &
Penambahan Barang Modal
Cost of Production & Capital Formation
Index
(1) (2) (3) (4) (5) (6) (7) (8)
Aceh 121,87 119,24 125,73 120,02 126,73 109,01 101,54
Sumatera Utara 119,66 118,50 131,14 120,77 125,05 113,57 99,08
Sumatera Barat 140,53 144,80 128,46 125,11 126,54 122,63 112,32
Riau 108,86 109,14 106,38 117,89 117,04 119,80 92,34
Jambi 108,82 100,52 124,77 119,28 120,70 116,29 91,23
Sumatera Selatan 137,01 147,85 109,83 120,92 123,03 116,71 113,30
Bengkulu 140,65 129,56 170,89 125,72 132,55 113,76 111,87
Lampung 134,90 138,63 107,80 117,75 120,73 113,12 114,57
Kep. Bangka Belitung 95,60 95,60 93,98 108,54 111,79 103,19 88,07
Kepulauan Riau 122,73 122,73 - 116,50 121,69 108,01 105,34
Jawa Barat 139,33 138,11 140,06 126,78 133,45 117,89 109,90
Jawa Tengah 135,68 137,96 117,53 123,27 124,42 121,37 110,07
DI Yogyakarta 131,85 118,42 136,65 116,12 123,20 106,25 113,55
Jawa Timur 126,47 130,85 115,26 124,29 130,67 114,61 101,76
Banten 125,94 125,28 134,17 129,94 128,31 132,45 96,93
Bali 113,72 114,21 112,64 124,44 130,21 112,00 91,38
Nusa Tenggara Barat 117,10 112,48 137,00 125,05 132,90 107,91 93,64
Nusa Tenggara Timur 152,37 152,30 154,73 125,50 129,44 116,78 121,41
Kalimantan Barat 128,13 130,01 114,68 118,93 123,74 109,72 107,74
Kalimantan Tengah 125,88 123,15 147,48 118,04 125,61 105,40 106,64
Kalimantan Selatan 104,81 99,11 118,44 118,29 123,16 108,33 88,60
Kalimantan Timur 110,67 114,30 106,55 120,51 124,62 112,37 91,84
Sulawesi Utara 118,61 119,41 108,41 122,58 127,67 112,37 96,76
Sulawesi Tengah 137,47 148,42 108,08 123,70 130,78 111,10 111,14
Sulawesi Selatan 138,71 152,84 129,20 123,69 131,91 111,25 112,14
Sulawesi Tenggara 128,59 130,00 117,78 121,08 128,77 106,50 106,20
Gorontalo 127,54 124,11 141,88 118,41 118,40 118,42 107,71
Sulawesi Barat 131,64 125,18 137,07 122,89 129,53 109,52 107,13
Maluku 155,11 155,11 - 125,55 133,84 111,14 123,54
Maluku Utara 120,92 121,12 112,50 125,79 128,70 120,35 96,13
Papua Barat 140,08 140,08 - 124,51 130,55 112,27 112,51
Papua 103,45 103,04 122,19 120,12 125,41 108,48 86,12
INDONESIA 130,09 131,88 119,62 123,24 128,28 114,94 105,56
Tabel –––––– 3.81Table
Indeks Harga yang Diterima Petani Ikan (It), Indeks Harga yang Dibayar Petani Ikan (Ib)
dan Nilai Tukar Petani Sub Sektor Perikanan (NTN) menurut Propinsi, 2010
Price Received by Farmers Fish Indices (It), Price Paid by Farmers Fish Indices (Ib),
and Farmers’ Terms of Trade of Fishery Sub Sector (NTN) by Province, 2010
(2007=100)
Sumber : Diolah dari hasil Survei Harga Perdesaan, Badan Pusat StatistikSource Based on Rural Price Survey, BPS - Statistics Indonesia
http://www.bps.go.id
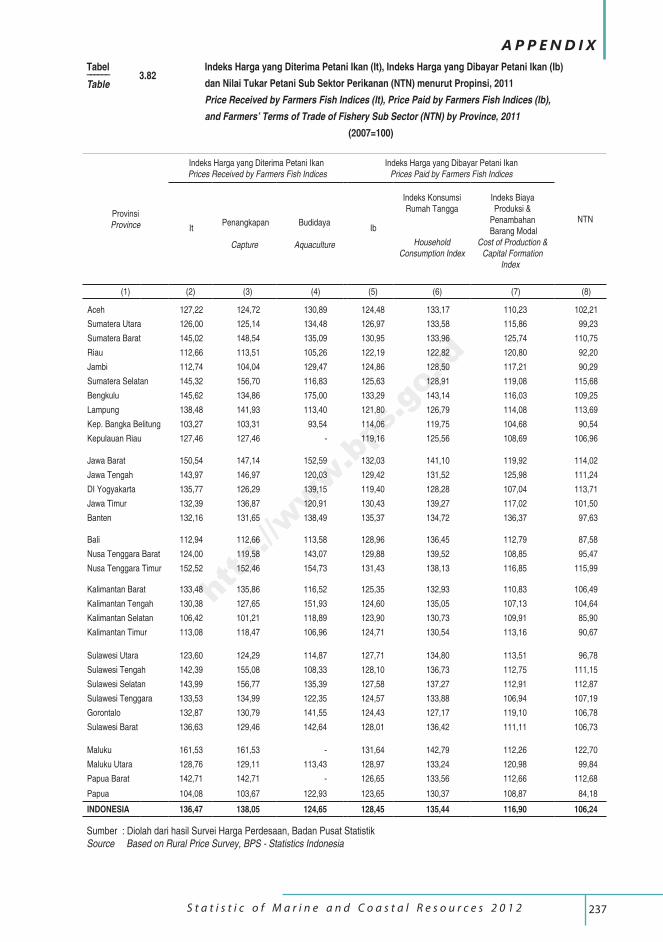
237 S t a t i s t i c o f M a r i n e a n d C o a s t a l R e s o u r c e s 2 0 1 2
A P P E N D I X
ProvinsiProvince
Indeks Harga yang Diterima Petani Ikan Prices Received by Farmers Fish Indices
Indeks Harga yang Dibayar Petani IkanPrices Paid by Farmers Fish Indices
NTN It
Penangkapan
Capture
Budidaya
Aquaculture
Ib
Indeks Konsumsi Rumah Tangga
Household Consumption Index
Indeks Biaya Produksi &
Penambahan Barang Modal
Cost of Production & Capital Formation
Index
(1) (2) (3) (4) (5) (6) (7) (8)
Aceh 127,22 124,72 130,89 124,48 133,17 110,23 102,21
Sumatera Utara 126,00 125,14 134,48 126,97 133,58 115,86 99,23
Sumatera Barat 145,02 148,54 135,09 130,95 133,96 125,74 110,75
Riau 112,66 113,51 105,26 122,19 122,82 120,80 92,20
Jambi 112,74 104,04 129,47 124,86 128,50 117,21 90,29
Sumatera Selatan 145,32 156,70 116,83 125,63 128,91 119,08 115,68
Bengkulu 145,62 134,86 175,00 133,29 143,14 116,03 109,25
Lampung 138,48 141,93 113,40 121,80 126,79 114,08 113,69
Kep. Bangka Belitung 103,27 103,31 93,54 114,06 119,75 104,68 90,54
Kepulauan Riau 127,46 127,46 - 119,16 125,56 108,69 106,96
Jawa Barat 150,54 147,14 152,59 132,03 141,10 119,92 114,02
Jawa Tengah 143,97 146,97 120,03 129,42 131,52 125,98 111,24
DI Yogyakarta 135,77 126,29 139,15 119,40 128,28 107,04 113,71
Jawa Timur 132,39 136,87 120,91 130,43 139,27 117,02 101,50
Banten 132,16 131,65 138,49 135,37 134,72 136,37 97,63
Bali 112,94 112,66 113,58 128,96 136,45 112,79 87,58
Nusa Tenggara Barat 124,00 119,58 143,07 129,88 139,52 108,85 95,47
Nusa Tenggara Timur 152,52 152,46 154,73 131,43 138,13 116,85 115,99
Kalimantan Barat 133,48 135,86 116,52 125,35 132,93 110,83 106,49
Kalimantan Tengah 130,38 127,65 151,93 124,60 135,05 107,13 104,64
Kalimantan Selatan 106,42 101,21 118,89 123,90 130,73 109,91 85,90
Kalimantan Timur 113,08 118,47 106,96 124,71 130,54 113,16 90,67
Sulawesi Utara 123,60 124,29 114,87 127,71 134,80 113,51 96,78
Sulawesi Tengah 142,39 155,08 108,33 128,10 136,73 112,75 111,15
Sulawesi Selatan 143,99 156,77 135,39 127,58 137,27 112,91 112,87
Sulawesi Tenggara 133,53 134,99 122,35 124,57 133,88 106,94 107,19
Gorontalo 132,87 130,79 141,55 124,43 127,17 119,10 106,78
Sulawesi Barat 136,63 129,46 142,64 128,01 136,42 111,11 106,73
Maluku 161,53 161,53 - 131,64 142,79 112,26 122,70
Maluku Utara 128,76 129,11 113,43 128,97 133,24 120,98 99,84
Papua Barat 142,71 142,71 - 126,65 133,56 112,66 112,68
Papua 104,08 103,67 122,93 123,65 130,37 108,87 84,18
INDONESIA 136,47 138,05 124,65 128,45 135,44 116,90 106,24
Tabel –––––– 3.82Table
Indeks Harga yang Diterima Petani Ikan (It), Indeks Harga yang Dibayar Petani Ikan (Ib)
dan Nilai Tukar Petani Sub Sektor Perikanan (NTN) menurut Propinsi, 2011
Price Received by Farmers Fish Indices (It), Price Paid by Farmers Fish Indices (Ib),
and Farmers’ Terms of Trade of Fishery Sub Sector (NTN) by Province, 2011
(2007=100)
Sumber : Diolah dari hasil Survei Harga Perdesaan, Badan Pusat StatistikSource Based on Rural Price Survey, BPS - Statistics Indonesia
http://www.bps.go.id
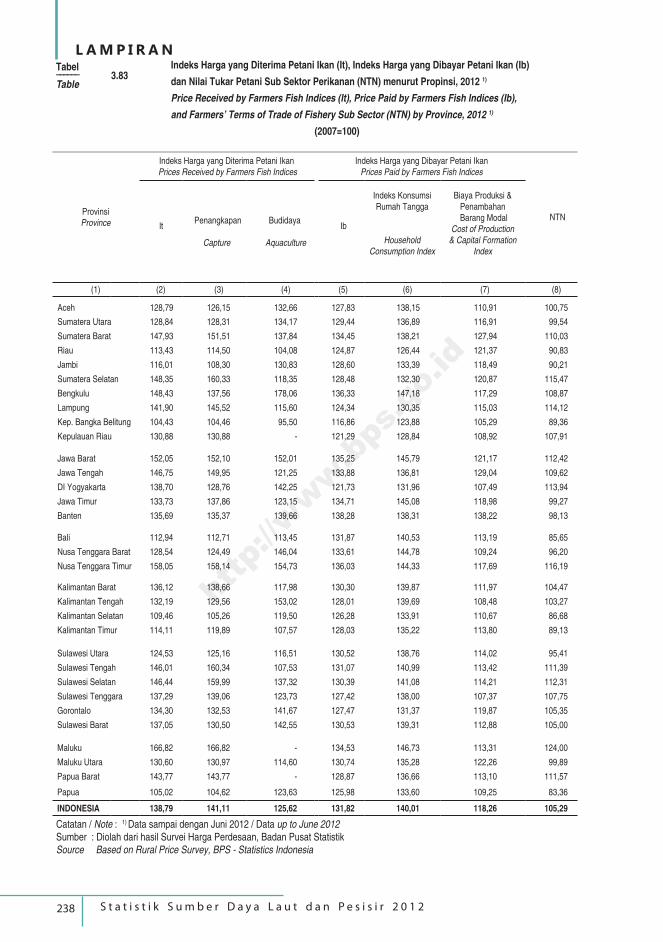
238 S t a t i s t i k S u m b e r D a y a L a u t d a n P e s i s i r 2 0 1 2
L A M P I R A N
ProvinsiProvince
Indeks Harga yang Diterima Petani Ikan Prices Received by Farmers Fish Indices
Indeks Harga yang Dibayar Petani IkanPrices Paid by Farmers Fish Indices
NTN lt
Penangkapan
Capture
Budidaya
Aquaculture
Ib
Indeks Konsumsi Rumah Tangga
Household Consumption Index
Biaya Produksi & Penambahan Barang Modal
Cost of Production & Capital Formation
Index
(1) (2) (3) (4) (5) (6) (7) (8)
Aceh 128,79 126,15 132,66 127,83 138,15 110,91 100,75
Sumatera Utara 128,84 128,31 134,17 129,44 136,89 116,91 99,54
Sumatera Barat 147,93 151,51 137,84 134,45 138,21 127,94 110,03
Riau 113,43 114,50 104,08 124,87 126,44 121,37 90,83
Jambi 116,01 108,30 130,83 128,60 133,39 118,49 90,21
Sumatera Selatan 148,35 160,33 118,35 128,48 132,30 120,87 115,47
Bengkulu 148,43 137,56 178,06 136,33 147,18 117,29 108,87
Lampung 141,90 145,52 115,60 124,34 130,35 115,03 114,12
Kep. Bangka Belitung 104,43 104,46 95,50 116,86 123,88 105,29 89,36
Kepulauan Riau 130,88 130,88 - 121,29 128,84 108,92 107,91
Jawa Barat 152,05 152,10 152,01 135,25 145,79 121,17 112,42
Jawa Tengah 146,75 149,95 121,25 133,88 136,81 129,04 109,62
DI Yogyakarta 138,70 128,76 142,25 121,73 131,96 107,49 113,94
Jawa Timur 133,73 137,86 123,15 134,71 145,08 118,98 99,27
Banten 135,69 135,37 139,66 138,28 138,31 138,22 98,13
Bali 112,94 112,71 113,45 131,87 140,53 113,19 85,65
Nusa Tenggara Barat 128,54 124,49 146,04 133,61 144,78 109,24 96,20
Nusa Tenggara Timur 158,05 158,14 154,73 136,03 144,33 117,69 116,19
Kalimantan Barat 136,12 138,66 117,98 130,30 139,87 111,97 104,47
Kalimantan Tengah 132,19 129,56 153,02 128,01 139,69 108,48 103,27
Kalimantan Selatan 109,46 105,26 119,50 126,28 133,91 110,67 86,68
Kalimantan Timur 114,11 119,89 107,57 128,03 135,22 113,80 89,13
Sulawesi Utara 124,53 125,16 116,51 130,52 138,76 114,02 95,41
Sulawesi Tengah 146,01 160,34 107,53 131,07 140,99 113,42 111,39
Sulawesi Selatan 146,44 159,99 137,32 130,39 141,08 114,21 112,31
Sulawesi Tenggara 137,29 139,06 123,73 127,42 138,00 107,37 107,75
Gorontalo 134,30 132,53 141,67 127,47 131,37 119,87 105,35
Sulawesi Barat 137,05 130,50 142,55 130,53 139,31 112,88 105,00
Maluku 166,82 166,82 - 134,53 146,73 113,31 124,00
Maluku Utara 130,60 130,97 114,60 130,74 135,28 122,26 99,89
Papua Barat 143,77 143,77 - 128,87 136,66 113,10 111,57
Papua 105,02 104,62 123,63 125,98 133,60 109,25 83,36
INDONESIA 138,79 141,11 125,62 131,82 140,01 118,26 105,29
Tabel –––––– 3.83Table
Indeks Harga yang Diterima Petani Ikan (It), Indeks Harga yang Dibayar Petani Ikan (Ib)
dan Nilai Tukar Petani Sub Sektor Perikanan (NTN) menurut Propinsi, 2012 1)
Price Received by Farmers Fish Indices (It), Price Paid by Farmers Fish Indices (Ib),
and Farmers’ Terms of Trade of Fishery Sub Sector (NTN) by Province, 2012 1)
(2007=100)
Catatan / Note : 1) Data sampai dengan Juni 2012 / Data up to June 2012Sumber : Diolah dari hasil Survei Harga Perdesaan, Badan Pusat StatistikSource Based on Rural Price Survey, BPS - Statistics Indonesia
http://www.bps.go.id

http://www.bps.go.id
http://www.bps.go.id