spatiotemporal changes in the genetic diversity of a bloom-forming microcystis aeruginosa...
TRANSCRIPT
ORIGINAL ARTICLE
Spatiotemporal changes in the geneticdiversity of a bloom-forming Microcystisaeruginosa (cyanobacteria) population
Enora Briand1,2, Nicolas Escoffier3,4, Cecile Straub3, Marion Sabart3,5, Catherine Quiblier1,6
and Jean-Francois Humbert3,4
1MNHN, USM505/EA4105 Ecosystemes et interactions toxiques, Paris Cedex 05, France; 2SCE, DepartementEau, Pole Fleuves, Rivieres et Milieux Humides, Route de Gachet, Nantes, France; 3Unite des Cyanobacteries,Institut Pasteur-CNRS URA 2172, Paris, France; 4INRA, UMR CARRTEL, Thonon-les-Bains Cedex, France;5Laboratoire Microorganismes: genome et environnement, UMR CNRS 6023, Universite Blaise Pascal,Clermont-Ferrand II, Aubiere Cedex, France and 6Universite Paris Diderot, PRG, Paris, France
The variations in microcystin concentrations during cyanobacterial blooms in freshwaterecosystems appear to depend on numerous factors, which have still not been fully identified.To contribute to clarify the situation, we have developed a spatial sampling approach to determinethe dynamics and genetic diversity of a bloom-forming population of Microcystis aeruginosa in alarge French reservoir, and the variations in the proportions of microcystin-producing genotypes.We demonstrated that marked changes occurred in the internal transcribed spacer (ITS) genotypecomposition of the M. aeruginosa population during the development of the bloom. These changesled progressively to the selection of one dominant ITS genotype throughout the entire reservoirwhen the cell number reached its maximum. At the same time, we identified a decrease in theproportion of the mcyBþ genotype, and a significant negative correlation between this proportionand that of the dominant ITS genotype during the bloom. Thus, it appeared that favorable conditionsfor Microcystis cell growth led to the selection, within the Microcystis population, of a non-microcystin-producing genotype, whereas potentially microcystin-producing genotypes weredominant in this population before and after the bloom, when environmental conditions were lessfavorable for growth.The ISME Journal (2009) 3, 419–429; doi:10.1038/ismej.2008.121; published online 18 December 2008Subject Category: microbial population and community ecologyKeywords: cyanobacteria; Microcystis aeruginosa; microcystins; bloom; genetic diversity
Introduction
Proliferations of harmful cyanobacteria are a growingproblem in many freshwater ecosystems, and may beexplained by the degradation of the water quality inmany of them because of eutrophication (for exampleCarpenter et al., 1998; Smith et al., 1999) and, to alesser extent, by climate warming (Paerl and Huis-man, 2008; Shatwell et al., 2008; Johnk et al., 2008). Inattempts to find out what governs cyanobacterialproliferations, over the past 10 years an increasingnumber of papers have dealt with the relativeimportance of biological, physicochemical andweather (for example Wiedner et al., 2002; Jacquet
et al., 2005; Catherine et al., 2008). Furthermore,several publications have recently investigated thegenetic diversity of some bloom-forming cyanobacter-ial populations, to assess their population structure(for example Barker et al., 2000; Wilson et al., 2005;Tanabe et al., 2007) or to find out whether biogeo-graphic differentiation occurs between these popula-tions at different spatial scales (for exampleBittencourt-Oliveira et al., 2001; Hayes et al., 2002;Laamanen et al., 2002; Gugger et al., 2005).
In most the studies of the population dynamicsand genetics of cyanobacteria, only one samplingpoint per ecosystem are investigated, and this madeit impossible to evaluate the spatial dynamics of thepopulations during the bloom development. Asa result we do not know whether cyanobacterialblooms in large freshwater ecosystems start at asingle point, and subsequently spread throughoutthe whole ecosystem, or whether blooms areinitiated at several different places within the body
Received 28 October 2008; accepted 4 November 2008; publishedonline 18 December 2008
Correspondence: J-F Humbert, Unite des Cyanobacteries, InstitutPasteur-CNRS URA 2172, 28 rue du Dr Roux, 75724 Paris Cedex 15,France.E-mail: [email protected]
The ISME Journal (2009) 3, 419–429& 2009 International Society for Microbial Ecology All rights reserved 1751-7362/09 $32.00
www.nature.com/ismej
of water. Similarly, there is no data available aboutthe spatiotemporal pattern of genetic diversityduring the development of cyanobacterial blooms,and this information could help to clarify thepopulation dynamics, and to find out whether oneor several genotypes are differentially selected atdifferent places during bloom development. Knowingthis would also allow us to estimate the spatial scaleat which dominant genotypes are selected during thedevelopment of the proliferating populations.
It is also particularly interesting to compare thechanges in the population dynamics and geneticsduring cyanobacterial proliferation to the change incyanotoxin production. Many studies of microcys-tins (MCs), which are the most frequently detectedcyanotoxins, have demonstrated that, for a givenspecies, the potential toxicity of the proliferatingpopulations varied greatly not only from place toplace, but also over the time course of the blooms(for example Kardinaal and Visser, 2005; Rantalaet al., 2006). These changes seem to be attributablemainly to changes in the relative proportions ofpotentially MC-producing and non-MC-producinggenotypes in the population (for example Vaitomaaet al., 2003; Kurmayer et al., 2004) but also, tochanges in the rate of MC production by the toxicgenotypes (for example Sivonen, 1990; Kaebernicket al., 2000; Wiedner et al., 2003; Gobler et al., 2007).Moreover, the recent work of Briand et al. (2008a)demonstrated that during a Planktothrix agardhiiproliferation there was an inverse correlation betweenthe changes in the proportion of potentially toxicgenotypes and in cyanobacterial cell abundances.
One interesting question about all these data ishow to establish the links between the changes incyanobacterial cell abundance, the genetic diversityof the population and the proportion of potentiallyMC-producing genotypes during the spatial courseof the development of a bloom in an ecosystem.To provide some answers to these questions, weinvestigated the development of a Microcystisaeruginosa bloom in the Grangent reservoir, whichis located on the Loire River in central France, usinga sampling strategy based on surveying six points inthe lake. Throughout the development of the bloom,the changes in the M. aeruginosa cell numbers andalso in its genetic diversity was evaluated at each ofthese sampling points by sequencing the internaltranscribed spacer (ITS) of the rRNA gene. We usedthe same samples to estimate the change inthe proportion of potentially MC-producing andnon-MC-producing genotypes using real-time PCR.
Materials and methods
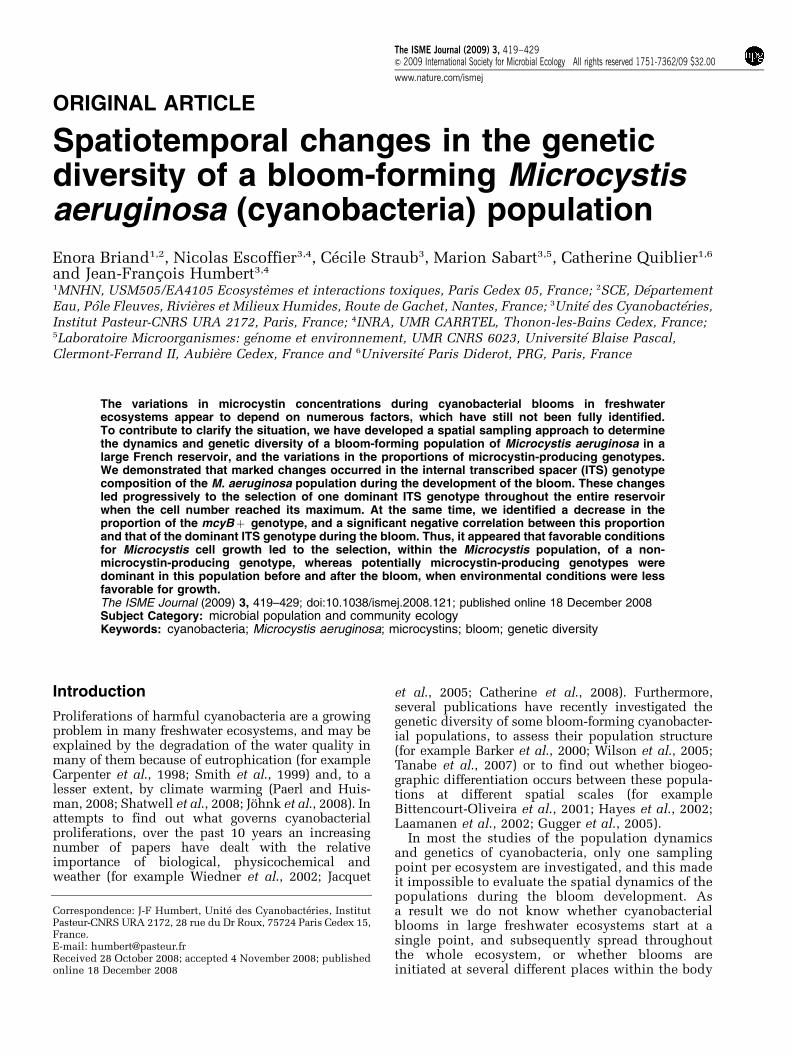
Study area and sampling strategyThe Grangent reservoir (451270N; 41150E) is locatedin the Massif Central (France), near Saint-Etienne, inthe upper part of the river Loire, and was created in1957 (Figure 1). The reservoir has a surface area of
365 Ha with a length of 21 km, a maximum depth of50 m and a capacity of 57.4� 106 m3. Lake Grangentconstitutes an important water reservoir for energyproduction and irrigation. This water body is also arecreational area, used for bathing and nauticalactivities. Since 1970, external phosphorus loadshave led to the hypereutrophication of the reservoir,which explains why M. aeruginosa blooms havebeen formed for several years (Berthon et al., 1996).
Sampling was conducted at six stations followingan upstream/downstream gradient on the Grangentreservoir (Figure 1). The study sites were sampledevery 2 weeks from 18 April to 1 August 2007. Watersamples were collected 0.5 m below the surfaceusing an electric pump that filtered 120, 60 or 30 l ofwater (depending on the biomass) through a 20-mmfilter; and then concentrated the biomass over a 20-mm filter into three 50-ml tubes (Greiner). The firstsample, which was used for cyanobacterial count-ing, was preserved with Lugol’s iodine (1:100)directly after sampling, and stored at 4 1C. The twoother samples were kept at �20 1C until tested forDNA extraction for molecular analysis (cloning,sequencing and real-time PCR).
M. aeruginosa cell densities (expressed in cells l�1)were determined in duplicate using a Malassezcounting chamber with a Nikon Optiphot 2 micro-scope (� 200; Nikon, Melville, NY, USA) after therapid disruption (20 s) of the colonial structure of M.aeruginosa by ultrasonication (ultrasonic processorat 25 kHz; Reynolds and Jaworski, 1978).
DNA extraction, PCR amplification andcloning–sequencing of the ITSDNA was extracted according to the protocol ofHumbert and Le Berre (2001) when cell number wassufficient to obtain good amplification of the ITS.Briefly, after filtering the sample, pieces of filter wereplaced in a tube and subjected to ultrasonication, asdescribed previously, in 2–4 ml cell lysis buffer (0.05 M
Tris–HCl, 0.05 M NaCl, 0.05 M EDTA at pH 8, and with
N
Dam
Ca
B
LA
Ch
R500 m
Figure 1 Location of the Grangent storage reservoir in France.Revotes (R), Chatelet (Ch), Lizeron (L), Anse (A), Camaldules (Ca)and Barrage (B) are the six sampling stations used in this study.
Genetic diversity in a Microcystis populationE Briand et al
420
The ISME Journal
a final concentration of 10 mg ml�1 of lysozyme). Thetubes were incubated at 37 1C for 1 h. Proteinase K(0.5 mg ml�1) and 1% sodium dodecyl sulfate werethen added, and the tubes were placed in a water bathat 40 1C and left overnight. After a phenol–chloroformextraction, and ethanol precipitation, the DNA ex-tracted was stored at �40 1C until used.
The ITS sequence of the rRNA operon wasamplified in each DNA extract. The 50-ml PCRmixtures contained 10–100 ng of template DNA, a100-mM concentration of each of the four deoxyr-ibonucleotide triphosphates, 5� PCR reaction buf-fer, a 200 mM concentration of MgCl2, 0.4 mM of eachprimer (forward primer: 50-TGTAAAACGACGGCCAGTCCATGGAAG(CT)TGGTCA(CT)G-30; reverseprimer: 50-CCTCTGTGTGCCTAGGTATCC-30; Itemanet al., 2005) and 1 U of Taq DNA Polymerase (GoTaqFlexi DNA Polymerase; Promega, Madison, WI,USA). The DNA template and a negative controlwere subjected to an initial denaturing step at 95 1Cfor 10 min. The following 35 cycles consisted of a30 s denaturing step at 95 1C, a 30 s annealing step at60 1C and a 60 s extension step at 72 1C. A final 7 minextension step was carried out at 72 1C. Amplifica-tions of the target region were checked by electro-phoresis on a 1.5% agarose gel stained withethidium bromide. In every sample, a single bandwas observed by electrophoresis, which is consis-tent with the fact that the ITS sequence is the samein the two rRNA operons present in Microcystis(Janse et al., 2003; Humbert et al., 2005).
Positive PCR products were purified before clon-ing using the QIAquick PCR Purification Kit(Qiagen, Hilden, Germany) according to the protocolprovided with the kit. Purified PCR products werecloned in pGEM-T vector system II (Promega)according to the manufacturer’s instructions (1:1–2:1 molar ratio of the PCR products to the vectors).Between 40 and 50 white colonies were randomlypicked from each clone library for the sequencing,which was performed by GATC Biotech usingcommercial SP6 (50-TAGGTGACACTATAGAATAC-30) primer. For further analyses, we used only thesequences sharing 495% identity with the M.aeruginosa, Microcystis viridis, Microcystis wesen-bergii, Microcystis ichthyoblabe and Microcystisnovacekii sequences from GenBank. DNA–DNAhybridization experiments (Otsuka et al., 2001)suggest that all these species are conspecific. Allnucleotide sequences have been deposited in theGenBank-EMBL database under the accession num-bers EU867825-EU868608.
The sequences were aligned using ClustalW inMega4 software (Tamura et al., 2007), and manuallycorrected in GeneDoc (Nicholas and Nicholas,1997). A minimum spanning tree, which connectsall genotypes together with the lowest total cost wasconstructed using BioNumerics software (AppliedMaths) using the default setting. Estimations ofnucleotide diversity, analyses of molecular variance(AMOVA), and pairwise FST calculations were
performed using Arlequin software v3.0 (Excoffieret al., 2005). The AMOVA approach makes itpossible to study the genetic structure of popula-tions in an analysis of variance framework takinginto account the number of mutations betweengenotypes. We compared three groups of popula-tions, which were defined on the basis of thesampling dates (24 May, 8 June and 22 June).
Finally, a Multidimensional scaling (MDS) analy-sis of the genotypic composition of each sample wasperformed using XLStat software (Addinsoft). Thisanalysis represents the similarities between all thesampling points at each sampling date in a two-dimensional graph.
Multiplex real-time PCRThe proportion of mcy genotypes in the Microcystispopulation was determined by a real-time PCRanalysis. Two target gene regions were used: theintergenic spacer region within the phycocyanin(PC) operon and the mcyB region, which carries outone step in MC biosynthesis (Tillett et al., 2000), andwas located between core motifs A2 and A3(Marahiel et al., 1997). The primers and probes usedfor the PC and mcyB genes (listed in Table 1), whichare specific for Microcystis, are those describedpreviously by Kurmayer and Kutzenberger (2003).Fluorescent reporter and quencher dyes for probeof PC gene were modified (from 50-FAM and30-TAMRA to 50-CYA and 30-BHQ-2) to performmutiplex real-time PCR and to discriminate betweenthe two amplifications in a same run.
Amplification by real-time PCR was carried outusing an Mx3005P thermal cycler (Stratagene,Amsterdam, the Netherlands). All the reactionswere performed with 20-ml volumes in 96-wellplates (Stratagene). The multiplex reaction mixcontained 10 ml of 2� QuantiTec Probe PCR kitmix (Qiagen), a 300-nM (300 fmol ml�1) concentrationof each primer, a 100-nM concentration of theTaqMan probe for PC gene amplification and a
Table 1 Real-time PCR primers and probes used in this study
Gene regionand primersor probes
Sequencea (50–30)
mcyB region:30F CCTACCGAGCGCTTGGG108R GAAAATCCCCTAAAGATTCCTGAGTProbe FAM-CACCAAAGAAACACCCGAATCTGAGA
GG-TAMRA
PC gene region:188F GCTACTTCGACCGCGCC254R TCCTACGGTTTAATTGAGACTAGCCProbe CYA-CCGCTGCTGTCGCCTAGTCCCTG-
BHQ-2
Abbreviation: PC, phycocyanin.aFAM, 6-carboxyfluorescein; TAMRA, 6-carboxytetramethylrhoda-mine; CYA, 5-indocarboxycyanine; BHQ-2, black hole quencher-2.
Genetic diversity in a Microcystis populationE Briand et al
421
The ISME Journal

900-nM concentration of each primer, a 250-nM
concentration of the TaqMan probe for mcyB and2ml of template containing various amounts ofgenomic DNA. The mix was then filled to 20 ml withsterile Millipore water. Each sample was prepared intriplicate. Negative controls without DNA wereincluded for each PCR run. The temperature cycleconsisted of an initial preheating step of 15 min at95 1C, followed by 40 cycles of 30 s at 95 1C(denaturing), 1 min at 60 1C (annealing) and 30 s at72 1C (extension). For data analysis, the thresholdfor the fluorescence of all the samples was setmanually to 132 (relative fluorescence) for PC geneamplification, and to 665 for mcyB amplification toobtain the best PCR efficiency using linear–logcalibration curves. The sizes of the amplicons were66- and 78-bp for the PC and mcyB genes, respectively.
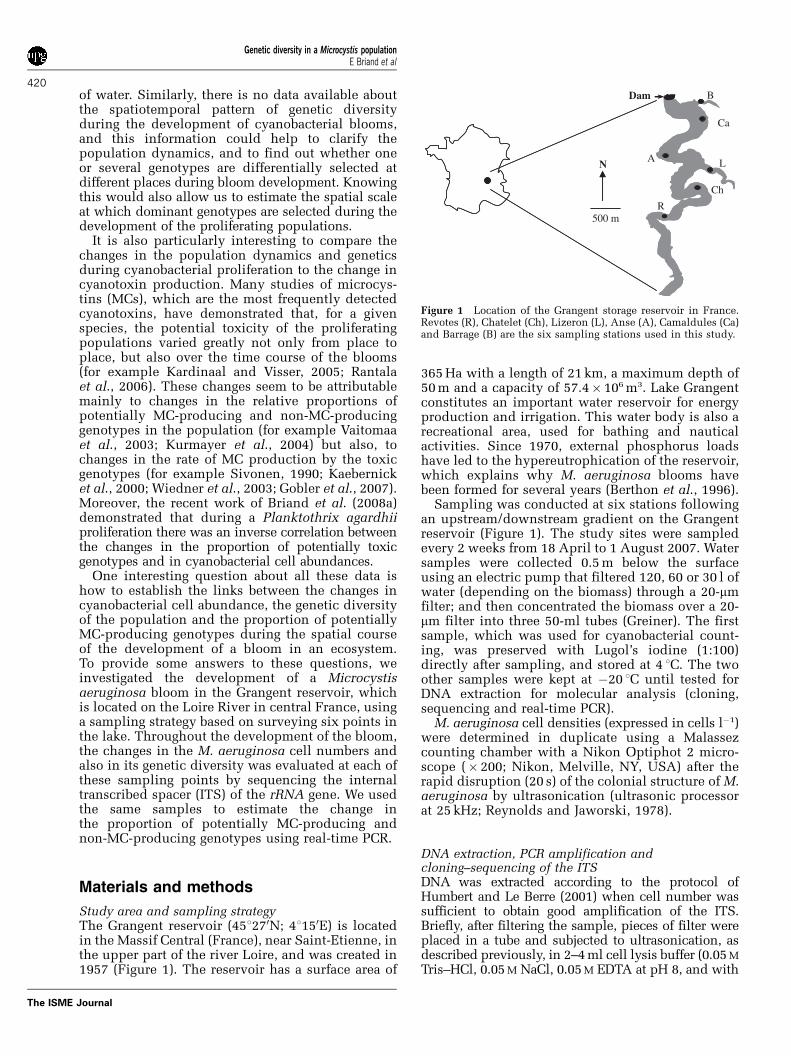
We used a novel method, the change in thresholdcycle (DCT; Briand et al., 2008a), to estimate therelative proportion of the mcyB subpopulation inthe Microcystis population by a single multiplexreal-time PCR. We had tested the reproducibilityof the method beforehand by applying it to severalMC-producing Microcystis strains. Standard curvesfor the PC and mcyB genes were constructed using thegenomic DNA of eight MC-producing Microcystisstrains PCC 7806, 7813, PCC 7820, PCC 7941, PCC9354, PCC 9355, PCC 9443 and PCC 9808. For eachstrain, serial dilutions containing 1.1� 101, 1.1,1.1� 10�1, 1.1� 10�2, 1.1� 10�3, 1.1� 10�4 and1.1� 10�5 ng of the genomic DNA ml�1 were pre-pared. The standard curves were established byrelating the known quantity of DNA (in pg) to thethreshold cycle (CT) number (the cycle number atwhich the fluorescence exceeds the threshold) foreach diluted sample (Table 2 and Figure 2a). Forboth genes, highly significant linear plots of theamounts of genomic DNA of the Microcystis strains
versus the CT numbers were obtained. The regres-sion equations, and the resulting DCT between thetwo genes (DCT¼CT for the PC gene�CT for mcyB)are shown in Table 2. We found that there was anarrow range of DCT values (with a mean DCT valueof �2.14±0.36) for all eight MC-producing Micro-cystis strains. As the CT decreases by 1 when thequantity of DNA decreases by 50%, the followingequation was deduced from the DCT values theore-tically calculated for proportions of mcyB genotypestrains of 100%, 50%, 25% and 12.5% of thepopulation: y¼ 3.32� log (x)�8.78, where y is theDCT, and x is the initial percentage of the mcyBgenotype strains.
This theoretical DCT equation was experimentallyvalidated with samples containing a mix of the MC-producing strain PCC 7806, and the non-MC-produ-cing strain PCC 9806. Five samples containing12.5%, 25%, 50%, 75% and 100% of the MC-producing strain, respectively, were tested, and theDCT for each percentage was calculated (Figure 2b1).The resulting DCT equation (y¼ 3.27� log (x)�8.53;Figure 2b2) was similar to the theoretical DCT
equation (y¼ 3.32� log (x)�8.78), which validatesour approach.
For each run of samples, serial dilutions contain-ing 1.1� 101, 1.1, 1.1� 10�1, 1.1� 10�2, 1.1� 10�3,1.1� 10�4 and 1.1� 10�5 ng of the genomic DNA ml�1
were prepared from the DNA extract of an MC-producing M. aeruginosa strain to serve as externalstandards for the real-time PCR. The DCT methodwas applied at each time point (Briand et al., 2008a),and an equation was deduced from the DCT valuestheoretically calculated for proportions of MC-producing strain corresponding to 100%, 50%,25% and 12.5% of the population: y¼ a log(x)�b,where y is the DCT and x is the initial percentage ofMC-producing strain.
Table 2 Regression equations for the PC and mcyB genes and values of DCT
Microcystis strain Regression equation for the PC gene Regression equation for the mcyB gene DCT
PCC 7806 y¼�3.09� log (x)+29.25 y¼�3.35� log (x)+32.02 �2.77(R2¼0.99; n¼ 3; Po10�3) (R2¼0.99; n¼ 3; Po10�3)
PCC 7813 y¼�3.03� log (x)+28.83 y¼�3.09� log (x)+30.97 �2.14(R2¼0.99; n¼ 4; Po10�4) (R2¼0.99; n¼ 4; Po10�4)
PCC 7820 y¼�2.91� log (x)+27.31 y¼�2.96� log (x)+29.30 �1.99(R2¼0.99; n¼ 5; Po10�4) (R2¼0.99; n¼ 5; Po10�4)
PCC 7941 y¼�3.06� log (x)+28.82 y¼�3.17� log (x)+30.66 �1.84(R2¼0.99; n¼ 3; Po10�3) (R2¼0.99; n¼ 3; Po10�3)
PCC 9354 y¼�2.98� log (x)+28.37 y¼�3.13� log (x)+30.64 �2.27(R2¼0.99; n¼ 3; Po10�3) (R2¼0.99; n¼ 3; Po10�3)
PCC 9355 y¼�2.84� log (x)+27.82 y¼�2.90� log (x)+29.85 �2.03(R2¼0.99; n¼ 4; Po10�4) (R2¼0.99; n¼ 4; Po10�4)
PCC 9443 y¼�3.02� log (x)+28.82 y¼�3.00� log (x)+30.42 �1.60(R2¼0.99; n¼ 3; Po10�3) (R2¼0.99; n¼ 3; Po10�3)
PCC 9808 y¼�2.61� log (x)+29.03 y¼�2.73� log (x)+31.49 �2.46(R2¼0.97; n¼ 3; Po10�3) (R2¼0.97; n¼ 3; Po10�3)
Mean DCT �2.14
Abbreviation: PC, phycocyanin.The regression equations were based on predetermined DNA concentrations of MC-producing Microcystis strains, where y is the CT value and x isthe starting concentrations of DNA (in pg).
Genetic diversity in a Microcystis populationE Briand et al
422
The ISME Journal
Results
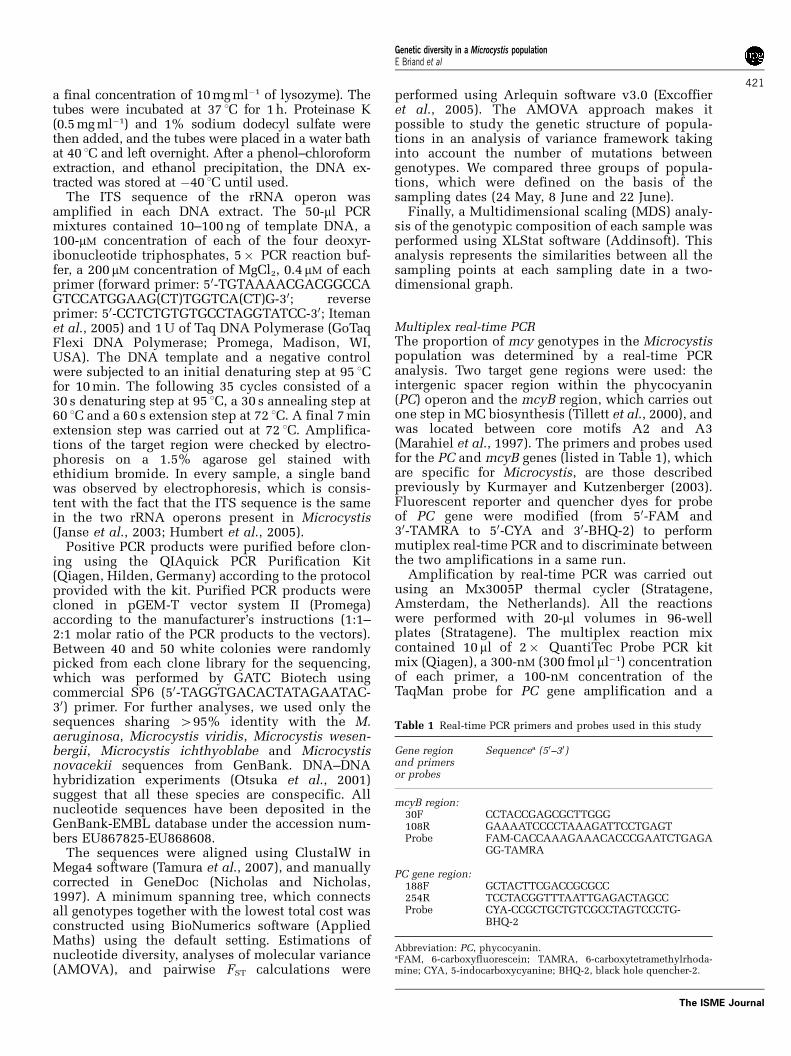
Variations in the abundance of M. aeruginosa in theGrangent reservoirThroughout the survey, the sites located in theupstream part of the Grangent reservoir (for example
Revotes and Chatelet) were always characterized bylow M. aeruginosa cell densities (o1.6� 106 cells l�1),and most of the highest Microcystis cell numbersoccurred in the middle and downstream parts of thereservoir (Figure 3). The M. aeruginosa bloom beganto develop in early May at the Lizeron sampling
-6
-4
-2
0
14
16
18
20
22
0 25 50 10075 0 25 50 10075mcyB+ genotype (%)
CT
val
ue
CT mcyB CT PC
? C
T =
-4.
98
? C
T =
-3.
92
? C
T =
-3
? C
T =
-2.
40
? C
T =
-2.
02
mcyB+ genotype (%)
14
19
24
29
34
39
1.E-02 1.E+00 1.E+011.E-01 1.E+02 1.E+041.E+03 1.E+05
DNA quantity (pg)
PC mcyB
y = 3.27 log (x) -8.53R2 = 0.99; n = 4; P < 10-4
y = -3.09 log (x) + 30.97R2 = 0.99; n = 4; P < 10-4
y = -3.03 log (x) + 28.83R2= 0.99; n = 4; P < 10-4
Cal
cula
ted
CT
val
ue
Cal
cula
ted
CT
val
ue
1 2
Figure 2 (a) Example of the standard curves for the mcyB (black circles) and phycocyanin (PC; gray squares) genes based onpredetermined concentrations of DNA of the microcystin (MC)-producing Microcystis strain PCC 7813 amplified by multiplex real-timePCR. (b1) Example of CT numbers obtained for the mcyB (black circles) and PC (gray squares) genes amplified by multiplex real-time PCRfrom a mix of MC-producing (PCC 7806), and non-MC-producing (PCC 9806) Microcystis strains. (b2) The DCT was calculated for eachmix, and the DCT equation was obtained by relating the calculated DCT to the percentage of cells with mcyB genotype. The error barsindicate standard deviations (n¼4).
Barrage
Camaldules
Anse
Lizeron
Chatelet
Revotes
August 01April 18 May 09 May 24 June 08 June 22 July 05 July 18
Downstream
Upstream
0 -
0.63
.106
0.63
.106 -
2.5
.106
2.5.
106 -
20.
106
140.
106 -
170
.106
20.1
06 - 4
0.10
6
40.1
06 - 6
0.10
6
60.1
06 - 8
0.10
6
80.1
06 - 1
00.1
06
100.
106
- 12
0.10
6
120.
106
- 14
0.10
6
Figure 3 Spatiotemporal changes in the Microcystis cell density (number of cells l�1) in the Grangent reservoir.
Genetic diversity in a Microcystis populationE Briand et al
423
The ISME Journal
point, which is located in the middle part of theGrangent reservoir (there was a rise from 7.4� 103
cells l�1 on 18 April to 1.3� 106 cells l�1 on 9 May).By the end of May, the Microcystis cell densitieswere very similar at all the sampling points. Thefirst cell abundance peak (9.2� 107 cells l�1) wasfound on 8th June, at the Anse sampling point, and asecond peak 15 days later at the Barrage samplingpoint, which is located not far from the dam (celldensity: 18� 107 cells l�1). Two weeks later (5 July),the bloom had declined throughout the reservoir,and cell abundances remained at a very low level forthe rest of the summer.
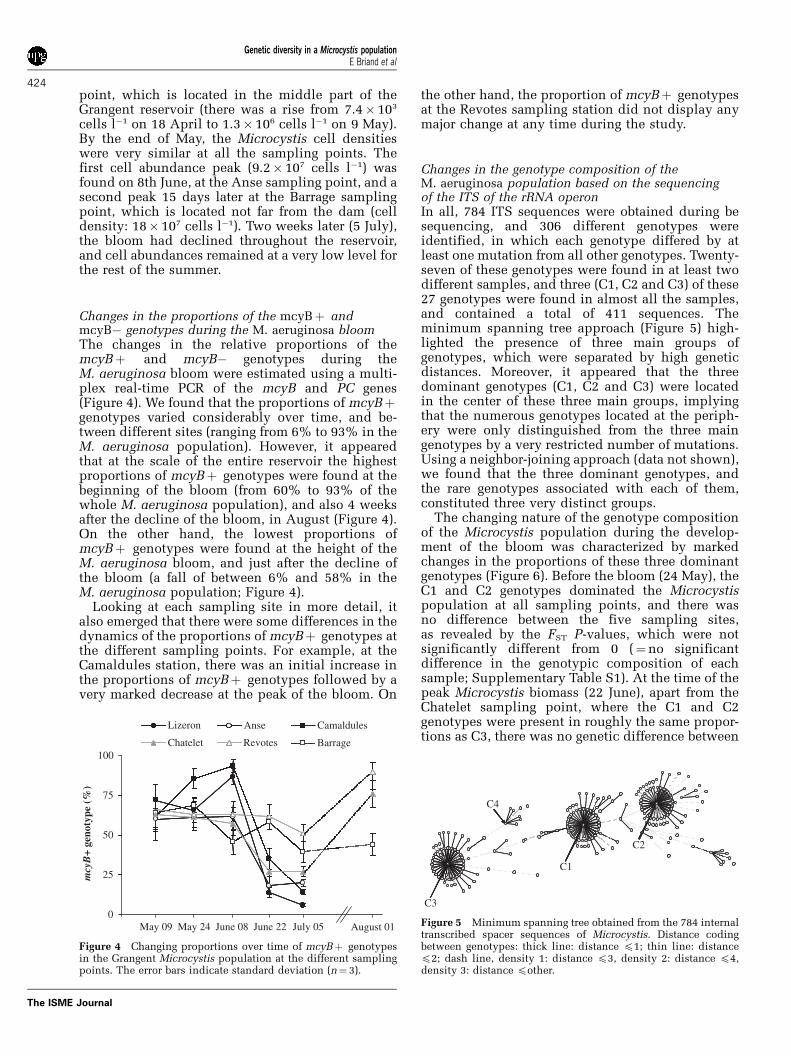
Changes in the proportions of the mcyBþ andmcyB� genotypes during the M. aeruginosa bloomThe changes in the relative proportions of themcyBþ and mcyB� genotypes during theM. aeruginosa bloom were estimated using a multi-plex real-time PCR of the mcyB and PC genes(Figure 4). We found that the proportions of mcyBþgenotypes varied considerably over time, and be-tween different sites (ranging from 6% to 93% in theM. aeruginosa population). However, it appearedthat at the scale of the entire reservoir the highestproportions of mcyBþ genotypes were found at thebeginning of the bloom (from 60% to 93% of thewhole M. aeruginosa population), and also 4 weeksafter the decline of the bloom, in August (Figure 4).On the other hand, the lowest proportions ofmcyBþ genotypes were found at the height of theM. aeruginosa bloom, and just after the decline ofthe bloom (a fall of between 6% and 58% in theM. aeruginosa population; Figure 4).
Looking at each sampling site in more detail, italso emerged that there were some differences in thedynamics of the proportions of mcyBþ genotypes atthe different sampling points. For example, at theCamaldules station, there was an initial increase inthe proportions of mcyBþ genotypes followed by avery marked decrease at the peak of the bloom. On
the other hand, the proportion of mcyBþ genotypesat the Revotes sampling station did not display anymajor change at any time during the study.
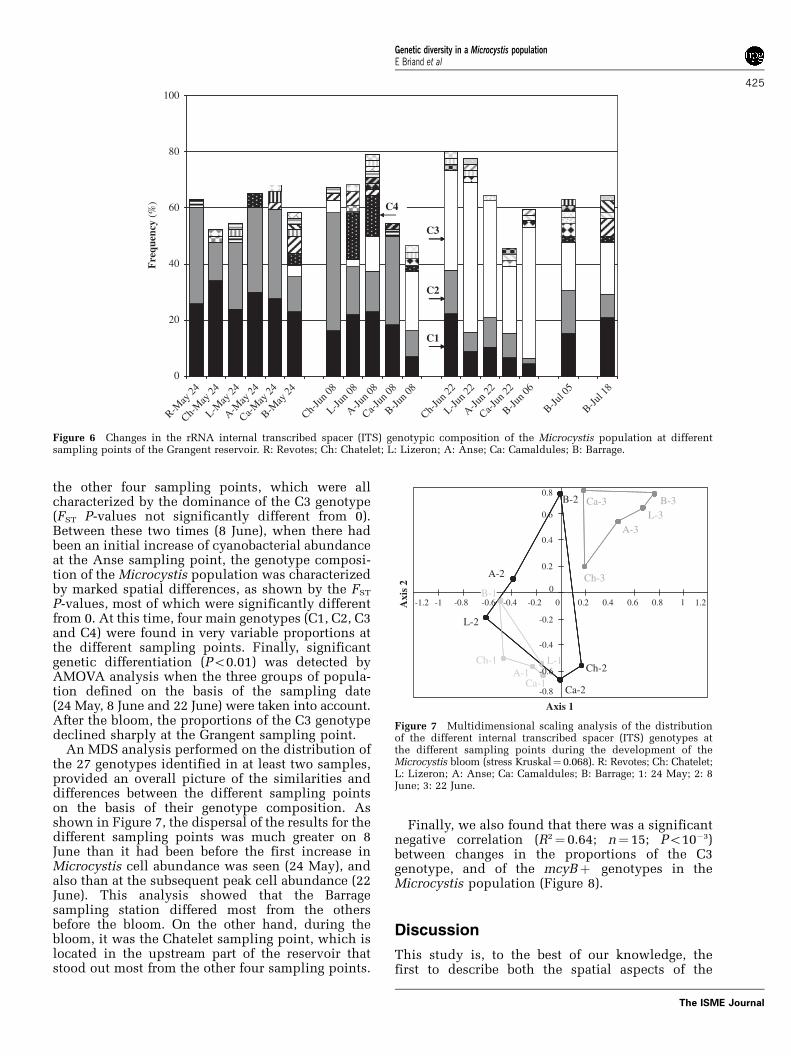
Changes in the genotype composition of theM. aeruginosa population based on the sequencingof the ITS of the rRNA operonIn all, 784 ITS sequences were obtained during besequencing, and 306 different genotypes wereidentified, in which each genotype differed by atleast one mutation from all other genotypes. Twenty-seven of these genotypes were found in at least twodifferent samples, and three (C1, C2 and C3) of these27 genotypes were found in almost all the samples,and contained a total of 411 sequences. Theminimum spanning tree approach (Figure 5) high-lighted the presence of three main groups ofgenotypes, which were separated by high geneticdistances. Moreover, it appeared that the threedominant genotypes (C1, C2 and C3) were locatedin the center of these three main groups, implyingthat the numerous genotypes located at the periph-ery were only distinguished from the three maingenotypes by a very restricted number of mutations.Using a neighbor-joining approach (data not shown),we found that the three dominant genotypes, andthe rare genotypes associated with each of them,constituted three very distinct groups.
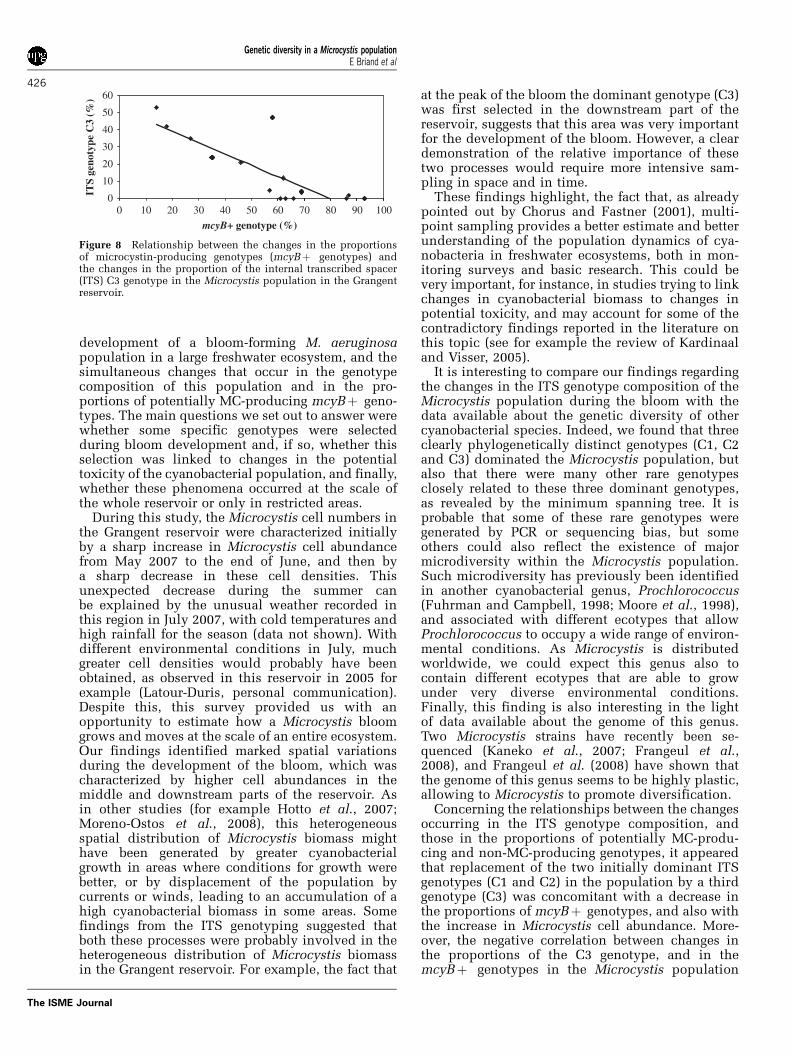
The changing nature of the genotype compositionof the Microcystis population during the develop-ment of the bloom was characterized by markedchanges in the proportions of these three dominantgenotypes (Figure 6). Before the bloom (24 May), theC1 and C2 genotypes dominated the Microcystispopulation at all sampling points, and there wasno difference between the five sampling sites,as revealed by the FST P-values, which were notsignificantly different from 0 (¼no significantdifference in the genotypic composition of eachsample; Supplementary Table S1). At the time of thepeak Microcystis biomass (22 June), apart from theChatelet sampling point, where the C1 and C2genotypes were present in roughly the same propor-tions as C3, there was no genetic difference between
0
25
50
75
100
Lizeron Anse Camaldules
BarrageChatelet Revotes
August 01June 22June 08 July 05May 24May 09
mcy
B+
gen
otyp
e (%
)
Figure 4 Changing proportions over time of mcyBþ genotypesin the Grangent Microcystis population at the different samplingpoints. The error bars indicate standard deviation (n¼ 3).
C3
C1
C2
C4
Figure 5 Minimum spanning tree obtained from the 784 internaltranscribed spacer sequences of Microcystis. Distance codingbetween genotypes: thick line: distance p1; thin line: distancep2; dash line, density 1: distance p3, density 2: distance p4,density 3: distance pother.
Genetic diversity in a Microcystis populationE Briand et al
424
The ISME Journal
the other four sampling points, which were allcharacterized by the dominance of the C3 genotype(FST P-values not significantly different from 0).Between these two times (8 June), when there hadbeen an initial increase of cyanobacterial abundanceat the Anse sampling point, the genotype composi-tion of the Microcystis population was characterizedby marked spatial differences, as shown by the FST
P-values, most of which were significantly differentfrom 0. At this time, four main genotypes (C1, C2, C3and C4) were found in very variable proportions atthe different sampling points. Finally, significantgenetic differentiation (Po0.01) was detected byAMOVA analysis when the three groups of popula-tion defined on the basis of the sampling date(24 May, 8 June and 22 June) were taken into account.After the bloom, the proportions of the C3 genotypedeclined sharply at the Grangent sampling point.
An MDS analysis performed on the distribution ofthe 27 genotypes identified in at least two samples,provided an overall picture of the similarities anddifferences between the different sampling pointson the basis of their genotype composition. Asshown in Figure 7, the dispersal of the results for thedifferent sampling points was much greater on 8June than it had been before the first increase inMicrocystis cell abundance was seen (24 May), andalso than at the subsequent peak cell abundance (22June). This analysis showed that the Barragesampling station differed most from the othersbefore the bloom. On the other hand, during thebloom, it was the Chatelet sampling point, which islocated in the upstream part of the reservoir thatstood out most from the other four sampling points.
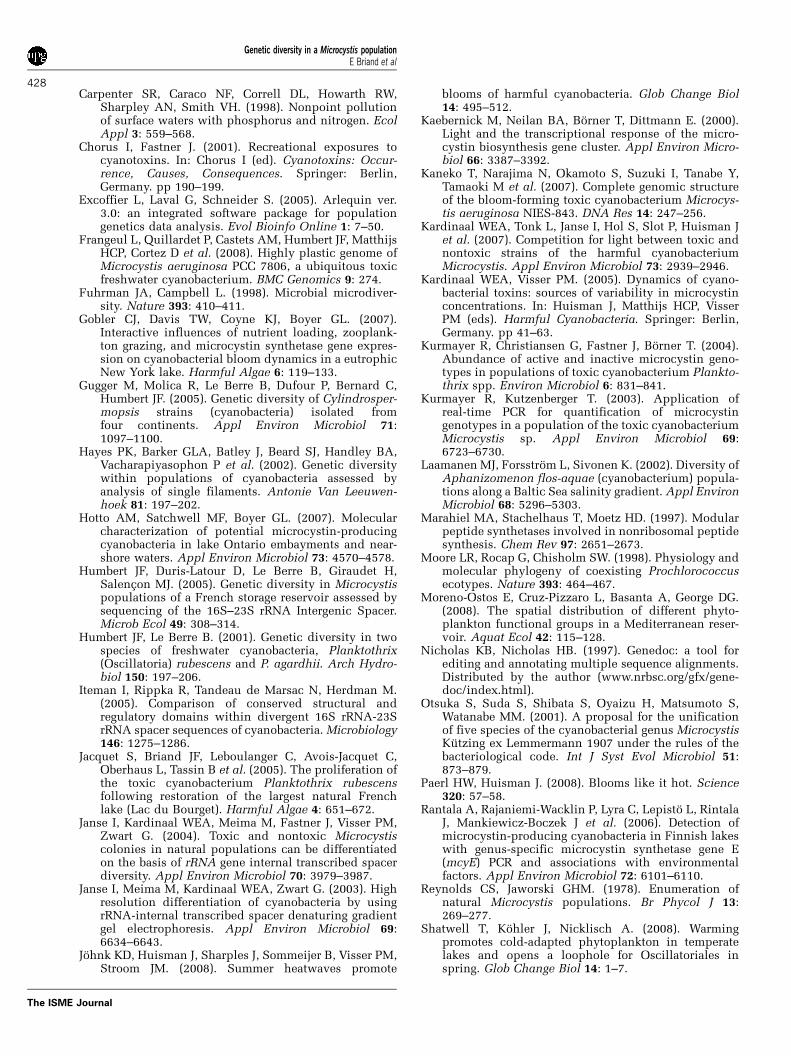
Finally, we also found that there was a significantnegative correlation (R2¼ 0.64; n¼ 15; Po10�3)between changes in the proportions of the C3genotype, and of the mcyBþ genotypes in theMicrocystis population (Figure 8).
Discussion
This study is, to the best of our knowledge, thefirst to describe both the spatial aspects of the
C4C4
20
60
0
40
80
100
C1
C2
C3
C4
Ca-May
24
B-May
24
A-May
24
L-May
24
Ch-M
ay 24
R-May
24
B-Jun 0
8
Ca-Jun
08
A-Jun 0
8
L-Jun 0
8
Ch-Ju
n 08
Ch-Ju
n 22
L-Jun 2
2
A-Jun 2
2
Ca-Jun
22
B-Jul 0
5
B-Jul 1
8
Fre
quen
cy (
%)
B-Jun 0
6
Figure 6 Changes in the rRNA internal transcribed spacer (ITS) genotypic composition of the Microcystis population at differentsampling points of the Grangent reservoir. R: Revotes; Ch: Chatelet; L: Lizeron; A: Anse; Ca: Camaldules; B: Barrage.
Ca-2
Axis 1
Axi
s 2
B-3Ca-3
A-3L-3
Ch-3
B-2
A-2
L-2
Ch-2
B-1
Ca-1A-1
L-1Ch-1
B-10 0.2 0.4 0.6 0.8 1.21-1 -0.8-1.2 -0.6 -0.4 -0.2
-0.8
-0.4
-0.2
-0.6
0
0.2
0.4
0.6
0.8
Figure 7 Multidimensional scaling analysis of the distributionof the different internal transcribed spacer (ITS) genotypes atthe different sampling points during the development of theMicrocystis bloom (stress Kruskal¼ 0.068). R: Revotes; Ch: Chatelet;L: Lizeron; A: Anse; Ca: Camaldules; B: Barrage; 1: 24 May; 2: 8June; 3: 22 June.
Genetic diversity in a Microcystis populationE Briand et al
425
The ISME Journal
development of a bloom-forming M. aeruginosapopulation in a large freshwater ecosystem, and thesimultaneous changes that occur in the genotypecomposition of this population and in the pro-portions of potentially MC-producing mcyBþ geno-types. The main questions we set out to answer werewhether some specific genotypes were selectedduring bloom development and, if so, whether thisselection was linked to changes in the potentialtoxicity of the cyanobacterial population, and finally,whether these phenomena occurred at the scale ofthe whole reservoir or only in restricted areas.
During this study, the Microcystis cell numbers inthe Grangent reservoir were characterized initiallyby a sharp increase in Microcystis cell abundancefrom May 2007 to the end of June, and then bya sharp decrease in these cell densities. Thisunexpected decrease during the summer canbe explained by the unusual weather recorded inthis region in July 2007, with cold temperatures andhigh rainfall for the season (data not shown). Withdifferent environmental conditions in July, muchgreater cell densities would probably have beenobtained, as observed in this reservoir in 2005 forexample (Latour-Duris, personal communication).Despite this, this survey provided us with anopportunity to estimate how a Microcystis bloomgrows and moves at the scale of an entire ecosystem.Our findings identified marked spatial variationsduring the development of the bloom, which wascharacterized by higher cell abundances in themiddle and downstream parts of the reservoir. Asin other studies (for example Hotto et al., 2007;Moreno-Ostos et al., 2008), this heterogeneousspatial distribution of Microcystis biomass mighthave been generated by greater cyanobacterialgrowth in areas where conditions for growth werebetter, or by displacement of the population bycurrents or winds, leading to an accumulation of ahigh cyanobacterial biomass in some areas. Somefindings from the ITS genotyping suggested thatboth these processes were probably involved in theheterogeneous distribution of Microcystis biomassin the Grangent reservoir. For example, the fact that
at the peak of the bloom the dominant genotype (C3)was first selected in the downstream part of thereservoir, suggests that this area was very importantfor the development of the bloom. However, a cleardemonstration of the relative importance of thesetwo processes would require more intensive sam-pling in space and in time.
These findings highlight, the fact that, as alreadypointed out by Chorus and Fastner (2001), multi-point sampling provides a better estimate and betterunderstanding of the population dynamics of cya-nobacteria in freshwater ecosystems, both in mon-itoring surveys and basic research. This could bevery important, for instance, in studies trying to linkchanges in cyanobacterial biomass to changes inpotential toxicity, and may account for some of thecontradictory findings reported in the literature onthis topic (see for example the review of Kardinaaland Visser, 2005).
It is interesting to compare our findings regardingthe changes in the ITS genotype composition of theMicrocystis population during the bloom with thedata available about the genetic diversity of othercyanobacterial species. Indeed, we found that threeclearly phylogenetically distinct genotypes (C1, C2and C3) dominated the Microcystis population, butalso that there were many other rare genotypesclosely related to these three dominant genotypes,as revealed by the minimum spanning tree. It isprobable that some of these rare genotypes weregenerated by PCR or sequencing bias, but someothers could also reflect the existence of majormicrodiversity within the Microcystis population.Such microdiversity has previously been identifiedin another cyanobacterial genus, Prochlorococcus(Fuhrman and Campbell, 1998; Moore et al., 1998),and associated with different ecotypes that allowProchlorococcus to occupy a wide range of environ-mental conditions. As Microcystis is distributedworldwide, we could expect this genus also tocontain different ecotypes that are able to growunder very diverse environmental conditions.Finally, this finding is also interesting in the lightof data available about the genome of this genus.Two Microcystis strains have recently been se-quenced (Kaneko et al., 2007; Frangeul et al.,2008), and Frangeul et al. (2008) have shown thatthe genome of this genus seems to be highly plastic,allowing to Microcystis to promote diversification.
Concerning the relationships between the changesoccurring in the ITS genotype composition, andthose in the proportions of potentially MC-produ-cing and non-MC-producing genotypes, it appearedthat replacement of the two initially dominant ITSgenotypes (C1 and C2) in the population by a thirdgenotype (C3) was concomitant with a decrease inthe proportions of mcyBþ genotypes, and also withthe increase in Microcystis cell abundance. More-over, the negative correlation between changes inthe proportions of the C3 genotype, and in themcyBþ genotypes in the Microcystis population
0
10
20
30
40
50
60
0 10 20 30 40 50 60 70 80 90 100
mcyB+ genotype (%)
ITS
geno
type
C3
(%)
Figure 8 Relationship between the changes in the proportionsof microcystin-producing genotypes (mcyBþ genotypes) andthe changes in the proportion of the internal transcribed spacer(ITS) C3 genotype in the Microcystis population in the Grangentreservoir.
Genetic diversity in a Microcystis populationE Briand et al
426
The ISME Journal

suggests that the ITS C1 and C2 genotypes, whichwere dominant before the bloom, were possiblymcyBþ genotypes. These findings also suggest that,under environmental conditions favorable for cya-nobacterial growth, the ITS C3 genotype displayedgreater fitness than the other ITS genotypes, and thatthis C3 genotype may have been a mcyB� genotype.This association between the ITS genotypes andtheir potential ability to produce MCs is consistentwith the paper of Janse et al. (2004), whichdemonstrated a close link between the ITS genotypeof several Microcystis colonies and their ability toproduce MCs. Some differences were found betweenthe different sampling sites in the evolution of theproportions of mcyBþ genotypes in the Microcystispopulation. We are not able to provide anygood explanation for these differences, but we thinkthat it is more interesting to take into account theoverall change in proportions, to minimize allthe sources of bias (from sampling to real-timePCR) that could have influenced the estimation ofthese values.
The fact that favorable environmental conditionsfor Microcystis growth seems to lead to the selectionof non-toxic genotypes is consistent with fieldsurvey data showing a negative relationship be-tween the cyanobacterial biomass and the averageMC cell content during the development of cyano-bacterial blooms (for example Kardinaal and Visser,2005), and also with the recent paper of Briand et al.(2008a) demonstrating a negative correlationbetween the cell abundance and the proportionof potentially MC-producing genotypes during aP. agardhii bloom. Moreover, two experimental stu-dies have recently demonstrated for M. aeruginosa(Kardinaal et al., 2007) and P. agardhii (Briand et al.,2008b), respectively, that under environmental con-ditions favorable for cyanobacterial growth, thefitness of non-MC-producing strains was greaterthan that of MC-producing ones.
In this paper we did not set out to investigate whathappens after the bloom in the Microcystis popula-tion, but our data do shed some light on this. Thefirst finding is that after the decrease in Microcystisabundance (July 2007), the proportions of toxicgenotypes initially remained unchanged, beforeincreasing to reach the same level as before thebloom there also appeared to be a concomitantdecrease in the proportion of the ITS C3 genotype,and an increase in that of the C1 and C2 genotypes,which is consistent with the increase in theproportions of mcyBþ genotypes after the bloom.These initial findings seem to indicate that themortality of Microcystis cells was higher among cellswith the C3 genotype than among those with the C1and C2 genotypes. This confirms that under un-favorable conditions for cyanobacterial growth,potentially MC-producing genotypes may havegreater fitness than non-MC-producing ones, aspreviously reported for P. agardhii (Briand et al.,2008a, b).
To conclude, in addition to providing someanswers to our initial questions concerning thespatial development of a bloom in a large reservoir,and the changes occurring in the genotypic compo-sition during the course of the bloom, this studyalso provides new evidence that MC-producingand non-MC-producing cyanobacterial cells maydisplay different fitness depending on the environ-mental conditions. The high proportions of MC-producing genotypes found before and after thebloom, when conditions for growth were notoptimal, and conversely, their decrease during thebloom, when environmental conditions favoredcyanobacterial growth, suggest that the benefits ofproducing MCs are particularly great under envir-onmental conditions that limit cell growth. How-ever, it also suggests that the cost of the MCproduction outweighs its benefits when environ-mental conditions promote good cyanobacterialgrowth.
Acknowledgements
We would like to thank Pierre Sauvignet for technicalassistance in sampling. Monika Ghosh is acknowledgedfor improving the English version of the article. This workwas supported by two ANR research programs (PRECODD:project Proliphyc; SEST: project Matrics).
References
Barker GLA, Konopka A, Handley BA, Hayes PK. (2000).Genetic variation in Aphanizomenon (cyanobacteria)colonies from the Baltic Sea and North America.J Phycol 36: 947–950.
Berthon JL, Devaux J, Aleya L, Giraudet H, Restituito F.(1996). Determinisme de l’eutrophisation de la retenuede Grangent (Loire): etude des apports en nutriments,de la dynamique des populations phytoplanctoniqueset des relations phyto-zooplancton en 1990–1991.Hydroecol Appl 8: 99–125.
Bittencourt-Oliveira MC, Cabral de Oliveira M, Bolch CJS.(2001). Genetic variability of Brazilian strains ofthe Microcystis aeruginosa complex (cyanobacteria/cyanophyceae) using the phycocyanin intergenicspacer and flanking regions (cpcBA). J Phycol 37:810–818.
Briand E, Gugger M, Francois JC, Bernard C, Humbert JF,Quiblier C. (2008a). Temporal variations in thedynamics of potentially microcystin-producing strainsin a bloom-forming Planktothrix agardhii (cyanobac-teria) population. Appl Environ Microbiol 74:3839–3848.
Briand E, Yepremian C, Humbert JF, Quiblier C. (2008b).Competition between microcystin- and non-microcys-tin-producing Planktothrix agardhii (cyanobacteria)strains under different environmental conditions.Environ Microbiol 10: 3337–3348.
Catherine A, Quiblier C, Yepremian C, Got P, Groleau A,Vincon-Leite B et al. (2008). Collapse of a Planktothrixagardhii perennial bloom and microcystin dynamicsin response to reduced phosphate concentrations in atemperate lake. FEMS Microbiol Ecol 65: 61–73.
Genetic diversity in a Microcystis populationE Briand et al
427
The ISME Journal
Carpenter SR, Caraco NF, Correll DL, Howarth RW,Sharpley AN, Smith VH. (1998). Nonpoint pollutionof surface waters with phosphorus and nitrogen. EcolAppl 3: 559–568.
Chorus I, Fastner J. (2001). Recreational exposures tocyanotoxins. In: Chorus I (ed). Cyanotoxins: Occur-rence, Causes, Consequences. Springer: Berlin,Germany. pp 190–199.
Excoffier L, Laval G, Schneider S. (2005). Arlequin ver.3.0: an integrated software package for populationgenetics data analysis. Evol Bioinfo Online 1: 7–50.
Frangeul L, Quillardet P, Castets AM, Humbert JF, MatthijsHCP, Cortez D et al. (2008). Highly plastic genome ofMicrocystis aeruginosa PCC 7806, a ubiquitous toxicfreshwater cyanobacterium. BMC Genomics 9: 274.
Fuhrman JA, Campbell L. (1998). Microbial microdiver-sity. Nature 393: 410–411.
Gobler CJ, Davis TW, Coyne KJ, Boyer GL. (2007).Interactive influences of nutrient loading, zooplank-ton grazing, and microcystin synthetase gene expres-sion on cyanobacterial bloom dynamics in a eutrophicNew York lake. Harmful Algae 6: 119–133.
Gugger M, Molica R, Le Berre B, Dufour P, Bernard C,Humbert JF. (2005). Genetic diversity of Cylindrosper-mopsis strains (cyanobacteria) isolated fromfour continents. Appl Environ Microbiol 71:1097–1100.
Hayes PK, Barker GLA, Batley J, Beard SJ, Handley BA,Vacharapiyasophon P et al. (2002). Genetic diversitywithin populations of cyanobacteria assessed byanalysis of single filaments. Antonie Van Leeuwen-hoek 81: 197–202.
Hotto AM, Satchwell MF, Boyer GL. (2007). Molecularcharacterization of potential microcystin-producingcyanobacteria in lake Ontario embayments and near-shore waters. Appl Environ Microbiol 73: 4570–4578.
Humbert JF, Duris-Latour D, Le Berre B, Giraudet H,Salencon MJ. (2005). Genetic diversity in Microcystispopulations of a French storage reservoir assessed bysequencing of the 16S–23S rRNA Intergenic Spacer.Microb Ecol 49: 308–314.
Humbert JF, Le Berre B. (2001). Genetic diversity in twospecies of freshwater cyanobacteria, Planktothrix(Oscillatoria) rubescens and P. agardhii. Arch Hydro-biol 150: 197–206.
Iteman I, Rippka R, Tandeau de Marsac N, Herdman M.(2005). Comparison of conserved structural andregulatory domains within divergent 16S rRNA-23SrRNA spacer sequences of cyanobacteria. Microbiology146: 1275–1286.
Jacquet S, Briand JF, Leboulanger C, Avois-Jacquet C,Oberhaus L, Tassin B et al. (2005). The proliferation ofthe toxic cyanobacterium Planktothrix rubescensfollowing restoration of the largest natural Frenchlake (Lac du Bourget). Harmful Algae 4: 651–672.
Janse I, Kardinaal WEA, Meima M, Fastner J, Visser PM,Zwart G. (2004). Toxic and nontoxic Microcystiscolonies in natural populations can be differentiatedon the basis of rRNA gene internal transcribed spacerdiversity. Appl Environ Microbiol 70: 3979–3987.
Janse I, Meima M, Kardinaal WEA, Zwart G. (2003). Highresolution differentiation of cyanobacteria by usingrRNA-internal transcribed spacer denaturing gradientgel electrophoresis. Appl Environ Microbiol 69:6634–6643.
Johnk KD, Huisman J, Sharples J, Sommeijer B, Visser PM,Stroom JM. (2008). Summer heatwaves promote
blooms of harmful cyanobacteria. Glob Change Biol14: 495–512.
Kaebernick M, Neilan BA, Borner T, Dittmann E. (2000).Light and the transcriptional response of the micro-cystin biosynthesis gene cluster. Appl Environ Micro-biol 66: 3387–3392.
Kaneko T, Narajima N, Okamoto S, Suzuki I, Tanabe Y,Tamaoki M et al. (2007). Complete genomic structureof the bloom-forming toxic cyanobacterium Microcys-tis aeruginosa NIES-843. DNA Res 14: 247–256.
Kardinaal WEA, Tonk L, Janse I, Hol S, Slot P, Huisman Jet al. (2007). Competition for light between toxic andnontoxic strains of the harmful cyanobacteriumMicrocystis. Appl Environ Microbiol 73: 2939–2946.
Kardinaal WEA, Visser PM. (2005). Dynamics of cyano-bacterial toxins: sources of variability in microcystinconcentrations. In: Huisman J, Matthijs HCP, VisserPM (eds). Harmful Cyanobacteria. Springer: Berlin,Germany. pp 41–63.
Kurmayer R, Christiansen G, Fastner J, Borner T. (2004).Abundance of active and inactive microcystin geno-types in populations of toxic cyanobacterium Plankto-thrix spp. Environ Microbiol 6: 831–841.
Kurmayer R, Kutzenberger T. (2003). Application ofreal-time PCR for quantification of microcystingenotypes in a population of the toxic cyanobacteriumMicrocystis sp. Appl Environ Microbiol 69:6723–6730.
Laamanen MJ, Forsstrom L, Sivonen K. (2002). Diversity ofAphanizomenon flos-aquae (cyanobacterium) popula-tions along a Baltic Sea salinity gradient. Appl EnvironMicrobiol 68: 5296–5303.
Marahiel MA, Stachelhaus T, Moetz HD. (1997). Modularpeptide synthetases involved in nonribosomal peptidesynthesis. Chem Rev 97: 2651–2673.
Moore LR, Rocap G, Chisholm SW. (1998). Physiology andmolecular phylogeny of coexisting Prochlorococcusecotypes. Nature 393: 464–467.
Moreno-Ostos E, Cruz-Pizzaro L, Basanta A, George DG.(2008). The spatial distribution of different phyto-plankton functional groups in a Mediterranean reser-voir. Aquat Ecol 42: 115–128.
Nicholas KB, Nicholas HB. (1997). Genedoc: a tool forediting and annotating multiple sequence alignments.Distributed by the author (www.nrbsc.org/gfx/gene-doc/index.html).
Otsuka S, Suda S, Shibata S, Oyaizu H, Matsumoto S,Watanabe MM. (2001). A proposal for the unificationof five species of the cyanobacterial genus MicrocystisKutzing ex Lemmermann 1907 under the rules of thebacteriological code. Int J Syst Evol Microbiol 51:873–879.
Paerl HW, Huisman J. (2008). Blooms like it hot. Science320: 57–58.
Rantala A, Rajaniemi-Wacklin P, Lyra C, Lepisto L, RintalaJ, Mankiewicz-Boczek J et al. (2006). Detection ofmicrocystin-producing cyanobacteria in Finnish lakeswith genus-specific microcystin synthetase gene E(mcyE) PCR and associations with environmentalfactors. Appl Environ Microbiol 72: 6101–6110.
Reynolds CS, Jaworski GHM. (1978). Enumeration ofnatural Microcystis populations. Br Phycol J 13:269–277.
Shatwell T, Kohler J, Nicklisch A. (2008). Warmingpromotes cold-adapted phytoplankton in temperatelakes and opens a loophole for Oscillatoriales inspring. Glob Change Biol 14: 1–7.
Genetic diversity in a Microcystis populationE Briand et al
428
The ISME Journal
Sivonen K. (1990). Effect of light, temperature, nitrate,orthophosphate, and bacteria on growth of andhepatotoxin production by Oscillatoria agardhiistrains. Appl Environ Microbiol 56: 2658–2666.
Smith TH, Tilman GD, Nekola JC. (1999). Eutrophication:impacts of excess nutrient inputs on freshwater,marine, and terrestrial ecosystems. Environ Pollut1–3: 179–196.
Tamura K, Dudley J, Nei M, Kumar S. (2007). MEGA4:molecular evolutionary genetics analysis (MEGA)software version 4.0. Mol Biol Evol 24: 1596–1599.
Tanabe Y, Kasai F, Watanabe MM. (2007). Multilocussequence typing (MLST) reveals high genetic diversityand clonal population structure of the toxic cyano-bacterium Microcystis aeruginosa. Microbiol 153:3695–3703.
Tillett D, Dittmann E, Erhard M, von Dohren H, Borner T,Neilan BA. (2000). Structural organization ofmicrocystin biosynthesis in Microcystis aeruginosa
PCC7806: an integrated peptide–polyketide synthetasesystem. Chem Biol 7: 753–764.
Vaitomaa J, Rantala A, Halinen K, Rouhiainen L, TallbergP, Mokelke L et al. (2003). Quantitative real-time PCRfor determinationof microcystin synthetase E copynumbers for Microcystis and Anabaenain lakes. ApplEnviron Microbiol 69: 7289–7297.
Wiedner C, Nixdorf B, Heinz R, Wirsing B, Neumann U,Weckesser J. (2002). Regulation of cyanobacteria andmicrocystin dynamics in polymictic shallow lakes.Arch Hydrobiol 155: 383–400.
Wiedner C, Visser PM, Fastner J, Metcalf JS, Codd GA,Mur LR. (2003). Effects of light on the microcystincontent of Microcystis strainPCC 7806. Appl EnvironMicrobiol 69: 1475–1481.
Wilson AE, Sarnelle O, Neilan BA, Salmon TP, GehringerMM, Hay ME. (2005). Genetic variation of the bloom-forming cyanobacterium Microcystis aeruginosa with-in and among lakes: implications for harmful algalblooms. Appl Environ Microbiol 71: 6126–6133.
Supplementary Information accompanies the paper on The ISME Journal website (http://www.nature.com/ismej)
Genetic diversity in a Microcystis populationE Briand et al
429
The ISME Journal