responses of cyanobacteria to herbivorous zooplankton across predator regimes: who mows the bloom?
TRANSCRIPT

Responses of cyanobacteria to herbivorous zooplanktonacross predator regimes: who mows the bloom?
PABLO URRUTIA-CORDERO* ,† , MATTIAS K. EKVALL* AND LARS-ANDERS HANSSON*
*Department of Biology, Lund University, Lund, Sweden†Center for Environmental and Climate Research, Lund University, Lund, Sweden
SUMMARY
1. The massive growth of large, toxic cyanobacteria in eutrophic waters has traditionally been
explained by their evolution of defences to herbivorous zooplankton. These conclusions come mostly
from studies using the large-bodied cladoceran Daphnia as a grazer model. In contrast, very little is
known about the effects of other zooplankters such as copepods and small cladocerans that, unlike
Daphnia, often coexist with cyanobacterial blooms and under high levels of fish predation.
2. We performed a series of grazing experiments during a cyanobacterial bloom in a eutrophic lake,
subject to decreasing predation on zooplankton (removal of cyprinid fish). We also used long-term
observational data to analyse the response of cyanobacteria to changes in abundance, body size and
biomass of the naturally, coexisting zooplankton community across different predator regimes.
3. A natural grazer community, dominated by selective herbivores like calanoid and cyclopoid cope-
pods, positively affected cyanobacterial growth in early summer at low cyanobacterial densities.
However, cyclopoid copepods and small cladocerans suppressed the growth of Anabaena, Microcystis
and Planktothrix species under bloom conditions in late summer, with the exception of the highly
toxic Microcystis botrys.
4. Long-term observational data support the results from the grazing experiments regarding the
potential capacity of the natural zooplankton community to suppress cyanobacterial growth, espe-
cially of the dominant taxon Microcystis (including the most toxic species, M. botrys). In particular,
these results suggest that direct grazing may contribute significantly to the observed 72% decrease in
Microcystis biomass through a 111% increase in abundance of cyclopoid copepods, and an 18%
increase in body size of cyclopoid copepods and a 31% increase in body size of the generalist feeder
Daphnia, during the biomanipulation.
5. Together, these results suggest that, within the complex interactions brought about by trophic cas-
cades, direct grazing by the coexisting zooplankton community is a strong driver regulating cyano-
bacterial growth in eutrophic lakes and that this can display contrasting effects, both seasonally and
under different levels of fish predation. Importantly, we show that herbivory may be enhanced along
a gradient of decreasing fish predation by the combined action of copepods (selective herbivores)
and Daphnia (generalist herbivores).
Keywords: copepods, cyanobacteria, herbivory, predation, zooplankton
Introduction
Massive proliferations or ‘blooms’ of potentially toxic
cyanobacteria are common in eutrophic waterbodies and
have been associated with the evolution by these cyano-
bacteria of defences against herbivorous zooplankton
(Hansson et al., 2007a, 2013; Chislock et al., 2013a). The
large size and specific morphology (single cells aggre-
gated in filaments or colonies) of cyanobacteria may
provide resistance against herbivorous zooplankton
(Wilson, Sarnelle & Tillmanns, 2006). In addition, cyano-
bacteria may also produce toxic metabolites and possess
Correspondence: Pablo Urrutia-Cordero, Department of Biology, Lund University, Ecology building, SE-223 62 Lund, Sweden.
E-mail: [email protected]
960 © 2015 John Wiley & Sons Ltd
Freshwater Biology (2015) 60, 960–972 doi:10.1111/fwb.12555

low nutritional values reducing the growth and fitness
of herbivore communities (Brett & Muller-Navarra, 1997;
Hansson et al., 2007a; Urrutia-Cordero et al., 2013).
The understanding of zooplankton–cyanobacteria
interactions has mainly been obtained from laboratory
and field studies with the generalist cladoceran grazer
Daphnia (Wilson et al., 2006; Chislock et al., 2013a; Ger,
Hansson & L€urling, 2014). However, fish predation on
zooplankton is generally intense in eutrophic waters and
smaller-bodied zooplankton, such as copepods and
small cladocerans, tend to dominate plankton communi-
ties in these ecosystems (Jeppesen et al., 2000). Of spe-
cific interest is the impact of selective herbivores like
copepods, which have shown contrasting effects on
cyanobacterial growth depending on cyanobacterial tox-
icity or presence of alternative food in laboratory sys-
tems (Kurmayer & Juttner, 1999; Ger et al., 2010; Ger,
Panosso & Lurling, 2011), but for which evidence under
natural conditions is still lacking (Ger, Hansson &
L€urling, 2014). Therefore, focusing solely on Daphnia is
an over-generalisation that ignores the most common
zooplankton–cyanobacteria interactions and hinders pre-
dictions about bloom dynamics in natural environments
(Ger, Hansson & L€urling, 2014).
There is mounting evidence that increased herbivore
pressure on cyanobacteria, via changes in zooplankton
community structure (abundance or size spectrum), can
be achieved through alterations at higher trophic levels,
by the deliberate removal of planktivorous fish, enhance-
ment of piscivorous communities or natural massive
‘fish kills’ (Shapiro, Lamarra & Lynch, 1975; Hansson
et al., 1998). The effects of such trophic cascades seem to
depend greatly on the recovery of large-bodied Daphnia,
which have higher grazing rates and feed on a wider
size range of algae than smaller-bodied zooplankters
(Burns, 1968; Lacerot et al., 2013). However, still very lit-
tle is known about the potential impact of top-down
forces on phytoplankton communities through control of
different herbivore traits of other zooplankton communi-
ties that typically coexist with cyanobacterial blooms
(Hansson et al., 1998; Ger, Hansson & L€urling, 2014).
Similarly, only few studies have focused on sufficiently
extensive periods to assess zooplankton–cyanobacteria
interactions throughout the entire duration of cyanobac-
terial blooms (Ger, Hansson & L€urling, 2014).
We performed a series of grazing experiments to
quantify the seasonal response of cyanobacteria to graz-
ing by the naturally occurring herbivore community in a
eutrophic lake, subject to long-term fish removal (bioma-
nipulation). These experimental data were combined
with a long-term observational data set to investigate
the impact of herbivorous zooplankton on cyanobacterial
blooms across different levels of fish predation. The
effects of trophic cascades on plankton communities are
complex and system-dependent (Carpenter et al., 2011),
but to disentangle the relative contribution of other driv-
ers from the impacts of direct grazing on cyanobacteria
is beyond the scope of this study. Instead, we here focus
on evaluating whether (1) the grazing impacts of the
naturally occurring zooplankton community on cyano-
bacterial growth differ seasonally at different phyto-
plankton and zooplankton community structures, (2)
whether alterations at higher trophic levels (cyprinid fish
removal) may influence cyanobacterial bloom dynamics
by altering critical herbivore traits of the coexisting zoo-
plankton community (abundance, body size and bio-
mass) and, finally (3), whether results from experimental
tests performed under natural conditions are consistent
with long-term field observations.
Methods
Study site and lake monitoring
Lake Ringsj€on is a eutrophic lake consisting of three con-
nected basins located in Scania, southern Sweden. The
lake became eutrophic in the 1960s and 1970s, since
when there have been regular blooms of potentially
toxic cyanobacterial taxa such as Anabaena, Aphanizome-
non, Microcystis and Planktothrix (Cronberg, Annadotter
& Lawton, 1999). Since the beginning of the 1980s, a
strong control of the external input of nutrients has been
applied, reducing phosphorus loading from more than
30 tonnes to 5–10 tonnes per year. Additionally, since
2005, the lake has been subject to higher trophic level
manipulations in the form of removal of cyprinid fish,
mainly targeting roach (Rutilus rutilus) and bream (Abr-
amis brama). Therefore, chemical variables (phosphorus,
nitrogen, chlorophyll-a and Secchi depth) and major
zooplankton and cyanoabcterial taxa have been moni-
tored since 2000 in the western basin of Lake Rinsgsj€on
(Table 1; see more about the biomanipulation pro-
gramme at the website: http://www.ringsjon.se).
Grazing experiments
Three grazing experiments were performed in the wes-
tern basin of Lake Ringsj€on in June, July and August
2012. These experiments were based on the standard
method described by Lehman & Sandgren (1985), which
has subsequently been used by many others in both field
and laboratory experiments (Bergquist & Carpenter,
© 2015 John Wiley & Sons Ltd, Freshwater Biology, 60, 960–972
Zooplankton herbivory on cyanobacteria 961

1986; Vanni & Temte, 1990; Hansson, 1996; Hansson
et al., 2007b; Lebret et al., 2012). This method is similar
to a serial dilution study commonly used to quantify
zooplankton grazing (Landry & Hassett, 1982). Each
experiment was performed in six 10-L transparent plas-
tic containers, which were previously acid-washed with
a 10% HCL solution. The containers were sealed and
were placed 1 m apart in line in the surface water of the
lake using weights, ropes and buoys. There was no
source of nutrients entering or leaving the containers,
which were equally exposed to the same natural temper-
ature and light climate as in the lake.
The six 10-L plastic containers were filled with 9 L of
filtered (150-lm mesh) lake water, containing the natural
phytoplankton community in the lake without grazers
larger than 150 lm in body size (Table 2). The zooplank-
ton collected on the 150-lm mesh were pooled into a
bucket and subsequently added to the six containers to
create a natural grazer gradient of 0.25, 0.5, 1, 2, 4 and 6
times the amount of zooplankton in the lake (Table 2).
The amount of phytoplankton larger than 150 lmretained on the mesh was negligible, so the methods
used did not entail major changes between the phyto-
plankton community structure in the lake and in the
containers. This then allowed the study of algal growth
responses to grazing by creating a non-replicated gradi-
ent of zooplankton biomass. Although the 150-lm mesh
does not remove grazers smaller than 150 lm, their
abundances remained the same across all the enclosures
and changes in algal net growth rates can therefore only
be attributed to the presence of grazers lager than
150 lm. The containers were incubated for 72 h in the
lake to allow changes in phytoplankton community com-
position, while zooplankton biomass remained similar
and effects from the enclosures were minimal.
Phytoplankton samples were taken before and after
72 h of incubation in the lake according to Lehman &
Sandgren (1985). Zooplankton samples at the end of the
experiment were taken by filtering the entire volume of
the containers through a 150-lm mesh. All plankton
samples were immediately fixed in Lugol’s solution and
stored in a controlled temperature room at 4°C. Cyano-
bacteria (class, genus and species level of taxonomic res-
olution), total green algae and diatoms were counted on
a Olympus CK40 (LRI, Lund, Sweden) inverted micro-
scope, and biomasses were estimated according to Ekv-
all et al. (2013). The maximum length of filaments and
the spherical diameter of colonies were used as proxies
to express the size of each cyanobacterial species. The
abundance of zooplankton taxa (cyclopoid and calanoid
copepods, excluding nauplii; Daphnia; and small cladoc-
erans: mainly Bosmina and Chydorus), was determined
using a stereoscopic microscope (Olympus SZ40) at 920
magnification, and biomasses were estimated using
length–weight regressions according to Dumont, Van-
develde & Dumont (1975) and Bottrell et al. (1976).
Algal responses to grazing were determined by linear
regression analyses (F-test, one-tailed, n = 6) with net
growth rate (r) as the dependent variable (y-axis) and
the fixed increase of zooplankton biomass as the inde-
pendent variable (x-axis) according to Lehman & Sand-
gren (1985). Owing to the seasonal changes in
zooplankton abundances in the lake, this led to different
gradients of zooplankton biomass in each of the experi-
ments (June, July and August). This allowed mimicking
of the natural plankton succession in the lake and inte-
gration of these natural changes into the strength of the
regression analyses for each of the experiments. Net
growth rates (r) were calculated as r = ln(Nt/N0)/Δt,
where N0 and Nt express the biomass (mg L�1) at the
beginning and after the end of the 72-h incubations (rep-
resented by Δt). Since zooplankton can cause negative
(direct grazing) and positive (nutrient recycling) impacts
on the algal community, this method reveals the net
effect of these two (and other) processes on the growth
of each phytoplankton taxon. Thus, negative slopes indi-
cate that algal mortality caused by zooplankton grazing
was greater than any positive effect, and positive slopes
Table 1 Morphological and chemical characteristics of the western
basin of Lake Rinsgj€on. Numbers in brackets are of overall values
for Lake Rinsgj€on including all three basins. Chemical variables are
shown for the period of high fish abundance (2000–2004) and low
fish abundance (2005–2011) created by biomanipulation starting in
2005. Values represent summer means (�SD) including June, July
and August of each assessed year. Bold type indicates significant
differences between the two predator regimes (P < 0.05; Student0st-test, unpaired, one-tailed)
Parameters (unit) Ringsj€on western basin
Morphological
Mean depth (m) 3.1
Maximum depth (m) 5.4
Surface area (km2) 14.8 (40.0)
Catchment area (km2) 24.7 (347.0)
Total volume (mm3) 46.6 (184.2)
Retention time
(years; 1984–1993)0.3 (1.0)
Chemical High fish
abundance
(2000–2004)
Low fish
abundance
(2005–2011)
TP (lg L�1) 97 � 19 69 � 14
TN (lg L�1) 1540 � 221 1250 � 141
Chl-a (lg L�1) 64 � 28 49 � 13
Secchi depth (cm) 71 � 14 91 � 17
© 2015 John Wiley & Sons Ltd, Freshwater Biology, 60, 960–972
962 P. Urrutia-Cordero et al.

indicate that the positive effect from the presence of
grazers compensates for algal mortalities. The slope of
this regression also provides an estimate of the filtering
rate on each algal species (mg algae filtered per lg zoo-
plankton per day). Grazing scores were estimated across
the three grazing experiments to indicate the consistency
and direction of the responses of each phytoplankton
taxon to the natural zooplankton assemblage, calculated
by summation of positive significant (P < 0.05) slopes
(+1), negative significant (P < 0.05) slopes (�1) and no
significant (P > 0.05) relationships (0).
Long-term field study
We investigated the impact of different predator
regimes on the abundance, body size and biomass of
major zooplankton taxa (cyclopoid and calanoid cope-
pods, excluding nauplii; Daphnia; small cladocerans:
mainly Bosmina and Chydorus). Similarly, we studied
changes in biomass of the dominant phytoplankton
groups, that is total cyanobacteria, green algae and dia-
toms, as well as major cyanobacterial taxa (Anabaena,
Aphanizomenon, Planktothrix, Microcystis and dominant
Microcystis species). This was performed by comparing
the period prior to (hereafter named ‘high fish abun-
dance’) and after (hereafter named ‘low fish abundance’)
the start of the biomanipulation in 2005 using an inde-
pendent Student’s t-test (unpaired, one-tailed). Given
the absence of targeted taxa in distinct months of the
monitoring data, we used summer means (June, July
and August) of each year over the period 2000–2011 as
replicates for the analyses. Furthermore, we used the
same data set to investigate the effects of changing zoo-
plankton abundance, body size and biomass, on the bio-
mass of major cyanobacterial taxa (Anabaena,
Aphanizomenon, Microcystis and Planktothrix) through lin-
ear regression analyses (F-test, one-tailed, n = 11).
Counts and biomasses of cyanobacterial and zooplank-
ton taxa were obtained using the methods described
above for the grazing experiments. No monitoring data
were available for 2002 or 2012, and these years were
therefore excluded from the analyses.
Table 2 Zooplankton and cyanobacterial commu-
nities used in the grazing experiments (T0), and
representative of the seasonal community dynam-
ics in Lake Rinsgj€on in 2012. Means (� SD) sizes
and size ranges of zooplankton and cyanobacterial
taxa (n = 30 individuals) are represented by ‘maxi-
mum linear dimensions’ (maximum length of fila-
ments and spherical diameter of colonies) across
the three grazing experiments in June, July and
August. Note that only dominant cyanobacteria
are shown at species level
Biomasses of
zooplankton (lg L�1)
and phytoplankton
taxa (mg L�1)Mean size (lm)
Size range
(lm)
June July August
June–July–August
June–July–August
Zooplankton taxa
Calanoida 33.6 0.2 10.2 638 � 110 390–1274Cyclopoida 31.0 7.9 89.5 598 � 24 359–910Daphnia 15.6 0.3 14.0 585 � 15 306–1107Small cladocerans
(Bosmina and Chydorus)
5.1 9.5 90.2 289 � 4 182–650
Total zooplankton 85.3 17.9 203.9 � �Phytoplankton taxa
Species
Anabaena crassa 0.83 7.19 1.83 70 � 7 20–205Anabaena flos-aquae 0.02 0.11 0.07 43 � 9 15–125Anabaena lemmermanii 0.02 0.08 0.02 44 � 8 20–100Aphanizomenon gracile 0.01 0.11 1.24 110 � 41 10–310Aphanizomenon klebahnii 0.01 0.38 0.80 102 � 6 37–265Microcystis botrys 0.13 0.07 0.19 105 � 8 50–260Microcystis viridis 0.37 0.35 0.94 101 � 7 25–250Microcystis wesenbergii 0.14 0.13 0.59 83 � 11 25–260Planktothrix agardhii 0.01 0.09 2.28 278 � 59 15–655
Genera
Anabaena 0.89 7.90 2.01 � �Aphanizomenon 0.02 0.49 2.04 � �Microcystis 0.65 0.57 1.77 � �Planktothrix 0.01 0.09 2.28 � �Classes
Total cyanobacteria 1.72 11.82 10.40 � �Total green algae 2.59 0.13 0.25 � �Total diatoms 0.51 0.55 4.41 � �
© 2015 John Wiley & Sons Ltd, Freshwater Biology, 60, 960–972
Zooplankton herbivory on cyanobacteria 963

Results
Lake zooplankton and phytoplankton community used in
the grazing experiments
Total biomass of the natural grazer community decreased
considerably from June to July, but recovered in August
reaching a value of above 200 lg L�1 (Table 2). In June,
calanoid and cyclopoid copepods were the dominant
taxa, constituting 39 and 36% of the total zooplankton
biomass, respectively (Table 2). However, while cala-
noids were nearly absent in July and August (1–5%),
cyclopoids comprised around 50% of the total zooplank-
ton biomass, thereby dominating together with small cla-
docerans (Table 2). Daphnia only reached relevant
numbers in June (18%), and abundances were low in July
and August (1–7%) (Table 2). Average body size of the
zooplankton community remained nearly constant
among cyclopoids, Daphnia and small cladocerans from
June to August, but calanoid copepods showed high vari-
ation between months (Table 2). Calanoid copepods were
the largest zooplankters present in the zooplankton com-
munity followed by Daphnia and cyclopoid copepods,
and further by the small cladocerans (Table 2).
Cyanobacteria were scarce in June with a community
dominated by Anabaena and Microcystis, when other
algal competitors, such as green algae and diatoms, were
together present in higher abundances (Table 2). How-
ever, cyanobacteria increased dramatically in July, domi-
nated by the species Anabaena crassa (Table 2), whereas
green algae and diatoms decreased considerably
(Table 2). In August, the cyanobacterial community was
more diverse with Anabaena, Aphanizomenon, Microcystis
and Planktothrix together constituting more than 75% of
the total cyanobacterial biomass (Table 2). The average
size of most cyanobacterial species showed little varia-
tion among months, except for Aphanizomenon gracile
and Planktothrix agardhii (Table 2). However, more varia-
tion was found among species belonging to the same
genus, with the filamentous forms Anabaena flos-aquae
and A. lemmermanii generally smaller than A. crassa
(Table 2). Of the filamentous forms, the species Plankto-
thrix agardhii showed the greatest average length of fila-
ments (Table 2). The colonial cyanobacterium Microcystis
showed little size variation among the three represented
species M. viridis, M. wesenbergii and M. botrys (Table 2).
Grazing experiments
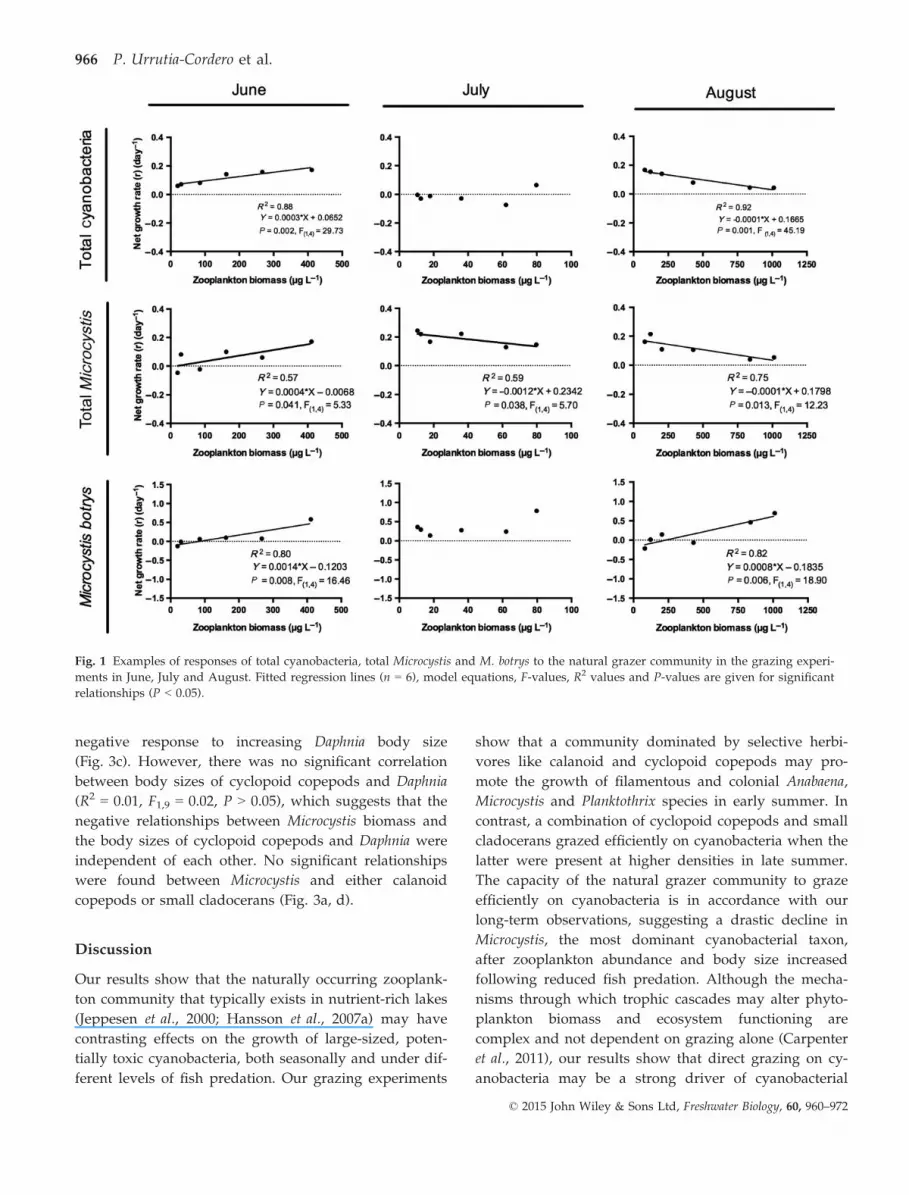
In June, the natural grazer community only affected neg-
atively the net growth rate of Anabaena flos-aquae and
total diatoms (Table 3), while Anabaena crassa, Plankto-
thrix agardhii and Microcystis botrys, together with the
total Microcystis, Planktothrix and cyanobacterial biomass,
showed a positive growth response to increasing grazer
biomass (Fig. 1, Table 3). In July, the growth rate of An-
abaena crassa was also affected positively, while the total
Microcystis biomass and green algae showed a signifi-
cant, negative response to the natural grazer community
(Fig. 1, Table 3). In August, the natural grazers were
able to significantly suppress the net growth rate of
Anabaena crassa, Microcystis viridis, Microcystis wesenbergii
and Planktothrix agardhii, together with the total biomass
of Anabaena, Microcystis, Planktothrix, green algae and
diatoms (Fig. 1, Table 3). As in June, the natural grazer
community stimulated the growth of M. botrys in
August, which was thereby the taxon least vulnerable to
grazing with an overall grazing score of +2 (Table 3).
Long-term field study
In contrast to calanoid copepods (Fig. 2a, b, c), both the
abundance and body size of cyclopoid copepods were
larger under the lower predation regime (Fig. 2a, b).
This led to a drastic increase in cyclopoid copepod bio-
mass during the period of lower predation pressure
(Fig. 2c). Similarly, the size of Daphnia (mostly repre-
sented by Daphnia cucullata) in the lake increased signifi-
cantly (Fig. 2b), although no changes in biomass were
observed due to a slight tendency to decrease in abun-
dance (Fig. 2a, c). The abundance of small cladocerans
was higher under the lower predation regime, although
no changes were observed in body size or biomass
(Fig. 2a, b, c).
Total cyanobacteria decreased considerably during the
period of lower predation pressure (Fig. 2d), while no
changes were observed in green algae and diatoms, the
other most prominent phytoplankton groups in the lake
(Fig. 2d). Although the biomasses of Anabaena, Aphani-
zomenon and Planktothrix did not differ between the two
periods (Fig. 2e), the start of biomanipulation brought
about a drastic decrease in Microcystis biomass (Fig. 2e).
All the three dominant Microcystis species (M. viridis,
M. wesenbergii and M. botrys) showed a highly significant
decrease in biomass under the lower fish predation
regime (Fig. 2e).
Linear regression analyses revealed a negative
response of Microcystis growth to the increase in body
size of cyclopoids (nearly significant, P = 0.056) and,
accordingly, in their biomass (Fig. 3b). No significant
relationship was found between Daphnia abundance and
the biomass of Microcystis (Fig. 3c). Similar to the
response to cyclopoid copepods, Microcystis showed a
© 2015 John Wiley & Sons Ltd, Freshwater Biology, 60, 960–972
964 P. Urrutia-Cordero et al.

Table
3Responsesofcyan
obacteriaat
differentlevelsoftaxonomic
resolution(species,
gen
era,
classes),totaldiatomsan
dgreen
algae
tozo
oplanktongrazingin
each
oftheexperi-
men
tsperform
edin
June,
July
andAugust.Bold
typeasterisks(*)an
ddouble
asterisks(**)
show
significant(P
<0.05
andP<0.01,resp
ectively)linearregressionan
alyses(y-axis:
net
algal
growth
rate,x-axis:zo
oplanktonbiomass;
n=6).Grazingscoresindicatetheconsisten
cyan
ddirectionoftheresp
onsesofcyan
obacteriato
thenaturalzo
oplanktoncommu-
nityacross
allexperim
ents,calculatedas
thesu
mofpositivesignificant(P
<0.05)slopes
(+1),neg
ativesignificantslopes
(�1)
andnosignificantrelationsh
ips(0),resp
ectively.Neg
a-
tiveslopes
andscoresindicatetaxathat
aresu
ppressed
,an
dpositiveslopes
andscorestaxathat
overallben
efitfrom
thegrazerpresence.NS=notsignificantrelationsh
ip
Grazing
score
June
July
August
R2
F-
value
(1,4)
Equation
P-
value
Direction
R2
F-
value
(1,4)
Equation
P-
value
Direction
R2
F-
value
(1,4)
Equation
P-
value
Direction
Species
A.crassa
0.66
7.90
Y=0.00
04*X
+0.08
91
0.024*
+0.55
4.94
Y=0.00
30*X
�0.33
05
0.045*
+0.64
7.22
Y=�0
.000
1*X
+0.13
38
0.028*
�1
A.flos-aqu
ae0.54
4.76
Y=�0
.000
6*X
+0.19
68
0.048*
�0.19
0.96
NS
0.19
1�
0.16
0.76
NS
0.21
7+
�1
A.lemmermanii
0.46
3.41
NS
0.07
0+
0.03
0.14
NS
0.36
2�
0.02
0.08
NS
0.39
3�
0
Aph
.gracile
0.26
1.45
NS
0.14
8�
0.05
0.19
NS
0.34
2�
0.15
0.69
NS
0.22
7�
0
Aph
.klebanhii
0.50
4.02
NS
0.05
8+
0.01
0.02
NS
0.44
6+
0.05
0.22
NS
0.33
2+
0
M.botrys
0.80
16.46
Y=0.00
14*X
�0.12
03
0.008**
+0.42
2.92
NS
0.08
1+
0.82
18.90
Y=0.00
08*X
�0.18
35
0.006**
+2
M.viridis
0.01
0.04
NS
0.43
0�
0.06
0.23
NS
0.32
7�
0.89
31.51
Y=�0
.000
3*X
+0.20
18
0.003**
��1
M.wesenbergii
0.46
3.43
NS
0.06
8+
0.51
4.21
NS
0.05
5�
0.70
9.16
Y=�0
.000
2*X
+0.22
77
0.020*
��1
P.agardh
ii0.66
7.89
Y=0.00
08*X
�0.07
09
0.024*
+0.29
1.61
NS
0.13
7�
0.77
13.71
Y=�0
.000
4*X
+0.25
96
0.011*
�0
Gen
era
Anabaena
0.06
0.24
NS
0.32
4+
0.43
3.05
NS
0.07
8+
0.60
6.11
Y=�0
.000
1*X
+0.11
79
0.035*
��1
Aph
anizom
enon
0.20
1.00
NS
0.18
7+
0.01
0.03
NS
0.43
4+
0.11
0.49
NS
0.26
2�
0
Microcystis
0.57
5.33
Y=0.00
04*X
�0.00
68
0.041*
+0.59
5.70
Y=�0
.001
2*X
+0.23
42
0.038*
�0.75
12.23
Y=�0
.000
1*X
+0.17
98
0.013*
��1
Planktothrix
0.66
7.89
Y=0.00
08*X
�0.07
09
0.024*
+0.29
1.61
NS
0.13
7�
0.77
13.71
Y=�0
.000
4*X
+0.25
96
0.011*
�0
Classes
Cyan
obacteria†
0.88
29.73
Y=0.00
03*X
+0.06
53
0.002**
+0.09
0.39
NS
0.28
2+
0.92
45.19
Y=�0
.000
1*X
+0.16
65
0.001**
�0
Diatoms
0.70
9.43
Y=�0
.000
4*X
�0.00
84
0.018*
�0.88
28.99
NS
0.08
2�
0.91
41.82
Y=�0
.000
2*X
+0.17
60
0.001**
��2
Green
algae
0.46
3.41
NS
0.06
8�
0.42
2.87
Y=�0
.002
6*X
+0.10
48
0.003**
�0.92
47.87
Y=�0
.000
2*X
+0.20
65
0.001**
��2
†Grazingratesontotalcyan
obacteriaad
aptedfrom
Ekvallet
al.(201
4).
© 2015 John Wiley & Sons Ltd, Freshwater Biology, 60, 960–972
Zooplankton herbivory on cyanobacteria 965
negative response to increasing Daphnia body size
(Fig. 3c). However, there was no significant correlation
between body sizes of cyclopoid copepods and Daphnia
(R2 = 0.01, F1,9 = 0.02, P > 0.05), which suggests that the
negative relationships between Microcystis biomass and
the body sizes of cyclopoid copepods and Daphnia were
independent of each other. No significant relationships
were found between Microcystis and either calanoid
copepods or small cladocerans (Fig. 3a, d).
Discussion
Our results show that the naturally occurring zooplank-
ton community that typically exists in nutrient-rich lakes
(Jeppesen et al., 2000; Hansson et al., 2007a) may have
contrasting effects on the growth of large-sized, poten-
tially toxic cyanobacteria, both seasonally and under dif-
ferent levels of fish predation. Our grazing experiments
show that a community dominated by selective herbi-
vores like calanoid and cyclopoid copepods may pro-
mote the growth of filamentous and colonial Anabaena,
Microcystis and Planktothrix species in early summer. In
contrast, a combination of cyclopoid copepods and small
cladocerans grazed efficiently on cyanobacteria when the
latter were present at higher densities in late summer.
The capacity of the natural grazer community to graze
efficiently on cyanobacteria is in accordance with our
long-term observations, suggesting a drastic decline in
Microcystis, the most dominant cyanobacterial taxon,
after zooplankton abundance and body size increased
following reduced fish predation. Although the mecha-
nisms through which trophic cascades may alter phyto-
plankton biomass and ecosystem functioning are
complex and not dependent on grazing alone (Carpenter
et al., 2011), our results show that direct grazing on cy-
anobacteria may be a strong driver of cyanobacterial
Fig. 1 Examples of responses of total cyanobacteria, total Microcystis and M. botrys to the natural grazer community in the grazing experi-
ments in June, July and August. Fitted regression lines (n = 6), model equations, F-values, R2 values and P-values are given for significant
relationships (P < 0.05).
© 2015 John Wiley & Sons Ltd, Freshwater Biology, 60, 960–972
966 P. Urrutia-Cordero et al.

growth and that this may be enhanced through the sus-
ceptibility of copepods (selective grazers) and Daphnia
(generalist grazers) to alterations in fish predation.
Unlike the effects of trophic cascades through changes
in Daphnia abundances (Hansson et al., 1998), the capac-
ity of copepods to alter cyanobacterial bloom dynamics
has hitherto been largely unexplored (Ger, Hansson &
L€urling, 2014). We have demonstrated, by taking advan-
tage of a whole-lake manipulated food chain, that a
community dominated by copepods can also signifi-
cantly suppress cyanobacterial growth.
The impact of copepod-dominated zooplankton com-
munities on cyanobacteria is still controversial (Ger,
Hansson & L€urling, 2014), showing contrasting results
with respect to bloom formation and stability (Moriarty
et al., 1973; Wang et al., 2010; Lacerot et al., 2013). The
positive growth response by cyanobacteria to the natural
grazer community in our experiments occurred at low
cyanobacterial densities in early summer, most likely
due to altered competition patterns as a result of selec-
tive grazing on other phytoplankton taxa, such as dia-
toms (cf. Wang et al., 2010). This may help to explain the
seasonal shift in phytoplankton community composition
and dominance of cyanobacteria observed from June to
July in Lake Ringsj€on (cf. Wang et al., 2010). These
responses can also be linked to the high biomass contri-
bution of calanoid copepods in the June experiment, as
those are known to avoid consuming cyanobacteria
when the supply of better quality food sources is high
(Ger et al., 2010; Ger & Panosso, 2014). In contrast, with
an advanced succession of species and at higher cyano-
bacterial densities, a community dominated by cyclo-
poid copepods and small cladocerans was able to
restrict the growth of cyanobacterial species not previ-
(a) (b) (c)
(d) (e) (f)
Fig. 2 Monitoring data for zooplankton (calanoid copepods, cyclopoid copepods, Daphnia and small cladocerans) abundance (a), size shown
as maximum length (b), biomass (c) as well as biomasses of major phytoplankton groups (d; cyanobacteria, green algae, diatoms and other
taxa), cyanobacterial genera (e; Anabaena, Aphanizomenon, Planktothrix and Microcystis) and Microcystis species (f), and comparing the periods
of high fish abundance (black bars; 2000–2004) and low fish abundance (grey bars; 2005–2011) created by biomanipulation starting in 2005
in Lake Ringsj€on. Values are for summer means (�SD) including June, July and August of each assessed year. Asterisks (*) and double
asterisks (**) show significant differences (P < 0.05 and P < 0.01, respectively; Student0s t-test, unpaired, one-tailed). Note that in a)
(cyclopoid copepods) the asterisk within parentheses denotes P = 0.053.
© 2015 John Wiley & Sons Ltd, Freshwater Biology, 60, 960–972
Zooplankton herbivory on cyanobacteria 967

ously grazed by the natural zooplankton community.
Although known to feed efficiently on motile planktonic
cells (Bouley & Kimmerer, 2006), raptorially feeding co-
pepods like cyclopoids can also feed efficiently on colo-
nial and filamentous cyanobacteria (Moriarty et al., 1973;
Kurmayer & Juttner, 1999). The grazing impact on
(a)
(b)
(c)
(d)
Fig. 3 Linear regression relationships between Microcystis biomass and calanoid copepods (a), cyclopoid copepods (b), Daphnia (c) and small
cladocerans (d), abundances, body sizes and biomasses throughout the period 2000–2011 in Lake Ringsj€on. Values represent summer means
(June, July and August) of each monitored year. Black circles represent years prior to the start of the biomanipulation in 2005 (high fish
abundance) and open circles the years afterwards (low fish abundance). Fitted regression lines, model equations, F-values, R2 values and
P-values are given for P-values below the 5% significance level. This information is also shown for the relationship between Microcystis
biomass and body size of cyclopoid copepods (dotted regression line) given its close level of significance (P = 0.056).
© 2015 John Wiley & Sons Ltd, Freshwater Biology, 60, 960–972
968 P. Urrutia-Cordero et al.

cyanobacteria by small cladocerans, such as Chydorus
and Bosmina, is weak and, in contrast to copepods, they
generally feed on food particles smaller than cyanobacte-
ria (Burns, 1968; Wilson, 1973). Nonetheless, cyclopoid
copepods are able to break down cyanobacterial colonies
or filaments into smaller pieces, which may be an indi-
rect mechanism facilitating subsequent grazing by smal-
ler cladocerans (Moriarty et al., 1973; Haney, 1987).
Altogether, our results suggest a significant grazing
impact by the naturally occurring zooplankton commu-
nity on cyanobacteria, in spite of size and morphologi-
cal-based constraints conferred by filaments and
colonies. However, direct grazing intensity can vary sea-
sonally; for example, the lack of significant grazing on
cyanobacteria in our experiments in July can be
explained by the low zooplankton abundances in the
lake, and thereby also in the experiments, most likely
resulting from the strong predation by newly hatched
0 + fish (Hansson et al., 2007b; Ekvall, Urrutia-Cordero
& Hansson, 2014). The marked differences between June
and August are, however, in accordance with optimal
foraging theory and suggest a strong opportunistic for-
aging behaviour by zooplankton on cyanobacteria in situ-
ations of low abundance of high-quality prey
(MacArthur & Pianka, 1966; DeMott & Moxter, 1991),
such as those created during high cyanobacterial prolif-
eration (in this case late summer).
In addition, our grazing experiments show unequal
grazer effects by the natural grazing community upon
different Microcystis species with similar size and form,
suggesting that chemical defences may also alter selec-
tive foraging patterns in natural environments (DeMott
& Moxter, 1991). Hence, while the natural grazers had a
negative effect on M. viridis and M. wesenbergii, the net
growth rate of M. botrys was consistently promoted.
Ekvall et al. (2013) identified the species M. botrys as a
major explanatory variable of a 300% increase in toxin
(microcystins) concentrations in a mesocosm experiment.
Additionally, in a survey of 13 waterbodies from nine
European countries, Via-Ordorika et al. (2004) found that
of the Microcystis species investigated, M. botrys repre-
sented the highest proportion (90%) of toxic subpopula-
tions – that is, colonies containing microcystins and the
gene mcy responsible for its synthesis (Tillett et al.,
2000). Microcystins are potent hepatotoxins that nega-
tively affect the growth and fitness of herbivores (Hans-
son et al., 2007a; Urrutia-Cordero et al., 2013), and
selective grazers, like copepods, have developed adap-
tive feeding strategies allowing the detection of toxic
secondary metabolites, such as microcystins (Kurmayer
& Juttner, 1999; Ger et al., 2011, 2014). Although we did
not quantify microcystins or other potential bioactive
compounds acting as grazing deterrents (Urrutia-
Cordero et al., 2013; Agha & Quesada, 2014a; Agha et al.,
2014b), our results suggest that selective feeding on
other taxa may favour the most toxic species (in this
case, M. botrys) by altered competitive patterns. These
results are consistent with observations that selective
feeding facilitates grazer coexistence with toxic cyano-
bacteria by feeding on the least toxic algal species
(DeMott & Moxter, 1991). Future studies should focus
on determining whether selective zooplankters may feed
on toxic species in oligo- or monospecific cyanobacterial
blooms, represented by only one or a few dominant
taxa, and when little alternative food is present (DeMott
& Moxter, 1991; Ger et al., 2010; Ger & Panosso, 2014).
Cyclopoid copepods were 111% more abundant and
18% larger during the period of lower fish predation in
Lake Ringsj€on, which subsequently translated into a
253% increase in body mass. Similarly, Daphnia individ-
uals increased by 31% in body size. While no cascading
effects were observed on algal competitors such as dia-
toms, green algae or other taxa, the combination of our
grazing experiments and field observations suggests that
a stronger zooplankton herbivory following reduced fish
predation contributed significantly to the observed 72%
decrease in Microcystis biomass. As in our grazing exper-
iments, the lake-monitoring data suggest that grazing on
cyanobacteria was most likely highest on the most domi-
nant taxa due to increased encounter rates. Hence, the
strong Microcystis dominance before the biomanipulation
was broken and was shifted to codominance with Anaba-
ena, Aphanizomenon and Planktothrix under the lower pre-
dation regime. Although densities of copepods were
much higher than for Daphnia during the biomanipula-
tion, an increase in grazer body size by both copepods
and Daphnia could also trigger drastic changes in phyto-
plankton community structure (Pace, 1984; Agrawal,
1998). Hence, the 18% and 31% increases in copepod
and Daphnia body sizes are equivalent to 86 and 177 lmlarger individuals, corresponding to the typical average
size of Microcystis colonies in Lake Ringsj€on. Hence, alto-
gether our results suggest a combined impact of cope-
pods (selective herbivores) and Daphnia (generalist
herbivores) on Microcystis blooms and, importantly, this
includes a decline in the most toxic species, M. botrys.
This is of considerable relevance as, in contrast to cope-
pods, cladocerans like Daphnia are generalist, non-selec-
tive feeders that cope with the ingestion of toxic prey
through higher physiological tolerance (Gustafsson,
Rengefors & Hansson, 2005; Chislock et al., 2013a,b). In
spite of the strong response of Microcystis biomass, the
© 2015 John Wiley & Sons Ltd, Freshwater Biology, 60, 960–972
Zooplankton herbivory on cyanobacteria 969

dominance of the relatively small-bodied Daphnia cucul-
lata after biomanipulation in Lake Ringsj€on, as well as
the modest changes in chlorophyll-a, nutrients and
water transparency levels, suggest that fish predation
risk was still relatively high and that a stronger reduc-
tion in fish predation should further induce a shift
towards the dominance of a lager zooplankton commu-
nity (Jeppesen et al., 2000).
Our results have important implications for the under-
standing of consumer–prey interactions, but also for the
potential management of other eutrophic lakes through,
for instance, biomanipulation. Although trophic cascades
may affect phytoplankton communities differently
depending on differences in, for example, lake trophic
status (Elser & Goldman, 1991), nutrient recycling
(Vanni & Findlay, 1990), behavioural shifts (Romare &
Hansson, 2003) and many other processes (see Carpenter
et al., 2011), our study suggests that stronger herbivory
on cyanobacteria can be achieved through increased
abundance and body size of both selective and general-
ist grazers (Pace, 1984; Hansson et al., 1998, 2013). The
importance of selective herbivores has traditionally been
neglected in the literature, and here, we demonstrate
that copepods are likely to make an important contribu-
tion to herbivory on cyanobacterial blooms as, in con-
trast to large-bodied Daphnia, they often coexist with
cyanobacteria and abundant fish predators (Jeppesen
et al., 2000). While the presence of effective antiherbivore
cyanobacterial defences has been used to explain most
zooplankton–cyanobacteria interactions (Wilson et al.,
2006; Ger, Hansson & L€urling, 2014), we argue that
overlooking other critical factors, such as predation
(Hansson et al., 2013), resource density (DeMott &
Moxter, 1991) and herbivore counter-adaptations to such
defences (Gustafsson et al., 2005; Chislock et al., 2013a,b),
has led to neglect of the potential capacity of herbivo-
rous zooplankton to ‘mow down’ cyanobacterial blooms.
This is of great relevance given the relative paucity of
information on effective use of low-quality resources like
cyanobacteria by selective feeders, thus aiding our
understanding of foraging choices that drive herbivore–
plant interactions in natural environments.
Acknowledgments
We thank the anonymous reviewers for their helpful
comments. We also thank the municipality of H€o€or for
providing the field data, and Susanne Gustafsson and
Gertrud Cronberg for their help with identification of
algae. This research was funded by the European Union
Interreg IV A project ‘Algae be gone!’, the collaborative
research strategic area ‘Biodiversity and Ecosystem Ser-
vices in a Changing Climate (BECC)’ and LIMNOTIP
through the ERA-Net BiodivERsA, with the national
funder Formas.
References
Agha R., Lezcano M.-A., Labrador M.D.M., Cires S. &
Quesada A. (2014b) Seasonal dynamics and sedimenta-
tion patterns of Microcystis oligopeptide-based chemo-
types reveal subpopulations with different ecological
traits. Limnology and Oceanography, 59, 861–871.Agha R. & Quesada A. (2014a) Oligopeptides as biomarkers
of cyanobacterial subpopulations. Toward an understand-
ing of their biological role. Toxins, 6, 1929–1950.Agrawal A.A. (1998) Algal defense, grazers, and their inter-
actions in aquatic trophic cascades. Acta Oecologica-Inter-
national Journal of Ecology, 19, 331–337.Bergquist A.M. & Carpenter S.R. (1986) Limnetic herbivory:
effects on phytoplankton populations and primary pro-
duction. Ecology, 67, 1351–1360.Bottrell H.H., Duncan A., Gliwicz Z.M., Grygierek E.,
Herzig A., Hillbrichtilkowska A. et al. (1976) Review of
some problems in zooplankton production studies.
Norwegian Journal of Zoology, 24, 419–456.Bouley P. & Kimmerer W.J. (2006) Ecology of a highly
abundant, introduced cyclopoid copepod in a temperate
estuary. Marine Ecology Progress Series, 324, 219–228.Brett M.T. & Muller-Navarra D.C. (1997) The role of highly
unsaturated fatty acids in aquatic food web processes.
Freshwater Biology, 38, 483–499.Burns C.W. (1968) Relationship between body size of filter-
feeding Cladocera and maximum size of particle
ingested. Limnology and Oceanography, 13, 675–678.Carpenter S.R., Cole J.J., Kitchell J.F. & Pace M.L. (2011)
Trophic cascades in lakes: lessons and prospects chapter
4. In Trophic Cascades. (Terborgh J. & Estes J.A. eds).
Island Press, Washington D.C, pp. 55–70.Chislock M.F., Sarnelle O., Jernigan L.M. & Wilson A.E.
(2013a) Do high concentrations of microcystin prevent
Daphnia control of phytoplankton? Water Research, 47,
1961–1970.Chislock M.F., Sarnelle O., Olsen B.K., Doster E. & Wilson
A.E. (2013b) Large effects of consumer offense on ecosys-
tem structure and function. Ecology, 94, 2375–2380.Cronberg G., Annadotter H. & Lawton L.A. (1999) The
occurrence of toxic blue-green algae in Lake Ringsjon,
southern Sweden, despite nutrient reduction and fish
biomanipulation. Hydrobiologia, 404, 123–129.DeMott W.R. & Moxter F. (1991) Foraging cyanobacteria by
copepods: responses to chemical defense and resource
abundance. Ecology, 72, 1820–1834.Dumont H.J., Vandevelde I. & Dumont S. (1975) Dry weight
estimate of biomass in a selection of Cladocera,
© 2015 John Wiley & Sons Ltd, Freshwater Biology, 60, 960–972
970 P. Urrutia-Cordero et al.

Copepoda and Rotifera from plankton, periphyton and
benthos of continental waters. Oecologia, 19, 75–97.Ekvall M.K., Martin J.D.L.C., Faassen E.J., Gustafsson S.,
Lurling M. & Hansson L.-A. (2013) Synergistic and spe-
cies-specific effects of climate change and water colour on
cyanobacterial toxicity and bloom formation. Freshwater
Biology, 58, 2414–2422.Ekvall M.K., Urrutia-Cordero P. & Hansson L.-A. (2014)
Linking cascading effects of fish predation and zoo-
plankton grazing to reduced cyanobacterial biomass
and toxin-levels following biomanipulation. PLoS ONE,
9, e112956.
Elser J.J. & Goldman C.R. (1991) Zooplankton effects on
phytoplankton in lakes of contrasting trophic status. Lim-
nology and Oceanography, 36, 64–90.Ger K.A., Arneson P., Goldman C.R. & Teh S.J. (2010) Spe-
cies specific differences in the ingestion of Microcystis
cells by the calanoid copepods Eurytemora affinis and
Pseudodiaptomus forbesi. Journal of Plankton Research, 32,
1479–1484.Ger K.A., Hansson L.-A. & L€urling M. (2014) Understand-
ing cyanobacteria-zooplankton interactions in a more
eutrophic world. Freshwater Biology, 59, 1783–1798.Ger K.A. & Panosso R. (2014) The effects of a microcystin-
producing and lacking strain of Microcystis on the sur-
vival of a widespread tropical copepod (Notodiaptomus
iheringi). Hydrobiologia, 738, 61–73.Ger K.A., Panosso R. & Lurling M. (2011) Consequences of
acclimation to Microcystis on the selective feeding behav-
ior of the calanoid copepod Eudiaptomus gracilis. Limnol-
ogy and Oceanography, 56, 2103–2114.Gustafsson S., Rengefors K. & Hansson L.A. (2005) Increased
consumer fitness following transfer of toxin tolerance to
offspring via maternal effects. Ecology, 86, 2561–2567.Haney J.F. (1987) Field studies on zooplankton-cyanobac-
teria interactions. New Zealand Journal of Marine and Fresh-
water Research, 21, 467–475.
Hansson L.-A. (1996) Algal recruitment from lake sediments
in relation to grazing, sinking, and dominance patterns in
the phytoplankton community. Limnology and Oceanogra-
phy, 41, 1312–1323.Hansson L.A., Annadotter H., Bergman E., Hamrin S.F., Je-
ppesen E., Kairesalo T. et al. (1998) Biomanipulation as an
application of food-chain theory: constraints, synthesis,
and recommendations for temperate lakes. Ecosystems, 1,
558–574.Hansson L.-A., Gustafsson S., Rengefors K. & Bomark L.
(2007a) Cyanobacterial chemical warfare affects zooplank-
ton community composition. Freshwater Biology, 52, 1290–1301.
Hansson L.-A., Nicolle A., Brodersen J., Romare P., Nilsson
P.A., Br€onmark C. et al. (2007b) Consequences of fish pre-
dation, migration, and juvenile ontogeny on zooplankton
spring dynamics. Limnology and Oceanography, 52, 696–706.
Hansson L.-A., Nicolle A., Graneli W., Hallgren P., Kritz-
berg E., Persson A. et al. (2013) Food-chain length alters
community responses to global change in aquatic sys-
tems. Nature Climate Change, 3, 228–233.Jeppesen E., Jensen J.P., Sondergaard M., Lauridsen T. &
Landkildehus F. (2000) Trophic structure, species richness
and biodiversity in Danish lakes: changes along a phos-
phorus gradient. Freshwater Biology, 45, 201–218.Kurmayer R. & Juttner F. (1999) Strategies for the co-exis-
tence of zooplankton with the toxic cyanobacterium
Planktothrix rubescens in Lake Zurich. Journal of Plankton
Research, 21, 659–683.Lacerot G., Kruk C., Lurling M. & Scheffer M. (2013) The
role of subtropical zooplankton as grazers of phytoplank-
ton under different predation levels. Freshwater Biology,
58, 494–503.Landry M.R. & Hassett R.P. (1982) Estimating the grazing
impact of marine micro-zooplankton. Marine Biology, 67,
283–288.Lebret K., Fern�andez Fern�andez M., Hagman C.H.C.,
Rengefors K. & Hansson L.-A. (2012) Grazing resistance
allows bloom formation and may explain invasion suc-
cess of Gonyostomum semen. Limnology and Oceanography,
57, 727–734.Lehman J.T. & Sandgren C.D. (1985) Species-specific rates
of growth and grazing loss among fresh-water algae. Lim-
nology and Oceanography, 30, 34–46.MacArthur R.H. & Pianka E.R. (1966) On optimal use of a
patchy environment. American Naturalist, 100, 603–609.Moriarty D.J., Darlingt J.P., Dunn I.G., Moriarty C.M. &
Tevlin M.P. (1973) Feeding and grazing in Lake-George,
Uganda. Proceedings of the Royal Society Series B-Biological
Sciences, 184, 299–319.Pace M.L. (1984) Zooplankton community structure, but nor
biomass, influences the phosphorous-chlorophyll a rela-
tionship. Canadian Journal of Fisheries and Aquatic Sciences,
41, 1089–1096.Romare P. & Hansson L.-A. (2003) A behavioral cascade:
top-predator induced behavioral shifts in planktivorous
fish and zooplankton. Limnology and Oceanography, 48,
1956–1964.Shapiro J., Lamarra V. & Lynch M. (1975) Biomanipulation:
an ecosystem approach to lake restoration. Proceedings of
a Symposium on Water Quality and Management through
Biological Control, Gainesville, 1975, 85–96.Tillett D., Dittmann E., Erhard M., Von Dohren H., Borner
T. & Neilan B.A. (2000) Structural organization of micro-
cystin biosynthesis in Microcystis aeruginosa PCC7806: an
integrated peptide-polyketide synthetase system. Chemis-
try & Biology, 7, 753–764.Urrutia-Cordero P., Agha R., Cires S., Lezcano M.A., San-
chez-Contreras M., Waara K.O. et al. (2013) Effects of
harmful cyanobacteria on the freshwater pathogenic free-
living amoeba Acanthamoeba castellanii. Aquatic Toxicology,
130, 9–17.
© 2015 John Wiley & Sons Ltd, Freshwater Biology, 60, 960–972
Zooplankton herbivory on cyanobacteria 971

Vanni M.J. & Findlay D.L. (1990) Trophic cascades and phy-
toplankton community structure. Ecology, 71, 921–937.Vanni M.J. & Temte J. (1990) Seasonal patterns of grazing
and nutrient limitation of phytoplankton in a eutrophic
lake. Limnology and Oceanography, 35, 697–709.Via-Ordorika L., Fastner J., Kurmayer R., Hisbergues M.,
Dittmann E., Komarek J. et al. (2004) Distribution of micr-
ocystin-producing and non-microcystin-producing Micro-
cystis sp in European freshwater bodies: detection of
microcystins and microcystin genes in individual colo-
nies. Systematic and Applied Microbiology, 27, 592–602.Wang X., Qin B., Gao G. & Paerl H.W. (2010) Nutrient
enrichment and selective predation by zooplankton
promote Microcystis (Cyanobacteria) bloom formation.
Journal of Plankton Research, 32, 457–470.Wilson A.E., Sarnelle O. & Tillmanns A.R. (2006) Effects of
cyanobacterial toxicity and morphology on the popula-
tion growth of freshwater zooplankton: meta-analyses of
laboratory experiments. Limnology and Oceanography, 51,
1915–1924.Wilson D.S. (1973) Food selection among copepods. Ecology,
54, 909–914.
(Manuscript accepted 9 February 2015)
© 2015 John Wiley & Sons Ltd, Freshwater Biology, 60, 960–972
972 P. Urrutia-Cordero et al.