cyanobacteria in south africa: a review - water
TRANSCRIPT
CYANOBACTERIA IN SOUTH AFRICA:
A REVIEW
REPORT TO THE
WATER RESEARCH COMMISSION
By
William (Bill) Harding and Bruce Paxton
SOUTHERN WATERS ECOLOGICAL RESEARCH AND CONSULTING
WRC Report No: TT 153/01
July 2001
Obtainable from:
Water Research Commission P O Box 824 Pretoria 0001
ISBN 1 86845 7745
Printed in the Republic of South Africa
DISCLAIMER
This report has been reviewed by the Water Research Commission (WRC) and approved for publication. Approval does not signify that the contents necessarily reflect the views and policies of the WRC, nor does mention of trade names or commercial products constitute
endorsement or recommendation for use.
Cover illustration: Background image: Anabaena solitaria bloom at Theewaterskloof (Villiersdorp, Western Cape, December 1993); Insert: Shoreline scum of Microcystis aeruginosa (Malmesbury District, Western Cape, April 1994); Chemical structure: Microcystin-LR (heptapeptide).
Artwork: Electric Egg Productions (Somerset West).
i
AUTHOR’S OVERVIEW
Cyanobacteria enjoy a notorious
reputation. Blooms rapidly emerge from
apparent obscurity, wreaking havoc on
water quality and ecosystem integrity, and
often recede abruptly. Some waters
exhibit frequent and even sustained
aggregations of these algae, while others
experience evanescent, but often
extremely noxious, growth events.
Seriously toxic incidents that evoke public
and occasionally governmental attention
are rare. None has received international
coverage via non-scientific media. The
events of the 1989 summer in the United
Kingdom, the sustained blooms in the
Australian Darling-Barwon River system
during the early summer of 1991, and the
South African Tsitsikamma-Kareedouw
poisoning of an entire dairy herd in 1996
were, however, catapulted to the national
attention of the affected countries.
Surprisingly, the cyanobacterial-related
deaths of dozens of dialysis patients in
Caruaru, Brazil during 1996 were not
regarded as being internationally
newsworthy. While there are,
undoubtedly, many cases of sustained
algal growths that result in persistent and
often worrying problems, these remain
largely hidden in the records of water
quality managers and potable supply
utilities. It is probable that numerous
cases from the agricultural and rural
sectors of many countries have gone
unnoticed, and the noxious effects
undiagnosed.
While the sporadic nature of
cyanobacterial blooms is a blessing in that
associated incidents of toxicosis are
relatively few, the perceived low intensity
of toxic events gives an illusion of the
problem being too transitory to warrant
any serious or sustained input in terms of
funding.
In developing countries, such as South
Africa, resistance to the provision of
funding for cyanobacterial research is
often based on the argument that there are
far greater health problems and that
funding needs to be directed to the
alleviation of diseases such as HIV-AIDS
and tuberculosis. While this is inarguably
legitimate, the threats posed by
cyanobacteria are also very real and are a
consequence of the insidious and
burgeoning problem caused by the
eutrophication of scarce water resources.
This renders selection of the “do nothing”
option invalid.
Globally, eutrophication receives second-
rate status in developing countries, not
least in South Africa. To illustrate, the
simple and effective implementation of
phosphorus stripping from wastewater
effluents continues to be ignored on the
basis of perceived high capital and
operating costs, but to the detriment of the
long-term cost to the environment and to
ii
society as a whole. This is compounded
by the harsh reality that South Africa
suffers from a dearth of suitably trained
and experienced professionals in the
disciplines of limnology and river ecology
who can provide meaningful support to
water quality managers. Despite being an
arid country with identified and serious
future limitations for water quality and
quantity, South Africa lacks tertiary
institutions that offer limnology or river
ecology, or even algology, as formal major
subject training courses. Out of 26 final
year (2000) zoology undergraduate
students attending a final year semester
course in freshwater ecology at a leading
South African university, none expressed
the intention to pursue a career in the
limnological or (aquatic) ecological
sciences. This is a damning indictment for
the future of aquatic ecosystem
management in this country.
Notwithstanding the best intentions of
integrated catchment management
philosophy and policy, the problem of
eutrophication, with its wide-ranging
associated evils, is unlikely to be
meaningfully resolved in the short-to-
medium term. Cyanobacterial blooms and
toxin production constitute a subset of this
greater problem. In the absence of
deliberate eutrophication management, the
reality is that increasing numbers of a
given population will be exposed to waters
containing cyanobacterial metabolites that
pose very real, acute and chronic
implications for their health, and
especially for those whose physical
condition may already be compromised.
The risk increases exponentially as one
moves from the relative safety provided by
tertiary water treatment in the cities, to
rural communities or areas serviced by
less-sophisticated water treatment
technologies.
A somewhat pessimistic implication is that
we will have to learn to live with the
impacts of unattenuated pollution and
eutrophication, and rely on water
treatment for the protection of our health
in areas where the impoundments are
eutrophic. However, this constitutes an
“end-of-pipe” approach that precludes the
greater portion of the South African
population from this protection.
While South Africa no longer enjoys the
scientific prominence in cyanobacterial
research that it held during the 1980s, the
continued development of cyanobacterial
understanding constitutes a crucial need.
Efforts to ensure prevention of excessive
cyanobacterial growth should underpin
practical research efforts and the primary
allocation of funding. Management of the
problem must now concentrate objectively
on mitigating the underlying causes of
eutrophication and degradation of aquatic
ecosystems, supported in parallel by
investigations of regional and local
cyanobacterial demographics and
incidence of toxicosis. Examples here
iii
would be the geographic expansion of
genera such as Oscillatoria, and the
appearance of hitherto rare cyanobacteria
such as Cylindrospermopsis. Expansion
of research into the realms of the
molecular pathways driving toxin
production, and the sourcing and provision
of funding for this purpose, might well be
more pragmatically served through the
persuance of collaborative international
research links with centres of excellence
that have established proven track records
in this regard. There are relatively few
funded programmes dealing with issues
pertaining to cyanobacteria in the
freshwater environment, with the
consequence that huge benefits stand to be
gained from aggregate efforts.
iv
TABLE OF CONTENTS
Authors Overview i How to use this document v
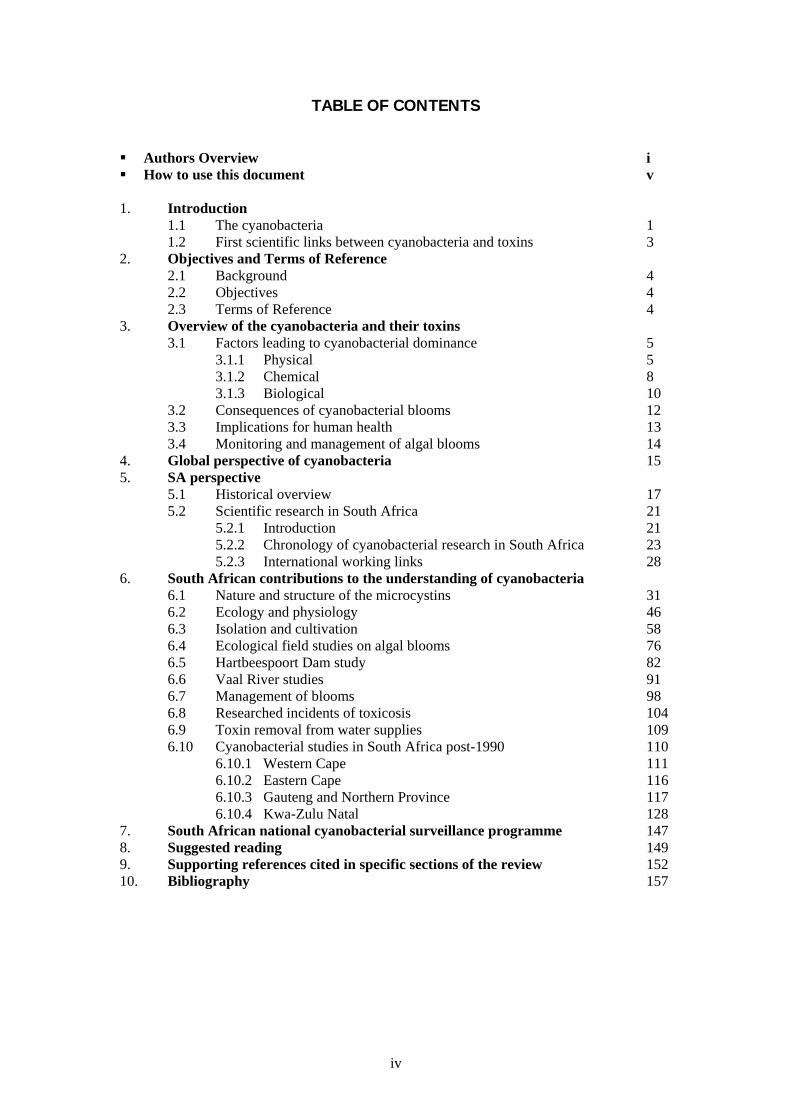
1. Introduction 1.1 The cyanobacteria 1 1.2 First scientific links between cyanobacteria and toxins 3 2. Objectives and Terms of Reference 2.1 Background 4 2.2 Objectives 4 2.3 Terms of Reference 4 3. Overview of the cyanobacteria and their toxins 3.1 Factors leading to cyanobacterial dominance 5 3.1.1 Physical 5 3.1.2 Chemical 8 3.1.3 Biological 10 3.2 Consequences of cyanobacterial blooms 12 3.3 Implications for human health 13 3.4 Monitoring and management of algal blooms 14 4. Global perspective of cyanobacteria 15 5. SA perspective 5.1 Historical overview 17 5.2 Scientific research in South Africa 21 5.2.1 Introduction 21 5.2.2 Chronology of cyanobacterial research in South Africa 23 5.2.3 International working links 28 6. South African contributions to the understanding of cyanobacteria 6.1 Nature and structure of the microcystins 31 6.2 Ecology and physiology 46 6.3 Isolation and cultivation 58 6.4 Ecological field studies on algal blooms 76 6.5 Hartbeespoort Dam study 82 6.6 Vaal River studies 91 6.7 Management of blooms 98 6.8 Researched incidents of toxicosis 104 6.9 Toxin removal from water supplies 109 6.10 Cyanobacterial studies in South Africa post-1990 110 6.10.1 Western Cape 111 6.10.2 Eastern Cape 116 6.10.3 Gauteng and Northern Province 117 6.10.4 Kwa-Zulu Natal 128 7. South African national cyanobacterial surveillance programme 147 8. Suggested reading 149 9. Supporting references cited in specific sections of the review 152 10. Bibliography 157
v
HOW TO USE THIS DOCUMENT
Of necessity a review document makes
multiple references to the published and
unpublished (grey literature) work of
researchers. In many cases, articles cite
the work of others in drawing the basis for
their arguments, or to substantiate their
findings. The documenting of reference
material has been dealt with in three ways
in this document:
Firstly, a bibliography of Suggested
Reading is provided. As this review
concentrates on South Africa in
particular, this section contains
references to books and publications
that will provide additional in-depth
understanding of the topic at hand;
Secondly, a section of Supporting
Literature, which, for specific sections
of the review, lists important
references, cited by South African
researchers in their work. Such
sections are clearly marked with a “see
Supporting Literature” flag;
Finally, a bibliography of references
used for the compilation of this
review.
Certain references may be duplicated in
the above, or the reader may need to
consult more than one thereof in order to
locate the details for a publication.
1
1. INTRODUCTION
1.1 The cyanobacteria
Cyanobacteria (aka “blue-green algae”)
are one of the earth’s most ancient life
forms. Evidence of their existence on
earth, derived from fossil records,
encompasses a period of some 3.5 billion
years. They are considered to have been
the first photosynthetic organisms and,
consequently, as having contributed to the
generation of oxygen in the earth’s
atmosphere. These organisms are not true
algae at all, but rather ancient bacteria
belonging to the procaryotic groupings of
organisms. The common name of “blue-
green algae” is derived from the
colouration (hence “cyan”) that many of
this algal division exhibit. They do not
occur only in marine and freshwater
environments, but also in a variety of
habitats ranging from hot springs to
beneath sandstone layers in the Golden
Gate National Park, and artificially-
illuminated cave systems such as the
Cango Caves near Oudtshoorn, South
Africa, to ice layers in the polar regions.
The cyanobacteria are entirely
cosmopolitan organisms, species of which
may commonly occur in relatively small
numbers in most aquatic environments.
However, during times of environmental
imbalance, usually caused by
eutrophication, cyanobacteria tend to gain
a selective advantage and out-develop the
remainder of the algal assemblage in terms
of numbers and biovolume. The result is a
phenomenon referred to as a “bloom” of
cyanobacteria, more correctly described as
dense aggregations of cells that are
sometimes buoyant, float to the surface
and form thick, paint-like scums on the
downwind shores of lakes and ponds, or
along the banks of rivers. In cases where
toxins are present, it is these scums of
algal cells that pose the greatest risk to
animals, as well as to humans who may
come into contact with the material (see
below).
The most alarming characteristic of the
cyanobacteria is the ability of many genera
and species to produce a range of
extremely potent biological toxins.
Toxins, encompassing hepato- and
neurotoxic secondary metabolites, are
most commonly known from the
cyanobacterial genera Anabaena,
Aphanizomenon, Cylindrospermopsis,
Microcystis, Nodularia, Nostoc and
Oscillatoria (Planktothrix). The majority
of poisoning incidents are the result of
acute or sub-acute liver toxicity caused by
the largest group of toxins known as the
microcystins. In general, the toxins are
produced in a random and unpredictable
fashion, and pose a significant threat in
terms of acute and chronic health risks to
both animals and humans. In addition,
certain genera and species produce taste
and odour compounds, typically geosmin

2
and 2-methyl isoborneol, which cause
non-hazardous but unpleasant problems
for suppliers and users of potable water.
3
1.2 The first scientific links
between cyanobacteria and
toxicity
Although relatively sound descriptions of
cyanobacterial “blooms” exist from as far
back as the 12th century, the first
conclusive demonstration of and links to
toxicity in this group of organisms
originated from Australia during the late
1800s. During 1878, George Francis, a
chemist from the town of Adelaide,
reported the poisoning of animals around
Lake Alexandrina in Australia. By
feeding a calf with algal scum from the
surface of the lake, he was able to
determine that it was the alga (Nodularia
spumigena) in the lake that had caused the
deaths.
This quaint description of a toxic algal
bloom by Francis (1878) is cited in Soll
and Williams (1985):
‘A conferva that is indigenous and
confined to the lakes has been produced in
excessive quantities, so much as to render
the water unwholesome. It is, I believe
Nodularia spumigena, allied to
Protococcus. Being very light, it floats on
the water, except during breezes when it
becomes diffused. Thus floating, it is
wafted to the lee shores, and forming a
thick scum like green oil paint, some two
to six inches thick and as thick and pasty
as porridge, it is swallowed by cattle when
drinking, especially such as suck their
drink at the surface like horses. This acts
poisonously and rapidly causes death.’
4
2. OBJECTIVES AND TERMS
OF REFERENCE
2.1 Background
Concerns within the South African aquatic
science community, pertaining to
cyanobacteria, were heightened by the
1996 incident of massive stock loss in the
Tsitsikamma-Kareedouw district of the
southern Cape (Harding, 1997a). A
resolution passed by the 1997 Annual
General Meeting of the Southern African
Society of Aquatic Scientists (SASAQS)
led to the submission of recommendations
calling for heightened attention to the
problems posed by cyanobacteria in South
Africa, to the national departments of
Water Affairs and Forestry, Agriculture,
Health and Welfare, and Environmental
Affairs and Tourism.
Subsequently, during 1998, a group of
concerned managers and scientists, led by
Dr Machiel Steynberg of Rand Water,
convened the Toxic Algal Forum.
2.2 Objectives of this review
During 1999, the Water Research
Commission (WRC) convened two
workshops at the Rhoodevallei Conference
Centre in Pretoria. The first placed the
problems facing South Africa in both
international and local perspective.
Professor Geoff Codd of the Department
of Biological Sciences, Dundee
University, Scotland attended this meeting
as international specialist in the field of
cyanobacteria and their associated toxins.
The workshop resolved that a review of
the South African experiences relating to
cyanobacteria was necessary in order to be
able to meaningfully evaluate new
research proposals and needs. This was
supported at a second workshop dealing
with the assessment of research needs
pertaining to cyanobacteria.
2.3 Terms of Reference
This review was tasked with drawing
together relevant information pertaining to
the history of cyanobacterial occurrence,
associated toxicity, poisonings, taste and
odour generation, research and
management in South Africa during the
20th century to December 1999. The
review proposal included the need to
document key international linkages, and
relevant photographic material.
5
3. OVERVIEW OF THE
CYANOBACTERIA AND THEIR
TOXINS
As indicated above, the purpose of this
review is to detail the South African
experiences of cyanobacteria, and the
contributions made by South African
researchers to the understanding of these
organisms. Accordingly, while this short
summary of cyanobacteria and their toxins
is included to aid readers who may be
unfamiliar with the topic, it is by no means
intended as an exhaustive review. The
reader is referred to the many excellent
texts and summaries listed in the section
on Recommended Reading. The
publication of the World Health
Organization (WHO) entitled “Toxic
Cyanobacteria in Water: A guide to their
public health consequences, monitoring
and management” (WHO, 1999) is
strongly recommended as essential reading
for anyone wishing to have a detailed
background to the topic. As a supportive
text, “The Ecology of Cyanobacteria:
Their Diversity in Time and Space”
(Whitton and Potts, eds., 2000) provides
an excellent, albeit disappointingly already
out of date with respect to toxins,
overview of the cyanobacteria. Texts and
reports identified in the unpublished “grey
literature” are referenced in this document,
but have not been included in the section
on Recommended Reading.
3.1 Factors leading to
cyanobacterial dominance
(“blooms”)
The information provided below is drawn
from arid climate experience and,
accordingly, may differ from the
understanding of similar factors in the
north-temperate zones. It must also be
stressed that factors that may influence the
growth and development of one alga over
another do not act singly, but rather in
concert with a constantly changing suite of
parameters – the combination of which
determines the outcome of a successional
phase of algal growth. It is only when a
single parameter becomes limiting that it
begins to exert definitive control.
3.1.1 Physical factors
Temperature
As water temperatures increase, algal
successional patterns typically follow a
progression from diatoms through
chlorophytes to cyanobacteria (Robarts
and Zohary, 1987). While cyanobacterial
dominance usually occurs at temperatures
in excess of 20EC, different genera have
wide ranges of temperature extremes. The
genus most commonly associated with
problems relating to toxin production,
namely Microcystis, copes well with
temperatures over a wide range of water
6
temperatures. In South Africa, prevailing
water temperatures are generally suitable
for cyanobacterial growth during the
greater portion of the year.
Water column stability and stratification
Wind-induced turbulence, flow and
temperature, or combinations may
variously affect the physical stability of a
body of water thereof. Furthermore,
otherwise stable conditions may be
disrupted through large-scale recreational
use by powercraft, or by the regular
disruption of conditions in canals and
waterways caused by the passing of barges
and ferries. When cyanobacteria are
present in numbers, stable water column
conditions are visibly evident by the
formation of surface scums of buoyant
algal cells.
Thermal stratification, resulting from a
layer of water becoming thermally distinct
from the remainder of the water column, is
a characteristic of deep lakes and
impoundments, but does also occur for
short periods in shallow lakes and ponds.
Thermal stratification ultimately results in
nutrient stratification, with the upper,
light-rich layer of water being rendered
nutrient-poor, and with nutrients in the
deeper layers of water being unavailable to
phytoplankton.
Turbulence is generally considered to
reduce cyanobacterial development, the
argument being that the algal cells will be
mixed out of the light rich environment for
periods of time that exceed their
relatively-long growth response times.
While this is certainly true for deeper
waters, wind-induced turbulence has been
shown to have an apposite effect in
nutrient-rich shallow and warm lakes.
Here, regular mixing mimics the principles
of a chemostat with the result that much
higher levels of production are attained
than would otherwise be the case in
systems with less mictic action (e.g.
Harding, 1997b). Varying frequencies of
mixing in the aquatic environment have
been shown to support those selective
processes driven by frequency of
disturbance (e.g. Connell, 1978; Reynolds,
1994; Harding, 1996).
Evaporation
Evaporation plays two roles. As water
volumes reduce, nutrient concentrations
increase, and so does the concentration of
dissolved salts (TDS). Thus, the process
alters nutrient availability and those
environmental characteristic of salinity
that would support successional sequences
favouring, for example, mildly halo-
tolerant cyanobacterial genera (e.g.
Nodularia).
Turbidity
The level of inorganic turbidity is
influenced by the factors that govern
7
stability, and also by the processes of
bioturbation. As turbidity increases, either
as a consequence of runoff bearing eroded
soils, or from the entrainment of
sediments, so light availability is reduced
with depth below the surface. At low to
moderate levels, ambient turbidity often
favours cyanobacterial development,
especially in rivers. This is due to the fact
that many cyanobacterial genera have light
harvesting mechanisms that impart to
them a selective growth advantage in
light-limited situations. Incidences of
Oscillatoria in muddy, turbid rivers are a
case in point. This advantage is
progressively reduced as the level of
turbidity increases.
Organic turbidity, or that turbidity
occurring as a consequence of algal
development, constitutes a self-attenuating
feature. This is most apparent in stable
water bodies where calm conditions can
allow the formation of extremely thick
scums of algae that limit the availability to
the cells below. The South African studies
on algal development in the Hartbeespoort
Dam, and the characteristics of encrusted
scums of Microcystis aeruginosa, are well
documented and are referred to elsewhere
in this review. The negative influence of
organic turbidity has been offset in
eupolymictic environments such as
Zeekoevlei (Harding, 1997b).
Colour
The level of ambient colour in water
reduces the ability of photosynthetically
active radiation (PAR) to penetrate deep
into the water column. In South Africa,
intensely coloured waters are a common
feature of the western and southern Cape,
and photic zone depths are generally quite
shallow (Kd ≅ 1.2 m). Low levels of pH
and nutrient availability typically
characterize these waters.
Notwithstanding this, some are well
known for their propensity to support
sustained and problematical blooms of
cyanobacteria.
Morphology
Lake morphology, or the shape and depth
of the lake basin or impoundment, can
play a profound role in the development of
cyanobacterial blooms through dictating
where, and the manner in which, algal
growth may occur. As should be apparent
from the foregoing, the development of
aggregations of cyanobacterial cells tends
to be favoured by shallow, warm and
sheltered conditions. Thus, this is more
likely to occur in sheltered bays of
dendritic lakes.
8
3.1.2 Chemical factors
Nutrients
The relationship between the excessive
enrichment of aquatic ecosystems with
plant nutrients (eutrophication) and the
consequent positive effect on algal growth
is well-known. While certain genera of
filamentous, nitrogen-fixing blue-greens
can overcome low levels of nitrogen
availability, phosphorus is accepted as
being the essential growth-limiting
nutrient. With respect to the relationship
between phosphorus availability and
cyanobacterial development, it must be
stressed that the simple non-limiting
availability of phosphorus does not, in
itself, provide this group of algae with the
ability to become dominant in a particular
body of water. For this to occur, a suitable
combination of both nutrients, and the
other abiotic and biotic factors described,
have to prevail in order for the
cyanobacteria to gain the selective
advantage.
Myths of N:P ratios
Much has been made of the relationship
between prevailing ratios of nitrogen and
phosphorus (N:P) and the composition and
density of phytoplankton assemblages that
may occur. While certain broad categories
generally and accurately support
prediction of which algal division may
predominate, other biophysical features
and attributes should not be excluded from
the equation. It is becoming increasingly
apparent that, notwithstanding the
prevailing N:P ratio, the phytoplankton
assemblage may be significantly altered
through biomanipulation, and without any
change whatsoever to the ambient
availability of nitrogen and phosphorus
(e.g. Harding and Wright, 1999).
Furthermore, the issue of N:P ratio as a
controlling factor in cyanobacterial
development only comes into play when
one or both elements are present in
concentrations that are limiting for further
algal development. Hence the value of
N:P ratios should be linked to nutrient
availability, and prediction of which
element is likely to become limiting
during the algal growth phase (e.g.
Reynolds, 1992).
The foregoing is by no means intended to
imply that eutrophic lakes and vleis can
simply be left in their enriched state while
superimposed or “piggy-back” techniques
are used to address the management of
noxious algal populations. The
management of eutrophication, focussed
on the attenuation of nutrient enrichment,
should and must remain the foundation of
water resource management. In most
cases where eutrophication has impacted
on an aquatic ecosystem it is not only the
phytoplankton that has been affected.
More often than not, one or more feedback
loops or switches have been impacted to
9
the point where imbalance occurs at more
than one level in the trophic web. What is
implied, therefore, is that far greater
improvements may be attained through the
concomitant application of nutrient
reduction and biomanipulation techniques,
and that the two measures should be
applied in concert with each other
wherever possible.
Sediments and seepages
The internal recycling of nutrients can
play a profound role in confounding
attempts to manage eutrophication through
the attenuation of external loading. In
certain cases what may seem to be
relatively minor accumulations of
sediments can produce autochotonous
loads of phosphorus that impart a high
level of resilience to rehabilitation efforts.
Management of phosphorus loads that
originate from sediments is often ignored
in shallow oxic lakes on the basis that
active phosphorus release will not prevail
in the absence of anoxic, reducing
conditions. While these conditions
certainly do drive P-release from
hypolimnetic sediments, in shallow lakes
the passive release of phosphorus into the
interstitial pore water, and its movement
into the overlying water facilitated through
wind- or bioturbation-induced sheer
stresses, causes significant quantities of
this element to be made available for plant
development.
pH and CO2
Conditions of high pH or a low
availability of CO2 generally favours the
growth of cyanobacteria. Cyanobacterial
physiology and growth, in relation to these
factors, is described in detail by Shapiro
(1990). On a diel basis, dense
aggregations of cyanobacteria cause the
pH to increase from early morning minima
to late afternoon maximum levels, a
phenomenon mirrored by a similar cycle
of dissolved oxygen concentrations.
Salinity
Cyanobacterial genera exhibit a wide
range of tolerance to salinity that
influences both the likely assemblage
composition and opportunities for
management – particularly in estuarine
and coastal wetland environments. Many
of the common ‘freshwater’ genera tend to
exhibit low salinity tolerances (< 3 ppt),
while others such as Nodularia
spumigena, and certain members of the
Planktothrix genus, tend to become
dominant as the ambient salinity increases.
The freshening of estuary environments
due to increased catchment runoff, or the
increased availability of nutrients in the
nearshore zone as a consequence of land-
based activities, can result in eutrophic
estuaries and algal blooms. In many cases
the negative effects impact on estuary-
based aquaculture or recreational pursuits,
with concomitant financial losses and
10
ecosystem devastation. Manipulation of
optimum salinity levels, or levels that are
unfavourable to the growth of the
problematical alga, has been attempted on
various scales, ranging from the
management of the Australian Peel-
Harvey Inlet (McComb and Lukatelich,
1995; Hearn, 1995) to the alleviation of a
toxic Microcystis bloom in a South
African coastal wetland (Harding, 1998).
Dissolved oxygen
Most well mixed, shallow and warm
eutrophic water bodies seldom suffer from
low levels of dissolved oxygen. In
systems, oxygen availability may directly
affect the development of other
populations of organisms such as
zooplankton and fish and, consequently,
affect the trophic web structure. Where
algal bloom collapse and decay occurs, the
resultant loss of oxygen through
degradative processes can result in fish
kills.
3.1.3 Biological factors
Trophic web interactions and ecosystem
degradation
Imbalances in trophic web structure can
and does have profound impacts on the
functioning of aquatic ecosystems, and
especially in shallow environments. In
recent years it has become profoundly
apparent that shallow lake systems exist in
one of two alternative and stable
conditions, either dominated by
macrophytes (see below), or by
phytoplankton. The eutrophication-
associated progression from the one
condition to the other is usually influenced
by the regulation of water levels that
previously exhibited a high level of natural
variability. These effects typically
become apparent as amplified “top-down”
control, for example with over-grazing of
zooplankton by fish, leading to excessive
and uncontrolled development of algae.
Restructuring of the “top-down” control
pathways through the deliberate
management of fish populations can have
profound and beneficial consequences
(e.g. Moss 1990; Scheffer et al. 1993;
Harding and Wright, 1999). Similarly, the
relief of seemingly intangible cause-and-
effect pathways through the imposition of
water level variation in regulated systems
serve to strengthen ecosystem functioning.
Macrophytes
The presence of healthy stands of rooted
aquatic macrophytes plays a crucial and
frequently overlooked role in determining
the extent of phytoplankton, including
cyanobacterial development. The
presence of submerged pondweeds is most
often challenged by the need to be able to
enjoy unhindered recreational pursuits.
Examples of the ill-advised or unwitting
eradication or over-control of plants such
as Potamogeton spp. resulting in noxious
11
algal dominance are legio. What is not
realized is the suite of benefits provided
by these plants – an array of functions that
encompasses much of the foregoing
summary of factors that influence
phytoplankton, and particularly
cyanobacterial dominance, namely:
Stabilization of sediments by the
plant roots;
Uptake of nutrients through both
the root zone and the leaves of the
plant;
Provision of refugia for
zooplankton that feed on algae;
Provision of shelter and habitat for
juvenile fish;
Provision of physical attachment
surface for a host of beneficial
epiphytes;
Provision of food and nesting
material for species of waterfowl.
The health of hydrophytes is often
severely impacted by water level
regulation, and the destruction of natural
variability with respect to water level
variations. This leads to impoverished
stands of rooted submerged plants, and
consequent loss of faunal habitat, and
concomitant strengthening and
encroachment of monospecific stands of
emergent species such as Typha, again
with few opportunities for habitat
development. Accordingly, regulated
eutrophic lakes in the arid to semi-arid
zones tend towards turbid, phytoplankton-
dominated open water areas surrounded by
dense and largely impenetrable bands of
reeds, and with an abrupt interface
between the shoreline and the open water,
and with the latter dominated by coarse
species of fish. This condition lends itself
to self-reinforcement and perpetuation.
12
3.2 Consequences of
cyanobacterial aggregations
(“blooms”)
Cyanobacterial blooms impact on the
health of aquatic ecosystems, and the users
thereof, in a number of ways. These
impacts include loss of aesthetic appeal,
turbid water, increased sedimentation, cost
implications for water treatment, health
threats as a consequence of toxicity,
reduced recreational use value and
ecosystem degradation, including that of
downstream environments. Some of the
dynamics that are involved are self-
reinforcing, with the consequence that the
problem becomes increasingly ingrained
and resistant to rehabilitation.
13
3.3 Implications for human
health
The health-related impacts of
cyanobacterial toxins on human and
animal health have been extensively
documented, and have been referenced in
the Suggested Reading section of this
document. Sufficient for the purposes of
this document, is that more than 60
cyanobacterial toxins are now known to
exist. This suite of compounds includes
hepatotoxic and neurotoxic alkaloids,
hepatotoxic peptides and
lipopolysaccharide endotoxins. A wide
range of fatal incidents of toxicosis,
involving domestic and stock animals, has
occurred around the world. Dramatic
incidents of human fatalities occurred
recently in South America, and reports of
non-fatal, cyanobacterial toxin induced
symptoms are legio.
14
3.4 The monitoring and
management of algal blooms
A variety of management strategies for
cyanobacterial blooms have emerged
during the past decade. Almost without
exception, these are based on the UK and
Australian models that resulted from the
incidents of toxicosis that occurred in
these countries (NRA, 1990; Ressom et al.
1993 and UKEA, 1998a), and detailed in
WHO (1999). These protocols are based
on a step-wise response to the exceedance
of “Alert levels” based on cyanobacterial
presence, numerical density and evidence
of toxins. A similar protocol was
formulated for South Africa (Quibell et al.
1995). Similar in-house response
procedures have been adopted by the
larger South African water utilities.
15
4. A GLOBAL PERSPECTIVE
OF CYANOBACTERIA
Cyanobacterial problems have emerged
during the past decade as a problem of
international consequence. The cause-
and-effect pathways of eutrophication and
water level regulation do not recognize
international boundaries, and the issues
dealt with in this review are indeed
cosmopolitan. In arid regions such as
Southern Africa, cyanobacterial problems
pose a considerable and significant threat
to the sustainable use and management of
scarce and diminishing water resources.
An examination of the global situation
clearly shows that the problem, although
evident through infrequent but sudden
blooms of varying toxicity and magnitude,
is certainly not static. Research efforts
continue to document the discovery of
new variants of toxins, and incidents of
poisoning continue to occur. It is perhaps
unfortunate that no central registry of
verified poisoning events is available.
Considerable effort is being made on a
number of fronts to delve deeper into the
physiology and bimolecular functioning of
the potentially toxic cyanobacterial
genera, and to seek the initiators and
pathways that trigger production of toxins
by these organisms. Work on the
relationships to cancer initiation and
promotion are also receiving attention.
Given the intermittent nature of the
problem, funding for cyanobacterial
research is difficult to come by, and
research effort is fragmented to very few
institutions located around the world.
Often the research is driven more by
personal interest than by grant funding
provided for the specific purpose. As the
problem is greater than the sum of the
parts of the whole, it is essential that inter-
programme communication and the
dissemination of information can
overcome the temporal limitations of
publishing first via the scientific literature.
On a global scale, incidents of toxicosis
remain largely confined to the poisoning
of domestic animals, livestock and,
occasionally, wild animals. An incident
involving 2 000 cases of gastroenteritis
and the associated 88 deaths of dialysis
patients in Brazil, and the more recent
1996 case in Caruaru, Brazil where more
than 60 dialysis patients died, constitute
the only verifiable and documented fatal
cases of cyanobacterially-linked human
poisonings (Codd and Bell, 1998;
Jochimsen et al. 1998; Pouria et al. 1998).
The ability to detect and resolve
cyanobacterial toxins in a variety of
sample matrices advanced by leaps and
bounds during the 1990s. The
methodologies remain costly and were
confined to use within relatively well-
equipped laboratories. This level of
sophistication often initiates a call for an
16
easy-to-use field method, possibly coupled
to some form of colour reaction. While
this has not been forthcoming to-date, the
apparent rarity of toxic incidents, the
likely need to verify any field assessment
in a quantitative manner, the availability
of animal (mouse) testing and the probable
high cost and limited shelf life of the
envisaged test kit should be offset against
the costs of transporting samples to distant
laboratories. In many cases the use of
international courier services for the
sending of samples to laboratories on other
continents provides a cost-effective means
of analysis.
Much effort, time and expense is being
spent on developing predictive ability, i.e.,
the ability to forecast whether or not a lake
or impoundment has the propensity to
develop potentially problematical
cyanobacterial blooms. While this
approach has some validity, it remains an
“end-of-pipe” symptomatic and most often
futile means of living with the problem.
The prevention and management of the
causes and consequences of eutrophication
are neither easy nor cost-friendly, but they
cannot be ignored. A practical and
pragmatic two-pronged preventative
approach, aimed at both eutrophication
and the understanding of the
cyanobacteria, needs to be encouraged and
interlaced on a global scale.
17
5. THE SOUTH AFRICAN
PERSPECTIVE
5.1 Historical overview – the
early discoveries
The pioneering work of D G Steyn
In South Africa, Dr D.G. Steyn (1945)
noted that over a period of twenty-five to
thirty years, the deaths of ‘many
thousands’ of stock (horses, sheep, cattle
and rabbits) around pans in the north-
eastern Free State and south-eastern
Transvaal had been reported by farmers in
the region who referred to the condition as
‘pan sickness’. The first deaths suspected
to be due to algal poisoning were brought
to the attention of staff at Onderstepoort
Veterinary Laboratories by farmers from
the Amersfoort district in 1927 (Steyn
ibid) and another case was reported from
Wakkerstroom in 1942.
Veterinary officers sent to investigate the
Wakkerstroom pan found that once the
pan had been fenced off, the apparent
disease ceased immediately. However,
water samples taken from this pan failed
to reach Onderstepoort in a condition that
would have allowed reliable experiments
to be carried out. Algal poisoning could
not definitively established as being the
cause of death. It was only after the
construction of the Vaal dam in 1938 that
this was achieved.
As the newly constructed dam began to
fill, extensive areas of fertile farmland
were inundated by the rising waters,
resulting in eutrophic conditions and the
appearance of a bloom of blue-green algae
which Edith Stephens (1949) estimated as
covering up to 98% of the dams’ surface
area. During the summers of 1942 and
1943, numerous stock deaths were being
reported on farms adjacent to the dam and
those located along the banks of the Vaal
and Wilge rivers where the waters from
these rivers overflowed into pans and
vleis.
In 1943 Dr Douw Steyn, then Head of the
Department of Pharmacology and
Toxicology at Onderstepoort Laboratories,
was sent to investigate. He reported
seeing many animals (horses, mules,
donkeys, dogs, hares, poultry, waterbirds
and fish) lying dead near the banks and
described the water as being the colour of
‘green pea soup’ with dense mats of algae
floating on the surface (Steyn 1945). A
light breeze was sufficient to drive the
floating mats of algae to the shallows
where they would decay, changing colour
to a dark purple and sometimes staining
the water red. It was found that high
incidences of stock mortality were usually
associated with prevailing winds - thus
mortality would occur on the western
banks on one day, and on the following
day, on the eastern banks as the direction
of the wind changed. Through
experiments conducted on-site and later,
18
through controlled feeding of animals at
Onderstepoort, Steyn was able to confirm
that it was indeed the algae that were
responsible for mortality. From these
experiments, he reached the following
astute and entirely accurate conclusions:
the algal-infested water was
poisonous;
fresh growing algae was poisonous
and the poison was discharged into the
water when the organism died;
the process of decay reduced toxicity
and dried algae was less poisonous
than fresh algae;
the toxicity could not be reduced by
boiling;
experimental animals administered
with polluted water displayed the
same symptoms as the cattle, sheep
and dogs which had died at the Vaal
Dam;
control of the bloom could be effected
by the application of copper sulphate;
the degree of poisoning depended
upon the quantity of algae consumed.
Steyn identified two toxic components
associated with the alga: (1) a toxin, which
affected the nervous system and liver and
(2) a toxin that caused photosensitisaton of
the skin (Steyn 1943). He described the
first toxin as ‘one of the most potent liver
toxins known’, which, in acute cases,
destroyed the liver cells within a few
hours. The second substance, causing
staining of the water in the pans, was
identified by Polson (Steyn 1943) as the
phycocyan chromoprotein. Steyn (1943)
suggested that the phycocyan reached the
blood of the animal and absorbed the
ultra-violet rays of the sun, causing the
skin lesions (photosensitisation) which
were so characteristic in cases of algal
poisoning. Typical symptoms of
poisoning included constipation, blood in
the faeces, a drop in milk yield, lesions on
the skin and jaundice as a result of liver
damage (Steyn 1945). Symptoms of more
severe poisoning included progressive
paralysis sometimes accompanied by
‘strychnine-like convulsions’ (Steyn
1945), coma and eventually death (Louw
1950). Typical post mortem symptoms
included necrosis of the liver cells and
haemorrhaging (Smit, cited in Louw
1950).
The blue-purple, fluorescent-coloured,
material was identified by Dr Polson as
phycocyanin, and it was found that if the
liver was damaged by the first poison, this
was taken up directly by the blood.
At that point of these incidents, the alga
responsible had only been recorded from
the eastern Transvaal and north eastern
Free State.
Steyn categorized the cases into peracute,
acute, sub-acute and chronic, depending
on the quantity of algae consumed.
Peracute cases were generally found dead
near the water’s edge. The symptoms
19
were deemed to be similar to those of
strychnine poisoning. In other cases, the
animals were overcome by an encroaching
paralysis. In acute and subacute cases, the
symptoms described above were
prolonged over a period of one to two
weeks. Jaundice-like conditions were
evident in some cases, and inflammation
and light sensitivity were evident in the
nasal membranes, ears and parts of the
skin. The affected animals’ faeces were
hard and often coated in a bloody slime.
In chronic cases, these symptoms were
recorded to last several weeks or months.
Other symptoms included emaciation, a
poor appetite and reduced milk
production.
Post-mortem analysis revealed blood in
the lungs, an enlarged liver that was often
dark red in colour (sometimes black).
Blood was occasionally found in the
intestines. In chronic cases, a light yellow,
bloody liquid was found in the
pericardium, chest cavity and peritoneum.
Steyn proposed methods of controlling the
algae, including copper sulphate,
suggesting a concentration of ‘one pound
for every 200 000 gallons of water. A
year prior to the writing of Steyn’s article,
the then Department of Irrigation treated
the dam by dosing it with copper sulphate,
released from a motorboat. Between the
1st of June and 30th September 1943, 360
tonnes were dissolved into the dam
(equivalent to 1-pound/300 000 gallons of
water). This cleared the algae from the
dam, until six months later, when a new
bloom developed. No further deaths were
recorded from September 1943 onwards.
It was believed that further infection of the
major irrigation dams could be avoided
only if the minor dams and pans in their
catchments were kept clear of
cyanobacteria. The alga was declared a
weed and a campaign was launched by the
Department of Agriculture and Forestry to
eradicate it. Unfortunately, no records of
this campaign appear to have been kept.
The American scientist, Theodore Olsen,
was the first person to document the
association between cyanobacterial genera
and the mortality of stock animals. It is
interesting to note that Olsen’s work was
conducted during the period 1948 to 1950,
i.e. during the same period that Steyn was
publishing the findings of his South
African experiences.
(see also Steyn 1944 and 1949).
20
The contributions of Edith Stephens
Edith Stephens, the doyen of South
African limnologists, examined the algae
from several locations including the Vaal
Dam, Bon Accord Dam and Spaarwater
Mine Dam in the Transvaal, and
Zeekoevlei and Rondevlei on the Cape
Flats (Stephens, 1949). She established
that the alga responsible for the poisoning
was a previously undescribed species of
blue green algae similar to Microcystis
aeruginosa Kutz. and named this new
species Microcystis toxica. Like M.
aeruginosa, M. toxica had spherical cells
containing 3-8 gas vesicles and cells
formed colonies which were bound by a
colourless gelatinous matrix which was
secreted by the individual cells. However,
she found that M. toxica differed from
M. aeruginosa in several respects
(Stephens, 1949):
M. toxica formed sponge-like colonies
which became hollow with
peripherally arranged cells;
M. toxica formed a framework of
close-packed cells which joined to
form a well-defined reticulum;
M. toxica colonies attained a size of
2.5 mm, larger than M. aeruginosa
which averaged 0.5 mm;
M. aeruginosa was found not to be
poisonous;
Decaying M. toxica was found to emit
a strong, unpleasant odour and dry in a
blue-purple scum, whereas M.
aeruginosa was found to be less
strong smelling, forming a milky-
white scum upon decay.
Herbarium records of Stephens’
collections are still housed in the Bolus
Herbarium at the University of Cape
Town.
21
5.2 Scientific research in South
Africa
5.2.1 Introduction
The following introductory excerpt is
extracted verbatim from a chapter
prepared by Pieter Thiel of the Medical
Research Council for a chapter published
in Environmental Medicine (Thiel, 1999).
‘Attempts to isolate the toxic principles
responsible for [these] dramatic
hepatotoxic effects started in the 1950s.
Most of the attempts in the USA, Australia
and South Africa were aimed at the
isolation of the hepatotoxic secondary
metabolites of strains of Microcystis
aeruginosa. Although the first indication
that these toxins were peptides was
obtained in 1959, it was not until 1982 that
the breakthrough was made in the isolation
and structural clarification of the first
hepatotoxins from M. aeruginosa by Dr
Dawie Botes and colleagues from the
South African Council for Scientific and
Industrial Research in Pretoria, South
Africa. The group of cycloheptapeptide
toxins isolated was given the name
cyanoginosins by Botes, but was
subsequently renamed microcystins. Six
years after the identification of the
microcystins another cyclic peptide
hepatotoxin was isolated and identified
from the filamentous cyanobacterium
Nodularia spumigena. Professors
Carmichael and Rinehart from the USA
and Dr Kaarina Sivonen from Finland
described the structure of a cyclic
pentapeptide hepatotoxin, nodularin,
which had some features in common with
the cyclic heptapeptide toxins from
M. aeruginosa (this discovery was made
in 1988, some 110 years after Francis
linked Nodularia to the deaths of animals
at Lake Alexandrina).
In 1959 Bishop and co-workers were the
first to demonstrate the peptide-like nature
of the hepatotoxins from M. aeruginosa.
Subsequent workers over the next two
decades in the USA, Australia and South
Africa were in agreement about the
peptide nature of the toxins, but reported
conflicting results on the composition of
the toxins they isolated (probably from
impurities or from the presence of more
than one toxin in their preparations).
Contributing to the difficulties in
elucidating the structure of the
hepatotoxins was the fact that they proved
to be cyclic peptides and contained
unknown amino acids in their structures.
The toxins proved to have no free amino
groups and yielded some methylamine
upon hydrolysis that eventually proved to
be a hydrolytic breakdown product of
N-methyldehydroalanine. The absence of
free amino groups and resistance towards
enzymatic digestion precluded the use of
the classical approach, using the Edman
procedure, in sequencing the amino acids
in the structure of the toxins.
22
The major breakthrough by Botes and co-
workers in elucidating the structures of the
hepatotoxins necessitated the use of a
variety of chemical and physical
techniques. Apart from the classical use
of chromatographic techniques to isolate
and identify hydrolysis products, use was
made of nuclear magnetic resonance
(NMR) and both electron impact and fast
atom bombardment mass spectrometry
(MS). They eventually showed that one
strain of M. aeruginosa was capable of
producing more than one toxin, and that
these toxins were all monocyclic
heptapeptides containing both D- and L-
amino acids.
23
5.2.2 A chronology of cyanobacterial
research in South Africa
Three distinct periods of activity can be
distinguished in South Africa’s history of
studies on cyanobacteria and their toxins:
1927 to 1970
The first cases of cyanobacterial poisoning
recorded in South Africa were diagnosed
by Dr DG “Douw” Steyn of the
Onderstepoort Veterinary Institute. These
occurred at a pan in the Wakkerstroom
area of the then south-eastern Transvaal.
The algae were responsible for the deaths
of horses, sheep, cattle, rabbits and water
birds. Thereafter, during the following 25
years, thousands of stock animals died
from algal poisoning. These incidents
were carefully documented by Dr Steyn.
The most serious cases were recorded
during the period 1941 to 1943, shortly
after the Vaal Dam was filled for the first
time. Many thousands of animals died,
including mules, donkeys, dogs, rabbits
and poultry. Steyn undertook a series of
pioneering investigations, and formulated
a number of erudite and entirely correct
assumptions regarding the toxins produced
by this group of organisms (see elsewhere
in this review). The vast blooms present
in the dam were subsequently treated with
copper sulphate, and no further poisonings
were reported from the area.
During the 1950s, PG Louw, also working
from Onderstepoort, succeeded in
isolating the poison from cyanobacteria
present in the nearby Bon Accord Dam.
He tentatively identified it as an alkaloid.
Subsequent to Louw’s investigations no
other cyanobacterial-related findings
emerged during the remainder of the
period to the end of the 1960s.
1970 to 1989
The onset of the 1970s saw a flurry of
activity on a number of fronts in the
cyanobacterial field. Central to this was
the reporting of an increased incidence of
poisonings during the early years of the
decade (e.g. Tustin et al. 1973; Scott,
1974). An awareness of the burgeoning
threat to the scarce water resources of an
arid South Africa, and the apparent cause
and effect links between this phenomenon
and cyanobacteria, was just cause for
attention. It may be argued, however, that
greater effort should have, and still needs
to be, paid to the ravages of our surface
waters through the ill-managed causes of
nutrient enrichment. During the same
period the foundations of the later multi-
disciplinary studies of the Hartbeespoort
Dam limnology (eutrophication) study
(NIWR, 1985) were being laid through the
interests of researchers based at the then
National Institute for Water Research of
the CSIR.
24
During 1977, a multi-departmental
investigation was initiated to undertake the
following tasks:
To obtain information on the types of
cyanobacteria capable of producing
toxins, and to describe the conditions
under which they did so;
To investigate methods for the control
of toxic algae;
To determine the chemical structures
of the toxin(s) involved, and to
develop methods to measure these
toxins in water;
To investigate the pathology of the
toxins on test animals in order to
determine safe exposure levels for
humans;
To investigate which water treatment
processes were necessary in order to
provide adequate levels of protection
for consumers of potable water.
The passage of time was to reveal just how
ably these goals were met.
This study was afforded a ten-year time
span, funded by the Department of
National Health and Population
Development and the NIWR, and was
prepared under the direction of W E
(Willem) Scott of the NIWR. The core
team of researchers comprised:
Dr DP (Dawie) Botes (National
Chemical Research Institute, and later
University of Cape Town);
Mr CA (Charl) Bruwer (Hydrological
Research Institute – now the Institute
for Water Quality Studies);
Professor JN Eloff (University of the
Orange Free State and later the
Kirstenbosch Botanical Gardens);
Miss PS (Sally) Gathercole (Research
Insitute for Nutritional Diseases, later
with the PROMEC division of the
Medical Research Council);
Mr JH Haumann (Microbial Genetics
Unit of the Medical Research
Council);
Dr K Jaskiewicz (Research Insitute for
Nutritional Diseases);
Dr E (Ella) Johanssen (National
Chemical Research Institute);
Dr TS Kellerman (Onderstepoort
Veterinary Research Institute);
Dr R (Rifka) Kfir (National Chemical
Research Institute, later with the
NIWR);
Professor GHJ (Gert) Kruger,
(University of the Orange Free State);
Dr PG (Pieter) Thiel (Research
Institute for Nutritional Diseases, later
with the PROMEC division of the
Medical Research Council);
Dr AJ van der Westhuizen (University
of the Orange Free State).
This mammoth effort spawned a number
of concomitant and interrelated
investigations and studies, as will be
apparent from the contents of this review.
The project was completed in 1987 (Scott,
1987), and it is not known whether a final
25
report was ever prepared. Rationalization
of the activities of the CSIR during the
same period saw an abrupt end to a
groundbreaking period of research into
both cyanobacteria and the limnology of
impounded waters (NIWR, 1985), and
with the research team disbanding to
pursue new career options or directions.
Nonetheless, the efforts of Scott’s team
had ensured that all of the project goals
were met, and the conclusions drawn and
technical achievements made were
recognized internationally as being of
enormous significance to the
understanding of a global problem.
Willem Scotts’ final publication on the
subject (Scott, 1991) detailed the range of
cyanobacterial genera that had been found
in South Africa, and the geographic
distribution.
1990 to 1999
Insofar as South Africa was concerned, the
closing years of the 1980s yielded little for
the cyanobacterial field. The country was
also now without any formal means of
having cyanobacterial or water samples
analysed for toxins. In the western Cape,
and despite opinions to the contrary, it was
becoming increasingly apparent that the
acid waters of the region were showing
alarming signs of potential cyanobacterial
problems. The recently commissioned
Theewaterskloof Dam, the single largest
water storage for the Cape metropole had
been plagued from the outset by taste and
odour problems caused by Anabaena
solitaria. This caused WR (Bill) Harding
to begin to lobby the then City of Cape
Town authority to heed the signs and to
put in place mechanisms for determining
whether or not toxins were also present.
At that time, an ill-advised myth had led
many to believe that if taste and odours
were present, toxins would not be!
At the same time, the then Umgeni Water
Board was also experiencing problems
with cyanobacterial blooms in certain of
its impoundments. The need to be able to
screen for the presence of toxins was
becoming increasingly essential. During
1992 six South Africans attended a
working meeting on detection methods for
cyanobacterial toxins convened at the
University of Bath, UK. Those attending
were:
Dr Henk van Vliet (IWQS,
Department of Water Affairs and
Forestry);
Dr Bill Harding (Department of
Scientific Services, City of Cape
Town);
Dr Bruce Rae (Umgeni Water);
Dr Pete Ashton (CSIR);
Dr Clark (CSIR);
Dr Thys Pieterse (Water Research
Commission)
The proceedings of this symposium (Codd
et al. 1994) indicated that the concerns
26
being experienced in South Africa were by
no means unique, and that scientists were
wrestling with similar problems in many
different countries. A variety of potential
analytical methods were proposed, the
most suitable of these appearing to be the
HPLC technique developed in the
laboratory of Professor Geoff Codd of the
Department of Biological Sciences,
University of Dundee (Lawton et al.
1994). Subsequent to the Bath
symposium, Bill Harding and Bruce Rae
spent time separately at Dundee to study
the technique used in order to use it under
South African conditions. The so-called
“Codd” method was later to become the
UK “Blue Book” reference method for
resolving and quantifying cyanobacterial
hepatotoxins, and is now used widely
throughout the world (see WHO 1999, or
UKEA, 1998b) for full details of the
analytical procedure).
During 1994 the City of Cape Town,
following the undisputed appearance of
toxins in the Theewaterskloof Dam,
established the then only laboratory in
Africa that was fully dedicated to the
analysis and quantification of
cyanobacterial hepatotoxins. Shortly
thereafter, Dr Elsie Meintjies of Rand
Water established a mirror facility at their
laboratories in Vereenigning, but it was
some years before this came into full
operation. Harding also assisted the Water
Utilities Corporation in Gaborone,
Botswana, to set up and commission an
identical procedure. Umgeni Water
adapted existing HPLC operations to
accommodate the method in support of
their studies on cyanobacteria in their
impoundments and pipelines. The
laboratories of IWQS were utilizing a
similar technique, but using an isocratic
method. During the late 1990s,
Dr Gordon Shephard of the MRC in
Parow, Cape Town, upgraded his HPLC
technique from that used by Sally
Gathercole and Pieter Thiel (1988) to the
“Codd” method.
The establishment of the laboratory in
Cape Town took place not a moment too
soon. The mid-1990s saw an explosion of
incidents of cyanobacterial toxicosis
throughout the western and southern Cape,
culminating in the largest single stock
death since the incidents described by
Steyn during the 1940s (see elsewhere in
this review).
During 1994, Professor Codd visited
South Africa to evaluate the performance
of the City of Cape Town’s laboratory,
and to assist the IWQS with the
formulation of an action plan, similar to
those already in place in the UK and
Australia, for dealing with the threats and
problems posed by cyanobacteria. The
resultant document, authored by Gavin
Quibell, stalled at the draft stage, only to
be revisited after the formation of the
Toxic Algal Forum (Quibell et al. 1995).
27
The closing years of the 90s saw a
worrying lull in attention to issues
pertaining to cyanobacteria. The
swansong of the CSIR-driven programmes
was a short course entitled Algae in Water
– Problems and Treatment held during
August 1989. This meeting dealt,
essentially, with the last objective of the
10-year programme, namely water
treatment options for dealing with
cyanobacterial in raw potable water
sources. Research activities were now
largely confined to the grey-area records
of water utility operations; the proposals
made to national government had
apparently fallen on deaf ears, and no
‘torch-carriers’ prepared to champion the
problem were coming to the fore.
During 1998 a group of concerned
scientists met at Rand Water in Alberton
to convene what became known as the
Toxic Algal Forum (TAF).
During 1999, the Water Research
Commission (WRC) convened two
workshops at the Rhoodevallei Conference
Centre in Pretoria. The first placed the
problems facing South Africa in both
international and local perspective.
Professor Geoff Codd of the Department
of Biological Sciences, Dundee
University, Scotland attended this meeting
as an international specialist in the field of
cyanobacteria and their associated toxins.
The second workshop, addressed
cyanobacterial research needs, and
enlisted the input of Professor Ian
Falconer from Australia. Both workshops
resolved that a review of the South
African experiences relating to
cyanobacteria was necessary in order to be
able to meaningfully evaluate new
research proposals and needs. The need
for this document was born.
28
5.2.3 International working links
Between 1980 and 1999, South African
researchers maintained working contacts
with three overseas specialists, namely Dr
Wayne W. Carmichael of Wright State
University, Ohio, USA; Professor Geoff
A. Codd, University of Dundee, Scotland;
and Professor Ian Falconer, University of
Adelaide, Australia. Their involvement,
connections and involvement are
summarised below:
Wayne W. Carmichael
Wayne Carmichael’s links to South Africa
began at a conference he organised in
Dayton, Ohio, during 1980. Several South
African scientists, viz. Eloff, Haumann,
Kruger, Scott and van der Westhuizen
were invited to attend. Subsequently,
Wayne visited South Africa during 1982
and 1985, the latter visit being for the 6th
IUPAC symposium on Mycotoxins and
Phycotoxins. On that occasion he visited
Willem Scott, Dawie Botes and Pieter
Thiel. His contact with South African
researches was renewed during 1992 at the
Bath symposium on detection methods for
algal toxins, and subsequently, through
visits to Dayton by Johan Grobbelaar and
Machiel Steynberg.
Geoffrey A. Codd
Geoff Codd’s influence in South Africa
has been mainly through the application of
the HPLC method, developed in his
laboratory, for the detection and resolution
of cyanobacterial hepatotoxins (see
elsewhere in this review). He also made
contributions towards the development of
cyanobacterial awareness and related
policy development in South Africa.
Following the 1992 Bath Symposium, two
South African delegates, viz. Bill Harding
and Bruce Rae, independently visited
Dundee to view the HPLC technique
before utilising it locally.
Geoff visited South Africa on several
occasions during 1993, 1994 and 1999,
during which visits he contributed to
various meetings, seminars and
workshops, provided specialist advice and
guidance to Umgeni Water, Rand Water,
the Water Research Commission, Cape
Town City Council and the Department of
Water Affairs and Forestry (DWAF). His
input was instrumental towards the
development of the as yet unpublished
DWAF policy for a national surveillance
programme for cyanobacteria (see
elsewhere in this review). At the 1999
Rhoode Vallei symposium Geoff delivered
the plenary lecture dealing with the global
perspective on cyanobacteria, and was
appointed as the Overseas Correspondent
for the Toxic Algal Forum.
29
The first Western Cape toxin analyses,
from the 1993 incident at Theewaterskloof
(see elsewhere) were undertaken in the
Dundee laboratories, as were the samples
from the 1994 animal poisoning incident
at Zeekoevlei. Subsequently the City of
Cape Town established its own dedicated
toxin analysis and detection facility at its
Athlone laboratories during 1994, and
Geoff Codd continued to provide
collaborative support and guidance. He
also visited the Cape Town laboratory
during 1994 to evaluate its performance.
Ian Falconer
Ian Falconer and Maria Runnegar
(Armidale, University of New South
Wales, Australia), and the South African
group of Dawie Botes and Willem Scott et
al. were in contact from the mid-1970s.
The joint interest of this work was the
elucidation of the structure of the
microcystins (see Botes et al. 1985).
Runnegar and Falconer (1982) had
published the structure of their variant, the
tyrosine methionine form, but missed the
dehydroalanine because it broke down,
and the ADDA moiety was unknown at
the time. Dawie Botes subsequently sent
the compounds to Cambridge for analysis,
and derived the first accurate structure (see
elsewhere in this review). Ian Falconer’s
direct links with South Africa were
restored during 1999 when he was invited
to give a plenary address and expert input
to the WRC workshop on Algae and
Endocrine Disruptors held at Rhoodevallei
during October 1999.
30
6. SOUTH AFRICAN
CONTRIBUTIONS TO THE GLOBAL
UNDERSTANDING OF THE
ECOLOGY AND TOXICOLOGY OF
CYANOBACTERIA
Subsequent to the pioneering work by
Steyn (see above), South African research
into cyanobacteria spanned the following:
Nature and structure of the
microcystins
Ecology and physiology
Isolation and cultivation
Ecological field studies on algal
blooms
Hartbeespoort Dam project (NIWR)
Vaal River studies
Management of blooms
Researched incidents of toxicosis
Toxin removal from water supplies
Cyanobacterial investigations in South
Africa post-1990
31
6.1 Elucidation of the nature
and structure of the microcystins
Prior to the definitive work on the
structure of microcystins performed in
South Africa by Eloff, Botes and
colleagues, the following research had
been conducted elsewhere.
− Bishop (1959) isolated an endotoxin
from Microcystis NRC-1 isolated from
a strain cultured from a natural bloom
from Little Ridean Lake, Ontario,
Canada. The toxin was found to be of a
peptide nature, and comprising seven
amino acids and ten residues.
− Murthy and Capindale (1970) isolated
toxin from same Microcystis strain as
did Bishop. He found fourteen
different amino acids in the acid
hydrosylate of the toxin.
− Rabin and Darbre (1975) purified the
toxin and found most of the common
amino acids and ornithine to be
present.
− Kirpenko et al. (1975) isolated a toxin
of molecular weight 19 400 ± 1 400
from a bloom of Microcytis aeruginosa
from Dnieper basin. Consisted of
acetomethylene, isothiocyanate,
carbohydrate groups, 16.6% peptide
and disulphide cross-linking bonds.
− Elleman et al. (1978) isolated a toxin
from a bloom of M. aeruginosa in
Malpas Dam Reservoir, New South
Wales, Australia. Using hydrolysis he
determined this to be a pentapeptide
(i.e. a nodularin-type toxin) with
equimolar quantities D-Ala, D-Glu,
erythro-β-CH3- Asp, L-Tyr and
methylamine.
The active constituent of the poisonous
algae, Microcystis toxica Stephens (Louw,
1950)
In 1950, P.G.J. Louw, a biochemist at
Onderstepoort, succeeded in isolating the
poison and tentatively identified it as an
alkaloid. The experiments were carried
out on M. toxica (Stephens) collected from
the Bon-Accord Dam near Onderstepoort.
Louw found that, when separated from
fresh algae, the watery filtrate was inactive
and that only once the algae began to
decay did the toxin leach into the water.
Experiments on rats and rabbits confirmed
that the concentration of toxins in the
water varied considerably from season to
season - being highest at the end of
summer. He also found that the rabbits
appeared to develop immunity after
several doses of the poison. Louw did not
elaborate on this very interesting, yet
incorrect, observation.
32
Experimental cases of algae poisoning in
small animals (Smit, 1950)
Smit (1950) observed that sudden death
could occur within half an hour after
injection or oral administration of the
alkaloid in small animals. Symptoms
included restlessness, anaemia, dyspnoea,
progressive paralysis, coma and eventually
death. Chronic cases revealed cirrhosis of
the liver.
Post mortem analysis revealed
bloodstained ascites, tumour splenis,
hyperaemia of the kidneys and necrosis of
the liver, blood stasis and haemorrhages.
The liver was dark red. Histopathological
examination of test animals revealed:
Spleen: well-defined malphigian
tubules
Kidney: blood stasis, slight
nephrosis in acute cases
Liver: severe necrosis of the hepatic
cells in acute cases. Karyorrhexis,
blood stasis, haemorrhages and fatty
degeneration.
Examination of toxic and non-toxic
Microcystis aeruginosa in the field and
laboratory culture (Scott 1979 and 1986)
Zehnder and Gorham (1960, cited in Scott
1986) demonstrated that M. aeruginosa
loses its colonial habit when grown under
laboratory conditions. Eloff (1981)
indicated that, in some cases,
M. aeruginosa lost its ability to form gas
vacuoles in laboratory cultures, rendering
the Microcystis cultures indistinguisable
from other genera such as Synechocystis
and Aphanocapsa. Thus, while field
samples may be adequately identified
using morphology, identification of
laboratory cultures with altered
morphology may present problems.
Scott further showed that two forms of
Microcystis, namely M. aeruginosa forma.
aeruginosa and forma flos-aquae were
easily distinguished on the basis of colony
morphology from the freshly collected
field material. Percentage composition of
the two strains from fixed sampling point
on the Hartbeespoort Dam showed that the
toxic M. aeruginosa forma aeruginosa
was dominant, whereas the non-toxic M.
aeruginosa forma flos-aquae formed a
significant proportion of the
phytoplankton population only during the
winter months. Harding (1996) has
observed that in many eutrophic vleis in
the western Cape, dominance by
Microcystis is typically in the form of the
non-toxic forma flos-aquae variant, and
appearance of M. aeruginosa forma
aeruginosa almost always associated with
toxicity.
Scott found that laboratory cultures of
M. aeruginosa were found to undergo
changes including loss of colonial growth
33
habit and sometimes gas vacuoles, making
it impossible to distinguish toxic and non-
toxic strains.
Loss of colonial growth habit is associated
with changes in the hydrophobicity of the
surface of the cells and reduced ability to
form mucopolysaccharides that may be
required for colony formation. The
reasons for the loss of the colonial habit
could not be explained, but demonstrated
the need for physiological, chemical and
genetic tools was demonstrated in order to
be able to undertake laboratory
identification.
Microcystis toxins: isolation,
identification, implications (Toerien et al.
1976)
Toerien et al. (1976) cite Louw (1950) as
suggesting that the M. toxica toxin was an
alkaloid. Hughes et al. (1958) suggested,
however, that M. toxica may be related or
the similar to M. aeruginosa forma
aeruginosa, and that the toxin may be an
acidic cyclic peptide. In this paper
Toerien and co-workers set out to clarify
the nature of the toxin produced by M.
aeruginosa forma aeruginosa from the
Hartbeespoort Dam.
Results suggestsed that Louw’s (1950)
conclusion that the toxins were alkaloid
was erroneous and that the toxins were
similar to those identified by Hughes et al.
(1958) as being polypeptides.
Preliminary study of the toxins of different
Microcystis strains (Amann and Eloff
1980)
Amann and Eloff (1980) report that the
characterisation of the toxins found in
Microcystis blooms had, at the time of
writing, led to widely divergent results
from different researchers. They
investigated toxins of six Microcystis
strains: M. aeruginosa NRC-1 (UV-001)
(Rideau Lake, Ontario), M. aeruginosa
(UV-006) (Hartebeespoort Dam), M.
aeruginosa (UV-007) (Gottingen culture),
M. aeruginosa (UV-010) (Witbank Dam),
M. aeruginosa (UV-018) (Gottingen
culture) and M. aeruginosa (UV-019)
(Allemanskraal Dam), using gel
chromatographic separation.
The quantity of phycocyanin extracted
from the strains differed significantly, but
this was not correlated with toxicity. The
toxic extracts from the Allemanskraal
Dam (UV-019) were found to have the
greatest difference in absorption behaviour
from all other extracts. This was ascribed
to the effect of laboratory cultivation on
the presence of the UV-absorbing
components. The difference in the
absorption patterns of UV-018 and
UV-007 (which originally came from the
34
same culture) was suspected to be due to
the difference in the cultivation history of
the two cultures and its effect on the UV
absorbing components.
The elution volume of the toxic
compounds was found to correspond to
vitamin B12, suggesting that if the
compounds were peptides, they would
have a molecular weight of 1300 daltons
or less. Based on the elution
characteristics, the authors suggest that the
toxins were similar or had similar
molecular weights. The similarity
between toxin from NRC-1 that had been
in cultivation for 25 years, and UV-001
that had been collected from a living
bloom in the Allemanskraal Dam,
suggested that toxin production is a
genetically stable characteristic. The
authors further proposed that the
differences in the toxins found by other
researchers were due to variations in
natural environmental conditions, the
extraction of mixed toxins and differences
between the extraction and fractionation
systems used.
Plasmid(s) involvement in the toxicity of
Microcystis aeruginosa (Hauman,
1981a,b)
Hauman investigated the possible
involvement of plasmids in toxin
production by M. aeruginosa. Plasmids
from M. aeruginosa WR70 were obtained
using mass lysis methods. Two plasmids
were found in lysates of M. aeruginosa
WR70 with molecular masses of 2.05 Md
and 5.02 Md, with the smaller plasmid
being more abundant. A plasmid of 2 Md
had been isolated from a non-toxic strain
of M. aeruginosa PCC 7005. Hauman
suspected that the 5.02 Md plasmid was
involved in toxicity, but this could not be
confirmed.
Four agents were used to test the toxicity
of M. aeruginosa (NIWR strain WR 70)
including acridine orange, which
eliminates the sex factors from E. coli
(Hirota, 1960) and cures toxigenic cultures
of Clostridium botulinum of their
prophages and toxicity (Eklund and
Poysky, 1973). Acridine orange interferes
with plasmid replication without
interfering with chromosomal replication
(Yamagata and Uchida, 1969). Sodium
dodecyl sulphate (SDS) selects for
plasmid-free cells in E. coli (Tomoeda
et al. 1968); Staphylococcus aereus
(Sonstein and Baldwin, 1972);
chloramphenicol, which eliminates the
plasmid-coded haemolysin of E. coli
(Mitchell and Kenworthy, 1977), and
streptomycin which acts as a mutagen in
the non-chromosomal genes of
Chlamydomonas (Sager 1962) (all cited in
Hauman, 1981a).
All agents tested eliminated the toxicity of
M. aerugninosa at relatively low doses.
35
No explanation could be suggested for
this. Hauman suggested that the
effectiveness of acridine orange at low
doses indicated that the genetic
determinant of toxicity could be a non-
integrated plasmid rather than a prophage,
as suggested by Vance (1977) for
M. aeruginosa NRC-1 (see also Vakeria et
al. 1985).
(see Supporting Literature)
Amino acid sequence of two toxic peptides
from Microcystis aeruginosa UV-006
(Eloff et al, 1982a)
Eloff et al. (1982a) isolated two major
toxins from Microcystis aeruginosa UV-
006 using gel chromatography and high
performance liquid chromatography.
Toxin ‘A’ was found to comprise: β-
methyl aspartic acid, D-glutamic acid, D-
alanine, L-alanine, L-leucine and
methylamine in a 1:1 molar ratio. Toxin
‘B’ was found to have a similar
composition with L-arginine replacing L-
alanine. From the molecular weights of
toxins ‘A’ and ‘B’ (1 550 and 1 650), the
authors concluded that 15 amino acids
were present.
Partial acid hydrolysis of ‘A’ and ‘B’,
with HPLC and amino acid analysis
suggested the following sequence of
amino acids:
A = D-glx → L-ala → D-ala → L-leu → mas
B = D-glx → L-arg → D-ala → L-leu → mas
where glx is glutamic acid coupled to
methylamine and mas is β-methyl aspartic
acid.
Extraction, isolation and stability of toxins
from Microcystis aeruginosa (Eloff et al.
1982b)
Toxins were extracted from cells of
Microcystis after pre-treatment by freeze
drying and extraction using acetone,
sodium carbonate (0.1M), methanol and
ethanol (at different concentrations),
methanol-chloroform-water (12:5.3),
0.01M HCl, 1% Triton in 1.25M K2HPO4
and water (at different temperatures).
Toxicity was determined by
intraperitoneal injection of white mice.
Some loss of toxicity was found to take
place after the removal of interferring
pigments. Using gel chromatography,
Eloff et al. (1982b) found a direct linear
relationship between toxicity and the
absorbance 240 nm at 1.0 (1 cm light
path), i.e. 1 mℓ of the toxic fraction at this
absorbance was sufficient to kill 19 mice.
High performance liquid chromatography,
using different gradient and isocratic
systems, was investigated to purify the
toxins. Good separations were achieved
using octadecyl-substituted columns with
55% MeOH in 25 mM ammonium. The
36
toxins were found to be unstable at pH 4 at
room temperature and loss of 50% toxicity
was found to occur by heating the toxins
to 100°C.
An HPLC method for detecting and
resolving the microcystins (Gathercole and
Thiel, 1987)
Sally Gathercole and Pieter Thiel
developed a very functional mono-
wavelength HPLC method that separated
six microcystin variants with a high degree
of resolution. This method provided a
basis for the development of the “Codd”
method (described elsewhere in this
report).
Isolation and characterization of four
toxins from the blue-green alga,
Microcystis aeruginosa (Botes et al.
1982a,b)
Toxins were isolated from two strains of
Microcystis aeruginosa from the
Hartebeespoort Dam (90% toxic
Microcystis aeruginosa forma aeruginosa
and 10% of the non-toxic Microcystis
aeruginosa forma flos aquae), and from a
toxic strain of Microcystis aeruginosa
forma aeruginosa grown in culture
originally from the Witbank Dam.
Amino acid analysis showed
compositional similarities in the structures
of the toxic variants, as well as with the
toxin isolated by Elleman (1978) from M.
aeruginosa. Botes and co-workers
subsequently demonstrated the
configuration assignments of the amino
acid residues, and demonstrated the
presence of N-methyldehydroalanine in
the toxins from M. aeruginosa (Botes et
al. 1982b).
A specific ultraviolet absorbance band of
Microcystis aeruginosa (Eloff, 1982)
Eloff (1982) cites Amann and Eloff (1980)
as stating that the nature of toxins
extracted from M. aeruginosa strains
isolated from Canada, Australia and USSR
suggested wide differences in amino acid
composition and molecular weight,
possibly due to divergent isolation
procedures. In this paper Eloff (1982)
reported that toxins from several isolates
are always associated with a 240 nm
absorbance band. He postulated that the
ratio of the absorbance at 240 nm to other
wavelengths could provide a measure of
toxin purity.
Figures presented in the text (not
reproduced here) show the elution profile
of M. aeruginosa toxins purified by gel
chromatography on a Sephadex G-25
superfine column. Fractions 68-87 were
found to be toxic, the combined pools of
fractions A, C, D, E and F concentrated 40
37
fold were not toxic when 0.4 ml was
injected into mice. Also shown are the
absorbance spectra for fraction 81 and five
non-toxic pools. The 240 nm absorbance
maximum was only evident in the toxic
fraction.
Fractions 78, 79, 80 and 81 were used for
LD50 determination. A direct linear
relationship was obtained for toxicity and
240nm absorbance. One ml of a toxic
fraction with an A1.0cm240nm - 1.0 is
sufficient to kill 19 mice (LD50 = 0.88 A
A1.0cm240nm/kg).
Absorbance ratios of 240/220 nm or
240/260 nm were found to provide an
estimate of toxin content and/or purity.
Elution patterns of M. aeruginosa isolates
NRC-1, UV-006 and UV-027, suggested
similarities and differences. Eloff
suggested that elution patterns could be
used for fingerprinting M. aeruginosa
isolates for taxonomic purposes.
Comparative study on the toxins from
several Microcystis aeruginosa isolates
(Eloff et al. 1982c)
In this study Eloff et al. extracted the
toxins (solvent extraction) of sixteen
clonal isolates of Microcystis aeruginosa
from different parts of the world. Toxin
composition was found to be similar but
variations in toxin composition were
found. Seven major toxins were identified
in all. In most cases one or two toxins
accounted for >90% of the toxin in a
single isolate, but, in some organisms, up
to six toxins were found. β-methyl aspartic
acid, glutamic acid, alanine, methylamine
and two other amino acids in a 1:1 molar
ratio were found in all cases. Other amino
acids in the major toxins included leucine
and arginine, leucine and alanine, tyrosine
and arginine, methionine and arginine,
leucine and tyrosine, alanine and tyrosine
or arginine and arginine. From toxin
composition, seven groups could be
identified, suggesting that toxin
composition may have taxanomic
significance. Differences between toxic
and non-toxic strains were found to be
quantitative and not qualitative.
Microcystis aeruginosa toxin: cell culture
toxicity, hemolysis, and mutagenicity
assays (Grabow et al. 1982)
During the early 1980s, the chemical and
toxicological properties of the compounds
in certain cyanobacterial species of algae
had not been fully established. It had been
ascertained that certain strains of
Microcystis aeruginosa produced toxins
which may have consisted of several
peptide or peptide containing toxins of
undefined structure with hepatotoxic or
neurotoxic activity (e.g. Collins 1978;
Kirpenko et al. 1970; Gorham and
38
Carmicheal, 1979). It had also been
established that the toxin now known as
microcystin (or fast-death factor) killed
mice in 1–3 h, and may have consisted of
a cyclic polypeptide containing up to 16
amino acids with a molecular weight of
between 654 to 19 400 (Collins 1978,
Gorham and Carmichael, 1979, Murthy
and Capindale, 1970; Toerien et al. 1976).
The death of mice and vervet monkeys
had been ascribed to circulatory failure
due to liver damage (Falconer et al. 1981;
Toerien et al. 1976; Tustin et al. 1973).
The short survival time suggested that
liver damage might not be the primary
cause, and that neurotoxic activity could
also be a factor (Gorham and Carmichael,
1979). Kirpenko et al. (1970) concluded
that the toxins lead to degenerative
changes in parenchymatous organs and
brain cells. Toxins had also been reported
to agglutinate erythrocytes (Carmichael
and Bent, 1981) and to be cytopathogenic
for cultures of mammalian cells (Kirpenko
et al. 1970).
Grabow and co-workers set out to
investigate the response of cells to
Microcystis toxin that had previously been
untested. They dealt with the
development and evaluation of biological
assays for the toxin and the testing of the
toxin for mutagenic activity using the
Ames/Salmonella microsome
mutagenicity assay (Ames test). Human
hepatoma cells, hamster ovary cell, fetal
rhesus monkey kidney cells, human
embryo lung cells, human cervical
carcinoma, African green monkey kidney
cells and primary vervet monkey kidney
cells were cultured, and subjected to the
following tests:
- Microtiter cell culture assays
- Hemagglutination and hemolysis tests
- Mouse toxicity tests
- Test for E. coli heat-labile enterotoxin
- Trypan blue test of cell membrane
permeability
- Bacteria
- Ames test
- Chemical toxicants and pesticides
It was found that the cells from all of the
cultures were severely damaged or
disintegrated after overnight incubation in
the presence of the toxin. Cytopathogenic
effects were detected in 6 h in cells seeded
in the presence of the undiluted toxin and
after 8 h when added to cells in established
24 h cultures. Serum had no effect on the
action of the toxin. The cell culture assays
were more sensitive than the mouse
toxicity test. The hemolysis tests were the
most sensitive for toxin obtained from the
Hartbeespoort Dam. For tests of
M. aeruginosa, WR70 toxin and toxins
from the Vaal and Roodeplaat Dams, cell
culture assays were more sensitive than
the mouse toxicity test, but the hemolysis
test was less sensitive than both.
In response to E. coli enterotoxin cell
elongation could be distinguished from
39
cytopathogenic effects of Microcystis
toxin. The mouse toxicity test was found
to be less sensitive than the microtiter cell
culture assays, while the Trypan blue test:
with mammalian tissue exhibited
disruption of membrane permeability
5 min after application of the Microcystis
toxin. This technique was not, however,
found to be particularly sensitive as an
assay for the toxin.
The results from the haemagglutination
and haemolysis test resembled the
agglutination of erythrocytes. Haemolysis
tests revealed that apparent diffusion of
erythrocytes and the absence of settling
were probably due to lysis of the cells.
Both reactions were found to be
temperature dependent: tests at 4°C
yielded negative results, tests at 10°C
yielded marginally positive results, at
35°C positive results yielded an end point
after 5 h. There was no evidence for
agglutination in addition to lysis. The
absence of evidence for agglutination
suggests that previous studies (e.g.
Carmichael and Bent 1981) mistook
haemagglutination for haemolysis.
The average count of E. coli cells cultured
in the presence of the toxins was found to
increase, while in the absence of the toxin,
the count decreased. Similar results were
obtained from the test on S. faecalis. This
suggested that these bacteria thrive in
toxin preparations. In the Ames tests no
mutagenic activity was detected in the
assays in the presence or absence of
activating liver enzymes. This indicated
that no mutagenic or carcinogenic
compounds were present.
The absence of significant differences in
the sensitivities of liver, lung, cervix,
ovary or kidney cells suggested that the
toxin was not specific to liver cells.
Damage to liver cells was a consequence
of the toxin being directly transported to
the liver. Epithelial cells were shown to
be slightly more sensitive than fibroblast
cells.
The trypan blue tests and haemolysis tests
suggested that the microcystin toxin
inactivated the cell membrane
permeability barrier almost
instantaneously. This confirmed that the
destruction of liver cells is the earliest
histological sign of the toxic effect on
animals and that this action is probably the
only mechanism of action of the
Microcystis toxin. Immediate disruption
of the cell membrane permeability also
suggested that protein synthesis is not
involved in the cytolytic action of the
toxin.
The pattern of early disintegration caused
by the toxin was found to be different
from the effects of heavy metal and
pesticide toxin effects that caused gradual
rounding of the cells and death.
40
The researchers also concluded that the
temperature dependency of the toxic effect
suggested that the toxin may be specific to
warm-blooded animals. The absence of
any correlation between the haemolysis
tests, mouse toxicity and cell culture tests,
suggested that these assays measured
different components, and that the ratio of
the components are not the same for all
strains of M. aeruginosa. The observation
that various compounds with different
molecular weights, physical properties and
amino acid composition exist substantiates
this. Grabow et al. (1982) correctly
warned that the toxicity noted in their
study might have been due to the
combined effects of different compounds.
(see Supporting Literature)
Effect of growth conditions on toxicity and
chemical composition of the toxin of
Microcystis aeruginosa (van der
Westhuizen 1984; van der Westhuizen and
Eloff 1982, 1985; van der Westhuizen et
al. 1986).
Van der Westhuizen investigated, under
laboratory conditions, the role of various
growth parameters, namely culture age,
temperature, irradiance and pH, on the
toxicity of M. aeruginosa, in an attempt to
determine how they influenced the
chemical composition and concentration
of the toxin. He further wished to
endeavour to explain of variability in
toxicity and to define optimal growth
conditions for production of toxins for
subsequent chemical analysis. Van der
Westhuizen’s study was divided into two
main areas, namely the influence of
growth conditions on (a) cell growth and
toxicity, and (b) on the chemical
composition of toxin produced by
UV-006. He drew the following
conclusions from his work:
(a) Influence of growth conditions on cell
growth and toxicity
Effect of culture age on growth and
toxicity:
Toxicity per cell mass of UV-006 and
UV-010 increased during the exponential
growth phase to a maximum (LD50 =
18 mg.kg-1 ) at the start of the stationary
phase, before declining rapidly. This
supported the finding of Paul Gorham
(1962, cited in van der Westhuizen, 1984)
that production of the toxin declines when
growth ceases. Decreasing toxicity in the
stationary phase is generally attributed to
the release of the toxin into the cell
medium through cell lysis.
Effect of pH (CO2 concentration) of the
medium on growth and toxicity:
pH was controlled by CO2 addition and,
therefore, the effects could be ascribed
either pH or CO2 concentration. The
highest growth rate of UV-006 occurred at
41
pH 9, and highest levels of toxicity
occurred at pH values above and below
pH 8. pH could not be correlated with
maximum growth rates, suggesting that
growth-inhibiting conditions under certain
pH conditions promoted toxin production.
The reasons for this could not be
determined, but van der Westhuizen
suggested that toxin production might be
related to stress conditions at higher and
lower pH levels.
Effect of temperature on growth and
toxicity:
Temperature was found to have the most
pronounced effect on toxicity. Highest
growth rate (td = 1.23 d) was obtained at
32°C, while the highest toxicity was found
at 20°C (LD50 = 25.4 mg.kg-1 ), but
reduced at temperatures in excess of 28°C.
Toxicity was 1.6 and 4 times less in cells
cultured at 32 and 36°C than cells cultured
at 28°C, suggesting that highest growth
rate is not correlated with highest toxicity.
This could not be attributed to leaching of
toxins into the medium since cells were
actively growing, but van der Westhuizen
(1984) considered the decreased toxin
production to be possibly related to
decreased stress levels at temperatures
above 20°C.
Effect of irradiance level on growth and
toxicity:
The level of irradiance levels was not
found to have any significant effect on
toxicity. Toxicity levels were lowest at
low irradiance, increased through
intermediate and declined thereafter at the
highest irradiance levels. Maximum
toxicity was not associated with the
highest irradiance-driven growth rate.
Van der Westhuizen (1984) postulated that
a well aerated culture of Microcystis
aeruginosa (UV-006) grown at pH 9.5,
20-24°C, 145 μmol.photons.m-2.s-1 and
harvested during the late logarithmic
growth phase should supply the maximum
quantity of toxin per unit time.
(b) Influence of growth conditions on the
chemical composition of toxin from
UV-006
Influence of different growth conditions of
chemical composition of M. UV-006 toxin
In this further study, van der Westhuizen
determined the amino acid composition of
the toxic peptides using gas
chromatography. This revealed that 90%
of the toxins were comprised of peptides
labelled as ‘A’ and ‘B’ by van der
Westhuizen (see table below) (assuming
that the toxins consisted of peptides A and
B only). The relative amino acid content
of these peptides, differing by only the
42
addition of one other amino acid, is
summarised in Table 1.
Table 1:
Relative amino acid content of toxins (peptides) H (A) and J (B).
Amino Acids Relative mole % ( ) = mole ratio H (A)* J(B)*
ALA (Alanine) 23.0 (1.1) 33.8 (1.80 LEU (Leucine) 26.3 (1.3) 24.5 (1.3) β-CH3-
ASP (β-CH3 aspartic acid)
20.7 (1.0) 19.0 (1.0)
GLU (Glutamic acid) 23.6 (1.1) 22.1 (1.2) ARG (Arginine) 6.30 (0.3)
* The labels ‘H’ and ‘J’ are referred to as A and B in subsequent discussions.
Effect of culture age:
Young cells were found to contain less of
peptide A as compared with mature cells -
toxicity increased with culture age from
the 4th to the 9th day, primarily due to an
increase in the concentration of toxin A.
Toxicity decreased on the 14th day due to
an equal decrease in toxins A and B, and
thereafter the composition of A and B
remained unchanged. Declining growth,
possibly due to die-off and consequent
leaching of the toxin into the medium,
occurred on the 14th day.
Effect of temperature:
Temperature-changes were found to
induce variations in both the concentration
and peptide composition of the toxin. A
third toxic peptide (C) was discovered in
higher concentrations than either peptides
A or B at 16°C. Peptide C was suspected
of containing aspartic acid rather than
β-methylaspartic acid. Small amounts of
phenylalanine and arginine were detected
in peptide C, as well as alanine (23%),
leucine (26%), aspartic acid (23%) and
glutamic acid (27%). The percentage
content of peptide A increased between
16°C and 36°C, while overall toxicity
decreased sharply – this being due to a
decrease in the concentration of peptides
A and B. Peptide C disappeared gradually
at higher temperatures, this ascribed by
van der Westhuizen as a consequence of
reduced synthesis or increased
decomposition, rather than leaching since
cells were still growing after the growth
phase.
43
Effect of irradiance:
Increased levels of toxicity at lower
irradiance were attributed to an increase in
the concentration of peptide B. The
concentration of peptide A increased at
higher irradiance levels. At still higher
levels, a reduction in overall toxicity was
due to an equal decrease in the
concentrations of both peptides A and B.
Effect of pH (CO2 concentration) of the
culture medium:
Total toxicity declined over the pH range
6.5 to 8 due to a rapid decrease in the
concentration of peptide B. Increased
overall toxicity was detected at pH 10.5,
and found to be due to an increase in the
concentrations of both peptides.
Amino acid composition:
Amino acid composition of the peptides A
and B was found to remain unchanged at
differing growth conditions, indicating
that changes in toxicity were related
primarily to the concentration of the
peptides.
Derivation of a partial structure for
microcystin-LA (Santikarn et al. 1983)
Working on the material isolated from
Witbank Dam (see Botes et al. 1982c),
Sitthivet Santikarn, a member of the
NCRL research team later led by Dawie
Botes (see below), determined a partial
structure for what was then known as
Toxin BE-4, later to be designated
cyanoginosin (= microcystin) –LA
(Santikarn et al. 1983).
The structure of Cyanoginosin-LA, and –
LR, -YR, -YA & -YM (Botes et al. 1984 &
1985; Botes, 1986).
At the time of this definitive work by
Dawie Botes and his colleagues, other
laboratories throughout the world had, for
more than three decades, been attempting
to characterize the toxic metabolites
isolated from blooms of Microcystis.
Botes’ laboratory had previously reported
on a partial structure for one of the toxins,
and the N-methyldehydroalanine (Mhda)
residue had been tentatively positioned as
an exocyclic branch of the
cyclohexapeptide (Santikarn et al. 1983).
In their 1984 paper, Botes and co-workers
corrected this tentative placement, and
established the position of the Mhda
moiety with a monocyclic heptapeptide
structure for cyanoginosin-LA. They also
proposed use of the term cyanoginosin and
a two-letter suffix, as opposed to the
previously used designations of
microcystin or aeruginosin. Cyanoginosin
had an LD50 of 0.05 μg g-1, and a
molecular weight of 909.
44
In subsequent work, this group of
researchers derived full or partial
structures for four additional toxic
analogues, viz. cyanoginosin (=
microcystin) –LA, -YR, -YA and –YM.
Preparation of antibodies to
cyanoginosin-LA (Kfir et al. 1985)
Due to their very low molecular weights,
the ability of microcystin-type toxins to
induce immune responses was deemed to
be very low. Based on the fact that
immunological studies could assist in
identifying the organ or cells targeted by
the toxins, Kfir and colleagues raised
antibodies against cyanoginosin-LA using
mice. They were able to purify and
characterize the resultant monoclonal
antibodies, and mooted the potential for
use of the antibody material for studying
both the biological activity of the toxins,
and their detection in water.
Environmental factors affecting the
production of peptide toxins by
Microcystis aeruginosa (Wicks and
Thiel, 1990).
Following the formulation of an analytical
procedure that allowed detection and
resolution of a range of microcystin
variants (Gathercole and Thiel, 1988),
Richard Wicks and Pieter Thiel monitored
six microcystins in Hartbeespoort Dam
over a period of two and a half years.
They found that the production of the
toxins was both positively and strongly
correlated with primary production, solar
radiation, water temperature, pH and
oxygen saturation. No strong relationships
were found that linked toxin
concentrations and the availability or
concentration of organic or inorganic
compounds. Wicks and Thiel concluded
that the specific rate of photosynthesis of
Microcystis aeruginosa was closely linked
to the concentration of peptide toxins
extracted from algal scums. They
concluded that studies conducted in the
laboratory could provide an indication of
those environmental factors likely to
influence cyanobacterial toxin production
in naturally occurring algal populations.
Toxic and non-toxic variants of
Microcystis aeruginosa (Eloff and van der
Westhuizen, (1981)
A number of studies and observations
have alluded to the fact that toxic and non-
toxic variants of M. aeruginosa exist.
Some, alluded to in this review, made this
association in relation to distinct
aerotypical variation in colony structure,
e.g. the forma aeruginosa vs forma flos-
aquae variants of Microcystis.
45
Eloff and van der Westhuizen set out to
test the hypotheses that the apparent
existence of toxic vs non-toxic variants
was due to:
- Microcystis- bacterial interactions;
- Environmental influences;
- Existence of different strain
variants.
These researchers found that
environmental factors only influenced
toxicity in “toxic” variants, and “non-
toxic” isolates lost the ability to form gas
vacuoles. They concluded that the
phenomenon was driven by the existence
of different taxons.
46
6.2 Cyanobacterial ecology and
physiology
The photo-oxidation of laboratory cultures
of Microcystis under low light intensities
(Eloff, 1978).
Abeliovich and Shilo (1972) postulated
that sudden die-off of cyanobacterial
blooms in nature were the result of photo-
oxidation. Allinson et al. (1937) found
that laboratory cultures were much more
sensitive to light intensities than natural
blooms. Zehnder and Gorham (1960)
noted that Microcystis growing under low
light intensities lyse for no apparent
reason. Also, laboratory cultures of
Microcystis reach cell concentrations of
5×10⁶ cells/mℓ, whereas in nature they can
reach concentrations of 109 cells/mℓ.
(see Supporting Literature)
Photo-oxidation of cyanobacteria in
natural conditions (Eloff et al. 1976)
Abeliovich and Shilo (1972) showed that
CO2 depletion sensitizes certain laboratory
strains of cyanobacteria to photo-oxidative
conditions. Photo-oxidation causes the
activity of superoxide dismutase (SOD) to
decrease (Abeliovich et al. 1974). Eloff et
al. suspected that this could be the cause
of sudden die-off observed in nature when
blooms are at peak development and
concentrated in scums. Under these
conditions the cyanobacteria are subjected
to high dissolved oxygen saturation
(200–300%) and rapid CO2 depletion.
Their paper discusses the possible
mechanisms underlying varying levels of
resistance to photooxidation and the
factors that may lead to photo-oxidative
death. Samples were collected from
Israeli fishponds using several
cyanobacteria types (Microcystis
aeruginosa strain 7005, Synechococcus sp.
6311, Aphanocapsa sp. 6714, Anabaena
sp B-381, Plectonema boryanum 594,
Nostoc sp, Microcystis sp NRC-1,
Microcystis Bethulie strain).
In field photo-oxidation experiments
dialysis tubing filled in the laboratory with
cyanobacterial culture was suspended in
pond water within 1 cm of the surface.
Dark controls were wrapped in a black
polythene sleeve. In the laboratory,
photooxidation experiments, cell
suspensions were placed in Klett test tubes
and incubated. A range of parameters,
namely: viable count, SOD activity (see
above), protein content, turbidity,
chlorophyll-a and phycocyanin contents
were measured and correlated.
Different strains of cyanobacteria showed
variable resistance to photo-oxidation. To
test whether the self-shading effect
protects the microorganisms against
photo-oxidation, the effect of cell density
on photo-oxidative sensitivity was
47
examined. It was noted that bleaching
occurred in all the Microcystis strain 7005
cultures, but that it occurred less rapidly in
the more concentrated suspensions.
Culture age appeared to have no effect on
sensitivity to photo-oxidation. It was
noted that SOD levels dropped rapidly
upon the onset of photooxidation in
laboratory strains. Initial SOD levels in
pond Microcystis were found to be low,
but all initial SOD activity was retained
after exposure to photo-oxidative
conditions. The results suggested a
difference in sensitivity to photo-oxidative
conditions between laboratory strains and
pond samples, emphasising the danger in
extrapolating data from laboratory
conditions to natural conditions and
drawing ecological conclusions.
The effects of photo-oxidative conditions
and chloramphenicol on SOD activity on
pond Microcystis suspensions were
investigated. SOD levels declined after
5 h in the suspensions exposed to light and
chloramphenicol. Turbidity and cell
protein decreased, lagging behind the SOD
drop. Phase-constrast micrographs
showed that these cells had bleached and
lysed.
In several experiments it was
demonstrated that the concentration,
breaking up of the colonies and effecting
the collapse of the gas vacuoles had no
effect on the viable count or turbidity of
the cell suspensions maintained under
photo-oxidative conditions in the field.
(see Supporting Literature section)
The fine structure of the cyanobacterium
Microcystis aeruginosa Kutz. emend
Elenkin in natural and controlled
environments (Barlow, 1978)
Fine structure of cells grown under natural
conditions
Barlow sampled several Microcystis
waterblooms from six Transvaal
impoundments (Hartbeespoort Dam,
Rietvlei Dam, Roodeplaat Dam,
Buffelspoort Dam, New Doringpoort Dam
and the Vaal Dam) for ultrastructural
study. An electron microscope was used
to study the cytological structures of
Microcystis cells in an attempt to link
season, locality and fine structure to
toxicity.
Barlow found the colonial morphologies
and cell diameters of M. aeruginosa forma
aeruginosa, M. aeruginosa forma flos-
aquae and M. wesenbergii easily
distinguishable using a light microscope,
but differences were less apparent at
cytological level. M. wesenbergii was
found to have prominent polyglucoside
rods and scalloped LIV of the cell wall (this
was also found in M. aeruginosa forma
aeruginosa from Buffelspoort Dam).
48
Barlow suggests, however, that such
structures may depend on metabolic
conditions or be preparative artefacts. M.
aeruginosa forma aeruginosa was
ultrastructurally indistinguishable from
forma flos-aquae. As a result, Barlow
distinguishes only two species with
certainty: M. aeruginosa and M.
wesenbergii. Barlow did not associate M.
wesenbergii with toxicity.
Although Barlow could not link the
presence of toxicity to season or any one
environmental factor he found that in
Buffelspoort Dam, which had the lowest
mean phosphorus and nitrogen
concentrations, was never found to have a
toxic bloom. Barlow suggested that
eutrophic conditions (high phosphorous
and nitrogen concentrations) might be
important for toxin induction.
Toxicity was usually associated with M.
aeruginosa f. aeruginosa, but this form
was not always toxic. Toxic M.
aeruginosa f. aeruginosa could be
distinguished from non-toxic M.
aeruginosa f. aeruginosa by the presence
of a prominent sheath composed of
globular acid mucopolysaccharide with
fibrils condensed into striae. Some toxic
M. aeruginosa f. aeruginosa cells were
found to possess microvilli-like structures,
membranous whorls and crystal lattices on
LIII and LIV of the cell wall. Barlow
suggested that the whorls may be
implicated in toxin production, while the
lattices may be the crystallized protein
structures of the toxin itself or viral
particles involved in toxin induction.
Notwithstanding this, the almost
consistent presence of toxicity in M.
aeruginosa forma aeruginosa, as opposed
to its absence in aggregations of M.
aeruginosa forma flos-aquae, remains an
extremely valuable distinguishing
diagnostic feature (author’s observation).
Other differences included variations in
the type and number of storage granules
(related perhaps to cell age or
environmental differences) and thykaloid
arrangement (possibly related to light
intensity).
The effect of light intensity
The effect of light intensity on the fine
structure of M. aeruginosa under
laboratory conditions was investigated.
The optimal growth rate for M. aeruginosa
cells was 3 600 - 18 000 lux. Lag phases
lasted approximately 5 d, followed by an
11 d period of exponential growth. Growth
rate declined rapidly at light levels in
excess of 18 000 lux.
Visual pigmentation and pigment ratios
were found to change considerably at
different light intensities. At 3 600 lux
and lower, cultures were green for the
duration of the experiment (28 d). At
5700 lux, cultures were yellow, at
18 000 lux they were orange. The ratio of
49
chlorophyll a to carotenoid, plotted against
light intensity showed that as light
intensity increased, carotenoid pigments
increased relative to chlorophyll a. A
reduction in this ratio occurred with
ageing. Carotenoid pigments shield cells
from detrimental light levels, preventing
the destruction of chlorophyll a and the
photo-oxidation of photosynthetic
pigments (Abelovich and Shilo, 1972,
cited in Eloff, 1978).
Gas vacuole content and thykaloid number
were also found significantly affected by
light intensity. Gas vacuole content
increased as light intensity increased to
6 000 lux, thereafter decreasing between
6 000 and 8 000 lux. Waaland et al.
(1971, cited in Eloff, 1978) suggested that
the vesicles could act as light shields in
addition to their possible buoyancy
functions. The absence of gas vacuoles
grown at low light intensities of 400 lux
supports this observation.
The amount of thykaloid membranes in
the cell was found to be directly
proportional to the amount of chlorophyll
a, suggesting that these were sites of
photosynthesis. Light intensity affected
thykaloid number and arrangement.
Thykaloids numbered 25 - 30 units at light
intensities of 3 600 lux and lower and
were peripherally arranged, parallel to the
cell wall and in stacks of 3 to 6.
Thykaloid units were shorter and fewer at
lower light intensities and were arranged
peripherally, singly and inwardly oriented
in relation to the cell wall. From this
evidence Barlow (1978) suggests that M.
aeruginosa is able to orient the thykaloids
to maximise the amount of light available.
The effects of ageing included: slight
decrease in the number of thykaloid units,
decrease in polyhedral bodies and gas
vacuole content and cytoplasmic shrinkage
and an increase in the cyanophycin
granules and lipid droplets.
Carotenoid composition as taxonomic
character for Microcystis isolates (Smit et
al. 1983)
Smit et al. (1983) emphasised the fact that
cell size and colony habit had previously
been the main taxonomic criteria to
distinguish different Microcystis species.
However, since both these characteristics
are variable under different environmental
conditions, they could not be relied upon
as absolutes. The purpose of this study
was to examine the pigment composition -
the carotenoids being the main lipid
pigments - in relation to their usefulness as
taxonomic markers. Nineteen Microcystis
aeruginosa, one M. incerta and one
Synechococcus isolate were investigated.
β-carotene was the major carotenoid
present and was found in all of the
Microcystis isolates (concentration:
50
100–1 577 μg.g-1 dry mass). Zeaxanthin
concentrations were found to be very
variable among the isolates
(concentrations: 2-871 μg.g-1). Echinone
and myxoxanthophyll were found to be the
second most abundant carotenoids present
(concentrations: 475-1 399 μg.g-1 and
1 740-2 954 μg.g-1 respectively). These
pigments were found to be absent from M.
incerta and only low concentrations were
found in the Synechococcus isolate.
Canthaxanthin was found in eight of the
isolates, while 3-hydroxy-echinone was
found as a trace pigment and only one
isolate had more than trace quantities of
cryptoxanthin. 4-hydroxy-4-keto β
carotene was identified in only three
isolates. Caloxanthin and nostoxanthin
were only identified in the M. incerta and
the Synechococcus isolates.
The ratio of occurrence of the main
carotenoids in Synechoccus and M. incerta
was found to differ significantly from all
other M. aeruginosa isolates, prompting
Smit and co-workers to suggest that the
carotenoid composition may have value
for distinguishing between different
genera.
Smit et al. (1983) found that there was
little qualitative difference between the
M. aeruginosa isolates, but quantitative
differences did appear to be present. A
clustering of the isolates into 7 groups was
evident from the data. Apart from isolate
UV-017, all of the isolates in groups III
and IV were non-toxic, while all isolates
in group I had a similar toxin composition
that was different from all of the others.
From these results, the researchers
suggested that quantitative carotenoid
composition might be taxonomically
useful in studies of cyanobacteria.
The effect of phosphate concentration.
(Barlow et al. 1977, 1979)
Barlow investigated the effect of changing
levels of phosphate on the fine structure of
M. aeruginosa cells in a laboratory
culture.
Increased external phosphate
concentration was found to result in faster
initial growth rate, but lower final cell
yield. Highest final yields were obtained
from phosphate concentrations of 2 mg.ℓ-1.
In the absence of phosphate, growth
proceeded slowly for 8 days before
ceasing. Phosphate starved cells showed a
decrease in the number of thykaloids and a
change from grouped peripherally
arranged orientation to shorter, single and
inwardly oriented units (similar to the
symptoms displayed by cells under low
light conditions). Cyanophycin granules
and lipid droplets were only present in
phosphate-starved cells.
51
Polyphosphate granules are indicative of
‘luxury uptake’ of phosphate (Shapiro,
1968, cited in Barlow, 1978) in conditions
of unlimited available phosphorous. After
introduction of cells into a new medium,
the number of polyphosphate granules
decreases before re-assimilation of
granules occurs. This suggested to Barlow
that stored polyphosphates needed to be
used initially for physiological activation
of the cells before external phosphate
could be assimilated. After 20 d, the
number of polyphosphate granules was the
same in all cells irrespective of the
concentration of external phosphate in the
growth medium, suggesting that a critical
concentration of polyphosphate could be
stored. In the phosphate-starved cells,
polyphosphate granules were still present
after 20 d, suggesting that these cells were
senescent and incapable of metabolizing
the stored polyphosphate.
Barlow (1978) made a distinction between
ageing due to nutrient depletion (when
cells could be re-stimulated by addition of
fresh media), and senescence due to
phosphate starvation, when restimulation
of growth may not have been possible.
Barlow (1978) suggested that the reason
for M. aeruginosa’s success in eutrophic
waters was due to its ability to store
phosphate during times of abundance, its
ability to regulate its position in the water
column and shield itself from harmful
light intensities using gas vesicles, and its
ability to orient itself its photosynthetic
apparatus to maximise light availability.
However, he pointed out that the fine
structure of the cells could not be used to
interpret the environment in which the
cells were growing.
However, in a second series of
experiments, Barlow and co-workers
demonstrated ultrastructural differences in
cells grown in the presence and absence of
phosphate (Barlow et al. 1979).
Barlow et al. (1979) cite Brown (1974) as
stating that the increase and decrease of
external phosphorous concentration
enhanced the toxicity of Microcystis
aeruginosa. Luxury uptake of
phosphorous occurs when phosphorous is
abundant in the medium (Shapiro 1968,
cited in Barlow et al. 1979) and levels of
acid soluble and insoluble polyphosphates
increase to a critical concentration in the
cell (Sicko-Goad and Jensen 1976, cited in
Barlow, 1979). Luxury uptake was found
to be exaggerated in cells initially starved
of phosphate (Shapiro 1967, cited in
Barlow).
Cultures grown at four phosphate
concentrations (0, 2, 4 and 8 mg.ℓ-1
HPO4=) were used. Cells grown in the
phosphate-starved medium showed
reduced growth rates after approximately
96 h and growth ceased after 8 d. Barlow
et al. (1978) suggested that the exponential
growth rate for the first four days was due
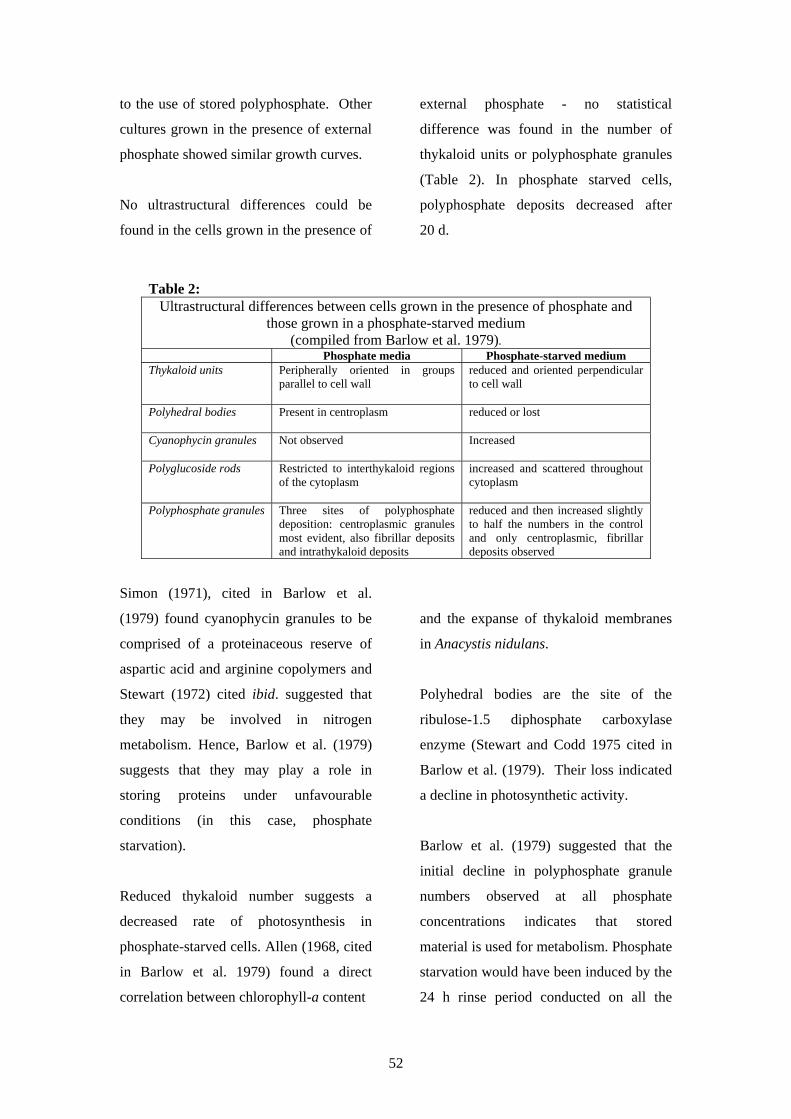
52
to the use of stored polyphosphate. Other
cultures grown in the presence of external
phosphate showed similar growth curves.
No ultrastructural differences could be
found in the cells grown in the presence of
external phosphate - no statistical
difference was found in the number of
thykaloid units or polyphosphate granules
(Table 2). In phosphate starved cells,
polyphosphate deposits decreased after
20 d.
Table 2: Ultrastructural differences between cells grown in the presence of phosphate and
those grown in a phosphate-starved medium (compiled from Barlow et al. 1979).
Phosphate media Phosphate-starved medium Thykaloid units Peripherally oriented in groups
parallel to cell wall
reduced and oriented perpendicular to cell wall
Polyhedral bodies Present in centroplasm
reduced or lost
Cyanophycin granules Not observed
Increased
Polyglucoside rods Restricted to interthykaloid regions of the cytoplasm
increased and scattered throughout cytoplasm
Polyphosphate granules Three sites of polyphosphate deposition: centroplasmic granules most evident, also fibrillar deposits and intrathykaloid deposits
reduced and then increased slightly to half the numbers in the control and only centroplasmic, fibrillar deposits observed
Simon (1971), cited in Barlow et al.
(1979) found cyanophycin granules to be
comprised of a proteinaceous reserve of
aspartic acid and arginine copolymers and
Stewart (1972) cited ibid. suggested that
they may be involved in nitrogen
metabolism. Hence, Barlow et al. (1979)
suggests that they may play a role in
storing proteins under unfavourable
conditions (in this case, phosphate
starvation).
Reduced thykaloid number suggests a
decreased rate of photosynthesis in
phosphate-starved cells. Allen (1968, cited
in Barlow et al. 1979) found a direct
correlation between chlorophyll-a content
and the expanse of thykaloid membranes
in Anacystis nidulans.
Polyhedral bodies are the site of the
ribulose-1.5 diphosphate carboxylase
enzyme (Stewart and Codd 1975 cited in
Barlow et al. (1979). Their loss indicated
a decline in photosynthetic activity.
Barlow et al. (1979) suggested that the
initial decline in polyphosphate granule
numbers observed at all phosphate
concentrations indicates that stored
material is used for metabolism. Phosphate
starvation would have been induced by the
24 h rinse period conducted on all the
53
cultures at the start of the experiment. The
period of maximum restorage was
approximately 8 d. The slight increase in
polyphosphate after the initial decrease
observed in the phosphate-starved cells,
suggests that restorage of phosphate had
been derived from other sources in the cell
such as RNA (Harold 1960 cited in
Barlow et al. 1979).
Barlow et al. (1979) hypothesised that the
ability of Microcystis aeruginosa to
continue growth for 8 d after phosphate
starvation using internal reserves may
partially explain its success in producing
waterblooms.
(see Supporting Literature)
The release of nannocytes during the
growth cycle of Microcystis (Pretorius et
al. 1977; Pretorius and Eloff, 1977)
Pretorius et al. observed small bodies
forming within Microcystis cells that were
similar to those observed by Canabaeus
(1929), and which she referred to as
‘nannocytes’. It was suggested that these
nannocytes may play a role in
reproduction as endospores, possibly
enabling Microcystis to endure
unfavourable environmental conditions.
Microcytis aeruginosa (UV-007 – a strain
of Microcystis that has become something
of an icon in cyanobacterial research, and
has travelled around the world from the
University of the Free State (UV =
Universiteit Vrystaat) to several research
laboratories – see elsewhere in this
review.) was grown in BG 11 medium at
two light intensities: 9.5 and 21
μEinsteins.m-2.sec-1. At 9.5 μEinsteins.m-2
sec-1 the logarithmic growth phase of the
culture lasted from day 0-10, while the
stationary phase began at day 30. At 21
μEinsteins.m-2.sec-1 the logarithmic
growth phase continued to day 6 followed
by a death phase due to the stress effect of
high light intensity. Cell numbers
oscillated until day ca 20, whereafter a
new growth was entered that was more
rapid than the first.
The hypothesis that this second growth
phase was due to the release of nannocytes
during or just prior to the death phase was
not confirmed - nannocytes were found to
form throughout the growth cycle and not
mainly under light stress conditions. Thus
while nannocytes play a role in
reproduction, they do not function as
means of surviving unfavourable
environmental conditions. Nannocytes
were released by rupturing the cell wall,
the cells becoming swollen before release,
suggesting a possible decrease in the
osmotic potential of the cell that triggered
the release.
54
Effect of lethal concentrations of copper
on the ultrastructure and growth of
Microcystis (Verhoeven and Eloff, 1979)
Verhoeven and Eloff (1979) reported that
copper was an effective algicide that was
used in natural waters to control blue-
green algae. Microcystis aeruginosa
Berkeley strain 7005 (UV-007) and M.
aeruginosa isolated from the
Hartbeespoort Dam (UV-006) were used
to test the effects of copper on the
ultrastracture of cells. Copper sulphate
was added once cultures had been grown
to a turbidity of 80, 150, 220, 310 Klett
units to give concentrations of 0.3, 0.4,
0.5, 0.6 and 0.7 ppm Cu2+. It was found
that toxicity of the copper depended on
cell concentration. Cell concentrations of
1.8×10⁷ cells.mℓ-1 (148 Klett units), 0.3
and 0.4 ppm Cu2+ decreased growth rate
temporarily, whereas 0.5 ppm Cu2+ was
lethal.
Copper was found to decrease the
electron-density of the nucleoplasm as
well as cause aggregation of the DNA
fibrils. Membrane-bounded inclusions
and polyphosphate bodies disappeared,
and thykaloids were present as short
membrane structures. Carboxysomes
remained present.
Cyanobacterial biocontrols (Scott and
Chutter, 1981).
As part of an investigation reviewing
controls for cyanobacterial blooms,
Willem Scott and Mark Chutter
investigated possible biological agents
capable of reducing algal populations in
ponds
Viruses
Scott and Chutter suggest that viruses may
be important in controlling blue-green
algae (e.g., review by Padan and Shilo
1973). The first virus isolated that was
capable of lysing a filamentous blue-green
alga Plectonema sp., was isolated from an
oxidation pond. The authors assumed that
viruses were not important in controlling
eukaryotic algae in large cultures, this on
the basis of there being no apparent
evidence to the contrary (e.g. reviews by
Lemke 1976; Hoffman and Stanker 1976;
Dodds 1979).
Bacteria
Stewart and Brown (1969, 1971) first
reported a myxobacterium capable of
lysing freshwater algae. Bacteria are
generally aerobic, flagellate, gram-
negative rods. Scott and Chutter suggest
that myxobacteria are more important than
viruses in controlling algal populations
55
than viruses since they are less host-
specific.
Fungi
Fungal parasites of freshwater algae are
referred to ‘chytrids’, and belonging to the
families Phlyctidiaceae, Rhizidiaceae and
Chytridiaceae. Pioneering work was
conducted by Lund (1957) and Canter
(1950, 1951, 1954) in the English Lake
District. Up to 70% of the individuals in
an algal population could be infected by
fungal parasites. A large proportion of
chytrids are host-specific, suggesting that,
in some instances, they may prevent
‘desirable’ species from growing while
allowing ‘less desirable’ species to
proliferate.
Algae
Some Chrysophyta and Pyrrophyta are
capable of phagotrophic nutrition. In
some cases, smaller algae such as
Chlorella may be ingested. Cole and
Wynne (cited in Scott and Chutter, 1981)
noted that when the chrysophyte
Ochromonas danica was mixed in culture
with Microcystis aeruginosa, the M.
aeruginosa numbers were reduced by 30%
in 10 min. as a result of ingestion by
Ochromonas.
Protozoa
Bader, Tsuchiya and Frederickson (1976a
& b, cited in Scott and Chutter) noted that
when the ciliate Colpoda steinii was added
to the blue-green alga Anacystis nidulans,
the ciliate could double every 4.3 hours –
it was estimated that approximately 1 000
algal cells were needed to produce one
ciliate. Ciliates formed cysts as soon as
the algal population was depleted. Lund
and Canter (1968) reported a 99%
reduction in the algal population within 7
to 14 days in the Lake District as a
consequence of protozoan predation.
Zooplankton
Uhlmann (1971) noted that zooplankton
grazing could completely suppress algal
growth in sewage lagoons and
hyperfertilised ponds – 5 mass units of
algae are required to produce 1 mass unit
of Daphnia. Uhlmann found that the
Volterra model does not hold for the
complex grazing relations between
Daphnia and Chlorella. Gliwicz and
Hillbricht-Ilkowska (1972) reported that
plankton feeders which filter larger
particles (10–15 μm) occurred in eutrophic
waters, while smaller filter feeders
(filtering 3–5 μm nanoplankton) occurred
in oligotrophic waters. Rotifers were
found to predominate in algal ponds.
56
Others
Little information is available on grazing
by benthic herbivores. The tadpoles of
Xenopus laevis are filter feeders of
planktonic algae, and where they occur in
large numbers they were assumed by
Chutter and Scott to have a considerable
impact on algal populations. Their
contribution to the nitrogen budget in the
form of ammonia is probably also
assumed to be significant.
(see Supporting Literature)
Katagnymene mucigera, a new planktonic
blue-green alga from South Africa
(CompJre et al. 1979).
A filamentous planktonic cyanophyte was
found in a 1976 study of Lindleyspoort
Reservoir in the (then) Transvaal province,
South Africa. The sample was identified
as Oscillatoria ornata Gom. f. planctonica
Elenk. A specimen of the sample was sent
to Trebon for a comparison with Elenkin’s
original description. The alga from
Lindleyspoort corresponded well with
Oscillatoria ornata f. planctonica
described by Elenkin (1949) but differed
by having straight or flexuose trichomes,
whereas those described by Elenkin are
often spirally coiled at the extremities.
The alga was then compared to several
other algal species from around the world
including: Oscillatoria lacustris (Kleb); T.
iwanoffianum Nygaard; Oscillatoria
lacustris var. solitaria Behre. CompJre et.
al decided to revive the old genus
Katagnymene and place the South African
form as a new species in this genus. The
South African species differed mainly by
having relatively longer cells and was
named mucigera.
K. mucigera was also prominent in the
Spitskop Dam on the Harts River,
southern Transvaal, and Harding recorded
this species from a small western Cape
irrigation dam during the early 1990s.
An unusual occurrence of biogenic
(cyanobacterial) carbonate sediments for
a sinkhole lake in the western Transvaal,
South Africa (Gow, 1981).
Bottom samples to depths of 60m were
collected from Wondergat, a sinkhole near
Mafikeng, Western Transvaal. Several
forms of biologically-accreted calcium
carbonate deposits up to a centimetre thick
were recovered. The complete
encrustation of the rock suggested that
they accreted sub-aquaeously in situ. Gow
describes the structure as ‘cauliflower
like’ in shape, with evidence of internal
banding. A second structure had a
discoidal shape, bearing a resemblance to
fungi, often with two lobes in close
association. The presence of banding and
57
uniformity of shape suggested biological
origin. Regularly distributed pits were
evident on the uppermost surfaces. A
third structure was identified and
described as being white with low
cohesion when dry, crumbling easily to a
fine powder.
Gow suggested that the first two structures
were stromatolites created by the
deposition of mucilaginous sheaths by
cyanobacteria. The identity of the third
type of structure was less evident.
To investigate the nature of the deposits,
encrustations were sectioned with a
diamond saw, and polished on glass and
prepared for microscopy. The powder was
found to contain irregular rounded grains
of similar size with numerous
microtubules. Two stromatolites showed
evidence of prokaryote unicells and
filaments – no organic material had been
preserved. No cellular structures could be
observed, but uniformity of size and
layered domed structure suggested typical
stromatolites. The presence of
microtubules in the powder suggested
biological origin. The size of the powder
grains approximated the size of small
cyanobacterial colonies and Gow
suggested that the microtubules represent
the tracks of cyanobacteria as the
carbonate was deposited.
The unicells in the stromatolites suggested
a solitary coccoid cyanobacteria, whereas
the filaments suggested filamentous
cyanobacteria. Gow inferred that these
structures were incidental and that the
more numerous microtubules were the
main carbonate accreting agents.
Cyanobacteria in the sandstone cliffs of
the Golden Gate National Park (Wessels
and Bhdel, 1995).
Cyanobacteria are known to occur from
just about any type of environment. They
are also known to contribute to the
processes of weathering in sandstone.
Wessels and Bhdel discovered a
cryptoendolithic community of
Chroococcidiopsis in Clarens sandstone in
the north-eastern Orange Free State. Such
communities contribute to soil formation,
and the formation of hollows. The
sandstone also provides localised areas in
which organic material is protected from
harsh environmental (surface) conditions,
including fires. The algal cells live
between the soil grains at what appear to
be optimal, light-dependent depths.
58
6.3 Isolation and cultivation
under laboratory conditions
Isolation methods
The isolation of Microcystis (Scott, 1974)
Scott attempted the isolation of three types
of Microcystis from dams in the Transvaal
to aid future studies on bloom formation,
toxicity and taxonomy. These dams
contained M. aeruginosa forma flos-
aquae, M. aeruginosa forma aeruginosa
(which may have been identical to M.
toxica Stephens. described by Stephens in
1949) and a third that was found to be the
dominant form in the Rietvlei dam and
identified by Komarek (1958, cited in
Scott, 1974) as M. wesenbergii.
Reynolds (1972), cited in Scott (1974)
noted that differences in colony size and
gas vacuole content - which is determined
by the chemical environment (Canabaeus
1929, cited in Scott 1974), light intensity
(Lemmermann 1910, cited in Scott 1974)
and age of the cells (Reynolds 1972, ibid.)
led to variations in buoyancy between
species. Buoyancy may be used to
separate out different species of blue-
green algae. However, problems arise
when trying to isolate Microcystis from
contaminants such as other algae and
bacteria embedded in the mucilage of the
colony.
Scott homogenised colonies of the various
species in a test-tube using a glass piston
to break the material into smaller units and
separate out any contaminating bacteria or
algae. Thereafter, buoyant cells were
separated from non-buoyant cells by
centrifugation for one hour at 4 500 x g.
The buoyant material was removed and
inoculated into sterile BG-11 medium with
0.1 mg.mℓ-1 Actidione to inhibit the
growth of eukaryotic algae and the culture
was incubated. Homogenisation and
centrifugation was repeated several times
and a unialgal culture of the three types of
Microcystis was obtained. The procedure
was, however, not successful in removing
contaminating bacteria.
Microcystis in pure culture (Scott, 1976,
1980)
Scott (1976) subsequently reported
success in isolating Microcystis from the
contaminating bacteria in the mucilage
surrounding the cells. This was achieved
by controlled homogenisation to yield
single cells of both Microcystis and
bacteria. The homogenate was then
repeatedly filtered through a
polycarbonate filter with a pore size large
enough to retain Microcystis cells, but
which allowed most other contaminating
bacteria to pass through. The filters were
then placed on nutrient medium. Scott
noted that the procedure was not always
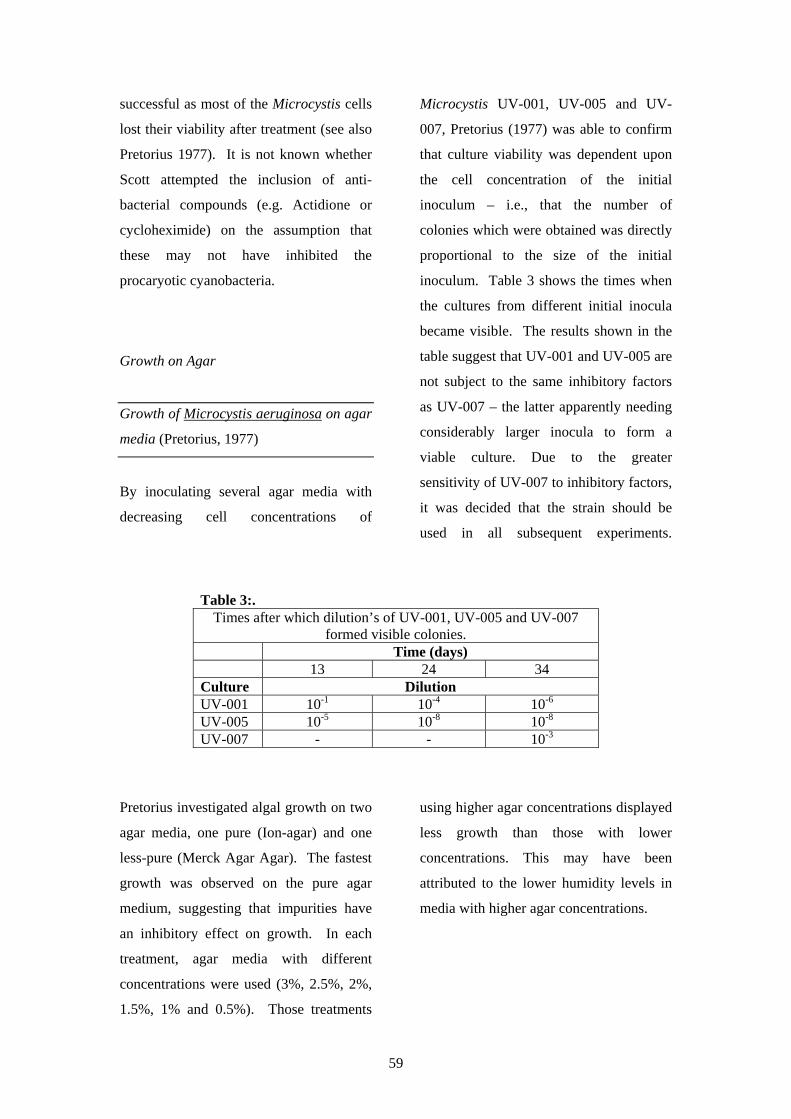
59
successful as most of the Microcystis cells
lost their viability after treatment (see also
Pretorius 1977). It is not known whether
Scott attempted the inclusion of anti-
bacterial compounds (e.g. Actidione or
cycloheximide) on the assumption that
these may not have inhibited the
procaryotic cyanobacteria.
Growth on Agar
Growth of Microcystis aeruginosa on agar
media (Pretorius, 1977)
By inoculating several agar media with
decreasing cell concentrations of
Microcystis UV-001, UV-005 and UV-
007, Pretorius (1977) was able to confirm
that culture viability was dependent upon
the cell concentration of the initial
inoculum – i.e., that the number of
colonies which were obtained was directly
proportional to the size of the initial
inoculum. Table 3 shows the times when
the cultures from different initial inocula
became visible. The results shown in the
table suggest that UV-001 and UV-005 are
not subject to the same inhibitory factors
as UV-007 – the latter apparently needing
considerably larger inocula to form a
viable culture. Due to the greater
sensitivity of UV-007 to inhibitory factors,
it was decided that the strain should be
used in all subsequent experiments.
Table 3:.
Times after which dilution’s of UV-001, UV-005 and UV-007 formed visible colonies.
Time (days) 13 24 34 Culture Dilution UV-001 10-1 10-4 10-6 UV-005 10-5 10-8 10-8 UV-007 - - 10-3
Pretorius investigated algal growth on two
agar media, one pure (Ion-agar) and one
less-pure (Merck Agar Agar). The fastest
growth was observed on the pure agar
medium, suggesting that impurities have
an inhibitory effect on growth. In each
treatment, agar media with different
concentrations were used (3%, 2.5%, 2%,
1.5%, 1% and 0.5%). Those treatments
using higher agar concentrations displayed
less growth than those with lower
concentrations. This may have been
attributed to the lower humidity levels in
media with higher agar concentrations.
60
The effect of media components,
sterilization and ageing
The effect of ageing on the physical and
chemical characteristics of the medium
after sterilization was investigated since it
had been observed that UV-007 displayed
poor growth in growth media older than
3 days. One of the problems that had been
identified in the laboratory culture of blue-
green algae was the formation of a white
or yellow precipitate on the medium after
approximately 72 h, whereafter the
capacity of the medium to support growth
was reduced. Iron has been identified as a
principal problem in the growth of algae at
a pH above 7 when using the N-11
medium (Zender and Gorham, 1960, cited
in Pretorius, 1977) - primarily because it is
insoluble and may be the cause of an iron
deficit. Other elements which may also
precipitate in the algal medium include
Mg2+, Ca2+ and PO43-.
To determine whether different oxidation
states of Fe may have different effects on
precipitation of Fe in blue-green algal
cultures, the replacement of Fe2 (SO4)3 (Fe
3+) with Fe SO4 (Fe 2+) in the growth
medium N-11 was investigated. In both
cases a white precipitate formed in the
medium after preparation. After 72 h, a
yellow precipitate formed in the Fe2 (SO4)3
medium, but not in the Fe SO4 medium.
The precipitate in the Fe SO4 medium had
little influence on the growth of UV-007,
suggesting that the precipitated elements
were in equilibrium with the solution. On
the basis of these observations, it was
concluded that the Fe SO4 medium was
more suitable to sustain the growth of UV-
007 than the Fe2 (SO4)3 medium and was
used in all subsequent experiments.
The effect of the timing of inoculation
before and after sterilization was also
investigated and it was determined that the
duration of time before sterilization had no
influence on the growth of UV-007, while
the duration of time after sterilization did
have an effect. The longer the duration of
time after sterilization, the more growth
was limited and the lag phase was
prolonged. The best growth was obtained
by inoculating 72 h after sterilization.
Experiments confirmed the presence of
peroxide (H2O2) in the medium, but
Pretorius (1977) was not able to determine
whether this had an inhibitory effect on
the growth of individual cells.
Aspects of the growth of Microcystis
aeruginosa on agar (Pretorius and Eloff,
1981)
Pretorius and Eloff (1981) noted that less
research has been done on Microcystis
than on Synechococcus or Anabaena since
axenic cultures of these algae were more
readily grown on an agar medium and
their growth rates are faster than
61
Microcystis - colonies of Synechococcus
become visible after 5 d (Allen, 1968,
cited in Pretorius and Eloff, 1981) whereas
Microcystis colonies only become visible
after 10 d.
They also encountered variable growth on
different types and concentrations of the
growth mediums - the highest growth rates
were obtained on ‘Difco’ Bacto agar, and
where lower agar concentrations were
used. These lower growth rates on more
concentrated agar media, they suggested,
could be attributable to the susceptibility
of Microcystis to growth inhibiting factors
in the agar medium.
Effect of light
The effect of light intensity (Pretorius,
1977)
The effect of light intensity on algal
cultures grown in liquid cultures was
investigated at three intensities (8, 17 and
30 μEinsteins.m-2.s-1). It was found that
at high light intensities (17 and 30
μEinsteins.m-2.s-1) initial growth was
rapid, followed by a stationary phase and
finally a die-off phase. At low light
intensities (8 μEinsteins.m-2.s-1) and
despite a slow growth rate, no die-off was
observed. Light intensities of 8
μEinsteins.m-2.s-1 were found to be
optimal and used in all subsequent
experiments.
The influence of light intensity on the
growth of different Microcystis isolates
(Krhger and Eloff, 1977)
Krhger and Eloff stressed that an
understanding of the regulatory role
played by light in the growth and death of
Microcystis species was important for
controlling their growth in the
environment. They grew seven different
Microcystis isolates at light intensities
varying between 4.5-38 μEinsteins.m-2.s-1.
By correlating cell death with turbidity
they were able to use turbidity as a
measure of growth. Growth was
associated with increased turbidity,
whereas the death phase was associated
with decreased turbidity due to cell
bleaching and lysis.
Microcystis cultures were found to be
sensitive to higher light intensities.
Cultures grown at high light intensities
(>14 μEinsteins.m-2.s-1) had high growth
rates but maintained these over shorter
periods and cells began to die off after 5 to
15 d. The maximum turbidity values (i.e.
low maximum cell numbers) for these
cultures was low (89 Klett units at 36
μEinsteins.m-2.s-1 after 6 d).
62
Cultures grown at low light intensities had
lower growth rates and took longer to
achieve maximum turbidity values (514
Klett units at 9.3 μEinsteins.m-2.s-1 after
47 d).
Krhger and Eloff (1977) also suggested,
but did not investigate, that early initiation
of the death phase in cultures grown at
higher light intensities may have been
attributable to
(i) increase in pH;
(ii) decrease in CO2 concentration
due to photosynthesis;
(iii) photooxidative bleaching of
cell pigments and
(iv) growth factors formed under
stress light conditions.
Microcystis aeruginosa (UV-004) from
Hendrik Verwoerd Dam was found to
have the highest specific growth rate (=
0.7 d-1, td = 0.99 d), while Microcystis
aeruginosa (UV-006) from the
Hartbeespoort Dam had the lowest (=
0.52 d-1, td = 1.33 d).
To measure sensitivity to high light
intensity, the light intensity at which light
saturation was reached was determined.
Optimal light intensity was defined as the
light intensity at which the highest yield
was obtained for a particular culture (i.e.
highest turbidity value). The highest
turbidity was calculated as log2 of the ratio
of final turbidity to initial turbidity (Tt /T0)
to make comparisons between the cultures
possible.
Optimal light intensity values measured
over a period of 22 d for all Microcystis
cultures ranged between 7.5 and 22
μEinsteins.m-2.s-1. Specific growth rate at
optimal light intensities were lowest for
Microcystis (UV-008) 0.14 d-1 and highest
for Microcystis incerta (UV-003) was 1.32
d-1. Maximum specific growth rate varied
between 0.52 d-1 and 1.32 d-1 for
Microcystis (UV-003) (Krhger and Eloff
1977).
Krhger and Eloff (1977) found that
Microcystis (UV-007) grown at low light
intensities (below 10 μEinsteins.m-2.sec-1)
were still growing after three months,
suggesting the suitability of this species
for stock cultures. No correlation was
found between light intensity and toxicity.
The growth rate of the toxic Microcystis
(UV-001) was found to be higher than the
growth rate of the other toxic species
Microcystis (UV-006) making Microcystis
(UV-001) more suitable for mass
cultivation.
63
The interaction between cell density of
Microcystis batch cultures and light
induced stress conditions (Krhger and
Eloff, 1979)
Krhger and Eloff (1979) also investigated
whether the growth inhibition of
Microcystis at light intensities > 10
μEinsteins.m-2.sec-1 may have been due to
the accumulation or depletion of some
substance in the growth medium, rather
than the direct effect of light per se.
Microcystis aeruginosa (Berkeley strain
7005) referred to as Microcystis UV-007
was used in a culture of BG 11. Four
different inoculations were prepared at
different cell concentrations and incubated
for 11 days. The concentrations after this
period were calculated from turbidity
values at 3.8, 6.8, 14.5, 21.6 × 10⁶. The
cells were then subjected to light
intensities of 20, 29 and 39 and 8
μEinsteins.m-2 .sec-1 (the lowest value as a
control).
The results from the figures suggest:
(i) higher cell concentrations
exhibited growth inhibition
sooner than lower cell
concentrations at all light
intensities and;
(ii) cultures grown at higher light
intensities exhibited growth
inhibition sooner than lower
light intensities at all cell
concentrations.
The performance (growth) of a particular
treatment was represented as the turbidity
values of the control (Tcontr.) for all time
intervals for the duration of the
experiment, subtracted from the
corresponding turbidity values of the
respective light treatments (Texp) and
added: ∑(Tcontr - Texp). The same was done
for cell concentration treatments. From
these observations, it was clear that
inhibition of growth increases with
increasing light intensity and cell
concentration.
Krhger and Eloff (1979) cite Eloff et al.
(1976) as reporting that bleaching and
inhibition of growth occurred at all cell
concentrations, but was less rapid in more
concentrated suspensions. However, in
their experiments, Eloff et al. kept pH,
CO2 and O2 and growth medium
concentrations in equilibrium with the
environment through dialysis tubing in
which the cultures were kept.
The discrepancy between the above
observations of Eloff et al. (1976) and
those of Krhger and Eloff suggest that it is
not light per se which is causing growth
inhibition, but the accumulation or
inhibition of some substance in the culture
medium which leads to light-induced
inhibition and the enhancement of
64
inhibition due to an increase in cell
concentration.
Krhger and Eloff suggested that factors
leading to light-induced inhibition may
include: increased O2, decreased CO2 or
pH.
Morphological and ultrastructural
changes in Microcystis grown at different
irradiance levels (Krhger, 1978).
Krhger revealed that age of the culture and
irradiance level influenced the size of the
cells and that cell size can be correlated
with toxicity. The influence of ageing and
light intensity on cell morphology was
also investigated using cultures of
UV-007.
Cell size and size distribution
This study showed there was:
(i) an increase in the variation of
cell size at different irradiance
levels;
(ii) an increase in cell volume;
(iii) an increase in the rate at
which cell volume increased
concomitant with increasing
light intensity. The
researchers observed an initial
decrease in cell volume at all
light intensities. Thereafter
cell volume increased,
reaching a maximum volume
dependant upon light intensity
- the higher the light intensity,
the sooner the maximum cell
volume was reached.
Maximum cell volume (139
μ3) was achieved at 17
μEinsteins.m-2.s-1 after 16 d
growth.
Krhger did not ascribe the changes in cell
volume and the variation of volume
directly to differences in light intensity,
but to the development of stress conditions
in the medium due to different growth
rates. The stress conditions were believed
to be created by depletion of CO2 in the
medium (findings elsewhere in Kruger’s
thesis support this conclusion where – e.g.
‘Influence of aerating gas’ where no
increase in cell volume took place in
cultures aerated with CO2 ).
Krhger suggested that an increase in cell
volume was caused by the inhibition of
cell division and the accumulation of
certain substances within the cell,
suggesting that production of the toxin
may also increase. Krhger also suggests
that growth conditions should be taken
into account when cell size is used as a
criterion for identifying Microcystis
strains. A narrow distribution curve and
small cell volume could be regarded as
being indicative of a healthy culture.
65
Changes in ultrastructure
No changes were found to take place in
the ultrastructure of the cells in the control
cultures grown at light intensities of 9.5
μEinsteins.m-2.s-1. No changes were found
in cells grown at stress light intensity (24
μEinsteins.m-2.s-1) during the logarithmic
growth phase. After the 6th day, the
thykaloid lamellae showed some
deterioration and a change in orientation.
Lipid droplets, carboxysomes and poly-β-
hydroxybutyric acid granules remained
present and inter-thykaloidal pigmentation
was still visible, suggesting a possible
protective mechanism against high light
intensity. 50% of the cells were dead after
8 d. Cell structure started to collapse,
thykaloids were completely deteriorated
and the remains of carboxysomes and
lipids were faintly visible. 70% of the cells
were dead by the 9th day.
Morphological changes in toxic and non-
toxic Microcystis isolates at different
irradiance levels (Krhger et al. 1981)
Krhger hypothesized that cell sizes
amongst algae may be environmentally
determined and thus may vary within
specific taxa. The cell size of
Synechococcus lividus had previously
been found to be influenced by
temperature, light intensity and dissolved
solids (Kullberg 1977, cited in Krhger et
al. 1981), while Krhger (1978) noted that
irradiance and culture age both had
significant impacts on cell size. Barlow
(1978) found that toxicity varied
according to cell size and that cell
diameters of toxic Microcystis vary from
4.1 to 5.0 nm, whereas toxic Microcystis
was found to be 4.8 nm. In this paper,
Kruger and co-workers state that it is
unclear whether differences in cell size
and toxicity may be related to
environmental factors, or whether this may
be due to different Microcystis taxa being
involved. They cite Toerien (1976) as
stating that M. aeruginosa forma
aeruginosa is toxic, whereas M.
aeruginosa forma flos-aquae (Komarek,
1958) is non-toxic (see comments and
observations elsewhere in this review).
Since distinction based on colony
formation is not possible for these two
forms, cell size may be a suitable
alternative. Krhger and co-workers tested
the relationship between cell morphology,
ageing and light intensity as well as die-
off of Microcystis at light intensities >10
μEinsteins.m-2.s-1, as follows:
Two axenic cultures of Microcystis were
used: Microcystis aeruginosa UV-007
(originally from the Gottingen culture
collection 1450-1) which does not possess
gas vacuoles and is non-toxic. It probably
corresponds to M. aeruginosa forma flos-
aquae. The second strain they used was
Microcystis aeruginosa UV-006 (isolated
from the Hartbeespoort Dam) which does
66
possess gas vacuoles and is toxic. This
strain, they suggested, may correspond to
M. aeruginosa forma aeruginosa
(Komarek, 1958).
The cultures were grown at seven different
light intensities (ranging from 4.5 to 40
μEinsteins.m-2.s-1 ) and size range curves
were plotted. The peak of the size
distribution curve was assumed to
represent average cell volume at a
particular light intensity. For the UV-007
cultures, average cell volume increased
with increasing light intensity up to 17
μEinsteins.m-2.s-1. Above 17
μEinsteins.m-2.s-1 a rapid increase in cell
volume preceded cell lysis. A good linear
correlation was found to exist between cell
volume and light intensities.
Changes in cell volumes of the toxic
isolate UV-006 were less than those of
UV-007. Cell size distribution of UV-006
remained relatively constant and stayed
within a narrower range than UV-007 at
corresponding light intensities. At 6.2
μEinsteins.m-2.s-1 UV-006 cell volumes
ranged between 10-50 m3, whereas UV-
007 cell volumes ranged between 20-70
m3 at similar light intensities. At higher
light intensities (26.5 μEinsteins.m-2.s-1),
UV-006 cell volumes ranged between 25-
110 m3, while UV-007 cell volumes
ranged between 20- >200 m3 at 12
μEinsteins.m-2.s-1.
Krhger and co-workers ascribed the
increase in cell size at light intensities
greater than 10 μEinsteins.m-2.s-1 to stress
conditions resulting from an increase in
CO2 concentration (and possibly a change
in the CO2/O2 ratio). This was confirmed
by the fact that no increase in cell size
took place in Microcystis cultures aerated
with 0.5% CO2, despite light intensities of
98 Einsteins m-2 s-1 (Krhger 1978). They
suggested that cell size may be a better
indicator of physiological stress than
turbidity, chlorophyll content or cell
number - small average cell size and
narrow size distribution curve would
indicate a healthy culture - and conclude
from the above that the lower variability in
cell size of the toxic isolate UV-006
suggests that it is better able to cope with
stress conditions than the non-toxic isolate
UV-007.
Non-toxic cells (UV-007 - M. aeruginosa
forma flos-aquae) were found to be larger
(3.4-7.5 μm) on average than toxic cells
(UV-006 - M. aeruginosa forma
aeruginosa) which ranged between 1.8
and 6.4 μm. Non-toxic cells became
larger as light intensity increased to 18
μEinsteins.m-2.s-1, toxic cell size remained
constant or became smaller. They
concluded that cell size should not be used
as a taxonomical character unless careful
account is taken of the environmental
conditions. Thus, cells collected near the
water surface would be expected to be
67
larger than those lower down due to higher
light intensities and low CO2 and O2
concentrations.
Chemical changes in the growth medium
of Microcystis batch cultures grown at
stress and non-stress light intensities
(Krhger and Eloff, 1979b)
Inhibition of the growth of Microcystis
under laboratory conditions occurs at light
intensities >10 μEinsteins.m-2.s-1, whereas
under natural conditions, Microcystis can
endure without adverse effect light
intensities of up to (and exceeding – see
work by Harding, 1996) 1 500
μEinsteins.m-2.s-1. Therefore, light could
not be the limiting factor for growth in
laboratory batch cultures. Krhger and
Eloff investigated the buffer ability of the
growth medium BG 11, changes in pH,
total alkalinity, CO2 and O2 concentration
as a result of the growth of Microcystis
UV-007 to identify the reasons for growth
inhibition of batch cultures at higher light
intensities.
Krhger and Eloff noted that cultures
exposed to lower light intensities (6.0, 9.5
and 12 μEinsteins.m-2.s-1) increased
continuously to maximum pH values of
after 14 to 19 d, whereas cultures exposed
to higher light intensities (19 and 26
Einsteins m-2 s-1) reached a maximum pH
values after 7 and 6.5 d respectively,
thereafter the pH dropped markedly.
From their work it is clear that the time of
maximum growth (i.e. highest turbidity
values) corresponded with the highest pH
values in both cultures, and that the
decrease in growth after 7 and 6.5 d for
cultures grown at higher light intensities
corresponded with a decrease in the pH.
A cessation of growth after 6.5 to 7 d
occurred in cultures grown at higher light
intensities (26 μEinsteins.m-2.s-1). A
depletion of CO2 and a decline in the
concentration ratio CO2:O2 indicating a
higher rate of removal of CO2 by
photosynthesis than replacement by
diffusion, appeared to be a cause. The
concentration ratio CO2:O2 in the cultures
grown at low light intensities (9.5
μEinsteins.m-2.s-1) decreased from 3.5 to
3.0 on the 9th day, and thereafter remained
constant, suggesting that the rate of CO2
removal was compensated for by diffusion
and CO2 stress was not evident.
Krhger and Eloff pointed out that
assimilation of CO2 by algae occurs by the
C3 pathway and ribulose diphosphate
carboxylase with a low affinity for CO2,
suggesting that Microcystis would not
effectively assimilate CO2 at the low
levels occurring in these cultures. They
also point out that RudP carboxylase
shows an oxygenating activity which,
under conditions of low CO2, high O2
concentrations and high pH (conditions
68
found in these cultures), accumulates
glycolic acid which may be excreted by
the cells. They also suggested that this
may also play a role in the die-off of cells,
but that this remains to be investigated.
Krhger and Eloff confirmed that pH does
not appear to be implicated in cessation of
growth at higher light intensities (pH =
10.75) since pH reached higher levels (pH
= 10.78) after 13 d at lower light
intensities, with sustained growth beyond
this period. The same patterns are evident
in O2 concentrations. Die-off could not be
explained by ‘photooxidative death’
described by Eloff as supported by data
from van Vuuren (1979).
Effect of temperature on cell growth
The effect of temperature on specific
growth rate and activation energy of
Microcystis and Synechococcus isolates
relevant to the onset of natural blooms
(Krhger and Eloff, 1978a)
Krhger and Eloff found a correlation
between the water temperature and the
development of Microcystis blooms in
small eutrophic impoundments in the Vaal
River catchment. They reported that
Microcystis blooms started to develop in
open lake water once temperatures reach
16-17EC (Connell et al. 1977, cited in
Krhger and Eloff).
The following organisms were used to test
the effect of temperature on growth:
Microcystis aeruginosa NRC-1 (UV-001);
Microcystis aeruginosa, Berkeley strain
7005 (UV-007); Microcystis aeruginosa,
Hartbeespoort Dam (UV-006);
Microcystis incerta, Cambridge culture
(UV-003); Synecoccus sp, Berkeley strain
6301, previously Anacystis nidulans (UV-
005).
Their results show the effect of
temperature on specific growth rate. A
rapid decline in the growth rate occurs
after the upper temperature limit is
surpassed (light intensities were kept
below saturating intensity).
The mean value of the optimal
temperature range was used to estimate the
optimal temperature value. UV-001
exhibited the lowest lower temperature
limit (10.5EC), while UV-006 (from
Hartbeespoort Dam) had the highest upper
temperature limit (40.0EC) - 3.6 to 5EC
higher than for any of the other
Microcystis isolates investigated. They
suggested that this might have been
attributable to the fact that the other
isolates had been grown under laboratory
conditions for much longer periods at
lower temperatures and had lost their
ability to adapt to higher temperatures.
Also, the other forms originated from
cooler European and Canadian lakes as a
opposed to the much warmer conditions in
South African impoundments. Optimal
69
growth temperatures remained relatively
constant for all Microcystis isolates
ranging between 28.8 and 30.5EC.
Synechococcus displayed the widest
temperature tolerance (lower temperature,
10.3EC; upper temperature 44.3EC) as
well as the highest thermal growth
optimum (34.5EC). The lower
temperature limits of 10.5-13.5EC for the
various Microcystis isolates suggested that
the temperatures in South African
highveld impoundments in winter (7-8EC)
may be a barrier to growth and that
overwintering may be related to the
production of nannocytes (Pretorius and
Eloff 1977, cited in Kruger and Eloff
1978a; see also elsewhere in this review).
Arrhenius plots prepared by Krhger and
Eloff show the specific growth rate as a
function of absolute temperature).
Inflection points are evident for all
organisms, suggesting different Arrhenius
relationships for different temperature
relationships. The changes in slope (i.e.
changes in activation energy) can be
attributed to the existence of master
reactions that limit the rate of growth over
different temperature ranges. Sorokin
(1960), cited in Krhger and Eloff (1978a),
suggested that the regulating reaction in
the lower temperature range is related to
cell division, whereas the regulating
reaction in the upper temperature range is
related to the accumulation of cell
material.
The most notable change in slope for all
organisms occurred at an inflection point
that occurred between 16-17.5EC. For
UV-006 (ex Hartbeespoort dam) this
corresponded to the temperatures recorded
during the occurrence of blooms in South
African impoundments noted by Scott et
al. (1977). Other reported inflection
points could be attributed to the fact that
the light intensities used for the duration
of the experiment were well below
saturating intensity - thus light intensity
rather than temperature may have been
limiting over this range, or that
corresponding with the upper temperature
limits of the organisms.
Effect of temperature and light on M.
aeruginosa UV-006 (van der Westhuizen
and Eloff, 1985).
Microcystis aeruginosa UV-006 was
originally isolated from Hartbeespoort
Dam. In this laboratory study it was
determined that cells were most toxic
when grown in well-aerated cultures at
20EC, a pH of 9.5, maintained using CO2,
and harvested during the late logarithmic
phase of growth. The 20EC LD50 (mice) of
25.4 mg.kg-1 was markedly reduced at
temperatures above 28EC. The fluence
rate induced a much smaller effect, but
toxin production was noted to be less at
the extremes of light availability.
70
Photo-oxidation
The absorption of oxygen from liquid
cultures of blue-green algae by alkaline
pyrogallol (Eloff, 1977a)
In this work Eloff investigated the growth
of Microcytis under different oxygen
tensions in the presence of alkaline
pyragallol, and described the absorption of
oxygen from the growth medium by
alkaline pyrogallol in order to determine
whether photo-oxidation takes place under
relatively low light intensities. Three
forms were used: Microcytis aeruginosa
strain 7005, Synechococcus sp. strain 6311
and Microcystis aeruginosa strain NRC-1.
It was determined that pyrogallol mixed
with equimolar parts sodium hydroxide
and sodium carbonate could absorb up to
70% of the oxygen in a bicarbonate-
carbonate buffered medium without
changing the pH. While this method could
be used to obtain partially anaerobic
conditions for the growth of Microcystis
cultures, at least 20% of the oxygen
remained in the medium. It is evident that
the higher the pyrogallol concentration,
the higher the yield in the Microcystis
culture. Eloff ascribed the increase in
yield of Microcystis grown in closed
containers in the presence of pyrogallol to
reduced photo-oxidation due to lowered
oxygen tensions rather than an increase in
the carbon dioxide concentration. The
experiments also confirm that photo-
oxidation could take place at low light
intensities of 1-4 × 10³ ergs.cm-2.s-1.
The influence of CO2
Chemical changes in the growth medium
with regard to pH, CO2 concentration, O2
concentration, alkalinity and buffer ability
of Microcystis cultures grown at stress
and non-stress light intensities (Krhger,
1978; Krhger and Eloff, 1981).
Krhger hypothesized that the inhibition of
growth of cultures could not be ascribed to
depletion of nutrients in the commonly
used BG-11 growth medium (since this
medium contains an excess of mineral
nutrients), pH or high O2 concentrations,
but to the depletion of the total inorganic
carbon content of the medium. Krhger
knew that from work conducted by
Wildman et al. that Microcystis might
release phosphate into the surrounding
medium and thereby increase its buffer
capacity. Since cyanophytes are not
known to grow at low pH levels - pH
values of 10 have been found to be
optimum (Gerloff, Fitzgerald and Skoog
1950 cited in Krhger 1978a), this may
serve to maintain pH levels within a
suitable range. However, Krhger (1978a)
points out that poor growth at very low
(<6.5) and very high pH levels (>10) has
more to do with the changes in the
71
composition of the medium than with the
pH per se.
Krhger also carried out tests on the
buffering ability of the growth medium
and found this to be about the same as tap
water. An increase in pH occurred at all
irradiance levels, suggesting that
Microcystis does not excrete sufficient
organic substances to buffer the medium
and prevent major pH changes. Turbidity
and pH values were found to correspond
to one another - highest turbidity values
correspond with the highest pH values.
Turbidity and pH values at 27 and 19
μEinsteins.m-2.s-1 decreased sharply after
6.5 and 7 d.
This paper reports changes with time in
turbidity, pH, O2 concentration, ΣCO2,
CO2:O2 ratio and total alkalinity. The
concentration of H2CO3 after 5 d was
calculated at 1.5 × 10⁻³ μmol.ℓ-1 - when the
minimum concentration of ΣCO2 (ΣCO2 =
H2CO3 + HCO-3 + CO2-
3) and maximum
pH values were reached. King (1970,
cited in Krhger, 1978a) suggests that the
minimum concentration of CO2 (aq)
required to support photosynthesis is 2.5
μmol.ℓ-1 – 1 600 times higher than the
value measured. From these results,
Krhger concluded that the cessation of
growth in cultures grown at 26
μEinsteins.m-2.s-1 after 6 d was therefore
due to the depletion of ΣCO2 in the
medium. Krhger, furthermore, indicated
that cessation of growth could not have
been caused by pH per se since pH
reached higher levels (pH =10.78) after
13 d at a lower light intensity, and where
healthy growth of cells was maintained.
This led him to conclude that the inability
of Microcystis to grow for extended
periods at light intensities > 10
μEinsteins.m-2.s-1 is due to a higher rate of
removal of CO2 by photosynthesis than
replenishment by diffusion. The poor
buffering capacity of the medium would
have further reduced the free CO2
concentration. At 9.5 μEinsteins.m-2.s-1
the rate of CO2 removal by photosynthesis
was in equilibrium with the rate of
replenishment, thus stress CO2
concentrations did not develop in these
cultures.
The influence of CO2 concentration of the
aerating gas, on the growth of Microcystis
in batch cultures (Krhger, 1978a).
In further work, Krhger suggested that
standardization of the CO2 concentration
and pH in batch cultures would be
important to obtain reproducible data for
investigating aspects such as nutrition.
Aeration with CO2 enriched air is the most
feasible way of achieving this. Different
concentrations of CO2-air mixtures were
bubbled through autoclaved medium at a
constant rate and the pH was determined.
Microcystis UV007 was used.
72
A correlation was found to exist between
μ max (d-1) and the CO2 concentration of
the aerating gas. The differences,
however, were not marked. The CO2
concentration of the aerating gas was
found to have a significant effect on the
final cell number and degree of
multiplication obtained in the culture after
6.6 days. Bleaching of cells was found to
occur at all irradiance levels when cultures
were aerated with air only or not aerated at
all. A correlation was found between CO2
concentration of the aerating gas and the
light intensity that the cultures could
withstand before bleaching occurred. CO2
concentration of the aerating gas was also
found to have an influence on cell
diameter - the lower the CO2
concentration, the larger the cell diameter.
Low CO2 concentrations appeared to
inhibit cell division. Healthy cells thus
tend to be smaller than cells under CO2 or
light stress (cell size is not directly
influenced by light stress but by the
growth rate of the cells which affects the
CO2 concentration of the medium under
different light intensities).
From his work, it was possible for Krhger
to determine the mathematical relationship
between specific growth rate and light
intensity using light intensities as high as
100 μEinsteins.m-2.s-1, since growth
inhibition and bleaching at these light
intensities did not occur in aerated batch
cultures.
Krhger concluded that it was possible to
prevent bleaching and die off of cells at
higher light intensities through aeration
with an appropriate concentration of CO2.
The CO2 concentration gradient between
the sparged gas and the medium was
found to be more important than the
volume of gas sparged per unit time.
Role of CO2 in culture of axenic
Microcystis for isolation of the toxin
(Krhger and Eloff, 1982)
Krhger and Eloff (1982) compared three
different cultures of Microcystis with
respect to their sensitivity to light. The
condition of the cultures was determined
using turbidity, cell number, chlorophyll-a
concentration and rate of photosynthesis.
They found that bleaching and die-off of
cells subjected to high light intensities
could be prevented if they were aerated
with CO2. The CO2 concentration gradient
between the aerating gas and cell
suspension was found to be more
important than the volume of gas sparged
per unit time. Krhger and Eloff (1982)
postulated that, as well as playing a
nutritional function, the CO2 may play a
catalytic role in protecting the cells against
photoinhibition. They suggest that
oxygenation instead of carboxylation by
ribulose diphosphate carboxylase may be
induced by the low CO2:O2 ratio just prior
to bleaching and lysis.
73
CO2 concentration was found to influence
cell size - the higher the CO2 concentration
the smaller were the cells.
The effect of agitation and turbulence
The effect of agitation and turbulence of
the growth medium on the growth and
viability of Microcystis (Krhger and Eloff,
1978a)
Eloff cites observations by Shillinglaw
and Pieterse (1977) that Microcystis
aeruginosa forma flos-aquae was the
dominant alga in pond systems having a
retention period of longer than 20 d,
suggesting that the turbulence associated
with shorter retention periods may
regulate growth. Microcystis blooms are
also known to develop after several wind-
free days. The purpose of this study was
to investigate the effect of agitation on the
growth of Microcystis in order to
determine the possible impacts of a
pumping system on the axenic mass
culture of Microcystis and the importance
of turbulence for water management.
Turbulence was found to have a slight
beneficial effect on the growth of UV-007
(M. aeruginosa Berkeley strain 7005)
reflected in the increased μ (maximum
specific growth rate measured during the
exponential growth phase) and the highest
turbidity values reached within 20 days
(log2 Tt/T0). Krhger and Eloff found that
these observations could be attributable to
more efficient aeration, improved nutrient
uptake and accessibility and exposure of
individual cells to light in the turbulent
cultures.
Turbulence increased the viability of the
cells (expressed as percentage recovery).
A significant correlation (r - 0.94, n = 5)
was obtained between the mean of the
percentage recovery values and linear
velocity. The researchers ascribed this to:
better accessibility to CO2, improved
nutrient uptake and accessibility, more
efficient illumination and a physiological
change in the cells leading to the
production of nannocytes.
The adverse effects on Microcystis of
water bodies with a short retention period
could not be ascribed to turbulence.
Krhger and Eloff proposed two
explanations for this:
(i) that the increased agitation of
a water body may lead to
increased CO2 availability
thus making green algae more
competitive; and
(ii) (ii) that the dispersion of a
growth factor in the water by
higher circulation levels.
These results should be
compared with those of
Harding (1997b), determined
74
in situ in a polymictic
hypertrophic lake.
Mass cultivation
Mass culture of Microcystis under sterile
conditions (Krhger and Eloff, 1978c)
In this study Krhger and Eloff state their
reasons for attempting to develop the mass
culture of algae as being the high protein
content relative to other plants (Fisher and
Burlew, 1953, cited in Krhger and Eloff,
1978c), and the ability of algae to
photobiosynthesise valuable organic
compounds which are difficult to
synthesize in vitro (such as sterols).
Surprisingly, they do not mention the
value of mass production of toxic
secondary metabolites for analytical
purposes.
But the primary aim of developing mass
culture techniques was to study the
biochemical characteristics of algae,
which requires access to large quantities of
axenic cell material. Natural algal blooms
which are subject to seasonal variation,
impurities (bacteria, zooplankton etc.) and
variations in the toxicity from bloom to
bloom could not be relied upon for the
isolation of biologically active substances
(Scott, 1987). One of the main reasons
why the structure and properties of the
toxins produced by Cyanophycaea could
not be studied were the difficulties
involved in mass culture. Problems
associated with mass culture included self-
shading and aeration (provision of CO2
and removal of O2).
Based on the system built by Juttner et al.
(1971), which they used to cultivate
Chromatium, Krhger and Eloff built a
similar tubular mass culture system to
grow Microcystis. Prior to the publication
of this work, no successful attempts to
grow a mass culture of Microcystis in this
type of system had been reported.
Microcystis aeruginosa (UV-007)
Berkeley strain 7005 was grown at 28EC
in BG-11 medium modified by altering the
citrate concentration and using 0.006 g.ℓ-1
FeSO4 instead of ferrous citrate.
This system yielded 8.5 g.ℓ-1 fresh mass
per litre per day over 7.6 d with a growth
rate of 0.6 doublings per d (F = 0.41 d-1)
and a total yield of 507.9 g. The high light
intensity (130 μEinsteins.m-2.s-1) did not
appear to have an inhibitory effect on the
cells and Krhger and Eloff suggested that
the same yield may be obtained in a
shorter space of time with increased light
intensity. pH was controlled between 8.5
and 10 by the addition of CO2.
They found that the O2 concentration of
the aerating gas, as well as that produced
by the cells, had no inhibitory effect on
cell growth despite high light intensities,

75
as long as the CO2 concentration remained
high. This suggested that a high CO2
concentration might be important for
protecting the cells against photooxidative
death (Eloff et. al. 1976 cited in Krhger
and Eloff 1978c).
76
6.4 Ecological field studies on
algal blooms
Algal blooms in the Vaal catchment area
(Tow, 1976)
Tow made observations on the chemical
parameters in several dams in the
Witwatersrand area between August 1974
and August 1975. He attempted a
correlation of the physical and chemical
parameters of the dams with the onset of
blooms of Microcystis aeruginosa.
Sodium, potassium, calcium and
magnesium concentrations were
monitored and found not to be limiting.
Monitoring of the seasonal variation in
primary productivity revealed highest
levels over spring and summer. The
vertical distribution of Microcystis in the
water column over a 24-h period was also
monitored and Microcystis colonies were
found to concentrate at the surface during
mid-morning. A downward movement
occurred at noon, and the colonies were
found in deeper water at night.
Apparently Tow did not attempt any
correlations with prevailing wind
directions.
The enrichment of the Jan Smuts Park
Dam was found to be due to sewage
discharge, combined with a high
evaporation rate and the absence of a
natural outlet, creating conditions most
favourable for the growth of Microcystis.
Similar conditions prevailed in the
Kleinfontein Dam. However, the absence
of a bloom during the summer of the study
period was assumed to be due to the high
turnover rate and low ammonium and
nitrogen levels. While Homestead Park,
Middle and Civic Dams were found to be
relatively unpolluted, although the
development of a bloom during the study
period was assumed to be due to an influx
of raw sewage. A comparison of the Jan
Smuts Park and Kleinfontein Dams
indicated the importance of nitrogen and
ortho-phosphate in bloom development.
During the period when Microcystis was
absent from the phytoplankton, the algae
was found to be present in the benthic
sediments of the dam, indicating that it
overwintered in the sediments.
Nitrogen fixation in a nitrogen-limited
impoundment (Ashton, 1976)
Ashton (1976) investigated conditions in
the Rietvlei Dam in terms of the
succession of algal blooms and nitrogen
fixation (the fixation of atmospheric
nitrogen by blue-green algae in freshwater
lakes can be a major factor in nitrogen
budgets) - especially in terms of the
heterocystous, nitrogen-fixing blue-green
algae Anabaena circinalis. The dam
frequently experienced large algal blooms
77
due to nutrient loading emanating from the
Hennops River.
Ashton reported changes in nitrogen
fixation rates with depth and time in the
top 6 m of the dam over the duration of
two 12-h studies. Fixation rates were
found to increase to a maximum at around
noon and then to decrease again between
noon and 18:00. With increasing depth,
the time of maximum fixation rates also
increased. Also, maximum nitrogen
fixation rates at depths of 1 and 2 m were
found to be less than maximum values at
0.25 m, indicating the importance of light
intensity in nitrogen fixation.
The total amount of nitrogen fixed per
hour on two days: (a) November 25th,
1975 and (b) December 9th of the same
year. Nitrogen fixation levels recorded for
December 9th were approximately 2% of
those recorded on 25 November, and
corresponded to the numbers of A.
circinalis colonies recorded at the time of
the surveys. Approximately 29% of the
total daily nitrogen fixation occurred
before noon - the largest proportion was
fixed between 12:00 and 15:00.
A comparison of the nitrogen and
phosphorus sources identified by Ashton
with the cell counts of A. circinalis for the
top 6m was undertaken. Low Kjeldahl-N,
NO3-N, NO2-N, PO4-P and total P
measured on November 25th suggested that
large quantities of these nutrients were tied
up in the algal cell material. High NH3-N
levels, that are indicative of the liberation
of large amounts of ammonia by algae as
products of nitrogen fixation, were
considered. The increase in Kjeldahl-N,
NO3-N, NO2-N, PO4-P and total P values
after the disappearance of the bloom
provided evidence of the subsequent
release of these elements from dead and
lysing algal material. The decrease in
Kjeldahl-N, NO3-N and NH3-N during
December was due to the onset of a
Microcystis bloom following the A.
circinalis bloom.
Based on daylight fixation rates, Ashton
estimated the total amount of nitrogen
fixed during the period of the Anabaena
bloom as being 1.13 metric t. (19 Kg N
fixed day-1). This is of some significance
when compared with the nitrogen loading
of the Hennops River (35.8 metric t a-1).
The fixation of nitrogen by algae is thus
equivalent to 3.2% of the annual loading.
Ashton pointed out that this value was
determined from a (temporally) short
period, and that the loads could vary
considerably from year to year.
Ashton further described the succession of
algal blooms in the Rietvlei dam as
follows: after winter overturn the
concentration of dissolved nitrogenous and
phosphorous compounds in the surface
waters are high, but concomitantly-low
water temperatures prevented the growth
of green and blue-green algae. Certain
78
cold-tolerant species were, however, able
to survive (eg. Melosira granulata var.
angustissima). As temperatures rose, non-
nitrogen fixing species became dominant
(eg. Volvox rousseletti), and reduced the
amount of available nitrogenous
compounds – resulting in a phosphorous-
rich environment suitable for the onset of
nitrogen-fixing blue-green algae i.e. A.
circinalis. Cooler weather and heavy
rainfalls caused a disappearance of the A.
circinalis bloom and the release of large
quantities of nitrogen. This led to the
creation of an environment suitable for the
onset of noxious nitrogen-requiring blue-
green algae, e.g. Microcystis aeruginosa
that are able to tolerate lower water
temperatures.
Ashton emphasised the importance of
phosphorous loading rather than nitrogen
loading in governing algal production,
since nitrogen is readily available from the
atmosphere. Thus, any treatment or event
that limits the availability of nitrogen and
not phosphorous would not be effective in
controlling problems related to
eutrophication.
The occurrence of Microcystis aeruginosa
in the bottom sediments of a shallow
eutrophic pan (Tow, 1979)
In a subsequent investigation, Tow
observed that little was known of the fate
of Microcystis aeruginosa during its
absence from the phytoplankton in the
winter months (here it should be noted that
this observation pertained to the pan
systems he was studying – perennial
dominance or presence of M. aeruginosa
is quite common in many parts of South
Africa). Tow collected sediments and
water samples over the period 27th July to
3 November 1975 from Jan Smuts Park
Dam, a natural shallow pan to the north of
Brakpan. Microscopic examination of the
sediments did not reveal the presence of
M. aeruginosa. The sediments were
therefore incubated to determine the
presence or absence of the alga. M.
aeruginosa - colonies appeared in all the
sediment samples after a period of
incubation.
Tow cites Reynolds (1973) as stating that
colonies settle on the bottom sediments
during autumn due to a reduction in the
number of their gas vacuoles. From the
results of his culture experiments, Tow
decided that M. aeruginosa colonies break
up into individual cells by sloughing off
the mucilaginous sheath, settle in the
sediments and later, under favourable
environmental conditions, redevelop into
colonies. They may also reform colonies
from the release of nannocytes (Pretorius
et al. 1977 cited in Tow, 1979). Tow
further postulated that water temperatures
might be the most important factor in
stimulating the development of summer
populations.
79
Studies on the ecology, growth and
physiology of toxic Microcystis aeruginosa
in South Africa (Scott et. al., 1981)
Growth of Microcystis at different light
intensities
Scott and co-workers concluded that the
ability of Microcystis to grow well at
relatively low light intensities (3 600 lux)
was indicative of a competitive advantage
that Microcystis has over other algae.
They were of the opinion that a further
competitive advantage is the presence of
gas vacuoles that prevent the cells sinking
to a depth where light may be limiting (for
a detailed review of cyanobacterial
buoyancy mechanisms see Walsby 1987).
Scott and co-workers recorded sigmoidal
growth curves for light intensities of
3 600, 5 700 and 18 000 lux. The initial
lag phased decreased with increasing light
intensity. Cultures grown at 3 600 lux
(corresponding to a depth of 4-5 m in a
typical non-silty Transvaal impoundment)
were observed to remain green, while
cultures grown at 5 700 and 18 000 lux
turned yellow-green and yellow
respectively. After returning these
cultures to lower light intensities (720 and
230 lux respectively), they turned green
again, but were unable to resume high
growth rates. Gas vacuole content was
also observed to increase with increasing
light intensities and age of the culture,
supporting the hypothesis that the
vacuoles act as light shields.
Fine structural observations
Thykaloid numbers decreased as the light
intensity increased: 4-6 long thykaloids
stacked parallel to the cell wall were
observed at lower light intensities. At
higher light intensities, thykaloids were
more fragmentary and arranged
perpendicular to the cell wall. Ageing
appeared to increase the number of
cyanophycin granules and lipid droplets in
the cells.
Field measurements.
Scott’s team compared the laboratory
observations on the pigmentation of
Microcystis aeruginosa with observations
of colonies kept in dialysis tubes for 48 h
in the Hartbeespoort Dam. Cells at the
surface of the dam showed a linear drop in
the chlorophyll:carotenoid ratio due to a
decrease in the chlorophyll content and a
more gradual decrease in the carotenoid
content. Cells at 3 m and 28 m showed an
increase in chlorophyll content, while
carotenoid content showed a slight
increase resulting in a lower
chlorophyll:carotenoid ratio.
Scott et al. (1981) suggested that
Microcystis adapts to high light intensities
by reducing the chlorophyll content of the
80
cells - at lower light intensities and in
darkness more chlorophyll is synthesised.
Disruption of Microcystis colonies for
enumeration as single cells (Zohary and
Pais Madeira, 1987)
Many researchers have been confronted by
the frustration of needing to disaggregate
colonies of Microcystis in order to be able
to count and measure single cells, and
accurately determine biovolumes. Tamar
Zohary and Cangela Pais Madeira
developed a simple and effective means of
disrupting the colonies using a high speed
“Ultra-Turrax”-type blender process.
Concomitant effects on the counts of other
phytoplankton present in the sample were
found to be minimal. The technique has
been and is still used in many laboratories.
Ecological associations of cyanobacteria
in a shallow, hypertrophic lake (Harding,
1991, 1992a,b, 1994, 1996, 1997a, 1999).
Over a period of 8 years, Bill Harding
conducted a series of in-depth
investigations of cyanobacteria in shallow
coastal lakes, and in particular Zeekoevlei,
a hypertrophic, continuously mixed
system. From his work Harding was able
to show that:
conditions in the well-mixed lake were
akin to those in a chemostat,
supporting significantly higher levels
of primary production than would
otherwise be the case;
that Microcystis aeruginosa forma flos
aquae is capable of acclimating and
attaining high levels of dominance in
conditions of rapidly fluctuating light
availability, and where mean wind
speeds were sufficient to otherwise
offset the gas vacuolate upward driven
motion of the alga;
that high frequencies of mixing select
for the generally non-toxic
Microcystis aeruginosa forma
aeruginosa;
Levels of primary production in
Zeekoevlei were comparable with, or
exceeded, those of the most
productive systems yet studied;
Despite sustained, non-limiting
availability of nutrients,
phytoplankton succession in
Zeekoevlei was dominated by large
ornamented chlorophyte species
during the spring and autumn, and by
Microcystis during the winter and
spring. The co-dominance of
chlorophyte species occurred despite
the high mean pH (9.3) and low N:P
(< 10) ratios;
Phytoplankton diversity was low, with
between 1 and 2 species comprising in
excess of 80% of the total
phytoplankton biovolume at any time.
This finding was consistent with the

81
tenets of the Intermediate Disturbance
Hypothesis (Connell, 1978).
82
6.5 The NIWR Hartbeespoort
Dam study
The presence of toxic Microcystis in
Hartbeespoort Dam (Scott, 1983).
During the early 1980s the Technical sub-
Committee of the Hartbeespoort Dam
study decided that a sensitive assay for
microcystins should be developed, and
that mouse assays would only give a yes
or no answer. Scott examined weekly
samples from the Hartbeespoort Dam to
determine the relative proportions of
Microcystis aeruginosa forma aeruginosa
(the toxic form) and M. aeruginosa forma
flos-aquae (Scott et. al., 1981) (non-toxic)
between 2nd November 1982 and 27th
September 1983.
Microcystis aeruginosa forma aeruginosa
was found to be present in the dam for at
least 10 months of the year. Toxicity tests
on Microcystis aeruginosa forma
aeruginosa using mouse assays confirmed
that it was always toxic.
Factors controlling primary production in
a hypertrophic lake (Hartbeespoort Dam,
South Africa) (Robarts, 1984)
Robarts (1984) investigated the physical
factors controlling algal primary
production (large populations of
Microcystis aeruginosa) in the
Hartbeespoort Dam, a hypertrophic, warm,
monomictic lake with high nitrogen and
phosphorous loading from the surrounding
suburbs. Amax, the maximum rate of
photosynthesis in the depth profile was
found to range between 12.4 mg.C.m-3.h-1
during April 1981 (winter overturn) and
5916 mg.C.m-3.h-1 during December 1981
(summer). Planimetrically-determined
integral rates of primary production (ΣA)
ranged between 46.9 mg.C.m-2.h-1 during
April 1981 and 3381 mg.C.m.-3.h-1 during
December 1981.
Robarts separated the factors controlling
primary production in the Hartbeespoort
Dam into two categories: Category (1)
included nutrient (N and P) and wind
factors which affected the algal standing
crop: high N and P loading rates ensured
that nutrients did not become limited and
were therefore initially responsible for
high primary production. Wind patterns
were responsible for considerable spatial
and temporal changes in the standing crop.
Category (2) included biological, chemical
and physical factors that affected rate
processes. The buoyancy mechanism of
M. aeruginosa enabled the bulk of the
population to remain within the euphotic
zone.
83
Microcystis aeruginosa and underwater
light attenuation in a hypertrophic lake
(Hartbeespoort Dam, South Africa)
(Robarts and Zohary 1984)
As part of the Hartbeespoort Dam
Research Programme (see elsewhere in
this review) Richard Robarts and Tamar
Zohary investigated underwater light
attenuation, primary productivity and
phytoplankton dynamics in the
hypertrophic Hartbeespoort Dam. The
dominant component of the phytoplankton
assemblage during most of the year was
Microcystis aeruginosa. Nitrogen and
phosphorus availability was never found
to be limiting, but was always in excess of
requirements.
The researchers found that blue light (443
nm) was found to attenuate more rapidly
(1% of the sub-surface value remained at
values ranging from 0.3-4.2 m) than green
(550 nm) (1% of the sub-surface value
between 0.6-8.5 m). A variable light
regime was suggested by euphotic zone
depth variation (zeu) (1% PAR) which
ranged between 0.6 and 6.4 m in 1982-83.
Surface chlorophyll a concentrations
ranged between 3.4 and 1 000 mg.m-3.
Most of the algal pigment was confined to
the upper 4 m of water column –
constituting a major factor constraining
light availability.
M. aeruginosa, was found to be the
dominant alga in the upper 8 m of the lake
during most of the year. Lowest algal
biovolumes were reached in late winter to
spring (10-30% of the total phytoplankton
volume during August to October).
During September and October species of
Chlorophyta appeared and became
dominant. Between the end of October
and December, M. aeruginosa increased
from comprising 50% of the
phytoplankton population to levels in
excess of 90%. By May, it comprised 98-
99% of the population. Decline occurred
in June and July and M. aeruginosa was
replaced as the dominant species by
Melosira granulata. A wide range of
colony sizes was recorded for M.
aeruginosa, ranging from 10 × 10 μm to
50 mm in calm weather. After dispersal of
the scums by wind, colonies of 10-100
mm in diameter were measured which
fractured easily when water turbulence
increased.
PAR and underwater light attenuation
were strongly affected by chlorophyll a.
However, only 68% of the variance
accounted for the relationship between
chlorophyll a concentration and light
attenuation, suggesting that other factors
were involved.
Primary productivity (measured by uptake
of radiolabelled 14C-CO2) ranged between
46.3 mg.C.m-2.h-1 and 2 290 mg.C.m-2 h-1.
Production was restricted to upper 4 m of
84
water column due to vertical stratification
of the phytoplankton and algal self-
shading (see comments above).
Two principal reasons for dominance of
M. aeruginosa were proposed by Robarts
and Zohary. Firstly, the ability of the alga
to maintain position in the upper part of
the water column. Robarts and Zohary
cite Humphries and Imberger (1982) as
suggesting that the alga could maximise
the photic depth to mixed layer depth
quotient (zeu/zm). The buoyancy
mechanism of the alga would remain in
the diurnally mixed layers (except during
high wind), zm in the quotient and the time
the algae spent in the euphotic zone would
be reduced. The second advantage that M.
aeruginosa has over other lake
competitors is its ability to increase in
colony size with a decrease in mixing and
turbulence (it was noted that when calm
weather followed a windy period, M.
aeruginosa moved to the surface and small
colonies started to clump together). The
increase in colony size would moderate
light attenuation and, hence, reduce self-
shading.
Hyperscums of the cyanobacterium
Microcystis aeruginosa in a hypertrophic
lake (Hartbeespoort Dam, South Africa)
(Zohary, 1985)
Tamar Zohary proposed that densely
packed scums of blue-green algae covered
by a crust of photo-oxidized cells and
found on the surface of hypertrophic
impoundments after prolonged periods of
warm weather be referred to as
‘hyperscums’. The physical, chemical and
biological characteristics of an extensive
hyperscum of M. aeruginosa covering
1-2 ha of the Hartbeespoort Dam in South
Africa for a period of 103 days were
investigated in this study. Zohary was of
the opinion that these hyperscums are rare
and do not occur in smaller hypertrophic
freshwater bodies. She postulated that the
conditions driving their development
include: hypertrophic conditions, a large
volume of water, stable weather conditions
and lake morphometry with wind-
protected sites for cyanobacterial
accumulation such as that provided by
impoundment structures such as the
Hartbeespoort Dam wall.
M. aeruginosa was the dominant
component of the hyperscum community
of cyanobacteria, comprising >99% of the
phytoplankton biomass. At 10 cm depth,
the number of M. aeruginosa cells per unit
volume ranged between 0.86 × 10⁹ and
1.76 × 10⁹ cells.mℓ-1. The chlorophyll a
85
concentration of the colonies exceeded
100 mg.ℓ-1 (1 x 10⁵ Fg.ℓ-1) - the highest
value reported for any planktonic
cyanobacteria in freshwater systems!
A surface crust on the top few centimetres
of the scum was identified as comprising
of a layer of Microcystis cells exposed to
photo-oxidizing conditions with high light
intensities, oxygen supersaturation and
CO2 depletion. Photo-oxidative damage
was evident as bleaching of the pigments,
which occurred after 2-3 hrs of exposure
to midday radiation. The buoyant crust,
1-3 mm thick covered the underlying
cyanobacteria. Light intensity below this
crust was found to be <0.001 μE.m-2.s-1,
making the interior of the scum aphotic.
Diel temperature variation within the
hyperscum ranged between 4.2 and 23.4°C
compared with 12.5 and 16.7°C within the
main basin of the dam. Dissolved oxygen
within the scum was undetectable. pH
ranged between 6.2-6.8 in the scum
compared with 8.8-9.6 in the main basin
of the impoundment. Redox potential
ranged from highly negative (-240 mV)
within the scum to positive (+51 mV) just
below it, while chlorophyll concentrations
ranged from 224 mg.ℓ-1 in the hyperscum
to 2.4 mg.ℓ-1 just below it (Table II, p.404
and Fig 4. p.405). Ammonium-N
concentration increased over time to a
maximum of 273 mg.ℓ-1 – a level ten times
the level of raw domestic sewage (Reeves
1972, cited in Zohary 1985). Nitrate-N
and nitrite-N concentrations were
negligible. From the above observations
Zohary suggested that the bacteria are
involved in denitrification and
ammonification processes.
Thus the conditions inside the hyperscum
are aphotic, anaerobic, highly reducing
with fluctuating temperatures and reduced
water movement. Zohary was able to
determine that, despite this, the
cyanobacteria were able to remain viable
under these conditions for as long as
77 days (11 weeks). Zohary suggested
that M. aeruginosa is capable of
chemoheterotrophic growth in the dark, as
has been reported for other cyanobacteria
(e.g., Khoja and Whitton, 1971, cited in
Zohary, 1985). The ecological function(s)
(if any) of the hyperscums could not be
determined by Zohary, but she felt that
they could serve as inocula for the
following season (in the same way as
overwintering in benthic sediments).
Factors favouring the formation of
Microcystis hyperscums (Zohary and
Breen, 1989)
Hyperscums were defined by Zohary
(1985) as crusted and buoyant
cyanobacterial mats that could persist at a
given location for extended periods of up
to several weeks. Cyanobacterial bloom
formation depends on the pre-existence of
86
a large enough and buoyant population of
cyanobacterial cells that, should wind-
induced mixing or turbulence be
insufficient to offset upward cell
movement, will aggregate at or near the
surface of a body of water (Reynolds and
Walsby, 1975). Zohary and Breen
examined the phenomenon of hyperscum
formation in further detail, and concluded
that, in addition to the above pre-requisites
for bloom formation, for hyperscums to
form prolonged periods of low wind
speed, suitable lake morphometry, large
standing crops of cyanobacteria and high
insolation were necessary.
Digestion of Microcystis aeruginosa by
Oreochromis mossambicus (de Moor and
Scott, 1985)
In this investigation De Moor and Scott
(1985) reported on the digestion of
Microcystis aeruginosa by Oreochromis
mossambicus and described its passage
through the gut.
The protein content of Microcystis used in
the feeding experiments, as determined by
de Moor and Scott (1985), was found to be
high (56%), whereas the phosphorus
content was always less than 1%. The
mean ash content was 7.0%. Experiments
designed to determine assimilation
efficiencies revealed a 5% decline in the
protein content of Microcystis fed to fish
over a 24 hr period, suggesting some
breakdown of cells and leaching of soluble
proteins. The analysis of faecal matter
(using total organic matter and protein
estimates) showed a wide range of
assimilation efficiencies for protein (32-
92%). The digestion of M. aeruginosa by
O. mossambicus was confirmed by
electron microscopical examination (EM)
of the faecal matter.
This EM of the faeces revealed cell-
content disintegration of Microcystis. 20-
25% of green faeces contained
ultrastructurally undamaged cells, while
less than 1% of the reddish brown faeces
contained undamaged cells. The colour of
the faeces is determined by the gastric pH
at the time of ingestion: low gastric pH
results in the cell walls becoming
permeable, allowing the entry of
proteolytic enzymes and leaching of cell
contents.
Comparison between the growth of O.
mossambicus fed on trout pellets and fish
fed on M. aeruginosa exclusively showed
a 2% change from the start to the end of
the experiment of fish fed on M.
aeruginosa. Fish fed on trout pellets
showed a 19% mass change, i.e. indicating
that M. aeruginosa is inadequate as a sole
food source for O. mossambicus.
De Moor and Scott concluded that,
although the digestibility of M. aeruginosa
was confirmed by the results of these
87
experiments, it was not adequate as the
sole food source.
Zooplankton community grazing in a
hypertrophic lake (Hartbeespoort Dam,
South Africa) (Jarvis, 1986)
Andrew Jarvis investigated the seasonal
population dynamics of the dominant
cladoceran species in terms of grazing
rates and food availability in the warm,
hypertrophic Hartbeespoort Dam.
Large cladocerans, Daphnia pulex and D.
longispina (up to 2.25 mm long),
dominated zooplankton biomass from
autumn to mid-summer. From January to
April (summer) of 1981 and 1982,
Daphnia was replaced by Ceriodaphnia
reticulata as the dominant crustacean.
The integrated community grazing rates
were highest in December (260% day-1)
when Daphnia dominated the grazing
community and edible phytoplankton were
diminishing through grazing pressure.
Lowest community grazing rates occurred
between Jan - Feb (19.8 - 35.3%) when the
phytoplankton comprised primarily
Microcystis, and with Ceriodaphnia
dominating grazing community during this
time. The specific grazing rate reflected
changes from Daphnia to Ceriodaphnia -
integrated specific grazing rates were
highest when Ceriodaphnia dominated the
herbivore community.
Species succession ranged from spring
dominance by edible Chlorophyceae and
Cryptophyceae to summer, autumn and
winter dominance by inedible Microcystis.
The most abundant, partially edible, genus
was Melosira. Midsummer decline in
Daphnia population and shift to smaller
cladoceran community (Ceriodaphnia)
was accompanied by a change from edible
phytoplankton species to Microcystis.
Several studies cited in Jarvis (e.g.,
Webster and Peters 1978; Gliwicz 1980;
Porter and McDonough 1984) indicate that
increased concentrations of large
cyanobacterial colonies reduce the
filtration rates of large cladocerans, and
increase particle rejection rates, leading to
increased energetic cost of their feeding
response and reduced brood size. Thus,
feeding by large Daphnia may have been
reduced by the presence of Microcystis.
Jarvis did not, however, rule out the
possibility of predation by fish fry as
being a possible explanation for the
decline in large Daphnia at the time of the
change to cyanobacterial dominance.
Lampert (1982), cited in Jarvis (1986)
reports that toxic inhibition of in situ
CGRs and SGRs by Microcystis does not
appear to occur.
Gliwicz (1977) cited by Jarvis indicated
that small-bodied cladocerans (e.g.
Ceriodaphnia) have a lower particle size
limit to ingestion and are able to replace
88
large cladocerans (e.g. Daphnia) in water
with large Cyanophyceaen particles.
Jarvis concluded that large filter feeders
such as Daphnia unlikely to retard
Cyanophycaea blooms by high grazing
pressure (see also the results of studies by
Combrink, 1994; and Harding and Wright,
1999).
See Supporting Literature
Apparent predation of Microcystis
aeruginosa Khtz. emend Elenkin by a
Saprospira-like bacterium in a
hypertrophic lake (Hartbeespoort dam,
South Africa) (Ashton and Robarts, 1987)
In this paper, Ashton and Robarts
described the colonisation and apparent
lysis of Microcystis aeruginosa by a
Saprospira-like organism in the
Hartbeespoort Dam. They noted that a
bloom of M. aeruginosa obtained from the
Hartbeespoort Dam had been colonised by
a colourless, unbranched gram-negative,
helically-shaped organism. A DAPI (a
DNA fluorescing stain) resolved the
organism into a series of bow- or comma-
shaped, prokaryotic cells. Colonisation
commenced on the ends of protruding
lobes and advanced along the colony.
Those portions of the colony that appeared
to have been parasitised were colourless
and the cell contents lysed, whereas
unparastised portions of the colony
appeared to be healthy. The filaments of
the organism appeared to penetrate the
outer sheath of the colony.
On the basis of morphological data,
Ashton and Robarts tentatively identified
the organism as Saprospira, possibly
S. albida. Their observations suggested
that this organism might be parasitic and
not dependent on the autolytic products of
Microcystis. They were only found in the
upper epilimnion, corresponding to the
depth distribution of Microcystis. It was
estimated that between 10 and 20% of the
Microcystis colonies in the upper 3 m of
the water column had been affected.
The researchers decided that Saprospira
only attacked the toxic form of
Microcystis (M. aeruginosa forma
aeruginosa) and that bioengineering
techniques may be used to produce a
persistent form that could aid in the
management of these blooms.
Ecological problems in Hartbeespoort
Dam (Jarvis, 1987).
Due to nutrient loading in the
Hartbeespoort Dam, the phosphorous
concentration is high and results in an N:P
ratio of between 5 and 2:1 (the ideal ratio
of carbon, nitrogen and phosphorous being
100:16:1 – the ‘Redfield’ ratio). Although
89
low nutrient ratios may suggest nitrogen
limitation of Microcystis aeruginosa (not
known to be capable of fixing its own
nitrogen), nitrogen levels in the
Hartbeespoort Dam never decrease to the
point where nitrogen limitation occurs.
Suitable nutrient conditions in the
Hartbeespoort Dam enable Microcystis to
form large buoyant colonies. Extremely
high standing crops enable Microcystis to
dominate by up to 90-99% of the
biovolume in the late summer (Robarts
and Zohary 1984). High species diversity
only occurs when green algae and
flagellates become more abundant in the
spring (August – October) (see also the
findings of Harding (1996) from the
hypertrophic Zeekoevlei – Western Cape).
The buoyancy mechanism of Microcystis
allows it to monopolise the upper euphotic
zone, effectively reducing the light
available to other species. This process is
compounded by stable stratification, calm
wind conditions and a reduction in the
mixing depth. Dense hyperscums build up
in sheltered sites (Zohary 1985 – see
elsewhere in this review). Anaerobic
conditions, decomposition and photo-
oxidation within these hyperscums result
in the production and release of foul-
smelling gases.
The standing crop of zooplankton in the
lake is low when compared to the standing
crop of phytoplankton (Jarvis 1986). High
maximum integrated grazing rates (260%
d-1) have been recorded during the spring-
early and early summer when species
diversity is high and Microcytis abundance
is low. When Microcystis is abundant,
grazing rates are lowest. Jarvis (1986)
suggested clogging of the filter feeding
mechanism as a reason for this. Schindler
(1971) and Hanazato & Yasuno (1987)
have shown that the assimilation
efficiency of zooplanton fed on
Microcystis is low. The reduced growth
potential of Oreochromis mossambicus
(the blue kurper) has also been attributed
to the poor nutritive quality of Microcystis
(see elsewhere in this review).
The underutilisation of Microcystis by the
zooplankton shifts the trophic pathway to
a detrital-based trophic structure. The
sedimentation and decomposition of
phytoplankton is at its highest following
the break-up of the hyperscums (NIWR
1985) accompanied by an increase in
heterotrophic activity per bacterial cell and
increase in bacterial numbers (Robarts &
Zohary 1986).
(see Supporting Literature)
Diurnal mixed layers and Microcystis
(Zohary and Robarts, 1989).
Microcystis aeruginosa remains dominant
in shallow South African waterbodies for
extended annual periods. In this
90
investigation, Tamar Zohary and Richard
Robarts set out to show that M. aeruginosa
remained dominant because of its ability
to maintain itself within the light-rich
shallow diurnally mixed layers of
Hartbeespoort Dam. Their work showed
that the formation of shallow layers mixed
on a daily frequency were indeed
important, while in deeper warm water
lakes, stability of the water column was a
greater determinant in the dominance of
the algal assemblage by Microcystis. In
work reported on elsewhere in this review,
Harding (1997b) showed that high
frequencies of mixing supported very high
levels of Microcystis productivity and
dominance.
91
6.6 Studies on cyanobacterial
behaviour and associations in the
Vaal River
An investigation into the phytoplankton
blooms in the Vaal River and the
environmental variables responsible for
their development (Pieterse, 1986, 1987;
Pieterse and Janse van Vuuren, 1997)
During the late 1980s Braam Pieterse
reported on changes in phytoplankton
diversity in the Vaal River near
Balkfontein. The initial work examined
which indicators of diversity were most
appropriate to the environment being
examined, and reported that the Hurlbert,
Shannon-Wiener or Simpson’s measures
were best suited to describing
phytoplankton community structure in the
river.
A subsequent series of investigations were
reported as a compilation of work in a
report to the Water Research Commission
(Pieterse and Van Vuuren, 1997). This
work is summarised below:
In response to development of
phytoplankton blooms along certain
sections of the Vaal River, resulting in
aesthetic problems, health hazards and
interfering with water treatment and
distribution systems, Braam Pieterse and
Sanet Janse van Vuuren undertook an
investigation of the causes and
consequences. Their work included the
effect of water transfer and stream
regulation on the algological and
environmental variables in the river. They
considered the project unique in the South
African context and to be of both local and
international scientific significance. The
work may be divided into several sub-
components that are summarised as
follows:
Phytoplanton production and
photosynthetic characteristics in relation
to environmental variables in the Vaal
river at Balkfontein (Pieterse and Janse
van Vuuren, 1997, Chapter 2).
In this component of the study, the
environmental variables that influenced
the production of phytoplankton in the
middle reaches of the Vaal River (at
Balkfontein) during 1993 were
investigated. It was found that discharge
was the most important variable
influencing transparency of the Vaal River
–increased discharge being associated with
episodic inputs from summer rain. A
higher discharge resulted in higher
concentrations of total suspended solids
(TSS) and, hence, turbidity, and, thus, a
reduced Zeu depth that impacted negatively
on algal growth. High discharges were
also related to higher nutrient and
chlorophyll-a concentrations, but
phytoplankton could not attain maximum
92
productivity because of the elevated
turbidity prevailing during floods. Only
after a lapse of several weeks after high
discharge, was the phytoplankton able to
bloom as the turbidities decreased.
During the winter-spring period (June to
September), a high TDS value, low
discharge and a possible increase in water
hyacinth infestation over the study period
was associated with low turbidity and
favourable light conditions for
photosynthesis and algal biomass build up.
However, increased water clarity was
associated with lower nutrient
concentrations (N, P and Si), thus limiting
production even when the light
environment was favourable. It was
suggested that the role that water hyacinth
plays in reducing nutrient concentrations
(especially DIN) and its ability to limit
phytoplankton production in the Vaal
River should be investigated further.
Reduced Ik (irradiance at the onset of light
saturation) and PBm (photosynthetic
capacity – ratio of carbon fixed at light
saturation to chl-a concentration) values
were associated with a reduced euphotic
zone in the Vaal River, but increased dPd
(daily rates of areal photosynthesis) and
Pm (photosynthesis in depth profile) values
were ascribed to an increase in
chlorophyll-a levels. The photosynthetic
efficiency (PSE) increased with decreased
concentrations of algal pigment.
Interestingly, the Vaal River at
Balkfontein is reported as switching from
a phosphorus-limited system (1986-1990)
to a nitrogen-limited system (1991-1993),
as suggested by reduced annual DIN:DIP
ratios. Roos et al. suggested that reduced
silica availability (1990-1993) was
responsible for reduced peak levels of
chlorophyll-a during the winter-spring
period.
Environmental variables, abundance and
seasonal succession of phytoplankton
populations (Pieterse and Janse van
Vuuren, 1997, Chapter 3)
This component of the study aimed to
describe the types of algae present,
seasonal occurrence patterns and
environmental effects controlling growth
and succession at four sites including the
Rand Water Barrage, Parys Municipality,
Western Transvaal Regional Water
Company and Goldfield Water at
Balkfontein. The findings, largely
consistent with extant understanding of
algal behaviour from the lentic
environments, may be summarised as
follows:
• Discharge was found to be the most
important variable affecting
phytoplankton blooms in the Vaal
River. Increased discharge increased
turbidity, and reduced light
93
penetration. Flooding also had the
capacity to wash phytoplankton
blooms out of the system, whereas
reduced discharges led to the settling
out of sediment and an associated
decrease in inorganic turbidity.
• Increased discharge diluted the
concentrations of dissolved solids
(TDS) resulting in lower
concentrations of major ion and hence
electrical conductivity. Decreases in
electrical conductivity results in
reduced flocculation of clay particles
and increasing turbidity, reducing the
quality of the underwater light climate
and resulting in conditions that are
unfavourable for algal growth.
• Increased discharge resulted in higher
particulate-borne nutrient availability
(nitrogen and phosphorus). The
disposal of industrial, mining and
domestic wastes at the level of the
watershed was found to increase
dissolved phosphorous and nitrogen
concentrations leading to
eutrophication of the river.
• Water temperature determined
dominance by specific algal species.
Summer periods promoted
cyanobacterial growth (e.g. the
filamentous Oscillatoria
simplicissima) and the filamentous
centric diatom Aulacoseira (formerly
Melosira) granulata. Winter blooms
were dominated by a succession of
unicellular centric diatoms and green
algae (e.g. Chlamydomonas incerta).
• Temperature and diatom concentration
had an impact on silicon and oxygen
concentrations – in the form of
increased water temperatures,
decreased oxygen solubility and
decreased silicon concentrations.
Diatom concentration increased with
high Si:DIP ratios – diatom numbers
led to decreases in Si concentrations.
• High temperatures and nutrient values
and low DIN:DIP and TN:TP ratios
(less than 5) and low Si:DIP ratios
were found to promote cyanobacterial
growth.
• pH increased with increasing chl-a
concentrations and higher algal
biomass – a consequence of elevated
photosynthetic activity. Similarly,
increased oxygen concentrations
(usually low because of higher
temperatures) were associated with
increasing algal biomass (chlorophyll-
a concentrations).
• Approximately 124 algal species from
seven major groups were identified
during the study. Some groups were
more prevalent at certain localities
than others. The highest diversity of
94
Cyanophyceae was found at the
Barrage, Euglenophyceae at
Balkfontein, and with biomass
increasing downstream from the
Barrage to Balkfontein.
The scarcity of Chrysophyceae and
Cryptophyceae and abundance of
Cyanophycaea demonstrated that the Vaal
River is a polluted and eutrophic system.
Maximum chlorophyll-a concentrations
occurred from January to March (summer)
and July to November (winter-spring).
Highest levels of algal pigments were
found at Parys due to high N and P
concentrations at this site.
The effect of increased concentrations of
total dissolved salts on algal species from
the Vaal River (Pieterse and Janse van
Vuuren, 1997, Chapter 4).
Irrigation return flows below the Barrage
are known to have a major impact on
salinity levels below the barrage.
Atmospheric pollution with a dominant
sulphate constituent also contributes to
TDS concentrations. Higher TDS levels
result in lower turbidities, increased light
penetration and elevated primary
productivity. Prinsloo reported that little
is known of the relationship between
salinity and algal communities in running
water. The change in salinity levels was
monitored at two study sites on the Vaal
River (Stilfontein and Balkfontein)
between 1984 and 1993. Average TDS
values were determined using an historical
overview and used to do growth and
carbon assimilation experiments.
An increase in salinity levels of 29
mg.ℓ-1.a-1 was observed between 1984-
1993 at Balkfontein. Mean annual TDS
concentration was 516 mg.ℓ-1. Stilfontein
TDS concentrations were observed to
increase by 21 mg.ℓ-1.a-1 and mean annual
concentrations were lower, 504 mg.ℓ-1.
Highest salinities occurred during the
winter-spring period. Lowest salinities
were recorded during floods as a
consequence of dilution.
Nutrient availability: phosphatase and
nitrate reductase activity in the Vaal River
and its phytoplankton (Pieterse and Janse
van Vuuren, 1997, Chapter 5).
The aim of this study was to determine the
availability of inorganic nitrogen and
phosphorus to algae using estimates of
enzyme activities. The role of nitrate
reductase (NR) and alkaline phosphatase
in phytoplankton was examined in
samples collected from the Vaal River at
Balkfontein. Since NR plays a role in
reducing NO3- to NH4
+ before nitrogen can
be incorporated in the cells, NR activity
has been used to predict (Hochman et al.
1986) the use of nitrate in cells rather than
95
NH4+ (which is the preferred form).
Inorganic orthophosphate (PO4-P) is the
main source of P for phytoplankton. Acid
and alkaline orthophosphatase is used by
phytoplankton to liberate orthophosphate
for metabolism in cells from
organophosphate esters (Wynne, 1981).
The presence of alkaline phosphatase in
lake water appears to reflect the degree of
eutrophication (Jones 1972) because it
corresponds to maximum rates of cell
division (Pollinger & Serruya 1976).
Axenic cultures of natural phytoplankton
samples from the Vaal River were
examined. Ambient concentrations of
nitrogen and phosphorous (as DIN, TN
and DIP and TP) were measured once a
month as part of a long-term management
programme.
Nitrate reductase (NR) activity
Coetzee and Pieterse used both
centrifugation and filtration techniques to
harvest cells and collect the NR enzyme.
They found that the filtration method
produced higher NR activity values than
centrifugation, but that the two methods
produced the same general trend.
NR activity was found to be inversely
proportional to chlorophyll-a
concentrations. Peaks in September 1993
(chl-a 79 μg.ℓ-l), November 1993 (chl-a
50.7 μg.ℓ-l) and March 1994 (chl-a
116 μg.ℓ-l) corresponded to low NR
activities on these same dates.
No correlation could be demonstrated
between NR activity and NO3-N or TN
concentration (similar to findings of
Wynne and Berman, 1990). Coetzee and
Pieterse concluded that the control of NR
activity is not directly dependent on NO3-
/NH4+ concentrations, but may be
dependent on several environmental
factors. A positive correlation was found
between NR activity, DIP (PO4-P) and TP
concentrations. The conclusion drawn
was that high P levels activate NR.
Phosphatase (PASE) activity
Four phosphatase enzyme activities
were studied: alkaline soluble and
particulate phosphatase and acid
soluble and particulate phosphatase.
All four were found to show the same
trend. PASE activity appeared to be
indirectly proportional to chl-a
concentrations. Hence, both NR and
PASE appear to be indirectly proportional
to chlorophyll-a concentrations,
suggesting both enzymes respond to
similar conditions. PASE corresponds
positively to NR activity. Phosphatase
activity also corresponded positively to
DIP (PO4-P) and TP concentrations. No
correlations were found between N:P
ratios and phosphatase activity.
96
(see Supporting Literature)
Phytoplankton biomass and environmental
variables in the Vaal River at Barrage and
Stilfontein (Pieterse and Janse van
Vuuren, 1997, Chapter 6).
The study aimed to investigate the
relationship between physical and
chemical environmental variables and
phytoplankton in the Vaal River. Using
statistical correlations, Pieterse and co-
workers compared water variables
upstream of the Rand Water Barrage
sluice gates with the 7 m deep water
released in to the Vaal River, the water at
Lindeques Drift 9 km downstream from
the barrage, and the water 140 km
downstream at Stilfontein.
At the Barrage and Lindeques Drift, NO3,
TDS, chlorophyll, pH, conductivity,
alkalinity and ionic species were
negatively correlated with turbidity and
orthophosphate. The water was turbid,
and orthophosphate concentrations were
found to be high when the concentration
of dissolved ions, chlorophyll, pH and
alkalinity were low.
Temperature, suspended solids, turbidity
and phosphorous were related to ionic
species (Na, Cl, SO4, etc.) and associated
properties of conductivity, TDS and
alkalinity. Erosion due to the summer
rains resulted in higher siltation loads,
with the converse being true during
winter. Longer water retention times in
winter led to high concentrations of
dissolved salts.
The chlorophyll concentration was
greatest in winter when the water was
clear and cold, and highest pH levels, a
direct consequence of algal
photosynthesis, were recorded during this
period. Algal growth was lowest in
summer when the water was turbid and
warm.
Depth related processes over a depth of
7 m were found to have a more significant
effect on variables than longitudinal
processes over a distance of 9 km.
Strong correlations between suspended
solids and turbidity and correlations
between conductivity, TDS and alkalinity
suggested that only one of each group
would be necessary for modelling
purposes (see below).
Modelling algal growth in the Vaal River
(Pieterse and Janse van Vuuren, 1997,
Chapter 7).
Cloot et al. described the foundation for a
mathematical model to describe the
development of algal blooms. Cloot’s
model for algal growth was based on the
assumptions that the water is eutrophic
97
and that the growth and death of algae are
primarily dependent on available light and
temperature. The parameters of the
equations include environmental variables
(maximal irradiance, temperature,
concentration of suspended inorganic
material, etc.) and on variables specific to
a particular algal group (optimal light
intensity temperature etc. for growth, algal
settling rate etc.).
Weekly-averaged temperature and total
suspended solids concentration were used
as the inputs to the model. The agreement
between calculated chlorophyll-a
concentrations and measured (observed)
values over a three-year period (1985 –
1987) were fairly good, but some
discrepancies remained. An additional
factor – the effects of dissolved silicon
concentration on the growth coefficient –
was included in order to improve the
quality of the simulation. The modelling
was based on the dissolved silicon
concentration as a mechanical and
chemical process, the uptake of silicon by
diatoms, the effect this (uptake) has on
silicon concentration in the water, and on
the growth coefficients of diatoms.
Applications of the model include: the
splitting of global data between smaller
groups responsible for blooms, identifying
important environmental variables for
specific algae in a bloom, describing
mechanisms when numerical data are not
available, a means of testing hypotheses
and as a planning tool in water resource
management.
98
6.7 Management of blooms
The feasibility of managing the nitrogen to
phosphorous ratio in the Hartbeespoort
Dam as a means of controlling
Microcystis scums (Conradie and Quibell,
1992).
Conradie and Quibell (1992) investigated
the possibility of managing Microcystis
populations by increasing the total
nitrogen: total phosphorous (TN:TP) ratio.
Factor influencing dominance of
Microcystis
Rhee and Gotham (1980) describe a model
of algal competition for nitrogen- and
phosphorus- limited growth where two
algal species are growth-limited for
different TN:TP ratios. They suggested
that Microcystis becomes nitrogen-limited
at a TN:TP ratio of 9. At ratios less than
this, Microcystis would be expected to
dominate the algal community. This
explanation was the basis of Chutter and
Rossouw’s (1992) paper suggesting that
the shift in dominance away from
Microcystis in the Hartbeespoort dam
during 1988/89 was because of an increase
in the TN:TP ratio.
However, studies by Bierman et al. (1974)
contradict the above hypothesis. In
studies of competition between
Microcystis and Chlorella, Bierman et al.
(1974) noted that the phosphorous
transport system of Microcystis was more
efficient than that for Chlorella, but that
the growth rate of Chlorella was faster.
Thus at a TN:TP ratio of 6, Microcystis
may not dominate, but will always
dominate at a TN:TP ratio of 30.
Dominance by Microcystis was related to
the availability of phosphorus – at
increased phosphorus concentrations,
Chlorella was able to utilise its faster
growth rate and outcompete Microcystis.
This contradicts the view that Microcystis
is able to dominate at lower TN:TP ratios.
Conradie and Quibell argued that this view
is too simplistic and that it was rather the
low concentrations of ortho-phosphate
triggered the shift away from a
Microcystis dominated community in the
Hartbeespoort Dam. This latter view is
deemed to be the most relevant in the
argument surrounding N:P ratios and algal
dominance. As has been so clearly
pointed out by Reynolds (1992), elemental
ratios are only of significance when the
availability of one or both thereof is
limiting, or potentially so.
De Noyelles and O’Brien (1978) stated
that when carbon concentrations are low
and pH is high, blue-green algae might
predominate since they may be better
assimilators of carbon (see also Shapiro
1990). Novak and Brune (1985) also
argued that the half saturation constants
(K) and maximum rate of uptake (Vm) for
99
carbon is species-specific and varies with
temperature and light. This could provide
an alternative explanation for the shift in
algal community composition in the
Hartbeespoort Dam. They cited numerous
other factors other than TN:TP ratios cited
by Chutter and Rossouw (1992) that may
have precipitated this shift.
(See Suggested Reading) Algal regrowth in the holding dam at the
Withoogte water treatment works (Quibell
and du Plessis, 1991)
Taste and odour problems were associated
with algal regrowth in the holding dam at
Withoogte treatment works that forms part
of the Berg River-Saldanha Government
Water Scheme in the Western Cape. The
study was initiated to assess the extent of
the problem and the effect on the DOC
content (dissolved organic carbon). Water
is abstracted at a depth of 4 m from the
Misverstand weir and pumped via a
12.5 km pipeline to the Withoogte holding
dam where it is fed into the treatment
works.
The algal population was found to consist
of the blue-green algae Anabaena sp., the
diatom Melosira sp. and the dinoflagellate
Peridinium sp. These organisms, when
they occur in sufficient quantity in
eutrophic waters fix large amounts of
carbon. The death, decay of these cells
combined with bacterial activity produce
micro-pollutants that produce taste and
odour in the chlorinated water. Anabaena
produces a characteristic ‘mouldy’ or
‘muddy’ taste (geosmin and/or 2-methyl
isoborneol) even when present in low
concentrations. Anabaena occasionally
forms a significant proportion of the
community in the Misverstand weir and
taste and odour problems were noted in
the potable water. This appeared to be the
most likely source of the taste and odour
problems. Other likely sources of taste
and odour suggested by Quibell and du
Plessis (1991) included bacterial activity
in the holding dam and treatment works.
They suggested the use of activated carbon
to combat the problem (see also work by
Harding relating to taste and odour
problems in the Theewaterskloof and
Voelvlei impoundments.
Health aspects of eutrophication (Scott et
al. 1985)
The paper highlights the role of phosphate
as a key nutrient in eutrophication and its
contribution towards health problems
associated with water supplies,
particularly the development of
cyanobacterial blooms. A brief history of
outbreaks (in Queensland Australia), the
kinds of toxins (structure) and their effects
is given. Also, possible links between
Legionnaires disease, Haff’s disease and
100
the occurrence of cyanobacteria and their
extracellular products is discussed.
The possible contribution of the
extracellular products of M. aeruginosa to
the formation of organohalogens
(potentially carcinogenic and/or
mutagenic) after chlorination is not
known.
Total organohalogen formation potential
(TOHp) was estimated after chlorination
of three unialgal NWIR laboratory
cultures of M. aeruginosa, strain WR 133.
Preliminary results showed that TOHp
increased with time in cultures augmented
with phosphorus. The third culture died
on the 8th day, and TOHp value has
increased to 6 700 μg.CHCl3.ℓ-1 at the
time. After 14 days, all three cultures
indicated TOHp concentrations in excess
of 1 000 μg CHCl3.ℓ-1.
Scott et al. summarise organohalogen
concentrations from several studies that
indicate that cyanobacterial cultures show
much higher TOHp values than green
algae.
Scott and co-workers point out the
possible beneficial effects of algae and
point out the use of floating mats of
Spirulina sp., Phormidium tenue,
Chroococcus turgidus and Nostoc
commune for food in Mexico (Ortega
1972). They also point out that some
species (Hydrodictyon reticulatum and
Aphanothece nidulans, Graf and Baier
1981) had antibacterial effects on a range
of pathogenic organisms.
(see Supporting Literature)
The management of phosphate
concentrations and algae in
Hartebeespoort Dam (Chutter and
Rossow, 1992).
This report aimed, firstly, to investigate
the impact of the so-called 1 mg.ℓ-1 special
orthophosphate standard for effluents on
the phosphorous load in the Hartbeespoort
Dam, and, secondly, to investigate the
cause of the disappearance of a bloom of
Microcystis during the summers of
1988/89 and 1989/90. The dam had been
full during April and May of 1988 and
deliberate flushing of the Microcystis
scums at the sluice gates contributed to the
major disappearance of Microcystis during
this time. However, the reason for the
failure of Microcystis to reappear
thereafter was the main reason for the
study.
Temperature and stability of the water
column were not outside the normal range
observed over the previous two summers,
precluding instability of the water column
as a possible factor.
101
The external load of total phosphate per
unit area declined in 1989 and 1990
relative to previous levels, with the flow-
weighted mean and annual concentration
of total phosphorus in the Crocodile river
having declined. The reduction in mean
total phosphate concentration in the dam
was deemed to be due to the reduced
incoming load and a greater proportion of
this load having sedimented from the
water column. The external load and the
flow-weighted mean annual concentration
of total nitrogen also declined, but not has
much as the total phosphorous load and
concentration. These changes resulted in
an increase in the TN:TP ratio and it was
suggested that the disappearance of
Microcystis was a consequence of this.
Recommendations were made that the 1
mg.ℓ-1 effluent phosphate standard be
strictly enforced, nutrient ratios and
composition of the phytoplankton
community in the dam should be regularly
monitored, and that nitrogen standards for
nitrogen effluents could be relaxed in
order to increase the TN:TP ratio.
Assessment of the phosphate standard
(DWAF, 1998)
The 1 mg.ℓ-1 standard for phosphate was
promulgated in August 1980 as the first
step in a national eutrophication control
programme. Initially, the standard was
introduced in seven sensitive catchments
(the so-called Special Standard Rivers),
and local authorities were given five years
to achieve compliance. During 1997/8,
compliance with the 1 mg.ℓ-1 phosphate
standard was assessed at the
Baviaanspoort and Zeekoegat wastewater
treatment plants (Gauteng, Roodeplaat
Dam). Both treatment works were found
to not comply, with the standard being
exceeded in greater than 50% of samples
analysed. The investigation concluded
that, while the standard would no doubt
result in an improvement in trophic
condition of the receiving waters in the
long term, internal loading from within the
impoundment would prolong the recovery
process. It was also concluded that a more
stringent standard, viz. 0.5 mg.ℓ-1 was
likely to be of far greater benefit.
Health Problems of Hartbeespoort Dam
(Aucamp et al. 1987).
Aucamp and co-workers considered the
impacts of increasing anthropogenic
activity in the catchments draining to
Hartbeespoort Dam, and inter alia on the
development of toxic cyanobacterial
blooms. They observed that, given the
buoyant nature of the dominant
cyanobacterial genera, the abstraction
offtakes for raw potable water should be
located as deep beneath the epilimnetic
layers of the dam as possible.
102
Furthermore, they noted that the water
treatment processes would require
augmentation with activated carbon if the
cyanobacterial toxins were to be
successfully removed.
Use of dissolved air floatation to remove
cyanobacteria (De Wet, 1980;
Langenegger, 1985).
Th work by De Wet reports on some of the
early investigations of dissolved air
floatation as a means of removing algae
from raw potable water. Using results
obtained from an 800 ℓ h-1 pilot plant, De
Wet concluded that there was no
significant difference between floatation
and sedimentation, other than that
floatation appeared to be a more
economical alternative. In subsequent
work, Otto Langenegger showed that some
of the problems encountered when treating
eutrophic waters could be overcome using
DAF technology.
(see also Williams et al. 1985)
Algal penetration of water treatment
plants (Pieterse et al. 19--).
Penetration of algal cells through all of the
stages of the potable treatment process can
and does occur. In an examination of this
phenomenon in South African waters,
Pieterse and co-workers investigated algal
penetration of the Goldfields treatment
works at Balkfontein on the Vaal River.
They found that the various secondary and
tertiary treatment processes, viz. pre-
chlorination, flocculation/sedimentation,
sand filtration and post-chlorination
reduced algal biomass and species
richness, but did not always preclude
passage of certain algal cells through the
complete system. They found the
following algae to commonly penetrate the
purification process: Synechococcus
cedrorum, Chlamydomonas incerta,
Oocystis lacustris, Scenedesmus opoliensis
and pennate diatoms. This work showed
that even large, ornamented algal cells
such as S. opoliensis pass through a
apparently intact treatment system.
Tastes and odours (Wnorowski, 1993)
Although not health-threatening, the
odours (geosmin and 2-methyl isoborneol)
produced by certain species present a
major problem to managers of many
potable water treatment plants. In most
cases addressing the problem entails the
retro-fitting of activated carbon treatment,
either in granular (GAC) or powdered
(PAC).
Wnorowsji examined water from 54 dams,
and found taste and odour problems to be
present in 30% thereof. All of the lakes
103
experiencing odours were dominated by
cyanobacteria, and with Microcystis as the
dominant genus. Geosmin was
exclusively found to be the odourous
compound. The result is interesting as
geosmin production is commonly
associated with species of Anabaena, and
not Microcystis (see also similar findings
in work by Umgeni Water described later
in this review).
104
6.8 Researched incidents of
toxicosis in South Africa
Mortality of a white rhinoceros
(Ceratotherium simum) suspected to be
associated with the blue-green alga
Microcystis aeruginosa (Soll and Williams
1985)
Soll and Williams (1985) reported the
deaths of several black wildebeest
(Connochaetes gnou) in the Willem
Pretorius Game Reserve (Free State).
These mortalities were suspected to have
been caused by a toxic bloom of
Microcystis (P le Roux, 1984, Division of
Nature Conservation, Orange Free State,
personal communication, cited in Soll and
Williams 1985).
This account relates the death of a white
rhinoceros (Ceratotherium simum) at
Barakologadi Game Reserve in the Odi
district of Bophuthatswana. The reserve,
on the banks of the Klipvoor Dam, was
approximately 9 000 ha in extent. Four
animals had been introduced from the
Umfolozi Game Reserve in Natal. Having
paired off, the older pair remained closer
to the dam than the younger pair. The
younger animals were found dead and in
an advanced state of decomposition in
mid-July 1979 and a post-mortem could
not be carried out. The condition of the
older animals appeared to be poor. The
female was subsequently found dead in
sternal recumbancy during late July of the
same year. Upon inspection, the animal
showed signs of excessive lacrimation and
dried soft faeces. The male appeared to be
healthy but showed signs of mild
diarrhoea. A necropsy was conducted on
the female, and revealed the following:
Macroscopical pathology
Severe hepatomegaly. The liver was
found swollen with rounded edges and
deep purple colouration. The surface
bulged when cut, red fluid seeped from
incision, the parenchyma was soft and
friable and evidenced advanced autolytic
changes (even though no other organs
showed signs of autolysis).
Petechiae and ecchymoses were apparent
in the subcutaneous tissue and serosa of
thorax, abdomen and diaphragm. Severe
subendocardial and subepicardial
haemorrhages were noted. Severe focal
disseminate subcapsular haemorrhage was
apparent in the spleen, and the blood
vessels supplying intestines were
congested. 5 ℓ of serous fluid was
discovered in the abdominal cavity, along
with serous atrophy of fat in the
mesentrium and pelvic area. Localized
congestion was also present in the lungs of
the animal.
105
Microscopical pathology
90 100% of the hepatocytes in the liver
had undergone lytic necrosis. The
connective tissue supporting the liver cell
plates was distorted or absent, and, hence,
confluent sinusoids with erythrocytes
admixed with cytoplasmic debris from
lysed hepatocytes. The portal triads
showed no lesions similar to those
typically reported for mice, cattle and
sheep in cases of Microcystis poisoning.
The spleen showed severe subcapsular
haemorrhage with atrophy of white pulp.
Lung congestion was considered as being
probably due to hypostasis.
Algal identification
A porridge-like green scum between 4 and
12 cm thick, and formed by blue-green
alga was reported as covering the surface
of the Klipvoor Dam. The Department of
Botany at the University of Pretoria
identified the bloom as comprising an
almost pure culture of M. aeruginosa. A
large amount of fertilizer had previously
been added to the dam as part of a fish-
breeding scheme, leading to the
development of the eutrophic conditions.
In their analysis, Soll and Williams
suggested a wide interspecies variation in
susceptibility to Microcystis toxins since,
despite the presence of many other species
in the reserve (giraffe, zebra, wildebeest,
impala, kudu, jackal and warthog), no
mortalities other than that of the
rhinoceros had been reported. This did
not, however, exclude deaths where the
carcass had not been detected, or where
decomposition was too advanced for
necropsy.
Soll and Williams cite Jackson et al.
(1984) as reporting that up to 90% of the
lethal dose from a bloom could be
ingested without measurable effect. They
suggest that, because rhinoceros would
drink a larger volume of water in the
reserve than other animals, it would ingest
more toxic algae. They also suggest that
variations in the toxicity of Microcystis
(due to environmental factors such as light
intensity, temperature, age of the cells and
pH) might explain the poisoning of the
rhinoceros, since they happened to drink
the water when the bloom was most toxic.
Giraffe deaths associated with Microcystis
in the Bloemhof Dam (Theron, 1990a)
During July 1989, Mr J. van Zyl of the
Sandveld Nature Reserve in the Orange
Free State reported the deaths of two
giraffe in January, and a further five
during March of that year. State
veterinarians could not ascertain the cause
of death, and the then Hydrological
Research Institute (HRI - now IWQS)
were asked to investigate.
106
Samples from the surface of the water of
the Bloemhof Dam confirmed that
between 10-60% of the algae in the dam
were Microcystis, and that between
10-15% of these colonies were toxic.
With hindsight, these characteristics were
not in themselves indicative of a
significant risk. Analysis using HPLC
confirmed that there were two toxins
present. A mouse injected with 0.5 mℓ of
a low (unspecified) concentration of the
toxin did not die within 24 h. This did not
preclude the presence of a toxin since the
concentration may have been too low, i.e
less than the LD50 level.
Wind directions on the Bloemhof Dam
were monitored: the wind was found to be
predominantly south west to westerly
between March and September, i.e.,
during the months that the deaths were
reported. This would have driven any
floating material, including the algae
towards the shore of the dam bordering the
Sandveld Nature Reserve. It was noted in
the report that giraffe do not wade into the
water like other wild animals, but drank
water near the shore – where Microcystis
scums would have been concentrated by
the prevailing winds.
The giraffe that had died had evidence of
muscle relaxation of the neck and large
quantities of water in the stomach –
typical symptoms of Microcystis
poisoning. Liver samples analysed at
Onderstepoort could, however, not
confirm this. It was concluded that
Microcystis poisoning had resulted in the
deaths of these giraffe.
Toxicity associated with Microcystis in the
Klipdrif Dam (Theron, 1990b).
During 1989, the HRI was again requested
by the Klipdrif irrigation board to
investigate the possible link between
livestock deaths near the Klipdrif Dam and
the occurrence of Microcystis in the dam.
It was reported that since 1988 a periodic
unpleasant smell was encountered near the
dam together with high concentrations of a
blue-coloured algae.
Samples were taken from the surface of
the dam and taken to the HRI laboratories
for analysis. Microscopic investigation of
the samples confirmed that the algal
community comprised of up to 80%
Microcystis. Two guinea pigs injected
with 10 ml of the sample and another two
with 15 ml. All four guinea pigs died
within 24 hours. Examination of the livers
revealed that they were yellow and friable.
This confirmed that the Microcystis
isolated from the Klipdrif Dam was highly
toxic.
107
Toxic algae in the Erfenis and
Allemanskraal Dams (Van Ginkel and
Hohls, 1999)
Algae were implicated in the deaths of
livestock at the Erfenis Dam during April
and May 1998. Toxicity was associated
with the presence of Anabaena spp.
During approximately the same period
algal blooms in the Allemanskraal Dam
were alleged to be the cause of malodours.
Both dams are in the eutrophic to
hypertrophic nutrient enrichment category,
and both are deemed to have a high
potential for cyanobacterial bloom
development.
Animal death due to nodularin (Nodularia
spumigena) toxicity (Harding et al. 1995)
During 1994, a short-lived bloom of
Nodularia spumigena was recorded in
Zeekoevlei, a hypertrophic shallow lake
on the Cape Flats near Cape Town. The
bloom was atypical in that N. spumigena is
uncommon in the Western Cape, and
Zeekoevlei is typically dominated by
Microcystis aeruginosa forma aeruginosa.
The bloom was found to contain 3470 mg
nodularin g-1 of freeze-dried material, and
resulted in the death of a bull terrier bitch
that drank from the scum. This occurrence
was the first reported incident of nodularin
in South Africa, and the first documented
case of cyanobacterial-related animal
poisoning in the south-western Cape (see
also Van Halderen et al. 1995).
Previously the confirmed but unreported
presence of Anabaena solitaria produced
microcystin in Theewaterskloof Dam
during November of 1993 was the only
indication that cyanobacterial toxicity
could become a problem in the province
(Harding, 1997a).
Livestock poisonings in the western Cape
(van Halderen et al. 1995).
The mid-1990s saw the widespread
appearance of incidents of cyanobacterial
toxicosis across the western and southern
Cape, as well as the presence of
hepatotoxins associated with an increasing
number of algal blooms. These incidents
culminated in a massive loss of dairy
livestock near Kareedouw, possibly the
single largest incident of stock death since
the cases reported by Douw Steyn during
the 1940s (Harding, 1997a). Van
Halderen and co-workers researched and
documented three incidents of stock
losses, two involving Nodularia
spumigena, and the third Microcystis
aeruginosa forma aeruginosa. The
presence of microcystins at concentrations
in excess of 1000 mg toxin.g-1 f-d weight
of scum, supporting the observation that
concentrations in excess of this level pose
a very real threat of lethal toxicosis.
Together with the Zeekoevlei incident,
108
(Harding et al. 1995), these cases were
investigated by a multi-disciplinary team
of veterinarians, algologists and
pathologists.
Biomagnification of microcystins by
marine filter feeders (Harding, 1998;
1999)
While biomagnification of cyanobacterial
hepatotoxins has been reported elsewhere
(e.g. Vasconcelos, 1995), the first such
reported incident in South Africa occurred
during 1998. The collapse of Sago
pondweed in Wildevoelvlei, a small
coastal vlei near Kommetjie, was followed
by a dense bloom of Microcystis
aeruginosa forma aeruginosa. The
microcystins –YR and –LR were detected
in both the scum material, and later in the
tissue of black mussels, Choromytilus
meridionalis located in the intertidal zone
where Wildevoelvlei drains to the sea. A
ban on mussel collections threatened the
livelihood of a community dependent
thereon, and efforts were made to
eradicate the algal bloom. Based on
experiences drawn elsewhere regarding
the sensitivity of M. aeruginosa to salinity
(Harding, 1994), a decision was made to
augment the salinity level in the
Wildevoelvleis to approximately one-third
that of sea water, viz. 10 ppt. This was
carried out by “bombing” the vlei with
coarse rock salt, and introducing salt in
solution from an adjacent wastewater
treatment works. The resultant ambient
salinity of 8 ppt was sustained enough to
bring about the decline of the M.
aeruginosa bloom, and succession by
Kirchneriella sp. Complete depuration of
the mussels was observed two weeks later.
The alleviation was, however, temporary,
and efforts to reduce the level of nutrient
enrichment in the vleis, and support the re-
establishment of rooted macrophytes
(Potamogeton pectinatus) have yet to bear
fruit.
109
6.9 Removal of toxins from
water supplies
Removal of Microcytis toxins in water
purification processes (Hoffman, 1976)
Hoffman (1976) confirmed the results of
previous studies that suggested that
conventional purification plants using
coagulation, flocculation, sedimentation,
filtration or chlorination are not able to
remove algal toxins. Toxicity assays on
mice injected with toxins subjected to the
above treatments showed that the
processes had failed to remove the toxins
to below active levels. However,
treatment with powered activated carbon
was able to remove the toxin. Bioassay
tests on the toxins occurring in solution in
the waters of the Hartbeespoort Dam
(mean chlorophyll a value of 20 μg.ℓ-1 )
showed that the concentration of toxins in
the water was too low to have any lethal
effects (it was determined that 560 ℓ
would have to be consumed by a human of
70 kg in order to be lethal).
Hoffman (1976) suggests that since the
LD50 for the toxins had not been
determined at the time of writing, the
cumulative effects of ingestion could not
be predicted.
(see also Section on post-1990 era for
details of investigations undertaken by the
Cape Metropolitan Council and Umgeni
Water .)
110
6.10 Cyanobacterial Studies in
South Africa post-1990
This section reviews the activities,
developments and incidents as reported for
various regions of the country during the
1990s, i.e., during the period following the
cessation of formal cyanobacterial
investigations at national level. During
this period the emphasis on cyanobacterial
research, and the detection of
cyanobacterial toxins was centered in the
local authority and water utility arenas.
However, towards the end of the 1990s,
fresh research studies conducted at tertiary
education centres began to emerge.
111
6.10.1 Western Cape
Incidents of toxicosis
Although blooms of cyanobacteria are
common in South Africa, animal deaths
due to hepatotoxins were, prior to 1994,
largely confined to the central and
Northern Provinces. This pattern changed
during the last weeks of 1993 when the
first stock losses, attributable to
cyanobacterial toxicosis, occurred in the
south-western Cape. Previously, problems
associated with cyanobacteria had been
limited to the production of the taste and
odour compound geosmin in
Theewaterskloof Dam near Villiersdorp.
The first detection of toxins was made
from a sample of Anabaena solitaria
collected from this same reservoir during
November 1993, and analysed at the
University of Dundee, Scotland.
Subsequently, between the December
months of 1993 and 1996, 7 stock and
domestic animal deaths were recorded in
this region and along the southern Cape
coast. During the same period a single
incident of stock loss was reported from
the Northern Province. Together, these
losses were estimated to represent an
immediate financial loss of 1.1 million SA
Rands (1996 value -1 US$ = R4.50).
The first south western Cape poisonings
occurred between December 1993 and
March 1994 in the Malmesbury-Darling
area. In both cases the stock losses (3
cattle plus 5 exhibiting photosensitivity,
and 29 sheep, respectively) occurred in
camps where animal deaths with identical
clinical signs had previously been
observed. These earlier deaths, however,
had not been linked to toxins produced by
the cyanobacteria. Filaments of Nodularia
spumigena were found in the drinking
water supplies in both incidents. No
analyses for the presence of nodularin
were performed as appropriate
methodology was not available locally at
the time. These two incidents have been
described in detail elsewhere (Van
Halderen et al. 1995).
During March 1994, a bloom of Nodularia
spumigena in Zeekoevlei, a shallow lake
near Cape Town, resulted in the death of a
bull terrier bitch. HPLC analysis of algal
material collected from where the dog
drank contained a nodularin concentration
of 3479 Fg.g-1 of freeze-dried (f-d)
material. This incident, described fully
elsewhere (Harding et al. 1995), was
interesting in that this was a short-lived
appearance of Nodularia in a lake which
has been dominated by Microcystis
aeruginosa forma flos-aquae for the past
five decades. At the time of writing this
review, N. spumigena had not
subsequently been recorded in Zeekoevlei.
In May of 1994 a bloom of Microcystis
aeruginosa forma aeruginosa occurred in
a farm dam near the town of Paarl,
resulting in the death of 11 sheep and
112
induced-photosensitivity in a further 20
animals. The cyanobacterial hepatotoxin,
microcystin-LR, was detected in the algal
bloom at 1 340 Fg.g-1 f-d weight, and a
second, unidentified, microcystin variant
at 585 Fg.g-1 f-d weight. The case history
of this incident is detailed in Van Halderen
et al. (1995).
After an incident-free lull of two years, a
Microcystis aeruginosa forma aeruginosa
bloom in the George district was
implicated in the deaths of three calves,
and photosensitivity in a further 30.
Analysis of lyophilized material from this
bloom revealed the presence of the
microcystins-LR and -YA at a combined
concentration of 1 720 Fg.g-1 f-d weight.
The George case was followed by a
massive stock loss of 290 in-milk dairy
cows on a farm in the Kareedouw district.
A further 70 animals were diagnosed with
acute photosensitivity and had to be
slaughtered. Although the clinical signs
and symptoms were consistent with acute
hepatotoxicosis, the water supply was
flushed out soon after the incident and no
toxins could be detected at the scene of the
incident. Microscopic examination of the
rumen contents of two of the dead animals
showed the presence of filaments of
Anabaena, and remnants of a mat of
Oscillatoria filaments was found growing
on the walls of the cement-lined reservoir
from which the animals had drunk. HPLC
analysis of rumen and bile revealed a
hydrophobic, microcystin-like component
possessing a UV238 spectrum closely
typical of the microcystins. The results of
further tests on the rumen contents,
performed by Professor Geoff Codd
(University of Dundee, Scotland), using
ELISA immunoassay and protein
phosphatase inhibition, were consistent
with the presence of microcystins.
During December 1996 another incident
was reported, again from the Malmesbury
district. Here three 8-month old lambs
died after drinking water containing
Microcystis aeruginosa forma aeruginosa,
and containing the microcystins -LR, -YR
and LY at a combined total concentration
of 1 890 Fg.g-1 f-d weight. No clinical
signs or symptoms were evident prior to
the deaths. Post-mortem examinations of
the affected animals showed severe lung
congestion and oedema, widespread endo-
and epicardial haemhorrages, severe liver
damage with yellow colouration, and
moderate swelling of the kidneys. There
were also widespread haemhorrages in the
skeletal muscles. The histopathological
examination showed pannecrosis of the
liver, and acute nephrosis of the kidneys.
During the period encompassed by these
incidents, a case of a death of goats was
reported from the Northern Province.
Eighteen four-month old goats died after
drinking from a cement-lined trough near
the town of Alldays. As was presumed to
be the case at Kareedouw, the causative
organism was found to be Oscillatoria.
113
Post-mortem examination revealed
swollen and congested livers, congestion
of the kidneys with some nephrosis, and
oedema of the lungs. The results of the
histopathological examination were
consistent with the effects of acute
cyanobacterial poisoning. HPLC analysis
of a water sample from this incident
contained 71 Fg.ℓ-1 of an unidentified,
hydrophobic microcystin.
Although cyanobacterial blooms have long
been common in South Africa, the
incidents reported on here represented the
first documented emergence of related
poisonings in the southern and south-
western regions of the country. They also
heralded the appearance of Oscillatoria-
related incidents in a country where, apart
from the possible exception of the Vaal
River, Microcystis and Anabaena spp. are
the commonly expected dominants of
cyanobacterial blooms.
The incidents involving Oscillatoria were
found to differ from those typical of
Microcystis or Anabaena in that a lesser
amount of cyanobacterial biomass appears
to be involved, and that the hydrophobic
toxins produced appear to have a toxicity
greater than equivalent amounts of the
more hydrophilic, commonly-encountered
microcystins. This observation has
significant implications for the
determination of toxicity based on
equivalents of microcystin-LR.
Cyanobacterial investigations
Cape Metropolitan Council
During the period 1990–1997 a number of
investigations were conducted to
investigate the ecological associations of
cyanobacteria in shallow well-mixed and
eutrophic lakes (Harding, 1991, 1992a,b,
1994, 1996 1997a,b; Harding and Quick,
1992, Harding and Wright, 1999). These
studies revealed inter alia that
cyanobacteria, and in particular
Microcystis aeruginosa, can adapt
extremely well to very high (< 1 day)
frequencies of intense mixing; that the
combination of mixing, non-nutrient
limitation and mild climatic conditions
results in chemostat-like conditions being
generated that support high levels of
phytoplankton productivity; that the
sustained effect of these conditions results
in a plagioclimactic (near-equilibrium)
dominated by, typically, one to three
species of phytoplankton. It was also
found that, despite the overwhelming
availability of nutrients, that clear co-
dominance of chlorophyte and cyanophyte
algal genera occurred, and that impairment
of the top-down control feedback dynamic
(fish > zooplankton > phytoplankton)
could be readily and effectively controlled.
Associated studies (Harding 1992a, 1994,
1996, 1998) clearly showed that the
regulation of water levels in shallow lakes
114
constituted a serious impairment to
ecosystem functioning, but that the effect
could be markedly reduced through
restoration of a greater degree of natural
variability.
The production of geosmin by Anabaena
solitaria has posed a problem for potable
water treatment in the Western Cape for
many years. Low level aggregations of
this alga appeared rapidly in the newly
commissioned Theewaterskloof Dam, and
were numerous enough to necessitate the
implementation of powdered activated
carbon (PAC) geosmin stripping at water
treatment facilities operated by the Cape
Town City Council. Following an initial
cyanobacterial bloom of Microcystis
robusta, A. solitaria subsequently
appeared in the Voëlvlei Dam near
Villiersdorp, with similar consequences.
Cyanobacterial hepatotoxins were detected
in both impoundments during the mid-
1990s, with low levels (chlorophyll-a <15
μg.ℓ-1) generating persistent extracellular
microcystin-LR concentrations of the
order of 1–3 μg.ℓ-1. Investigations
conducted by the Department of Scientific
Services of the Cape Town City Council
revealed considerable differences in the
ability of various batches of PAC to
remove both geosmin and microcystins
(SA Pieterse, CMC, pers. comm), and
necessitated that a challenge-testing
process be added to the tender for and
procurement of PAC for use by the local
authority.
The HPLC methodology developed by
Lawton and co-workers (the “Codd
Method”) for the detection of
cyanobacterial hepatotoxins was put to use
at the Cape Town City Council’s Athlone
laboratories during 1994. This was a
dedicated automated operation that
subjected the methodology to exhaustive
testing under local conditions, and using
samples submitted from South and
southern Africa. The method proved to be
robust, sensitive and reproducible for a
wide matrix of sample types including
water (fresh and brack), muds, algal cells,
blood and body fluids including rumen
and bile.
Medical Research Council (PROMEC
Division – Tygerberg (Shephard et al.
1998).
A joint project between the Photocatalytic
Research Group at the University of
Stellenbosch, and the Programme on
Mycotoxins and Experimental
Carcinogenesis (PROMEC) of the Medical
Research Council, was launched during
July 1995. The main objective of this
collaborative effort was to investigate the
possible titanium dioxide (TiO2)
photocatalytic oxidative degradation of
cyanobacterial microcystins in water.
115
Photocatalytic oxidation using TiO2 is
extremely effective in the chemical
destruction of dissolved organic
compounds, yielding only carbon dioxide,
inorganic ions and mineral acids as the
end products. The results of this project
revealed that it is possible to remove
microcystins –YR, -LR and –RR from
water via this process. More importantly,
no secondary degradation products were
observed. This means that total chemical
destruction (mineralization) of the parent
molecules occurred. Similar results were
achieved using both distilled water and
natural lake water as spiking media for
microcystins. The current research
programme of the Photocatalytic Research
Group aims to develop and optimize
small-scale photocatalytic reactors for
water treatment.
116
6.10.2 Eastern Cape
University of Port Elizabeth
The Microbiology Section of the
Department of Biochemistry at the
University of Port Elizabeth is focusing on
cyanobacteriology, with an emphasis on
toxin-producing genera. The scope of
these research projects include the
ecophysiology of growth and toxin
production, with emphasis on carbon and
nitrogen fluxes. Methods for the mass
production of toxin for research purposes,
using mass culture and membrane
bioreactor technology are also being
investigated. The ecophysiological data
contribute to a project investigating
cyanobacterial intra- and interspecies
competition. This work is aimed at
developing predictive models for bloom
prevention and control, and includes
genetic tagging, laboratory-scale
competition and mark and recapture-type
field experimentation. Various
toxicological experiments include the role
of specific micronutrients on the effects of
chronic exposure to microcystins. Related
work encompasses the survey of water
bodies for the presence of cyanobacteria,
and the establishment of a comprehensive
culture collection.

117
6.10.3 Gauteng and Northern Province
Rand Water
Over the past few decades, Rand Water
has developed a physical, chemical and
biological monitoring programme on
source and drinking water. This
information is used to protect source
water, to proactively ensure that treatment
changes are made to accommodate
changes in water quality and to evaluate
the performance of treatment process. To a
bulk water supplier of more than 10
million people, this programme is essential
for quality assurance and control and for
an awareness of changing water quality.
A good example of the practical
application and need for the monitoring of
especially blue-green algae was during the
1998 toxic algal bloom of Microcystis
aeruginosa in the Vaal Dam, which
resulted in toxin build-up in the backwash
water of the purification plant. The
presence of these toxins dramatically
increased treatment costs as the backwash
water could not be re-used and the
chlorination dosage increased. At the
same time, recreational warnings were
constantly issued to inform the public of
possible health risks when utilizing the
Vaal Dam water at specific locations for
recreation.
In order to be pro-actively aware of
situations such as those of 1998, Rand
Water has developed in-house competency
to perform phytoplankton species
identification, enumeration and
chlorophyll-a determinations on source
and drinking water as part of the
biological monitoring programme. This
source water monitoring includes:
• Daily monitoring of all intakes to the
purification plants. When blue-green
algal or associated toxin
concentrations exceed set alert levels,
the monitoring frequency is usually
stepped-up.
• The Vaal, Sterkfontein and Katse
Dams are monitored on a monthly
schedule. The frequency of
monitoring in the Vaal Dam can be
increased when the blue-green algal or
associated toxin concentrations exceed
set alert levels.
• The Vaal River from Vaal Dam to
Barrage and Loch Vaal is monitored
weekly during summer and bi-
monthly during winter. Because of
the importance of this water for
potable water generation and
recreational utilization, the monitoring
is also stepped up when blue-green
algal or associated toxin
concentrations exceed set alert levels.
• Phytoplankton monitoring of the
Liebenbergsvlei and Ash Rivers is
performed on a bi-monthly schedule,
while phytoplankton monitoring is
performed weekly on the Klip River,
Suikerbosrant River, Natalspruit,
118
Rietspruit, Taaibosspruit and the outlet
from the Barrage.
Due to the high importance placed on
cyanobacteria and their associated toxins,
an ELISA screening test laboratory has
been established at Rand Water’s
Hydrobiology section. It performs
screening tests on localities that are prone
to high blue-green algal biomass
concentrations on a set routine schedule,
which is not totally dependent on the blue-
green biomass concentrations at the time.
Further ELISA screening tests are initiated
as stipulated in the cyanophyceae
monitoring protocol. HPLC analyses are
also performed in-house as stipulated in
the cyanophyceae monitoring protocol.
The cyanophyte monitoring protocol
developed by Rand Water is based on the
Australian model. It has recently been
updated to incorporate the current trend
described in WHO (1999), and to
incorporate current information needs of
Rand Water. This protocol has been
optimised to serve both the drinking water
production unit and the recreational use of
the Vaal River Barrage, Loch Vaal and
Vaal Dam effectively.
In collaboration with universities, Rand
Water has focused some attention on
research during this past decade. The
research includes an investigation to
determine toxin production in the blue-
green alga Oscillatoria simplicissima
under certain environmental conditions.
In future this research will be expanded to
include various other aspects for example
rapid changes in environmental
conditions. Research to determine the
appropriateness and efficacy of treatment
processes for the removal of algal toxins
and associated tastes and odours from
drinking water has also been performed,
by evaluating different carbons, ozone,
and chlorination dosages.
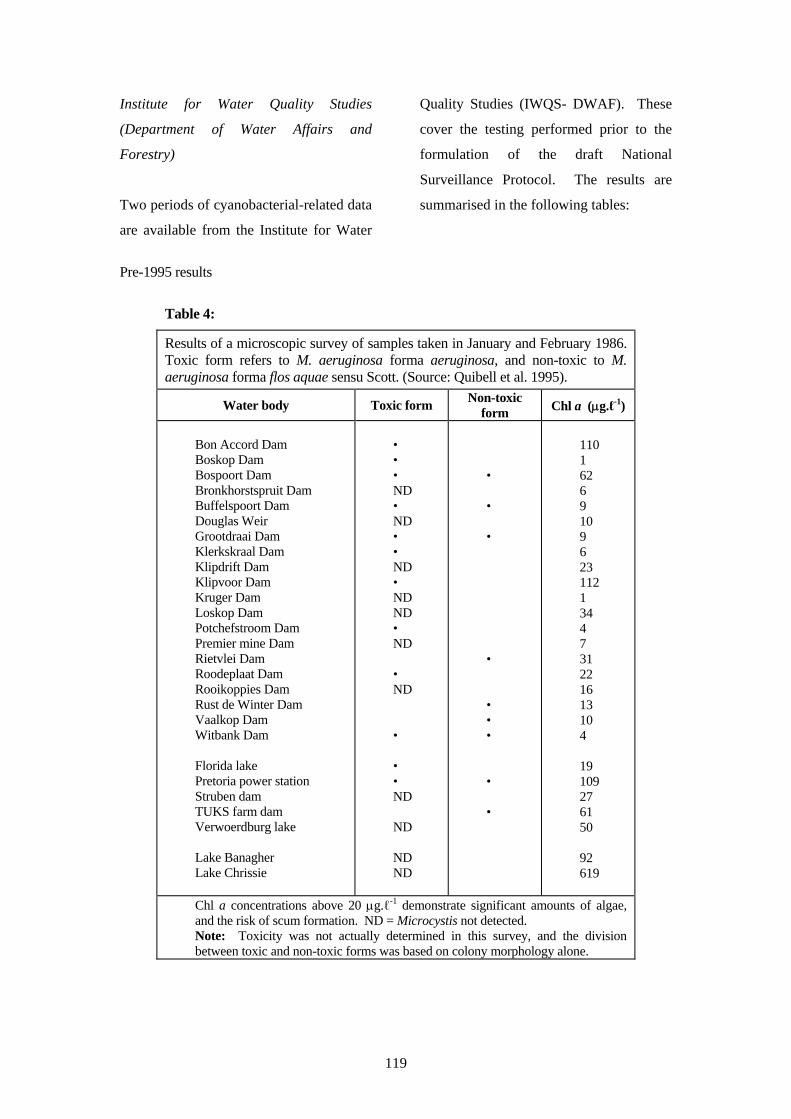
119
Institute for Water Quality Studies
(Department of Water Affairs and
Forestry)
Two periods of cyanobacterial-related data
are available from the Institute for Water
Quality Studies (IWQS- DWAF). These
cover the testing performed prior to the
formulation of the draft National
Surveillance Protocol. The results are
summarised in the following tables:
Pre-1995 results
Table 4:
Results of a microscopic survey of samples taken in January and February 1986. Toxic form refers to M. aeruginosa forma aeruginosa, and non-toxic to M. aeruginosa forma flos aquae sensu Scott. (Source: Quibell et al. 1995).
Water body Toxic form Non-toxic form Chl a (μg.ℓ-1)
Bon Accord Dam Boskop Dam Bospoort Dam Bronkhorstspruit Dam Buffelspoort Dam Douglas Weir Grootdraai Dam Klerkskraal Dam Klipdrift Dam Klipvoor Dam Kruger Dam Loskop Dam Potchefstroom Dam Premier mine Dam Rietvlei Dam Roodeplaat Dam Rooikoppies Dam Rust de Winter Dam Vaalkop Dam Witbank Dam Florida lake Pretoria power station Struben dam TUKS farm dam Verwoerdburg lake Lake Banagher Lake Chrissie
• • • ND • ND • • ND • ND ND • ND • ND • • • ND ND ND ND
• • • • • • • • •
110 1 62 6 9 10 9 6 23 112 1 34 4 7 31 22 16 13 10 4 19 109 27 61 50 92 619
Chl a concentrations above 20 μg.ℓ-1 demonstrate significant amounts of algae, and the risk of scum formation. ND = Microcystis not detected. Note: Toxicity was not actually determined in this survey, and the division between toxic and non-toxic forms was based on colony morphology alone.
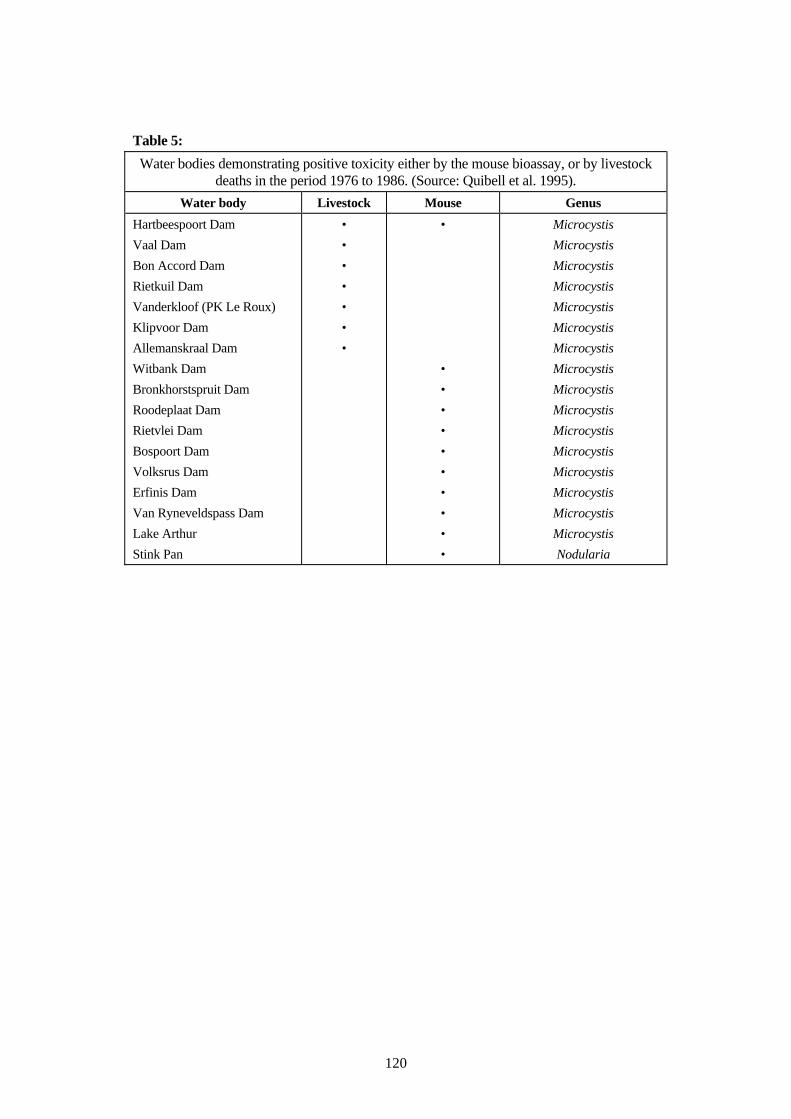
120
Table 5: Water bodies demonstrating positive toxicity either by the mouse bioassay, or by livestock
deaths in the period 1976 to 1986. (Source: Quibell et al. 1995). Water body Livestock Mouse Genus
Hartbeespoort Dam Vaal Dam Bon Accord Dam Rietkuil Dam Vanderkloof (PK Le Roux) Klipvoor Dam Allemanskraal Dam Witbank Dam Bronkhorstspruit Dam Roodeplaat Dam Rietvlei Dam Bospoort Dam Volksrus Dam Erfinis Dam Van Ryneveldspass Dam Lake Arthur Stink Pan
• • • • • • •
• • • • • • • • • • •
Microcystis Microcystis Microcystis Microcystis Microcystis Microcystis Microcystis Microcystis Microcystis Microcystis Microcystis Microcystis Microcystis Microcystis Microcystis Microcystis Nodularia
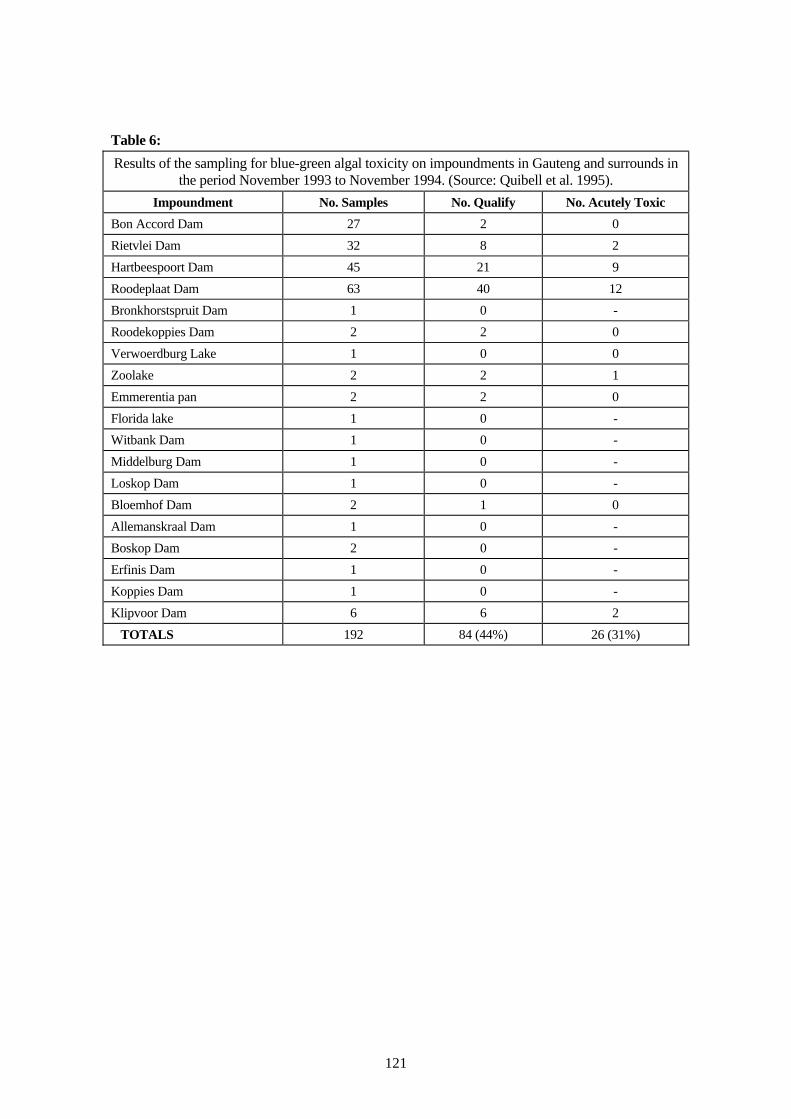
121
Table 6: Results of the sampling for blue-green algal toxicity on impoundments in Gauteng and surrounds in
the period November 1993 to November 1994. (Source: Quibell et al. 1995). Impoundment No. Samples No. Qualify No. Acutely Toxic
Bon Accord Dam 27 2 0 Rietvlei Dam 32 8 2 Hartbeespoort Dam 45 21 9 Roodeplaat Dam 63 40 12 Bronkhorstspruit Dam 1 0 - Roodekoppies Dam 2 2 0 Verwoerdburg Lake 1 0 0 Zoolake 2 2 1 Emmerentia pan 2 2 0 Florida lake 1 0 - Witbank Dam 1 0 - Middelburg Dam 1 0 - Loskop Dam 1 0 - Bloemhof Dam 2 1 0 Allemanskraal Dam 1 0 - Boskop Dam 2 0 - Erfinis Dam 1 0 - Koppies Dam 1 0 - Klipvoor Dam 6 6 2 TOTALS 192 84 (44%) 26 (31%)
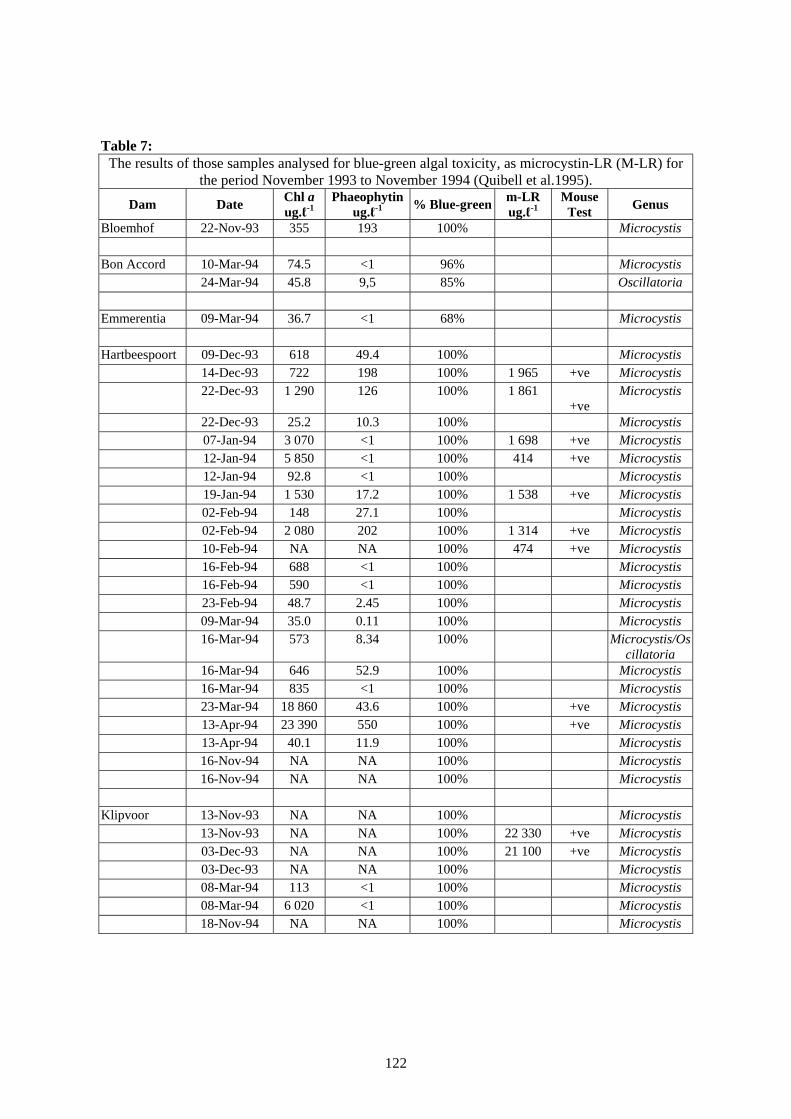
122
Table 7:
The results of those samples analysed for blue-green algal toxicity, as microcystin-LR (M-LR) for the period November 1993 to November 1994 (Quibell et al.1995).
Dam Date Chl a ug.ℓ-1
Phaeophytinug.ℓ-1 % Blue-green m-LR
ug.ℓ-1 Mouse
Test Genus
Bloemhof 22-Nov-93 355 193 100% Microcystis Bon Accord 10-Mar-94 74.5 <1 96% Microcystis 24-Mar-94 45.8 9,5 85% Oscillatoria Emmerentia 09-Mar-94 36.7 <1 68% Microcystis Hartbeespoort 09-Dec-93 618 49.4 100% Microcystis 14-Dec-93 722 198 100% 1 965 +ve Microcystis 22-Dec-93 1 290 126 100% 1 861
+ve Microcystis
22-Dec-93 25.2 10.3 100% Microcystis 07-Jan-94 3 070 <1 100% 1 698 +ve Microcystis 12-Jan-94 5 850 <1 100% 414 +ve Microcystis 12-Jan-94 92.8 <1 100% Microcystis 19-Jan-94 1 530 17.2 100% 1 538 +ve Microcystis 02-Feb-94 148 27.1 100% Microcystis 02-Feb-94 2 080 202 100% 1 314 +ve Microcystis 10-Feb-94 NA NA 100% 474 +ve Microcystis 16-Feb-94 688 <1 100% Microcystis 16-Feb-94 590 <1 100% Microcystis 23-Feb-94 48.7 2.45 100% Microcystis 09-Mar-94 35.0 0.11 100% Microcystis 16-Mar-94 573 8.34 100% Microcystis/Os
cillatoria 16-Mar-94 646 52.9 100% Microcystis 16-Mar-94 835 <1 100% Microcystis 23-Mar-94 18 860 43.6 100% +ve Microcystis 13-Apr-94 23 390 550 100% +ve Microcystis 13-Apr-94 40.1 11.9 100% Microcystis 16-Nov-94 NA NA 100% Microcystis 16-Nov-94 NA NA 100% Microcystis Klipvoor 13-Nov-93 NA NA 100% Microcystis 13-Nov-93 NA NA 100% 22 330 +ve Microcystis 03-Dec-93 NA NA 100% 21 100 +ve Microcystis 03-Dec-93 NA NA 100% Microcystis 08-Mar-94 113 <1 100% Microcystis 08-Mar-94 6 020 <1 100% Microcystis 18-Nov-94 NA NA 100% Microcystis
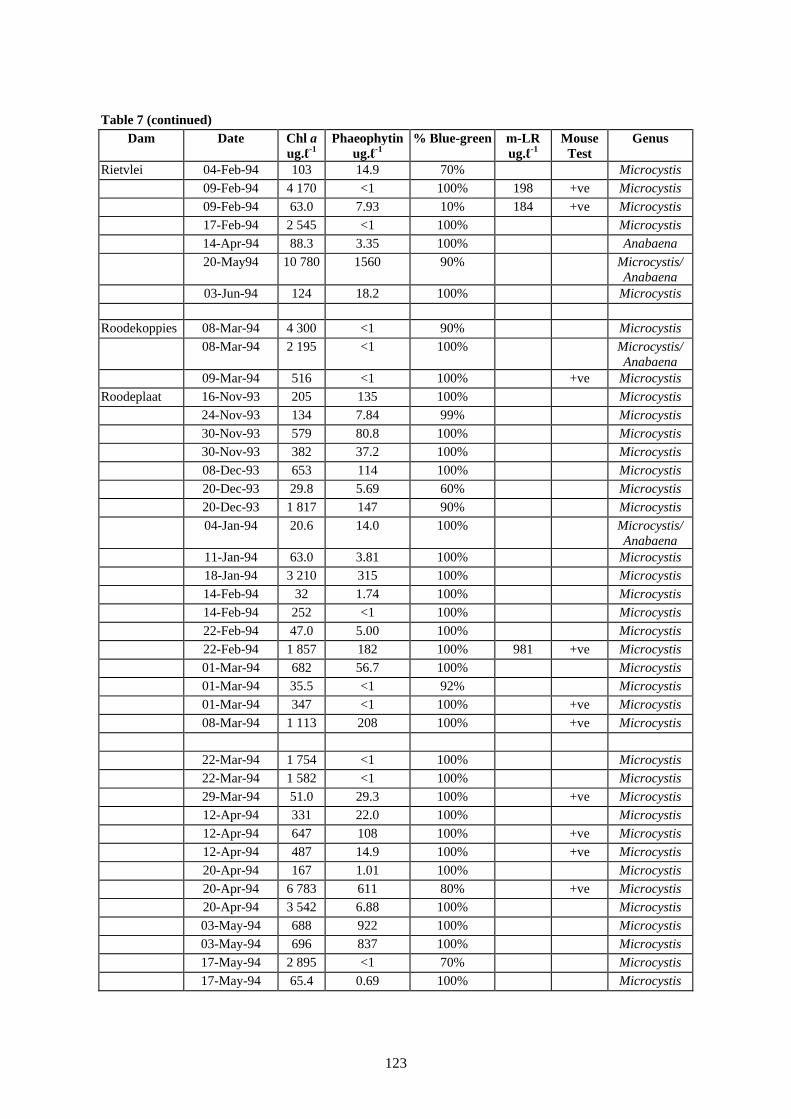
123
Table 7 (continued)
Dam Date Chl a ug.ℓ-1
Phaeophytinug.ℓ-1
% Blue-green m-LR ug.ℓ-1
Mouse Test
Genus
Rietvlei 04-Feb-94 103 14.9 70% Microcystis 09-Feb-94 4 170 <1 100% 198 +ve Microcystis 09-Feb-94 63.0 7.93 10% 184 +ve Microcystis 17-Feb-94 2 545 <1 100% Microcystis 14-Apr-94 88.3 3.35 100% Anabaena 20-May94 10 780 1560 90% Microcystis/
Anabaena 03-Jun-94 124 18.2 100% Microcystis Roodekoppies 08-Mar-94 4 300 <1 90% Microcystis 08-Mar-94 2 195 <1 100% Microcystis/
Anabaena 09-Mar-94 516 <1 100% +ve Microcystis Roodeplaat 16-Nov-93 205 135 100% Microcystis 24-Nov-93 134 7.84 99% Microcystis 30-Nov-93 579 80.8 100% Microcystis 30-Nov-93 382 37.2 100% Microcystis 08-Dec-93 653 114 100% Microcystis 20-Dec-93 29.8 5.69 60% Microcystis 20-Dec-93 1 817 147 90% Microcystis 04-Jan-94 20.6 14.0 100% Microcystis/
Anabaena 11-Jan-94 63.0 3.81 100% Microcystis 18-Jan-94 3 210 315 100% Microcystis 14-Feb-94 32 1.74 100% Microcystis 14-Feb-94 252 <1 100% Microcystis 22-Feb-94 47.0 5.00 100% Microcystis 22-Feb-94 1 857 182 100% 981 +ve Microcystis 01-Mar-94 682 56.7 100% Microcystis 01-Mar-94 35.5 <1 92% Microcystis 01-Mar-94 347 <1 100% +ve Microcystis 08-Mar-94 1 113 208 100% +ve Microcystis 22-Mar-94 1 754 <1 100% Microcystis 22-Mar-94 1 582 <1 100% Microcystis 29-Mar-94 51.0 29.3 100% +ve Microcystis 12-Apr-94 331 22.0 100% Microcystis 12-Apr-94 647 108 100% +ve Microcystis 12-Apr-94 487 14.9 100% +ve Microcystis 20-Apr-94 167 1.01 100% Microcystis 20-Apr-94 6 783 611 80% +ve Microcystis 20-Apr-94 3 542 6.88 100% Microcystis 03-May-94 688 922 100% Microcystis 03-May-94 696 837 100% Microcystis 17-May-94 2 895 <1 70% Microcystis 17-May-94 65.4 0.69 100% Microcystis

124
Table 7: (continued)
Dam Date Chl a ug.ℓ-1
Phaeophytinug.ℓ-1 % Blue-green m-LR
ug.ℓ-1 Mouse
Test Genus
Roodeplaat 17-May-94 4 092 <1 68% +ve Microcystis 24-May-94 13 700 539 98% +ve Microcystis 24-May-94 31 609 1408 100% +ve Microcystis 08-Jun-94 2 568 106 100% Microcystis 14-Jun-94 860 6.88 100% +ve Microcystis 14-Jun-94 13 184 64.2 100% +ve Microcystis 12-Jul-94 502 858 100% Microcystis
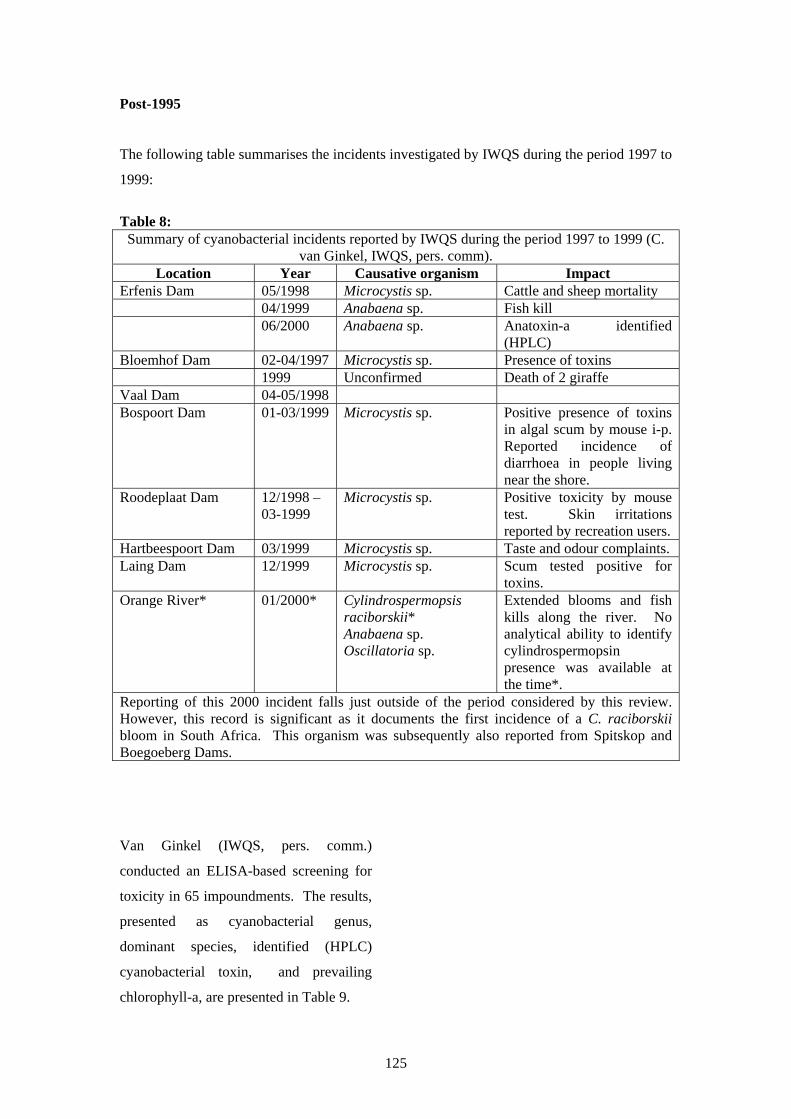
125
Post-1995
The following table summarises the incidents investigated by IWQS during the period 1997 to
1999:
Table 8:
Summary of cyanobacterial incidents reported by IWQS during the period 1997 to 1999 (C. van Ginkel, IWQS, pers. comm).
Location Year Causative organism Impact Erfenis Dam 05/1998 Microcystis sp. Cattle and sheep mortality 04/1999 Anabaena sp. Fish kill 06/2000 Anabaena sp. Anatoxin-a identified
(HPLC) Bloemhof Dam 02-04/1997 Microcystis sp. Presence of toxins 1999 Unconfirmed Death of 2 giraffe Vaal Dam 04-05/1998 Bospoort Dam 01-03/1999 Microcystis sp. Positive presence of toxins
in algal scum by mouse i-p. Reported incidence of diarrhoea in people living near the shore.
Roodeplaat Dam 12/1998 – 03-1999
Microcystis sp. Positive toxicity by mouse test. Skin irritations reported by recreation users.
Hartbeespoort Dam 03/1999 Microcystis sp. Taste and odour complaints. Laing Dam 12/1999 Microcystis sp. Scum tested positive for
toxins. Orange River* 01/2000* Cylindrospermopsis
raciborskii* Anabaena sp. Oscillatoria sp.
Extended blooms and fish kills along the river. No analytical ability to identify cylindrospermopsin presence was available at the time*.
Reporting of this 2000 incident falls just outside of the period considered by this review. However, this record is significant as it documents the first incidence of a C. raciborskii bloom in South Africa. This organism was subsequently also reported from Spitskop and Boegoeberg Dams.
Van Ginkel (IWQS, pers. comm.)
conducted an ELISA-based screening for
toxicity in 65 impoundments. The results,
presented as cyanobacterial genus,
dominant species, identified (HPLC)
cyanobacterial toxin, and prevailing
chlorophyll-a, are presented in Table 9.
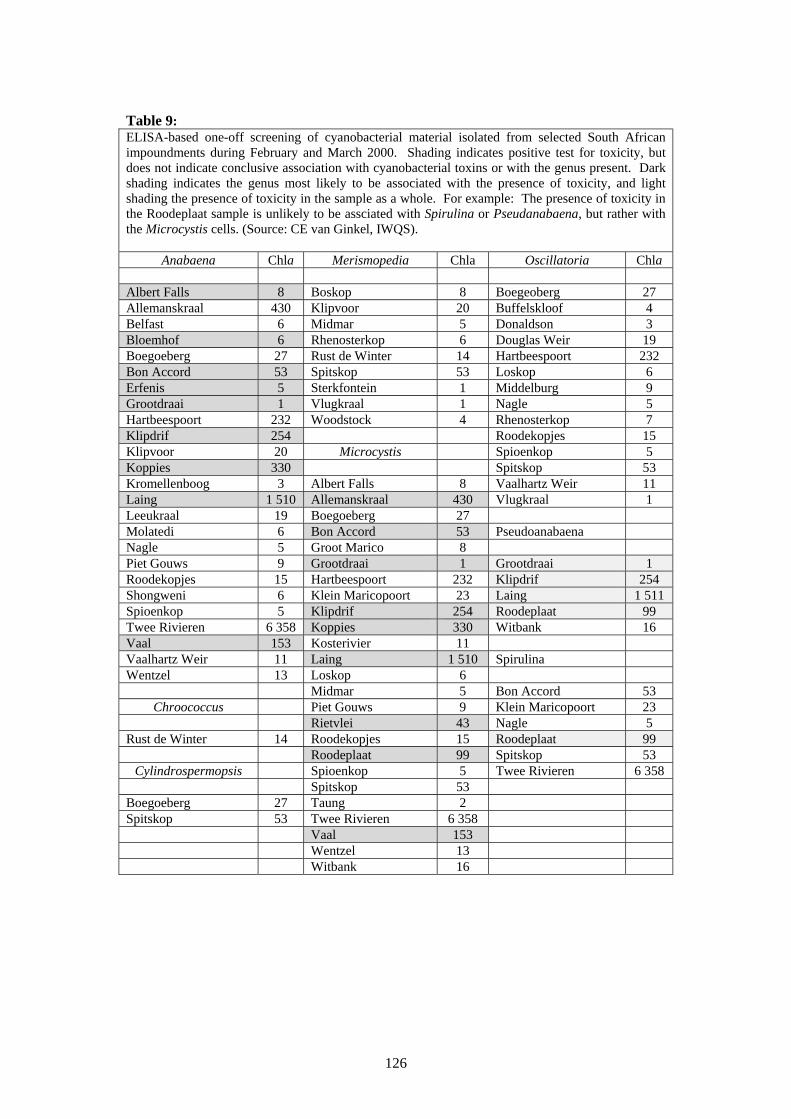
126
Table 9: ELISA-based one-off screening of cyanobacterial material isolated from selected South African impoundments during February and March 2000. Shading indicates positive test for toxicity, but does not indicate conclusive association with cyanobacterial toxins or with the genus present. Dark shading indicates the genus most likely to be associated with the presence of toxicity, and light shading the presence of toxicity in the sample as a whole. For example: The presence of toxicity in the Roodeplaat sample is unlikely to be assciated with Spirulina or Pseudanabaena, but rather with the Microcystis cells. (Source: CE van Ginkel, IWQS).
Anabaena Chla Merismopedia Chla Oscillatoria Chla Albert Falls 8 Boskop 8 Boegeoberg 27 Allemanskraal 430 Klipvoor 20 Buffelskloof 4 Belfast 6 Midmar 5 Donaldson 3 Bloemhof 6 Rhenosterkop 6 Douglas Weir 19 Boegoeberg 27 Rust de Winter 14 Hartbeespoort 232 Bon Accord 53 Spitskop 53 Loskop 6 Erfenis 5 Sterkfontein 1 Middelburg 9 Grootdraai 1 Vlugkraal 1 Nagle 5 Hartbeespoort 232 Woodstock 4 Rhenosterkop 7 Klipdrif 254 Roodekopjes 15 Klipvoor 20 Microcystis Spioenkop 5 Koppies 330 Spitskop 53 Kromellenboog 3 Albert Falls 8 Vaalhartz Weir 11 Laing 1 510 Allemanskraal 430 Vlugkraal 1 Leeukraal 19 Boegoeberg 27 Molatedi 6 Bon Accord 53 Pseudoanabaena Nagle 5 Groot Marico 8 Piet Gouws 9 Grootdraai 1 Grootdraai 1 Roodekopjes 15 Hartbeespoort 232 Klipdrif 254 Shongweni 6 Klein Maricopoort 23 Laing 1 511 Spioenkop 5 Klipdrif 254 Roodeplaat 99 Twee Rivieren 6 358 Koppies 330 Witbank 16 Vaal 153 Kosterivier 11 Vaalhartz Weir 11 Laing 1 510 Spirulina Wentzel 13 Loskop 6 Midmar 5 Bon Accord 53
Chroococcus Piet Gouws 9 Klein Maricopoort 23 Rietvlei 43 Nagle 5 Rust de Winter 14 Roodekopjes 15 Roodeplaat 99 Roodeplaat 99 Spitskop 53
Cylindrospermopsis Spioenkop 5 Twee Rivieren 6 358 Spitskop 53 Boegoeberg 27 Taung 2 Spitskop 53 Twee Rivieren 6 358 Vaal 153 Wentzel 13 Witbank 16
127
University of the Witwatersrand
This review would not be complete
without inclusion of reference to the
comprehensive study and description of
South African marine cyanophytes
undertaken by Simone Silva and Richard
Pienaar of the Department of Botany at
WITS (e.g. Silva and Pienaar, 1997a, b).
128
6.10.4 Kwa-Zulu Natal
Umgeni Water
During the 1990s a number of problems
related to the occurrence of cyanobacteria
in raw potable water supplies were
investigated in the laboratories of Umgeni
Water in Pietermaritzburg. During this
period an extensive database was amassed,
and several detailed reports were
published via the Water Research
Commission. These are summarised in
this section.
Cyanobacterial investigations
Phytoplankton assemblages in water
storages
The occurrence and abundance of
cyanobacteria in the Umgeni Water
operational area was examined over a
5-year period from 1990 to 1994 (Graham
et al. 1998). The genera of Microcystis,
Anabaena and Oscillatoria, were found to
be the most abundant and significant from
a water treatment perspective. Other
genera encountered were Chroococcus,
Gloeocapsa, Gomphonema, and
Merismopedia.
Figure 1 (B-D) illustrates some summary
abundance statistics for the three most
important and dominant cyanobacteria.
The total algal count (A) has also been
included to provide some measure of how
the individual genera contributed to the
total algal count. Figure 2 illustrates the
proportional composition (as a percentage
of the total median count) of the major
algal genera for the respective
impoundments. Microcystis was found to
be the dominant cyanobacterial genus,
with secondary dominance by Anabaena, a
finding that mirrors the typical occurrence
of cyanobacteria in South African waters.
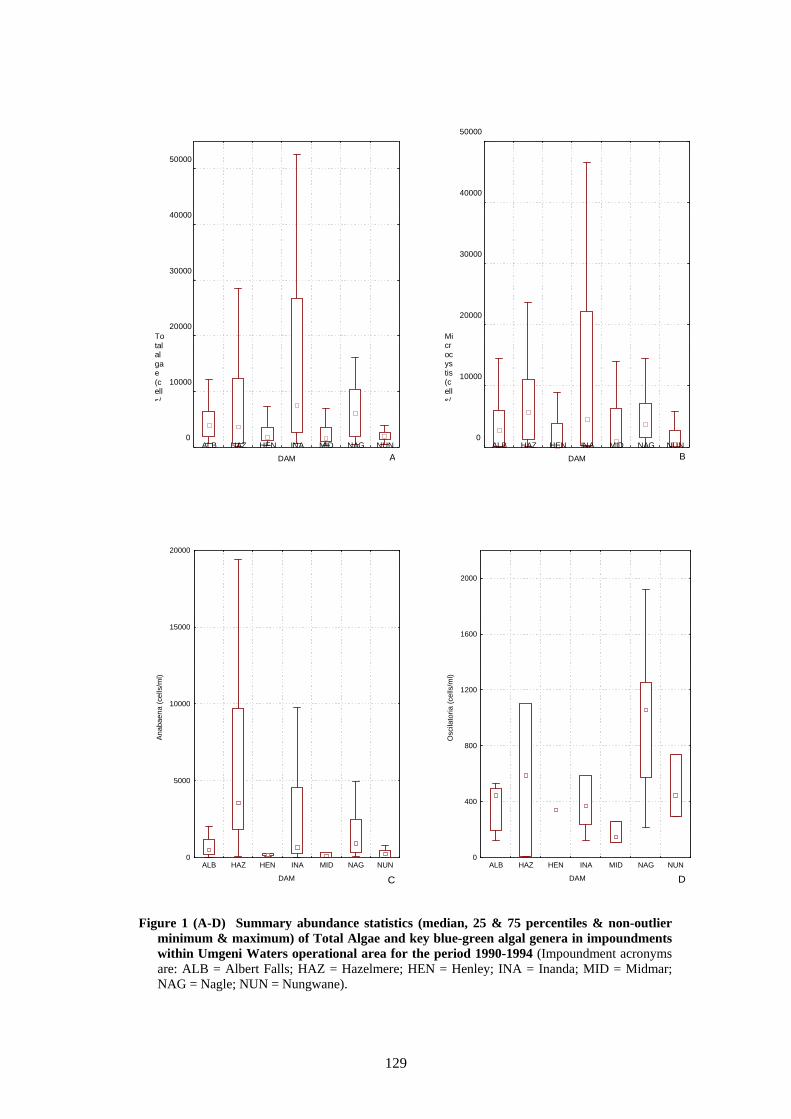
129
DAM
Totalalgae(cells/
0
10000
20000
30000
40000
50000
ALB HAZ HEN INA MID NAG NUN
DAM
Microcystis(cells/
0
10000
20000
30000
40000
50000
ALB HAZ HEN INA MID NAG NUNA B
DAM
Ana
baen
a (c
ells
/ml)
0
5000
10000
15000
20000
ALB HAZ HEN INA MID NAG NUN
DAM
Osc
ilato
ria (c
ells
/ml)
0
400
800
1200
1600
2000
ALB HAZ HEN INA MID NAG NUN
C D
Figure 1 (A-D) Summary abundance statistics (median, 25 & 75 percentiles & non-outlier
minimum & maximum) of Total Algae and key blue-green algal genera in impoundments within Umgeni Waters operational area for the period 1990-1994 (Impoundment acronyms are: ALB = Albert Falls; HAZ = Hazelmere; HEN = Henley; INA = Inanda; MID = Midmar; NAG = Nagle; NUN = Nungwane).
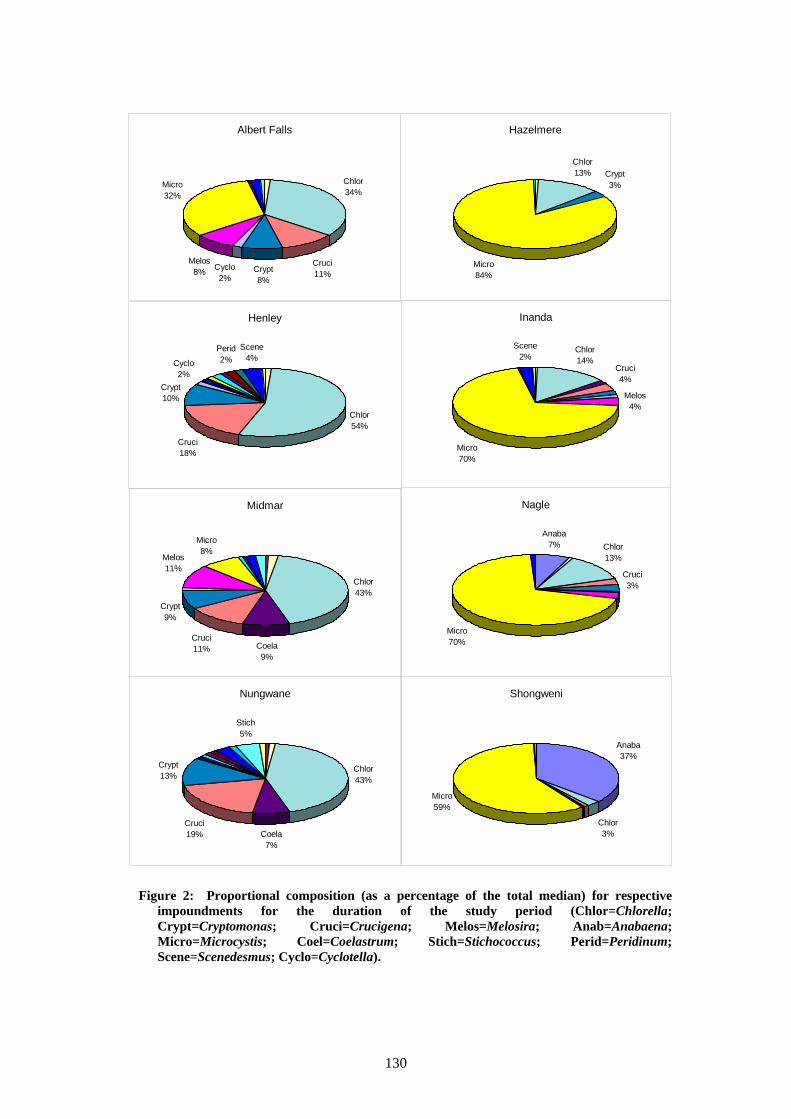
130
555 555
555
555
555
Albert Falls
Chlor34%
Cruci11%Crypt
8%Cyclo2%
Melos8%
Micro32%
Hazelmere
Chlor13%
Micro84%
Crypt3%
Henley
Chlor54%
Cruci18%
Crypt10%
Cyclo2%
Perid2%
Scene4%
Inanda
Chlor14%
Cruci4%
Melos4%
Micro70%
Scene2%
Midmar
Chlor43%
Coela9%
Cruci11%
Crypt9%
Melos11%
Micro8%
Nagle
Anaba7% Chlor
13%
Cruci3%
Micro70%
Nungwane
Chlor43%
Coela7%
Cruci19%
Crypt13%
Stich5%
Shongweni
Anaba37%
Chlor3%
Micro59%
Figure 2: Proportional composition (as a percentage of the total median) for respective
impoundments for the duration of the study period (Chlor=Chlorella; Crypt=Cryptomonas; Cruci=Crucigena; Melos=Melosira; Anab=Anabaena; Micro=Microcystis; Coel=Coelastrum; Stich=Stichococcus; Perid=Peridinum; Scene=Scenedesmus; Cyclo=Cyclotella).
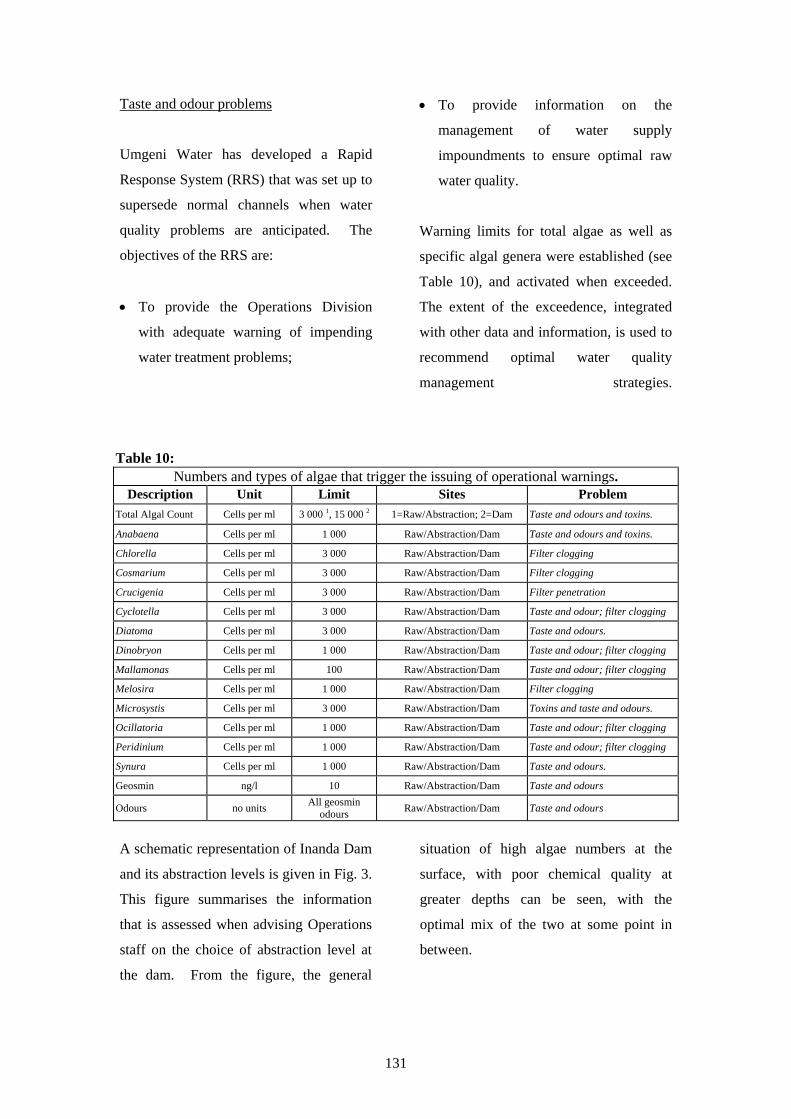
131
Taste and odour problems
Umgeni Water has developed a Rapid
Response System (RRS) that was set up to
supersede normal channels when water
quality problems are anticipated. The
objectives of the RRS are:
• To provide the Operations Division
with adequate warning of impending
water treatment problems;
• To provide information on the
management of water supply
impoundments to ensure optimal raw
water quality.
Warning limits for total algae as well as
specific algal genera were established (see
Table 10), and activated when exceeded.
The extent of the exceedence, integrated
with other data and information, is used to
recommend optimal water quality
management strategies.
Table 10: Numbers and types of algae that trigger the issuing of operational warnings.
Description Unit Limit Sites Problem Total Algal Count Cells per ml 3 000 1, 15 000 2 1=Raw/Abstraction; 2=Dam Taste and odours and toxins.
Anabaena Cells per ml 1 000 Raw/Abstraction/Dam Taste and odours and toxins.
Chlorella Cells per ml 3 000 Raw/Abstraction/Dam Filter clogging
Cosmarium Cells per ml 3 000 Raw/Abstraction/Dam Filter clogging
Crucigenia Cells per ml 3 000 Raw/Abstraction/Dam Filter penetration
Cyclotella Cells per ml 3 000 Raw/Abstraction/Dam Taste and odour; filter clogging
Diatoma Cells per ml 3 000 Raw/Abstraction/Dam Taste and odours.
Dinobryon Cells per ml 1 000 Raw/Abstraction/Dam Taste and odour; filter clogging
Mallamonas Cells per ml 100 Raw/Abstraction/Dam Taste and odour; filter clogging
Melosira Cells per ml 1 000 Raw/Abstraction/Dam Filter clogging
Microsystis Cells per ml 3 000 Raw/Abstraction/Dam Toxins and taste and odours.
Ocillatoria Cells per ml 1 000 Raw/Abstraction/Dam Taste and odour; filter clogging
Peridinium Cells per ml 1 000 Raw/Abstraction/Dam Taste and odour; filter clogging
Synura Cells per ml 1 000 Raw/Abstraction/Dam Taste and odours.
Geosmin ng/l 10 Raw/Abstraction/Dam Taste and odours
Odours no units All geosmin odours Raw/Abstraction/Dam Taste and odours
A schematic representation of Inanda Dam
and its abstraction levels is given in Fig. 3.
This figure summarises the information
that is assessed when advising Operations
staff on the choice of abstraction level at
the dam. From the figure, the general
situation of high algae numbers at the
surface, with poor chemical quality at
greater depths can be seen, with the
optimal mix of the two at some point in
between.
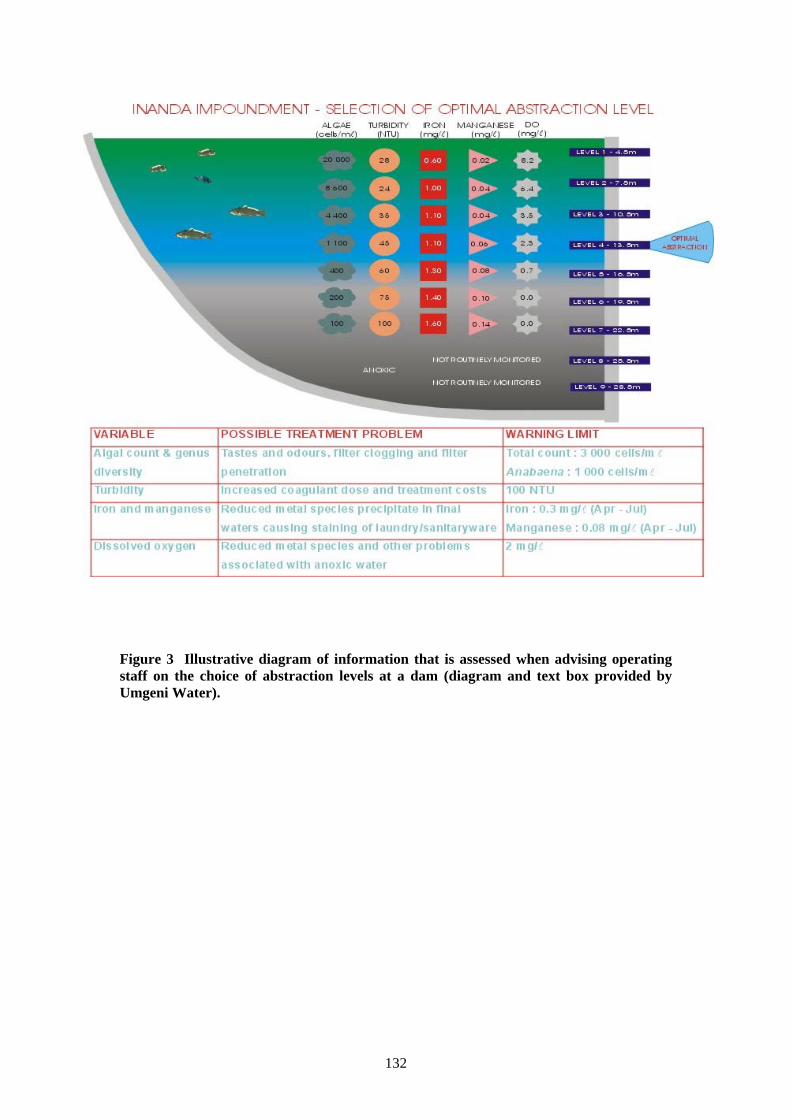
132
Figure 3 Illustrative diagram of information that is assessed when advising operating staff on the choice of abstraction levels at a dam (diagram and text box provided by Umgeni Water).
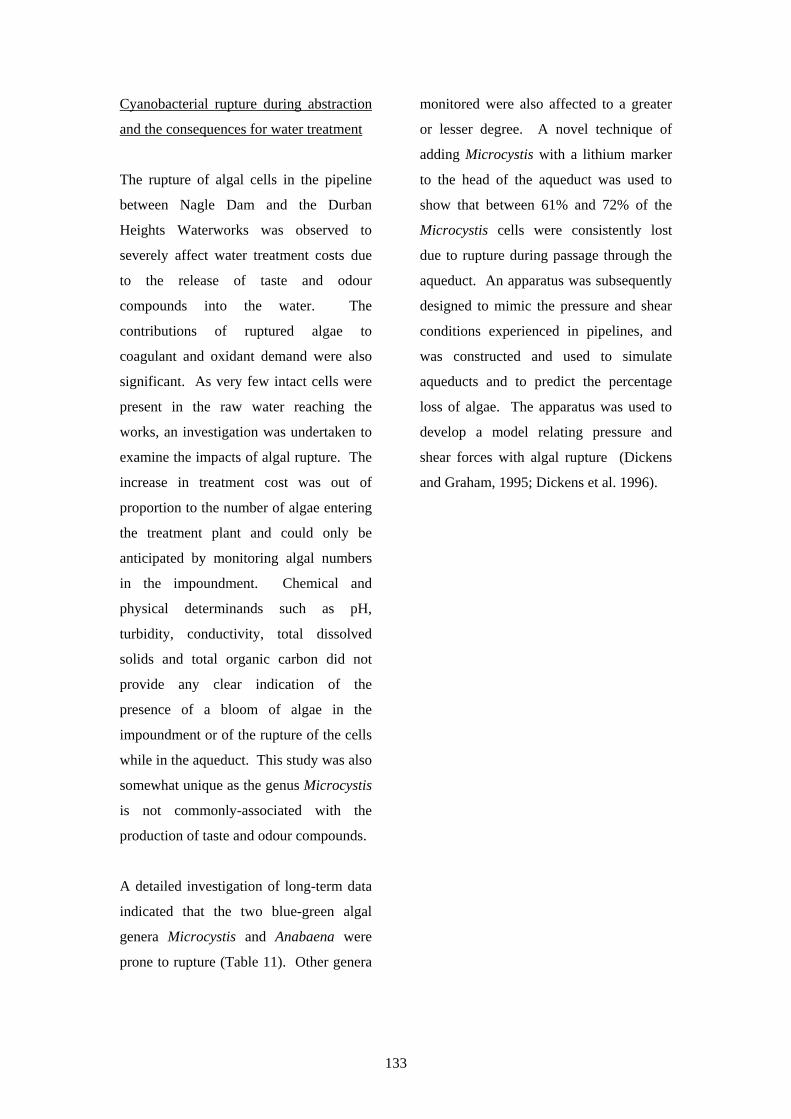
133
Cyanobacterial rupture during abstraction
and the consequences for water treatment
The rupture of algal cells in the pipeline
between Nagle Dam and the Durban
Heights Waterworks was observed to
severely affect water treatment costs due
to the release of taste and odour
compounds into the water. The
contributions of ruptured algae to
coagulant and oxidant demand were also
significant. As very few intact cells were
present in the raw water reaching the
works, an investigation was undertaken to
examine the impacts of algal rupture. The
increase in treatment cost was out of
proportion to the number of algae entering
the treatment plant and could only be
anticipated by monitoring algal numbers
in the impoundment. Chemical and
physical determinands such as pH,
turbidity, conductivity, total dissolved
solids and total organic carbon did not
provide any clear indication of the
presence of a bloom of algae in the
impoundment or of the rupture of the cells
while in the aqueduct. This study was also
somewhat unique as the genus Microcystis
is not commonly-associated with the
production of taste and odour compounds.
A detailed investigation of long-term data
indicated that the two blue-green algal
genera Microcystis and Anabaena were
prone to rupture (Table 11). Other genera
monitored were also affected to a greater
or lesser degree. A novel technique of
adding Microcystis with a lithium marker
to the head of the aqueduct was used to
show that between 61% and 72% of the
Microcystis cells were consistently lost
due to rupture during passage through the
aqueduct. An apparatus was subsequently
designed to mimic the pressure and shear
conditions experienced in pipelines, and
was constructed and used to simulate
aqueducts and to predict the percentage
loss of algae. The apparatus was used to
develop a model relating pressure and
shear forces with algal rupture (Dickens
and Graham, 1995; Dickens et al. 1996).
134
Table 11:
Results of Student's Paired Differences and the Wilcoxon Matched Pairs tests comparing the Nagle Dam flow weighted average for historical algal data with Durban Heights WW mean algal counts and the median % loss
between the respective sample points.
Genus Number of paired couplets
Significance (Student's test)
Significance (Wilcoxon test)
Nagle algae, flow weighted mean
(cells.mℓ-1)
WW algae, mean
(cells.mℓ-1)
Median % loss between Nagle & Dbn Hts WW *
Total 161 P < 0.001 P < 0.001 2 548 942 47 Anabaena 77 P < 0.001 P < 0.001 780 56 100 Ankistrodesmus 32 NS P < 0.01 8 5 100 Chlamydomonas 104 NS NS 15 13 26 Chlorella 159 NS P < 0.001 458 345 24 Cocconeis 8 P < 0.01 P < 0.01 5 0 100 Coelastrum 42 P < 0.001 P < 0.001 94 34 100 Cosmarium 40 NS P < 0.01 22 13 100 Crucigenia 135 P < 0.001 P < 0.001 118 57 70 Cryptomonas 151 NS NS 47 63 + 16 Cyclotella 128 NS NS 53 39 25 Cymbella 12 NS NS 23 2 100 Diatoma 17 NS P < 0.01 7 3 100 Melosira 154 NS NS 296 273 23 Microcystis 133 P < 0.001 P < 0.001 1 154 28 100 Navicula 109 NS P < 0.01 13 9 41 Nitzschia 80 P < 0.001 P < 0.001 12 6 100 Oocystis 83 P < 0.001 P < 0.001 25 8 100 Oscillatoria 15 NS P < 0.01 893 202 100 Pandorina 12 NS NS 27 9 100 Pediastrum 22 NS NS 50 15 100 Pteromonas 9 NS ---- 3 0 100 Scenedesmus 127 P < 0.01 P < 0.001 55 34 63 Spermatozopsis 14 NS P < 0.01 26 2 100 Stichococcus 21 NS P < 0.001 28 4 100 Synedra 24 NS P < 0.001 12 2 100 Tetraedron 28 P < 0.01 P < 0.001 14 5 100 Trachelomonas 23 P < 0.01 P < 0.001 4 0 100 (* Median % loss - calculated as the median of all of the percentage losses between Nagle Dam and Durban Heights WW. NS - results considered statistically non-significant at P > 0.05).
135
Using the large database of water quality
(including algal) and water treatment cost
data, available at Umgeni Water, a study
was undertaken to explain the water
quality relationships (particularly as they
affected algae) in impoundments, and to
see how this affected the cost of water
treatment (Graham et al. 1998). The aims
and findings of this study are summarised
below:
Aims:
• To establish the key
environmental variables
influencing the distribution and
abundance of problematic algae in
impoundments in the Umgeni
Water operational area.
• To establish a predictive model(s)
relating algae to the environment
for the major impoundments in the
Umgeni Water operational area.
• To build an economic model
relating water treatment costs to
the types and numbers of algae
likely to be found in
impoundments.
Models were developed that described the
relationship between algal abundance and
key water quality variables. In most cases,
the models developed were related to
algae that were known to adversely-affect
water treatment (traditionally certain blue-
green and diatom algal genera).
Thereafter impoundment water quality
was examined to determine which factors
were most impacting on water treatment,
and, hence, treatment costs, at selected
waterworks (WW). Models were
subsequently developed relating raw water
quality entering respective water works
with the associated treatment costs.
Findings:
Algal environmental associations
As is a common feature of this type of
study, many of the environmental
variables investigated were highly
correlated with each other. This is a
consequence of process and functional
relationships. The variation of the original
large number of environmental variables
(53) could be reasonably accounted for by
a smaller number of ‘key’ environmental
variables identified as conductivity, Secchi
depth, silicon, total inorganic nitrogen,
total phosphorus, inflow, temperature,
dissolved oxygen and stability
(stratification). These variables
represented the primary aspects of
variation in the environmental data and
had intuitive biological appeal in that they
are often implicated in the literature as
influencing algal populations.
Low conductivity, low turbidity, ‘inland’
impoundments (Midmar, Albert Falls,
136
Nagle and Henley) were identified as
distinct from more turbid ‘coastal’
impoundments (Hazelmere, and to a lesser
extent, Nungwane). Inanda was
characterised by generally higher
conductivities but low turbidities.
Midmar, Albert Falls and Nagle neatly
demonstrate the change in water quality
with progression down the Mgeni River
catchment. This progression is
characterised by increased conductivities.
Inanda, the last impoundment on the
Mgeni system cascade, had the highest
conductivity.
Weaker gradients (characterised by total
inorganic nitrogen, total phosphorus and
inflows) distinguished between Midmar,
Nagle and Albert Falls (higher total
phosphorus) and Nungwane and Henley
(higher total inorganic nitrogen). Inanda
was relatively ‘mixed’, experiencing a
range of values for total inorganic
nitrogen, total phosphorus and inflows.
Impoundments with similar water-quality
are more likely to respond similarly to
management/perturbation.
The reduced set of ‘key’ environmental
variables explained a low (16%), but
statistically significant (P < 0.01) portion
of the variability in the algal data. This
low amount of explained variation is not
unusual for large multi-genera ecological
data. Of these variables, total inorganic
nitrogen, silicon, temperature, inflow and
secchi were the most important in
explaining algal variability. The
ordination diagram, Fig. 4, illustrates the
response of key algae to significant
environment variables. Not all algae had
appreciable amounts of their variability
explained by analyses.
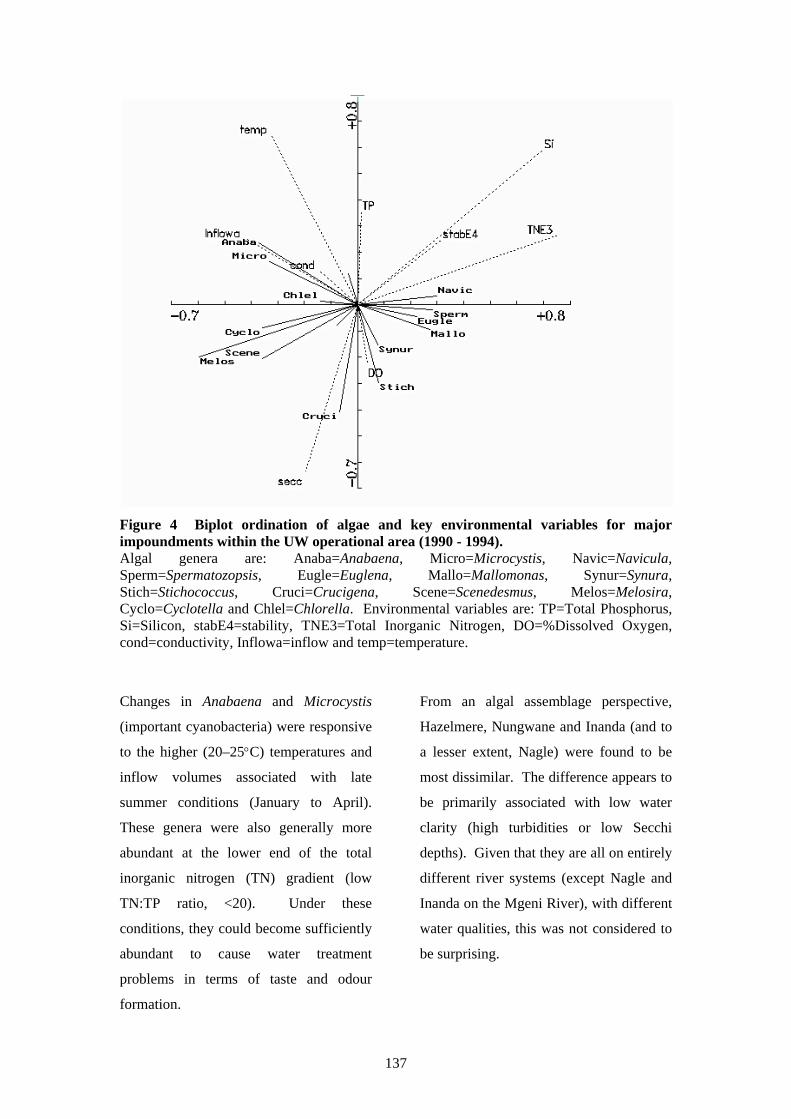
137
Figure 4 Biplot ordination of algae and key environmental variables for major impoundments within the UW operational area (1990 - 1994). Algal genera are: Anaba=Anabaena, Micro=Microcystis, Navic=Navicula, Sperm=Spermatozopsis, Eugle=Euglena, Mallo=Mallomonas, Synur=Synura, Stich=Stichococcus, Cruci=Crucigena, Scene=Scenedesmus, Melos=Melosira, Cyclo=Cyclotella and Chlel=Chlorella. Environmental variables are: TP=Total Phosphorus, Si=Silicon, stabE4=stability, TNE3=Total Inorganic Nitrogen, DO=%Dissolved Oxygen, cond=conductivity, Inflowa=inflow and temp=temperature.
Changes in Anabaena and Microcystis
(important cyanobacteria) were responsive
to the higher (20–25°C) temperatures and
inflow volumes associated with late
summer conditions (January to April).
These genera were also generally more
abundant at the lower end of the total
inorganic nitrogen (TN) gradient (low
TN:TP ratio, <20). Under these
conditions, they could become sufficiently
abundant to cause water treatment
problems in terms of taste and odour
formation.
From an algal assemblage perspective,
Hazelmere, Nungwane and Inanda (and to
a lesser extent, Nagle) were found to be
most dissimilar. The difference appears to
be primarily associated with low water
clarity (high turbidities or low Secchi
depths). Given that they are all on entirely
different river systems (except Nagle and
Inanda on the Mgeni River), with different
water qualities, this was not considered to
be surprising.
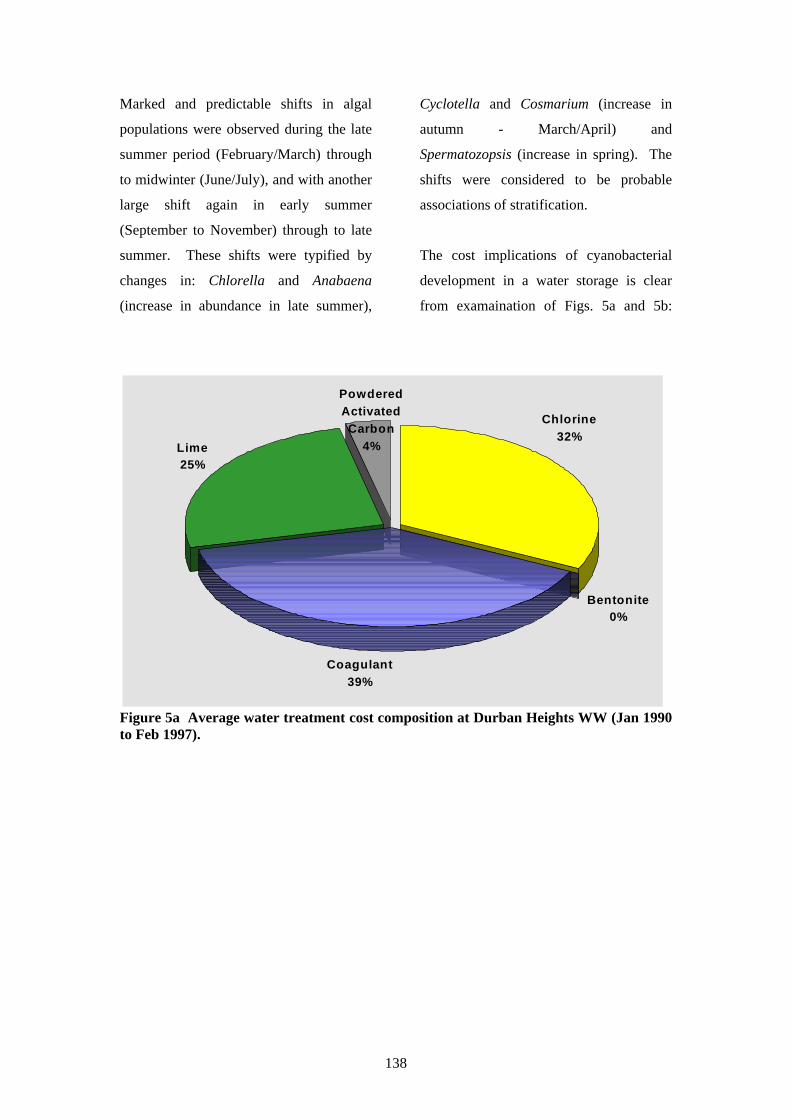
138
Marked and predictable shifts in algal
populations were observed during the late
summer period (February/March) through
to midwinter (June/July), and with another
large shift again in early summer
(September to November) through to late
summer. These shifts were typified by
changes in: Chlorella and Anabaena
(increase in abundance in late summer),
Cyclotella and Cosmarium (increase in
autumn - March/April) and
Spermatozopsis (increase in spring). The
shifts were considered to be probable
associations of stratification.
The cost implications of cyanobacterial
development in a water storage is clear
from examaination of Figs. 5a and 5b:
Bentonite0%
Lime25%
Chlorine 32%
Powdered Activated
Carbon4%
Coagulant39%
Figure 5a Average water treatment cost composition at Durban Heights WW (Jan 1990 to Feb 1997).
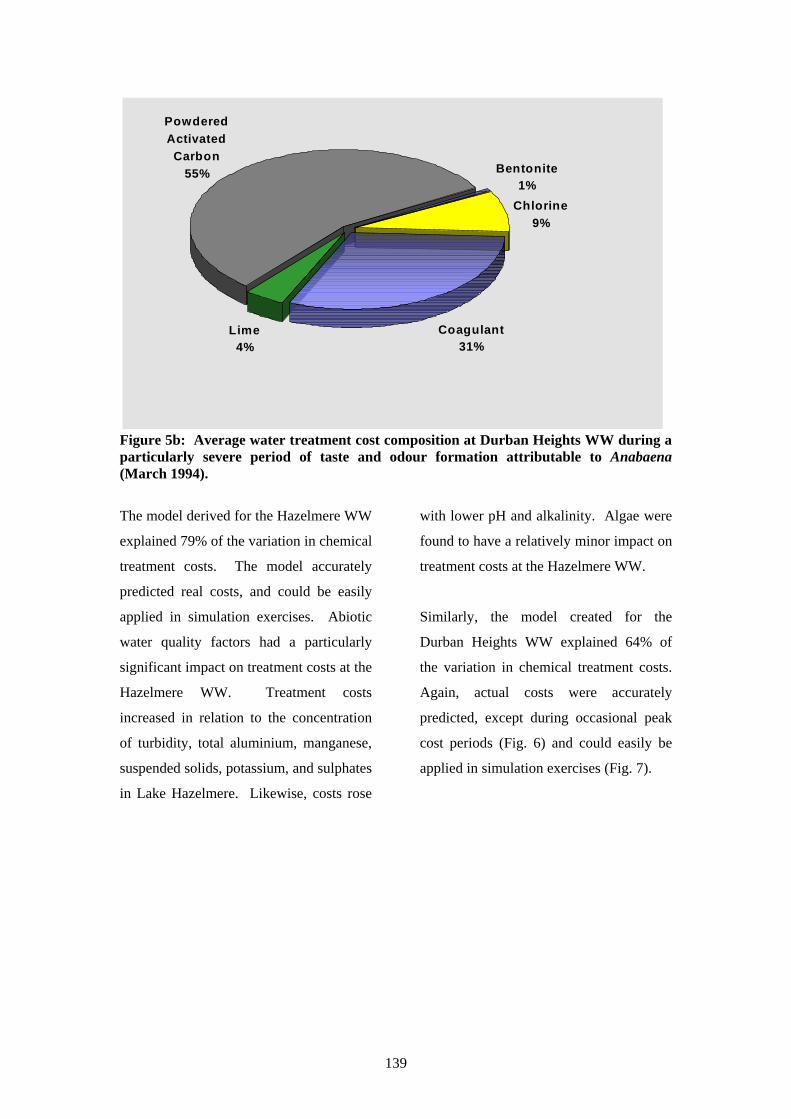
139
Bentonite1%
Lime4%
Powdered Activated
Carbon55%
Chlorine9%
Coagulant31%
Figure 5b: Average water treatment cost composition at Durban Heights WW during a particularly severe period of taste and odour formation attributable to Anabaena (March 1994).
The model derived for the Hazelmere WW
explained 79% of the variation in chemical
treatment costs. The model accurately
predicted real costs, and could be easily
applied in simulation exercises. Abiotic
water quality factors had a particularly
significant impact on treatment costs at the
Hazelmere WW. Treatment costs
increased in relation to the concentration
of turbidity, total aluminium, manganese,
suspended solids, potassium, and sulphates
in Lake Hazelmere. Likewise, costs rose
with lower pH and alkalinity. Algae were
found to have a relatively minor impact on
treatment costs at the Hazelmere WW.
Similarly, the model created for the
Durban Heights WW explained 64% of
the variation in chemical treatment costs.
Again, actual costs were accurately
predicted, except during occasional peak
cost periods (Fig. 6) and could easily be
applied in simulation exercises (Fig. 7).
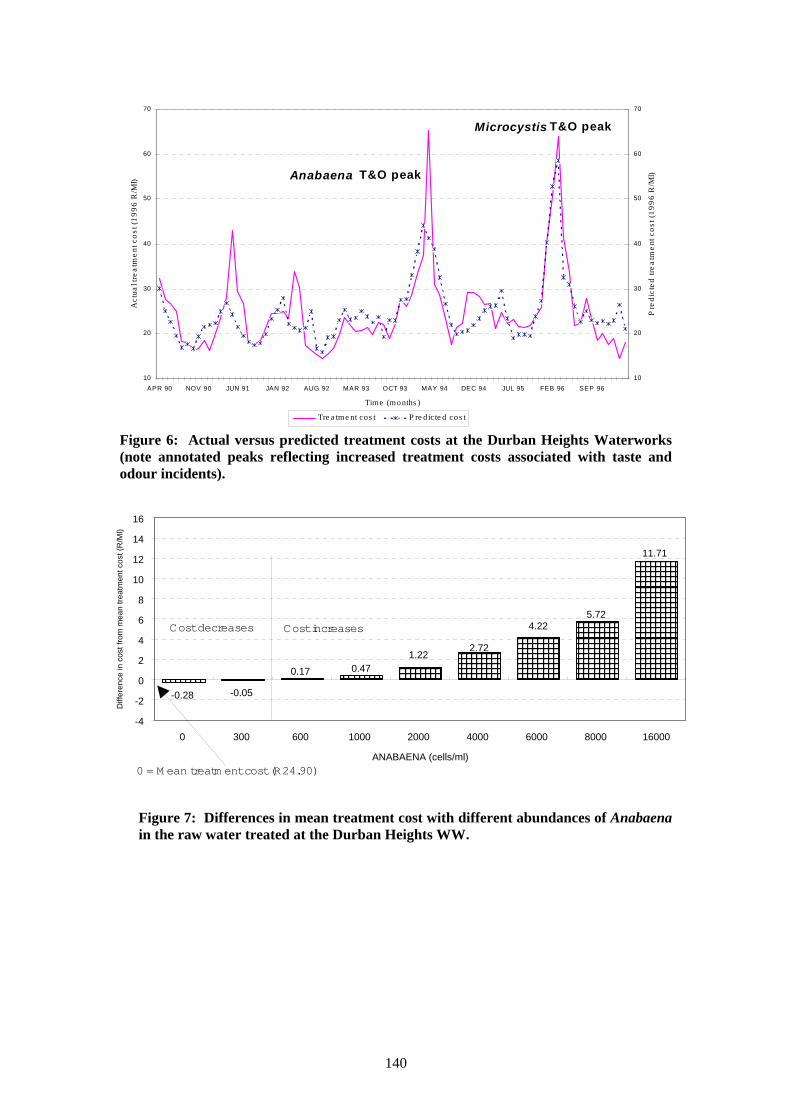
140
10
20
30
40
50
60
70
APR 90 NOV 90 JUN 91 JAN 92 AUG 92 MAR 93 OCT 93 MAY 94 DEC 94 JUL 95 FEB 96 SEP 96
Time (months )
Act
ual t
reat
men
t cos
t (19
96 R
/Ml)
10
20
30
40
50
60
70
Pre
dict
ed tr
eatm
ent c
ost (
1996
R/M
l)
Tre a tme nt cos t P re d ic te d co s t
Anabaena T&O peak
Microcystis T&O peak
Figure 6: Actual versus predicted treatment costs at the Durban Heights Waterworks (note annotated peaks reflecting increased treatment costs associated with taste and odour incidents).
Figure 7: Differences in mean treatment cost with different abundances of Anabaena in the raw water treated at the Durban Heights WW.
2.72
11.71
4.225.72
0.470.17
-0.05-0.28
1.22
-4
-2
0
2
4
6
8
10
12
14
16
0 300 600 1000 2000 4000 6000 8000 16000
ANABAENA (cells/ml)
Diff
eren
ce in
cos
t fro
m m
ean
treat
men
t cos
t (R
/Ml)
Cost increasesCost decreases
0 = M ean treatm ent cost (R24.90)
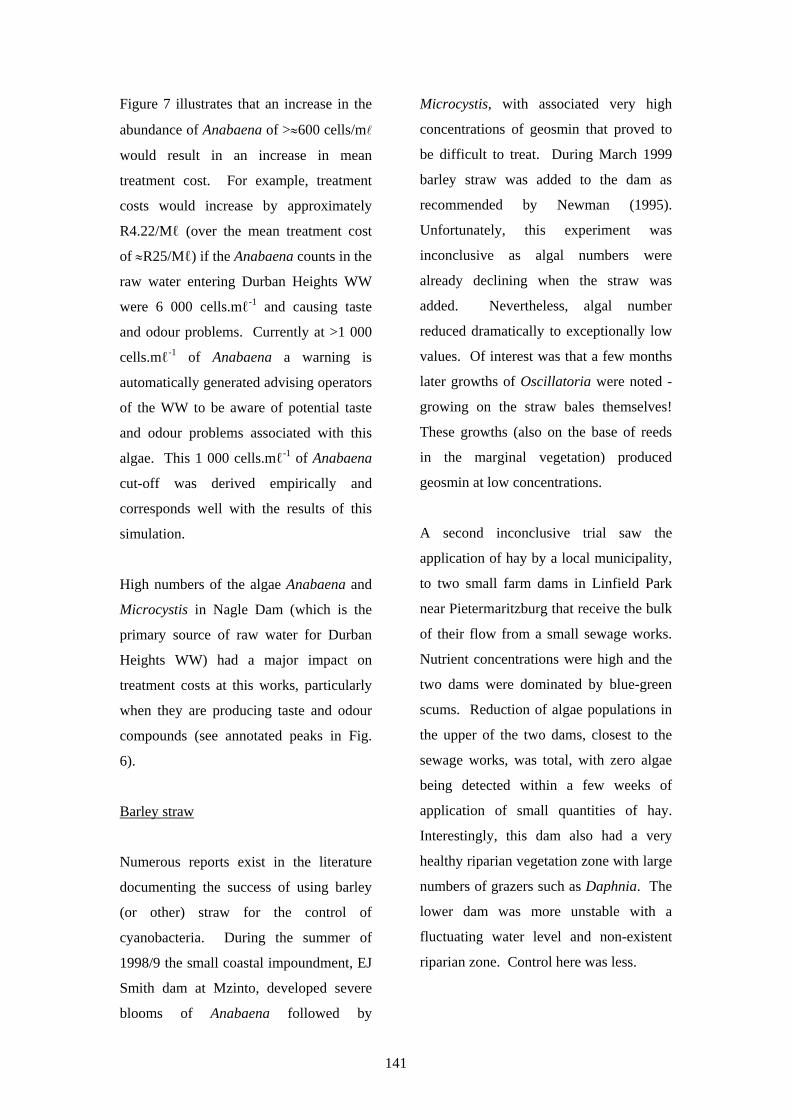
141
Figure 7 illustrates that an increase in the
abundance of Anabaena of >≈600 cells/ml
would result in an increase in mean
treatment cost. For example, treatment
costs would increase by approximately
R4.22/Mℓ (over the mean treatment cost
of ≈R25/Mℓ) if the Anabaena counts in the
raw water entering Durban Heights WW
were 6 000 cells.mℓ-1 and causing taste
and odour problems. Currently at >1 000
cells.mℓ-1 of Anabaena a warning is
automatically generated advising operators
of the WW to be aware of potential taste
and odour problems associated with this
algae. This 1 000 cells.mℓ-1 of Anabaena
cut-off was derived empirically and
corresponds well with the results of this
simulation.
High numbers of the algae Anabaena and
Microcystis in Nagle Dam (which is the
primary source of raw water for Durban
Heights WW) had a major impact on
treatment costs at this works, particularly
when they are producing taste and odour
compounds (see annotated peaks in Fig.
6).
Barley straw
Numerous reports exist in the literature
documenting the success of using barley
(or other) straw for the control of
cyanobacteria. During the summer of
1998/9 the small coastal impoundment, EJ
Smith dam at Mzinto, developed severe
blooms of Anabaena followed by
Microcystis, with associated very high
concentrations of geosmin that proved to
be difficult to treat. During March 1999
barley straw was added to the dam as
recommended by Newman (1995).
Unfortunately, this experiment was
inconclusive as algal numbers were
already declining when the straw was
added. Nevertheless, algal number
reduced dramatically to exceptionally low
values. Of interest was that a few months
later growths of Oscillatoria were noted -
growing on the straw bales themselves!
These growths (also on the base of reeds
in the marginal vegetation) produced
geosmin at low concentrations.
A second inconclusive trial saw the
application of hay by a local municipality,
to two small farm dams in Linfield Park
near Pietermaritzburg that receive the bulk
of their flow from a small sewage works.
Nutrient concentrations were high and the
two dams were dominated by blue-green
scums. Reduction of algae populations in
the upper of the two dams, closest to the
sewage works, was total, with zero algae
being detected within a few weeks of
application of small quantities of hay.
Interestingly, this dam also had a very
healthy riparian vegetation zone with large
numbers of grazers such as Daphnia. The
lower dam was more unstable with a
fluctuating water level and non-existent
riparian zone. Control here was less.
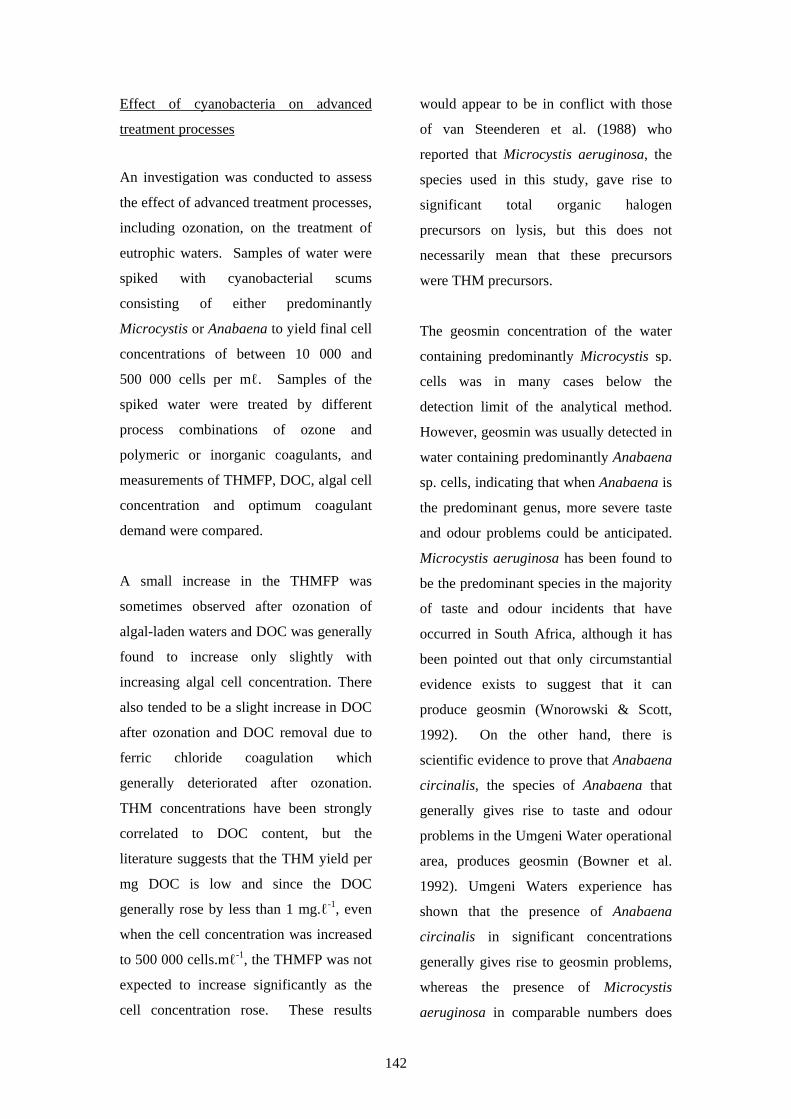
142
Effect of cyanobacteria on advanced
treatment processes
An investigation was conducted to assess
the effect of advanced treatment processes,
including ozonation, on the treatment of
eutrophic waters. Samples of water were
spiked with cyanobacterial scums
consisting of either predominantly
Microcystis or Anabaena to yield final cell
concentrations of between 10 000 and
500 000 cells per mℓ. Samples of the
spiked water were treated by different
process combinations of ozone and
polymeric or inorganic coagulants, and
measurements of THMFP, DOC, algal cell
concentration and optimum coagulant
demand were compared.
A small increase in the THMFP was
sometimes observed after ozonation of
algal-laden waters and DOC was generally
found to increase only slightly with
increasing algal cell concentration. There
also tended to be a slight increase in DOC
after ozonation and DOC removal due to
ferric chloride coagulation which
generally deteriorated after ozonation.
THM concentrations have been strongly
correlated to DOC content, but the
literature suggests that the THM yield per
mg DOC is low and since the DOC
generally rose by less than 1 mg.ℓ-1, even
when the cell concentration was increased
to 500 000 cells.mℓ-1, the THMFP was not
expected to increase significantly as the
cell concentration rose. These results
would appear to be in conflict with those
of van Steenderen et al. (1988) who
reported that Microcystis aeruginosa, the
species used in this study, gave rise to
significant total organic halogen
precursors on lysis, but this does not
necessarily mean that these precursors
were THM precursors.
The geosmin concentration of the water
containing predominantly Microcystis sp.
cells was in many cases below the
detection limit of the analytical method.
However, geosmin was usually detected in
water containing predominantly Anabaena
sp. cells, indicating that when Anabaena is
the predominant genus, more severe taste
and odour problems could be anticipated.
Microcystis aeruginosa has been found to
be the predominant species in the majority
of taste and odour incidents that have
occurred in South Africa, although it has
been pointed out that only circumstantial
evidence exists to suggest that it can
produce geosmin (Wnorowski & Scott,
1992). On the other hand, there is
scientific evidence to prove that Anabaena
circinalis, the species of Anabaena that
generally gives rise to taste and odour
problems in the Umgeni Water operational
area, produces geosmin (Bowner et al.
1992). Umgeni Waters experience has
shown that the presence of Anabaena
circinalis in significant concentrations
generally gives rise to geosmin problems,
whereas the presence of Microcystis
aeruginosa in comparable numbers does
143
not always result in a taste and odour
problem.
Ozonation of Microcystis sp. generally had
a significant effect on the coagulant
demand, although as mentioned above,
this was dependent on the ozone
concentration. At ozone concentrations
that resulted in an increased coagulant
demand, the demand increased almost
exponentially with increasing cell
concentration when Microcystis sp.
predominated.
Ozonation of Anabaena sp. also resulted
in increases in coagulant demand, but the
effect of ozonation was much smaller than
with Microcystis sp. As a result, the
coagulant dose for an unozonated water
containing predominantly Microcystis sp.
was always lower than that for a water
containing predominantly Anabaena sp. at
similar cell concentrations. After
ozonation, however, the coagulant
demands for water containing
predominantly Microcystis sp. or
Anabaena sp. at comparative cell
concentrations were much closer in value,
especially at the greater cell
concentrations. Despite this, the coagulant
demand still tended to be lower when
Microcystis was the dominant genus.
The differences observed between the two
blue-green algal genera suggest that
Microcystis sp. are more susceptible to
lysis by ozonation. However, when
Anabaena sp. predominated, the coagulant
demand was always higher than for the
same water containing comparable
concentrations of Microcystis sp. implying
that Anabaena sp. are less amenable to
removal by coagulation.
Detection methods for algal toxins
In the early days of monitoring algal
toxins (as late at the early 1990s), the lack
of suitable laboratory techniques was a
severe restriction. As standards became
available (at great cost!) it was possible to
use these to research the methods. A
Water Research Commission funded
project set out to identify novel techniques
that would be quicker, easier and cheaper,
and later to optimise techniques developed
in other laboratories overseas. (Recently
the laboratory has begun to use ELISA
techniques to monitor algal toxins in raw
water supplies. This technique of
monitoring has proved to be robust and
will be used for standard screening of
blue-green algae rich samples in the
future).
This project was based on a study of 4
microcystin toxins (MC RR, MC YR, MC
LR, MC YA) and Nodularin. There were
three broad sections, including methods of
analysis, monitoring and remedial action.
144
Methods of Analysis
Two methods were investigated, namely
HPLC with fluorescence detection and
HPLC with photodiode array UV
detection.
Fluorescence Detection
4-(2-phthalimidyl) benzoyl chloride (PIB-
Cl) was used as the derivatisation reagent
but the results from this study were
inconclusive.
Photodiode Array UV Detection
This was essentially an assessment of the
“Codd” method. The work showed clearly
that the latter method was reliable for
both quantitative and qualitative analysis.
However, a number of limitations were
observed. These include:
• poor detection sensitivity due to matrix
interference (toxins not detected at 0.4
µg.ℓ-1 in some cases)
• low recoveries in spiked tap and raw
water samples
• low recoveries as a result of turbidity in
the sample
• co-elution of other organic compounds
present in the sample matrix often
masked toxin peaks
• the UV spectra was of limited use at
low toxin concentrations
• sample preparation procedure long and
laborious
• long sample analysis time
Using the Codd method as a basis for
toxin analysis, the laboratory was able to
achieve sample detection limits in the
range 0.04 to 0.08 µgℓ-1 for the various
algal toxins.
Monitoring
Routine monitoring of Midmar, Albert
Falls, Henley, Shongweni, Nagle, Inanda,
Hazelmere, and Nungwane Dams was
conducted during the period February
1995 to March 1997. No toxins were
detected in main basin samples of water
from these dams. However, concentrated
algal scum samples from Nagle, Inanda,
Albert Falls and Hazelmere Dams were
found to contain microcystin toxins.
Other sites with toxic scums included the
Camps Drift Weir on the Umsunduzi
River and the kwaMakutha wastewater
works. The conclusion drawn from the
algal toxin-monitoring programme was
that microcystin toxins did not appear to
be entering the water supply in the
Umgeni Water catchment and as such did
not pose an urgent threat.
145
Remedial Action
The three techniques for the removal of
toxins in water, namely chlorination,
ozonation and treatment with powdered
activated carbon that have been reported in
literature were assessed. The findings
were as follows:
Chlorination
• toxin removal found to be pH-
dependent
• doses up to 4 mg.ℓ-1 were required for
toxin removal at pH 7-8
Ozonation
• toxin removal also pH dependent
• doses between 2.5 to 3 mg.ℓ-1
recommended for raw water with pH 7-
8
Powdered Activated Carbon (PAC)
Three wood-based carbons and one coal-
based carbon were tested. The Sutcliffe
WF PAC (wood-based) was found to be
most effective for toxin removal. A
typical dose of 20 mg.ℓ-1 was used.
HPLC-MS
Attempts were made to identify an
unknown toxin found in a Nagle Dam
scum with the above technique. However,
the experiment was dominated by the
presence of impurities.
Sterile Culture of Toxic Microcystis
Microcystis was found to grow very
slowly in BG-11 culture media. The
cultures, however, remained toxic for 5
months. No tests were done after this
period.
The above work is reported in Rae et al.
(1999).
Algal identification and enumeration at
Umgeni Water
As problems associated with algae are
dependent on the size and composition of
their population, it is necessary to quantify
both the type and abundance of algae in
the water.
The Hydrobiology laboratory at Umgeni
Water uses the membrane filter method of
determining both algal type (identified
down to genus level) and algal abundance.
This method has been refined “in house”
and accredited in terms of ISO/IEC Guide
25 (1990). The membrane filter method is
a rapid method capable of detecting algae
at low concentrations and with adequate
training has proven to be reliable and
robust compared to the traditionally
slower but more accurate sedimentation
chamber approach. In principle, the
146
method involves filtering a known volume
of sample (generally 20-50 mℓ for “raw”
water samples and 1 200mℓ for “final” or
potable water samples) under low vacuum
onto a cellulose nitrate 0.45 μm membrane
filter. The samples are then air dried and
may then be examined under a standard
compound light microscope with a 63X
objective oil immersion lens. With a 10X
eyepiece, normal counting magnifications
are therefore 630X. If necessary, an algal
count to genus level may be available
within 15 min after receipt of a sample.
Routinely however samples are available
within 24 h after sample collection.
The laboratory participates in a quarterly
inter-laboratory proficiency testing
scheme (PTS) with all the major Southern
African centres of algal identification and
counting participating (both within the
academic (university) and production
(water authorities) environments). The
method has been shown to be remarkably
robust during these PTS exercises and
within the production environment of
Umgeni Water, which handles some 500
to 600 algal samples per month.
Dedicated computer software was
developed at Umgeni Water to ensure
statistical confidence in the algal counts
produced by the Hydrobiology laboratory.
Three criteria are specified to ensure the
reliability of the algal count data produced
viz:
1. The estimate of the total count of
algae in a sample should be within
prespecified precision;
2. The estimates of the count of different
algal genera should be within
prespecified precision;
3. The pre-specified proportion of algal
genera present should be detected.
This software has certain basic user inputs,
e.g. sample monitoring point, volume of
sample filtered, magnification of
microscope used and analyst. Algae
observed under the microscope are entered
into a database by the analyst via a
standard PC keyboard, where each key is
configured to represent a unique algal
genus. Once sufficient fields of view
under the microscope are counted, and the
prespecified statistical criteria are met, the
counting software prompts the analyst to
stop counting. Results are converted to
cells/ml and stored in the database with,
amongst other details, relevant sample
point, analyst, count, and statistical
criteria. This software has recently been
re-written and will be capable of running
on a stand-alone PC. Umgeni Water have
indicated that their intention is to make
this software commercially available.
(see Supporting Literature)
147
7. South African national surveillance programme for cyanobacteria
A draft surveillance and monitoring
protocol for cyanobacteria was drafted
during 1995 by Quibell et al. with the
assistance of Professor Geoff Codd from
the University of Dundee, Scotland. The
objectives of the review, which did not
emerge from the draft stage, were the
following:
To provide a review of the blue-green
algal toxins, their pathological effects,
factors affecting their production, and
the management of these algae;
To select, test and establish the
sampling and analysis procedures for a
national surveillance programme;
To present the results of a preliminary
sampling network, as well as to
provide a summary of previous
incidents of toxic blue-green algal
events in South Africa;
To select and prioritise water bodies
for the phased implementation of the
national surveillance programme.
The draft report by Quibell and colleagues
made the following conclusions:
That the greatest priority facing
management of the problems posed by
cyanobacteria in South Africa was to
determine the extent of the problem,
and that a national surveillance and
monitoring programme was required
for this purpose;
That the HPLC-based analysis
technique developed by Lawton et al.
(1994) was the best available
analytical technique for the purpose of
separating and quantifying the
cyanobacterial hepatotoxins;
That, from the initial surveillance
screening, the occurrence of
cyanobacteria in South African waters
was both ubiquitous and present at a
high level of (biovolume) dominance;
That there was a strong likelihood that
almost all water bodies in South
Africa could support cyanobacterial
growth;
That approximately one-third of the
samples examined as part of the
preliminary screening were found to
be toxic, and that this presented a
definite threat to the users of both raw
and treated water in South Africa.
The draft report also established a basis
for the initiation of a formal monitoring
programme, by ranking water storage
impoundments into one of three priority
categories, as follows:
Priority 1: All water bodies that
serve as a source of drinking water for
humans, and specifically including those
water bodies served by minimal or no
treatment. A pre-requisite for inclusion in
the monitoring protocol was a phosphate
(as P) concentration, at the 90th percentile,
148
greater than 30 μgℓ-1. Thus categorized,
the survey identified 70 ‘Priority 1’ dams
Priority 2: All water bodies other
than Priority 1, and with a 90th percentile
phosphate (as P) concentration > 30 μg.ℓ-1.
This category included irrigation dams
used for contact recreation and livestock
watering. A total of 42 ‘Priority 2’ dams
were identified.
Priority 3: All water bodies with a
phosphate (as P) 90th percentile value of
<30 μg.ℓ-1 . 96 ‘Priority 3’ dams were
identified.
Although by no means onerous, the draft
surveillance protocol acknowledged that
the processing of the above numbers of
samples on a routine basis (assuming that
all contained identified cyanobacterial
cells at any one time) was beyond the
analytical capacity of the laboratories of
the Department of Water Affairs and
Forestry. An alternative to this would be
to enlist the capacity of the analytical
facilities of the major regional water
supply utilities, viz. Umgeni Water, Rand
Water and the City of Cape Town. This
was an entirely reasonable suggestion as
the division of the workload between 5 or
more laboratories (other laboratories with
developed analytical capacity for
cyanobacterial toxins were being created
in Bellville and Port Elizabeth, as well as
in Gaborone, Botswana) would make the
analytical load relatively easy to handle.
Furthermore, the processing of samples by
the regional water supply authorities
themselves is a practical and sensible
option. Once analysed, the results would
be conveyed to Pretoria for storage in a
central data base.
Akin to the monitoring and surveillance
phased or step-wise monitoring and
response protocols already created in the
United Kingdom (NRA, 1990) and
Australia (Ressom et al. 1993), the draft
DWAF document incorporated a
hierarchical approach with increasing
levels and intensity of response.
It is most unfortunate that five years have
been allowed to pass without the draft
protocol having been subjected to detailed
review and consideration, or without the
methodology having been tested for at
least one of the priority levels. However,
the work performed by IWQS (see
elsewhere in this review) has recently
provided additional valuable data on the
cyanobacterial status of many of South
Africa’s major water storages.
149
8. SUGGESTED READING BELL SG AND CODD GA (1994) Cyanobacterial toxins and human health. Rev. in Med. Microbiol. 5 256-264. CARMICHAEL WW (1982) Chemical and toxicological studies of the toxic freshwater cyanobacteria Microcystis aeruginosa, Anabaena flos-aque and Aphanizomenon flos-aquae. S. Afr. J. Sci., 78 367-372. CARMICHAEL WW (1997) The Cyanotoxins. Adv. in Bot. Res. 27 211-256. CARMICHAEL WW AND FALCONER IR (1993) Diseases related to freshwater blue-green algal toxins, and control measures. In: Algal Toxins in Seafood and Drinking Water. Falconer, IR (ed.) Academic Press. CARMICHAEL WW (1994) The Toxins of Cyanobacteria. Sci. Am. 270 64-70. CARMICHAEL WW (1997) The Cyanotoxins. Adv. Bot. Res. 27 212-256. CARR NG AND WHITTON BA (eds.) (1982) The Biology of Cyanobacteria. University of California Press. CODD GA AND BELL SG (1998) Toxic Cyanobacteria: The Global View. In: Proc. of the 1998 WaterTECH Meet. Brisbane, Australia. AWWA. 1-14. CODD GA, BELL, SG AND BROOKS WP (1989) Cyanobacterial toxins in water. Water Sci. and Technol. 21 1-13. CODD GA, STEFFENSEN DA, BURCH MD AND BAKER PD (1994) Toxic blooms of cyanobacteria in Lake Alexandrina, South Australia – Learning from history. Aust. J. Mar. and Freshwater Res. 45 731-736. CODD GA, JEFFRIES TM, KEEVIL CW AND POTTER E (1994) Detection Methods for Cyanobacterial Toxins. Royal Society of Chemistry. CODD GA AND BELL SG (1996) The Occurrence and Fate of Blue-Green Algal Toxins in Freshwaters. University of Dundee Research Report. HMSO (London). CRAVENS JB AND VAN DEN BROEK J (1983). Pilot evaluation of microscreens for algae removal in South Africa. Paper presented at the Biann. Conf. of the Inst. Water Pollut. Control, Southern African Branch, East London, 16-19 May 1983. CSIR (Council for Scientific and Industrial Research) (1989) Proceedings of a Short Course on Algae in Water: Problems and Treatment. DEEM AW AND. THORPE F (1939). Toxic algae in Colorado. J. Am. vet. med. Ass. 95 542-544. DE VRIES SE, GALEY FD, NAMIKOSHI M AND WOO JC (1993) Clinical and pathologic findings of blue-green algae (Microcystis aeruginosa) intoxication in a dog. J. Vet. Diagn. Invest. 5 403-408. DEPARTMENT OF WATER RESOURCES , PARAMATTA, NSW (1992) Blue-Green Algae: Final Report of the New South Wales Blue-Green Algae Task Force. EPA (United States Environmental Protection Agency) (1992) A Status Report on Planktonic Cyanobacteria (Blue-Green Algae) and Their Toxins. EPA/600/R-92/079. EDWARDS C, ANNADOTTER H AND CODD GA (1994) Cyanobacterial (blue-green algal) toxins in waterbodies and supply sources; Scientific Advances and Management Needs. In: Proc. of the Stockholm Water Symp. Integrated Measures to Overcome Barriers to Minimizing Harmful Fluxes from Land to Water. Stockholm. FALCONER I (ed) (1993) Algal Toxins in Seafood and Drinking Water. Academic Press. FITCH CP BISHOP LM AND BOYD WL (1934.) Cornell Vet. 24 30. FRITSCH FE (1918) Contributions to our Knowledge of the Freshwater Algae of Africa. 2. A first report on the freshwater algae, mostly from the Cape Peninsula, in the herbarium of the South African Museum. Ann. S. Afr. Mus. 9 483-611. FRITSCH FE (1959) The Structure and Reproduction of the Algae. Vol. 2. Third Edition. University Press.London. p. 27. FRITSCH FE AND STEPHENS E (1921) Contributions to our knowledge of the freshwater algae of Africa 3. Freshwater algae (exclusive of Diatoms), mainly from the Transkei territories, Cape Colony. Trans. R. Soc. S. Afr. 9 1-72.
150
FRITSCH FE AND RICH F (1924) Contributions to our knowledge of the freshwater algae of Africa 4. Freshwater and subaerial algae from Natal. Trans. R. Soc. S. Afr. 11 297-398. FRITSCH FE AND RICH F (1929) Contributions to our knowledge of the freshwater algae of Africa 7. Freshwater algae (exclusive of Diatoms) from Griqualand West. Trans. R. Soc. S. Afr. 18 1-92. FRITSCH FE AND RICH F (1937) Contributions to our knowledge of the freshwater algae of Africa 13 Algae from the Belfast Pan, Transvaal. Trans. R. Soc. S. Afr. 25 153-228. GORHAM PR (1962) Laboratory studies on the toxins produced by waterblooms of blue-green algae. Am. J. Public Health 52 2100 - 2105. GORHAM PR MCNICHOLAS S AND ALLEN EAD (1982) Problems encountered in searching for new strains of toxic planktonic cyanobacteria. S. Afr. J. Sci. 78 357-362. GUNN GJ (1992) Poison Cyanobacteria. In Pract. 132-133. HOCHMAN A, NISSANY A, WYNNE D, KAPLAN B AND BERMAN T (1986) Nitrate reductase: an improved assay method for phytoplankton. J. Plank. Res.8 385-392. HUNTER PR (1993) The relevance of cyanobacteria (blue-green algae) to public health. Culture 14 6-8. INGRAM WM AND PRESCOTT GW (1954) Toxic fresh-water algae. Am. Midl. Nat. 52 75-87. JACOBY JM, GIBBONS HL, HANOWELL R AND BOUCHARD DD (1994) Wintertime blue-green algal toxicity in a mesotrophic lake. J. Freshwater Ecol. 9 241-251. KELLERMAN TS AND COETZER JAW (1984) Hepatogenous photosensitivity diseases in South Africa. Technical Communication No. 193, Department of Agriculture, Pretoria. KHOJA T AND WHITTON BA (1971) Heterotrophic growth of blue-green algae. Arch. Mikrobiol. 79 280–282. KIVIRANTA J AND ABDEL-HAMEED A (1994) Toxicity of the blue-green alga Oscillatoria agardhii to the mosquito Aedes aegypti and the shrimp Artemia salina. World J. of Biotechnol. 10 517-520. KOMAREK J (1958) Die taxonomische Revision der Planktischen Blaualgen der Tschechoslowakei. In Algologische Studien by J. Komarek and M. Ettl. Prague, 10-206. KRINSKY NI (1966) The role of carotenoid pigments as protective agents against photosensitized oxidations in chloroplasts. In: Goodwin, TW (ed.) Biochemistry of Chloroplasts 1 423-430. Academic Press, London and New York. MDBMC (Murray Darling Basin Ministerial Council) (1994) The Algal Management Strategy. A component of the natural resources management strategy. MITCHELL SA (1989) The Effective Use of Water by Means of an Algal Aquaculture System. WRC Report 182/1/89. NRA (National Rivers Authority) (1990) Toxic Blue-Green Algae. NRA Water Quality Series No 2. NYGAARD G (1932) Contributions to our knowledge of the freshwater algae of Africa 9. Freshwater algae and phytoplankton from the Transvaal. Trans. R. Soc. S. Afr. 20 101-148. RaPALA J, LAHTO K, SIVONEN K AND NIEMELA SI (1994) Biodegradability and adsorption on lake sediments of cyanobacterial hepatotoxins and anatoxin-a. Letters in Appl. Microbiol. 19 423-428. RESSOM R, SAN SOONG F, FITZGERALD J, TURCZYNOWICZ L, EL SAADI O, RODER D, MAYNARD T AND FALCONER I (1993) Health Effects of Toxic Cyanobacteria. Report to the Environmental Health Standing Committee of the National Health and Medical Research Council. Adelaide, South Australia. REYNOLDS CS (1971) The ecology of the planktonic blue-green algae in the North Shropshire Meres. Field Studies 3 409-432. REYNOLDS CS (1987) Cyanobacterial Water Blooms. Adv. in Bot. Res. 13 67-141. REYNOLDS CS, OLIVER RL AND WALSBY AE (1987) Cyanobacterial dominance: the role of buoyancy regulation in dynamic lake environments. NZ J. of Mar. and Freshwater Res. 21 379-390. RICH F (1932) Contributions to our knowledge of the freshwater algae of Africa. 10. Phytoplankton from South African Pans and Vleis. Trans. R. Soc. S. Afr. 20 149-188.
151
RICH F (1935) Contributions to our knowledge of the freshwater algae of Africa. 11. Algae from a pan in Southern Rhodesia. Trans. R. Soc. S. Afr. 23 107-160. RINEHART KL, NAMIKOSHI M AND CHOI BW (1994) Structure and biosynthesis of toxins from blue-green algae (cyanobacteria). J. of Appl. Phycol. 6 159-176. SHAPIRO J (1968) Studies on the natural factors affecting phosphate absorbtion and its utilization by algae. Water Res. 2 21-23. SHAPIRO J (1973) Blue-green algae: Why they become dominant. Science 179 382-384. SHILLINGLAW SN (1980) Common Algae Found in South African Impoundments. Technical Report TR 106, Department of Environmental Affairs, Pretoria. STEFFENSON DA AND NICHOLSON BC (eds.) (1994) Toxic Cyanobacteria: Current Status of Research and Management. Proc. of an int. workshop, Adelaide, Australia, March 1994. STEIN JR AND BORDEN CA (1984) Causative and beneficial algae in human disease conditions: a review. Phycologia. 23 485-501. STElN DG, SCOTT WE, TOERIEN DF AND VISSER JH (1975) The eutrophication of some South African impoundments, I. Rietvlei Dam. Water SA 1 45-52. STElN DJ, TOERIEN DF AND VISSER JH (1975) Eutrophication levels of some South African impoundments. II. Hartebeespoort Dam. Water SA 1 93-101. SUBRAMANIAN G, SEKAR S AND SAMPOORNAM S (1994) Biodegradation and utilization of organophosphorus pesticides by cyanobacteria. Int. Biodeterior. and biodegradation 33 129-143. TENCALLA FG, DIETRICH DR AND SCHLATTER C (1994) Toxicity of Microcystis aeruginosa peptide toxin to yearling rainbow trout (Oncorhynchus mykiss). Aquatic Toxicol. 30 215-224. VAKERIA D, CODD GA, BELL SG, BEATTIE, KA and PRIESTLY IM (1985) Toxicity and extrachromosomal DNA in strains of the cyanobacterium Microcystis aeruginosa. FEMS Microbiol. Letters 29 69-72. WAALAND JR, WAALAND SD AND BRANTON D (1971) Gas vacuoles. Light and shielding in blue-green algae. J. Cell. Biol. 48 212-215. WALMSLEY RD AND TOERIEN DF (1975) Algal bioassays and nitrogen fixation. S. Afr. J. Sci. 71 313-314. WALMSLEY RD AND ASHTON PJ (1977) Algal growth potential and the succession of algae in a nitrogen-limited impoundment. S. Afr. J. Sci. 73 151-152. WALMSLEY RD, TOEREIN DF AND STEIJN DJ (1978) Eutrophication of four Transvaal Dams. Water SA 4 61-75. WALSBY AE (1987) Mechanisms of buoyancy regulation by planktonic cyanobacteria with gas vesicles. In: Fay P and Van Baalen C (eds.) The Cyanobacteria. Elsevier, Amsterdam. WELSH H (1961) Some new and interesting cyanophytes from the Transvaal, South Africa. Nova Hedwigia III 2 399-404. WELSH H (1962) Some new cyanophytes from Southern Africa. Revue Algologique 3 227-233 WELSH H (1964) A contribution to our knowledge of the blue-green algae (Cyanophyceae, Schizophyceae, Myxophyceae) of South West Africa. Nova Hedwigia. 7 15-32 plus 4 plates. WELSH H (1965) A contribution to our knowledge of the blue-green algae of South West Africa and Bechuanaland. Nova Hedwigia. 9 131-162 plus 4 plates. WEST GS (1912) Freshwater algae. Ann. S. Afr. Mus. 9 61-90 plus 2 plates. WILDMAN RB, BENNER BL, HELD DD AND SCHAUBERGER CW (1975) Influence of blue-green algae on the pH and buffer capacity of culture media. Iowa Acad. Sci. Proc. 81 192 -196. WHO (World Health Organization) (1999) Toxic Cyanobacteria in Water: A Guide to their Public Health Consequences, Monitoring and Management (Chorus, I and J. Bartram, eds.) E and F Spon Publishing, London. WHITTON BA AND POTTS M (2000) The Ecology of Cyanobacteria: Their Diversity in Time and Space. Kluwer Academic Publishers.
152
9. SUPPORTING REFERENCES AS CITED IN THE TEXT Zooplankton community grazing in a hypertrophic lake (Hartbeespoort Dam, South Africa). (Jarvis, 1986). GLIWICZ ZM (1977) Food size selection and seasonal succession of filter feeding zooplankton in an eutrophic lake. Ekol. Pol. 25 179-225. GLIWICZ, ZM (1980) Filtering rates and food size selection in cladocerans – another aspect of interspecific competition in filter feeding zooplankton. In: Kerfoot WC (ed.) Evolution and Ecology of Zooplankton Communities. University Press of New England. 282-291. LAMPERT, W (1982) Further studies on the inhibitory effect of the toxic blue-green Microcystis aeruginosa on the filtering rate of zooplankton. Arch. Hydrobiol. 95 207-220. PORTER KG AND MCDONOUGH R (1984) The energetic cost of response to blue green algae filaments by cladocerans. Limnol. Oceanogr. 29 365-369. WEBSTER KE AND PETERS RH (1978) Some size dependent inhibitions of larger cladoceran filterers in filamentous suspensions. Limnol. Oceanogr. 23 1238-1245. Plasmid involvement in Microcystis aeruginosa toxicity (Hauman, 1981) HIROTA Y (1960) The effect of acridine dyes on mating type factors in E. coli. Proc. Nat. Acad. Sci. USA 46 57-64. EKLUND MW AND POYSKY FT (1973) Bacteriophages and toxigenicity of Clostridium botulinum. In: Hobbs BC and Christian JHB (eds.) The Microbiological Safety of Food. Academic Press, London. MITCHELL I DE G AND KENWORTHY R (1977) Attempted elimination of plasmid-determined haemolysin, K88 antigen and enterotoxin from E.coli pathogenic for pigs. J.Appl.Bacteriol. 42 207-212. SAGER R (1962) Streptomycin as a mutagen for nonchromosomal genes. Proc. Nat. Acad. Sci.USA. 48 2018-2026. SONSTEIN SA AND BALDWIN JN (1972) Loss of the penicillinase plasmid after treatment of Staphylococcus aureus with sodium dodecyl sulphate. J. Bacteriol. 109 262-265. TOMOEDA M, INUZUKA M, KUBO N AND NAKAMURA S (1968) Effective elimination of drug resistance and sex factors in E. coli by sodium dodecyl sulphate. J. Bacteriol. 95 1078-1089. VANCE BD (1977) Prophage induction in toxic Microcystis aeruginosa NRC-1. J. Phycol. 13 70. YAMAGATA H AND UCHIDA H (1969) Effect of acridine orange on sex factor multiplication in E.coli. J.Mol.Biol. 46 73-84. Microcystis aeruginosa toxin: cell culture toxicity, hemolysis, and mutagenicity assays (Grabow et al. 1982) CARMICHAEL WW AND BENT PE (1981) Haemagglutination method for detection of freshwater cyanobacteria (blue-green algae) toxins. Appl. Environ. Microbiol. 41 1383-1388. COLLINS M (1978) Algal toxins. Microbiol. Rev. 42 725-746. FALCONER IR, JACKSON ARB, LANGLEY J AND RUNNEGAR MT (1981) Liver pathology in mice in poisoning by the blue-green alga Microcystis aeruginosa. Aust. J. Biol. Sci. 34 179-187. GORHAM PR AND CARMICHAEL WW (1979) Phycotoxins from blue-green algae. Pure Appl. Chem. 52 165-174. KIRPENKO YA, STANKEVICH VV, ORLOVSKY VM, KIRPENKO NI, BOKOV AV AND KARPENKO TF (1979) A comparative assessment of the toxic effect of biologically
153
active substances of blue-green algae at the cellular and organismic levels. Hydrobiol. J. 15 83-86. MURTHY JR AND CAPINDALE JB (1970) A new isolation and structure for the endotoxin from Microcystis aeruginosa NRC-1. Can. J. Biochem. 48 508-510. TOERIEN DF, SCOTT WE AND PITOUT MJ (1976) Microcystis toxins: isolation, identification, implications. Water SA 2 160-162. TUSTIN RC, VAN RENSBURG SJ AND ELOFF JN (1973) Hepatic damage in the primate following ingestion of toxic algae, p.383-385. In: Saunders SJ and Terblanche J (eds.) Liver. Pitman Medical Books, London. The photooxidation of laboratory cultures of Microcystis under low light intensities (Eloff, 1978). ABELIOVICH A AND SHILO M (1972) Photooxidative death in blue-green algae. J. Bacteriol. 111 682-689. ALLINSON FE, HOOVER SR AND MORRIS HJ (1937) Physiological Studies with the nitrogen-fixing alga Nostoc muscorum. Bot. Gaz. 98 433-463. ZEHNDER A AND GORHAM PR (1960) Factors influencing the growth of Microcystis aeruginosa Kutz. emend Elenkin. Can. J. Microbiol. 6 645-659. Photooxidation of cyanobacteria in natural conditions (Eloff et al. 1976) ABELIOVICH A, KELLENBERG D AND SHILO M (1974) Effect of photooxidative conditions on levels of superoxide dismutase in Anacystis nidulans. Photochem. Photobiol. 19 379-382. ABELOVICH A AND SHILO M (1972) Photooxidative death in blue-green algae. J. Bacteriol. 111 682-689. Effect of phosphate concentration on the fine structure of the cyanobacterium, Microcystis aeruginosa Kutz. Emend. Elenkin (Barlow et al. 1979) ALLEN MM (1968) Simple conditions for growth of unicellular blue-green algae on plates. J. Phycol. 4 1 - 4. HAROLD FM (1960) Accumulation of inorganic polyphosphate in mutants of Neurospora crassa. I. Relationship to growth and nucleic acid synthesis. Biophys. Acta. 45 172-188. SICKO-GOAD L, JENSEN TE and AYALA RP (1978) Phosphate metabolism in blue-green algae. II. Chnages in phosphate distribution during starvation and the ‘polyphosphate overplus’ phenomenon in Plectonema boryanum. Can. J. Microbiol. 24 105-108. SIMON RD (1971) Cyanophycin granules from the blue-green alga Anabaena cylindrica: A reserve material consisting of co-polymers of aspartic acid and arginine. Proc. natn. Acad. Sci. USA. 68 265-267. STEWART, WDP (1972) Algal metabolism and water pollution in the Tay Region. Proc. Roy. Soc. Edinb. 71 209-224. STEWART WDP and CODD GA (1975) Polyhedral bodies (carboxysomes) of nitrogen-fixing blue-green algae. Br. phycol. J. 10 273-278.
154
Cyanobacterial biocontrols (Scott and Chutter, 1980). BADER FG, TSUCHIYA HM AND FREDERICKSON AG (1976a) Grazing of ciliates on blue-green algae: Effects of ciliate encystment and related phenomena. Biotechnol.Bioeng. 18 311-332. BADER FG, TSUCHIYA HM AND FREDERICKSON AG (1976b) Grazing of ciliates on blue-green algae: Effects of light shock on the grazing relation and on the algal population. Biotechnol.Bioeng. 18 333-348. CANTER HM (1950) Fungal parasites of the phytoplankton I. Ann. Bot. Lond, N.S. 14 263-289. CANTER HM (1951) Fungal parasites of the phytoplankton II. Ann. Bot. Lond, N.S. 15 129-156. CANTER HM (1954) Fungal parasites of the phytoplankton III. Tans. Brit. Mycol. Soc. 37 111-133. CANTER HM AND LUND JWG (1968) The importance of Protozoa in controlling the abundance of planktonic algae in lakes. Proc. Linn. Soc. Lond. 179 203-219. COLE GT AND WYNNE MJ (1974) Endocystosis of Microcystis aeruginosa by Ochromonas danica. J. Phycol. 10 397-410. DODDS JA (1979) Viruses of marine algae. Experientia. 35 440-442. GLIWICZ ZM AND HILLBRICHT-ILKOWSKA A (1972) Efficiency of the utilisation of nannoplankton primary production by communities of filter feeding animals measured in situ. Verh. Int. Ver. Limnol. 18 197-203. HEUSSLER P, CASTILLO SJ AND MERINO MF (1978) Parasite problems in the outdoor cultivation of Scenedesmus. Ergebn. Limnol. 11 223-227. HOFFMAN LR AND STANKER LH (1976) Virus-like particles in the green alga Cylindrocapsa. Can. J. Bot. 54 2827-2841. LEMKE, PA (1976) Viruses of eukaryotic microorganims. Ann. Rev. Microbiol. 30 105-145. PADAN AND SHILO (1973) Cyanophages – Viruses attacking blue-green algae. Bact. Rev. 37 343-370. STEWART JR AND BROWN RM (1971) Algicidal non fruiting myxobacteria with high G + C ratios. Arch. Mikrobiol. 80 170–190. STEWART JR AND BROWN RM (1969) Cytophaga that kills or lyses algae. Science. 164 1523-1524. UHLMANN D (1971) Algicidal non-fruiting myxobacteria with high G + C ratios. Arch. Mikrobiol. 80 170-190. The feasibility of managing the nitrogen to phosphorous ratio in the Hartbeespoort Dam as a means of controlling Microcystis scums (Conradie and Quibell, 1992). BIERMAN VJ, VERHOFF FH, POULSEN TL AND TENNEY MW (1974) Multinutrient dynamic models of algal growth and species competition in eutrophic lakes. In: Modelling the eutrophication process. Ann Arbor Science Publishers, Ann Arbor, Michigan. DE NOYELLES F AND O’BRIEN WJ (1978) Phytoplankton succession in nutrient enriched experimental pondss as related to changing carbon, nitrogen and phosphorous conditions. Arch. Hydrobiol. 84 137-165. NOVAK JT AND BRUNE DE (1985) Inorganic carbon limited growth kinetics of some freshwater algae. Water Res. 19 215-225. RHEE GY AND GOTHAM IJ (1980) Optimum N:P ratios and coexistence of planktonic algae. J. Phycol. 16 281-286.
155
NIWR Hartbeespoort Dam Study Ecological problems in Hartbeespoort Dam (Jarvis, 1987). BARICA J. (1981) Hypertrophy – the ultimate stage of eutrophication. Water Qual. Bull. 6 95-98; 155-156. HANAZATO T AND YASUNO, M (1987) Evaluation of Microcystis as a food for zooplankton in a eutrophic lake. Hydrobiologia 144 251-259. JARVIS AC (1986) Zooplankton community grazing in a hypertrophic lake (Hartbeespoort Dam, South Africa). J. Plankton Res. 8 1065-1078. NIWR (NATIONAL INSTITUTE FOR WATER RESEARCH) (1985) The Limnology of Hartbeespoort Dam. South African National Scientific Programmes Report N. 110, CSIR, Pretoria, RSA. ROBARTS RD (1984) Factors controlling primary production in a hypertrophic lake (Hartbeespoort Dam, South Africa). J. Plankton Res. 6 91-105. ROBARTS RD AND ZOHARY T (1984) Microcytis aeruginosa and underwater light attenuation in a hypertrophic lake (Hartbeespoort Dam, South Africa). J. Ecol. 73 1001-1017. ROBARTS RD AND ZOHARY T (1986) The influence of a cyanobacterial hyperscum on the heterotrophic activity of planktonic bacteria in a hypertrophic lake. Appl. Environ. Microbiol. 51 609-613. SCHINDLER JE (1971) Food quality and zooplankton nutrition. J. Anim. Ecol. 40 589-595. ZOHARY T (1985) Hyperscums of the cyanobacterium Microcystis aeruginosa in a hypertrophic lake (Hartbeespoort Dam, South Africa). J. Plankton Res. 7 399-409. Vaal River investigations Nutrient availability: phosphatase and nitrate reductase activity in the Vaal River and its phytoplankton (Coetzee and Pieterse pp 185–197). HOCHMAN A, NISSANY A, WYNNE D, KAPLAN B AND BERMAN T (1986) Nitrate reductase: an improved assay method for phytoplankton. J. Plank. Res. 8 385-392. JONES JG (1972) Studies on the freshwater micro-organisms. Phosphatase activity in lakes of differing degrees of eutrophication. J. Ecol. 60:777-791. POLLINGER U AND SERRUYA C (1976) Phased division of Peridinium cinctum fa westii and the development of the blooms in Lake Kinneret. J. Phycol 11 155-162. WYNNE D (1981) The role of phosphatase in the metabolism of Peridium cinctum from Lake Kinneret. Hydrobiol. 83 93-99. WYNNE D AND BERMAN T (1990) The influence of environmental factors on nitrate reductase activity in freshwater phytoplankton. Hydrobiol. 194 235-243.
Health aspects of eutrophication (Scott et al. 1985).
PILKINGTON NH AND VAN VUUREN LRJ (1981) Formation of trihalomethanes during chlorination of algae laden surface waters. Paper presented at the Australian Water and Wastewater Assoc. Perth, April 1981, 7 p. (CSIR Reprint RW 812). SCOTT WE (1985) Examination of toxic and non-toxic Microcystis aeruginosa in the field and laboratory culture. In: Steyn PS and Vlegaar R (eds.) Mycotoxins and Phycotoxins, Elsevier Science Publishers, Amsterdam.
156
Umgeni Water investigations BOWNER KH, PADOVAN A; OLIVER RL; KORTH W AND GANF GG (1992) “Physiology of Geosmin Production by Anabaena circinalis Isolated from the Murrumbidgee River, Australia”, Water. Sci. Technol. 25 259-267. DICKENS CWS, GRAHAM PM AND FREESE S (1996) Algae rupture during abstraction from reservoirs and the consequences for water treatment. Water Research Commision Report No. 558/1/96. DICKENS CWS AND GRAHAM PM (1995) The Rupture of Algae During Abstraction from a Reservoir and the Effects on Water Quality. J Water SRT-Aqua 44 29-37. FREESE SD, JUBY GJG AND TROLLIP D (1996) “The Effect of Pre-Ozonation of a Eutrophic Water and the Subsequent Treatment Implications”. Paper presented at the IOA Conf. Sydney, Australia. FREESE SD, JUBY GJG AND TROLLIP D (1996) “The Influence of High Concentrations of Cyanobacteria on the By-Products Produced after Pre-Oozonation of Surface Water”. Paper presented at the WISA Biannual Conf. Port Elizabeth. GRAHAM PM, DICKENS CWS AND MBOWA S (1998) Modelling the Water Quality in Impoundments within the Umgeni Water Operational Area and the Consequences for Potable Water Treatment Costs. WRC Report No, 615/1/98. NEWMAN J (1995) Control of Algae with Straw. CAPM, Long Ashton Research Station, Reading, UK. PRYOR MJ AND FREESE SD (2000) “The Treatment of Eutrophic Water Using Pre- and Intermediate Ozonation, Peroxone and PICA Carbon”. WRC Report No. 694/1/00. RAE B, MOOLLAN RW AND CLARK RC (1999) Algal toxins in drinking water supplies. WRC Report No. 549/1/99. VAN STEENDEREN RA, SCOTT WE AND WELCH DI (1988) “Microcystis aeruginosa as an Organohalogen Precursor” Water SA 14 59-62. WNOROWSKI AU AND SCOTT WE (1992) “Incidence of Off-Flavours in South African Waters”. Water. Sci. Technol. 25 225-232.
157
10. BIBLIOGRAPHY ABELOVICH A AND SHILO M (1972) Photo-oxidative death in blue-green algae. J. Bact. 111 682-689. ALLANSON BR AND GIESKES JMTM (1961) An investigation into the ecology of polluted inland waters in the Transvaal. Hydrobiologia. 18 79-94. ALLEN MM (1968) Simple conditions for growth of unicellular blue-green algae on plates. J. Phycol. 4 1 - 4. AMANN MJ AND ELOFF JN (1980) Preliminary study of the toxins of different Microcystis strains. S. Afr. J. Sci. 76 419-420. ASHTON PJ (1976) Nitrogen fixation in a nitrogen-limited impoundment. J. Water Pollut. Control Fed. 51 570-579. ASHTON PJ (1981) Nitrogen fixation and the nitrogen budget of a eutrophic impoundment. Wat. Res. 15 823-833. ASHTON PJ AND ROBARTS RD (1987) Apparent predation of Microcystis aeruginosa Kátz. Emend Elenkin by a Saprospira-like bacterium in a hypertrophic Lake (Hartebeespoort Dam, South Africa). J. Limnol. Soc. sth. Afr. 13 44-47. AUCAMP PJ, PIETERSE SA AND VIVIER FS (1987) Health Problems of Hartbeespoort Dam. Foundation for Research and Development. Ecosys. Prog. Occ. Rep. 25 83-93. BARLOW DJ (1978) The Fine Structure of the Cyanobacterium Microcystis aeruginosa Kutz. emend. Elenkin in Natural and Controlled Environments. M.Sc. Thesis, University of Pretoria. BARLOW DJ, SCOTT WE AND FUNKE IF (1977) Fine structural changes in response to different light intensities in cultured Microcystis aeruginosa. Proc. Electron Microsc. Soc. S. Afr. 7 105-106. BARLOW DJ; VAN RENSBURG WLJ; PIETERSE AJH AND ELOFF JN (1979) Effect of phosphate concentration on the fine structure of the cyanobacterium Microcystis aeruginosa Kutz. emend. Elenkin. J. Limnol. Soc. sth. Afr. 5 79-83. BISHOP CT, ANET EFLJ AND GORHAM PR (1959) Isolation and identification of the fast-death facto in Microcystis aeruginosa NRC-1. Can. J. Biochem. Physiol. 37 453. BOTES DP (1986) Cyanoginosins - Isolation and structure. In: Steyn PS and Vlegaar R (eds.) Mycotoxins and Phycotoxins. Elsevier Science Publishers, Amsterdam, 161-167. BOTES DP, VILJOEN CC, KRUGER H, WESSELS PL AND WILLIAMS DH (1982a) Structure of toxins of the blue-green alga Microcystis aeruginosa. S. Afr. J. Sci. 78 378. BOTES DP, VILJOEN CC; KRUGER H; WESSELS PL AND WILLIAMS DH (1982b) Configuration assignments of the amino acid residues and the presence of N-methyldehydroalanine in toxins from the blue-green alga, Microcystis aeruginosa. Toxicon. 20 1037-1042. BOTES DP, KRUGER H AND VILJOEN CC (1982c) Isolation and charactersitics of four toxins from the blue-green alga, Microcystis aeruginosa. Toxicon, 20 945-954. BOTES DP, VILJOEN CC, KRUGER H, WESSELS PL AND WILLIAMS DH (1982d) Structure of toxins of the blue-green alga Microcystis aeruginosa. S. Afr. J. Sci. 78 378. BOTES DP, TUINMAN AA, WESSELS PL, VILJOEN CC, KRUGER H, WILLIAMS DH, SANTIKARN S, SMITH RJ AND HAMMOND SJ (1984) The structure of cyanoginosin-LA, a cyclic heptapeptide toxin from the cyanobacterium Microcystis aeruginosa. J. chem. Soc. Perkin Trans. I, 1984 2311-2318. BOTES DP, WESSELS, PL, KRUGER H, RUNNEGAR MTC, SANTIKARN S, SMITH RJ, BARNA JCJ AND WILLIAMS DH (1985) Structural studies on cyanoginosins-LR, -YR, -YA and -YM, peptide toxins from Microcystis aeruginosa. J. chem. Soc. Perkin Trans. I. 1985 2747-2748. CANABAEUS L (1929) Uber die Hereocysten und Gasvakuolen der Blaualgen. Kolkwitz’s Planzenforsch. 13 1-48.
158
CHUTTER FM AND ROUSSOW JN (1992) The Management of Phosphate Concentrations and Algae in Hartbeespoort Dam. Contract Report to the Water Research Commission. Report No 289/1/92. CODDGA AND BELL SG (1998) Toxic Cyanobacteria: The Global View. In: Proc. of the 1998 WaterTECH Meet. Brisbane, Australia. AWWA. 1-14. CODD GA, JEFFRIES TM, KEEVIL CW AND POTTER E (1994) Detection Methods for Cyanobacterial Toxins. Royal Society of Chemistry. COMBRINK S (1994) The zooplankton of Zeekoevlei and Princess Vlei (western Cape) – a preliminary assessment. Water SA 20 299-306. COMMISSION FOR INQUIRY INTO WATER MATTERS (1970) Report No. RP. 34/1970, Government Printer, Pretoria. COMPéRE P, KOMAREK J, WALMSLEY RD, AND BARLOW DJ (1979) Katagnymene mucigera, a new planktonic blue-green alga from South Africa. Bulletin Jardin Botanique National de Belgique (Brussels) 49 383-391. CONNELL JH (1978) Diversity in tropical rain forests and coral reefs. Science 199 1302-1310. CONRADIE E AND QUIBELL GE (1992) The feasibility of managing the nitrogen to phosphorous ratio in the Hartbeespoort Dam as a means of controlling Microcystis scums. N/A210/02/DEQ0492. DWAF (Department of Water Affairs and Forestry) (1998) Assessment of the Implementation of the Phosphate Standard at the Baviaanspoort and Zeekoegat Water Care Works. Institute for Water Quality Studies Report N/A230/01/DEQ0797). DE MOOR F AND SCOTT WE (1985) Digestion of Microcystis aeruginosa by Oreochromis Mossambicus. J. Limnol. Soc. sth. Afr. 11 14-19. DE WET FJ (1980) Flotation (sic) of Algal Waters. Occasional paper produced by the Institute of Water Pollution Control (Southern African Branch). DE WET JS (1979) Die groei van Microcystis met aminosure as stikstofbron. M.Sc. Thesis, University of the Orange Free State, Bloemfontein. DICKENS CS AND SLATTER NP (1992) Algae penetration of a waterworks: the problem and the solution. Municipal Engineer 13-17. ELENKIN AA (1949) Monographia algarum Cyanophycearum aquidulcium et terrestrium in finibus U.R.S.S. inventarum. Pars specialis 2 989-1909. ELLEMAN TC, FALCONER IR, JACKSON ARB AND RUNNEGAR MT (1978) Isolation, characterization and pathology of the toxin from a Microcystis aeruginosa (= Anacystis cyanea) bloom. Aust. J. Biol. Sci. 31 209. ELOFF JN (1977) The absorption of oxygen from liquid cultures of blue-green algae by alkaline pyrogallol. J. Limnol. Soc. sth. Afr. 3 13-16. ELOFF JN (1978) The photooxidation of laboratory cultures of Microcystis under low light intensities. Proc. Third Int. Symp. Environm. Biogeochem. Wolfenbuttel. ELOFF JN (1981) Autecological studies on Microcystis. In: Carmichael, WW (ed.). The Water Environment: Algal Toxins and Health, Plenum Press, New York. 71-96. ELOFF JN (1982) A specific ultraviolet absorbance band of Microcystis aeruginosa toxins. J. Limnol. Soc. sth. Afr. 8 5-7. ELOFF JN, STEINITZ Y AND SHILO M (1976) Photooxidation of Cyanobacteria in natural conditions. Appl. Environm. Microbiol. 31 119-126. ELOFF JN AND VAN DER WESTHUIZEN AJ (1981) Toxicological studies on Microcystis. In: Carmichael WW (ed.) The Water Environment: Algal Toxins and Health. Plenum Press, New York. 343-364. ELOFF JN, KRUGER GHJ AND VAN DER WESTHUIZEN AJ (1980) A comparison of multiple container and tubular systems for the large scale laboratory culture of unicellular algae. J. Limnol. Soc. sth. Afr. 6 93-95. ELOFF JN, SIEGELMANN HW AND KYCIA H (1982a) Amino acid sequence of two toxic peptides from Microcystis aeruginosa UV-006. S. Afr. J. Sci. 78 377. ELOFF JN, SIEGELMAN HW AND KYCIA H (1982b) Comparative study on the toxins for several Microcystis aeruginosa isolates. S. Afr. J. Sci. 78 377.
159
ELOFF JN, SIEGELMANN HW AND KYCIA H (1982c) Extraction, isolation and stability of toxins from Microcystis aeruginosa. S. Afr. J. Sci. 78 377. FRANCIS G (1878) Poisonous Australian lake. Nature 18 11-12. GATHERCOLE PS AND THIEL PG (1987) Liquid chromatographic determination of the cyanoginosins, toxins produced by the cyanobacterium Microcystis aeruginosa. J. Chromatogr. 408 435-440. GERLOFF GC, FRITZGERALD GP AND SKOOG F (1950) Isolation, purification and nutrient solution requirements of blue-green algae. In: Brunel J, Prescott GW and Tiffany LH (eds.) The Culturing of Algae. Charles F. Kellering Foundation, Yellow Springs, Ohio. 27-44. GOW CE (1981) Unusual occurrence of biogenic (cyanobacterial) carbonate sediments for a sinkhole lake in the western Transvaal, South Africa. S. Afr. J. Sci. 77 564-565. GRABOW WOK, DU RANDT WC, PROZESKY OW AND SCOTT WE (1982) Microcystis aeruginosa toxin: Cell culture toxicity, hemolysis, and mutagenicity assays. Appl. environ. Microbiol. 43 1425-1433. HARDING WR (1991) The Ecology of Some Urban-Impacted Coastal Vleis on the Cape Flats near Cape Town, with Special Reference to Phytoplankton Periodicity. M.Sc Thesis, Department of Zoology, University of Cape Town. HARDING WR (1992a) A contribution to the knowledge of South African coastal vleis: The limnology and phytoplankton periodicity of Princess Vlei, Cape Peninsula. Water SA 18121-130. HARDING WR (1992b) Zeekoevlei – Water chemistry and phytoplankton periodicity. Water SA 18 237-246. HARDING WR (1994) Water quality trends and the influence of salinity in a highly regulated estuary near Cape Town, South Africa. S. Afr. J. Sc. 90 240-246. HARDING WR (1996) The Phytoplankton Ecology of a Hypertrophic, Shallow Lake, with Particular Reference to Primary Production, Periodicity and Diversity. Unpublished PhD thesis, Department of Zoology, University of Cape Town. HARDING WR (1997a) New regional emergence of cyanobacterial toxicosis. Harmful Algae News 16 12-13. HARDING WR (1997b) Phytoplankton primary production in a shallow, well-mixed, hypertrophic South African lake. Hydrobiologia 344 87-102. HARDING WR (1998) Magnification of cyanobacterial (Microcystis aeruginosa) hepatotoxins, produced in a hypertrophic freshwater coastal wetland, by marine filter feeders (Choromytilus meridionalis). Internat. Verein. Limnol. 27 (in press). HARDING WR (1999) Saving a wetland and a marine mussel resource impacted by cyanobacterial toxins. Harmful Algae News 18 11. HARDING WR AND THORNTON JA (1997) Eutrophication in African Lakes with particular reference to phosphorus loading. Paper presented at the Fifth Session of CIFA Working Party on Pollution and Fisheries, Accra, Ghana, 16-19 December 1997. Rome, FAO/FIR, 22pp and tables. HARDING WR AND WRIGHT S (1999) Initial findings regarding changes in phyto- and zooplankton composition and abundance following the temporary drawdown and refilling of a shallow, hypertrophic South African coastal lake. J. Lake and Reservoir Manage. 15 47-53. HARDING WR, ROWE N, WESSELS JC, BEATTIE KA AND CODD GA (1995) Death of a dog attributed to the cyanobacterial (blue-green algal) hepatotoxin nodularin in South Africa. J. S. Afr. Vet. Assoc. 66 256-259. HAUMAN JH (1981a) Is a plasmid(s) involved in the toxicity of Microcystis aeruginosa? In Carmichael WW (ed.) The Water Environment: Algal Toxins and Health. Plenum Press, New York. 97-102. HAUMAN JH (1981b) A Molecular Biological Characterisation of Microcystis aeruginosa Kutz. emend. Elenkin. M.Sc. Thesis, University of Pretoria. HEARN CJ (1995) Water exchange between shallow estuaries and the ocean. In: Eutrophic Estuaries and Shallow Lagoons (AJ McComb, ed.) CRC Press. HOFFMAN JRH (1976) Removal of Microcystis toxins in water purification processes. Water SA 2 58-60.
160
HUGHES EO, GORHAM PR AND ZEHNDER A (1958) Toxicity of a unialgal culture of Microcystis aeruginosa. Can. J. Microbiol. 4 225-236. HUMPHRIES S AND IMBERGER J (1982) The influence of internal structure and dynamics of Burrinjuck Reservoir on phytoplankton blooms. Report of the Centre for Water Research, University of Western Australia. ED-82-023. JARVIS AC (1986) Zooplankton community grazing in a hypertrophic lake (Hartbeespoort Dam, South Africa). J. Plankton Res. 81065-1078. JARVIS AC (1987) Ecological problems in Hartbeespoort Dam. Symposium on Hartbeespoort Dam: Quo vadis? J. Limnol. Soc. sth. Afr. 14 82-86. JOCHIMSEN EM, CARMICHAEL WW, JISI AN, CARDO D, COOKSON ST, HOLMES CEM, ANTUNES B DE C, DE MELO FILHO AD, LYRA TM, BARRETO VST, AZEVEDO SMFO AND JARVIS WR (1998) Liver failure and death after exposure to microcystins at a hemodialysis center in Brazil. New Eng. J. Med. 338 873-878. JUTTNER F (1971) Massensucht photogropher organismes in einer automatischen Kulturanlage. Arch. Mikrobiol. 77 275-280. KFIR R, JOHANNSEN E AND BOTES DP (1985) Preparation of anticyanoginosin-LA monoclonal antibody. In: Steyn PS and Vlegaar R (eds.) Mycotoxins and Phycotoxins, Elsevier Science Publishers, Amsterdam.377-385. KFIR R, JOHANNSEN E AND BOTES DP (1986) Monoclonal antibody specific for cyanoginosin-LA: preparation and characterisation. Toxicon 24 543-552. KIRPENKO UA, PEREVOZCHENKO II, SIRENKO KA AND LUKIND LF (1975) Isolation of toxin from blue-green algae biomass and some of its physicochemical properties. Dopov. Akad. Nauk. ukr. RSR Ser. B. 359. KRÜGER GHJ (1978) The Effect of Physico-Chemical Factors on Growth Relevant to the Mass Culture of Mycrocystis (sic). Ph.D. Thesis, University Orange Free State, South Africa. KRÜGER GHJ AND ELOFF JN (1977) The influence of light intensity on the growth of different Microcystis isolates. J. Limnol. Soc. sth. Afr. 3 21-25. KRÜGER GHJ AND ELOFF JN (1978a) Defined algal production systems - culture of Microcystis. In: Grobbelaar JU, Soeder CJ and Toerien DF (eds.) Acta Academica, University of the Orange Free State, Bloemfontein. KRÜGER GHJ AND ELOFF JN (1978b) Mass culture of Microcystis under sterile conditions. J. Limnol. Soc. sth. Afr. 4 119-124. KRÜGER GHJ AND ELOFF JN (1978c) The effect of agitation and turbulence of the growth medium on the growth and viability of Microcystis. J. Limnol. Soc. sth. Afr. 4 69-74. KRÜGER GHJ AND ELOFF JN (1978d) The effect of temperature on specific growth rate and activation energy of Microcystis and Synechococcus isolates relevant to the onset of natural blooms. J. Limnol. Soc. sth. Afr. 4 9-20. KRÜGER GHJ AND ELOFF JN (1979a) Chemical changes in the growth medium of Microcystis batch cultures grown at stress and non-stress light intensities. J. Limnol. Soc. sth. Afr. 5 11-16. KRÜGER GHJ AND ELOFF JN (1979b) The interaction between cell density of Microcystis batch cultures and light induced stress conditions. Z. Pflanzenphysiol. 95 441-447. KRÜGER GHJ AND ELOFF JN (1981) The effect of physico-chemical factors on growth relevant to the mass culture of axenic Microcystis. In: Carmichael WW (ed.) The Water Environment: Toxins and Health. Plenum, New York. 193-222. KRÜGER GHJ AND ELOFF JN (1982) Role of CO2 in culture of axenic Microcystis for isolation of the toxin. S. Afr. J. Sci. 78 376. KRÜGER GHJ AND JUTTNER F (1980) Carbon metabolism in Microcystis under low light intensities. J. gen. Microbiol. 119 27-30. KRÜGER GHJ, ELOFF JN AND PRETORIUS JA (1981) Morphological changes in toxic and non-toxic Microcystis isolates at different irradiance levels. J. Phycol. 17 52-56. KULLBERG RG (1977) The effects of some ecological factors on cell size of the hot spring alga Synechococcus lividus (Cyanophyta). J. Phycol. 13 111 -115.
161
LAWTON LA, EDWARDS C AND CODD GA (1994) Extraction and high performance liquid chromatographic method for the determination of microcystins in raw and treated waters. The Analyst 119 1525-1529. LANGENEGGER O (1985) New developments in floatation for drinking water. Paper presented at the Symposium on Recent Developments in Drinking Water Purification. CSIR, Pretoria. LEMMERMANN E (1910) Algen I. Schizophyceen. In: Kryptogamenflora dr Mark Brandenburg, Bd. III, Leipzig. 1-256. LOUW PGJ (1950) The active constituent of the poisonous algae, Mycrocystis (sic) toxica Stephens. S. Afr. Ind. Chem. 4 62-66. MDBMC (Murray Darling Basin Ministerial Council, Australia) (1994) The Algal Management Strategy. A component of the natural resources management strategy. MAYNARD T AND FALCONER I (1993) Health Effects of Toxic Cyanobacteria. Report to the Environmental Health Standing Committee of the National Health and Medical Research Council. Adelaide, South Australia. MCCOMB AJ AND LUKATELICH RJ (1995) The Peel-Harvey Estuarine System, Western Australia. In: Eutrophic Estuaries and Shallow Lagoons McComb AJ (ed.) CRC Press. MOSS B (1990) Engineering and biological approaches to the restoration from eutrophication of shallow lakes in which aquatic plant communities are important components. Hydrobiologia 200/210 367-377. MURTHY JR AND CAPINDALE JB (1970) A new isolation and structure for the endotoxin from Microcystis aeruginosa NRC-1. Can. J. Biochem. 48 508. NIWR (NATIONAL INSTITUTE FOR WATER RESEARCH) (1985). The Limnology of Hartebeespoort Dam. South African National Scientific Programmes Report 110, Pretoria. NRA (National Rivers Authority, United Kingdom) (1990) Toxic Blue-Green Algae. NRA Water Quality Series No 2. PIETERSE AJH (1986) Aspects of the ecology and significance of algal populations of the Vaal River. Paper presented at the Vaal River Ecosystem: Status and Problems Symp. Foundation for Research and Development, Ecosystem Programmes, CSIR, Pretoria. Occasional Report 5. 175-199. PIETERSE AJH (1987) Observations on temporal trends in phytoplankton diversity in theVaal River at Balkfontein, South Africa. J. Limnol. Soc. sth. Afr. 13 1-6. PIETERSE AJH AND JANSE VAN VUUREN S (1997) An Investigation into the Phytoplankton Blooms in the Vaal River and the Environmental Variables Responsible for their Development and Decline. WRC Report 359/1/97. PIETERSE AJH, FOUCHE L AND LANGENEGGER O (19--). The penetration of purification processes by algal species in a full-scale water treatment plant. (publication or proceedings unidentified) 269-284. POURIA S, DE ANDRADE A, BARBOSA J, CALVACANTI RL, BARRETO VTS, WARD CJ, PRESISER W, POON GK, NEILD GH AND CODD GA (1998) Fatal microcystin intoxication in haemodialysis unit in Caruaru, Brazil. The Lancet 352 21-26. PRETORIUS JA (1977) Groei van Microcystis aeruginosa op Agarmedium. M.Sc. Thesis, University of the Orange Free State, Bloemfontein. PRETORIUS JA AND ELOFF JN (1977) Occurrence of nannocytes in Microcystis. S. Afr. J. Sci. 73 245-246. PRETORIUS JA AND ELOFF JN (1981) Aspects of the growth of Microcystis aeruginosa on agar. J. Limnol. Soc. sth. Afr. 7 67-71. PRETORIUS JA, KRUGER GHJ AND ELOFF JN (1977) The release of nannocytes during the growth cycle of Microcystis. J. Limnol. Soc. sth. Afr. 3 17-20. QUIBELL, GE AND DU PLESSIS BJ (1991) Algal Regrowth in the Holding Dam at the Withoogte Water Treatment Works. DWAF Report N G100/00DEQ2891). QUIBELL G, BADENHORST JE AND CARELSON CIC (1995) Draft National Toxic Blue-Green Algal Surveillance Programme for South Africa (unpublished). Institute for Water Quality Studies, Department of Water Affairs and Forestry, Pretoria.
162
RABIN P AND DARBRE A (1975) An improved extraction procedure for the endotoxin from Microcystis aeruginosa NRC-1. Biochem. Soc. Trans. 3 428. RESSOM R, SAN SOONG F, FITZGERALD J, TURCZYNOWICZ L, EL SAADI O, RODER D, MAYNARD T AND FALCONER I (1993) Health Effects of Toxic Cyanobacteria (Blue-green algae). Report to the Environmental Health Standing Committee of the (Australian) National Health and Medical Research Council. University of Adelaide and the South Australian Health Commission, Adelaide, South Australia. REYNOLDS CS (1972) Growth, gas vacuolation and buoyancy in a natural population of planktonic blue-green alga. Freshwat. Biol. 2 87 - 106. REYNOLDS CS (1992) Eutrophication and the management of planktonic algae: What Vollenweider couldn’t tell us. In: Eutrophication: Research and Application to Water Supply (Sutcliffe DW and Jones JG (eds.) Freshwater Biological Association. REYNOLDS CS (1994) The long, the short and the stalled: on the attributes of phytoplankton selected by physical mixing in lakes and rivers. Hydrobiologia 289 9-21. REYNOLDS CS AND WALSBY AE (1975) Water Blooms. Biol. Rev. 50 437-481. ROBARTS RD (1984) Factors controlling primary production in a hypertrophic lake (Hartbeespoort Dam, South Africa). J. Plankton Res. 6 91-105. ROBARTS RD AND ZOHARY T (1984) Microcytis aeruginosa and underwater light attenuation in a hypertrophic lake (Hartbeespoort Dam, South Africa). J. Ecol. 73 1001-1017. ROBARTS RD AND ZOHARY T (1986) The influence of a cyanobacterial hyperscum on the heterotrophic activity of planktonic bacteria in a hypertrophic lake. Appl. Environ. Microbiol. 51 609-613. ROBARTS RD AND ZOHARY T (1987) Temperature effects on photosynthetic capacity, respiration, and growth rates of bloom-forming cyanobacteria. NZ J. Mar. and Freshwater Res. 21 391-399. RUNNEGAR MTC AND FALCONER IR (1982) The in vivo and in vitro biological effects of the peptide hepatotoxin from the blue-green alga Microcystis aeruginosa. S. Afr. J. Sci. 78 363-366. SANTIKARN S, WILLIAMS DH, SMITH RJ, HAMMOND SJ, BOTES DP, TUINMAN A, WESSELS PL, VILJOEN CC AND KRUGER H (1983) A partial structure for the toxin BE-4 from the blue-green algae, Microcystis aeruginosa. J. Chem. Soc., Chem. Commun. 652-554. SCHEFFER M, HOSPER SH, MEIJER M-L, MOSS B AND JEPPESEN E (1993) Alternative equilibria in shallow lakes. Trends in Ecol. and Evol. 8 275-279. SCOTT WE (1974) The isolation of Microcystis. S. Afr. J. Sci. 70 179. SCOTT WE (1976) Microcystis in pure culture. Water Report 4 2 NIWR, Pretoria. SCOTT WE (1979) Observations on the ecology, growth and physiology of Microcystis aeruginosa in the laboratory and in the field. Paper presented at the Health Aspects of Water Supplies Symposium, CSIR, Pretoria. SCOTT WE (1980) Large scale cultivation of toxic Microcystis aeruginosa. Water Report 11 2-3. NIWR, Pretoria.. SCOTT WE (1983) The Presence of Toxic Microcystis in Hartbeespoort Dam. Report by the National Institute for Water Research to the Hartbeespoort Dam Technical sub-Committee. NIWR W 5/136/4/2. SCOTT WE (1986) Examination of toxic and non-toxic Microcystis aeruginosa in the field and in laboratory culture. In: Steyn PS and Vlegaar R (eds.) Mycotoxins and Phycotoxins. Elsevier Science Publishers, Amsterdam. 41-50. SCOTT WE (1987) Toxins of Blue-Green Algae: A ten-year report. National Institute for Water Report, Council for Scientific and Industrial Research, Pretoria. SCOTT WE (1991) Occurrence and significance of toxic cyanobacteria in Southern Africa. Water. Sci. Technol. 23 175-180. SCOTT WE AND CHUTTER FM (1981) Introduction: Infections and Predators. Wastewater for Aquaculture. Proceedings of a Workshop on Biological Production Systems and Waste Treatment, Bloemfontein, 12 –13 March 1980. Grobbelaar JU, Soeder CJ and Toerien DF (eds.) UOFS Publ., Series C. 3 103-109.
163
SCOTT WE, BARLOW DJ AND HAUMAN JH (1981) Studies on the ecology, growth and physiology of toxic Microcytis aeruginosa in South Africa. In: Carmichael WW (ed.) The Water Environment: Algal Toxins and Health. Plenum Publishing Corporation. SCOTT WE, VAN STEENDEREN RA AND WELCH DI (1985) Health aspects of eutrophication. Proc. Symp. on the Impact of Phosphate on SA Waters. Pretoria, 22 November 1985. 1-12. SHAPIRO J (1990) Current beliefs regarding dominance by blue-greens: The case for the importance of CO2 and pH. Internat. Verein. Limnol. 24 38-54. SHEPHARD GS, STOCKENSTROM S, DE VILLIERS D, ENGELBRECHT WJ, SYDENHAM EW AND WESSELS GFS (1998) Photocatalytic degradation of cyanobacterial microcystin toxins in water. Toxicon 36 1895-1901. SHILLINGLAW SN AND PIETERSE AJH (1977) Application of Algal and Plant Systems for the Treatment of Nutrient Enriched Waters. National Institute for Water Research. CSIR Project No 620/2153/0 Project Report 4. SILVA SMF AND PIENAAR RN (1997a) Marine cyanophytes from the Western Cape, South Africa: Nostocales and Stignematales. S. Afr.J.Bot. 63 436-448. SILVA SMF AND PIENAAR RN (1997b) Epipelic marine cyanophytes of Bazaruto Island, Inhambane, Mozambique. S. Afr.J.Bot. 63 459-464. SLABBERT JL AND MORGAN WSG (1982) A bioassay technique using Tetrahymena pyriformis for the rapid assessment of toxicants in water. Wat. Res. 16 517-523. SMIT JD (1950) Experimental cases of algae poisoning in small animals. S. Afr. Ind. Chem. 4 66. SMIT EJ, KRUGER GHJ AND ELOFF JN (1983) Carotenoid composition as taxonomic character for Microcystis isolates. Limnol. Soc. sth. Afr. 9 43-48. SOLL MD AND WILLIAMS MC (1985) Mortality of a white rhinoceros (Ceratotherium simum) suspected to be associated with the blue-green alga Microcystis aeruginosa. J. S. Afr. Vet. Assoc. 56 46-49. SOROKIN C (1960) Kinetic studies of temperature effects on the cellular level. Biochim. Biophys. Acta 38 197-204. STEPHENS EL (1949) Microcystis toxica sp. a poisonous alga from the Transvaal and the Orange Free State. Trans. R. Soc. S. Afr. 32 105-112. STEYN DG (1943) Poisoning of animals by algae on dams and pans. Farming in South Africa 18 489. STEYN DG (1944) Vergiftiging deur slyk (algae) op damme en panne. SA Med. J. 18 378-379. STEYN DG (1945) Poisoning of animals and human beings by algae. S. Afr. J. Sci. 41 243-244. STEYN DG (1949) Vergiftiging van mens en dier. Van Schaik, Pretoria. THERON CP (1990a) Kameelperdvrektes en die teenwoordigheid van Microcystis in Bloemhof Dam. DWAF-HRI Report N4/84/1. THERON CP (1990b) ‘n Ondersoek na die voorkoms van Microcystis in Klipdrif Dam. Institute for Water Quality Studies Report N4/84/1. Department of Water Affairs and Forestry. THIEL PG (1999) Blooms of blue-green algae. In: Moller L (ed.) Environmental Medicine. Stockholm: Karolinska Inst. TOERIEN DF (1974) Half saturation constant for nitrogen-limited growth of the green alga Selenastrum capricornutum Printz. S.Afr. J. Sci. 70 75. TOERIEN DF (1975) South African eutrophication problems. A perspective. Wat. Pollut. Control, 74 134-142. TOERIEN DF (1977) A review of eutrophication and guidelines for its control in South Africa. CSIR Special Report WAT 48, Pretoria, South Africa. TOERIEN DF AND STEYN DJ (1973) Application of algal bioassays in eutrophication analyses. S. Afr. J. Sci. 69 79-82. TOERIEN DF AND WALMSLEY RD (1977). Tussentydse riglyne vir die beheer van eutrofikasie. WRC Technical Report 1.
164
TOERIEN DF, HUANG CH, RADIMSKY J, PEARSON EA AND SCHERFIG I (1971). Final Report. Provisional algal assay procedures. SERL. Report 71-6. University of California, Berkeley. TOERIEN DF, HYMAN KL AND BRUWER MJ (1974) Comparison of the algal bioassay responses of Selenastrum capricornutum and Microcystis aeruginosa. S. Afr. J. Sci. 70 75. TOERIEN DF, HYMAN KL AND BRUWER MJ (1975). A preliminary trophic status classification of some South African impoundments. Water SA 1 5-23. TOERIEN DF, SCOTT WE. AND PITOUT MJ (1976) Microcystis toxins: Isolation, identification, implications. Water SA 2 160-162. TOW M (1976) Algal Blooms in the Vaal Catchment Area. M.Sc. Thesis. University of the Witwatersrand, Johannesburg. TOW M (1979) The occurrence of Microcystis aeruginosa in the bottom sediments of a shallow eutrophic pan. J. Limnol. Soc. sth. Afr. 5 9-10. TUSTIN RC, VAN RENSBURG, SJ AND ELOFF JN (1973) Hepatic damage in the primate following ingestion of toxic algae. In: Saunders SJ and Terblanche J (eds.) Liver, Pitman Medical London, pp. 383-385. UKEA (United Kingdom Environment Agency) (1998a) Guidance for Agency Staff on blue-green algal monitoring and management of incidents. Internal Directive. UKEA (United Kingdom Environment Agency) (1998b) The determination of microcystin algal toxins in raw and treated waters by high performance liquid chromatography. Methods for the Examination of Waters and Associated Materials. Environment Agency, Bristol, UK. VAKERIA D, CODD GA, BELL SG, BEATTIE KA AND PRIESTLEY IM (1985) Toxicity and extrachromasomal DNA in strains of the cyanobacterium Microcystis aeruginosa. FEMS Microbiology Letters 29 69-72. VAN GINKEL CE AND HOHLS BC (1999) Toxic Algae in Erfenis and Allemanskraal Dams. Occasional report by the Institute for Water Quality Studies, Department of Water Affairs and Forestry. N/C400/03/DEQ/1999. VAN DER WESTHUIZEN AJ (1984) Effect of Growth Conditions on Toxicity and Chemical Composition of the Toxin of Microcystis aeruginosa. Ph.D. Thesis, University of the Orange Free State, Bloemfontein. VAN DER WESTHUIZEN AJ AND ELOFF JN (1982a) Effect of culture age and pH of culture medium on the growth and toxicity of the blue-green alga Microcystis aeruginosa. Z. Pflanzenphysiology 110 157-163. VAN DER WESTHUIZEN AJ AND ELOFF JN (1982b) Toxin extraction from the blue-green alga Microcystis aeruginosa by different extraction media. J. Limnol. Soc. sth. Afr. 8 76-77. VAN DER WESTHUIZEN AJ AND ELOFF JN (1985) Effect of temperature and light on the toxicity and growth of the blue-green alga Microcystis aeruginosa (UV-006). Planta. 163 55-59. VAN DER WESTHUIZEN AJ, ELOFF JN AND KRUGER GHJ (1986) Effect of temperature and light (fluence rate) on the composition of the toxin of the cyanobacterium Microcystis aeruginosa (UV-006). Arch. Hydrobiol. 108 145-154. VAN HALDEREN A, HARDING WR, WESSELS JC, SCHNEIDER DJ, HEINE EWP, VAN DER MERWE, J AND FOURIE JM (1995) Cyanobacterial (blue-green algae) poisoning of livestock in the western Cape province of South Africa. J. S. Afr. Vet. Assoc. 66 260-264. VAN VUUREN MM (1979) Die Invloed van Ligintensiteit en Ligkwaliteit op die Groei van Microcystis aeruginosa. M.Sc. Thesis, University of the Orange Free State, Bloemfontein. VAN VUUREN LRJ, MEIRING PGJ, HENZEN MR AND KOLBE FF (1965) The floatation of algae in water reclamation. Int. J. Air. Wat. Poll. 9 823-832. VAN VUUREN LRJ, DE WET FJ AND CILLIE GG (1983) Treatment of water from eutrophied impoundments. Wat. Supply. 1 145-156. VAN WYK PWJ, ELOFF JN AND VERHOEVEN RL (1979) Investigation of membrane bound inclusions in Microcystis. Proc. Electron Microsc. Soc. S. Afr. 3 157-158.
165
VERHOEVEN RL AND ELOFF JN (1979) Effect of lethal concentrations of copper on the ultrastructure and growth of Microcystis. Proc. Electron Microsc. Soc. S. Afr. 9 161 - 162. WHO (World Health Organization) (1999) Toxic Cyanobacteria in Water: A Guide to their public health consequences, monitoring and management. Chorus I and Bartram J (eds.) E and F Spon Publishing, London. WESSELS DCJ AND BhDEL B (1995) Epilithic and cryptoendolithic cyanobacteria of Clarens sandstone cliffs in the Golden Gate Highlands National Park, South Africa. Bot. Acta. 108 220-226. WHITTON BA AND POTTS M (2000) The Ecology of Cyanobacteria: Their Diversity in Time and Space. Kluwer Academic Publishers. WICKS RJ AND THIEL PG (1990) Environmental factors affecting the production of peptide toxins in floating scums of the cyanobacterium Microcystis aeruginosa in a hypertrophic African reservoir. Environ. Sci. Technol. 24 1413-1418. WILLIAMS PG, VAN VUUREN LRJ AND VAN DER MERWE PJ (1985) Dissolved air floatation upgrades a conventional plant treating eutrophic water. Proc. Eleventh Fed. Conv. Australian Water and Wastewater Assoc. Melbourne.189-196. WNOROWSKI AU (1993) Research on taste and odour forming microorganisms in South African surface waters. WRC Report 320/1/93. ZEHNDER A AND GORHAM PR (1960) Factors influencing the growth of Microcystis aeruginosa Khtz. emend. Elenkin. Can. J. Microbiol. 6 645 - 659. ZOHARY T (1985) Hyperscums of the cyanobacterium Microcystis aeruginosa in a hypertrophic lake (Hartbeespoort Dam, South Africa). J. Plankton Res. 7 399-409. ZOHARY T AND BREEN CM (1989) Environmental factors favouring the formation of Microcystis aeruginosa hyperscums in a hypertrophic lake. Hydrobiologia 178 179-192. ZOHARY T AND PAIS MADEIRA AM (1987) Counting natural populations of Microcystis aeruginosa: A simple method for colony disruption into single cells and its effect on cell counts of other species. J. Limnol. Soc. sth. Afr. 13 75-77. ZOHARY T AND ROBARTS RD (1989) Diurnal mixed layers and the long-term dominance of Microcystis aeruginosa. J. Plankton Research 11 25-48.