spatial dynamics of human-origin h1 influenza a virus in north american swine
TRANSCRIPT
Spatial Dynamics of Human-Origin H1 Influenza A Virusin North American SwineMartha I. Nelson1*, Philippe Lemey2, Yi Tan1, Amy Vincent3, Tommy Tsan-Yuk Lam4, Susan Detmer5,
Cecile Viboud1, Marc A. Suchard6, Andrew Rambaut1,7, Edward C. Holmes1,4, Marie Gramer5
1 Division of International Epidemiology and Population Studies, Fogarty International Center, National Institutes of Health, Bethesda, Maryland, United States of America,
2 Department of Microbiology and Immunology, Katholieke Universiteit Leuven, Leuven, Belgium, 3 Virus and Prion Diseases of Livestock Research Unit, National Animal
Disease Center, USDA-ARS, Ames, Iowa, United States of America, 4 Department of Biology, The Pennsylvania State University, University Park, Pennsylvania, United States
of America, 5 The University of Minnesota Veterinary Diagnostic Laboratory, St. Paul, Minnesota, United States of America, 6 Departments of Biomathematics and Human
Genetics, David Geffen School of Medicine at UCLA, and Department of Biostatistics, UCLA School of Public Health, Los Angeles, California, United States of America,
7 Institute of Evolutionary Biology, University of Edinburgh, Ashworth Laboratories, Edinburgh, United Kingdom
Abstract
The emergence and rapid global spread of the swine-origin H1N1/09 pandemic influenza A virus in humans underscores theimportance of swine populations as reservoirs for genetically diverse influenza viruses with the potential to infect humans.However, despite their significance for animal and human health, relatively little is known about the phylogeography ofswine influenza viruses in the United States. This study utilizes an expansive data set of hemagglutinin (HA1) sequences(n = 1516) from swine influenza viruses collected in North America during the period 2003–2010. With these data weinvestigate the spatial dissemination of a novel influenza virus of the H1 subtype that was introduced into the NorthAmerican swine population via two separate human-to-swine transmission events around 2003. Bayesian phylogeographicanalysis reveals that the spatial dissemination of this influenza virus in the US swine population follows long-distance swinemovements from the Southern US to the Midwest, a corn-rich commercial center that imports millions of swine annually.Hence, multiple genetically diverse influenza viruses are introduced and co-circulate in the Midwest, providing theopportunity for genomic reassortment. Overall, the Midwest serves primarily as an ecological sink for swine influenza in theUS, with sources of virus genetic diversity instead located in the Southeast (mainly North Carolina) and South-central (mainlyOklahoma) regions. Understanding the importance of long-distance pig transportation in the evolution and spatialdissemination of the influenza virus in swine may inform future strategies for the surveillance and control of influenza, andperhaps other swine pathogens.
Citation: Nelson MI, Lemey P, Tan Y, Vincent A, Lam TT-Y, et al. (2011) Spatial Dynamics of Human-Origin H1 Influenza A Virus in North American Swine. PLoSPathog 7(6): e1002077. doi:10.1371/journal.ppat.1002077
Editor: Claus O. Wilke, University of Texas at Austin, United States of America
Received January 13, 2011; Accepted April 7, 2011; Published June 9, 2011
This is an open-access article, free of all copyright, and may be freely reproduced, distributed, transmitted, modified, built upon, or otherwise used by anyone forany lawful purpose. The work is made available under the Creative Commons CC0 public domain dedication.
Funding: The research leading to these results has received funding in part from the European Research Council under the European Community’s SeventhFramework Programme (FP7/2007-2013)/ERC Grant agreement no. 260864; NIH grant R01 GM080533; NSF grant DMS 0856099; NIH grant R01 GM086887; and theNational Evolutionary Synthesis Center (NESCent), NSF EF-0423641. The funders had no role in study design, data collection and analysis, decision to publish, orpreparation of the manuscript.
Competing Interests: The authors have declared that no competing interests exist.
* E-mail: [email protected]
Introduction
Swine influenza A viruses cause severe respiratory disease in pigs,
similar to that which presents in humans, and constitute an important
economic concern for the US swine industry and threat to public
health. Influenza was first clinically recognized in pigs in the
Midwestern US in conjunction with the severe 1918 ‘Spanish flu’
H1N1 pandemic in humans [1], although whether the pandemic
originated in humans or pigs remains unresolved [2]. Periodic
transmission of influenza viruses between humans and swine occurs
in both directions, including such notable cases as the 1976 outbreak of
swine A/H1N1 influenza virus in humans in Fort Dix, New Jersey [3]
and the 2009 swine-origin A/H1N1 pandemic virus in humans [4,5].
The 1918-origin ‘classical’ H1N1 swine influenza virus circulated in
US swine for 80 years with relatively few antigenic changes [6], but in
the last decade the antigenic diversity of swine influenza viruses in the
US has multiplied, stimulating research, development, and uptake of
influenza vaccines in the US swine industry.
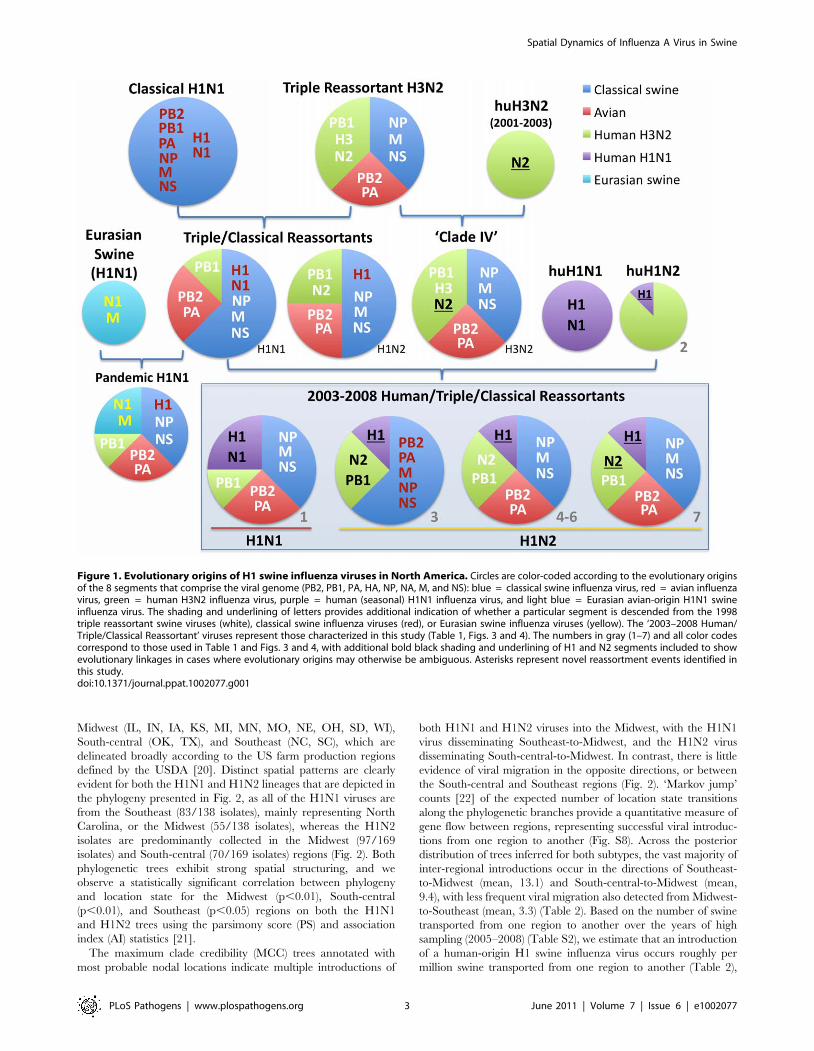
Currently, influenza A viruses of the H1N1, H1N2, and H3N2
subtypes all co-circulate in US swine. In 1998–1999, a triple
reassortant H3N2 influenza virus emerged in US swine that possessed
HA (H3), NA (N2), and PB1 segments of human H3N2 virus origin,
PB2 and PA segments of avian virus origin, and NP, M1/2, and
NS1/2 segments of classical swine virus origin [7] (Fig. 1). Over the
next decade these H3N2 triple reassortant swine viruses further
reassorted with human H3N2 viruses [8,9], as well as with the co-
circulating H1N1 classical swine viruses [10,11]. Mainly these
reassortment events involved the HA and NA segments, preserving
what has been termed the ‘triple reassortant internal genes’ (TRIG)
constellation (avian-origin PB2 and PA, human H3N2-origin PB1,
and classical swine-origin NP, M1/2, and NS1/2).
In 2003 influenza A virus of entirely human H1N2 origin was
identified in Canadian swine [12], and in 2005 H1N1 viruses with
human-origin H1 and N1 segments were identified in the United
States, representing two separate introductions of human H1 virus
into swine that were referred to as ‘d-1’ (H1N2) and ‘d -2’ (H1N1)
PLoS Pathogens | www.plospathogens.org 1 June 2011 | Volume 7 | Issue 6 | e1002077
lineages based on the order of identification [13]. These human-H1
origin swine viruses also acquired novel genome segments via
reassortment with other swine and human influenza viruses [12,13].
Globally, the swine influenza virus population is spatially
separated into the North American and Eurasian lineages, although
both lineages co-circulate in Asia, which imports swine from North
America and Europe. In the US the traditional center of swine
production is located in the ‘Corn Belt’ of the Midwest, including
Iowa, Illinois, Indiana, and Minnesota [14]. Beginning in the
1970’s, swine production expanded into large new facilities located
in the Southeastern US, mainly North Carolina, and more recently
into Oklahoma in the South-central US [15]. Due to the lower cost
of transporting swine versus the required amount of feed, the
majority of swine born in the South-central and Southeastern
regions are transported by road to the Midwestern Corn Belt to be
fattened and slaughtered, resulting in continuous large-scale
movements of swine (‘swine-flows’) into the Midwest [14]. However,
the role of local, regional, and global swine-flows in the ecology and
evolution of swine influenza viruses remains unclear.
The aim of our study was to investigate the role of inter-regional
swine-flows in the spatial dissemination of newly introduced swine
viruses in the US, using the human-origin A/H1 influenza virus as
a case study. We utilize HA1 sequence data from a large data set
of swine influenza virus isolates (n = 1,516 sequences) collected
from 23 US states during 2003–2010 and apply recently developed
methods of Bayesian phylogeography. The strength of the
Bayesian approach is that the diffusion process among discrete
location states is integrated with time-scaled phylogenies that
incorporate phylogenetic uncertainty. This approach provides a
formal framework to test hypotheses about viral diffusion processes
driven by known population distributions and movements.
Results
Phylogenetic analysisOf the 1,516 HA1 (H1) influenza virus sequences collected from
swine in the United States and Canada from 2003–2010 that were
included in this study, 41 were related to the human pandemic
H1N1/09 virus, all of which were collected in 2009–2010 and
appear to result from multiple human-to-swine transmission
events. These pandemic viruses have been described previously
and thus are not the focus of the present study [16]. Of the
remaining 1,475 swine viruses, 327 were phylogenetically related
to seasonal human H1 viruses (Fig. S1), which constitute two
phylogenetically distinct clusters, representing two contemporane-
ous, but independent introductions of different human influenza
viruses into swine (Fig. 2), consistent with previous findings [13].
Both of these clusters are phylogenetically most closely related to
human H1 influenza viruses collected in early 2003. One cluster
(n = 138 sequences) is related to widespread human seasonal A/
H1N1 virus, while the other cluster (n = 187 sequences) is related
to a less common human reassortant A/H1N2 virus that
circulated globally in humans from 2001–2003. The A/H1N2
reassortant virus contains an HA derived from human seasonal
H1N1 viruses and 7 segments of human H3N2 influenza virus
origin [17].
We estimated the Time to the Most Recent Common Ancestor
(TMRCA) for the nodes adjoining the branch that represents the
human-to-swine transmission events of the H1N1 and H1N2
viruses. Accordingly, the cross-species transmission of H1N1 from
humans into swine is estimated to have occurred during the period
October 2002–March 2003, which coincides with the timing of the
A/H1N1-dominant 2002–2003 winter influenza epidemic in
humans in North America [18] (Fig. 2, Table S1). Similarly, the
timeframe for the cross-species transmission of the H1N2 virus
into swine is estimated to be August 2002–February 2003, which
overlaps with the time period when A/H1N2 viruses circulated in
humans in North America (Table S1).
To explore the whole-genome evolution of these human-origin
swine influenza viruses, maximum likelihood trees were inferred
for the subset (n = 31) of the human-origin swine influenza virus
HA1 sequences for which the NA and internal gene sequences
were publicly available at GenBank [19]. Major reassortment
events are summarized in Table 1 and Fig. 1, including the H1N1
and 2003–2004 H1N2 reassortment events (#1 and #2/3
respectively, Table 1) that have been described previously
[12,13]. The PB2 phylogeny is depicted in Fig. 3, the NA (N2)
phylogeny is depicted in Fig. 4, and the phylogenies of other 5
segments and N1 are available in the Supporting Information
(Figs. S2, S3, S4, S5, S6, and S7). Notably, all H1N1 and H1N2
isolates collected after 2004 have acquired the triple reassortant
internal genes (TRIG) cassette, which were originally derived in
1998 from avian influenza viruses (PB2 and PA), human influenza
viruses (PB1), and classical swine influenza viruses (NP, M, and
NS). The topology of these trees suggests that the human H1N2-
origin lineage may have acquired components of the TRIG
cassette approximately 3–4 times over the course of 2007–2008 via
multiple reassortment events (Fig. 3, Fig. S2, S3, S4, S5, S6, and
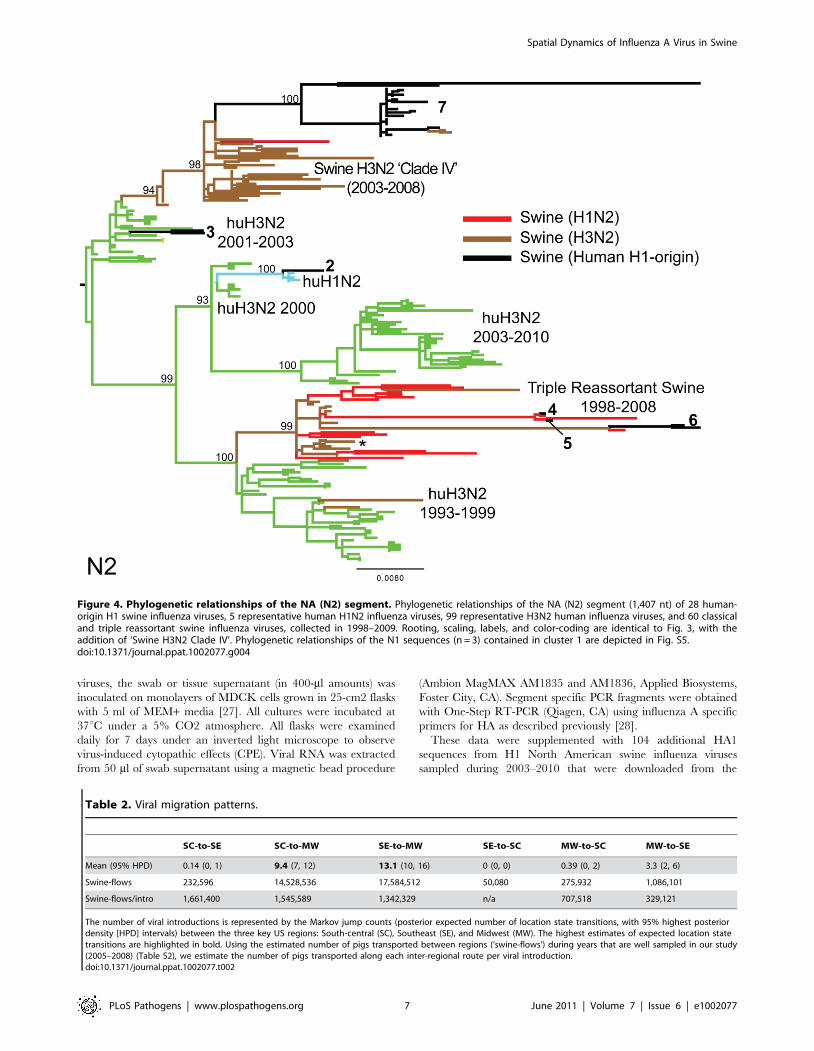
S). The largest clade (n = 21) of 2008 human H1N2-origin swine
isolates (#7, Table 1) contains the TRIG, but also has acquired via
reassortment a human H3N2-origin NA (N2) segment that had
circulated in swine at least since 2003, when human H3N2 viruses
appear to have reassorted with a lineage of swine A/H3N2 triple
reassortant swine viruses that is referred to ‘clade IV’ in the
nomenclature for the HA segment [9] (Fig. 4).
Spatial movements of human-origin H1 virus in swineTo investigate the spatial dissemination of these novel viruses
within the US swine population, we inferred separate Bayesian
phylogenies for the H1N1 and H1N2 data sets, considering the
three discrete US regions that are well sampled in our data: the
Author Summary
Since 1998, genetically and antigenically diverse influenzaA viruses have circulated in North American swine due tocontinuous cross-species transmission and reassortmentwith avian and human influenza viruses, presenting apandemic threat to humans. Millions of swine aretransported year-round from the southern United Statesinto the corn-rich Midwest, but the importance of thesemovements in the spatial dissemination and evolution ofthe influenza virus in swine is unknown. Using a large dataset of influenza virus sequences collected in NorthAmerican swine during 2003–2010, we investigated thespatial dynamics of two influenza viruses of the H1subtype that were introduced into swine from humansaround 2003. Employing recently developed Bayesianphylogeography methods, we find that the spread of thisinfluenza virus follows the large-scale transport of swinefrom the South to the Midwest. Based on this pattern ofviral migration, we suggest that the genetic diversity ofswine influenza viruses in the Midwest is continuallyaugmented by the importation of viruses from sourcepopulations located in the South. Understanding theimportance of long-distance pig movements in theevolution and spatial dissemination of influenza virus inswine may inform future strategies for the surveillance andcontrol of influenza, and perhaps other swine pathogens.
Spatial Dynamics of Influenza A Virus in Swine
PLoS Pathogens | www.plospathogens.org 2 June 2011 | Volume 7 | Issue 6 | e1002077
Midwest (IL, IN, IA, KS, MI, MN, MO, NE, OH, SD, WI),
South-central (OK, TX), and Southeast (NC, SC), which are
delineated broadly according to the US farm production regions
defined by the USDA [20]. Distinct spatial patterns are clearly
evident for both the H1N1 and H1N2 lineages that are depicted in
the phylogeny presented in Fig. 2, as all of the H1N1 viruses are
from the Southeast (83/138 isolates), mainly representing North
Carolina, or the Midwest (55/138 isolates), whereas the H1N2
isolates are predominantly collected in the Midwest (97/169
isolates) and South-central (70/169 isolates) regions (Fig. 2). Both
phylogenetic trees exhibit strong spatial structuring, and we
observe a statistically significant correlation between phylogeny
and location state for the Midwest (p,0.01), South-central
(p,0.01), and Southeast (p,0.05) regions on both the H1N1
and H1N2 trees using the parsimony score (PS) and association
index (AI) statistics [21].
The maximum clade credibility (MCC) trees annotated with
most probable nodal locations indicate multiple introductions of
both H1N1 and H1N2 viruses into the Midwest, with the H1N1
virus disseminating Southeast-to-Midwest, and the H1N2 virus
disseminating South-central-to-Midwest. In contrast, there is little
evidence of viral migration in the opposite directions, or between
the South-central and Southeast regions (Fig. 2). ‘Markov jump’
counts [22] of the expected number of location state transitions
along the phylogenetic branches provide a quantitative measure of
gene flow between regions, representing successful viral introduc-
tions from one region to another (Fig. S8). Across the posterior
distribution of trees inferred for both subtypes, the vast majority of
inter-regional introductions occur in the directions of Southeast-
to-Midwest (mean, 13.1) and South-central-to-Midwest (mean,
9.4), with less frequent viral migration also detected from Midwest-
to-Southeast (mean, 3.3) (Table 2). Based on the number of swine
transported from one region to another over the years of high
sampling (2005–2008) (Table S2), we estimate that an introduction
of a human-origin H1 swine influenza virus occurs roughly per
million swine transported from one region to another (Table 2),
Figure 1. Evolutionary origins of H1 swine influenza viruses in North America. Circles are color-coded according to the evolutionary originsof the 8 segments that comprise the viral genome (PB2, PB1, PA, HA, NP, NA, M, and NS): blue = classical swine influenza virus, red = avian influenzavirus, green = human H3N2 influenza virus, purple = human (seasonal) H1N1 influenza virus, and light blue = Eurasian avian-origin H1N1 swineinfluenza virus. The shading and underlining of letters provides additional indication of whether a particular segment is descended from the 1998triple reassortant swine viruses (white), classical swine influenza viruses (red), or Eurasian swine influenza viruses (yellow). The ‘2003–2008 Human/Triple/Classical Reassortant’ viruses represent those characterized in this study (Table 1, Figs. 3 and 4). The numbers in gray (1–7) and all color codescorrespond to those used in Table 1 and Figs. 3 and 4, with additional bold black shading and underlining of H1 and N2 segments included to showevolutionary linkages in cases where evolutionary origins may otherwise be ambiguous. Asterisks represent novel reassortment events identified inthis study.doi:10.1371/journal.ppat.1002077.g001
Spatial Dynamics of Influenza A Virus in Swine
PLoS Pathogens | www.plospathogens.org 3 June 2011 | Volume 7 | Issue 6 | e1002077

although this provides only a lower boundary as the introductions
are estimated based on our limited sampling, and we can only
detect introductions with substantial onward transmission.
To quantitatively estimate the importance of known geograph-
ical swine population distributions and movements in the spatial
dynamics of the virus, we encoded four potential predictors of viral
dissemination between pairwise regions as phylogeographic
models [23] and fitted these models individually to the sequence
data: (i) the number of swine transported annually from one region
to another (with directionality), (ii) the swine population size in the
region of origin, (iii) the swine population size in the region of
destination, and (iv) the product of the swine population sizes in
the region of origin and the region of destination (Tables S2 and
S3). Given that the South-central, Southeast, and Midwest regions
are approximately equidistant from each other by road and
geodesic distance, we did not consider geographical distances to be
a potential predictor of viral movements in our inter-regional
analysis. Bayes factor comparisons [24] via marginal likelihood
estimates of the model fit for each potential predictor indicates that
the spatial dynamics of the human-origin H1 virus in swine are
best described by the number of swine transported annually from
one region to another (Table 3). Fixing the rates relative to the
swine population size of the region of destination also improved
the marginal likelihood, reflecting the directionality of swine-flows
from regions of relatively lower swine population size in the South-
central and Southeast regions to the largest swine population
found in the Midwest. The poorest marginal likelihood was
obtained when rates were fixed relative to the swine population in
the region of origin, indicating low rates of viral dissemination out
of the large swine populations in the Midwest.
Finally, to ensure that the observed geographical patterns were
not an artifact of sampling (Fig. S9), we repeated the phylogeo-
graphic analysis using a balanced data set that was randomly
subsampled from the original data to obtain equal numbers of
sequences from each region (n = 70). Using this balanced data set
we find very similar patterns as those derived from the full data
set, with substantial viral movement from South-central to
Midwest and Southeast to Midwest and strongest support for
Figure 2. Phylogenetic relationships of 325 human H1-origin swine influenza viruses. Time-scaled Bayesian MCC tree of 325 HA1 (H1)sequences from human H1-origin influenza viruses collected from North American swine during 2003–2010, and 57 and 35 human H1N1 and H1N2sequences, respectively, collected during 2000–2010 that are included as background. Tip labels have been removed (available in Fig. S10) andbranches are colored by host species, subtype, and most probable location state: dark blue = human H1N1, light blue = human H1N2, green =swine influenza viruses collected in the Southeastern US (SE), yellow - swine influenza viruses collected in the Midwestern US (MW), magenta = swineinfluenza viruses collected in the South-central US (SC), and orange = swine influenza viruses collected in Canada (Can). Dotted lines with asterisksrepresent the estimated time period for human-to-swine transmission of H1N1 (*) and H1N2 (**) viruses, and posterior probabilities .0.90 for keynodes are included.doi:10.1371/journal.ppat.1002077.g002
Spatial Dynamics of Influenza A Virus in Swine
PLoS Pathogens | www.plospathogens.org 4 June 2011 | Volume 7 | Issue 6 | e1002077
the ‘swine-flows’ model (Tables S4 and S5). The numbers of viral
introductions are somewhat lower than in the original analysis
(Table S4) and there is weaker support for the ‘swine-flows’
model (Table S5), but this is expected given the smaller number
of sequences used in the sensitivity analysis.
Discussion
To capture the early spatial patterns of a newly emergent
virus in swine populations prior to extensive geographical
mixing, this study focused on an H1 influenza virus that was
introduced twice from humans into swine around 2003. The fact
that this human H1 virus was introduced into swine on two
separate occasions (H1N1 and H1N2) allows, uniquely, a side-
by-side comparison of the spatial dynamics of two similar
emergent viruses. In our statistical analysis, we also take
advantage of the independent nature of these two introductions
through a model that simultaneously draws information from
the H1N1 and H1N2 evolutionary histories to inform the rates
of movement in an asymmetric diffusion model. The latter
allows us to fully characterize the bidirectional movement
between the three major sampling regions despite the fact that
the independent lineages provide very different numbers of
samples from these regions.
We find that the key source population of the human-origin
H1N1 virus is likely to be swine in the Southeastern US,
particularly North Carolina, whereas the source population of the
H1N2 virus appears to be swine in the South-central US,
including Oklahoma. Subsequently, both the H1N1 and H1N2
virus rapidly disseminated to the Midwestern US, apparently
following the main swine transportation routes (‘swine-ways’) to
the Midwest, the traditional center of American pig farming, to
be fattened on the feed corn produced in the region prior to
slaughter. Although the Midwest swine population is .4-fold
larger than the Southeast swine population and .12-fold greater
than the South-central population, the Midwest effectively serves
as an ecological sink for the virus due to its commercial function
as a final marketing destination and net importer of pigs. These
results appear to be robust to sampling bias, as we found similar
patterns of viral migration using a subsampled data set
comprising 70 isolates that were randomly sampled from each
of the three US regions (Tables S4 and S5).
It is certainly possible for novel lineages of influenza virus to
begin their spread in the Midwest, and we have not considered
farm density, climatic conditions, husbandry practices, biosecurity,
vaccination status, or any other factors that would favor viral
emergence in the South-central or Southeast versus the Midwest.
The role of newer high-density swine production facilities in
Oklahoma and North Carolina in viral evolution, in tandem with
other immunological or environmental factors, clearly requires
study at a finer spatial scale. Rather, our findings suggest that any
viral lineage that originates in the Midwest would be less likely to
spread to other US regions due to lower rates of regional
exportation of Midwestern swine, whereas viruses that originate in
the South-central or Southeast are likely to rapidly disseminate to
the Midwest.
Although the Midwest does not appear to be a source
population for swine influenza viruses, the region is likely to
provide a reservoir for multiple genetically distinct variants to co-
circulate and exchange segments via reassortment due to the
continual importation of swine influenza viruses from other
regions. Even a limited sampling (31 whole-genome sequences)
revealed extensive reassortment between the human-origin swine
viruses and other swine and human influenza viruses over a 7-year
period. Both the human H1N1- and H1N2-origin swine viral
genomes exhibit a pattern of HA and NA segments that are closely
related to human viruses, but internal segments related to triple
reassortant swine viruses (TRIG), suggesting that such genomic
arrangements may be selectively favored (although this clearly
requires further study).
Overall, our study captures the effects of at least a decade of
large-scale structural changes in the US commercial swine
industry on the evolution and spread of one of the most
economically important pathogens in US swine. Further
understanding of the role of long-distance pig transport in the
ecology and evolution of swine influenza viruses may inform
targeted surveillance and mitigation strategies in the future,
including intensified surveillance in the less sampled Southern
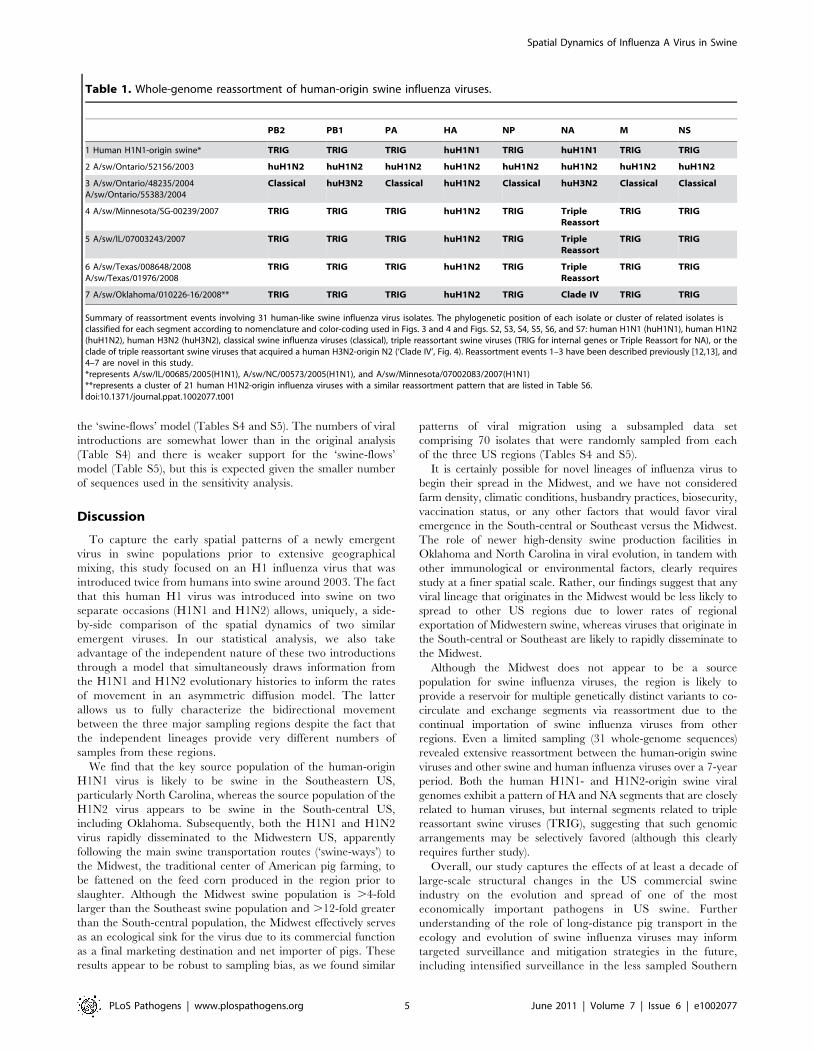
Table 1. Whole-genome reassortment of human-origin swine influenza viruses.
PB2 PB1 PA HA NP NA M NS
1 Human H1N1-origin swine* TRIG TRIG TRIG huH1N1 TRIG huH1N1 TRIG TRIG
2 A/sw/Ontario/52156/2003 huH1N2 huH1N2 huH1N2 huH1N2 huH1N2 huH1N2 huH1N2 huH1N2
3 A/sw/Ontario/48235/2004A/sw/Ontario/55383/2004
Classical huH3N2 Classical huH1N2 Classical huH3N2 Classical Classical
4 A/sw/Minnesota/SG-00239/2007 TRIG TRIG TRIG huH1N2 TRIG TripleReassort
TRIG TRIG
5 A/sw/IL/07003243/2007 TRIG TRIG TRIG huH1N2 TRIG TripleReassort
TRIG TRIG
6 A/sw/Texas/008648/2008A/sw/Texas/01976/2008
TRIG TRIG TRIG huH1N2 TRIG TripleReassort
TRIG TRIG
7 A/sw/Oklahoma/010226-16/2008** TRIG TRIG TRIG huH1N2 TRIG Clade IV TRIG TRIG
Summary of reassortment events involving 31 human-like swine influenza virus isolates. The phylogenetic position of each isolate or cluster of related isolates isclassified for each segment according to nomenclature and color-coding used in Figs. 3 and 4 and Figs. S2, S3, S4, S5, S6, and S7: human H1N1 (huH1N1), human H1N2(huH1N2), human H3N2 (huH3N2), classical swine influenza viruses (classical), triple reassortant swine viruses (TRIG for internal genes or Triple Reassort for NA), or theclade of triple reassortant swine viruses that acquired a human H3N2-origin N2 (‘Clade IV’, Fig. 4). Reassortment events 1–3 have been described previously [12,13], and4–7 are novel in this study.*represents A/sw/IL/00685/2005(H1N1), A/sw/NC/00573/2005(H1N1), and A/sw/Minnesota/07002083/2007(H1N1)**represents a cluster of 21 human H1N2-origin influenza viruses with a similar reassortment pattern that are listed in Table S6.doi:10.1371/journal.ppat.1002077.t001
Spatial Dynamics of Influenza A Virus in Swine
PLoS Pathogens | www.plospathogens.org 5 June 2011 | Volume 7 | Issue 6 | e1002077

regions. While increased genetic and antigenic diversity
observed in swine influenza viruses in recent years has
stimulated ongoing research into the development of new
influenza vaccines for swine, including live-virus and DNA-
based approaches [25], identifying key geographical sources of
the virus and reservoirs of genetic diversity may direct
vaccination strategies in pigs of different age groups and
specified localities. Although the patterns of viral dissemination
we identify using the human-origin H1 influenza virus as a case
study are striking, these findings invite further study into the
phylogeography of swine influenza viruses at more precise
spatial scales, including within our broadly defined Midwest
region, as well as globally.
Materials and Methods
Data generationFor this study we newly generated a total of 1,412 HA1
sequences (889 nt) from H1 influenza A viruses collected from
swine in the United States and Canada that exhibited respiratory
disease during the period 2003–2008 [26] (Table S6). Two of the
isolates were swine viruses that were isolated from turkeys: A/
turkey/North Carolina/00533/2005 and A/turkey/North Car-
olina/00536/2005, but these were triple reassortant viruses and
not included in the phylogeographic analysis. HA1 gene sequences
were obtained either from virus isolates or directly from the
originally submitted nasal swab or lung tissue material. To isolate
Figure 3. Phylogenetic relationships of the PB2 segment. Phylogenetic relationships of the PB2 segment (2,277 nt) of the 31 human H1-originswine influenza viruses for which whole-genome sequences are available (2003–2008) and, as background, 12 classical swine isolates (1931–2004),triple reassortant swine viruses of H3 (n = 18) and H1 (n = 26) subtypes (1998–2009), 2 avian-H3N3 origin swine isolates, and 15 representative H3N2,H1N2, and H1N1 human influenza isolates. The maximum likelihood tree is mid-point rooted for clarity, and all branch lengths are drawn to scale.Bootstrap values .70% are included for key nodes. Shading of branches, according to evolutionary origins of tip isolate, is similar to those used inTable 1: black = human H1-origin swine influenza viruses, purple = human H1N1, green = human H3N2, light blue = human H1N2, blue = classicalswine influenza viruses, pink = avian H3N3-origin swine isolates, red = triple reassortant swine influenza viruses (H1), and brown = triple reassortantswine influenza viruses (H3). Numbers associated with human-origin swine influenza viruses also correspond to those listed in Table 1: 1 = A/sw/IL/00685/2005(H1N1), A/sw/NC/00573/2005(H1N1), and A/sw/Minnesota/07002083/2007(H1N1); 2 = A/sw/Ontario/52156/2003(H1N2); 3 = A/sw/Ontario/48235/2004(H1N2) and A/sw/Ontario/55383/2004(H1N2); 4 = A/sw/Minnesota/SG-00239/2007(H1N2); 5 = A/sw/IL/07003243/2007(H1N2);6 = A/sw/Texas/008648/2008(H1N2) and A/sw/Texas/01976/2008(H1N2); and 7 = a cluster of 21 human H1N2-origin influenza viruses, represented byA/sw/Oklahoma/010226-16/2008(H1N2) (listed in Table S6). The asterisk denotes the first triple reassortant swine influenza viruses identified in theUnited States in 1998–1999 (e.g., A/sw/Nebraska/209/1998(H3N2)).doi:10.1371/journal.ppat.1002077.g003
Spatial Dynamics of Influenza A Virus in Swine
PLoS Pathogens | www.plospathogens.org 6 June 2011 | Volume 7 | Issue 6 | e1002077
viruses, the swab or tissue supernatant (in 400-ml amounts) was
inoculated on monolayers of MDCK cells grown in 25-cm2 flasks
with 5 ml of MEM+ media [27]. All cultures were incubated at
37uC under a 5% CO2 atmosphere. All flasks were examined
daily for 7 days under an inverted light microscope to observe
virus-induced cytopathic effects (CPE). Viral RNA was extracted
from 50 ml of swab supernatant using a magnetic bead procedure
(Ambion MagMAX AM1835 and AM1836, Applied Biosystems,
Foster City, CA). Segment specific PCR fragments were obtained
with One-Step RT-PCR (Qiagen, CA) using influenza A specific
primers for HA as described previously [28].
These data were supplemented with 104 additional HA1
sequences from H1 North American swine influenza viruses
sampled during 2003–2010 that were downloaded from the
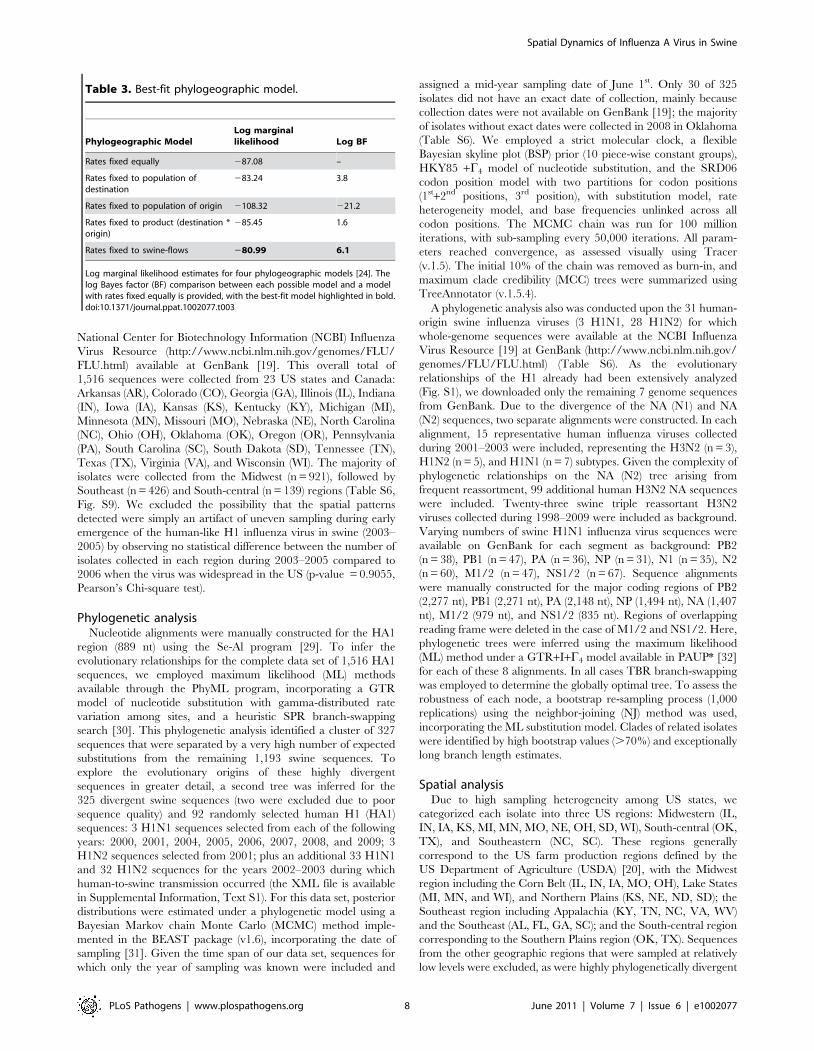
Table 2. Viral migration patterns.
SC-to-SE SC-to-MW SE-to-MW SE-to-SC MW-to-SC MW-to-SE
Mean (95% HPD) 0.14 (0, 1) 9.4 (7, 12) 13.1 (10, 16) 0 (0, 0) 0.39 (0, 2) 3.3 (2, 6)
Swine-flows 232,596 14,528,536 17,584,512 50,080 275,932 1,086,101
Swine-flows/intro 1,661,400 1,545,589 1,342,329 n/a 707,518 329,121
The number of viral introductions is represented by the Markov jump counts (posterior expected number of location state transitions, with 95% highest posteriordensity [HPD] intervals) between the three key US regions: South-central (SC), Southeast (SE), and Midwest (MW). The highest estimates of expected location statetransitions are highlighted in bold. Using the estimated number of pigs transported between regions (‘swine-flows’) during years that are well sampled in our study(2005–2008) (Table S2), we estimate the number of pigs transported along each inter-regional route per viral introduction.doi:10.1371/journal.ppat.1002077.t002
Figure 4. Phylogenetic relationships of the NA (N2) segment. Phylogenetic relationships of the NA (N2) segment (1,407 nt) of 28 human-origin H1 swine influenza viruses, 5 representative human H1N2 influenza viruses, 99 representative H3N2 human influenza viruses, and 60 classicaland triple reassortant swine influenza viruses, collected in 1998–2009. Rooting, scaling, labels, and color-coding are identical to Fig. 3, with theaddition of ‘Swine H3N2 Clade IV’. Phylogenetic relationships of the N1 sequences (n = 3) contained in cluster 1 are depicted in Fig. S5.doi:10.1371/journal.ppat.1002077.g004
Spatial Dynamics of Influenza A Virus in Swine
PLoS Pathogens | www.plospathogens.org 7 June 2011 | Volume 7 | Issue 6 | e1002077
National Center for Biotechnology Information (NCBI) Influenza
Virus Resource (http://www.ncbi.nlm.nih.gov/genomes/FLU/
FLU.html) available at GenBank [19]. This overall total of
1,516 sequences were collected from 23 US states and Canada:
Arkansas (AR), Colorado (CO), Georgia (GA), Illinois (IL), Indiana
(IN), Iowa (IA), Kansas (KS), Kentucky (KY), Michigan (MI),
Minnesota (MN), Missouri (MO), Nebraska (NE), North Carolina
(NC), Ohio (OH), Oklahoma (OK), Oregon (OR), Pennsylvania
(PA), South Carolina (SC), South Dakota (SD), Tennessee (TN),
Texas (TX), Virginia (VA), and Wisconsin (WI). The majority of
isolates were collected from the Midwest (n = 921), followed by
Southeast (n = 426) and South-central (n = 139) regions (Table S6,
Fig. S9). We excluded the possibility that the spatial patterns
detected were simply an artifact of uneven sampling during early
emergence of the human-like H1 influenza virus in swine (2003–
2005) by observing no statistical difference between the number of
isolates collected in each region during 2003–2005 compared to
2006 when the virus was widespread in the US (p-value = 0.9055,
Pearson’s Chi-square test).
Phylogenetic analysisNucleotide alignments were manually constructed for the HA1
region (889 nt) using the Se-Al program [29]. To infer the
evolutionary relationships for the complete data set of 1,516 HA1
sequences, we employed maximum likelihood (ML) methods
available through the PhyML program, incorporating a GTR
model of nucleotide substitution with gamma-distributed rate
variation among sites, and a heuristic SPR branch-swapping
search [30]. This phylogenetic analysis identified a cluster of 327
sequences that were separated by a very high number of expected
substitutions from the remaining 1,193 swine sequences. To
explore the evolutionary origins of these highly divergent
sequences in greater detail, a second tree was inferred for the
325 divergent swine sequences (two were excluded due to poor
sequence quality) and 92 randomly selected human H1 (HA1)
sequences: 3 H1N1 sequences selected from each of the following
years: 2000, 2001, 2004, 2005, 2006, 2007, 2008, and 2009; 3
H1N2 sequences selected from 2001; plus an additional 33 H1N1
and 32 H1N2 sequences for the years 2002–2003 during which
human-to-swine transmission occurred (the XML file is available
in Supplemental Information, Text S1). For this data set, posterior
distributions were estimated under a phylogenetic model using a
Bayesian Markov chain Monte Carlo (MCMC) method imple-
mented in the BEAST package (v1.6), incorporating the date of
sampling [31]. Given the time span of our data set, sequences for
which only the year of sampling was known were included and
assigned a mid-year sampling date of June 1st. Only 30 of 325
isolates did not have an exact date of collection, mainly because
collection dates were not available on GenBank [19]; the majority
of isolates without exact dates were collected in 2008 in Oklahoma
(Table S6). We employed a strict molecular clock, a flexible
Bayesian skyline plot (BSP) prior (10 piece-wise constant groups),
HKY85 +C4 model of nucleotide substitution, and the SRD06
codon position model with two partitions for codon positions
(1st+2nd positions, 3rd position), with substitution model, rate
heterogeneity model, and base frequencies unlinked across all
codon positions. The MCMC chain was run for 100 million
iterations, with sub-sampling every 50,000 iterations. All param-
eters reached convergence, as assessed visually using Tracer
(v.1.5). The initial 10% of the chain was removed as burn-in, and
maximum clade credibility (MCC) trees were summarized using
TreeAnnotator (v.1.5.4).
A phylogenetic analysis also was conducted upon the 31 human-
origin swine influenza viruses (3 H1N1, 28 H1N2) for which
whole-genome sequences were available at the NCBI Influenza
Virus Resource [19] at GenBank (http://www.ncbi.nlm.nih.gov/
genomes/FLU/FLU.html) (Table S6). As the evolutionary
relationships of the H1 already had been extensively analyzed
(Fig. S1), we downloaded only the remaining 7 genome sequences
from GenBank. Due to the divergence of the NA (N1) and NA
(N2) sequences, two separate alignments were constructed. In each
alignment, 15 representative human influenza viruses collected
during 2001–2003 were included, representing the H3N2 (n = 3),
H1N2 (n = 5), and H1N1 (n = 7) subtypes. Given the complexity of
phylogenetic relationships on the NA (N2) tree arising from
frequent reassortment, 99 additional human H3N2 NA sequences
were included. Twenty-three swine triple reassortant H3N2
viruses collected during 1998–2009 were included as background.
Varying numbers of swine H1N1 influenza virus sequences were
available on GenBank for each segment as background: PB2
(n = 38), PB1 (n = 47), PA (n = 36), NP (n = 31), N1 (n = 35), N2
(n = 60), M1/2 (n = 47), NS1/2 (n = 67). Sequence alignments
were manually constructed for the major coding regions of PB2
(2,277 nt), PB1 (2,271 nt), PA (2,148 nt), NP (1,494 nt), NA (1,407
nt), M1/2 (979 nt), and NS1/2 (835 nt). Regions of overlapping
reading frame were deleted in the case of M1/2 and NS1/2. Here,
phylogenetic trees were inferred using the maximum likelihood
(ML) method under a GTR+I+C4 model available in PAUP* [32]
for each of these 8 alignments. In all cases TBR branch-swapping
was employed to determine the globally optimal tree. To assess the
robustness of each node, a bootstrap re-sampling process (1,000
replications) using the neighbor-joining (NJ) method was used,
incorporating the ML substitution model. Clades of related isolates
were identified by high bootstrap values (.70%) and exceptionally
long branch length estimates.
Spatial analysisDue to high sampling heterogeneity among US states, we
categorized each isolate into three US regions: Midwestern (IL,
IN, IA, KS, MI, MN, MO, NE, OH, SD, WI), South-central (OK,
TX), and Southeastern (NC, SC). These regions generally
correspond to the US farm production regions defined by the
US Department of Agriculture (USDA) [20], with the Midwest
region including the Corn Belt (IL, IN, IA, MO, OH), Lake States
(MI, MN, and WI), and Northern Plains (KS, NE, ND, SD); the
Southeast region including Appalachia (KY, TN, NC, VA, WV)
and the Southeast (AL, FL, GA, SC); and the South-central region
corresponding to the Southern Plains region (OK, TX). Sequences
from the other geographic regions that were sampled at relatively
low levels were excluded, as were highly phylogenetically divergent
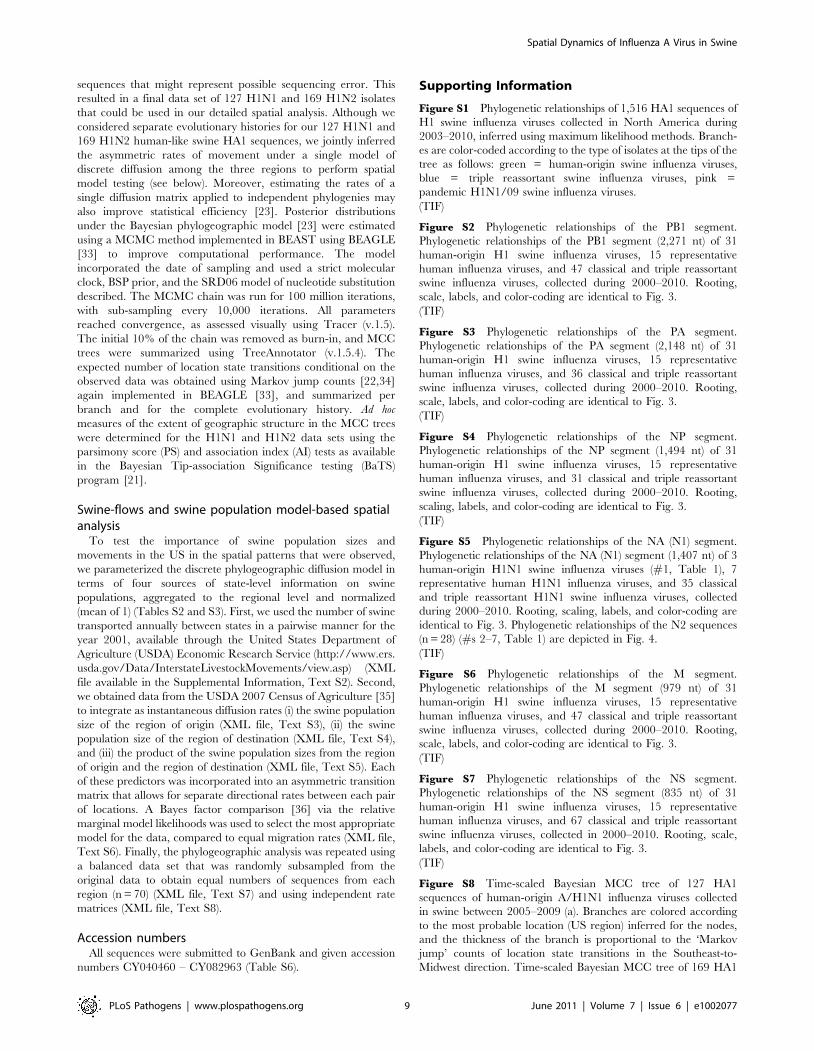
Table 3. Best-fit phylogeographic model.
Phylogeographic ModelLog marginallikelihood Log BF
Rates fixed equally 287.08 –
Rates fixed to population ofdestination
283.24 3.8
Rates fixed to population of origin 2108.32 221.2
Rates fixed to product (destination *origin)
285.45 1.6
Rates fixed to swine-flows 280.99 6.1
Log marginal likelihood estimates for four phylogeographic models [24]. Thelog Bayes factor (BF) comparison between each possible model and a modelwith rates fixed equally is provided, with the best-fit model highlighted in bold.doi:10.1371/journal.ppat.1002077.t003
Spatial Dynamics of Influenza A Virus in Swine
PLoS Pathogens | www.plospathogens.org 8 June 2011 | Volume 7 | Issue 6 | e1002077
sequences that might represent possible sequencing error. This
resulted in a final data set of 127 H1N1 and 169 H1N2 isolates
that could be used in our detailed spatial analysis. Although we
considered separate evolutionary histories for our 127 H1N1 and
169 H1N2 human-like swine HA1 sequences, we jointly inferred
the asymmetric rates of movement under a single model of
discrete diffusion among the three regions to perform spatial
model testing (see below). Moreover, estimating the rates of a
single diffusion matrix applied to independent phylogenies may
also improve statistical efficiency [23]. Posterior distributions
under the Bayesian phylogeographic model [23] were estimated
using a MCMC method implemented in BEAST using BEAGLE
[33] to improve computational performance. The model
incorporated the date of sampling and used a strict molecular
clock, BSP prior, and the SRD06 model of nucleotide substitution
described. The MCMC chain was run for 100 million iterations,
with sub-sampling every 10,000 iterations. All parameters
reached convergence, as assessed visually using Tracer (v.1.5).
The initial 10% of the chain was removed as burn-in, and MCC
trees were summarized using TreeAnnotator (v.1.5.4). The
expected number of location state transitions conditional on the
observed data was obtained using Markov jump counts [22,34]
again implemented in BEAGLE [33], and summarized per
branch and for the complete evolutionary history. Ad hoc
measures of the extent of geographic structure in the MCC trees
were determined for the H1N1 and H1N2 data sets using the
parsimony score (PS) and association index (AI) tests as available
in the Bayesian Tip-association Significance testing (BaTS)
program [21].
Swine-flows and swine population model-based spatialanalysis
To test the importance of swine population sizes and
movements in the US in the spatial patterns that were observed,
we parameterized the discrete phylogeographic diffusion model in
terms of four sources of state-level information on swine
populations, aggregated to the regional level and normalized
(mean of 1) (Tables S2 and S3). First, we used the number of swine
transported annually between states in a pairwise manner for the
year 2001, available through the United States Department of
Agriculture (USDA) Economic Research Service (http://www.ers.
usda.gov/Data/InterstateLivestockMovements/view.asp) (XML
file available in the Supplemental Information, Text S2). Second,
we obtained data from the USDA 2007 Census of Agriculture [35]
to integrate as instantaneous diffusion rates (i) the swine population
size of the region of origin (XML file, Text S3), (ii) the swine
population size of the region of destination (XML file, Text S4),
and (iii) the product of the swine population sizes from the region
of origin and the region of destination (XML file, Text S5). Each
of these predictors was incorporated into an asymmetric transition
matrix that allows for separate directional rates between each pair
of locations. A Bayes factor comparison [36] via the relative
marginal model likelihoods was used to select the most appropriate
model for the data, compared to equal migration rates (XML file,
Text S6). Finally, the phylogeographic analysis was repeated using
a balanced data set that was randomly subsampled from the
original data to obtain equal numbers of sequences from each
region (n = 70) (XML file, Text S7) and using independent rate
matrices (XML file, Text S8).
Accession numbersAll sequences were submitted to GenBank and given accession
numbers CY040460 – CY082963 (Table S6).
Supporting Information
Figure S1 Phylogenetic relationships of 1,516 HA1 sequences of
H1 swine influenza viruses collected in North America during
2003–2010, inferred using maximum likelihood methods. Branch-
es are color-coded according to the type of isolates at the tips of the
tree as follows: green = human-origin swine influenza viruses,
blue = triple reassortant swine influenza viruses, pink =
pandemic H1N1/09 swine influenza viruses.
(TIF)
Figure S2 Phylogenetic relationships of the PB1 segment.
Phylogenetic relationships of the PB1 segment (2,271 nt) of 31
human-origin H1 swine influenza viruses, 15 representative
human influenza viruses, and 47 classical and triple reassortant
swine influenza viruses, collected during 2000–2010. Rooting,
scale, labels, and color-coding are identical to Fig. 3.
(TIF)
Figure S3 Phylogenetic relationships of the PA segment.
Phylogenetic relationships of the PA segment (2,148 nt) of 31
human-origin H1 swine influenza viruses, 15 representative
human influenza viruses, and 36 classical and triple reassortant
swine influenza viruses, collected during 2000–2010. Rooting,
scale, labels, and color-coding are identical to Fig. 3.
(TIF)
Figure S4 Phylogenetic relationships of the NP segment.
Phylogenetic relationships of the NP segment (1,494 nt) of 31
human-origin H1 swine influenza viruses, 15 representative
human influenza viruses, and 31 classical and triple reassortant
swine influenza viruses, collected during 2000–2010. Rooting,
scaling, labels, and color-coding are identical to Fig. 3.
(TIF)
Figure S5 Phylogenetic relationships of the NA (N1) segment.
Phylogenetic relationships of the NA (N1) segment (1,407 nt) of 3
human-origin H1N1 swine influenza viruses (#1, Table 1), 7
representative human H1N1 influenza viruses, and 35 classical
and triple reassortant H1N1 swine influenza viruses, collected
during 2000–2010. Rooting, scaling, labels, and color-coding are
identical to Fig. 3. Phylogenetic relationships of the N2 sequences
(n = 28) (#s 2–7, Table 1) are depicted in Fig. 4.
(TIF)
Figure S6 Phylogenetic relationships of the M segment.
Phylogenetic relationships of the M segment (979 nt) of 31
human-origin H1 swine influenza viruses, 15 representative
human influenza viruses, and 47 classical and triple reassortant
swine influenza viruses, collected during 2000–2010. Rooting,
scale, labels, and color-coding are identical to Fig. 3.
(TIF)
Figure S7 Phylogenetic relationships of the NS segment.
Phylogenetic relationships of the NS segment (835 nt) of 31
human-origin H1 swine influenza viruses, 15 representative
human influenza viruses, and 67 classical and triple reassortant
swine influenza viruses, collected in 2000–2010. Rooting, scale,
labels, and color-coding are identical to Fig. 3.
(TIF)
Figure S8 Time-scaled Bayesian MCC tree of 127 HA1
sequences of human-origin A/H1N1 influenza viruses collected
in swine between 2005–2009 (a). Branches are colored according
to the most probable location (US region) inferred for the nodes,
and the thickness of the branch is proportional to the ‘Markov
jump’ counts of location state transitions in the Southeast-to-
Midwest direction. Time-scaled Bayesian MCC tree of 169 HA1
Spatial Dynamics of Influenza A Virus in Swine
PLoS Pathogens | www.plospathogens.org 9 June 2011 | Volume 7 | Issue 6 | e1002077
sequences of human-origin A/H1N1 influenza viruses collected in
swine between 2005–2010 (b). Branches are colored according to
the most probable location (US region) inferred for the nodes, and
the thickness of the branch is proportional to the ‘Markov jump’
counts of location state transitions in the South-central-to-Midwest
direction.
(TIF)
Figure S9 The number of H1 swine influenza virus isolates
collected from each of the three US regions – South-central
(green), Southeast (red), and Midwest (blue) – and other localities
in the US and Canada (purple) during the study period 2003–2010
for: (a) the entire data set of 1,516 isolates and (b) the 325 human-
origin H1 swine influenza virus isolates.
(TIF)
Figure S10 Fig. 2, including isolate names.
(EPS)
Table S1 Time to the most recent common ancestor (TMRCA)
of human-origin H1N1 and H1N2 influenza viruses in North
American swine. Mean TMRCA estimates, with credible intervals,
for parent and descendent nodes of the branch along which
human-to-swine transmission occurred. Estimated date of emer-
gence in swine is the difference between the TMRCA and the date
of the most recently collected isolate for H1N1 (A/Swine/Illinois/
03036/2010, June 24, 2010) and H1N2 (A/Swine/Minnesota/
03043/2010, July 7, 2010).
(DOCX)
Table S2 ‘Swine-flows’ between US regions, 2001. Number of
pigs transported between US regions in a pairwise manner during
2001, aggregated from the state level. Data compiled from State
certificates of veterinary inspection for animals for feeding and
breeding, and hence reflect general patterns but underestimate
actual flows. Available through the United States Department of
Agriculture (USDA) Economic Research Service (http://www.ers.
usda.gov/Data/InterstateLivestockMovements/view.asp).
(DOCX)
Table S3 US swine populations, 2007. Number of hogs and pigs
recorded in each region, aggregated from the state level, in 2007.
Data based on inventory and sales, available from the USDA 2007
Census of Agriculture [35].
(DOCX)
Table S4 Comparison of viral migration patterns in the full data
set and subset of data with equal sampling in 3 regions. The
number of viral introductions is represented by the Markov jump
counts (number of expected location state transitions) with 95%
highest posterior density (HPD) intervals between the three key US
regions: South-central (SC), Southeast (SE), and Midwest (MW),
for three data sets: (a) the entire data set of human-origin H1 swine
influenza viruses (n = 325 isolates) using combined rate matrices
(see Table 2), (b) a subsampled data set including equal numbers
(n = 70) of isolates randomly sampled from each region (MW, SC,
and SE), and (c) the entire data set using separate rate matrices.
(DOCX)
Table S5 Best-fit phylogeographic model. Log marginal likeli-
hood estimates for four phylogeographic models [24]. The log
Bayes factor (BF) comparison between each possible model and a
model with rates fixed equally is provided, with the best-fit model
highlighted in bold, for both (a) all data (see Table 3) and (b) a
subsampled data set including 70 isolates randomly sampled from
each region (MW, SC, and SE).
(DOCX)
Table S6 Accession numbers for entire data set (n = 1,516) of
swine influenza virus HA1 (H1) sequences used in this analysis,
including the 1,412 sequences newly generated in this analysis.
GenBank accession numbers (HA), isolate name, and collection
date, when available, are listed. The 325 human-origin swine
influenza viruses are identified as ‘human’, with the isolates that are
associated with cluster 7 denoted in parentheses. The 31 isolates for
which whole-genome sequences are available on GenBank are
identified with the accession number for the PB2 segment.
(DOCX)
Text S1 Background XML. XML file used to infer Bayesian
time-scaled phylogeny for the entire data set of 325 human-origin
H1 swine influenza viruses and 92 background human H1N1 and
H1N2 influenza viruses (Fig. 2).
(TXT)
Text S2 ‘Swineflows’ XML. XML file used to infer Bayesian
time-scaled phylogeny for 127 human H1N1-origin swine
influenza viruses and 169 H1N2 human-origin swine influenza
viruses, parameterized with data on the number of swine
transported annually between US states (Tables 3 and S2).
(TXT)
Text S3 Origins XML. XML file used to infer Bayesian time-
scaled phylogeny for 127 human H1N1-origin swine influenza
viruses and 169 H1N2 human-origin swine influenza viruses,
parameterized with the swine population size of the US region of
origin (Tables 3 and S3).
(TXT)
Text S4 Destinations XML. XML file used to infer Bayesian
time-scaled phylogeny for 127 human H1N1-origin swine
influenza viruses and 169 H1N2 human-origin swine influenza
viruses, parameterized the swine population size of the US region
of destination (Tables 3 and S3).
(TXT)
Text S5 Gravity XML. XML file used to infer Bayesian time-
scaled phylogeny for 127 human H1N1-origin swine influenza
viruses and 169 H1N2 human-origin swine influenza viruses,
parameterized with the product of the swine population sizes from
the region of origin and the region of destination (Tables 3 and S3).
(TXT)
Text S6 Equal rates XML. XML file used to infer Bayesian
time-scaled phylogeny for 127 human H1N1-origin swine
influenza viruses and 169 H1N2 human-origin swine influenza
viruses, with equal diffusion rates (Table 3).
(TXT)
Text S7 Subsample XML. XML file used to infer Bayesian time-
scaled phylogeny for a human H1-origin swine influenza virus
data set that was randomly subsampled from the original data to
obtain equal numbers of sequences from each region (n = 70)
(Tables S4 and S5).
(TXT)
Text S8 Independent rates XML. XML file used to infer
Bayesian time-scaled phylogeny for 127 human H1N1-origin
swine influenza viruses and 169 H1N2 human-origin swine
influenza viruses, allowing for independent rate matrices (Tables
S4 and S5).
(TXT)
Acknowledgments
We would like to thank Kevin Juleen for data retrieval and the Los Alamos
National Laboratory (LANL) for assistance with database management.
Spatial Dynamics of Influenza A Virus in Swine
PLoS Pathogens | www.plospathogens.org 10 June 2011 | Volume 7 | Issue 6 | e1002077
Author Contributions
Conceived and designed the experiments: MIN PL MAS AR ECH.
Performed the experiments: AV SD MG. Analyzed the data: MIN PL YT
TTYL MAS CV AR ECH. Wrote the paper: MIN PL AV CV MAS AR
ECH MG.
References
1. Koen JS (1918) A practical method for field diagnosis of swine diseases. Am J Vet
Med 14: 468–470.
2. Smith GJD, Bahl J, Vijaykrishna D, Zhand J, Poon LLM, et al. (2009) Datingthe emergence of pandemic influenza viruses. Proc Natl Acad Sci 106:
11709–11712.3. Gaydos JC, Hodder RA, Top FH, Jr., Soden VJ, Allen RG, et al. (1977) Swine
influenza A at Fort Dix, New Jersey (January-February 1976). I. Case findingand clinical study of cases. , J Infect Dis 136(Suppl): S356–362.
4. Garten RJ, David CT, Russell CA, Shu B, Lindstrom S, et al. (2009) Antigenic
and genetic characteristics of swine-origin 2009 A(H1N1) influenza virusescirculating in humans. Science 325: 197–201.
5. Smith GJ, Vijaykrishna D, Bahl J, Lycet SJ, Worobey M, et al. (2009) Originsand evolutionary genomics of the 2009 swine-origin H1N1 influenza A
epidemic. Nature 459: 1122–1125.
6. Chambers TM, Hinshaw VS, Kawaoka Y, Easterday BC, Webster RG (1991)Influenza viral infection of swine in the United States 1988–1989. Arch Virol
116: 261–265.7. Zhou NN, Senne DA, Landgraf JS, Swenson SL, Erickson G, et al. (1999)
Genetic reassortment of avian, swine, and human influenza A viruses inAmerican pigs. J Virol 73: 8851–8856.
8. Webby RJ, Swenson SL, Krauss SL, Gerrish PJ, Goyal SM, et al. (2000)
Evolution of swine H3N2 influenza viruses in the United States. J Virol 74:8243–8251.
9. Olsen CW, Karasin AI, Carman S, Li Y, Bastien N, et al. (2006) Triplereassortant H3N2 influenza A viruses, Canada, 2005. Emerg Infect Dis 12:
1132–1135.
10. Karasin AI, Olsen CW, Anderson GA (2000) Genetic characterization of anH1N2 influenza virus isolated from a pig in Indiana. J Clin Microbiol 38:
2453–2456.11. Karasin AI, Landgraf J, Swenson S, Erickson G, Goyal S, et al. (2002) Genetic
characterization of H1N2 influenza A viruses isolated from pigs throughout theUnited States. J Clin Microbiol 40: 1073–1079.
12. Karasin AI, Carman S, Olsen CW (2006) Identification of human H1N2 and
human-swine reassortant H1N2 and H1N1 influenza A viruses among pigs inOntario, Canada (2003 to 2005). J Clin Microbiol 44: 1123–1126.
13. Vincent AL, Ma W, Lager KM, Gramer MR, Richt JA, et al. (2009)Characterization of a newly emerged genetic cluster of H1N1 and H1N2 swine
influenza virus in the United States. Virus Genes 39: 176–185.
14. Shields DA, Mathews KH, Jr. Interstate Livestock Movements. EconomicResearch Service reports. Available: http://www.ers.usda.gov/publications/
ldp/jun03/ldpm10801/. Accessed 8 August 2010.15. McBride W, Key N Economic and structure relationships in US hog production.
Economic Research Service reports. Available: http://www.ers.usda.gov/Publications/AER818/. Accessed 8 August 2010.
16. Vijaykrishna D, Poon LL, Zhu CH, Ma SK, Li OT, et al. (2010) Reassortment
of pandemic H1N1/2009 influenza A virus in swine. Science 328: 1529.17. Gregory V, Bennett M, Orkhan MH, Al Hajjar S, Varsano N, et al. (2002)
Emergence of influenza A H1N2 reassortant viruses in the human populationduring 2001. Virology 300: 1–7.
18. Anonymous. Update: influenza activity – United States and worldwide, 2002-03
season, and composition of the 2003-04 influenza vaccine. MMWR 52:
516–521.
19. Bao Y, Bolotov P, Dernovoy D, Kiryutin B, Zaslavsky L, et al. (2008) The
influenza virus resource at the National Center for Biotechnology Information.
J Virol 82: 596–601.
20. Anonymous Agriculture Fact Book, United States Department of Agriculture
(USDA). Available: http://www.usda.gov/news/pubs/fbook98/ch2a.htm.
21. Parker J, Rambaut A, Pybus OG (2008) Correlating viral phenotypes with
phylogeny: accounting for phylogenetic uncertainty. Infect Genet Evol 8:
239–246.
22. Minin VN, Suchard MA (2008) Counting labeled transitions in continuous-time
Markov models of evolution. J Math Biol 56: 391–412.
23. Lemey P, Rambaut A, Drummond AJ, Suchard MA (2009) Bayesian
phylogeography finds its roots. PLoS Comput Biol 5: e1000520.
24. Suchard MA, Redelings BD (2006) Bali-Phy: simultaneous Bayesian inference of
alignment and phylogeny. Bioinformatics 22: 2047–2048.
25. Thacker E, Janke B (2008) Swine influenza virus: zoonotic potential and
vaccination strategies for the control of avian and swine influenzas. J Infect Dis
197 Suppl 1: S19–24.
26. Macken C, Lu H, Goodman J, Boykin L (2001) The value of a database in
surveillance and vaccine selection. In: Osterhaus ADME, Cox N, Hampson AW,
eds. Options for the Control of Influenza IV. Amsterdam: Elsevier Science. pp
103–106.
27. Meguro H, Bryant JD, Torrence AE, Wright PF (1979) Canine kidney cell line
for isolation of respiratory viruses. J Clin Microbiol 9: 175–179.
28. Hoffmann E, Stech J, Guan Y, Webster RG, Perez DR (2001) Universal primer
set for the full-length amplification of all influenza A viruses. Arch Virol 146:
2275–2289.
29. Rambaut A Sequence alignment editor, version 2.0. Available: http://tree.bio.
ed.ac.uk/software/seal/. Accessed 4 May 2010.
30. Guindon S, Gascuel O (2003) A simple, fast, and accurate algorithm to estimate
large phylogenies by maximum likelihood. Syst Biol 52: 696–704.
31. Drummond AJ, Rambaut A BEAST, version 1.6. Available: http://evolve.zoo.
ac.uk/beast. Accessed 14 September 2010.
32. Swofford DL (2003) PAUP*: Phylogenetic analysis using parsimony (*and other
methods), version 4.0. Sunderland, Massachusetts: Sinauer.
33. Suchard MA, Rambaut A (2009) Many-core algorithms for statistical
phylogenetics. Bioinformatics 25: 1370–1376.
34. Minin VN, Suchard MA (2008) Fast, accurate and simulation-free stochastic
mapping. Philos Trans R Soc Lond B Biol Sci 363: 3985–3995.
35. Anonymous 2007 Census of agriculture, United States: summary and state data.
pp. 402-410. Available at http://www.agcensus.usda.gov/Publications/2007/
Full_Report/Volume_1,_Chapter_2_County_Level/index.asp.
36. Suchard MA, Weiss RE, Sinsheimer JS (2001) Bayesian selection of continuous-
time Markov chain evolutionary models. Mol Evol Biol 18: 1001–1013.
Spatial Dynamics of Influenza A Virus in Swine
PLoS Pathogens | www.plospathogens.org 11 June 2011 | Volume 7 | Issue 6 | e1002077