airbus group h1 results 2016
TRANSCRIPT
AIRBUS GROUP
H1 RESULTS 2016
27 JULY 2016
TOM ENDERS Chief Executive Officer
HARALD WILHELM Chief Financial Officer
SAFE HARBOUR STATEMENT
This presentation includes forward-looking statements. Words such as “anticipates”, “believes”, “estimates”, “expects”, “intends”, “plans”,
“projects”, “may” and similar expressions are used to identify these forward-looking statements. Examples of forward-looking statements include
statements made about strategy, ramp-up and delivery schedules, introduction of new products and services and market expectations, as well as
statements regarding future performance and outlook.
By their nature, forward-looking statements involve risk and uncertainty because they relate to future events and circumstances and there are many
factors that could cause actual results and developments to differ materially from those expressed or implied by these forward-looking statements.
THESE FACTORS INCLUDE BUT ARE NOT LIMITED TO:
Changes in general economic, political or market conditions, including the cyclical nature of some of Airbus Group’s businesses;
Significant disruptions in air travel (including as a result of terrorist attacks);
Currency exchange rate fluctuations, in particular between the Euro and the U.S. dollar;
The successful execution of internal performance plans, including cost reduction and productivity efforts;
Product performance risks, as well as programme development and management risks;
Customer, supplier and subcontractor performance or contract negotiations, including financing issues;
Competition and consolidation in the aerospace and defence industry;
Significant collective bargaining labour disputes;
The outcome of political and legal processes including the availability of government financing for certain programmes and the size of defence and space
procurement budgets;
Research and development costs in connection with new products;
Legal, financial and governmental risks related to international transactions;
Legal and investigatory proceedings and other economic, political and technological risks and uncertainties.
As a result, Airbus Group’s actual results may differ materially from the plans, goals and expectations set forth in such forward-looking statements.
For a discussion of factors that could cause future results to differ from such forward-looking statements, see Airbus Group “Registration
Document” dated 5 April 2016.
Any forward-looking statement contained in this presentation speaks as of the date of this presentation. Airbus Group undertakes no obligation to
publicly revise or update any forward-looking statements in light of new information, future events or otherwise.
2
DISCLAIMER
H1 RESULTS 2016 3
GROUP
HIGHLIGHTS
DIVISIONAL
HIGHLIGHTS
GUIDANCE 2016
& KEY TAKEAWAYS
H1 2016 HIGHLIGHTS 4
Robust and diversified commercial backlog supporting ramp-up
H1 financials driven by back-loaded delivery schedule
Continued focus on ramp-up and transition
A400M and A350 programme charges recognised in Q2 2016
Significant progress on strategy to focus on core – material capital gains
2016 Guidance confirmed*
* On a constant perimeter
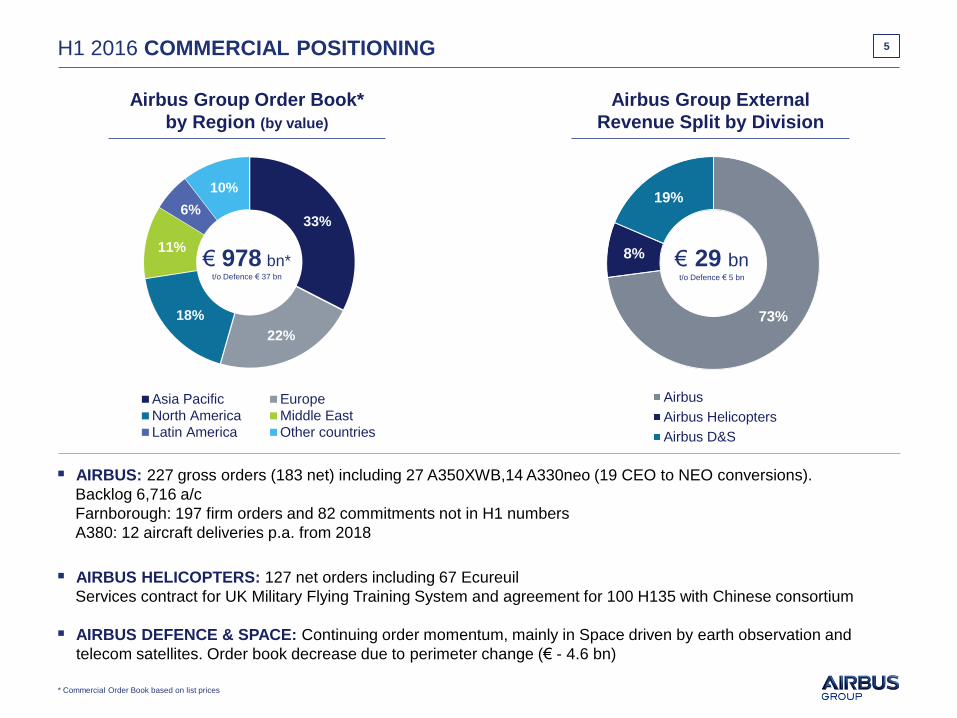
73%
8%
19%
Airbus
Airbus Helicopters
Airbus D&S
33%
22%
18%
11%
6%
10%
Asia Pacific Europe
North America Middle East
Latin America Other countries
H1 2016 COMMERCIAL POSITIONING
AIRBUS: 227 gross orders (183 net) including 27 A350XWB,14 A330neo (19 CEO to NEO conversions).
Backlog 6,716 a/c
Farnborough: 197 firm orders and 82 commitments not in H1 numbers
A380: 12 aircraft deliveries p.a. from 2018
AIRBUS HELICOPTERS: 127 net orders including 67 Ecureuil
Services contract for UK Military Flying Training System and agreement for 100 H135 with Chinese consortium
AIRBUS DEFENCE & SPACE: Continuing order momentum, mainly in Space driven by earth observation and
telecom satellites. Order book decrease due to perimeter change (€ - 4.6 bn)
5
* Commercial Order Book based on list prices
Airbus Group Order Book*
by Region (by value)
Airbus Group External
Revenue Split by Division
€ 978 bn* t/o Defence € 37 bn
€ 29 bn t/o Defence € 5 bn
1.47 1.41
3.41
0.00
0.50
1.00
1.50
2.00
2.50
3.00
3.50
4.00
-1.0
-3.2
1.2
-2
-2
-1
-1
0
1
1
2
2
0 0
1.88 1.68
6.5% 5.9%
4.13
0
1
2
3
4
5
6
29 29
64
0
10
20
30
40
50
60
70
80
H1 2016 FINANCIAL PERFORMANCE 6
* Pre-goodwill impairment and exceptionals; ** H1 2016 Average number of shares: 775,116,098 compared to 785,672,234 in H1 2015; Capitalised R&D: € 112 m in H1 2016 and € 76 m in H1 2015
in €
bn
in €
bn /
RoS
(%
)
in €
in €
bn
EPS** before one-off
Revenues EBIT* before one-off
FCF before M&A
FY Results
H1 2015 H1 2016
H1 2015 H1 2016 H1 2015 H1 2016
H1 2015 H1 2016
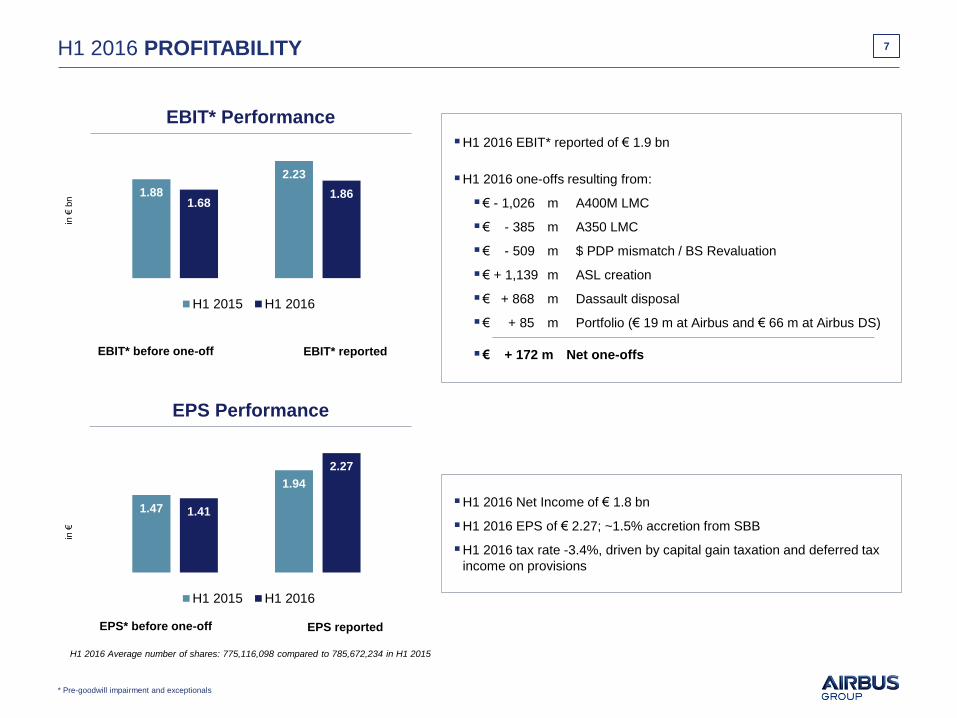
H1 2016 PROFITABILITY 7
* Pre-goodwill impairment and exceptionals
in €
H1 2016 EBIT* reported of € 1.9 bn
H1 2016 one-offs resulting from:
€ - 1,026 m A400M LMC
€ - 385 m A350 LMC
€ - 509 m $ PDP mismatch / BS Revaluation
€ + 1,139 m ASL creation
€ + 868 m Dassault disposal
€ + 85 m Portfolio (€ 19 m at Airbus and € 66 m at Airbus DS)
€ + 172 m Net one-offs
H1 2016 Net Income of € 1.8 bn
H1 2016 EPS of € 2.27; ~1.5% accretion from SBB
H1 2016 tax rate -3.4%, driven by capital gain taxation and deferred tax
income on provisions
in €
bn
EBIT* before one-off EBIT* reported
EBIT* Performance
1.88
2.23
1.68 1.86
H1 2015 H1 2016
EPS* before one-off EPS reported
EPS Performance
H1 2016 Average number of shares: 775,116,098 compared to 785,672,234 in H1 2015
1.47
1.94
1.41
2.27
H1 2015 H1 2016
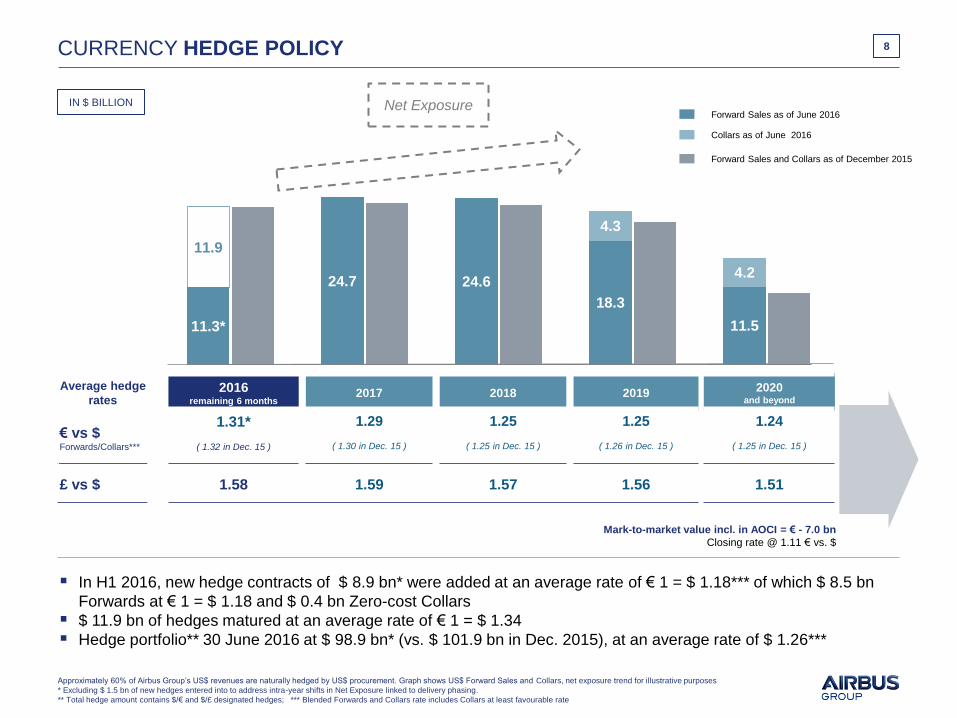
CURRENCY HEDGE POLICY 8
In H1 2016, new hedge contracts of $ 8.9 bn* were added at an average rate of € 1 = $ 1.18*** of which $ 8.5 bn
Forwards at € 1 = $ 1.18 and $ 0.4 bn Zero-cost Collars
$ 11.9 bn of hedges matured at an average rate of € 1 = $ 1.34
Hedge portfolio** 30 June 2016 at $ 98.9 bn* (vs. $ 101.9 bn in Dec. 2015), at an average rate of $ 1.26***
Mark-to-market value incl. in AOCI = € - 7.0 bn
Closing rate @ 1.11 € vs. $
Average hedge
rates 2016
remaining 6 months 2017 2018 ² 2019 2020
and beyond
€ vs $ Forwards/Collars***
1.31*
( 1.32 in Dec. 15 )
1.29
( 1.30 in Dec. 15 )
1.25
( 1.25 in Dec. 15 )
1.25
( 1.26 in Dec. 15 )
1.24
( 1.25 in Dec. 15 )
£ vs $ 1.58 1.59 1.57 1.56 1.51
IN $ BILLION Net Exposure
Collars as of June 2016
Forward Sales as of June 2016
Forward Sales and Collars as of December 2015
Approximately 60% of Airbus Group’s US$ revenues are naturally hedged by US$ procurement. Graph shows US$ Forward Sales and Collars, net exposure trend for illustrative purposes
* Excluding $ 1.5 bn of new hedges entered into to address intra-year shifts in Net Exposure linked to delivery phasing.
** Total hedge amount contains $/€ and $/£ designated hedges; *** Blended Forwards and Collars rate includes Collars at least favourable rate
11.3*
24.7 24.6
18.3
11.5
11.9
4.3
4.2
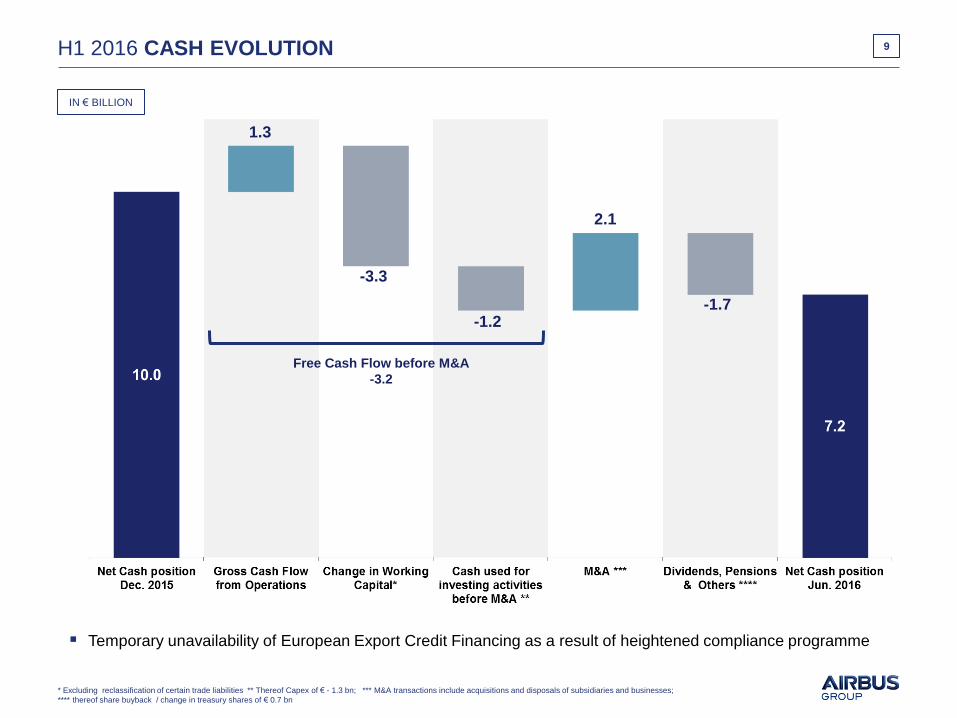
H1 2016 CASH EVOLUTION 9
* Excluding reclassification of certain trade liabilities ** Thereof Capex of € - 1.3 bn; *** M&A transactions include acquisitions and disposals of subsidiaries and businesses;
**** thereof share buyback / change in treasury shares of € 0.7 bn
Temporary unavailability of European Export Credit Financing as a result of heightened compliance programme
Free Cash Flow before M&A
-3.2
1.3
IN € BILLION
-3.3
-1.2
2.1
-1.7
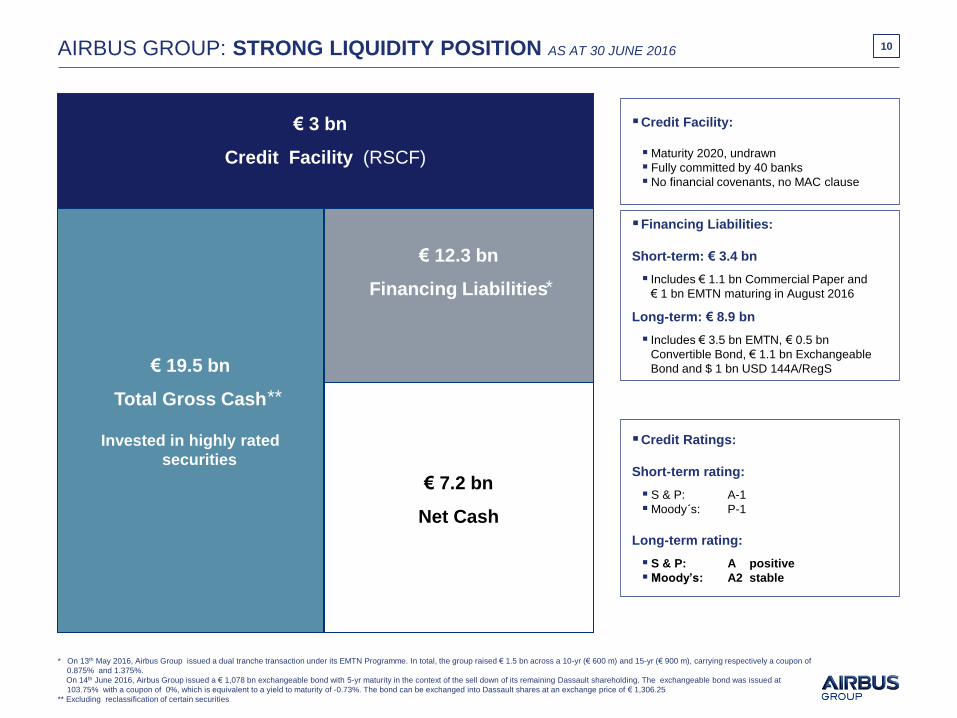
AIRBUS GROUP: STRONG LIQUIDITY POSITION AS AT 30 JUNE 2016 10
Credit Facility:
Maturity 2020, undrawn
Fully committed by 40 banks
No financial covenants, no MAC clause
Financing Liabilities:
Short-term: € 3.4 bn
Includes € 1.1 bn Commercial Paper and
€ 1 bn EMTN maturing in August 2016
Long-term: € 8.9 bn
Includes € 3.5 bn EMTN, € 0.5 bn
Convertible Bond, € 1.1 bn Exchangeable
Bond and $ 1 bn USD 144A/RegS
Credit Ratings:
Short-term rating:
S & P: A-1
Moody´s: P-1
Long-term rating:
S & P: A positive
Moody’s: A2 stable
* On 13th May 2016, Airbus Group issued a dual tranche transaction under its EMTN Programme. In total, the group raised € 1.5 bn across a 10-yr (€ 600 m) and 15-yr (€ 900 m), carrying respectively a coupon of
0.875% and 1.375%.
On 14th June 2016, Airbus Group issued a € 1,078 bn exchangeable bond with 5-yr maturity in the context of the sell down of its remaining Dassault shareholding. The exchangeable bond was issued at
103.75% with a coupon of 0%, which is equivalent to a yield to maturity of -0.73%. The bond can be exchanged into Dassault shares at an exchange price of € 1,306.25
** Excluding reclassification of certain securities
€ 7.2 bn
Net Cash
€ 19.5 bn
Total Gross Cash
Invested in highly rated
securities
€ 12.3 bn
Financing Liabilities
€ 3 bn
Credit Facility (RSCF)
*
**
11
GROUP
HIGHLIGHTS
DIVISIONAL
HIGHLIGHTS
GUIDANCE 2016
& KEY TAKEAWAYS
H1 RESULTS 2016
12
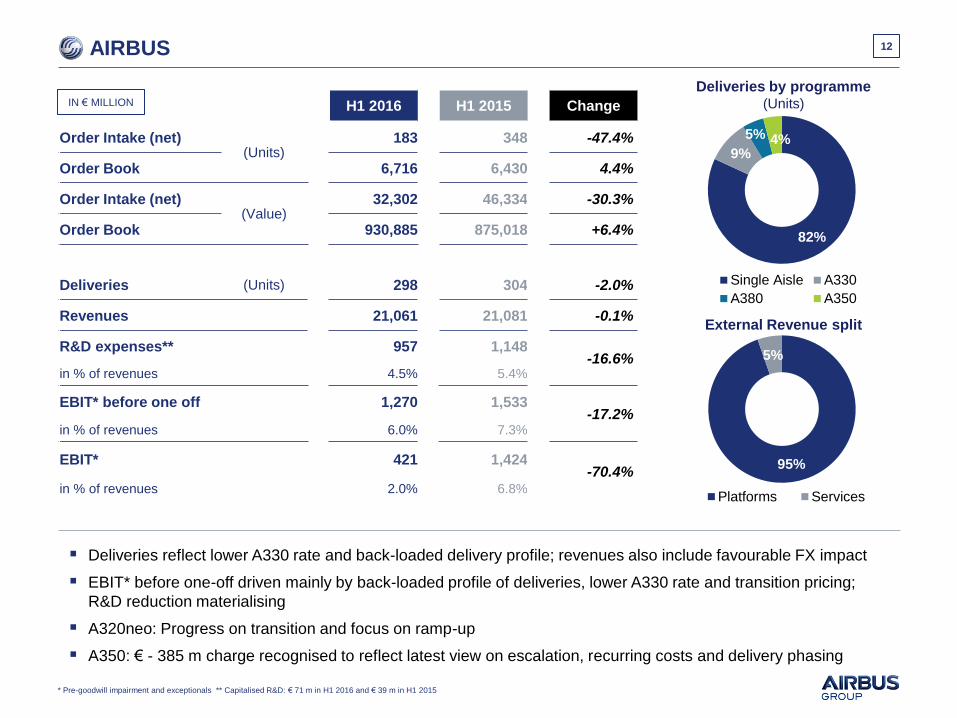
IN € MILLION
External Revenue split
Deliveries by programme (Units)
AIRBUS
* Pre-goodwill impairment and exceptionals ** Capitalised R&D: € 71 m in H1 2016 and € 39 m in H1 2015
Deliveries reflect lower A330 rate and back-loaded delivery profile; revenues also include favourable FX impact
EBIT* before one-off driven mainly by back-loaded profile of deliveries, lower A330 rate and transition pricing;
R&D reduction materialising
A320neo: Progress on transition and focus on ramp-up
A350: € - 385 m charge recognised to reflect latest view on escalation, recurring costs and delivery phasing
H1 2016 H1 2015 Change
Order Intake (net) (Units)
183 348 -47.4%
Order Book 6,716 6,430 4.4%
Order Intake (net) (Value)
32,302 46,334 -30.3%
Order Book 930,885 875,018 +6.4%
Deliveries (Units) 298 304 -2.0%
Revenues 21,061 21,081 -0.1%
R&D expenses** 957 1,148 -16.6%
in % of revenues 4.5% 5.4%
EBIT* before one off 1,270 1,533 -17.2%
in % of revenues 6.0% 7.3%
EBIT* 421 1,424 -70.4%
in % of revenues 2.0% 6.8%
82%
9%
5% 4%
Single Aisle A330
A380 A350
95%
5%
Platforms Services
13
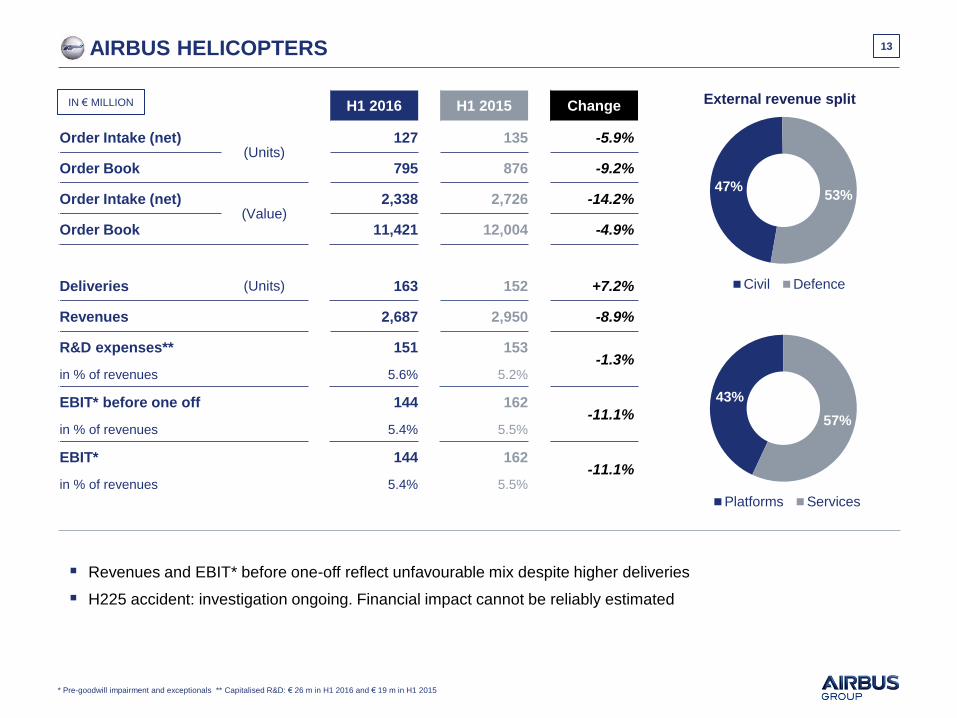
External revenue split
AIRBUS HELICOPTERS
* Pre-goodwill impairment and exceptionals ** Capitalised R&D: € 26 m in H1 2016 and € 19 m in H1 2015
H1 2016 H1 2015 Change
Order Intake (net) (Units)
127 135 -5.9%
Order Book 795 876 -9.2%
Order Intake (net) (Value)
2,338 2,726 -14.2%
Order Book 11,421 12,004 -4.9%
Deliveries (Units) 163 152 +7.2%
Revenues 2,687 2,950 -8.9%
R&D expenses** 151 153 -1.3%
in % of revenues 5.6% 5.2%
EBIT* before one off 144 162 -11.1%
in % of revenues 5.4% 5.5%
EBIT* 144 162 -11.1%
in % of revenues 5.4% 5.5%
Revenues and EBIT* before one-off reflect unfavourable mix despite higher deliveries
H225 accident: investigation ongoing. Financial impact cannot be reliably estimated
IN € MILLION
47% 53%
Civil Defence
43%
57%
Platforms Services
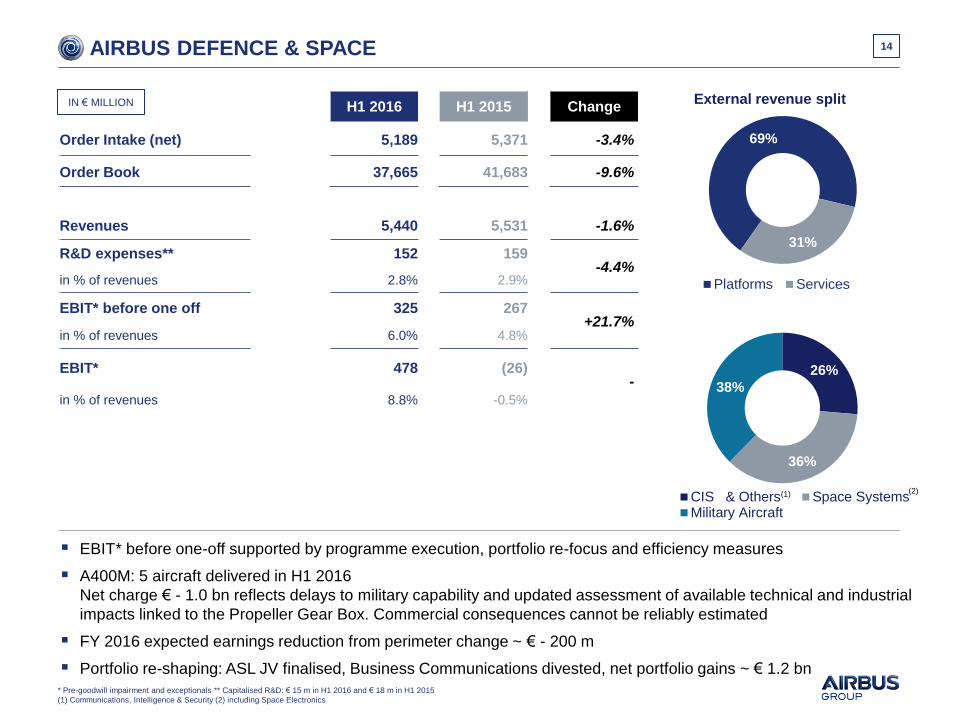
14 AIRBUS DEFENCE & SPACE
* Pre-goodwill impairment and exceptionals ** Capitalised R&D: € 15 m in H1 2016 and € 18 m in H1 2015
(1) Communications, Intelligence & Security (2) including Space Electronics
EBIT* before one-off supported by programme execution, portfolio re-focus and efficiency measures
A400M: 5 aircraft delivered in H1 2016
Net charge € - 1.0 bn reflects delays to military capability and updated assessment of available technical and industrial
impacts linked to the Propeller Gear Box. Commercial consequences cannot be reliably estimated
FY 2016 expected earnings reduction from perimeter change ~ € - 200 m
Portfolio re-shaping: ASL JV finalised, Business Communications divested, net portfolio gains ~ € 1.2 bn
External revenue split H1 2016 H1 2015 Change
Order Intake (net) 5,189 5,371 -3.4%
Order Book 37,665 41,683 -9.6%
Revenues 5,440 5,531 -1.6%
R&D expenses** 152 159 -4.4%
in % of revenues 2.8% 2.9%
EBIT* before one off 325 267 +21.7%
in % of revenues 6.0% 4.8%
EBIT* 478 (26) -
in % of revenues 8.8% -0.5%
IN € MILLION
(1) (2)
26%
36%
38%
CIS & Others Space SystemsMilitary Aircraft
69%
31%
Platforms Services
15
GROUP
HIGHLIGHTS
DIVISIONAL
HIGHLIGHTS
GUIDANCE 2016
& KEY TAKEAWAYS
H1 RESULTS 2016
2016 GUIDANCE 16
* Pre-goodwill impairment and exceptionals
As the basis for its 2016 guidance, Airbus Group expects the world economy and air traffic to grow
in line with prevailing independent forecasts, which assume no major disruptions
Airbus Group confirms its 2016 earnings and Free Cash Flow guidance based on a
constant perimeter:
Airbus expects to deliver more than 650 aircraft and the commercial order book is expected to
grow.
Before M&A, Airbus Group expects stable EBIT* before one-off and EPS* before one-off
compared to 2015.
Before M&A, Airbus Group expects to deliver stable Free Cash Flow compared to 2015, although
the A400M industrial situation and delivery re-scheduling makes the achievement of 2016 free
cash flow guidance more difficult. Export Credit Agency financing is targeted to resume in the
fourth quarter of 2016.
The perimeter change in Airbus Defence & Space implemented at H1 2016 is expected
to reduce EBIT* before one-off and Free Cash Flow before M&A by around € 200
million and EPS* before one-off by around 20 cents.
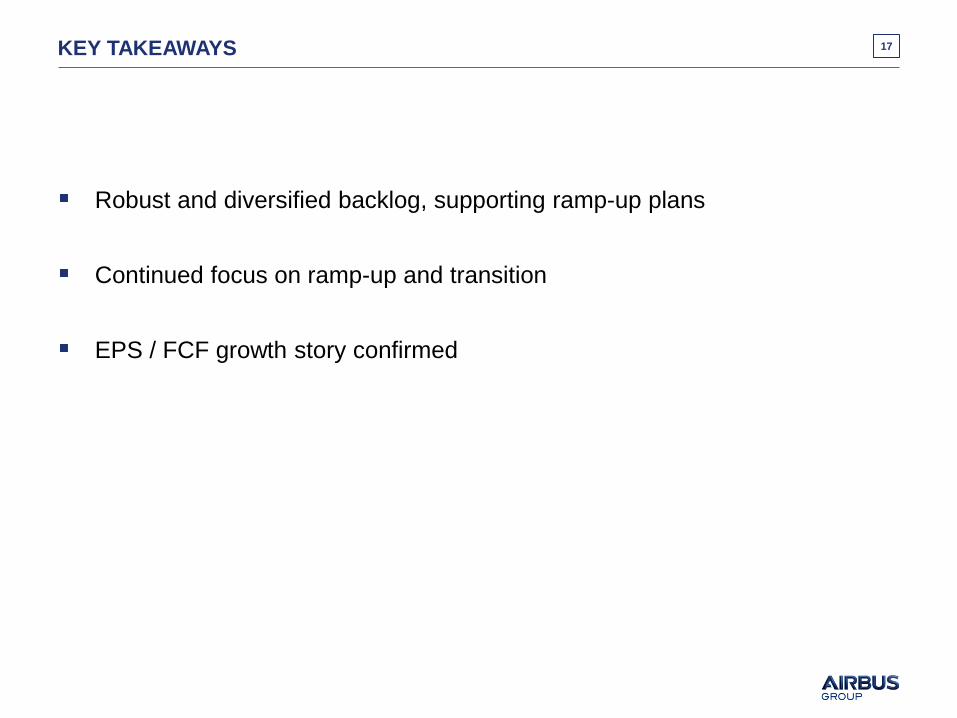
KEY TAKEAWAYS
Robust and diversified backlog, supporting ramp-up plans
Continued focus on ramp-up and transition
EPS / FCF growth story confirmed
17
18
APPENDIX
H1 RESULTS 2016
1.34
1.33
1.31
1.30
1.36
1.35
1.34
1.33
1.25
1.27
1.29
1.31
1.33
1.35
1.37
Q1 Q2 Q3 Q4
2016 E FY 2015
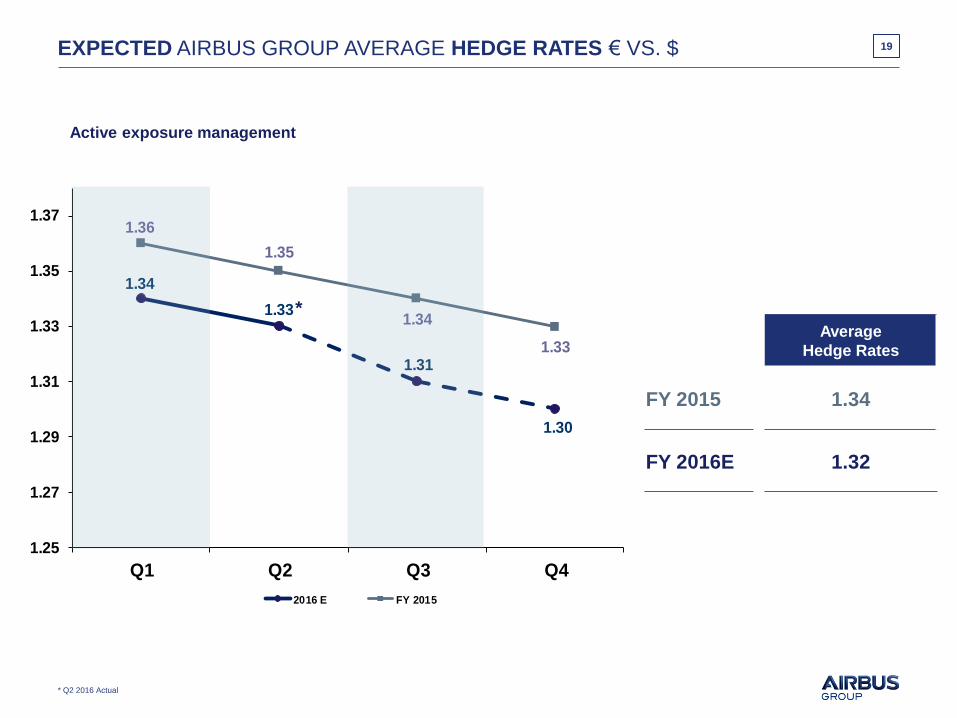
EXPECTED AIRBUS GROUP AVERAGE HEDGE RATES € VS. $ 19
Active exposure management
*
Average
Hedge Rates
FY 2015 1.34
FY 2016E 1.32
* Q2 2016 Actual
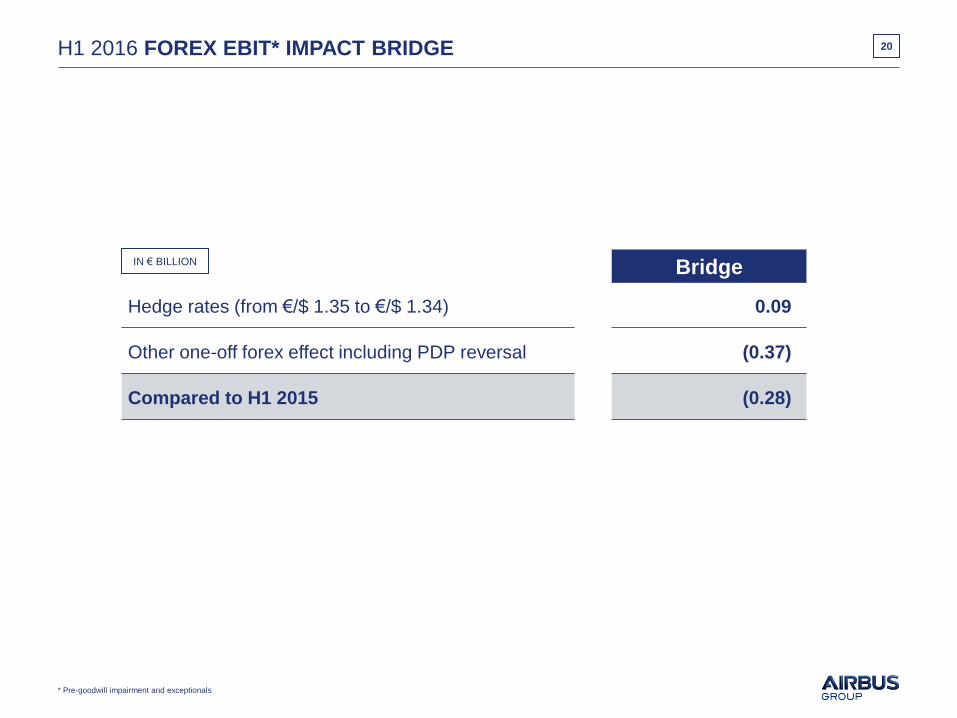
H1 2016 FOREX EBIT* IMPACT BRIDGE 20
* Pre-goodwill impairment and exceptionals
Bridge
Hedge rates (from €/$ 1.35 to €/$ 1.34) 0.09
Other one-off forex effect including PDP reversal (0.37)
Compared to H1 2015 (0.28)
IN € BILLION
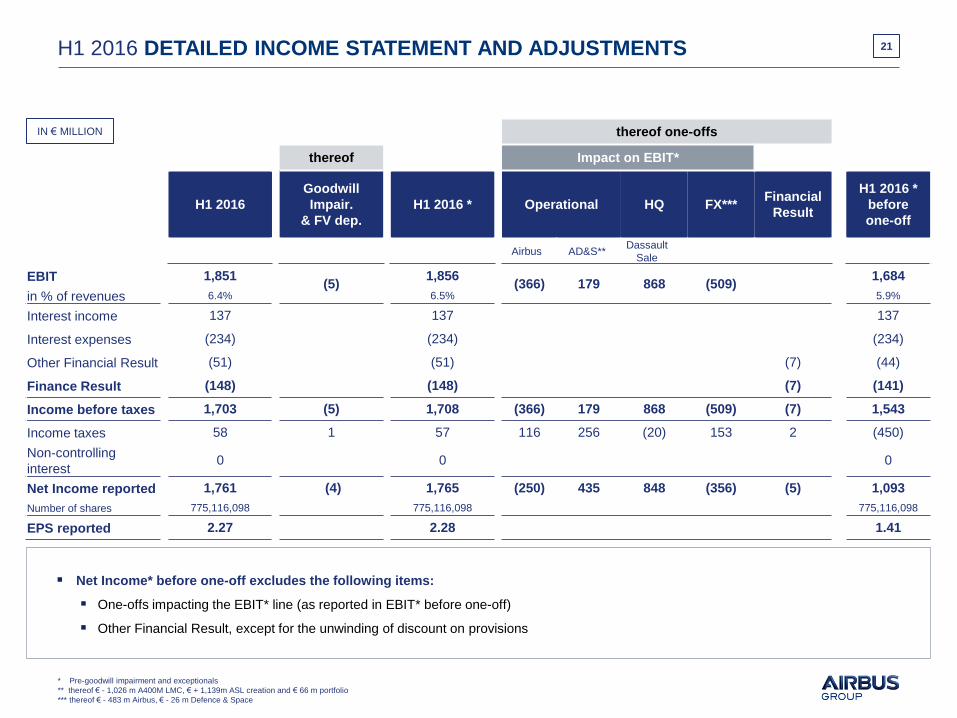
H1 2016 DETAILED INCOME STATEMENT AND ADJUSTMENTS 21
* Pre-goodwill impairment and exceptionals
** thereof € - 1,026 m A400M LMC, € + 1,139m ASL creation and € 66 m portfolio
*** thereof € - 483 m Airbus, € - 26 m Defence & Space
thereof one-offs
thereof Impact on EBIT*
H1 2016
Goodwill
Impair.
& FV dep.
H1 2016 * Operational HQ FX*** Financial
Result
H1 2016 *
before
one-off
Airbus AD&S** Dassault
Sale
EBIT 1,851 (5)
1,856 (366) 179 868 (509)
1,684
in % of revenues 6.4% 6.5% 5.9%
Interest income 137 137 137
Interest expenses (234) (234) (234)
Other Financial Result (51) (51) (7) (44)
Finance Result (148) (148) (7) (141)
Income before taxes 1,703 (5) 1,708 (366) 179 868 (509) (7) 1,543
Income taxes 58 1 57 116 256 (20) 153 2 (450)
Non-controlling
interest 0 0 0
Net Income reported 1,761 (4) 1,765 (250) 435 848 (356) (5) 1,093
Number of shares 775,116,098 775,116,098 775,116,098
EPS reported 2.27 2.28 1.41
Net Income* before one-off excludes the following items:
One-offs impacting the EBIT* line (as reported in EBIT* before one-off)
Other Financial Result, except for the unwinding of discount on provisions
IN € MILLION
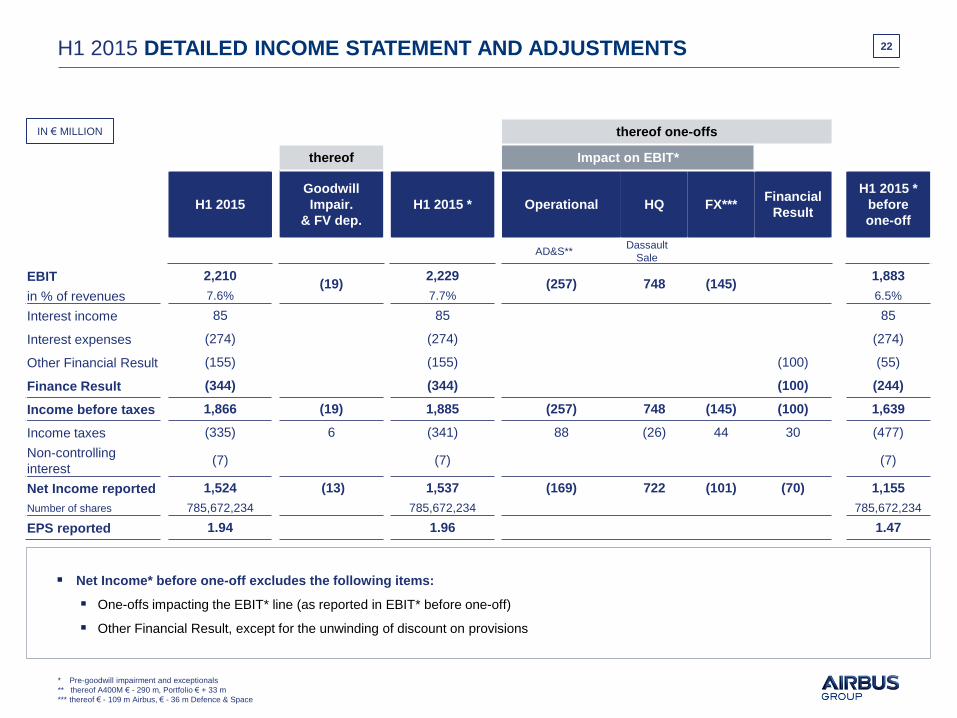
H1 2015 DETAILED INCOME STATEMENT AND ADJUSTMENTS 22
thereof one-offs
thereof Impact on EBIT*
H1 2015
Goodwill
Impair.
& FV dep.
H1 2015 * Operational HQ FX*** Financial
Result
H1 2015 *
before
one-off
AD&S** Dassault
Sale
EBIT 2,210 (19)
2,229 (257) 748 (145)
1,883
in % of revenues 7.6% 7.7% 6.5%
Interest income 85 85 85
Interest expenses (274) (274) (274)
Other Financial Result (155) (155) (100) (55)
Finance Result (344) (344) (100) (244)
Income before taxes 1,866 (19) 1,885 (257) 748 (145) (100) 1,639
Income taxes (335) 6 (341) 88 (26) 44 30 (477)
Non-controlling
interest (7) (7) (7)
Net Income reported 1,524 (13) 1,537 (169) 722 (101) (70) 1,155
Number of shares 785,672,234 785,672,234 785,672,234
EPS reported 1.94 1.96 1.47
Net Income* before one-off excludes the following items:
One-offs impacting the EBIT* line (as reported in EBIT* before one-off)
Other Financial Result, except for the unwinding of discount on provisions
IN € MILLION
* Pre-goodwill impairment and exceptionals
** thereof A400M € - 290 m, Portfolio € + 33 m
*** thereof € - 109 m Airbus, € - 36 m Defence & Space
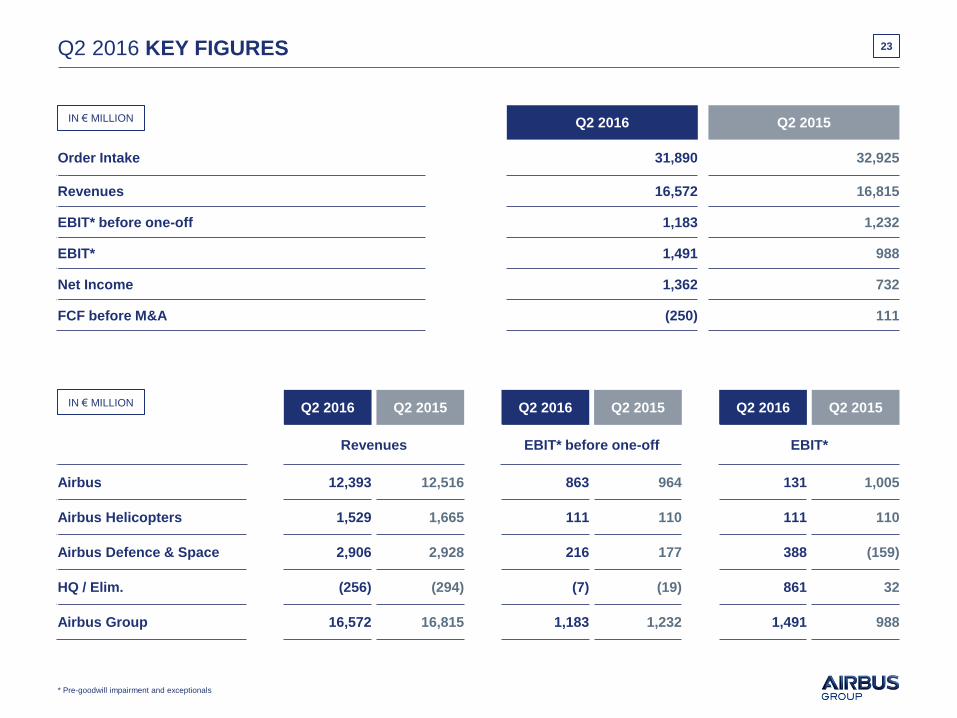
Q2 2016 KEY FIGURES 23
* Pre-goodwill impairment and exceptionals
IN € MILLION
Q2 2016 Q2 2015 Q2 2016 Q2 2015 Q2 2016 Q2 2015
Revenues EBIT* before one-off EBIT*
Airbus 12,393 12,516 863 964 131 1,005
Airbus Helicopters 1,529 1,665 111 110 111 110
Airbus Defence & Space 2,906 2,928 216 177 388 (159)
HQ / Elim. (256) (294) (7) (19) 861 32
Airbus Group 16,572 16,815 1,183 1,232 1,491 988
IN € MILLION
Q2 2016 Q2 2015
Order Intake 31,890 32,925
Revenues 16,572 16,815
EBIT* before one-off 1,183 1,232
EBIT* 1,491 988
Net Income 1,362 732
FCF before M&A (250) 111
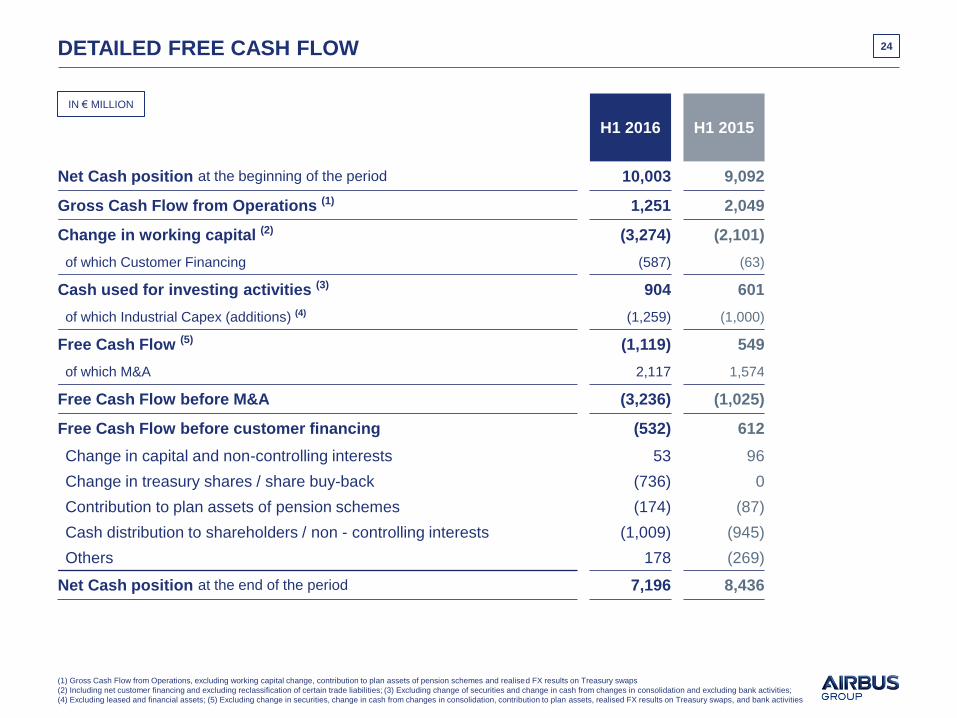
DETAILED FREE CASH FLOW 24
(1) Gross Cash Flow from Operations, excluding working capital change, contribution to plan assets of pension schemes and realised FX results on Treasury swaps
(2) Including net customer financing and excluding reclassification of certain trade liabilities; (3) Excluding change of securities and change in cash from changes in consolidation and excluding bank activities;
(4) Excluding leased and financial assets; (5) Excluding change in securities, change in cash from changes in consolidation, contribution to plan assets, realised FX results on Treasury swaps, and bank activities
IN € MILLION
H1 2016 H1 2015
Net Cash position at the beginning of the period 10,003 9,092
Gross Cash Flow from Operations (1) 1,251 2,049
Change in working capital (2) (3,274) (2,101)
of which Customer Financing (587) (63)
Cash used for investing activities (3) 904 601
of which Industrial Capex (additions) (4) (1,259) (1,000)
Free Cash Flow (5) (1,119) 549
of which M&A 2,117 1,574
Free Cash Flow before M&A (3,236) (1,025)
Free Cash Flow before customer financing (532) 612
Change in capital and non-controlling interests 53 96
Change in treasury shares / share buy-back (736) 0
Contribution to plan assets of pension schemes (174) (87)
Cash distribution to shareholders / non - controlling interests (1,009) (945)
Others 178 (269)
Net Cash position at the end of the period 7,196 8,436
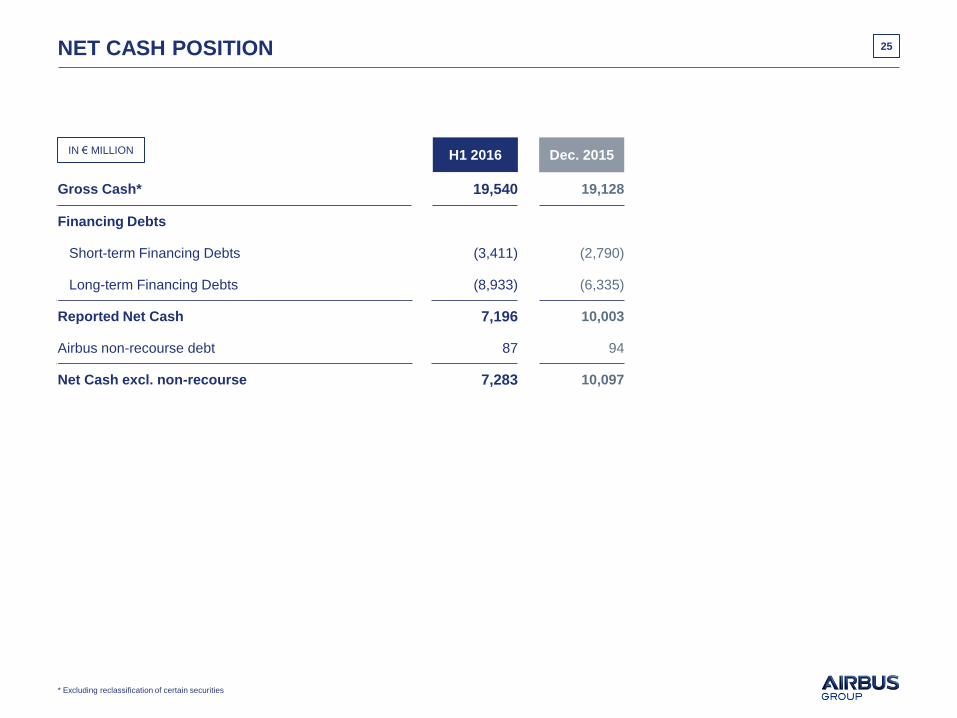
NET CASH POSITION 25
IN € MILLION H1 2016 Dec. 2015
Gross Cash* 19,540 19,128
Financing Debts
Short-term Financing Debts (3,411) (2,790)
Long-term Financing Debts (8,933) (6,335)
Reported Net Cash 7,196 10,003
Airbus non-recourse debt 87 94
Net Cash excl. non-recourse 7,283 10,097
* Excluding reclassification of certain securities
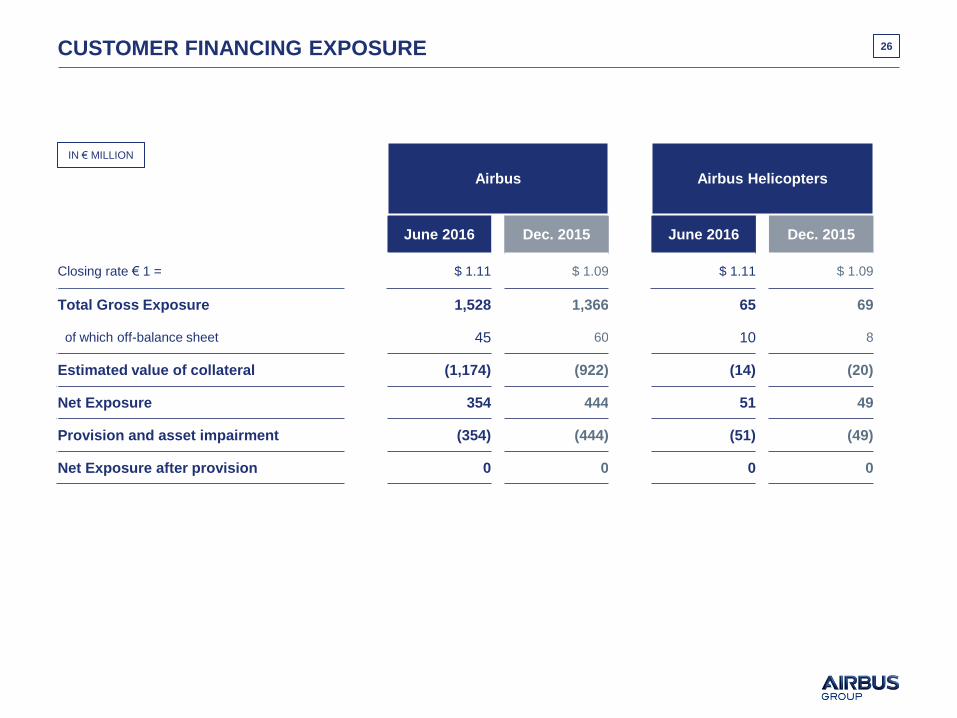
CUSTOMER FINANCING EXPOSURE 26
IN € MILLION
Airbus Airbus Helicopters
June 2016 Dec. 2015 June 2016 Dec. 2015
Closing rate € 1 = $ 1.11 $ 1.09 $ 1.11 $ 1.09
Total Gross Exposure 1,528 1,366 65 69
of which off-balance sheet 45 60 10 8
Estimated value of collateral (1,174) (922) (14) (20)
Net Exposure 354 444 51 49
Provision and asset impairment (354) (444) (51) (49)
Net Exposure after provision 0 0 0 0
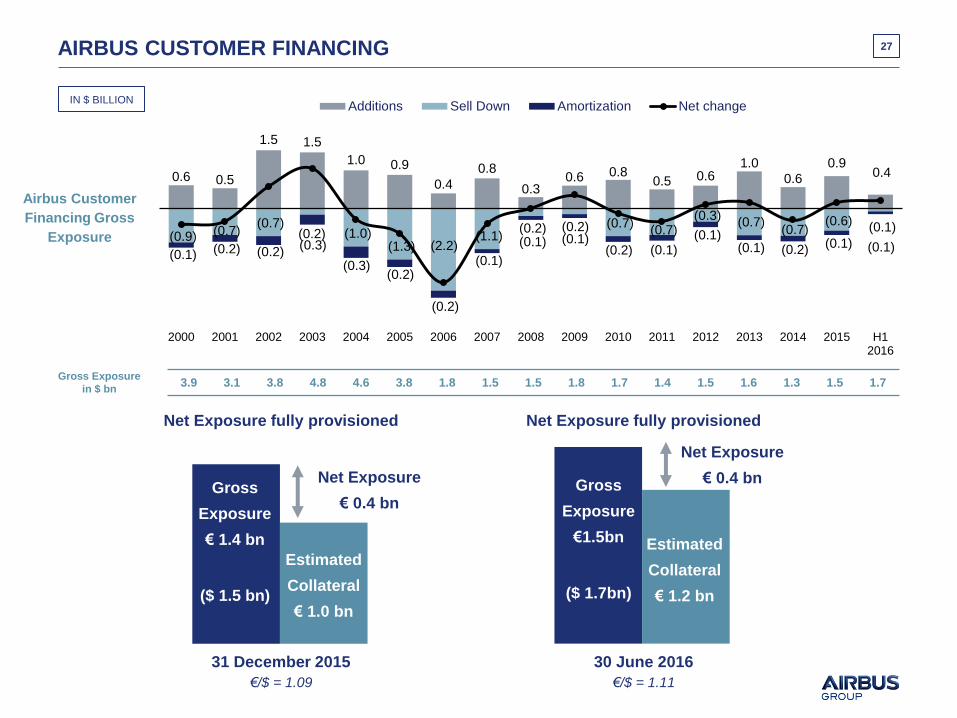
AIRBUS CUSTOMER FINANCING 27
Gross Exposure
in $ bn 3.9 3.1 3.8 4.8 4.6 3.8 1.8 1.5 1.5 1.8 1.7 1.4 1.5 1.6 1.3 1.5 1.7
Airbus Customer
Financing Gross
Exposure
Net Exposure
€ 0.4 bn
31 December 2015
€/$ = 1.09
Gross
Exposure
€ 1.4 bn
($ 1.5 bn)
Estimated
Collateral
€ 1.0 bn
Net Exposure
€ 0.4 bn
30 June 2016
€/$ = 1.11
Estimated
Collateral
€ 1.2 bn
Net Exposure fully provisioned
Gross
Exposure
€1.5bn
($ 1.7bn)
Net Exposure fully provisioned
IN $ BILLION
0.6 0.5
1.5 1.5
1.0 0.9
0.4
0.8
0.3 0.6 0.8
0.5 0.6 1.0
0.6
0.9 0.4
(0.9) (0.7) (0.7)
(0.2) (1.0) (1.3) (2.2)
(1.1) (0.2) (0.2) (0.7)
(0.7) (0.3)
(0.7) (0.7)
(0.6)
(0.1) (0.1) (0.2) (0.2)
(0.3)
(0.3) (0.2)
(0.2)
(0.1)
(0.1) (0.1) (0.2) (0.1)
(0.1) (0.1) (0.2)
(0.1)
(0.1)
2000 2001 2002 2003 2004 2005 2006 2007 2008 2009 2010 2011 2012 2013 2014 2015 H12016
Additions Sell Down Amortization Net change
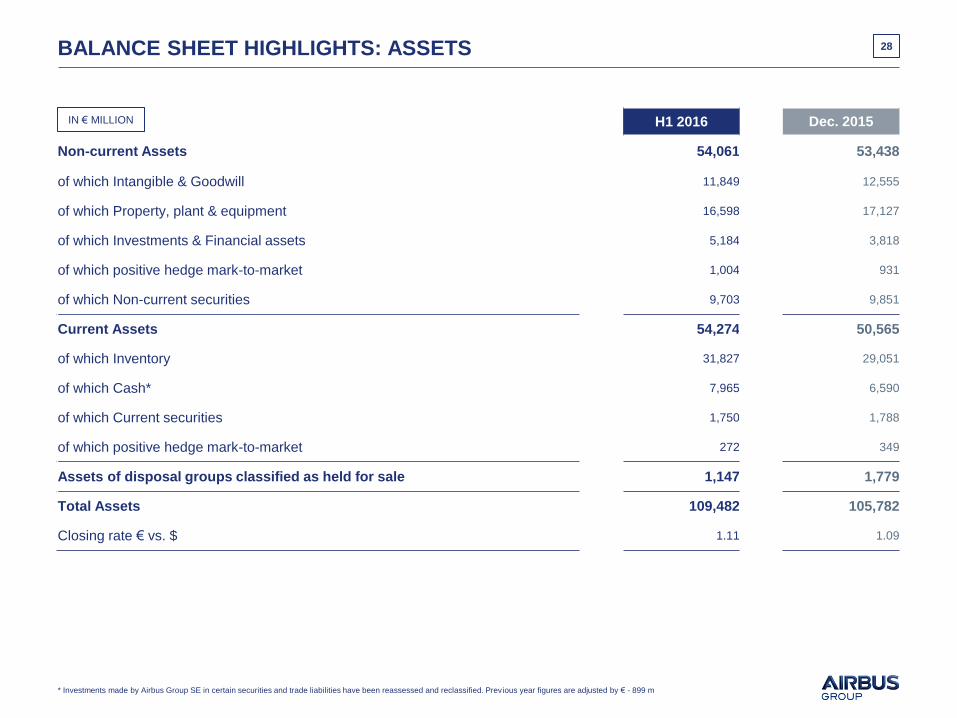
BALANCE SHEET HIGHLIGHTS: ASSETS 28
IN € MILLION H1 2016 Dec. 2015
Non-current Assets 54,061 53,438
of which Intangible & Goodwill 11,849 12,555
of which Property, plant & equipment 16,598 17,127
of which Investments & Financial assets 5,184 3,818
of which positive hedge mark-to-market 1,004 931
of which Non-current securities 9,703 9,851
Current Assets 54,274 50,565
of which Inventory 31,827 29,051
of which Cash* 7,965 6,590
of which Current securities 1,750 1,788
of which positive hedge mark-to-market 272 349
Assets of disposal groups classified as held for sale 1,147 1,779
Total Assets 109,482 105,782
Closing rate € vs. $ 1.11 1.09
* Investments made by Airbus Group SE in certain securities and trade liabilities have been reassessed and reclassified. Previous year figures are adjusted by € - 899 m
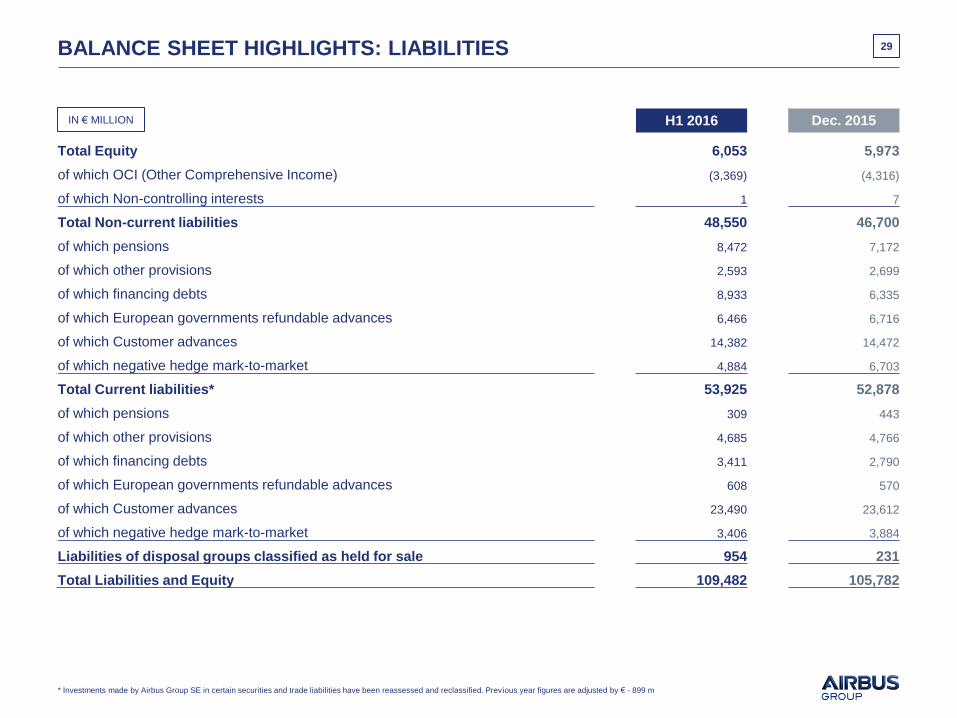
BALANCE SHEET HIGHLIGHTS: LIABILITIES 29
IN € MILLION H1 2016 Dec. 2015
Total Equity 6,053 5,973
of which OCI (Other Comprehensive Income) (3,369) (4,316)
of which Non-controlling interests 1 7
Total Non-current liabilities 48,550 46,700
of which pensions 8,472 7,172
of which other provisions 2,593 2,699
of which financing debts 8,933 6,335
of which European governments refundable advances 6,466 6,716
of which Customer advances 14,382 14,472
of which negative hedge mark-to-market 4,884 6,703
Total Current liabilities* 53,925 52,878
of which pensions 309 443
of which other provisions 4,685 4,766
of which financing debts 3,411 2,790
of which European governments refundable advances 608 570
of which Customer advances 23,490 23,612
of which negative hedge mark-to-market 3,406 3,884
Liabilities of disposal groups classified as held for sale 954 231
Total Liabilities and Equity 109,482 105,782
* Investments made by Airbus Group SE in certain securities and trade liabilities have been reassessed and reclassified. Previous year figures are adjusted by € - 899 m
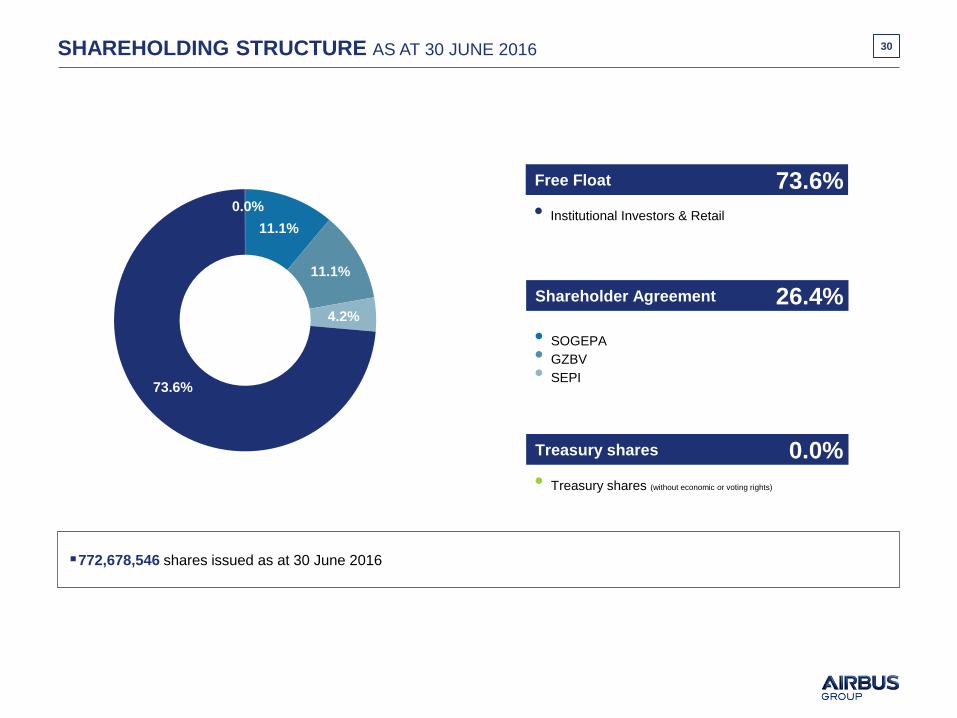
SHAREHOLDING STRUCTURE AS AT 30 JUNE 2016
772,678,546 shares issued as at 30 June 2016
30
Shareholder Agreement
• SOGEPA
• GZBV
• SEPI
• Institutional Investors & Retail
Free Float
• Treasury shares (without economic or voting rights)
Treasury shares
11.1%
11.1%
4.2%
73.6%
0.0%
73.6%
26.4%
0.0%
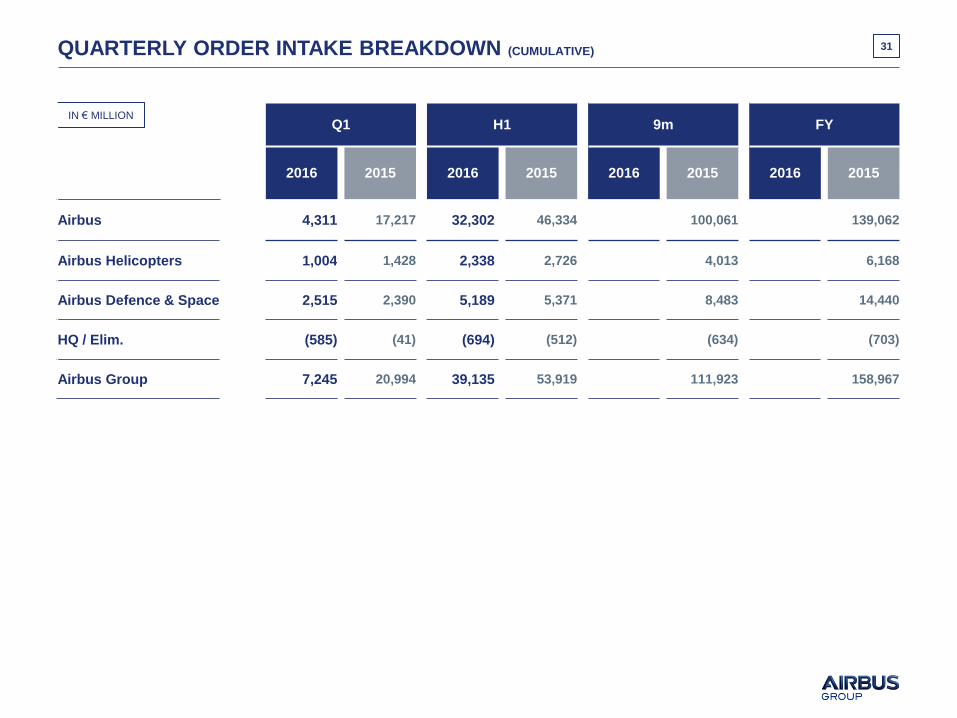
QUARTERLY ORDER INTAKE BREAKDOWN (CUMULATIVE) 31
IN € MILLION Q1 H1 9m FY
2016 2015 2016 2015 2016 2015 2016 2015
Airbus 4,311 17,217 32,302 46,334 100,061 139,062
Airbus Helicopters 1,004 1,428 2,338 2,726 4,013 6,168
Airbus Defence & Space 2,515 2,390 5,189 5,371 8,483 14,440
HQ / Elim. (585) (41) (694) (512) (634) (703)
Airbus Group 7,245 20,994 39,135 53,919 111,923 158,967

QUARTERLY ORDER BOOK BREAKDOWN (CUMULATIVE) 32
IN € MILLION Q1 H1 9m FY
2016 2015 2016 2015 2016 2015 2016 2015
Airbus 904,589 901,565 930,885 875,018 914,692 952,450
Airbus Helicopters 11,615 12,371 11,421 12,004 11,818 11,769
Airbus Defence & Space 42,596 41,854 37,665 41,683 41,657 42,861
HQ / Elim. (1,820) (1,226) (1,884) (1,727) (1,297) (1,216)
Airbus Group 956,980 954,564 978,087 926,978 966,870 1,005,864
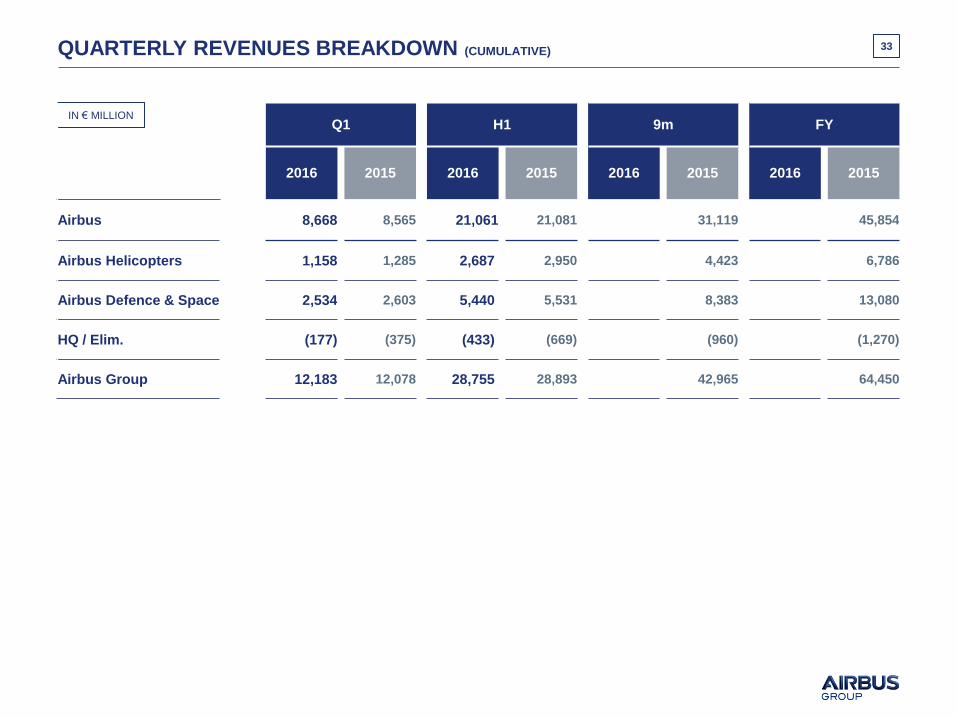
QUARTERLY REVENUES BREAKDOWN (CUMULATIVE) 33
IN € MILLION Q1 H1 9m FY
2016 2015 2016 2015 2016 2015 2016 2015
Airbus 8,668 8,565 21,061 21,081 31,119 45,854
Airbus Helicopters 1,158 1,285 2,687 2,950 4,423 6,786
Airbus Defence & Space 2,534 2,603 5,440 5,531 8,383 13,080
HQ / Elim. (177) (375) (433) (669) (960) (1,270)
Airbus Group 12,183 12,078 28,755 28,893 42,965 64,450
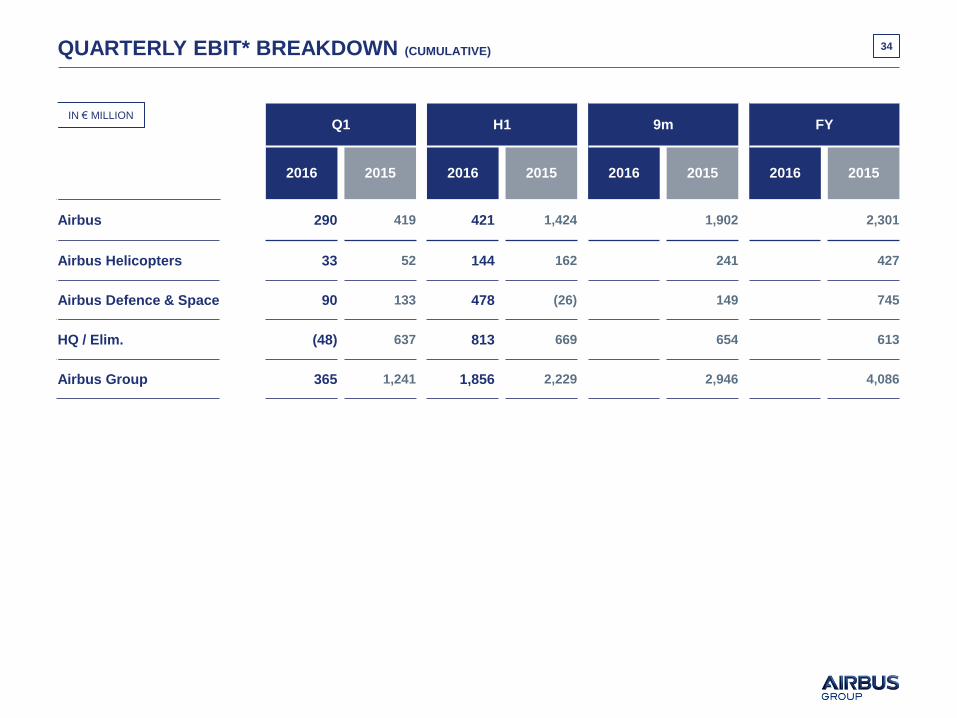
QUARTERLY EBIT* BREAKDOWN (CUMULATIVE) 34
IN € MILLION Q1 H1 9m FY
2016 2015 2016 2015 2016 2015 2016 2015
Airbus 290 419 421 1,424 1,902 2,301
Airbus Helicopters 33 52 144 162 241 427
Airbus Defence & Space 90 133 478 (26) 149 745
HQ / Elim. (48) 637 813 669 654 613
Airbus Group 365 1,241 1,856 2,229 2,946 4,086
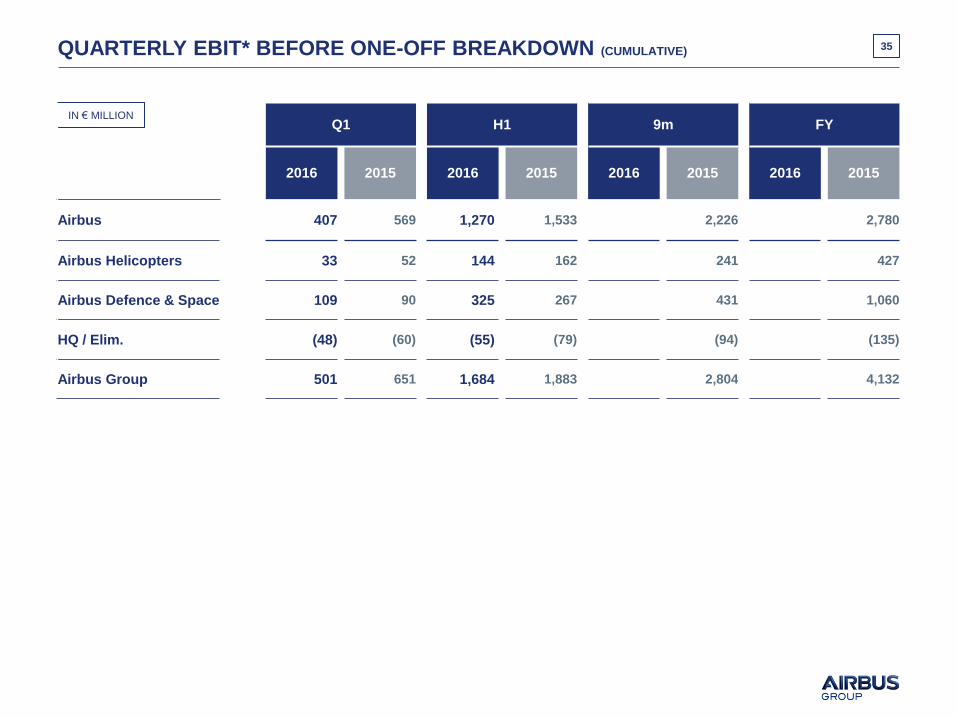
QUARTERLY EBIT* BEFORE ONE-OFF BREAKDOWN (CUMULATIVE) 35
IN € MILLION Q1 H1 9m FY
2016 2015 2016 2015 2016 2015 2016 2015
Airbus 407 569 1,270 1,533 2,226 2,780
Airbus Helicopters 33 52 144 162 241 427
Airbus Defence & Space 109 90 325 267 431 1,060
HQ / Elim. (48) (60) (55) (79) (94) (135)
Airbus Group 501 651 1,684 1,883 2,804 4,132