international property handbook h1 2015 - deloitte
TRANSCRIPT

International property handbookH1 2015Confidential – key clients only
International property handbook H1 2015 II
Welcome to the first edition of the International Property Handbook, our semi-annual review of real estate investment in 20 countries and over 50 cities. Drawing on expertise from across Deloitte’s global real estate network, the Handbook tracks the flows of real estate capital and acts as a useful guide to investment trends and key deals in the most active markets.
And there is certainly no shortage of activity: 2014 investment levels exceed those recorded in 2013 in almost every country covered, and in many cases the impact of this demand has pushed down yields, boosting pricing of directly- and indirectly-held real estate alike. What’s more, the share of cross border transactions continues to rise. Nevertheless, just as economic prospects continue to vary markedly from country to country, so too does the outlook for real estate investment and performance, with some locations slowing as others gain momentum.
We hope you find this report useful, and would encourage you to get in touch with your local market contact with any questions.
Robert O’Brien Global Real Estate Leader
Introduction Contents
International economic III overview
International investment V activity
Cross-border investment VI
Pricing and performance VII
Listed property performance X
Private fundraising XI
Data summary XII
International tax rates XIII
Key contacts by market XV
Australia 1
Belgium 9
Canada 14
China 22
France 28
Germany 33
Ireland 41
Italy 46
Japan 51
Netherlands 57
Norway 62
Poland 67
Russia 72
Singapore 76
South Korea 80
Spain 85
Sweden 91
Taiwan 96
United Kingdom 100
United States 106
Recent global research 120
International property handbook H1 2015 III
International economic overview
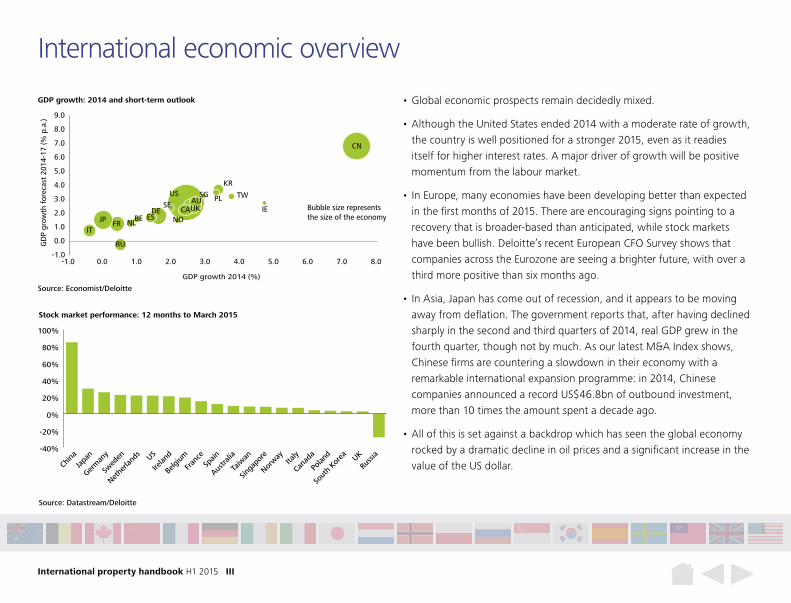
• Global economic prospects remain decidedly mixed.
• Although the United States ended 2014 with a moderate rate of growth, the country is well positioned for a stronger 2015, even as it readies itself for higher interest rates. A major driver of growth will be positive momentum from the labour market.
• In Europe, many economies have been developing better than expected in the first months of 2015. There are encouraging signs pointing to a recovery that is broader-based than anticipated, while stock markets have been bullish. Deloitte’s recent European CFO Survey shows that companies across the Eurozone are seeing a brighter future, with over a third more positive than six months ago.
• In Asia, Japan has come out of recession, and it appears to be moving away from deflation. The government reports that, after having declined sharply in the second and third quarters of 2014, real GDP grew in the fourth quarter, though not by much. As our latest M&A Index shows, Chinese firms are countering a slowdown in their economy with a remarkable international expansion programme: in 2014, Chinese companies announced a record US$46.8bn of outbound investment, more than 10 times the amount spent a decade ago.
• All of this is set against a backdrop which has seen the global economy rocked by a dramatic decline in oil prices and a significant increase in the value of the US dollar.
-40%
-20%
0%
20%
40%
60%
80%
100%
Source: Datastream/Deloitte
Stock market performance: 12 months to March 2015
China
Japa
n
Germ
any
Swed
en
Nethe
rland
s US
Irelan
d
Belgi
um
Fran
ceSp
ain
Austra
lia
Taiw
an
Singa
pore
Norway
Italy
Cana
da
Polan
d
Sout
h Ko
rea UK
Russ
ia
Source: Economist/Deloitte
GDP growth: 2014 and short-term outlook
US
UK
KR
AU
BE CA
CN
FR
DE IE
IT JP NL NO
PL
RU
SG
ES
SE TW
-1.0
0.0
1.0
2.0
3.0
4.0
5.0
6.0
7.0
8.0
9.0
-1.0 0.0 1.0 2.0 3.0 4.0 5.0 6.0 7.0 8.0
GDP growth 2014 (%)
GD
P gr
owth
for
ecas
t 20
14-1
7 (%
p.a
.)
Bubble size represents the size of the economy
International property handbook H1 2015 IV
International economic overview
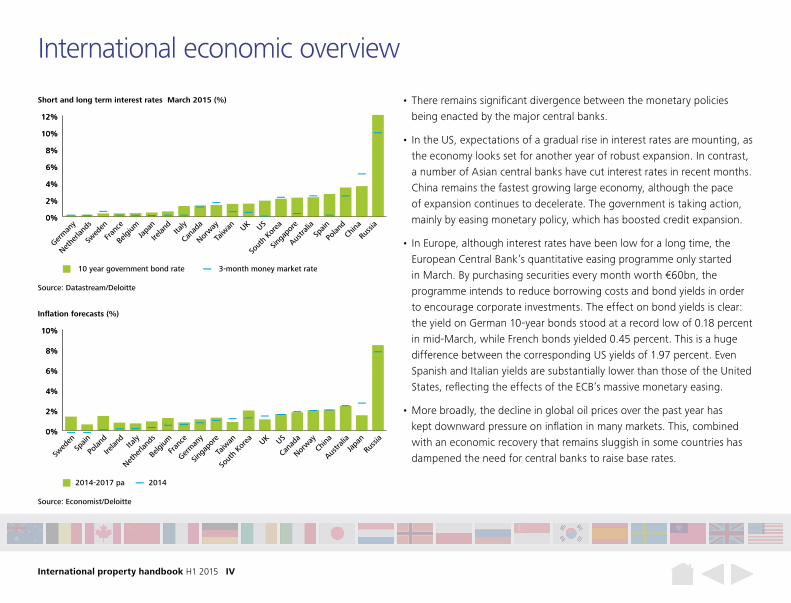
• There remains significant divergence between the monetary policies being enacted by the major central banks.
• In the US, expectations of a gradual rise in interest rates are mounting, as the economy looks set for another year of robust expansion. In contrast, a number of Asian central banks have cut interest rates in recent months. China remains the fastest growing large economy, although the pace of expansion continues to decelerate. The government is taking action, mainly by easing monetary policy, which has boosted credit expansion.
• In Europe, although interest rates have been low for a long time, the European Central Bank’s quantitative easing programme only started in March. By purchasing securities every month worth €60bn, the programme intends to reduce borrowing costs and bond yields in order to encourage corporate investments. The effect on bond yields is clear: the yield on German 10-year bonds stood at a record low of 0.18 percent in mid-March, while French bonds yielded 0.45 percent. This is a huge difference between the corresponding US yields of 1.97 percent. Even Spanish and Italian yields are substantially lower than those of the United States, reflecting the effects of the ECB’s massive monetary easing.
• More broadly, the decline in global oil prices over the past year has kept downward pressure on inflation in many markets. This, combined with an economic recovery that remains sluggish in some countries has dampened the need for central banks to raise base rates.
0%
2%
4%
6%
8%
10%
12%
0%
2%
4%
6%
8%
10%
12%
Source: Datastream/Deloitte
10 year government bond rate 3-month money market rate
Short and long term interest rates March 2015 (%)
Germ
any
Nethe
rland
s
Swed
en
Fran
ce
Belgi
umJa
pan
Irelan
dIta
ly
Cana
da
Norway
Taiw
an UK US
Sout
h Ko
rea
Singa
pore
Austra
liaSp
ain
Polan
dCh
ina
Russ
ia
0%
2%
4%
6%
8%
10%
0%
2%
4%
6%
8%
10%
Source: Economist/Deloitte
2014-2017 pa 2014
Inflation forecasts (%)
Germ
any
Nethe
rland
s
Swed
en
Fran
ce
Belgi
umJa
pan
Irelan
dIta
ly
Cana
da
Norway
Taiw
an UK US
Sout
h Ko
rea
Singa
pore
Austra
liaSp
ain
Polan
dCh
ina
Russ
ia
International property handbook H1 2015 V
International investment activity
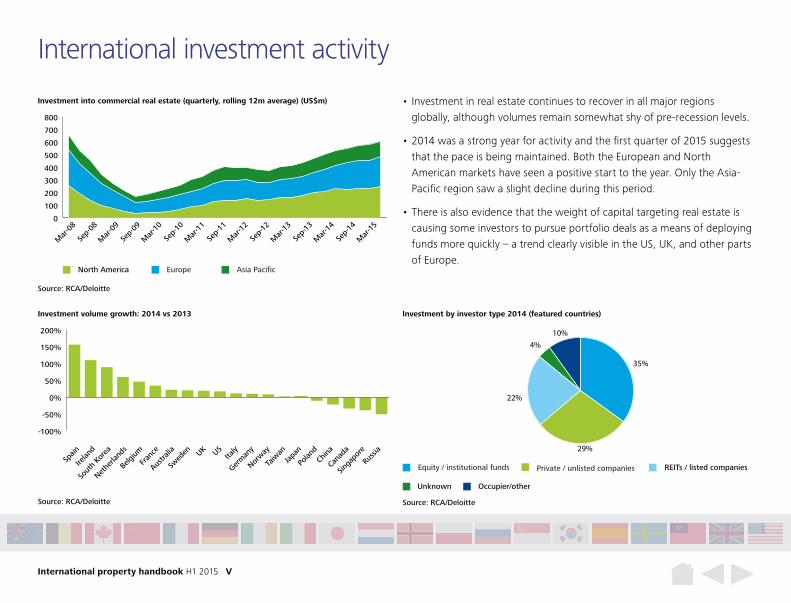
• Investment in real estate continues to recover in all major regions globally, although volumes remain somewhat shy of pre-recession levels.
• 2014 was a strong year for activity and the first quarter of 2015 suggests that the pace is being maintained. Both the European and North American markets have seen a positive start to the year. Only the Asia-Pacific region saw a slight decline during this period.
• There is also evidence that the weight of capital targeting real estate is causing some investors to pursue portfolio deals as a means of deploying funds more quickly – a trend clearly visible in the US, UK, and other parts of Europe.
0
100
200
300
400
500
600
700
800
Source: RCA/Deloitte
Investment into commercial real estate (quarterly, rolling 12m average) (US$m)
Mar
-08
Sep-
08
Mar
-09
Sep-
09
Mar
-10
Sep-
10
Mar
-11
Sep-
11
Mar
-12
Sep-
12
Mar
-13
Sep-
13
Mar
-14
Sep-
14
Mar
-15
North America Europe Asia Pacific
-100%
-50%
0%
50%
100%
150%
200%
Source: RCA/Deloitte
Investment volume growth: 2014 vs 2013
Spain
Irelan
d
Sout
h Ko
rea
Nethe
rland
s
Belgi
um
Fran
ce
Austra
lia
Swed
en UK USIta
ly
Germ
any
Norway
Taiw
anJa
pan
Polan
dCh
ina
Cana
da
Singa
pore
Russ
ia
Source: RCA/Deloitte
Investment by investor type 2014 (featured countries)
35%
10%
22%
29%
4%
Equity / institutional funds Private / unlisted companies
Occupier/otherUnknown
REITs / listed companies
International property handbook H1 2015 VI
Cross-border investment
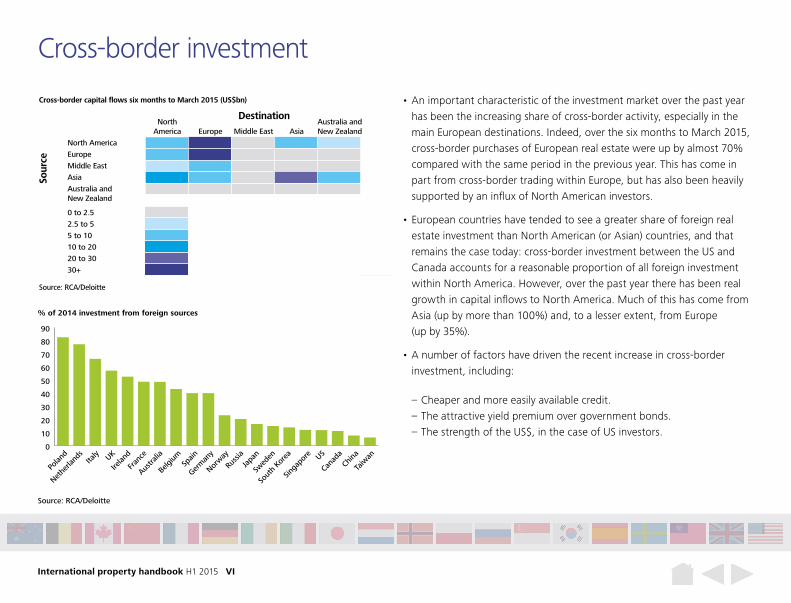
• An important characteristic of the investment market over the past year has been the increasing share of cross-border activity, especially in the main European destinations. Indeed, over the six months to March 2015, cross-border purchases of European real estate were up by almost 70% compared with the same period in the previous year. This has come in part from cross-border trading within Europe, but has also been heavily supported by an influx of North American investors.
• European countries have tended to see a greater share of foreign real estate investment than North American (or Asian) countries, and that remains the case today: cross-border investment between the US and Canada accounts for a reasonable proportion of all foreign investment within North America. However, over the past year there has been real growth in capital inflows to North America. Much of this has come from Asia (up by more than 100%) and, to a lesser extent, from Europe (up by 35%).
• A number of factors have driven the recent increase in cross-border investment, including:
– Cheaper and more easily available credit. – The attractive yield premium over government bonds. – The strength of the US$, in the case of US investors.
NorthAmerica Europe Middle East Asia
Australia andNew Zealand
North America
Europe
Middle East
Asia
Australia and New Zealand
0 to 2.5
2.5 to 5
5 to 10
10 to 20
20 to 30
30+
Sour
ce
Destination
Source: RCA/Deloitte
Cross-border capital flows six months to March 2015 (US$bn)
0
10
20
30
40
50
60
70
80
90
Taiw
anCh
ina
Cana
daUS
Singa
pore
Sout
h Ko
rea
Swed
enJa
pan
Russ
ia
Norway
Germ
any
Belgi
um
Austra
lia
Fran
ceSp
ain
Irelan
dUK
Nethe
rland
sIta
ly
Polan
d
Source: RCA/Deloitte
% of 2014 investment from foreign sources
International property handbook H1 2015 VII
Pricing and performance
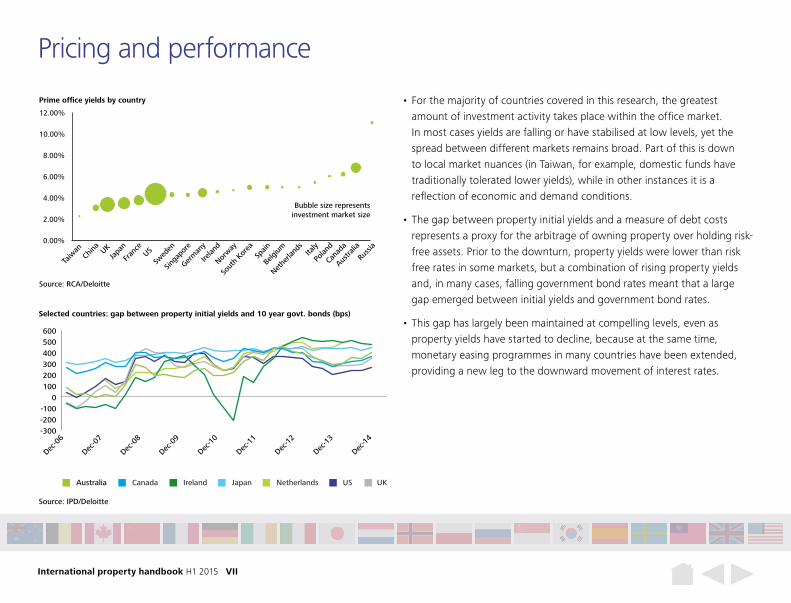
• For the majority of countries covered in this research, the greatest amount of investment activity takes place within the office market. In most cases yields are falling or have stabilised at low levels, yet the spread between different markets remains broad. Part of this is down to local market nuances (in Taiwan, for example, domestic funds have traditionally tolerated lower yields), while in other instances it is a reflection of economic and demand conditions.
• The gap between property initial yields and a measure of debt costs represents a proxy for the arbitrage of owning property over holding risk-free assets. Prior to the downturn, property yields were lower than risk free rates in some markets, but a combination of rising property yields and, in many cases, falling government bond rates meant that a large gap emerged between initial yields and government bond rates.
• This gap has largely been maintained at compelling levels, even as property yields have started to decline, because at the same time, monetary easing programmes in many countries have been extended, providing a new leg to the downward movement of interest rates.
Source: RCA/Deloitte
Bubble size representsinvestment market size
Prime office yields by country
0.00%
2.00%
4.00%
6.00%
8.00%
10.00%
12.00%
Taiw
anCh
ina UK
Fran
ce
Swed
enSin
gapo
reGer
man
yIre
land
Japa
n
Norway
Sout
h Ko
rea
Spain
Belgi
um Italy
Nethe
rland
s
Polan
dCa
nada
US
Austra
liaRu
ssia
-300-200-100
0100200300400500600
Dec-0
6
Dec-0
7
Dec-0
8
Dec-0
9
Dec-1
0
Dec-1
1
Dec-1
2
Dec-1
3
Dec-1
4
Australia Canada Ireland UKUSJapan Netherlands
Source: IPD/Deloitte
Selected countries: gap between property initial yields and 10 year govt. bonds (bps)
International property handbook H1 2015 VIII
Pricing and performance
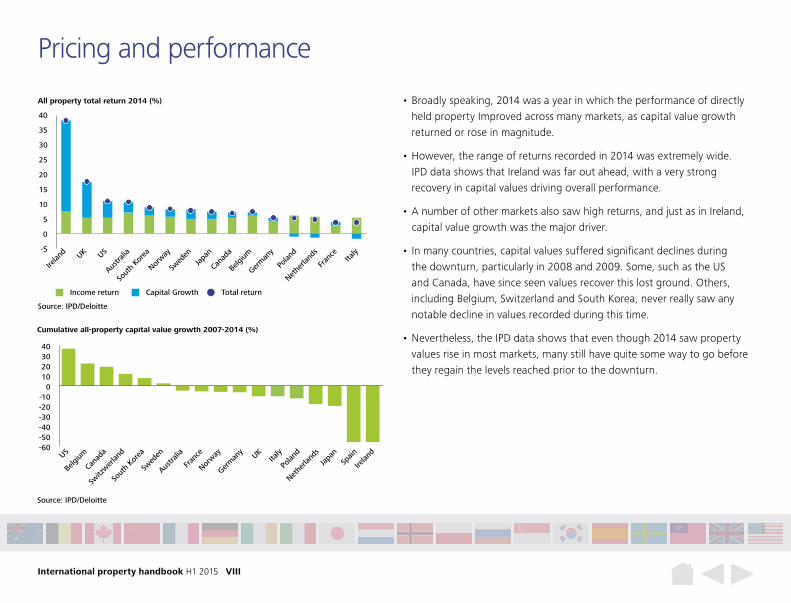
• Broadly speaking, 2014 was a year in which the performance of directly held property Improved across many markets, as capital value growth returned or rose in magnitude.
• However, the range of returns recorded in 2014 was extremely wide. IPD data shows that Ireland was far out ahead, with a very strong recovery in capital values driving overall performance.
• A number of other markets also saw high returns, and just as in Ireland, capital value growth was the major driver.
• In many countries, capital values suffered significant declines during the downturn, particularly in 2008 and 2009. Some, such as the US and Canada, have since seen values recover this lost ground. Others, including Belgium, Switzerland and South Korea, never really saw any notable decline in values recorded during this time.
• Nevertheless, the IPD data shows that even though 2014 saw property values rise in most markets, many still have quite some way to go before they regain the levels reached prior to the downturn.
All property total return 2014 (%)
40
Income return
Source: IPD/Deloitte
Capital Growth Total return
-5
0
5
10
15
20
25
30
35
Cana
daUS
Sout
h Ko
rea
Swed
enJa
pan
Norway
Germ
any
Belgi
um
Austra
lia
Fran
ce
Irelan
d UK
Nethe
rland
sIta
ly
Polan
d
-60-50-40-30-20-10
010203040
Source: IPD/Deloitte
Cumulative all-property capital value growth 2007-2014 (%)
Spain
Irelan
d
Sout
h Ko
rea
Switz
werlan
d
Nethe
rland
s
Belgi
um
Fran
ce
Austra
lia
Swed
en UKUSIta
ly
Germ
any
Norway
Japa
n
Polan
d
Cana
da
International property handbook H1 2015 IX
Pricing and performance
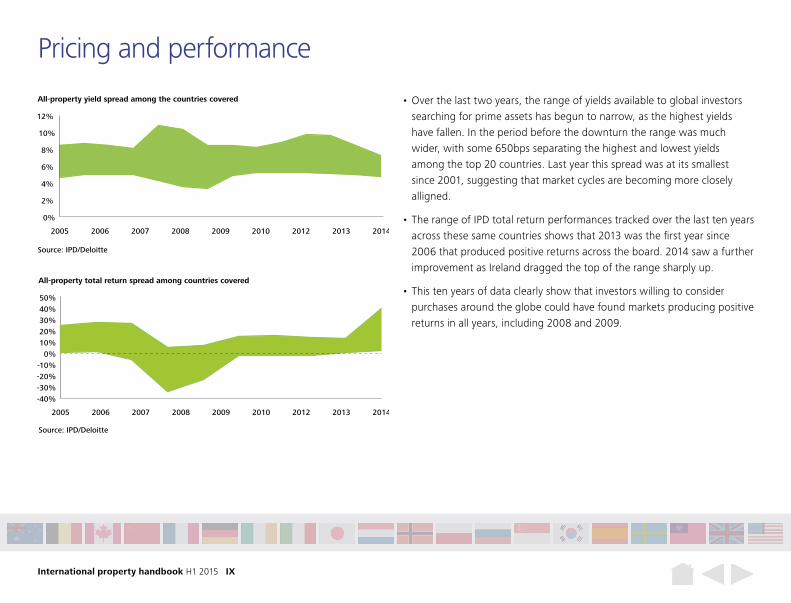
• Over the last two years, the range of yields available to global investors searching for prime assets has begun to narrow, as the highest yields have fallen. In the period before the downturn the range was much wider, with some 650bps separating the highest and lowest yields among the top 20 countries. Last year this spread was at its smallest since 2001, suggesting that market cycles are becoming more closely alligned.
• The range of IPD total return performances tracked over the last ten years across these same countries shows that 2013 was the first year since 2006 that produced positive returns across the board. 2014 saw a further improvement as Ireland dragged the top of the range sharply up.
• This ten years of data clearly show that investors willing to consider purchases around the globe could have found markets producing positive returns in all years, including 2008 and 2009.
0%
2%
4%
6%
8%
10%
12%
All-property yield spread among the countries covered
Source: IPD/Deloitte
2005 2006 2007 2008 2009 2010 2012 2013 2014
-40%-30%-20%-10%
0%10%20%30%40%50%
All-property total return spread among countries covered
Source: IPD/Deloitte
2005 2006 2007 2008 2009 2010 2012 2013 2014
International property handbook H1 2015 X
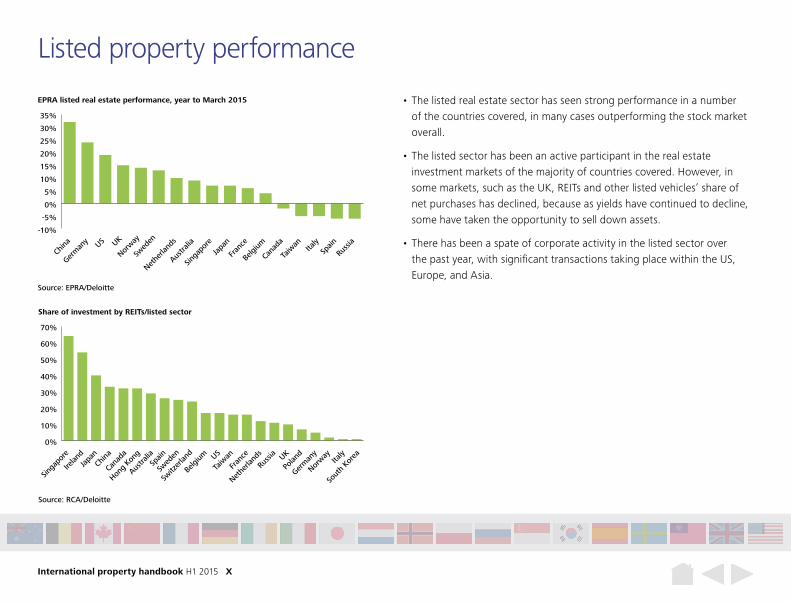
Listed property performance
• The listed real estate sector has seen strong performance in a number of the countries covered, in many cases outperforming the stock market overall.
• The listed sector has been an active participant in the real estate investment markets of the majority of countries covered. However, in some markets, such as the UK, REITs and other listed vehicles’ share of net purchases has declined, because as yields have continued to decline, some have taken the opportunity to sell down assets.
• There has been a spate of corporate activity in the listed sector over the past year, with significant transactions taking place within the US, Europe, and Asia.
Source: RCA/Deloitte
Share of investment by REITs/listed sector
0%
10%
20%
30%
40%
50%
60%
70%
Germ
any
Spain
Swed
en
Switz
erlan
d
Fran
ce
Belgi
umJa
pan
Italy
Cana
da
Polan
d
Norway
Taiw
an
Irelan
d UKUS
Sout
h Ko
rea
Nethe
rland
s
Hong
Kong
Singa
pore
Austra
liaCh
ina
Russ
ia
Source: EPRA/Deloitte
EPRA listed real estate performance, year to March 2015
-10%
-5%
0%
5%
10%
15%
20%
25%
30%
35%
Germ
any
Nethe
rland
s
Swed
en
Fran
ce
Belgi
umJa
pan
Italy
Cana
da
Norway
Taiw
anUKUS
Singa
pore
Austra
liaSp
ainCh
ina
Russ
ia

International property handbook H1 2015 XI
Private fundraising
• The volume of capital raised each quarter by private real estate funds has been rising since mid-2014.
• 2014 was a very strong year for capital raised to target Europe, although funds raised in the first quarter of 2015 continue to show a greater focus on North America, reflecting interest from institutional investors.
• Nevertheless, both the European and Asian markets have seen an uplift in interest from institutions compared with a year ago.
• Although those with opportunistic strategies account for less than half of the number of funds raised in Q1, in terms of capital, opportunistic funds still dominate.
Source: Preqin/Deloitte
Aggregate capital raised (US$bn)
0
10
20
30
40
Dec-11
Mar
-12
Jun-1
2
Sep-1
2
Dec-12
Mar
-13
Jun-1
3
Sep-1
3
Dec-13
Mar
-14
Mar
-15
Jun-1
4
Sep-1
4
Dec-14
Sep-1
0
Mar
-10
Jun-1
0
Jun-1
1
Mar
-10
Sep-1
1
Dec10
Source: Preqin/Deloitte
Primary focus of capital raised – Q1 2015
0%
10%
20%
30%
40%
50%
60%
70%
80%
90%
100%
0%
10%
20%
30%
40%
50%
60%
70%
80%
90%
100%
Rest of World EuropeAsiaNorth America
Geography Strategy
DebtCoreDistressedValue AddedOpportunistic
International property handbook H1 2015 XII
CountryEconomic
outlook
GDP growth
forecast 2014-17 (% p.a.)
GDP (US$ bn)
Ease of doing
business rank
(1= best) *Transparency
score **
Central bank
base rate Mar-15
10 year govt.
bond YTM 31 Mar-15
Property Investment
trend
Property investment
2014 (US$ bn)
Percentage from foreign
investors
Ease of registering
property rank
(1=best) *
Direct property
total return
2014Rental trend
Yield trend
Office prime yield
Australia 2.9 1,440 10 80 2.25% 2.32 38.7 43% 53 10.6% 6.25%
Belgium 1.6 537 42 76 0.05% 0.45 3.1 42% 171 7.1% 5.00%
Canada 2.2 1,770 16 81 0.75% 1.36 18 11% 55 7.3% 5.27%
China 6.8 10,300 90 36 5.35% 3.66 337 8% 37 – 3.00%
France 1.2 2,840 31 69 0.05% 0.48 32.7 48% 126 6.6% 3.75%
Germany 1.8 3,780 14 79 0.05% 0.18 63 40% 89 6.0% 4.45%
Ireland 2.7 242 13 74 0.05% 0.75 5.8 52% 50 40.1% 4.50%
Italy 0.8 2,150 56 43 0.05% 1.29 7.1 77% 41 3.6% 5.00%
Japan 1.5 4,600 29 76 0.00% 0.40 52.4 16% 73 7.4% 3.40%
Netherlands 1.3 868 27 83 0.05% 0.34 11.5 66% 58 4.0% 6.20%
Norway 1.5 500 6 86 1.25% 1.49 4.9 19% 5 8.2% 4.75%
Poland 3.5 546 32 61 1.50% 2.31 4.9 82% 39 5.0% 6.00%
Russia -0.2 1,906 62 27 14.00% 12.13 6.2 20% 12 – 11.00%
Singapore 3.3 303 1 84 0.34% 2.27 10.3 12% 24 – 4.25%
South Korea 3.7 1,420 5 55 1.75% 2.17 17.9 14% 79 9.0% 5.00%
Spain 1.7 1,401 33 60 0.05% 1.21 13.4 40% 66 0.3% 5.00%
Sweden 2.4 569 11 87 -0.25% 0.42 18.2 15% 18 8.1% 4.25%
Taiwan 3.2 529 19 61 1.88% 1.54 8.8 6% 40 – 1.85%
UK 2.5 2,900 8 78 0.50% 1.58 92.3 54% 68 17.9% 3.50%
US 2.8 17,400 7 74 0.25% 1.93 420 12% 29 11.2% 4.10%
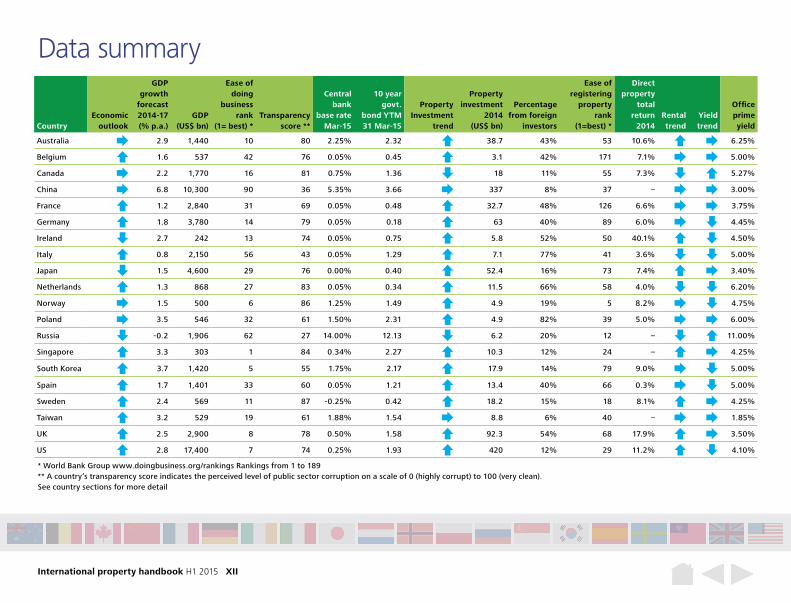
Data summary
* World Bank Group www.doingbusiness.org/rankings Rankings from 1 to 189** A country’s transparency score indicates the perceived level of public sector corruption on a scale of 0 (highly corrupt) to 100 (very clean).See country sections for more detail
International property handbook H1 2015 XIII
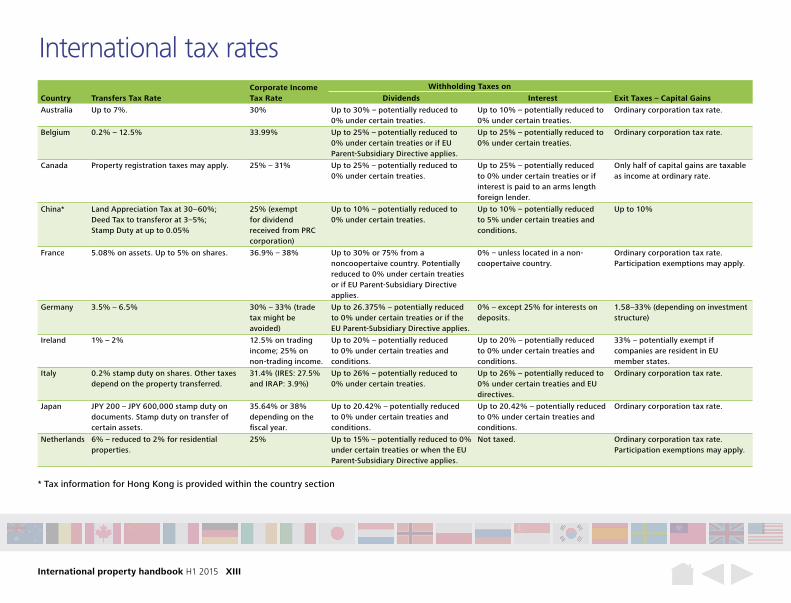
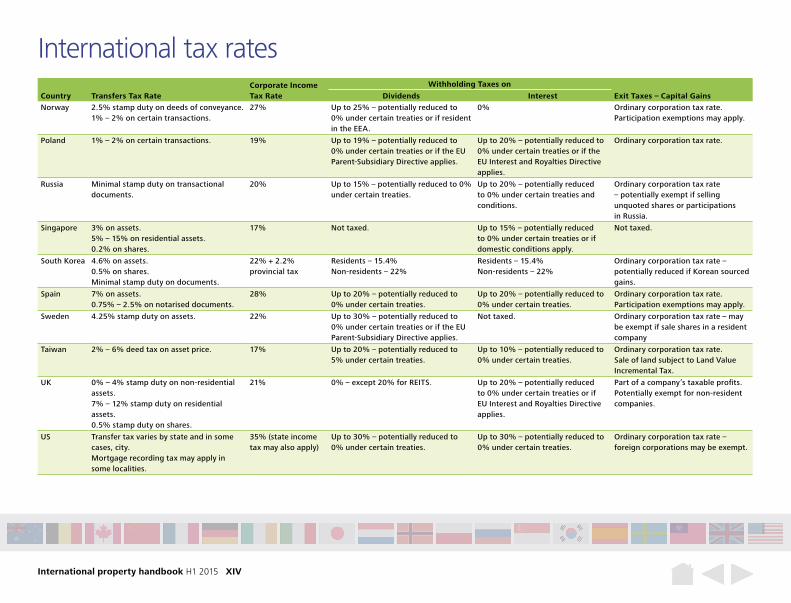
International tax rates
Country Transfers Tax RateCorporate Income Tax Rate
Withholding Taxes on
Exit Taxes – Capital GainsDividends Interest
Australia Up to 7%. 30% Up to 30% – potentially reduced to 0% under certain treaties.
Up to 10% – potentially reduced to 0% under certain treaties.
Ordinary corporation tax rate.
Belgium 0.2% – 12.5% 33.99% Up to 25% – potentially reduced to 0% under certain treaties or if EU Parent-Subsidiary Directive applies.
Up to 25% – potentially reduced to 0% under certain treaties.
Ordinary corporation tax rate.
Canada Property registration taxes may apply. 25% – 31% Up to 25% – potentially reduced to 0% under certain treaties.
Up to 25% – potentially reduced to 0% under certain treaties or if interest is paid to an arms length foreign lender.
Only half of capital gains are taxable as income at ordinary rate.
China* Land Appreciation Tax at 30–60%;Deed Tax to transferor at 3–5%;Stamp Duty at up to 0.05%
25% (exempt for dividend received from PRC corporation)
Up to 10% – potentially reduced to 0% under certain treaties.
Up to 10% – potentially reduced to 5% under certain treaties and conditions.
Up to 10%
France 5.08% on assets. Up to 5% on shares. 36.9% – 38% Up to 30% or 75% from a noncoopertaive country. Potentially reduced to 0% under certain treaties or if EU Parent-Subsidiary Directive applies.
0% – unless located in a non-coopertaive country.
Ordinary corporation tax rate. Participation exemptions may apply.
Germany 3.5% – 6.5% 30% – 33% (trade tax might be avoided)
Up to 26.375% – potentially reduced to 0% under certain treaties or if the EU Parent-Subsidiary Directive applies.
0% – except 25% for interests on deposits.
1.58–33% (depending on investment structure)
Ireland 1% – 2% 12.5% on trading income; 25% on non-trading income.
Up to 20% – potentially reduced to 0% under certain treaties and conditions.
Up to 20% – potentially reduced to 0% under certain treaties and conditions.
33% – potentially exempt if companies are resident in EU member states.
Italy 0.2% stamp duty on shares. Other taxes depend on the property transferred.
31.4% (IRES: 27.5% and IRAP: 3.9%)
Up to 26% – potentially reduced to 0% under certain treaties.
Up to 26% – potentially reduced to 0% under certain treaties and EU directives.
Ordinary corporation tax rate.
Japan JPY 200 – JPY 600,000 stamp duty on documents. Stamp duty on transfer of certain assets.
35.64% or 38% depending on the fiscal year.
Up to 20.42% – potentially reduced to 0% under certain treaties and conditions.
Up to 20.42% – potentially reduced to 0% under certain treaties and conditions.
Ordinary corporation tax rate.
Netherlands 6% – reduced to 2% for residential properties.
25% Up to 15% – potentially reduced to 0% under certain treaties or when the EU Parent-Subsidiary Directive applies.
Not taxed. Ordinary corporation tax rate. Participation exemptions may apply.
* Tax information for Hong Kong is provided within the country section
International property handbook H1 2015 XIV
International tax ratesCountry Transfers Tax Rate
Corporate Income Tax Rate
Withholding Taxes on
Exit Taxes – Capital GainsDividends Interest
Norway 2.5% stamp duty on deeds of conveyance. 1% – 2% on certain transactions.
27% Up to 25% – potentially reduced to 0% under certain treaties or if resident in the EEA.
0% Ordinary corporation tax rate. Participation exemptions may apply.
Poland 1% – 2% on certain transactions. 19% Up to 19% – potentially reduced to 0% under certain treaties or if the EU Parent-Subsidiary Directive applies.
Up to 20% – potentially reduced to 0% under certain treaties or if the EU Interest and Royalties Directive applies.
Ordinary corporation tax rate.
Russia Minimal stamp duty on transactional documents.
20% Up to 15% – potentially reduced to 0% under certain treaties.
Up to 20% – potentially reduced to 0% under certain treaties and conditions.
Ordinary corporation tax rate – potentially exempt if selling unquoted shares or participations in Russia.
Singapore 3% on assets.5% – 15% on residential assets.0.2% on shares.
17% Not taxed. Up to 15% – potentially reduced to 0% under certain treaties or if domestic conditions apply.
Not taxed.
South Korea 4.6% on assets.0.5% on shares.Minimal stamp duty on documents.
22% + 2.2% provincial tax
Residents – 15.4%Non-residents – 22%
Residents – 15.4%Non-residents – 22%
Ordinary corporation tax rate – potentially reduced if Korean sourced gains.
Spain 7% on assets.0.75% – 2.5% on notarised documents.
28% Up to 20% – potentially reduced to 0% under certain treaties.
Up to 20% – potentially reduced to 0% under certain treaties.
Ordinary corporation tax rate.Participation exemptions may apply.
Sweden 4.25% stamp duty on assets. 22% Up to 30% – potentially reduced to 0% under certain treaties or if the EU Parent-Subsidiary Directive applies.
Not taxed. Ordinary corporation tax rate – may be exempt if sale shares in a resident company
Taiwan 2% – 6% deed tax on asset price. 17% Up to 20% – potentially reduced to 5% under certain treaties.
Up to 10% – potentially reduced to 0% under certain treaties.
Ordinary corporation tax rate. Sale of land subject to Land Value Incremental Tax.
UK 0% – 4% stamp duty on non-residential assets.7% – 12% stamp duty on residential assets.0.5% stamp duty on shares.
21% 0% – except 20% for REITS. Up to 20% – potentially reduced to 0% under certain treaties or if EU Interest and Royalties Directive applies.
Part of a company’s taxable profits.Potentially exempt for non-resident companies.
US Transfer tax varies by state and in some cases, city. Mortgage recording tax may apply in some localities.
35% (state income tax may also apply)
Up to 30% – potentially reduced to 0% under certain treaties.
Up to 30% – potentially reduced to 0% under certain treaties.
Ordinary corporation tax rate –foreign corporations may be exempt.
International property handbook H1 2015 XV
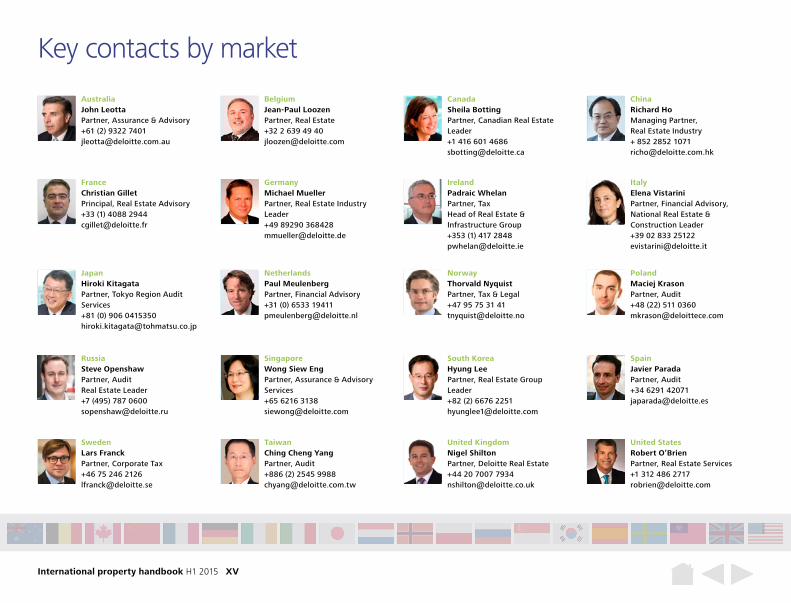
Key contacts by market
AustraliaJohn LeottaPartner, Assurance & Advisory+61 (2) 9322 [email protected]
BelgiumJean-Paul LoozenPartner, Real Estate+32 2 639 49 [email protected]
CanadaSheila BottingPartner, Canadian Real Estate Leader+1 416 601 [email protected]
ChinaRichard HoManaging Partner,Real Estate Industry+ 852 2852 [email protected]
FranceChristian GilletPrincipal, Real Estate Advisory+33 (1) 4088 [email protected]
GermanyMichael MuellerPartner, Real Estate Industry Leader+49 89290 [email protected]
IrelandPadraic WhelanPartner, TaxHead of Real Estate & Infrastructure Group+353 (1) 417 [email protected]
ItalyElena VistariniPartner, Financial Advisory, National Real Estate & Construction Leader+39 02 833 [email protected]
JapanHiroki KitagataPartner, Tokyo Region Audit Services+81 (0) 906 [email protected]
NetherlandsPaul MeulenbergPartner, Financial Advisory+31 (0) 6533 [email protected]
NorwayThorvald NyquistPartner, Tax & Legal+47 95 75 31 [email protected]
PolandMaciej KrasonPartner, Audit+48 (22) 511 [email protected]
RussiaSteve OpenshawPartner, Audit Real Estate Leader +7 (495) 787 0600 [email protected]
SingaporeWong Siew EngPartner, Assurance & Advisory Services+65 6216 [email protected]
South KoreaHyung LeePartner, Real Estate Group Leader +82 (2) 6676 [email protected]
SpainJavier ParadaPartner, Audit+34 6291 [email protected]
SwedenLars FranckPartner, Corporate Tax+46 75 246 [email protected]
TaiwanChing Cheng YangPartner, Audit+886 (2) 2545 [email protected]
United KingdomNigel ShiltonPartner, Deloitte Real Estate+44 20 7007 [email protected]
United StatesRobert O’BrienPartner, Real Estate Services+1 312 486 [email protected]
International property handbook H1 2015 1
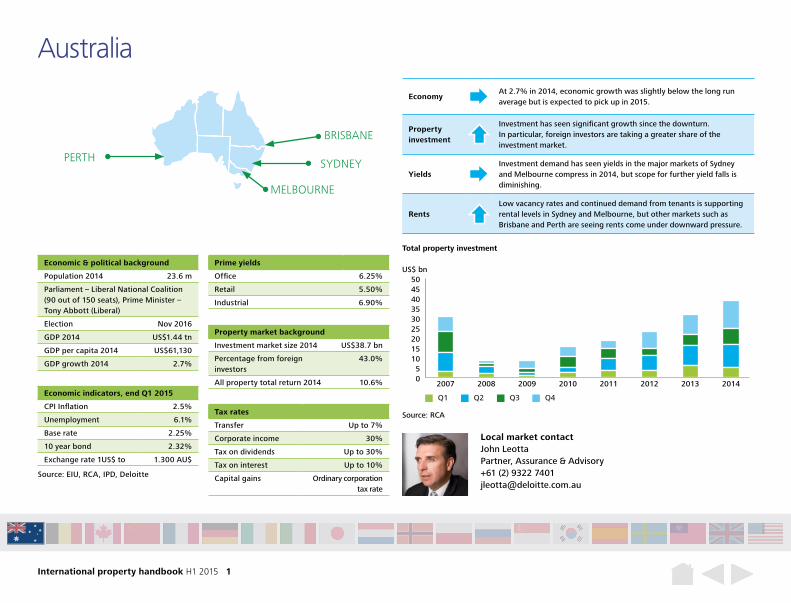
EconomyAt 2.7% in 2014, economic growth was slightly below the long run average but is expected to pick up in 2015.
Property investment
Investment has seen significant growth since the downturn.In particular, foreign investors are taking a greater share of the investment market.
YieldsInvestment demand has seen yields in the major markets of Sydney and Melbourne compress in 2014, but scope for further yield falls is diminishing.
RentsLow vacancy rates and continued demand from tenants is supporting rental levels in Sydney and Melbourne, but other markets such as Brisbane and Perth are seeing rents come under downward pressure.
Australia
Economic & political background
Population 2014 23.6 m
Parliament – Liberal National Coalition (90 out of 150 seats), Prime Minister – Tony Abbott (Liberal)
Election Nov 2016
GDP 2014 US$1.44 tn
GDP per capita 2014 US$61,130
GDP growth 2014 2.7%
Prime yields
Office 6.25%
Retail 5.50%
Industrial 6.90%
Property market background
Investment market size 2014 US$38.7 bn
Percentage from foreign investors
43.0%
All property total return 2014 10.6%Economic indicators, end Q1 2015
CPI Inflation 2.5%
Unemployment 6.1%
Base rate 2.25%
10 year bond 2.32%
Exchange rate 1US$ to 1.300 AU$
Local market contactJohn Leotta Partner, Assurance & Advisory +61 (2) 9322 7401 [email protected]
05
101520253035404550
20142013201220112010200920082007
Source: RCA
Total property investment
US$ bn
Q1 Q2 Q3 Q4
Tax rates
Transfer Up to 7%
Corporate income 30%
Tax on dividends Up to 30%
Tax on interest Up to 10%
Capital gains Ordinary corporation tax rate
Source: EIU, RCA, IPD, Deloitte
PERTH
MELBOURNE
BRISBANE
SYDNEY
International property handbook H1 2015 2
Source: EIU
GDP growth CPI inflation
Economic output and inflation
0%
1%
2%
3%
4%
5%
2016201520142013201220112010200920082007200620052004
0%
1%
2%
3%
4%
5%
6%
7%
2016201520142013201220112010200920082007200620052004
Source: EIU
Consumer expenditure growth
Consumer spending and unemployment
Unemployment rate
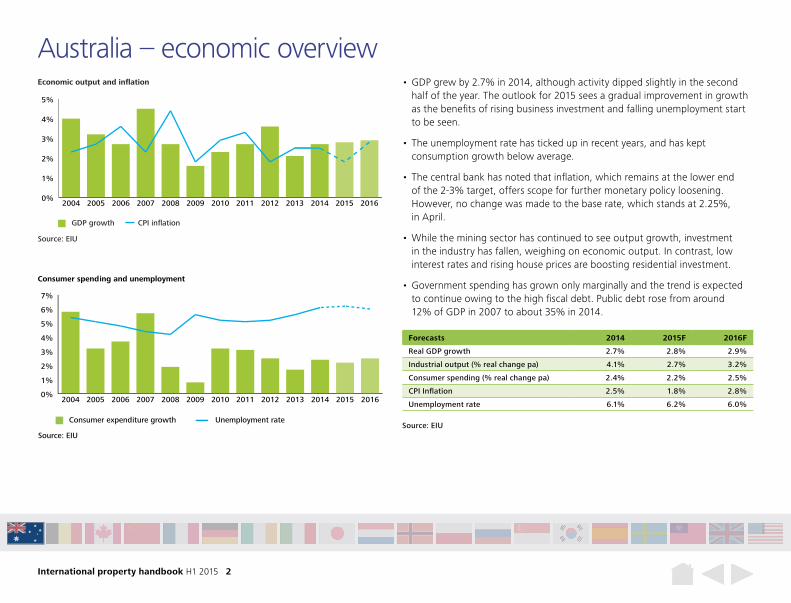
Forecasts 2014 2015F 2016F
Real GDP growth 2.7% 2.8% 2.9%
Industrial output (% real change pa) 4.1% 2.7% 3.2%
Consumer spending (% real change pa) 2.4% 2.2% 2.5%
CPI Inflation 2.5% 1.8% 2.8%
Unemployment rate 6.1% 6.2% 6.0%
Source: EIU
• GDP grew by 2.7% in 2014, although activity dipped slightly in the second half of the year. The outlook for 2015 sees a gradual improvement in growth as the benefits of rising business investment and falling unemployment start to be seen.
• The unemployment rate has ticked up in recent years, and has kept consumption growth below average.
• The central bank has noted that inflation, which remains at the lower end of the 2-3% target, offers scope for further monetary policy loosening. However, no change was made to the base rate, which stands at 2.25%, in April.
• While the mining sector has continued to see output growth, investment in the industry has fallen, weighing on economic output. In contrast, low interest rates and rising house prices are boosting residential investment.
• Government spending has grown only marginally and the trend is expected to continue owing to the high fiscal debt. Public debt rose from around 12% of GDP in 2007 to about 35% in 2014.
Australia – economic overview
International property handbook H1 2015 3
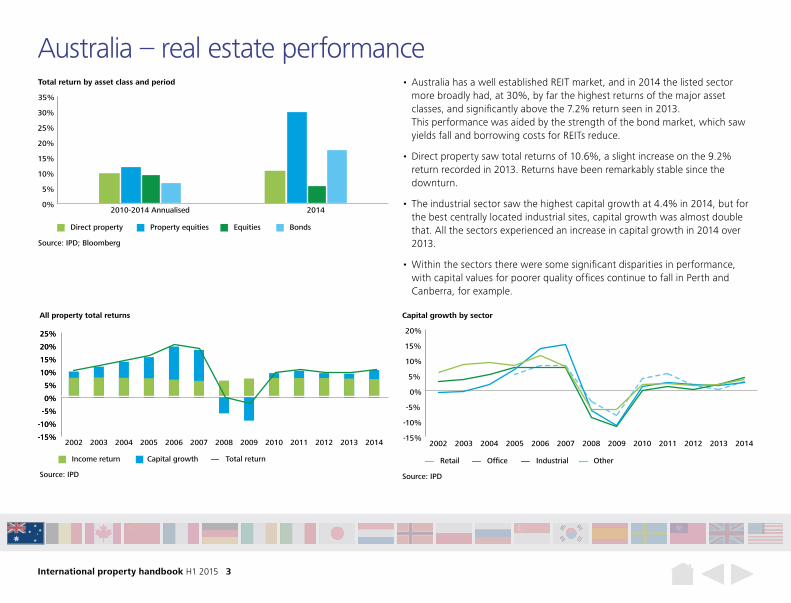
Australia – real estate performance • Australia has a well established REIT market, and in 2014 the listed sector
more broadly had, at 30%, by far the highest returns of the major asset classes, and significantly above the 7.2% return seen in 2013. This performance was aided by the strength of the bond market, which saw yields fall and borrowing costs for REITs reduce.
• Direct property saw total returns of 10.6%, a slight increase on the 9.2% return recorded in 2013. Returns have been remarkably stable since the downturn.
• The industrial sector saw the highest capital growth at 4.4% in 2014, but for the best centrally located industrial sites, capital growth was almost double that. All the sectors experienced an increase in capital growth in 2014 over 2013.
• Within the sectors there were some significant disparities in performance, with capital values for poorer quality offices continue to fall in Perth and Canberra, for example.
-15%
-10%
-5%
0%
5%
10%
15%
20%
25%
-15%
-10%
-5%
0%
5%
10%
15%
20%
25%
2014201320122011201020092008200720062005200420032002
All property total returns
Source: IPD
Income return Capital growth Total return
-15%
-10%
-5%
0%
5%
10%
15%
20%
2014201320122011201020092008200720062005200420032002
Source: IPD
OfficeRetail Industrial Other
Capital growth by sector
0%
5%
10%
15%
20%
25%
30%
35%
20142010-2014 Annualised
Source: IPD; Bloomberg
Total return by asset class and period
Direct property Property equities Equities Bonds
International property handbook H1 2015 4
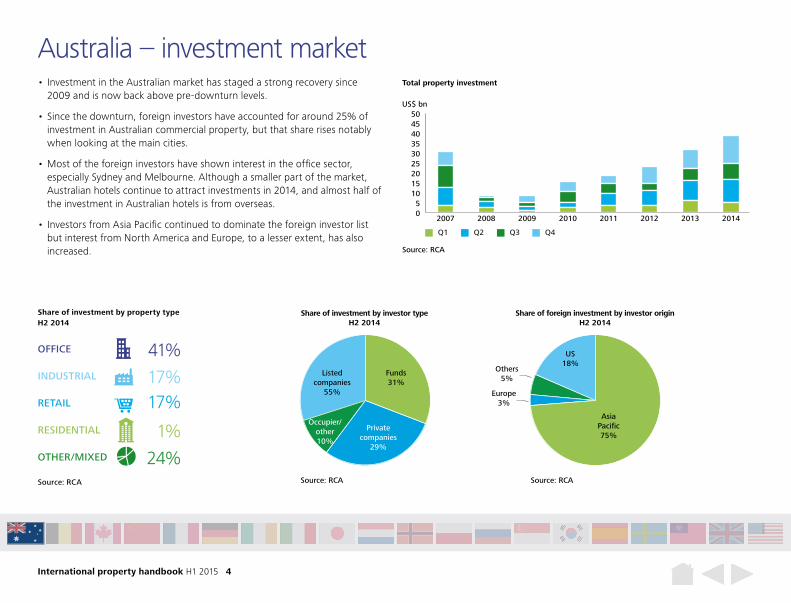
• Investment in the Australian market has staged a strong recovery since 2009 and is now back above pre-downturn levels.
• Since the downturn, foreign investors have accounted for around 25% of investment in Australian commercial property, but that share rises notably when looking at the main cities.
• Most of the foreign investors have shown interest in the office sector, especially Sydney and Melbourne. Although a smaller part of the market, Australian hotels continue to attract investments in 2014, and almost half of the investment in Australian hotels is from overseas.
• Investors from Asia Pacific continued to dominate the foreign investor list but interest from North America and Europe, to a lesser extent, has also increased.
Australia – investment market
Private companies
29%
Share of investment by investor type H2 2014
Source: RCA
Listed companies
55%
Occupier/other10%
Funds31%
Share of foreign investment by investor origin H2 2014
Source: RCA
US18%
Others5%
Asia Pacific75%
Europe3%
Share of investment by property type H2 2014
Source: RCA
OFFICE 41%INDUSTRIAL 17%RETAIL 17%RESIDENTIAL 1%OTHER/MIXED 24%
05
101520253035404550
20142013201220112010200920082007
Source: RCA
Total property investment
US$ bn
Q1 Q2 Q3 Q4
International property handbook H1 2015 5
Sydney – key recent deals
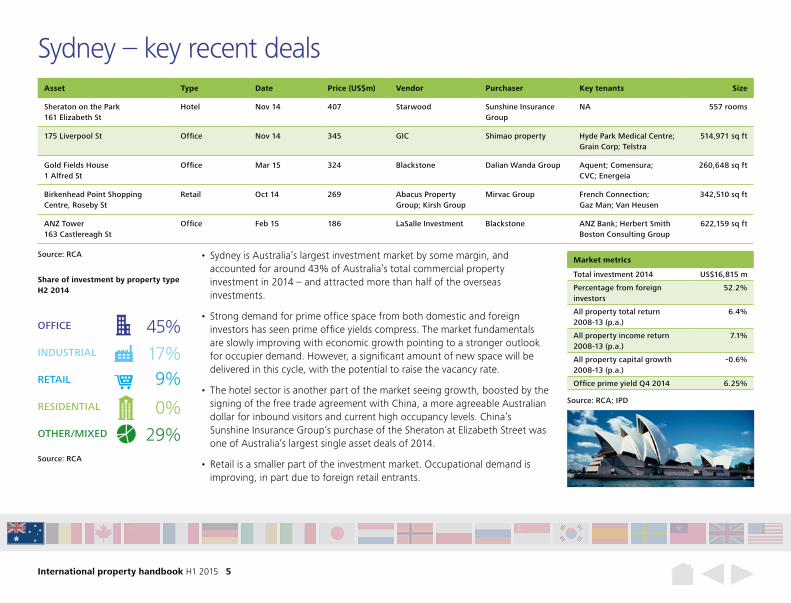
• Sydney is Australia’s largest investment market by some margin, and accounted for around 43% of Australia’s total commercial property investment in 2014 – and attracted more than half of the overseas investments.
• Strong demand for prime office space from both domestic and foreign investors has seen prime office yields compress. The market fundamentals are slowly improving with economic growth pointing to a stronger outlook for occupier demand. However, a significant amount of new space will be delivered in this cycle, with the potential to raise the vacancy rate.
• The hotel sector is another part of the market seeing growth, boosted by the signing of the free trade agreement with China, a more agreeable Australian dollar for inbound visitors and current high occupancy levels. China’s Sunshine Insurance Group’s purchase of the Sheraton at Elizabeth Street was one of Australia’s largest single asset deals of 2014.
• Retail is a smaller part of the investment market. Occupational demand is improving, in part due to foreign retail entrants.
Source: RCA
45%
17%9%
0%
29%
Source: RCA; IPD
Market metrics
Total investment 2014 US$16,815 m
Percentage from foreign investors
52.2%
All property total return 2008-13 (p.a.)
6.4%
All property income return 2008-13 (p.a.)
7.1%
All property capital growth 2008-13 (p.a.)
-0.6%
Office prime yield Q4 2014 6.25%
Asset Type Date Price (US$m) Vendor Purchaser Key tenants Size
Sheraton on the Park 161 Elizabeth St
Hotel Nov 14 407 Starwood Sunshine Insurance Group
NA 557 rooms
175 Liverpool St Office Nov 14 345 GIC Shimao property Hyde Park Medical Centre; Grain Corp; Telstra
514,971 sq ft
Gold Fields House 1 Alfred St
Office Mar 15 324 Blackstone Dalian Wanda Group Aquent; Comensura; CVC; Energeia
260,648 sq ft
Birkenhead Point Shopping Centre, Roseby St
Retail Oct 14 269 Abacus Property Group; Kirsh Group
Mirvac Group French Connection; Gaz Man; Van Heusen
342,510 sq ft
ANZ Tower 163 Castlereagh St
Office Feb 15 186 LaSalle Investment Blackstone ANZ Bank; Herbert Smith Boston Consulting Group
622,159 sq ft
Share of investment by property typeH2 2014
Source: RCA
OFFICE
INDUSTRIAL
RETAIL
RESIDENTIAL
OTHER/MIXED
International property handbook H1 2015 6
Melbourne – key recent deals
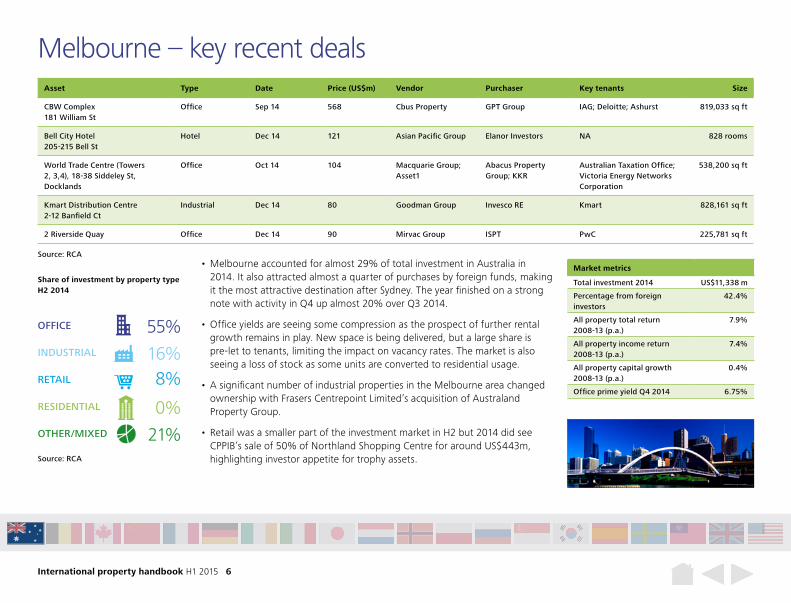
• Melbourne accounted for almost 29% of total investment in Australia in 2014. It also attracted almost a quarter of purchases by foreign funds, making it the most attractive destination after Sydney. The year finished on a strong note with activity in Q4 up almost 20% over Q3 2014.
• Office yields are seeing some compression as the prospect of further rental growth remains in play. New space is being delivered, but a large share is pre-let to tenants, limiting the impact on vacancy rates. The market is also seeing a loss of stock as some units are converted to residential usage.
• A significant number of industrial properties in the Melbourne area changed ownership with Frasers Centrepoint Limited’s acquisition of Australand Property Group.
• Retail was a smaller part of the investment market in H2 but 2014 did see CPPIB’s sale of 50% of Northland Shopping Centre for around US$443m, highlighting investor appetite for trophy assets.
Source: RCA
55%
16%8%
0%
21%Source: RCA; IPD
Market metrics
Total investment 2014 US$11,338 m
Percentage from foreign investors
42.4%
All property total return 2008-13 (p.a.)
7.9%
All property income return 2008-13 (p.a.)
7.4%
All property capital growth 2008-13 (p.a.)
0.4%
Office prime yield Q4 2014 6.75%
Asset Type Date Price (US$m) Vendor Purchaser Key tenants Size
CBW Complex 181 William St
Office Sep 14 568 Cbus Property GPT Group IAG; Deloitte; Ashurst 819,033 sq ft
Bell City Hotel 205-215 Bell St
Hotel Dec 14 121 Asian Pacific Group Elanor Investors NA 828 rooms
World Trade Centre (Towers 2, 3,4), 18-38 Siddeley St, Docklands
Office Oct 14 104 Macquarie Group; Asset1
Abacus Property Group; KKR
Australian Taxation Office; Victoria Energy Networks Corporation
538,200 sq ft
Kmart Distribution Centre 2-12 Banfield Ct
Industrial Dec 14 80 Goodman Group Invesco RE Kmart 828,161 sq ft
2 Riverside Quay Office Dec 14 90 Mirvac Group ISPT PwC 225,781 sq ft
Share of investment by property typeH2 2014
Source: RCA
OFFICE
INDUSTRIAL
RETAIL
RESIDENTIAL
OTHER/MIXED
International property handbook H1 2015 7
Brisbane – key recent deals
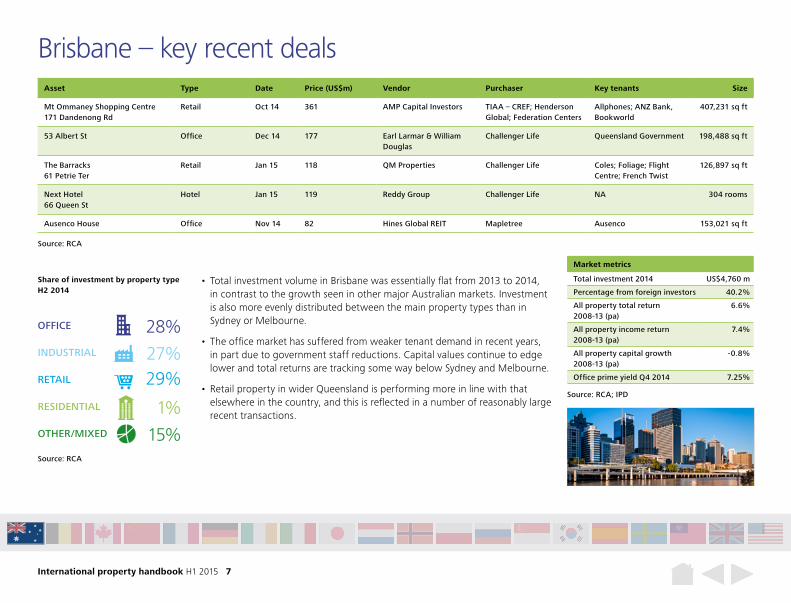
• Total investment volume in Brisbane was essentially flat from 2013 to 2014, in contrast to the growth seen in other major Australian markets. Investment is also more evenly distributed between the main property types than in Sydney or Melbourne.
• The office market has suffered from weaker tenant demand in recent years, in part due to government staff reductions. Capital values continue to edge lower and total returns are tracking some way below Sydney and Melbourne.
• Retail property in wider Queensland is performing more in line with that elsewhere in the country, and this is reflected in a number of reasonably large recent transactions.
Source: RCA
28%
27%29%
1%
15%
Source: RCA; IPD
Market metrics
Total investment 2014 US$4,760 m
Percentage from foreign investors 40.2%
All property total return 2008-13 (pa)
6.6%
All property income return 2008-13 (pa)
7.4%
All property capital growth 2008-13 (pa)
-0.8%
Office prime yield Q4 2014 7.25%
Asset Type Date Price (US$m) Vendor Purchaser Key tenants Size
Mt Ommaney Shopping Centre171 Dandenong Rd
Retail Oct 14 361 AMP Capital Investors TIAA – CREF; Henderson Global; Federation Centers
Allphones; ANZ Bank, Bookworld
407,231 sq ft
53 Albert St Office Dec 14 177 Earl Larmar & William Douglas
Challenger Life Queensland Government 198,488 sq ft
The Barracks 61 Petrie Ter
Retail Jan 15 118 QM Properties Challenger Life Coles; Foliage; Flight Centre; French Twist
126,897 sq ft
Next Hotel 66 Queen St
Hotel Jan 15 119 Reddy Group Challenger Life NA 304 rooms
Ausenco House Office Nov 14 82 Hines Global REIT Mapletree Ausenco 153,021 sq ft
Share of investment by property typeH2 2014
Source: RCA
OFFICE
INDUSTRIAL
RETAIL
RESIDENTIAL
OTHER/MIXED
International property handbook H1 2015 8
Perth – key recent deals
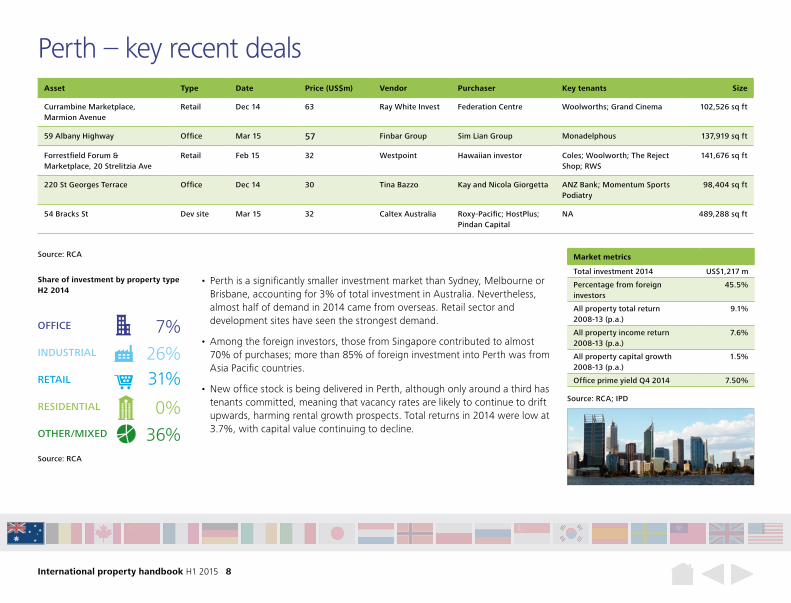
• Perth is a significantly smaller investment market than Sydney, Melbourne or Brisbane, accounting for 3% of total investment in Australia. Nevertheless, almost half of demand in 2014 came from overseas. Retail sector and development sites have seen the strongest demand.
• Among the foreign investors, those from Singapore contributed to almost 70% of purchases; more than 85% of foreign investment into Perth was from Asia Pacific countries.
• New office stock is being delivered in Perth, although only around a third has tenants committed, meaning that vacancy rates are likely to continue to drift upwards, harming rental growth prospects. Total returns in 2014 were low at 3.7%, with capital value continuing to decline.
Source: RCA
7%
26%31%
0%
36%
Source: RCA; IPD
Market metrics
Total investment 2014 US$1,217 m
Percentage from foreign investors
45.5%
All property total return 2008-13 (p.a.)
9.1%
All property income return 2008-13 (p.a.)
7.6%
All property capital growth 2008-13 (p.a.)
1.5%
Office prime yield Q4 2014 7.50%
Asset Type Date Price (US$m) Vendor Purchaser Key tenants Size
Currambine Marketplace, Marmion Avenue
Retail Dec 14 63 Ray White Invest Federation Centre Woolworths; Grand Cinema 102,526 sq ft
59 Albany Highway Office Mar 15 57 Finbar Group Sim Lian Group Monadelphous 137,919 sq ft
Forrestfield Forum & Marketplace, 20 Strelitzia Ave
Retail Feb 15 32 Westpoint Hawaiian investor Coles; Woolworth; The Reject Shop; RWS
141,676 sq ft
220 St Georges Terrace Office Dec 14 30 Tina Bazzo Kay and Nicola Giorgetta ANZ Bank; Momentum Sports Podiatry
98,404 sq ft
54 Bracks St Dev site Mar 15 32 Caltex Australia Roxy-Pacific; HostPlus; Pindan Capital
NA 489,288 sq ft
Share of investment by property typeH2 2014
Source: RCA
OFFICE
INDUSTRIAL
RETAIL
RESIDENTIAL
OTHER/MIXED
International property handbook H1 2015 9
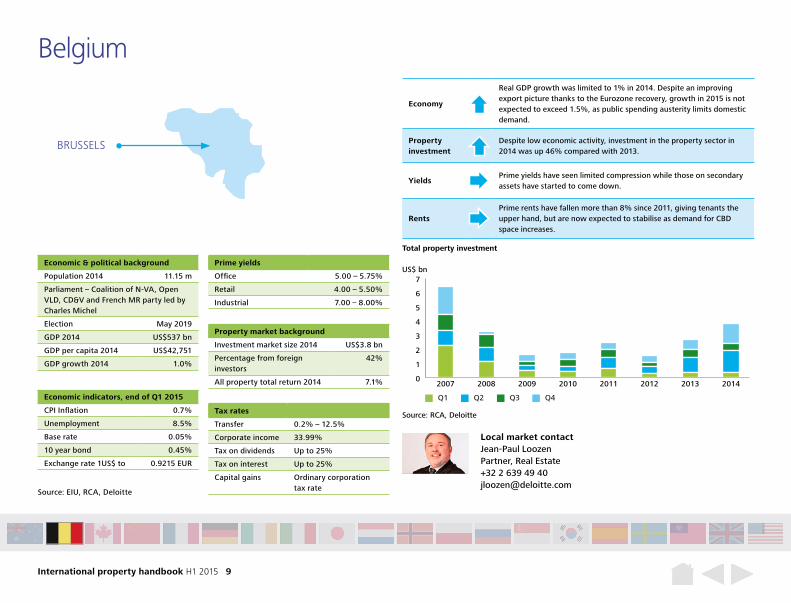
Economy
Real GDP growth was limited to 1% in 2014. Despite an improving export picture thanks to the Eurozone recovery, growth in 2015 is not expected to exceed 1.5%, as public spending austerity limits domestic demand.
Property investment
Despite low economic activity, investment in the property sector in 2014 was up 46% compared with 2013.
YieldsPrime yields have seen limited compression while those on secondary assets have started to come down.
RentsPrime rents have fallen more than 8% since 2011, giving tenants the upper hand, but are now expected to stabilise as demand for CBD space increases.
Belgium
Economic & political background
Population 2014 11.15 m
Parliament – Coalition of N-VA, Open VLD, CD&V and French MR party led by Charles Michel
Election May 2019
GDP 2014 US$537 bn
GDP per capita 2014 US$42,751
GDP growth 2014 1.0%
Prime yields
Office 5.00 – 5.75%
Retail 4.00 – 5.50%
Industrial 7.00 – 8.00%
Property market background
Investment market size 2014 US$3.8 bn
Percentage from foreign investors
42%
All property total return 2014 7.1%
Tax rates
Transfer 0.2% – 12.5%
Corporate income 33.99%
Tax on dividends Up to 25%
Tax on interest Up to 25%
Capital gains Ordinary corporation tax rate
Economic indicators, end of Q1 2015
CPI Inflation 0.7%
Unemployment 8.5%
Base rate 0.05%
10 year bond 0.45%
Exchange rate 1US$ to 0.9215 EUR
Local market contactJean-Paul Loozen Partner, Real Estate +32 2 639 49 40 [email protected]
0
1
2
3
4
5
6
7
20142013201220112010200920082007
Source: RCA, Deloitte
Total property investment
US$ bn
Q1 Q2 Q3 Q4
Source: EIU, RCA, Deloitte
BRUSSELS
International property handbook H1 2015 10
Source: EIU
GDP growth CPI inflation
Economic output and inflation
-3%
-2%
-1%
0%
1%
2%
3%
4%
5%
2016201520142013201220112010200920082007200620052004
0%1%2%3%4%5%6%7%8%9%
10%
2016201520142013201220112010200920082007200620052004
Source: EIU
Consumer expenditure growth
Consumer spending and unemployment
Unemployment rate
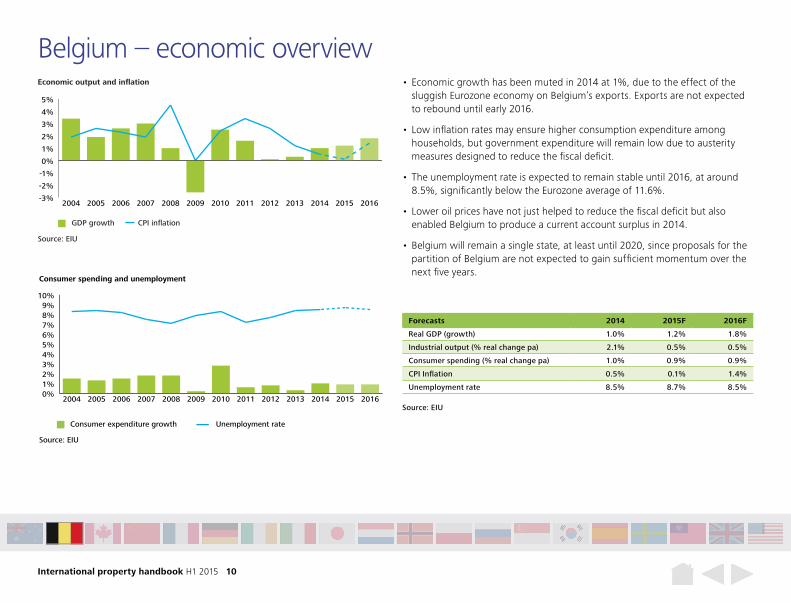
Forecasts 2014 2015F 2016F
Real GDP (growth) 1.0% 1.2% 1.8%
Industrial output (% real change pa) 2.1% 0.5% 0.5%
Consumer spending (% real change pa) 1.0% 0.9% 0.9%
CPI Inflation 0.5% 0.1% 1.4%
Unemployment rate 8.5% 8.7% 8.5%
Source: EIU
• Economic growth has been muted in 2014 at 1%, due to the effect of the sluggish Eurozone economy on Belgium’s exports. Exports are not expected to rebound until early 2016.
• Low inflation rates may ensure higher consumption expenditure among households, but government expenditure will remain low due to austerity measures designed to reduce the fiscal deficit.
• The unemployment rate is expected to remain stable until 2016, at around 8.5%, significantly below the Eurozone average of 11.6%.
• Lower oil prices have not just helped to reduce the fiscal deficit but also enabled Belgium to produce a current account surplus in 2014.
• Belgium will remain a single state, at least until 2020, since proposals for the partition of Belgium are not expected to gain sufficient momentum over the next five years.
Belgium – economic overview
International property handbook H1 2015 11
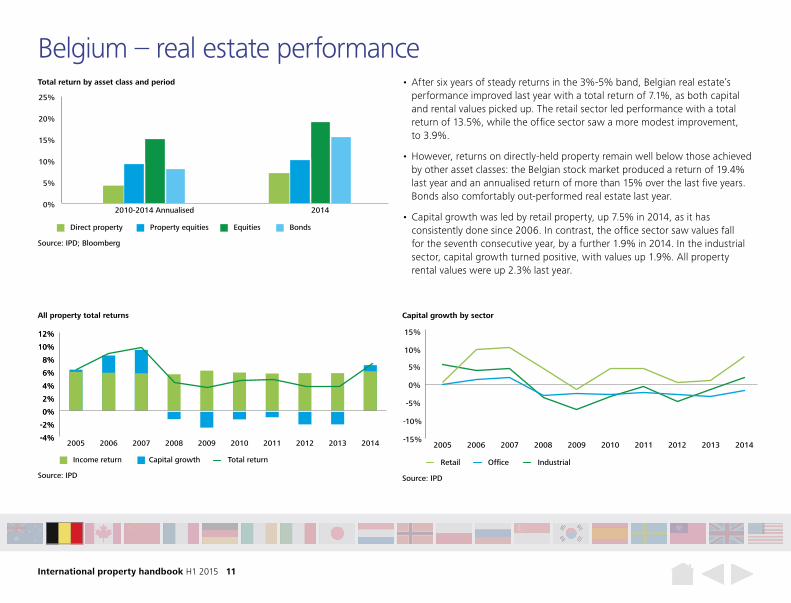
Belgium – real estate performance• After six years of steady returns in the 3%-5% band, Belgian real estate’s
performance improved last year with a total return of 7.1%, as both capital and rental values picked up. The retail sector led performance with a total return of 13.5%, while the office sector saw a more modest improvement, to 3.9%.
• However, returns on directly-held property remain well below those achieved by other asset classes: the Belgian stock market produced a return of 19.4% last year and an annualised return of more than 15% over the last five years. Bonds also comfortably out-performed real estate last year.
• Capital growth was led by retail property, up 7.5% in 2014, as it has consistently done since 2006. In contrast, the office sector saw values fall for the seventh consecutive year, by a further 1.9% in 2014. In the industrial sector, capital growth turned positive, with values up 1.9%. All property rental values were up 2.3% last year.
-4%
-2%
0%
2%
4%
6%
8%
10%
12%
-4%
-2%
0%
2%
4%
6%
8%
10%
12%
2014201320122011201020092008200720062005
Source: IPD
Income return Capital growth Total return
All property total returns
-15%
-10%
-5%
0%
5%
10%
15%
2014201320122011201020092008200720062005
Source: IPD
OfficeRetail Industrial
Capital growth by sector
0%
5%
10%
15%
20%
25%
20142010-2014 Annualised
Source: IPD; Bloomberg
Total return by asset class and period
Direct property Property equities Equities Bonds
International property handbook H1 2015 12
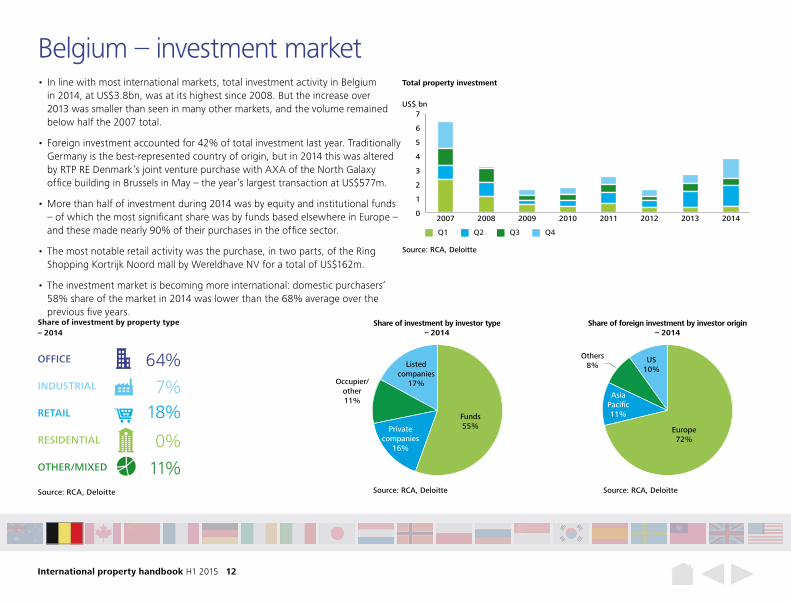
• In line with most international markets, total investment activity in Belgium in 2014, at US$3.8bn, was at its highest since 2008. But the increase over 2013 was smaller than seen in many other markets, and the volume remained below half the 2007 total.
• Foreign investment accounted for 42% of total investment last year. Traditionally Germany is the best-represented country of origin, but in 2014 this was altered by RTP RE Denmark’s joint venture purchase with AXA of the North Galaxy office building in Brussels in May – the year’s largest transaction at US$577m.
• More than half of investment during 2014 was by equity and institutional funds – of which the most significant share was by funds based elsewhere in Europe – and these made nearly 90% of their purchases in the office sector.
• The most notable retail activity was the purchase, in two parts, of the Ring Shopping Kortrijk Noord mall by Wereldhave NV for a total of US$162m.
• The investment market is becoming more international: domestic purchasers’ 58% share of the market in 2014 was lower than the 68% average over the previous five years.
Belgium – investment market
Private companies
16%
Share of investment by investor type – 2014
Source: RCA, Deloitte
Listed companies
17%Occupier/other11%
Funds55%
Share of foreign investment by investor origin – 2014
Source: RCA, Deloitte
US10%
Europe72%
Asia Pacific11%
Others8%
Share of investment by property type – 2014
Source: RCA, Deloitte
OFFICE 64%INDUSTRIAL 7%RETAIL 18%RESIDENTIAL 0%OTHER/MIXED 11%
0
1
2
3
4
5
6
7
20142013201220112010200920082007
Source: RCA, Deloitte
Total property investment
US$ bn
Q1 Q2 Q3 Q4
International property handbook H1 2015 13
Brussels – key recent deals
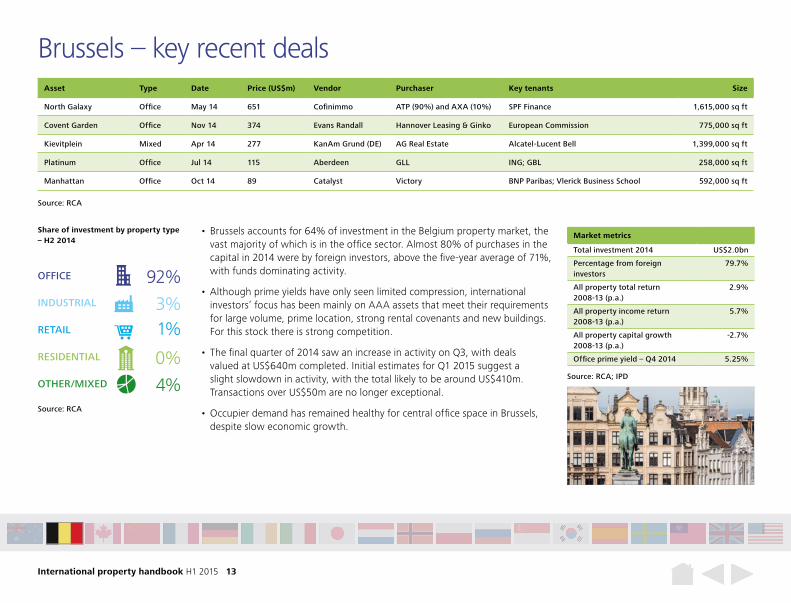
• Brussels accounts for 64% of investment in the Belgium property market, the vast majority of which is in the office sector. Almost 80% of purchases in the capital in 2014 were by foreign investors, above the five-year average of 71%, with funds dominating activity.
• Although prime yields have only seen limited compression, international investors’ focus has been mainly on AAA assets that meet their requirements for large volume, prime location, strong rental covenants and new buildings. For this stock there is strong competition.
• The final quarter of 2014 saw an increase in activity on Q3, with deals valued at US$640m completed. Initial estimates for Q1 2015 suggest a slight slowdown in activity, with the total likely to be around US$410m. Transactions over US$50m are no longer exceptional.
• Occupier demand has remained healthy for central office space in Brussels, despite slow economic growth.
Source: RCA
92%
3%1%
0%
4%Source: RCA; IPD
Market metrics
Total investment 2014 US$2.0bn
Percentage from foreign investors
79.7%
All property total return 2008-13 (p.a.)
2.9%
All property income return 2008-13 (p.a.)
5.7%
All property capital growth 2008-13 (p.a.)
-2.7%
Office prime yield – Q4 2014 5.25%
Asset Type Date Price (US$m) Vendor Purchaser Key tenants Size
North Galaxy Office May 14 651 Cofinimmo ATP (90%) and AXA (10%) SPF Finance 1,615,000 sq ft
Covent Garden Office Nov 14 374 Evans Randall Hannover Leasing & Ginko European Commission 775,000 sq ft
Kievitplein Mixed Apr 14 277 KanAm Grund (DE) AG Real Estate Alcatel-Lucent Bell 1,399,000 sq ft
Platinum Office Jul 14 115 Aberdeen GLL ING; GBL 258,000 sq ft
Manhattan Office Oct 14 89 Catalyst Victory BNP Paribas; Vlerick Business School 592,000 sq ft
Share of investment by property type– H2 2014
Source: RCA
OFFICE
INDUSTRIAL
RETAIL
RESIDENTIAL
OTHER/MIXED
International property handbook H1 2015 14
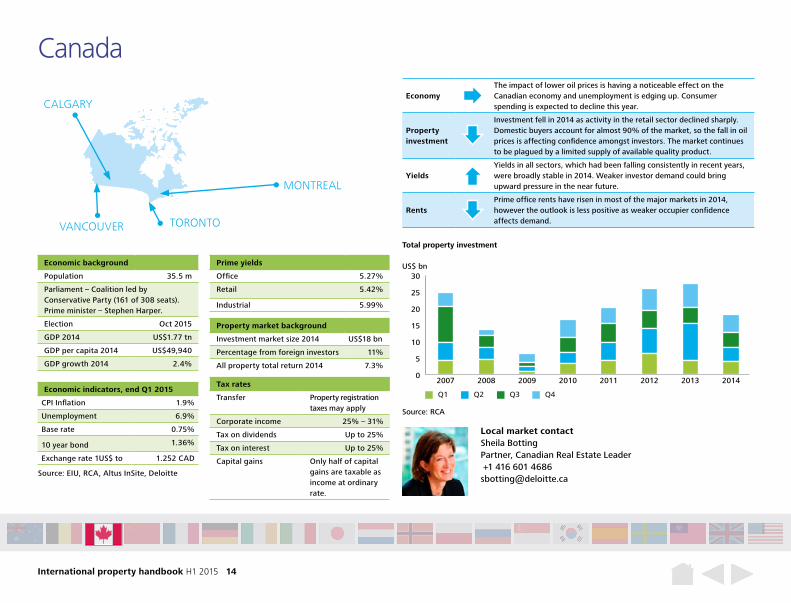
EconomyThe impact of lower oil prices is having a noticeable effect on the Canadian economy and unemployment is edging up. Consumer spending is expected to decline this year.
Property investment
Investment fell in 2014 as activity in the retail sector declined sharply. Domestic buyers account for almost 90% of the market, so the fall in oil prices is affecting confidence amongst investors. The market continues to be plagued by a limited supply of available quality product.
YieldsYields in all sectors, which had been falling consistently in recent years, were broadly stable in 2014. Weaker investor demand could bring upward pressure in the near future.
RentsPrime office rents have risen in most of the major markets in 2014, however the outlook is less positive as weaker occupier confidence affects demand.
Canada
Economic background
Population 35.5 m
Parliament – Coalition led by Conservative Party (161 of 308 seats). Prime minister – Stephen Harper.
Election Oct 2015
GDP 2014 US$1.77 tn
GDP per capita 2014 US$49,940
GDP growth 2014 2.4%
Prime yields
Office 5.27%
Retail 5.42%
Industrial 5.99%
Tax rates
Transfer Property registration taxes may apply
Corporate income 25% – 31%
Tax on dividends Up to 25%
Tax on interest Up to 25%
Capital gains Only half of capital gains are taxable as income at ordinary rate.
Property market background
Investment market size 2014 US$18 bn
Percentage from foreign investors 11%
All property total return 2014 7.3%
Economic indicators, end Q1 2015
CPI Inflation 1.9%
Unemployment 6.9%
Base rate 0.75%
10 year bond 1.36%
Exchange rate 1US$ to 1.252 CAD
Local market contactSheila Botting Partner, Canadian Real Estate Leader +1 416 601 4686 [email protected]
0
5
10
15
20
25
30
20142013201220112010200920082007
Source: RCA
Total property investment
US$ bn
Q1 Q2 Q3 Q4
Source: EIU, RCA, Altus InSite, Deloitte
TORONTO
CALGARY
MONTREAL
VANCOUVER
International property handbook H1 2015 15
Source: EIU
GDP growth CPI inflation
Economic output and inflation
-4%
-3%
-2%
-1%
0%
1%
2%
3%
4%
2016201520142013201220112010200920082007200620052004
0%
2%
4%
6%
8%
10%
2016201520142013201220112010200920082007200620052004
Source: EIU
Consumer expenditure growth
Consumer spending and unemployment
Unemployment rate
Forecasts 2014 2015F 2016F
Real GDP (growth) 2.4% 2.0% 2.3%
Industrial output (% real change pa) 2.0% -1.0% 1.7%
Consumer spending (% real change pa) 2.9% 1.8% 1.8%
CPI Inflation 1.9% 0.7% 2.3%
Unemployment rate 6.9% 6.8% 6.6 %
Source: EIU
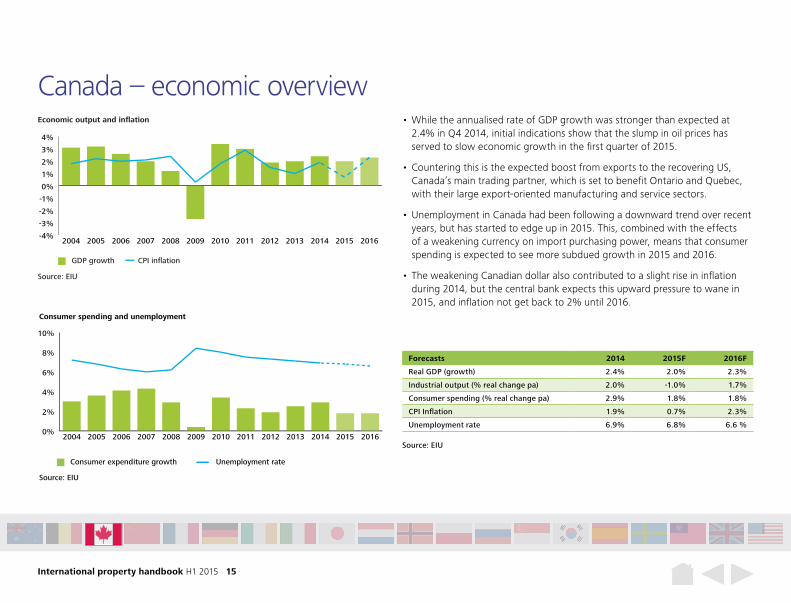
Canada – economic overview • While the annualised rate of GDP growth was stronger than expected at
2.4% in Q4 2014, initial indications show that the slump in oil prices has served to slow economic growth in the first quarter of 2015.
• Countering this is the expected boost from exports to the recovering US, Canada’s main trading partner, which is set to benefit Ontario and Quebec, with their large export-oriented manufacturing and service sectors.
• Unemployment in Canada had been following a downward trend over recent years, but has started to edge up in 2015. This, combined with the effects of a weakening currency on import purchasing power, means that consumer spending is expected to see more subdued growth in 2015 and 2016.
• The weakening Canadian dollar also contributed to a slight rise in inflation during 2014, but the central bank expects this upward pressure to wane in 2015, and inflation not get back to 2% until 2016.
International property handbook H1 2015 16
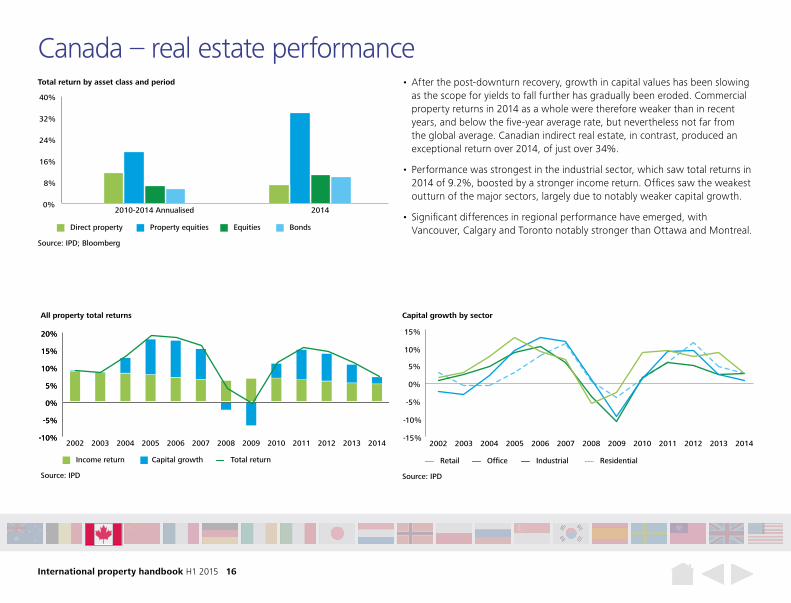
Canada – real estate performance• After the post-downturn recovery, growth in capital values has been slowing
as the scope for yields to fall further has gradually been eroded. Commercial property returns in 2014 as a whole were therefore weaker than in recent years, and below the five-year average rate, but nevertheless not far from the global average. Canadian indirect real estate, in contrast, produced an exceptional return over 2014, of just over 34%.
• Performance was strongest in the industrial sector, which saw total returns in 2014 of 9.2%, boosted by a stronger income return. Offices saw the weakest outturn of the major sectors, largely due to notably weaker capital growth.
• Significant differences in regional performance have emerged, with Vancouver, Calgary and Toronto notably stronger than Ottawa and Montreal.
-10%
-5%
0%
5%
10%
15%
20%
-10%
-5%
0%
5%
10%
15%
20%
2014201320122011201020092008200720062005200420032002
Source: IPD
Income return Capital growth Total return
All property total returns
-15%
-10%
-5%
0%
5%
10%
15%
2014201320122011201020092008200720062005200420032002
Source: IPD
OfficeRetail Industrial Residential
Capital growth by sector
0%
8%
16%
24%
32%
40%
20142010-2014 Annualised
Source: IPD; Bloomberg
Total return by asset class and period
Direct property Property equities Equities Bonds
International property handbook H1 2015 17
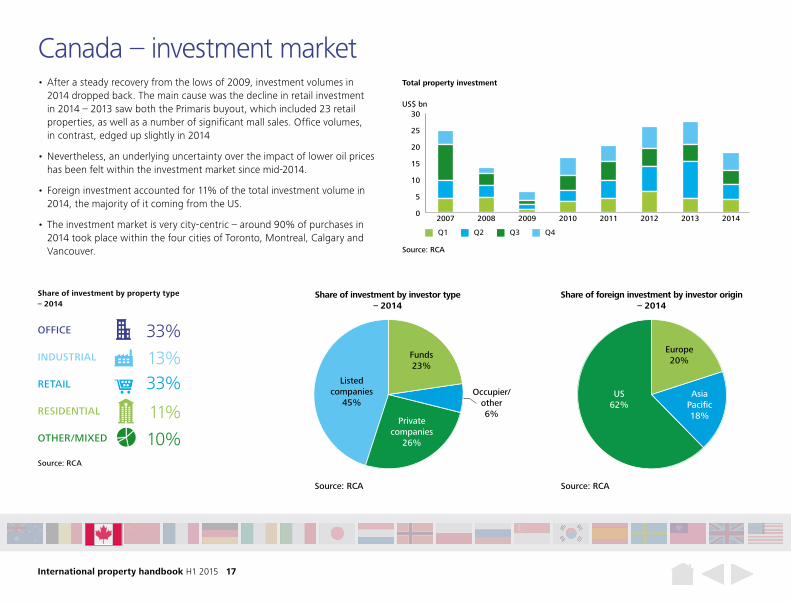
• After a steady recovery from the lows of 2009, investment volumes in 2014 dropped back. The main cause was the decline in retail investment in 2014 – 2013 saw both the Primaris buyout, which included 23 retail properties, as well as a number of significant mall sales. Office volumes, in contrast, edged up slightly in 2014
• Nevertheless, an underlying uncertainty over the impact of lower oil prices has been felt within the investment market since mid-2014.
• Foreign investment accounted for 11% of the total investment volume in 2014, the majority of it coming from the US.
• The investment market is very city-centric – around 90% of purchases in 2014 took place within the four cities of Toronto, Montreal, Calgary and Vancouver.
Canada – investment market
Private companies
26%
Share of investment by investor type – 2014
Source: RCA
Listed companies
45%Occupier/
other6%
Funds23%
Share of foreign investment by investor origin – 2014
Source: RCA
US62%
Europe20%
Asia Pacific18%
Share of investment by property type – 2014
Source: RCA
OFFICE 33%INDUSTRIAL 13%RETAIL 33%RESIDENTIAL 11%OTHER/MIXED 10%
0
5
10
15
20
25
30
20142013201220112010200920082007
Source: RCA
Total property investment
US$ bn
Q1 Q2 Q3 Q4
International property handbook H1 2015 18
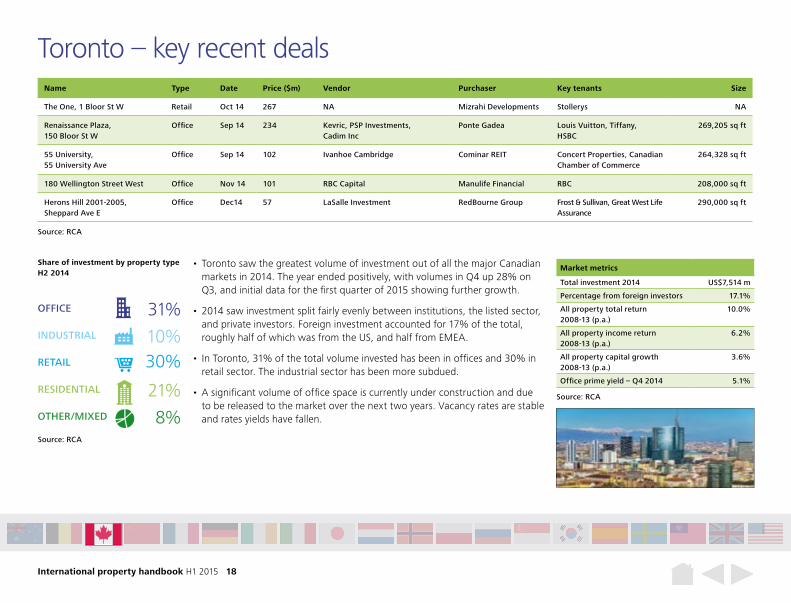
Name Type Date Price ($m) Vendor Purchaser Key tenants Size
The One, 1 Bloor St W Retail Oct 14 267 NA Mizrahi Developments Stollerys NA
Renaissance Plaza, 150 Bloor St W
Office Sep 14 234 Kevric, PSP Investments, Cadim Inc
Ponte Gadea Louis Vuitton, Tiffany, HSBC
269,205 sq ft
55 University, 55 University Ave
Office Sep 14 102 Ivanhoe Cambridge Cominar REIT Concert Properties, Canadian Chamber of Commerce
264,328 sq ft
180 Wellington Street West Office Nov 14 101 RBC Capital Manulife Financial RBC 208,000 sq ft
Herons Hill 2001-2005, Sheppard Ave E
Office Dec14 57 LaSalle Investment RedBourne Group Frost & Sullivan, Great West Life Assurance
290,000 sq ft
Toronto – key recent deals
Source: RCA
• Toronto saw the greatest volume of investment out of all the major Canadian markets in 2014. The year ended positively, with volumes in Q4 up 28% on Q3, and initial data for the first quarter of 2015 showing further growth.
• 2014 saw investment split fairly evenly between institutions, the listed sector, and private investors. Foreign investment accounted for 17% of the total, roughly half of which was from the US, and half from EMEA.
• In Toronto, 31% of the total volume invested has been in offices and 30% in retail sector. The industrial sector has been more subdued.
• A significant volume of office space is currently under construction and due to be released to the market over the next two years. Vacancy rates are stable and rates yields have fallen.
Source: RCA
Market metrics
Total investment 2014 US$7,514 m
Percentage from foreign investors 17.1%
All property total return 2008-13 (p.a.)
10.0%
All property income return 2008-13 (p.a.)
6.2%
All property capital growth 2008-13 (p.a.)
3.6%
Office prime yield – Q4 2014 5.1%
Share of investment by property type H2 2014
Source: RCA
OFFICE 31%INDUSTRIAL 10%RETAIL 30%RESIDENTIAL 21%OTHER/MIXED 8%
International property handbook H1 2015 19
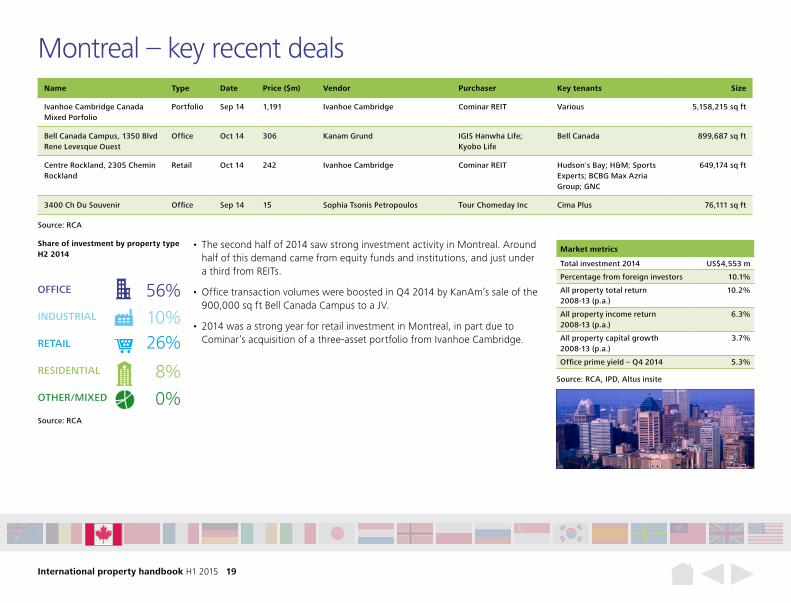
Name Type Date Price ($m) Vendor Purchaser Key tenants Size
Ivanhoe Cambridge Canada Mixed Porfolio
Portfolio Sep 14 1,191 Ivanhoe Cambridge Cominar REIT Various 5,158,215 sq ft
Bell Canada Campus, 1350 Blvd Rene Levesque Ouest
Office Oct 14 306 Kanam Grund IGIS Hanwha Life; Kyobo Life
Bell Canada 899,687 sq ft
Centre Rockland, 2305 Chemin Rockland
Retail Oct 14 242 Ivanhoe Cambridge Cominar REIT Hudson's Bay; H&M; Sports Experts; BCBG Max Azria Group; GNC
649,174 sq ft
3400 Ch Du Souvenir Office Sep 14 15 Sophia Tsonis Petropoulos Tour Chomeday Inc Cima Plus 76,111 sq ft
Montreal – key recent deals
Source: RCA
• The second half of 2014 saw strong investment activity in Montreal. Around half of this demand came from equity funds and institutions, and just under a third from REITs.
• Office transaction volumes were boosted in Q4 2014 by KanAm’s sale of the 900,000 sq ft Bell Canada Campus to a JV.
• 2014 was a strong year for retail investment in Montreal, in part due to Cominar’s acquisition of a three-asset portfolio from Ivanhoe Cambridge.
Market metrics
Total investment 2014 US$4,553 m
Percentage from foreign investors 10.1%
All property total return 2008-13 (p.a.)
10.2%
All property income return 2008-13 (p.a.)
6.3%
All property capital growth 2008-13 (p.a.)
3.7%
Office prime yield – Q4 2014 5.3%
Share of investment by property type H2 2014
Source: RCA
OFFICE 56%INDUSTRIAL 10%RETAIL 26%RESIDENTIAL 8%OTHER/MIXED 0%
Source: RCA, IPD, Altus insite
International property handbook H1 2015 20
Name Type Date Price ($m) Vendor Purchaser Key tenants Size
Brookfield Place Calgary, East 225 6th Ave SW
Office Oct 14 914 Brookfield Property Partners
Brookfield Canada Office Properties
Cenovus 1,400,000 sq ft
Brentwood Village, Brentwood Road
Retail Mar 15 109 Kimco RioCan REIT Safeway; London Drugs; Sears
294,000 sq ft
Grid 5 Apartments 618 5th Ave SW
Residential Dec 14 88 Kingsett Capital AIMCo
Killam Properties Inc NA 307 units
Beverly Centre Lake, 500 Midpark Way SE
Residential Dec 14 63 HealthLease REIT Health Care REIT NA 270 units
1 Executive Place, 1816 Crowchild Trail NW
Office Oct 14 41 GWL Realty Industrial Alliance Insurance & Financial Services Inc
Alberta Human Services 118,644 sq ft
Calgary – key recent deals
Source: RCA
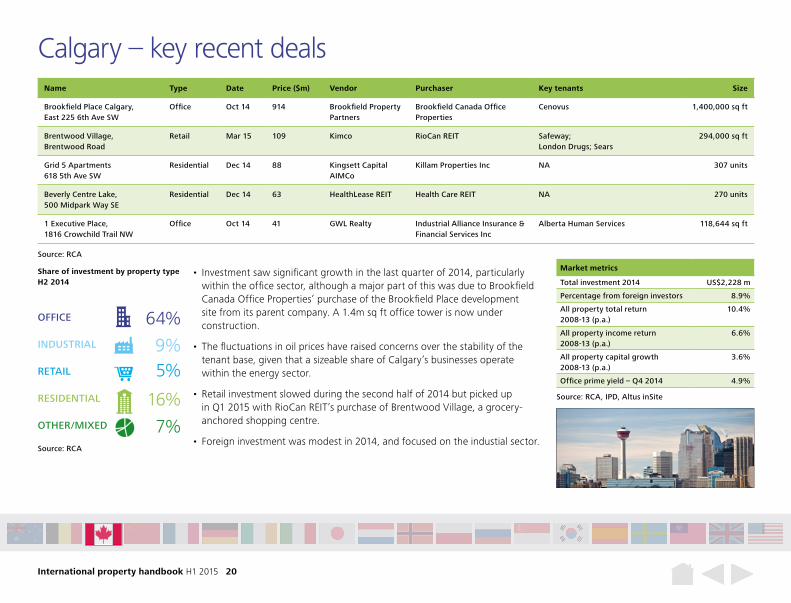
• Investment saw significant growth in the last quarter of 2014, particularly within the office sector, although a major part of this was due to Brookfield Canada Office Properties’ purchase of the Brookfield Place development site from its parent company. A 1.4m sq ft office tower is now under construction.
• The fluctuations in oil prices have raised concerns over the stability of the tenant base, given that a sizeable share of Calgary’s businesses operate within the energy sector.
• Retail investment slowed during the second half of 2014 but picked up in Q1 2015 with RioCan REIT’s purchase of Brentwood Village, a grocery-anchored shopping centre.
• Foreign investment was modest in 2014, and focused on the industial sector.
Source: RCA, IPD, Altus inSite
Market metrics
Total investment 2014 US$2,228 m
Percentage from foreign investors 8.9%
All property total return 2008-13 (p.a.)
10.4%
All property income return 2008-13 (p.a.)
6.6%
All property capital growth 2008-13 (p.a.)
3.6%
Office prime yield – Q4 2014 4.9%
Share of investment by property type H2 2014
Source: RCA
OFFICE 64%INDUSTRIAL 9%RETAIL 5%RESIDENTIAL 16%OTHER/MIXED 7%
International property handbook H1 2015 21
Name Type Date Price ($m) Vendor Purchaser Key tenants Size
Langara Gardens, 501 W 57th Ave
Apartment Sep 14 188 Peterson InvestmentGroup Inc
Concert Properties NA 621 units
Hyatt Regency Vancouver, 655 Burrard St
Hotel Nov 14 124 Hyatt Hotels Innvest REIT Hyatt Hotels 644 rooms
Neelu Bachra Centre 550 W Broadway
Office Dec 14 40 NA Orca West Developments Ltd NA 52,036 sq ft
Real Canadian Super Store, 2855 Gladwin Rd
Retail Oct 14 35 Loblaw Cos Choice Properties Real Canadian Super Store 141,487 sq ft
411 Dunsmuir St Office Sep 14 32 CRS Group; Omincron 411 Dunsmuir Inc; MJD Holdings Inc NA 55,414 sq ft
Vancouver – key recent deals
Source: RCA
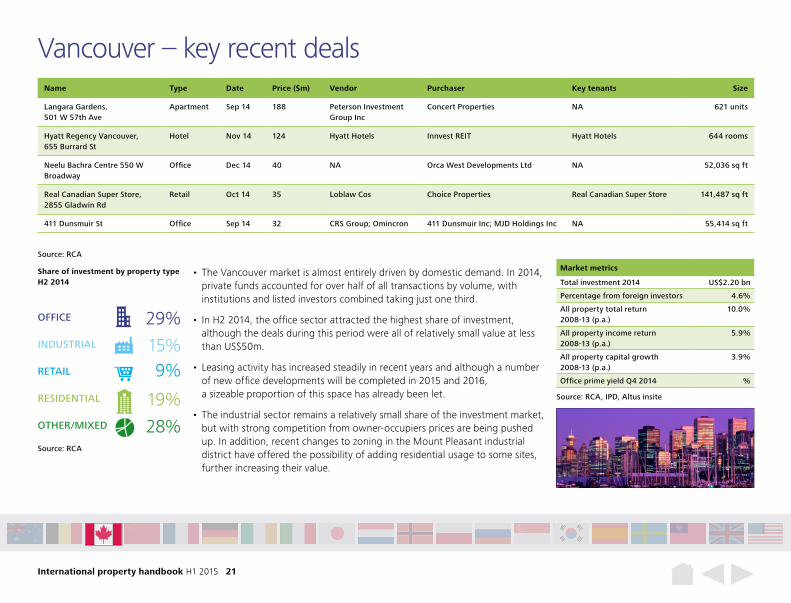
• The Vancouver market is almost entirely driven by domestic demand. In 2014, private funds accounted for over half of all transactions by volume, with institutions and listed investors combined taking just one third.
• In H2 2014, the office sector attracted the highest share of investment, although the deals during this period were all of relatively small value at less than US$50m.
• Leasing activity has increased steadily in recent years and although a number of new office developments will be completed in 2015 and 2016, a sizeable proportion of this space has already been let.
• The industrial sector remains a relatively small share of the investment market, but with strong competition from owner-occupiers prices are being pushed up. In addition, recent changes to zoning in the Mount Pleasant industrial district have offered the possibility of adding residential usage to some sites, further increasing their value.
Source: RCA, IPD, Altus insite
Market metrics
Total investment 2014 US$2.20 bn
Percentage from foreign investors 4.6%
All property total return 2008-13 (p.a.)
10.0%
All property income return 2008-13 (p.a.)
5.9%
All property capital growth 2008-13 (p.a.)
3.9%
Office prime yield Q4 2014 %
Share of investment by property type H2 2014
Source: RCA
OFFICE 29%INDUSTRIAL 15%RETAIL 9%RESIDENTIAL 19%OTHER/MIXED 28%
International property handbook H1 2015 22
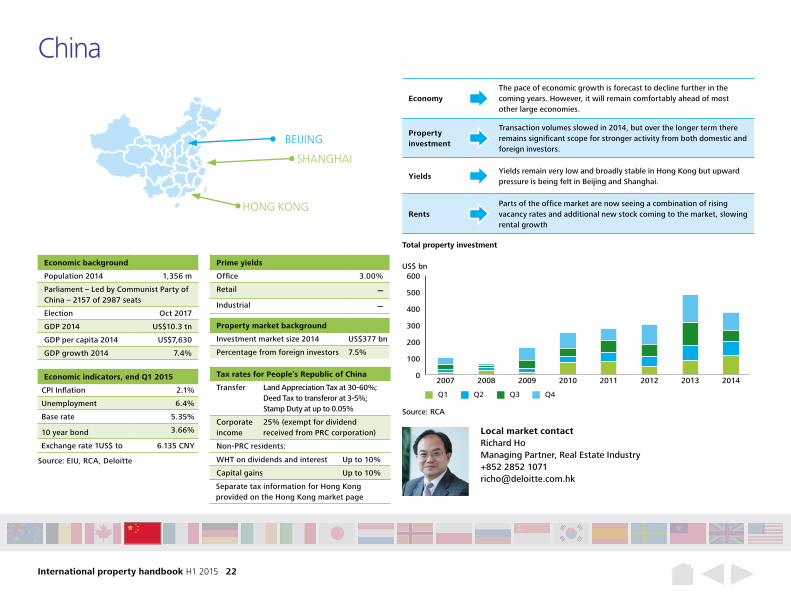
EconomyThe pace of economic growth is forecast to decline further in the coming years. However, it will remain comfortably ahead of most other large economies.
Property investment
Transaction volumes slowed in 2014, but over the longer term there remains significant scope for stronger activity from both domestic and foreign investors.
YieldsYields remain very low and broadly stable in Hong Kong but upward pressure is being felt in Beijing and Shanghai.
RentsParts of the office market are now seeing a combination of rising vacancy rates and additional new stock coming to the market, slowing rental growth
China
Economic background
Population 2014 1,356 m
Parliament – Led by Communist Party of China – 2157 of 2987 seats
Election Oct 2017
GDP 2014 US$10.3 tn
GDP per capita 2014 US$7,630
GDP growth 2014 7.4%
Prime yields
Office 3.00%
Retail –Industrial –
Tax rates for People’s Republic of China
Transfer Land Appreciation Tax at 30-60%; Deed Tax to transferor at 3-5%; Stamp Duty at up to 0.05%
Corporate income
25% (exempt for dividend received from PRC corporation)
Non-PRC residents:
Property market background
Investment market size 2014 US$377 bn
Percentage from foreign investors 7.5%
Economic indicators, end Q1 2015
CPI Inflation 2.1%
Unemployment 6.4%
Base rate 5.35%
10 year bond 3.66%
Exchange rate 1US$ to 6.135 CNY
Local market contactRichard Ho Managing Partner, Real Estate Industry +852 2852 1071 [email protected]
0
100
200
300
400
500
600
20142013201220112010200920082007
Source: RCA
Total property investment
US$ bn
Q1 Q2 Q3 Q4
Source: EIU, RCA, Deloitte
BEIJING
SHANGHAI
HONG KONG
Separate tax information for Hong Kong provided on the Hong Kong market page
WHT on dividends and interest Up to 10%
Capital gains Up to 10%
International property handbook H1 2015 23
Source: EIU
GDP growth CPI inflation
Economic output and inflation
-2%0%2%4%6%8%
10%12%14%16%
2016201520142013201220112010200920082007200620052004
0%
2%
4%
6%
8%
10%
12%
2016201520142013201220112010200920082007200620052004
Source: EIU
Consumer expenditure growth
Consumer spending and unemployment
Unemployment rate
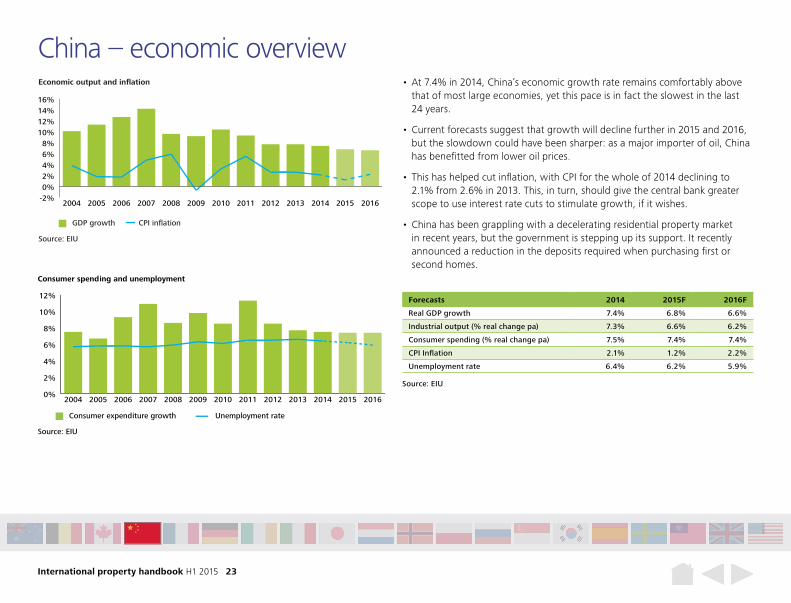
Forecasts 2014 2015F 2016F
Real GDP growth 7.4% 6.8% 6.6%
Industrial output (% real change pa) 7.3% 6.6% 6.2%
Consumer spending (% real change pa) 7.5% 7.4% 7.4%
CPI Inflation 2.1% 1.2% 2.2%
Unemployment rate 6.4% 6.2% 5.9%
Source: EIU
• At 7.4% in 2014, China’s economic growth rate remains comfortably above that of most large economies, yet this pace is in fact the slowest in the last 24 years.
• Current forecasts suggest that growth will decline further in 2015 and 2016, but the slowdown could have been sharper: as a major importer of oil, China has benefitted from lower oil prices.
• This has helped cut inflation, with CPI for the whole of 2014 declining to 2.1% from 2.6% in 2013. This, in turn, should give the central bank greater scope to use interest rate cuts to stimulate growth, if it wishes.
• China has been grappling with a decelerating residential property market in recent years, but the government is stepping up its support. It recently announced a reduction in the deposits required when purchasing first or second homes.
China – economic overview
International property handbook H1 2015 24
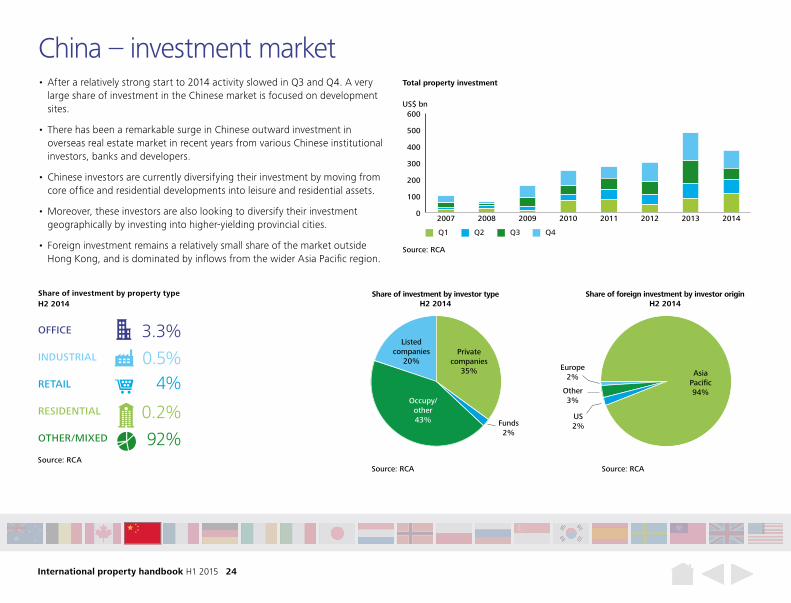
Funds2%
Europe2%
Other3%
US2%
Share of investment by investor type H2 2014
Source: RCA
Listed companies
20%Private
companies 35%
Occupy/other43%
Share of foreign investment by investor originH2 2014
Source: RCA
US31%
Asia Pacific94%
• After a relatively strong start to 2014 activity slowed in Q3 and Q4. A very large share of investment in the Chinese market is focused on development sites.
• There has been a remarkable surge in Chinese outward investment in overseas real estate market in recent years from various Chinese institutional investors, banks and developers.
• Chinese investors are currently diversifying their investment by moving from core office and residential developments into leisure and residential assets.
• Moreover, these investors are also looking to diversify their investment geographically by investing into higher-yielding provincial cities.
• Foreign investment remains a relatively small share of the market outside Hong Kong, and is dominated by inflows from the wider Asia Pacific region.
China – investment market
Share of investment by property type H2 2014
Source: RCA
OFFICE 3.3%INDUSTRIAL 0.5%RETAIL 4%RESIDENTIAL 0.2%OTHER/MIXED 92%
0
100
200
300
400
500
600
20142013201220112010200920082007
Source: RCA
Total property investment
US$ bn
Q1 Q2 Q3 Q4
International property handbook H1 2015 25
Hong Kong – key recent deals
Source: RCA
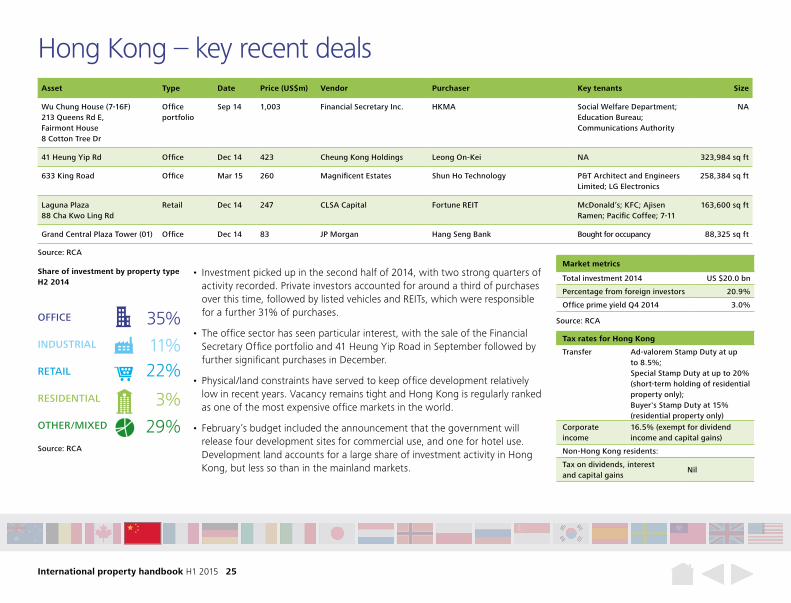
Asset Type Date Price (US$m) Vendor Purchaser Key tenants Size
Wu Chung House (7-16F) 213 Queens Rd E, Fairmont House 8 Cotton Tree Dr
Office portfolio
Sep 14 1,003 Financial Secretary Inc. HKMA Social Welfare Department; Education Bureau; Communications Authority
NA
41 Heung Yip Rd Office Dec 14 423 Cheung Kong Holdings Leong On-Kei NA 323,984 sq ft
633 King Road Office Mar 15 260 Magnificent Estates Shun Ho Technology P&T Architect and Engineers Limited; LG Electronics
258,384 sq ft
Laguna Plaza 88 Cha Kwo Ling Rd
Retail Dec 14 247 CLSA Capital Fortune REIT McDonald’s; KFC; Ajisen Ramen; Pacific Coffee; 7-11
163,600 sq ft
Grand Central Plaza Tower (01) Office Dec 14 83 JP Morgan Hang Seng Bank Bought for occupancy 88,325 sq ft
• Investment picked up in the second half of 2014, with two strong quarters of activity recorded. Private investors accounted for around a third of purchases over this time, followed by listed vehicles and REITs, which were responsible for a further 31% of purchases.
• The office sector has seen particular interest, with the sale of the Financial Secretary Office portfolio and 41 Heung Yip Road in September followed by further significant purchases in December.
• Physical/land constraints have served to keep office development relatively low in recent years. Vacancy remains tight and Hong Kong is regularly ranked as one of the most expensive office markets in the world.
• February’s budget included the announcement that the government will release four development sites for commercial use, and one for hotel use. Development land accounts for a large share of investment activity in Hong Kong, but less so than in the mainland markets.
Share of investment by property type H2 2014
Source: RCA
OFFICE 35%INDUSTRIAL 11%RETAIL 22%RESIDENTIAL 3%OTHER/MIXED 29%
Source: RCA
Market metrics
Total investment 2014 US $20.0 bn
Percentage from foreign investors 20.9%
Office prime yield Q4 2014 3.0%
Tax rates for Hong Kong
Transfer Ad-valorem Stamp Duty at up to 8.5%; Special Stamp Duty at up to 20% (short-term holding of residential property only); Buyer's Stamp Duty at 15% (residential property only)
Corporate income
16.5% (exempt for dividend income and capital gains)
Non-Hong Kong residents:
Tax on dividends, interest and capital gains
Nil
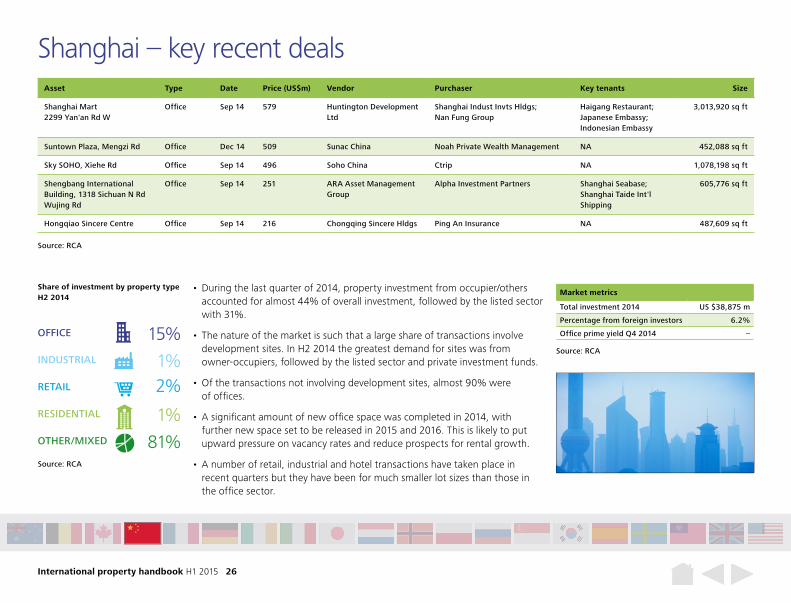
International property handbook H1 2015 26
Asset Type Date Price (US$m) Vendor Purchaser Key tenants Size
Shanghai Mart 2299 Yan'an Rd W
Office Sep 14 579 Huntington Development Ltd
Shanghai Indust Invts Hldgs; Nan Fung Group
Haigang Restaurant; Japanese Embassy; Indonesian Embassy
3,013,920 sq ft
Suntown Plaza, Mengzi Rd Office Dec 14 509 Sunac China Noah Private Wealth Management NA 452,088 sq ft
Sky SOHO, Xiehe Rd Office Sep 14 496 Soho China Ctrip NA 1,078,198 sq ft
Shengbang International Building, 1318 Sichuan N Rd Wujing Rd
Office Sep 14 251 ARA Asset Management Group
Alpha Investment Partners Shanghai Seabase; Shanghai Taide Int'l Shipping
605,776 sq ft
Hongqiao Sincere Centre Office Sep 14 216 Chongqing Sincere Hldgs Ping An Insurance NA 487,609 sq ft
Shanghai – key recent deals
Source: RCA
• During the last quarter of 2014, property investment from occupier/others accounted for almost 44% of overall investment, followed by the listed sector with 31%.
• The nature of the market is such that a large share of transactions involve development sites. In H2 2014 the greatest demand for sites was from owner-occupiers, followed by the listed sector and private investment funds.
• Of the transactions not involving development sites, almost 90% were of offices.
• A significant amount of new office space was completed in 2014, with further new space set to be released in 2015 and 2016. This is likely to put upward pressure on vacancy rates and reduce prospects for rental growth.
• A number of retail, industrial and hotel transactions have taken place in recent quarters but they have been for much smaller lot sizes than those in the office sector.
Source: RCA
Market metrics
Total investment 2014 US $38,875 m
Percentage from foreign investors 6.2%
Office prime yield Q4 2014 –
Share of investment by property type H2 2014
Source: RCA
OFFICE 15%INDUSTRIAL 1%RETAIL 2%RESIDENTIAL 1%OTHER/MIXED 81%
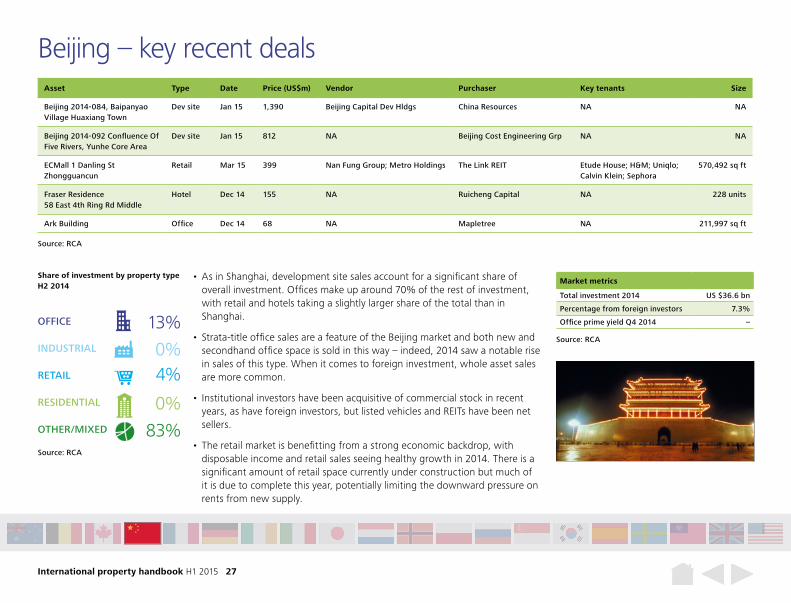
International property handbook H1 2015 27
Asset Type Date Price (US$m) Vendor Purchaser Key tenants Size
Beijing 2014-084, Baipanyao Village Huaxiang Town
Dev site Jan 15 1,390 Beijing Capital Dev Hldgs China Resources NA NA
Beijing 2014-092 Confluence Of Five Rivers, Yunhe Core Area
Dev site Jan 15 812 NA Beijing Cost Engineering Grp NA NA
ECMall 1 Danling St Zhongguancun
Retail Mar 15 399 Nan Fung Group; Metro Holdings The Link REIT Etude House; H&M; Uniqlo; Calvin Klein; Sephora
570,492 sq ft
Fraser Residence 58 East 4th Ring Rd Middle
Hotel Dec 14 155 NA Ruicheng Capital NA 228 units
Ark Building Office Dec 14 68 NA Mapletree NA 211,997 sq ft
Beijing – key recent deals
Source: RCA
• As in Shanghai, development site sales account for a significant share of overall investment. Offices make up around 70% of the rest of investment, with retail and hotels taking a slightly larger share of the total than in Shanghai.
• Strata-title office sales are a feature of the Beijing market and both new and secondhand office space is sold in this way – indeed, 2014 saw a notable rise in sales of this type. When it comes to foreign investment, whole asset sales are more common.
• Institutional investors have been acquisitive of commercial stock in recent years, as have foreign investors, but listed vehicles and REITs have been net sellers.
• The retail market is benefitting from a strong economic backdrop, with disposable income and retail sales seeing healthy growth in 2014. There is a significant amount of retail space currently under construction but much of it is due to complete this year, potentially limiting the downward pressure on rents from new supply.
Source: RCA
Market metrics
Total investment 2014 US $36.6 bn
Percentage from foreign investors 7.3%
Office prime yield Q4 2014 –
Share of investment by property type H2 2014
Source: RCA
OFFICE 13%INDUSTRIAL 0%RETAIL 4%RESIDENTIAL 0%OTHER/MIXED 83%

International property handbook H1 2015 28
EconomyHigh unemployment and a high level of spending on public services have contributed to a weak economic performance – just 0.4% growth in 2014.
Property investment
Investment volumes picked up strongly last year, finishing a third higher than in 2013, with Paris notably increasing its share of transactions. The market is expected to remain active as interest from foreign investors widens.
YieldsYields have dropped below 4% for prime Paris office space, and there would appear to be limited room for further falls. Prime shopping centre yields stand at around 4.25%.
RentsParis rents have seen little upward movement reflecting an uncertain occupier market. Outside the capital office rents remained stable across most of the country. Parts of the retail market have seen strong growth.
France
Economic background
Population 64.6 m
Parliament – National Assembly and Senate. President – Francois Hollande
Election April 2017
GDP 2014 US$2.84 tn
GDP per capita US$43,970
GDP growth 2014 0.4%
Prime yields
Office 3.75%
Retail 4.00%
Industrial 6.75%
Property market background
Investment market size 2014 US$32.7bn
Percentage from foreign investors
48.4%
All property total return 2014 6.6%Economic indicators, end Q1 2015
CPI Inflation 0.6%
Unemployment 9.7%
Base rate 0.05%
10 year bond 0.48%
Exchange rate 1US$ to 0.9215 EUR
Tax rates
Transfer 5.08% on assets, up to 5% on shares
Corporate income 36.9% – 38%
Tax on dividends Up to 30%
Tax on interest 0%
Capital gains Ordinary corporation tax rate. Participation exemptions may apply
Local market contactChristian Gillet Principal, Real Estate Advisory +33 (1) 4088 2944 [email protected]
0
10
20
30
40
50
20142013201220112010200920082007
Source: RCA
Total property investment
US$ bn
Q1 Q2 Q3 Q4
Source: EIU, RCA, IPD, Deloitte
PARIS
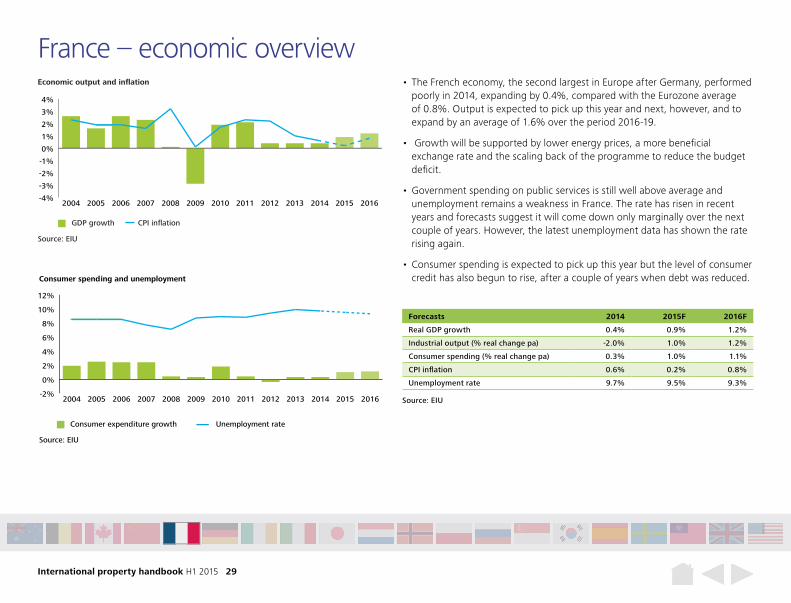
International property handbook H1 2015 29
Forecasts 2014 2015F 2016F
Real GDP growth 0.4% 0.9% 1.2%
Industrial output (% real change pa) -2.0% 1.0% 1.2%
Consumer spending (% real change pa) 0.3% 1.0% 1.1%
CPI inflation 0.6% 0.2% 0.8%
Unemployment rate 9.7% 9.5% 9.3%
Source: EIU
GDP growth CPI inflation
Economic output and inflation
-4%
-3%
-2%
-1%
0%
1%
2%
3%
4%
2016201520142013201220112010200920082007200620052004
-2%
0%
2%
4%
6%
8%
10%
12%
2016201520142013201220112010200920082007200620052004
Source: EIU
Consumer expenditure growth
Consumer spending and unemployment
Unemployment rate
Source: EIU
• The French economy, the second largest in Europe after Germany, performed poorly in 2014, expanding by 0.4%, compared with the Eurozone average of 0.8%. Output is expected to pick up this year and next, however, and to expand by an average of 1.6% over the period 2016-19.
• Growth will be supported by lower energy prices, a more beneficial exchange rate and the scaling back of the programme to reduce the budget deficit.
• Government spending on public services is still well above average and unemployment remains a weakness in France. The rate has risen in recent years and forecasts suggest it will come down only marginally over the next couple of years. However, the latest unemployment data has shown the rate rising again.
• Consumer spending is expected to pick up this year but the level of consumer credit has also begun to rise, after a couple of years when debt was reduced.
France – economic overview
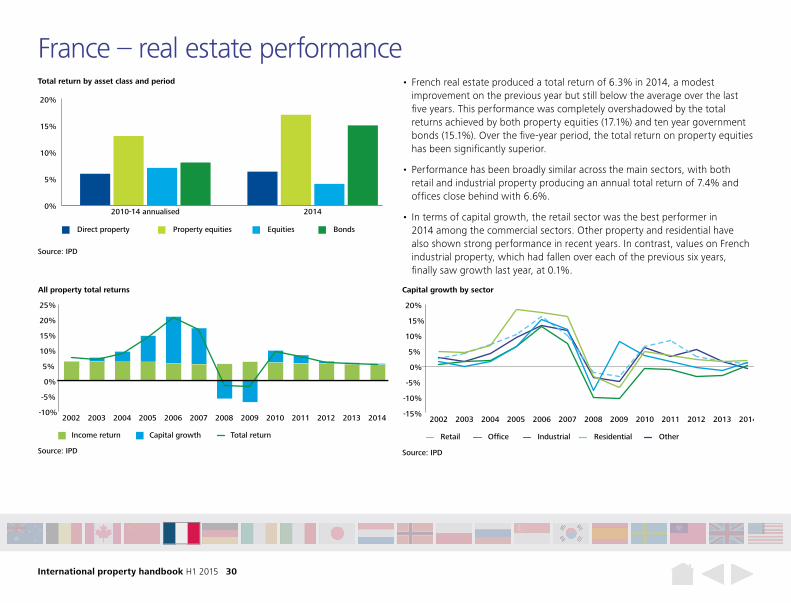
International property handbook H1 2015 30
France – real estate performance • French real estate produced a total return of 6.3% in 2014, a modest
improvement on the previous year but still below the average over the last five years. This performance was completely overshadowed by the total returns achieved by both property equities (17.1%) and ten year government bonds (15.1%). Over the five-year period, the total return on property equities has been significantly superior.
• Performance has been broadly similar across the main sectors, with both retail and industrial property producing an annual total return of 7.4% and offices close behind with 6.6%.
• In terms of capital growth, the retail sector was the best performer in 2014 among the commercial sectors. Other property and residential have also shown strong performance in recent years. In contrast, values on French industrial property, which had fallen over each of the previous six years, finally saw growth last year, at 0.1%.
-10%
-5%
0%
5%
10%
15%
20%
25%
2014201320122011201020092008200720062005200420032002
Source: IPD
Income return Capital growth Total return
All property total returns
-15%
-10%
-5%
0%
5%
10%
15%
20%
2014201320122011201020092008200720062005200420032002
Source: IPD
OfficeRetail Industrial Residential Other
Capital growth by sector
Total return by asset class and period
Source: IPD
Direct property Property equities Equities Bonds
0%
5%
10%
15%
20%
20142010-14 annualised
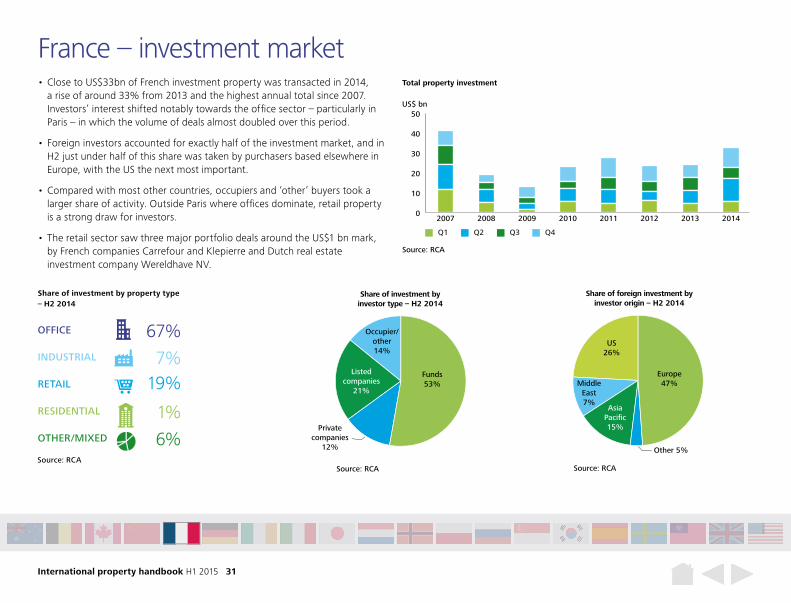
International property handbook H1 2015 31
Share of investment by property type – H2 2014
Source: RCA
OFFICE 67%INDUSTRIAL 7%RETAIL 19%RESIDENTIAL 1%OTHER/MIXED 6%
Occupier/other14%
Share of investment by investor type – H2 2014
Source: RCA
Listed companies
21%
Funds53%
Private companies
12%
Share of foreign investment by investor origin – H2 2014
Source: RCA
Europe47%
Other 5%
Middle East7%
US26%
AsiaPacific15%
Occupier/other14%
Share of investment by investor type – H2 2014
Source: RCA
Listed companies
21%
Funds53%
Private companies
12%
Share of foreign investment by investor origin – H2 2014
Source: RCA
Europe47%
Other 5%
Middle East7%
US26%
AsiaPacific15%
• Close to US$33bn of French investment property was transacted in 2014, a rise of around 33% from 2013 and the highest annual total since 2007. Investors’ interest shifted notably towards the office sector – particularly in Paris – in which the volume of deals almost doubled over this period.
• Foreign investors accounted for exactly half of the investment market, and in H2 just under half of this share was taken by purchasers based elsewhere in Europe, with the US the next most important.
• Compared with most other countries, occupiers and ‘other’ buyers took a larger share of activity. Outside Paris where offices dominate, retail property is a strong draw for investors.
• The retail sector saw three major portfolio deals around the US$1 bn mark, by French companies Carrefour and Klepierre and Dutch real estate investment company Wereldhave NV.
France – investment market
0
10
20
30
40
50
20142013201220112010200920082007
Source: RCA
Total property investment
US$ bn
Q1 Q2 Q3 Q4
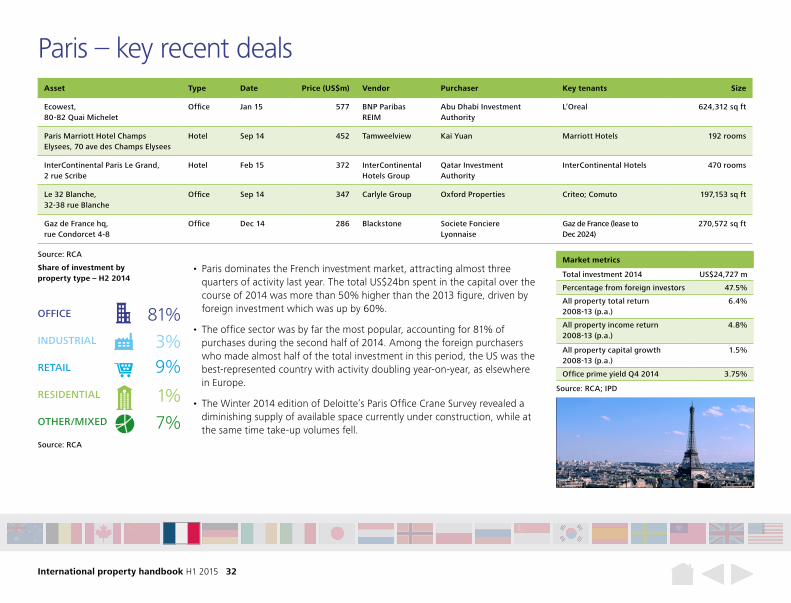
International property handbook H1 2015 32
Paris – key recent deals
Source: RCA
Asset Type Date Price (US$m) Vendor Purchaser Key tenants Size
Ecowest, 80-82 Quai Michelet
Office Jan 15 577 BNP Paribas REIM
Abu Dhabi Investment Authority
L’Oreal 624,312 sq ft
Paris Marriott Hotel Champs Elysees, 70 ave des Champs Elysees
Hotel Sep 14 452 Tamweelview Kai Yuan Marriott Hotels 192 rooms
InterContinental Paris Le Grand, 2 rue Scribe
Hotel Feb 15 372 InterContinental Hotels Group
Qatar Investment Authority
InterContinental Hotels 470 rooms
Le 32 Blanche, 32-38 rue Blanche
Office Sep 14 347 Carlyle Group Oxford Properties Criteo; Comuto 197,153 sq ft
Gaz de France hq, rue Condorcet 4-8
Office Dec 14 286 Blackstone Societe Fonciere Lyonnaise
Gaz de France (lease to Dec 2024)
270,572 sq ft
• Paris dominates the French investment market, attracting almost three quarters of activity last year. The total US$24bn spent in the capital over the course of 2014 was more than 50% higher than the 2013 figure, driven by foreign investment which was up by 60%.
• The office sector was by far the most popular, accounting for 81% of purchases during the second half of 2014. Among the foreign purchasers who made almost half of the total investment in this period, the US was the best-represented country with activity doubling year-on-year, as elsewhere in Europe.
• The Winter 2014 edition of Deloitte’s Paris Office Crane Survey revealed a diminishing supply of available space currently under construction, while at the same time take-up volumes fell.
Share of investment by property type – H2 2014
Source: RCA
Source: RCA; IPD
OFFICE 81%INDUSTRIAL 3%RETAIL 9%RESIDENTIAL 1%OTHER/MIXED 7%
Market metrics
Total investment 2014 US$24,727 m
Percentage from foreign investors 47.5%
All property total return 2008-13 (p.a.)
6.4%
All property income return 2008-13 (p.a.)
4.8%
All property capital growth 2008-13 (p.a.)
1.5%
Office prime yield Q4 2014 3.75%
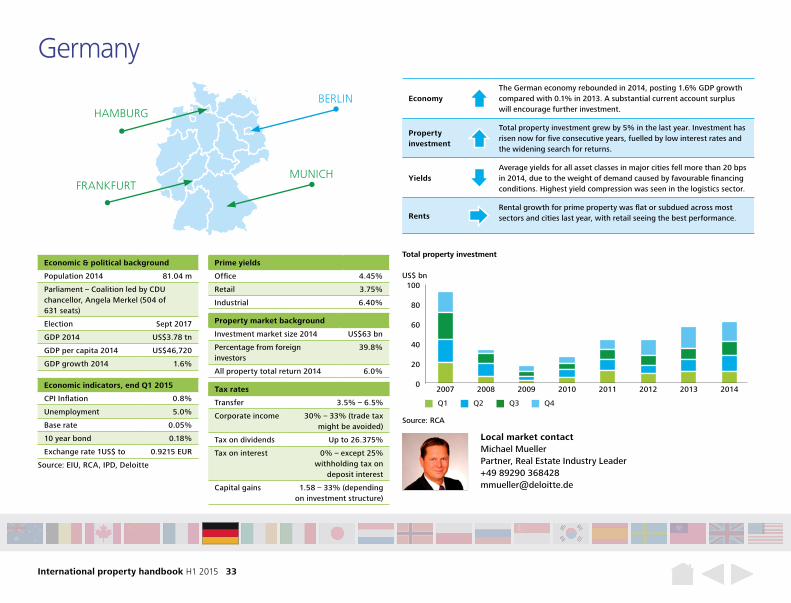
International property handbook H1 2015 33
EconomyThe German economy rebounded in 2014, posting 1.6% GDP growth compared with 0.1% in 2013. A substantial current account surplus will encourage further investment.
Property investment
Total property investment grew by 5% in the last year. Investment has risen now for five consecutive years, fuelled by low interest rates and the widening search for returns.
YieldsAverage yields for all asset classes in major cities fell more than 20 bps in 2014, due to the weight of demand caused by favourable financing conditions. Highest yield compression was seen in the logistics sector.
RentsRental growth for prime property was flat or subdued across most sectors and cities last year, with retail seeing the best performance.
Germany
Economic & political background
Population 2014 81.04 m
Parliament – Coalition led by CDU chancellor, Angela Merkel (504 of 631 seats)
Election Sept 2017
GDP 2014 US$3.78 tn
GDP per capita 2014 US$46,720
GDP growth 2014 1.6%
Property market background
Investment market size 2014 US$63 bn
Percentage from foreign investors
39.8%
All property total return 2014 6.0%
Prime yields
Office 4.45%
Retail 3.75%
Industrial 6.40%
Tax rates
Transfer 3.5% – 6.5%
Corporate income 30% – 33% (trade tax might be avoided)
Tax on dividends Up to 26.375%
Tax on interest 0% – except 25% withholding tax on
deposit interest
Capital gains 1.58 – 33% (depending on investment structure)
Economic indicators, end Q1 2015
CPI Inflation 0.8%
Unemployment 5.0%
Base rate 0.05%
10 year bond 0.18%
Exchange rate 1US$ to 0.9215 EUR
Local market contactMichael Mueller Partner, Real Estate Industry Leader +49 89290 368428 [email protected]
0
20
40
60
80
100
20142013201220112010200920082007
Source: RCA
Total property investment
US$ bn
Q1 Q2 Q3 Q4
Source: EIU, RCA, IPD, Deloitte
MUNICHFRANKFURT
BERLINHAMBURG
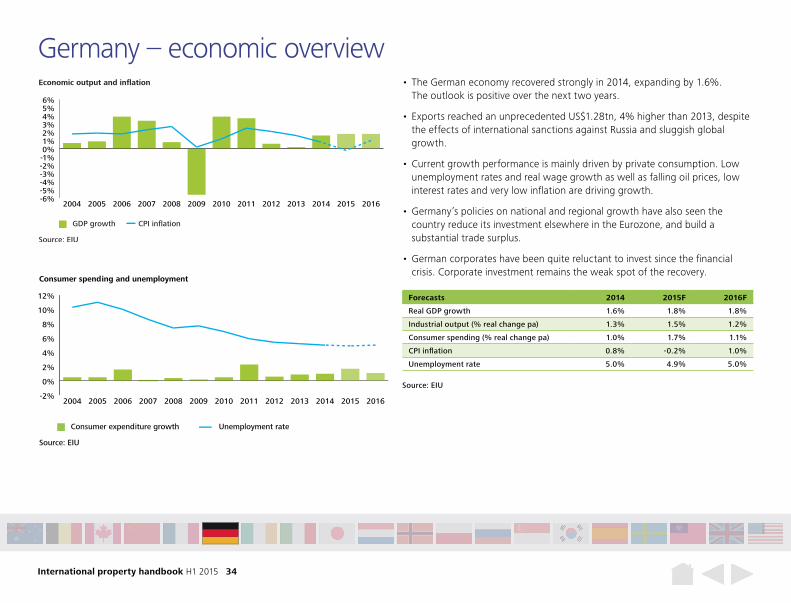
International property handbook H1 2015 34
Forecasts 2014 2015F 2016F
Real GDP growth 1.6% 1.8% 1.8%
Industrial output (% real change pa) 1.3% 1.5% 1.2%
Consumer spending (% real change pa) 1.0% 1.7% 1.1%
CPI inflation 0.8% -0.2% 1.0%
Unemployment rate 5.0% 4.9% 5.0%
Source: EIU
GDP growth CPI inflation
Economic output and inflation
-6%-5%-4%-3%-2%-1%0%1%2%3%4%5%6%
2016201520142013201220112010200920082007200620052004
-2%
0%
2%
4%
6%
8%
10%
12%
2016201520142013201220112010200920082007200620052004
Source: EIU
Consumer expenditure growth
Consumer spending and unemployment
Unemployment rate
Source: EIU
• The German economy recovered strongly in 2014, expanding by 1.6%. The outlook is positive over the next two years.
• Exports reached an unprecedented US$1.28tn, 4% higher than 2013, despite the effects of international sanctions against Russia and sluggish global growth.
• Current growth performance is mainly driven by private consumption. Low unemployment rates and real wage growth as well as falling oil prices, low interest rates and very low inflation are driving growth.
• Germany’s policies on national and regional growth have also seen the country reduce its investment elsewhere in the Eurozone, and build a substantial trade surplus.
• German corporates have been quite reluctant to invest since the financial crisis. Corporate investment remains the weak spot of the recovery.
Germany – economic overview
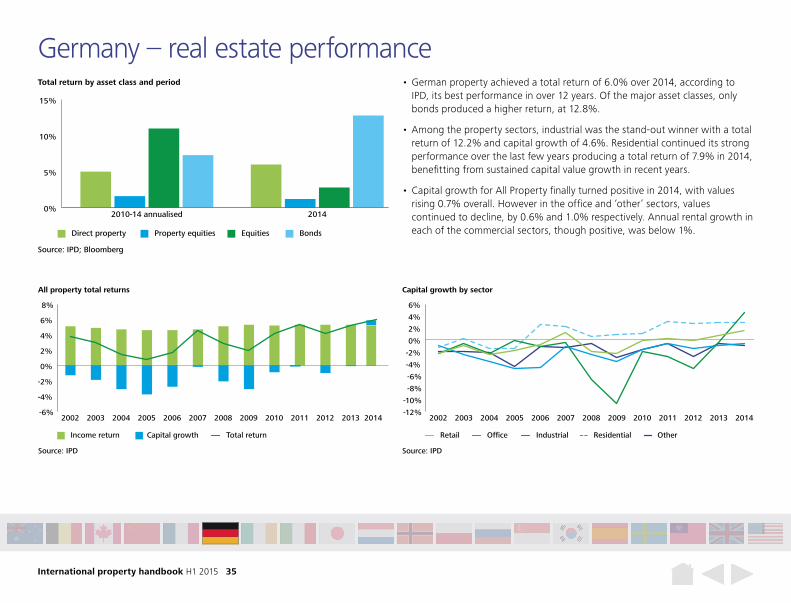
International property handbook H1 2015 35
Germany – real estate performance • German property achieved a total return of 6.0% over 2014, according to
IPD, its best performance in over 12 years. Of the major asset classes, only bonds produced a higher return, at 12.8%.
• Among the property sectors, industrial was the stand-out winner with a total return of 12.2% and capital growth of 4.6%. Residential continued its strong performance over the last few years producing a total return of 7.9% in 2014, benefitting from sustained capital value growth in recent years.
• Capital growth for All Property finally turned positive in 2014, with values rising 0.7% overall. However in the office and ‘other’ sectors, values continued to decline, by 0.6% and 1.0% respectively. Annual rental growth in each of the commercial sectors, though positive, was below 1%.
-6%
-4%
-2%
0%
2%
4%
6%
8%
2014201320122011201020092008200720062005200420032002
Source: IPD
Income return Capital growth Total return
All property total returns
-12%
-10%
-8%
-6%
-4%
-2%
0%
2%
4%
6%
2014201320122011201020092008200720062005200420032002
Source: IPD
OfficeRetail Industrial Residential Other
Capital growth by sector
Source: IPD; Bloomberg
Total return by asset class and period
Direct property Property equities Equities Bonds
0%
5%
10%
15%
20142010-14 annualised
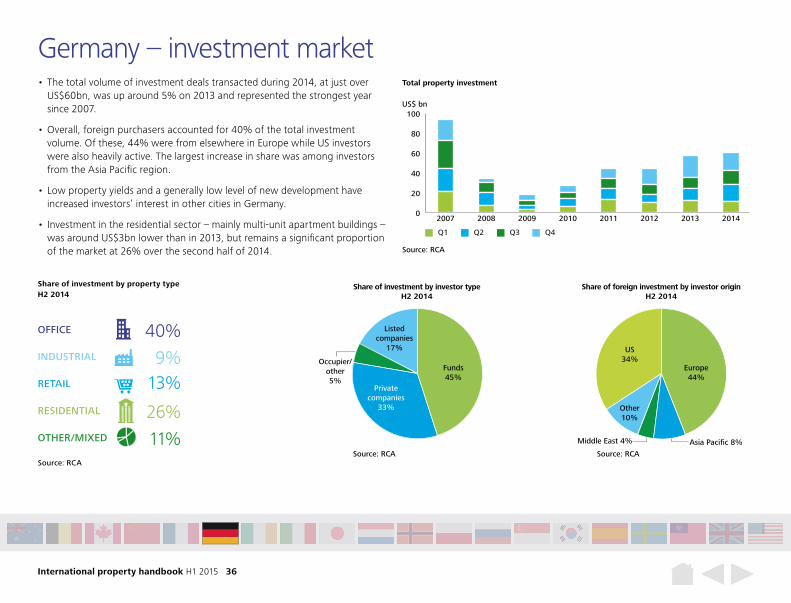
International property handbook H1 2015 36
0
20
40
60
80
100
20142013201220112010200920082007
Source: RCA
Total property investment
US$ bn
Q1 Q2 Q3 Q4
Share of investment by property typeH2 2014
Source: RCA
OFFICE 40%INDUSTRIAL 9%RETAIL 13%RESIDENTIAL 26%OTHER/MIXED 11%
Share of investment by investor type H2 2014
Source: RCA
Listed companies
17%
Occupier/other5%
Funds45%
Private companies
33% Other10%
Share of foreign investment by investor origin H2 2014
Source: RCA
US34%
Middle East 4%
Europe44%
Asia Pacific 8%
Share of investment by investor type H2 2014
Source: RCA
Listed companies
17%
Occupier/other5%
Funds45%
Private companies
33% Other10%
Share of foreign investment by investor origin H2 2014
Source: RCA
US34%
Middle East 4%
Europe44%
Asia Pacific 8%
• The total volume of investment deals transacted during 2014, at just over US$60bn, was up around 5% on 2013 and represented the strongest year since 2007.
• Overall, foreign purchasers accounted for 40% of the total investment volume. Of these, 44% were from elsewhere in Europe while US investors were also heavily active. The largest increase in share was among investors from the Asia Pacific region.
• Low property yields and a generally low level of new development have increased investors’ interest in other cities in Germany.
• Investment in the residential sector – mainly multi-unit apartment buildings – was around US$3bn lower than in 2013, but remains a significant proportion of the market at 26% over the second half of 2014.
Germany – investment market
International property handbook H1 2015 37
Frankfurt – key recent deals
• In 2014, Frankfurt underlined its position as the primary German target for investors, as the volume of transactions rose sharply from 2013’s total.
• Q4 was particularly active, with around US$4bn of transactions completed. Domestic investors accounted for 54% of acquisitions over this period, while just over 20% were made by US purchasers. South Korea and the UK were the next most significant countries represented.
• Office property was the main attraction for investors towards the end of last year: while this sector took a 65% share of the market over the whole of H2, in the final quarter this rose to over 70%.
• As a result of this weight of demand, backed by an improving occupancy picture, yields on prime offices continued to fall, reaching around 4.7%, close to their long-term low.
Share of investment by property typeH2 2014
Source: RCA
Source: RCA
Source: RCA; IPD
OFFICE 65%INDUSTRIAL 4%RETAIL 11%RESIDENTIAL 5%OTHER/MIXED 15%
Market metrics
Total investment 2014 US$8,372 m
Percentage from foreign investors
39.0%
All property total return 2008-13 (p.a.)
1.7%
Income return 2008-13 (p.a.) 4.6%
Capital growth 2008-13 (p.a.) -2.9%
Office prime yield Q4 2014 4.7%
Asset Type Date Price (US$m) Vendor Purchaser Key tenants Size
PalaisQuartier DEU Mixed Portfolio
Mixed Dec 14 996 Rabo RE Group
Deutsche Bank; ECE
Deutsche Bahn AG; Union Investment RE
902,992 sq ft 218 units
Silberturm Frankfurt Jurgen Ponto Platz, 1
Office Oct 14 568 IVG Deutschland
Samsung Group Deutsche Bahn AG (Lease runs to 2027)
771,865 sq ft
ECB Building Office Apr 15 526 RFR Holding GmbH
IVG IF GmbH European Central Bank 645,834 sq ft
WINX – The riverside tower Neue Mainzer Strasse, 6-12
Office Nov 14 438 DIC Asset AG Susanne Klatten Union Investment RE 452,088 sq ft
IBC complex Office Nov 14 376 Caisse de Depot
RFR Realty KFW Bank Group; Universal Investment GmbH
810,234 sq ft
International property handbook H1 2015 38
Berlin – key recent deals
• Among the main German cities, the highest proportion of investment into residential property is in Berlin, headed in recent months by the purchase of 2,600 apartments by HOWOGE.
• In contrast, the proportion of investor funds targeting retail property was much lower than in other cities, at just 11% in H2 2014, a sharp decline from the previous year. Nonetheless, prime retail yields have continued to fall and remain only a little above the other main German cities.
• As elsewhere in Germany, investors have been increasingly willing to explore secondary locations offering higher returns, and the increase in sales of development sites offers a further sign of the depth of demand.
• While prime city centre office rents have remained broadly stable over the last 12 months, out of town office rents have risen by around 5%.
Share of investment by property typeH2 2014
Source: RCA
Source: RCA
Source: RCA; IPD
OFFICE 37%INDUSTRIAL 9%RETAIL 11%RESIDENTIAL 35%OTHER/MIXED 8%
Market metrics
Total investment 2014 US$8,053 m
Percentage from foreign investors
43.0%
All property total return 2008-13 (p.a.)
3.4%
Income return 2008-13 (p.a.) 4.8%
Capital growth 2008-13 (p.a.) -1.4%
Office prime yield Q4 2014 4.5%
Asset Type Date Price (US$m) Vendor Purchaser Key tenants Size
Berlin apartment portfolio Apartment Mar 15 420 Deutsche Wohnen AG
ADo Properties NA 5,750 units
Berlin Marzahn apartments TAG DE portfolio
Apartment Nov 14 213 TAG Immobilien AG
HOWOGE NA 2,600 units
Deutsche Bank-Hochhaus Otto Suhr Allee 6-16
Office Mar 15 168 Art Invest Deutsche Bank Deutsche Bank 418,720 sq ft
Grand Hotel Esplanade Bellevuestrasse, 1
Hotel Sep 14 106 Blackstone Host Hotels & Resorts; APG; Govt of Singapore
NA 394 rooms
Office Campus an der O2 World; Muhlenstrasse
Office Mar 15 97 Strauss & Partner Dev
Amundi Real Estate; EDF Zalando; Anschutz Entertainment
282,017 sq ft
International property handbook H1 2015 39
Munich – key recent deals
• Investment into real estate in Munich in 2014 was up around 10.5% on the total in 2014, and prime office yields remain the lowest among the top German cities.
• After domestic investors, who took a 68% share of the market in Q4 2014, US buyers – both equity funds and institutions – were the next most active with 17%. French institutions were also keen purchasers during this period.
• As elsewhere, the office sector has been most in demand, particularly among foreign buyers, however retail took a larger share of the market than in the other cities covered, and domestic investors completed a significant number of hotel deals during the final quarter, reflecting the current strength of Munich’s tourism sector.
• A shortage of supply of new office space in the city centre has helped bring average vacancy rates down to their lowest in more than a decade. Healthy levels of demand in Munich have driven the strongest rental growth among the largest German centres.
Share of investment by property typeH2 2014
Source: RCA
Source: RCA
Source: RCA; IPD
OFFICE 58%INDUSTRIAL 3%RETAIL 18%RESIDENTIAL 4%OTHER/MIXED 17%
Market metrics
Total investment 2014 US$6,618 m
Percentage from foreign investors
32.5%
All property total return 2008-13 (p.a.)
6.3%
Income return 2008-13 (p.a.) 4.9%
Capital growth 2008-13 (p.a.) 1.4%
Office prime yield Q4 2014 4.0%
Asset Type Date Price (US$m) Vendor Purchaser Key tenants Size
Lenbach GärtenLuisenstrasse, 14
Office Sep 14 231 AM alpha Norges Bank Invt Mgmt; BNP Paribas
Conde Nast; McKinsey & Company
699,660 sq ft
Art Deco PalaisArnulfstrasse, 56-60
Office Dec 14 199 Blue Colibri AG BNP Paribas Deutsche Post; Kienbaum; E.ON; Consense
403,650 sq ft
Deutsche Bahn officeRichelstrasse, 3
Office Sep 14 190 Hannover Leasing Quantum Immobilien AG DB Netz AG 678,132 sq ft
Le Meridien MunichBayerstrasse, 41
Hotel Mar 15 177 Kildare partners DekaBank NA 381 units
Bruckmann Quartier Nymphenburger Strasse 84-86
Office Oct 14 101 Bruckmann Holding Rock Capital GmbH Designworks USA; Brand David; Mein Prospekt
269,100 sq ft
International property handbook H1 2015 40
Hamburg – key recent deals
• Over 46% of investment in Hamburg during 2014 was made by foreign buyers, a greater share than in both Munich and Frankfurt. US, UK and Sweden were the top three countries of origin.
• The demand among investors for offices was notably higher than in 2013, while in all other sectors, and for retail in particular, the volume of deals declined.
• Well below average supply of new office space over the last two years, combined with a sharp increase in take-up in 2014, have resulted in a further fall in the city centre vacancy rate and increased interest in more fringe locations.
• Although making up a relatively small proportion of the investment market, the industrial sector is an important part of the Hamburg market, and prime yields at the end of last year were at their lowest in over ten years.
Share of investment by property typeH2 2014
Source: RCA
Source: RCA
Source: RCA; IPD
OFFICE 62%INDUSTRIAL 5%RETAIL 16%RESIDENTIAL 12%OTHER/MIXED 5%
Market metrics
Total investment – 2014 US$5,234 m
Percentage from foreign investors
46.1%
All property total return 2008-13 (p.a.)
4.5%
Income return – 2008-13 (p.a.) 5.0%
Capital growth – 2008-13 (p.a.) -0.5%
Office prime yield – Q4 2014 4.5%
Asset Type Date Price (US$m) Vendor Purchaser Key tenants Size
Uberseequartier (4 office & 1 apartment property)
Mixed Dec 14 293 Gross & Partner; Propertize
Hines Postbank, La Baracca, KanAsia
489,644 sq ft 64 units
Axel Springer Haus Axel Springer Platz, 1
Office Jan 15 157 Axel Springer AG City of Hamburg Axel Springer AG 592,020 sq ft
Hamburg Apartments portfolio
Apartment Nov 14 131 City of Hamburg SAGA GWG Stiftung Nachbarschaft
NA 900 units
Millerntorplatz 1 Office Dec 14 119 Credit Suisse Dream Global REIT City of Hamburg; Deutsche Rentenversicherung
375,987 sq ft
Hotel Atlantic Kempinski An Der Alster 72
Hotel Dec 14 87 Octavian Hotel Holding GmbH
Asklepios Kliniken; Dr Broermann Hotels & Residences GmbH
NA 245 units
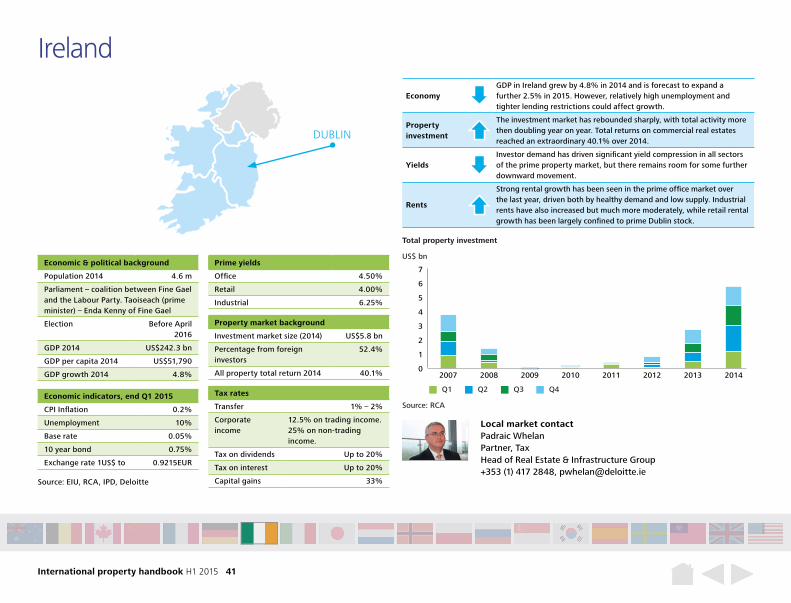
International property handbook H1 2015 41
EconomyGDP in Ireland grew by 4.8% in 2014 and is forecast to expand a further 2.5% in 2015. However, relatively high unemployment and tighter lending restrictions could affect growth.
Property investment
The investment market has rebounded sharply, with total activity more then doubling year on year. Total returns on commercial real estates reached an extraordinary 40.1% over 2014.
YieldsInvestor demand has driven significant yield compression in all sectors of the prime property market, but there remains room for some further downward movement.
Rents
Strong rental growth has been seen in the prime office market over the last year, driven both by healthy demand and low supply. Industrial rents have also increased but much more moderately, while retail rental growth has been largely confined to prime Dublin stock.
Ireland
Economic & political background
Population 2014 4.6 m
Parliament – coalition between Fine Gael and the Labour Party. Taoiseach (prime minister) – Enda Kenny of Fine Gael
Election Before April 2016
GDP 2014 US$242.3 bn
GDP per capita 2014 US$51,790
GDP growth 2014 4.8%
Prime yields
Office 4.50%
Retail 4.00%
Industrial 6.25%
Property market background
Investment market size (2014) US$5.8 bn
Percentage from foreign investors
52.4%
All property total return 2014 40.1%
Tax rates
Transfer 1% – 2%
Corporate income
12.5% on trading income. 25% on non-trading income.
Tax on dividends Up to 20%
Tax on interest Up to 20%
Capital gains 33%
Economic indicators, end Q1 2015
CPI Inflation 0.2%
Unemployment 10%
Base rate 0.05%
10 year bond 0.75%
Exchange rate 1US$ to 0.9215EUR
Local market contactPadraic Whelan Partner, Tax Head of Real Estate & Infrastructure Group +353 (1) 417 2848, [email protected]
Source: RCA
Q1
Total property investment
US$ bn
Q2 Q3 Q4
0
1
2
3
4
5
6
7
20142013201220112010200920082007
Source: EIU, RCA, IPD, Deloitte
DUBLIN
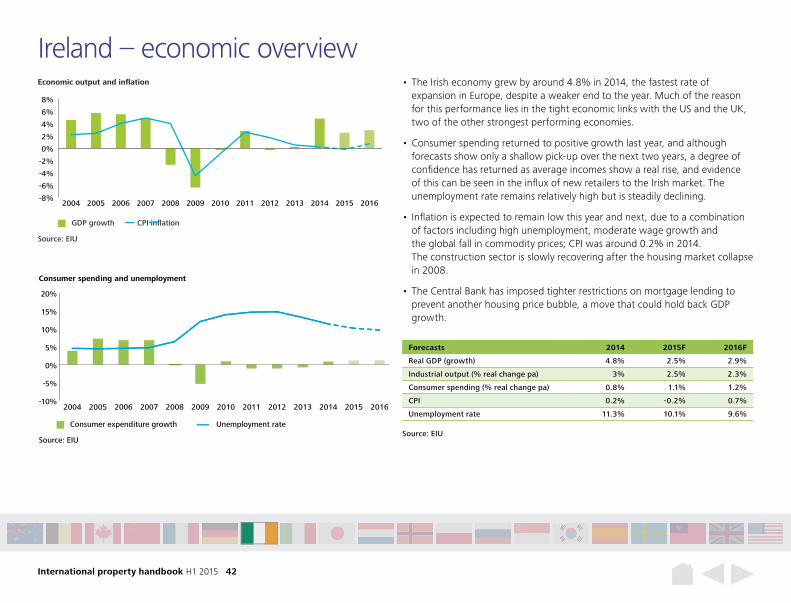
International property handbook H1 2015 42
Forecasts 2014 2015F 2016F
Real GDP (growth) 4.8% 2.5% 2.9%
Industrial output (% real change pa) 3% 2.5% 2.3%
Consumer spending (% real change pa) 0.8% 1.1% 1.2%
CPI 0.2% -0.2% 0.7%
Unemployment rate 11.3% 10.1% 9.6%
-10%
-5%
0%
5%
10%
15%
20%
2016201520142013201220112010200920082007200620052004
Source: EIU
Consumer expenditure growth
Consumer spending and unemployment
Unemployment rateSource: EIU
• The Irish economy grew by around 4.8% in 2014, the fastest rate of expansion in Europe, despite a weaker end to the year. Much of the reason for this performance lies in the tight economic links with the US and the UK, two of the other strongest performing economies.
• Consumer spending returned to positive growth last year, and although forecasts show only a shallow pick-up over the next two years, a degree of confidence has returned as average incomes show a real rise, and evidence of this can be seen in the influx of new retailers to the Irish market. The unemployment rate remains relatively high but is steadily declining.
• Inflation is expected to remain low this year and next, due to a combination of factors including high unemployment, moderate wage growth and the global fall in commodity prices; CPI was around 0.2% in 2014. The construction sector is slowly recovering after the housing market collapse in 2008.
• The Central Bank has imposed tighter restrictions on mortgage lending to prevent another housing price bubble, a move that could hold back GDP growth.
Ireland – economic overview
Source: EIU
GDP growth CPI inflation
Economic output and inflation
-8%
-6%
-4%
-2%
0%
2%
4%
6%
8%
2016201520142013201220112010200920082007200620052004
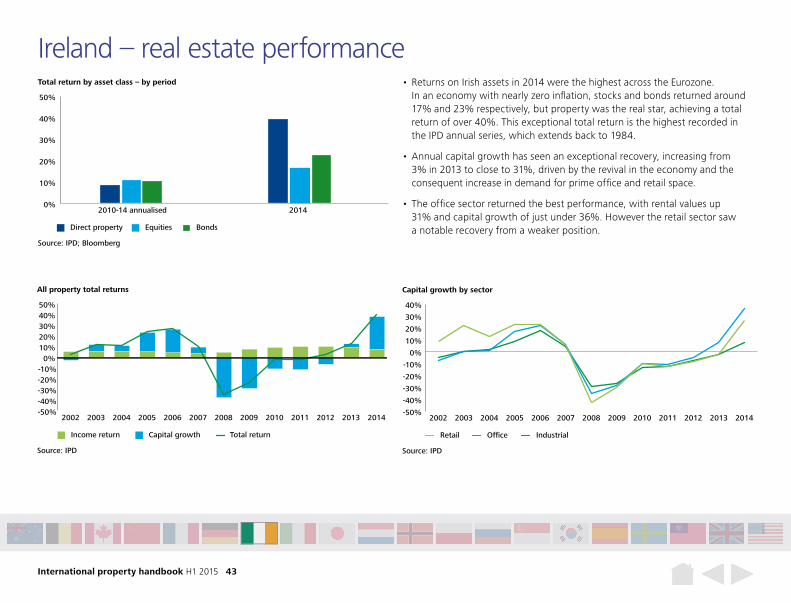
International property handbook H1 2015 43
Ireland – real estate performance • Returns on Irish assets in 2014 were the highest across the Eurozone.
In an economy with nearly zero inflation, stocks and bonds returned around 17% and 23% respectively, but property was the real star, achieving a total return of over 40%. This exceptional total return is the highest recorded in the IPD annual series, which extends back to 1984.
• Annual capital growth has seen an exceptional recovery, increasing from 3% in 2013 to close to 31%, driven by the revival in the economy and the consequent increase in demand for prime office and retail space.
• The office sector returned the best performance, with rental values up 31% and capital growth of just under 36%. However the retail sector saw a notable recovery from a weaker position.
-50%-40%-30%-20%-10%
0%10%20%30%40%50%
2014201320122011201020092008200720062005200420032002
Source: IPD
Income return Capital growth Total return
All property total returns
-50%
-40%
-30%
-20%
-10%
0%
10%
20%
30%
40%
2014201320122011201020092008200720062005200420032002
Source: IPD
OfficeRetail Industrial
Capital growth by sector
0%
10%
20%
30%
40%
50%
20142010-14 annualised
Source: IPD; Bloomberg
Total return by asset class – by period
Direct property Equities Bonds
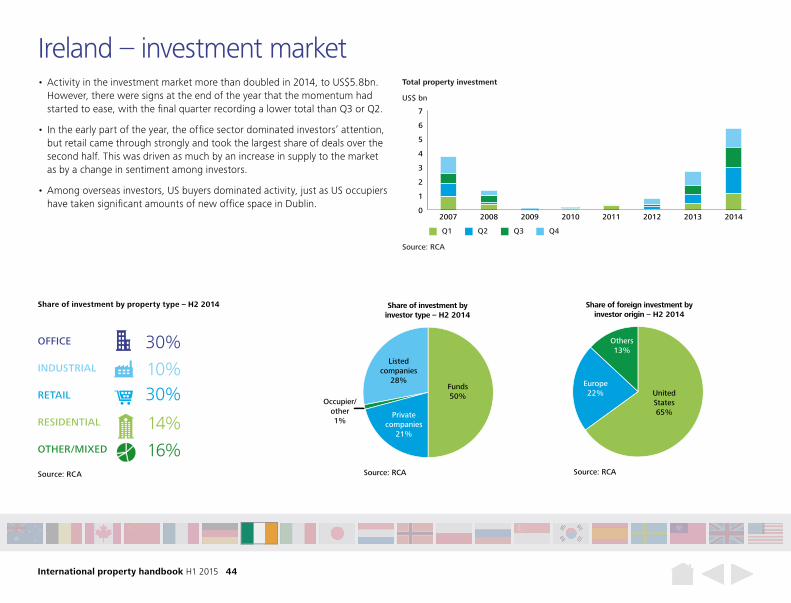
International property handbook H1 2015 44
Share of investment by property type – H2 2014
Source: RCA
OFFICE 30%INDUSTRIAL 10%RETAIL 30%RESIDENTIAL 14%OTHER/MIXED 16%
Occupier/other1%
Share of investment by investor type – H2 2014
Source: RCA
Listed companies
28%Funds50%
Private companies
21%
Share of foreign investment by investor origin – H2 2014
Source: RCA
Europe22%
Others13%
United States65%
Occupier/other1%
Share of investment by investor type – H2 2014
Source: RCA
Listed companies
28%Funds50%
Private companies
21%
Share of foreign investment by investor origin – H2 2014
Source: RCA
Europe22%
Others13%
United States65%
• Activity in the investment market more than doubled in 2014, to US$5.8bn. However, there were signs at the end of the year that the momentum had started to ease, with the final quarter recording a lower total than Q3 or Q2.
• In the early part of the year, the office sector dominated investors’ attention, but retail came through strongly and took the largest share of deals over the second half. This was driven as much by an increase in supply to the market as by a change in sentiment among investors.
• Among overseas investors, US buyers dominated activity, just as US occupiers have taken significant amounts of new office space in Dublin.
Ireland – investment market
Source: RCA
Q1
Total property investment
US$ bn
Q2 Q3 Q4
0
1
2
3
4
5
6
7
20142013201220112010200920082007
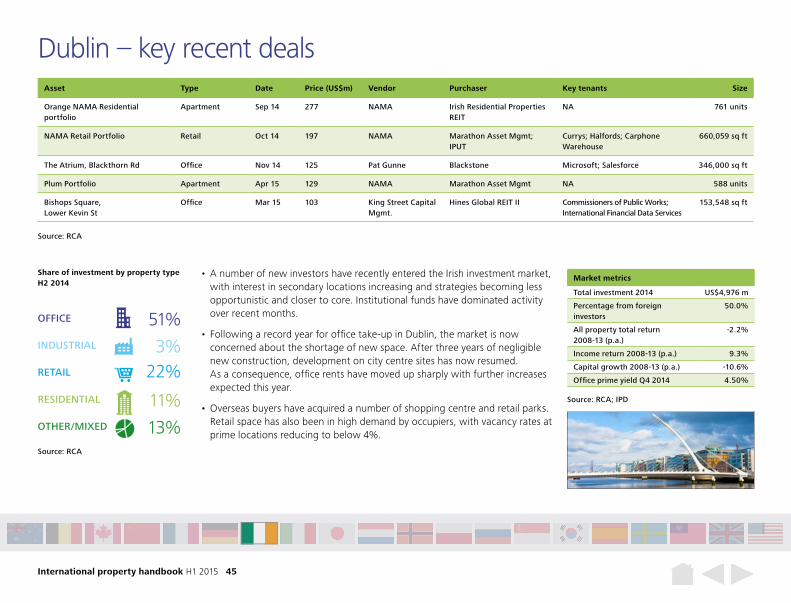
International property handbook H1 2015 45
Dublin – key recent deals
• A number of new investors have recently entered the Irish investment market, with interest in secondary locations increasing and strategies becoming less opportunistic and closer to core. Institutional funds have dominated activity over recent months.
• Following a record year for office take-up in Dublin, the market is now concerned about the shortage of new space. After three years of negligible new construction, development on city centre sites has now resumed. As a consequence, office rents have moved up sharply with further increases expected this year.
• Overseas buyers have acquired a number of shopping centre and retail parks. Retail space has also been in high demand by occupiers, with vacancy rates at prime locations reducing to below 4%.
Share of investment by property typeH2 2014
Source: RCA
Source: RCA
Source: RCA; IPD
OFFICE 51%INDUSTRIAL 3%RETAIL 22%RESIDENTIAL 11%OTHER/MIXED 13%
Market metrics
Total investment 2014 US$4,976 m
Percentage from foreign investors
50.0%
All property total return 2008-13 (p.a.)
-2.2%
Income return 2008-13 (p.a.) 9.3%
Capital growth 2008-13 (p.a.) -10.6%
Office prime yield Q4 2014 4.50%
Asset Type Date Price (US$m) Vendor Purchaser Key tenants Size
Orange NAMA Residential portfolio
Apartment Sep 14 277 NAMA Irish Residential Properties REIT
NA 761 units
NAMA Retail Portfolio Retail Oct 14 197 NAMA Marathon Asset Mgmt; IPUT
Currys; Halfords; Carphone Warehouse
660,059 sq ft
The Atrium, Blackthorn Rd Office Nov 14 125 Pat Gunne Blackstone Microsoft; Salesforce 346,000 sq ft
Plum Portfolio Apartment Apr 15 129 NAMA Marathon Asset Mgmt NA 588 units
Bishops Square, Lower Kevin St
Office Mar 15 103 King Street Capital Mgmt.
Hines Global REIT II Commissioners of Public Works; International Financial Data Services
153,548 sq ft
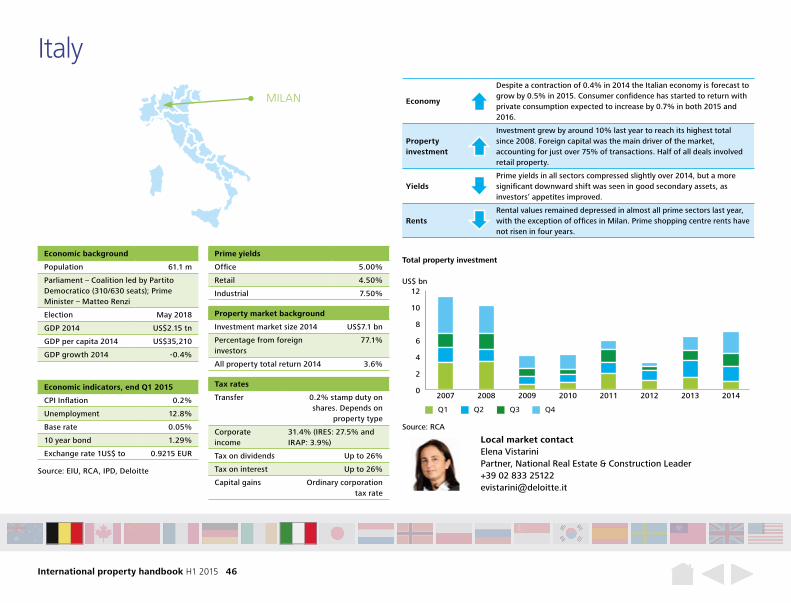
International property handbook H1 2015 46
Economy
Despite a contraction of 0.4% in 2014 the Italian economy is forecast to grow by 0.5% in 2015. Consumer confidence has started to return with private consumption expected to increase by 0.7% in both 2015 and 2016.
Property investment
Investment grew by around 10% last year to reach its highest total since 2008. Foreign capital was the main driver of the market, accounting for just over 75% of transactions. Half of all deals involved retail property.
YieldsPrime yields in all sectors compressed slightly over 2014, but a more significant downward shift was seen in good secondary assets, as investors’ appetites improved.
RentsRental values remained depressed in almost all prime sectors last year, with the exception of offices in Milan. Prime shopping centre rents have not risen in four years.
Italy
Economic background
Population 61.1 m
Parliament – Coalition led by Partito Democratico (310/630 seats); Prime Minister – Matteo Renzi
Election May 2018
GDP 2014 US$2.15 tn
GDP per capita 2014 US$35,210
GDP growth 2014 -0.4%
Prime yields
Office 5.00%
Retail 4.50%
Industrial 7.50%
Property market background
Investment market size 2014 US$7.1 bn
Percentage from foreign investors
77.1%
All property total return 2014 3.6%
Tax rates
Transfer 0.2% stamp duty on shares. Depends on
property type
Corporate income
31.4% (IRES: 27.5% and IRAP: 3.9%)
Tax on dividends Up to 26%
Tax on interest Up to 26%
Capital gains Ordinary corporation tax rate
Economic indicators, end Q1 2015
CPI Inflation 0.2%
Unemployment 12.8%
Base rate 0.05%
10 year bond 1.29%
Exchange rate 1US$ to 0.9215 EUR
Local market contactElena Vistarini Partner, National Real Estate & Construction Leader +39 02 833 25122 [email protected]
0
2
4
6
8
10
12
20142013201220112010200920082007
Source: RCA
Total property investment
US$ bn
Q1 Q2 Q3 Q4
Source: EIU, RCA, IPD, Deloitte
MILAN
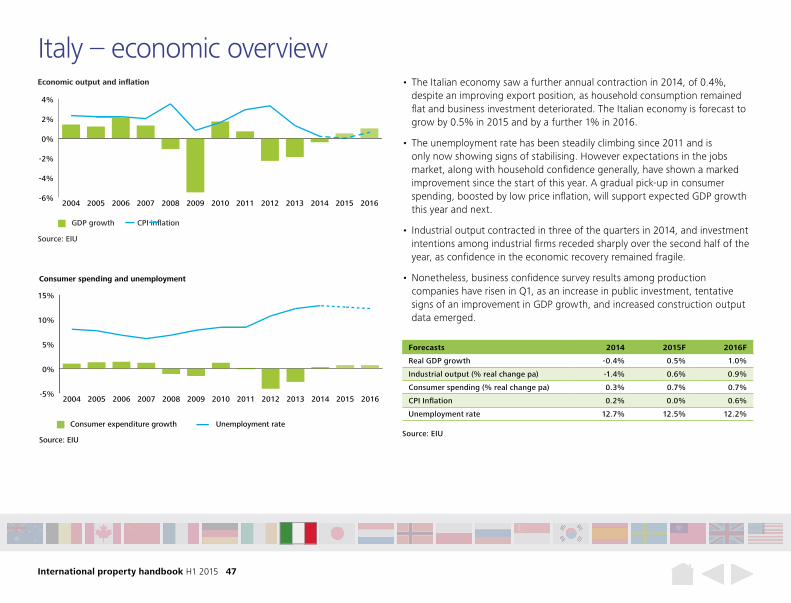
International property handbook H1 2015 47
Forecasts 2014 2015F 2016F
Real GDP growth -0.4% 0.5% 1.0%
Industrial output (% real change pa) -1.4% 0.6% 0.9%
Consumer spending (% real change pa) 0.3% 0.7% 0.7%
CPI Inflation 0.2% 0.0% 0.6%
Unemployment rate 12.7% 12.5% 12.2%
Source: EIU
GDP growth CPI inflation
Economic output and inflation
-6%
-4%
-2%
0%
2%
4%
2016201520142013201220112010200920082007200620052004
-5%
0%
5%
10%
15%
2016201520142013201220112010200920082007200620052004
Source: EIU
Consumer expenditure growth
Consumer spending and unemployment
Unemployment rateSource: EIU
• The Italian economy saw a further annual contraction in 2014, of 0.4%, despite an improving export position, as household consumption remained flat and business investment deteriorated. The Italian economy is forecast to grow by 0.5% in 2015 and by a further 1% in 2016.
• The unemployment rate has been steadily climbing since 2011 and is only now showing signs of stabilising. However expectations in the jobs market, along with household confidence generally, have shown a marked improvement since the start of this year. A gradual pick-up in consumer spending, boosted by low price inflation, will support expected GDP growth this year and next.
• Industrial output contracted in three of the quarters in 2014, and investment intentions among industrial firms receded sharply over the second half of the year, as confidence in the economic recovery remained fragile.
• Nonetheless, business confidence survey results among production companies have risen in Q1, as an increase in public investment, tentative signs of an improvement in GDP growth, and increased construction output data emerged.
Italy – economic overview
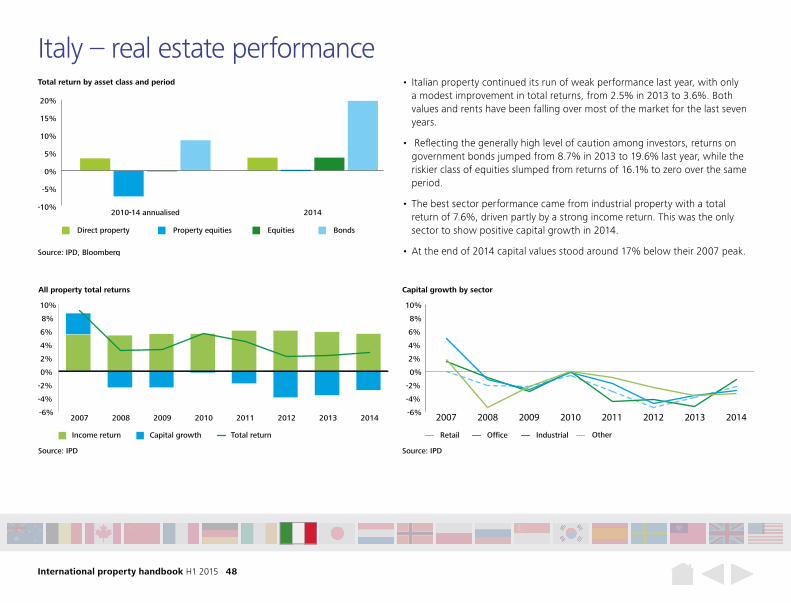
International property handbook H1 2015 48
Italy – real estate performance • Italian property continued its run of weak performance last year, with only
a modest improvement in total returns, from 2.5% in 2013 to 3.6%. Both values and rents have been falling over most of the market for the last seven years.
• Reflecting the generally high level of caution among investors, returns on government bonds jumped from 8.7% in 2013 to 19.6% last year, while the riskier class of equities slumped from returns of 16.1% to zero over the same period.
• The best sector performance came from industrial property with a total return of 7.6%, driven partly by a strong income return. This was the only sector to show positive capital growth in 2014.
• At the end of 2014 capital values stood around 17% below their 2007 peak.
-6%
-4%
-2%
0%
2%
4%
6%
8%
10%
20142013201220112010200920082007
Source: IPD
Income return Capital growth Total return
All property total returns
-6%
-4%
-2%
0%
2%
4%
6%
8%
10%
20142013201220112010200920082007
Source: IPD
OfficeRetail Industrial Other
Capital growth by sector
Total return by asset class and period
Source: IPD, Bloomberg
Direct property Property equities Equities Bonds
-10%
-5%
0%
5%
10%
15%
20%
20142010-14 annualised
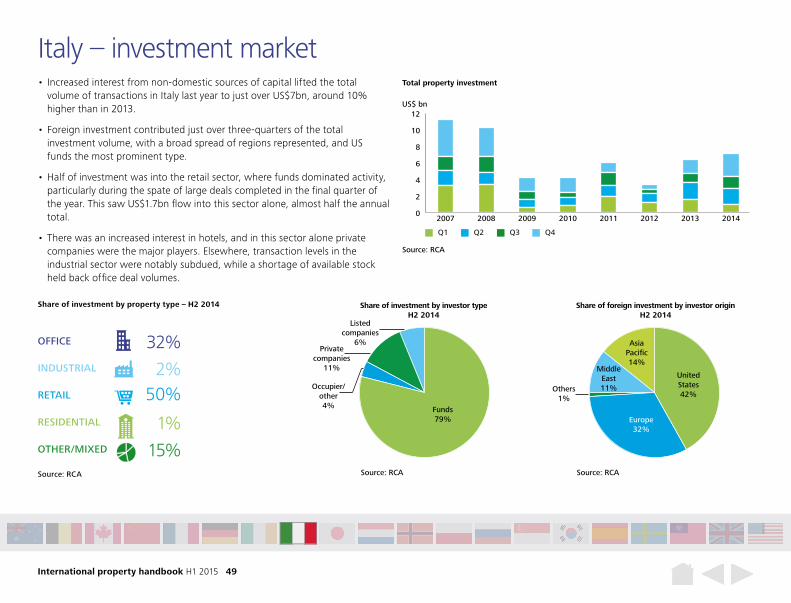
International property handbook H1 2015 49
Share of investment by property type – H2 2014
Source: RCA
OFFICE 32%INDUSTRIAL 2%RETAIL 50%RESIDENTIAL 1%OTHER/MIXED 15%
Occupier/other4%
Share of investment by investor typeH2 2014
Source: RCA
Listed companies
6%
Funds79%
Private companies
11%
Share of foreign investment by investor originH2 2014
Source: RCA
Asia Pacific14%
United States42%
Europe32%
Middle East11%Others
1%
• Increased interest from non-domestic sources of capital lifted the total volume of transactions in Italy last year to just over US$7bn, around 10% higher than in 2013.
• Foreign investment contributed just over three-quarters of the total investment volume, with a broad spread of regions represented, and US funds the most prominent type.
• Half of investment was into the retail sector, where funds dominated activity, particularly during the spate of large deals completed in the final quarter of the year. This saw US$1.7bn flow into this sector alone, almost half the annual total.
• There was an increased interest in hotels, and in this sector alone private companies were the major players. Elsewhere, transaction levels in the industrial sector were notably subdued, while a shortage of available stock held back office deal volumes.
Italy – investment market
0
2
4
6
8
10
12
20142013201220112010200920082007
Source: RCA
Total property investment
US$ bn
Q1 Q2 Q3 Q4
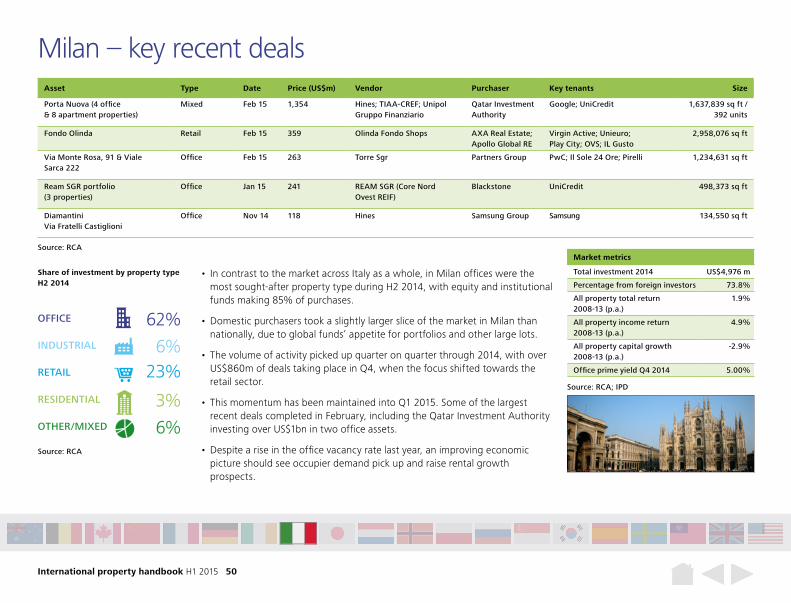
International property handbook H1 2015 50
Milan – key recent deals
• In contrast to the market across Italy as a whole, in Milan offices were the most sought-after property type during H2 2014, with equity and institutional funds making 85% of purchases.
• Domestic purchasers took a slightly larger slice of the market in Milan than nationally, due to global funds’ appetite for portfolios and other large lots.
• The volume of activity picked up quarter on quarter through 2014, with over US$860m of deals taking place in Q4, when the focus shifted towards the retail sector.
• This momentum has been maintained into Q1 2015. Some of the largest recent deals completed in February, including the Qatar Investment Authority investing over US$1bn in two office assets.
• Despite a rise in the office vacancy rate last year, an improving economic picture should see occupier demand pick up and raise rental growth prospects.
Share of investment by property typeH2 2014
Source: RCA
Source: RCA
Source: RCA; IPD
OFFICE 62%INDUSTRIAL 6%RETAIL 23%RESIDENTIAL 3%OTHER/MIXED 6%
Market metrics
Total investment 2014 US$4,976 m
Percentage from foreign investors 73.8%
All property total return 2008-13 (p.a.)
1.9%
All property income return 2008-13 (p.a.)
4.9%
All property capital growth 2008-13 (p.a.)
-2.9%
Office prime yield Q4 2014 5.00%
Asset Type Date Price (US$m) Vendor Purchaser Key tenants Size
Porta Nuova (4 office & 8 apartment properties)
Mixed Feb 15 1,354 Hines; TIAA-CREF; Unipol Gruppo Finanziario
Qatar Investment Authority
Google; UniCredit 1,637,839 sq ft / 392 units
Fondo Olinda Retail Feb 15 359 Olinda Fondo Shops AXA Real Estate; Apollo Global RE
Virgin Active; Unieuro; Play City; OVS; IL Gusto
2,958,076 sq ft
Via Monte Rosa, 91 & Viale Sarca 222
Office Feb 15 263 Torre Sgr Partners Group PwC; Il Sole 24 Ore; Pirelli 1,234,631 sq ft
Ream SGR portfolio (3 properties)
Office Jan 15 241 REAM SGR (Core Nord Ovest REIF)
Blackstone UniCredit 498,373 sq ft
Diamantini Via Fratelli Castiglioni
Office Nov 14 118 Hines Samsung Group Samsung 134,550 sq ft
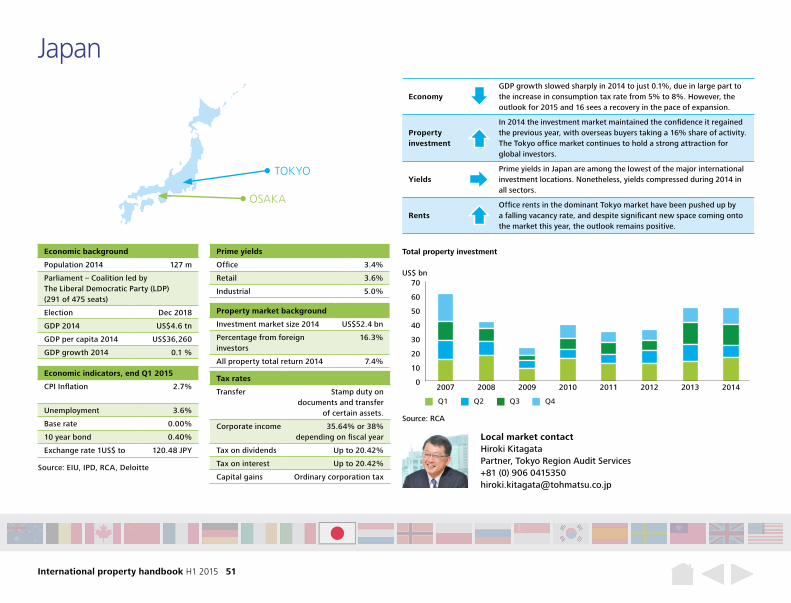
International property handbook H1 2015 51
EconomyGDP growth slowed sharply in 2014 to just 0.1%, due in large part to the increase in consumption tax rate from 5% to 8%. However, the outlook for 2015 and 16 sees a recovery in the pace of expansion.
Property investment
In 2014 the investment market maintained the confidence it regained the previous year, with overseas buyers taking a 16% share of activity. The Tokyo office market continues to hold a strong attraction for global investors.
YieldsPrime yields in Japan are among the lowest of the major international investment locations. Nonetheless, yields compressed during 2014 in all sectors.
RentsOffice rents in the dominant Tokyo market have been pushed up by a falling vacancy rate, and despite significant new space coming onto the market this year, the outlook remains positive.
Japan
Economic background
Population 2014 127 m
Parliament – Coalition led by The Liberal Democratic Party (LDP) (291 of 475 seats)
Election Dec 2018
GDP 2014 US$4.6 tn
GDP per capita 2014 US$36,260
GDP growth 2014 0.1 %
Prime yields
Office 3.4%
Retail 3.6%
Industrial 5.0%
Tax rates
Transfer Stamp duty on documents and transfer
of certain assets.
Corporate income 35.64% or 38% depending on fiscal year
Tax on dividends Up to 20.42%
Tax on interest Up to 20.42%
Capital gains Ordinary corporation tax
Property market background
Investment market size 2014 US$52.4 bn
Percentage from foreign investors
16.3%
All property total return 2014 7.4%
Local market contactHiroki Kitagata Partner, Tokyo Region Audit Services +81 (0) 906 0415350 [email protected]
0
10
20
30
40
50
60
70
20142013201220112010200920082007
Source: RCA
Total property investment
US$ bn
Q1 Q2 Q3 Q4
Source: EIU, IPD, RCA, Deloitte
TOKYO
OSAKA
Economic indicators, end Q1 2015
CPI Inflation 2.7%
Unemployment 3.6%
Base rate 0.00%
10 year bond 0.40%
Exchange rate 1US$ to 120.48 JPY
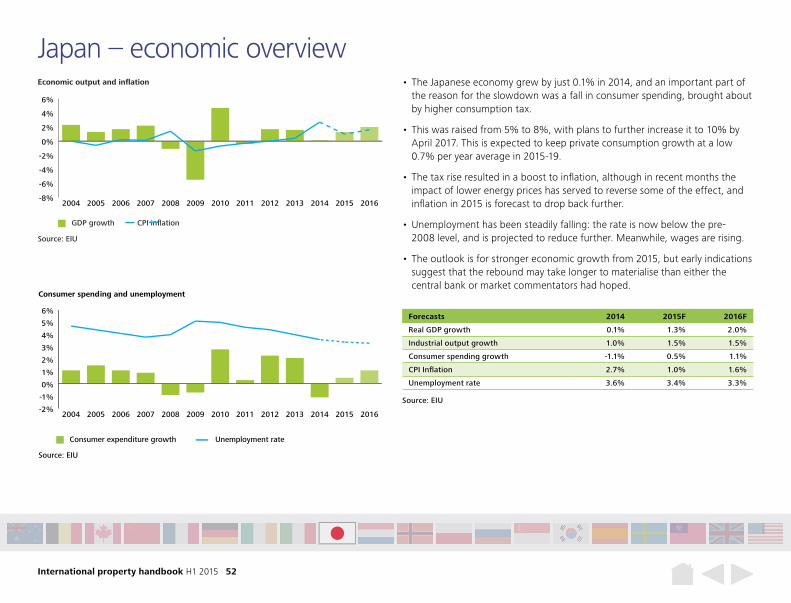
International property handbook H1 2015 52
Forecasts 2014 2015F 2016F
Real GDP growth 0.1% 1.3% 2.0%
Industrial output growth 1.0% 1.5% 1.5%
Consumer spending growth -1.1% 0.5% 1.1%
CPI Inflation 2.7% 1.0% 1.6%
Unemployment rate 3.6% 3.4% 3.3%
Source: EIU
GDP growth CPI inflation
Economic output and inflation
-8%
-6%
-4%
-2%
0%
2%
4%
6%
2016201520142013201220112010200920082007200620052004
Source: EIU
• The Japanese economy grew by just 0.1% in 2014, and an important part of the reason for the slowdown was a fall in consumer spending, brought about by higher consumption tax.
• This was raised from 5% to 8%, with plans to further increase it to 10% by April 2017. This is expected to keep private consumption growth at a low 0.7% per year average in 2015-19.
• The tax rise resulted in a boost to inflation, although in recent months the impact of lower energy prices has served to reverse some of the effect, and inflation in 2015 is forecast to drop back further.
• Unemployment has been steadily falling: the rate is now below the pre- 2008 level, and is projected to reduce further. Meanwhile, wages are rising.
• The outlook is for stronger economic growth from 2015, but early indications suggest that the rebound may take longer to materialise than either the central bank or market commentators had hoped.
Japan – economic overview
-2%
-1%
0%
1%
2%
3%
4%
5%
6%
2016201520142013201220112010200920082007200620052004
Source: EIU
Consumer expenditure growth
Consumer spending and unemployment
Unemployment rate
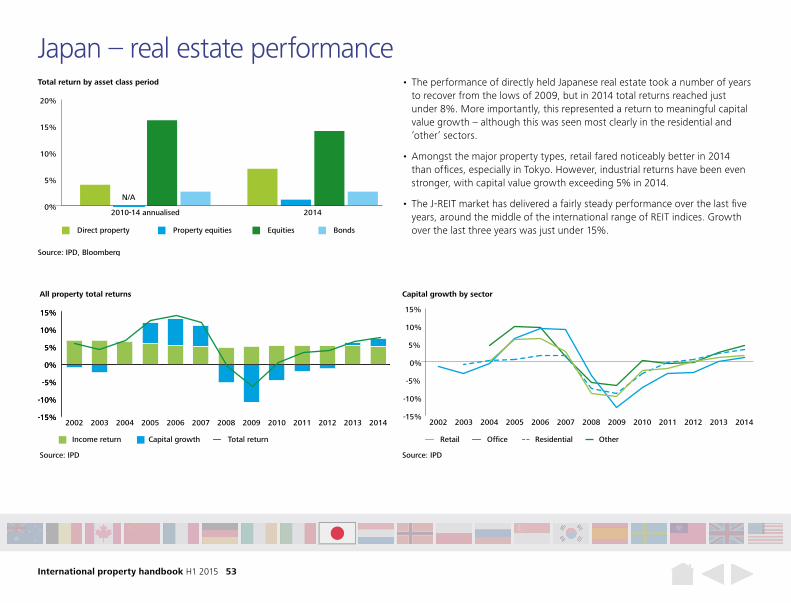
International property handbook H1 2015 53
Japan – real estate performance • The performance of directly held Japanese real estate took a number of years
to recover from the lows of 2009, but in 2014 total returns reached just under 8%. More importantly, this represented a return to meaningful capital value growth – although this was seen most clearly in the residential and ‘other’ sectors.
• Amongst the major property types, retail fared noticeably better in 2014 than offices, especially in Tokyo. However, industrial returns have been even stronger, with capital value growth exceeding 5% in 2014.
• The J-REIT market has delivered a fairly steady performance over the last five years, around the middle of the international range of REIT indices. Growth over the last three years was just under 15%.
-15%
-10%
-5%
0%
5%
10%
15%
-15%
-10%
-5%
0%
5%
10%
15%
2014201320122011201020092008200720062005200420032002
All property total returns
Source: IPD
Income return Capital growth Total return
-15%
-10%
-5%
0%
5%
10%
15%
2014201320122011201020092008200720062005200420032002
Source: IPD
Capital growth by sector
OfficeRetail Residential Other
Total return by asset class period
Source: IPD, Bloomberg
Direct property
N/A
Property equities Equities Bonds
0%
5%
10%
15%
20%
20142010-14 annualised
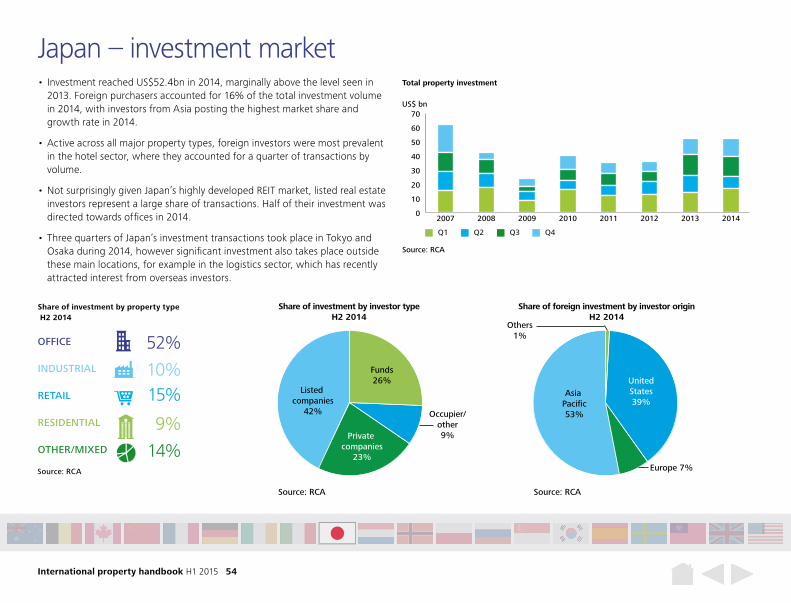
International property handbook H1 2015 54
Share of investment by property type H2 2014
Source: RCA
OFFICE 52%INDUSTRIAL 10%RETAIL 15%RESIDENTIAL 9%OTHER/MIXED 14%
Occupier/other9%
Share of investment by investor typeH2 2014
Source: RCA
Listed companies
42%
Funds26%
Private companies
23%
Share of foreign investment by investor originH2 2014
Source: RCA
Asia Pacific53%
UnitedStates39%
Europe 7%
Others1%
• Investment reached US$52.4bn in 2014, marginally above the level seen in 2013. Foreign purchasers accounted for 16% of the total investment volume in 2014, with investors from Asia posting the highest market share and growth rate in 2014.
• Active across all major property types, foreign investors were most prevalent in the hotel sector, where they accounted for a quarter of transactions by volume.
• Not surprisingly given Japan’s highly developed REIT market, listed real estate investors represent a large share of transactions. Half of their investment was directed towards offices in 2014.
• Three quarters of Japan’s investment transactions took place in Tokyo and Osaka during 2014, however significant investment also takes place outside these main locations, for example in the logistics sector, which has recently attracted interest from overseas investors.
Japan – investment market
0
10
20
30
40
50
60
70
20142013201220112010200920082007
Source: RCA
Total property investment
US$ bn
Q1 Q2 Q3 Q4
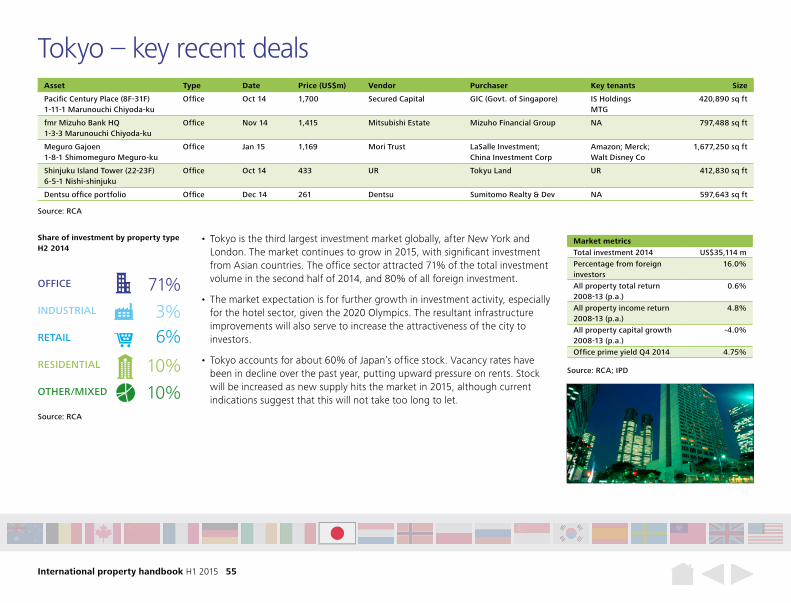
International property handbook H1 2015 55
Market metricsTotal investment 2014 US$35,114 mPercentage from foreign investors
16.0%
All property total return 2008-13 (p.a.)
0.6%
All property income return 2008-13 (p.a.)
4.8%
All property capital growth 2008-13 (p.a.)
-4.0%
Office prime yield Q4 2014 4.75%
Tokyo – key recent deals
• Tokyo is the third largest investment market globally, after New York and London. The market continues to grow in 2015, with significant investment from Asian countries. The office sector attracted 71% of the total investment volume in the second half of 2014, and 80% of all foreign investment.
• The market expectation is for further growth in investment activity, especially for the hotel sector, given the 2020 Olympics. The resultant infrastructure improvements will also serve to increase the attractiveness of the city to investors.
• Tokyo accounts for about 60% of Japan’s office stock. Vacancy rates have been in decline over the past year, putting upward pressure on rents. Stock will be increased as new supply hits the market in 2015, although current indications suggest that this will not take too long to let.
Share of investment by property typeH2 2014
Source: RCA
Source: RCA
Source: RCA; IPD
OFFICE 71%INDUSTRIAL 3%RETAIL 6%RESIDENTIAL 10%
10%
Asset Type Date Price (US$m) Vendor Purchaser Key tenants Size
Pacific Century Place (8F-31F) 1-11-1 Marunouchi Chiyoda-ku
Office Oct 14 1,700 Secured Capital GIC (Govt. of Singapore) IS Holdings MTG
420,890 sq ft
fmr Mizuho Bank HQ 1-3-3 Marunouchi Chiyoda-ku
Office Nov 14 1,415 Mitsubishi Estate Mizuho Financial Group NA 797,488 sq ft
Meguro Gajoen 1-8-1 Shimomeguro Meguro-ku
Office Jan 15 1,169 Mori Trust LaSalle Investment; China Investment Corp
Amazon; Merck; Walt Disney Co
1,677,250 sq ft
Shinjuku Island Tower (22-23F) 6-5-1 Nishi-shinjuku
Office Oct 14 433 UR Tokyu Land UR 412,830 sq ft
Dentsu office portfolio Office Dec 14 261 Dentsu Sumitomo Realty & Dev NA 597,643 sq ft
OTHER/MIXED
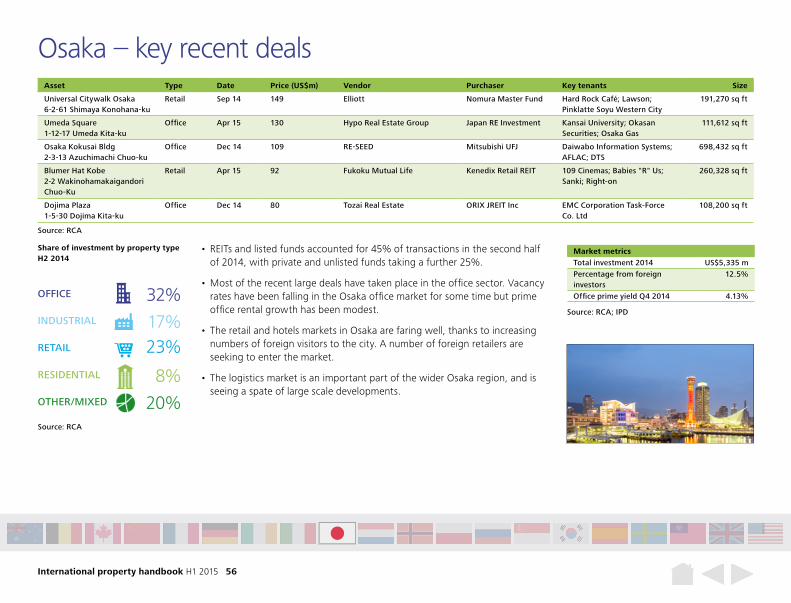
International property handbook H1 2015 56
Market metricsTotal investment 2014 US$5,335 mPercentage from foreign investors
12.5%
Office prime yield Q4 2014 4.13%
Osaka – key recent deals
• REITs and listed funds accounted for 45% of transactions in the second half of 2014, with private and unlisted funds taking a further 25%.
• Most of the recent large deals have taken place in the office sector. Vacancy rates have been falling in the Osaka office market for some time but prime office rental growth has been modest.
• The retail and hotels markets in Osaka are faring well, thanks to increasing numbers of foreign visitors to the city. A number of foreign retailers are seeking to enter the market.
• The logistics market is an important part of the wider Osaka region, and is seeing a spate of large scale developments.
Source: RCA
Source: RCA; IPD
Asset Type Date Price (US$m) Vendor Purchaser Key tenants Size
Universal Citywalk Osaka 6-2-61 Shimaya Konohana-ku
Retail Sep 14 149 Elliott Nomura Master Fund Hard Rock Café; Lawson; Pinklatte Soyu Western City
191,270 sq ft
Umeda Square 1-12-17 Umeda Kita-ku
Office Apr 15 130 Hypo Real Estate Group Japan RE Investment Kansai University; Okasan Securities; Osaka Gas
111,612 sq ft
Osaka Kokusai Bldg 2-3-13 Azuchimachi Chuo-ku
Office Dec 14 109 RE-SEED Mitsubishi UFJ Daiwabo Information Systems; AFLAC; DTS
698,432 sq ft
Blumer Hat Kobe 2-2 Wakinohamakaigandori Chuo-Ku
Retail Apr 15 92 Fukoku Mutual Life Kenedix Retail REIT 109 Cinemas; Babies "R" Us; Sanki; Right-on
260,328 sq ft
Dojima Plaza 1-5-30 Dojima Kita-ku
Office Dec 14 80 Tozai Real Estate ORIX JREIT Inc EMC Corporation Task-Force Co. Ltd
108,200 sq ft
Share of investment by property typeH2 2014
Source: RCA
OFFICE 32%INDUSTRIAL 17%RETAIL 23%RESIDENTIAL 8%
20%OTHER/MIXED
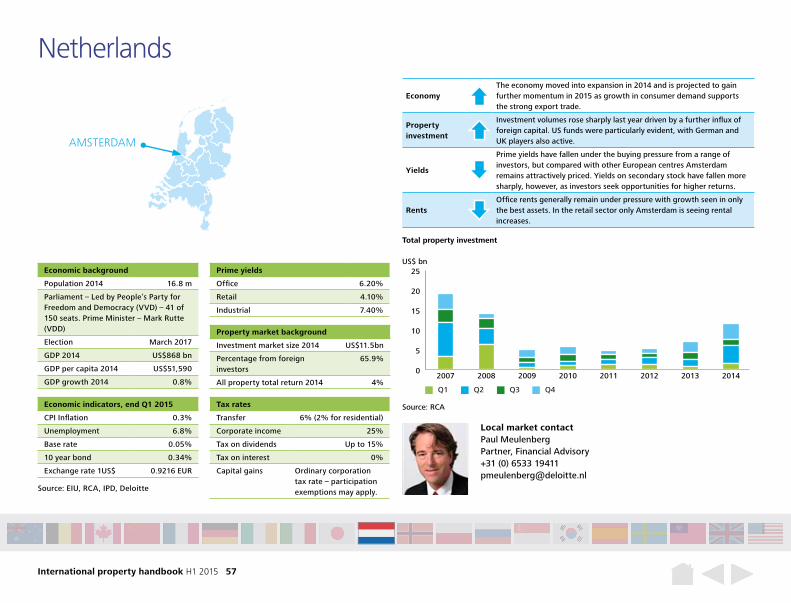
International property handbook H1 2015 57
EconomyThe economy moved into expansion in 2014 and is projected to gain further momentum in 2015 as growth in consumer demand supports the strong export trade.
Property investment
Investment volumes rose sharply last year driven by a further influx of foreign capital. US funds were particularly evident, with German and UK players also active.
Yields
Prime yields have fallen under the buying pressure from a range of investors, but compared with other European centres Amsterdam remains attractively priced. Yields on secondary stock have fallen more sharply, however, as investors seek opportunities for higher returns.
RentsOffice rents generally remain under pressure with growth seen in only the best assets. In the retail sector only Amsterdam is seeing rental increases.
Netherlands
Economic background
Population 2014 16.8 m
Parliament – Led by People’s Party for Freedom and Democracy (VVD) – 41 of 150 seats. Prime Minister – Mark Rutte (VDD)
Election March 2017
GDP 2014 US$868 bn
GDP per capita 2014 US$51,590
GDP growth 2014 0.8%
Prime yields
Office 6.20%
Retail 4.10%
Industrial 7.40%
Economic indicators, end Q1 2015
CPI Inflation 0.3%
Unemployment 6.8%
Base rate 0.05%
10 year bond 0.34%
Exchange rate 1US$ 0.9216 EUR
Local market contactPaul Meulenberg Partner, Financial Advisory +31 (0) 6533 19411 [email protected]
0
5
10
15
20
25
20142013201220112010200920082007
Source: RCA
Total property investment
US$ bn
Q1 Q2 Q3 Q4
Property market background
Investment market size 2014 US$11.5bn
Percentage from foreign investors
65.9%
All property total return 2014 4%
Source: EIU, RCA, IPD, Deloitte
AMSTERDAM
Tax rates
Transfer 6% (2% for residential)
Corporate income 25%
Tax on dividends Up to 15%
Tax on interest 0%
Capital gains Ordinary corporation tax rate – participation exemptions may apply.
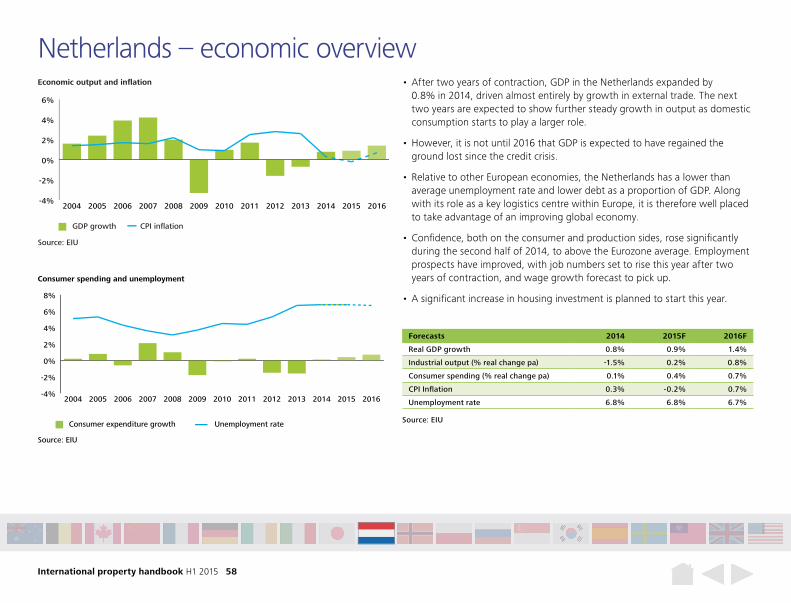
International property handbook H1 2015 58
Forecasts 2014 2015F 2016F
Real GDP growth 0.8% 0.9% 1.4%
Industrial output (% real change pa) -1.5% 0.2% 0.8%
Consumer spending (% real change pa) 0.1% 0.4% 0.7%
CPI Inflation 0.3% -0.2% 0.7%
Unemployment rate 6.8% 6.8% 6.7%
Source: EIU
GDP growth CPI inflation
Economic output and inflation
-4%
-2%
0%
2%
4%
6%
2016201520142013201220112010200920082007200620052004
-4%
-2%
0%
2%
4%
6%
8%
2016201520142013201220112010200920082007200620052004
Source: EIU
Consumer expenditure growth
Consumer spending and unemployment
Unemployment rate Source: EIU
• After two years of contraction, GDP in the Netherlands expanded by 0.8% in 2014, driven almost entirely by growth in external trade. The next two years are expected to show further steady growth in output as domestic consumption starts to play a larger role.
• However, it is not until 2016 that GDP is expected to have regained the ground lost since the credit crisis.
• Relative to other European economies, the Netherlands has a lower than average unemployment rate and lower debt as a proportion of GDP. Along with its role as a key logistics centre within Europe, it is therefore well placed to take advantage of an improving global economy.
• Confidence, both on the consumer and production sides, rose significantly during the second half of 2014, to above the Eurozone average. Employment prospects have improved, with job numbers set to rise this year after two years of contraction, and wage growth forecast to pick up.
• A significant increase in housing investment is planned to start this year.
Netherlands – economic overview
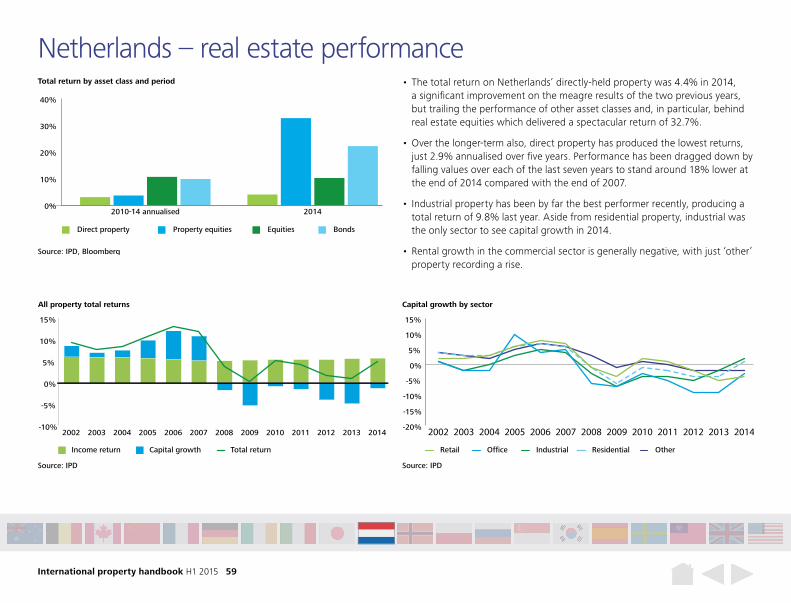
International property handbook H1 2015 59
Netherlands – real estate performance • The total return on Netherlands’ directly-held property was 4.4% in 2014,
a significant improvement on the meagre results of the two previous years, but trailing the performance of other asset classes and, in particular, behind real estate equities which delivered a spectacular return of 32.7%.
• Over the longer-term also, direct property has produced the lowest returns, just 2.9% annualised over five years. Performance has been dragged down by falling values over each of the last seven years to stand around 18% lower at the end of 2014 compared with the end of 2007.
• Industrial property has been by far the best performer recently, producing a total return of 9.8% last year. Aside from residential property, industrial was the only sector to see capital growth in 2014.
• Rental growth in the commercial sector is generally negative, with just ‘other’ property recording a rise.
-10%
-5%
0%
5%
10%
15%
2014201320122011201020092008200720062005200420032002
Source: IPD
Income return Capital growth Total return
All property total returns
-20%
-15%
-10%
-5%
0%
5%
10%
15%
2014201320122011201020092008200720062005200420032002
Source: IPD
OfficeRetail Industrial OtherResidential
Capital growth by sector
Total return by asset class and period
Source: IPD, Bloomberg
Direct property Property equities Equities Bonds
0%
10%
20%
30%
40%
20142010-14 annualised
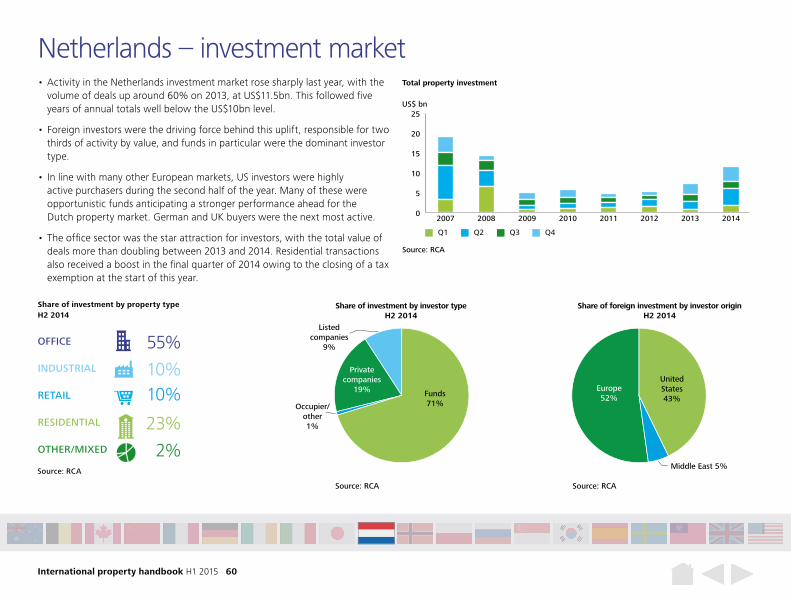
International property handbook H1 2015 60
Share of investment by property type H2 2014
Source: RCA
OFFICE 55%INDUSTRIAL 10%RETAIL 10%RESIDENTIAL 23%OTHER/MIXED 2%
Occupier/other1%
Share of investment by investor type H2 2014
Source: RCA
Listed companies
9%
Funds71%
Private companies
19%
Share of foreign investment by investor originH2 2014
Source: RCA
Europe52%
Middle East 5%
United States43%
• Activity in the Netherlands investment market rose sharply last year, with the volume of deals up around 60% on 2013, at US$11.5bn. This followed five years of annual totals well below the US$10bn level.
• Foreign investors were the driving force behind this uplift, responsible for two thirds of activity by value, and funds in particular were the dominant investor type.
• In line with many other European markets, US investors were highly active purchasers during the second half of the year. Many of these were opportunistic funds anticipating a stronger performance ahead for the Dutch property market. German and UK buyers were the next most active.
• The office sector was the star attraction for investors, with the total value of deals more than doubling between 2013 and 2014. Residential transactions also received a boost in the final quarter of 2014 owing to the closing of a tax exemption at the start of this year.
Netherlands – investment market
0
5
10
15
20
25
20142013201220112010200920082007
Source: RCA
Total property investment
US$ bn
Q1 Q2 Q3 Q4
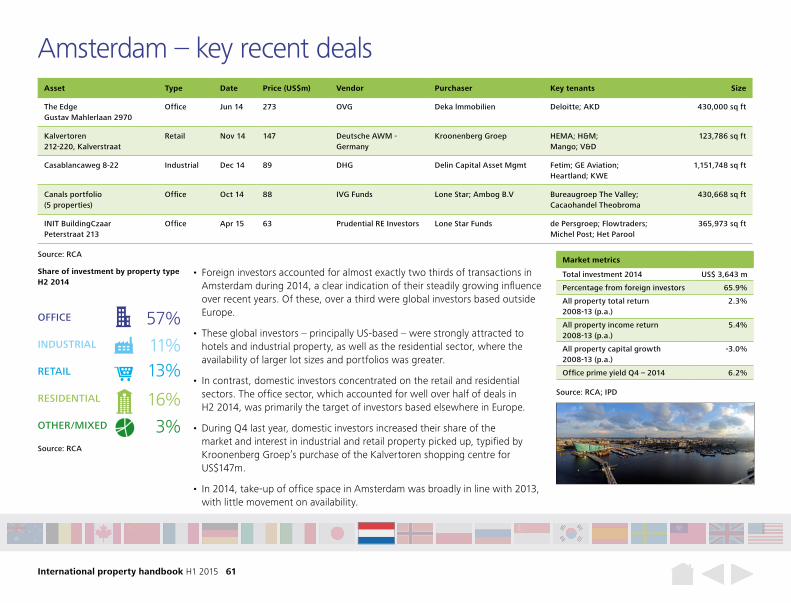
International property handbook H1 2015 61
Amsterdam – key recent deals
Source: RCA
Asset Type Date Price (US$m) Vendor Purchaser Key tenants Size
The Edge Gustav Mahlerlaan 2970
Office Jun 14 273 OVG Deka lmmobilien Deloitte; AKD 430,000 sq ft
Kalvertoren 212-220, Kalverstraat
Retail Nov 14 147 Deutsche AWM - Germany
Kroonenberg Groep HEMA; H&M; Mango; V&D
123,786 sq ft
Casablancaweg 8-22 Industrial Dec 14 89 DHG Delin Capital Asset Mgmt Fetim; GE Aviation; Heartland; KWE
1,151,748 sq ft
Canals portfolio (5 properties)
Office Oct 14 88 IVG Funds Lone Star; Ambog B.V Bureaugroep The Valley; Cacaohandel Theobroma
430,668 sq ft
INIT BuildingCzaar Peterstraat 213
Office Apr 15 63 Prudential RE Investors Lone Star Funds de Persgroep; Flowtraders; Michel Post; Het Parool
365,973 sq ft
• Foreign investors accounted for almost exactly two thirds of transactions in Amsterdam during 2014, a clear indication of their steadily growing influence over recent years. Of these, over a third were global investors based outside Europe.
• These global investors – principally US-based – were strongly attracted to hotels and industrial property, as well as the residential sector, where the availability of larger lot sizes and portfolios was greater.
• In contrast, domestic investors concentrated on the retail and residential sectors. The office sector, which accounted for well over half of deals in H2 2014, was primarily the target of investors based elsewhere in Europe.
• During Q4 last year, domestic investors increased their share of the market and interest in industrial and retail property picked up, typified by Kroonenberg Groep’s purchase of the Kalvertoren shopping centre for US$147m.
• In 2014, take-up of office space in Amsterdam was broadly in line with 2013, with little movement on availability.
Share of investment by property type H2 2014
Source: RCA
Source: RCA; IPD
OFFICE 57%INDUSTRIAL 11%RETAIL 13%RESIDENTIAL 16%OTHER/MIXED 3%
Market metrics
Total investment 2014 US$ 3,643 m
Percentage from foreign investors 65.9%
All property total return 2008-13 (p.a.)
2.3%
All property income return 2008-13 (p.a.)
5.4%
All property capital growth 2008-13 (p.a.)
-3.0%
Office prime yield Q4 – 2014 6.2%
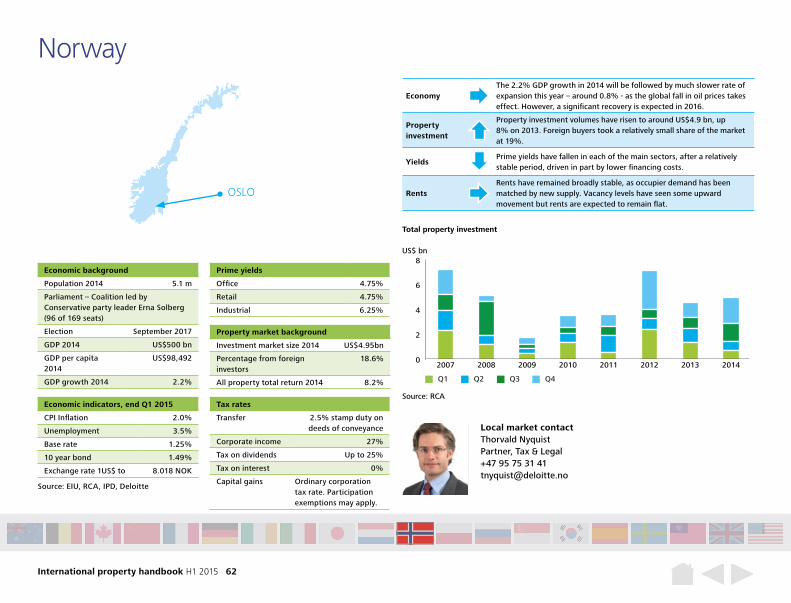
International property handbook H1 2015 62
EconomyThe 2.2% GDP growth in 2014 will be followed by much slower rate of expansion this year – around 0.8% - as the global fall in oil prices takes effect. However, a significant recovery is expected in 2016.
Property investment
Property investment volumes have risen to around US$4.9 bn, up 8% on 2013. Foreign buyers took a relatively small share of the market at 19%.
YieldsPrime yields have fallen in each of the main sectors, after a relatively stable period, driven in part by lower financing costs.
RentsRents have remained broadly stable, as occupier demand has been matched by new supply. Vacancy levels have seen some upward movement but rents are expected to remain flat.
Norway
Economic background
Population 2014 5.1 m
Parliament – Coalition led by Conservative party leader Erna Solberg (96 of 169 seats)
Election September 2017
GDP 2014 US$500 bn
GDP per capita 2014
US$98,492
GDP growth 2014 2.2%
Prime yields
Office 4.75%
Retail 4.75%
Industrial 6.25%
Economic indicators, end Q1 2015
CPI Inflation 2.0%
Unemployment 3.5%
Base rate 1.25%
10 year bond 1.49%
Exchange rate 1US$ to 8.018 NOK
Local market contactThorvald Nyquist Partner, Tax & Legal +47 95 75 31 41 [email protected]
Property market background
Investment market size 2014 US$4.95bn
Percentage from foreign investors
18.6%
All property total return 2014 8.2%
Source: EIU, RCA, IPD, Deloitte
OSLO
Tax rates
Transfer 2.5% stamp duty on deeds of conveyance
Corporate income 27%
Tax on dividends Up to 25%
Tax on interest 0%
Capital gains Ordinary corporation tax rate. Participation exemptions may apply.
0
2
4
6
8
20142013201220112010200920082007
Source: RCA
Total property investment
US$ bn
Q1 Q2 Q3 Q4
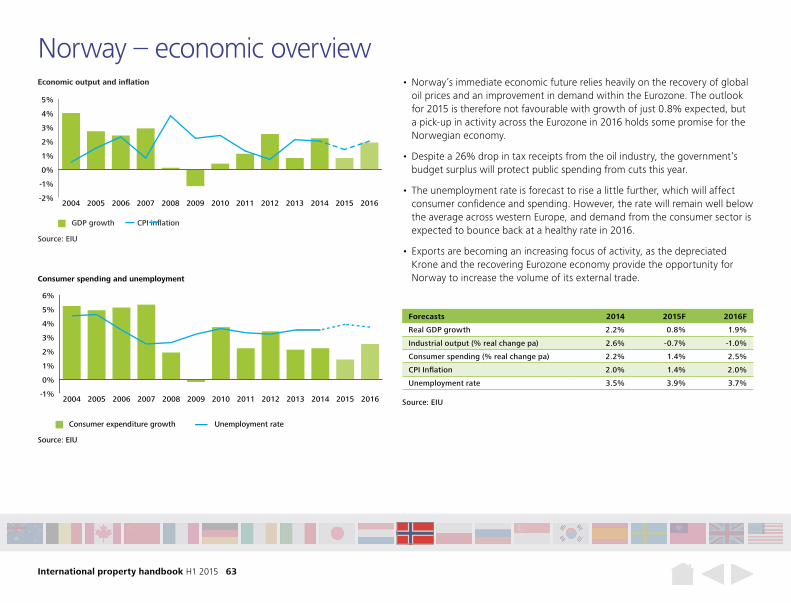
International property handbook H1 2015 63
Forecasts 2014 2015F 2016F
Real GDP growth 2.2% 0.8% 1.9%
Industrial output (% real change pa) 2.6% -0.7% -1.0%
Consumer spending (% real change pa) 2.2% 1.4% 2.5%
CPI Inflation 2.0% 1.4% 2.0%
Unemployment rate 3.5% 3.9% 3.7%
Source: EIU
GDP growth CPI inflation
Economic output and inflation
-2%
-1%
0%
1%
2%
3%
4%
5%
2016201520142013201220112010200920082007200620052004
-1%
0%
1%
2%
3%
4%
5%
6%
2016201520142013201220112010200920082007200620052004
Source: EIU
Consumer expenditure growth
Consumer spending and unemployment
Unemployment rate
Source: EIU
• Norway’s immediate economic future relies heavily on the recovery of global oil prices and an improvement in demand within the Eurozone. The outlook for 2015 is therefore not favourable with growth of just 0.8% expected, but a pick-up in activity across the Eurozone in 2016 holds some promise for the Norwegian economy.
• Despite a 26% drop in tax receipts from the oil industry, the government’s budget surplus will protect public spending from cuts this year.
• The unemployment rate is forecast to rise a little further, which will affect consumer confidence and spending. However, the rate will remain well below the average across western Europe, and demand from the consumer sector is expected to bounce back at a healthy rate in 2016.
• Exports are becoming an increasing focus of activity, as the depreciated Krone and the recovering Eurozone economy provide the opportunity for Norway to increase the volume of its external trade.
Norway – economic overview
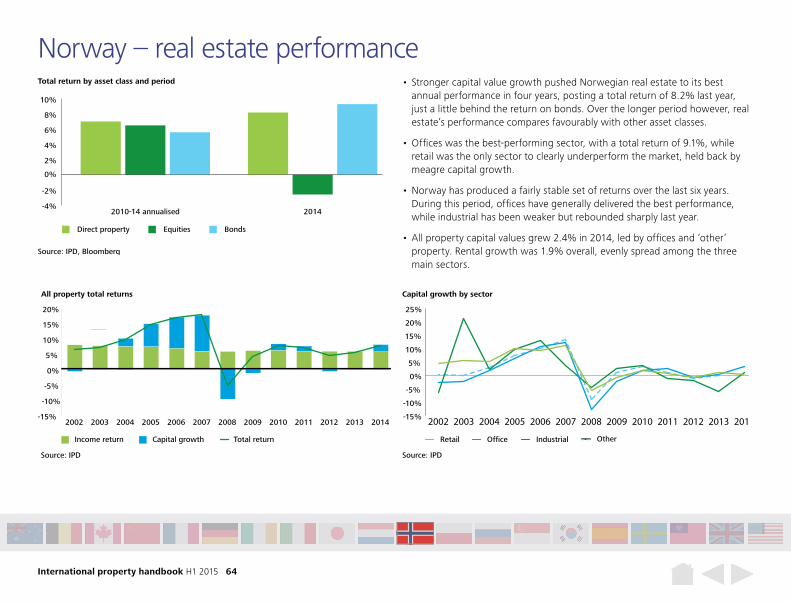
International property handbook H1 2015 64
Norway – real estate performance • Stronger capital value growth pushed Norwegian real estate to its best
annual performance in four years, posting a total return of 8.2% last year, just a little behind the return on bonds. Over the longer period however, real estate’s performance compares favourably with other asset classes.
• Offices was the best-performing sector, with a total return of 9.1%, while retail was the only sector to clearly underperform the market, held back by meagre capital growth.
• Norway has produced a fairly stable set of returns over the last six years. During this period, offices have generally delivered the best performance, while industrial has been weaker but rebounded sharply last year.
• All property capital values grew 2.4% in 2014, led by offices and ‘other’ property. Rental growth was 1.9% overall, evenly spread among the three main sectors.
-15%
-10%
-5%
0%
5%
10%
15%
20%
2014201320122011201020092008200720062005200420032002
Source: IPD
Income return Capital growth Total return
All property total returns
-15%
-10%
-5%
0%
5%
10%
15%
20%
25%
2014201320122011201020092008200720062005200420032002
Source: IPD
OfficeRetail Industrial Other
Capital growth by sector
Total return by asset class and period
Source: IPD, Bloomberg
Direct property Equities Bonds
-4%
-2%
0%
2%
4%
6%
8%
10%
20142010-14 annualised
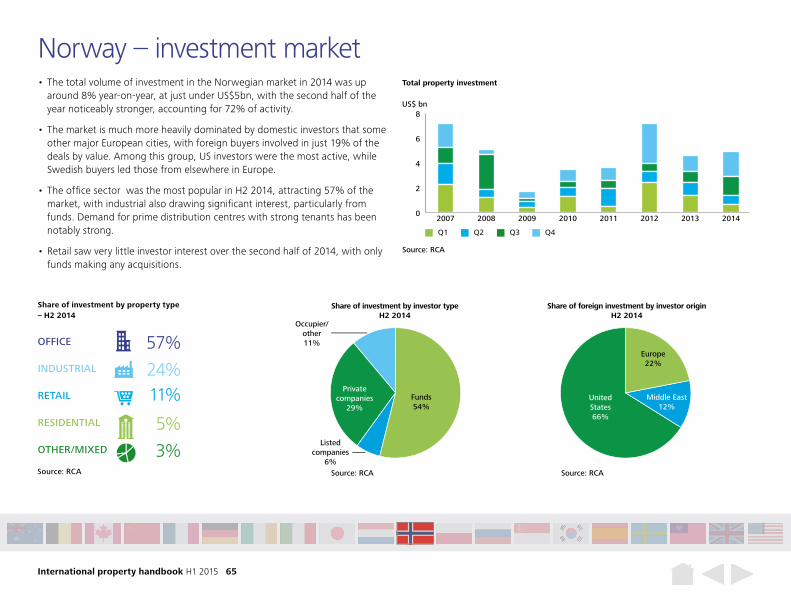
International property handbook H1 2015 65
Share of investment by property type – H2 2014
Source: RCA
OFFICE 57%INDUSTRIAL 24%RETAIL 11%RESIDENTIAL 5%OTHER/MIXED 3%
Occupier/other11%
Share of investment by investor typeH2 2014
Source: RCA
Listed companies
6%
Funds54%
Private companies
29%
Share of foreign investment by investor originH2 2014
Source: RCA
United States66%
Europe22%
Middle East12%
• The total volume of investment in the Norwegian market in 2014 was up around 8% year-on-year, at just under US$5bn, with the second half of the year noticeably stronger, accounting for 72% of activity.
• The market is much more heavily dominated by domestic investors that some other major European cities, with foreign buyers involved in just 19% of the deals by value. Among this group, US investors were the most active, while Swedish buyers led those from elsewhere in Europe.
• The office sector was the most popular in H2 2014, attracting 57% of the market, with industrial also drawing significant interest, particularly from funds. Demand for prime distribution centres with strong tenants has been notably strong.
• Retail saw very little investor interest over the second half of 2014, with only funds making any acquisitions.
Norway – investment market
0
2
4
6
8
20142013201220112010200920082007
Source: RCA
Total property investment
US$ bn
Q1 Q2 Q3 Q4
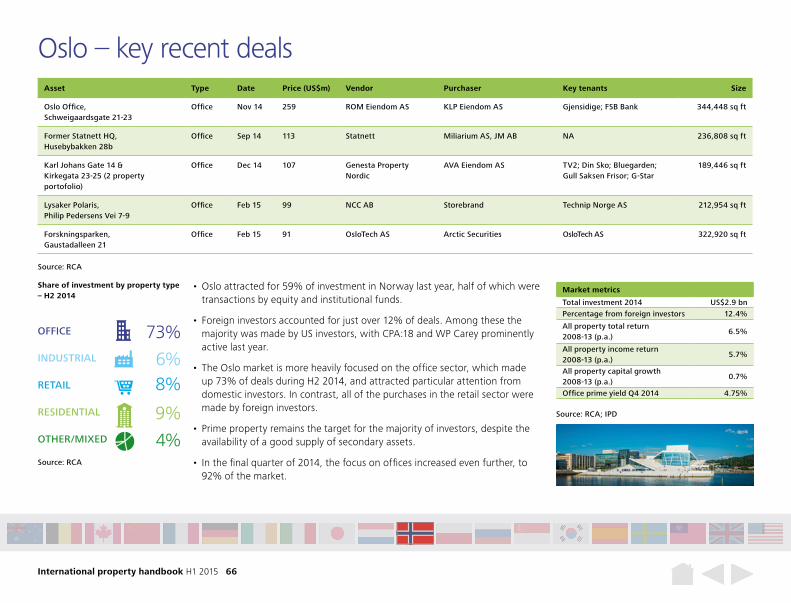
International property handbook H1 2015 66
Oslo – key recent deals
Source: RCA
Asset Type Date Price (US$m) Vendor Purchaser Key tenants Size
Oslo Office, Schweigaardsgate 21-23
Office Nov 14 259 ROM Eiendom AS KLP Eiendom AS Gjensidige; FSB Bank 344,448 sq ft
Former Statnett HQ, Husebybakken 28b
Office Sep 14 113 Statnett Miliarium AS, JM AB NA 236,808 sq ft
Karl Johans Gate 14 & Kirkegata 23-25 (2 property portofolio)
Office Dec 14 107 Genesta Property Nordic
AVA Eiendom AS TV2; Din Sko; Bluegarden; Gull Saksen Frisor; G-Star
189,446 sq ft
Lysaker Polaris, Philip Pedersens Vei 7-9
Office Feb 15 99 NCC AB Storebrand Technip Norge AS 212,954 sq ft
Forskningsparken, Gaustadalleen 21
Office Feb 15 91 OsloTech AS Arctic Securities OsloTech AS 322,920 sq ft
Source: RCA; IPD
Market metrics
Total investment 2014 US$2.9 bnPercentage from foreign investors 12.4%
All property total return 2008-13 (p.a.)
6.5%
All property income return 2008-13 (p.a.)
5.7%
All property capital growth 2008-13 (p.a.)
0.7%
Office prime yield Q4 2014 4.75%
• Oslo attracted for 59% of investment in Norway last year, half of which were transactions by equity and institutional funds.
• Foreign investors accounted for just over 12% of deals. Among these the majority was made by US investors, with CPA:18 and WP Carey prominently active last year.
• The Oslo market is more heavily focused on the office sector, which made up 73% of deals during H2 2014, and attracted particular attention from domestic investors. In contrast, all of the purchases in the retail sector were made by foreign investors.
• Prime property remains the target for the majority of investors, despite the availability of a good supply of secondary assets.
• In the final quarter of 2014, the focus on offices increased even further, to 92% of the market.
Share of investment by property type – H2 2014
Source: RCA
OFFICE 73%INDUSTRIAL 6%RETAIL 8%RESIDENTIAL 9%OTHER/MIXED 4%
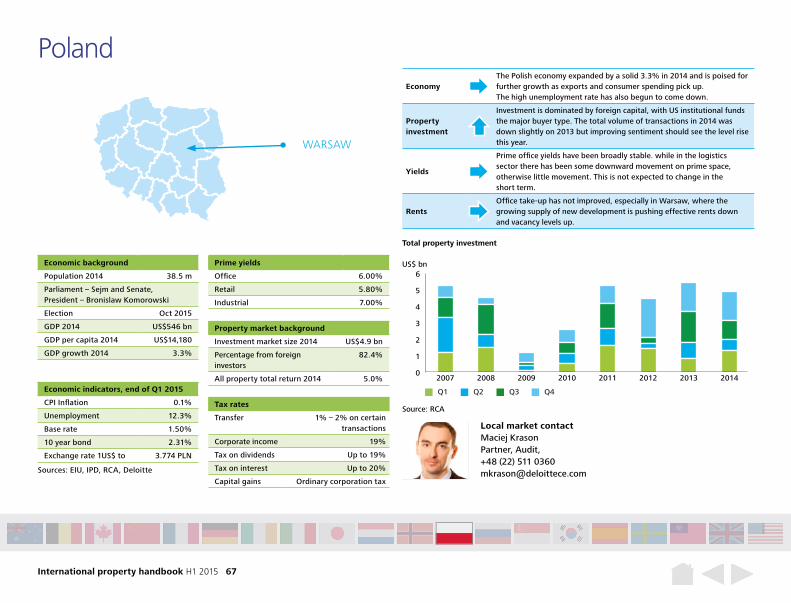
International property handbook H1 2015 67
Poland
Economic background
Population 2014 38.5 m
Parliament – Sejm and Senate, President – Bronislaw Komorowski
Election Oct 2015
GDP 2014 US$546 bn
GDP per capita 2014 US$14,180
GDP growth 2014 3.3%
Property market background
Investment market size 2014 US$4.9 bn
Percentage from foreign investors
82.4%
All property total return 2014 5.0%
Prime yields
Office 6.00%
Retail 5.80%
Industrial 7.00%
Tax rates
Transfer 1% – 2% on certain transactions
Corporate income 19%
Tax on dividends Up to 19%
Tax on interest Up to 20%
Capital gains Ordinary corporation tax
Economic indicators, end of Q1 2015
CPI Inflation 0.1%
Unemployment 12.3%
Base rate 1.50%
10 year bond 2.31%
Exchange rate 1US$ to 3.774 PLN
Local market contactMaciej KrasonPartner, Audit, +48 (22) 511 [email protected]
0
1
2
3
4
5
6
20142013201220112010200920082007
Source: RCA
Total property investment
US$ bn
Q1 Q2 Q3 Q4
WARSAW
EconomyThe Polish economy expanded by a solid 3.3% in 2014 and is poised for further growth as exports and consumer spending pick up. The high unemployment rate has also begun to come down.
Property investment
Investment is dominated by foreign capital, with US institutional funds the major buyer type. The total volume of transactions in 2014 was down slightly on 2013 but improving sentiment should see the level rise this year.
Yields
Prime office yields have been broadly stable. while in the logistics sector there has been some downward movement on prime space, otherwise little movement. This is not expected to change in the short term.
RentsOffice take-up has not improved, especially in Warsaw, where the growing supply of new development is pushing effective rents down and vacancy levels up.
Sources: EIU, IPD, RCA, Deloitte
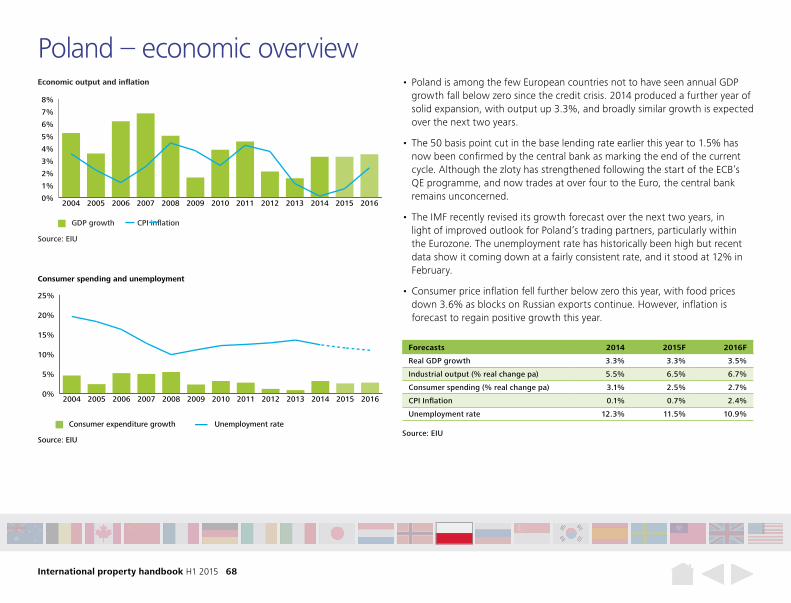
International property handbook H1 2015 68
Forecasts 2014 2015F 2016F
Real GDP growth 3.3% 3.3% 3.5%
Industrial output (% real change pa) 5.5% 6.5% 6.7%
Consumer spending (% real change pa) 3.1% 2.5% 2.7%
CPI Inflation 0.1% 0.7% 2.4%
Unemployment rate 12.3% 11.5% 10.9%
Source: EIU
GDP growth CPI inflation
Economic output and inflation
0%
1%
2%
3%
4%
5%
6%
7%
8%
2016201520142013201220112010200920082007200620052004
0%
5%
10%
15%
20%
25%
2016201520142013201220112010200920082007200620052004
Source: EIU
Consumer expenditure growth
Consumer spending and unemployment
Unemployment rateSource: EIU
• Poland is among the few European countries not to have seen annual GDP growth fall below zero since the credit crisis. 2014 produced a further year of solid expansion, with output up 3.3%, and broadly similar growth is expected over the next two years.
• The 50 basis point cut in the base lending rate earlier this year to 1.5% has now been confirmed by the central bank as marking the end of the current cycle. Although the zloty has strengthened following the start of the ECB’s QE programme, and now trades at over four to the Euro, the central bank remains unconcerned.
• The IMF recently revised its growth forecast over the next two years, in light of improved outlook for Poland’s trading partners, particularly within the Eurozone. The unemployment rate has historically been high but recent data show it coming down at a fairly consistent rate, and it stood at 12% in February.
• Consumer price inflation fell further below zero this year, with food prices down 3.6% as blocks on Russian exports continue. However, inflation is forecast to regain positive growth this year.
Poland – economic overview
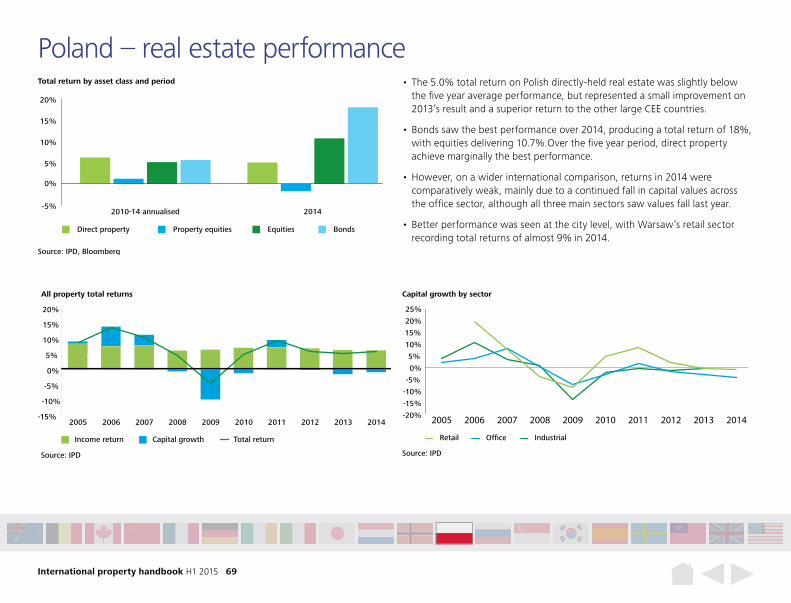
International property handbook H1 2015 69
Poland – real estate performance • The 5.0% total return on Polish directly-held real estate was slightly below
the five year average performance, but represented a small improvement on 2013’s result and a superior return to the other large CEE countries.
• Bonds saw the best performance over 2014, producing a total return of 18%, with equities delivering 10.7%.Over the five year period, direct property achieve marginally the best performance.
• However, on a wider international comparison, returns in 2014 were comparatively weak, mainly due to a continued fall in capital values across the office sector, although all three main sectors saw values fall last year.
• Better performance was seen at the city level, with Warsaw’s retail sector recording total returns of almost 9% in 2014.
-15%
-10%
-5%
0%
5%
10%
15%
20%
2014201320122011201020092008200720062005
Source: IPD
Income return Capital growth Total return
All property total returns
-20%
-15%
-10%
-5%
0%
5%
10%
15%
20%
25%
2014201320122011201020092008200720062005
Source: IPD
OfficeRetail Industrial
Capital growth by sector
Total return by asset class and period
Source: IPD, Bloomberg
Direct property Property equities Equities Bonds
-5%
0%
5%
10%
15%
20%
20142010-14 annualised
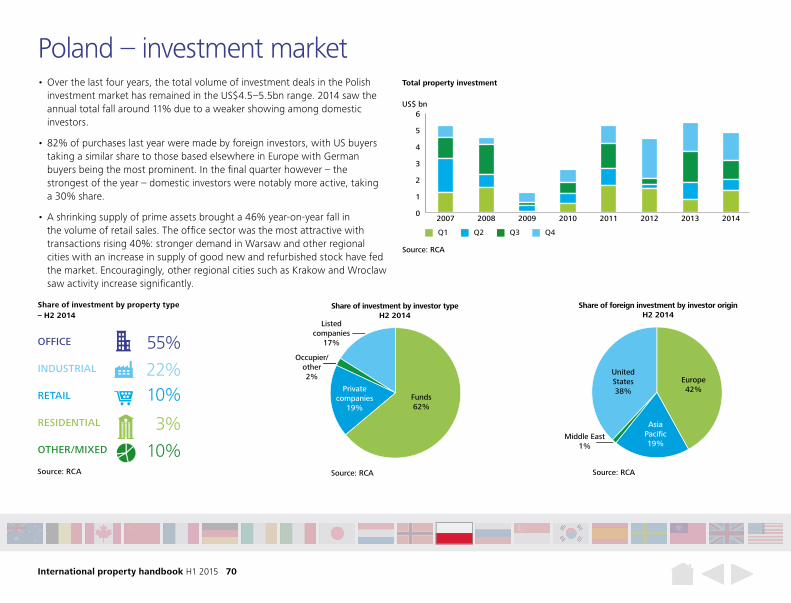
International property handbook H1 2015 70
Share of investment by property type – H2 2014
Source: RCA
OFFICE 55%INDUSTRIAL 22%RETAIL 10%RESIDENTIAL 3%OTHER/MIXED 10%
Occupier/other2%
Share of investment by investor typeH2 2014
Source: RCA
Listed companies
17%
Funds62%
Private companies
19%
Share of foreign investment by investor originH2 2014
Source: RCA
Asia Pacific19%
United States38%
Europe42%
Middle East1%
Occupier/other2%
Share of investment by investor typeH2 2014
Source: RCA
Listed companies
17%
Funds62%
Private companies
19%
Share of foreign investment by investor originH2 2014
Source: RCA
Asia Pacific19%
United States38%
Europe42%
Middle East1%
• Over the last four years, the total volume of investment deals in the Polish investment market has remained in the US$4.5–5.5bn range. 2014 saw the annual total fall around 11% due to a weaker showing among domestic investors.
• 82% of purchases last year were made by foreign investors, with US buyers taking a similar share to those based elsewhere in Europe with German buyers being the most prominent. In the final quarter however – the strongest of the year – domestic investors were notably more active, taking a 30% share.
• A shrinking supply of prime assets brought a 46% year-on-year fall in the volume of retail sales. The office sector was the most attractive with transactions rising 40%: stronger demand in Warsaw and other regional cities with an increase in supply of good new and refurbished stock have fed the market. Encouragingly, other regional cities such as Krakow and Wroclaw saw activity increase significantly.
Poland – investment market
0
1
2
3
4
5
6
20142013201220112010200920082007
Source: RCA
Total property investment
US$ bn
Q1 Q2 Q3 Q4
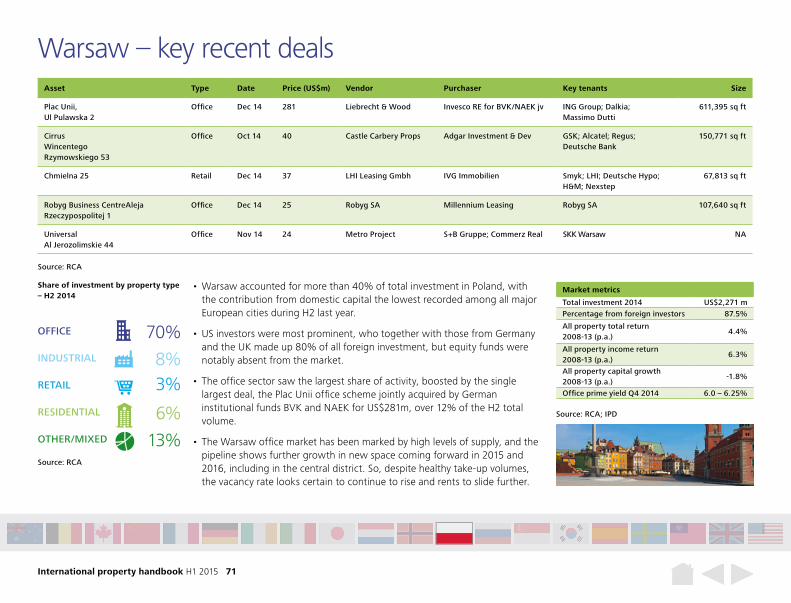
International property handbook H1 2015 71
Warsaw – key recent deals
Source: RCA
Asset Type Date Price (US$m) Vendor Purchaser Key tenants Size
Plac Unii, Ul Pulawska 2
Office Dec 14 281 Liebrecht & Wood Invesco RE for BVK/NAEK jv ING Group; Dalkia; Massimo Dutti
611,395 sq ft
Cirrus Wincentego Rzymowskiego 53
Office Oct 14 40 Castle Carbery Props Adgar Investment & Dev GSK; Alcatel; Regus; Deutsche Bank
150,771 sq ft
Chmielna 25 Retail Dec 14 37 LHI Leasing Gmbh IVG Immobilien Smyk; LHI; Deutsche Hypo; H&M; Nexstep
67,813 sq ft
Robyg Business CentreAleja Rzeczypospolitej 1
Office Dec 14 25 Robyg SA Millennium Leasing Robyg SA 107,640 sq ft
Universal Al Jerozolimskie 44
Office Nov 14 24 Metro Project S+B Gruppe; Commerz Real SKK Warsaw NA
Source: RCA; IPD
Market metrics
Total investment 2014 US$2,271 mPercentage from foreign investors 87.5%
All property total return 2008-13 (p.a.)
4.4%
All property income return 2008-13 (p.a.)
6.3%
All property capital growth 2008-13 (p.a.)
-1.8%
Office prime yield Q4 2014 6.0 – 6.25%
• Warsaw accounted for more than 40% of total investment in Poland, with the contribution from domestic capital the lowest recorded among all major European cities during H2 last year.
• US investors were most prominent, who together with those from Germany and the UK made up 80% of all foreign investment, but equity funds were notably absent from the market.
• The office sector saw the largest share of activity, boosted by the single largest deal, the Plac Unii office scheme jointly acquired by German institutional funds BVK and NAEK for US$281m, over 12% of the H2 total volume.
• The Warsaw office market has been marked by high levels of supply, and the pipeline shows further growth in new space coming forward in 2015 and 2016, including in the central district. So, despite healthy take-up volumes, the vacancy rate looks certain to continue to rise and rents to slide further.
Share of investment by property type – H2 2014
Source: RCA
OFFICE 70%INDUSTRIAL 8%RETAIL 3%RESIDENTIAL 6%OTHER/MIXED 13%
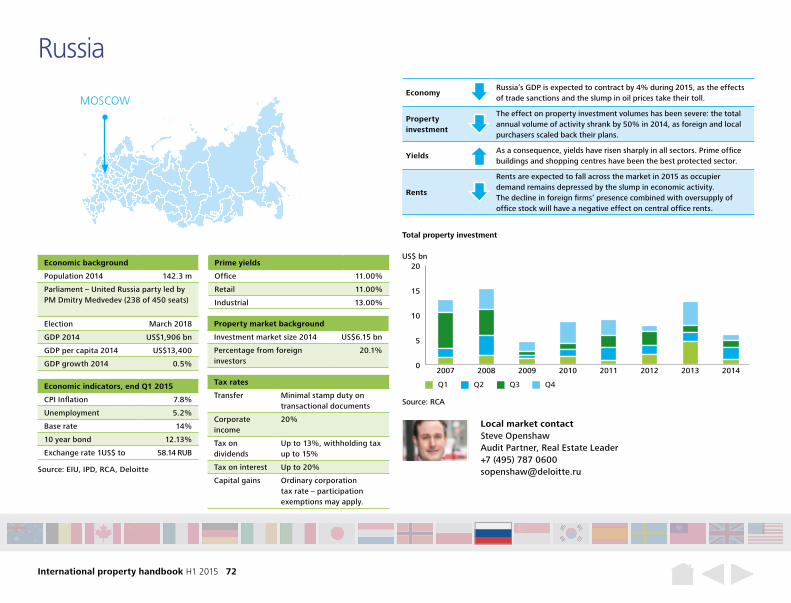
International property handbook H1 2015 72
EconomyRussia’s GDP is expected to contract by 4% during 2015, as the effects of trade sanctions and the slump in oil prices take their toll.
Property investment
The effect on property investment volumes has been severe: the total annual volume of activity shrank by 50% in 2014, as foreign and local purchasers scaled back their plans.
YieldsAs a consequence, yields have risen sharply in all sectors. Prime office buildings and shopping centres have been the best protected sector.
Rents
Rents are expected to fall across the market in 2015 as occupier demand remains depressed by the slump in economic activity. The decline in foreign firms’ presence combined with oversupply of office stock will have a negative effect on central office rents.
Russia
Economic background
Population 2014 142.3 m
Parliament – United Russia party led by PM Dmitry Medvedev (238 of 450 seats)
Election March 2018
GDP 2014 US$1,906 bn
GDP per capita 2014 US$13,400
GDP growth 2014 0.5%
Prime yields
Office 11.00%
Retail 11.00%
Industrial 13.00%
Property market background
Investment market size 2014 US$6.15 bn
Percentage from foreign investors
20.1%
Tax rates
Transfer Minimal stamp duty on transactional documents
Corporate income
20%
Tax on dividends
Up to 13%, withholding tax up to 15%
Tax on interest Up to 20%
Capital gains Ordinary corporation tax rate – participation exemptions may apply.
Local market contactSteve Openshaw Audit Partner, Real Estate Leader+7 (495) 787 [email protected]
0
5
10
15
20
20142013201220112010200920082007
Source: RCA
Total property investment
US$ bn
Q1 Q2 Q3 Q4Economic indicators, end Q1 2015
CPI Inflation 7.8%
Unemployment 5.2%
Base rate 14%
10 year bond 12.13%
Exchange rate 1US$ to 58.14 RUB
Source: EIU, IPD, RCA, Deloitte
MOSCOW
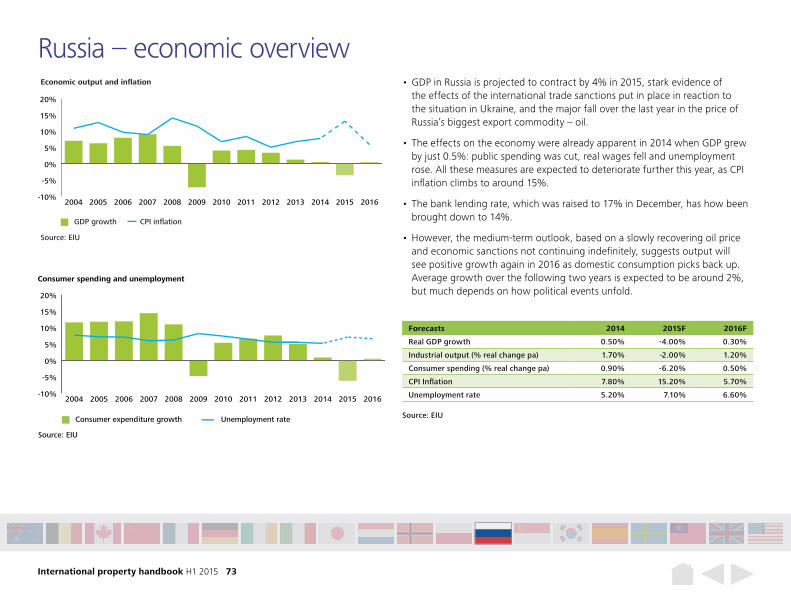
International property handbook H1 2015 73
Source: EIU
GDP growth CPI inflation
Economic output and inflation
-10%
-5%
0%
5%
10%
15%
20%
2016201520142013201220112010200920082007200620052004
-10%
-5%
0%
5%
10%
15%
20%
2016201520142013201220112010200920082007200620052004
Source: EIU
Consumer expenditure growth
Consumer spending and unemployment
Unemployment rate
Forecasts 2014 2015F 2016F
Real GDP growth 0.50% -4.00% 0.30%
Industrial output (% real change pa) 1.70% -2.00% 1.20%
Consumer spending (% real change pa) 0.90% -6.20% 0.50%
CPI Inflation 7.80% 15.20% 5.70%
Unemployment rate 5.20% 7.10% 6.60%
Source: EIU
• GDP in Russia is projected to contract by 4% in 2015, stark evidence of the effects of the international trade sanctions put in place in reaction to the situation in Ukraine, and the major fall over the last year in the price of Russia’s biggest export commodity – oil.
• The effects on the economy were already apparent in 2014 when GDP grew by just 0.5%: public spending was cut, real wages fell and unemployment rose. All these measures are expected to deteriorate further this year, as CPI inflation climbs to around 15%.
• The bank lending rate, which was raised to 17% in December, has how been brought down to 14%.
• However, the medium-term outlook, based on a slowly recovering oil price and economic sanctions not continuing indefinitely, suggests output will see positive growth again in 2016 as domestic consumption picks back up. Average growth over the following two years is expected to be around 2%, but much depends on how political events unfold.
Russia – economic overview
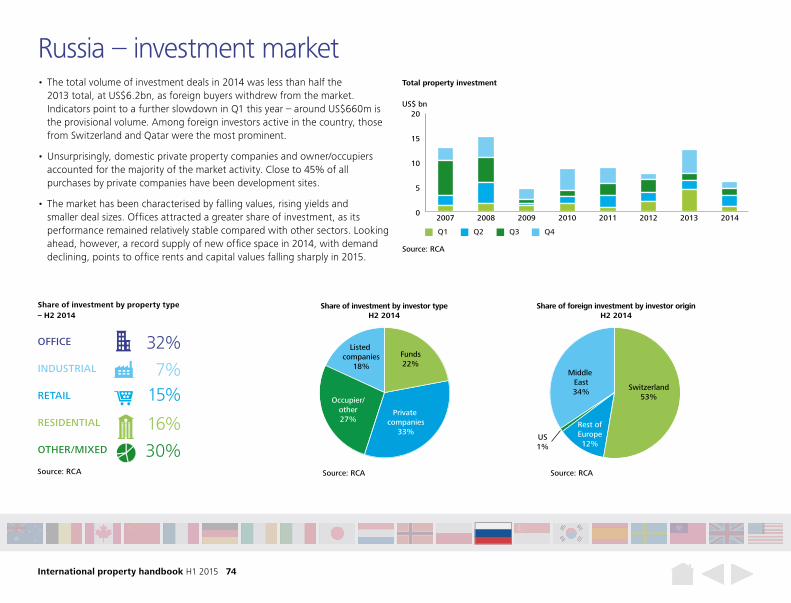
International property handbook H1 2015 74
Share of investment by property type – H2 2014
Source: RCA
OFFICE 32%INDUSTRIAL 7%RETAIL 15%RESIDENTIAL 16%OTHER/MIXED 30%
Occupier/other27%
Share of investment by investor typeH2 2014
Source: RCA
Listed companies
18%
Funds22%
Private companies
33%
Share of foreign investment by investor originH2 2014
Source: RCA
Rest of Europe12%
Middle East34% Switzerland
53%
US1%
• The total volume of investment deals in 2014 was less than half the 2013 total, at US$6.2bn, as foreign buyers withdrew from the market. Indicators point to a further slowdown in Q1 this year – around US$660m is the provisional volume. Among foreign investors active in the country, those from Switzerland and Qatar were the most prominent.
• Unsurprisingly, domestic private property companies and owner/occupiers accounted for the majority of the market activity. Close to 45% of all purchases by private companies have been development sites.
• The market has been characterised by falling values, rising yields and smaller deal sizes. Offices attracted a greater share of investment, as its performance remained relatively stable compared with other sectors. Looking ahead, however, a record supply of new office space in 2014, with demand declining, points to office rents and capital values falling sharply in 2015.
Russia – investment market
0
5
10
15
20
20142013201220112010200920082007
Source: RCA
Total property investment
US$ bn
Q1 Q2 Q3 Q4
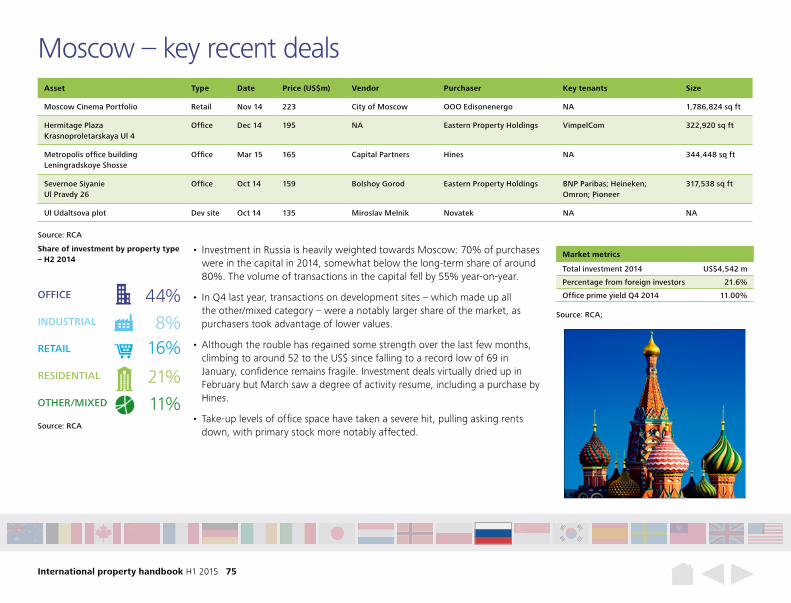
International property handbook H1 2015 75
Moscow – key recent deals
Source: RCA
Asset Type Date Price (US$m) Vendor Purchaser Key tenants Size
Moscow Cinema Portfolio Retail Nov 14 223 City of Moscow OOO Edisonenergo NA 1,786,824 sq ft
Hermitage Plaza Krasnoproletarskaya Ul 4
Office Dec 14 195 NA Eastern Property Holdings VimpelCom 322,920 sq ft
Metropolis office building Leningradskoye Shosse
Office Mar 15 165 Capital Partners Hines NA 344,448 sq ft
Severnoe Siyanie Ul Pravdy 26
Office Oct 14 159 Bolshoy Gorod Eastern Property Holdings BNP Paribas; Heineken; Omron; Pioneer
317,538 sq ft
Ul Udaltsova plot Dev site Oct 14 135 Miroslav Melnik Novatek NA NA
• Investment in Russia is heavily weighted towards Moscow: 70% of purchases were in the capital in 2014, somewhat below the long-term share of around 80%. The volume of transactions in the capital fell by 55% year-on-year.
• In Q4 last year, transactions on development sites – which made up all the other/mixed category – were a notably larger share of the market, as purchasers took advantage of lower values.
• Although the rouble has regained some strength over the last few months, climbing to around 52 to the US$ since falling to a record low of 69 in January, confidence remains fragile. Investment deals virtually dried up in February but March saw a degree of activity resume, including a purchase by Hines.
• Take-up levels of office space have taken a severe hit, pulling asking rents down, with primary stock more notably affected.
Share of investment by property type – H2 2014
Source: RCA
Source: RCA;
OFFICE 44%INDUSTRIAL 8%RETAIL 16%RESIDENTIAL 21%OTHER/MIXED 11%
Market metrics
Total investment 2014 US$4,542 m
Percentage from foreign investors 21.6%
Office prime yield Q4 2014 11.00%
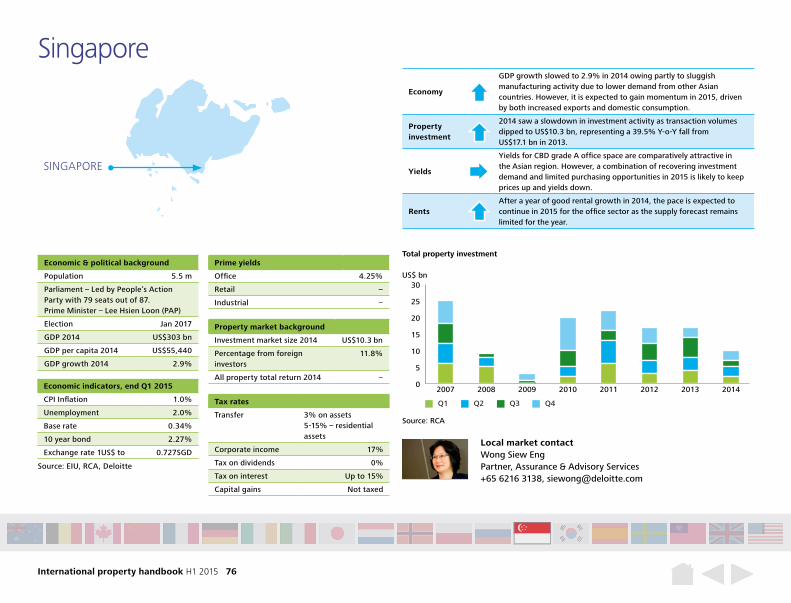
International property handbook H1 2015 76
Economy
GDP growth slowed to 2.9% in 2014 owing partly to sluggish manufacturing activity due to lower demand from other Asian countries. However, it is expected to gain momentum in 2015, driven by both increased exports and domestic consumption.
Property investment
2014 saw a slowdown in investment activity as transaction volumes dipped to US$10.3 bn, representing a 39.5% Y-o-Y fall from US$17.1 bn in 2013.
Yields
Yields for CBD grade A office space are comparatively attractive in the Asian region. However, a combination of recovering investment demand and limited purchasing opportunities in 2015 is likely to keep prices up and yields down.
RentsAfter a year of good rental growth in 2014, the pace is expected to continue in 2015 for the office sector as the supply forecast remains limited for the year.
Singapore
Economic & political background
Population 5.5 m
Parliament – Led by People’s Action Party with 79 seats out of 87. Prime Minister – Lee Hsien Loon (PAP)
Election Jan 2017
GDP 2014 US$303 bn
GDP per capita 2014 US$55,440
GDP growth 2014 2.9%
Prime yields
Office 4.25%
Retail –
Industrial –
Property market background
Investment market size 2014 US$10.3 bn
Percentage from foreign investors
11.8%
All property total return 2014 –Economic indicators, end Q1 2015
CPI Inflation 1.0%
Unemployment 2.0%
Base rate 0.34%
10 year bond 2.27%
Exchange rate 1US$ to 0.727SGDLocal market contactWong Siew EngPartner, Assurance & Advisory Services +65 6216 3138, [email protected]
0
5
10
15
20
25
30
20142013201220112010200920082007
Source: RCA
Total property investment
US$ bn
Q1 Q2 Q3 Q4Tax rates
Transfer 3% on assets5-15% – residential assets
Corporate income 17%
Tax on dividends 0%
Tax on interest Up to 15%
Capital gains Not taxed
Source: EIU, RCA, Deloitte
SINGAPORE
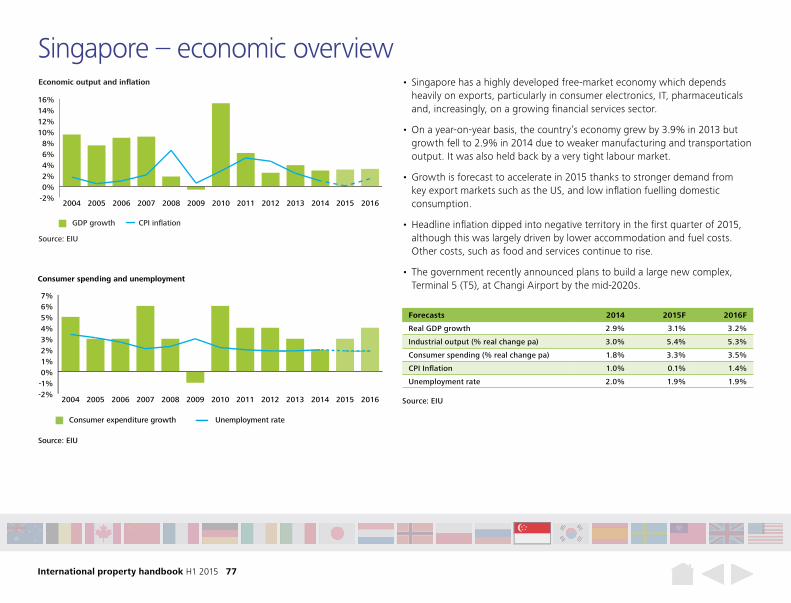
International property handbook H1 2015 77
Source: EIU
GDP growth CPI inflation
Economic output and inflation
-2%0%2%4%6%8%
10%12%14%16%
2016201520142013201220112010200920082007200620052004
-2%-1%0%1%2%3%4%5%6%7%
2016201520142013201220112010200920082007200620052004
Source: EIU
Consumer expenditure growth
Consumer spending and unemployment
Unemployment rate
Forecasts 2014 2015F 2016F
Real GDP growth 2.9% 3.1% 3.2%
Industrial output (% real change pa) 3.0% 5.4% 5.3%
Consumer spending (% real change pa) 1.8% 3.3% 3.5%
CPI Inflation 1.0% 0.1% 1.4%
Unemployment rate 2.0% 1.9% 1.9%
Source: EIU
• Singapore has a highly developed free-market economy which depends heavily on exports, particularly in consumer electronics, IT, pharmaceuticals and, increasingly, on a growing financial services sector.
• On a year-on-year basis, the country’s economy grew by 3.9% in 2013 but growth fell to 2.9% in 2014 due to weaker manufacturing and transportation output. It was also held back by a very tight labour market.
• Growth is forecast to accelerate in 2015 thanks to stronger demand from key export markets such as the US, and low inflation fuelling domestic consumption.
• Headline inflation dipped into negative territory in the first quarter of 2015, although this was largely driven by lower accommodation and fuel costs. Other costs, such as food and services continue to rise.
• The government recently announced plans to build a large new complex, Terminal 5 (T5), at Changi Airport by the mid-2020s.
Singapore – economic overview
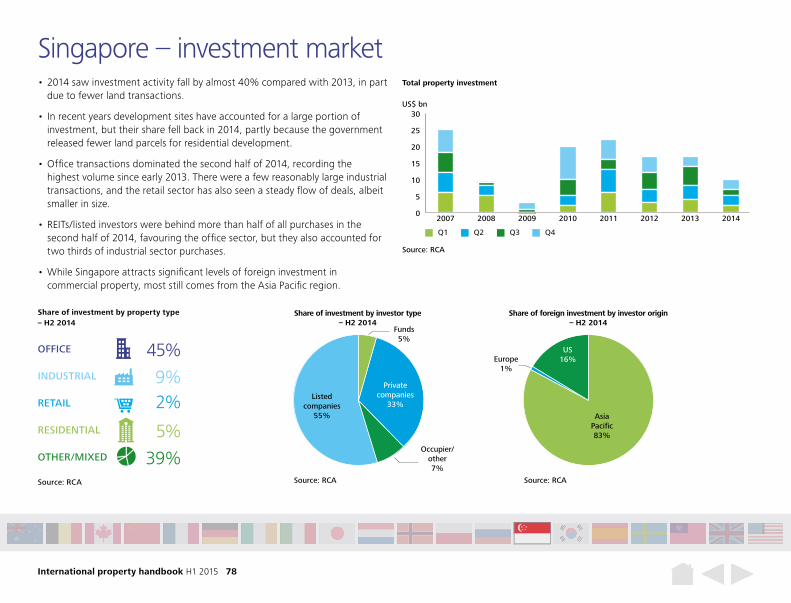
International property handbook H1 2015 78
• 2014 saw investment activity fall by almost 40% compared with 2013, in part due to fewer land transactions.
• In recent years development sites have accounted for a large portion of investment, but their share fell back in 2014, partly because the government released fewer land parcels for residential development.
• Office transactions dominated the second half of 2014, recording the highest volume since early 2013. There were a few reasonably large industrial transactions, and the retail sector has also seen a steady flow of deals, albeit smaller in size.
• REITs/listed investors were behind more than half of all purchases in the second half of 2014, favouring the office sector, but they also accounted for two thirds of industrial sector purchases.
• While Singapore attracts significant levels of foreign investment in commercial property, most still comes from the Asia Pacific region.
Singapore – investment market
Private companies
33%
Share of investment by investor type – H2 2014
Source: RCA
Listed companies
55%
Occupier/other7%
Funds5%
Share of foreign investment by investor origin – H2 2014
Source: RCA
US16%Europe
1%
Asia Pacific83%
Share of investment by property type – H2 2014
Source: RCA
OFFICE 45%INDUSTRIAL 9%RETAIL 2%RESIDENTIAL 5%OTHER/MIXED 39%
0
5
10
15
20
25
30
20142013201220112010200920082007
Source: RCA
Total property investment
US$ bn
Q1 Q2 Q3 Q4
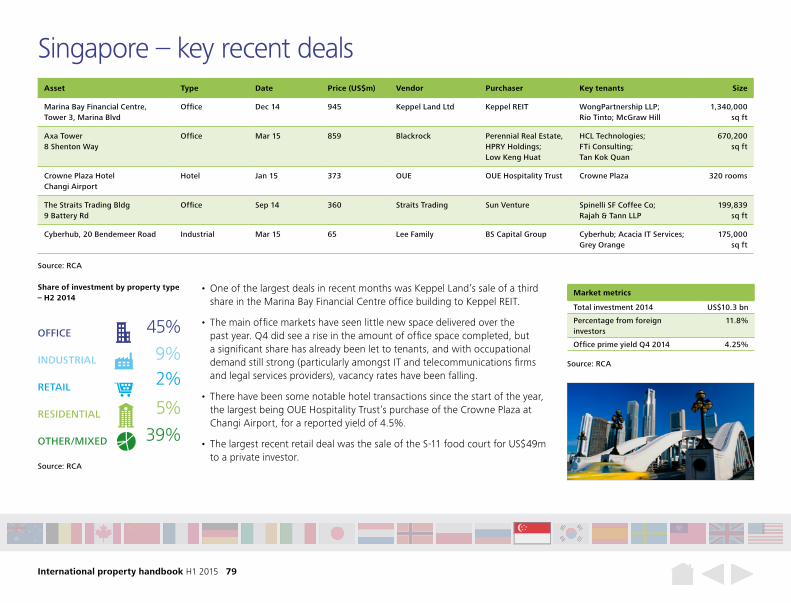
International property handbook H1 2015 79
Singapore – key recent deals
• One of the largest deals in recent months was Keppel Land’s sale of a third share in the Marina Bay Financial Centre office building to Keppel REIT.
• The main office markets have seen little new space delivered over the past year. Q4 did see a rise in the amount of office space completed, but a significant share has already been let to tenants, and with occupational demand still strong (particularly amongst IT and telecommunications firms and legal services providers), vacancy rates have been falling.
• There have been some notable hotel transactions since the start of the year, the largest being OUE Hospitality Trust’s purchase of the Crowne Plaza at Changi Airport, for a reported yield of 4.5%.
• The largest recent retail deal was the sale of the S-11 food court for US$49m to a private investor.
Source: RCA
45%
9%2%
5%
39%
Source: RCA
Market metrics
Total investment 2014 US$10.3 bn
Percentage from foreign investors
11.8%
Office prime yield Q4 2014 4.25%
Asset Type Date Price (US$m) Vendor Purchaser Key tenants Size
Marina Bay Financial Centre, Tower 3, Marina Blvd
Office Dec 14 945 Keppel Land Ltd Keppel REIT WongPartnership LLP; Rio Tinto; McGraw Hill
1,340,000 sq ft
Axa Tower8 Shenton Way
Office Mar 15 859 Blackrock Perennial Real Estate, HPRY Holdings;Low Keng Huat
HCL Technologies;FTi Consulting;Tan Kok Quan
670,200sq ft
Crowne Plaza Hotel Changi Airport
Hotel Jan 15 373 OUE OUE Hospitality Trust Crowne Plaza 320 rooms
The Straits Trading Bldg 9 Battery Rd
Office Sep 14 360 Straits Trading Sun Venture Spinelli SF Coffee Co; Rajah & Tann LLP
199,839 sq ft
Cyberhub, 20 Bendemeer Road Industrial Mar 15 65 Lee Family BS Capital Group Cyberhub; Acacia IT Services; Grey Orange
175,000 sq ft
Share of investment by property type– H2 2014
Source: RCA
OFFICE
INDUSTRIAL
RETAIL
RESIDENTIAL
OTHER/MIXED
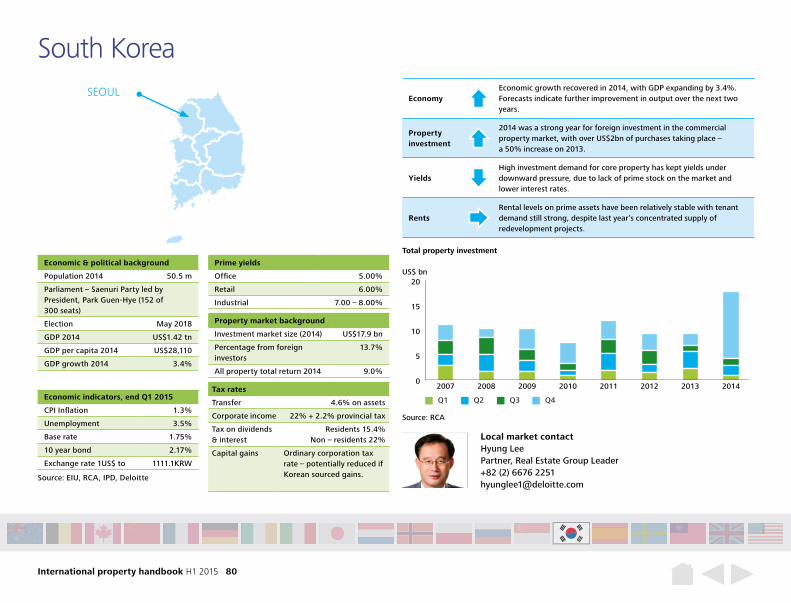
International property handbook H1 2015 80
EconomyEconomic growth recovered in 2014, with GDP expanding by 3.4%. Forecasts indicate further improvement in output over the next two years.
Property investment
2014 was a strong year for foreign investment in the commercial property market, with over US$2bn of purchases taking place – a 50% increase on 2013.
YieldsHigh investment demand for core property has kept yields under downward pressure, due to lack of prime stock on the market and lower interest rates.
RentsRental levels on prime assets have been relatively stable with tenant demand still strong, despite last year’s concentrated supply of redevelopment projects.
Economic & political background
Population 2014 50.5 m
Parliament – Saenuri Party led by President, Park Guen-Hye (152 of 300 seats)
Election May 2018
GDP 2014 US$1.42 tn
GDP per capita 2014 US$28,110
GDP growth 2014 3.4%
Prime yields
Office 5.00%
Retail 6.00%
Industrial 7.00 – 8.00%
Property market background
Investment market size (2014) US$17.9 bn
Percentage from foreign investors
13.7%
All property total return 2014 9.0%
Tax rates
Transfer 4.6% on assets
Corporate income 22% + 2.2% provincial tax
Tax on dividends & interest
Residents 15.4% Non – residents 22%
Capital gains Ordinary corporation tax rate – potentially reduced if Korean sourced gains.
Economic indicators, end Q1 2015
CPI Inflation 1.3%
Unemployment 3.5%
Base rate 1.75%
10 year bond 2.17%
Exchange rate 1US$ to 1111.1KRW
Local market contactHyung Lee Partner, Real Estate Group Leader +82 (2) 6676 2251 [email protected]
0
5
10
15
20
20142013201220112010200920082007
Source: RCA
Total property investment
US$ bn
Q1 Q2 Q3 Q4
Source: EIU, RCA, IPD, Deloitte
SEOUL
South Korea
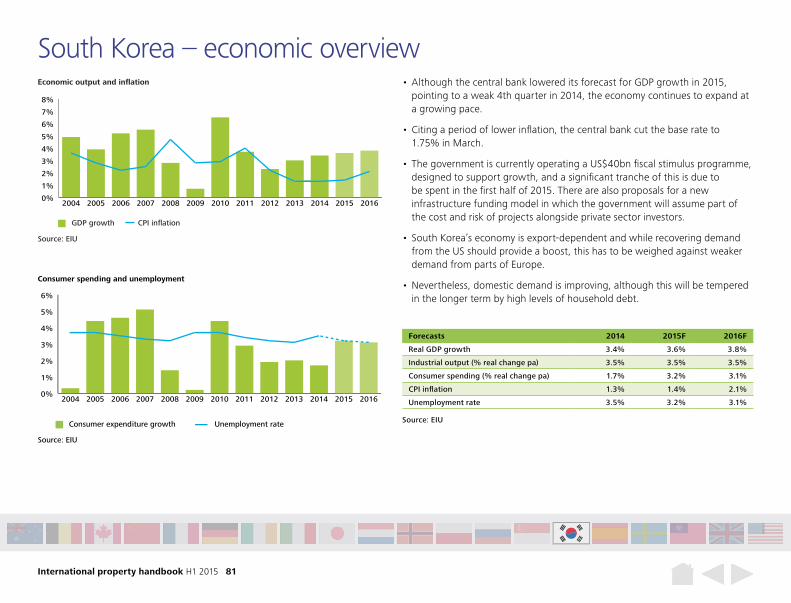
International property handbook H1 2015 81
Forecasts 2014 2015F 2016F
Real GDP growth 3.4% 3.6% 3.8%
Industrial output (% real change pa) 3.5% 3.5% 3.5%
Consumer spending (% real change pa) 1.7% 3.2% 3.1%
CPI inflation 1.3% 1.4% 2.1%
Unemployment rate 3.5% 3.2% 3.1%
Source: EIU
GDP growth CPI inflation
Economic output and inflation
0%
1%
2%
3%
4%
5%
6%
7%
8%
2016201520142013201220112010200920082007200620052004
0%
1%
2%
3%
4%
5%
6%
2016201520142013201220112010200920082007200620052004
Source: EIU
Consumer expenditure growth
Consumer spending and unemployment
Unemployment rate Source: EIU
• Although the central bank lowered its forecast for GDP growth in 2015, pointing to a weak 4th quarter in 2014, the economy continues to expand at a growing pace.
• Citing a period of lower inflation, the central bank cut the base rate to 1.75% in March.
• The government is currently operating a US$40bn fiscal stimulus programme, designed to support growth, and a significant tranche of this is due to be spent in the first half of 2015. There are also proposals for a new infrastructure funding model in which the government will assume part of the cost and risk of projects alongside private sector investors.
• South Korea’s economy is export-dependent and while recovering demand from the US should provide a boost, this has to be weighed against weaker demand from parts of Europe.
• Nevertheless, domestic demand is improving, although this will be tempered in the longer term by high levels of household debt.
South Korea – economic overview
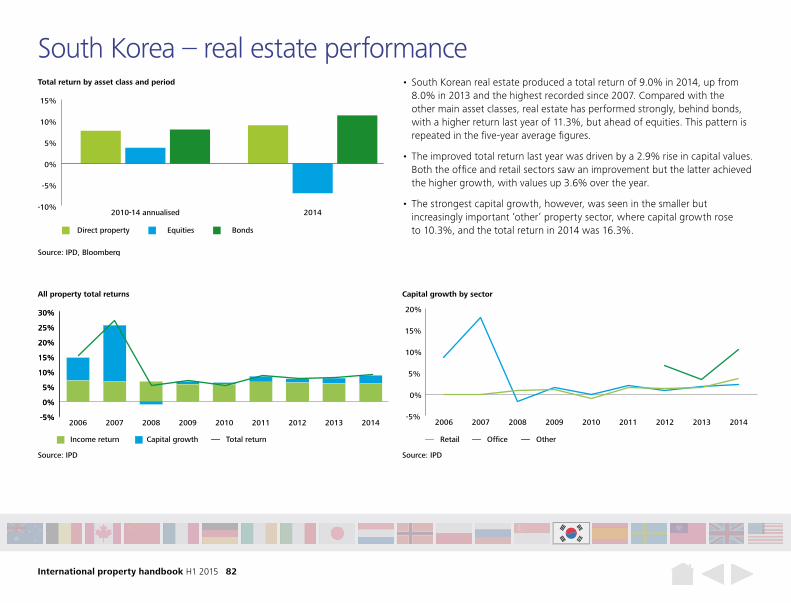
International property handbook H1 2015 82
South Korea – real estate performance • South Korean real estate produced a total return of 9.0% in 2014, up from
8.0% in 2013 and the highest recorded since 2007. Compared with the other main asset classes, real estate has performed strongly, behind bonds, with a higher return last year of 11.3%, but ahead of equities. This pattern is repeated in the five-year average figures.
• The improved total return last year was driven by a 2.9% rise in capital values. Both the office and retail sectors saw an improvement but the latter achieved the higher growth, with values up 3.6% over the year.
• The strongest capital growth, however, was seen in the smaller but increasingly important ‘other’ property sector, where capital growth rose to 10.3%, and the total return in 2014 was 16.3%.
-5%
0%
5%
10%
15%
20%
25%
30%
-5%
0%
5%
10%
15%
20%
25%
30%
201420132012201120102009200820072006
15.326.75.46.95.58.67.68.09.0
All property total returns
Source: IPD
Income return Capital growth Total return
-5%
0%
5%
10%
15%
20%
201420132012201120102009200820072006
Source: IPD
Capital growth by sector
OfficeRetail Other
Total return by asset class and period
Source: IPD, Bloomberg
Direct property Equities Bonds
-10%
-5%
0%
5%
10%
15%
20142010-14 annualised
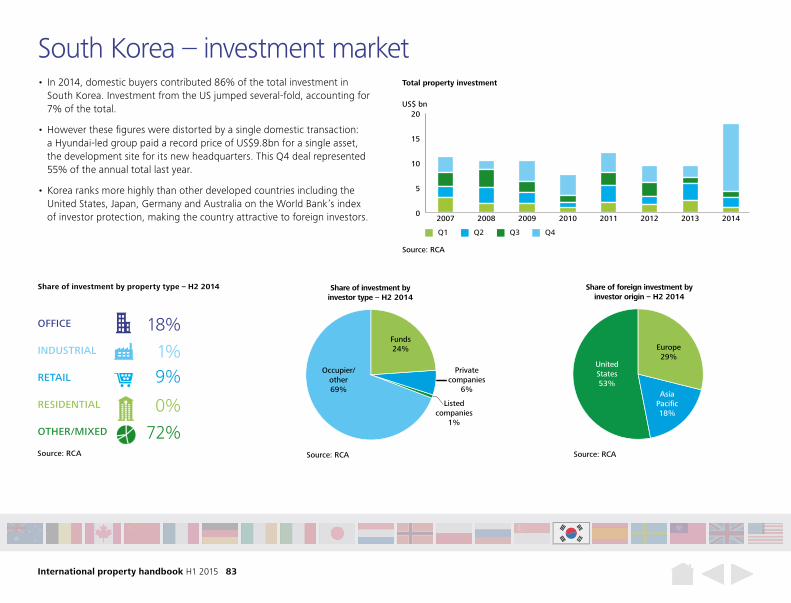
International property handbook H1 2015 83
Share of investment by property type – H2 2014
Source: RCA
OFFICE 18%INDUSTRIAL 1%RETAIL 9%RESIDENTIAL 0%OTHER/MIXED 72%
Occupier/other69%
Share of investment by investor type – H2 2014
Source: RCA
Listed companies
1%
Funds24%
Private companies
6%
Share of foreign investment by investor origin – H2 2014
Source: RCA
Europe29%
Asia Pacific18%
United States53%
Occupier/other69%
Share of investment by investor type – H2 2014
Source: RCA
Listed companies
1%
Funds24%
Private companies
6%
Share of foreign investment by investor origin – H2 2014
Source: RCA
Europe29%
Asia Pacific18%
United States53%
• In 2014, domestic buyers contributed 86% of the total investment in South Korea. Investment from the US jumped several-fold, accounting for 7% of the total.
• However these figures were distorted by a single domestic transaction: a Hyundai-led group paid a record price of US$9.8bn for a single asset, the development site for its new headquarters. This Q4 deal represented 55% of the annual total last year.
• Korea ranks more highly than other developed countries including the United States, Japan, Germany and Australia on the World Bank’s index of investor protection, making the country attractive to foreign investors.
South Korea – investment market
0
5
10
15
20
20142013201220112010200920082007
Source: RCA
Total property investment
US$ bn
Q1 Q2 Q3 Q4
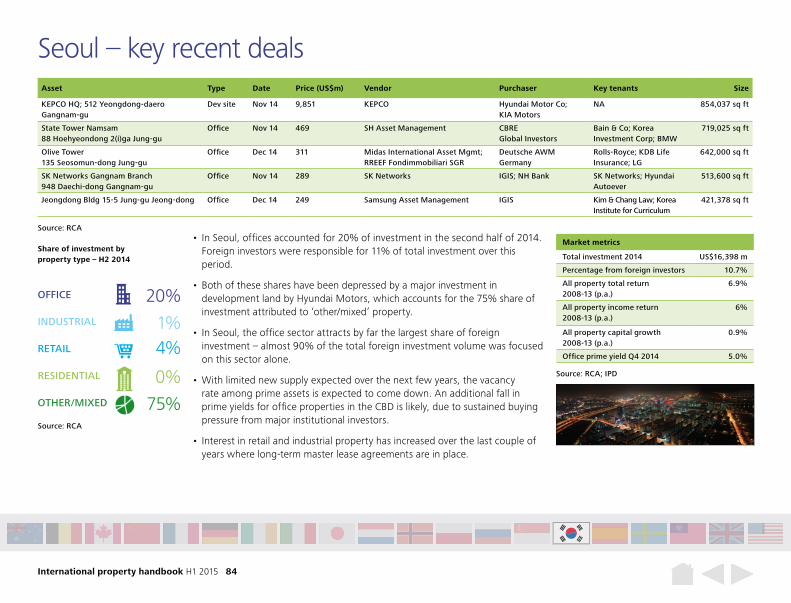
International property handbook H1 2015 84
Seoul – key recent deals
Source: RCA
Asset Type Date Price (US$m) Vendor Purchaser Key tenants Size
KEPCO HQ; 512 Yeongdong-daero Gangnam-gu
Dev site Nov 14 9,851 KEPCO Hyundai Motor Co; KIA Motors
NA 854,037 sq ft
State Tower Namsam 88 Hoehyeondong 2(i)ga Jung-gu
Office Nov 14 469 SH Asset Management CBRE Global Investors
Bain & Co; Korea Investment Corp; BMW
719,025 sq ft
Olive Tower 135 Seosomun-dong Jung-gu
Office Dec 14 311 Midas International Asset Mgmt; RREEF Fondimmobiliari SGR
Deutsche AWM Germany
Rolls-Royce; KDB Life Insurance; LG
642,000 sq ft
SK Networks Gangnam Branch 948 Daechi-dong Gangnam-gu
Office Nov 14 289 SK Networks IGIS; NH Bank SK Networks; Hyundai Autoever
513,600 sq ft
Jeongdong Bldg 15-5 Jung-gu Jeong-dong Office Dec 14 249 Samsung Asset Management IGIS Kim & Chang Law; Korea Institute for Curriculum
421,378 sq ft
• In Seoul, offices accounted for 20% of investment in the second half of 2014. Foreign investors were responsible for 11% of total investment over this period.
• Both of these shares have been depressed by a major investment in development land by Hyundai Motors, which accounts for the 75% share of investment attributed to ‘other/mixed’ property.
• In Seoul, the office sector attracts by far the largest share of foreign investment – almost 90% of the total foreign investment volume was focused on this sector alone.
• With limited new supply expected over the next few years, the vacancy rate among prime assets is expected to come down. An additional fall in prime yields for office properties in the CBD is likely, due to sustained buying pressure from major institutional investors.
• Interest in retail and industrial property has increased over the last couple of years where long-term master lease agreements are in place.
Share of investment by property type – H2 2014
Source: RCA
Source: RCA; IPD
OFFICE 20%INDUSTRIAL 1%RETAIL 4%RESIDENTIAL 0%OTHER/MIXED 75%
Market metrics
Total investment 2014 US$16,398 m
Percentage from foreign investors 10.7%
All property total return 2008-13 (p.a.)
6.9%
All property income return 2008-13 (p.a.)
6%
All property capital growth 2008-13 (p.a.)
0.9%
Office prime yield Q4 2014 5.0%
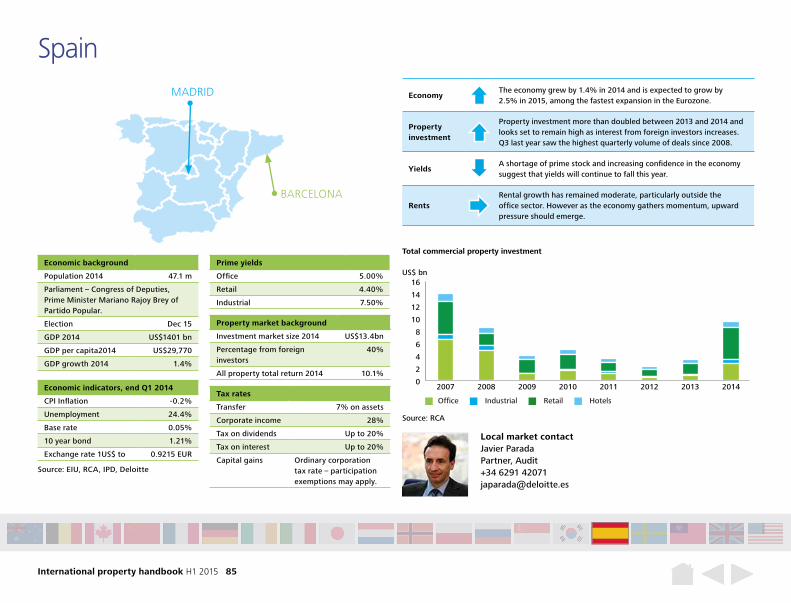
International property handbook H1 2015 85
EconomyThe economy grew by 1.4% in 2014 and is expected to grow by 2.5% in 2015, among the fastest expansion in the Eurozone.
Property investment
Property investment more than doubled between 2013 and 2014 and looks set to remain high as interest from foreign investors increases. Q3 last year saw the highest quarterly volume of deals since 2008.
YieldsA shortage of prime stock and increasing confidence in the economy suggest that yields will continue to fall this year.
RentsRental growth has remained moderate, particularly outside the office sector. However as the economy gathers momentum, upward pressure should emerge.
Spain
Economic background
Population 2014 47.1 m
Parliament – Congress of Deputies, Prime Minister Mariano Rajoy Brey of Partido Popular.
Election Dec 15
GDP 2014 US$1401 bn
GDP per capita2014 US$29,770
GDP growth 2014 1.4%
Prime yields
Office 5.00%
Retail 4.40%
Industrial 7.50%
Property market background
Investment market size 2014 US$13.4bn
Percentage from foreign investors
40%
All property total return 2014 10.1%
Economic indicators, end Q1 2014
CPI Inflation -0.2%
Unemployment 24.4%
Base rate 0.05%
10 year bond 1.21%
Exchange rate 1US$ to 0.9215 EUR
Tax rates
Transfer 7% on assets
Corporate income 28%
Tax on dividends Up to 20%
Tax on interest Up to 20%
Capital gains Ordinary corporation tax rate – participation exemptions may apply.
Local market contactJavier Parada Partner, Audit +34 6291 42071 [email protected]
0
2
4
6
8
10
12
14
16
20142013201220112010200920082007
Source: RCA
Total commercial property investment
US$ bn
Office Industrial Retail Hotels
Source: EIU, RCA, IPD, Deloitte
MADRID
BARCELONA
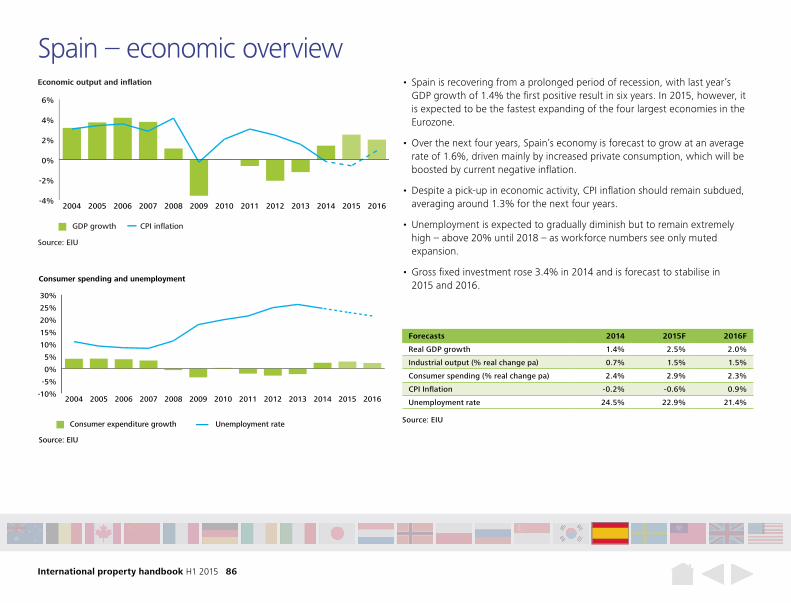
International property handbook H1 2015 86
Forecasts 2014 2015F 2016F
Real GDP growth 1.4% 2.5% 2.0%
Industrial output (% real change pa) 0.7% 1.5% 1.5%
Consumer spending (% real change pa) 2.4% 2.9% 2.3%
CPI Inflation -0.2% -0.6% 0.9%
Unemployment rate 24.5% 22.9% 21.4%
Source: EIU
GDP growth CPI inflation
Economic output and inflation
-4%
-2%
0%
2%
4%
6%
2016201520142013201220112010200920082007200620052004
-10%
-5%
0%
5%
10%
15%
20%
25%
30%
2016201520142013201220112010200920082007200620052004
Source: EIU
Consumer expenditure growth
Consumer spending and unemployment
Unemployment rate Source: EIU
• Spain is recovering from a prolonged period of recession, with last year’s GDP growth of 1.4% the first positive result in six years. In 2015, however, it is expected to be the fastest expanding of the four largest economies in the Eurozone.
• Over the next four years, Spain’s economy is forecast to grow at an average rate of 1.6%, driven mainly by increased private consumption, which will be boosted by current negative inflation.
• Despite a pick-up in economic activity, CPI inflation should remain subdued, averaging around 1.3% for the next four years.
• Unemployment is expected to gradually diminish but to remain extremely high – above 20% until 2018 – as workforce numbers see only muted expansion.
• Gross fixed investment rose 3.4% in 2014 and is forecast to stabilise in 2015 and 2016.
Spain – economic overview
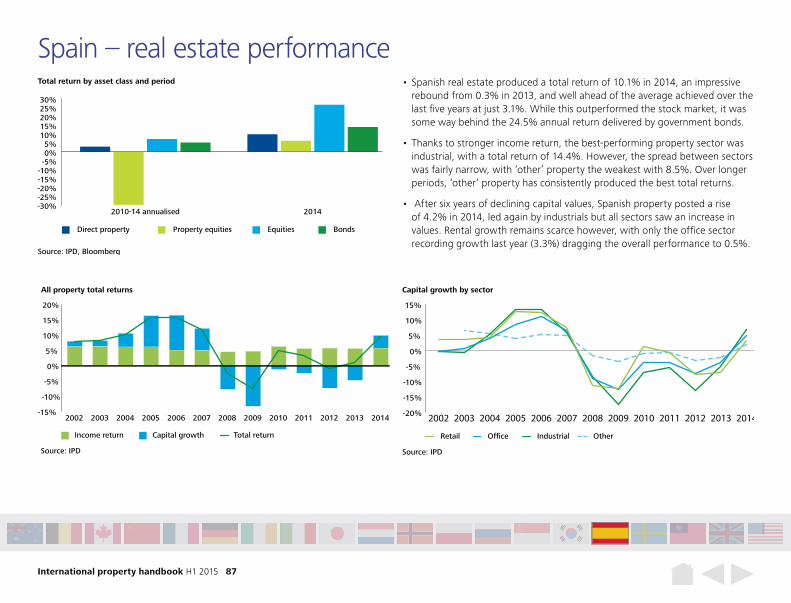
International property handbook H1 2015 87
Spain – real estate performance • Spanish real estate produced a total return of 10.1% in 2014, an impressive
rebound from 0.3% in 2013, and well ahead of the average achieved over the last five years at just 3.1%. While this outperformed the stock market, it was some way behind the 24.5% annual return delivered by government bonds.
• Thanks to stronger income return, the best-performing property sector was industrial, with a total return of 14.4%. However, the spread between sectors was fairly narrow, with ‘other’ property the weakest with 8.5%. Over longer periods, ‘other’ property has consistently produced the best total returns.
• After six years of declining capital values, Spanish property posted a rise of 4.2% in 2014, led again by industrials but all sectors saw an increase in values. Rental growth remains scarce however, with only the office sector recording growth last year (3.3%) dragging the overall performance to 0.5%.
-15%
-10%
-5%
0%
5%
10%
15%
20%
2014201320122011201020092008200720062005200420032002
Source: IPD
Income return Capital growth Total return
All property total returns
-20%
-15%
-10%
-5%
0%
5%
10%
15%
2014201320122011201020092008200720062005200420032002
Source: IPD
OfficeRetail Industrial Other
Capital growth by sector
Total return by asset class and period
Source: IPD, Bloomberg
Direct property Property equities Equities Bonds
-30%-25%-20%-15%-10%-5%0%5%
10%15%20%25%30%
20142010-14 annualised
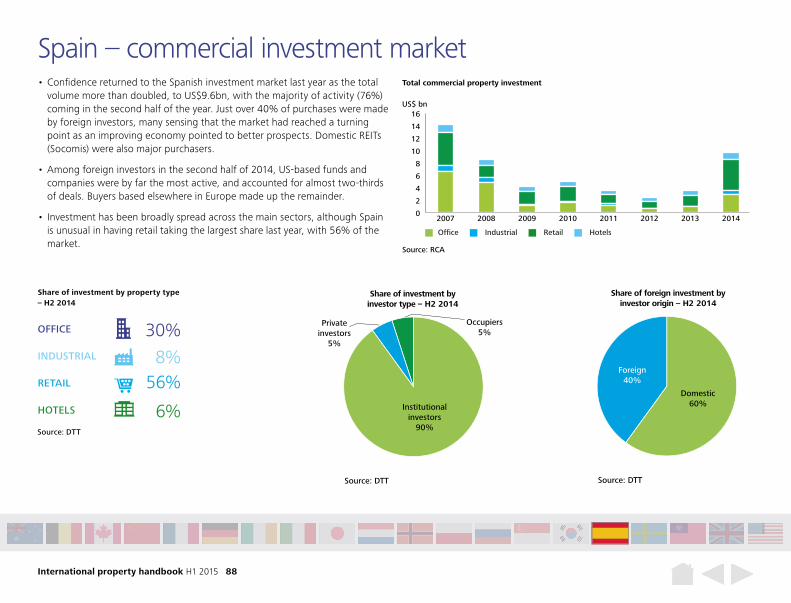
International property handbook H1 2015 88
Share of investment by property type – H2 2014
Source: DTT
OFFICE 30%INDUSTRIAL 8%RETAIL 56%HOTELS 6%
Occupiers5%
Share of investment by investor type – H2 2014
Source: DTT
Institutional investors
90%
Private investors
5%
Share of foreign investment by investor origin – H2 2014
Source: DTT
Domestic60%
Foreign40%
Occupiers5%
Share of investment by investor type – H2 2014
Source: DTT
Institutional investors
90%
Private investors
5%
Share of foreign investment by investor origin – H2 2014
Source: DTT
Domestic60%
Foreign40%
• Confidence returned to the Spanish investment market last year as the total volume more than doubled, to US$9.6bn, with the majority of activity (76%)coming in the second half of the year. Just over 40% of purchases were made by foreign investors, many sensing that the market had reached a turning point as an improving economy pointed to better prospects. Domestic REITs (Socomis) were also major purchasers.
• Among foreign investors in the second half of 2014, US-based funds and companies were by far the most active, and accounted for almost two-thirds of deals. Buyers based elsewhere in Europe made up the remainder.
• Investment has been broadly spread across the main sectors, although Spain is unusual in having retail taking the largest share last year, with 56% of the market.
Spain – commercial investment market
0
2
4
6
8
10
12
14
16
20142013201220112010200920082007
Source: RCA
Total commercial property investment
US$ bn
Office Industrial Retail Hotels
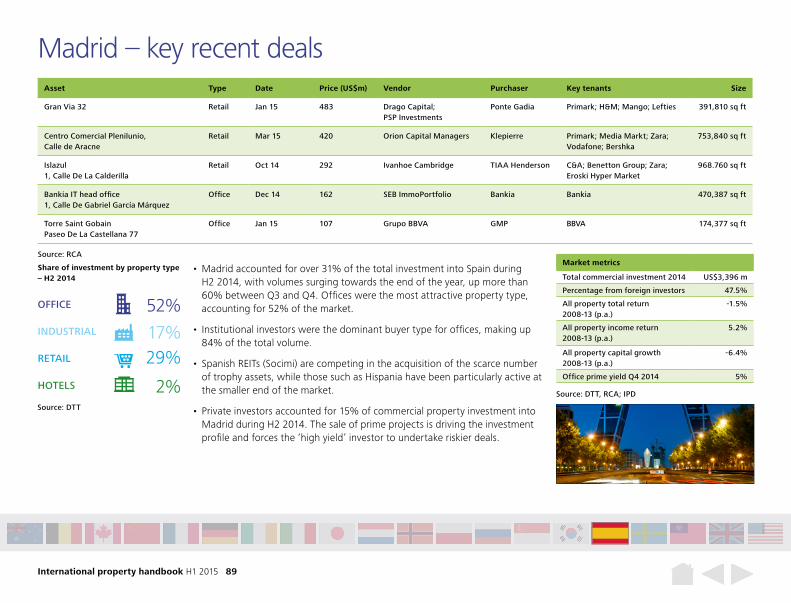
International property handbook H1 2015 89
Madrid – key recent deals
Source: RCA
Asset Type Date Price (US$m) Vendor Purchaser Key tenants Size
Gran Via 32 Retail Jan 15 483 Drago Capital; PSP Investments
Ponte Gadia Primark; H&M; Mango; Lefties 391,810 sq ft
Centro Comercial Plenilunio, Calle de Aracne
Retail Mar 15 420 Orion Capital Managers Klepierre Primark; Media Markt; Zara; Vodafone; Bershka
753,840 sq ft
Islazul 1, Calle De La Calderilla
Retail Oct 14 292 Ivanhoe Cambridge TIAA Henderson C&A; Benetton Group; Zara; Eroski Hyper Market
968.760 sq ft
Bankia IT head office 1, Calle De Gabriel García Márquez
Office Dec 14 162 SEB ImmoPortfolio Bankia Bankia 470,387 sq ft
Torre Saint Gobain Paseo De La Castellana 77
Office Jan 15 107 Grupo BBVA GMP BBVA 174,377 sq ft
• Madrid accounted for over 31% of the total investment into Spain during H2 2014, with volumes surging towards the end of the year, up more than 60% between Q3 and Q4. Offices were the most attractive property type, accounting for 52% of the market.
• Institutional investors were the dominant buyer type for offices, making up 84% of the total volume.
• Spanish REITs (Socimi) are competing in the acquisition of the scarce number of trophy assets, while those such as Hispania have been particularly active at the smaller end of the market.
• Private investors accounted for 15% of commercial property investment into Madrid during H2 2014. The sale of prime projects is driving the investment profile and forces the ‘high yield’ investor to undertake riskier deals.
Source: DTT, RCA; IPD
Market metrics
Total commercial investment 2014 US$3,396 m
Percentage from foreign investors 47.5%
All property total return 2008-13 (p.a.)
-1.5%
All property income return 2008-13 (p.a.)
5.2%
All property capital growth 2008-13 (p.a.)
-6.4%
Office prime yield Q4 2014 5%
Share of investment by property type – H2 2014
Source: DTT
OFFICE 52%INDUSTRIAL 17%RETAIL 29%HOTELS 2%
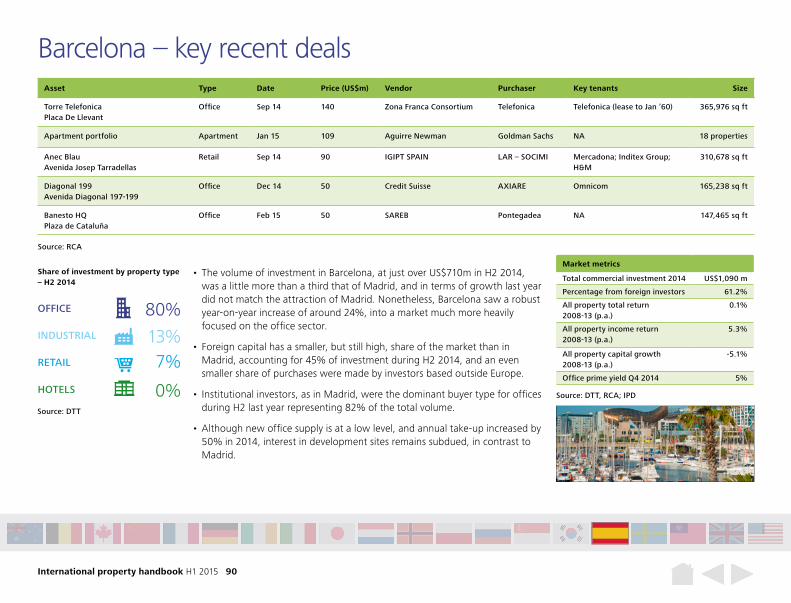
International property handbook H1 2015 90
Barcelona – key recent deals
Source: RCA
Asset Type Date Price (US$m) Vendor Purchaser Key tenants Size
Torre Telefonica Placa De Llevant
Office Sep 14 140 Zona Franca Consortium Telefonica Telefonica (lease to Jan ’60) 365,976 sq ft
Apartment portfolio Apartment Jan 15 109 Aguirre Newman Goldman Sachs NA 18 properties
Anec Blau Avenida Josep Tarradellas
Retail Sep 14 90 IGIPT SPAIN LAR – SOCIMI Mercadona; Inditex Group; H&M
310,678 sq ft
Diagonal 199 Avenida Diagonal 197-199
Office Dec 14 50 Credit Suisse AXIARE Omnicom 165,238 sq ft
Banesto HQ Plaza de Cataluña
Office Feb 15 50 SAREB Pontegadea NA 147,465 sq ft
• The volume of investment in Barcelona, at just over US$710m in H2 2014, was a little more than a third that of Madrid, and in terms of growth last year did not match the attraction of Madrid. Nonetheless, Barcelona saw a robust year-on-year increase of around 24%, into a market much more heavily focused on the office sector.
• Foreign capital has a smaller, but still high, share of the market than in Madrid, accounting for 45% of investment during H2 2014, and an even smaller share of purchases were made by investors based outside Europe.
• Institutional investors, as in Madrid, were the dominant buyer type for offices during H2 last year representing 82% of the total volume.
• Although new office supply is at a low level, and annual take-up increased by 50% in 2014, interest in development sites remains subdued, in contrast to Madrid.
Source: DTT, RCA; IPD
Market metrics
Total commercial investment 2014 US$1,090 m
Percentage from foreign investors 61.2%
All property total return 2008-13 (p.a.)
0.1%
All property income return 2008-13 (p.a.)
5.3%
All property capital growth 2008-13 (p.a.)
-5.1%
Office prime yield Q4 2014 5%
Share of investment by property type – H2 2014
Source: DTT
OFFICE 80%INDUSTRIAL 13%RETAIL 7%HOTELS 0%
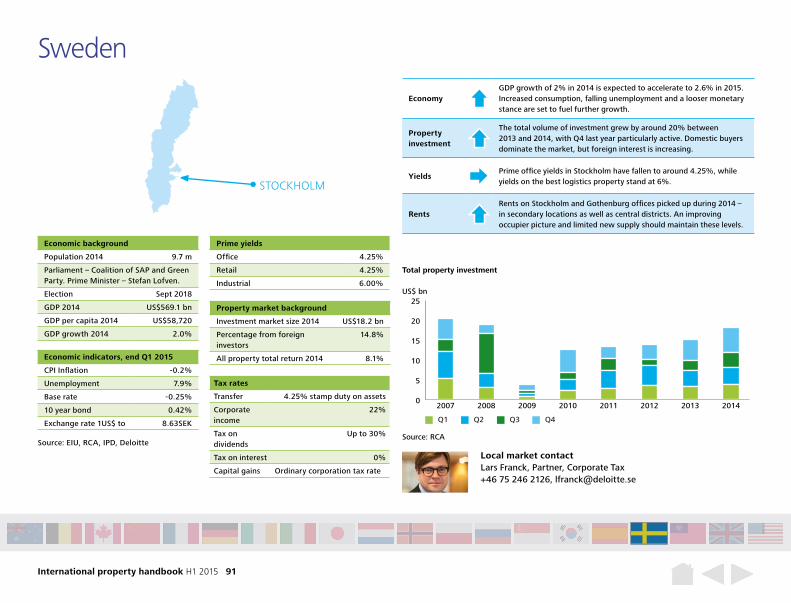
International property handbook H1 2015 91
Tax rates
Transfer 4.25% stamp duty on assets
Corporate income
22%
Tax on dividends
Up to 30%
Tax on interest 0%
Capital gains Ordinary corporation tax rate
EconomyGDP growth of 2% in 2014 is expected to accelerate to 2.6% in 2015. Increased consumption, falling unemployment and a looser monetary stance are set to fuel further growth.
Property investment
The total volume of investment grew by around 20% between 2013 and 2014, with Q4 last year particularly active. Domestic buyers dominate the market, but foreign interest is increasing.
YieldsPrime office yields in Stockholm have fallen to around 4.25%, while yields on the best logistics property stand at 6%.
RentsRents on Stockholm and Gothenburg offices picked up during 2014 – in secondary locations as well as central districts. An improving occupier picture and limited new supply should maintain these levels.
Sweden
Economic background
Population 2014 9.7 m
Parliament – Coalition of SAP and Green Party. Prime Minister – Stefan Lofven.
Election Sept 2018
GDP 2014 US$569.1 bn
GDP per capita 2014 US$58,720
GDP growth 2014 2.0%
Prime yields
Office 4.25%
Retail 4.25%
Industrial 6.00%
Property market background
Investment market size 2014 US$18.2 bn
Percentage from foreign investors
14.8%
All property total return 2014 8.1%Economic indicators, end Q1 2015
CPI Inflation -0.2%
Unemployment 7.9%
Base rate -0.25%
10 year bond 0.42%
Exchange rate 1US$ to 8.63SEK
Local market contactLars Franck, Partner, Corporate Tax +46 75 246 2126, [email protected]
0
5
10
15
20
25
20142013201220112010200920082007
Source: RCA
Total property investment
US$ bn
Q1 Q2 Q3 Q4
STOCKHOLM
Source: EIU, RCA, IPD, Deloitte
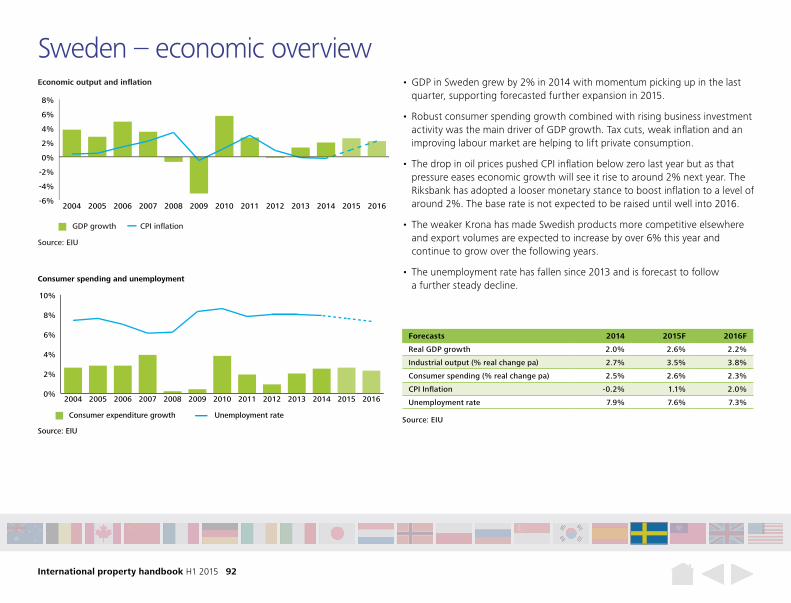
International property handbook H1 2015 92
Forecasts 2014 2015F 2016F
Real GDP growth 2.0% 2.6% 2.2%
Industrial output (% real change pa) 2.7% 3.5% 3.8%
Consumer spending (% real change pa) 2.5% 2.6% 2.3%
CPI Inflation -0.2% 1.1% 2.0%
Unemployment rate 7.9% 7.6% 7.3%
Source: EIU
GDP growth CPI inflation
Economic output and inflation
-6%
-4%
-2%
0%
2%
4%
6%
8%
2016201520142013201220112010200920082007200620052004
0%
2%
4%
6%
8%
10%
2016201520142013201220112010200920082007200620052004
Source: EIU
Consumer expenditure growth
Consumer spending and unemployment
Unemployment rateSource: EIU
• GDP in Sweden grew by 2% in 2014 with momentum picking up in the last quarter, supporting forecasted further expansion in 2015.
• Robust consumer spending growth combined with rising business investment activity was the main driver of GDP growth. Tax cuts, weak inflation and an improving labour market are helping to lift private consumption.
• The drop in oil prices pushed CPI inflation below zero last year but as that pressure eases economic growth will see it rise to around 2% next year. The Riksbank has adopted a looser monetary stance to boost inflation to a level of around 2%. The base rate is not expected to be raised until well into 2016.
• The weaker Krona has made Swedish products more competitive elsewhere and export volumes are expected to increase by over 6% this year and continue to grow over the following years.
• The unemployment rate has fallen since 2013 and is forecast to follow a further steady decline.
Sweden – economic overview
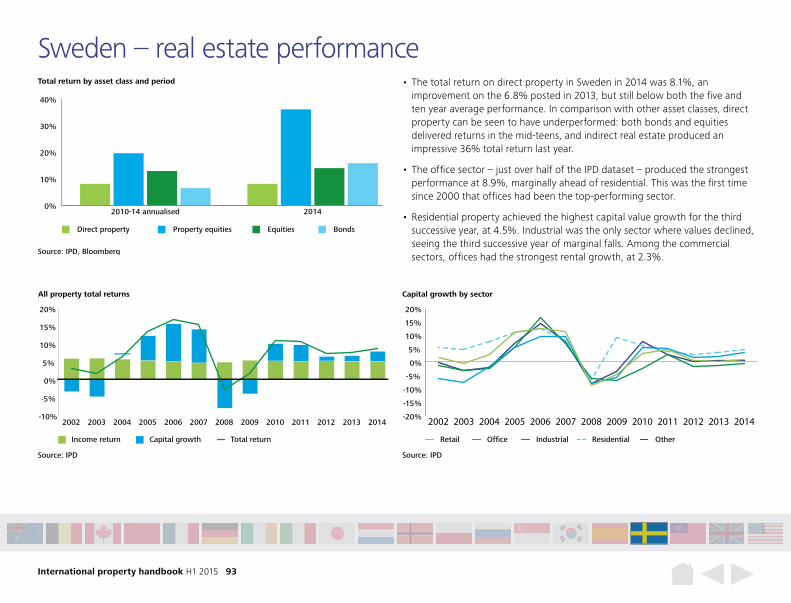
International property handbook H1 2015 93
Sweden – real estate performance • The total return on direct property in Sweden in 2014 was 8.1%, an
improvement on the 6.8% posted in 2013, but still below both the five and ten year average performance. In comparison with other asset classes, direct property can be seen to have underperformed: both bonds and equities delivered returns in the mid-teens, and indirect real estate produced an impressive 36% total return last year.
• The office sector – just over half of the IPD dataset – produced the strongest performance at 8.9%, marginally ahead of residential. This was the first time since 2000 that offices had been the top-performing sector.
• Residential property achieved the highest capital value growth for the third successive year, at 4.5%. Industrial was the only sector where values declined, seeing the third successive year of marginal falls. Among the commercial sectors, offices had the strongest rental growth, at 2.3%.
-10%
-5%
0%
5%
10%
15%
20%
2014201320122011201020092008200720062005200420032002
Source: IPD
Income return Capital growth Total return
All property total returns
-20%
-15%
-10%
-5%
0%
5%
10%
15%
20%
2014201320122011201020092008200720062005200420032002
Source: IPD
OfficeRetail Industrial OtherResidential
Capital growth by sector
Total return by asset class and period
Source: IPD, Bloomberg
Direct property Property equities Equities Bonds
0%
10%
20%
30%
40%
20142010-14 annualised
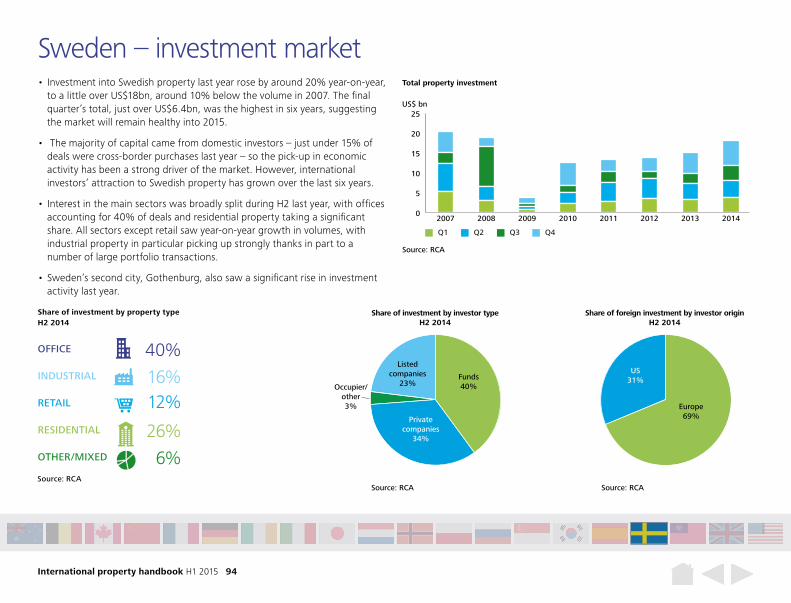
International property handbook H1 2015 94
Occupier/other3%
Share of investment by investor type H2 2014
Source: RCA
Listedcompanies
23%Funds40%
Private companies
34%
Share of foreign investment by investor originH2 2014
Source: RCA
US31%
Europe69%
• Investment into Swedish property last year rose by around 20% year-on-year, to a little over US$18bn, around 10% below the volume in 2007. The final quarter’s total, just over US$6.4bn, was the highest in six years, suggesting the market will remain healthy into 2015.
• The majority of capital came from domestic investors – just under 15% of deals were cross-border purchases last year – so the pick-up in economic activity has been a strong driver of the market. However, international investors’ attraction to Swedish property has grown over the last six years.
• Interest in the main sectors was broadly split during H2 last year, with offices accounting for 40% of deals and residential property taking a significant share. All sectors except retail saw year-on-year growth in volumes, with industrial property in particular picking up strongly thanks in part to a number of large portfolio transactions.
• Sweden’s second city, Gothenburg, also saw a significant rise in investment activity last year.
Sweden – investment market
Share of investment by property type H2 2014
Source: RCA
OFFICE 40%INDUSTRIAL 16%RETAIL 12%RESIDENTIAL 26%OTHER/MIXED 6%
0
5
10
15
20
25
20142013201220112010200920082007
Source: RCA
Total property investment
US$ bn
Q1 Q2 Q3 Q4
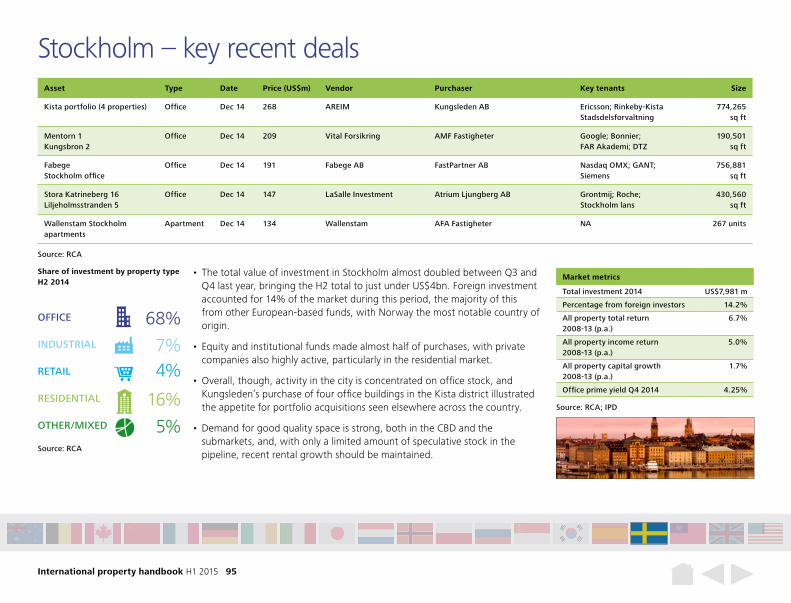
International property handbook H1 2015 95
Stockholm – key recent deals
Source: RCA
Asset Type Date Price (US$m) Vendor Purchaser Key tenants Size
Kista portfolio (4 properties) Office Dec 14 268 AREIM Kungsleden AB Ericsson; Rinkeby-Kista Stadsdelsforvaltning
774,265 sq ft
Mentorn 1 Kungsbron 2
Office Dec 14 209 Vital Forsikring AMF Fastigheter Google; Bonnier; FAR Akademi; DTZ
190,501 sq ft
Fabege Stockholm office
Office Dec 14 191 Fabege AB FastPartner AB Nasdaq OMX; GANT; Siemens
756,881 sq ft
Stora Katrineberg 16 Liljeholmsstranden 5
Office Dec 14 147 LaSalle Investment Atrium Ljungberg AB Grontmij; Roche; Stockholm lans
430,560 sq ft
Wallenstam Stockholm apartments
Apartment Dec 14 134 Wallenstam AFA Fastigheter NA 267 units
• The total value of investment in Stockholm almost doubled between Q3 and Q4 last year, bringing the H2 total to just under US$4bn. Foreign investment accounted for 14% of the market during this period, the majority of this from other European-based funds, with Norway the most notable country of origin.
• Equity and institutional funds made almost half of purchases, with private companies also highly active, particularly in the residential market.
• Overall, though, activity in the city is concentrated on office stock, and Kungsleden’s purchase of four office buildings in the Kista district illustrated the appetite for portfolio acquisitions seen elsewhere across the country.
• Demand for good quality space is strong, both in the CBD and the submarkets, and, with only a limited amount of speculative stock in the pipeline, recent rental growth should be maintained.
Share of investment by property type H2 2014
Source: RCA
Source: RCA; IPD
OFFICE 68%INDUSTRIAL 7%RETAIL 4%RESIDENTIAL 16%OTHER/MIXED 5%
Market metrics
Total investment 2014 US$7,981 m
Percentage from foreign investors 14.2%
All property total return 2008-13 (p.a.)
6.7%
All property income return 2008-13 (p.a.)
5.0%
All property capital growth 2008-13 (p.a.)
1.7%
Office prime yield Q4 2014 4.25%
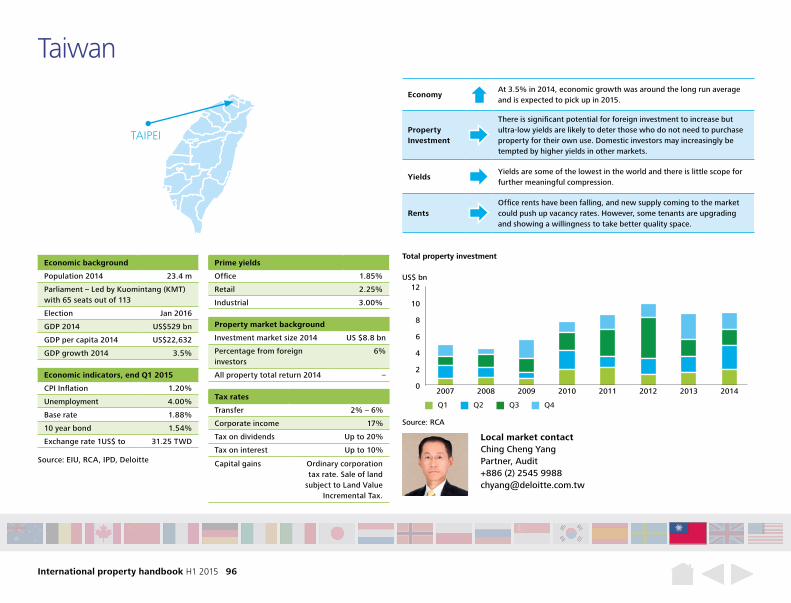
International property handbook H1 2015 96
Taiwan
Economic background
Population 2014 23.4 m
Parliament – Led by Kuomintang (KMT) with 65 seats out of 113
Election Jan 2016
GDP 2014 US$529 bn
GDP per capita 2014 US$22,632
GDP growth 2014 3.5%
Economic indicators, end Q1 2015
CPI Inflation 1.20%
Unemployment 4.00%
Base rate 1.88%
10 year bond 1.54%
Exchange rate 1US$ to 31.25 TWD
Prime yields
Office 1.85%
Retail 2.25%
Industrial 3.00%
Property market background
Investment market size 2014 US $8.8 bn
Percentage from foreign investors
6%
All property total return 2014 –
Local market contactChing Cheng Yang Partner, Audit +886 (2) 2545 9988 [email protected]
0
2
4
6
8
10
12
20142013201220112010200920082007
Source: RCA
Total property investment
US$ bn
Q1 Q2 Q3 Q4
Source: EIU, RCA, IPD, Deloitte
TAIPEI
Tax rates
Transfer 2% – 6%
Corporate income 17%
Tax on dividends Up to 20%
Tax on interest Up to 10%
Capital gains Ordinary corporation tax rate. Sale of land
subject to Land Value Incremental Tax.
EconomyAt 3.5% in 2014, economic growth was around the long run average and is expected to pick up in 2015.
Property Investment
There is significant potential for foreign investment to increase but ultra-low yields are likely to deter those who do not need to purchase property for their own use. Domestic investors may increasingly be tempted by higher yields in other markets.
YieldsYields are some of the lowest in the world and there is little scope for further meaningful compression.
RentsOffice rents have been falling, and new supply coming to the market could push up vacancy rates. However, some tenants are upgrading and showing a willingness to take better quality space.
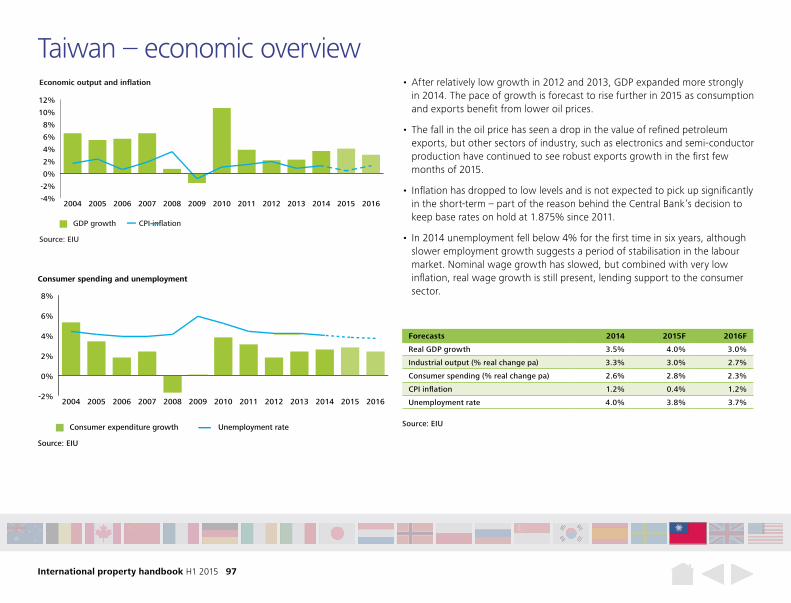
International property handbook H1 2015 97
Forecasts 2014 2015F 2016F
Real GDP growth 3.5% 4.0% 3.0%
Industrial output (% real change pa) 3.3% 3.0% 2.7%
Consumer spending (% real change pa) 2.6% 2.8% 2.3%
CPI inflation 1.2% 0.4% 1.2%
Unemployment rate 4.0% 3.8% 3.7%
Source: EIU
GDP growth CPI inflation
Economic output and inflation
-4%
-2%
0%
2%
4%
6%
8%
10%
12%
2016201520142013201220112010200920082007200620052004
-2%
0%
2%
4%
6%
8%
2016201520142013201220112010200920082007200620052004
Source: EIU
Consumer expenditure growth
Consumer spending and unemployment
Unemployment rate Source: EIU
• After relatively low growth in 2012 and 2013, GDP expanded more strongly in 2014. The pace of growth is forecast to rise further in 2015 as consumption and exports benefit from lower oil prices.
• The fall in the oil price has seen a drop in the value of refined petroleum exports, but other sectors of industry, such as electronics and semi-conductor production have continued to see robust exports growth in the first few months of 2015.
• Inflation has dropped to low levels and is not expected to pick up significantly in the short-term – part of the reason behind the Central Bank’s decision to keep base rates on hold at 1.875% since 2011.
• In 2014 unemployment fell below 4% for the first time in six years, although slower employment growth suggests a period of stabilisation in the labour market. Nominal wage growth has slowed, but combined with very low inflation, real wage growth is still present, lending support to the consumer sector.
Taiwan – economic overview
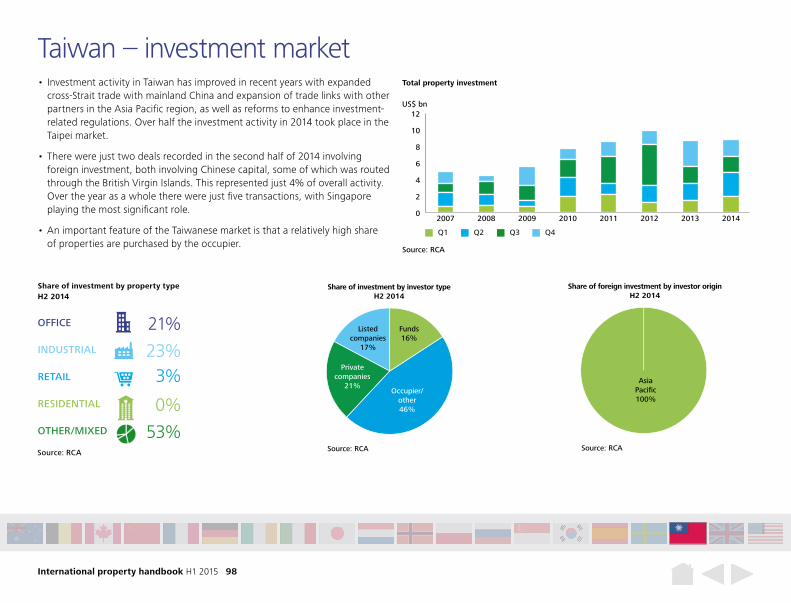
International property handbook H1 2015 98
Share of investment by property type H2 2014
Source: RCA
OFFICE 21%INDUSTRIAL 23%RETAIL 3%RESIDENTIAL 0%OTHER/MIXED 53%
Occupier/other46%
Share of investment by investor typeH2 2014
Source: RCA
Listed companies
17%
Funds16%
Private companies
21%
Share of foreign investment by investor originH2 2014
Source: RCA
Asia Pacific100%
Occupier/other46%
Share of investment by investor typeH2 2014
Source: RCA
Listed companies
17%
Funds16%
Private companies
21%
Share of foreign investment by investor originH2 2014
Source: RCA
Asia Pacific100%
• Investment activity in Taiwan has improved in recent years with expanded cross-Strait trade with mainland China and expansion of trade links with other partners in the Asia Pacific region, as well as reforms to enhance investment-related regulations. Over half the investment activity in 2014 took place in the Taipei market.
• There were just two deals recorded in the second half of 2014 involving foreign investment, both involving Chinese capital, some of which was routed through the British Virgin Islands. This represented just 4% of overall activity. Over the year as a whole there were just five transactions, with Singapore playing the most significant role.
• An important feature of the Taiwanese market is that a relatively high share of properties are purchased by the occupier.
Taiwan – investment market
0
2
4
6
8
10
12
20142013201220112010200920082007
Source: RCA
Total property investment
US$ bn
Q1 Q2 Q3 Q4
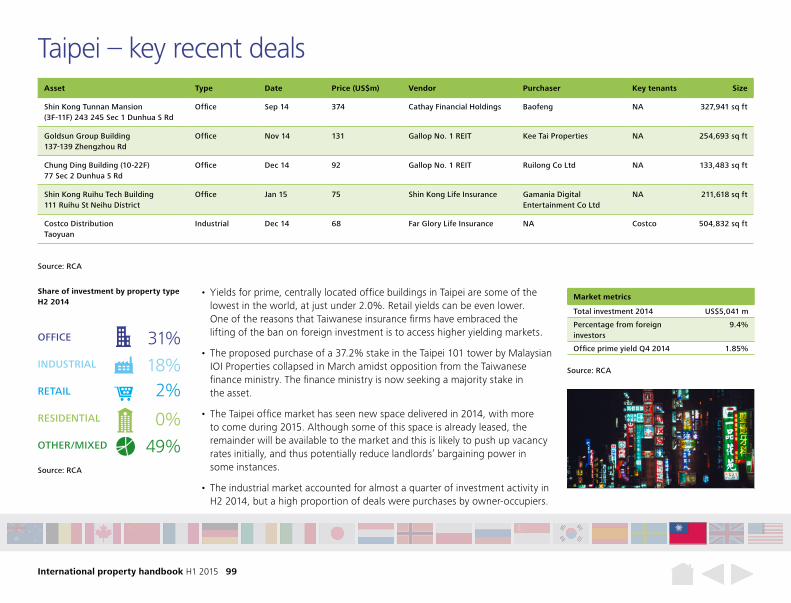
International property handbook H1 2015 99
Taipei – key recent deals
• Yields for prime, centrally located office buildings in Taipei are some of the lowest in the world, at just under 2.0%. Retail yields can be even lower. One of the reasons that Taiwanese insurance firms have embraced the lifting of the ban on foreign investment is to access higher yielding markets.
• The proposed purchase of a 37.2% stake in the Taipei 101 tower by Malaysian IOI Properties collapsed in March amidst opposition from the Taiwanese finance ministry. The finance ministry is now seeking a majority stake in the asset.
• The Taipei office market has seen new space delivered in 2014, with more to come during 2015. Although some of this space is already leased, the remainder will be available to the market and this is likely to push up vacancy rates initially, and thus potentially reduce landlords’ bargaining power in some instances.
• The industrial market accounted for almost a quarter of investment activity in H2 2014, but a high proportion of deals were purchases by owner-occupiers.
Share of investment by property typeH2 2014
Source: RCA
Source: RCA
Source: RCA
OFFICE 31%INDUSTRIAL 18%RETAIL 2%RESIDENTIAL 0%
49%
Market metrics
Total investment 2014 US$5,041 m
Percentage from foreign investors
9.4%
Office prime yield Q4 2014 1.85%
Asset Type Date Price (US$m) Vendor Purchaser Key tenants Size
Shin Kong Tunnan Mansion (3F-11F) 243 245 Sec 1 Dunhua S Rd
Office Sep 14 374 Cathay Financial Holdings Baofeng NA 327,941 sq ft
Goldsun Group Building137-139 Zhengzhou Rd
Office Nov 14 131 Gallop No. 1 REIT Kee Tai Properties NA 254,693 sq ft
Chung Ding Building (10-22F)77 Sec 2 Dunhua S Rd
Office Dec 14 92 Gallop No. 1 REIT Ruilong Co Ltd NA 133,483 sq ft
Shin Kong Ruihu Tech Building111 Ruihu St Neihu District
Office Jan 15 75 Shin Kong Life Insurance Gamania Digital Entertainment Co Ltd
NA 211,618 sq ft
Costco DistributionTaoyuan
Industrial Dec 14 68 Far Glory Life Insurance NA Costco 504,832 sq ft
OTHER/MIXED
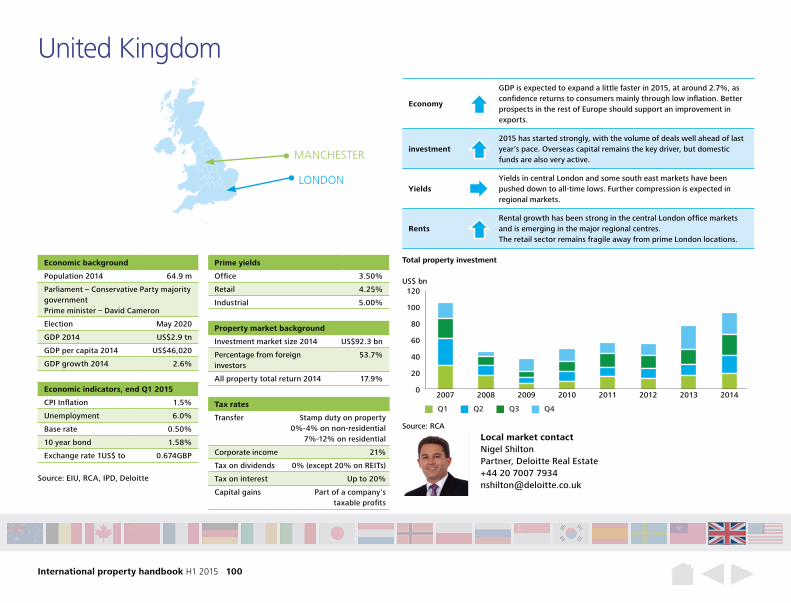
International property handbook H1 2015 100
United Kingdom
Economic background
Population 2014 64.9 m
Parliament – Conservative Party majority government Prime minister – David Cameron
Election May 2020
GDP 2014 US$2.9 tn
GDP per capita 2014 US$46,020
GDP growth 2014 2.6%
Property market background
Investment market size 2014 US$92.3 bn
Percentage from foreign investors
53.7%
All property total return 2014 17.9%
Prime yields
Office 3.50%
Retail 4.25%
Industrial 5.00%
Tax rates
Transfer Stamp duty on property 0%-4% on non-residential
7%-12% on residential
Corporate income 21%
Tax on dividends 0% (except 20% on REITs)
Tax on interest Up to 20%
Capital gains Part of a company's taxable profits
Economic indicators, end Q1 2015
CPI Inflation 1.5%
Unemployment 6.0%
Base rate 0.50%
10 year bond 1.58%
Exchange rate 1US$ to 0.674GBP
0
20
40
60
80
100
120
20142013201220112010200920082007
Source: RCA
Total property investment
US$ bn
Q1 Q2 Q3 Q4
MANCHESTER
LONDON
Economy
GDP is expected to expand a little faster in 2015, at around 2.7%, as confidence returns to consumers mainly through low inflation. Better prospects in the rest of Europe should support an improvement in exports.
investment2015 has started strongly, with the volume of deals well ahead of last year’s pace. Overseas capital remains the key driver, but domestic funds are also very active.
YieldsYields in central London and some south east markets have been pushed down to all-time lows. Further compression is expected in regional markets.
RentsRental growth has been strong in the central London office markets and is emerging in the major regional centres. The retail sector remains fragile away from prime London locations.
Source: EIU, RCA, IPD, Deloitte
Local market contactNigel ShiltonPartner, Deloitte Real Estate+44 20 7007 [email protected]
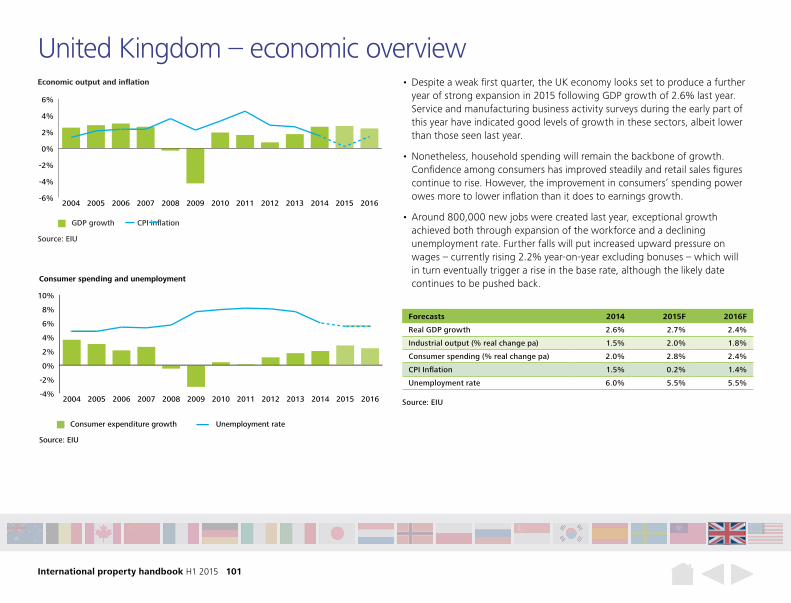
International property handbook H1 2015 101
Forecasts 2014 2015F 2016F
Real GDP growth 2.6% 2.7% 2.4%
Industrial output (% real change pa) 1.5% 2.0% 1.8%
Consumer spending (% real change pa) 2.0% 2.8% 2.4%
CPI Inflation 1.5% 0.2% 1.4%
Unemployment rate 6.0% 5.5% 5.5%
Source: EIU
GDP growth CPI inflation
Economic output and inflation
-6%
-4%
-2%
0%
2%
4%
6%
2016201520142013201220112010200920082007200620052004
-4%
-2%
0%
2%
4%
6%
8%
10%
2016201520142013201220112010200920082007200620052004
Source: EIU
Consumer expenditure growth
Consumer spending and unemployment
Unemployment rate
Source: EIU
• Despite a weak first quarter, the UK economy looks set to produce a further year of strong expansion in 2015 following GDP growth of 2.6% last year. Service and manufacturing business activity surveys during the early part of this year have indicated good levels of growth in these sectors, albeit lower than those seen last year.
• Nonetheless, household spending will remain the backbone of growth. Confidence among consumers has improved steadily and retail sales figures continue to rise. However, the improvement in consumers’ spending power owes more to lower inflation than it does to earnings growth.
• Around 800,000 new jobs were created last year, exceptional growth achieved both through expansion of the workforce and a declining unemployment rate. Further falls will put increased upward pressure on wages – currently rising 2.2% year-on-year excluding bonuses – which will in turn eventually trigger a rise in the base rate, although the likely date continues to be pushed back.
United Kingdom – economic overview
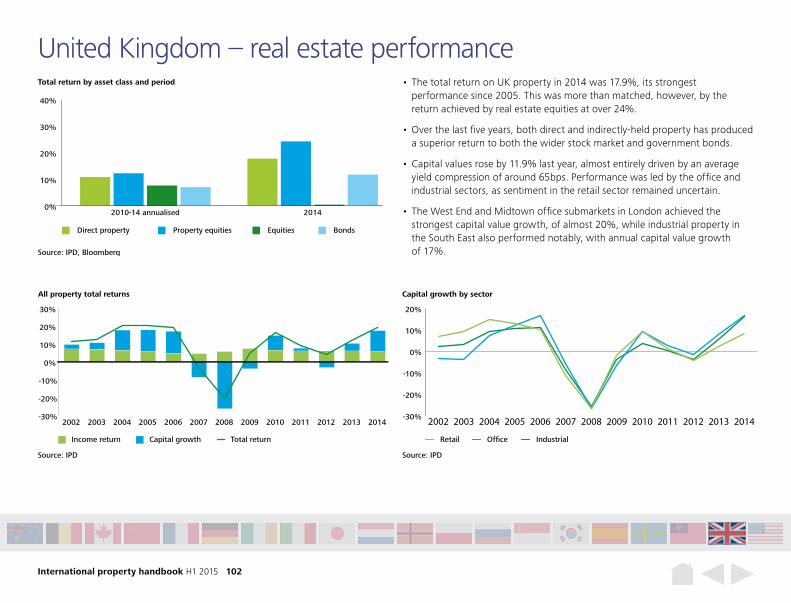
International property handbook H1 2015 102
United Kingdom – real estate performance • The total return on UK property in 2014 was 17.9%, its strongest
performance since 2005. This was more than matched, however, by the return achieved by real estate equities at over 24%.
• Over the last five years, both direct and indirectly-held property has produced a superior return to both the wider stock market and government bonds.
• Capital values rose by 11.9% last year, almost entirely driven by an average yield compression of around 65bps. Performance was led by the office and industrial sectors, as sentiment in the retail sector remained uncertain.
• The West End and Midtown office submarkets in London achieved the strongest capital value growth, of almost 20%, while industrial property in the South East also performed notably, with annual capital value growth of 17%.
-30%
-20%
-10%
0%
10%
20%
30%
2014201320122011201020092008200720062005200420032002
Source: IPD
Income return Capital growth Total return
All property total returns
-30%
-20%
-10%
0%
10%
20%
2014201320122011201020092008200720062005200420032002
Source: IPD
OfficeRetail Industrial
Capital growth by sector
Total return by asset class and period
Source: IPD, Bloomberg
Direct property Property equities Equities Bonds
0%
10%
20%
30%
40%
20142010-14 annualised
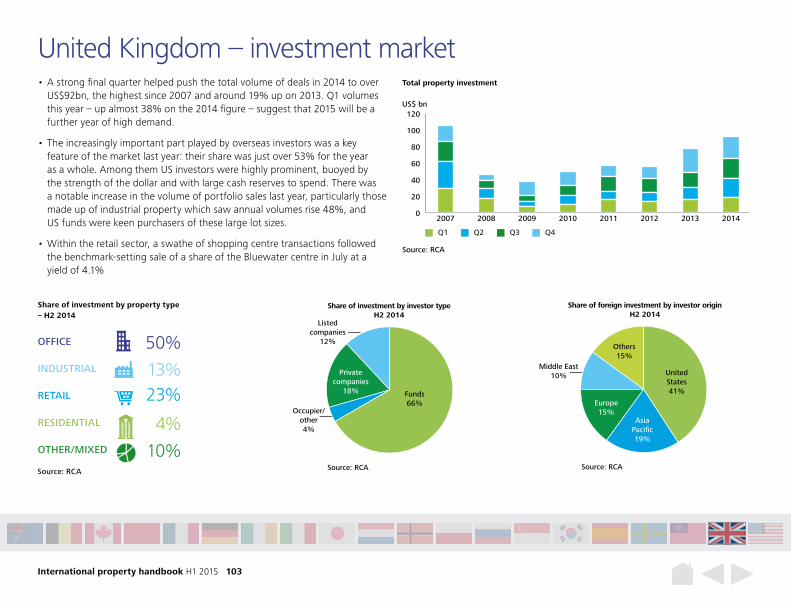
International property handbook H1 2015 103
Share of investment by property type – H2 2014
Source: RCA
OFFICE 50%INDUSTRIAL 13%RETAIL 23%RESIDENTIAL 4%OTHER/MIXED 10%
Occupier/other4%
Share of investment by investor typeH2 2014
Source: RCA
Listed companies
12%
Funds66%
Private companies
18%
Share of foreign investment by investor originH2 2014
Source: RCA
Asia Pacific19%
United States41%
Europe15%
Middle East10%
Others15%
Occupier/other4%
Share of investment by investor typeH2 2014
Source: RCA
Listed companies
12%
Funds66%
Private companies
18%
Share of foreign investment by investor originH2 2014
Source: RCA
Asia Pacific19%
United States41%
Europe15%
Middle East10%
Others15%
• A strong final quarter helped push the total volume of deals in 2014 to over US$92bn, the highest since 2007 and around 19% up on 2013. Q1 volumes this year – up almost 38% on the 2014 figure – suggest that 2015 will be a further year of high demand.
• The increasingly important part played by overseas investors was a key feature of the market last year: their share was just over 53% for the year as a whole. Among them US investors were highly prominent, buoyed by the strength of the dollar and with large cash reserves to spend. There was a notable increase in the volume of portfolio sales last year, particularly those made up of industrial property which saw annual volumes rise 48%, and US funds were keen purchasers of these large lot sizes.
• Within the retail sector, a swathe of shopping centre transactions followed the benchmark-setting sale of a share of the Bluewater centre in July at a yield of 4.1%
United Kingdom – investment market
0
20
40
60
80
100
120
20142013201220112010200920082007
Source: RCA
Total property investment
US$ bn
Q1 Q2 Q3 Q4

International property handbook H1 2015 104
London – key recent deals
Source: RCA
Asset Type Date Price (US$m) Vendor Purchaser Key tenants Size
Canary Wharf portfolio
Mixed Apr 15 3,864 Canary Wharf Group Brookfield Property Partners; Qatar Investment Authority
Various 7,031,314 sq ft
HSBC HQ 8 Canada Square
Office Dec 14 1,717 National Pension Service (Korea)
Qatar Investment Authority HSBC 1,184,030 sq ft
Swiss RE Tower 30 St Mary Axe
Office Nov 14 1,158 IVG Immobilien; Evans Randall
Safra Group Swiss RE; Allianz; Kirkland & Ellis
506,281 sq ft
New Scotland Yard 10a Broadway
Office Dec 14 577 Metropolitan Police Abu Dhabi Financial Group NA 400,000 sq ft
Tower Place 1 Tower Pl
Office Jan 15 506 Deutsche Bank Ping An Insurance Marsh & McLeannan
375,983 sq ft
• London attracts a greater share of foreign investment than the UK as a whole, at over two thirds in 2014. Central London stock remained the focus for the majority of Middle and Far Eastern investors willing to pay prices at yields at the bottom of their long-term range, while UK funds’ sights have generally moved to higher-yielding assets elsewhere in the country.
• The market is dominated by the office sector, but retail property in the West End, particularly on Bond Street, is highly prized by international purchasers.
• Rental growth prospects in the office sector have been a strong incentive for investors in recent quarters. Stock with shorter leases left to run – which would allow owners to capture the expected growth – has performed more strongly than that with longer term income.
• Demand from occupiers has been particularly strong around the central stations of the new Crossrail train service due to start in 2018.
Share of investment by property type – H2 2014
Source: RCA
Source: RCA
OFFICE 78%INDUSTRIAL 3%RETAIL 9%RESIDENTIAL 2%OTHER/MIXED 8%
Market metrics
Total investment 2014 US$45.6 bn
Percentage from foreign investors 67.6%
All property total return 2008-13 (p.a.)
11.2%
All property income return 2008-13 (p.a.)
5.3%
All property capital growth 2008-13 (p.a.)
5.7%
Office prime yield Q4 2014 3.50%
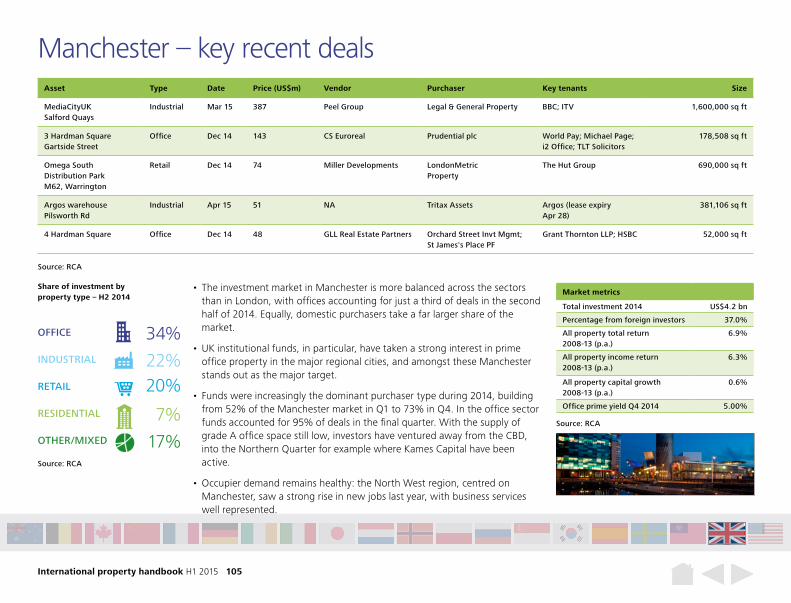
International property handbook H1 2015 105
Manchester – key recent deals
Source: RCA
Asset Type Date Price (US$m) Vendor Purchaser Key tenants Size
MediaCityUK Salford Quays
Industrial Mar 15 387 Peel Group Legal & General Property BBC; ITV 1,600,000 sq ft
3 Hardman Square Gartside Street
Office Dec 14 143 CS Euroreal Prudential plc World Pay; Michael Page; i2 Office; TLT Solicitors
178,508 sq ft
Omega South Distribution Park M62, Warrington
Retail Dec 14 74 Miller Developments LondonMetric Property
The Hut Group 690,000 sq ft
Argos warehouse Pilsworth Rd
Industrial Apr 15 51 NA Tritax Assets Argos (lease expiry Apr 28)
381,106 sq ft
4 Hardman Square Office Dec 14 48 GLL Real Estate Partners Orchard Street Invt Mgmt; St James's Place PF
Grant Thornton LLP; HSBC 52,000 sq ft
• The investment market in Manchester is more balanced across the sectors than in London, with offices accounting for just a third of deals in the second half of 2014. Equally, domestic purchasers take a far larger share of the market.
• UK institutional funds, in particular, have taken a strong interest in prime office property in the major regional cities, and amongst these Manchester stands out as the major target.
• Funds were increasingly the dominant purchaser type during 2014, building from 52% of the Manchester market in Q1 to 73% in Q4. In the office sector funds accounted for 95% of deals in the final quarter. With the supply of grade A office space still low, investors have ventured away from the CBD, into the Northern Quarter for example where Kames Capital have been active.
• Occupier demand remains healthy: the North West region, centred on Manchester, saw a strong rise in new jobs last year, with business services well represented.
Share of investment by property type – H2 2014
Source: RCA
Source: RCA
OFFICE 34%INDUSTRIAL 22%RETAIL 20%RESIDENTIAL 7%OTHER/MIXED 17%
Market metrics
Total investment 2014 US$4.2 bn
Percentage from foreign investors 37.0%
All property total return 2008-13 (p.a.)
6.9%
All property income return 2008-13 (p.a.)
6.3%
All property capital growth 2008-13 (p.a.)
0.6%
Office prime yield Q4 2014 5.00%
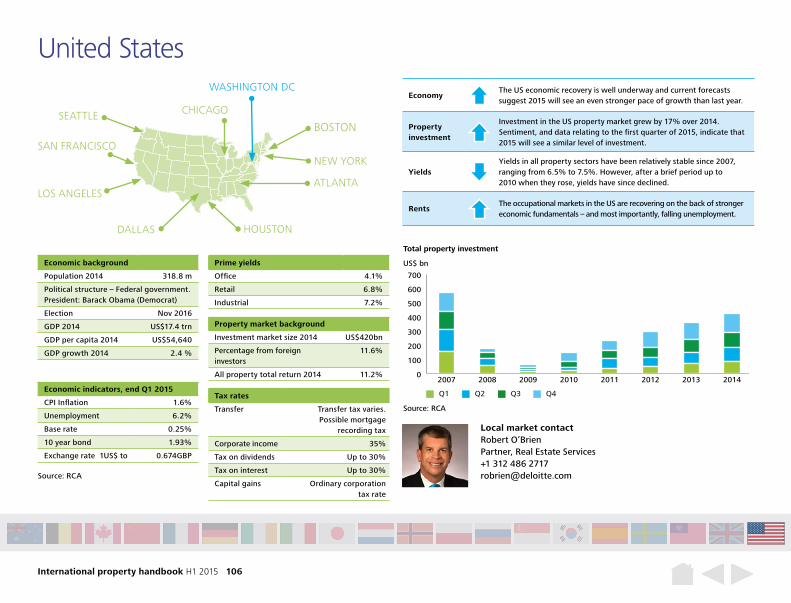
International property handbook H1 2015 106
United States
Economic background
Population 2014 318.8 m
Political structure – Federal government. President: Barack Obama (Democrat)
Election Nov 2016
GDP 2014 US$17.4 trn
GDP per capita 2014 US$54,640
GDP growth 2014 2.4 %
Property market background
Investment market size 2014 US$420bn
Percentage from foreign investors
11.6%
All property total return 2014 11.2%
Prime yields
Office 4.1%
Retail 6.8%
Industrial 7.2%
Tax rates
Transfer Transfer tax varies. Possible mortgage
recording tax
Corporate income 35%
Tax on dividends Up to 30%
Tax on interest Up to 30%
Capital gains Ordinary corporation tax rate
Economic indicators, end Q1 2015
CPI Inflation 1.6%
Unemployment 6.2%
Base rate 0.25%
10 year bond 1.93%
Exchange rate 1US$ to 0.674GBP
Local market contactRobert O’BrienPartner, Real Estate Services+1 312 486 [email protected]
0
100
200
300
400
500
600
700
20142013201220112010200920082007
Source: RCA
Total property investment
US$ bn
Q1 Q2 Q3 Q4
BOSTON
EconomyThe US economic recovery is well underway and current forecasts suggest 2015 will see an even stronger pace of growth than last year.
Property investment
Investment in the US property market grew by 17% over 2014. Sentiment, and data relating to the first quarter of 2015, indicate that 2015 will see a similar level of investment.
YieldsYields in all property sectors have been relatively stable since 2007, ranging from 6.5% to 7.5%. However, after a brief period up to 2010 when they rose, yields have since declined.
RentsThe occupational markets in the US are recovering on the back of stronger economic fundamentals – and most importantly, falling unemployment.
Source: RCA
NEW YORK
ATLANTA
HOUSTONDALLAS
LOS ANGELES
SAN FRANCISCO
SEATTLE CHICAGO
WASHINGTON DC
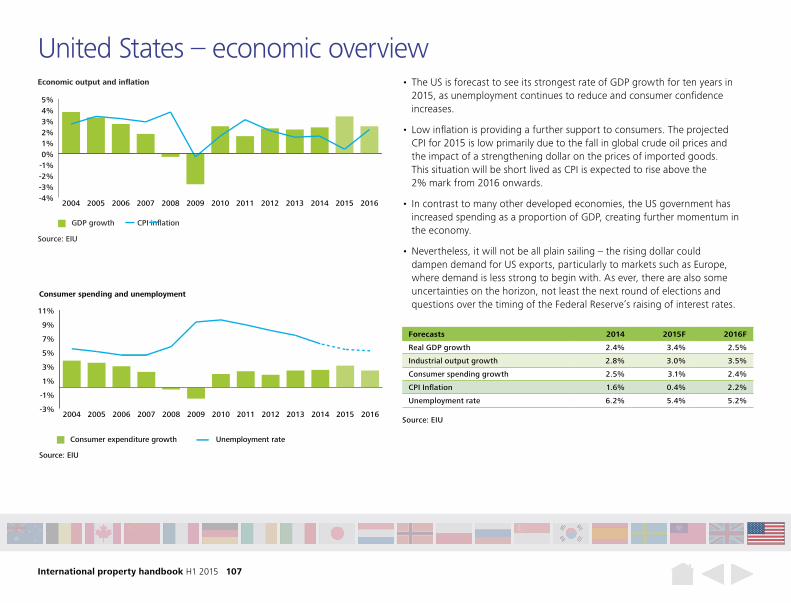
International property handbook H1 2015 107
Forecasts 2014 2015F 2016F
Real GDP growth 2.4% 3.4% 2.5%
Industrial output growth 2.8% 3.0% 3.5%
Consumer spending growth 2.5% 3.1% 2.4%
CPI Inflation 1.6% 0.4% 2.2%
Unemployment rate 6.2% 5.4% 5.2%
Source: EIU
GDP growth CPI inflation
Economic output and inflation
-4%-3%-2%-1%0%1%2%3%4%5%
2016201520142013201220112010200920082007200620052004
Source: EIU
• The US is forecast to see its strongest rate of GDP growth for ten years in 2015, as unemployment continues to reduce and consumer confidence increases.
• Low inflation is providing a further support to consumers. The projected CPI for 2015 is low primarily due to the fall in global crude oil prices and the impact of a strengthening dollar on the prices of imported goods. This situation will be short lived as CPI is expected to rise above the 2% mark from 2016 onwards.
• In contrast to many other developed economies, the US government has increased spending as a proportion of GDP, creating further momentum in the economy.
• Nevertheless, it will not be all plain sailing – the rising dollar could dampen demand for US exports, particularly to markets such as Europe, where demand is less strong to begin with. As ever, there are also some uncertainties on the horizon, not least the next round of elections and questions over the timing of the Federal Reserve’s raising of interest rates.
United States – economic overview
-3%
-1%
1%
3%
5%
7%
9%
11%
2016201520142013201220112010200920082007200620052004
Source: EIU
Consumer expenditure growth
Consumer spending and unemployment
Unemployment rate
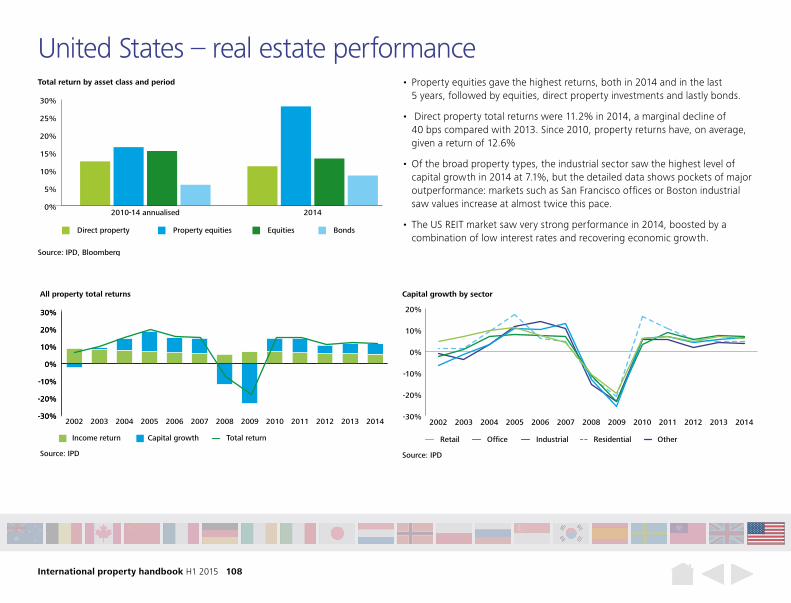
International property handbook H1 2015 108
United States – real estate performance • Property equities gave the highest returns, both in 2014 and in the last
5 years, followed by equities, direct property investments and lastly bonds.
• Direct property total returns were 11.2% in 2014, a marginal decline of 40 bps compared with 2013. Since 2010, property returns have, on average, given a return of 12.6%
• Of the broad property types, the industrial sector saw the highest level of capital growth in 2014 at 7.1%, but the detailed data shows pockets of major outperformance: markets such as San Francisco offices or Boston industrial saw values increase at almost twice this pace.
• The US REIT market saw very strong performance in 2014, boosted by a combination of low interest rates and recovering economic growth.
-30%
-20%
-10%
0%
10%
20%
30%
-30%
-20%
-10%
0%
10%
20%
30%
2014201320122011201020092008200720062005200420032002
All property total returns
Source: IPD
Income return Capital growth Total return
-30%
-20%
-10%
0%
10%
20%
2014201320122011201020092008200720062005200420032002
Source: IPD
Capital growth by sector
OfficeRetail Industrial Residential Other
Total return by asset class and period
Source: IPD, Bloomberg
Direct property Property equities Equities Bonds
0%
5%
10%
15%
20%
25%
30%
20142010-14 annualised
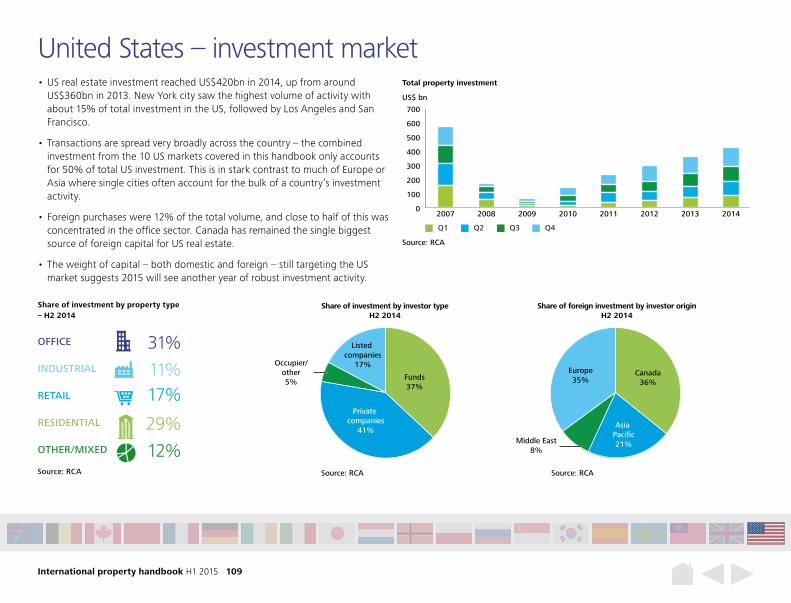
International property handbook H1 2015 109
Share of investment by property type – H2 2014
Source: RCA
OFFICE 31%INDUSTRIAL 11%RETAIL 17%RESIDENTIAL 29%OTHER/MIXED 12%
Occupier/other5%
Share of investment by investor typeH2 2014
Source: RCA
Listed companies
17%
Funds37%
Private companies
41%
Share of foreign investment by investor originH2 2014
Source: RCA
Asia Pacific21%
Canada36%
Europe35%
Middle East8%
• US real estate investment reached US$420bn in 2014, up from around US$360bn in 2013. New York city saw the highest volume of activity with about 15% of total investment in the US, followed by Los Angeles and San Francisco.
• Transactions are spread very broadly across the country – the combined investment from the 10 US markets covered in this handbook only accounts for 50% of total US investment. This is in stark contrast to much of Europe or Asia where single cities often account for the bulk of a country’s investment activity.
• Foreign purchases were 12% of the total volume, and close to half of this was concentrated in the office sector. Canada has remained the single biggest source of foreign capital for US real estate.
• The weight of capital – both domestic and foreign – still targeting the US market suggests 2015 will see another year of robust investment activity.
United States – investment market
0
100
200
300
400
500
600
700
20142013201220112010200920082007
Source: RCA
Total property investment
US$ bn
Q1 Q2 Q3 Q4
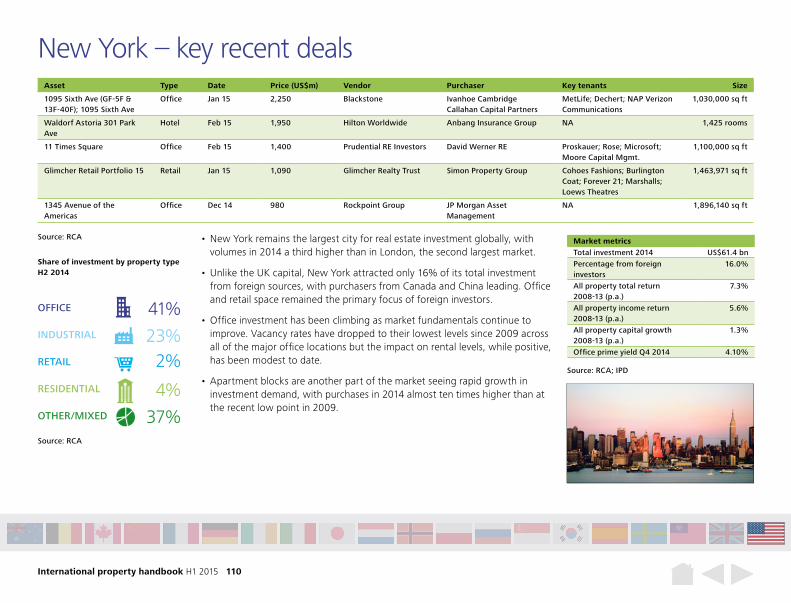
International property handbook H1 2015 110
Market metricsTotal investment 2014 US$61.4 bnPercentage from foreign investors
16.0%
All property total return 2008-13 (p.a.)
7.3%
All property income return 2008-13 (p.a.)
5.6%
All property capital growth 2008-13 (p.a.)
1.3%
Office prime yield Q4 2014 4.10%
New York – key recent deals
• New York remains the largest city for real estate investment globally, with volumes in 2014 a third higher than in London, the second largest market.
• Unlike the UK capital, New York attracted only 16% of its total investment from foreign sources, with purchasers from Canada and China leading. Office and retail space remained the primary focus of foreign investors.
• Office investment has been climbing as market fundamentals continue to improve. Vacancy rates have dropped to their lowest levels since 2009 across all of the major office locations but the impact on rental levels, while positive, has been modest to date.
• Apartment blocks are another part of the market seeing rapid growth in investment demand, with purchases in 2014 almost ten times higher than at the recent low point in 2009.
Share of investment by property typeH2 2014
Source: RCA
Source: RCA
Source: RCA; IPD
OFFICE 41%INDUSTRIAL 23%RETAIL 2%RESIDENTIAL 4%
37%
Asset Type Date Price (US$m) Vendor Purchaser Key tenants Size
1095 Sixth Ave (GF-5F & 13F-40F); 1095 Sixth Ave
Office Jan 15 2,250 Blackstone Ivanhoe Cambridge Callahan Capital Partners
MetLife; Dechert; NAP Verizon Communications
1,030,000 sq ft
Waldorf Astoria 301 Park Ave
Hotel Feb 15 1,950 Hilton Worldwide Anbang Insurance Group NA 1,425 rooms
11 Times Square Office Feb 15 1,400 Prudential RE Investors David Werner RE Proskauer; Rose; Microsoft; Moore Capital Mgmt.
1,100,000 sq ft
Glimcher Retail Portfolio 15 Retail Jan 15 1,090 Glimcher Realty Trust Simon Property Group Cohoes Fashions; Burlington Coat; Forever 21; Marshalls; Loews Theatres
1,463,971 sq ft
1345 Avenue of the Americas
Office Dec 14 980 Rockpoint Group JP Morgan Asset Management
NA 1,896,140 sq ft
OTHER/MIXED
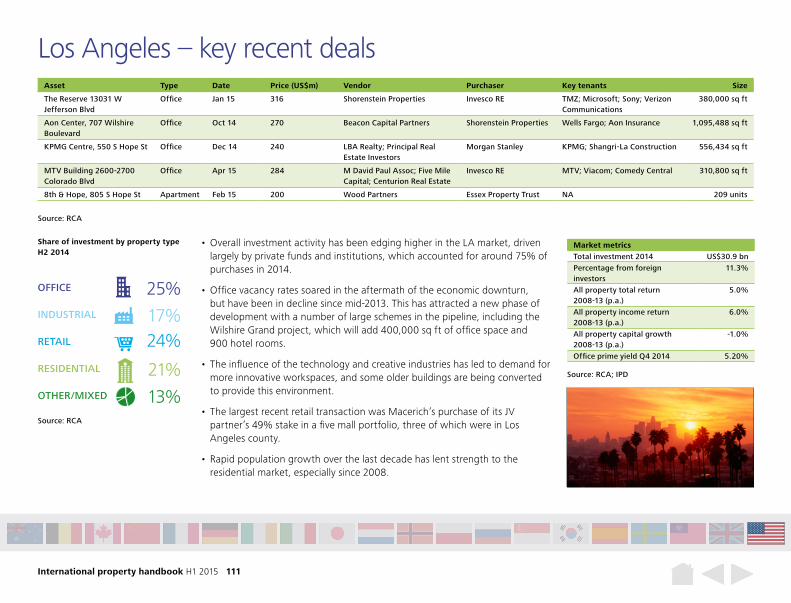
International property handbook H1 2015 111
Market metricsTotal investment 2014 US$30.9 bnPercentage from foreign investors
11.3%
All property total return 2008-13 (p.a.)
5.0%
All property income return 2008-13 (p.a.)
6.0%
All property capital growth 2008-13 (p.a.)
-1.0%
Office prime yield Q4 2014 5.20%
Los Angeles – key recent deals
• Overall investment activity has been edging higher in the LA market, driven largely by private funds and institutions, which accounted for around 75% of purchases in 2014.
• Office vacancy rates soared in the aftermath of the economic downturn, but have been in decline since mid-2013. This has attracted a new phase of development with a number of large schemes in the pipeline, including the Wilshire Grand project, which will add 400,000 sq ft of office space and 900 hotel rooms.
• The influence of the technology and creative industries has led to demand for more innovative workspaces, and some older buildings are being converted to provide this environment.
• The largest recent retail transaction was Macerich’s purchase of its JV partner’s 49% stake in a five mall portfolio, three of which were in Los Angeles county.
• Rapid population growth over the last decade has lent strength to the residential market, especially since 2008.
Source: RCA
Source: RCA; IPD
Asset Type Date Price (US$m) Vendor Purchaser Key tenants Size
The Reserve 13031 W Jefferson Blvd
Office Jan 15 316 Shorenstein Properties Invesco RE TMZ; Microsoft; Sony; Verizon Communications
380,000 sq ft
Aon Center, 707 Wilshire Boulevard
Office Oct 14 270 Beacon Capital Partners Shorenstein Properties Wells Fargo; Aon Insurance 1,095,488 sq ft
KPMG Centre, 550 S Hope St Office Dec 14 240 LBA Realty; Principal Real Estate Investors
Morgan Stanley KPMG; Shangri-La Construction 556,434 sq ft
MTV Building 2600-2700 Colorado Blvd
Office Apr 15 284 M David Paul Assoc; Five Mile Capital; Centurion Real Estate
Invesco RE MTV; Viacom; Comedy Central 310,800 sq ft
8th & Hope, 805 S Hope St Apartment Feb 15 200 Wood Partners Essex Property Trust NA 209 units
Share of investment by property typeH2 2014
Source: RCA
OFFICE 25%INDUSTRIAL 17%RETAIL 24%RESIDENTIAL 21%
13%OTHER/MIXED
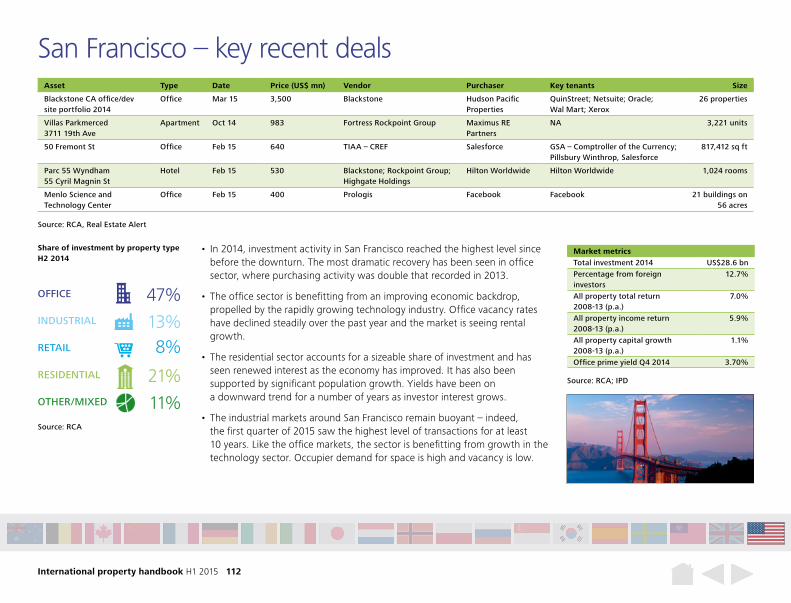
International property handbook H1 2015 112
Market metricsTotal investment 2014 US$28.6 bnPercentage from foreign investors
12.7%
All property total return 2008-13 (p.a.)
7.0%
All property income return 2008-13 (p.a.)
5.9%
All property capital growth 2008-13 (p.a.)
1.1%
Office prime yield Q4 2014 3.70%
San Francisco – key recent deals
• In 2014, investment activity in San Francisco reached the highest level since before the downturn. The most dramatic recovery has been seen in office sector, where purchasing activity was double that recorded in 2013.
• The office sector is benefitting from an improving economic backdrop, propelled by the rapidly growing technology industry. Office vacancy rates have declined steadily over the past year and the market is seeing rental growth.
• The residential sector accounts for a sizeable share of investment and has seen renewed interest as the economy has improved. It has also been supported by significant population growth. Yields have been on a downward trend for a number of years as investor interest grows.
• The industrial markets around San Francisco remain buoyant – indeed, the first quarter of 2015 saw the highest level of transactions for at least 10 years. Like the office markets, the sector is benefitting from growth in the technology sector. Occupier demand for space is high and vacancy is low.
Source: RCA, Real Estate Alert
Source: RCA; IPD
Asset Type Date Price (US$ mn) Vendor Purchaser Key tenants Size
Blackstone CA office/dev site portfolio 2014
Office Mar 15 3,500 Blackstone Hudson Pacific Properties
QuinStreet; Netsuite; Oracle; Wal Mart; Xerox
26 properties
Villas Parkmerced 3711 19th Ave
Apartment Oct 14 983 Fortress Rockpoint Group Maximus RE Partners
NA 3,221 units
50 Fremont St Office Feb 15 640 TIAA – CREF Salesforce GSA – Comptroller of the Currency; Pillsbury Winthrop, Salesforce
817,412 sq ft
Parc 55 Wyndham 55 Cyril Magnin St
Hotel Feb 15 530 Blackstone; Rockpoint Group; Highgate Holdings
Hilton Worldwide Hilton Worldwide 1,024 rooms
Menlo Science and Technology Center
Office Feb 15 400 Prologis Facebook Facebook 21 buildings on 56 acres
Share of investment by property typeH2 2014
Source: RCA
OFFICE 47%INDUSTRIAL 13%RETAIL 8%RESIDENTIAL 21%
11%OTHER/MIXED
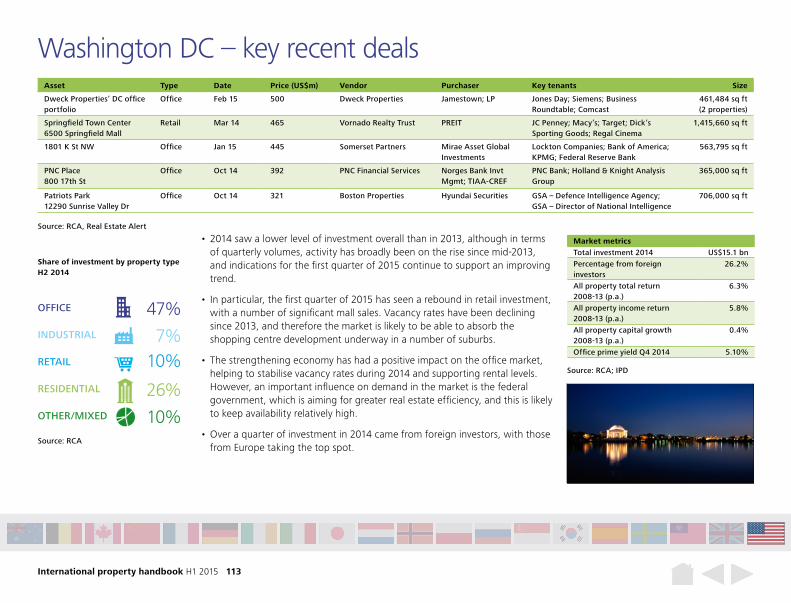
International property handbook H1 2015 113
Market metricsTotal investment 2014 US$15.1 bnPercentage from foreign investors
26.2%
All property total return 2008-13 (p.a.)
6.3%
All property income return 2008-13 (p.a.)
5.8%
All property capital growth 2008-13 (p.a.)
0.4%
Office prime yield Q4 2014 5.10%
Washington DC – key recent deals
• 2014 saw a lower level of investment overall than in 2013, although in terms of quarterly volumes, activity has broadly been on the rise since mid-2013, and indications for the first quarter of 2015 continue to support an improving trend.
• In particular, the first quarter of 2015 has seen a rebound in retail investment, with a number of significant mall sales. Vacancy rates have been declining since 2013, and therefore the market is likely to be able to absorb the shopping centre development underway in a number of suburbs.
• The strengthening economy has had a positive impact on the office market, helping to stabilise vacancy rates during 2014 and supporting rental levels. However, an important influence on demand in the market is the federal government, which is aiming for greater real estate efficiency, and this is likely to keep availability relatively high.
• Over a quarter of investment in 2014 came from foreign investors, with those from Europe taking the top spot.
Share of investment by property typeH2 2014
Source: RCA
Source: RCA, Real Estate Alert
Source: RCA; IPD
OFFICE 47%INDUSTRIAL 7%RETAIL 10%RESIDENTIAL 26%
10%
Asset Type Date Price (US$m) Vendor Purchaser Key tenants Size
Dweck Properties’ DC office portfolio
Office Feb 15 500 Dweck Properties Jamestown; LP Jones Day; Siemens; Business Roundtable; Comcast
461,484 sq ft (2 properties)
Springfield Town Center 6500 Springfield Mall
Retail Mar 14 465 Vornado Realty Trust PREIT JC Penney; Macy’s; Target; Dick’s Sporting Goods; Regal Cinema
1,415,660 sq ft
1801 K St NW Office Jan 15 445 Somerset Partners Mirae Asset Global Investments
Lockton Companies; Bank of America; KPMG; Federal Reserve Bank
563,795 sq ft
PNC Place 800 17th St
Office Oct 14 392 PNC Financial Services Norges Bank Invt Mgmt; TIAA-CREF
PNC Bank; Holland & Knight Analysis Group
365,000 sq ft
Patriots Park 12290 Sunrise Valley Dr
Office Oct 14 321 Boston Properties Hyundai Securities GSA – Defence Intelligence Agency; GSA – Director of National Intelligence
706,000 sq ft
OTHER/MIXED
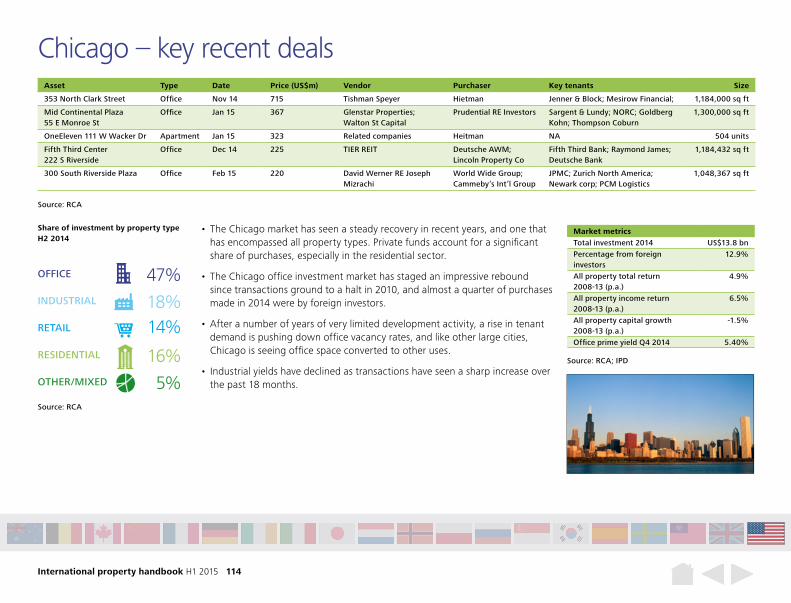
International property handbook H1 2015 114
Market metricsTotal investment 2014 US$13.8 bnPercentage from foreign investors
12.9%
All property total return 2008-13 (p.a.)
4.9%
All property income return 2008-13 (p.a.)
6.5%
All property capital growth 2008-13 (p.a.)
-1.5%
Office prime yield Q4 2014 5.40%
Chicago – key recent deals
• The Chicago market has seen a steady recovery in recent years, and one that has encompassed all property types. Private funds account for a significant share of purchases, especially in the residential sector.
• The Chicago office investment market has staged an impressive rebound since transactions ground to a halt in 2010, and almost a quarter of purchases made in 2014 were by foreign investors.
• After a number of years of very limited development activity, a rise in tenant demand is pushing down office vacancy rates, and like other large cities, Chicago is seeing office space converted to other uses.
• Industrial yields have declined as transactions have seen a sharp increase over the past 18 months.
Source: RCA
Source: RCA; IPD
Asset Type Date Price (US$m) Vendor Purchaser Key tenants Size
353 North Clark Street Office Nov 14 715 Tishman Speyer Hietman Jenner & Block; Mesirow Financial; 1,184,000 sq ft
Mid Continental Plaza 55 E Monroe St
Office Jan 15 367 Glenstar Properties; Walton St Capital
Prudential RE Investors Sargent & Lundy; NORC; Goldberg Kohn; Thompson Coburn
1,300,000 sq ft
OneEleven 111 W Wacker Dr Apartment Jan 15 323 Related companies Heitman NA 504 units
Fifth Third Center 222 S Riverside
Office Dec 14 225 TIER REIT Deutsche AWM; Lincoln Property Co
Fifth Third Bank; Raymond James; Deutsche Bank
1,184,432 sq ft
300 South Riverside Plaza Office Feb 15 220 David Werner RE Joseph Mizrachi
World Wide Group; Cammeby’s Int’l Group
JPMC; Zurich North America; Newark corp; PCM Logistics
1,048,367 sq ft
Share of investment by property typeH2 2014
Source: RCA
OFFICE 47%INDUSTRIAL 18%RETAIL 14%RESIDENTIAL 16%
5%OTHER/MIXED
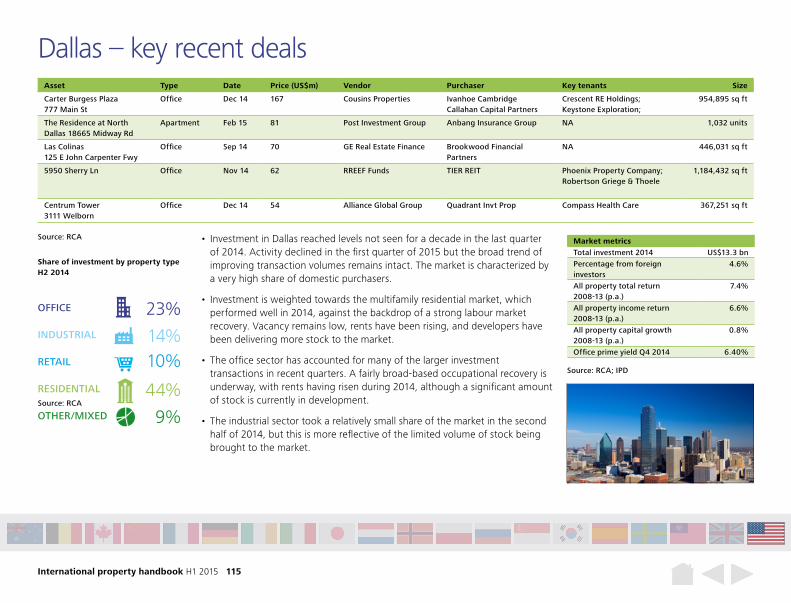
International property handbook H1 2015 115
Market metricsTotal investment 2014 US$13.3 bnPercentage from foreign investors
4.6%
All property total return 2008-13 (p.a.)
7.4%
All property income return 2008-13 (p.a.)
6.6%
All property capital growth 2008-13 (p.a.)
0.8%
Office prime yield Q4 2014 6.40%
Dallas – key recent deals
• Investment in Dallas reached levels not seen for a decade in the last quarter of 2014. Activity declined in the first quarter of 2015 but the broad trend of improving transaction volumes remains intact. The market is characterized by a very high share of domestic purchasers.
• Investment is weighted towards the multifamily residential market, which performed well in 2014, against the backdrop of a strong labour market recovery. Vacancy remains low, rents have been rising, and developers have been delivering more stock to the market.
• The office sector has accounted for many of the larger investment transactions in recent quarters. A fairly broad-based occupational recovery is underway, with rents having risen during 2014, although a significant amount of stock is currently in development.
• The industrial sector took a relatively small share of the market in the second half of 2014, but this is more reflective of the limited volume of stock being brought to the market.
Share of investment by property typeH2 2014
Source: RCA
Source: RCA
Source: RCA; IPD
OFFICE 23%INDUSTRIAL 14%RETAIL 10%RESIDENTIAL 44%
9%
Asset Type Date Price (US$m) Vendor Purchaser Key tenants Size
Carter Burgess Plaza 777 Main St
Office Dec 14 167 Cousins Properties Ivanhoe Cambridge Callahan Capital Partners
Crescent RE Holdings; Keystone Exploration;
954,895 sq ft
The Residence at North Dallas 18665 Midway Rd
Apartment Feb 15 81 Post Investment Group Anbang Insurance Group NA 1,032 units
Las Colinas 125 E John Carpenter Fwy
Office Sep 14 70 GE Real Estate Finance Brookwood Financial Partners
NA 446,031 sq ft
5950 Sherry Ln Office Nov 14 62 RREEF Funds TIER REIT Phoenix Property Company; Robertson Griege & Thoele
1,184,432 sq ft
Centrum Tower 3111 Welborn
Office Dec 14 54 Alliance Global Group Quadrant Invt Prop Compass Health Care 367,251 sq ft
OTHER/MIXED
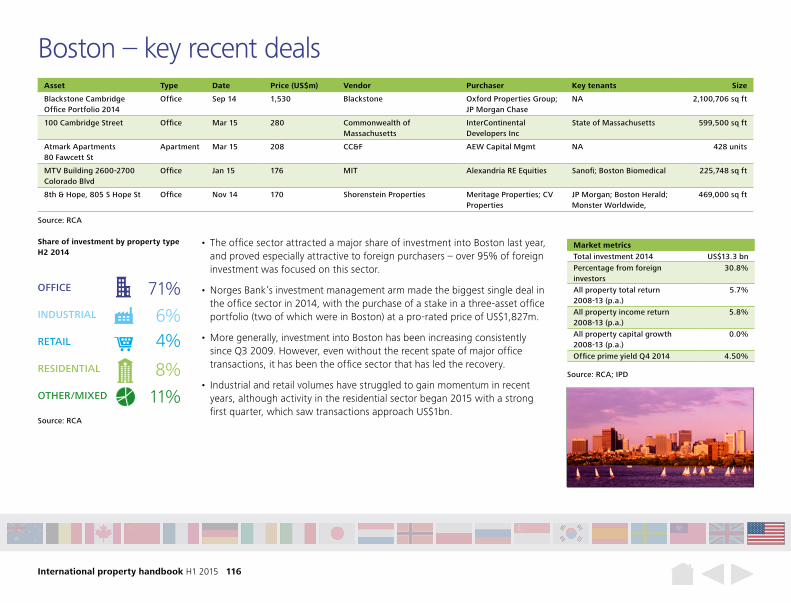
International property handbook H1 2015 116
Market metricsTotal investment 2014 US$13.3 bnPercentage from foreign investors
30.8%
All property total return 2008-13 (p.a.)
5.7%
All property income return 2008-13 (p.a.)
5.8%
All property capital growth 2008-13 (p.a.)
0.0%
Office prime yield Q4 2014 4.50%
Boston – key recent deals
• The office sector attracted a major share of investment into Boston last year, and proved especially attractive to foreign purchasers – over 95% of foreign investment was focused on this sector.
• Norges Bank’s investment management arm made the biggest single deal in the office sector in 2014, with the purchase of a stake in a three-asset office portfolio (two of which were in Boston) at a pro-rated price of US$1,827m.
• More generally, investment into Boston has been increasing consistently since Q3 2009. However, even without the recent spate of major office transactions, it has been the office sector that has led the recovery.
• Industrial and retail volumes have struggled to gain momentum in recent years, although activity in the residential sector began 2015 with a strong first quarter, which saw transactions approach US$1bn.
Source: RCA
Source: RCA; IPD
Asset Type Date Price (US$m) Vendor Purchaser Key tenants Size
Blackstone Cambridge Office Portfolio 2014
Office Sep 14 1,530 Blackstone Oxford Properties Group; JP Morgan Chase
NA 2,100,706 sq ft
100 Cambridge Street Office Mar 15 280 Commonwealth of Massachusetts
InterContinental Developers Inc
State of Massachusetts 599,500 sq ft
Atmark Apartments 80 Fawcett St
Apartment Mar 15 208 CC&F AEW Capital Mgmt NA 428 units
MTV Building 2600-2700 Colorado Blvd
Office Jan 15 176 MIT Alexandria RE Equities Sanofi; Boston Biomedical 225,748 sq ft
8th & Hope, 805 S Hope St Office Nov 14 170 Shorenstein Properties Meritage Properties; CV Properties
JP Morgan; Boston Herald; Monster Worldwide,
469,000 sq ft
Share of investment by property typeH2 2014
Source: RCA
OFFICE 71%INDUSTRIAL 6%RETAIL 4%RESIDENTIAL 8%
11%OTHER/MIXED
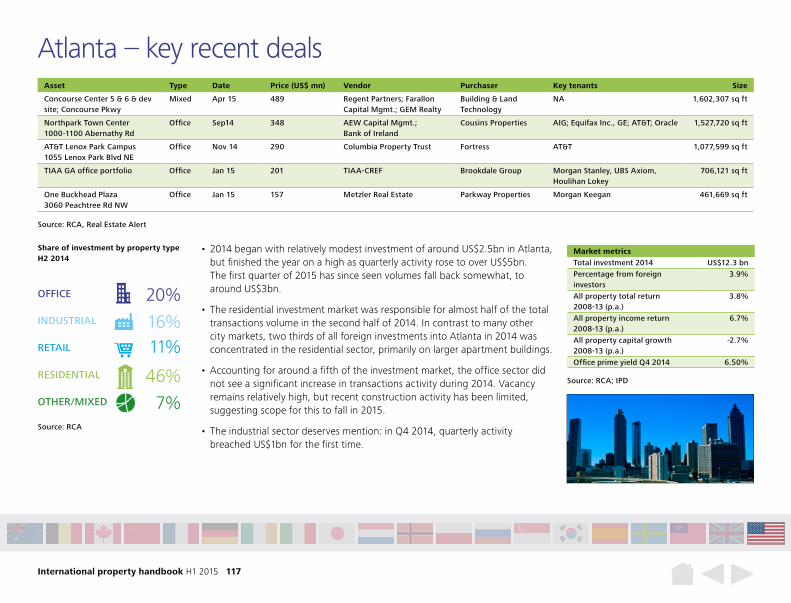
International property handbook H1 2015 117
Market metricsTotal investment 2014 US$12.3 bnPercentage from foreign investors
3.9%
All property total return 2008-13 (p.a.)
3.8%
All property income return 2008-13 (p.a.)
6.7%
All property capital growth 2008-13 (p.a.)
-2.7%
Office prime yield Q4 2014 6.50%
Atlanta – key recent deals
• 2014 began with relatively modest investment of around US$2.5bn in Atlanta, but finished the year on a high as quarterly activity rose to over US$5bn. The first quarter of 2015 has since seen volumes fall back somewhat, to around US$3bn.
• The residential investment market was responsible for almost half of the total transactions volume in the second half of 2014. In contrast to many other city markets, two thirds of all foreign investments into Atlanta in 2014 was concentrated in the residential sector, primarily on larger apartment buildings.
• Accounting for around a fifth of the investment market, the office sector did not see a significant increase in transactions activity during 2014. Vacancy remains relatively high, but recent construction activity has been limited, suggesting scope for this to fall in 2015.
• The industrial sector deserves mention: in Q4 2014, quarterly activity breached US$1bn for the first time.
Source: RCA, Real Estate Alert
Source: RCA; IPD
Asset Type Date Price (US$ mn) Vendor Purchaser Key tenants Size
Concourse Center 5 & 6 & dev site; Concourse Pkwy
Mixed Apr 15 489 Regent Partners; Farallon Capital Mgmt.; GEM Realty
Building & Land Technology
NA 1,602,307 sq ft
Northpark Town Center 1000-1100 Abernathy Rd
Office Sep14 348 AEW Capital Mgmt.; Bank of Ireland
Cousins Properties AIG; Equifax Inc., GE; AT&T; Oracle 1,527,720 sq ft
AT&T Lenox Park Campus 1055 Lenox Park Blvd NE
Office Nov 14 290 Columbia Property Trust Fortress AT&T 1,077,599 sq ft
TIAA GA office portfolio Office Jan 15 201 TIAA-CREF Brookdale Group Morgan Stanley, UBS Axiom, Houlihan Lokey
706,121 sq ft
One Buckhead Plaza 3060 Peachtree Rd NW
Office Jan 15 157 Metzler Real Estate Parkway Properties Morgan Keegan 461,669 sq ft
Share of investment by property typeH2 2014
Source: RCA
OFFICE 20%INDUSTRIAL 16%RETAIL 11%RESIDENTIAL 46%
7%OTHER/MIXED
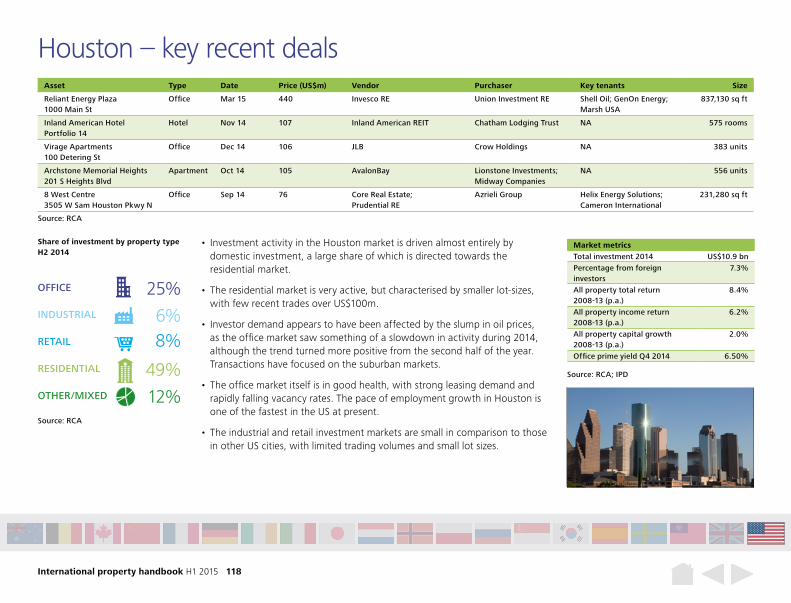
International property handbook H1 2015 118
Market metricsTotal investment 2014 US$10.9 bnPercentage from foreign investors
7.3%
All property total return 2008-13 (p.a.)
8.4%
All property income return 2008-13 (p.a.)
6.2%
All property capital growth 2008-13 (p.a.)
2.0%
Office prime yield Q4 2014 6.50%
Houston – key recent deals
• Investment activity in the Houston market is driven almost entirely by domestic investment, a large share of which is directed towards the residential market.
• The residential market is very active, but characterised by smaller lot-sizes, with few recent trades over US$100m.
• Investor demand appears to have been affected by the slump in oil prices, as the office market saw something of a slowdown in activity during 2014, although the trend turned more positive from the second half of the year. Transactions have focused on the suburban markets.
• The office market itself is in good health, with strong leasing demand and rapidly falling vacancy rates. The pace of employment growth in Houston is one of the fastest in the US at present.
• The industrial and retail investment markets are small in comparison to those in other US cities, with limited trading volumes and small lot sizes.
Source: RCA
Source: RCA; IPD
Asset Type Date Price (US$m) Vendor Purchaser Key tenants Size
Reliant Energy Plaza 1000 Main St
Office Mar 15 440 Invesco RE Union Investment RE Shell Oil; GenOn Energy; Marsh USA
837,130 sq ft
Inland American Hotel Portfolio 14
Hotel Nov 14 107 Inland American REIT Chatham Lodging Trust NA 575 rooms
Virage Apartments 100 Detering St
Office Dec 14 106 JLB Crow Holdings NA 383 units
Archstone Memorial Heights 201 S Heights Blvd
Apartment Oct 14 105 AvalonBay Lionstone Investments; Midway Companies
NA 556 units
8 West Centre 3505 W Sam Houston Pkwy N
Office Sep 14 76 Core Real Estate; Prudential RE
Azrieli Group Helix Energy Solutions; Cameron International
231,280 sq ft
Share of investment by property typeH2 2014
Source: RCA
OFFICE 25%INDUSTRIAL 6%RETAIL 8%RESIDENTIAL 49%
12%OTHER/MIXED
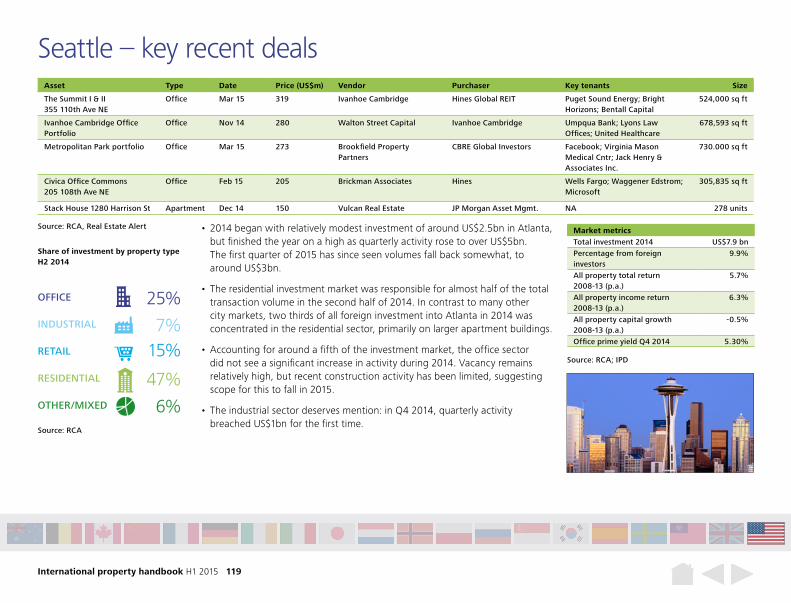
International property handbook H1 2015 119
Market metricsTotal investment 2014 US$7.9 bnPercentage from foreign investors
9.9%
All property total return 2008-13 (p.a.)
5.7%
All property income return 2008-13 (p.a.)
6.3%
All property capital growth 2008-13 (p.a.)
-0.5%
Office prime yield Q4 2014 5.30%
Seattle – key recent deals
• 2014 began with relatively modest investment of around US$2.5bn in Atlanta, but finished the year on a high as quarterly activity rose to over US$5bn. The first quarter of 2015 has since seen volumes fall back somewhat, to around US$3bn.
• The residential investment market was responsible for almost half of the total transaction volume in the second half of 2014. In contrast to many other city markets, two thirds of all foreign investment into Atlanta in 2014 was concentrated in the residential sector, primarily on larger apartment buildings.
• Accounting for around a fifth of the investment market, the office sector did not see a significant increase in activity during 2014. Vacancy remains relatively high, but recent construction activity has been limited, suggesting scope for this to fall in 2015.
• The industrial sector deserves mention: in Q4 2014, quarterly activity breached US$1bn for the first time.
Share of investment by property typeH2 2014
Source: RCA
Source: RCA, Real Estate Alert
Source: RCA; IPD
OFFICE 25%INDUSTRIAL 7%RETAIL 15%RESIDENTIAL 47%
6%
Asset Type Date Price (US$m) Vendor Purchaser Key tenants Size
The Summit I & II 355 110th Ave NE
Office Mar 15 319 Ivanhoe Cambridge Hines Global REIT Puget Sound Energy; Bright Horizons; Bentall Capital
524,000 sq ft
Ivanhoe Cambridge Office Portfolio
Office Nov 14 280 Walton Street Capital Ivanhoe Cambridge Umpqua Bank; Lyons Law Offices; United Healthcare
678,593 sq ft
Metropolitan Park portfolio Office Mar 15 273 Brookfield Property Partners
CBRE Global Investors Facebook; Virginia Mason Medical Cntr; Jack Henry & Associates Inc.
730.000 sq ft
Civica Office Commons 205 108th Ave NE
Office Feb 15 205 Brickman Associates Hines Wells Fargo; Waggener Edstrom; Microsoft
305,835 sq ft
Stack House 1280 Harrison St Apartment Dec 14 150 Vulcan Real Estate JP Morgan Asset Mgmt. NA 278 units
OTHER/MIXED
International property handbook H1 2015 120
Recent global research
Global economic outlook Q2 2015
Expectations & Market Realities in Real Estate 2015:
Scaling new heights February 2015
European CFO Survey Q1 2015
Reflexions magazine April 2015
M&A Index H1 2015
2015 Commercial Real Estate Outlook (US)
Asia Pacific economic outlook Q2 2015
UK Real Estate Predictions 2015

Deloitte refers to one or more of Deloitte Touche Tohmatsu Limited (“DTTL”), a UK private company limited by guarantee, and its network of member firms, each of which is a legally separate and independent entity. Please see www.deloitte.co.uk/about for a detailed description of the legal structure of DTTL and its member firms.
Deloitte LLP is the United Kingdom member firm of DTTL.
This publication has been written in general terms and therefore cannot be relied on to cover specific situations; application of the principles set out will depend upon the particular circumstances involved and we recommend that you obtain professional advice before acting or refraining from acting on any of the contents of this publication. Deloitte LLP would be pleased to advise readers on how to apply the principles set out in this publication to their specific circumstances. Deloitte LLP accepts no duty of care or liability for any loss occasioned to any person acting or refraining from action as a result of any material in this publication.
© 2015 Deloitte LLP. All rights reserved.
Deloitte LLP is a limited liability partnership registered in England and Wales with registered number OC303675 and its registered office at 2 New Street Square, London EC4A 3BZ, United Kingdom. Tel: +44 (0) 20 7936 3000 Fax: +44 (0) 20 7583 1198
Designed and produced by The Creative Studio at Deloitte, London. 44732A