simulated impedance of diffusion in porous media - nrel
TRANSCRIPT
Electrochimica Acta 251 (2017) 681–689
Simulated impedance of diffusion in porous media
Samuel J. Coopera,*, Antonio Berteib, Donal P. Fineganc,d, Nigel P. Brandonb
aDyson School of Design Engineering, Imperial College London, London, SW7 1NA, UKb Electrochemical Science and Engineering, Earth Science and Engineering, Imperial College London, London, SW7 2AZ, UKc Electrochemical Innovation Lab, Department of Chemical Engineering, University College London, London WC1E 7JE, UKdNational Renewable Energy Laboratory, 15013 Denver West Parkway, Golden, CO 80401, USA
A R T I C L E I N F O
Article history:Received 28 April 2017Received in revised form 24 July 2017Accepted 25 July 2017Available online 27 July 2017
Keywords:ImpedanceMicrostructureDiffusionTomographyEISWarburgTauFactor
A B S T R A C T
This paper describes the use of a frequency domain, finite-difference scheme to simulate the impedancespectra of diffusion in porous microstructures. Both open and closed systems are investigated for a rangeof ideal geometries, as well as some randomly generated synthetic volumes and tomographically derivedmicrostructural data. In many cases, the spectra deviate significantly from the conventional Warburg-type elements typically used to represent diffusion in equivalent circuit analysis. A key finding is thatcertain microstructures show multiple peaks in the complex plane, which may be misinterpreted asseparate electrochemical processes in real impedance data. This is relevant to battery electrode design asthe techniques for nano-scale fabrication become more widespread. This simulation tool is provided asan open-source MatLab application and is freely available online as part of the TauFactor platform.© 2017 The Authors. Published by Elsevier Ltd. This is an open access article under the CC BY license
(http://creativecommons.org/licenses/by/4.0/).
Contents lists available at ScienceDirect
Electrochimica Acta
journa l home page : www.e l sev ier .com/ loca te /e le cta cta
1. Introduction
Electrochemical impedance spectroscopy (EIS) is perhaps themost widely used technique for characterising electrochemicaldevices [1]. Either by fitting equivalent circuit models in thecomplex plane or by analysis of the distribution of relaxation times(DRT), it is possible to investigate and decouple the relativecontributions to the impedance made by the various physical andelectrochemical processes occurring in a cell [2].
Although cell electrodes are inherently three dimensionalobjects, the majority of elements in equivalent circuits (such asresistors, inductors and capacitors) are zero dimensional. Warburgelements are commonly used to model idealised one dimensionaldiffusion under a variety of boundary constraints. It is possible tofind analytical solutions, or reasonable approximations, to manycombinations of these boundary scenarios, such as Dirichlet (i.e.,specified concentration), Neumann (i.e., specified flux) and semi-infinite [3]. This allows conventional fitting algorithms toincorporate Warburg elements, without the additional computa-tional cost incurred by solving these domains numerically for eachset of parameters.
* Corresponding author.E-mail address: [email protected] (S.J. Cooper).
http://dx.doi.org/10.1016/j.electacta.2017.07.1520013-4686/© 2017 The Authors. Published by Elsevier Ltd. This is an open access artic
However, the pseudo-1D nature of Warburg elements requiresthat the intricate details of real 3D microstructures must besummarised with only a few bulk parameters, such as the porosityand tortuosity factor. The tortuosity factor is a measure of theresistance to diffusive transport caused by convolutions in the flowpaths [4]. As is shown later in this article, structures with verydifferent morphologies can have identical tortuosity factors andporosities. However, analysing structures across a range ofstimulation frequencies, as well as the usual steady-state analysis,enables some additional features of interest to be extracted thatmay be relevant to performance. Moreover, when analysingimpedance data, it would be of interest to know whether themicrostructure is responsible for deviations in the spectra awayfrom the conventional Warburg model [5].
The effect of pore geometry on impedance was first modelled indetail in a 1976 paper by Keiser et al. [6], following on closely fromthe work of De Levie [7], where a pseudo-3D numerical model wasused to generate impedance spectra for a range of closed poregeometries. The model uses a simplified transmission lineassemblage of series resistors and branching capacitors, withthe coefficients representing spatial distribution and axi-symme-try. The original paper is in German, but the concept wassummarised for a wider audience in a review of EIS methods byBarsoukov and Macdonald [2], which also reframes it in thecontext of penetration depths. Raistrick [8] points out thelimitations of the pseudo-3D approach and Eloot et al. [9] do
le under the CC BY license (http://creativecommons.org/licenses/by/4.0/).

682 S.J. Cooper et al. / Electrochimica Acta 251 (2017) 681–689
question the accuracy and relevance of Keiser’s result; however, asthese concerns are due in part to the assumptions required to makethe calculation computationally feasible under the constraints ofthe day, it is reasonable to expect that the general trends would stillbe valid. Although over 40 years have passed since the Keiser paper,the authors of this work were unable to find an instance where thenumerical results were directly used in the analysis of an EISspectrum. This is likely due to both the unavailability ofmicrostructural data and the computational expense of thesimulation.
However, despite the uncertainty surrounding the link betweenEIS spectra and the geometry of microstructures, very many papershave cited Keiser, as well as its subsequent mentions in books andarticles by Lasia [10–12], as a possible explanation for distortions inimpedance spectra. Malko et al. [13] used EIS to investigate PEMcarbon catalyst optimisation and attributed a deviation from theexpected 45� slope to the pore broadening/narrowing phenomenadiscussed by Keiser. Noack et al. [14] also cited Keiser to explainvariation in EIS results between samples of graphite felt electrodes.González-Buch et al. [15] used SEM image data to show that thetemplated pores in their metallic cathodes were narrowing cones,which lead them to conclude that their distorted EIS spectra couldbe explained by Keiser’s findings. A study by Cericola and Spahr[16] analysed the effect of particle size, shape, and orientation onthe performance of graphite electrodes and used Keiser’s results tointerpret a deviation from the expected 90� slope in the lowfrequency region of a blocked electrode. The degradation of siliconelectrodes was investigated by Radvanyi et al. [17] and once again,they associate evolution of features in the EIS data to changes in thegeometry of the system. A study by Wu et al. [18] on supercapacitorelectrodes found an additional “arc-shaped” feature in their EISdata which they conclude, citing Keiser, to be the result of transportprocesses in “orbicular pores”, after they systematically rule outother potential causes. Hitz and Lasia modelled “pear-shaped”pores similar to those investigated by Keiser and also observed asemi-cricle at high frequency, rather than the expected 45� slope[11]. As a final remark, Zhang et al. [19] highlighted the importanceof the pore geometry for designing advanced supercapacitorelectrodes, acknowledging that capturing non-uniform ion diffu-sion is crucial for high power performance. To clarify the cause ofvariation within the EIS spectra in each of the above cases, thematerial microstructures must be mapped in 3D and explored.
Recent advances in computed tomography (CT) have allowedthe details of porous microstructures to be captured at highresolution [20–23]. This microstructural data is typically stored ascuboid voxels, each containing a grayscale value related to the localdensity or atomic mass of the sample, depending on the techniqueused. A segmentation approach must typically then be employedto convert this grayscale data into a labelled volume (althoughsegmentation-free transport simulations are also possible [24]),representing the distribution of the various phases. As demon-strated in many recent studies [25–28], the segmented geometrydata can then be used to calculate various microstructuralparameters, such as the volume fractions, surface areas, triplephase boundary densities and tortuosity factors; all of which are ofinterest when trying to predict the performance of, for example, aporous electrochemical electrode
This article presents the implementation of a frequency domainfinite-difference solver, suitable for segmented tomographic data,applied to calculate the diffusive impedance spectra of porousmaterials. First, an investigation of some idealised geometries ispresented to aid the intuitive interpretation of the possible effectsby analysing several simple open and closed systems. Followingthis, the method is applied to some real geometries, derived fromtomographic data.
2. Method
2.1. Simulation
The solver used in this study is based on the finite-differenceapproach implemented in the open-source TauFactor platformrecently released by the authors [24]. TauFactor was originallydeveloped for quantifying diffusive tortuosity factors fromsegmented tomographic data by solving the steady-state diffusionequation between a pair of parallel Dirichlet boundaries. Althoughit is possible in principle to model a sinusoidal stimulation at one ofthe boundaries in the time domain, the computational cost wouldbe prohibitive. In this study, the system was transformed into thefrequency domain, where a sinusoidal stimulation is once againrepresented as a Dirichlet boundary condition. This approachallows the various optimization techniques already implementedin the TauFactor platform, such as over-relaxation, checkerboard-ing and vectorisation, to be used in the frequency domain,massively accelerating convergence (for more details, see [24]).
The system of equations in sys. (1) captures this steady-statediffusion problem in the frequency domain, including the fixedvalue (Dirichlet) conditions imposed at two parallel boundaries,where Q = (0, Lx) � (0, Ly) � (0, Lz) is a cuboid in R3 and V � Q is theregion of a porous medium inside Q where diffusion occurs. T, I andB are two-dimensional subsets of Q (i.e., Top, Interfacial andBottom), such that @V = T [ I [ B and @Vjz¼Lz ¼ B, @Vjz¼0 ¼ T,@Vj0<z<Lz ¼ I. The complex distribution of the diffusing speciesthrough the porous medium V is then modelled by the solution to
r2C � ivDC ¼ 0; in V;
C ¼ 0; on T;rC�n ¼ 0; on I;C ¼ 1; on B;
8>>>><>>>>:
ð1Þ
where n is the outward pointing unit normal to V; C is thecomplex concentration of the diffusing species; i is the imaginaryunit; D is the intrinsic diffusivity of transporting phase (set to 1 inall cases); and v is the frequency of the boundary stimulation,which is changed to calculate each point in a spectrum.
In the case where the top boundary is closed, the condition atboundary T simply becomes the same as boundary I. In all cases,convergence was measured by the stability of the compleximpedance measured at the stimulated boundary, B.
In each simulation, a characteristic frequency, vc, was defined,around which the frequency range [vc � 2�4, vc � 211] wasinvestigated.
vc ¼ D
L2ð2Þ
where, for open systems, L is the length of the control volume (CV)in the direction normal to the stimulated surface and, for closedsystems, L is equal to the maximum penetration distance from thestimulated surface to the tip of the longest pore path.
For each frequency, the impedance Z was calculated as the ratiobetween the amplitude of the concentration stimulus (1 in allcases) and the complex diffusion flux at the inlet boundary, andthen normalised to ~Z for ease of comparison by using Eq. (3).
Z� ¼ Z
ADL
ð3Þ
where, for open systems, A is the total area of the CV boundarynormal to the direction of flow and, for closed systems, A is the“mean accessible area”, which is defined as the algebraic mean areaaccessible to diffusion at each discrete depth into the porenetwork. Using this formulation also means that the low frequency

S.J. Cooper et al. / Electrochimica Acta 251 (2017) 681–689 683
intercept of open systems is equal to t=e, which is a usefulcharacteristic feature for comparison between structures.
In order to initialise the simulation of open systems, the steady-state time-domain solution was found first and used as the lowfrequency intercept (i.e., v = 0). For closed systems, the lowfrequency initialisation involved setting all voxels in V to
C ¼ 1 þ 0i.The physical interpretation of the transport equation and
boundary conditions described above are those of idealiseddiffusion with either applied concentrations or zero fluxes at theboundaries. This simple system does not reflect the coupled multi-physics processes occurring in a real electrochemical electrode,such as contributions to transport from convection and electricmigration, charge separation (i.e., double layers) near theboundaries or concentrated solution effects, which would requiremore general transport models based on the Poisson-Nernst-Planck equations [29]. However, it is worth considering that theseare the exact assumptions used in the standard Warburg model[30], which is widely used in EIS today. Furthermore, it is thesimplicity of this system which allows for the system to be solvedso quickly, using the tomography data directly as the nodes.
2.2. Example structures
The closed pore structures investigated in figure 4 of the articleby Keiser et al. [6] were approximately recreated in 2D using MSPaint. These 2D templates were then used to produce voxelisedaxi-symmetric volumes through a simple rotation algorithm.Simulations were run on both the 2D (i.e., prismatic) and 3Ddatasets. Due to the mirror symmetry of each structure in thedirection normal to the stimulating boundary, only half the 2Dstructures (128 � 128 voxels) and quarter of the 3D volumes (128 �128 � 128 voxels) were required for simulation. Straight(prismatic) closed pore systems are expected to recover theanalytical Finite Space Warburg (FSW) solution and, similarly,prismatic open pore systems should recreate a Finite LengthWarburg (FLW) solution.
Following this, a set of 6 new idealised 2D geometries were alsocreated, through trial and error, each of which had the samevolume fraction (e = 0.5) as well as the same tortuosity factor (t =1.57) in the vertical direction of the white phase. At steady-state,these structures are indistinguishable in terms of their diffusive
Fig.1. Simulated impedance spectra for 2D (l) and 3D (r) recreations of the 5 simple closeas normalised using Eq. (3), whereas the main axes employ a second normalisation such tcomparison of the shapes.
properties in the direction of interest; however, they would beexpected to have distinct frequency spectra.
The “Sierpinski carpet” and “Pythagoras tree” 2D fractalstructures were also investigated as they are commonly referencedin the literature as potential models for rough or multi-lengthscalesystems [31–37]. An open boundary (FLW) was given to theSierpinski carpets and, in order to converge to grid independentsolutions, 5 � 5 voxel regions were used to represent the smallestsquares, such that the sixth order carpet had the dimensions 3645� 3645. The Pythagoras trees are closed systems (FSW) and onlyrequired 250 � 250 pixels to resolve their features. Due to themirror symmetry of both fractals normal to the diffusion direction,only half the regions were required for simulation.
The fourth geometric category investigated was a 3D pseudo-random packing of spheres, which is a common model system forbattery and fuel cell electrodes [38]. Although homogenisationapproaches have been developed to represent these systems in 1D[39,40,30], extending this approach to 3D expands the design spacefor advanced electrodes by allowing for in-plane heterogeneity.The diffusion impedance from real battery systems typically comesfrom the solid phase diffusion in the radial direction withinparticles, rather than through the pore network [41,42]; however,anode-supported SOFCs can show losses from the extended,tortuous transport paths in the gas phase. The 3D packing ofspheres was generated to have a linearly increasing porosity in thedirection normal to the stimulated surface and it was analysed todevelop a better understanding of what may be possible in reality.
Finally, two real tomographic datasets were also investigated,which were taken from a previous article by the authors on batteryseparator materials (Celgard 2325 and Celgard 2500) [43]. Thesestructures where chosen because they have been manufactured toshow a pronounced variation in porosity in the through-planedirection.
3. Results
Figure 1 shows the results of the simulated impedancecalculations for the 2D and 3D creation of the 5 simple closed-pore geometries investigated by Keiser et al. [6].
The spectra of the seven 2D open-systems are shown in Fig. 2 .Each geometry has the same volume fraction of the white phase, aswell as the same steady-state response in the time domain whenan open boundary condition is used (i.e., the same tortuosity
d-pore geometries investigated by Keiser et al. [6]. The inset graphs show the spectrahat all spectra converge to the same value as the straight pore (1), to allow for clearer

Fig. 2. Simulated impedance spectra of 7 simple open-pore geometries, eachdesigned to have the same pore volume fraction and tortuosity factor in thedirection normal to the stimulated boundary (vertical). The transport is occurringthrough the white phase of each geometry, with a constant zero concentration atthe top surface and an applied sinusoidal concentration at the bottom.
684 S.J. Cooper et al. / Electrochimica Acta 251 (2017) 681–689
factor). This means that based on current electrode equivalentcircuit models, they would each be treated identically in terms oftransport. However, simulated impedance reveals significantdifferences in their spectra.
Although geometry 1 in Fig. 2 has a straight diffusion path, itstortuosity factor is the same as the other geometries due to theregion of isolated pore volume. However, the isolated volumesimply has the effect of linearly scaling the spectra, so it will still bethe same shape as the FLW solution, which is useful as a referencefor interpreting the other shapes. The tortuosity factors of the othersix geometries, although numerically identical, originate from a
Fig. 3. Simulated impedance spectra of two 2D fractals, as the fractal order increases for (aclosed ends.
variety of combinations of constriction and path length convolu-tion.
Figure 3 shows impedance plots for the first 6 orders of the two2D fractal systems considered. The inset of the Sierpinski carpetgraph shows the high frequency region in greater detail for the firstand last geometries only.
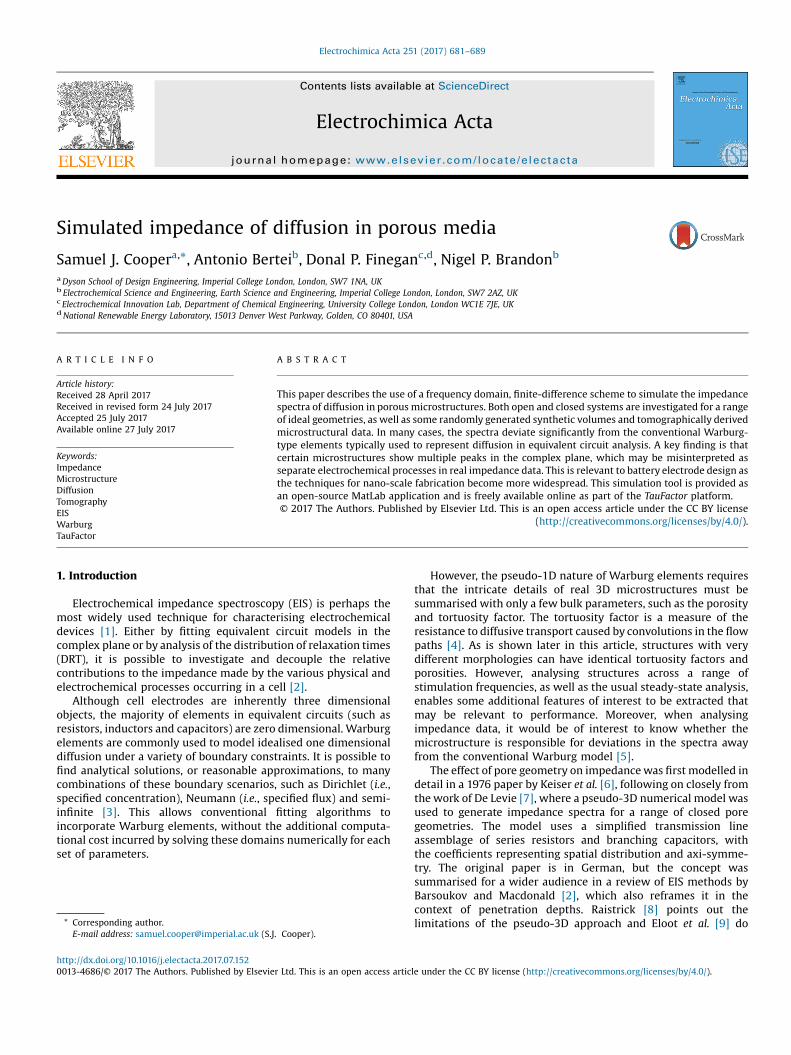
The four impedance spectra resulting from the analysis of twotomographic datasets of battery separator materials are shown inFig. 4 . The separators where imaged in a previous study by theauthors [43], which showed them to have variable porosity in thethrough-plane direction. The axes of these two plots have beenscaled such that the low frequency intercept of both samplesaligns. Representative slices from the segmented tomographicimages of the two samples are shown in the top right corner ofeach axis. Analytical spectra of FLW with the same low frequencyintercepts are also plotted for comparison. Circles have been usedto highlight the characteristic frequency of each spectrum.
Figure 5 shows the spectra obtained in a synthetic structure,generated by Monte Carlo algorithm [44], representing a 3Drandom packing of spherical particles linearly distributed alongthe vertical direction. The four simulations are obtained by flippingthe packing, in order to have a linearly increasing or decreasingporosity along the diffusion direction, and considering either openor closed boundary condition at the top. The distribution ofrelaxation times for the two open structures, performed by usingthe DRTtools toolbox [45], is shown in the inset of Fig. 5.
4. Discussion
4.1. Comparison with pseudo-3D models
The results in the two plots in Fig. 1 show the same generaltrends as those described by Keiser et al., despite the fact that thephysics being modelled in the two studies is not identical. TheKeiser et al. pseudo-3D model, as well as the models presented byde Levie [7] and Eloot et al. [9], consider the impedance generatedby a pore filled with an electrolyte with finite ohmic resistivitysurrounded by electrode walls having a specific surface capaci-tance. The diffusion impedance modelled in this study refers to a
) Sierpinski Carpet fractal with open boundaries and (b) Pythagoras Tree fractal with
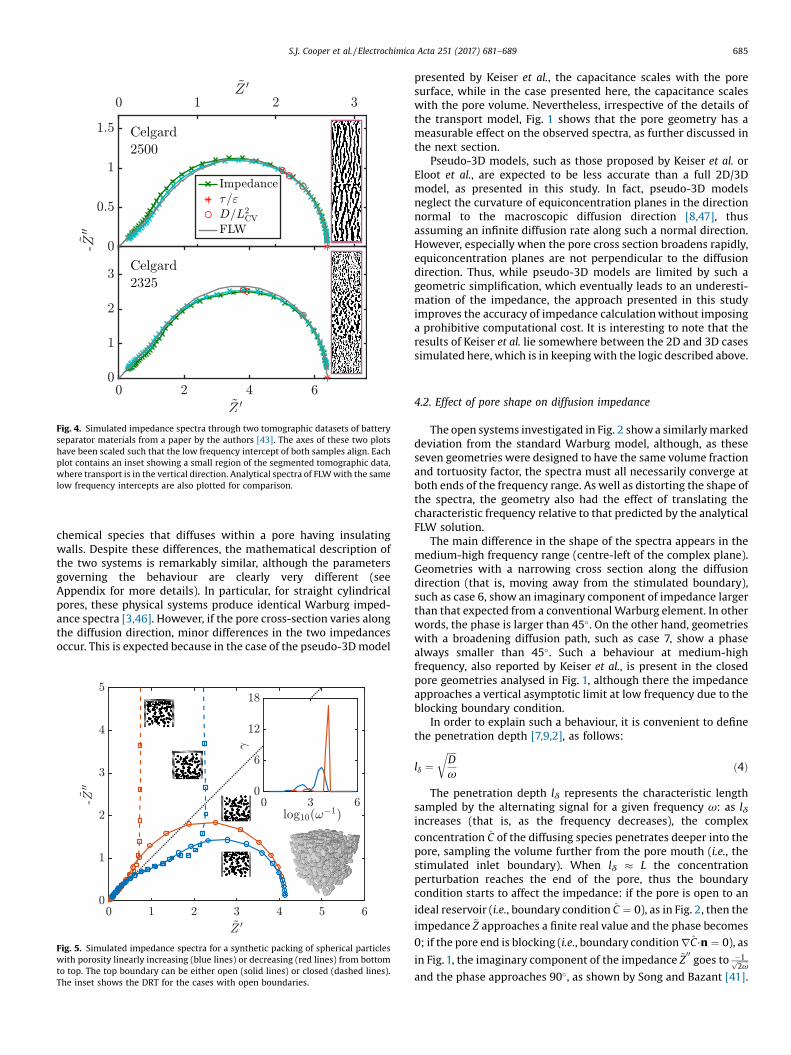
Fig. 4. Simulated impedance spectra through two tomographic datasets of batteryseparator materials from a paper by the authors [43]. The axes of these two plotshave been scaled such that the low frequency intercept of both samples align. Eachplot contains an inset showing a small region of the segmented tomographic data,where transport is in the vertical direction. Analytical spectra of FLW with the samelow frequency intercepts are also plotted for comparison.
S.J. Cooper et al. / Electrochimica Acta 251 (2017) 681–689 685
chemical species that diffuses within a pore having insulatingwalls. Despite these differences, the mathematical description ofthe two systems is remarkably similar, although the parametersgoverning the behaviour are clearly very different (seeAppendix for more details). In particular, for straight cylindricalpores, these physical systems produce identical Warburg imped-ance spectra [3,46]. However, if the pore cross-section varies alongthe diffusion direction, minor differences in the two impedancesoccur. This is expected because in the case of the pseudo-3D model
Fig. 5. Simulated impedance spectra for a synthetic packing of spherical particleswith porosity linearly increasing (blue lines) or decreasing (red lines) from bottomto top. The top boundary can be either open (solid lines) or closed (dashed lines).The inset shows the DRT for the cases with open boundaries.
presented by Keiser et al., the capacitance scales with the poresurface, while in the case presented here, the capacitance scaleswith the pore volume. Nevertheless, irrespective of the details ofthe transport model, Fig. 1 shows that the pore geometry has ameasurable effect on the observed spectra, as further discussed inthe next section.
Pseudo-3D models, such as those proposed by Keiser et al. orEloot et al., are expected to be less accurate than a full 2D/3Dmodel, as presented in this study. In fact, pseudo-3D modelsneglect the curvature of equiconcentration planes in the directionnormal to the macroscopic diffusion direction [8,47], thusassuming an infinite diffusion rate along such a normal direction.However, especially when the pore cross section broadens rapidly,equiconcentration planes are not perpendicular to the diffusiondirection. Thus, while pseudo-3D models are limited by such ageometric simplification, which eventually leads to an underesti-mation of the impedance, the approach presented in this studyimproves the accuracy of impedance calculation without imposinga prohibitive computational cost. It is interesting to note that theresults of Keiser et al. lie somewhere between the 2D and 3D casessimulated here, which is in keeping with the logic described above.
4.2. Effect of pore shape on diffusion impedance
The open systems investigated in Fig. 2 show a similarly markeddeviation from the standard Warburg model, although, as theseseven geometries were designed to have the same volume fractionand tortuosity factor, the spectra must all necessarily converge atboth ends of the frequency range. As well as distorting the shape ofthe spectra, the geometry also had the effect of translating thecharacteristic frequency relative to that predicted by the analyticalFLW solution.
The main difference in the shape of the spectra appears in themedium-high frequency range (centre-left of the complex plane).Geometries with a narrowing cross section along the diffusiondirection (that is, moving away from the stimulated boundary),such as case 6, show an imaginary component of impedance largerthan that expected from a conventional Warburg element. In otherwords, the phase is larger than 45�. On the other hand, geometrieswith a broadening diffusion path, such as case 7, show a phasealways smaller than 45�. Such a behaviour at medium-highfrequency, also reported by Keiser et al., is present in the closedpore geometries analysed in Fig. 1, although there the impedanceapproaches a vertical asymptotic limit at low frequency due to theblocking boundary condition.
In order to explain such a behaviour, it is convenient to definethe penetration depth [7,9,2], as follows:
ld ¼ffiffiffiffiDv
rð4Þ
The penetration depth ld represents the characteristic lengthsampled by the alternating signal for a given frequency v: as ldincreases (that is, as the frequency decreases), the complex
concentration C of the diffusing species penetrates deeper into thepore, sampling the volume further from the pore mouth (i.e., thestimulated inlet boundary). When ld � L the concentrationperturbation reaches the end of the pore, thus the boundarycondition starts to affect the impedance: if the pore is open to an
ideal reservoir (i.e., boundary condition C ¼ 0), as in Fig. 2, then theimpedance ~Z approaches a finite real value and the phase becomes
0; if the pore end is blocking (i.e., boundary condition rC�n ¼ 0), as
in Fig. 1, the imaginary component of the impedance ~Z00goes to �1ffiffiffiffiffi
2vp
and the phase approaches 90�, as shown by Song and Bazant [41].

686 S.J. Cooper et al. / Electrochimica Acta 251 (2017) 681–689
These two opposite behaviours can be used to explain theimpedance response at medium-high frequency in Fig. 2 for poreswith a narrowing or broadening cross section. When the pore crosssection narrows the diffusion flux is hindered, thus resembling theblocking wall boundary condition: as a consequence, the negativeimaginary component of the diffusion impedance rises and thephase is larger than 45� (e.g., Fig. 2, case 6). On the other hand, if thepore cross section broadens, the diffusion flux enters into a largerregion, which resembles a reservoir, thus the imaginary compo-nent of diffusion impedance decreases and the phase becomessmaller than 45� (e.g., Fig. 2, case 7). Therefore, the shape of thediffusion impedance in the complex plane can be related to thepore geometry, as similarly reported by Keiser et al. for a differentphysics.
The concept of penetration depth is also useful to explain thedifference between the impedance response of cases 4, 5 and 7 inFig. 2. All the pore shapes show a broadening cross section for thediffusing species, thus leading to a decrease in phase <45�. Sincethe broadening in case 7 is closer to the pore mouth than in cases 4and 5, the departure from the 45� slope occurs for a smallerpenetration depth ld in case 7, that is, for a larger frequencyaccording to Eq. (4), as shown in Fig. 2. As the broadening is furtherfrom the pore mouth, as in cases 4 and 5, the frequencycorresponding to the shift in phase becomes smaller.
Thus, since a change in pore cross section at a distance ld fromthe pore mouth is captured by a shift in phase in the complex plane,Eq. (4) can be used to estimate the expected frequency range wherea distortion in diffusion impedance will be revealed given thediffusivity D and the feature size ld. For example, a sharp variationin pore geometry at a distance ld = 1, 10, 1000 mm from the poreinlet will be detected by diffusion impedance in the frequencyrange v � 103, 10, 10�3 Hz in a liquid (D = 10�9 m s�2) or v � 107,105, 10 Hz in a gas (D = 10�5 m s�2), respectively.
The sequence of spectra in Fig. 3 a shows that as the order of thefractal increases, not only does its general resistance to transportincrease (low frequency intercept) due to the more tortuousdiffusion path, but there is also a change in shape of the highfrequency region. In line with the results in Fig. 2, the approachtowards the expected 45� line becomes increasingly steep as theseverity of the path narrowing increases near the stimulatedsurface. Conversely, in Fig. 3 b as the fractal order increases, a largerarea is available per unit penetration depth, increasing the extentto which the spectra stay below the 45� line in the medium-highfrequency range, being in qualitative agreement with thedepressed impedance arcs produced by hierarchical microstruc-tures [31], systems with distributed pore sizes [48] or those with“secondary” pore networks [36,37].
4.3. Application to real 3D structures and some practicalconsiderations
The spectra shown in Fig. 4, generated from tomographicvolumes of battery separator materials, show that these kind ofdistortions can even be detected in real materials that are fairlyhomogeneous. Although the distortions observed are relativelymodest compared to some of the synthetic geometries discussedearlier in the paper (in agreement with what has been previouslyreported by Candy et al. [49] for homogeneous spherical packings)they may still be noticeable in real EIS data. Beyond simply thedistortion to the shape, the most pronounced difference betweenthe spectra are the locations of the characteristic frequenciescompared to the analytical FLW solution. One potential explana-tion for this is the relative contribution of extended path lengthand path constriction in the observed tortuosity factor. This wouldsuggest that the Celgard 2325 structure has more convoluted flowpaths, meaning that the frequency at which the full thickness of the
system is probed is lower than the calculated value of vc. It isimportant to offer a cautionary note here that if the impedancespectrum of a tomographic dataset differs from the Warburgsolution, but there is no reason to expect a variable porosity in thedirection measured for the material as a whole, then the mostlikely explanation is that the volume analysed is too small and isnot a representative sample. TauFactor already offers severalmethods to evaluate the minimum representative volume for adiffusion simulation.
More pronounced distortions are revealed in the syntheticpacking structures with linearly distributed porosity as in Fig. 5.Functionally graded or multi-layered structures have beenincreasingly used for advanced electrodes in solid oxide fuel cells[50–53] and Li-ion batteries [54,55], although this approach hasreceived some criticism [56]. For such highly heterogeneousstructures, the impedance response of diffusing species differsremarkably from the conventional Warburg behaviour, as in Fig. 5.For example, the open structure with linearly increasing porosity(solid blue line) appears to have two distinct peaks, reflective oftwo different time constants. It is worth restating here, to avoid anyconfusion, that this model does not consider any electrochemistryand that the two observed peaks are both from a purely diffusiveprocess. Figure 5 also contains an inset showing the distribution ofrelaxation times (DRT) for the two open systems. Although the DRTspectrum for a FLW is expected to have many peaks, the secondarypeak is especially pronounced in this structure. Since DRT analysisis increasingly used as a screening tool to identify the number ofphysical/electrochemical processes to be associated with equiva-lent circuit elements [57], such a pronounced peak due merely tothe diffusion in an anisotropic microstructure might be misinter-preted for an additional electrochemical process, thus leading to amisuse of extra equivalent circuit elements as already discussed byBertei et al. [58].
Hence, once the electrode microstructure is known, for examplethrough computed tomography as in Fig. 4, the impedanceresponse due to the diffusion phenomena can be evaluated andsubtracted from the experimental spectra to focus on the otherelectrochemical phenomena of interest. Notably, the approach canbe reversed: provided that diffusion be the main phenomenontaking place in the electrode, diffusion impedance can be used as atool to infer microstructural information, similar to what iscurrently done with electrochemical porosimetry [59,60]. This iscertainly possible to some extent, as shown in the previous sectionregarding the shift in phase for narrowing or broadening crosssections, yet with some limitations. In fact, any heterogeneity inthe porous structure does produce a feature in the complex planeat a frequency roughly equal to the corresponding penetrationdepth (Eq. (4)), but different signals become more convoluted as ldincreases and are eventually affected by the pore-end boundarycondition for ld � L: beyond this penetration depth, that is, forfrequencies v < vc, the quality of microstructural information thatcan be inferred from diffusion impedance worsens dramatically.This means that heterogeneous features in the pore structure arebetter resolved when closer to the pore inlet at high frequency (i.e.,for v > vc). Moreover, the same diffusion impedance fingerprintcan be produced by different families of microstructures, thus thereconstruction of the porous structure from diffusion impedance isnot unequivocally determined. On the other hand, relevantmicrostructural metrics regarding the pore geometry can bedistinguished, such as the narrowing/broadening of cross sectionor decrease/increase in porosity as shown in Figs. 2 and 5.
This paper is intended to showcase the simulated impedancetechnique, but future studies will aim to analyse representativevolumes of tomographic data and compare these to measured EISspectra.

Fig. 6. Simulated phase angle against log frequency for three simple micro-
S.J. Cooper et al. / Electrochimica Acta 251 (2017) 681–689 687
5. Conclusions
The simulation approach presented in this paper allows theeffect of geometry on diffusion to be calculated and compared tothe conventional Warburg elements commonly used in equivalentcircuit models. The results for simple closed pore geometries agreewell with those presented by Keiser et al. . This study extends thework of Keiser et al. to include open systems, for which similardeviations from the spectra of the simple 1D case were alsoobserved. The simulation tool has been integrated into theTauFactor platform, which is specifically designed for the analysisof tomographic data.
Analysis of battery separator material tomography datasetsshowed minor deviations from the standard Warburg solution,depending on the direction analysed, while larger deviations arerevealed in synthetic electrodes with graded porosity or with fractalgeometry. The tool presented in this study is thus essential for theunderstanding, deconvolution and prediction of the diffusionimpedance response in heterogeneous porous media, especiallyfor advanced electrodes with engineered microstructure.
Acknowledgements
This project has received funding from the European Union’sHorizon 2020 research and innovation programme under theMarie-Skłodowska-Curie grant agreement No 654915 and theEPSRC grants EP/M014045/1 and EP/K002252/1. The authorswould like to thank Gavin Reade, Dr Vladimir Yufit, Prof. AnthonyKucernak and Prof. Alan Atkinson for useful discussions on EIS andmicrostructure, as well as Dr Paul Shearing for the use oftomography data acquired in his laboratory. Disclaimer: theEuropean Commission Research Executive Agency is not responsi-ble for any use that may be made of the information this papercontains.
Appendix A.
The three-dimensional diffusion problem can be reduced to apseudo-3D model in order to show the similarities with the modelspresented by Keiser et al. and Eloot et al. .
Let us call x the main direction of diffusion flux in the porousdomain. Assuming that the pore is axisymmetric and equiconcen-tration planes are normal to the diffusion direction x, the governingequation can be reduced to an ordinary differential equation asfollows:
ivCpr2dx ¼ � ddx
�DdCdxpr2
!dx; in 0 < x < L;
C ¼ 1; at x ¼ 0;( ðFLWÞ : C ¼ 0;
ðFSWÞ : � DdCdx
¼ 0;at x ¼ L;
8>>>>>>><>>>>>>>:
ðA:1Þ
where r represents the local pore radius, which is a function of x.System (A.1) can be recast in dimensionless form after defining
the dimensionless coordinate ~x ¼ x=L, the dimensionless radius~r ¼ r=r0 (where r0 is the pore radius at x = 0), and the characteristicfrequency vc ¼ D
L2as follows:
d2C
d~x2þ 2
~rd~rd~x
dCd~x
� ivvc
C ¼ 0; in 0 < ~x < 1;
C ¼ 1; at ~x ¼ 0;( ðFLWÞ : C ¼ 0;
ðFSWÞ :dCd~x
¼ 0;at ~x ¼ 1:
8>>>>>>>>><>>>>>>>>>:
ðA:2Þ
Let us now consider the impedance of an axisymmetric porefilled with an electrolyte, having constant conductivity s,surrounded by electrode walls with specific surface capacitancec, which is the same physics studied by Keiser et al. and Eloot et al..
The pseudo-3D model of such a system is as follows:
ivcV 2prdx ¼ � ddx
�sdVdxpr2
!dx; in 0 < x < L;
V ¼ 1; at x ¼ 0;( ðFLWÞ : V ¼ 0;
ðFSWÞ : � sdVdx
¼ 0;at x ¼ L;
8>>>>>>><>>>>>>>:
ðA:3Þ
where V is the complex electric potential.By considering the same dimensionless groups already defined
in Eq. (A.2), with the only exception for the characteristicfrequency vc ¼ sro
2cL2, Eq. (A.3) becomes:
d2V
d~x2þ 2
~rd~rd~x
dVd~x
� ivvc
V~r¼ 0; in 0 < ~x < 1;
V ¼ 1; at ~x ¼ 0;( ðFLWÞ : V ¼ 0;
ðFSWÞ :dVd~x
¼ 0;at ~x ¼ 1:
8>>>>>>><>>>>>>>:
ðA:4Þ
Equation (A.4) is very similar to the reduced diffusion model
reported in Eq. (A.2), where V ¼ C; s = D and 2cr0¼ 1. The only
difference is in the 1~r factor in the rightmost term of Eq. (A.4). Such a
factor comes from the fact that in this system the capacitancescales with the pore surface while in the diffusion problem themass-capacitance scales with the pore volume. However, when thepore radius is constant (~r ¼ 1), eqs. (A.2) and (A.4) are identical,thus they produce the same Warburg impedance responseirrespective of the different physics, except for a few dimensionalscaling factors, which do not affect the impedance shape in thecomplex plane.
The accuracy of the pseudo-3D model becomes questionable asthe assumption of equiconcentration planes perpendicular todiffusion direction no longer holds, such as for ratios of top tobottom cross section (AT/AB) much different from 1 as reported inFig. 6 . In such a case, the pseudo-3D model i) underestimates thediffusion resistance Z0(v = 0) and ii) overestimates the frequencydependence (i.e., ’(v) shifts slightly on the right towards larger
structures each with a different ratio of the inlet to outlet area.

688 S.J. Cooper et al. / Electrochimica Acta 251 (2017) 681–689
frequencies) in comparison with the 3D model. This is due to thefact that, in 3D and in reality, the diffusion flux perpendicular to x isfinite (that is, not infinite as assumed in pseudo-3D), thus resultingin a larger resistance and larger timescale than what predicted bythe pseudo-3D model.
References
[1] D.D. MacDonald, Reflections on the history of electrochemical impedancespectroscopy, Electrochimica Acta 51 (2006) 1376–1388.
[2] E. Barsoukov, J.R. Macdonald, Impedance Spectroscopy: Theory, Experiment,and Applications, 2nd Edition, (2005) .
[3] U. Tröltzsch, O. Kanoun, Generalization of transmission line models forderiving the impedance of diffusion and porous media, Electrochimica Acta 75(2012) 347–356.
[4] N. Epstein, On tortuosity and the tortuosity factor in flow and diffusionthrough porous media, Chemical Engineering Science 44 (1989) 777–779.
[5] J. Landesfeind, J. Hattendorff, A. Ehrl, W.A. Wall, H.A. Gasteiger, TortuosityDetermination of Battery Electrodes and Separators by ImpedanceSpectroscopy, Journal of The Electrochemical Society 163 (2016) A1373–A1387.
[6] H. Keiser, K.D. Beccu, M.A. Gutjahr, Abschätzung der porenstruktur poröserelektroden aus impedanzmessungen, Electrochimica Acta 21 (1976) 539–543.
[7] R. de Levie, On porous electrodes in electrolyte solutions: I. Capacitanceeffects, Electrochimica Acta 8 (1963) 751–780.
[8] I. Raistrick, Impedance studies of porous electrodes, Electrochimica Acta 35(1990) 1579–1586.
[9] K. Eloot, F. Debuyck, M. Moors, A.P. Van Peteghem, Calculation of theimpedance of noncylindrical pores Part I: Introduction of a matrix calculationmethod, Journal of Applied Electrochemistry 25 (1995) 326–333.
[10] A. Lasia, Electrochemical Impedance Spectroscopy and its Applications,volume 1, (2014) .
[11] C. Hitz, A. Lasia, Experimental study and modeling of impedance of the her onporous Ni electrodes, Journal of Electroanalytical Chemistry 500 (2001) 213–222.
[12] R. Jurczakowski, C. Hitz, A. Lasia, Impedance of porous Au based electrodes,Journal of Electroanalytical Chemistry 572 (2004) 355–366.
[13] D. Malko, T. Lopes, E.A. Ticianelli, A. Kucernak, A catalyst layer optimisationapproach using electrochemical impedance spectroscopy for PEM fuel cellsoperated with pyrolysed transition metal-N-C catalysts, Journal of PowerSources 323 (2016) 189–200.
[14] J. Noack, G. Cognard, M. Oral, M. Küttinger, N. Roznyatovskaya, K. Pinkwart, J.Tübke, Study of the long-term operation of a vanadium/oxygen fuel cell,Journal of Power Sources 326 (2016) 137–145.
[15] C. González-Buch, I. Herraiz-Cardona, E. Ortega, J. García-Antón, V. Pérez-Herranz, Study of the catalytic activity of 3D macroporous Ni and NiMocathodes for hydrogen production by alkaline water electrolysis, Journal ofApplied Electrochemistry 46 (2016) 791–803.
[16] D. Cericola, M.E. Spahr, Impedance Spectroscopic Studies of the PorousStructure of Electrodes containing Graphite Materials with Different ParticleSize and Shape, Electrochimica Acta 191 (2016) 558–566.
[17] E. Radvanyi, W. Porcher, E. De Vito, A. Montani, S. Franger, S. Jouanneau Si Larbi,Failure mechanisms of nano-silicon anodes upon cycling: an electrodeporosity evolution model, Physical Chemistry Chemical Physics 16 (2014)17142.
[18] H. Wu, X. Wang, L. Jiang, C. Wu, Q. Zhao, X. Liu, B. Hu, L. Yi, The effects ofelectrolyte on the supercapacitive performance of activated calcium carbide-derived carbon, Journal of Power Sources 226 (2013) 202–209.
[19] Y. Zhang, L. Liu, On Diffusion in Heterogeneous Media, American Journal ofScience 312 (2013) 1028–1047.
[20] D.S. Eastwood, R.S. Bradley, F. Tariq, S.J. Cooper, O.O. Taiwo, J. Gelb, A. Merkle, D.J.L. Brett, N.P. Brandon, P.J. Withers, P.D. Lee, P.R. Shearing, The application ofphase contrast X-ray techniques for imaging Li-ion battery electrodes, NuclearInstruments and Methods in Physics Research Section B: Beam Interactionswith Materials and Atoms 324 (2014) 118–123.
[21] N. Ni, S.J. Cooper, R. Williams, N. Kemen, D.W. McComb, S.J. Skinner,Degradation of (La 0.6 Sr 0.4) 0.95 (Co 0.2 Fe 0.8)O 3-d Solid Oxide Fuel CellCathodes at the Nanometer Scale and below, ACS Applied Materials &Interfaces 8 (2016) 17360–17370.
[22] L. Holzer, B. Iwanschitz, T. Hocker, B. M??nch, M. Prestat, D. Wiedenmann, U.Vogt, P. Holtappels, J. Sfeir, A. Mai, T. Graule, Microstructure degradation ofcermet anodes for solid oxide fuel cells: Quantification of nickel grain growthin dry and in humid atmospheres, Journal of Power Sources 196 (2011) 1279–1294.
[23] P. Pietsch, V. Wood, X-Ray Tomography for Lithium Ion Battery Research: APractical Guide, Annu. Rev. Mater. Res 47 (2017) 12.1-12.29.
[24] S.J. Cooper, A. Bertei, P.R. Shearing, J.A. Kilner, N.P. Brandon, TauFactor: Anopen-source application for calculating tortuosity factors from tomographicdata, SoftwareX 5 (2016) 203–210.
[25] P.R. Shearing, N.P. Brandon, J. Gelb, R. Bradley, P.J. Withers, A.J. Marquis, S.J.Cooper, S.J. Harris, Multi Length Scale Microstructural Investigations of aCommercially Available Li-Ion Battery Electrode, Journal of theElectrochemical Society 159 (2012) A1023–A1027.
[26] J. Joos, M. Ender, I. Rotscholl, N.H. Menzler, E. Ivers-Tiffée, Quantification ofdouble-layer Ni/YSZ fuel cell anodes from focused ion beam tomography data,Journal of Power Sources 246 (2014) 819–830.
[27] F. Tariq, M. Kishimoto, S.J. Cooper, P.R. Shearing, N.P. Brandon, Advanced 3DImaging and Analysis of SOFC Electrodes, ECS Transactions 57 (2013) 2553–2562.
[28] Y.C. Karen Chen-Wiegart, J.S. Cronin, Q. Yuan, K.J. Yakal-Kremski, S.a. Barnett, J.Wang, 3D Non-destructive morphological analysis of a solid oxide fuel cellanode using full-field X-ray nano-tomography, Journal of Power Sources 218(2012) 348–351.
[29] J.R. Macdonald, Utility and Importance of Poisson-Nernst-Planck Immittance-Spectroscopy Fitting Models, The Journal of Physical Chemistry C 117 (2013)23433–23450.
[30] S. Devan, V.R. Subramanian, R.E. White, Analytical Solution for the Impedanceof a Porous Electrode, Journal of The Electrochemical Society 151 (2004) A905.
[31] M. Eikerling, A.A. Kornyshev, E. Lust, Optimized Structure of NanoporousCarbon-Based Double-Layer Capacitors, Journal of The Electrochemical Society152 (2005) E24.
[32] J. Schröttle, A. Dörnbrack, Turbulence structure in a diabatically heated forestcanopy composed of fractal Pythagoras trees, Theoretical and ComputationalFluid Dynamics 27 (2013) 337–359.
[33] A. Ebrahimi Khabbazi, J. Hinebaugh, A. Bazylak, Analytical tortuosity-porositycorrelations for Sierpinski carpet fractal geometries, Chaos, Solitons & Fractals78 (2015) 124–133.
[34] T.C. Halsey, M. Leibig, The double layer impedance at a rough electrode: arandom walk method, Electrochimica Acta 36 (1991) 1699–1702.
[35] M. Leibig, T.C. Halsey, The double-layer impedance at a rough surface:numerical results, Journal of Electroanalytical Chemistry 358 (1993) 77–109.
[36] Y. Gourbeyre, B. Tribollet, C. Dagbert, L. Hyspecka, A Physical Model forAnticorrosion Behavior of Duplex Coatings, Journal of The ElectrochemicalSociety 153 (2006) B162.
[37] M. Itagaki, Y. Hatada, I. Shitanda, K. Watanabe, Complex impedance spectra ofporous electrode with fractal structure, Electrochimica Acta 55 (2010) 6255–6262.
[38] G.M. Goldin, A.M. Colclasure, A.H. Wiedemann, R.J. Kee, Three-dimensionalparticle-resolved models of Li-ion batteries to assist the evaluation ofempirical parameters in one-dimensional models, Electrochimica Acta 64(2012) 118–129.
[39] M. Doyle, J.P. Meyers, J. Newman, Computer Simulations of the ImpedanceResponse of Lithium Rechargeable Batteries, Journal of The ElectrochemicalSociety 147 (2000) 99.
[40] J.P. Meyers, M. Doyle, R.M. Darling, J. Newman, The Impedance Response of aPorous Electrode Composed of Intercalation Particles, Journal of TheElectrochemical Society 147 (2000) 2930.
[41] J. Song, M.Z. Bazant, Effects of Nanoparticle Geometry and Size Distribution onDiffusion Impedance of Battery Electrodes, Journal of the ElectrochemicalSociety 160 (2013) A15–A24.
[42] J. Song, M.Z. Bazant, Electrochemical Impedance of a Battery Electrode withAnisotropic Active Particles, Electrochimica Acta 131 (2014) 214–227.
[43] D.P. Finegan, S.J. Cooper, B. Tjaden, O.O. Taiwo, J. Gelb, G. Hinds, D.J.L. Brett, P.R.Shearing, Characterising the structural properties of polymer separators forlithium-ion batteries in 3D using phase contrast X-ray microscopy, Journal ofPower Sources 333 (2016) 184–192.
[44] C. Chueh, A. Bertei, J. Pharoah, C. Nicolella, Effective conductivity in randomporous media with convex and non-convex porosity, International Journal ofHeat and Mass Transfer 71 (2014) 183–188.
[45] T.H. Wan, M. Saccoccio, C. Chen, F. Ciucci, Influence of the DiscretizationMethods on the Distribution of Relaxation Times Deconvolution:Implementing Radial Basis Functions with DRTtools, Electrochimica Acta 184(2015) 483–499.
[46] M. Bazant, Electrochemical Energy Systems, Spring 2011, in: ElectrochemicalEnergy Systems, volume 626, MIT OpenCourseWare, 2011.
[47] J. Gunning, The exact impedance of the de Levie grooved electrode, Journal ofElectroanalytical Chemistry 392 (1995) 1–11.
[48] M. Musiani, M. Orazem, B. Tribollet, V. Vivier, Impedance of blockingelectrodes having parallel cylindrical pores with distributed radii,Electrochimica Acta 56 (2011) 8014–8022.
[49] J.-P. Candy, P. Fouilloux, M. Keddam, H. Takenouti, The characterization ofporous electrodes by impedance measurements, Electrochimica Acta 26(1981) 1029–1034.
[50] D. Simwonis, H. Thülen, F. Dias, A. Naoumidis, D. Stöver, Properties of Ni/YSZporous cermets for SOFC anode substrates prepared by tape casting and coat-mix1 process, Journal of Materials Processing Technology 92 (1999) 107–111.
[51] Y. Liu, C. Compson, M. Liu, Nanostructured and functionally graded cathodesfor intermediate temperature solid oxide fuel cells, Journal of Power Sources138 (2004) 194–198.
[52] E.S. Greene, W.K. Chiu, M.G. Medeiros, Mass transfer in graded microstructuresolid oxide fuel cell electrodes, Journal of Power Sources 161 (2006) 225–231.
[53] S.W. Sofie, Fabrication of Functionally Graded and Aligned Porosity in ThinCeramic Substrates With the Novel Freeze?Tape-Casting Process, Journal ofthe American Ceramic Society 90 (2007) 2024–2031.
[54] V. Ramadesigan, R.N. Methekar, F. Latinwo, R.D. Braatz, V.R. Subramanian,Optimal Porosity Distribution for Minimized Ohmic Drop across a PorousElectrode, Journal of The Electrochemical Society 157 (2010) A1328.
[55] S. Golmon, K. Maute, M.L. Dunn, A design optimization methodology for Li+batteries, Journal of Power Sources 253 (2014) 239–250.

S.J. Cooper et al. / Electrochimica Acta 251 (2017) 681–689 689
[56] Y. Dai, V. Srinivasan, On Graded Electrode Porosity as a Design Tool forImproving the Energy Density of Batteries, Journal of The ElectrochemicalSociety 163 (2016) A406–A416.
[57] A. Weber, S. Dierickx, A. Kromp, E. Ivers-Tiffée, Sulfur Poisoning of Anode-Supported SOFCs under Reformate Operation, Fuel Cells 13 (2013) 487–493.
[58] A. Bertei, G. Arcolini, C. Nicolella, P. Piccardo, Effect of Non-Uniform ElectrodeMicrostructure in Gas Diffusion Impedance, ECS Transactions 68 (2015) 2897–2905.
[59] H.-K. Song, Y.-H. Jung, K.-H. Lee, L.H. Dao, Electrochemical impedancespectroscopy of porous electrodes: the effect of pore size distribution,Electrochimica Acta 44 (1999) 3513–3519.
[60] H.-K. Song, J.-H. Sung, Y.-H. Jung, K.-H. Lee, L.H. Dao, M.-H. Kim, H.-N. Kim,Electrochemical Porosimetry, Journal of The Electrochemical Society 151(2004) E102.