imaging of mixing of two miscible liquids using electrical impedance tomography and linear impedance...
TRANSCRIPT
5th World Congress on Industrial Process Tomography, Bergen, Norway
1�
Imaging of mixing of two miscible liquids using electrical
impedance tomography Jari Kourunen1, Lasse M. Heikkinen1, Marko Vauhkonen1, Ritva Käyhkö2, Jouni Matula2, Jari Käyhkö3
1Department of Physics, University of Kuopio, P.O.Box 1627, FIN-70211 Kuopio, Finland, 2Wetend
Technologies Ltd, Kaartilantie 7, FIN-57230 Savonlinna, Finland, 3Lappeenranta University of Technology, FiberLaboratory, Vipusenkatu 10, FIN-57200 Savonlinna
ABSTRACT
The objective of this paper is to study mixing of two miscible liquids in turbulent flow. Strictly speaking we are studying the performance and mixing patterns of TrumpJet® mixing system of papermaking chemicals and additives. TrumpJet® is a jet injection mixer developed and produced by Wetend Technologies Ltd. The studies are made in cooperation with the company. As a monitoring system, we use an electrical impedance tomography system developed at the Department of Physics, University of Kuopio. In this study only eight current injections are used and 64 corresponding voltages are measured. The frame rate of the system is about 40 frames/s. Difference reconstruction approach is used to produce three-dimensional images of the conductivity distribution. In order to quantify the quality of mixing, mixing index is calculated based on the reconstructed images. Laboratory tests are done in pilot plant. We compare the mixing of chemical to the main flow with TrumpJet technology to conventional chemical injection system.
Keywords Electrical impedance tomography, liquid-liquid mixing, 3D-imaging
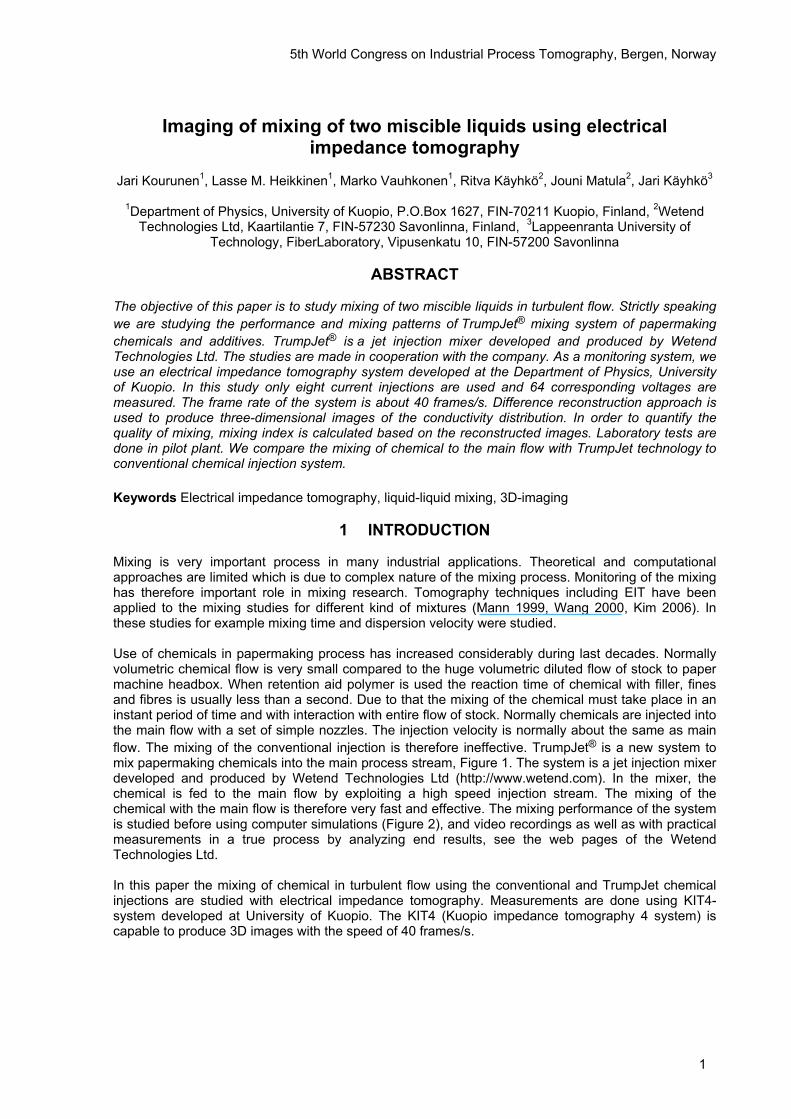
1 INTRODUCTION Mixing is very important process in many industrial applications. Theoretical and computational approaches are limited which is due to complex nature of the mixing process. Monitoring of the mixing has therefore important role in mixing research. Tomography techniques including EIT have been applied to the mixing studies for different kind of mixtures (Mann 1999, Wang 2000, Kim 2006). In these studies for example mixing time and dispersion velocity were studied. Use of chemicals in papermaking process has increased considerably during last decades. Normally volumetric chemical flow is very small compared to the huge volumetric diluted flow of stock to paper machine headbox. When retention aid polymer is used the reaction time of chemical with filler, fines and fibres is usually less than a second. Due to that the mixing of the chemical must take place in an instant period of time and with interaction with entire flow of stock. Normally chemicals are injected into the main flow with a set of simple nozzles. The injection velocity is normally about the same as main flow. The mixing of the conventional injection is therefore ineffective. TrumpJet® is a new system to mix papermaking chemicals into the main process stream, Figure 1. The system is a jet injection mixer developed and produced by Wetend Technologies Ltd (http://www.wetend.com). In the mixer, the chemical is fed to the main flow by exploiting a high speed injection stream. The mixing of the chemical with the main flow is therefore very fast and effective. The mixing performance of the system is studied before using computer simulations (Figure 2), and video recordings as well as with practical measurements in a true process by analyzing end results, see the web pages of the Wetend Technologies Ltd. In this paper the mixing of chemical in turbulent flow using the conventional and TrumpJet chemical injections are studied with electrical impedance tomography. Measurements are done using KIT4-system developed at University of Kuopio. The KIT4 (Kuopio impedance tomography 4 system) is capable to produce 3D images with the speed of 40 frames/s.
5th World Congress on Industrial Process Tomography, Bergen, Norway
2
Figure 1: TrumpJet® injection mixer.
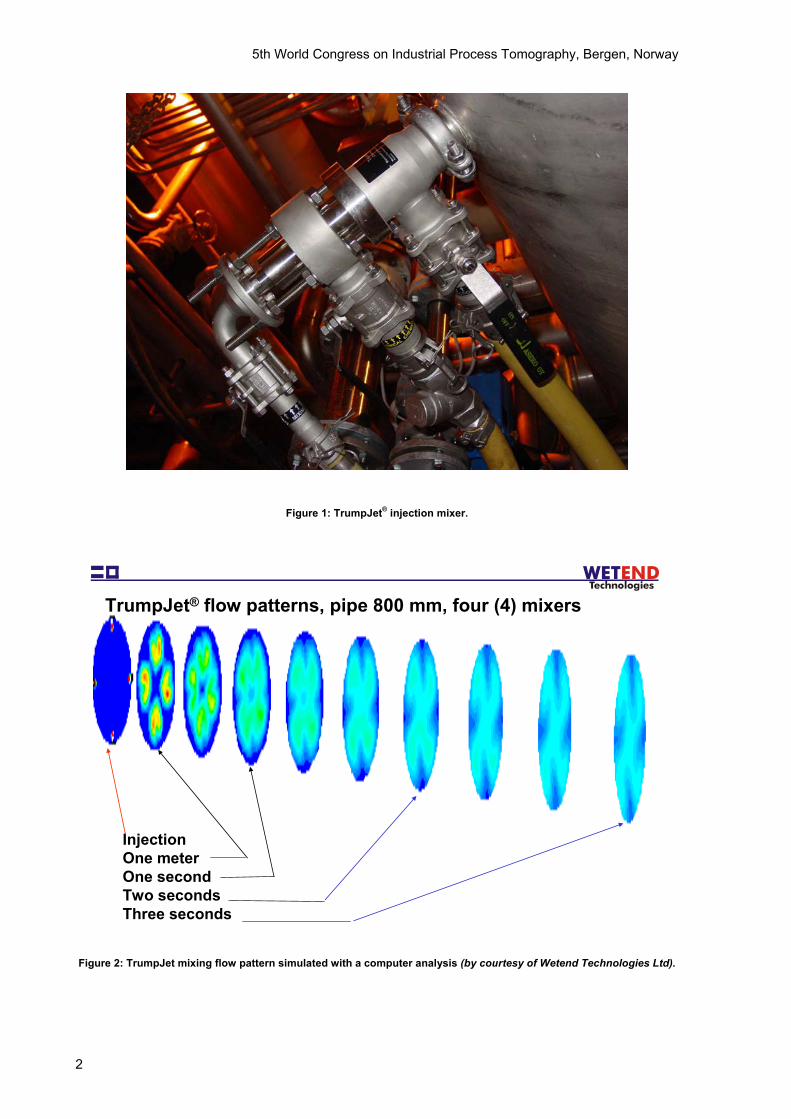
InjectionOne meterOne secondTwo secondsThree seconds
TrumpJet® flow patterns, pipe 800 mm, four (4) mixers
WETENDTechnologies
Figure 2: TrumpJet mixing flow pattern simulated with a computer analysis (by courtesy of Wetend Technologies Ltd).
5th World Congress on Industrial Process Tomography, Bergen, Norway
3�
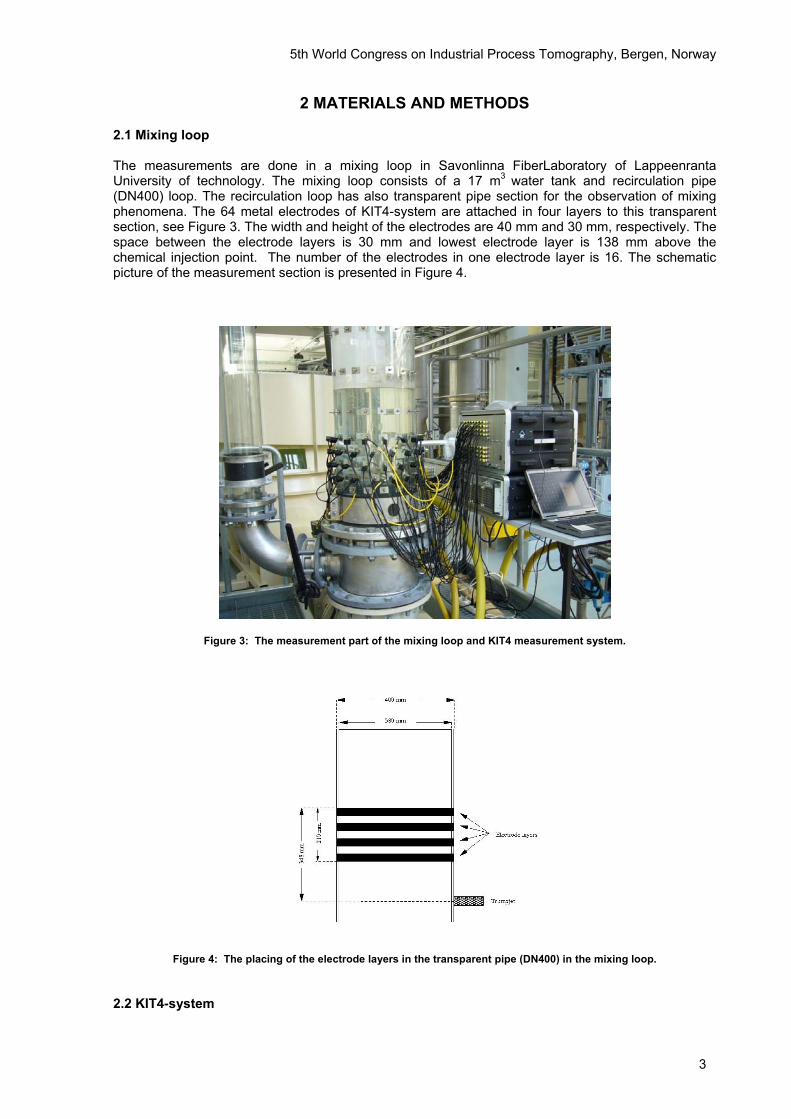
2 MATERIALS AND METHODS 2.1 Mixing loop The measurements are done in a mixing loop in Savonlinna FiberLaboratory of Lappeenranta University of technology. The mixing loop consists of a 17 m3 water tank and recirculation pipe (DN400) loop. The recirculation loop has also transparent pipe section for the observation of mixing phenomena. The 64 metal electrodes of KIT4-system are attached in four layers to this transparent section, see Figure 3. The width and height of the electrodes are 40 mm and 30 mm, respectively. The space between the electrode layers is 30 mm and lowest electrode layer is 138 mm above the chemical injection point. The number of the electrodes in one electrode layer is 16. The schematic picture of the measurement section is presented in Figure 4.
Figure 3: The measurement part of the mixing loop and KIT4 measurement system.
Figure 4: The placing of the electrode layers in the transparent pipe (DN400) in the mixing loop. 2.2 KIT4-system

5th World Congress on Industrial Process Tomography, Bergen, Norway
4
KIT4-system is newest EIT system developed at the Department of physics, University of Kuopio (Kourunen 2007). The system is modular and adaptive. Moreover, it consists of 16 independent current injection channels and 80 simultaneously sampled measurement channels, real-time controller and a host PC. The analogy output (waveform) cards, the analogy input cards and the system controller are produced by National Instruments. The voltage-to-current converters and the pre-amplifier units for the voltage measurement are produced by Kuopio research group. The amplitude and frequency of the injected current are from 0 to 5 mA and from 1 kHz to 100 kHz, respectively. The input range of the measured voltages is ±10 V. Many parameters of the system effect to the speed of the system. In this paper the imaging rate of the system is tuned to be about 40 frames/s. Furthermore, phase information of the measured voltages is ignored i.e. only conductivity images can be reconstructed. In this paper the current injection procedure is opposite one, which has been modified for 3D as presented in the earlier research report of Heikkinen (Heikkinen 2006). In this procedure only 8 independent current patterns are used. The amplitude and frequency of injected current are 3 mA and 10 kHz, respectively. Voltages for each current injection are measured simultaneously from all the electrodes against the ground electrode, which is one of the current injection electrodes. The length of the total data vector for each frame is 512. Image reconstructions approach used in this paper is similar as presented in (Heikkinen 2006). As a summary, the following main steps are included in the procedure to produce 3D ERT images in real time.
1. A reference data set 0V is measured. The best homogeneous conductivity σ0 and the
electrode contact impedances 64,...,1, =izi are estimated based on the reference data set using mesh 1, see Figure 5.
2. A matrix K is constructed for the image reconstruction
1111 )( −−−− ΓΓ+Γ= vT
prvT JJJK ,
where the Jacobian J is computed in ),( 0 izσ using mesh 1. The computed Jacobian is
mapped to the mesh 2. The number of the estimated parameters is therefore 3150. The matrix
vΓ is a noise covariance matrix and prΓ is a prior covariance matrix.
3. Now the estimated conductivity distribution σ can be written in form VK∆+= 0σσ
where V∆ is difference between the measured voltage V and the reference voltage 0V .
4. The result vector σ is sent to the visualization software. The conductivity is visualized in the mesh 2.
5th World Congress on Industrial Process Tomography, Bergen, Norway
5�
a) b)
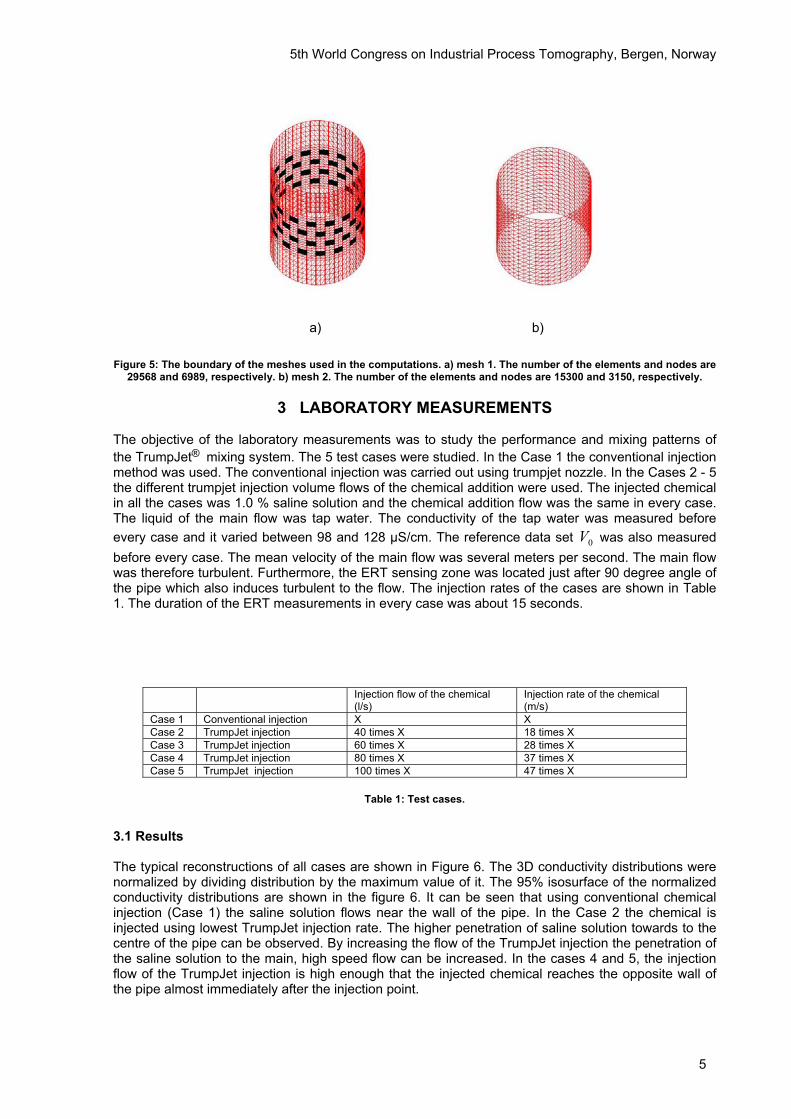
Figure 5: The boundary of the meshes used in the computations. a) mesh 1. The number of the elements and nodes are
29568 and 6989, respectively. b) mesh 2. The number of the elements and nodes are 15300 and 3150, respectively.
3 LABORATORY MEASUREMENTS The objective of the laboratory measurements was to study the performance and mixing patterns of the TrumpJet® mixing system. The 5 test cases were studied. In the Case 1 the conventional injection method was used. The conventional injection was carried out using trumpjet nozzle. In the Cases 2 - 5 the different trumpjet injection volume flows of the chemical addition were used. The injected chemical in all the cases was 1.0 % saline solution and the chemical addition flow was the same in every case. The liquid of the main flow was tap water. The conductivity of the tap water was measured before every case and it varied between 98 and 128 µS/cm. The reference data set 0V was also measured before every case. The mean velocity of the main flow was several meters per second. The main flow was therefore turbulent. Furthermore, the ERT sensing zone was located just after 90 degree angle of the pipe which also induces turbulent to the flow. The injection rates of the cases are shown in Table 1. The duration of the ERT measurements in every case was about 15 seconds.
Injection flow of the chemical (l/s)
Injection rate of the chemical (m/s)
Case 1 Conventional injection X X Case 2 TrumpJet injection 40 times X 18 times X Case 3 TrumpJet injection 60 times X 28 times X Case 4 TrumpJet injection 80 times X 37 times X Case 5 TrumpJet injection 100 times X 47 times X
Table 1: Test cases.
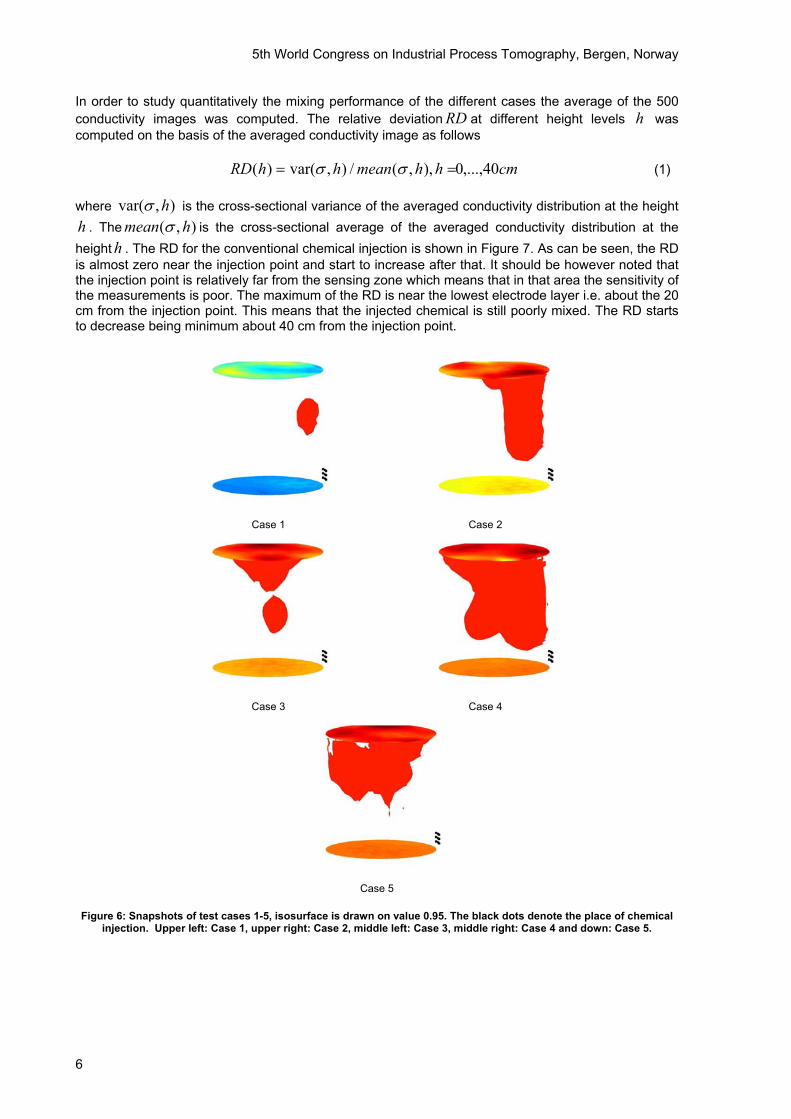
3.1 Results The typical reconstructions of all cases are shown in Figure 6. The 3D conductivity distributions were normalized by dividing distribution by the maximum value of it. The 95% isosurface of the normalized conductivity distributions are shown in the figure 6. It can be seen that using conventional chemical injection (Case 1) the saline solution flows near the wall of the pipe. In the Case 2 the chemical is injected using lowest TrumpJet injection rate. The higher penetration of saline solution towards to the centre of the pipe can be observed. By increasing the flow of the TrumpJet injection the penetration of the saline solution to the main, high speed flow can be increased. In the cases 4 and 5, the injection flow of the TrumpJet injection is high enough that the injected chemical reaches the opposite wall of the pipe almost immediately after the injection point.
5th World Congress on Industrial Process Tomography, Bergen, Norway
6
In order to study quantitatively the mixing performance of the different cases the average of the 500 conductivity images was computed. The relative deviationRD at different height levels h was computed on the basis of the averaged conductivity image as follows
cmhhmeanhhRD 40,...,0),,(/),var()( == σσ (1) where ),var( hσ is the cross-sectional variance of the averaged conductivity distribution at the height h . The ),( hmean σ is the cross-sectional average of the averaged conductivity distribution at the heighth . The RD for the conventional chemical injection is shown in Figure 7. As can be seen, the RD is almost zero near the injection point and start to increase after that. It should be however noted that the injection point is relatively far from the sensing zone which means that in that area the sensitivity of the measurements is poor. The maximum of the RD is near the lowest electrode layer i.e. about the 20 cm from the injection point. This means that the injected chemical is still poorly mixed. The RD starts to decrease being minimum about 40 cm from the injection point.
Case 1 Case 2
Case 3 Case 4
Case 5
Figure 6: Snapshots of test cases 1-5, isosurface is drawn on value 0.95. The black dots denote the place of chemical
injection. Upper left: Case 1, upper right: Case 2, middle left: Case 3, middle right: Case 4 and down: Case 5.
5th World Congress on Industrial Process Tomography, Bergen, Norway
7�
Figure 7: The RD for the Case 1 as a function of height. The black dotted line denotes the place of chemical injection. Two dash-dotted lines denote the places of the first and fourth electrode layers.
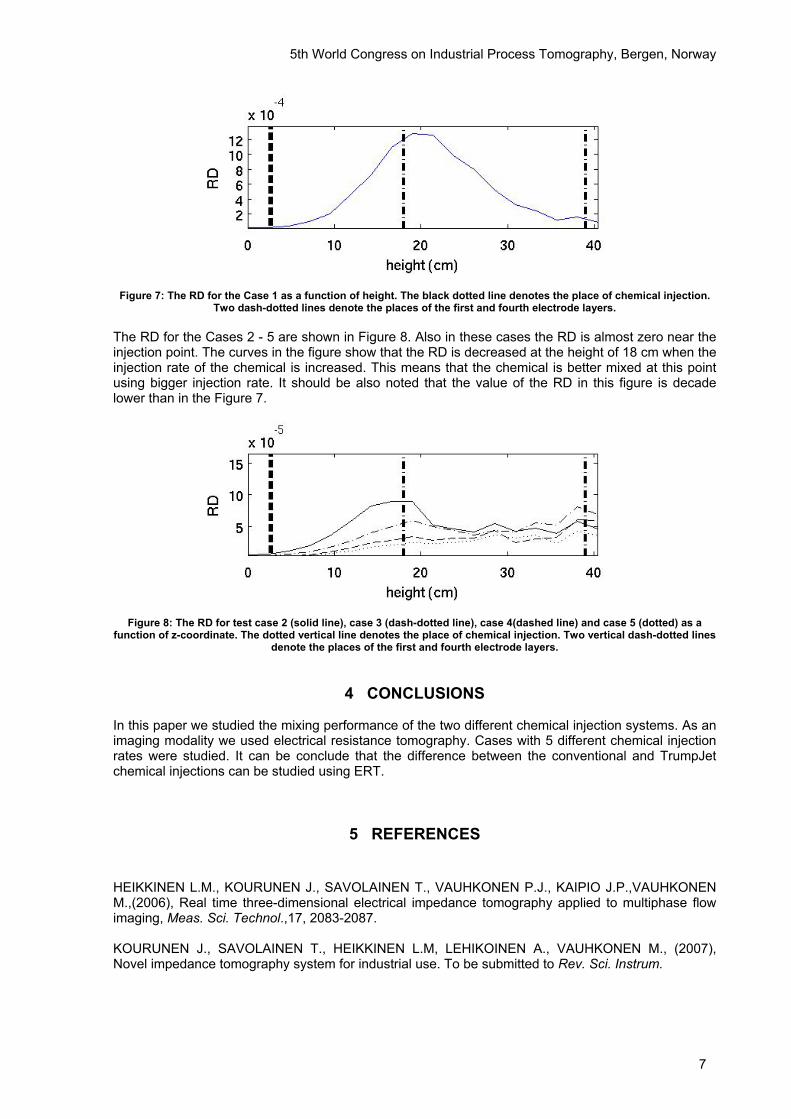
The RD for the Cases 2 - 5 are shown in Figure 8. Also in these cases the RD is almost zero near the injection point. The curves in the figure show that the RD is decreased at the height of 18 cm when the injection rate of the chemical is increased. This means that the chemical is better mixed at this point using bigger injection rate. It should be also noted that the value of the RD in this figure is decade lower than in the Figure 7.
Figure 8: The RD for test case 2 (solid line), case 3 (dash-dotted line), case 4(dashed line) and case 5 (dotted) as a function of z-coordinate. The dotted vertical line denotes the place of chemical injection. Two vertical dash-dotted lines
denote the places of the first and fourth electrode layers.
4 CONCLUSIONS In this paper we studied the mixing performance of the two different chemical injection systems. As an imaging modality we used electrical resistance tomography. Cases with 5 different chemical injection rates were studied. It can be conclude that the difference between the conventional and TrumpJet chemical injections can be studied using ERT.
5 REFERENCES
HEIKKINEN L.M., KOURUNEN J., SAVOLAINEN T., VAUHKONEN P.J., KAIPIO J.P.,VAUHKONEN M.,(2006), Real time three-dimensional electrical impedance tomography applied to multiphase flow imaging, Meas. Sci. Technol.,17, 2083-2087. KOURUNEN J., SAVOLAINEN T., HEIKKINEN L.M, LEHIKOINEN A., VAUHKONEN M., (2007), Novel impedance tomography system for industrial use. To be submitted to Rev. Sci. Instrum.

5th World Congress on Industrial Process Tomography, Bergen, Norway
8
KIM S., NKAYA N. A., DYAKOWSKI T., (2006), Measurement of mixing of two miscible liquids in a stirred vessel with electrical resistance tomography, Int. Comm. Heat. Mass. Transfer, 33(9), 1088-1095. MANN R., WANG W., FORREST A.E., HOLDEN P.J., DICKIN F.J., DYAKOWSKI T., EDWARDS R.B., (1999) Gas-liquid and miscible liquid mixing in a plant-scale vessel monitored using electrical resistance tomography, Chem. Eng. Comm., 175, 39-48. WANG M., DORWARD A., VLAEV D., MANN R., (2000), Measurements of gas-liquid mixing in a stirred vessel using electrical resistance tomography, Chem. Eng. J., 77, 93-98.