crack detection in shafts using mechanical impedance
TRANSCRIPT
Mechanical Engineering Research; Vol. 2, No. 2; 2012 ISSN 1927-0607 E-ISSN 1927-0615
Published by Canadian Center of Science and Education
10
Crack Detection in Shafts Using Mechanical Impedance Measurements
A. Tlaisi1, A. S. J. Swamidas1, A. Akinturk1 & M. R. Haddara1
1 Faculty of Engineering and Applied Science, Memorial University of Newfoundland, St. John’s, Canada
Correspondence: A. Tlaisi, Faculty of Engineering and Applied Science, Memorial University of Newfoundland, St. John’s, Canada. E-mail addresses: [email protected]
Received: May 17, 2012 Accepted: June 9, 2012 Online Published: July 26, 2012
doi:10.5539/mer.v2n2p10 URL: http://dx.doi.org/10.5539/mer.v2n2p10
Abstract
In this study, experimental and analytical investigations are carried out on an overhanging cylindrical shaft carrying a propeller at the cantilever end, in order to identify the crack existence in shafts using the mechanical impedance approach. Also the experimental study uses the modal analysis software, LMS Test LabTM, for measuring and analyzing the response results from un-cracked and cracked shafts. In the numerical study, both the un-cracked and the cracked shafts (with varying crack depths) are modeled by finite element procedure. 3-D iso-parametric elements (element types 186 and 187), available in the ANSYS FEM program, are utilized to model the system. The impedance and velocity frequency response functions are used to identify the crack depth in the shaft system. Impedance and mobility were measured and simulated in the vertical direction for the resonant frequencies and anti-resonant frequencies. The experimental results are used to validate the numerical results. A better crack detection procedure was obtained by the plot of the slope of the non-dimensional frequency ratio (in the resonant and anti-resonant regimes) vs. the non-dimensional crack depth ratio. By this method crack presence could be definite detected when the non-dimensional crack ratio is greater than 0.20 to 0.25. In addition monitoring of the lower torsional frequency indicated the crack presence even from the beginning stages.
Keywords: experimental and numerical investigation, cracked shaft, mechanical impedance, finite element method, modal analysis, ANSYS
1. Introduction
The appearance of a transverse crack in a shaft brings with it a greater risk of collapse. Even though the presence of a crack may not lead to sudden failure, it will affect considerably its dynamic behavior. The primary reason for the difficulty in detecting the presence of a crack in rotating shafts with an overhang seems to be due to the very small changes that occur in the system frequencies unless the crack depth is nearly 50% of the of the shaft diameter; the rotor shaft system will be in a state of sudden failure beyond this crack depth. In the last four decades, many numerical and experimental studies have been carried out to identify the effects of different type of cracks, such as transverse, longitudinal, slant, breathing cracks and notches. In these studies the researchers have used different methods to identify crack presence in structures. One of these methods is detection and monitoring of cracks using mechanical impedance.
Manley (1941) mentioned that the concept of mechanical impedance has been used since 1939. It was used for the analysis of vibrational problems in engine systems. In this paper, the resonant frequencies were determined by developing equations for damped linear systems. The author stated that the method of impedance can be applied to the case of torsional vibration of rotating shafts. Kane and McGoldrick (1949) discussed the longitudinal vibrations of marine propulsion-shafting systems. The purpose was to: (i) estimate the longitudinal critical speeds, and (ii) calculate with more precision which elements were critically affecting the longitudinal vibration. This study was mainly concerned with the types of vibrations that occur in the electric-drive propulsion system of a marine vessel. It was concluded that the longitudinal vibrations were less affected than the torsional vibrations. The vibratory system was limited to the rotating elements in the torsional vibrations. The longitudinal vibrations, however, were affected by the machinery masses and their foundations. The authors used three methods to estimate the natural frequencies, viz., (i) fixed end approximation method; (ii) Two body approximation method; and (iii) mechanical impedance method. The authors concluded that this paper provided guidance for deciding
www.ccsenet.org/mer Mechanical Engineering Research Vol. 2, No. 2; 2012
11
whether the thrust bearing, mounting, machinery foundations, and propeller clearances need to be included in the rotor modelling procedure. Also, they found an agreement between the computed values of natural frequencies for all the models, as well as for the experimental results.
Chenea (1952) used the concept of impedance to analyze an elastic bar, a tapered and stepped shaft, and a string in longitudinal, torsional and lateral oscillations respectively. He applied the models as continuous systems, and considered both the free and forced vibration. He assumed that the cross-sectional area of an elastic bar changed gradually and that there were internal and external dampings in the system. The model consisted of a spring connected with damping in a series and then connected to another damping in parallel. By the same technique, he used this model for torsional oscillation. In both cases, he found the natural frequencies of the systems.
On (1967) used experimental and analytical procedures for determining mechanical impedance and to find its effects on dynamic response. He developed the concept of mechanical impedance in terms of point and transfer impedance parameters. He developed two DOF (degree-of-freedom) and three DOF lumped mass models, for theoretically representing, complex aerospace structures, as large inter-connected matrix systems. He compared his theoretical results with experimental results on such aerospace structures and found them to be reasonably good. He mentioned that this approach could be extended to many systems subjected to steady state, transient and random excitations.
Hamidi, Piaud and Massoud (1992) developed two mathematical models (using three-dimensional stress intensity factors at the crack region) to determine the bending natural frequencies of a single span rotor. They used natural frequencies, mode shapes and frequency response functions to identify the crack presence. The analytical methods were compared with the results of experimental measurements. The following conclusions were made: (i) When crack depth was more than 30% of the shaft radius, the rate of change of natural frequencies was very high; and (ii) The speed of rotating shaft did not affect the values of natural frequencies; this was probably due to the fact that the stiffness of the shafts were not reduced significantly by the rotating speed effects on the shaft.
Bamnios and Trochidis (1995) investigated the influence of a transverse open crack on the mechanical impedance experimentally and analytically. Cantilever beams were used to obtain the change of the mechanical impedance at different locations and sizes of the crack under the effect of longitudinal and bending vibrations. From vibration results they found that the changes of mechanical impedance were more in the lateral directions than in the longitudinal direction. Zakhezin and Malysheva (2001) used a numerical finite element based crack detection technique and modal tests on a single span shaft. They included system damping in their model and calculated the system’s natural frequencies, eigen-values, and eigen-vectors up to a frequency of 1,100 Hz. These values were calculated for a rotor with and without cracks at varying locations and depths. The method was tested and results verified to demonstrate the good quality of results obtained.
Prabhakar, Sekhar and Mohanty (2001) investigated experimentally the influence of a transverse surface crack on the mechanical impedance of a rotor bearing system, supported between two bearings. This system consisted of rigid disks, distributed parameter finite shaft elements, and discrete bearings. The experimental work was done to validate their previous numerical analysis results. They tried to use the concept of mobility for detecting and monitoring the crack using different crack parameters and force locations. The authors did this experiment for an un-cracked and a cracked shaft. They used different depths (20% and 40% of diameter to represent the crack depth) at the location. Also, they measured the mobility in two directions, horizontal and vertical, at the bearing locations. This measurement was taken at different rotor speeds. They found that the mobility was directly proportional to the depth of the crack, as well as to the rate of change of mobility at the running frequency. Moreover, since the crack depth was assumed to grow vertically, the rate of change of mobility in the vertical direction was greater than that in the horizontal direction. There was considerable agreement between experimental results and numerical simulations. Therefore, the authors suggested using this method to detect the crack, while monitoring a rotor-bearing system.
Bamnios, Douka and Trochidis (2002) carried out analytical and experimental studies on cracked beams to investigate the effect of a transverse open crack on the mechanical impedance under various boundary conditions. They used a spring connecting the two segments of the cantilever beam as a model of the crack. The beam had a uniform rectangular cross-section and the crack was assumed open and had a uniform depth. Additionally, bending vibrations were considered and the bending spring constant
TK was given by:
,1
cK T )()346.5( waJEIwc
where, w was the depth of the beam, E the modulus of elasticity of the beam, I the area moment of inertia for the
www.ccsenet.org/mer Mechanical Engineering Research Vol. 2, No. 2; 2012
12
beam cross-section and J (a/w) is the dimensionless local compliance function. They found that the impedance and natural frequencies changed with the presence of a crack, as well as by its size and location. Also, the natural frequencies of the cracked beam were reduced when compared with the un-cracked beam. As seen from the numerical results, the crack had a strong effect on the mechanical impedance and this effect depended on the crack’s location. The changes of the mechanical impedance and the natural frequencies can be used as indicators for the presence of a crack. There was agreement between analytical and experimental studies in all cases.
Prabhakar, Mohanty and Sekhar (2002) investigated the influence of a transverse surface crack for open and breathing cases (depending on the rotor deflection) by continuing their earlier studies on a rotor bearing system supported between two bearings. They used FEM analysis to show this influence on the mechanical impedance of a rotor-bearing system. They attempted to use the concept of mobility (inverse of the impedance) to detect the crack by using different crack parameters and force locations. They found that the mechanical impedance changed and was quite sensitive to the presence of crack; it decreased (in an open crack) as the crack depth increased; and it decreased more when the location of the crack moved toward the disk. For the case of a breathing crack the mechanical impedance decreased as the crack depth increased. The sensitivity was more apparent in the breathing crack case. Additionally, when the running frequency for the breathing crack was doubled the sudden change in mechanical impedance was easily observed. For a breathing crack, the mechanical impedance was sensitive to small or large crack depths, even if the crack depth ratio was less than 0.1 (ratio between crack depth and shaft diameter). Finally, the authors recommended that the measurement of mechanical impedance can be used as a good indicator for the presence of cracks.
Sekhar and Srinivas (2003) used shell elements with 4 nodes using CQUAD4 elements available in commercial finite element analysis software NASTRAN and FEMAP to model hollow cracked composite shafts, fabricated using stacking sequences of boron-epoxy, carbon-epoxy and graphite-epoxy materials. The finite element formulation was based on first order shear deformation theory. They generated crack on the shaft by using bullion operations. Also spring elements were used to represent the effect of the bearings. They have stated that the stacking sequences such as 90/0/90/0 and 90//90/0/0 produced a higher frequency than other sequences of stacking. They also found that for all the three materials, the eigen-frequencies decreased with increase in crack depth. They also observed that the carbon-epoxy shaft had a higher frequency than the other two materials for the same crack. Sinou and Lees (2007) analyzed the influence of a breathing transverse crack on the dynamic response of an on-line rotating shaft. Also they investigated the development of the orbit of the cracked rotor at half and one-third of the first critical speed. They used Harmonic Balance Method to obtain shaft response parameters by considering the effects of different crack depths and locations. Li, Yao, Ren and Wen (2008) used FE-based simulation (through ANSYS) to model the dynamic characteristics of a faulty multi-span rotor system. This system was connected together by axial membrane coupling, considering each span to be elastic and supporting a rigid rotor at the free end. They examined in detail the bending-torsion coupling vibration of a single-span rotor and the whole rotor system; they analyzed four cases for the occurrence of cracks and rubbing faults (crack location was in the middle of the span and the crack depths were 0.0, 0.2D, 0.4D, and 0.6D). They examined: (i) The nonlinear dynamic characteristics, (ii) Responses of the rotor system, (iii) The influences of membrane coupling, and (iv) Effect of gearing on the rotor system. They concluded that detailed examination of both coupling and gear response would help one to properly diagnose the cracks occurring in the span.
Citarella and Cricri (2010) investigated a complex 3D fatigue crack growth due to torsion loading using two different methods, viz., the dual boundary element method and the finite element method. They adopted a number of different criteria for the crack path assessment, using minimum strain energy density, maximum principal stress, approximate energy release rate and various approaches formulated for stress intensity factor estimation. Also, they modeled crack surfaces with discontinuous quadratic quadrilateral elements while the surfaces intersecting a crack were modeled with edge-discontinuous quadrilateral elements. It was found that the computational results obtained using the finite element method and dual boundary element method gave a very good agreement. Additionally, the stress intensity factors and the crack paths estimated by different method were pretty well consistent.
2. Shaft-propeller-bearing Test Rig and Experimental Setup
In this part of the present study, the characteristics of the vibrating un-cracked and cracked shafts were investigated through modal testing. Manually-made saw cuts (0.65 mm wide) were used as cracks for different depths. The main objective of this experimental study was to study the effect of cracks on the lateral vibrations of a shaft. The experimental results were used to validate the numerical models. For the experimental portion of the study, the Engineering Innovation (LMS Test LabTM) software package with two measurement channels was used. The first input channel consisted of the time history output from the modal hammer used in the study. The
www.ccsenet.org/mer Mechanical Engineering Research Vol. 2, No. 2; 2012
13
number designation of the impact hammer type was 8206-002 and the maximum force (non-destructive) that it can deliver was 4448N (for a steel tipped impact hammer). The head of the hammer could use different tip materials, viz., aluminum, plastic, rubber, and stainless steel. In this study, plastic tip (DB-3991-002) material was used. The second channel consisted of the time history output from the accelerometer device.
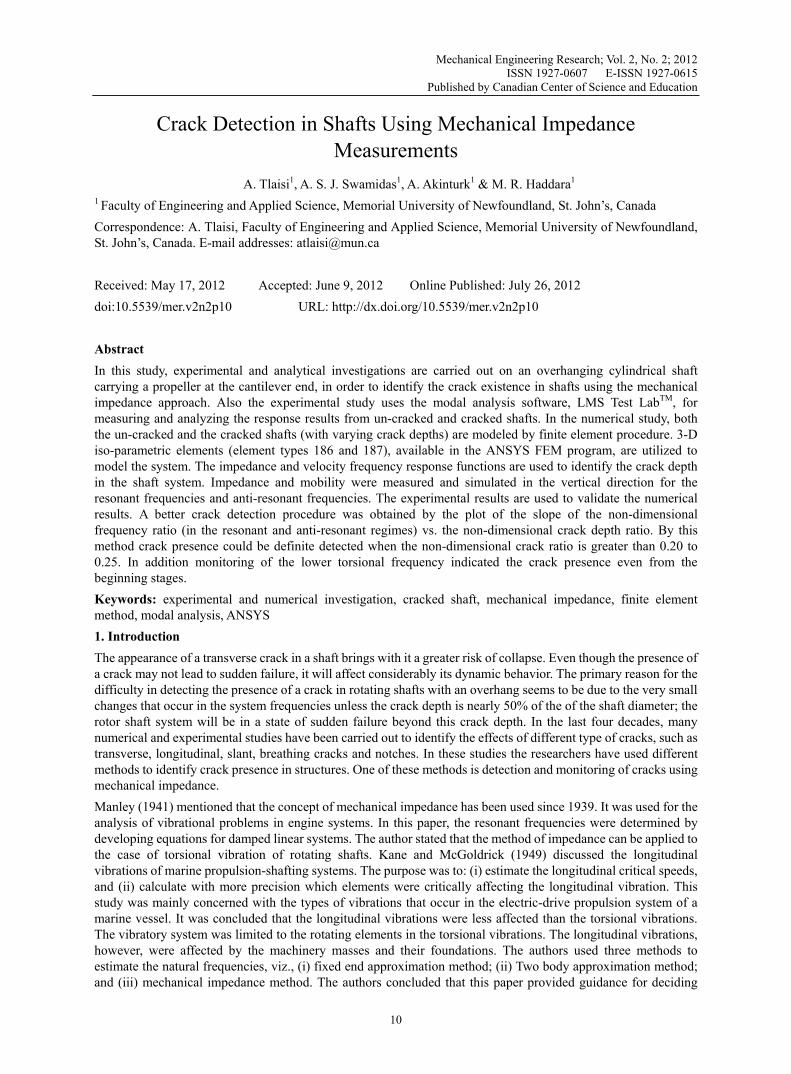
As shown in the Figure 1, a continuous shaft with an overhang was used in this study. The propeller was attached to the free end of the overhang. In the experimental aspects of this study, LMS Test Lab TM was used to acquire and process the vibration test results. During modal tests the shaft, with the overhang, was locked (or fixed) to the bearing support (bearing 1) as shown in Figure 2(a).
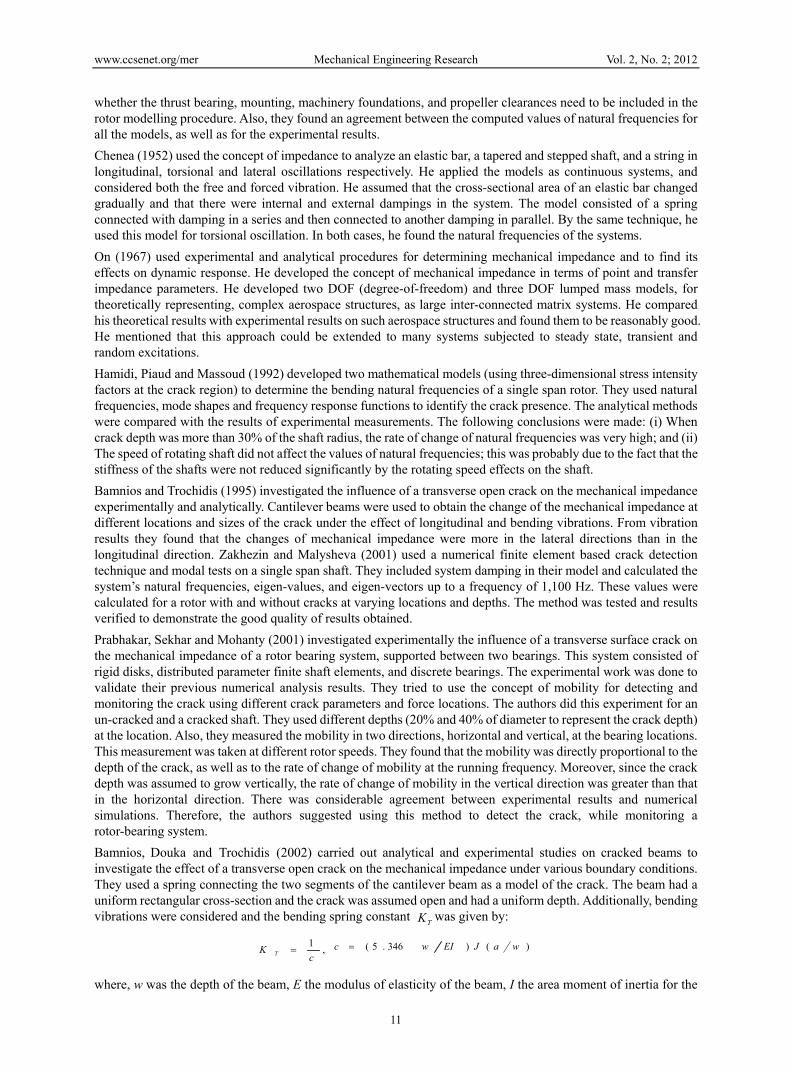
The fixed rotor shaft of 16 mm diameter and 1220 mm length was supported on two bearings with greased fittings, and deep-grooved ball-bearing inserts. Set screws were used to fix the shaft at bearing 1. The experimental program was carried out to identify the shaft characteristics with and without the presence of crack; a crack (of width 0.65mm) having different depths was made at 2.0 cm to the right of bearing number 2, as shown in Figure 2(b).
Figure 1. The shaft-propeller system with bearing and the LMS Test Lab during modal tests
Figure 2. (a) Clamped end of the cylindrical shaft at bearing 1; (b) Saw-cut crack with 70% crack depth ratio
3. Relationship between Input and Output in Dynamic Response of the Rotating Shaft
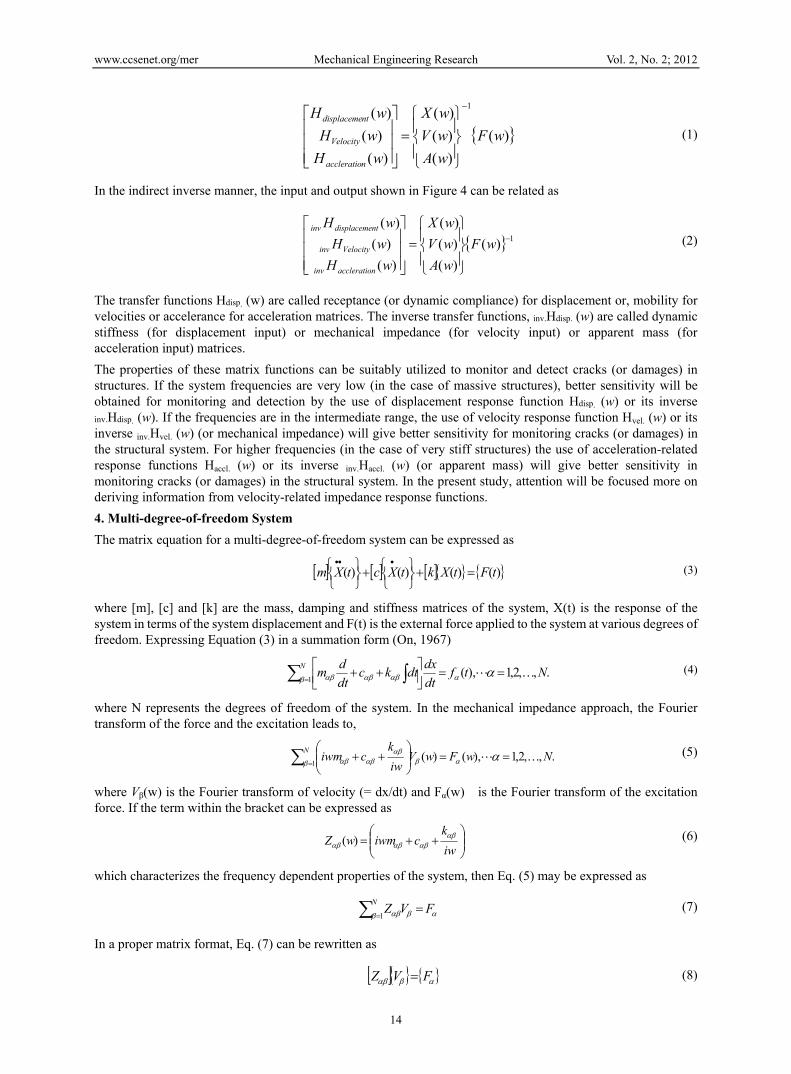
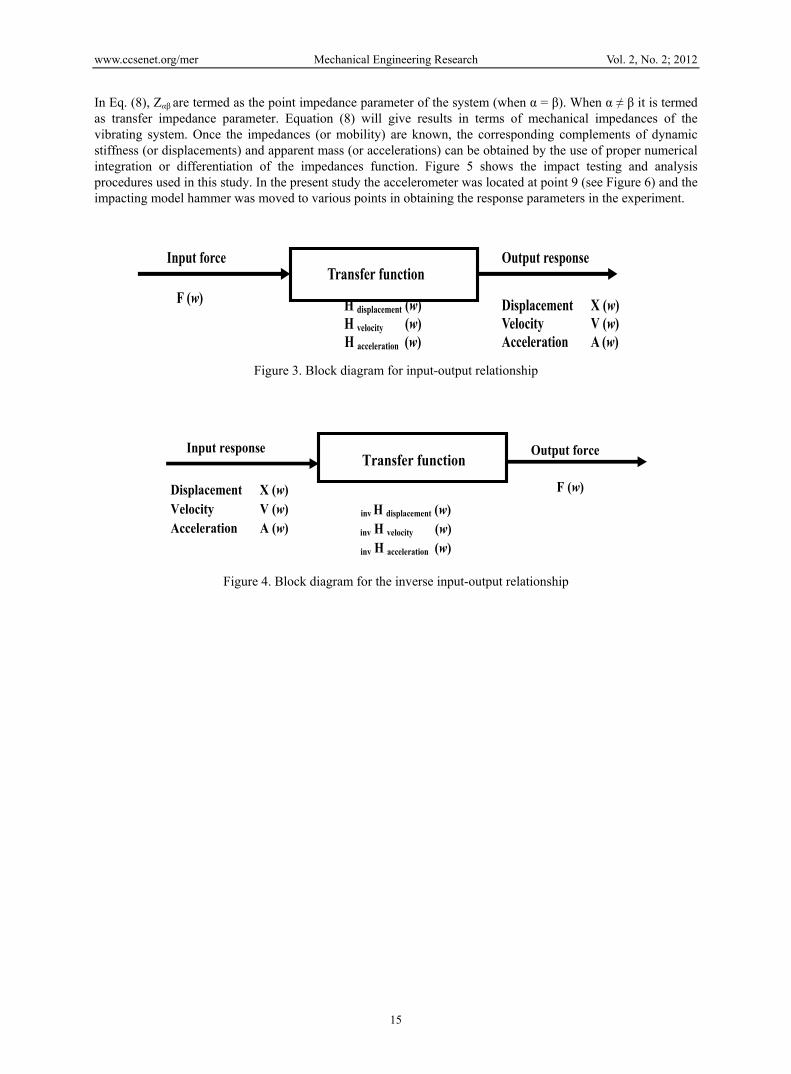
This section illustrates the relationship that exists between the input and output obtained from a vibrating system (in this case, a rotating shaft). The relationship can be expressed by the block diagram given in Figure 3, which relates the input and the output in a direct manner. The inverse of the relationship shown in Figure 3 can be shown in Figure 4 (Schwarz & Richardson, 1999). In the direct forward manner, the input and output shown in Figure 3 can be related as
www.ccsenet.org/mer Mechanical Engineering Research Vol. 2, No. 2; 2012
14
)(
)(
)(
)(
)(
)(
)(1
wF
wA
wV
wX
wH
wH
wH
naccleratio
Velocity
ntdisplaceme
(1)
In the indirect inverse manner, the input and output shown in Figure 4 can be related as
1)(
)(
)(
)(
)(
)(
)(
wF
wA
wV
wX
wH
wH
wH
naccleratioinv
Velocityinv
ntdisplacemeinv
(2)
The transfer functions Hdisp. (w) are called receptance (or dynamic compliance) for displacement or, mobility for velocities or accelerance for acceleration matrices. The inverse transfer functions, inv.Hdisp. (w) are called dynamic stiffness (for displacement input) or mechanical impedance (for velocity input) or apparent mass (for acceleration input) matrices.
The properties of these matrix functions can be suitably utilized to monitor and detect cracks (or damages) in structures. If the system frequencies are very low (in the case of massive structures), better sensitivity will be obtained for monitoring and detection by the use of displacement response function Hdisp. (w) or its inverse inv.Hdisp. (w). If the frequencies are in the intermediate range, the use of velocity response function Hvel. (w) or its inverse inv.Hvel. (w) (or mechanical impedance) will give better sensitivity for monitoring cracks (or damages) in the structural system. For higher frequencies (in the case of very stiff structures) the use of acceleration-related response functions Haccl. (w) or its inverse inv.Haccl. (w) (or apparent mass) will give better sensitivity in monitoring cracks (or damages) in the structural system. In the present study, attention will be focused more on deriving information from velocity-related impedance response functions.
4. Multi-degree-of-freedom System
The matrix equation for a multi-degree-of-freedom system can be expressed as
)()()()( tFtXktXctXm
(3)
where [m], [c] and [k] are the mass, damping and stiffness matrices of the system, X(t) is the response of the system in terms of the system displacement and F(t) is the external force applied to the system at various degrees of freedom. Expressing Equation (3) in a summation form (On, 1967)
.,,2,1),(1
Ntfdt
dxdtkc
dt
dm
N
(4)
where N represents the degrees of freedom of the system. In the mechanical impedance approach, the Fourier transform of the force and the excitation leads to,
.,,2,1),()(1
NwFwViw
kciwm
N
(5)
where Vβ(w) is the Fourier transform of velocity (= dx/dt) and Fα(w) is the Fourier transform of the excitation force. If the term within the bracket can be expressed as
iw
kciwmwZ )( (6)
which characterizes the frequency dependent properties of the system, then Eq. (5) may be expressed as
FVZN
1 (7)
In a proper matrix format, Eq. (7) can be rewritten as
FVZ (8)
www.ccsenet.org/mer Mechanical Engineering Research Vol. 2, No. 2; 2012
15
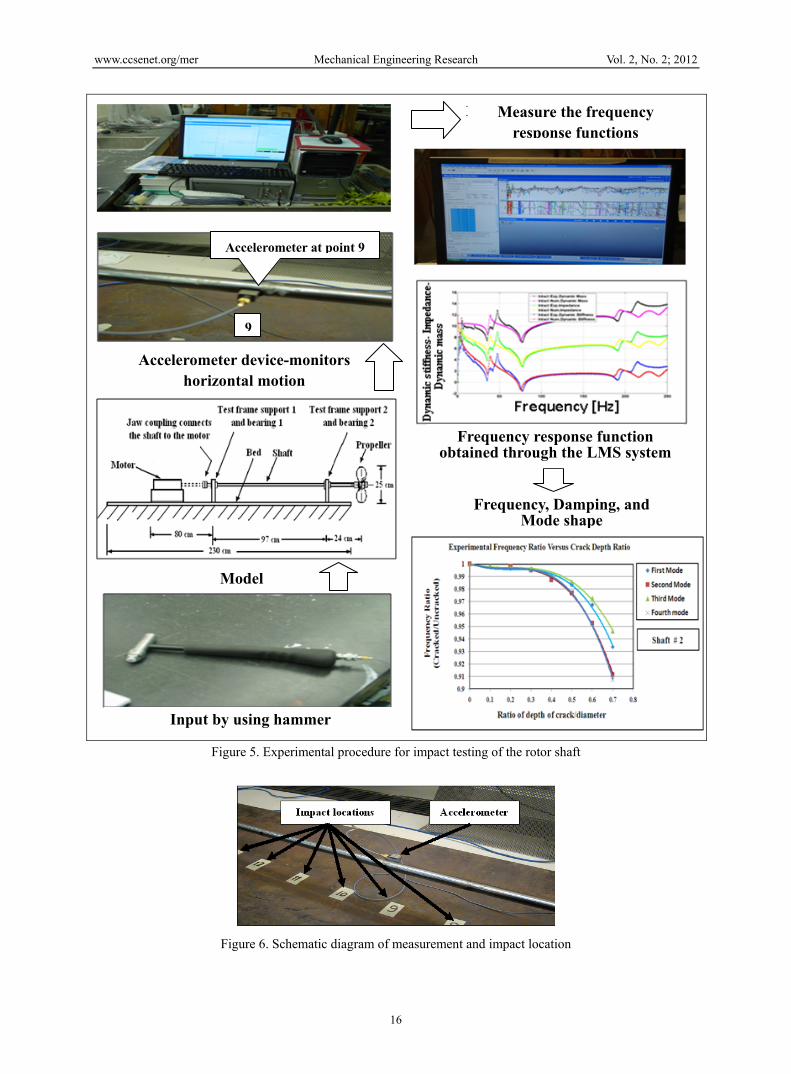
In Eq. (8), Zαβ are termed as the point impedance parameter of the system (when α = β). When α ≠ β it is termed as transfer impedance parameter. Equation (8) will give results in terms of mechanical impedances of the vibrating system. Once the impedances (or mobility) are known, the corresponding complements of dynamic stiffness (or displacements) and apparent mass (or accelerations) can be obtained by the use of proper numerical integration or differentiation of the impedances function. Figure 5 shows the impact testing and analysis procedures used in this study. In the present study the accelerometer was located at point 9 (see Figure 6) and the impacting model hammer was moved to various points in obtaining the response parameters in the experiment.
Output response
Displacement X (w) Velocity V (w) Acceleration A (w)
Input force
F (w)
Transfer function
H displacement (w) H velocity (w) H acceleration (w)
Figure 3. Block diagram for input-output relationship
Output force
Displacement X (w) Velocity V (w) Acceleration A (w)
Input response
F (w)
Transfer function
inv H displacement (w)
inv H velocity (w)
inv H acceleration (w)
Figure 4. Block diagram for the inverse input-output relationship
www.ccsenet.org/mer Mechanical Engineering Research Vol. 2, No. 2; 2012
16
Figure 5. Experimental procedure for impact testing of the rotor shaft
Figure 6. Schematic diagram of measurement and impact location
Accelerometer at point 9
9
Accelerometer device-monitors horizontal motion
Frequency response function obtained through the LMS system
Frequency, Damping, and Mode shape
Model
Input by using hammer
Measure the frequency response functions
www.ccsenet.org/mer Mechanical Engineering Research Vol. 2, No. 2; 2012
17
5. Computer Simulation with ANSYS Workbench (Solid Works)
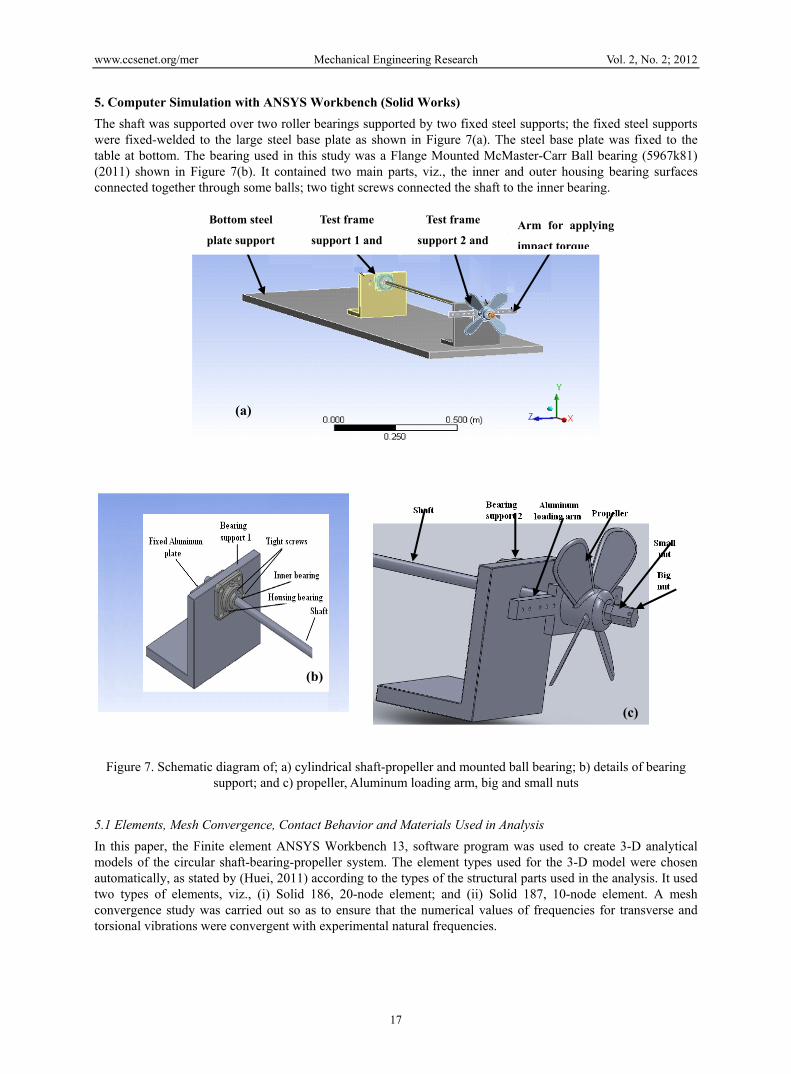
The shaft was supported over two roller bearings supported by two fixed steel supports; the fixed steel supports were fixed-welded to the large steel base plate as shown in Figure 7(a). The steel base plate was fixed to the table at bottom. The bearing used in this study was a Flange Mounted McMaster-Carr Ball bearing (5967k81) (2011) shown in Figure 7(b). It contained two main parts, viz., the inner and outer housing bearing surfaces connected together through some balls; two tight screws connected the shaft to the inner bearing.
Figure 7. Schematic diagram of; a) cylindrical shaft-propeller and mounted ball bearing; b) details of bearing support; and c) propeller, Aluminum loading arm, big and small nuts
5.1 Elements, Mesh Convergence, Contact Behavior and Materials Used in Analysis
In this paper, the Finite element ANSYS Workbench 13, software program was used to create 3-D analytical models of the circular shaft-bearing-propeller system. The element types used for the 3-D model were chosen automatically, as stated by (Huei, 2011) according to the types of the structural parts used in the analysis. It used two types of elements, viz., (i) Solid 186, 20-node element; and (ii) Solid 187, 10-node element. A mesh convergence study was carried out so as to ensure that the numerical values of frequencies for transverse and torsional vibrations were convergent with experimental natural frequencies.
(a)
(b)
(c)
Bottom steel
plate support
Test frame
support 1 and
Test frame
support 2 and Arm for applying
impact torque
www.ccsenet.org/mer Mechanical Engineering Research Vol. 2, No. 2; 2012
18
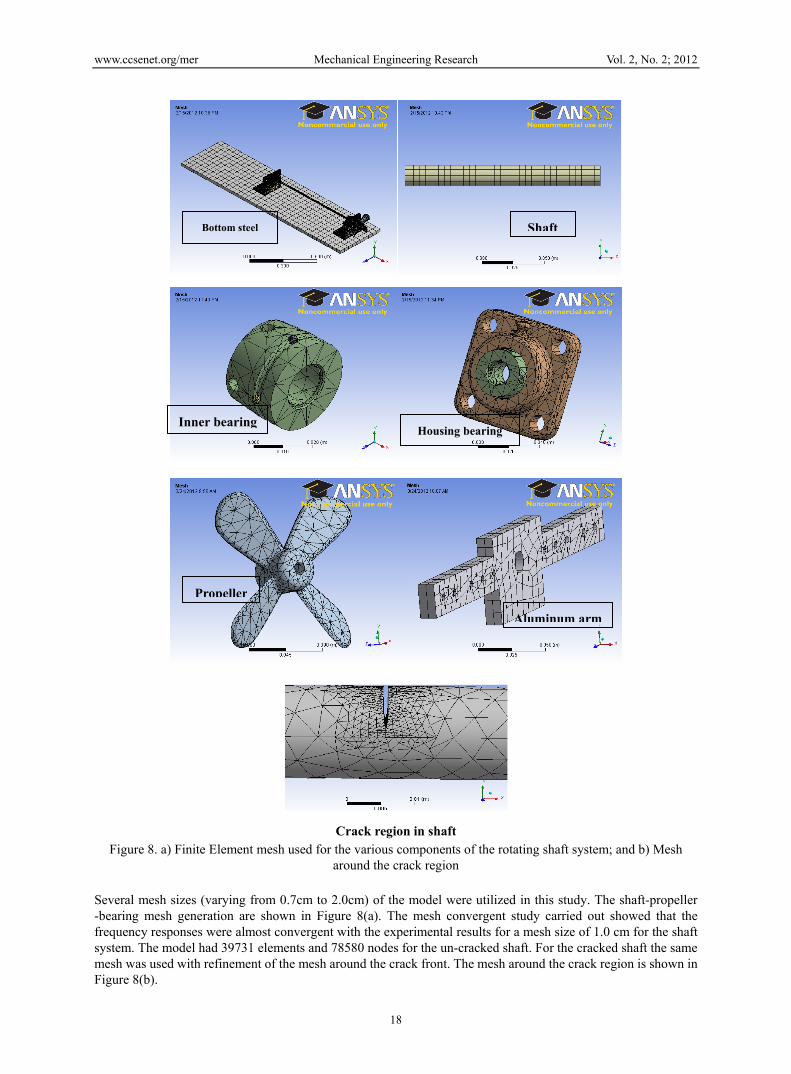
Crack region in shaft Figure 8. a) Finite Element mesh used for the various components of the rotating shaft system; and b) Mesh
around the crack region
Several mesh sizes (varying from 0.7cm to 2.0cm) of the model were utilized in this study. The shaft-propeller -bearing mesh generation are shown in Figure 8(a). The mesh convergent study carried out showed that the frequency responses were almost convergent with the experimental results for a mesh size of 1.0 cm for the shaft system. The model had 39731 elements and 78580 nodes for the un-cracked shaft. For the cracked shaft the same mesh was used with refinement of the mesh around the crack front. The mesh around the crack region is shown in Figure 8(b).
Bottom steel Shaft
Inner bearing Housing bearing
Propeller
Aluminum arm
www.ccsenet.org/mer Mechanical Engineering Research Vol. 2, No. 2; 2012
19
In ANSYS Workbench the contact between two bodies were represented by two contact surfaces, one specified as a contact surface and the other as a target surface. In the present shaft-propeller system, three types of contact (bonded, frictional, frictionless) were used. It can be indicated as follows: (i) The parts which were bonded together are, viz., two tight screws to inner bearing and to shaft, housing bearing to inner connection (a part that is made to fill the space between the bearing surfaces and the steel supports, to avoid unwanted zero modes), housing bearing to balls, shaft to small nut, shaft to big nut, shaft to fixed aluminum, propeller to small nut, small nut to big nut, and fixed aluminum to support 1; (ii) The parts which had frictional contacts were, viz., aluminum loading arm to shaft (friction coefficient is 0.2), aluminum loading arm to propeller (friction coefficient is 0.1), inner connection to support (friction coefficient is 0.001), and shaft to propeller (friction coefficient is 0.1); and (iii) The parts which had frictionless contacts were, viz., balls to inner bearing, balls to inner connections, inner bearing to inner connections, inner bearing to shaft, inner connections to shaft and fixed aluminum plate to support. The frictional coefficients became important in determining the correct torsional frequency since the propeller was not welded to the shaft, but joined rigidly through a slotted keyway system. The frictional coefficients that gave the frequency close to the experimental values were used to get the correct numerical values. The same consideration was used in identifying the frictional coefficient for the torque arm.
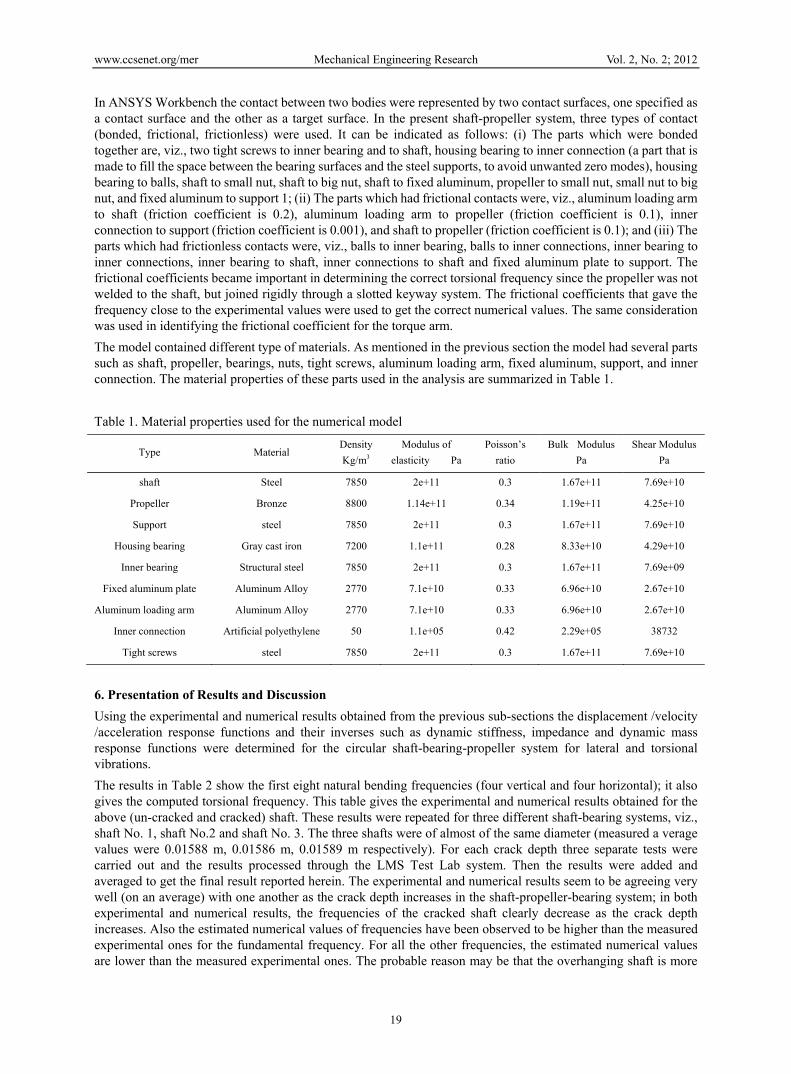
The model contained different type of materials. As mentioned in the previous section the model had several parts such as shaft, propeller, bearings, nuts, tight screws, aluminum loading arm, fixed aluminum, support, and inner connection. The material properties of these parts used in the analysis are summarized in Table 1.
Table 1. Material properties used for the numerical model
Type Material Density
Kg/m3
Modulus of
elasticity Pa
Poisson’s
ratio
Bulk Modulus
Pa
Shear Modulus
Pa
shaft Steel 7850 2e+11 0.3 1.67e+11 7.69e+10
Propeller Bronze 8800 1.14e+11 0.34 1.19e+11 4.25e+10
Support steel 7850 2e+11 0.3 1.67e+11 7.69e+10
Housing bearing Gray cast iron 7200 1.1e+11 0.28 8.33e+10 4.29e+10
Inner bearing Structural steel 7850 2e+11 0.3 1.67e+11 7.69e+09
Fixed aluminum plate Aluminum Alloy 2770 7.1e+10 0.33 6.96e+10 2.67e+10
Aluminum loading arm Aluminum Alloy 2770 7.1e+10 0.33 6.96e+10 2.67e+10
Inner connection Artificial polyethylene 50 1.1e+05 0.42 2.29e+05 38732
Tight screws steel 7850 2e+11 0.3 1.67e+11 7.69e+10
6. Presentation of Results and Discussion
Using the experimental and numerical results obtained from the previous sub-sections the displacement /velocity /acceleration response functions and their inverses such as dynamic stiffness, impedance and dynamic mass response functions were determined for the circular shaft-bearing-propeller system for lateral and torsional vibrations.
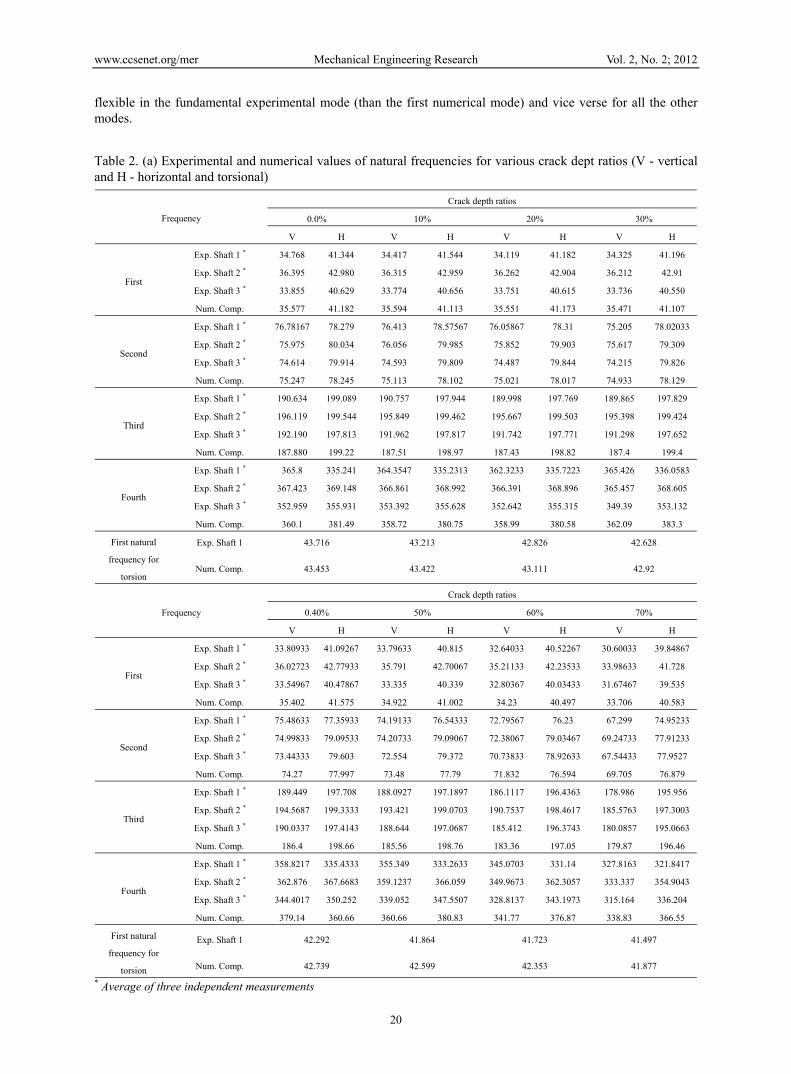
The results in Table 2 show the first eight natural bending frequencies (four vertical and four horizontal); it also gives the computed torsional frequency. This table gives the experimental and numerical results obtained for the above (un-cracked and cracked) shaft. These results were repeated for three different shaft-bearing systems, viz., shaft No. 1, shaft No.2 and shaft No. 3. The three shafts were of almost of the same diameter (measured a verage values were 0.01588 m, 0.01586 m, 0.01589 m respectively). For each crack depth three separate tests were carried out and the results processed through the LMS Test Lab system. Then the results were added and averaged to get the final result reported herein. The experimental and numerical results seem to be agreeing very well (on an average) with one another as the crack depth increases in the shaft-propeller-bearing system; in both experimental and numerical results, the frequencies of the cracked shaft clearly decrease as the crack depth increases. Also the estimated numerical values of frequencies have been observed to be higher than the measured experimental ones for the fundamental frequency. For all the other frequencies, the estimated numerical values are lower than the measured experimental ones. The probable reason may be that the overhanging shaft is more
www.ccsenet.org/mer Mechanical Engineering Research Vol. 2, No. 2; 2012
20
flexible in the fundamental experimental mode (than the first numerical mode) and vice verse for all the other modes.
Table 2. (a) Experimental and numerical values of natural frequencies for various crack dept ratios (V - vertical and H - horizontal and torsional)
Frequency
Crack depth ratios
0.0% 10% 20% 30%
V H V H V H V H
First
Exp. Shaft 1 * 34.768 41.344 34.417 41.544 34.119 41.182 34.325 41.196
Exp. Shaft 2 * 36.395 42.980 36.315 42.959 36.262 42.904 36.212 42.91
Exp. Shaft 3 * 33.855 40.629 33.774 40.656 33.751 40.615 33.736 40.550
Num. Comp. 35.577 41.182 35.594 41.113 35.551 41.173 35.471 41.107
Second
Exp. Shaft 1 * 76.78167 78.279 76.413 78.57567 76.05867 78.31 75.205 78.02033
Exp. Shaft 2 * 75.975 80.034 76.056 79.985 75.852 79.903 75.617 79.309
Exp. Shaft 3 * 74.614 79.914 74.593 79.809 74.487 79.844 74.215 79.826
Num. Comp. 75.247 78.245 75.113 78.102 75.021 78.017 74.933 78.129
Third
Exp. Shaft 1 * 190.634 199.089 190.757 197.944 189.998 197.769 189.865 197.829
Exp. Shaft 2 * 196.119 199.544 195.849 199.462 195.667 199.503 195.398 199.424
Exp. Shaft 3 * 192.190 197.813 191.962 197.817 191.742 197.771 191.298 197.652
Num. Comp. 187.880 199.22 187.51 198.97 187.43 198.82 187.4 199.4
Fourth
Exp. Shaft 1 * 365.8 335.241 364.3547 335.2313 362.3233 335.7223 365.426 336.0583
Exp. Shaft 2 * 367.423 369.148 366.861 368.992 366.391 368.896 365.457 368.605
Exp. Shaft 3 * 352.959 355.931 353.392 355.628 352.642 355.315 349.39 353.132
Num. Comp. 360.1 381.49 358.72 380.75 358.99 380.58 362.09 383.3
First natural
frequency for
torsion
Exp. Shaft 1 43.716 43.213 42.826 42.628
Num. Comp. 43.453 43.422 43.111 42.92
Frequency
Crack depth ratios
0.40% 50% 60% 70%
V H V H V H V H
First
Exp. Shaft 1 * 33.80933 41.09267 33.79633 40.815 32.64033 40.52267 30.60033 39.84867
Exp. Shaft 2 * 36.02723 42.77933 35.791 42.70067 35.21133 42.23533 33.98633 41.728
Exp. Shaft 3 * 33.54967 40.47867 33.335 40.339 32.80367 40.03433 31.67467 39.535
Num. Comp. 35.402 41.575 34.922 41.002 34.23 40.497 33.706 40.583
Second
Exp. Shaft 1 * 75.48633 77.35933 74.19133 76.54333 72.79567 76.23 67.299 74.95233
Exp. Shaft 2 * 74.99833 79.09533 74.20733 79.09067 72.38067 79.03467 69.24733 77.91233
Exp. Shaft 3 * 73.44333 79.603 72.554 79.372 70.73833 78.92633 67.54433 77.9527
Num. Comp. 74.27 77.997 73.48 77.79 71.832 76.594 69.705 76.879
Third
Exp. Shaft 1 * 189.449 197.708 188.0927 197.1897 186.1117 196.4363 178.986 195.956
Exp. Shaft 2 * 194.5687 199.3333 193.421 199.0703 190.7537 198.4617 185.5763 197.3003
Exp. Shaft 3 * 190.0337 197.4143 188.644 197.0687 185.412 196.3743 180.0857 195.0663
Num. Comp. 186.4 198.66 185.56 198.76 183.36 197.05 179.87 196.46
Fourth
Exp. Shaft 1 * 358.8217 335.4333 355.349 333.2633 345.0703 331.14 327.8163 321.8417
Exp. Shaft 2 * 362.876 367.6683 359.1237 366.059 349.9673 362.3057 333.337 354.9043
Exp. Shaft 3 * 344.4017 350.252 339.052 347.5507 328.8137 343.1973 315.164 336.204
Num. Comp. 379.14 360.66 360.66 380.83 341.77 376.87 338.83 366.55
First natural
frequency for
torsion
Exp. Shaft 1 42.292 41.864 41.723 41.497
Num. Comp. 42.739 42.599 42.353 41.877
* Average of three independent measurements
www.ccsenet.org/mer Mechanical Engineering Research Vol. 2, No. 2; 2012
21
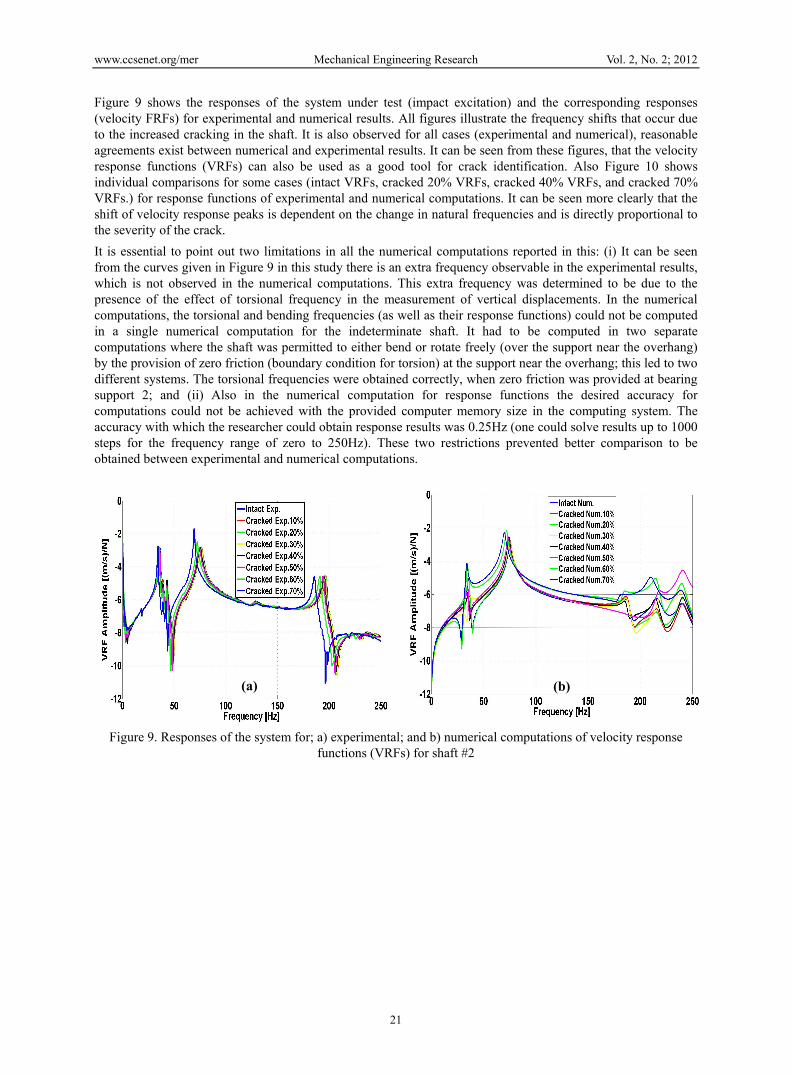
Figure 9 shows the responses of the system under test (impact excitation) and the corresponding responses (velocity FRFs) for experimental and numerical results. All figures illustrate the frequency shifts that occur due to the increased cracking in the shaft. It is also observed for all cases (experimental and numerical), reasonable agreements exist between numerical and experimental results. It can be seen from these figures, that the velocity response functions (VRFs) can also be used as a good tool for crack identification. Also Figure 10 shows individual comparisons for some cases (intact VRFs, cracked 20% VRFs, cracked 40% VRFs, and cracked 70% VRFs.) for response functions of experimental and numerical computations. It can be seen more clearly that the shift of velocity response peaks is dependent on the change in natural frequencies and is directly proportional to the severity of the crack.
It is essential to point out two limitations in all the numerical computations reported in this: (i) It can be seen from the curves given in Figure 9 in this study there is an extra frequency observable in the experimental results, which is not observed in the numerical computations. This extra frequency was determined to be due to the presence of the effect of torsional frequency in the measurement of vertical displacements. In the numerical computations, the torsional and bending frequencies (as well as their response functions) could not be computed in a single numerical computation for the indeterminate shaft. It had to be computed in two separate computations where the shaft was permitted to either bend or rotate freely (over the support near the overhang) by the provision of zero friction (boundary condition for torsion) at the support near the overhang; this led to two different systems. The torsional frequencies were obtained correctly, when zero friction was provided at bearing support 2; and (ii) Also in the numerical computation for response functions the desired accuracy for computations could not be achieved with the provided computer memory size in the computing system. The accuracy with which the researcher could obtain response results was 0.25Hz (one could solve results up to 1000 steps for the frequency range of zero to 250Hz). These two restrictions prevented better comparison to be obtained between experimental and numerical computations.
Figure 9. Responses of the system for; a) experimental; and b) numerical computations of velocity response functions (VRFs) for shaft #2
(a) (b)
www.ccsenet.org/mer Mechanical Engineering Research Vol. 2, No. 2; 2012
22
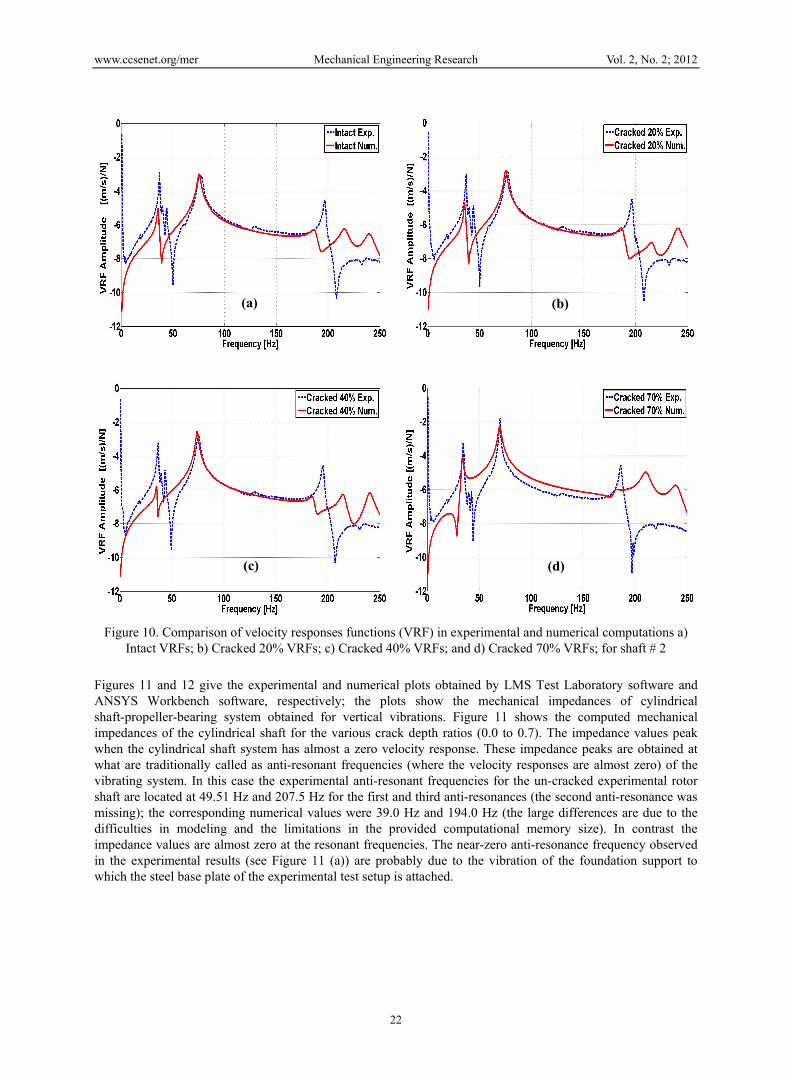
Figure 10. Comparison of velocity responses functions (VRF) in experimental and numerical computations a) Intact VRFs; b) Cracked 20% VRFs; c) Cracked 40% VRFs; and d) Cracked 70% VRFs; for shaft # 2
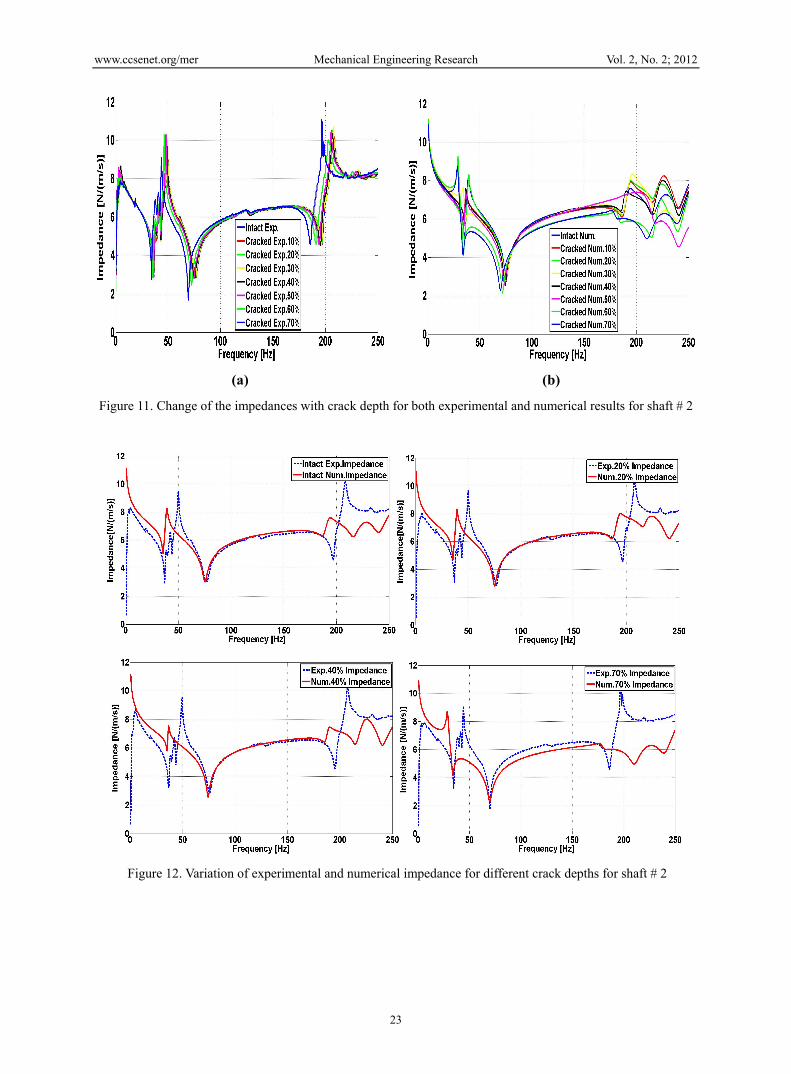
Figures 11 and 12 give the experimental and numerical plots obtained by LMS Test Laboratory software and ANSYS Workbench software, respectively; the plots show the mechanical impedances of cylindrical shaft-propeller-bearing system obtained for vertical vibrations. Figure 11 shows the computed mechanical impedances of the cylindrical shaft for the various crack depth ratios (0.0 to 0.7). The impedance values peak when the cylindrical shaft system has almost a zero velocity response. These impedance peaks are obtained at what are traditionally called as anti-resonant frequencies (where the velocity responses are almost zero) of the vibrating system. In this case the experimental anti-resonant frequencies for the un-cracked experimental rotor shaft are located at 49.51 Hz and 207.5 Hz for the first and third anti-resonances (the second anti-resonance was missing); the corresponding numerical values were 39.0 Hz and 194.0 Hz (the large differences are due to the difficulties in modeling and the limitations in the provided computational memory size). In contrast the impedance values are almost zero at the resonant frequencies. The near-zero anti-resonance frequency observed in the experimental results (see Figure 11 (a)) are probably due to the vibration of the foundation support to which the steel base plate of the experimental test setup is attached.
(a) (b)
(c) (d)
www.ccsenet.org/mer Mechanical Engineering Research Vol. 2, No. 2; 2012
23
(a) (b)
Figure 11. Change of the impedances with crack depth for both experimental and numerical results for shaft # 2
Figure 12. Variation of experimental and numerical impedance for different crack depths for shaft # 2
www.ccsenet.org/mer Mechanical Engineering Research Vol. 2, No. 2; 2012
24
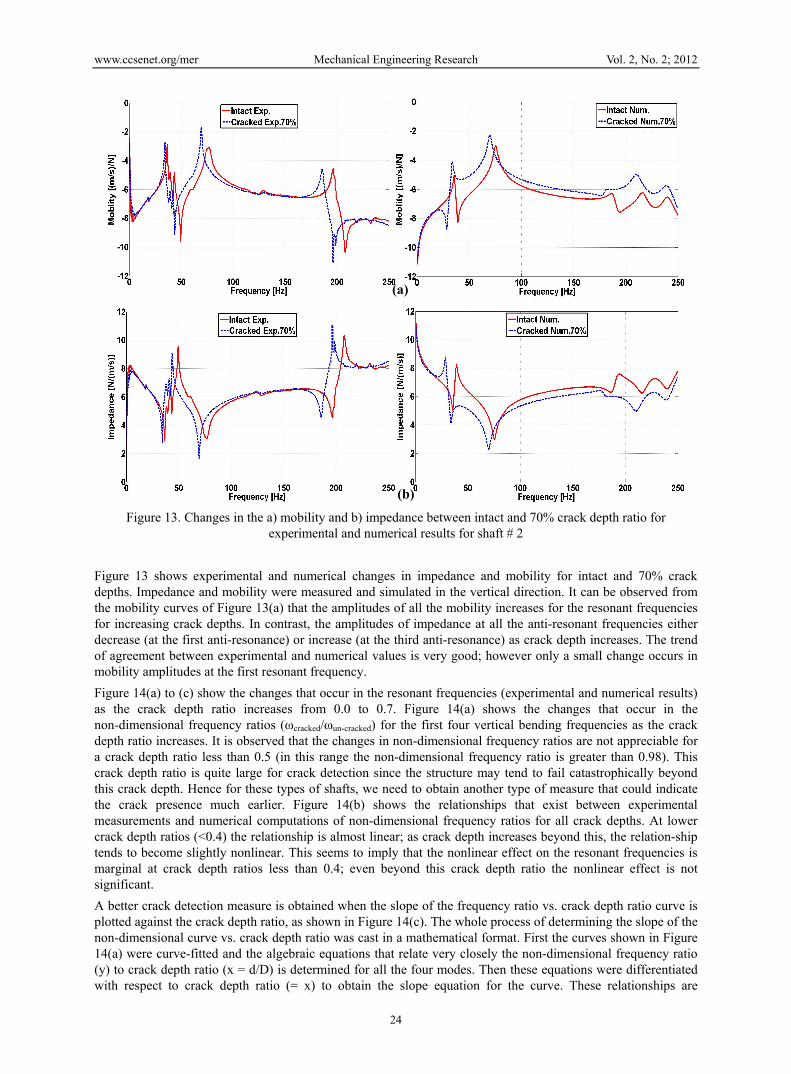
Figure 13. Changes in the a) mobility and b) impedance between intact and 70% crack depth ratio for
experimental and numerical results for shaft # 2
Figure 13 shows experimental and numerical changes in impedance and mobility for intact and 70% crack depths. Impedance and mobility were measured and simulated in the vertical direction. It can be observed from the mobility curves of Figure 13(a) that the amplitudes of all the mobility increases for the resonant frequencies for increasing crack depths. In contrast, the amplitudes of impedance at all the anti-resonant frequencies either decrease (at the first anti-resonance) or increase (at the third anti-resonance) as crack depth increases. The trend of agreement between experimental and numerical values is very good; however only a small change occurs in mobility amplitudes at the first resonant frequency.
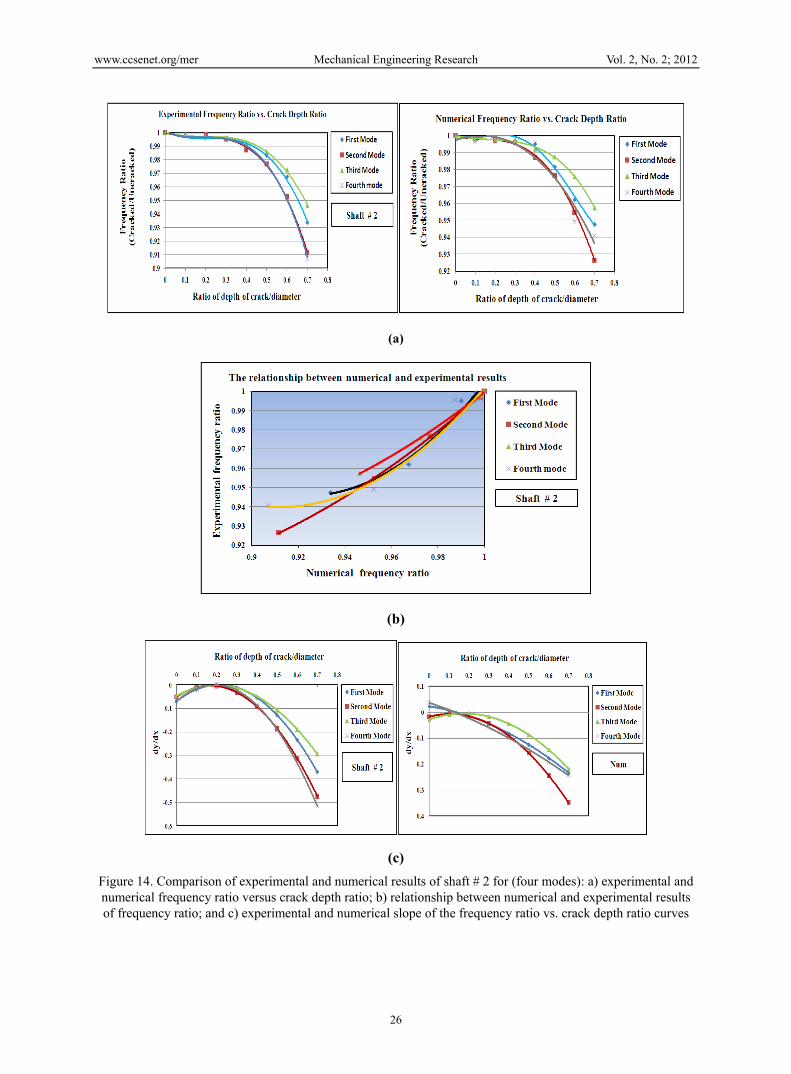
Figure 14(a) to (c) show the changes that occur in the resonant frequencies (experimental and numerical results) as the crack depth ratio increases from 0.0 to 0.7. Figure 14(a) shows the changes that occur in the non-dimensional frequency ratios (ωcracked/ωun-cracked) for the first four vertical bending frequencies as the crack depth ratio increases. It is observed that the changes in non-dimensional frequency ratios are not appreciable for a crack depth ratio less than 0.5 (in this range the non-dimensional frequency ratio is greater than 0.98). This crack depth ratio is quite large for crack detection since the structure may tend to fail catastrophically beyond this crack depth. Hence for these types of shafts, we need to obtain another type of measure that could indicate the crack presence much earlier. Figure 14(b) shows the relationships that exist between experimental measurements and numerical computations of non-dimensional frequency ratios for all crack depths. At lower crack depth ratios (<0.4) the relationship is almost linear; as crack depth increases beyond this, the relation-ship tends to become slightly nonlinear. This seems to imply that the nonlinear effect on the resonant frequencies is marginal at crack depth ratios less than 0.4; even beyond this crack depth ratio the nonlinear effect is not significant.
A better crack detection measure is obtained when the slope of the frequency ratio vs. crack depth ratio curve is plotted against the crack depth ratio, as shown in Figure 14(c). The whole process of determining the slope of the non-dimensional curve vs. crack depth ratio was cast in a mathematical format. First the curves shown in Figure 14(a) were curve-fitted and the algebraic equations that relate very closely the non-dimensional frequency ratio (y) to crack depth ratio (x = d/D) is determined for all the four modes. Then these equations were differentiated with respect to crack depth ratio (= x) to obtain the slope equation for the curve. These relationships are
(b)
(a)
www.ccsenet.org/mer Mechanical Engineering Research Vol. 2, No. 2; 2012
25
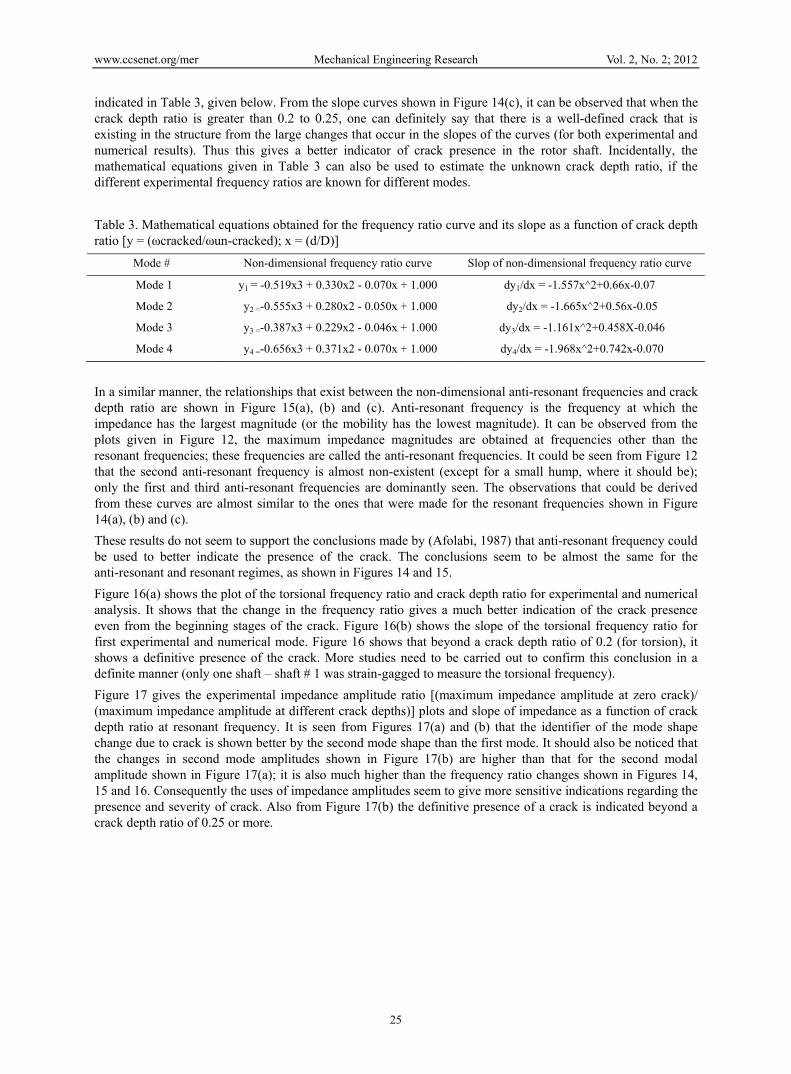
indicated in Table 3, given below. From the slope curves shown in Figure 14(c), it can be observed that when the crack depth ratio is greater than 0.2 to 0.25, one can definitely say that there is a well-defined crack that is existing in the structure from the large changes that occur in the slopes of the curves (for both experimental and numerical results). Thus this gives a better indicator of crack presence in the rotor shaft. Incidentally, the mathematical equations given in Table 3 can also be used to estimate the unknown crack depth ratio, if the different experimental frequency ratios are known for different modes.
Table 3. Mathematical equations obtained for the frequency ratio curve and its slope as a function of crack depth ratio [y = (ωcracked/ωun-cracked); x = (d/D)]
Mode # Non-dimensional frequency ratio curve Slop of non-dimensional frequency ratio curve
Mode 1 y1 = -0.519x3 + 0.330x2 - 0.070x + 1.000 dy1/dx = -1.557x^2+0.66x-0.07
Mode 2 y2 =-0.555x3 + 0.280x2 - 0.050x + 1.000 dy2/dx = -1.665x^2+0.56x-0.05
Mode 3 y3 =-0.387x3 + 0.229x2 - 0.046x + 1.000 dy3/dx = -1.161x^2+0.458X-0.046
Mode 4 y4 =-0.656x3 + 0.371x2 - 0.070x + 1.000 dy4/dx = -1.968x^2+0.742x-0.070
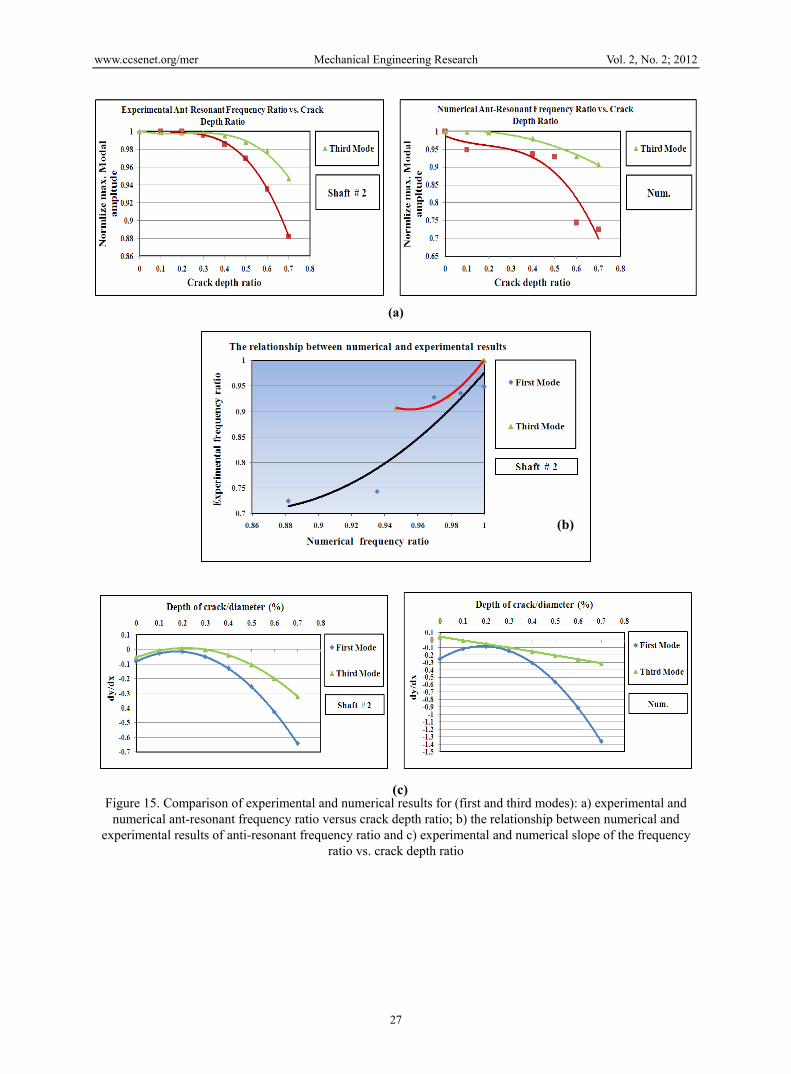
In a similar manner, the relationships that exist between the non-dimensional anti-resonant frequencies and crack depth ratio are shown in Figure 15(a), (b) and (c). Anti-resonant frequency is the frequency at which the impedance has the largest magnitude (or the mobility has the lowest magnitude). It can be observed from the plots given in Figure 12, the maximum impedance magnitudes are obtained at frequencies other than the resonant frequencies; these frequencies are called the anti-resonant frequencies. It could be seen from Figure 12 that the second anti-resonant frequency is almost non-existent (except for a small hump, where it should be); only the first and third anti-resonant frequencies are dominantly seen. The observations that could be derived from these curves are almost similar to the ones that were made for the resonant frequencies shown in Figure 14(a), (b) and (c).
These results do not seem to support the conclusions made by (Afolabi, 1987) that anti-resonant frequency could be used to better indicate the presence of the crack. The conclusions seem to be almost the same for the anti-resonant and resonant regimes, as shown in Figures 14 and 15.
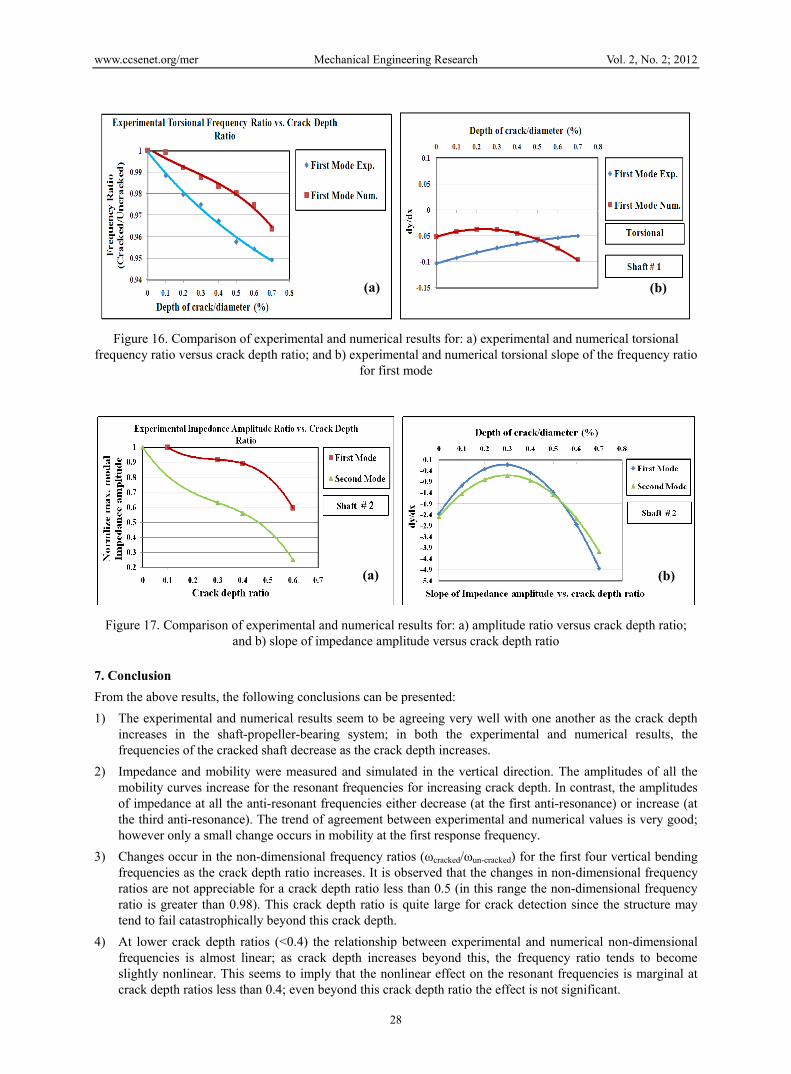
Figure 16(a) shows the plot of the torsional frequency ratio and crack depth ratio for experimental and numerical analysis. It shows that the change in the frequency ratio gives a much better indication of the crack presence even from the beginning stages of the crack. Figure 16(b) shows the slope of the torsional frequency ratio for first experimental and numerical mode. Figure 16 shows that beyond a crack depth ratio of 0.2 (for torsion), it shows a definitive presence of the crack. More studies need to be carried out to confirm this conclusion in a definite manner (only one shaft – shaft # 1 was strain-gagged to measure the torsional frequency).
Figure 17 gives the experimental impedance amplitude ratio [(maximum impedance amplitude at zero crack)/ (maximum impedance amplitude at different crack depths)] plots and slope of impedance as a function of crack depth ratio at resonant frequency. It is seen from Figures 17(a) and (b) that the identifier of the mode shape change due to crack is shown better by the second mode shape than the first mode. It should also be noticed that the changes in second mode amplitudes shown in Figure 17(b) are higher than that for the second modal amplitude shown in Figure 17(a); it is also much higher than the frequency ratio changes shown in Figures 14, 15 and 16. Consequently the uses of impedance amplitudes seem to give more sensitive indications regarding the presence and severity of crack. Also from Figure 17(b) the definitive presence of a crack is indicated beyond a crack depth ratio of 0.25 or more.
www.ccsenet.org/mer Mechanical Engineering Research Vol. 2, No. 2; 2012
26
(a)
(b)
(c)
Figure 14. Comparison of experimental and numerical results of shaft # 2 for (four modes): a) experimental and numerical frequency ratio versus crack depth ratio; b) relationship between numerical and experimental results of frequency ratio; and c) experimental and numerical slope of the frequency ratio vs. crack depth ratio curves
www.ccsenet.org/mer Mechanical Engineering Research Vol. 2, No. 2; 2012
27
(a)
Figure 15. Comparison of experimental and numerical results for (first and third modes): a) experimental and
numerical ant-resonant frequency ratio versus crack depth ratio; b) the relationship between numerical and experimental results of anti-resonant frequency ratio and c) experimental and numerical slope of the frequency
ratio vs. crack depth ratio
(b)
(c)
www.ccsenet.org/mer Mechanical Engineering Research Vol. 2, No. 2; 2012
28
Figure 16. Comparison of experimental and numerical results for: a) experimental and numerical torsional frequency ratio versus crack depth ratio; and b) experimental and numerical torsional slope of the frequency ratio
for first mode
Figure 17. Comparison of experimental and numerical results for: a) amplitude ratio versus crack depth ratio; and b) slope of impedance amplitude versus crack depth ratio
7. Conclusion
From the above results, the following conclusions can be presented:
1) The experimental and numerical results seem to be agreeing very well with one another as the crack depth increases in the shaft-propeller-bearing system; in both the experimental and numerical results, the frequencies of the cracked shaft decrease as the crack depth increases.
2) Impedance and mobility were measured and simulated in the vertical direction. The amplitudes of all the mobility curves increase for the resonant frequencies for increasing crack depth. In contrast, the amplitudes of impedance at all the anti-resonant frequencies either decrease (at the first anti-resonance) or increase (at the third anti-resonance). The trend of agreement between experimental and numerical values is very good; however only a small change occurs in mobility at the first response frequency.
3) Changes occur in the non-dimensional frequency ratios (ωcracked/ωun-cracked) for the first four vertical bending frequencies as the crack depth ratio increases. It is observed that the changes in non-dimensional frequency ratios are not appreciable for a crack depth ratio less than 0.5 (in this range the non-dimensional frequency ratio is greater than 0.98). This crack depth ratio is quite large for crack detection since the structure may tend to fail catastrophically beyond this crack depth.
4) At lower crack depth ratios (<0.4) the relationship between experimental and numerical non-dimensional frequencies is almost linear; as crack depth increases beyond this, the frequency ratio tends to become slightly nonlinear. This seems to imply that the nonlinear effect on the resonant frequencies is marginal at crack depth ratios less than 0.4; even beyond this crack depth ratio the effect is not significant.
(a) (b)
(a) (b)
www.ccsenet.org/mer Mechanical Engineering Research Vol. 2, No. 2; 2012
29
5) A better crack detection measure is obtained when the slope of the frequency ratio vs. crack depth ratio curve is plotted against the crack depth ratio. In this case it can be observed that when the crack depth ratio is greater than 0.2 to 0.25, one can definitely say that there is a well-defined crack that is existing in the structure from the large changes that occur in the slopes of the curves (for both experimental and numerical results.
6) Conclusions derived for anti-resonant frequencies are almost similar to the ones that were made for the resonant frequencies.
7) The torsional frequency ratio vs. crack depth ratio for experimental and numerical analysis show that the change in the frequency ratio gives a much better indication of the crack presence even from the beginning stages of the crack.
8) The uses of impedance amplitudes seem to give more sensitive indications regarding the presence and severity of crack.
Acknowledgements
The authors would like to express their sincere gratitude the staff of the Structural Lab of the Faculty of Engineering and Applied Science at the Memorial University. They also for would like to thank the funding agency (National Research Council of Canada) for funding the costs of experimental specimens.
References
Afolabi, D. (1987). An anti-resonance technique for detecting structural damage. Proceedings of Fifth International Model Analysis Conference. London, 1, 491-495.
Bamnios, G., & Trochidis, A. (1995). Mechanical impedance of a cracked cantilever beam. Acoustical Society of America, 97(6). Retrieved from http://asadl.org/jasa/resource/1/jasman/v97/i6/p3625_s1
Bamnios, Y., Douka, E., & Trochidis, A. (2002). Crack identification in beam structures using mechanical impedance. Journal of Sound and Vibration, 256(2), 287-297. http://dx.doi.org/10.1006/jsvi.2001.4209
Chenea, P. (1952). On application of impedance method to continuous systems. American Society of Mechanical Engineers.
Citarella, R., & Cricri, G. (2010). Comparison of dbem and fem crack path predictions in a notched shaft under torsion. Engineering Fracture Mechanics, 77, 1730-1749. http://dx.doi.org/10.1016/j.engfracmech.2010.03.012
Hamidi, L., Piaud, J., & Massoud, M. (1992). A study of crack influence on the modal characteristics of rotors. International Conference on Vibrations in Rotating Machinery, held at Bath, UK, Paper C432/066, 283-288.
Huei, L. (2011). Finite element simulations with ansys workbench 13 theory – applications – case studies. Publisher: Stephen Schroff, USA, 34-35, 2011. Retrieved from www.SDCpublications.com
Kane, J., & McGoldrick, R. (1949). Longitudinal vibrations of marine propulsion-shafting systems. Society of Naval Architects and Marine Engineers, 57, 193-232.
Li, X., Yao, H. Ren, Z., & Wen, B. (2008). Simulation of dynamic characteristics of faulty multi-span rotor system through FEA, 15thInternational Congress on Sound and Vibration, Daejeon, Korea. http://dx.doi.org/CNKI:SUN:DBDX.0.2008-02-025
Manley, R. (1941). Mechanical impedance of damped vibrating systems. Journal of the Royal Aeronautical Society, 45(371), 342-348.
McMaster, Carr. (2011). (Princeton, New Jersey, USA) supplies products (including bearings) used to maintain manufacturing plants and large commercial facilities worldwide. Retrieved on September 15, 2011, from www.mcmaster.com
On, F. J. (1967). Mechanical impedance analysis for lumped parameter multi-degree of freedom/multi-dimensional systems. NASA TN D-3865, Spring field, Virginia. Retrieved from http://oai.dtic.mil/oai/oai?verb=getRecord&metadataPrefix=html&identifier=ADA395541.
Prabhakar, S., Mohanty, A., & Sekhar, A. (2002). Crack detection by measurement of mechanical impedance of a rotor-bearing system. Acoustical Society of America, 112(6), 2825-2830. Retrieved from http://www.ncbi.nlm.nih.gov/pubmed/12509003
www.ccsenet.org/mer Mechanical Engineering Research Vol. 2, No. 2; 2012
30
Prabhakar, S., Sekhar, A., & Mohanty, A. (2001). Detection and monitoring of cracks using mechanical impedance of rotor-bearing system. Journal of the Acoustical Society of America, 110(5), 2351-2359. Retrieved from http://www.ncbi.nlm.nih.gov/pubmed/11757925
Schwarz, B., & Richardson, M. (1999). Experimental modal analysis, CSI Reliability Week. Orlando, FL, 12. Retrieved from http://vibetech.com/assets/papers/paper28.pdf
Sekhar, A., & Srinivas, B. (2003). Dynamics of cracked composite shafts. Journal of Reinforced Plastics and Composites, 22(7), 637-653. Retrieved from http://jrp.sagepub.com/content/22/7/637
Sinou, J., & Lees, A. (2007). A non-linear study of a cracked rotor. European Journal of Mechanics and Solids, 26, 152-170. http://www.sciencedirect.com/science/journal/09977538
Zakhezin, A., & Malysheva, T. (2001). Modal analysis rotor system for diagnostic of the fatigue crack. Condition Monitoring Conference, St. Catherine’s College, Oxford, UK.