first biomass conference of the americas - nrel
TRANSCRIPT
Volume I11
FIRST BIOMASS CONFERENCE OF THE AMERICAS:
ENERGY, ENVIRONMENT, AGRICULTURE, AND INDUSTRY
National Renewable Energy Laborato y Golden, Colorado

NOTICE
This publication was reproduced from the best available camera-ready copy submitted by the authors and received no editorial review at NREL
This report was prepared as an account of work sponsored by an agency of the United States government. Neither the United States government nor any agency thereof, nor any of their employees, makes any warranty, express or implied, or assumes any legal liability or responsibility for the accuracy, completeness, or usefulness of any information, apparatus, product, or process disclosed, or represents that its use would not infringe privately owned rights. Reference herein to any specific commercial product, process, or serwce by trade name, trademark, manufacturer, or otherwise does not necessarily constitute or imply its endorsement, recommendation, or favoring by the United States government or any agency thereof. The views and opinions of authors expressed herein do not necessarily state or reflect those of the United States government or any agency thereof.
Preface
The oral papers and poster papers presented at the First Biomass Conference of the Americas in Burlington, Vermont, August 3GSeptember 2, 1993, and available when publication of this book began, are reproduced herein. It should be emphasized that almost all of these papers were published as received, whether they were in camera-ready form or not. The technical content of each paper and the opinions expressed are attributed entirely to the authors. In a few cases, grammatical changes were made, and abstract pages were retyped to improve readability.
The First Biomass Conference of the Americas w~ designed to provide a national and international forum to support the development of a viable biomass industry. Although papers on research activities and technologies under development that address industry problems comprised part of this conference, an effort was made to focus on -scale-up and demonstration projects, technology transfer to end users, and commercial applications of biomass and wastes. The conference was divided into these major subject areas:
Resource Base Power Production Transportation Fuels Chemicals and Products Environmental Issues Commercializing Biomass Projects Biomass Energy System Studies Biomass in Latin America - Overview
The papers in this book are grouped in the same subject areas.
We believe this conference is the first of its kind and that it fills a real need to document and disseminate information on important developments in biomass. It is our intent to continue this program biannually in coordination with the biannual conference presented by the Commission of the European Communities on biomass developments in Europe, and to expand the program by including an exposition of vendors who market biomass equipment and services to the industry. The Second Biomass Conference of the Americas has been scheduled for 1995.
We would like to express our sincere appreciation to all the authors, who made an extra effort to produce quality papers under a rather stringent time schedule, to the Session Chairs who also doubled as members of the Program Committee and assisted in the selection of papers, to the Executive Committee who kept us headed in the proper direction, and to the sponsors of the conference-the U.S. Departments of Agriculture and Energy; the U.S. Environmental Protection Agency; Energy, Mines and Resources Canada; and the National Renewable Energy Laboratory, under whose auspices the conference was presented. %e cooperation of these organizations was a key ingredient essential to the planning, organization, and presentation of this conference.
Donald L. Klass Entech International, Inc.
iii
Contents
Volume I
Page
RESOURCE BASE
Biomass
Biomass: An Overview in the United States sf America, T. Robertson andH.Shapouri . . . . . . . . . . . . . . . . . . . . . . . . . . . . . . . . . . . . . . . . . . . . . . . . . 1
Projected Wood Energy Impact on U.S. Forest Wood Resources, K.Skog . . . . . . . . . . . . . . . . . . . . . . . . . . . . . . . . . . . . . . . . . . . . . . . . . . . . . . . 18
Some Ecological Guidelines for Large-Scale Biomass Plantations, W. Hoffman, J.H. Cook, and 9. Beyea . . . . . . . . . . . . . . . . . . . . . . . . . . . . . . . . . 33
Energy from Wood Biomass: The Experience of the Brazilian Forest Sector, L. Couto, L.R. Grda, and D.R. Betters . . . . . . . . . . . . . . . . . . . . . . . . . . . 42
Evaluating a Biomass Resource: The TVA Region-Wide Biomass Resource Assessment Model, Me Downing and RE. Graham . . . . . . . . . . . . . . . . . . 54
Short-Rotation Forestry for Energy Production in Hawaii, V.D. Phillips, W. Liu, and R.A. Merriam . . . . . . . . . . . . . . . . . . . . . . . . . . . . . . . 68
TVA GIs-Based Biomass Resource Assessment, C.E. Noon . . . . . . . . . . . . . . . . . . . . . . . . 74 Forest Biomass and Energy-Wood Potential in the Southern
United States, J.R. Saucier . . . . . . . . . . . . . . . . . . . . . . . . . . . . . . . . . . . . . . . . . . 79 Biomass Energy Inventory and Mapping System, J.D. Kasile . . . . . . . . . . . . . . . . . . . . . . . 88 Biomass Resources in California, V.M. Tiango and P.S. Sethi . . . . . . . . . . . . . . . . . . . . . . 94
. . . . . . . . . . . . . . . . . . . . . . . . . . . . . . . . . . . . . Finnish Bioenergy Research, H. Malinen 100 An Evaluation of the Regional Supply of Biomass at
Three Midwestern Sites, B.C. English, K.D. Dlllivan, M.A. Ojo, . . . . . . . . . . . . . . . . . . . . . . . . . . . . . . . . . . . . R.R. Alexander, and R.L. Graham 106
Wastes and Residues
Energy Conversion of Animal Manures: Feasibility Analysis for Thirteen Western States, J. Whittier, S. Haase, R. Milward, G. Churchill,
. . . . . . . . . . . . . . . . . . . . . . M.B. Searles, M. Moser, D. Swanson, and G. Morgan 112 Cotton Gin Trash in the Western United States: Resource Inventory and
Energy Conversion Characterization, S.G. Haase, M.W. Quinn, J.P. Whittier, T.M. Cohen, R. R. Lansford,
. . . . . . . . . . . . . . . . . . . . . . . . . . . . . . . J.D. Craig, D.S. Swanson, and G. Morgan 126 . . . . . . . . . . . . . . . . Systems for Harvesting and Handling Cotton Plant Residue, W. Coates 143
Collection and Hauling of Cereal Grain Chaff, B. Reding, P. Leduc, . . . . . . . . . . . . . . . . . . . . . . . . . . . . . . . . . . . . . . . . . . . . . . . . and M. Stumborg 149
. . . . . . . . . . . . . . . . Managing Woodwaste: Yield from Residue, E. Nielson and S. Rayner 156
Contents (Continued)
Feedstock Research
Page
Overview of Feedstock Research in the United States, Canada, and Brazil, 9. Ferrell, M-L. Tardif, L. Couto, L.R. Garca, D. Betters, and J.Ashworth . . . . . . . . . . . . . . . . . . . . . . . . . . . . . . . . . . . . . . . . . . . . . . . . . . . .
Willow Bioenergy Plantation Research in the Northeast, E.H. White, L.P. Abrahamson, R.F. Kopp, and C.A. Nowak . . . . . . . . . . . . . . . . . . . . . . . . . . .
The Role and Significance of Salix Plantations for Energy in Swedish Agriculture, L.S. Forsse, S. Ledin, ancf H. Johansson . . . . . . . . . . . . . . . . . . . . . . .
From Research Plots to Prototype Biomass Plantations, W.A. Kenney, B.J. Vanstone, R.L. Gambles, and L. Zsuffa . . . . . . . . . . . . . . . . . . . . . . . . . . . . .
Compatibility of Switchgrass as an Energy Crop in Farming Systems of the Southeastern USA, D.I. Bransby, R. Rodriguez-Kabana, and S.E. Sladden . . . . . . . .
Integrated Production of Warm Season Grasses and Agroforestry for Biomass Production, R. Samson, P. Girouard, J. Omielan, and J. Henning . . . . . . . . . . . . . . .
Switchgrass as a Biofuels Crop for the Upper Southeast, B.J. Parrish . . . . . . . . . . . . . . . . . . . . . . . . . . . . . . . . . . . . . . . . . . . . . . . . . . and D.D. Wolf
Production of BiomassIEnergy Crops on Phosphatic Clay Soils in Central Florida, J.A. Stricker, G.M. Prine, K.R. Woodad, D.L. Anderson, D.B. Shibles, and T.C. Riddle . . . . . . . . . . . . . . . . . . . . . . . . . . . . . . . . . . . . . . .
SpaceIAge Forestry: Implications of Planting Density and Rotation Age on SRIC Management Decisions, R.A. Merriam, V.D. Phillips, and W. Liu . . . . . . . . . .
An Optimal Staggered Harvesting Strategy for Herbaceous Biomass Energy Crops, M.G. Bhat and B.C. English . . . . . . . . . . . . . . . . . . . . . . . . . . . . . . . . . . .
Evaluating the Economics of Biomass Energy Production in the Watts Bar Region, R.R. Alexander, B.C. English, M.G. Bhat, and R.L. Graham . . . . . . . . . . . .
Herbaceous Energy Crops in Humid Lower South USA, G.M. Prine and K.R.Woodard . . . . . . . . . . . . . . . . . . . . . . . . . . . . . . . . . . . . . . . . . . . . . . . . . .
Understory Biomass from Southern Pine Forests as a Fuel Source, T.T. Ku and J.B.Baker . . . . . . . . . . . . . . . . . . . . . . . . . . . . . . . . . . . . . . . . . . . . . . . . . . . . .
Massahake Whole Tree Harvesting Method for Pulp Raw-Material and Fuel-R&D in 1993-1998, D.A. Asplund and M.A. Ahonen . . . . . . . . . . . . . . . . . .
Nutrient Enhanced Short Rotation Coppice for Biomass in Central Wales, R.W. Hodson, F.M. Slater, S.F. Lynn, and P.F. Randerson . . . . . . . . . . . . . . . . . . .
Development and Analysis of SRIC Harvesting Systems, B.J. Stokes and B.R.Hartsough . . . . . . . . . . . . . . . . . . . . . . . . . . . . . . . . . . . . . . . . . . . . . . . . .
Carbon and Nitrogen Distribution in Oak-Hickory Forests Distributed Along a Productivity Gradient, R.T. Reber, D.J. Kaczmarek,
. . . . . . . . . . . . . . . . . . . . . . . . . . . . . . . . . . . . . . . . P.E. Pope, and K.S. Rodkey Compatibility of Switchgrass as an Energy Crop in Farming Systems
of the Southeastern USA, D.I. Bransby, R. Rodriguez-Kabana, and S.E.Sladden . . . . . . . . . . . . . . . . . . . . . . . . . . . . . . . . . . . . . . . . . . . . . . . . . . .
Five Years of Research in Energy Plantation in Southern Quebec (Canada), M. Labrecque and T.I. Teodorescu . . . . . . . . . . . . . . . . . . . . . . . . . . . . . . . . . . . .
content^ (Continued)
Page /
Commercial Systems
Acquisition of Wood Fuel at the Joseph C. McNeil Generating Station, . . . . . . . . . . . . . . . . . . . . . . . . . . . . . . . . . . . . . . . . . . . . . . . . . . . . W.Kropelin
~rincibles of Commkrcially Available Pretreatment and Feeding Equipment for Baled Biomasses, T. Koch, R.M. Hummelshfl~ . . . . . . . . . . . . . . . . . . . . . . . . .
. . . . . . . . . . . . . . . . . . . . . . . . . Integrated Solid Waste Management in Japan, A.S. Gohen
POWER PRODUCTION
Combustion
Biomass Combustion Technologies for Power Generation, G.A. Wiltsee, Jr., C.R. McGowin, and E.E. Hughes . . . . . . . . . . . . . . . . . . . . . . . . . . . . . . . . . . . . .
Cofiring of Biofuels in Coal Fired Boilers: Results of Case Study Analysis, D.A. Tillman, E. Hughes, and B.A. Gold . . . . . . . . . . . . . . . . . . . . . . . . . . . . . . .
Successful Experience with Limestone and Other Storbents for Combustion . . . . . . . . . . . . . . . . . . . . . . . . . of Biomass in Fluid Bed Power Boilers, D.R. Coe
The Wood Brazilian Big-GT Demonstration Project, E. Carpentieri . . . . . . . . . . . . . . . . . . . Alkali Slagging Problems with Biomass Fuels, T.R. Miles, T.R. Miles, Jr.,
L.L. Baxter, B.M. Jenkins, and L.L. Oden . . . . . . . . . . . . . . . . . . . . . . . . . . . . . . . . . . . . . . . . . . . On-Site Power Generation for the Future, R.L. McCarroll and W.E. Partanen
. . . . . . . . . . . . . . . . . . . . . . Wood Power in North Carolina, J.G. Cleland and L. Guessous Assessment of Ethanol-Fueled IMHEXGD Fuel Cell Power Plants in
. . . . . . . . . . . . . . . . . . . . . . . . . . . Distributed Generation, R. Woods and J. Lefeld Computational Model of a Whole Tree combustor, K.M. Bryden and
K.W.Rag1and . . . . . . . . . . . . . . . . . . . . . . . . . . . . . . . . . . . . . . . . . . . . . . . . . . Economical Impact of the BIGICC Technology Use on the Sugar Cane Industry,
L.C. de Queiroz and M.J. Marzano do Nascimento . . . . . . . . . . . . . . . . . . . . . . . . . Steam Generation by Combus~on of Processed Waste Fats, F. Pudel
. . . . . . . . . . . . . . . . . . . . . . . . . . . . . . . . . . . . . . . . . . . . . . . and P. Lengenfeld
Thermal and Biological Gasification,
Thermal and Biological Gasification, R.P. Overend and C.J. Rivard . . . . . . . . . . . . . . . . . . 470 Pilot Scale Testing of Biomass Feedstocks for Use in Gasification1
Gas Turbine Based Power Generation Systems, D.J. Najewicz and A.H.Furman . . . . . . . . . . . . . . . . . . . . . . . . . . . . . . . . . . . . . . . . . . . . . . . . . . . 498
Production of 800 kW of Electrical Power Using Medium Calorific Gas from a Biomass Gasifier Integrated in a Combined Cycle, I. Gulyurtlu and I. Cabrita . . . . . . . . . . . . . . . . . . . . . . . . . . . . . . . . . . . . . . . . . . 5 13
Fuel Conversion Efficiency and Energy Balance of a 400 kW, Fluidized Bed Straw Gasifier, A. Ergiidenler, A.E. Ghaly, and F. Hamdullahpur, . . . . . . . . . . . 521
Evaluation of Energy Plantation Crops in a High-Throughput Indirectly Heated . . . . . . . . . . . . . . . . . . . . . . . . . . . . Biomass Gasifier, M.A. Paisley and R.D. Litt 538
vii
Contents (Continued)
Page
Development of a Catalytic System for Gasification of Wet Biomass, D.C. Elliott, L.J. Sealock, M.R. Phelps, G.G. Neuenschwander, and T.R.Ha ........................................................ 557
Biomass Gasification Hot Gas Cleanup for Power Generation, B.C. Wiant, D.M. Bachovchin, R.H. Carty, M. Onischak, D.A. Horazak, and R.H. Rue1 . . . . . . . 571
Process and Design Considerations for the Anaerobic Digestion of Municipal Solid Waste, S.R. Shrivastava and B. Bastuk . . . . . . . . . . . . . . . . . . . . . 583
Energy Supply of Food Processing Plants and Breweries from Its Specific Solid Wastes, U. Behmel, G. Leupold, and R. Meyer-Pittroff . . . . . . . . . . . 595
Biogas Production from Low Temperature Lagoon Digesters Treating . . . . . . . . . . . . . . . . . . . . Livestock Manure, L.M. Safley, Jr. and P.W. Westerman 608
. . . . . . . . . . . . . . . . . . . . . . . . . . . . . The R.D.F. Gasifier of Florentine Area, G. Barducci 621 Analysis of Tars Produced in Biomass Gasification, J. Zhou, Y. Wang,
. . . . . . . . . . . . . . . . . . . . . . . . . . . . . . . . . . . . . . . . . . . . . . and C.M. Kinoshita 634 Temperature and Pressure Distributions in a 400 kW, Fluidized Bed Straw
. . . . . . . . . . . . . . . . . . . Gasifier, A. Ergiidenler, A.E. Ghaly, and F. Hamdullahpur 640
Waste Generation, Disposal, Emissions
Manufacturing Combustible Briquettes from Forestry and Timber Industries' Wastes in Order to Reduce the Overexploitation of Fuelwood in
. . . . . . . . . . . . . . . . . . . . . . . . Central American Forests, L. Ortiz and E. Gonzalez 649 Utilization of Agricultural Waste in Power Production, J.C. Clausen
. . . . . . . . . . . . . . . . . . . . . . . . . . . . . . . . . . . . . . . . . . . . . . . . and I. Rasmussen 664 . . . . . . . . . Case Study of Recycling Options for New Hampshire Generators, P.M. Coleman 680
Environmental Issues: New Techniques for Managing and Using Wood Fuel . . . . . . . . . . . . . . . . . . . . . . . . . . . . . . . . . . . . Ash, J.E. Fehrs and C.T. Donovan 689
Wood Ash to Treat Sewage Sludge for Agricultural Use, R.K. White . . . . . . . . . . . . . . . . . 706 . . . . . . . . . . . . . . . . . . . . . . . . . Pilot Scale Cotton Gin Trash Energy Recovery, S.L. Harp 712
Direct Observation of the Release of Alkali Vapor Species in Biofuel . . . . . . . . . . . . . . . . . . . Combustion and Gasification, R.J. French and T.A. Milne 7 18
Emissions from Laboratory Combustor Tests of Manufactured Wood Products, R. Wilkening, M. Evans, K. Ragland, and A. Baker . . . . . . . . . . . . . . . . . . . . . . . . 724
Drying Wood Waste with a Pulse Combustion Dryer, A.G. Buchkowski andJ.A.Kitchen . . . . . . . . . . . . . . . . . . . . . . . . . . . . . . . . . . . . . . . . . . . . . . . . 730
Biomass Ash Utilization, D.R. Bristol, D.J. Noel, B. O'Brien, and B. Parker . . . . . . . . . . . . 736
Heat, Steam, and Fuels--Commercial Systems
The Biomass Energy Industry of Northern New England: Lessons for America, . . . . . . . . . . . . . . . . . . . . . . . . . . . . . . . . . . . . J.F. Connors and N.H. Keeney I11 742
North Plant Co-Generation Project for South Davis County Sewer Improvement . . . . . . . . . . . . . . . . . . . . . . . . . . . . . . . . . . . . . . . . . . . . . . District, L.S. Rogers 747
Contents (Continued)
Page
The ACIMETB Process: An Innovative Approach to Biogasification of . . . . . . . . . . . . . . . . . . . . . . . . . . . . . . Municipal Sludge, S. Ghosh, and K. Buoy 759
Biomass Power Production in Amazonia: Environmentally Sound, . . . . . . . . . . . . . . . . . . Economically Productive, D.B. Waddle, and J.B. Hollomon 770
A Fluidized Bed Furnace Fired with Biomass Waste to Supply Heat for a Spray Dryer in a Plant Producing Floortiles, I. Gulyurtlu, R. Andre, J. Mendes, A. Monteiro,
. . . . . . . . . . . . . . . . . . . . . . . . . . . . . . . . . . . . . . . . . . . . . . . . . . . and I. Cabrita 783 The Experience of Burning the High-Moistured Waste of Biomass
. . . . . . . . . . . . . . . . . . . Conversion, F.Z. Fincker, L.V. Zysin, and I.B. Kubyshkin 789
Volume Il
TRANSPORTATION FUELS
Biodiesel
. . . . . . . . . . . . . . . . . . . . . . . . An Overview of the Current Status of Biodiesel, T.B. Reed 797 Transesterification Process to Manufacture Ethyl Ester of
Rape Oil, R.A. Korus, D.S. Hoffman, N. Barn, C.L. Peterson, . . . . . . . . . . . . . . . . . . . . . . . . . . . . . . . . . . . . . . . . . . . . . . . . . and D.C. Drown 815
. . . . . . . . . . . . . . . . . . . . Conversion of Rice Hulls to Diesel Fuel, S. Ochs and J. Kuester 827 Nonaqueous Enzymatic Synthesis of Ester Fuels, E.S. Olson, H.K. Singh,
. . . . . . . . . . . . . . . . . . . . . . . . . . . . . . . . . . . . . . . . . . . . . and M.L. Yagelowich 837 Energetic and Economic Feasibility Associated with The Production,
Processing and Conversion of Beef Tallow to Diesel Fuel, . . . . . . . . . . . . . . . . . . . . . . . . . . . . . . . . . . . . . . . R.G. Nelson and M.D. Schrock 848
Chemical Composition of Tall Oil-Based Cetane Enhancer for Diesel . . . . . . . . . . . . . . . . . . . . . . . . . . . . . . . Fuels, Y. Feng, A. Wong, and J. Monnier 863
National Soydiesel Development Board Standards for Biodiesel, . . . . . . . . . . . . . . . . . . W.C. Holmberg, E.E. Gavett, P.N. Menill, and J.E. Peeples 876
Progress Report Idaho On-Road Test with Vegetable Oil As a . . . . . . . . . . . . . . . . . . . . . . . . . . . . . . . . Diesel Fuel, D. Reece and C.L. Peterson 891
Biodiesel from Microalgae: Complementarity in a Fuel Development . . . . . . . . . . . . . . . . . . . . . . . . . . . . . . . . . . . . . . . . . . . . . Strategy, L.M. Brown 902
Cost Implications of Feedstock Combinations for Community Sized . . . . . . . . . . . . . . . . . . . . . . Biodiesel Production, J.A. Weber and D.L. Van Dyne 910
Rapeseed Oil as Diesel Fuel, An Overview, C.L. Peterson, J. Brown, . . . . . . . . . . . . . . . . . . . . . . . . . . . . . . D. Guerra, D.C. Drown, and R.V. Withers 916
Rapeseed and Safflower Oils As Diesel Fuels, C.L. Peterson, H. Haines, andC.Chase . . . . . . . . . . . . . . . . . . . . . . . . . . . . . . . . . . . . . . . . . . . . . . . . . . . 922
Processing of Waste Fats into a Fuel Oil Substitute, F. Pudel . . . . . . . . . . . . . . . . . . . . . . . . . . . . . . . . . . . . . . . . . . . . . . . and P. Lengenfeld 928
Contents (Continued)
Page
Pyrolytic Liquids
Production of Fuels by Cellulose Liquefaction, B .KO Datta and C. A. McAuliffe . . . . . . . . . . 93 1 Fast Pyrolysis of Sweet Sorghum Bagasse in a Fluidized Bed,
M. Palm, J. Piskorz, C. Peacocke, D.S. Scott, and A.V. Bridgewater . . . . . . . . . . . . 947 MSW and Biomass to Liquid Fuels by Packaged Liquefaction Plants,
H.S. Joyner, B.M. Vaughan, D.H. White, and D. Wolf . . . . . . . . . . . . . . . . . . . . . 964 Light Hydrocarbon Liquids from Dry Raw Sewage Sludge,
D.G.B. Boocock, S.K. Konar, J. Liu, N. Bahadur, and A. Leung . . . . . . . . . . . . . . . 978 IEA Technoeconomic Sensitivity Analysis of Thermochemical Conversion
of Wood to Gasoline Processes, A.V. Bridgwater, J.P. Diebold, D. Beckman, D.C. Elliott, and Y. Salantausta . . . . . . . . . . . . . . . . . . . . . . . . . . . . 993
Ethanol
. . . . . . . . . . . . . An Overview of Ethanol Production for Transportation Fuels, C.E. Wyman 1010 Waste Paper and Pulp Sludge as Feedstock for Ethanol Production,
. . . . . . . . . . . . . . . . . . . . . . . . . . . . . . . . . . . . . . . . . . K. Sosulski, B. Swerhone 1032 Production of Ethanol from Corn Fiber, R.T. Elander and L.J. Russo . . . . . . . . . . . . . . . . . 1045 Development of Yeasts for Xylose Fermentation, T.W. Jeffries,
V. Yang, J. Marks, S. Amartey, W.R. Kenealy, J.-Y. Cho, . . . . . . . . . . . . . . . . . . . . . . . . . . . . . . . . . . . . . . . . . . . K. Dahn, and B.P. Davis 1056
Improving Ethanol Production by Membrane Technology: The . . . . . . . . . . . . . . . Continuous Saccharification Reactor, M. Cheryan and J. Escobar 1068
Separation of Acid and Sugar by Ion Exclusion Chromatography, An Application in the Conversion of Cellulose to Ethanol,
. . . . . . . . . . . . . . . . . . . . . . . . . . . . . . . . . . . . . . . . . . S. Hartfield and R. Hester 1078 Automated Small-Scale Fuel Alcohol Plant: A Means to Add Value to
Food Processing Waste, J.H. Wolfram, L.P. Wernimont, . . . . . . . . . . . . . . . . . . . . . . . . . . . . . . . . . . . . . . . . . . . . . . . . . . and J.G. Keller 109 1
Engineering Aspects of Lignocellulosic Biomass Conversion to Ethanol, . . . . . . . . . . . . . . . . . . . . . . . . . . . . . . . . . . . . . . G.P. Philippidis and T.K. Smith 1104
Overview of Chemical Pretreatment of Biomass for Ethanol Production- Constraints, Challenges, Current Status, and Future Trends, T.-A.Hsu . . . . . . . . . . . . . . . . . . . . . . . . . . . . . . . . . . . . . . . . . . . . . . . . . . . . . 1110
Methanol and Ethers
Expanding Liquid Transportation Fuels Through Methanol, Higher Alcohols . . . . . . . . . . . . . . . . . . . . . . . . . . . . . . . . . . . . . . . . . . . . . and Ethers, W .J. Pie1 1 1 16
Hot-Gas Conditioning of Biomass Derived Synthesis Gas, M.A. Paisley and R.D.Litt . . . . . . . . . . . . . . . . . . . . . . . . . . . . . . . . . . . . . . . . . . . . . . . . . . . . . . 1133
The Production of Nonhydrocarbon-Derived Methanol, Ethanol, and Their -
Butyl Ethers from Biomass and Butanes Using the MOP Process, . . . . . . . . . . . . . . . . . . . . . . . . . . . . . . . . . . . . . N.E. Anderson and D.E. Hallberg 1148
Contents (Continued)
Current and Future Market Developments for Fuel Ncohols and . . . . . . . . . . . . . . . . . . . . . . . . . . . . . . . . . . . . . . . . . . . Ethers, K.D. Miller, Jr.
Commercial Systems
The Economic Characteristics of the U.S. Fuel Ethanol Market, K.N. Rask and N. Rask . . . . . . . . . . . . . . . . . . . . . . . . . . . . . . . . . . . . . . . . . . . .
. . . . . . . . . . . . . . . . . . . . . . . . . . . . . . . . . Fuel Ethanol Production in Brazil, I.C. Macedo The Development of Commercial Scale Rapid Thermal Processing of Biomass,
. . . . . . . . . . . . . . . . . . . . . . . . . . . . . . . . . S.L. Smith, R.G. Graham, and B. Free1
CHEMICALS AND PRODUCTS
Research I
. . . . . . . . . . Chemicals and Products Erom Biomass Conversion: An Overview, H.E. Chum Catalytic Conversion of a Wood-Derived Oil to Fuels and Chemicals:
Effect of Process Conditions and Catalysts, 9.D. Adjaye and '
. . . N.N.Bakhshi . . . . . . . . . . . . . . . . . . . . . . . . . . . . . . . . . . . . . . . . . . . . . . . . A Novel Multiphase Bioreactor for Fermentations to Produce Organic
Acids from Dairy Wastes, S.-T. Yang, H. Zhu, Y. Li, and E.M.Silva . . . . . . . . . . . . . . . . . . . . . . . . . . . . . . . . . . . . . . . . . . . . . . . . . . . . .
Three Immobilized-Cell Columnar Bioreactors for Enhanced Production . . . . . . . . . of Commodity Chemicals, B.H. Davison, C.D. Scott, and E.N. Kaufman
Bonding Exterior Grade Structural Panels with Copolymer Resins of Biomass Residue Components, Phenol, and Formaldehyde,
. . . . . . . . . . . . . . . . . . . . . . . . . . . . . . . . . . . . . . . . . . . . . . . . . . . . . . C.M.Chen Metal Mediated Transformations of Lignin Models. Preparation of
Benzoquinones as Chemical Intermediates, 9.J. Bozell andB.R.Hames . . . . . . . . . . . . . . . . . . . . . . . . . . . . . . . . . . . . . . . . . . . . . . . . .
Wood as a Feedstock for Activated Carbons, M. Jagtoyen and F. Derbyshire, . . . . . . . . . . . . Catalytic Conversion of Lactic Acid and Its Derivatives, P.B. Kokitkar,
R. Langford, D.J. Miller, and J.E. Jackson . . . . . . . . . . . . . . . . . . . . . . . . . . . . . . . Production of Low-Cost Calcium Magnesium Acetate (CMA) as an
Environmentally Friendly Deicer from Cheese Whey, S.-T. Yang, . . . . . . . . . . . . . . . . . . . . . . . . . . . . . . . . . . . . . . . H.Zhu,Y.Li,andI.-C.Tang
Study of Lignocellulose~Components for Production of Lactic Acid, N. Padukone, S.L. Schmidt, B.J. Goodman, and C.E. Wyman . . . . . . . . . . . . . . . . .
Fractionation of Lignocellulosic Biomass Components by Prehydrolysis- Organosolv Delignification, M.G. Papatheofanous, E. Billa, D.P. Koullas, B. Monties, and E.G. Koukios . . . . . . . . . . . . . . . . . . . . . . . . . . . . .
Page ,
1159
content^ (Continued)
Page
Biodegradable LigninIPolyolefin Composite Films, B. KoBikovB, V. Demjanovh, M. MikulASovB, and J.H. Lora . . . . . . . . . . . . . . . . . . . . . . . . . . . . 1326
Hemicellulose as a Potential Substrate for Production of PHA (A Biodegradable Thermoplastic), J.A. Ramsay, M.-C. B.A. Hassan, and B.A. Ramsay . . . . . . . . . . . . . . . . . . . . . . . . . . . . . . . . . . . . . . . . . . . . . . . . 1332
New Lignin Products for Ecological Situation Improvement, G. Telysheva and G. Shulga . . . . . . . . . . . . . . . . . . . . . . . . . . . . . . . . . . . . . . . . . . . . . . . . . . 1339
Technology 'Transfer
Commercialization of Low Molecular Weight Guayule Rubber in Environmentally Friendly Coatings, S.F. Thames and 2.14. He . . . . . . . . . . . . . . . . . 1344
Ablative Fast Pyrolysis: Converting Wood, Agriculturd Wastes and Crops into Energy and Chemicals, D.A. Johnson, D. Maclean, H.L. Chum,
. . . . . . . . . . . . . . . . . . . . . . . . . . . . . . . . . . . . . . . . . . . . . . . . and R.P. Overend 1367 The Thermochemical Conversion of Cellulosic Biomass to High Value
Chemicals and Fuel Additives, S.W. Fitzpatrick . . . . . . . . . . . . . . . . . . . . . . . . . . . 1385 Sweet Sorghum Cropping Systems for On-Farm Ethanol or Lactic Acid,
. . . . . . . . . . . . . . . . . . . . . . . . . . . . I.C. Anderson, D.R. Bwton, and E.L. Hunter 1409 Using Biosolids from Agricultural Processing as Food for animals,
R.L. Belyea, T.E. Clevenger, D.L. Van Dyne, S.E. Eckhoff, . . . . . . . . . . . . . . . . . . . . . . . . . . . . . . . . . . . . M.A. Wallig, and M.E. Tumbleson 1416
Food, Fuel, and Feed Production with Microalgae, J.R. Benemarm . . . . . . . . . . . . . . . . . . . . . . . . . . . . . . . . . . . . . . . . . . . . . . . and J.C. Weissman 1427
Commercial Systems
. . . . . . . . . . . . . . . . . . . . . . . . . . Chemicals from Biomass by Fermentation, R.L. Hinman 1441 Commercial Production of Specialty Chemicals and Pharmaceuticals from Biomass,
. . . . . . . . . . . . . . . . . . . . . . . . . . . . . . . . . . . . . . . . . . . . . . . . . J.D. McChesney 1448 Commercial Charcoal Manufacture in Brazil, M.E. Rezende, A. Lessa,
. . . . . . . . . . . . . . . . . . . . . . . . . . . . . . . . . . V. Pasa, R. Sampaio, and P. Macedo 1456 The Growth and Harvesting of Kenaf and Its Conversion to Products:
Case History of an Industrial Biomass Crop, C.S. Taylor . . . . . . . . . . . . . . . . . . . . 1472 Commercial Production of the Oil Absorbent Sea Sweep, T.B. Reed
. . . . . . . . . . . . . . . . . . . . . . . . . . . . . . . . . . . . . . . . . . . . . . . . and W.L. Mobeck 1485
Volume I l l
ENVIRONMENTAL ISSUES
Global Climate Change
Options for Cost-Effectively Reducing Atmospheric Methane Concentrations from Anthrapogenic Biomass Sources, K.F. Roos, C. Jacobs, and M. Orlic . . . . . . . . 1494
Contents (Continued)
Page
Reducing the Rate of Carbon Dioxide Buildup with Biomass Fuel Under . . . . . . . . . . . . Climate Change, R. Peart, R. C q , J. Jones, K. Boote, and L. Allen
Bottom-Up Comparisons of C02 Storage and Costs in Forestry and Biomass . . . . . . . . . . . . . . . . . . . . . . . . . . . . . . . . . . . . . . . Energy Projects, J.N. Swisher
Environmental Benefits of the Brazilian Ethanol Programme, E.L. La Rovere . . . . . . . . . . . . . . . . . . . . . . . . . . . . . . . . . . . . . . . . . . . . . . . . . . andP.Audinet
The Impact of a 50% Reduction of Solid Waste Disposal in Canada on Methane Emissions from Landfills in 2000, E.M.F. Patenaude, G.T. Owen and J.A. Barclay . . . . . . . . . . . . . . . . . . . . . . . . . . . . . . . . . . . . . . . .
Biomass Utilization
Environmental Issues Related to Biomass: An Overview, M. Hughes . . . . . . . . . . . . . . . . . . . . . . . . . . . . . . . . . . . . . . . . . . . . . . . . andJ.W.Ranney
Renewable Biomass Energy: Understanding Regional Scale Environmental . . . . . . . . . . . . . . . . . . . . . . . . . . . . . . Impacts, R.L. Graham and M. Downing :.
Preliminary Results of the Impacts of Intensive Harvesting on Soil . . . . . . . . . . . Chemistry and Temperature, M.K. Mahendrappa and D.G.O. Kingston
Fueling Diesel Engines with Methyl-Ester Soybean Oil, L.G. Schumacher, W .G. Hires, and S.C. Borgelt . . . . . . . . . . . . . . . . . . . . . . . . . . . . . . . . . . . . . . . .
Hazardous Emissions, Operating Practices, and Air Regulations at Industrial . . . . . . . . . . . . . . . . . . . . . . . . . Wood-Fired Facilities in Wisconsin, A.J. Hubbard
Biomass Growth Aspects During Bioreclamation of Contaminated Soils, . . . . . . . . . . . . . . . . . . . . . . . . . . . . . . . . . . . . . M. Elektorowicz and R.N. Yong
Woody Biomass Production in a Spray Irrigation Wastewater Treatment . . . . . . . . . . . . . . . . Facility in North Carolina, D. Frederick, R. Lea, and R. Milosh
. . . . . . . . . . . . . . . . . . . . . . . . . . . . Cells on Corrugations for Pollution Control, R. Clyde Suitable Woody Species for a Land Application Alternative to Pulp and
Paper Mill Wastewater Disposal, M. Aw and M.R. Wagner . . . . . . . . . . . . . . . . . . The Opportunities for Woody Biomass Fuels in New Zealand Produced in
Association with Land Disposal of Effluent, R.E.H. Sims . . . . . . . . . . . . . . . . . . . . . . . . . . . . . . . . . . . . . . . . . . . . . . . . . . andC.Collins
Wastewater Sludge Fertilization: Biomass Productivity and Heavy Metal Bioaccumulation in Two Salix Species Grown in Southern , Quebec (Canada), T.I. Teodorescu, M. Labrecque, S. Daigle,
. . . . . . . . . . . . . . . . . . . . . . . . . . . . . . . . . . . . . . . . . . . . . . . . . . andG.Poisson
Biofuels Test Procedures
An Overview of the Effect of Fuel Properties on Emissions from Biomass Fuels, M.S. Graboski . . . . . . . . . . . . . . . . . . . . . . . . . . . . . . . . . . . . . . . . . . . . .
Reporting of Fuel Properties When Testing Diesel Engines with Alternative . . . . . . . . . . . . . . . . . . . . . . . . Fuels an ASAE Engineering Practice, C.L. Peterson
Fuel Characterization Requirements for Cofiring Biomass in Coal-Fired . . . . . . . . . . . . . . . . . . . . . Boilers, D.E. Prinzing, N.S. Harding, and D.A. Tillman
xiii
Contents (Continued)
Page
Feedstock Characterization and Recommended Procedures, H.L. Chum, T.A. Milne, D.K. Johnson, and F.A. Agblevor . . . . . . . . . . . . . . . . . . . . . . . . . . . . 1685
COMMERCIALIZING BIOMASS PROJECTS
Key Issues
Coming On Stream: Financing Biomass and Alternative-Fuel Projects in the . . . . . . . . . . . . . . . . . . . . . . . . . . . . . . . . . . . . . . . . . . 1990s, E.B. Mumford, Jr. 1704
Tax Issues and Incentives for Biomass Projects, K. Martin . . . . . . . . . . . . . . . . . . . . . . . . . 1712 The Economics of Producing Energy Crops, H. Shapouri and J. Duffield . . . . . . . . . . . . . . . 1723 Income Tax Credits and Incentives Available for Producing Energy
. . . . . . . . . . . . . . . . . . . . . . . . . . . . . . . . . . . . . . . from Biomass, G.A. Sanderson 1738 Legislative Factors Influencing the Use of Ethanol in the United States,
. . . . . . . . . . . . . . . . . . . . . . . . . . . V.L. Putsche, B.J. Goodman, and C.E. Wyman 1744 . . . . . . . . . . . . . . . . . . . . . . . Environment, Bioenergy, and Politics in Norway, R. Veiberg 1750
I
Case Histories
Three Biomass Power Plants in New England First Five Years of Challenges . . . . . . . . . . . . . . . . . . . . . . . . . . . . . . . . . . . . . . . . . and Solutions, J.D. LeBlanc 1754
Case History of MSW-to-Energy Financings Session 4C, Commercializing . . . . . . . . . . . . . . . . . . . . . . . . . . . . Biomass Projects-"Key Issues", D.L. Barrett 1770
Case Study: 1-95 Landfill Gas Recovery Project, Fairfax County, Virginia, M.J. McGuigan, E.R. Peterson, J.M. Smithberger,
. . . . . . . . . . . . . . . . . . . . . . . . . . . . . . . . . . . . . . . . . . . . . . . . . and W.L. Owen 1787 . . . . . . . . . . . . . . . . . . . . . . . . . . . Power from Municipal Solid Waste, A. Fidalgo dos Reis 1796
BIOMASS ENERGY SYSTEMS STUDIES
The Role of Natural Resource and Environmental Economics in Determining the Trade-offs in Consumption and Production of Energy Inputs:
. . . . . . . . . . . . The Case of Biomass Energy Crops, M. Downing and R.L. Graham 1802 An Inventory Control Model for Biomass Dependent Production Systems,
. . . . . . . . . . . . . . . . . . . . . . . . . . . . . . . . . . . . . . . . S.C. Grado and C.H. Strauss 1818 Commercialization Analysis for Fuels from Pinyon-Juniper Biomass,
. . . . . . . . . . . . . . . . . . . . . . . . . . . . . . . . . . . . . . . . . . . . . . . . . . . . G.P. Morris 1833 An Economic Evaluation of Forest Improvement Opportunities and
Impacts from the Emergence of a Biomass Fuel Market in Southwestern Nova Scotia: Phase I. Development of Framework
. . . . . . . . . . . . . . . . . . . . . . . . . . and Methodology, A.L. Manley and G.D. Savage 1839 . . . . . . . . . . . . . . . . . . . . . . . . . Great Lakes Regional Biomass Energy Program, F. Kuzel 1845
. . . . . . . . . . . . . . . . . Public Beliefs That May Affect Biomass Development, H.M. Draper 1849 Considerations in Implementing Integrated Biomass Energy Systems
. . . . . . . . . . . . . . . . . . . . . in Developing Countries, R.D. Perlack and J.W. Ranney 1855
Contents (Concluded)
Page Evaluating Energy-System Alternatives in the Context of Sustainable
. . . . . . . . . . . . . . . . . . . . . . . . . . . . . . . . . . . . . . . . . . . Development, D. Wilson 1861 . . . . . . . . . . . . . . . . . . . . . . . . . . . Northeastern States Sharpen Biomass Focus, P.D. Lusk 1867
BIOMASS IN LATIN AMERICA-OVERVIEW
. . . . . . . . . . . . . . . . . . . . . . . . . . . . . . . Biomass in Latin America-Overview, W.R. Park 1877 . . . . . . . . . . . . . . . . . . . . . . . . . . . . . . . . . . . . . . . Ethanol Fuels in Brazil, S.C. Trindade 1885
Biomass as ~eedstock for Chemicals and Energy on the Threshold of the . . . . . . . . . . . . . . . . . . . . . . . . . . . . . . . . . . . . . . 2lst Century, R.E. Cunningham 1906
OPTIONS FOR COST-EFFECTIVELY REDUCING ATMOSPHERIC METHANE 9
C O N C ~ T I O N S FROM ANTHROPOGENIC BIOMASS SOURCES '
K. F. Roos, C. Jacobs, and M. Orlicb U. S . Environmental Protection Agency
Washington, DC 20460
Abstract
Methane is a major greenhouse gas, second only to carbon dioxide in its contribution to future global warming. Methane concentrations have more than doubled over the last two centuries and continue to rise annually. These increases are largely correlated with increasing human populations. Methane emissions from human related activities currently account for about 70 percent of annual emissions. Of these human related emissions, biomass sources account for about 75 percent and non-biomass sources about 25 percent. Because methane has a shorter lifetime than other major greenhouse gases, efforts to reduce methane emissions may fairly quickly be translated into lower atmospheric concentrations of methane and lower levels of radiative forcing. This fairly quick response would have the benefit of slowing the rate of climate change and hence allow natural ecosystems more time to adapt.
Importantly, methane may be cost-effectively reduced from a number of biomass and non-biomass sources in the United States and worldwide. Methane is a valuable fuel, not just a waste by-product, and often systems may be reconfigured to reap the fuel value of the methane and more than justify the necessary expenditures. Such options for reducing methane emissions from biomass sources exist for landfills, livestock manures, and ruminant livestock, and have been implemented to varying degrees in countries around the world. However, there are a number of barriers that hinder the more widespread use of technologies, including institutional, financial, regulatory, informational, and other barriers. This paper describes an array of available options that may be cost-effectively implemented to reduce methane emissions from biomass sources.' This paper also discusses a number of programs that have been developed in the United States and internationally to promote the implementation of these methane reduction options and overcome existing barriers.
Background: Methane Is An Important Greenhouse Gas
Methane is an important greenhouse gas and a major environmental pollutant while also being a potentially valuable renewable energy source. Options for reducing emissions of methane into the atmosphere offer one of the most effective means of mitigating global warming in the near term for the following reasons: ,
i#
Methane is one of the principal greenhouse gases, second only to carbon dioxide (COJ in its contribution to potential global warming. In fact, methane is responsible for roughly 18 percent of the total contribution in 1990 of all greenhouse gases to "radiative forcing," the measure used to determine the extent to which the atmosphere is trapping heat due to emissions of greenhouse gases.
Methane's atmospheric concentration is rising rapidly, more than doubling over the last two centuries1 and currently increasing at about 0.6 percent per year2, in contrast to CO,, whose atmospheric concentration is increasing at 0.4 percent per year.=
Methane is a potent contributor to global warming. On a kilogram for kilogram basis, methane is a more potent greenhouse gas than C02 (about 60 times greater after 20 years, 22 times greater after 100 years, and 9 times greater after 500 year^).^
Reductions in methane emissions will produce substantial benefits in the short-run. Methane has a shorter atmospheric lifetime than other greenhouse gases -- methane lasts around 10 years in the atmosphere4, whereas CO, lasts over 200 years. Due to methane's high potency and short life span, stabilization of methane emissions will have a rapid impact on mitigating potential climate change.
Methane stabilization is likely to be nearly as effective as limiting CO, emissions to 1990 levels. In order to stabilize methane concentrations at current levels, anthropogenic methane emissions would need to be reduced by about 10 to 15 percent. This methane concentration stabilization would have roughly the same effect on reducing the expected potential warming of the earth over the next fifty years as maintaining C02 emissions at 1990 levels as illustrated in Figure I.
There are many opportunities to modify human activities that emit methane because human related activities account for about 70 percent of annual methane emissions. Methane is emitted into the atmosphere largely by anthropogenic (human-related) sources, which currently account for approximately 70 percent of the estimated 500 teragrarns (Tg) of annual global methane emission^.^ Anthropogenic biomass sources account for about 50 percent of global methane emissions and include: landfills; ruminant livestock; livestock manures; rice cultivation; and biomass burning. Anthropogenic non-biomass sources account for about 20 percent of global emissions and natural sources of methane currently account for the remaining 30 percent of global emissions as illustrated in Table 1.
In contrast to the numerous sources of other greenhouse gasses, a few large and gassy facilities often account for a large portion of methane emissions. Applying emissions
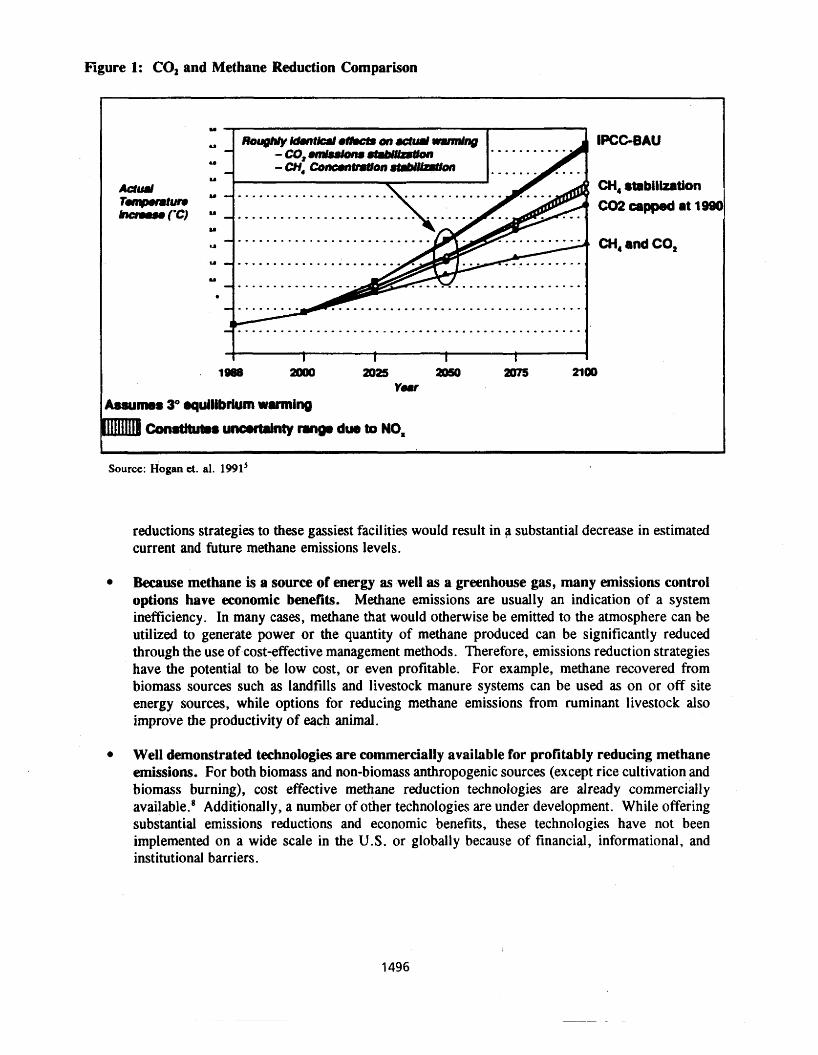
Figure 1: CO, and Methane Reduction Comparison
Y
U
U
U
Aclurrl LI
; CH, mblllzation 1 - t ~ hclws. ('C)
I C02cappedat1980 U
a* CH, and CO, U
Y
loss 2000 m25 ZOSO 2075 2100 Yaw
A w m s 3" qulllbrium warming
ConsUtute8 uncarbinty nngo due to NO,
Source: Hogan et. al. 1991'
reductions strategies to these gassiest facilities would result in a substantial decrease in estimated current and future methane emissions levels.
Because methane is a source of energy as well as a greenhouse gas, many emissions control options have economic benefits. Methane emissions are usually an indication of a system inefficiency. In many cases, methane that would otherwise be emitted to the atmosphere can be utilized to generate power or the quantity of methane produced can be significantly reduced through the use of cost-effective management methods. Therefore, emissions reduction strategies have the potential to be low cost, or even profitable. For example, methane recovered from biomass sources such as landfills and livestock manure systems can be used as on or off site energy sources, while options for reducing methane emissions from ruminant livestock also improve the productivity of each animal.
Well demonstrated technologies are commercially available for profitably reducing methane emissions. For both biomass and non-biomass anthropogenic sources (except rice cultivation and biomass burning), cost effective methane reduction technologies are already commerciaily available.* Additionally, a number of other technologies are under development. While offering substantial emissions reductions and economic benefits, these technologies have not been implemented on a wide scale in the U.S. or globally because of financial, informational, and institutional barriers.
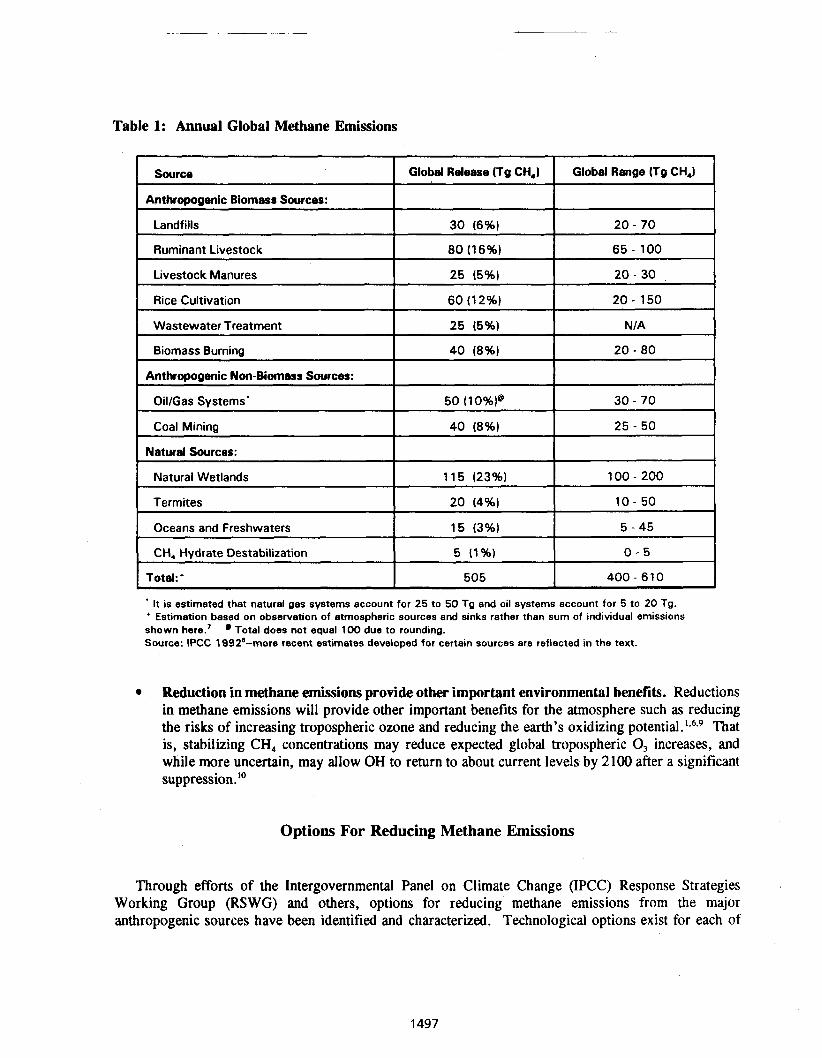
Table 1: Annual Global Methane Emissions
It is estimated that natural gas systems account for 25 to 50 Tg and oil systems account for 5 to 20 Tg. + Estimation based on observation of atmospheric sources and sinks rather than sum of individual emissions shown here.' @ Total does not equal 100 due to rounding. Source: IPCC 1992'--more recent estimates developed for certain sources are reflected in the text.
Reduction in methane emissions provide other important environmental benefits. Reductions in methane emissions will provide other important benefits for the atmosphere such as reducing the risks of increasing tropospheric ozone and reducing the earth's oxidizing p~tential. ' .~.~ That is, stabilizing CH, concentrations may reduce expected global tropospheric 0, increases, and while more uncertain, may allow OH to return to about current levels by 2100 after a significant upp press ion.'^
Global Range (Tg CH,)
20 - 70
65 - 100
20 - 30
20 - 150
NIA
20 - 80
30 - 70
25 - 50
100 - 200
10 - 50
5 - 45
0 - 5
400 - 610
Source
Anthropogenic Biomass Sources:
Landfills
Ruminant Livestock
L~vestock Manures
Rice Cultivation
Wastewater Treatment
Biomass Burning
Anthropogenic Non-Biomass Sources:
OilIGas Systems'
Coal Mining
Natural Sources:
Natural Wetlands
Termites
Oceans and Freshwaters
CH, Hydrate Destabilization
Total: +
Options For Reducing Methane Emissions
Global Release (Tg CH,)
30 (6%)
80 (1 6%)
25 (5%)
6 0 (1 2%)
25 (5%)
40 (8%)
50 (lo%)@
40 (8%)
1 15 (23%)
20 (4%1
15 (3%)
5 (1%)
505
Through efforts of the Intergovernmental Panel on Climate Change (IPCC) Response Strategies Working Group (RSWG) and others, options for reducing methane emissions from the major anthropogenic sources have been identified and characterized. Technological options exist for each of
the following biomasse sources and represent about 35 percent of anthropogenic emissions:
Landfills; Livestock Manures; and Ruminant Livestock.
Efforts are still required to develop and demonstrate options for reducing methane emissions from biomass burning and rice cultivation.
Many of the technological options currently available are cost-effective in many regions of the world, and have already been implemented to a limited extent. The available options represent different Levels of technical complexity and capital needs and therefore should be adaptable to a wide variety of country situations. ~iscussiobs of the available technologies for each of the above biomass sources follow.'
Landfills
Methane is generated in landfills as a direct result of the decomposition of the organic component (volatile solids) of solid wastes. The organic component of landfilled waste is broken down by bacteria in a complex biological process, which produces methane, carbon dioxide, and trace gases. Because the methanogenic (methane-producing) stage of this process is anaerobic, methane production is favored in landfills capped with soil or clay that limits air infiltration. However, anaerobic conditions will exist to some extent in any landfill, whether it is covered or not. The most recent estimate of global methane emissions from landfills ranges from 20 to 60 Tg per year: primarily from developed countries. Several options have been identified that can reduce methane emissions from landfills by up to 90 percent. Additional benefits that result from these strategies include improved air and water quality, reduced risk of fire and explosion, and the recovery of a clean and convenient fuel. The available options include:
*
Methane Recovery and Utilization
Methane can be recovered from landfills, and its energy value may be put to a profitable use. The recovery of methane from anaerobic landfills can be a low-cost and relatively low technology option. Recovery efficiencies are typically as high as 80 percent, with some projects achieving almost complete recovery. Utilization options for the recovered gas include electricity generation, direct use in industry, and natural gas supply."
Aerobic Landill Management
Using a more complex technology, landfills have been designed to be aerobic in Japan so that less methane is produced. Aerobic designs increase the rate of decomposition and reduce the emissions of harmfbl and odorous trace gases into the atmosphere while also reducing the total volume landfilled. Semi-aerobic landfills equipped with single air conduction channels have been able to reduce methane emissions by more than 50 percent. More advanced designs that are still being developed have achieved reductions of over 80 percent in test applications.
Reduced LQndfilZing of Waste
The reduced landfilling of waste is an additional option that reduces the quantity of waste placed in landfills. This can be achieved by recycling and reusing material, incinerating solid waste and
composting organic material, and through additional technologies under development.
Livestock Manure Management
Methane is produced during anaerobic decomposition of the organic material (volatile solids) in livestock manure. Manure management systems that store manure under anaerobic conditions such as lagoons or liquid/slurry tanks are the major contributors to methane emissions from this source. The most recent estimate of global emissions from this source ranges from 10 to 18 Tg per year.".''
Methane emissions from anaerobic digestion constitute a wasted energy resource which can be recovered by adapting manure management and treatment practices to facilitate methane collection. This methane (biogas) can be used directly to produce on-farm electricity, heat, and cooling or for off-farm electrical sales.16 The other products of anaerobic digestion, contained in the treated manure effluent, can be utilized in a number of ways, depending on local needs and resources. Successful applications include use as animal feed supplements, aquaculture applications, and as a crop fertilizer. Additionally, managed anaerobic decomposition is a very effective method of reducing the environmental and human health problems associated with manure management. The controlled bacterial decomposition of the volatile solids in manure reduces the potential for contamination from runoff, significantly reduces pathogen levels, removes most noxious odors, and retains the nitrogen content of the manure.
The development of successful manure-to-energy facilities depends on several important regional factors, including the ambient temperature and climate; economic, technical and material resources; existing manure management practices; regulatory requirements; and the specific benefits of developing an energy resource and a source of high quality fertilizer. Choosing regionally appropriate technologies is vital to gaining the acceptance of the technologies by livestock producers. With successful implementation, current reduction options can reduce methane emissions by as much as 25 to 80 percent at particular sites. Identified options include:'
Covered Lagoons
The treatment of manure in lagoons is typically associated with intensive farm operations. Manure solids are washed out of the livestock housing facilities with large quantities of water, and the resulting slurry flows into a primary lagoon or series of lagoons. The anaerobic conditions treat the manure by destroying volatile solids thereby reducing biological oxygen demand (BOD) and generally producing significant methane emissions, provided temperatures remain high enough. Placing an impermeable floating cover over the lagoon and connecting a gas blower effectively recovers methane which can be cost-effectively utilized for electricity generation, farm heating, and refrigeration. Lagoons are most common in North America, Europe, and regions of Asia and Australia.
Small Scale Digesters
Digesters are designed to enhance the anaerobic decomposition of organic material and to maximize methane production and recovery. Small scale digesters typically require a small amount of manure and are relatively simple to build and operate. As such, they are an appropriate strategy for regions with technical, capital, and material resource constraints. Due to the rising cost of commercial fertilizers, the recovery of high quality fertilizer from digesters can be an even more important benefit than the energy supplied from biogas. A number of different digester designs have been developed such as the Fixed Dome, KVIC, and Flexible Bag. These designs are not heated, and while they can operate in colder
regions under batch loading operation, they are more appropriate for temperate and tropical regions.
Large Scale Digesters
Larger, often more technologically advanced digesters are usually heated, have larger capacities, require greater capital investment, and in general are more complex to build and operate. However, advanced designs can greatly improve the performance of livestock manure treatment, and can operate in colder regions. The operation of these digesters can be integrated with current manure management practices at large livestock operations and typicdly in more developed regions. The two primary digester designs are Complete Mix and Plug Flow digesters. Manure quantity and the percent total solids of the manure are important for determining appropriate design criteria for all digester systems.
Ruminant Livestock
Ruminant livestock is one of the largest anthropogenic biomass sources of methane emissions globally. Methane is produced as part of the normal digestion process of ruminant animals (cattle, buffalo, sheep, goats, and camels) as nutrients (proteins, carbohydrates etc.) are digested from a typical biomass diet in their forestomach, ,or rumen. Some of this methane, which is exhaled or eructated by the animal, represents an inefficiency -- feed energy converted to methane cannot be used by the animal for maintenance, growth or production of product. The most recent estimate of global emissions from this source ranges from 50 to 82 Tg per year: with large ruminants (cattle and buffalo) accounting for about 80 percent of these emissions."
The conditions under which animals are managed vary greatly by country, especially between developed and developing countries. Reduction strategies must be tailored to country-specific circumstances. Despite the differences in animal management practices among various countries, one common strategy for reducing methane emissions is to increase animal productivity. This leads to smaller size herds required to produce the same amount of product. With adequate resources, current and potential future technologies and management practices can reduce methane emissions per unit product by 25 to 75 percent in many animal management system^.'^ Virtually all efforts that improve animal productivity will reduce methane emissions per unit product produced. Many opportunities exist for reducing methane emissions from ruminant animals by improving animal productivity and reducing methane emissions per unit of product (e.g., methane emissions per kilogram (kg) of milk produced):
Improved Nutrition Through Mechanicul & Chemical Feed Processing .
Improved nutrition reduces methane emissions per unit product by enhancing animal performance, including weight gain, milk production, work production, and reproductive performance. Mechanical and chemical feed processing options include wrapping and preserving rice straw to enhance digestibility, chopping straw to enhance animal intake, and alkali treatment of low digestible straws to enhance digestibility. These options are applicable to accessible ruminant animals with limited or poor quality feed, and may decrease methane emissions per unit product on the order of 10 to 25 percent (assuming feed digestibility is increased by 5 percent), depending on animal management practices.
Improved Nutrition nrough Strategic Supplementation
Strategic supplementation provides critical nutrients such as nitrogen and important minerals to animals on low quality feeds. Additionally, it may include providing microbial and/or bypass protein to
the animal. Methane emissions per unit product may be reduced by 25 to 75 percent due to substantial increases in animal productivity, depending on animal management practices. In particular, applying molasses urea blocks (MUBs) and bypass protein techniques in tropical areas with chronic feed constraints can produce emissions reductions per unit product near the high end of the range.13.14 The use of chemicals (ionophores) and defaunation are also possible options, though further efforts to develop better agents and to demonstrate practical methods of defaunation are necessary.
Production Enhancing Agents
Certain agents can act directly to improve productivity. These agents are generally most applicable to large-scale commercial systems with welldeveloped markets. Emissions reductions per unit product of 5 to 15 percent have been demonstrated. Additional reductions may be achieved by shifts in rumen microbial patterns. Options include the use of bovine somatotropin @ST) and anabolic steroids.
Improved Production nrough Improved Genetic C;haracteristics
Genetic characteristics are limiting factors mainly in intensive production systems. Improvements in genetic characteristics over the last fifty years have already contributed to substantial reductions in methane emissions per unit product in these systems. Continued improvements in genetic potential will further increase productivity, and thereby further reduce methane emissions per unit product. Emissions reductions from these options remain to be quantified.
Improved Production Eflciency nrough Improved Reproduction
Large portioris of the herd of large ruminants are maintained for the purpose of producing offspring. Methane emissions per unit product can be significantly reduced if reproductive efficiency is increased and fewer animals are required to provide the desired number of offspring. Options such as artificial insemination, twinning, and embryo transplants address reproduction directly. The nutritional options described above can also improve reproduction.
Efforts To Achieve These Reductions
These options for reducing methane emissions from biomass sources while offering substantial reduction potential have not been implemented on a wide scale to date. A number of barriers currently limit the implementation of these options around the world. This includes financial, informational, political, and in some cases technical barriers. Future efforts will have to remove these barriers. In general, future efforts should be targeted toward:
Scoping Assessments: Identifying the most promising of the available technologies and practices for specific regions around the world and identifying the barriers that may have to be overcome.
Prefeasibility Analyses: Compiling detailed technical information on specific candidate sites and regions to overcome one of the most powerful barriers -- lack of information on how technologies can actually be deployed at specific sites.
Demonstration Projects: In many cases, demonstrating technology which fully matches the users set of needs in relation to constraints in specific areas will be crucial to removing existing barriers. Upon the clear demonstration that certain appropriate technologies have substantial pay backs in addition to large environmental benefits when put into practice, much more energy will be placed toward removing other barriers.
Institution Building: Changes in technologies and practices require in-country institutional support in a number of different forms ranging from policy support to technical training support. Lack of institutional support is a major cause of past failures in the promotion of technologies and practices.
The U.S. EPA has a number of efforts underway in the United States and around the world which are beginning to develop this information and spur project development. These efforts are summarized below.
Domes tic Efforts
In general, EPA's approach to reducing U.S. methane emissions involves a close working relationship with the relevant industries, with the aim of identifying and encouraging implementation of economically attractive ways to capture and use methane as an energy source. These public-private initiatives typically involve establishment of a working group that includes government, industry, and other representatives and, in consultation with the working group, development of a voluntary program. Companies that participate in these voluntary programs sign a memorandum of understanding with EPA, in which they agree to identify and implement profitable methane control strategies. Examples include the AgSTAR program, under which livestock producers agree to capture and utilize the methane generated from livestock manure wherever profitable and a planned outreach program to educate landfill owners and operators about the economic and environmental benefits of using their landfill gas to produce energy.
In total, these domestic efforts, including non-biomass source programs such as the Natural Gas Program are expected to reduce methane emissions by 7 to 10 Tg per year by 2000.
International Efforts
The U.S. EPA is involved in methane reduction programs in several countries. These programs typically involve the following steps, which are carried out in close cooperation with technical and policy experts in the different countries: 1) scoping assessments; 2) prefeasibility analyses; 3) demonstration projects; and 4) development of institutional support. The Ruminant Livestock Program is an example of this approach currently active in India, China, Bangladesh, Tanzania, and Brazil and is designed to overcome the many barriers--including institutional, financial, information, and technical. Additionally, EPA has begun to identify landfill methane reduction opportunities in several countries, including China, India, and Poland, and Ruminant Livestock Programs are planned for Eastern Europe.
In total, these international efforts, including non-biomass source programs are expected to reduce a
methane emissions by 12 to 35 Tg in the near term and potentially 30 to 90 Tg in the longer term.
Conclusion
Methane is a major greenhouse gas, second only to carbon dioxide in its contribution to potential global warming. The concentration of methane in the atmosphere is rising at about 0.6 percent per year, 50 percent faster than CO,. In order to stabilize methane concentrations at current levels, anthropogenic methane emissions would have to be reduced by about 10 to 15 percent. Stabilization of methane concentrations would have roughly the same effect on reducing the expected potential warming of the earth over the next fifty years as maintaining CO, emissions at 1990 levels. Because methane lasts only about 10 years in the atmosphere, reductions in methane emissions will produce substantial benefits in the short run. Moreover, there are many cost-effective opportunities to reduce methane emissions from anthropogenic sources.
Feasible, cost-effective, and often profitable options for reducing methane emissions from the following biomass sources, which represent about 35 percent of anthropogenic emissions, have been identified: landfills, livestock manures, and ruminant livestock. In the United States, the U.S. EPA has several programs in place aimed at reducing methane emissions from these sources. These efforts are designed to overcome the barriers that hinder more widespread use of reduction and utilization technologies and typically involve public-private partnerships that take advantage of the fact that reductions can often be achieved at a profit. EPA is also involved in methane reduction programs internationally, including programs in China, India, Eastern European countries, and countries of the former Soviet Union. Through these domestic and international efforts, EPA is contributing significantly to stabilization of global methane emissions.
Notes
a. This paper is a revision of a previously published paper which identifies options for all anthropogenic sources; merview of ODtions for Cost-Effectivelv Reducing Methane Emissions into the Atmos~here, K.B. Hogan, Chief, Methane Programs, Office of Air and Radiation, Global Change Division, U.S. EPA, presented at Air & Waste Management Association 8 8 Annual Meeting & Exhibition, Denver, CO, June 13-18, paper #93-WP-104.02
b. The authors are program managers for EPA's AgSTAR, Landfill, and Ruminant Livestock Programs respectively and can be contacted at U.S. Environmental Protection Agency, 401 M St, SW, 6202J, Washington, DC 20460.
c. Several documents developed by the U.S. EPA and referenced in this paper demonstrate the cost- effectiveness of these options.
d. Methane is reported with a direct Global Warming Potential (GWP) of 35 over a 20 year time frame, 11 over 100 years, and 4 over 500 years, and with indirect effects that could be comparable in magnitude to its direct effect (IPCC 19926). The issue of GWP will be further addressed in the next IPCC science assessment. The GWP reflects the effect that releasing a kilogram of methane would have over a specified time horizon, relative to releasing a kilogram of carbon dioxide.
e. Options are also developed for other non-biomass methane sources including coal mining, oil, and natural gas systems.
f. Some of the reduction technologies, such as generation of power from landfill methane, are themselves sources of greenhouse gas emissions. However, emissions from these sources consist primarily of relatively small quantities of C 4 and can be considered negligible.
References
1. IPCC, Climate Change: The IPCC Scientific Assessment, Report Prepared for Intergovernmental Panel on Climate Change by Working Group 1, 1990.
2. L.P. Steele, E.J. Dlugokencky, P.M. Lang, et al., "Slowing Down of the Global Accumulation of Atmospheric Methane During the 1980's," Nature, No. 358: 313-316, (July 23, 1992).
3. Oak Ridge National LibraryIThe Carbon Dioxide Information Analysis Center, Trends '91, Atmospheric and Climate Research Division, U.S. Department of Energy, Oak Ridge, TN, 1992.
4. G.L. Vaghjiani and A.R. Ravishankara 1991, "New Measurement of the Rate Coefficient for the Reaction of OH with Methane," Nature, No. 350: 406-409 (April 4, 1991).
5. K.B. Hogan, J.S. Hoffman, and A.M. Thompson, "Methane on the Greenhouse Agenda," Naturg, No. 354: 181-182 (1992).
6 . IPCC, Climate Chanpe 1992: The Su~~lementarv Re~ort to the IPCC Scientific Assessment, Report prepared for Intergovernmental Panel on Climate Change by Working Group 1, 1992.
7. P.J. Crutzen, "Methane's Sinks and Sources," Nature, No. 350, (April 1991).
8. U.S. EPA, ODtions for Reducing Methane Emissions Internationallv. Volume I -- Technological Options for Reducing Methane Emissions, Report to Congress (Draft), Office of Air and Radiation, Washington, D.C., December, 1992.
9. WMO, Scientific Assessment of Stratos~heric Ozone: 1989, Report No. 20, World Meteorological Organization Global Ozone Research , and Monitoring Project, Geneva, Switzerland, 1990.
10. A.M. Thompson, R.W. Stewart, M.A. Owens, et al., Atmospheric Environment, 23: 519-532 (1989).
11. U.S. EPA, Global Anthropoeenic Methane Emissions, Report to Congress (Draft), Office of Planning, Policy, and Evaluation, Washington, D.C., 1993.
12. U.S. EPA, Methane Emissions and OP~ortunities for Control: Worksho~ Results of Intergovernmental Panel on Climate Change, EPAl40019-901007, Office of Air and Radiation, Washington, D.C., 1990.
13. R.A. Leng, Im~rovine Ruminant Production and Reducing Methane Emissions from Ruminants bv Strategic Su~~lementation, U.S. Environmental Protection Agency, Washington D.C., June, 1991.
14. M. Saadullah, Importance of Urea Molasses Block Lick and Bv~ass Protein on Animal Production Bangladesh), International Atomic Energy Agency, International Symposium on
Nuclear and Related Techniques in Animal Production and Health, Vienna, Austria, 15 - 19 April, 1991.
15. L.M. Safley, Jr., M.E. Casada, J.W. Woodbury, et al., Global Methane Emissions from Livestock and Poultrv Manure, U . S . Environmental Protection Agency, Washington, D. C . , 1992.
16. K.F. Roos, Profitable Alternatives for Rwlatory Impacts on Livestock Waste Management, in Proceedings of American Society of Agricultural Engineers 1991 National Livestock, Poultry, and Aquaculture Waste Management Meeting.
17. U.S. EPA, Ootions for Reducing Methane Emissions in the United States, Report to Congress @raft), Office of Air and Radiation, Washington, D.C., 1993.
REDUCING THE RATE OF CARBON DIOXIDE BUILDUP WITH BIOMASS FUEL UNDER CLIMATE CHANGE
R. Peart, R. Curry, J. Jones, Agr. Engineering Dept., K. Boote, Agronomy Dept. and L. Allen, USDA-ARS, Agronomy Dept.,
Univesity of Florjda Gainesville, FL 32611
Abstract
We have been working for several years on estimating, through crop simulation and crop growth chamber experiments, the changes in yield and in irrigation demand which would be brought about by a doubling of atmospheric greenhouse gases, given the results of three General Circulation Models (GCM) that simulate the climate change that would be expected. We are now beginning to study the impact this might have in relation to biomass fuels.
An important question is the effect of the changed climate on crop production, would the increased carbon dioxide concentration outweigh the negative climate change effects on crop yields? Results are quite variable due to different climate change effects at different locations and the differences in historical weather and in soils in different locations. However, on balance, climate change would result in reduced yields of the crops we studied, soybean, maize and peanut. However, U.S. production of these crops could be maintained or increased by the use of irrigation on more acres. Irrigated crops, in general, would have increased yields under climate change because of the increased photosynthetic efficiency with higher carbon dioxide levels.
Results on net remediation of carbon dioxide buildup by the use of biomass fuel rather than fossil fuel are not completed, but previous work has shown that Midwest non-irrigated maize production provides much more equivalent biomass energy than is required for its production. Our studies with soybean show a ratio of equivalent energy output in the seed to energy used in producing the crop ranging from 4 to almost 9 under climate change.
Introduction
The build-up of carbon dioxide in the earth's atmosphere is very real, well-documented, proven, and even predictable. In their widely-read book, Limits To Growth, Meadows et al. (1972) showed a plot of atmospheric CO, concentration based on data from 1958-70 and then extrapolated to 2000. This 21-year-old curve shows the 1993 value to be about 360 ppm, close to the current value of around 350 ppm. The momentum of the world's steadily growing demand for fossil energy is massive.
To have a measurable effect on this rate of buildup of CO,, we must employ as many different strategies as are practical, because probably no one method alone will suffice. So we must think in terms of increasing the globd photosynthetic rates, reducing the consumption of fossil fuels, substituting biomass fuel and solar energy for fossil fuels, improving combustion efficiencies, improving our nuclear power technologies, including storage of wastes and calming unfounded fears, all concurrently.
Climate change due to the greenhouse effect is much less easily predicted than the carbon dioxide buildup, but current General Circulation Models (GCMs) give indications of a general temperature increase and of a shifting of precipitation amounts that would be detrimental to crop production in many parts of the U.S. Would this effect cripple efforts to produce biomass fuel with current excess crop production capacity in the U.S.?
We have been working for several years on estimating, through crop simulation (Curry, et al, 1992) and crop growth chamber experiments (Allen, et al, 1983), the changes in yield, yield variability and in irrigation demand which would be brought about by a doubling of atmospheric greenhouse gases, given the results of three General Circulation Models (GCM) that simulate climate change under these conditions. Here we report briefly on these results and show preliminary findings about how these changed cropping results might quantitatively affect the growing of biomass fuel in addition to necessary food production.
Effect of Carbon Dioxide on Photosynthesis
Photosynthesis, powered by solar radiation, combines CO, and H, 0 to produce carbohydrates in the plant, and the concentration of carbon dioxide has a direct effect on the rate of photosynthesis. Major agronomic crops have one of two different chemical pathways that are followed in this process, called C3 and C4. Maize, or corn, is the major C4 crop, and in general, a doubling of do, concentration results in an increase in photosynthesis of about 10%. C3 crops, such as soybean, wheat and peanut, are influenced more strongly by carbon dioxide concentration, and a doubling increases photosynthesis by about 30%, on average over the range of solar radiation from sunup to sundown (Allen, 1990, and Baker, et al., 1989). 6
A major ongoing experiment by the USDA Agricultural Research Service using open-air injection of CO, for more realistic testing of high CO, effects, has shown similar results (Allen and Beladi, 1990)
Climate Change and Carbon Dioxide Effects on Crops in the U.S.
While increased CO, concentration generally improves photosynthesis, the predicted climate change effects, higher temperatures and shifts in rainfall patterns, are deterimental to yields in most locations. To study \
these effects in detail, we used crop simulation models that respond accurately to environmental variables. Thus, while these models do not account for diseases and insect problems, the are excellent tools for making comparisons of crop performance under different environmental conditions. The crop models included SOYGRO, (Jones, et al., 1988), CERES Maize (Jones and Kiniry, 19861, and PNUTGRO (Boote, et al., 1989)
for peanut. The system used to manage the crop model and the weather data was DSSAT, a decision support system developed to assist in agricultural decision making (Jones, et al., 1990, and IBSNAT, 1989).
The climate change parameters used in developing the doubled CO, scenarios came from General Circulation Models (GCM) developed to study world weather dynamics. The parameters applied to 40 years of weather data at each location included a daily adjustment for temperature and solar radiation, and a monthly adjustment on the precipitation events. The GCMs used in this study were the GISS model from the Goddard Institute of Space Science at Columbia University (Hansen, et al., 1988), the GFDL model of the Geophysical Fluid Dynamics Lab at Stanford (Manabe and Wetherald, 1987), and the UKMO model from the United Kingdom Meteorological Office (Wilson and Mitchell, 1987).
Here we present results of soybean simulations at two typical locations, Des Moines, IA, and Indianapolis, IN, in the Midwest, and two in the Southeast, Charlotte, NC, and Memphis, TN. These results in Figures 1-5 are with soybean averaged over 40 years of historical weather data for each location. The simulations were done for each weather year, day-by-day, and results were averaged. This gives a much more realistic result than running one simulation of an "average" weather year. Then for each of the 3 "doubled" CO, climate change scenarios, these weather data were adjusted by the appropriate parameters and the simulations run again. The actual CO, concentration used was 550 ppm rather than double the 330 ppm, since the effect of doubling CO, is estimated to occur at the 550 ppm level because of the added effects of other greenhouse gases, mainly methane, which are also increasing. Runs were made for non-irrigated (rainfed) and irrigated management. Irrigation was applied by the model when the low soil moisture produced moisture stress in the crop and enough water was added to bring the top 30 cm of soil up to its field capacity. Improved irrigation management for humid areas such as these could probably improve the efficiency of this irrigation strategy.
Figure 1 shows non-irrigated yields averaged over the 40 years, 1951-90, and the negative effect of climate change is much more pronounced in the Southeast, cutting yields in half in Memphis, where climate change generally had the greatest negative effect of all the 27 southeastern locations in our studies. Among the 3 climate change scenarios, results varied a great deal, and we averaged those results. Figure 2 shows irrigated yields for the same locations and weather. The reduced differences show that much of the climate change effect is caused by the rainfall during the growing season. Total annual rainfall was not reduced in these climate change predictions, but the monthly amounts were reduced during some months of the growing season. The CO, increase caused some yield increases, but the higher temperature outweighed that influence in Memphis.
Climate Change Effects on Irrigation Water Demand
Figure 3 is very significant and shows the greatly increased water required for irrigation in both regions. For the Southeast, with the greatly reduced rainfed yields shown in Figure 1, growers will have a strong incentive to turn to irrigation, but it will require more water, and more pumping energy, than under current climate conditions. Figure 4 shows the differences between irrigated yields and rainfed yields under the same conditions otherwise. Both seed yield and total biomass yield are shown. The left-hand bars represents current practice, and these show why irrigation is generally utilized more in the Southeast. The second bar from the left shows the margins expected under climate change, and these increase to more than 2 t/ha in the southeastern locations and almost 2 t/ha in Indianapolis. Two metric tones is about 30 bushels of soybeans, and at a current price of $6 per bushel, this would provide a strong incentive to irrigate.
More bad news for the Southeast is forecast in Figure 5, which shows a count of the number of years, in the 40 years of runs, when yields would be below 0.67 t/ha, about 10 bu/acre. This yield would return a gross of $60 per acre at $6 per bushel. This figure was chosen as being typical of annual land costs, and the grower would lose all the other input costs with yields below this figure, so these events could be called "crop failures". These much more frequent crop failures in the Southeast would further encourage farmers to install irrigation.
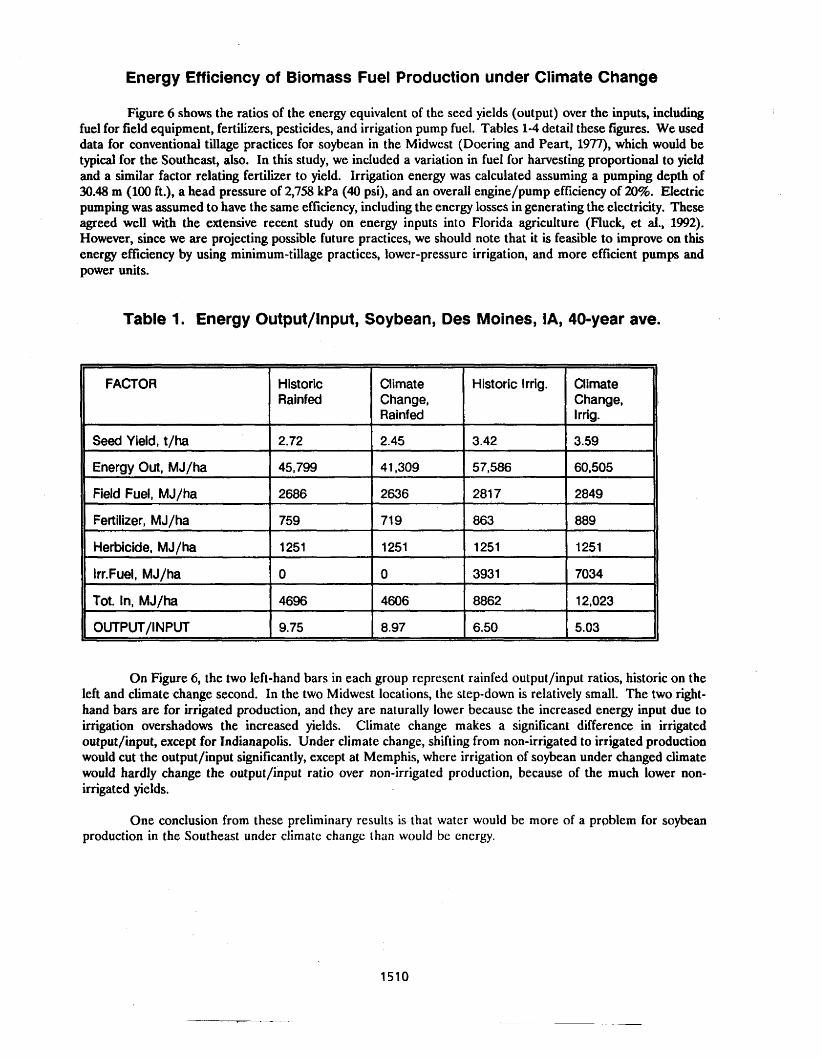
Energy Efficiency of Biomass Fuel Production under Climate Change
Figure 6 shows the ratios of the energy equivalent of the seed yields (output) over the inputs, including fuel for field equipment, fertilizers, pesticides, and irrigation pump fuel. Tables 1-4 detail these figures. We used data for conventional tillage practices for soybean in the Midwest (Doering and Peart, 1977), which would be typical for the Southeast, also. In this study, we included a variation in fuel for harvesting proportional to yield and a similar factor relating fertilizer to yield. Irrigation energy was calculated assuming a pumping depth of 30.48 m (100 ft.), a head pressure of 2,758 kPa (40 psi), and an overall engine/pump efficiency of 20%. Electric pumping was assumed to have the same efficiency, including the energy losses in generating the electricity. These agreed well with the extensive recent study on energy inputs into Florida agriculture (muck, et al., 1992). However, since we are projecting possible future practices, we should note that it is feasible to improve on this energy efficiency by using minimum-tillage practices, lower-pressure irrigation, and more efficient pumps and power units.
Table 1. Energy Output/lnput, Soybean, Des Moines, IA, 40-year ave.
On Figure 6, the two left-hand bars in each group represent rainfed output/input ratios, historic on the left and climate change second. In the two Midwest locations, the step-down is relatively small. The two right- hand bars are for irrigated production, and they are naturally lower because the increased energy input due to irrigation overshadows the increased yields. Climate change makes a significant difference in irrigated output/input, except for Indianapolis. Under climate change, shifting from non-irrigated to irrigated production would cut the output/input significantly, except at Memphis, where irrigation of soybean under changed climate would hardly change the outputlinpu t ratio over non-irrigated production, because of the much lower non- irrigated yields.
FACTOR Historic Climate Historic Irrig. Climate Rainfed Change, Change,
Field Fuel, MJ/ha 2686 2636 281 7 2849
Fertilizer, MJ/ha 759 719 863 889
One conclusion from these preliminary results is that water would be more of a problem for soybean production in the Southeast under climate change than would be energy.
Herbicide, MJ/ha
Irr.Fuel, MJ/ha
Tot. In, MJ/ha
OUTPUT/INPUT
1251
0
4696
9.75
1251
0
4606
8.97
1251
3931
8862
6.50
1251
7034
12,023
5.03 A
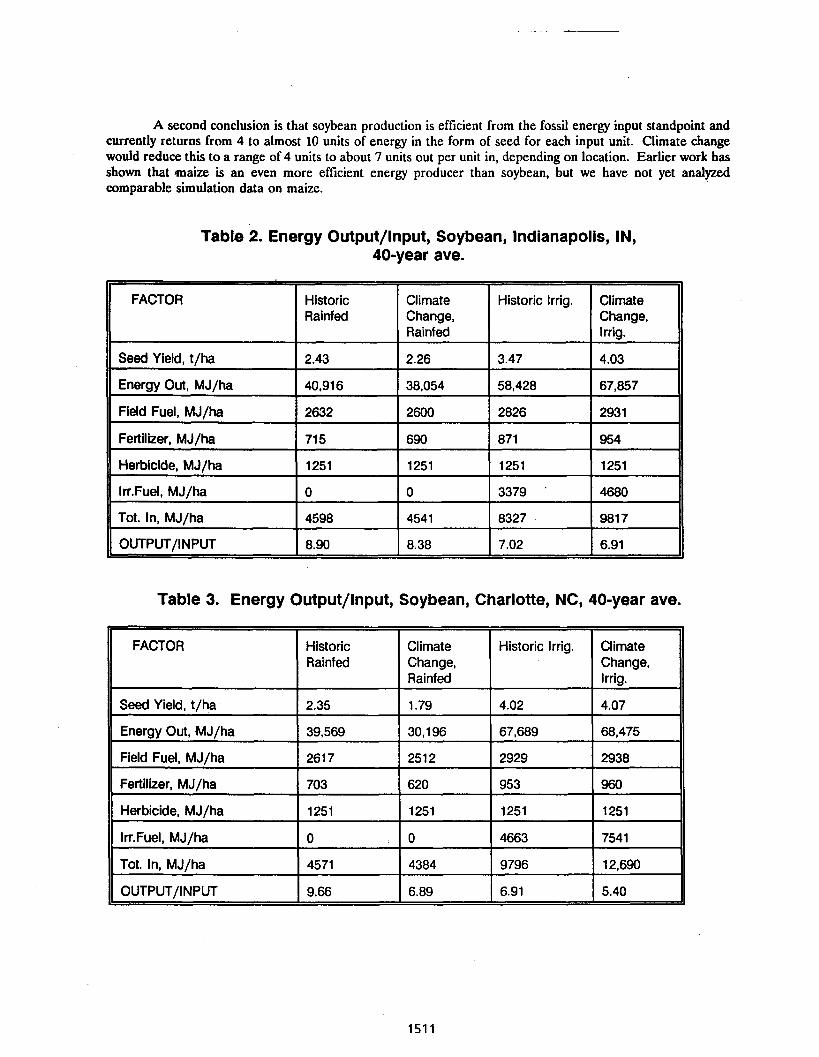
A second conclusion is that soybean production is efficient from the fossil energy input standpoint and currently returns from 4 to almost 10 units of energy in the form of seed for each input unit. Climate change would reduce this to a range of 4 units to about 7 units out per unit in, depending on location. Earlier work has shown that maize is an even more efficient energy producer than soybean, but we have not yet analyzed comparable simulation data on maize.
Table 2. Energy Output/lnput, Soybean, Indianapolis, IN, 40-year ave.
Table 3. Energy Output/lnput, Soybean, Charlotte, NC, 40-year ave.
FACTOR
Seed Yield, t/ha
Energy Out, MJ/ha
Field Fuel, MJ/ha
Fertilizer, MJ/ha
Herbicide, MJ/ha
Irr.Fuel, MJ/ha
Tot. In. MJ/ha
OUTPUT/INPUT
Historic Rainfed
2.43
40,916
2632
71 5
1251
0
4598
8.90
FACTOR
Seed Yield, t/ha
Energy Out, -MJ/ha
Field Fuel, MJ/ha
Fertilizer, M J/ha
Herbicide, MJ/ha
Irr.Fuel, MJ/ha
Tot. In, MJ/ha
OUTPUT/INPUT
Climate Change, Rainfed
2.26
38,054
2600
690
1251
0
4541
8.38
Climate Change, Rainfed
1.79
30,196
251 2
620
1251
0
4384
6.89
Historic Rainfed
2.35
39,569
261 7
703
1251
0
4571
9.66
Historic Irrig.
3.47
58,428
2826
871
1251
3379 .
8327
7.02
Historic Irrig.
4.02
67,689
2929
953
1251
4663
9796
6.91
Climate Change, Irrig.
4.03
67,857
293 1
954
1251
4680
981 7
6.91
Climate Change, Irrig.
4.07
68,475
2938
960
1251
754 1
12,690
5.40
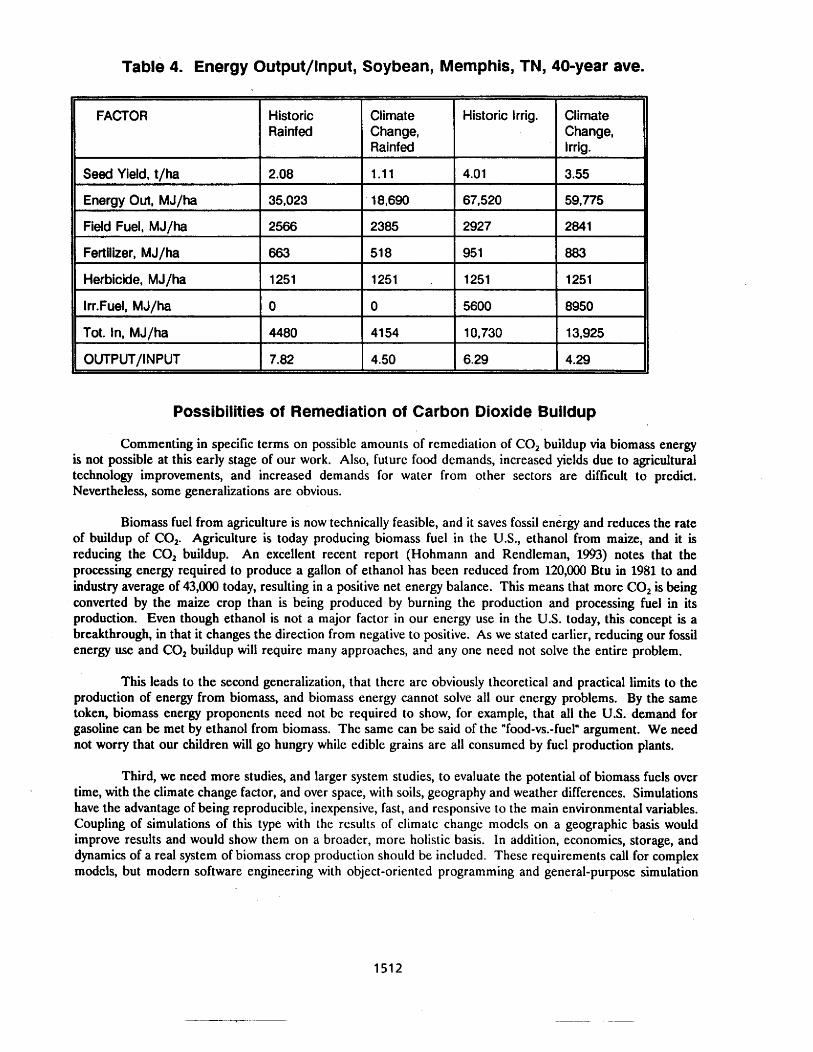
Table 4. Energy Output/lnput, Soybean, Memphis, TN, 40-year ave.
Possibilities of Remediation of Carbon Dioxide Buildup
Commenting in specific terms on possible amounts of remediation of CO, buildup via biomass energy is not possible at this early stage of our work. Also, future food demands, increased yields due to agricultural technology improvements, and increased demands for water from other sectors are difficult to predict. Nevertheless, some generalizations are obvious.
FACTOR
Seed Yield, t/ha
Biomass fuel from agriculture is now technically feasible, and it saves fossil energy and reduces the rate of buildup of CO,. Agriculture is today producing biomass fuel in the U.S., ethanol from maize, and it is reducing the CO, buildup. An excellent recent report (Hohrnann and Rendleman, 1993) notes that the processing energy required to produce a gallon of ethanol has been reduced from 120,000 Btu in 1981 to and industry average of 43,000 today, resulting in a positive net energy balance. This means that more C02 is being converted by the maize crop than is being produced by burning the production and processing fuel in its production. Even though ethanol is not a major factor in our energy use in the U.S. today, this concept is a breakthrough, in that it changes the direction from negative to positive. As we stated earlier, reducing our fossil energy use and CO, buildup will require many approaches, and any one need not solve the entire problem.
Historic Irrig.
4.01
This leads to the second generalization, that there are obviously theoretical and practical limits to the production of energy from biomass, and biomass energy cannot solve all our energy problems. By the same token, biomass energy proponents need not be required to show, for example, that all the U.S. demand for gasoline can be met by ethanol from biomass. The same can be said of the "food-vs.-fuel" argument. We need not worry that our children will go hungry while edible grains are all consumed by fuel production plants.
Climate Change, Irrig.
3.55
Historic Rainfed
2.08
t
Third, we need more studies, and larger system studies, to evaluate the potential of biomass fuels over time, with the climate change factor, and over space, with soils, geography and weather differences. Simulations have the advantage of being reproducible, inexpensive, fast, and rcsponsive to the main environmental variables. Coupling of simulations of this type with the results of climate change models on a geographic basis would improve results and would show them on a broadcr, morc'holistic basis. In addition, economics, storage, and dynamics of a real system of biomass crop production should be included. These requirements call for complex models, but modern software engineering with object-oriented programming and general-purpose simulation
Climate Change, Rainfed
1.11
Energy Out, MJ/ha
Field Fuel, MJ/ha
Fenilizer, MJ/ha
Herbicide, MJ/ha
Irr.Fuel, MJ/ha
Tot. In, MJ/ha
OUTPUT/INPUT
35,023
2566
663
1251
0
4480
7.82
18,690
2385
51 8
1251 .
67,520
2927
951
1251
59,775
2841
883
1251
8950
13,925
4.29
0
41 54
4.50
5600
10,730
6.29
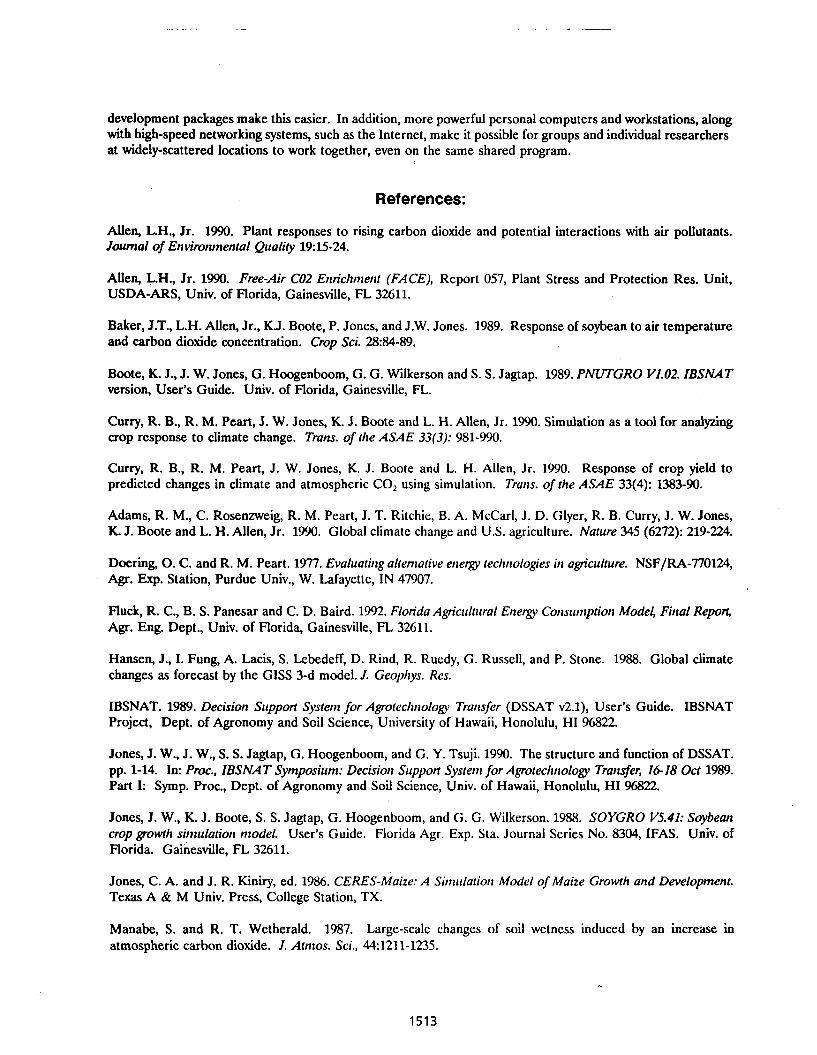
development packages make this easier. In addition, more powerful personal computers and workstations, along with high-speed networking systems, such as the Internet, make it possible for groups and individual researchers at widely-scattered locations to work together, even on the same shared program.
References:
Allen, L.H., Jr. 1990. Plant responses to rising carbon dioxide and potential interactions with air pollutants. Journal of Environmental Quality 19:15-24.
Allen, L.H., Jr. 1990. Free-Air C02 E~triclrment (FACE), Report 057, Plant Stress and Protection Res. Unit, USDA-ARS, Univ. of Florida, Gainesville, FL 32611.
Baker, J.T., L.H. Allen, Jr., K J . Boote, P. Jones, and J.W. Jones. 1989. Response of soybean to air temperature and carbon dioxide concentration. Crop Sci. 28234-89.
Boote, K. J., J. W. Jones, G. Hoogenboom, G. G. Wilkerson and S. S. Jagtap. 1989. PNUTGRO V1.02. IBSNAT version, User's Guide. Univ. of Florida, Gainesville, FL.
Curry, R. B., R. M. Peart, J. W. Jones, K. J. Boote and L. H. Allen, Jr. 1990. Simulation as a tool for analyzing crop response to climate change. Trans. of the ASAE 33(3): 981-990.
Curry, R. B., R. M. Peart, J. W. Jones, K. J. Boote and L. H. Allen, Jr. 1990. Response of crop yield to predicted changes in climate and atmospheric CO, using simulation. Truns. of the ASAE 33(4): 1383-90.
Adams, R. M., C. Rosenzweig, R. M. Peart, J. T. Ritchie, B. A. McCarl, J. D. Glyer, R. B. Curry, J. W. Jones, K. J. Boote and L. H. Allen, Jr. 1990. Global climate change and U.S. agriculture. Nahtre 345 (6272): 219-224.
Doering, 0. C. and R. M. Peart. 1977. Evalrtatir1g allenlative ertergy technologies irt agngncltlhire. NSF/RA-770124, Agr. Exp. Station, Purdue Univ., W. Lafayette, IN 47907.
Fluck, R. C., B. S. Panesar and C. D. Baird. 1992. Florida Agriclrltltral E~lergy Cortsunrptiot~ Model, Final Report, Agr. Eng. Dept., Univ. of Florida, Gainesville, FL 32611.
Hansen, J., I. Fung, A. Lacis, S. Lebedeff, D. Rind, R. Ruedy, G. Russell, and P. Stone. 1988. Global climate changes as forecast by the GISS 3-d model. J. Geopllys. Res.
IBSNAT. 1989. Decisior~ Support System for Agrotecltrlology Transfer (DSSAT v2.1), User's Guide. IBSNAT Project, Dept. of Agronomy and Soil Science, University of Hawaii, Honolulu, HI 96822.
Jones, J. W., J. W., S. S. Jagtap, G. Hoogenboom, and G. Y. Tsuji. 1990. The structure and function of DSSAT. pp. 1-14. In: Proc., IBSNAT Symposiltnt: Decisiort Slipyorf Systertl for Agrolecl~nology Tra~lsfer, 1&18 Oct 1989. Part I: Syrnp. Proc., Dept. of Agronomy and Soil Science, Univ. of Hawaii, Honolulu, HI %822.
Jones, J. W., K. J. Boote, S. S. Jagtap, G. Hoogenboom, and G. G. Wilkerson. 1988. SOYGRO V5.41: Soybean crop growth simulatio~r model. User's Guide. Florida Agr. Exp. Sta. Journal Series No. 8304, IFAS. Univ. of Florida. ~ainesville, FL 32611.
Jones, C. A. and J. R. Kiniry, ed. 1986. CERES-Maize: A Si~ttlilafiort Model of Maize Growth and Development. Texas A & M Univ. Press, College Station, TX.
Manabe, S. and R. T. Wetherald. 1987. Large-scale changes of soil wetness induced by an increase in atmospheric carbon dioxide. I. Atntos. Sci., 44:1211-1235.

Meadows, Donela H., D. L. Meadows, J. Randers and W. W. Behrens 111.1972. 77ze Lintits to Growth. Universe Books, New York, NY 10016.
Rosenzweig, C., R. B. Curry, T. Y. Chou, J. Ritchie, J. Jones, and R. Peart. 1993. Simulated Wheat, Corn, and Soybean Response to Predicted Climate Change in the US. In C. Rosenzweig and A. Iglesias (eds). Implications of Climate Change for Ititematio~tal Ag~culhrrc: Crop Modelillg Shr dy. US EPA. Washington, DC. (in press).
Wiison, CA. and J.F.B. Mitchell. 1987. A Doubled CO, Climate Sensitivity Experiment with a Global model including a Simple Ocean. J. Geop~zys. Res., 92:13315-13343.
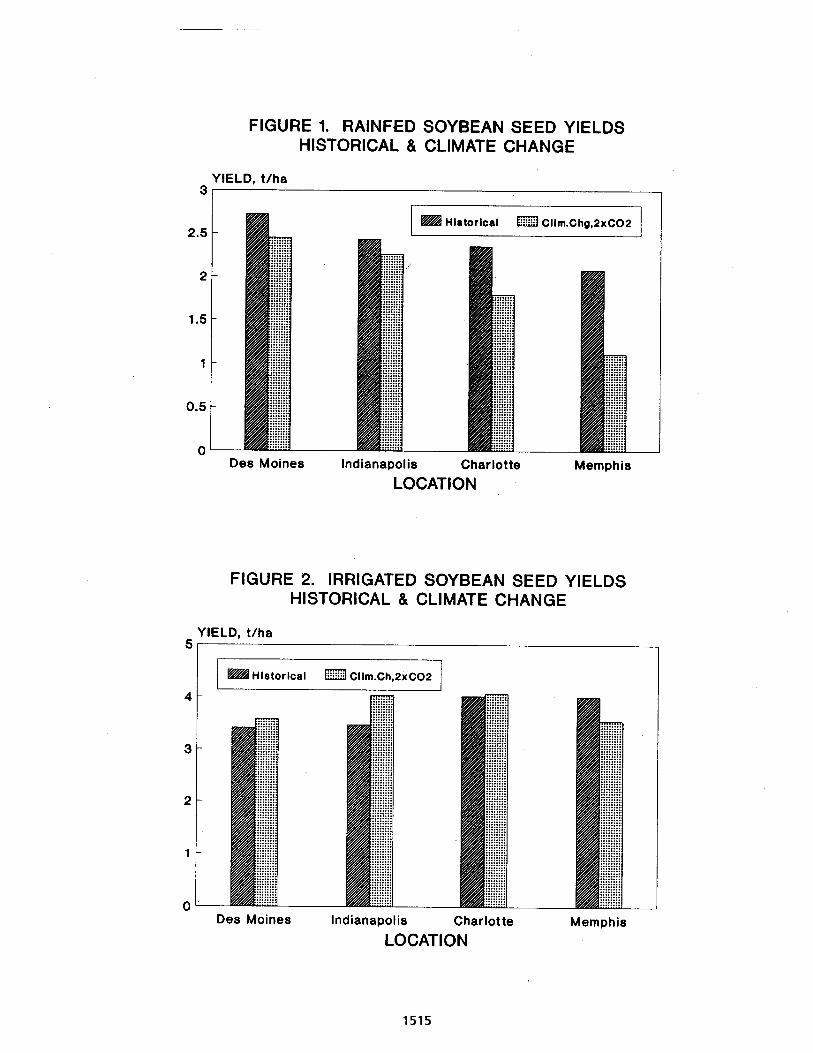
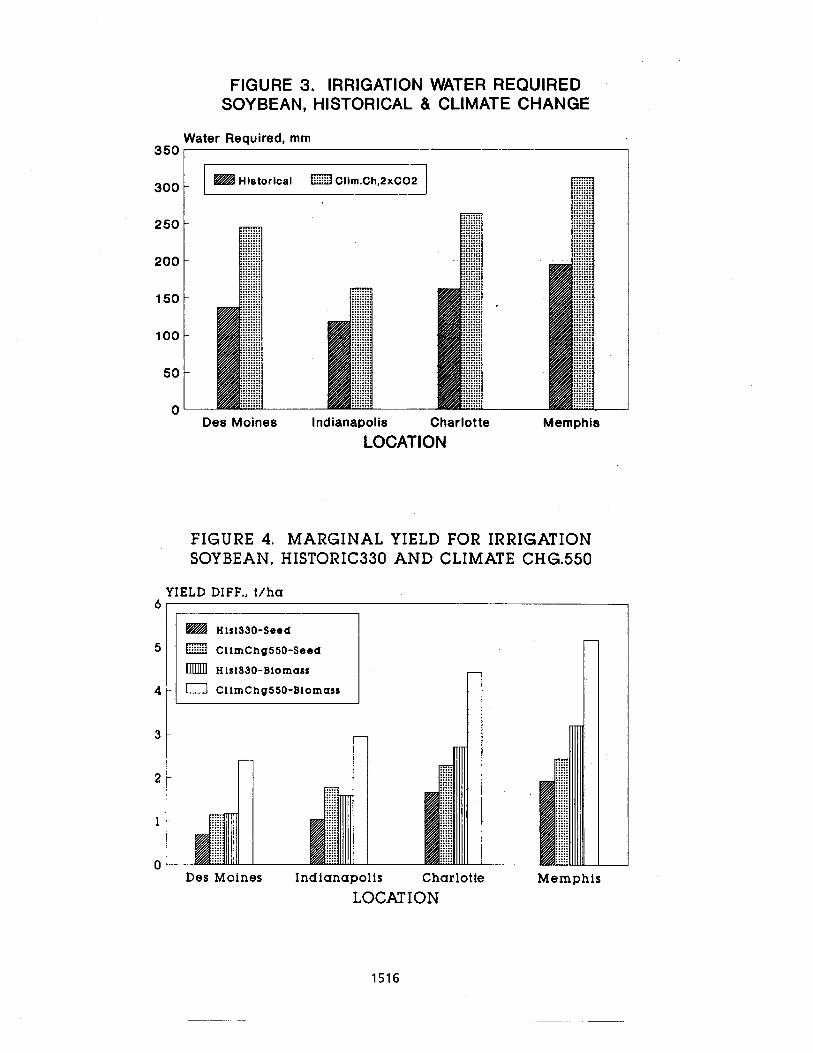
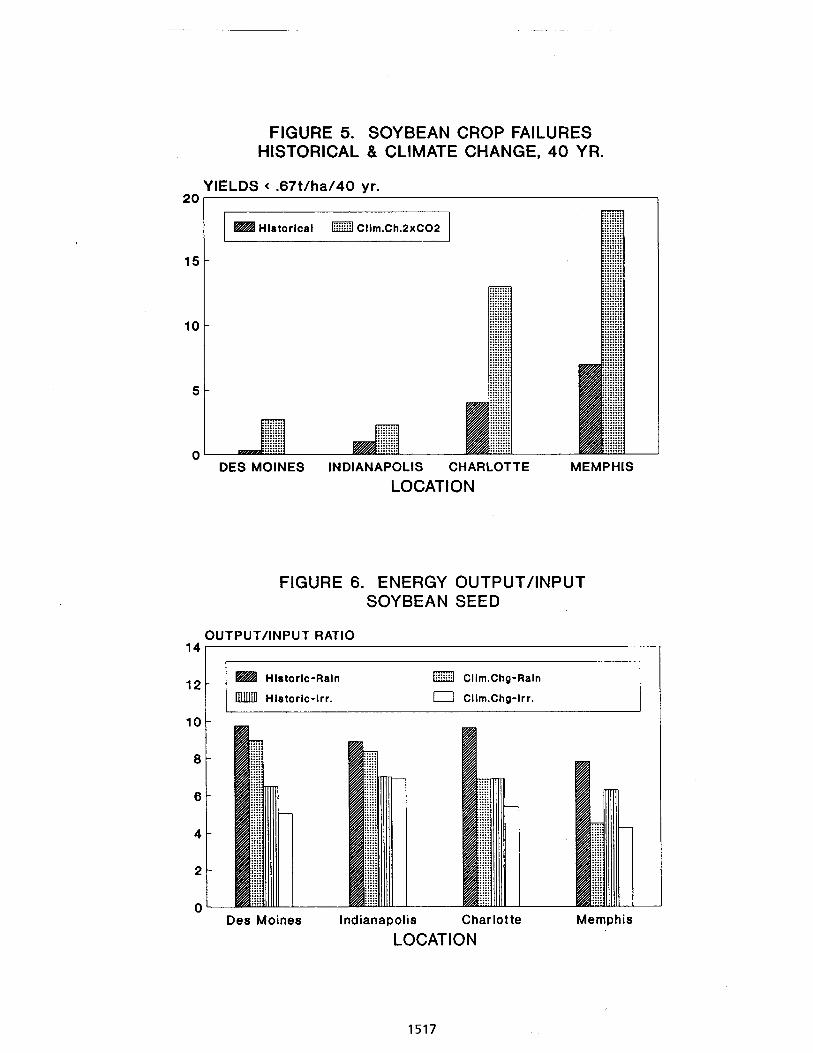
BOTTOM-UP COMPARISONS OF CO2 STORAGE AND COSTS IN FORESTRY AND BIOMASS ENERGY PROJECTS
Joel N. Swisher, Ph.D., P.E. UNEP Collaborating Center
Risa National Laboratory P.O. Box 49
*,
DK-4000 Roskilde, Denmark
Abstract
In order to include forestry and biomass energy projects in a possible CO2 emission reduction regime, and to compare the costs of individual projects or national programs, it is necessary to determine the rate of equivalency between carbon in fossil fuel emissions and carbon stored in different types of forestry, biomass and renewable energy projects. This paper presents a comprehensive and consistent methodology to account for the costs and carbon flows of different categories of forestry and biomass energy projects and describes the application of the methodology to several sets of projects in Latin America. The results suggest that both biomass energy development and forestry measures including reforestation and forest protection can contribute significantly to the reduction of global C@ emissions, and that local land-use capacity must determine the type of projectvthat is appropriate in specific cases. No single approach alone is sufficient as either a national or global strategy for sustainable land use or carbon emission reduction.
Introduction
In order to stabilize the atmospheric concentration of C02, global emissions must be reduced by at least 60 percent from current levels (IPCC 1990). Approximately 80 percent of total emissions come from fossil fuels, mostly from industrialized nations (WRI 1990). The U.S. and the (former) U.S.S.R. are the largest contributors, together emitting nearly half of the world's carbon from fossil fuels (Marland et al 1988). Much of the remaining 20 percent are believed to come from deforestation, mostly in tropical nations, with Brazil being the largest contributor of carbon emissions from deforestation (Houghton et al 1987). The developing nbtions are expected to emit an increasing share of future global carbon emissions and thus cannot be ignored in any strategy to reduce global carbon emissions.
Because the major sources of anthropogenic C02 emissions are fossil fuel use and tropical deforestation, the principal opportunities for emission reductions are implementing alternative energy technology and rwersing deforestation. The rate of deforestation in the early 1980's was estimated at 1 1 million hectares per year, contributing approximately 1600 million tons of carbon to the atmosphere each year (Lanly 1983, Houghton et a1 1987). Recent estimates of deforestation rates are even higher (Myers 1989, WRI 1990).
The Role of Forests and Biomass
The tropical land area that can potentially be spared from deforestation or rejuvenated through reforestation is large, on the order of hundreds of millions of hectares (Houghton 1990). This represents a major sink for global carbon emissions, and potentially one of the least expensive measures available for slowing the rate of C a accumulation. Because land and labor, the two principal inputs, are inexpensive in most tropical nations, and because biomass growth rates are high, this carbon-storage "technology" can achieve relatively low costs. Thus, reversing the trend of tropical deforestation, and promoting reforestation worldwide, is considered part of a global strategy to reduce the net atmospheric accumulation of C02. In late 1989, for example, the European Ministerial Conference on Atmospheric Pollution and Climate Change proposed an agreement to stabilize OECD carbon emissions by the year 2000 and to achieve a net global reforestation rate of 12 million hectares per year (Nordwyck Declaration 1989).
Several estimates have been made of the overall potential for carbon storage through reforestation and the land area that would be required to sequester various quantities of carbon (Marland 1988, Grainger 1990). The potential costs of this approach on a global basis have been estimated based on macroeconomic models and extrapolations from current forestry experience (Nordhaus 1991, Sedjo 1989). However, the technical and political feasibility of such global forestry schemes is questionable, as they do not consider the many conflicting economic and environmental uses of the land. An analysis of the forest sector that depends on the application of a few technical or economic parameters on a global basis is also questionable.
Meanwhile, some analysts have concluded that forest land could contribute more to global C02 stabilization through sustained production of fuel for biomass energy systems to replace fossil fuel use (Houghton 1990, Hall et a1 1991). Because land suitable for annual crops will be limited by competition with food crops, any ambitious development of biomass energy must depend on woody biomass from trees or other perennial plants, grown on land that cannot support annual crops. The extent to which biomass from energy plantations is a truly renewable energy source that does not add to atmospheric C02 accumulation depends on the sustainability of the plantations as a land-use. There are many examples of unsuccessful plantation efforts, handicapped by poor

soil conditions, inadequate technical extension, and other problems (Durst 1987). Such projects provide neither renewable energy nor C02 storage, and only add to the pressure for further deforestation.
A Bottom-Up Approach to Forestry and Land-Use
There has yet to be a consistent analysis of the magnitude and cost of carbon savings by a "bottom- up" approach, beginning at the project level, to sustainable forestry development. Rather than hypothesize about reforesting areas of continental dimensions, the approach here is to consider carbon storage in a context in which it might succeed: that of a local or national sustainable forest development strategy. Although proposals abound, no such strategy has been fully implemented to date, largely due to the difficulty in funding the needed non-commercial or unprofitable components. This approach is then applied to projects that have been studied in Costa Rica and other Latin American countries, and to a set of projects proposed in Costa Rica under the Tropical Forest Action Plan, to estimate a sample set of project-level and national-level C@ reduction cost estimates.
A bottom-up analysis must begin with the land-use capacity of the land. Land-use capacity is defined as "the biophysical capacity of the most intensive use that a unit of land can support without deterioration in productive capacity ... use at capacity or under-use can be recommended, but over-use starts degradation and loss of productive capacity that is manifested by indications of erosion, sedimentation of rivers and lakes, impacts on the hydrological cycle, etc." (Tosi et a1 1985, p. 43) The causes of deforestation in Latin America are numerous and complex, but the majority results h m agricultural conversion, mostly to pasture for livestock, of land that cannot support intensive use. Commercial logging is not a major direct cause of deforestation in Latin America, but logging roads can be .used by agricultural colonists to clear larger forest areas thari those used by 'logging operations. Reversing deforestation requires the identification and application of sustainable land-uses that fit the inherent land-use capacity.
The high rates of deforestation and land conversion in Central America are not consistent with this capacity. Both Costa Rica and Guatemala, for example, have already over-used a great deal of the land with forest capacity only. However, as shown in Table 1, much of the land with more intensive agricultural capacity is actually under-used as pasture. Agricultural reform may be needed to increase the land-use intensity on land suitable for annual crops. However, much of the land suitable to production forestry, such as biomass energy plantations, must be restored from pasture or lies in remote protected regions. The remaining land, which is suitable for protection or perennial crops, cannot sustainably support plantations.
Land that cannot support such intensive use can be devoted to a variety of other land-uses, including protection forestry in some cases, to reverse the deforestation process and provide long- term benefits in terms of the environment and the local social and economic situation. Rather than consider these lands as a source of renewable biomass fuel, the analysis treats their potential for long-term storage of C02 only in sustainable land-uses to which they are suited. In regard to carbon storage and long-term project survival, there are important trade-offs and sensitivities in regard to climate, soil, species selection, bio-diversity and the local environmental and social conditions. The total costs of carbon savings in forestry and biomass energy projects depend on the type of project, the climate and growth potential, capital needs, training and management costs, and the opportunity cost of land. While the focus on CO;? storage is somewhat artificial, it provides a global-level context in which to analyze these projects and a basis on which to compare their ecological and economic effects.
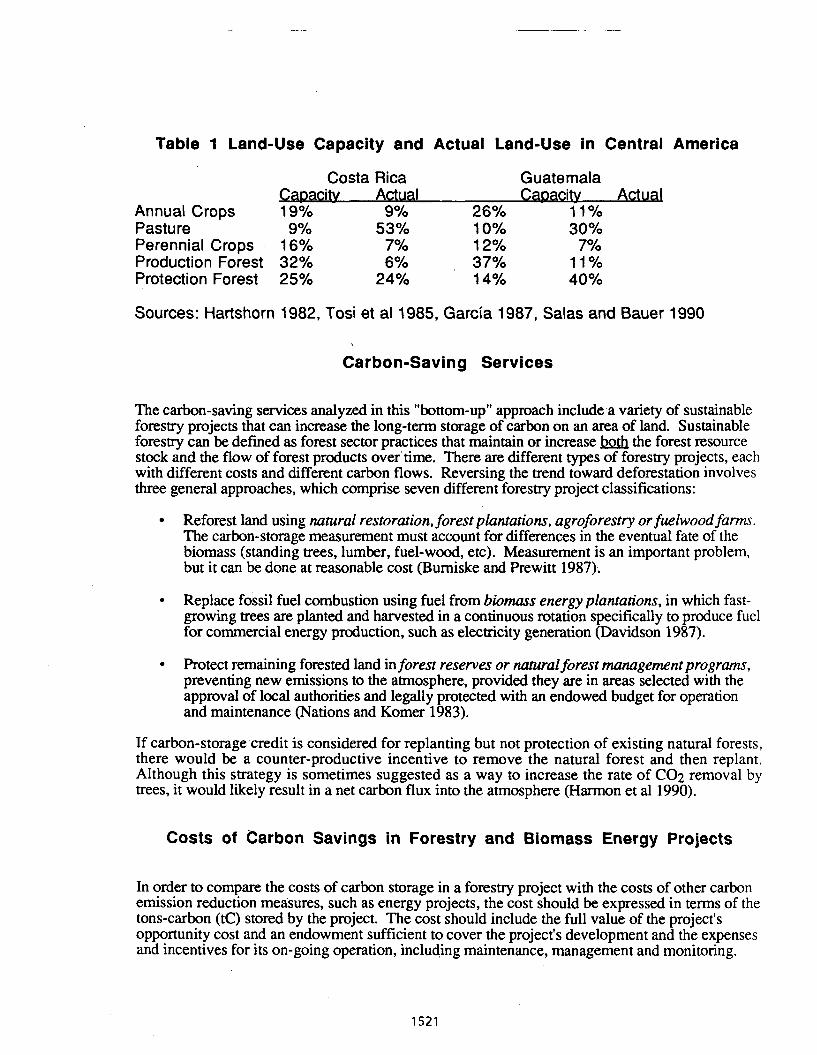
Table 1 Land-Use Capacity and Actual Land-Use in Central America
Costa Rica Guatemala Capacity Actual Capacity Actud
Annual Crops 1 9% 9% 26% 1 1 O/O
Pasture 9% 53% 10% 30% Perennial Crops 16% 7% 12% 7% Production Forest 32% 6% 37% 11% Protection Forest 25% 24% 14% 40%
Sources: Hartshorn 1982, Tosi et al 1985, Garcia 1987, Salas and Bauer 1990
Carbon-Saving Services
The carbon-saving services analyzed in this "bottom-up" approach include a variety of sustainable forestry projects that can increase the long-term storage of carbon on an area of land. Sustainable forestry can be defined as forest sector practices that maintain or increase the forest resource stock and the flow of forest products over'time. There are different types of forestry projects, each with different costs and different carbon flows. Reversing the trend toward deforestation involves three general approaches, which comprise seven different forestry project classifications:
Reforest land using natural restoration, forest plantations, agroforestry or fuelwood farms. The carbon-storage measurement must account for differences in the eventual fate of the biomass (standing trees, lumber, fuel-wood, etc). Measurement is an important problem, but it can be done at reasonable cost (Bumiske and Prewitt 1987).
Replace fossil fuel combustion using fuel from biomass energy plantations, in which fast- growing trees are planted and harvested in a continuous rotation specifically to produce fuel for commercial energy production, such as elecmcity generation (Davidson 1987).
Protect remaining forested land in forest reserves or natural forest management programs, preventing new emissions to the atmosphere, provided they are in areas selected with the approval of local authorities and legally protected with an endowed budget for operation and maintenance (Nations and Komer 1983).
If carbon-storage credit is considered for replanting but not protection of existing natural forests, there would be a counter-productive incentive to remove the natural forest and then replant. Although this strategy is sometimes suggested as a way to increase the rate of CO;! removal by trees, it would likely result in a net carbon flux into the atmosphere (Harmon et a1 1990).
Costs of Carbon Savings In Forestry and Biomass Energy Projects
In order to compare the costs of carbon storage in a forestry project with the costs of other carbon emission reduction measures, such as energy projects, the cost should be expressed in terms of the tons-carbon (tC) stored by the project. The cost should include the full value of the project's opportunity cost and an endowment sufficient to cover the project's development and the expenses and incentives for its on-going operation, including maintenance, management and monitoring.
Total unit cost = Cnet / Knet
where: Cnet = Net cost of the carbon-saving project ($/ha) Rtnet = Net decrease in carbon emissions horn the project (tC/ha)
The cost of the project, Cnet, must include the total amount of money that would be needed to establish, maintain, manage and monitor the project, rather than carrying out the land-use that the project replaces. Thus, Cnet must include the opportunity cost for the land on which the project is implemented. The opportunity cost is the difference between the value of the land without the project and its value with the project (excluding the value imparted by the project itself'). Additional costs for biomass energy conversion must also be included.
where: A = Land area of project Copp = Opportunity cost of the project Cest = Cost of establishing the project Cmgm = Cost of management and extension services Cmnt = Cost of an endowment to maintain the project Cmon = Cost of an endowment to monitor the project's performance Cnrg = Cost of biomass energy production in excess of present value of energy savings
In this analysis, cost values that are originally in foreign currencies are converted to US dollars using the interbank free exchange rate prevailing at the time for which the cost values are expressed. The dollar costs are then converted to 1989 dollars using the GDP deflator.
The relevant unit of measurement for carbon storage in forestry projects is the increment in COz flux, expressed as tons of carbon-equivalent (tC), out of the atmosphere, compared to existing conditions (in the case of carbon removal) or to a reference condition (in the case of prevention). The carbon-accounting procedure should explicitly account for the carbon storage of the land-use without the project, a difficult but necessary step in estimating the impact of both forest and energy projects. Emission savings for renewable energy projects must be compared on the basis of the carbon content of the fossil fuel replaced.
The procedure must account for the variation in growth rates among different biological resources, the timing of carbon storage over the forest life cycle, and the different fates of wood, leaf and soil carbon under different types of land-use (Hall et a1 1985). Thus the procedure should incorporate important parameters such as species, climate, soil type, planting density, and the land management type and rotation time (Lugo et a1 1988, Brown et al 1989). It should also account for the possibility that some part of the project either will not succeed, or would have been done anyway. In either case, the effective carbon stored would decrease, and the cost per ton would increase.
Each type bf project is different in terns of its carbon storage potential. Some store carbon in standing natural forest, some accumulate carbon in new biomass grown in the project, some accumulate carbon in harvested products that enter long-term storage, and biomass energy plantations prevent carbon emissions from fossil fuel use. For the purpose of this analysis, the dynamics of the carbon flows over time are not considered. Rather, only long-term (more than 20 years) average or steady-state carbon storage densities are analyzed.
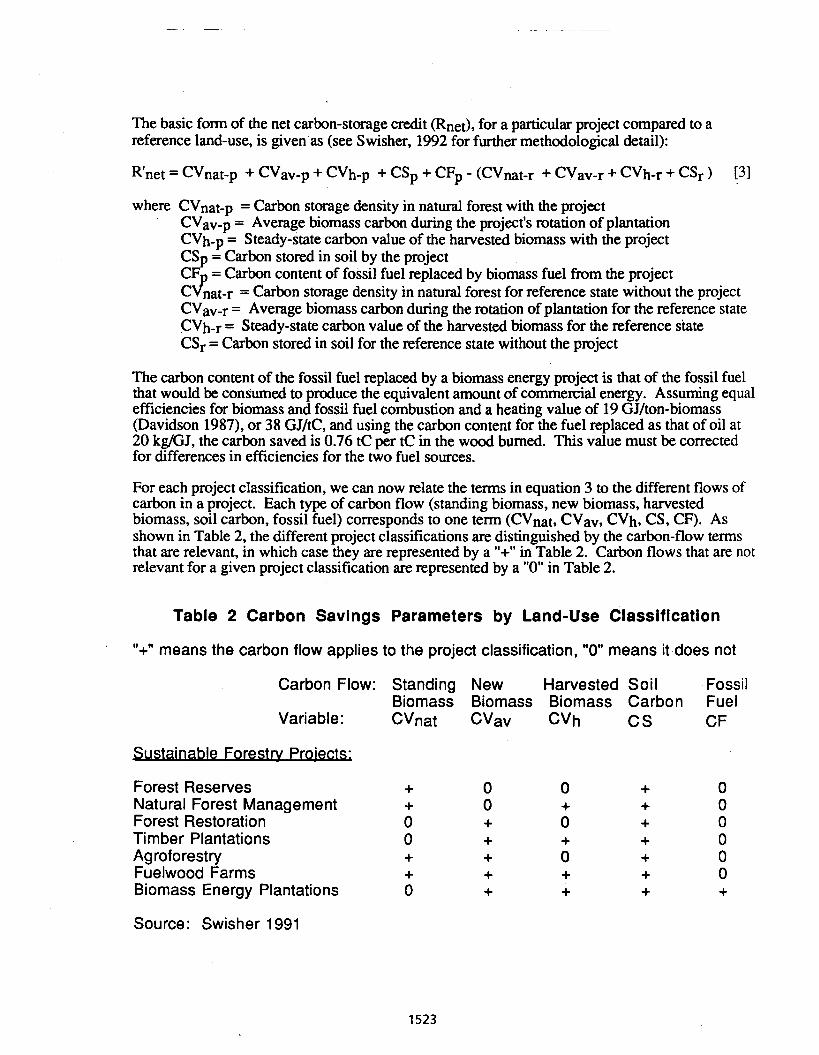
The basic form of the net carbon-storage credit (Rnet), for a particular project compared to a reference land-use, is given as (see Swisher, 1992 for further methodological detail):
where CVnat-p = Carbon storage density in natural forest with the project CVav-p = Average biomass carbon during the project's rotation of plantation CVh-p = Steady-state carbon value of the harvested biomass with the project CS = Carbon stored in soil by the project CF' = Carbon content of fossil fuel replaced by biomass fuel from the project c\P,at-r = Carbon storage density in natural forest for reference state without the project CVav-r = Average biomass carbon during the rotation of plantation for the reference state CVhq = Steady-state carbon value of the harvested biomass for the reference state CSr = Carbon stored in soil for the reference state without the project
The carbon content of the fossil fuel replaced by a biomass energy project is that of the fossil fuel that would be consumed to produce the equivalent amount of commercial energy. Assuming equal efficiencies for biomass and fossil fuel combustion and a heating value of 19 GJIton-biomass (Davidson 1987), or 38 GJ/tC, and using the carbon content for the fuel replaced as that of oil at 20 kgIGJ, the carbon saved is 0.76 tC per tC in the wood burned. This value must be corrected for differences in efficiencies for the two fuel sources.
For each project classification, we can now relate the terms in equation 3 to the different flows of carbon in a project. Each type of carbon flow (standing biomass, new biomass, harvested biomass, soil carbon, fossil fuel) corresponds to one term (CVnat, CVaV, CVh, CS, CF). As shown in Table 2, the different project classifications are distinguished by the carbon-flow terns that are relevant, in which case they are represented by a "+" in Table 2. Carbon flows that are not relevant for a given project classification are represented by a "0" in Table 2.
Table 2 Carbon Savings Parameters by Land-Use Classification
"+" means the carbon flow applies to the project classification, "0" means it does not
Carbon Flow: Standing New Harvested Soil Fossil Biomass Biomass Biomass Carbon Fuel
Variable: CVnat CVav CVh CS CF
Forest Reserves + 0 0 Natural Forest Management + 0 + Forest Restoration 0 + 0 Timber Plantations 0 + + Agroforestry + + 0 Fuelwood Farms + + + Biomass Energy Plantations 0 + +
Source: Swisher 1991
An'alysls of Sample Forestry Projects
As an example of the carbon storage analysis methodology presented above, Table 3 gives estimates of the costs and carbon storage potential of individual projects studied in Costa Rica (S wisher 199)). Additional estimates are made, based on project data from three literature sources: two that consider timber plantations and one on biomass energy development (McCorrnick 1987, Sedjo 1983, Carpentieri et al 1993). Also, the costs and carbon savings are recalculated, assuming that all of the harvested wood from each project is used for biomass energy conversion. The energy project is assumed to be a condensing-extraction steam-turbine (CEST) generator with a net efficiency of 21 percent. Electricity from this source replaces a 30-percent efficient oil-fired plant.
The projects studied include those being conducted under the Forest Development Program for Small and Medium Farmers in Costa Rica. This program is an effort by the Costa Rican Forest Service, Department of Rural Forest Development (Desarrollo Campesino Forestal, DECAFOR) to empower private forestry organizations who currently lack the needed administrative and organizational skill to carry out forestry projects on a widespread basis. The principal funding mechanism for this project is the Fondo para Desarr01lo Forestal (FDF) which, for four years beginning in 1989, has been fmancing 12,000 ha/yr of forest plantations by small fanners' organizations and cooperatives, through an innovative revolving rural credit program (Canet 1989). Training and technical assistance are provided through a rural extension program.
The approximate costs of the forestry projects studied in Costa Rica range from $4/ton-carbon for forest reserves to $1 Uton for small-holder woodlots and $26/ton for restoration of degraded natural forest ecosystems (Swisher 1991). Calculated costs for the other projects are similar, and the carbon storage potentials for plantation projects are mostly between 80 and 100 tC/ha, depending on climate and project design. When the same projects are considered as biomass energy plantations, the carbon savings per hectare generally increase slightly and the cost per ton decreases somewhat, although not in every case. Thus, based on conventional energy-conversion technology, the performance of biomass energy plantations in preventing carbon emissions is not much different, over the 40-year life of a power station, than that of forest plantations and other projects.
The carbon savings and costs of the biomass energy projects are recalculated in Table 4, assuming more advanced energy conversion processes, based on biomass gasification technology such as that now under commercial development in Sweden and Brazil (Larson et a1 1989, SEW 1991, Carpentieri et al 1993). The improved efficiency of steam-injected gas-turbine (STIG) technology increases the carbn savings per hectare without significantly increasing the cost of carbon savings. Gas-turbine combined-cycle (GTCC) technology further improves performance but at significantly increased cost, because the cost of carbon savings is relatively sensitive to increases in the capital cost of the conversion equipment.
National Carbon Emission Reduction Potential
It would also be useful to have national estimates of carbon-savings potential as a function of cost, but sufficient information is not available to accomplish such as analysis, for the world or even for one country. The results presented below are a Fist step in this process of estimating carbon- savings cost and potential from the bottom-up. We use the carbon-savings results for the different types of projects analyzed above to estimate national carbon-storage potential for Costa Rica, based on project proposals and cost estimates given in the national Tropical Forest Action Plan (TFAP).
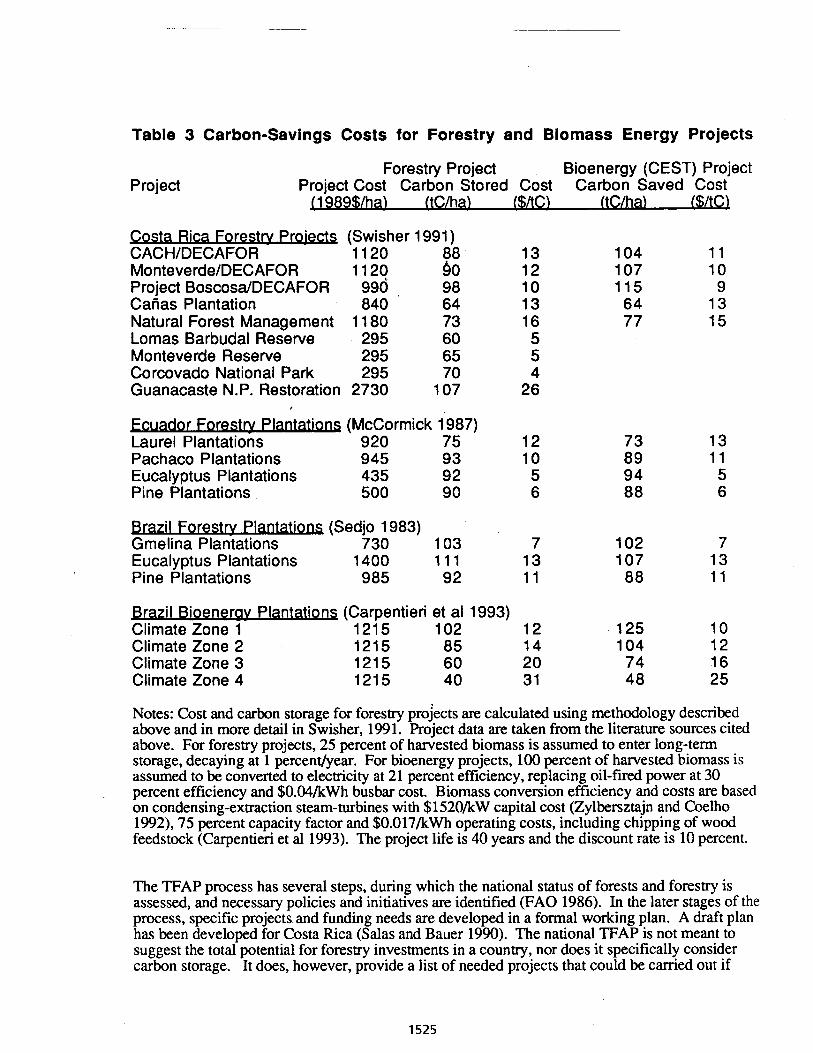
Table 3 Carbon-Savings Costs for Forestry and Biomass Energy Projects
Forestry Project Bioenergy (CEST) Project Project Project Cost Carbon Stored Cost Carbon Saved Cost
11 989$/ha! (tC1ha) f$ltC) ItClha) f$/tC\
Costa Rica Forestry P r o i a (Swisher 1991 ) CACHIDECAFOR 1120 88 MonteverdeIDECAFOR 1120 90 Project BoscosalDECAFOR 990 98 Caiias Plantation 840 64 Natural Forest Management 1 180 73 Lomas Barbuda1 Reserve 295 60 Monteverde Reserve 295 65 Corcovado National Park 295 70 Guanacaste N.P. Restoration 2730 107
P la miens (McCormick 1987) Laurel Plantations 920 75 Pachaco Plantations 945 93 Eucalyptus Plantations 435 92 Pine Plantations 500 90
I Forestry Plantations (Sedjo 1983) Gmelina Plantations 730 103 7 102 7 Eucalyptus Plantations 1400 1 I 1 13 107 13 Pine Plantations 985 92 11 88 11
Brazil Bioenerav Plantations (Carpentieri et a1 1993) Climate Zone 1 1215 102 12 Climate Zone 2 Climate Zone 3 Climate Zone 4
Notes: Cost and carbon storage for forestry proJects are calculated using methodology described above and in more detail in Swisher, 1991. Project data are taken from the literature sources cited above. For forestry projects, 25 percent of harvested biomass is assumed to enter long-term storage, decaying at 1 percentlyear. For bioenergy projects, 100 percent of harvested biomass is assumed to be converted to electricity at 21 percent efficiency, replacing oil-fired power at 30 percent efficiency and $O.M/kWh busbar cost. Biomass conversion efficiency and costs are based on condensing-extraction steam-turbines with $1520/kW capital cost (Zylbersztajn and Coelho 1992), 75 percent capacity factor and $0.017/kWh operating costs, including chipping of wood feedstock (Carpentieri et a1 1993). The project life is 40 years and the discount rate is 10 percent.
The TFAP process has several steps, during which the national status of forests and forestry is assessed, and necessary policies and initiatives are identified (FA0 1986). In the later stages of the process, specific projects and funding needs are developed in a formal working plan. A draft plan has been developed for Costa Rica (Salas and Bauer 1990). The national TFAP is not meant to suggest the total potential for forestry investments in a country, nor does it specifically consider carbon storage. It does, however, provide a list of needed projects that could be carried out if
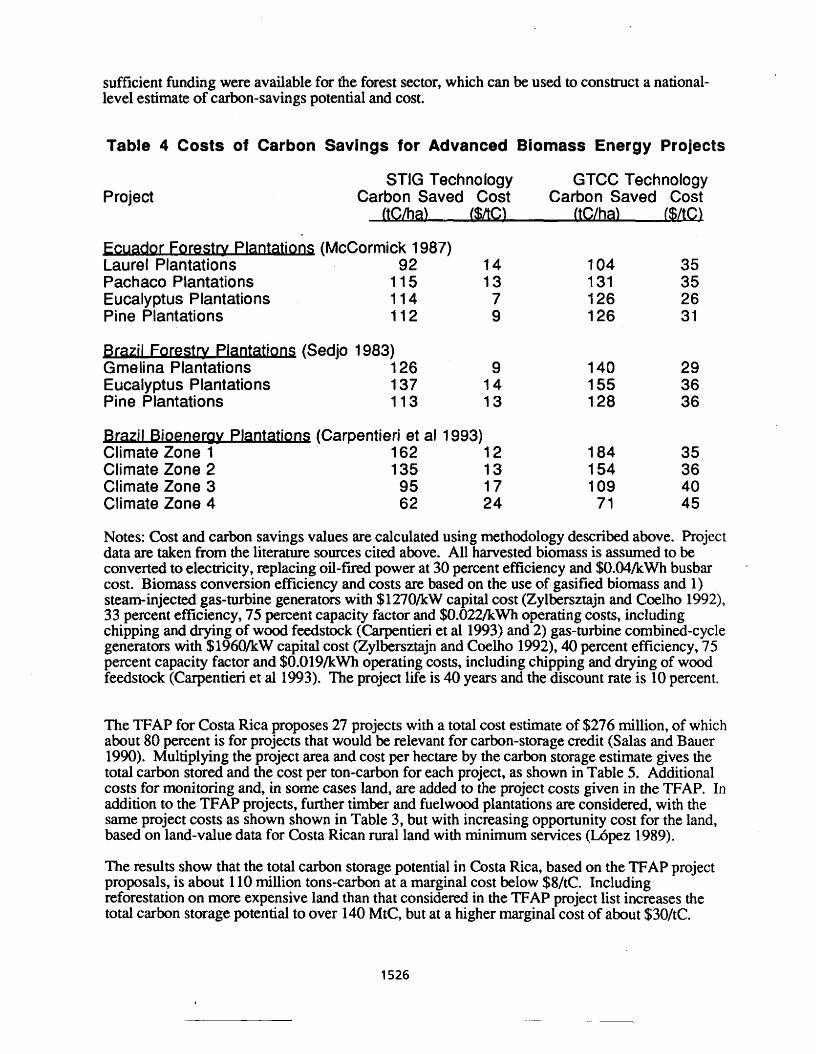
sufficient funding were available for the forest sector, which can be used to construct a national- level estimate of carbon-savings potential and cost.
Table 4 Costs of Carbon Savings for Advanced Biomass Energy Projects
Project STlG Technology GTCC Technology
Carbon Saved Cost Carbon Saved Cost !tC/ha) cs/tC) ftC/ha) [$AC)
dor Forestry P- (McCormick 1987) Laurel Plantations 92 14 104 35 Pachaco Plantations 115 13 131 35 Eucalyptus Plantations 114 7 126 26 Pine Plantations 112 9 126 31
5 (Sedjo 1983) Gmelina Plantations 126 9 140 29 Eucalyptus Plantations 137 14 155 36 Pine Plantations 113 13 128 36
. . *ens (Carpentieri et al 1993) Climate Zone 1 162 I 2 184 35 Climate Zone 2 135 13 154 36 Climate Zone 3 95 17 109 40 Climate Zone 4 62 24 71 45
Notes: Cost and carbon savings values are calculated using methodology described above. hojec t data are taken from the literature sources cited above. All harvested biomass is assumed to be converted to electricity, replacing oil-fired power at 30 percent efficiency and $O.O4/kWh busbar cost. Biomass conversion efficiency and costs are based on the use of gasified biomass and 1) steam-injected gas-turbine generators with S1270,kW capital cost (Zylbersztajn and Coelho 1992), 33 percent efficiency, 75 percent capacity factor and W.O22/kWh operating costs, including chipping and drying of wood feedstock (Carpentieri et a1 1993) and 2) gas-turbine combined-cycle generators with $1960/kW capital cost (Zylbersztajn and Coelho 1992), 40 percent efficiency, 75 percent capacity factor and $0.019/kWh operating costs, including chipping and drying of wood feedstock (Carpentieri et a1 1993). The project life is 40 years and the discount rate is 10 percent.
The TFAP for Costa Rica proposes 27 projects with a total cost estimate of $276 million, of which about 80 percent is for projects that would be relevant for carbon-storage credit (Salas and Bauer 1990). Multiplying the project area and cost per hectare by the carbon storage estimate gives the total carbon stored and the cost per ton-carbon for each project, as shown in Table 5. Additional costs for monitoring and, in some cases land, are added to the project costs given in the TFAP. In addition to the TFAP projects, further timber and fuelwood plantations are considered, with the same project costs as shown shown in Table 3, but with increasing opportunity cost for the land, based on land-value data for Costa Rican rural land with minimum services (Lhpez 1989).
The results show that the total carbon storage potential in Costa Rica, based on the TFAP project proposals, is about 110 million tons-carbon at a marginal cost below $8/tC. Including reforestation on more expensive land than that considered in the TFAP project list increases the total carbon storage potential to over 140 MtC, but at a higher marginal cost of about $30/tC.
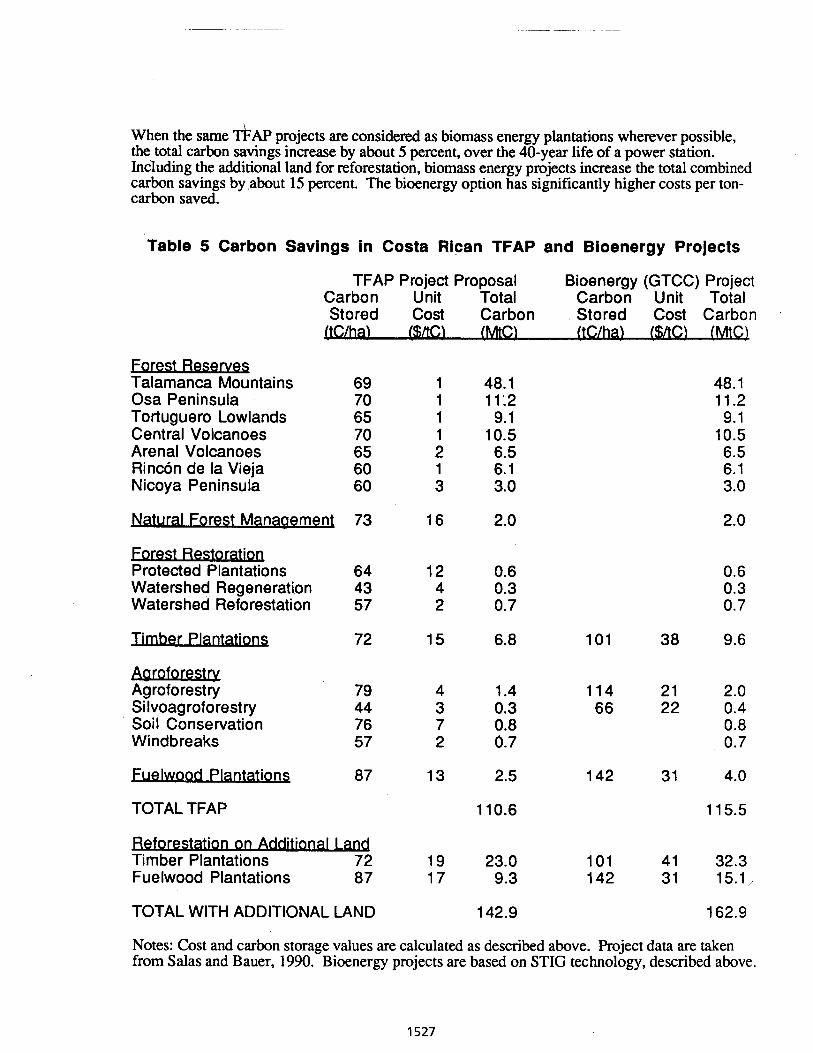
When the same T ~ A P projects are considered as biomass energy plantations wherever possible, the total carbon savings increase by about 5 percent, over the 40-year life of a power station. Including the additional land for reforestation, biomass energy projects increase the total combined carbon savings by about 15 percent. The bioenergy option has significantly higher costs per ton- carbon saved.
Table 5 Carbon Savings in Costa Rican TFAP and Bioenergy Projects
TFAP Project Proposal Bioenergy (GTCC) Project Carbon Unit Total Carbon Unit Total Stored Cost Carbon Stored Cost Carbon .
ha) (SAC) (MtC! (tuha) (SAC) Cw v Talarnanca Mountains 69 Osa Peninsula 70 Tortuguero Lowlands 65 Central Volcanoes 70 Arenal Volcanoes 65 Rincon de la Vieja 60 Nicoya Peninsula 60
Natural Forest Manaaemenf 73 16 2.0 2.0
Forest Restoration Protected Plantations Watershed Regeneration 43 4 0.3 Watershed Reforestation 57 2 0.7
Timber P l a m 72 15 6.8 101 38 9.6
lluQmmY Agroforestry 79 4 1.4 114 21 2.0 Silvoagroforest ry 44 3 0.3 66 22 0.4 Soil Conservation 76 7 0.8 0.8 Windbreaks 57 2 0.7 0.7
TOTAL TFAP 1 10.6 11 5.5
Timber Plantations 72 19 23.0 101 4 1 32.3 Fuelwood Plantations 87 17 9.3 142 31 15.1,
TOTAL WITH ADDITIONAL LAND 142.9 162.9
Notes: Cost and carbon storage values are calculated as described above. Project data are taken from Salas and Bauer, 1990. Bioenergy projects are based on STIG technology, described above.
The values shown in Table 5 for biomass energy projects are based on the assumption that the biomass harvested from the plantations and all other projects capable of producing a sustainable yield is converted to electricity, using the most efficient process (GTCC) analyzed above, to replace a 30-percent efficient oil-fired plant. A less expensive process (STIG) would give less carbon savings, but the cost per ton-carbon saved would be lower, comparable to that of the forestry projects. One might also assume that advanced biomass conversion technologies would replace advanced fossil technology, rather than conventional technology as assumed above. This assumption would also reduce the carbon savings and the cost per ton of the bioenergy projects.
It is important to note that the carbon savings for the biomass energy projects are based on one power-station lifetime of 40 years, or about 3-6 harvest rotations in the biomass plantations. The advantage of biomass energy, as a strategy for using forest plantations in a way that reduces global carbon emissions, is that additional power stations could be built and operated indefinitely in the future. The biomass fuel could be supplied from the same land, provided that it can continue to be harvested sustainably. Thus, in the long tern, the carbon savings can continue to accumulate beyond the values calculated above, while the carbon savings of the forestry options are essentially one- time values.
Comparison with Other National Estimates
Another proposal for a bottom-up reforestation program is the FLORAM project in Brazil, excluding the Amazon region. This program provides for the reforestation of 20 million hectares of degraded land in southern Brazil over the next 30 fears, together with the restoration of 45 million hectares of dry savannah in northeastern Brazil, at an approximate cost of $22.5 billion (Instituto de Estudos Avanqados 1990). The estimated carbon storage benefit is 3.6 billion tons from reforestation and 1.4 billion tons from savannah restoration, at an average cost of $4.SO/tC.
These carbon storage calculations are not consistent with those made above, and it appears that they are exaggerated by as much as a factor of two, but they do indicate the potential for such efforts in a large country such as Brazil, even excluding the carbon benefits of reversing the deforestation process in the Amazon region. Moreover, the savannah land is generally in areas that are considered too dry for plantation development, so the restoration of this land may well be compatible with biomass development in adjacent humid areas (Carpentieri, 1993).
Implications for Carbon Emission Reduction Strategies
The results of the analysis described above suggest an intermediate strategy, between the extremes calling for either global reforestation or biomass energy development to mitigate global climate change. Because massive reforestation based on timber plantations would saturate the slowly- growing world timber market with its output (Kuusela 1987), biomass energy projects to supply growing energy demands in developing countries would provide a more reliable long-term use for biomass grown in plantations. Moreover, biomass energy plantations can be developed on land that is not capable of supporting annual crops, thus reducing the potential competition between energy and food production.
The key issue regarding sustainability, however, is the land-use capacity. While biomass energy plantations offer an attractive use for production forest land, not all potential forest land can
support production forestry on a sustainable basis. If applied to areas where the land cannot support such use, bioenergy projects would impose fuel demands that could not be met, creating pressure to harvest other lands, including primary forest. Reckless biaenergy development could even accelerate deforestation, reversing some of the carbon emission savings achieved through replacing fossil fuels.
Other land areas have different land-use capacities, including agroforestry and forest protection. Programs designed to achieve these land-uses where appropriate can significantly increase carbon storage and reduce net carbon emissions, as illustrated above, at relatively low cost. Thus, these programs should be considered an important part of national strategies to promote sustainable land- use and carbon emission savings. Table 5 shows that, even with advanced technology, biomass energy development could achieve, over the 40-year life of a power station, no more than a 15 percent increase in total carbon savings from implementing the national TFAP together with plantations on additional available land in Costa Rica. Most of the carbon savings from the original plan come from protection of standing biomass on forest lands vulnerable to deforestation, while about 15 percent comes from new biomass in forest restoration, natural forest management, agroforestry and plantation projects.
Land suited to forest plantations can provide fuel for biomass energy development to replace fossil fuels and, to the extent that harvests are sustainable, can continue to prevent carbon emissions indefinitely in the future. In the long term, therefore, one hectare of sustainably-managed plantation land can save more carbon through bioenergy than through other forestry uses, including massive timber plantations. In the medium term, however, the total carbon savings potential of other forestry options are equally or more important, and they can be achieved at relatively low cost. These options include protection and implementation of agroforestry, natural forest management and other mixed uses on land that cannot support plantations.
In the next 40-50 years, much of the world's strategy for limiting carbon emissions must be established. Sustainable forest development, based on realistic assessments of land-use capacity, can play an important role by reversing the current trend of tropical deforestation. It therefore appears to be a false dichotomy to consider carbon savings via biomass energy development and carbon storage in forest management and reforestation as alternative, competing strategies (Hall et a1 199 1). These strategies apply, for the most part, to different land areas, and they can therefore be considered as complementary approaches to land-use and carbon emission reduction.
Social Implications uf Sustainable Forestry Development
The projects studied in this research, and most of the TFAP proposals, are projects that the Central American governments are anxious to implement but unable to because of financial constraints such as the foreign debt burden and poor terms of trade with the industrialized world (Umaiia 1989). Properly implemented reforestation, biomass energy and agroforestry projects can have significant social and economic benefits in many developing nations (Nations and Komer 1983). The local socio-economic effect is the key to the success of tropical reforestation efforts, and to their prospect of providing long-term carbon storage. Indeed, it is difficult to imagine any forest development achieving sufficient longevity for long-term carbon storage without providing local benefits.
Unless the local people receive the benefits of a forest project, providing continuing resources and real incentives to maintain rather than deplete forest resources, the project will likely fail. This problem has been observed in several unsuccessful fuelwood plantation projects that were well- funded, but lacked sufficient local incentives (Catterson et a1 1987). Many tropical plantation
efforts have failed in the past, sometimes due to poor technical design but often due to inattention to the local social context and institu tiond baniers.
The barriers to sustainable plantations include the lack of long-term incentives, technical experience or cultural tradition; the uneven land distribution and laws that reward deforestation; and the poor returns due to the inherently long-term nature of forestry investments and to the availability of cheap (and often illegal) wood from primary forests (Rodriguez and Vargas 1988). Barriers to agroforestry include subsistence needs and lack of capital and appropriate technology and development policy (Castillo, 1 989). Barriers to local involvement in rural forest development include lack of capital, technical capability, enabling legislation, and forestry culture. Barriers to forest protection include population pressure driven by land tenure uncertainty and the lack of basic technical studies, integrated forest management policies and plans, and facilities for sustainable uses such as eco-tourism. Overcoming these limitations is a goal of Costa Rica's Sustainable Development Strategy, under which the management of inhabited areas surrounding protected areas is integrated into the regional-level planning of eight conservation units (Quesada 1989).
The barriers that most types of have in common are capital costs, personnel capability, access to land, legislative hurdles, and consistency of political support. While funding is obviously a major barrier, the most important short-term limitation appears to be a lack of qualified personnel to carry out the projects and to provide the essential extension services that are needed to successfully involve local people. The strongest long-term barrier may be land tenure and the inequitable land distribution throughout Latin America Much of the best land is owned by very few and used for extensive purposes such as cattle ranching, while population pressure is forcing overly intensive use of lands with the capacity for uses no more intensive than forestry (Leonard 1987). This mismatch makes it difficult to use the best land and perpetuates the pressure on forests from overuse of low-productivity land.
Conclusion
The need for reforestation in developing nations, evidenced by the projects proposed under the TFAP, and the carbon-saving potential of forestry and biomass energy projects, indicate the potential benefits of sustainable forestry development. Such projects have gotten a boost recently, especially in Costa Rica, fi-om the advent of "debt-for-nature" swaps that meet the dual objectives of relieving the debt burden and funding needed natural resources programs (Conservation International 1989). Several world fund mechanisms and emission trading systems have been proposed that would transfer resources from carbon emitters to tropical countries for the purpose of carbon emission reductions (WRI 1989, Gmbb 1989). Some such proposals include funding forestry projects for carbon- storage (S wisher and Masters 1989, Goldemberg 1990).
International funding of projects on the basis of carbon savings, based perhaps on a mechanism such as carbon offsets, could enable such transfers to become routine commercial transactions, which internalize the environmental costs of CO;! emissions and the environmental benefits of reforestation and renewable energy (Swisher and Masters 1991). The premise of carbon offsets is not that land is freely available in developing countries to displace other lands uses and plant trees of any type desired. Rather it is that a real need exists for reforestation, forest management and biomass energy development, which will not be financed under existing conditions, but that offer both local and global benefits if implemented under the proper conditions.
References
Brown, S., A.J.R. Gillespie, A.E. Lugo, 1989, "Biomass Estimations for Tropical Forests with Applications to Forest Inventory Data," Forest Science, vol. 35, no. 4, pp. 881-902.
Burniske, G.R. and L.T. Prewitt, 1987. Impact Analysis of the Forestry Component of the CARE-Guatemala Agroforesny Program, Guatemala, CARE.
Canet, G., 1989. Programa de Desarrollo Forestal para Medianos y Pequeiios Agricultores Organizados, Direccibn General de Forestal, San JosC, Costa Rica, July.
Carpentieri, A.E., E.D. Larson and J, Woods, 1993. "Future Biomass-Based Electricity Supply in Norteast Brazil," Biomass and Bioenergy, vol. 4, no. 3, pp. 149-173.
Castillo, C.B., 1989. "Costa Rica: Desarrollo Campesino Forestal," in Hedstrom, I., ed., La Situacio'n Ambiental en Cennoamtrica y el Caribe, San Jos6, Cost Rica, Departmento EcumCnico de Investigaciones.
Catterson, T.M., 1987. "Rethinking Forestry Strategy in Africa," Desertificarion Control Bulletin, UN Environment Program, No. 14, pp. 31-37.
Conservation International, 1989. "The Debt for Nature Exchange: A Tool for International Conservation," Washington.
Davidson, J., 1987, "Bioenergy Tree Plantations in the Tropics: Ecological Implications and Impacts," Geneva, International Union for the Conservation of Nature Ecology Paper 12.
Durst, P.B., 1987. "Financial Aspects of Contract Reforestation in the Philippines," Raleigh, NC, Southeastern Center for Forest Economics Research, FPEI Working Paper no. 10.
Food and Agriculture Organization (FAO), 1986. Tropical Forestry Action Plan. FAO, Rome. Garcia, L.E., et al, 1987. Pe@l Ambiental de la Repliblica & Guatemala, Second Edition,
Guatemala, Universidad Rafael Landivar. Goldemberg, J., 1990. "How to Stop Global Warming," Technology Review, vol. 93, no. 8, pp.
25-3 1. Grainger, A., 1990. "Modeling the Impact of Alternative Afforestation Strategies to Reduse
Carbon Dioxide Emissions," Proceedings, Cogerence on Tropical Forestry Response Options to Global Climate Change, pp. 93-104, Sao Paulo, January.
Grubb, M., 1989. The Greenhouse EfSect: Negotiating Targets, Royal Institute of Imernational Affairs, London.
Hall, C.A.S., R.P. Detweiler, P. Bogdonoff, S. Underhill, 1985. "Land Use Change and Carbon Exchange in the Tropics I," Environmental Management, vol. 9 pp. 313-334.
Hall, D.O., H.E. Mynick, R.H. Williams, 1991. "Cooling the Greenhouse with Bioenergy," Nature, vol. 353, pp. 1 1- 12.
Harmon, M.E., W.K. Ferrel, J.F Franklin, 1990. "Effects on Carbon Storage of Old-Growth Forests Converted to Young Forests," Science, vol. 247, pp. 699-702.
Hartshorn, G., 1982. Costa Rica: Country Environmental Profile, San JosC, Tropical Science Ctr. Houghton, R.A., R.D. Boone, J.R. Fruci, J.E. Hobbie, J.M. Melillo, C.A. Palm, B.J. Peterson,
G.R. Shaver, G.M. Woodwell, 1987. "The Flux of Carbon from Terrestrial Ecosystems to the Atmosphere in 1980 Due to Changes in Land Use," Tellus, vol. 39B, pp. 122-139.
Houghton, R.A., 1990. "The Future Role of Tropical Forests in Affecting the Carbon Dioxide Concentration of the Atmosphere," Ambio, vol. 19, pp. 204-209.
Instituto de Estudos Avan~ados, 1990. "Projecto FLORAM - uma Platforma," Estudos Avan~ados, Universidade de Siio Paulo, vol. 4, no. 9.
Intergovernmental Panel on Climate Change (IPCC) Working Group 1, 1990. Scientific Assessment of Climate Change, Geneva, U.N. Environment Programme, June.
Kuusela, K., 1987. "Forest Products: World Situation, Ambio, Ambio, vol. 16, p. 80-85. Lanly, J., 1983. "Assessment of the Forest Resources of the Tropics," Forestry A stracts, vol.
44, no. 6, June. 1
Larson, E.D., P. Svenningsson, I. Bjerle, 1989. "Biomass Gasification for Gas Turbine Power Generation," in Johansson, T.B., B. Bodlund and R.H. Williams (eds.), Electricity, Lund University Press, Sweden. I
Leonard, H.J., 1987. Natural Resources and Economic Development in Central America, New Brunswick, NJ, Transaction Books.
Mpez R., H., 1989. "Manual de Cogidos Utilizados en la Informaci6n Sobre Valores de Predios," San Jost, Costa Rica, Ministerio de Hacienda.
Lugo, A.E., S. Brown, J. Chapman, 1988. "An Analytical Review of Production Rates and Stemwood Biomass of Tropical Forest Plantations," Forest Ecology and Management, vol. 23, pp 179-200.
Marland, G., 1988. The Prospect of Solving the C02 Problem Through Global Reforestation, US Dept. of Energy, DOE/NBB-0082, Washington.
Marland, G., T.A. Boden, R.C. Griffen, S.F. Huang, P. Kanciruk, T.R. Nelson, 1988. Estimates of C02 Emissions from Fossil Fuel Burning and Cement Manufacturing, Oak Ridge National Laboratory.
McCormic k, I., ed., 1 987. Analis fs Econdrnico de Inversiones en Plantaciones Forestales en Ecuadbr, Quito, Direccidn Nacional Forestal.
Myers, N., 1989. Deforestation Rates in Tropical Forests and Their Climatic Implications, Friends of the Earth, London.
Nations, J.D., and D. Komer, 1983. "Central America's Tropical Rainforests: Positive Steps for Survival," Ambio, vol. 12, pp. 232-238.
Nordhaus, W.D., 1991. "The Cost of Slowing Climatic Change: A Survey," The Energy Journa[, vol. 12, no. 1.
Nordwyck Declaration of the Ministerial Conference on Atmospheric Pollution and Climate Change, Nordwyck, Netherlands, November 1989.
Quesada, C., 1989. "Sintesis de ECODES," in Estrategfa de Conservacidn para Desarrollo Sostenible en Costa Rica, San Jose, MIRENEM, September.
Rodriguez C., S., and E. Vargas M., 1988. El Recurso Forestal en Costa Rica, Heredia, Costa Rica, Editorial de la Universidad Nacional
Salas, J.L., and J. Bauer, 1990. Plan de Accidn Forestal de Costa Rica, San Jost, MIRENEM. Sedjo, R.A., 1989. "Forests: A Tool to Moderate Global Warming?" Environment, vol. 31, pp.
14-20. Sedjo, R. A., 198 3. The Comparative Economics of Plantation Forestry, Washington, Resources
for the Future. Svensk Energi Utveckling (SEU) AB, 1991. Ress release, Stockholm, November. Swisher, J.N., and G.M. Masters, 1989. International Carbon Emission Offsets, Stanford Univ.,
Civil Engineering Dept. Technical Report TR-309, Palo, Alto, Calif. Swisher J.N. and G.M. Masters, 1992 "A Mechanism to Reconcile Equity and Efficiency in
Global Climate Protection," Ambio, vol. 21, p. 154- 159. Swisher, J.N., 1991. Prospects for International f rude in Environmental Services: An Analysis of
International Carbon Emission Ofsets, PhD Thesis, Stan ford Univ., Civil Engineering Dep t. Swisher J:N., 1992. "Cost and Performance of C02 Storage in Forestry Projects," Biomass and
Bioenergy, vol. 1, no. 6, pp. 317-328. Tosi, J. A., et al, 1985. Sistema para la Detenninacidn de la Capacidad de Uso de las Tierras de
Costa Rica, San Jose, Centro Cientifica Tropical. Uma fia, A., 1989. Greenhouse Economics: Global Resources and the Political Economy of
Climate Change, Ministerio de Recursos Naturales, Energia y Miiias, San J o l , Costa Rica. World Resources Institute, 1989. Natural Endowments: Financing Resource Conservation for
Development, World Resources Institute, Washington. World Resources Inst.. 1990. World Resources 1990-91, New York, Oxford Press. Zylbersztajn, D. and S. Coelho, 1992. "An Economic Evalaution of Biomass Use for Electricity
Production and its Environmental Consequences in Brazil," Proceedings of Advances in Thermochemical Biomass Conversion, Interlaken, Switzerland, May.
ENVIRONMENTAL BENEFITS OF THE BRAZILIAN ETHANOL PROGRAMME
Emilio Lbbre La Rovere -. PPUCOPPEIUFRJ
Energy Planning ProgrammeIFederal University of Rio de Janeiro C.P. 68565 Rio de Janeiro
CEP 21 945-970 Brazil Fax: (55) 21 290 6626
Pierre Audinet ClRED
Centre International de Recherches sur I'Environnement et le Developpement 1, rue du 11 novembre
92120 Montrouge France
Fax: (33) 1 40 92 93 17
ABSTRACT
After nearly twenty years since it was first launched, the Brazilian Ethanol Programme to date remains the largest commercial application of biomass for energy production and use in the world. It succeeded in demonstrating the technical feasibility of large scale ethanol production from sugar cane and its use to fuel car engines. On social and economic grounds, however, its evaluation is less positive. The purpose of this study is to provide an updated overview of the perspectives for the Ethanol Programme under the light of increasingly important local and global environmental concerns. Major results show thlat after oil prices sharply decreased in the eighties, an overall positive evaluation of the Ethanol Programme can only be supported upon the basis of its contribution to curb the increase of air pollution in Br'uilian cities and of the greenhouse effect. It is concluded that the very survival of the Ethanol Programme, depends upon adequate economic compensation considering its global environmental benefits. These are appraised within two scenarios based on the use of a Markal-like model to define the range and costs of curbing greenhouse gases with a policy aiming at extending the Etllanol Progmnme.
Introduction
This paper presents some preliminary results of a study being carried out by the Energy Planning Programme of the Centre for Postgraduate Studies in Engineering of the Federal University of RJO de Janeiro (PPEICOPPEIUFRT) on the strategies for limiting the e~nission of greenhouse gases in Brazil. To address these issues a Brazilian team, bringing together the Economic Research Institute of the Ministry of Planning (IPEA) and the Ministry of Mines and Energy with PPE/COPPE/UFRJ as the core group, has been working in cooperation with the French l~lternational Centre of Environment and Developlnent Research (CIRED) and the UNEP Collaborating Centre on Environment and Developnlent at RISO, in Denmark (La Rovere 1993). This research effort includes the elaboration of mid and long-term ethanol-he1 scenarios, in order to assess the economic impact of limiting C02 emissions. A first section presents a general social and economic frame appraising the Ethanol Programme. The need for a deeper evaluation of the Programme on environmental grounds leads us to review the environmental impacts of the Programme for both production and use at a local and regional level in the second section. The role of the Ethanol Progranune in curbing CO, emissions in Brazil is discussed in the third section, along with the presentation of the overall balance of CO, elllissions from the energy system in the country. Section 4 deals with the long run potential of extending the Ethanol Progranln~e in Brazil and its associated abatement costs of avoiding carbon emissiorls. Section 5 reviews a set of constraints (financial, environmental, etc) which limit the building of a strategy based on the extension of sugar cane production for ethanol.
I. The Brazilian Ethanol Programme: General Features. Since the i~~troduction of sugar cane plantations by the European colo~lisers in the 16th century, Brazil has always been an important producer and exporter of sugar. The Brazilian govenlment's major answer to t11e problems of the bending trend of intematiollal sugar prices and the increasing burden of the petroleum bill after 1973, has beell to install the Ethanol Progranule. TPo date, it remains tile largest co~mlercial application of biomass for energy production and use in the world. After the launching of the Programnle in 1975, ethanol production fro111 sugar cane increased from 0.6GI to the 199 1/92 season level of 12GI per year. Apart from this, 8.6Mt of sugar and 73Mt of bagasse from 229Mt of sugar cane are produced in the sane season (Copersucar 1992), harvested on approximately 4Mha. Tlle task for the first five years was to replace petrol by gasohol (20% ethanol). This was completed easily, without engine modification in light gasoline vehicles. On the production side, idle production capacities and the flexibility of existing distilleries were used to shift fro111 the production of sugar to that of ethanol. After the second oil crisis, a decisive new step was taken to extend the use of ethanol to light vehicles using pure ethanol. The Brazilian auton~otive industry (mainly branch ofices of major European and American car makers) agreed to the rili~lor techllical changes required in the ma~ufacturing of such cars. The investment effort required for this phase of the Ethanol Progrmne was funded through soft loans by the government. Tax reductions turned ethanol and ethanol powered car prices highly attractive to the consumers. Today, 4.2M of ethanol powered cars consume 10.5G1 of ethanol per year and 1.3Gl of ethanol is used for the production of gasohol for the rest of the cars in the country. The sharp decrease of oil prices in the international l~larket in the mid-eighties seriously affected the cost-
I effectiveness of the Ethanol Programme. The govemnent stopped funding the building of new distilleries and therefore limited the production capacity. Tht: incentives for the co~lsumption of etlianol however carried on. Ethanol consumption growth slowed down but did not stop. From Illore than +27%/year between 1 98 1 and 1986, the growth rate went down to + 1,3%/year between 1986 and 1 992 (Copersucar 1992). As a result, in 1989 and 1990, a supply crisis took place and affected the credibility of the Ethanol Progrmune considerably. The share of new ethn~~ol powered cars in the total amount of cars sold on the

market shrunk from almost 100% in 1988 ta around 4% during the crisis, to stabilize at a number oscillating between 10 and 20% (Anfavea 1992). This new equilibrium has been reached at the cost of a net decrease of ethanol rate in petrol. Today it has gone down by an average of 12%, showing large seasonal and regional fluctuations. Therefore, the very existence of the Ethanol Programme is put in question. The programme necessitates a rationalization of its working principles. The Petrobras (The Brazillian state- owned company responsible for petroleum production and marketing) envisages abandoning its role in the transport and distribution of alcohol to lessen its financial losses caused by storing and marketing ethanol. Environmental protection has become the most important clause governing the need to continue with the Ethanol Programme: the city of Sao Paulo has obtained the licence to retain a proportion of 22% of ethanol in its Gasohol in order to limit the acute problem of air pollution in the city. The other regional capitals of Brazil have applied for the same. Yet this strategy is competing with new oil based gasoline blends with higher oxygen content which are being successfully launched in the market by all major oil companies (including Petrobras). The future of the Ethanol Programme is not only linked to its economical and social impacts but also to its ecological ones. This progrmne successfully de~nonstrated the technical feasibility of large scale ethanol production from sugar cane and its use to fbel car engines. Further, the purely alcohol powered car engine, a major tecluical innovation of the progranmle, shows enlission rates sliglltly lower than that of the petrol powered car engines (Cetesb 1992) and equivalent drivability comfort and durability. Important productivity gains in sugar cane production and transfonlution have also taken place (1977: 26001 of ethanol per ha; 1987: 3900Uha; 1991: 5400Vha, Pinazza 199 1). A continued decrease of the production cost of alcohol of more than 3%/year has taken place since the beginning of the Ethanol Progranmle (internal calculations Copersucar, 1992). Two conunents can be made from these figures: (a) Given the huge potential of use of by-products, especially from sugar cane bagasse, the technical innovations that are actually implemented are few (Catao Aguiar & al. 1992). Amongst other uses, such as production of cattle food or paper, sugar cane bagasse could be used as a raw material for the generation of excess power to be supplied by the sugar cane refineries to the grid (Ogden & .al. 1990). Studies have shown positive rates of returns 011 investments in combined cycles in this industry (La Rovere & al. 1992). Taking into account the institutional and technological barriers, the, effective potential of power supply through cogeneration by the sugar cane industry is estimated by Brazilian off~cial power control agencies at 2000MW by,the year 20 10. (8) The decrease in the production cost of alcol~ol owes more to the decrease in real agricultural wages allotted in the sugar cane industry during the past decade, than to teclmical progress ( h s k 1991b). In the State of Sao Paulo itself, the average agricultural wages in the sugar cane sector have lost more than 70% of their values between 1978 and 1992 in real tenns (data fro111 the Instituto de Econo~ilia Agricola of Sao Paulo's State Secretariat of Agriculture). Today the production cost of alcohol is still superior to the one of petrol manufactured from imported petroleuni priced at just below $20/bbl; approxi~nately equal to half of its international price in 1980 when the second phase of the Ethanol Progranune was launched. Results from recent years show that production facilities (both annexed and autonomous distilleries) even in the region of Sao Paulo - where distilleries are most efficient - require' oil prices of at least $20/bbl for ethanol to be an economically effective substitute for oil (Rask 1991a). I11 the long run, the perspectives of an economic viability of ethanol fbel are much better, considering the double impact of possible petroleum price hikes and of potent,ial productivity gains in the production of alcohol and its by-products (especially through the introduction of improved fermentation teclulologies). This is especially true when one takes into account the n~acroeco~~omic impacts of the Brazillian Ethanol Progranune. Apart from the foreign exchange which the progranmle saved ($18 billions from 1976 to 1990; $ 1990; Navarro 1992), the programme has been responsible for the creation of 720 thousand direct jobs and more than 200 thousand indirect jobs in rural areas in a country where the rural exodus to the big cities is the cause of serious social and environmental disruptions. The Ethanol Progranune has also been a huge ~nechanism of transfer of subsidised public funds (a total of $10 billions;
$ 199 I; Navarro 1992) to a few important industrialists, increasing income disparities. However the Ethanol Programme merely reproduced the general features of the Brazilian style of development (concentration of land, power and wealth), like a microcosm of the entire social body (La Rovere 198 1).
2. Environmental Impacts of the Brazilian Ethanol Programme. 2.7. lrnpacts of Ethanol Production. Sugar cane is produced in Brazil through large scale plantations. It is a monoculture using large amounts of chemicals and water with disruptive impacts on soil fertility and biodiversity losses. The incentives for extending sugar cane plantations granted by the Ethanol Programme led to a reduction of land available for staple food crops like beans and rice, in some particular regions of the state of Sao Paulo. Preharvest burning of green biomass ("barbojo") causes important air pollution problems at the local level, affecting average-sized cities in the inner parts of Sao Pnulo state where sugar cane plantatiolls are concentrated. This could be avoided by mechanical harvesting, today li~nited to 15 % of total cropped surface in this state. Sugar cane processing for ethanol production at the distilleries also contributes to air pollution as the required steam is generated by bagasse-fed boilers. But the huge amounts of highly polluting liquid effluetlts such as wastewater and vinasse (stillage) produced by the distilleries are the most negative, environmentally speaking. Roughly 200 liters of wastewater results from the processing of each ton of sugar cane and 10 to 17 liters (13 liters in the average) of vinasse are generated per liter of ethanol produced, totalling more than 150 billion liters per season at present production levels. A number of ecological accidents were caused in the past when these effluents reached fresh water streams due to the disruption of decantation chins during the rainy seasons, and killed all their fish. More recently, in some regions vi~lasse is being successfully returned to the soil as a fertiliser (63 % of the vi~lasse produced in the state of Sao Paulo is used for this end). Moreover, sorne years ago the process of anacrobic fermentation of viim.sse and wastewater, producing biogas and biofertiliser, became commercially available in the country. In terms of enviro~ullental impacts of the processillg of sugar cane for the production of ethanol in Brazil, it is possible to distiilguisl~ 3 maill phases of techlical change defining a more global pat11 of environmental concern (Table I). These three innovation phases have distinct features according to the sugar cane refineries' attitudes towards environment, affected by factors such as: - age (efficiency of the equipment and machinery); - geographical location (intensity of coiltrols by environmental protection agencies); - size (level of coilsumption of inputs and production of effluents and pollutants). Table 1 supplies certain details on the three phases. It demonstrates how the nature of the envirorune~~tal constraints changed with time, responding to the growth and land occupation of sugar cane production and to an increasing popular awareness of pollution and environment. The three phases correspond approximately to the different eco~lonlic policies related to the Ethanol Programnle. The situation in 1993 has bee11 considerably improved from what prevailed at the beginning of the Etlla.1101 Progranmle due especially to the setting up of varlous incentives and controls operated at the factory level which oriented the sugar cane refineries towards lowering their input co~~sumption and production of effluents.
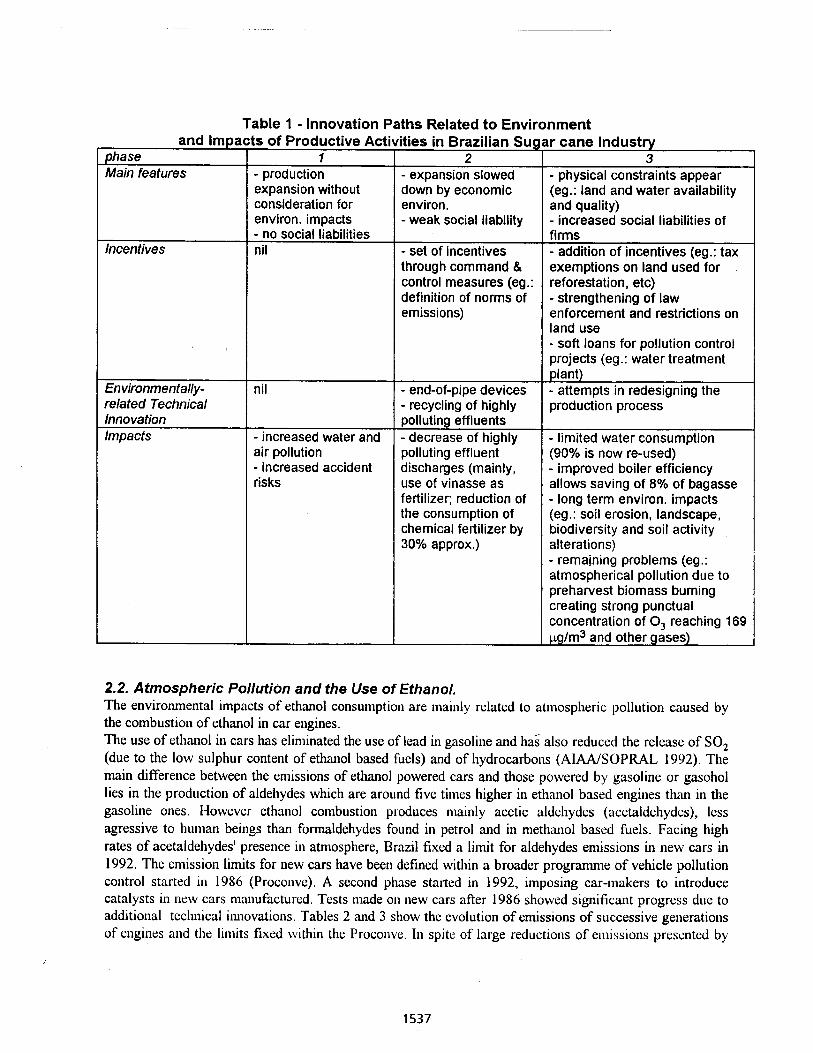
Table 1 - Innovation P a t h s Related to Environment
Main features
Incentives
Environmentally- related Technical lnnovation Impacts
expansion without consideration for environ. impacts - no social liabilities nil
nil
- increased water and air pollution - increased accident risks
down by economic environ. - weak social liability
- set of incentives through command & control measures (eg.: definition of norms of emissions)
- end-of-pipe devices - recycling of highly polluting effluents - decrease of highly polluting effluent discharges (mainly, use of vinasse a s fertilizer; reduction of the consumption of chemical fertilizer by 30% approx.)
nr cane l n d u s t ~
(eg.: land and water availability and quality) - increased social liabilities of firms - addition of incentives (eg.: tax exemptions on land used for reforestation, etc) - strengthening of law enforcement and restrictions on land use - soft loans for pollution control projects (eg.: water treatment plant) - attempts in redesigning the production process
- limited water consumption (90% is now re-used) - improved boiler efficiency allows saving of 8% of bagasse - long term environ. impacts (eg.: soil erosion, landscape, biodiversity and soil activity alterations) - remaining problems (eg.: atmospherical pollution due to p r e h a ~ e s t biomass burning creating strong punctual concentration of O, reaching 169 pg/m3 and other gases)
2.2. Atmospheric Pollution and the Use of Ethanol. The environmental impacts of ethanol consumption are mainly related to atmospheric pollution caused by the combustion of ethanol in car engines. The use of ethanol in cars has eliminated the use of lead in gasoline and has also reduced the release of SO, (due to the low sulphur content of ethanol based fuels) and of hydrocarbons (AIAA/SOPRAL 1992). The main difference between the emissions of ethanol powered cars and those powered by gasoline or gasohol lies in the production of aldehydes which are around five times higher in ethanol based engines th'm in the gasoline ones. However ethanol conlbustion produces nlainly acetic aldehydes (acetaldehydes), less agressive to human beings than formaldehydes found in petrol and in methanol based fuels. Facing high rates of acetaldehydes' presence in atnlosphere, Brazil fixed a limit for aldehydes emissions in new cars in 1992. The emission limits for new cars have been defined within a broader programme of vehicle pollution control started in 1986 (Proconve). A second phase started in 1992, imposing car-makers to introduce catalysts in new cars manufactured. Tests made on new cars after 1986 showed significant progress due to additional teclulical inllovations. Tables 2 and 3 show the evolution of emissions of successive generations of engines and the linlits fixed within the Proconve. In spite of large reductions of emissions grescnted by
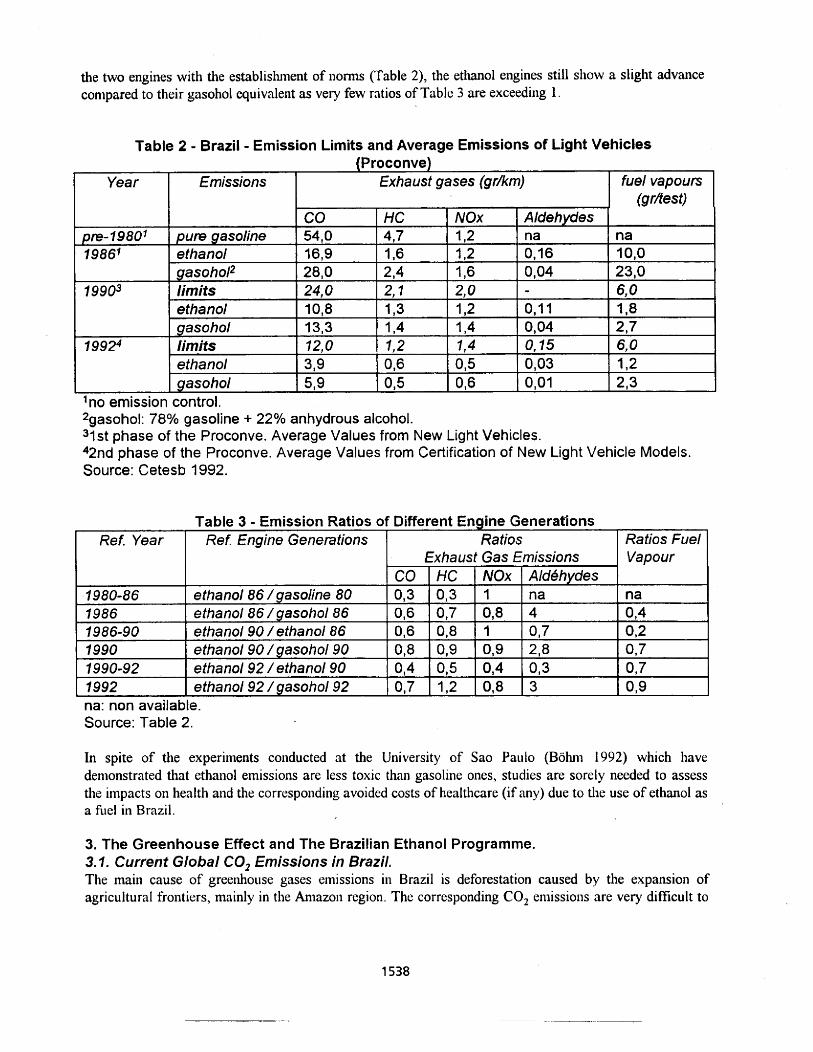
the two engines with the establishment of llonns (Table 2), the ethanol engines still show a slight advance compared to their gasohol equivalent as very few ratios of Table 3 are exceeding 1.
Table 2 - Brazil - Emission Limits and Average Emissions of Light Vehicles (Proconve)
In spite of the experiments conducted at the University of Sao Paulo (Bohnl 1992) which have
Table 3 - Emission Ratios of Different Engine Generations
demonstrated that ethanol emissions are less toxic than gasoli~le ones, studies are sorely needed to assess
fuel vapours (gr/test)
na 10,O 23,O 6 0 I& 2,7 6.0 1 2 2,3
the impacts on health and the corresponding avoided costs of healthcare (if any) due to the use of ethanol as a file1 in Brazil.
'no emission control. 2gasohol: 78% gasoline + 22% anhydrous alcohol. 3lst phase of the Proconve. Average Values from New Light Vehicles. 42nd phase of the Proconve. Average Values from Certification of New Light Vehicle Models. Source: Cetesb 1992.
Year
pre-19801 1986'
19903
I
19924
Ratios Fuel Vapour
na o14 0,2 0,7 0,7 0 I 9
3. The Greenhouse Effect and The Brazilian Ethanol Programme. 3.7. Current Global CO, Emissions in Brazil. The main cause of greethouse gases emissions in Brazil is deforestation caused by the expansion of agricultural frontiers, mainly in the Anlazoll region. The corresponding C02 enlissions are very difficult to
Emissions
pure gasoline ethanol gasohop limits ethanol gasohol limits ethanol gasohol
Exhaust gases (gr/km)
na: non available. Source: Table 2.
Ref. Year
7980-86 7986
Ref Engine Generations
ethanol 86 / gasoline 80 ethanol 86 / gasohol 86
Ratios Exhaust Gas Emissions
Aldehydes na 0,16 0,04 - 0, l I 0104 0,15 0103 0,OI
CO 54,O 16,9 28,O 24,O 1018 13,3 12,O
Ald6hydes na 4 0 ,7 2,8 0,3 3
CO 013 016 016 0,8 0,4 0,7
7986-90 I ethanol 90 / ethanol 86
HC 1 NOx
7990 1990-92 1992
4,7 l16 2,4 2,1 l l 3 1 ,4 12
HC 0,3 017
ethanol 90 /gasohol 90 ethanol 92 / ethanol 90 ethanol 92 /gasohol 92
1 2 1,2 1,6 2,0 1 2 114 7,4 a 5 016
3 I 9 5,s
NOx 1 0,8
0,6 0 5
OI8 0,9 0,5 1,2
I 0,9 0,4 018
quantify due to lack of reliable data concerning the exact stirface of deforested land and the biomass densities of the different kinds of forests and savannahs affected. Within the wide spectrum of figures found in the available literature, the estimates (Reis 1992) shown in Table 4 supply an order of magnitude of this phenomenon.
Table 4 - Amazon Deforestation and C02 Emissions Year Area Annual Increase Annual CO, Emissions
(hectares) (%) (hectares) (Mt C) (% of World) 7978 15,291 3.1 7988 37,763 7.7 2,247 3 10-450 4.4-6.2 7 989 40,143 8.2 2,380 330-480 4.6-6.6 7990 41,525 8.5 1,381 190-270 2.7-3.8 7991 42,635 8.7 1,110 150-220 2.2-3.1 Note: MtC = million tons of carbon. Source: Reis (1 992).
Present CO, emissions due to energy consumption are considerably lower. They were estimated by PPE/COPPE/UFRJ using a methodology based upon OECD emission coefficients (OECD 1991) except for bionlass hels which were disaggregated in order to establish more appropriate specific coefficients for wood and charcoal (Pinguelli, La Rovere, Legey & al. 1992). Our estimates give an evolution from 39MtC in 1970 to 67MtC in 1980 and 73MtC in 1990. This corresponds to roughly 1% of total global enussions, ranking Brazil between the fifteenth and the twentieth place in the world for C02 emissions due to energy consumption. Table 5 shows the share of energy sources and economic sectors in the current Brazilian C02 emissions from energy use.
Natural Gas TOTAL
Table 5 - CO, emissions due to Energy Consumption in Brazil - 1990 ( MtC/year and % )
Economic Sector Industry Transport Domestic Agriculture Energy Conversions Energy Sector Commercial/Public
Source : Pinguelli, La Rovere,
Energy Source Oil Wood Coal Charcoal
MtC/year 42 12 8.5 7.5
% 58 16 12 10
The present profile of CO, en~issions due to energy consumption is vely low indeed, in regard not only to population (144 million) but also to economic activity ($350 billions of GDP): 1990 figures are 0.5tC/year/capita and O.ZkgC/$ of GDP. To put it on an illtenlational perspective, Brazilian CO, emissions per Mwh of electricity generated are more than ten times less than present U.S. levels and in the car transportation sector C02 emissions per energy used are half of U.S. figures. This can be explained by the very large share (60%) of renewables in the present Brazilian energy balance. Hydropower accounts for the overwhelming majority (94%) of electricity generation. Ethanol from sugar cane secures more than half of the energy consunled by car tra~~sportation. Sugar cane bagasse supplies 6% of the overall Brazilian energy balance (SNEIMME 1992). Renewable firewood and forest wastes are estimated to provide up to 80% of domestic woodfie1 consun~ptio~~. Industry has become the larger consumer of primary wood (62% of its energy content) to meet 32% of its heat demand, ~llai~lly because of the important role of charcoal as a fuel and feedstock for pig iron ma~~ufacturing (Nogueira & La Rovere, forthcoming). Up to 20% of the woodfuel and up to 30% of the charcoal used in industry are estimated to be renewably produced. \
On the other hand, given the huge amount of natural resources available in the count~y, the potential for renebable energy production is far from being tapped. This can be well illustrated by looking to the long- run prospects (La Rovere 1992a).
3.2. Carbon Emissions and Ethanol Production and Use in Brazil. The net C02 emissions from etl~anol in Brazil has been well assessed by De Carvalho Macedo (1992). Accounti~lg for the quantity of fossil fuels used in the productio~l of ethanol shows that tlle energy balance is considerably positive due to the existence of a large supply of cane bagasse used as he1 in the process. The energy used from fossil sources in the whole process is 27iMJlt cane, of which 214MJ is used in agriculture (the maill part being consunled in the productioll of fertilizers for cane culture) and 57MJ, in industry. This value correspo~lds to a ratio of renewable energy yroducedlnon renewable energy conswned of 81 1, and a productioll of 5.4kgC/t cane (with 0.02tClGJ for diesel or fuel oil). The carbon released in the atmosphere when bagasse and ethanol are co~lsu~lred for fuel is compensated by a11 equivalent quantity of carboil absorbed by sugar cane during its growth. On an average, distilleries (annexed and autonomous) are now able to save 8% of the bagasse yroduced, whlch they sell to other i~ldustries (Table 6). Accoullti~lg also for this qurult~ty of bagasse used as c? fuel and the ethanol consumed by cars - both correspo~lding to avoided emissions of C by substituting fossil fuels - Dc Carvalho Macedo (1 992) gives the following results sumllarized in Table 6, using 1990-9 1 as a base season.
Table 6 - Brazil: Net CO, Emissions due to Sugar c a n e Production a n d Use, 1990-91
This total of 9.45MtC for the year 1990-9 1 corresponds to almost 13% of the total enlissions of carbon due to energy consumption in Brazil in 1990 (Table 5). Accounting only for the substitution of gasoline the use of etlmnol has avoided the release in the atnlosyllere of an averase of 5.86MtC/yenr from 1980 till 1990. The results are sulnnlnrized in Table 7 and in Figure 1.
Ethanol substitution for gasoline Bagasse substitution for fuel oil in other industries Fossil fuel utilization in sugar cane industry Net contribution (uptake)
MtC/year - 7.41 - 3.24 + 1.20 - 9.45
Source: De Carvalho Macedo 1992.
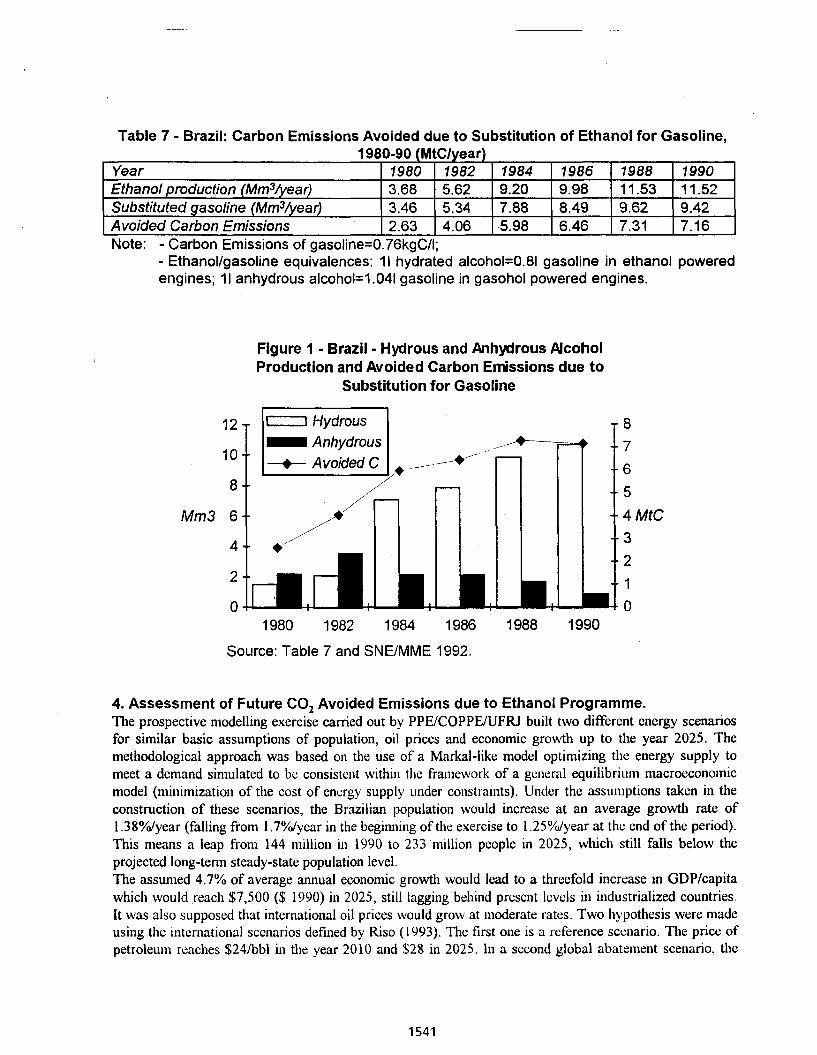
Table 7 - Brazil: Carbon Emissions Avoided due to Substitution of Ethanol for Gasoline,
Note:
1980-90 (MtClyear)
- Carbon Emissions of gasoline=0.76kgC/I; - Ethanollgasoline equivalences: 11 hydrated alcohol=0.81 gasoline in ethanol powered engines; I I anhydrous alcohol=I .041 gasoline in gasohol powered engines.
Figure I - Brazil - Hydrous and Anhydrous Alcohol Production and Avoided Carbon Ennissions due t o
Substitution for Gasoline
Year Ethanol production (Mm3/year) Substituted gasoline (MmVyear) A voided Carbon Emissions
Anhydrous
8 -- - -- 5 Mm3 6 - - - - 4 MtC
4.- +' - - 3 - - 2
2 - - -- 1
0 1 -0
1980 3.68 3.46 2.63
1984 9.20 7.88 5.98
1980 1982 1984 1986 1988 1990
Source: Table 7 and SNEIMME 1992.
1988 11.53 9.62 7.31
1982 5.62 5.34 4.06
1986 9.98 8.49 6.46
4. Assessment of Future CO, Avoided Emissions due to Ethanol Programme. The prospective n~odelling exercise carried out by PPEICOPPEIUFRJ built two different energy scenarios for similar basic assumptiolls of population, oil prices and economic growth up to the year 2025. The methodological approach was based on the use of a Markal-like model optimizing the energy supply to meet a demand simulated to be consistent within the framework of a general equilibriiuli macroeconornic model (minimization of the cost of energy supply i~nder constraints). Under the assumptions taken in the construction of these scenarios, the Brazilian population would increase at an average growth rate of 1.38Ydyear (falling from 1.7%/year in the beginning of the exercise to 1.25YJyear at the end of the period). This means a leap from 144 lnillion in 1990 to 233 'million people in 2025, which still falls below the projected long-term steady-state population level. The assunled 4.7% of average annual economic growth would lead to a threefold increase in GDPIcapita which would reach $7,500 ($ 1990) in 2025, still lagging behind present levels in industrialized countries. It was also supposed that international oil prices would grow at moderate rates. Two hypothesis were made using the international scenarios defined by k s o (1993). The first one is a reference scenario. The price of petroleu~n reaches $24/bbl in the year 2010 and $28 in 2025. In a second global abatement scenario, the
1990 11.52 9.42 7.16
price of petroleum is limited to $21/bbl in the year 2010 and $23/bbl in 2025, due to environmental constraints on its use worldwide. In our projections, Scenario 1 provides a reference case for comparative analysis. It assumes the energy demand and supply pattern of 1990 to be kept until 2025. Only a small adjustment was made allowing for a slight (10%) decrease in the energy intensity of the Brazilian economy due to endogenous technical progress trends. According to the present trend, the Ethanol Programme would be phased out. All new cars are gasohol powered. The proportion of anhydrous alcohol in gasoline being maintained at O- 10%. The number of pure ethanol powered cars is gradually decreasing due to the scrapping of the fleet and the freezing of alcohol production, stopping definitely by the year 20 10. In Scenario 2, the strategy of extending the Ethanol Programme to fight global climate change is assessed. Ethanol production fiom sugar cane is strongly increased to reach 22% of ethanol blending in gasohol and to fuel 30% of the car fleet with pure alcohol in the year 2010. Further extension of the Progrannle in the future is also assessed by testing the effect of doubling the share of ethanol-powered cars: 60% of the fleet in 2025. This choice allows us to figure out a larger range of costs for an ethanol oriented policy, purposely eliminating values resylting from the calculatio~~s of averages on an extended period of t h e . Excess electricity would be supplied to the grid by alcohol distilleries using high efficiency cogeneration schemes fed by sugar cane bagasse. As far as productivity assumptions are concerned, the reduction of ethanol production cost is considered as being merely the result of an increase in the productivity of sugar cane per hectare. Actually, the production cost of ethanol is constituted by two thirds of agricultural costs to grow sugar cane. Till 2010, the only rate of agricultural productivity increase assumed is that average country yield will reach the present maximum yield attained by the most efficient sugar cane refineries in the State of Sao Paulo. Between 2010 and 2025, no additional productivity gains are supposed to take place. Therefore, rather conservative hypothesises are used. Gross estimates of increase in land for sugar cane are based on land cultivated for ethanol used for energy purposes and on the following average yields: 75t/ha/year of sugar cane; 721 ethanol per tome of sugar cane. The comparative analysis of the results of the two scenarios is presented in Table 8. These results clearly i~ldicate the potential role of the Ethanol Progranune to curb the increase of CO, emissions from the energy system in Brazil. Ethanol substitution for gasoline and secondary bagasse cogeneration substitution for coal and oil-fired power generation allow for significant decrease of fossil fuel consumption and their corresponding emissions. Reductions 111 the range from 8 to 10% of CO, emissions in the year 2010 can be obtained at reaso~lable costs: froill 25.5$/tC in the low oil price scenario down to less than 2.l$/tC with only a modest increase in oil prices. This also shows the high sensitivity of CO, emissio~ls abatement costs to changes in the reference energy prices scenario. Pursuing and deepening this strategy to the year 2025 would allow for substantially increasing the amount of avoided C02 einissions (77 to 8 lMtC/year) more than doubling the corresponding rates of reduction of total CO, emissions from the energy system, increased to a level around 18%. But the incremental costs of achieving this level of CO, emissions reduction would also be inuch higher, ranging fro111 8 1.1 to 106.5$/tC according to the oil prices estimates. Other measures directed to avoid C02 emissions would certainly be more cost-effective in this case, but such a strategy remains a valid option if the need for larger reductions of CO, emissions arises or if a higher oil prices scenario materializes. Of course, the picture would look much Itlore promising if the pace of technological ~~ulovation in the hture leads to larger productivity gains in ethanol production than assuiued here.
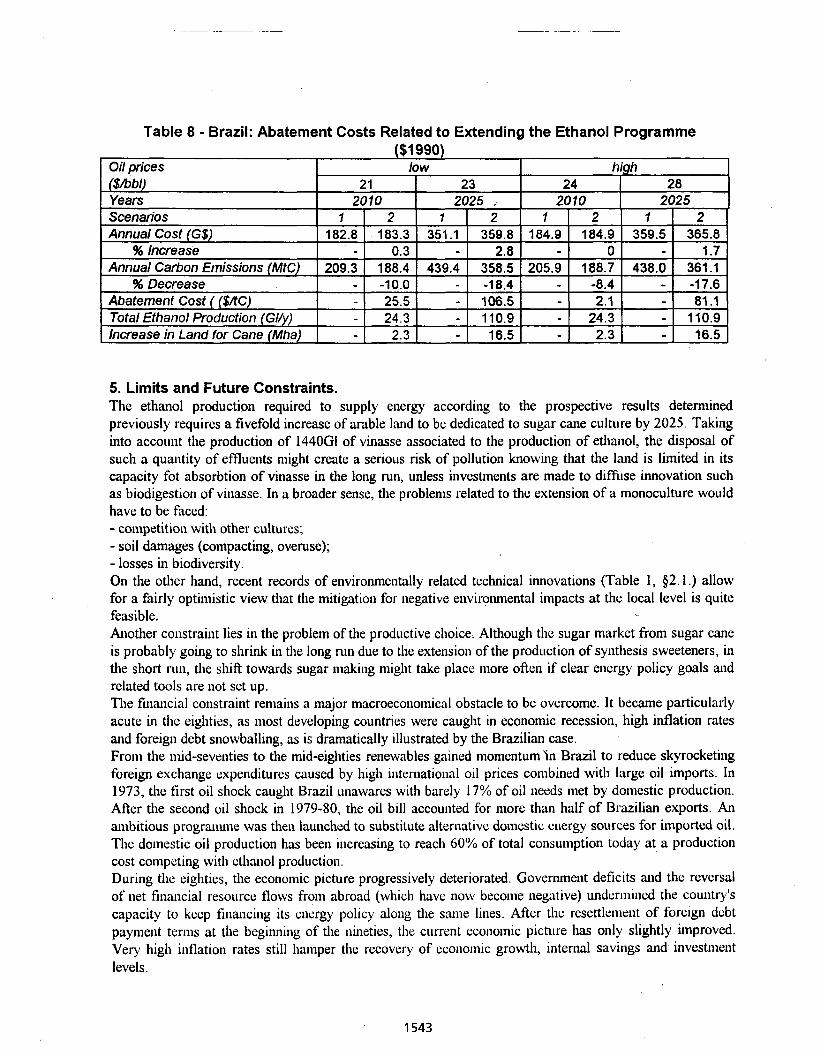
5. Limits and Future Constraints. The ethanol production required to supply energy according to the prospective results detern~ined previously requires a fivefold increase of arable land to be dedicated to sugar cane culti~re by 2025. Taking into account the production of 1440GI of vinasse associated to the production of ethanol, the disposal of such a quantity of effluents might create a serious risk of pollution knowing that the lcand is limited in its capacity fot absorbtion of vinasse in the 1o11g run, unless investlnents are made to difhse innovat~on such as biodigestion of vinasse. In a broader sense, the problems related to the extension of a monoculture woi~ld have to be faced: - co~llpetition with other cultures; - soil damages (compacting, overuse); - losses in biodiversity. On the other hand, recent records of environmentally related technical innovations (Table 1, $2.1.) allow for a fairly optimistic view that the mitigation for negative environmental impacts at the local level is quite feasible. Another co~lstraillt lies in the problem of the productive choice. Although the sugar market from sugar cane is probably going to shrink in the long run due to the extension of the production of synthesis sweeteners, in the short run, the shift towards sugar nlakilig might take place more often if clear energy policy goals and related tools are not set up. The financial constraint remains a major macroeconornical obstacle to be overcome. It became particularly acute in the eighties, as most developing countries were caught in economic recession, high inflation rates and foreign debt snowballing, as is dramatically illustrated by the Brazilian case. From the mid-seventies to the mid-eighties renewables gained momentum In Brazil to reduce skyrocketing foreign exchange expenditures caused by high i~lternational oil prices conlbined with large oil imports. In 1973, the first oil shock caught Brazil unawares with barely 17% of oil needs met by domestic production. After the second oil shock in 1979-80, the oil bill accou~lted for more than half of Brazilian exports. An ambitious progranune was then launched to substitute alternative dolnestic energy sources for imported oil. The domestic oil production has been increasing to reach 60% of total consulnption today at a production cost competing with ethanol production. During the eighties, the economic picture progressively deteriorated. Government deficits and the reversal of net finalcia1 resource flows from abroad (which have now become negative) underlnined the country's capacity to keep financing its energy policy along the sane Ilnes. After the resettlement of fore~gn debt pay~nent ternls at the beginning of the nineties, the current economic picture has only slightly improved. Very high inflation rates still hamper the recovery of ecollolnlc growth, internal savings and investment levels.
Table 8 - Brazil: Abatement Costs Related to Extending the Ethanol Programme ($1 990)
Oil prices ($/bbl) Years Scenarios Annual Cost (G$)
% Increase Annual Carbon Emissions (MtC)
% Decrease Abatement Cost ( ($kc) Total Ethanol Production (Gl/y) Increase in Land for Cane (Mha)
high low 24
2010 28
2025 2 1
2010 1
184.9
205.9 - - - -
1 359.5
- 438.0
- - - -
1 182.8
209.3 - - -
23 2025 .
2 184.9
0 188.7
-8.4 2.1
24.3 2.3
2 365.8
1.7 361.1 -17.6 81.1
110.9 16.5
2 183.3
0.3 188.4 -10.0 25.5 24.3
2.3
1 351.1
439.4 - - - -
2 359.8
2.8 358.5 -18.4 106.5 110.9 16.5
Short-term prospects of the Brazilian energy policy now point in exactly the opposite direction of the scenario which would minimize C02 enussions favouring investments in fossil fuel, an option which also couples with the availability of foreign fbnding facilities. The option of ethanol production for the supply of liquid he1 is limited in its development due to various dimensions (technical, environmental, financial, and social) affecting the availability of production factors, the capacity of access to information (especially techfiological) of the sugar cane refineries and the orientation of an incentive system. Apart from the examples detailed at the beginning of this section, other obstacles l~arnper the dissemination of appropriate technology for the required productivity increase of the ethanol industry. Among them, one can mention insufficient research and development efforts and the lack of larger dissemination of inforn~ation and the absence of an adequate institutional framework.
Conclusion
The United Nations Framework Conve~ltiocl on Clinlate Cl~alge signed by 154 countries clearly states that developing countries must be colnpensated for the "agreed full increme~ltal costs" incurred to limit their greenhouse gas e~nissions (United Nations 1992). Nevertheless it should be avoided to submit general interests of Brazilian society and other developing countries to meeting preservation targets of the global environment, wheil lt is nlainly nle~laced by pollutio~l originated from industrialized countries. On the other hand, there also exists large scope for a positive synergy between a sustainable energy developmei~t strategy for Brazil and the prevention of global climate change. To this end, alternatives for tapping the renewable energy potential should include appropriate measures to minimize eventual negative social and ecological impacts at the local and regional levels, besides demonstrating their economic cost- effectiveness. The case of the Ethanol Programme well illustrates this point. Taking into account the due precautioils to minimize local and regional environnlental costs, increasing ethanol- and bagasse production from sugar cme will surely contribute to meet national development objectives and silnultaneously Illnit CO, enlissions. Short-ten11 constraillts to promote sustainable energy development and also to contribute to preventing global ciill~ate changes should not be underestimated, however. As mentioned, recent trends of the Brazilian energy policy point in exactly the opposite direction, due to the lack of capacity for funding large investments. The transfer of rul adequate amount of financial resources from industrialized countries in appropriate soft tenns is thus required in order to make a positive contribution of Brazilian energy system to curb the increase of t l~e gree~house effect feasible. Of course the responsibility of goverm~lants fro111 developing coui~tries must be engaged. In the case of the Brazilian Ethanol Programme this means that goverlu1lent efforts should be directed to pro~note the production and use of ethanol and bagasse. This includes the adoption of appropriate energy pricing policies, n~eclxulisms for information dissen~illation, adequate institutiotlal building, providing sofi funding facilities a~ld measures to foster research and development efforts in this area. In this connection it should be wanled that co~nplete deregulation and privatization of energy sectors will hardly allow for removing non-economic barriers to sustainable energy development strategies. On the other hand, the industrialized countries must be made responsiblr: for two crucial points: ensuring a11 adequate level of energy prices and chmlelliog an appl-opriate flow of filla~lcini resources towards the sustainable energy developmeilt of the South. Prices of fossil fuols should bc kept suffic~ently high to reflect their overall ei~viro~unental costs and shape the orientation of technological progress in the industrialized world. A shift to more efficient end-use energy technologies and renewnbles in developing cou~ltries is heavily dependent on a similar lllove in the North. That is a major case for the adoption of a carbon tax on fossil fuels in industrialized countries. Finally, the North has a major role to play in helping developing
countries to overcome their short-term financial constraints to invest in C02 enlissions abatement strategies. The Brazilian case well illustrates the large C02 emissions abatement potential at reasonable costs if investments in ethanol production could benefit from international funding. Support for the Ethanol Programne from agencies such as the World Bank has been rather insufficient in the past. Besides the reshaping of their actions, new mechanisms to fund "small-regret" sustainable energy development strategies are sorely needed. Regarding this, the implementation of the United Nations Convention on Global Climate Change has a crucial role to play. A first step towards this end would be the allocation of a considerably increased amount of financial resources to the Global Environment Facility (GEF) and its use to support the viability of these strategies, in Brazil as in other developing countries.
References
AIAAISOPRAL 1992. Ethanol, Energy source jor a sustainable society. Sao Paulo: AIAAISOPRAL.
ANFAVEA 1992. Statistical Yearbook. Sao Paulo: Anfavea, Industria Auto~nobilistica Brasileira
Catao Aguiar, S., E.L. La Rovere and P. Audinet 1992. Sugar cane bagasse as an energy source in Brazil. k o de Janeiro: Unpublished.
Bohm, G.M. 1992.. "Energia da biomassa e meio ambiente: experiencia do Laboratorio de poluiqao atmosferica experimental da Faculdade de Medicina da USP." Proceedings of the Seminar "A energia da biomassa, c/esenvolvimento e meio ambiente". Rio de Janeiro: Conselho Nacional de Industrias.
CETESB 1992. Controle da polui~ao veicular no Brasil. Sao Paulo: Cetesb.
COPERSUCAR 1989. Proalcool, Fundomentos e perspectivns. Sao Paulo: Copersucar.
COPERSUCAR 1992. Kelatorio anual, 1991/1992. Sao Paulo: Copersucar.
De Carvalho, J. (Ed.) 1992. Desenvolvimenlo em harmonin com o meio ambienle. Rio de Janeiro: Fundaqao Brasileira para a conservaqao da natureza.
De Carvalho Macedo, I. 1992. "The sugar cane agro-industry. Its contribution to reducing C02 emissions in Brazil." Biomass & Bioenergy, 3/2:77-80.
Grassi, G. & al. (fortl~co~ming). Proceedings of the 7th E.C. Conference on Biomass for energy, industry and environment. Florence: Elsevier Applied Science Publishers.
Grassi, G., A. Collina, H. Zibetta (Eds.) 1992. Proceedings ofthe 6th E.C. Conference on Biomass for energy, indzrstry and environment. Bruxelles: Elsevier Applied Science.
Kirchhoff, V.W.J.H. 1991. As queimadas da cann. Sao Jose do Carnpos: Transtec Editorial.
Kirchhoff, V.W.J.H. & al. 1991. "Enhancements of CO and 0 3 from bumings in sugar cane fields." Journal of Atmospheric Chemistry, 12:87- 102.
La Rovere, E.L. 1993. "Limiting the Elnission of Greenhouse Gases in Brazil". C p 2 News (The Newsletter of UNEP Collaborating Centre on Energy and Environment), 4: 4-5.
La Rovere, E.L. 1992. "Curbing the increase of greahouse effect through energy production from renewable biomass." Proceedings of [he Ezrropean Forzrm on Electricity production from Biomass. Bn~ssels: Conunission of European Co~lununities.
La Rovere, E.L. 1992a (October). "La rnise en valeur des potentiels energetiqoes des ressources renouvelables - une strategie dt: lutte contre I'augmentatioo de I'effet de sene: le cas du Brisil." Proceedings of International Workshop on "Prospective Modelling, Decision Criteria and International Negotiation on Sustainable Development: the Case of Climaie Change. Paris: CIRED.
La Rovere, E.L. 198 1 (July). "Les coiits sociaux et ecologiques du Plan Alcool bresilien." Economie et Humanisme, 260: 36-47.
La Rovere, E. and G. Krause 1992. "The use of combined cycle systems for excess electricity generation in the sugar industry.". In GRASS1 & al. 1992; 897-903.
Navarro, L. 1992. "Cana de aqucar: base auto-sustentavel para o suprimento de combustiveis". In De Carvalho, 1992, 23-35.
Nogueira, L.A.H. and E.L. La Rovere 1992. "Supporting the Fuelwood Transition in Brazil : the Brazilian Technical Cooperation on Dendroenergy." In Grassi & al. forthcomming.
OECD 1991. Estimation of Greenhouse Gas Emissions and Sinh. Final Report from OECD Experts Meeting, 1 8-2 1 February 199 1, prepared for IPCC, revised August 199 1.
Ogden, I.M., R.H. Williams and M.E. Fulrner M.E. 1990. Cogeneration applications of biomass goslfier/gos turbine technologies in the cane sugar and alcohol industries. Princeton: Center for Energy and Enviro~unental Studies, Princeton Uiliversity.
Pinazza, A.H. 1991. "0 process0 de integraqao da P&D junto ao coinplexo aqucareiro." Anais do Simposio Nocionol de Administm~ao em CBT. k o de Janeiro.
Pinguelli, L.P., E.L. La Rovere, L.F.L. Legey & nl. 1992. Etnivsoes de Dioxido de Corbono no Sisterno Energetico: Estintntivo da Contribuipo Llrosi1eit.a porn o Efeito Estzrfn r Cornparapes Internacionnis. Rio de Janeiro: PPEICOPPEIUFRJ.
Rask, K. 199 1. Eviclence of the En~pirical Relevcmce of the Infrrnt Industry Argumenr ji)r the Protection of Brazilian Elhnnol Prodtrction. New York: Colgate University.
h s k , K . 199 la. The Social Costs ofYrodrrcing Elhano1 From Sugar cone in Brazil: Evidence from 1978- 1987. Discussion Paper No. 9 1-07. New York: Colgate University.
Rask, K. 199 1 b. The strzrcture of Technology in Brnzilinn Sugor cane Prothrction, 1975-1987- Discussioll Paper No. 9 1 - 10. New York: Colgate University.
Reis, E . 1992. An Econometric Model ofA~nozon Defbrestotion. Rio de Janeiro: IPEA.
RISO 1993. UNEP Greenhouse Gas Abatement Costing Studies. Methodolog~cnl Framework fir National Greenhouse Gns Aborernent Costing S/rrdies. Phase two guidelines. Roskilde: Riso.
SNEIMME 1992. Balan~o energetic0 national, 1992. Brasilia: Ministerio de Minas e Emrgia.
United Nations 1992 (May) United Notions Framework Convention on Climote Change, NAC2371L14. Geneva.
THE IMPACT OF A 50% REDUCTION OF SOLID WASTE DISPOSAL IN CANADA ON METHANE EMISSIONS FROM LANDFILLS IN 2000
Lynne M.F. Patenaude, M.A.Sc., Project Engineer; Gordon T. Owen, M.Sc., AIHead, Waste Management Technologies Section,
Environment Canada, Ottawa, Ontario, Canada, KIA OH3; Jody A. Barclay, B.Sc., Research Officer, Energy, Mines and Resources Canada,
Ottawa, Ontario, Canada, KIA OE4.
Abstract
~anada's Green Plan established a goal of 50% reduction in municipal solid waste (MSW) disposal between 1988 and the year 2000. Canada has also committed to stabilizing greenhouse gas emissions at 1990 levels by 2000. MSW landfills are targeted since they account for a significant portion of anthropogenic methane emissions.
Current composition and quantities of MSW were estimated. Using five scenarios for achieving a 50% reduction of waste disposed, the quantities and composition of waste managed were estimated through to the year 2000. A first-order decay model was used to estimate methane emissions from landfills for each scenario by varying the methane generation potential (Lo) based on the amount of biodegradable carbon in the MSW stream.
Despite the overall reduction in waste, methane emissions are still projected to increase between 1990 and 2000 for scenarios with 25 to 45% of waste going to landfill in-2000. The estimated increases in methane emissions range from 2% for the high composting scenario to 16% for the high landfill scenario. In general, emissions peak during the 1990's and are decreasing by 2000. The projected increase in emissions is due to the 65-75 % contribution of MSW landfilled before 1990.
In conclusion, a significant reduction in methane emissions from landfills by 2000 will require methane recovery systems in addition to MSW reduction initiatives.
1
Introduction
It is generally accepted that emissions of methane (CH,), carbon dioxide (Cw and nitrous oxide (N,O) influence global climate through the greenhouse effect. The management of municipal solid waste (MSW), including collection, disposal, treatment, and utilization results in emissions of greenhouse gases: c&, C 4 , and N20. The biomass component of MSW, mainly paper, wood, food and yard wastes, produces CH, and C02 during anaerobic decomposition in landfill, while C02 is produced from all but the inert components of MSW during incineration.
Canada has committed to reducing the disposal of MSW by 50% by the year 2000, while also stabilizing greenhouse gas emissions at 1990 levels. In Canada's 1990 inventory of greenhouse gas emissions (Jaques, 1992), methane emissions from MSW landfills were estimated to account for 38% of methane emissions in Canada due to human activity (anthropogenic sources).
A study was initiated by Environment Canada and Energy, Mines and Resources Canada to investigate the impact of MSW management on greenhouse gas emissions. The first phase of the study examined how achieving the 50% MSW reduction goal will affect methane emissions from landfills in the year 2000 (Proctor and ~edfern Limited and ORTECH International, 1993). Several scenarios for achieving the 50% reduction goal were considered. The results of this phase are repofted in this summary.
Further work, currently nearing completion, examines the direct and indirect impacts on greenhouse gas emissions of waste diversion, utilization, and disposal processes, due to process energy use, raw material displacement and energy displacement, etc. A life-cycle approach will be used for this analysis. Waste management processes being considered include reduction at source, recycling, composting , fermentation, pyrolysis and incineration. This work should provide a valuable decision-making tool to aid in minimizing the greenhouse gas impacts of MS W management.
Municipal Solid Waste (MSW) Generation
To predict the methane emissions from landfills between 1990 and 2000, it was necessary to characterize the quantity and composition of MSW from 1950 to 2000. Unfortunately, accurate data on MSW generation are not readily available. For the period 1950-1988, estimates made by Levelton (199 1) were used. More accurate data for the province of Ontario for the period 1988-1990 were used to estimate residential MSW generation in each province, based on population, per capita income and urbanlrural split. Industrial, commercial and institutional MSW generation esti.nates by province were developed from earlier work.
Achieving 50% Reduction in MSW by 2000
Several different scenarios were considered by which the 50% reduction goal could be achieved using common waste management techniques. In each scenario, the proportion of MSW diverted from disposal through reduction at source, reuse, recycling and composting was estimated.
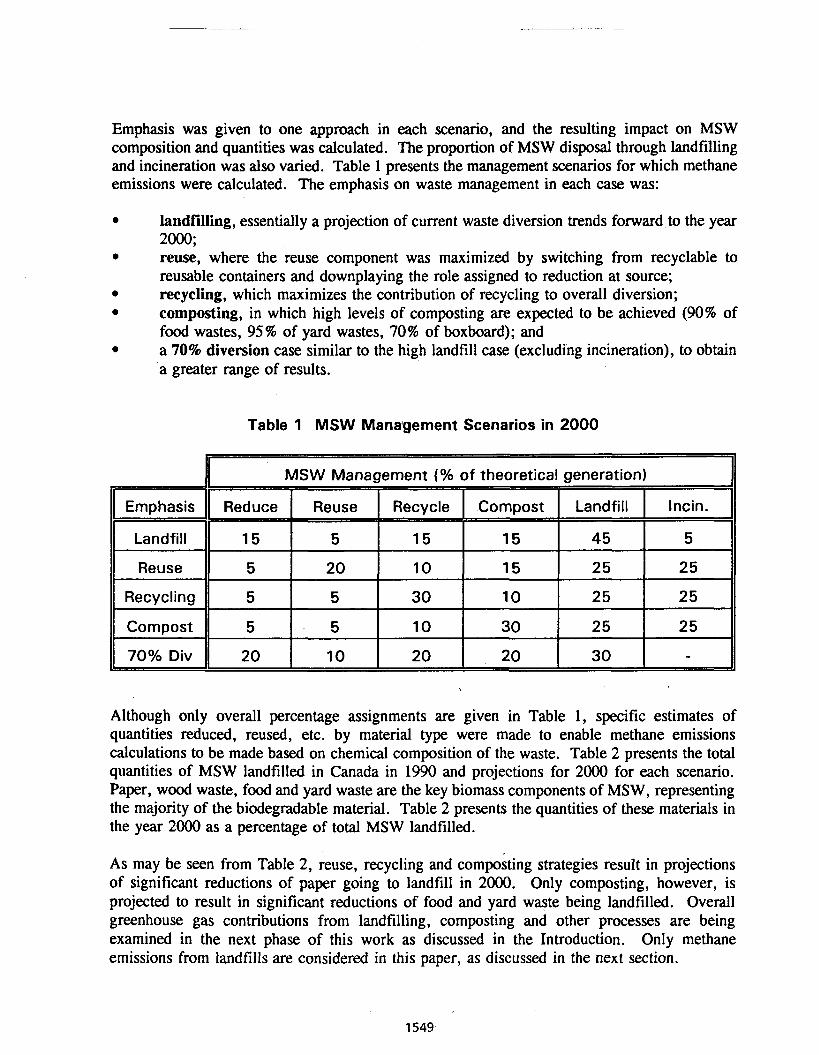
Emphasis was given to one approach in each scenario, and the resulting impact on MSW composition and quantities was calculated. The proportion of MSW disposal through landfilling and incineration was also varied. Table 1 presents the management scenarios for which methane emissions were calculated. The emphasis on waste management in each case was:
landfilling, essentially a projection of current waste diversion trends forward to the year 2000; reuse, where the reuse component was maximized by switching from recyclable to reusable containers and downplaying the role assigned to reduction at source; recycling, which maximizes the contribution of recycling to overall diversion; composting, in which high levels of composting are expected to be achieved (90% of food wastes, 95% of yard wastes, 70% of boxboard); and a 70% diversion case similar to the high landfill case (excluding incineration), to obtain a greater range of results.
Table 1 MSW Management Scenarios in 2000
Although only overall percentage assignments are given in Table 1, specific estimates of quantities reduced, reused, etc. by material type were made to enable methane emissions calculations to be made based on chemical composition of the waste. Table 2 presents the total quantities of MSW landfilled in Canada in 1990 and projections for 2000 for each scenario. Paper, wood waste, food and yard waste are the key biomass components of MSW, representing the majority of the biodegradable material. Table 2 presents the quantities of these materials in the year 2000 as a percentage of total MSW landfilled.
IEmphasisI
As may be seen from Table 2, reuse, recycling and composting strategies result in projections of significant reductions of paper going to landfill in 2000. Only composting, however, is projected to result in significant reductions of food and yard waste being landfilled. Overall greenhouse gas contributions from landfilling, composting and other processes are being examined in the next phase of this work as discussed in the Introduction. Only methane emissions from landfills are considered in this paper, as discussed in the next section.
MSW Management (% of theoretical generation)
Incin.
5
25
25
25
-
Reduce
15
5
5
5
70% Div 20
Reuse
5
20
5
5
10
Recycle
15
10
30
10
20
Compost
15
15
10
30
20
Landfill
45
25
25
25
30
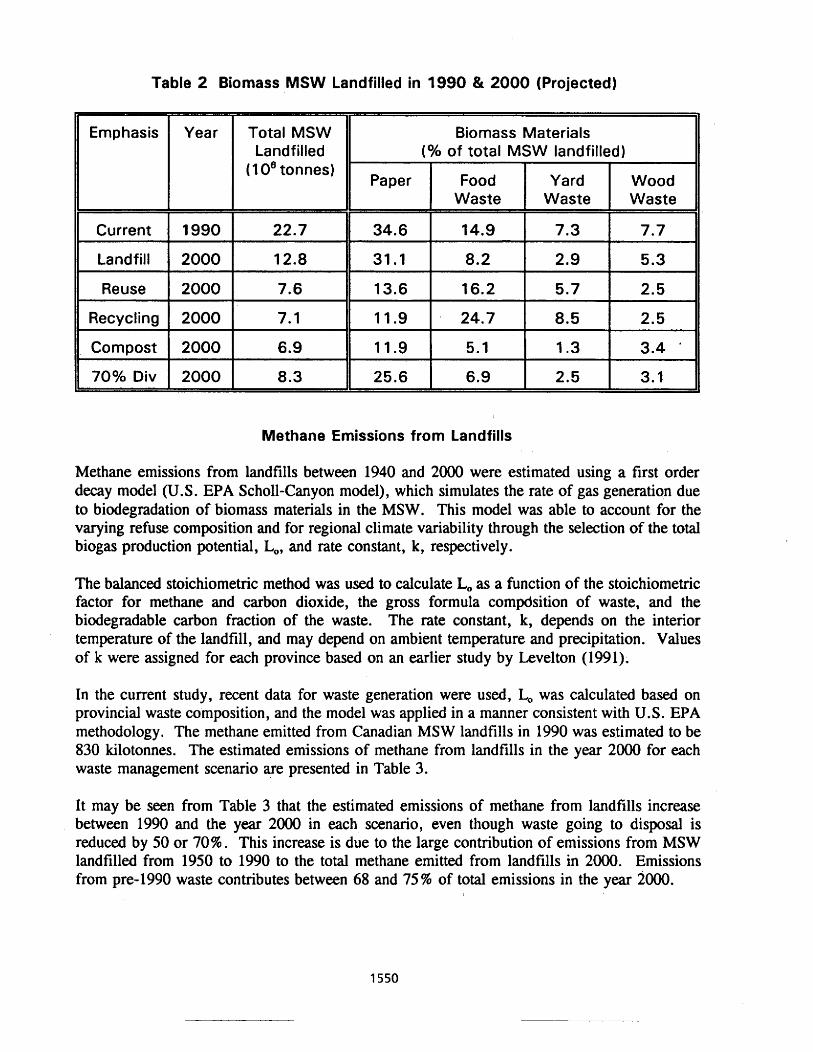
Table 2 Biomass MSW Landfilled in 1990 & 2000 (Projected)
Methane Emissions from Landfills
Methane emissions from landfills between 1940 and 2000 were estimated using a first order decay model (U.S. EPA Scholl-Canyon model), which simulates the rate of gas generation due to biodegradation of biomass materials in the MSW. This model was able to account for the varying refuse composition and for regional climate variability through the selection of the total biogas production potential, Lo, and rate constant, k, respectively.
The balanced stoichiometric method was used to calculate Lo as a function of the stoichiometric factor for methane and carbon dioxide, the gross formula compdsition of waste, and the biodegradable carbon fraction of the waste. The rate constant, k, depends on the interior temperature of the landfill, and may depend on ambient temperature and precipitation. Values of k were assigned for each province based on an earlier study by Levelton (1991).
In the current study, recent data for waste generation were used, Lo was calculated based on provincial waste composition, and the model was applied in a manner consistent with U.S. EPA methodology. The methane emitted from Canadian MSW landfills in 1990 was estimated to be 830 kilotonnes. The estimated emissions of methane from landfills in the year 2000 for each waste management scenario are presented in Table 3.
It may be seen from Table 3 that the estimated emissions of methane from landfills increase between 1990 and the year 2000 in each scenario, even though waste going to disposal is reduced by 50 or 70%. This increase is due to the large contribution of emissions from MSW landfilled from 1950 to 1990 to the total methane emitted from landfills in 2000. Emissions from pre-1990 waste contributes between 68 and 75% of total emissions in the year 2000.
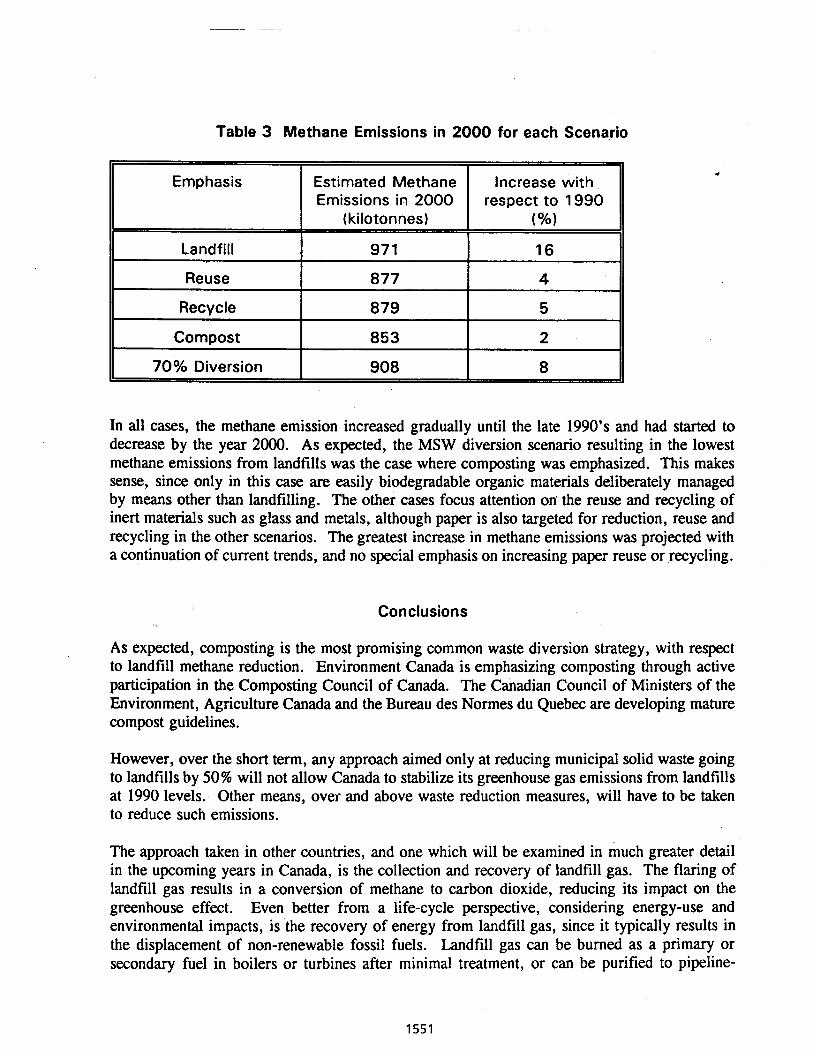
Table 3 Methane Emissions in 2000 for each Scenario
Emphasis
Landfill
Increase with respect to 1990
(%I
Estimated Methane Emissions in 2000
(kilotonnes)
971
Reuse
Recycle
Compost
70% Diversion
In all cases, the methane emission increased gradually until the late 1990's and had started to decrease by the year 2000. As expected, the MSW diversion scenario resulting in the lowest methane emissions from landfills was the case where composting was emphasized. This makes sense, since only in this case are easily biodegradable organic materials deliberately managed by means other than landfilling. The other cases focus attention on' the reuse and recycling of inert materials such as glass and metals, although paper is also targeted for reduction, reuse and recycling in the other scenarios. The greatest increase in methane emissions was projected with a continuation of current trends, and no special emphasis on increasing paper reuse or recycling.
877
879
853
908
Conclusions
As expected, composting is the most promising common waste diversion strategy, with respect to landfill methane reduction. Environment Canada is emphasizing composting through active participation in the Composting Council of Canada. The Canadian Council of Ministers of the Environment, Agriculture Canada and the Bureau des Normes du Quebec are developing mature compost guidelines.
However, over the short term, any approach aimed only at reducing municipal solid waste going to landfills by 50% will not allow Canada to stabilize its greenhouse gas emissions from landfills at 1990 levels. Other means, over and above waste reduction measures, will have to be taken to reduce such emissions.
The approach taken in other countries, and one which will be examined in much greater detail in the upcoming years in Canada, is the collection and recovery of landfill gas. The flaring of landfill gas results in a conversion of methane to carbon dioxide, reducing its impact on the greenhouse effect. Even better from a life-cycle perspective, considering energy-use and environmental impacts, is the recovery of energy from landfill gas, since it typically results in the displacement of non-renewable fossil fuels. Landfill gas can be burned as a primary or secondary fuel in boilers or turbines after minimal treatment, or can be purified to pipeline-
quality gas by removal of the carbon dioxide.
The collection and recovery of landfill gas is occurring at several landfills in Canada. Some of the largest landfill gas recovery projects are at Clover Bar in Edmonton, Alberta; Miron in Montreal, Quebec; and Brock West in Toronto, Ontario. A study will be conducted this year, in conjunction with interested stakeholders, to evaluate the technical, environmental and socio- economic barriers to more widespread application of landfill gas recovery. It is anticipated that concerted efforts to identify and remove controllable barriers to landfill gas recovery will allow Canada to mitigate the impact on the greenhouse effect due to the landfilling of municipal solid waste and other biomass wastes.
Anaerobic digestion will likely be examined in more detail in upcoming work, since the production and utilization of high quality methane for energy applications from organic waste decomposition is the primary purpose of this process. It is a much more controlled and efficient means to produce high quality methane from MSW biomass when compared to landfilling.
References
Jaques, A .P. (1 992), "Canada's Greenhouse Gas Emissions: Estimates for 199OW, Environment Canada, Environmental Protection Series Report EPS 5/AP/4, December.
B. H. Levelton & Associates Limited. (1 99 I), "Inventory of Methane Emissions from Landfills in Canada", Report presented to Environment Canada, June.
Proctor and Redfern Limited and ORTECH International (1993), "Estimation of the Effects of Various municipal Waste Management Strategies on Greenhouse Gas Emissions", Draft Study Report presented to Environment Canada (unpublished), March.
ENVIRONMENTAL ISSUES RELATED TO BIOMASS: AN OVERVIEW
Merritt Hughes Office of Energy
United States Department of Agriculture Washington, D.C. 202 15
Jack W. Ranney Oak Ridge National Laboratory
Oak Ridge, TN 3783 1
Abstract
With public attention increasingly focused on environmentalism and climate change, there is enormous potential for the commercial use of biomass to accelerate. Renewable feedstocks such as biomass can provide more environmentally balanced sources of energy and other non-food products than fossil fuels. Biomass utilization is in a precarious position, however, with public attention increasingly focused on both its potential and the strength of the challenges it faces. The paper is divided into five sections. Section I1 briefly addresses economic environmental issues. The extent to which externalities are accounted for in the market price of fuels plays a significant role in determining both the ultimate size of biofuel markets and the extent of the environmental benefits of feedstock cultivation and conversion processes. Sections 111 through IV catalogue the main hazards and benefits that are likely to arise in the large scale commercialization of biomass fuel and note where the major uncertainties lay. Environmental issues arise with the cultivation of each feedstock and with each step in the process of its conversion to fuel. Feedstocks are discussed in Section 111 in terms of three main groups; wastes, energy crops, and traditional agricultural crops. In Section IV, conversion processes are also divided into three groups, on the basis of the end energy carrier; gas, liquid, and solid and electricity. Section V is devoted to a conclusion and summary.
SECTION I= INTRODUCTION
With public attention increasingly focused on environmentalism and climate change, there is enormous potential for the commercial use of biomass to accelerate. Renewable feedstocks such as biomass can provide more environmentally balanced sources of energy and other non-food products than fossil fuels. At the same time, however, the long history of environmental degradation caused by the combustion of fossil fuel is spurring the rapid development of "clean" fuel technologies. Fossil fuel and related products also have substantially lower market prices than their biomass counterparts. Biomass utilization is in a precarious position, with public attention increasing both its potential and the strength of the challenges it faces.
The environmental case for increased biomass utilization can be made ftom two main arguments. From a long-run perspective, biomass utilization can potentially mitigate global climate change. Substitution of biomass for fossil fuel could contribute significantly to the reduction of greenhouse gases. Biomass will always be potentially more climate neutral than fossil fuel because of its potentially closed carbon cycle. The amount of carbon dioxide released during the combustion of biomass is the same amount it absorbed as it grew. Moreover, certain plants can increase the amount of carbon and nitrogen stored in the soil. Methane, the second most important greenhouse gas, can be significantly reduced by capturing the emissions from decomposing biomass.
Biomass can also potentially reverse local ecosystem degradation on a relatively short time scale. Because energy crops provide relatively consistent ground cover, as well as low chemical inputs, they are potentially a good choice for highly erodible land. Due to their relatively large root mass, many energy crops can potentially play a remediation role, resolving water quality and riparian ecology issues that may occur from large scale intensive monocultures. Likewise, energy crops may be able to provide ecological buffer zones near forests, fly-ways and swamps. Potentially, energy crops may be able to provide an "environmentally friendly" method of stabilizing farm production and prices since a broader range of crop markets naturally leads to increased flexibility in planting and enhanced risk management.
The remainder of this paper is divided into four additional sections. Section I1 briefly addresses economic environmental issues. Biofuels have a natural environmental advantage over fossil fuels. This advantage, however, is generally external to the market pricing system. The extent to which externalities are accounted for in the market price of fuels plays a significant role in determining both the ultimate size of biofuel markets and the extent of the environmental benefits of feedstock cultivation and conversion processes. Sections I11 through IV catalogue the main hazards and benefits that are likely to arise in the large scale commercialization of biomass fuel and note where the major uncertainties lay. Environmental issues arise with the cultivation of each feedstock and with each step in the process of its conversion to fuel. Feedstocks are discussed in Section I11 in terms of three main groups; wastes, energy crops, and traditional agricultural crops. In Section IV, conversion processes are also divided into three groups, on the basis of the end energy carrier; gas, liquid, and solid and electricity. Section V is devoted to a conclusion and summary.
SECTION 11: ECONOMTCS ANX) THE ENVIRONMENT
Most biomass fuel today is produced from agricultural, forestry or municipal waste. The use of fuel derived from biomass waste has a very high environmental benefit because it both substitutes

for fuels that produce more toxic emissions during combustion, and it utilizes a feedstock that in itself is environmentally damaging. The second most common type of biomass used for fuel are traditional agricultural crops. Traditional agricultural crops, such as corn, soybeans or rapeseed also provide the environmental benefit of substituting for more polluting fuel types. Their use, however, is more driven by economic concerns than environmental. Energy crops are the least utilized, and, indeed, the least understood in terms of their environmental impact.
Biomass technologies tend to be expensive. Most biofuel production relies heavily on the use of negative, or zero, feedstock costs. The feedstock with the lowest marginal cost is commercial waste. The use of commercial waste also has a high environmental marginal benefit. These two facts are not unrelated. Waste imposes substantial and well recognized environmental costs, what economists refer to as "negative externalities". Recognition of externalities is reflected in tipping fees and costs that regulation imposes.
Traditional agricultural crops effectively have the second lowest marginal cost. Though there is no benefit to the environment from growing food crops, apart from their role in reducing fossil fuel emissions, their non-food use has economic benefits. In addition to stabilizing farm income, some of the benefits accrue more broadly to society as a whole, such as reduced budget outlays of the Federal farm programs. Like the environmental benefit of utilizing waste, these general economic benefits are reflected in the market price.
Energy crops may be able to provide environmental benefit to certain types of land on which they are grown, in addition to displacing more toxic feedstocks. These additional positive externalities, or environmental benefits, of fuel produced from energy crops need to be reflected in the price of energy crops like the negative externalities of waste or the general economic benefit of traditional agricultural crops are in their respective prices. Though markets effectively incorporate specific private costs in the price of commodities, without policy intervention they do not necessarily fully reflect negative or positive externalities. Though technology currently exists that allows many types of biomass products to be relatively "climate neutral", they may be nonviable economically without explicit recognition of externalities.
Economic strategy plays a large role in determining the environmental impact of biomass cultivation. Accounting for externalities in policy analysis allows for a broader range of concerns to be evaluated and addressed. Less obviously, economics can also influence which options appear to be most environmentally beneficial.
For example, in terms of reducing carbon dioxide emission, forests can play two positive roles. They can be used to sequester carbon dioxide, or they can be cultivated and harvested in order to substitute for fossil fuel usage. Which option minimizes emissions depends on a variety of parameters, including the growth rate, the current stock, and the harvesting and conversion efficiency. Recent analysis (Marland and Marland, 1992) suggests that the length of the time period (i.e. the time horizon) for which decisions are made plays a key role in the analysis of how to minimize carbon dioxide emissions. The optimal time horizon, however, depends on economics.
In order to obtain a net carbon emission reduction through fossil fuel substitution, some minimum amount of wood must be harvested to offset the (fossil) energy used in harvesting and fuel conversion. The decision to use wood to substitute for fossil fuel is based on how many harvests can glean that critical amount within the given time period. If the critical amount is not grown within the time period, as in the case of a low growth forest, more total carbon dioxide emission is avoided by sequestration. With faster growth, hence greater harvest potential, more emissions reduction can be
achieved by harvesting the wood to substitute for fossil fuel. Also, with a longer time horizon, harvesting wood in order to substitute for fossil fuel makes sense at a lower growth rate.
The economic problem of choosing the optima1 time horizon can be analyzed by equating the market interest rate with the project's internal rate of return. The internal rate of return depends on factors such as harvest and conversion costs, the per unit value of the end product, and how fast the wood grows. The values of these factors may vary through time. The optimal economic time horizon ends when the marginal return to postponing harvest no longer exceeds the rate of return that could be earned elsewhere, i.e., the market interest rate. One implication of this is that the higher the market interest rate is, the shorter is the profitable growing cycle.
It is commonly assumed in practice that the market interest rate reflects the social rate of time preference, that is, the relative valuation of the present versus the future. The implication for carbon dioxide emission reduction is that the higher the market interest rate is, the less useful it will be to use wood to substitute for fossil fuel because the time horizon will not be long enough relative to the growth rate. It is important to note that in this analysis the market interest rate serves as a cost of capital in the economic determination of the time horizon, but the use of the time horizon in the evaluation of emission minimization assumes the market interest rate is a proxy for the social rate of time preference. Implicitly, the social rate of time preference incorporates externalities. Depending on the context, however, the market interest rate may or may not be a valid proxy for the social rate of time preference, and may or may not adequately account for environmental externalities.
We point out these basic economics because they are, ultimately, determinants of the net environmental benefit of biomass. Environmental degradation is a social problem. Our economy is based on prices that reflect private costs. If we as a society decide that a response to environmental degradation should be implemented through economic means, an accounting of these externalities need to be fully incorporated into resource economic policy analysis. The economic valuation of environmental concerns frequently requires specific and somewhat arbitrary decisions. These decisions will inevitably influence what environmental "issues" will be important in the struggle to make large scale biomass utilization commercially successful.
SECTION 111: FEEDSTOCKS
It is useful to classify feedstocks in terms of three main categories; waste, energy crops, and traditional agricultural crops. While there are ecological pros and cons that differ somewhat between each specific feedstock of any particular category, it is possible to make some general comments about each category.
Agricultural, Forestry and Municipal Waste
There are many benefits and few costs associated with using waste as a feedstock, whether it be industrial, agriculturnl or municipal. MSW generation in the U .S. is estimated at roughly 137 million tons per year, about 4 pounds per capita per day. Roughly 65 percent of this is organic, including paper (36 percent), yard waste (20 percent) and food waste (9 percent). MSW landfills account for the largest single source of anthropogenic methane emissions in the U.S., comprising about 35 percent of the total (EPA 1993). Another very large source of methane emissions is from agriculture. The livestock industry produces over 1 billion tons of manure annually. Methane emissions from livestock operations account for roughly 2.2 Tg or 10 percent of total U.S. methane emissions (Agstar).
Both MSW landfills and unprocessed manure can result in leachate that contaminates surface water, causing fishkills and oxygen deprivation in aquatic ecosystems. The leachate also contains high levels of organic nitrogen that converts to nitrate, and bacteria that pose human health hazards.
Since there is value in keeping some crop or forestry residue on the land after harvest, the opportunity cost associated with leaving less than the optimal amount can be construed as the "cost" of its alternative use. Some agricultural waste left in the field increases rhizome activity and the soils ability to retain nutrients and water, as well as decreasing erosion. Too much residue, however, can lead to depressed crop growth due to lower soil temperatures, reduce nitrate formation, and harbor pests and diseases. The amount of residue that is beneficial to leave on the ground after harvest varies by type of farming system. In low-input, wetland agriculture much of the required nutrients are carried in the irrigation water. In high-input agriculture, most of the nutrients are provided by chemical fertilizers.
In the U.S. a number of tests have been performed analyzing the amount of residue recycling that needs to occur in order to contain soil erosion to a level consistent with a high level of sustainable crop productivity. While there is considerable variation from site to site, the average fraction of residues that can be removed in the corn belt, on average, is 35 percent (Lindstrom 1979). Shifting from conventional to low-till increases this fraction to 52 percent, and shifting to no-till increases the recoverable portion even further to 58 percent.
Environmental benefits also result from removal of some, but probably not all, of residues from logging sites. Seventy percent of a tree's nutrients are concentrated in foliage, twigs and fine roots (Evans and Hibberd, 1991). Conventional harvesting removes about 30 to 50 percent of most above-ground nutrients (mainly nitrogen and calcium). Whole tree harvest (excluding litter) can generally removes roughly 90 percent of above ground nutrients. Whole-tree harvesting can therefore be problematic in terms of soil fertility. Removal can also upset nutrient balances by changing the ph of the soil, leading to more or less decomposition and leaching of minerals. Moreover, residues are important to forest ecosystem for their more general role in sustaining biodiversity.
Energy Crops
Energy crops, particularly herbaceous and short rotation woody crops, are in a more ambiguous position with respect to the environmental benefit of their development. Cultivating these energy crops on ecologically simplified land, particularly former crop land, can have a positive environmental impact. But they cannot support the ecological complexity that unmanaged vegetation can, and are also more likely, in general, to lead to erosion and chemical runoff than unmanaged systems.
The most ecologically disruptive periods in cultivation occur at planting and harvesting. Soil erosion, nutrient run-off and habitat destruction occurs mainly at these times. Energy crops are potentially more environmentally benign than conventional row crops because their cultivation cycles tend to be longer. Unlike conventional row crops, perennial grasses need replanting only every 10 years. Short rotation woody crops are likely to have a 5 to 10 year cycle, which can be significantly lengthened through coppicing.
Productivity and rates and sustainability of energy crops, like other crops, are proportionately related to nutrient additions. Energy crops may be slightly easier to manage with respect to nutrient conservation than row crops, close crops, and hay, but to attain and maintain high productivity rates
requires nutrient additions. Tree crops, particularly hardwoods, are somewhat different in that because their cultivation cycle stretches over years, some of the nutrients absorbed by the crop are returned to the soil. Energy crops in this sense offer an environmental/economic compromise between high-input, intensively managed conventional crops (that have a relatively high economic return but can also have a negative impact on the local ecology), and natural, unmanaged ecosystems that have little, if any, economic reward.
In only a few decades, assmuch of a third of the remaining farm land is expected to be no longer needed for food supply, even with strong growth in export markets. Even now, more food can be grown on US land than can be sold for a fair return. The Acreage Reduction Program (ARP) is designed to withdraw land from production in order to maintain prices through lower supply. Since 1930, crop yields have more than doubled. USDA predicts that yield and productivity will continue to increase fairly rapidly. The amount of land needed for food crops will therefore likely to continue to decrease. If there is significant demand for energy crops in the future, shifting former food cropland acreage to energy crop production could provide substantial environmental benefits while continuing to utilize productive resources.
Much of the fragile crop land that could benefit from energy crop planting is currently enrolled in the ARP arid Conservation Reserve Program (CRP). The CRP is designed to withdraw highly erodible land from agricultural use, and requires the establishment of groundcover to stem soil erosion. The combined acreage enrolled in the ARP and CRP in 1992 was 56 million acres. The Department of Energy has estimated that there could be between 35 million and 200 million acres available for energy crops, depending on market conditions and alternative uses for land. The Electric Power Research Institute (Turnbull, 1993) estimates 50 million acres.
Cultivation of energy crops on former pasture land would probably result in water quality improvement, even with moderate application of fertilizer. Pastures generally greatly contribute to nitrate pollution from cattle dropping and fast runoff from compacted soil that results from cattle trampling. A recent study (Graham and Downing, 1993) suggests that cultivation of switchgrass will reduce soil erosion, evapotranspiration and nitrate loss in runoff. Though the use of phosphorous fertilizers was projected to increase significantly in some regions due to switchgrass cultivation, effects on surface water and groundwater were not found to be significant.
Energy crops may offer opportunities to increase biodiversity in agricultural landscapes, particularly where forest fragmentation is extreme. How large a role energy crops can play is an area of active research. Energy crops, especially trees, may provide some general landscape habitat improvement for selected "interior" forest" species, but they also have the potential to harbor pests and game animals.
The greatest environmental concerns for energy crops are probably the use of herbicides in the establishment of short-rotation woody crops and the use of atrazine in herbaceous crops. Herbicide use for short-rotation woody crops can be reduced through alternative methods of weed control such as establishment of a desirable ground cover. The difficulty is more intransigent for grasses; alternative herbicides may be required (Ranney et a1 1991). Though little data exists, the rate of erosion during the first year of energy crop establishment is probably about the same as for food crops. After establishment the rate drops off dramatically. Because of longer cultivation cycles, energy crops are likely to have much lower erosion rates, on average (Pinmental and Krummel 1987).
Extended use of biomass for energy, especially if cultivated on agricultural land, could potentially reduce U.S. carbon dioxide emissions by 10 to 20 percent. The upper end of this range
reflects an extremely ambitious schedule of tens of millions of acres and 5,000 megawatts (Wright 1993). These emission reductions need to be balanced, however, with consideration of local environmental issues.
Energy crops can help diversify landscapes even as monocultures by their introduction into the highly simplified ecologies of traditional farming systems. The energy crops themselves can be diversified. Agroforestry and mixed tree species in a variety of arrangements are beginning to be implemented in the western portion of the U.S. Opportunities for innovative planting systems of energy crops are extensive.
Tmditianal Agricultuml Crops
Environmental remediation occurring through the cultivation of food crops is relatively problematic. Environmental benefits of using traditional agricultural crops as fuel feedstock accrue during the combustion phase of the total fuel cycle. Environmental costs of high-input agriculture can be significant. They include; erosion and chemical runoff, nutrient absorption, and ecological simplification.
Alternative farming practices, such as no-till or conservation tillage, winter cover crop, time release fertilizers and complex cropping systemg can reduce the environmental costs of current average farming methods. Conservation tillage commonly refers to any planting system that keeps at least 30 percent of the surface soil covered by residue after planting where water erosion is of concern, or an equivalent amount of small grain residue where wind is a concern. Conservation till and no-till cultivation systems tend to develop soils that are cooler and have a higher organic matter content. In one study, evaporation rates for conventional tillage were more than three times as high as for no-tillage. Erosion is lowered due to higher organic residue and root mass in the soil. Over time, however, there is a tendency for the soil to compact under no-till or conservation-till systems, inhibiting root growth and water retention. Low-till food crop cultivation also has the disadvantage of possibly requiring increased application of pesticides and herbicides to avoid lower yield.
In some situations it may make sense to rotate or double plant energy crops in planting systems that also incorporate food and fiber crops. It is well known that double cropping with certain mixtures of crops can significantly improve yields. Multiple cropping can be beneficially combined with conservation tillage or no-tillage practices as a method to decrease pesticide and herbicide use. A number of studies have recently been completed on agroforesty (multiple land use including intermixing crops, trees and other woody species, and native forage) (Lewis and Pearson, 1987).
SECTION IV: CONVERSION PROCESSES AND ENERGY CARRIERS
Processes that conveit biomass to convenient fuels can loosely be grouped ,based on the end products; gases, liquids, solids. Few of the many potentially useful processes have actually been attempted on a commercial scale. A great deal of the environmental impacts associated with commercial use are therefore also unknown. Many times conversion processes also involve co- products that provide environmental benefits in their production process. For example, the production of ethanol from sugar cane results in vinasse (waste water), that itself can be used as a source of biogas. Likewise, in the conversion process to ethanol, one component of the cellulosic material, lignin, cannot be converted. However, lignin could be utilized as an adhesive for time- release fertilizer, reducing run-off associated with the cultivation of the feedstock.
Gas Fuels
There are two types of gas that can be produced from biomass; "biogas" a mixture of methane and carbon dioxide, and "syngas", a combination of carbon monoxide and hydrogen. Aerobic digestion (composting) and anaerobic digestion produce biogas while thermal gasification processes can be used to produce either biogas or syngas. Each of these processes can be applied to waste or other feedstocks, with waste being more commonly used.
The Environmental Protection Agency has recently begun a program, Agstar, to encourage the enhanced generation, (through anaerobic digestion) and utilization of methane from livestock operations. Seventy six percent of methane emissions from livestock operations are generated from anaerobic conditions of liquid manure systems. Most of these emissions can be harnessed through minor modification. Programs like these can make sense economically, reduce greenhouse gases, and provide a more environmentally sound residue.
A switch from landfilling to anaerobic digestion of MSW can reduce processing time by an order of magnitude and double or triple the amount of recoverable gas (DOE 1992) Though no anaerobic digestion plants currently operate in the U.S., they have proven successful in Europe and Brazil. One ton of MSW can be converted into roughly 1,920 square feet of methane. The market value of the methane produced from one gross wet ton of MSW has been estimated at about $4.00 (Badger 1992).
Anaerobic digestors reduce leachate that can cause fishkills and oxygen deprivation in aquatic ecosystems by contaminating surface water. The leachate also contains high levels of organic nitrogen. Anaerobic digestion converts organic nitrogen into inorganic nitrogen which is more easily absorbed by land vegetation. Anaerobic digestion has the additional benefit of killing bacteria that pose human health hazards.
The other potentially commercial type of biomass gas production is thermochemical. Feedstocks for gasification could include both energy crops and MSW. Though commercial MSW gasification plants were built in the U.S. during the 1970s were not successful, those built a decade later in Europe have been. The Department of Energy and the private sector are currently jointly working on the development of a gasification system that uses pelletized wood waste. It is expected that as carbon dioxide emissions regulations become more stringent, industries that have invested significantly in coal gasification systems may want to utilize biomass.
Liquid Biomcrss Fuels
Biofuels currently under development in the U.S. include ethanol, its ether form ETBE, methanol, biod iesel and biocrude. Feedstocks include traditional agricultural crops, herbaceous and short rotation woody energy crops, aquatic energy crops such as microalgae, and processed wood and agricultural residues. Conversion technologies cover fermentation (ethanol), gasification and pyrolysis (methanol), catalytic and chemical treatment and extraction (diesel).
The most common type of biofuel in the U.S. is ethanol. While ethanol potentially can be produced from energy crops, MSW, and other cellulosic material, the only commercial feedstock to date in the U.S. is corn. Corn ethanol, first produced commercially in 1979, now provides roughly 1 billion gallons per year of automotive fuel. Wastes from the process of converting either corn, other starch crops, or cellulosic to ethanol are likely to be environmentally benign. The fermentation portion of the process depends on enzymes that are.recyc1ed. Dilute acid that is used in the
pretreatment process to separate the lignin from other components of cellulosic feedstock could potentially cause some contamination problems though none have been reported.
Toxic and atmospheredegrading emissions generated from ethanol combustion are low relative to standard gasoline. Liquid fuel with an 85 percent fraction of ethanol by volume (E85) is the most concentrated blend of ethanol and gasoline that has undergone a complete set of performance tests. These tests demonstrate that emissions from E85 allow it to be classified under the California emission standards (a regulatory system focused on local air quality concerns) as a "transitional low emissions vehicle" (TLEV). Most of the emissions levels measured are well below the TLEV standards, with the exceptions being some types of volatile organic particles and nitrogen oxides. The full environmental benefit is, of course, much greater than this since ethanol use reduces greenhouse gases that are not part of the California standards.
Biodiesel is also becoming a potentially viable alternative fuel. Because no specifications for biodiesel have been established yet, there is little information on environmental issues related to the production of biodiesel. Recent tests comparing biodiesel with petroleum diesel indicate that biodiesel a. contains little or no sulfur, b. emissions of particulate matter and carbon monoxide are significantly less, c. hydrocarbons and nitrogen oxides are somewhat reduced.
Solid Fuels and Electricity
The most common type of biomass fuel is solid, either not processed or minimally processed. Almost 3.4 quads of solid biomass were used in the U.S. during 1991 (Harris and Rosen 1992). This translates to roughly 8 percent of total energy use. Virtually all of the solid biomass utilized for fuel was derived from waste. The majority was used in direct combustion. Half was wood waste both generated and burned by the timber industry to produce inhouse heat and electricity. One quarter was wood used for residential heating.
The remainder was a combination of agricultural, wood, and municipal waste used to generate three fourths of a quad of commercially available electricity (Harris and Rosen 1992). Substituting waste for coal or petroleum oil eliminates the toxic emissions and other residues that would result from burning coal or petroleum oil to generate electricity. Air emissions for all types of biomass combustion tend to be low relative to coal and petroleum oil, particularly with respect to sulfur and carbon dioxide and sulfur. While the sulfur content of coal typically ranges from .05 to 5 percent by weight, the sulfur content of biomass generally ranges from .O1 to 1 percent. Biomass is frequently co-fired with coal in order to reduce sulfur emissions. Even though nitrogen oxide emissions also tend to be lower biomass than for coal, they are of some concern. Strategies such as staged combustion and the use of catalytic reduction devices are possible remedies.
Other environmental benefits also accrue from burning MSW or other types of waste to produce electricity. Combustion of MSW reduces its volume up to 90 percent. Though the ash from MSW combustion can be used as a fertilizer in some locations, it is generally disposed of in landfills dedicated to ash waste. The leachate from ash monofills is generally less than from ordinary landfills. It also generally has a lower metal concentrate. Most metals dissolve more slowly in ash monofills because the ash (and accompanying scrubber lime) is relatively basic.
SECTION V: CONCLUSION
It is not inevitable that all types of biomass are significantly more climate neutral or more
ecologically sound than the alternatives, nor can they be expected to totally displace fossil fuels. Critics of biomass are quick to point out the many uncertainties surrounding the largely unchartered territory of large scale commercial application of most biomass fuels. Specific potential negative impacts of feedstock cultivation include erosion, chemical runoff and ecosystem simplificationlhabitat destruction on cropland producing traditional agricultural crops and energy crops. Interestingly, the potential benefits are in the same areas. How biomass production is ultimately implemented becomes the key issue.
Environmental benefits of the conversion and combustion portions of the fuel cycle are similarly not assured. Mass combustion of municipal solid waste (MSW) for energy recovery provides a good example to this point. Though carbon and methane emissions could be reduced in the U.S. by substituting biomass fuel for fossil fuel, there are potentially other types of emissions that may mitigate the benefit. Combustion of MSW under some conditions is more environmentally sound than landfilling. However, biomass combustion can produce problematic amounts of particulate matter and nitrogen oxides so that without adequate emission controls, one form of pollution is simply substituted for another.
It is clearly possible for biomass utilization to make a positive contribution to halting or remediating environmental degradation. Most of the biomass currently used for fuel is waste from forestry, agriculture or municipalities. The use of waste contributes two-fold to environmental remediation; once by directly reducing material that can cause degradation, second by substituting for fuels that present greater hazards. Fuels produced from waste include electricity and gas as well as direct combustion products.
The timber industry is the leader in the use of biomass power due to its convenient supply of wood waste feedstock. Its use of wood waste reduces water and soil degradation that would otherwise be likely to occur. Agriculture and municipal waste management facilities are well situated to harness methane emissions are a natural byproduct of livestock production and landfills. Methane production can be enhanced through simple anaerobic digestion processing of manure and other organic waste materials.
Energy crops offer an environmental/economic compromise between high-input, intensively managed conventional crops (that have a relatively high economic return but can also have a negative impact on the local ecology), and natural, unmanaged ecosystems that have little, if any, economic reward. Energy crops are potentially more environmentally benign than conventional row crops because their cultivation cycles tend to be longer, hence have fewer periods of erosion, runoff and habitat destruction.
Biomass conversion efficiency is both a real issue in conversion economics and highly relevant to the biomass production system itself. Conversion efficiency affects how much land and biomass will be needed to generate a given amount of energy, and, by extension, the environmental impacts of cultivating biomass. Efficiency, thus, has a large role in defining the cost curve of biomass and its ultimate utilization.
Badger. P.C. 1992. "Biomass Energy Program Report: Southeast Region." Biologue. Vol. 10, No. 1. pp.41-47.
Bull. S.R. 1992. "Biomass as Fuel: Liquid Fuels for Transportation." in Kuliasha, M.A., A. Zucker, and K.J. Ballew. 1992. Technologies for a Greenhouse Constrained Society. Chelsea Michigan: Lewis Publishers Inc. pp. 159-169.
Dripchak, K. and R. Scheithauer. 1990. A Scenario for Assessing Environmental Impacts of La r~e - Scale Lignocellulosic-Based Fuel Ethanol Production and Use. Interim Report for Oak Ridge National Laboratories under contract #32X-SE940C. Vienna, Virginia: JAYCOR.
English, B. Alexander, R.R., K.H. Loewen, S.A. Cody G.V. Cole and W.R. Goodman. 1992. Deveio~ment of a Farm-Firm Modelling Svstem for Evaluation of Herbaceous Energv C r o ~ s . Final Project Report, March 1991. Oak Ridge, TN: Oak Ridge National Laboratory.
Evans, J. and B.G. Hibberd 1991. " Tree Plantation Review: Study No.8: Plantation Operations. Shell International Petroleum Com~anv. Shell Center. London.
Hall, D., F. Rosillo-Calle, R.H. Williams, J. Woods. 1993. "Biomass for Energy: Supply Prospects." Chapter 14 in Renewable Energv: Sources for Fuels and Electricity, Edited by T.B.Johansson, H. Kelly, A.K.N. Reddy and R. Williams. Washington, D.C.: Island Press.
Hall, D. and J. Woods. 1992. "Biomass:Past Present and Future" in Kuliasha, M.A., A. Zucker, and K.J. Ballew. editors. Technologies for a Greenhouse Constrained Society. Chelsea Michigan: Lewis Publishers Inc.
Harris, W.L. and H. Rosen "Conversion of Biomass to Fuel and Energy" in U.S. Department of Agriculture. 1992. New Cro~s . New Uses. New Markets. Washington D.C.: Office of Publishing and Visual Communications. pp. 2 12-220.
Hohman, N. and C.M. Rendleman. 1993. "Emerging Technologies in Ethanol Production" Agricultural Information Bulletin, No. 663. Washington, D.C. : Economic Research Service, U.S. Department of Agriculture.
Pasztor, J . and L. Kristoferson. "Biomass Energy" in Hollander, J .M. editor. 1992. The Enerrzv- Environment Connection Washington D.C. : Island Press. pp. 176-220
Lewis, C.E. and H.A. Pearson. 1987. Agroforestry using Tame Pastures under Planted Pines in Southern United States. in H.L. Gholz ed., Agroforestrv: Realities. Possibilities and Potentials. Martinus Nijhoff Publishers: Dordrecht, The Netherlands. pp. 195-2 12.
Lindstrom M.J. et al. 1979. "Tillage and Crop Residue Effects on Soil Erosion in the Corn Belt," Journal of Soil and Water conservation. March-April:80-82.
Marland, G. and S. Marland. 1992. "Should We Store Carbon in Trees?" Water. Air and Soil Pollution 64: 181-195.
Parrish, D.J. D.D. Wolf, W.L. Daniels, D.H. Vaughan and J.S. Cundiff. 1990. Perennial S~ecies for &timum Production of Herbaceous Biomass in the Piedmont.. Final Report 1985-1989. Oak Ridge, T N . : Oak Ridge National Laboratory.
Perlack, R.D., J.W. Ranney, L.L. Wright. 1992.Environmental Emissions and Socioeconomic Considerations in the Production. Storage. and Transportation of Biomass Energy Feedstocks. Oak Ridge, TN . : Oak Ridge National Laboratory.
Ranney, J. W., L.L. Wright, C.P. Mitchell. 199 1. "Carbon Storage and Recycling in Short-Rotation. Energy Crops. " International Energy Agency, Forest Energy Agreement.
Ranney, J . W. 1992. "Can Biomass Energy Crops Really Improve Overall Environmental Quality?" prepared for the 7th European Conference on Biomass for Energy and Environment, Agriculture and Industry.
Ranney, J. W. 1992. "Environmental Considerations in Biomass Resource Management for a Greenhouse-Constrained Society. " in M. A. Kuliasha, A. Zucker, and K. J. Ballew, editors. Technoloeies for a Greenhouse Constrained Society. Chelsea Michigan: Lewis Publishers Inc. pp.519-546.
SRI International. 1992. Data Summarv of Munici~al Solid Waste Management Alternatives - Executive Summarv. Golden Colorado: National Renewable Energy Laboratory.
Strawn, N. 1990. "Alcohol Fuels: Alternatives for Today and the Future. " Biolome. Vol 7, No. 2. pp. 13-17.
Turnbull, J . 1993. Stratepies for Achievim A Sustainable Clean and Cost-Effective Biomass Resource. Electric Power Research Institute.
U . S . Department of Energy. 1992. DOElCHl0093-152. Solar Thermal and Biomass Power Division, Office of Solar Energy Conversion.
U.S. Department of Energy. 1988. Enerev Technoloeies and the Environment, DOEIEH-0077. pp. 2 17-237.
U .S. Environmental Protection Agency. 1993. Anthro~ogenic Methane Emissions in the United States: Estimates for 1990. Report to Congress. Global Change Division, Office of Air and Radiation. Washington, D.C.
Walker, J.N., J.A. DeShazer, and B.J. Barfield. 1992. "Biomass as an Energy Source. " Agricultural Engineer. November, pp. 24-26.
West, D.C. and L.K. Mann. 1983. Whole-Tree Harvestin~:Fourth Year Progress Re~ort for 1982 Nutrient Depletion Estimates. Postharvest Impacts on Nutrient Dynamics. and ~eeeneration. ORNLITM-8805, Environmental Sciences Division Publication No. 2184, Oak Ridge National Laboratory, Oak Ridge, TN.
Williams, R. and Larson, E. 1993. "Advanced Gasification-Based Biomass Power Generation. " Chapter 17 in Renewable Enerpv: Sources for Fuels and Electricity, Edited by T.B.Johansson, H. Kelly, A.K.N. Reddy and R. Williams. Washington, D.C. : Island Press.

Williams, R.H. 1992. "Roles for Biomass in Sustainable Development. " prepared for the 1992 Greenhouse Gas Emissions and Mitigation Research Symposium. US EPA Air and Energy Engineering Laboratory. Washington D.C.
Wright, L. 1993. "Role of New Wood Energy Crops in Mitigation of Fossil C02 Emissions" in Biomass and Bioenergv Oak Ridge, TN: Oak Ridge National Laboratory. (in press)
RENEWABLE BIOMASS ENERGY: UNDERSTANDING REGIONAL SCALE ENVIRONMENTAL IMPACTS
Robin L. Graham and Mark Downing Environmental Sciences Division, Oak Ridge National Laboratory
Building 1505, Mail Stop 6038, P. 0. Box 2008, Oak Ridge TN 37831-6038
Abstract
If biomass energy is to become a significant component of the U.S. energy sector, millions of acres of farmland must be converted to energy crops. The environmental implications of this change in land use must be quantitatively evaluated. The land use changes will be largely driven by economic considerations. Farmers will grow energy crops when it is profitable to do so. Thus, models which purport to predict environmental changes induced by energy crop production must take into account those economic features which will influence land use change.
In this paper, we present an approach for projecting the probable environmental impacts of growing energy crops at the regional scale. The approach takes into account both economic and environmental factors. We demonstrate the approach by analyzing, at a county-level, the probable impact of switchgrass production on erosion, evapotranspiration, nitratein runoff, and phosphorous fertilizer use in two multi-county subregions within the Tennessee Valley Authority (TVA) region. Our results show that the adoption of switchgrass production will have different impacts in each subregion as a result of differences in the initial land use and soil conditions in the subregions. Erosion, evapotranspiration, and nitrate in runoff are projected to decrease in both subregions as switchgrass displaces the current crops. Phosphorous fertilizer applications are likely to increase in one subregion and decrease in the other due to initial differences in the types of conventional crops grown in each subregion. Overall these changes portend an improvement in water quality in the subregions with the increasing adoption of switchgrass.
Introduction . ..
Sourcing electric power plants or liquid fuel conversion facilities with biomass from energy crops will cause major shifts in the use of the agricultural land. Energy crops, like other crops, require agricultural-quality land for good yields (Wright et al. 1992). As a rule of thumb, a 100 Megawatt power plant operating at baseload will require about 500,000 dry tons of biomass per year or 100,000 acres of agricultural-quality land dedicated to energy crops (provided the average yield on that land is 5 dry tons per acre per year). Thus any sizable power plant fueled by biomass from energy crops will require large acreages of agricultural-quality land for growing energy crops. Liquid fuel facilities are also expected to require large amounts of biomass and correspondingly large acreages of energy crops. To reduce the costs associated with transporting biomass from the field to the power plant or liquid fuel facility, the energy crops will be grown on agricultural land near the facility. Thus the introduction of a new biomass conversion facility, be it power or liquid fuel, will cause a shift from conventional crops to energy crops on the nearby agricultural land.
The environmental effects of that shift will depend on the amount of land, the soil quality and slope of the land, the crops and cropping practices that are displaced, the landscape surrounding the energy crops, and the management regime of the displacing energy crop. If one assumes that energy crops will be located where they can be procured at the least cost to the conversion facility and greatest profit to farmers, then economics will determine the amount and type of land to be converted to energy crop production. Thus any projection of the environmental impacts associated with energy crops must be driven by the economic factors which will control the location of the land use conversion.
Our objective is to demonstrate an approach for predicting environmental impacts that could be associated with sourcing biomass-based power or liquid fuel plants. The environmental impacts of the conversion process (e.g., air pollutants, ash disposal, CO, emissions) are not considered in this study. See Downing and Graham (1993b, these proceedings) for a brief discussion of the possible impacts of the conversion process. For our demonstration we project the environmental changes that would be associated with the conversion of existing agricultural cropland to switchgrass (Panicum vitgatum) in two subregions within the Tennessee Valley Authority region (Figure 1). Switchgrass is a native grass that can be harvested for 10 or more years without replanting, tolerates droughty years, and produces cellulosic biomass suitable for conversion to liquid fuels (Bransby et al. 1990). The specific environmental changes that we examine are erosion, evapotranspiration, and the quantity of nitrate in runoff. We also examine changes in phosphorous fertilizer applications. Evapotranspiration will affect water quantity in the region, while fertilizer use and nitrate in runoff will affect water quality. Erosion will affect both water quality and the inherent productivity of the land. Our demonstration takes into consideration the economic factors, except for transportation costs, that will influence the location of the land use conversion. Transportation costs are not included in this demonstration as we wished to show the general impact of energy crops to a region rather than the impacts associated with a specific facility. [Noon (1993, these proceedings) describes a network optimization approach for determining the location of the lowest cost biomass for a specific conversion facility. His approach takes into account both the price paid to the farmer and the transportation costs and is designed to interface with our approach for determining the price paid to the farmer.] We show that the introduction of energy crops into different regions with differing soils, crops and topography will result in environmental consequences unique to each region. Furthermore, these consequences can be quantitatively predicted using integrated environmental and economic models that take into account initial land use and soil quality differences.
mods
study sites
Two subregions within the TVA region were selected for our demonstration. The boundaries of the subregions were based on current land use and physiographic features and largely follow the boundaries of the United States Department of Agriculture (USDA) Major Land Resource Areas in this region (USDA Soil Conservation Service (SCS) 19811. The TVA region had been previously subdivided into 8 subregions to capture the range of land use, topography, and climate in the TVA region (Downing and Graham 1993b, these proceedings). The first subregion is centered on Nashville, Tennessee, basin and encompasses 57 counties. The major conventional crops in the subregion in terms of acreage planted are corn, wheat, and soybeans with egch crop being about equally dominant. Approximately 19% of the land (2.8 million acres) in the subregion is currently being cropped. The second subregion is centered on Memphis, Tennessee, and lies on either side of the Mississippi River but does not include thk fertile Mississippi bottomland. This subregion encompasses 31 counties. The major crops are soybeans, cotton, and wheat with soybeans being clearly the dominant crop. A higher percentage of the land (47%; 4.6 million acres) is currently being cropped. For our analysis we assume that no- or low-till methods are being used to produce all the conventional crops except cotton and that soybeans and wheat are managed similarly in each subregion.
We used a 5-stage approach which linked agricultural databases with environmental and economic models (Figure 2). The economic modeling is explained in greater detail in Downing and Graham (1993b, these proceedings).
In this stage we characterized the soils, current crops, and crop yields in each subregion. Soil quality was characterized using SCS agricultural capability classes. The classes signify limitations in crop choice and are based on soil and site characteristics. There are eight general classes ranging from "1" (few limitations restricting cropland use) to "8" (precluded from cropland use). Classes 5-8 are generally unsuited for cropland. Within classes 2-8 there are four subclasses defining the primary reason for cropland limitations. These subclasses are "wft (excessive water), "e" (erosion potential), "s" (soil restrictions - salinity, shallowness or texture problems), or 5" (climate restrictions). For our analysis, the 29 SCS classes were aggregated into 9 soil categories by grouping classes 5-8 into one category and grouping 3w and 4w together and 3s and 4s together. This resulted in 9 categories - 1, 2e, 2s, 2w, 3e, 3-4s, 3-4w, 4e, and 5+. There were no climate-restricted soils in either subregion. The National Resources Inventory database (USDA SCS 1987) was used to determine 1) the distribution OF cropland across the 9 soil categories in each subregion, 2) the relative proportion of the cropland planted to each of the three most dominant crops in each soil category in each subregion, and 3) the SCS soil name most commonly (in terms of acreage) associated with a particular soil category in each subregion. The 1987 Agricultural Census (US. Dept. of Commerce 1989) was used to determine the amount of cropland in each county. For our analysis, 'kropland" did not include permanent pasture, cropland used for grazing and pasture, or land planted to tobacco, horticulture, orchards, or vegetables. We excluded the latter cropland because it is highly profitable and unlikely to be converted to energy crops. National agricultural statistics at the county level for
1988, 1989, and 1990 were used to calculate the average yield of the 3 dominant crops within each subregion. The most common soil name for each soil category in each subregion was further characterized using the SCS SOILS5 database.
Only the three most dominant crops in each subregion were considered in the analysis and we assumed that all cropland (as defined previously) within a subregion was currently planted to one of these three crops.
For the conventional crops - soybeans, cotton, corn, and wheat, the University of Tennessee Agricultural Extension Service publication Guide to Farm Planning manual was used as the basis for defining crop management activities and crop production costs including application and timing of fertilizer, harvest date, labor costs, and equipment usage. Switchgrass management scenarios were developed from Cherney et al. (1990) and Parrish et al. (1990) while switchgrass production costs (to the farmer) were estimated from Bransby et al. (1990) and Dobbins et al. (1990).
The Erosion Productivity Impact Calculator (EPIC) model developed by USDA Agricultural Research Service (ARS) at the Blacklands Research Center at Texas A&M University was used to predict the erosion, evapotranspiration, and nitrate runoff associated with switchgrass and the four conventional crops (Sharpley and Williams 1990). EPIC is a simulation model of erosion, plant growth and related soil and water processes. It has a daily time step and is designed to simulate agricultural crop growth and soil responses to management practices on different soils under different climatic conditions. Because erosion impacts on crop productivity can develop slowly, the model is designed to simulate up to hundreds of years of cropping practices. The model was initially developed by ARS to assist in the 1985 status report on the nation's soil and water resources as required under the Soil and Water Resource Conservation Act. Because the purpose of the model was to address the wide variation in crop productivity and soil resources that exist in the United States, the model was designed to be as mechanistic as possible. Inputs to the model include soil characteristics, daily weather data (precipitation, maximum temperature, minimum temperature, solar radiation, and wind speed), crop parameters (e.g., maximum leaf area index, maximum root depth, optimal nitrogen concentration in plant tissue), and management practices (date of planting, date of harvest, date and amount of fertilizer application, tillage practice, etc.). The model considers only one crop at a time although multiple cropping over time is allowed. It also assumes uniform field conditions. The model can accept up to 10 different soil horizons. The model has been widely used and adapted for many crops (Sharpley and Williams 1990). One of the convenient features of the model is that it comes with related crop parameter, weather, and soil databases. Thus, the user does not need to develop all of the input parameters. All four of the dominant conventional crops were modeled with EPIC crop parameters developed by ARS. We used switchgrass parameters developed by B. English of the University of Tennessee (B. English, personal communication). The model was run to simulate thirty years of continuous crop production using weather data uniquely characteristic of each subregion, the soil names unique to each subregion and each of the 9 soil categories, and management practices specific to each crop. In total, 72 EPIC runs were made. Average values (over 30 years) were calculated for annual crop yield (dry tons, bushels or bales per acre per year), annual erosion (tons soil per acre per year), evapotranspiration (inches per year), and annual nitrate loss in runoff (lbs N-NO, per acre per year).
For each of the conventional crops in each subregion, the yields predicted by EPIC were adjusted by the actual average yield in the subregion (as calculated in stage 1) using the following formula.
where: Yi = adjusted crop yield for soil category i,
Ei = EPIC predicted yield for soil category i,
Pi = proportion of crop in the subregion planted on lands of soil category i, and
Y, = average yield of crop within the subregion.
In this manner, the sensitivity of conventional crop yields to soil quality was predicted. The switchgrass yields predicted by EPIC were used with no further modification after verifying with switchgrass experts that the EPIC switchgrass yields were similar to those observed in the field (S. McLaughlin, personal communication). We used EPIC to predict how crop yields would be affected by soil quality because the potential profit from an acre of land is partially dependent on crop yield. Thus conventional crop yield is an important determinant in the price of switchgrass and consequently the location of switchgrass production. Downing and Graham (1993b these proceedings) discuss this in greater detail.
Using the yields and production costs generated in Stages 2 and 3 and- the market price of conventional crops, the breakeven price for switchgrass was calculated for each crop on each soil category in each subregion. The breakeven price is the price for switchgrass that would ensure the farmer of making a profit equal to that which he would obtain from growing the conventional crop [see Downing and Graham (1993b, these proceedings)]. The maximum breakeven price of the three crops was then selected as the breakeven price that would influence the cost of switchgrass to a conversion facility. The soil categories in each subregion were then ranked by their maximum breakeven price to determine the economic order in which lands of each soil category would be converted to switchgrass production. Implicit in this ranking was the assumption that lands with the lowest breakeven price would provide the lowest cost biomass to a conversion facility and, therefore, would be the first to be shifted to energy crop production.
In stage five the environmental impacts of converting land to energy crops were examined on a per acre basis (by soil category and subregion) and for each subregion as a whole.
For each soil category in each subregion, the expected erosion, evapotranspiration, nitrate loss in runoff, and phosphorous fertilizer application rate (lbs P,O, per acre per year) of each of the three conventional crops were compared to the corresponding switchgrass values. The percentage change in each of the environmental variables that would be associated with converting the land from each conventional crop to switchgrass was determined. Because there were no empirical data to validate the predicted EPIC values for the environmental variables, we deemed it more appropriate to look at the relative changes in these environmental variables rather than the absolute changes.
We examined the environmental effects of shifting land into energy crop production at the regional scale by calculating the relative change (for the entire subregion) of each of the environmental variables as a function of the percentage of the cropland in the subregion that was converted to switchgrass.
This calculation was accomplished in a series of steps. First, the expected erosion, evapotranspiration, phosphorous fertilizer use, or nitrate loss in runoff associated with conventional crop production (for each soil category) was calculated by weighting the environmental values of each of the three dominant crops by the relative dominance of that crop on that soil category and summing the three weighted values. In step two, this summed conventional crop environmental value was then multiplied by the acreage of land of that soil category in the subregion to determine the total amount of erosion, for example, that would be expected from conventional crops growing on lands of that soil category. In step three, the nine soil category amounts were summed to arrive at an estimated baseline environmental value for that subregion as a whole (e.g., the total amount of erosion expected from all cropland in that subregion). In step four, the environmental value for the subregion if switchgrass was grown on all the land with the lowest breakeven price (for switchgrass) was calculated [e.g., the amount of erosion expected in the region (tons per year) if the land with the lowest cost for growing switchgrass is in switchgrass production while the rest of the area grows conventional crops]. In step five, this switchgrass-modified environmental value was then divided by the baseline value to determine the relative subregional change associated with converting land with the lowest switchgrass price. Steps four and five were repeated eight times, each time putting land of the next lowest breakeven price into switchgrass production until all the cropland in the subregion was growing switchgrass. By plotting these cumulative environmental values against amount of cropland acreage in switchgrass production at each of the nine breakeven prices, we were able to construct a regional picture of how increasing production of switchgrass would impact the environmental quality of the subregion.
Resutts
The results of the breakeven analysis and modeling of switchgrass yields are shown in Figure 3. The yields and breakeven price varied by both soil category and subregion. The estimated environmental effect of converting from any of the three dominant crops to switchgrass is shown for the Nashville region in Figure 4 and the Memphis region in Figure 5. Not surprisingly, EPIC predicted that growing switchgrass and mowing it each fall rather than planting and growing each of the conventional crops would result in major reductions in erosion across all soil categories in both regions. Reductions in evapotranspiration which would translate to increases in stream and river flow were also predicted with switchgrass production. Reduction in nitrate in runoff was predicted for some soils with the substitution of some crops, especially soybeans. Phosphorous fertilizer application, a crop-specific management input which is insensitive to soil category was increased when soybean production was converted to switchgrass but was decreased for all other crops. The accuracy of these EPIC-based estimates is difficult to assess. On the basis of general understanding of crop processes and crop differences, the direction of each of the variables with switchgrass production would appear reasonable. Nitrate in runoff is sometimes higher with soybeans than corn or wheat and nitrate in run off from hay (a surrogate for switchgrass) is low (Reckhow et al. 1980). The exact magnitude of the shifts is less defensible especially for evapotranspiration and nitrate in runoff. This is not to say that the numbers were unrealistic, they were within the range observed in agricultural fields, but rather that we have no local field data with which to verify the predictions.
The wide variation in regional-scale environmental impacts as a consequence of planting switchgrass is illustrated in Figure 6. Erosion showed the most dramatic change. With regards to erosion, there was little difference between subregions but some difference as the curve moved from land of one soil category to land of the soil category with the next lowest breakeven price. For example, the very sharp drop in regional erosion in the Memphis subregion when going from 87% of the cropland to 93% of the cropland in switchgrass occurred because a highly erosive soil category ("4e") was put into switchgrass production at that point in the curve. From a regional perspective, this resulted in a greater reduction in erosion than when land of a less erosive soil category was put into switchgrass production.
Nitrate loss in runoff decreased more for the Memphis region than the Nashville region because soybeans which produced comparatively high amounts of nitrate in runoff under the modeled management regime (summer planting, winter fallow) are a much more significant crop in the Memphis region than the Nashville region. The projected decrease in nitrate in runoff could result in improved water quality, but to quantify this improvement would require more information on the location of the fields in relation to streams. This point will be elaborated in the discussion.
Evapotranspiration shifts were moderate in both regions but might be projected to increase annual stream flow in the Memphis region where cropland occupies 47% of the land. Given the Nashville region is mostly in pasture and forest, the moderate decrease in evapotranspiration from cropland would probably not make much of a regional difference in stream flow.
The phosphorous fertilizer application curves reflect the variation in kinds and proportions of crops that are grown in the two regions. Because soybeans require less phosphorous fertilizer than does switchgrass (Figures 4 and 5). phosphorous fertilizer use increased whenever soybeans were displaced by switchgrass. Thus in the Memphis region where soybean production accounts for over 50% of the cropland on all soil categories, increasing switchgrass production on any soil category meant increasing phosphorous fertilizer applications. Consequently, the phosphorous fertilizer application curve for the region steadily increased as more and more land was converted to switchgrass production. In the Nashville region, the crop situation is more complex, as some soil categories are dominated by soybeans while others are not. Thus regional phosphorous fertilizer use first increased as lands in soil categories that are dominated by soybeans were planted to switchgrass but then decreased as lands that are dominated by corn were planted to switchgrass. The increase in phosphorous fertilizer use in the Memphis region would not necessarily translate to high phosphorous loadings into streams as most phosphorous is fairly tightly bound to soil particles and enters streams through erosional processes which were projected to be greatly reduced with switchgrass.
Discussion
We used county as our minimum spatial analysis unit within a subregion as good quality county- specific information is easily accessed from national databases at minimal cost. Also, counties appeared to provide good spatial resolution for a region as large as the TVA region and a region in which counties are comparatively small (allowing minimal within-county variation in climate and other model input parameters) and of similar size. West of the Mississippi River, where counties are much larger, a county-level resolution may not be appropriate.
The EPIC model is quite suitable for much finer spatial resolutions than a county. Thus, if digital soil and land cover maps are available, the approach taken in this study could readily (but not trivially) be married with a Geographic Information System (GIs) so that land use changes could be predicted for very specific locations based on soil characteristics and land use. One can envision a GIs containing soil and land use information linked to both a database with relating economic and environmental variables and a network transportation model such as that described by Noon (1993, these proceedings). With such a system one could project both the lowest total cost (farmer cost plus travel cost) of supplying biomass to any facility location and the environmental consequences of procuring that supply (i.e., causing the projected land use shifts). That is our long-term goal.
The type of environmental analysis presented here is not sufficient for projecting all environmental impacts as it considers only those environmental impacts that are neighbor independent (Hunsaker et al. 1990). That is to say, the projected impacts of a specific land use change are not a function of the surrounding lands. For example, the erosion on a specific field is not affected by what happens on an adjacent field. There are environmental amenities that are strongly neighbor dependent, such as stream water quality and wildlife habitat. For example, reducing erosion on fields adjacent to streams should have a greater effect on sediment-loadings to water than reducing erosion on fields far from the stream. One can assume that a major reduction in erosion in a region should positively affect stream water quality but the degree of the benefit cannot be ascertained until the location of the land in relation to the streams is determined. Similarly, wildlife habitat quality is neighbor dependent. An acre of forest in the middle of corn fields provides a different habitat than an acre of forest in the middle of a forest. Wildlife habitat is also patch size dependent. For example, 10 small fields covering 10 acres each will probably not provide the same habitat as a single 100-acre field.
To project the neighbor-dependent environmental effects of energy crops will require a GIs with soil and land use maps. More importantly, however, it will require algorithms that calculate habitat value or stream quality as a function of the surrounding lands (Graham et al. 1991). At this time, the knowledge necessary to build such algorithms or at least algorithms that are quantitatively defensible is incomplete. While algorithms for nutrient and pesticide transport to streams are fairly advanced and can be applied under many situations, algorithms for habitat quality assessments are still very site specific and difficult to generalize to a region. The field of landscape ecology provides methodologies for addressing the development of such algorithms (Turner 1989). The bottom line, however, is that field studies of animal use of energy crops, flora in energy crops, and nutrient and pesticide transport from energy crops are needed if the neighbor-dependent environmental effects of energy crops are to be modeled in detailed rather than generic fashion.
The approach of linking economic models which dictate probable location of land use change with environmental models which predict the environmental impacts of land use change is essential to understanding how biomass energy technology will affect the environment. This study is one step in developing a comprehensive approach for effecting those linkages. The results of this study should not be viewed as definitive or necessarily reflective of what might be projected elsewhere. Each location will have unique environmental and land use attributes which will effect both the economic and environmental impacts of energy crop production. Furthermore, model projections are only as good as the basic data which undergird them. Energy crops have not been widely grown in this region and thus we can only hypothesize their likely yields and sensitivity to soil and site differences using a mechanistic simulation model. More field studies are needed to both characterize the energy crops themselves and their likely environmental impact. Nonetheless, we are capable now of projecting at least the first order environmental changes that might be associated with introducing energy crops into a region.
Research sponsored jointly by the Biofuels Systems Division, U.S. Department of Energy, under contract DE-AC05-840R21400 with Martin Marietta Energy Systems, Inc. and Tennessee Valley Authority (TVA) under Memorandum Wnderstanding, Contract No. TV-87041V (DOE No. 1610- F031-Al). This document has not been subjected to TVA review and therefore does not necessarily reflect the views of TVA and no official endorsement should be inferred.
References
Bransby, D.I., S.E Sladden, and D.D. Kee. 1990. Selection and Improvement of Herbaceous Energy Crops for the Southeastern USA: Final Report on a Field and Laboratory Research Program for the Period March 15, 198.5, to March 14, 1990, ORNL/Sub/85-2740915. Oak Ridge, TN: Oak Ridge National Laboratory.
Cherney, J.H., KD. Johnson, J.J. Volenec, E.J. Kladivko, and D.K. Greene. 1990. Evaluation of Potential Herbaceous Biomass Crops on Marginal Crop Lands: I ) Agronomic Potential. Final Report 1985-1989, ORNLJSubB5-274129/5&P1. Oak Ridge, TN: Oak Ridge National Laboratory.
Dobbins, C.L., P. Preckel, A. Mdafri, J. Lowenberg-DeBoer, and D. Stucky. 1990. Evaluation of Potential Herbaceous Biomass Crops on Marginal Crop Lands: 2) Economic Potential. Final Report 1985-1 989, ORNLJSub/85-274129/5&P2. Oak Ridge, TN: Oak Ridge National Laboratory.
Downing, M., and R.L. Graham. 1993a. "The Role of Natural Resource and Environmental Economics in Determining the Trade-offs in Consumption and Production of Energy Inputs: The Case of Biomass Energy Crops." In Proceedings of the Fimt Biomass Conference of the Americas: Energy, Environment, Agriculture, and Industry, August 30 - Sept. 2, 1993. Burlington, VT.
Downing, M., and R.L. Graham. 1993b. "Evaluating a Biomass Resource: The TVA Region-wide Biomass Resource Assessment Model." In Roceedings of the First Biomass Conference of the Americas: Energy, Environment, Agriculture, and industry, August 30 - Sept 2, 1993, Burlington, VT.
Graham, R.L., C.T. Hunsaker, R.V. O'Neill, and B.L. Jackson. 1991. "Ecological Risk Assessment at the Regional Scale." Ecological Applications, 1 : 196-206.
Hunsaker, C.T., R.L. Graham, G.W. Suter, 11, R.V. O'Neill, L.W. Barnthouse, and R.H. Gardner. 1990. "Assessing Ecological Risk on a Regional Scale." Environmental Management, 14:325-332.
Noon, C. 1993. " W A GIs-based Biomass Resource Assessment." In PToceedings of the F h t Biomass Conference of the Americas: Energy, Environment, Agriculture, and Industry, August 30 - Sept. 2, 1993, Burlington, VT.
Parrish, D.J., D.D. Wolf, W.L. Daniels, D.H. Vaughn, and J.S. Cundiff. 1990. Perennial Speciesfor Optimum Production of Herbaceous Biomass in the Piedmont: Final Report 1985-89, ORNL/Sub/85-27413/5. Oak Ridge, TN: Oak Ridge National Laboratory.
Reckhow, KH., M.N. Beaulac, and J.T. Simpson. 1980. Modeling Phosphorous Loading and Lake Response Under Uncertainty: A Manual and Compilation of Export Coefficients, EPA 44015-80-011. Washington, D.C.: United States Environmental Protection Agency.
Sharpley, AN., and J.R. Williams (eds.). 1990. EPIC--ErosionlProductivity Impact Calculator: 1. Model Documentation, U.S. Department of Agriculture Technical Bulletin No. 1768.
Turner, M.G. 1989. "Landscape Ecology: The Effect of Pattern on Process." Annual Review of Ecology and Systematics, 20: 171 -197.
U.S. Department of Agriculture, Soil Conservation Service (SCS). 1981. Land Resource Regions and Major Land Resource Areas of the United States, Agriculture Handbook 2%. Washington, D.C.
. 1987. Basic Statistics 1982 National Resources Inventory, Statistical Bulletin No. 756. Iowa State University Statistical Laboratory.
U.S. Department of Commerce, Bureau of the Census. 1989. 1987 Census of Agriculture, Volume 1: Geographic Area Series, Washington, D.C.
Wright, L.L., R.L. Graham, AF. Turhollow, and B.C. English. 1992. "Growing Short-rotation Woody Crops for Energy Production." In Forests and Global Change, Vol 1: Opportunities for Increasing Forest Cover, R.N. Neil and D. Hair (eds.). Chapter 8,97-122. Washington, D.C.: American Forests.
.'Ths submnad fnmuampt hns ban aumOrad by a connata 01 tho U.S. ~overnnsnt uda connect No. m- ACM-840RZ1400. AccaChWlv. It10 U.S. Gownnmnt retam a m n s x d u * v s . royahy-free kcsnse to pkbh or r . p o b c e the pubbhed l a m of llw conwknan, a slow orhas to do so. f a U.S. Gonrnmsnt p w m -
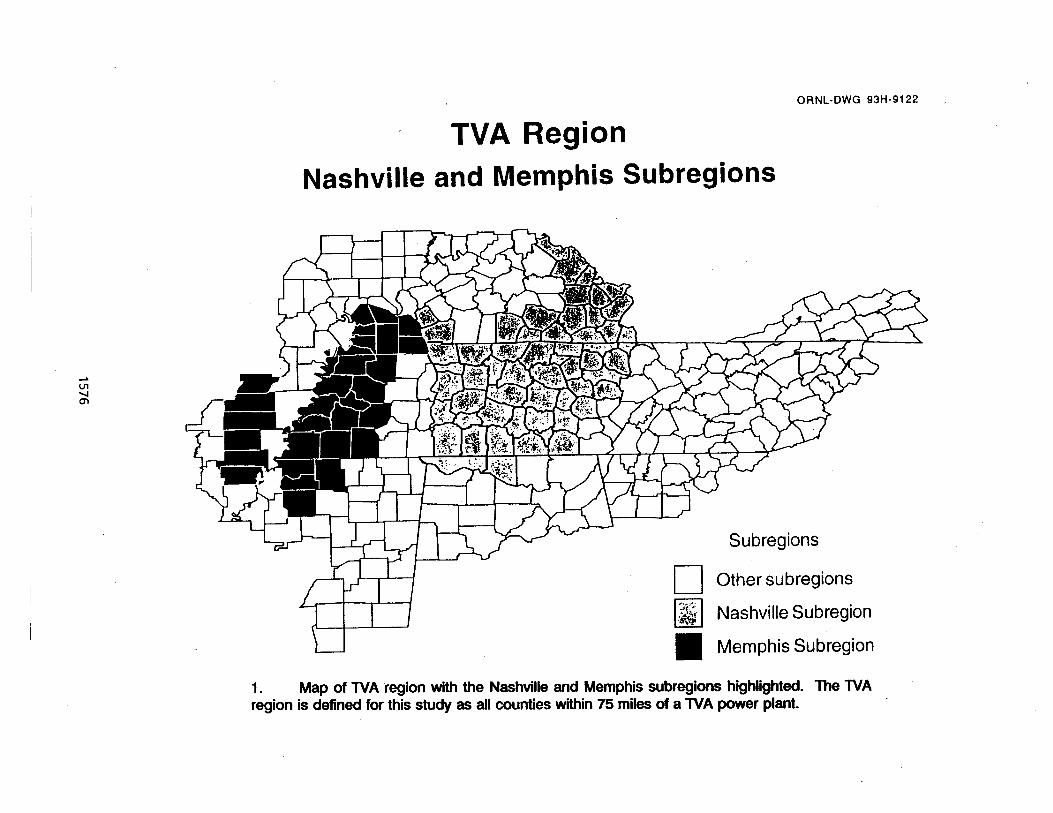
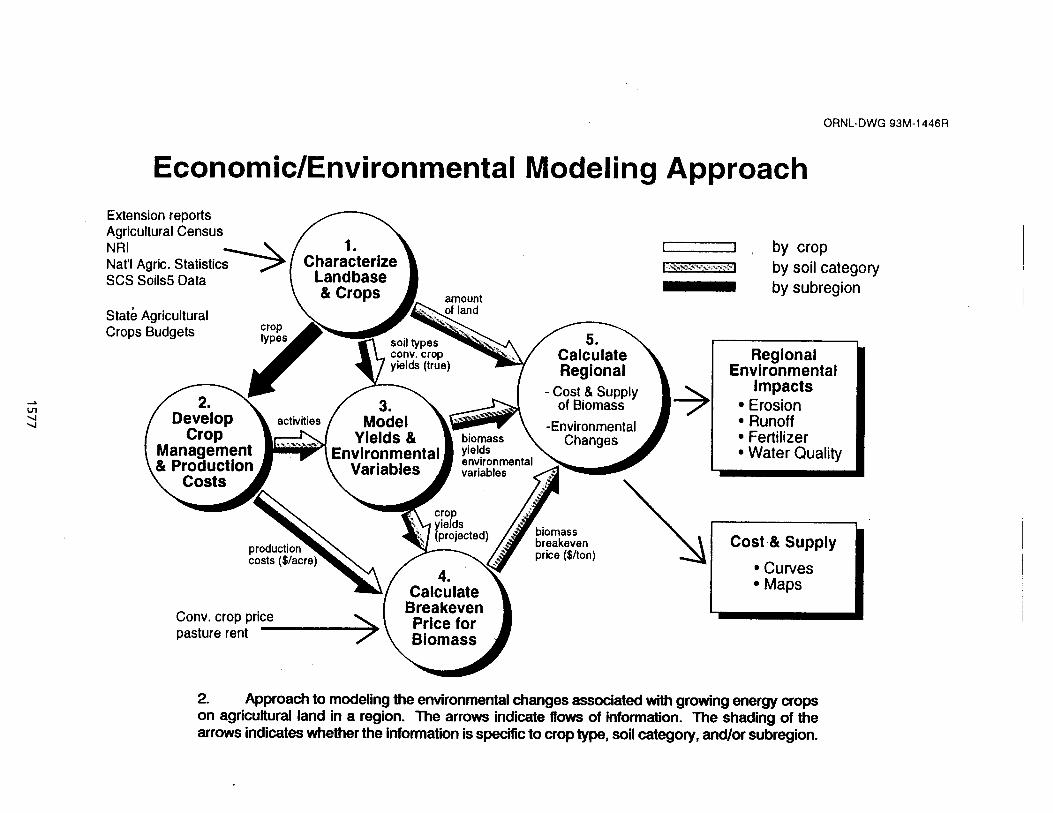
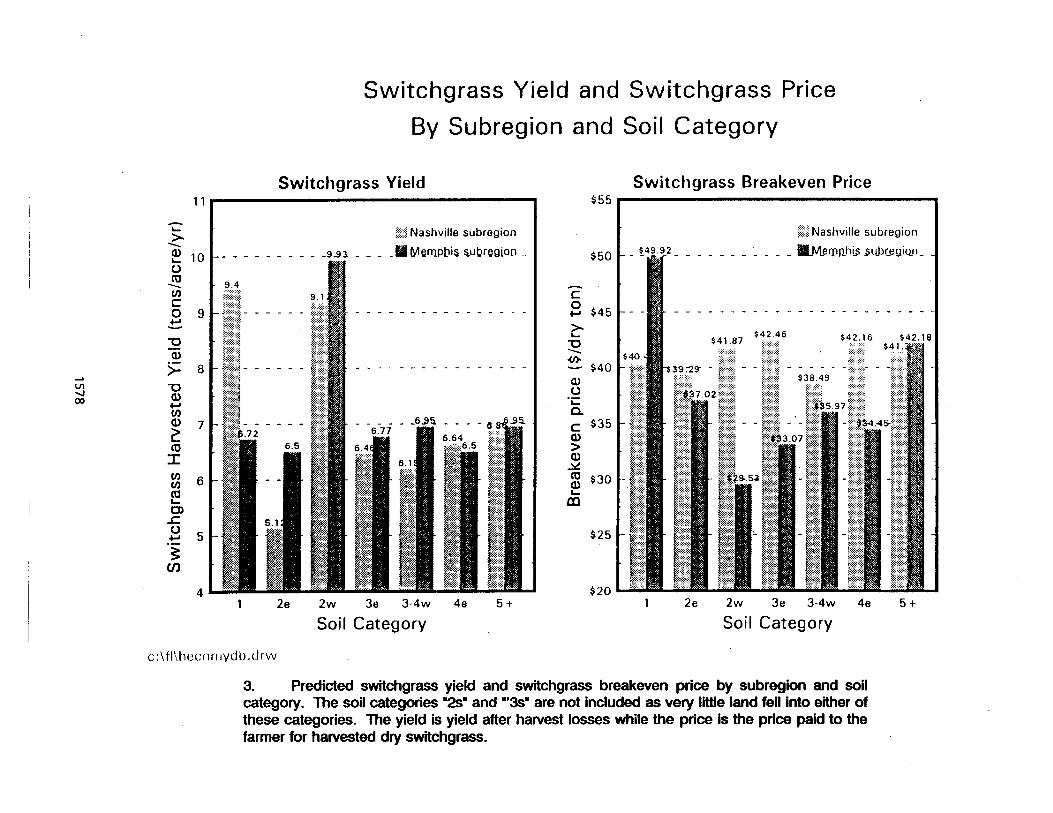
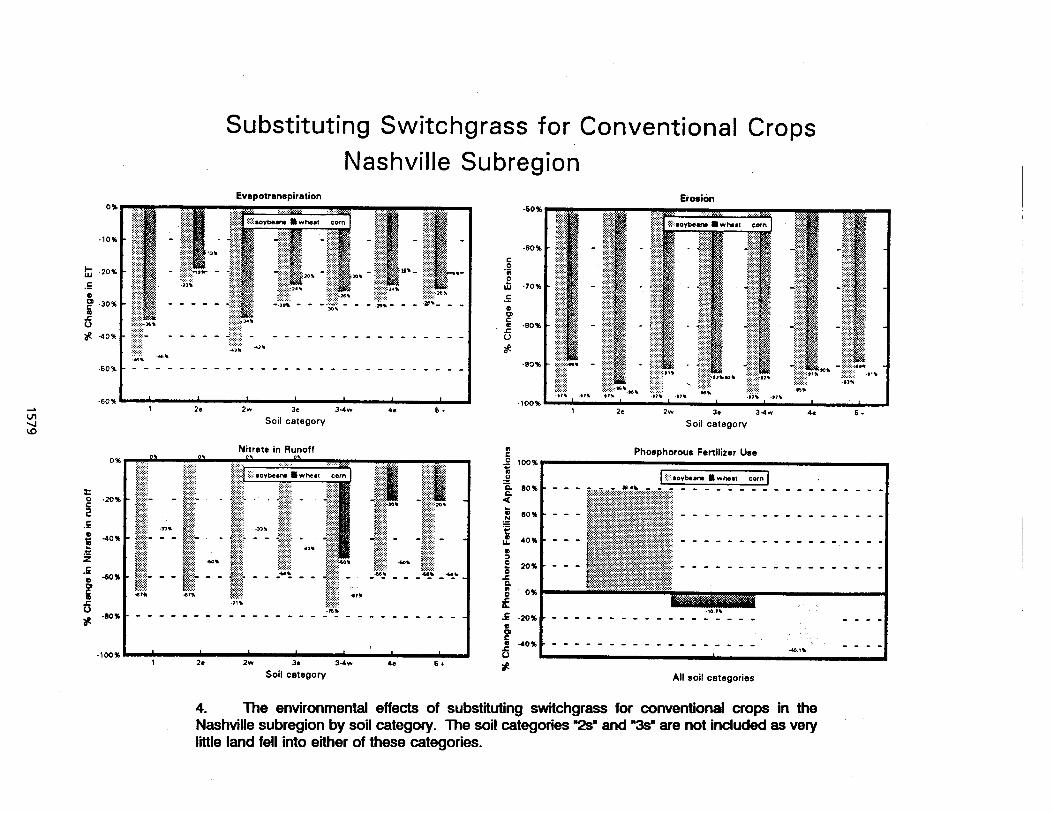
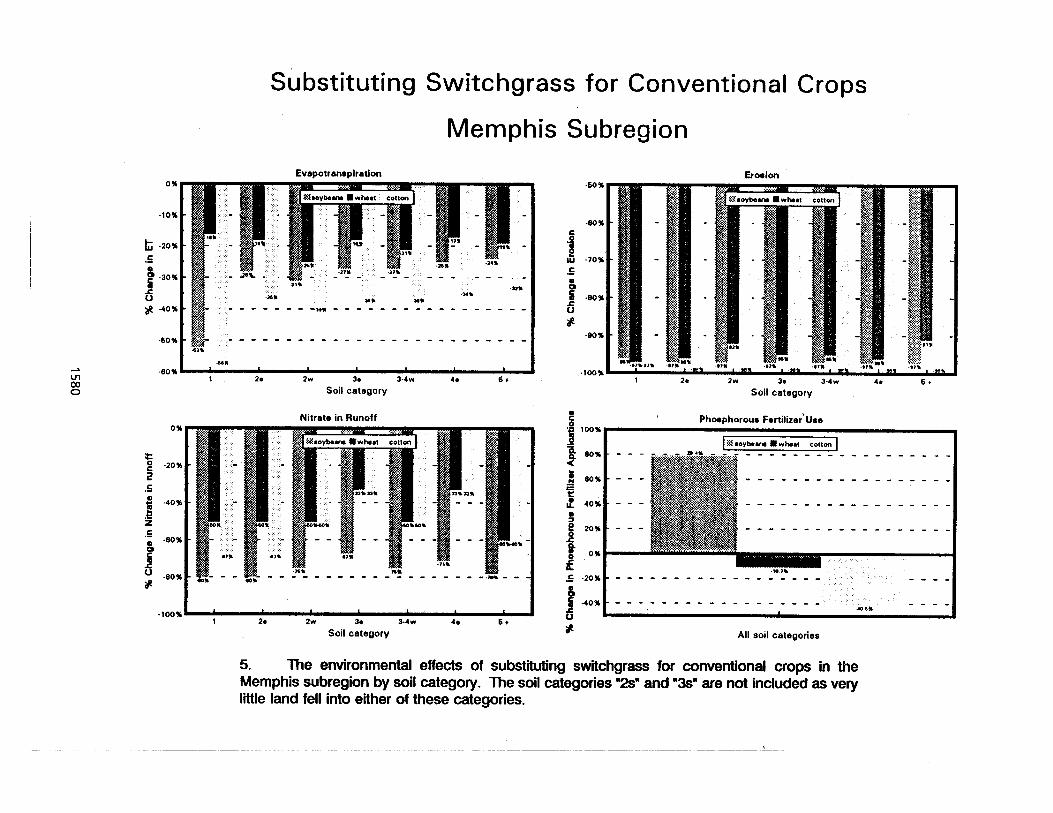
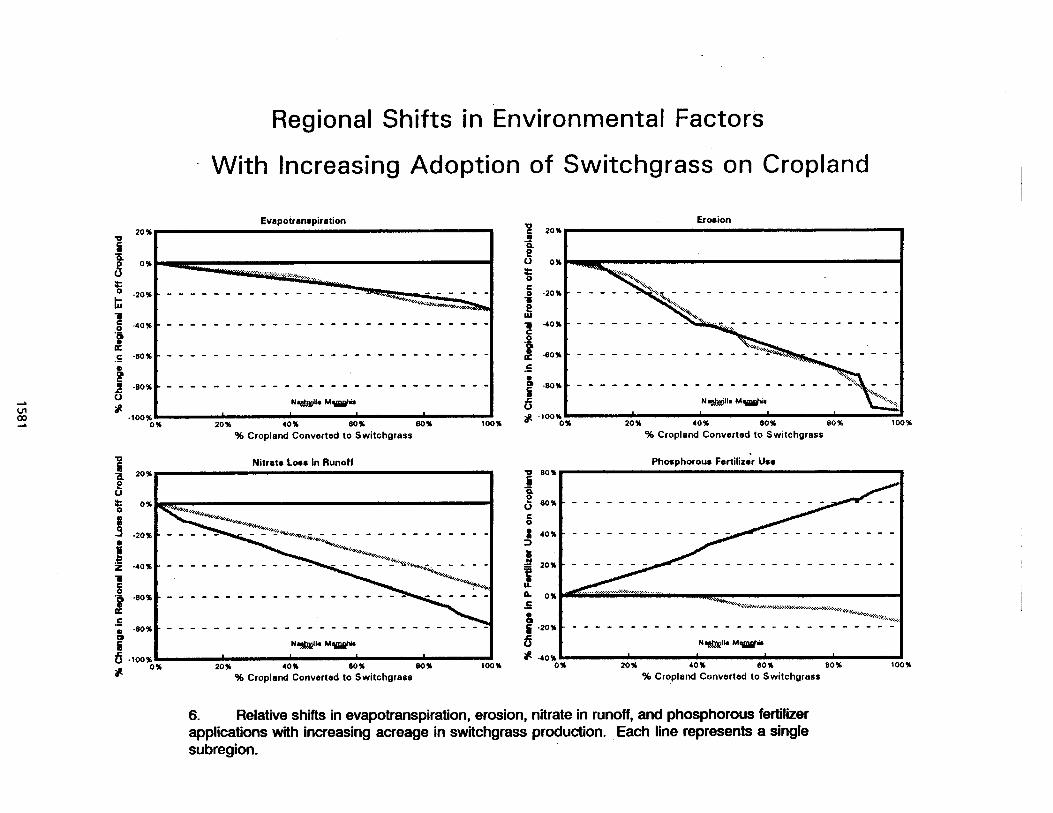
PRELIMINARY RESULTS OF THE IMPACTS OF INTENSIVE HARVESTING ON SOU CHEMISTRY ANI) TEMPERATURE.
Mahendrappa, M.K. and D.G.O. Kingston Forestry Canada - Maritimes Region
P.O. Box 4000, Fredericton, N.B. E3B 5P7
Abstract
Over 80% of clearcutting operations in Canada involve whole-tree harvesting, in which non- merchantable components of tree biomass (slash) are removed from the forests. The removal of slash from the sites leads to a loss of nutrients and faster decomposition of soil organic matter. It sets up a chain reaction leading to increased nitrification due to warmer soil temperature, increased acidity build-up, and subsequent loss of base cations from the solurn. The ultimate result is site deterioration and reduced timber yield.
In 1989, a series of lysimeter studies was started on sites representing the major soil types in all three Maritime provinces and to including all the commercially important tree species. Whole- tree harvesting, conventional harvesting, and control constituted the three main treatments in each of the studies. Treatment responses in terms of soil temperature at three depths and the chemical composition of soil leachates were characterized.
The diurnal fluctuations in the soil temperatures were most pronounced in the whole-tree harvested plots, followed by the conventional harvest plots. The largest difference in the temperature between the treatments consistently occurred immediately below the organic horizon in the mid-afternoon hours. At lower depths, the patterns were similar but the differentia1 magnitudes were smaller. The temperatures in the whole-tree harvested plots were between 5-6°C higher than those in the control and conventionally harvested plots during the first growing season after the treatments were implemented. During the spring and summer months, soil temperatures were warmer in the whole-tree harvested plots. but after September the trends reversed. The slash in the conventionaIly harvested plots acted as insulation to conserve heat. The calculated heat units accumulated were significantly higher in the whole-tree harvested plots over the growing season than in the other plots.
lntroductlon
Potential impacts of intensive harvesting on site have been of concern to forest soil scientists since the late 19th Century (Ebermayer 1876 - see Tamm 1979 and Smith a 4. 1986). However, it was not until the second half of the 20th Century that interest in this subject was rekindled after evidence of decreasing forest productivity, due to repeated annual litter raking, was discovered in Sweden and Germany (See Rennie 1955). Lately, many reviews have been written on this topic (Foster and Morrison 1982; Freedman 1981; Kimmins ad. 1985; Smith 5 a. 1986). Recently, in New Brunswick, Prince Edward Island, and Nova Scotia, preliminary work was done to evaluate the comparability of local results with those published elsewhere (Mahendrappa gt A. 1988,1989: Maliondo 1989). The primary objective of the study conducted in the three provinces was to evaluate the potential loss of nutrients from forests due to the removal of nutrient rich foliage and branches through intensive harvesting. Though the term "intensive harvesting" is generally used to represent various degrees of biomass gathering from forests, in this report it is used to represent whole-tree harvesting. In the Maritirnes, almost all the above-ground biomass of only the merchantable trees is used in whole-tree harvesting operations; hence, it is assumed that the nutrients in non-merchantable trees are left on site.
The results of biomass and nutrient inventories of New Brunswick forests (Maliondo @ @. 1990) indicated that a high proportion of the nutrients is removed from forests due to whole-tree harvesting, compared to conventional (boles only) harvesting. As a result of whole-tree harvesting, the soil lacks of protection from solar radiation and hydrologic factors that cause soil erosion. Increased incidence of solar radiation results in faster biochemical reactions that ultimately lead to potential site degradation characterized by nutrient deplesion and site acidification. The reactions responsible for such degradation include faster decomposition of reserve organic matter, nitrification of mineralized ammonical nitrogen and leaching of base cations in association with nitrate. Nitrification, being an acidifying reaction, produces H ions and thus increases the solubility and mobility of acid cations such-as Al, Fe, Mu, Zn, etc. (Maliondo 1989; Maliondo - et - al. 1990). Results to support these possibilities are available in various literature published in Sweden (Lundkvist 1988), the United States (Smith g 4. 1986; Anderson 1990: Hornbeck 1990; Smith 1990; McCormack 1990), and New Zealand (Dyck and Skinner 1990).
Based on the interpretations of data from nutrient and biomass inventories of N.B. forests and on information available in the scientific journals, a research proposal was presented to the Energy from the Forest (ENFOR) program. The objective of the proposal was to evaluate the potential changes in the soil chemical characteristics due to intensive harvesting in the Maritimes using lysimeter systems. The lysimeter studies were initiated to test a hypothesis that removal of all biomass from the forest during harvesting would result in site degradation. Presented in this report are some of the preliminary results in terms of soil chemistry and temperature as affected by different harvesting methods. Because of the preliminary nature of the results, the data on soil solution chemistry are presented without much interpretation.
Matertal and methods
Lysimeter studies were initiated in six locations, representing hardwood, softwood, and mixedwood stands growing on different soil types in the Maritimes region (Figure 1). Some mensurational characteristics of stands at each study site are listed in Table 1. Three treatment common to each of the six study sites include control (Cont.), conventional harvest (CH) and whole tree harvesting (WT). Additional treatments were included in the experiments to match the silvicultural practices used by collaborating agencies. These included select cutting (Sel), in which a certain proportion of the trees were harvested; flail operation, in which the residue from the chippers was spread back on the soil; and spreading of ash from co-generation stations (Ash). In addition, at one site, lysimeters were installed on the skidder rows (Skr) where the organic horizons had been disturbed.
On each site, the treatments were duplicated on 1 0 0 X 200 m blocks. In each block, two lysimeter systems were installed in duplicates at three different depths. Temperature sensor probes (thermistors) were located at the same positions as the lysimeters. The lysimeters and thermistors were located immediately below the organic horizons, at the bottom of the rooting zones, and at the midpoint between the two. The locations of the lysimeters were staggered such that the collection of leachates from the upper lysimeter did not influence the leachates collected from the lysimeters located at a greater depth.
Installation of lysimeters and themisfom
For the installation of the lysimeters and thermistors, soil pits measuring approximately 1.3 X 1.3 X 1 m were excavated and small holes were dug by trowels on two walls of the soil pit. These holes were extended as far as the arm could reach. The lysimeters and thermistors were placed at the end of these holes in the side walls such that the soil above them was not disturbed. After the lysimeters and thermistors were installed, a fiberglass tub measuring 1.3 X 1.3 X 1 m in size was lowered into the soil pit and the space between the tub and the pit was carefully back-filled, making sure that the tygon tubing and wires attached to the lysimeters and thermistors were not damaged. The thermistors were connected to Omnidata data loggers- and the tygon tubing from the lysimeters was connected to the sample bottles (Figure 2). The lysimeters consisted of a glass housing 6 cm in diameter fitted with a fritted glass disk fused in place 5 mm below the rim of the funnel. The fine pores in the fritted disks, measuring 2-5 microns, are very effective in filtering out the particulates in the leachates. The collection of soil solution (leachates) was facilitated by connecting the sample bottle to the vacuum system created by the siphoning of water from one bottle to the other located at a height differential of 100 cm (Rieberk and Morris 1983). A one-way flow valve was placed between the sample bottle and the upper vacuum bottle to avoid contamination of the sample with the liquid used in the vacuum system. Another one-way flow valve was placed at the lower end of the siphon tube to prevent reverse flow of the liquid from the lower bottle.
Collec#on and proussing of temperaturn data
A total of seven thermistors were connected to each data logger - six in the soil profile and the other to record aix temperature about 0.5 m above the soil surface. The data logger was programmed to measure soil and air temperature at half hour intervals and to record an average of two measurements each hour. The temperature measurements were camed out during May-Oct./Nov. (until frost occurred both days and nights). Datapacks @SP) were changed when they were more than 90% full. The information from the datapacks was downloaded directly onto a computer using an Omnidata reader.
CbIIection and processhg of leacbtes
The leachates in the sample collection bottles were collected once a month, starting from May through to October. Although the vacuum systems generally held the vacuum for up to a month, they were rejuvenated periodically by transferring the liquid from the lower to the upper bottle. The leachate samples collected were filtered for pH measurement and stored in a cold room at close to O°C.
The leachates were analyzed for electrical conductivity (Ec), dissolved organic carbon (DOC), various cations (Ca, Mg, Na, K, NH,, Al, Fe, Mn, Zn, Pb), and anions (NO,, SO,, PO,, Cl, F, oxalate). In addition total Kjdlkahl nitrogen and B were also measured in the leachate samples. All the analyses were camed out by laboratories that have participated in the QA/QC program across the country. Representative samples were analyzed by more than one laboratory.
Overwintering of iysimetem and themistors
The lysimeters were filled with 50% ethanol and both ends of the tubing were clamped. This prevented freezing and cracking of glass lysimeters during winter. During the spring, the alcohol was drained and the lysimeter was rinsed twice with distilled water before starting sample collection.
During the winter months, the thermistor probes were removed from the soil and taken to the laboratory calibration verification. If left in the field over winter, the heat-shrunk sheaths protecting the thermistors would have gotten wet, frozen, and damaged the sensors.
Only the temperature data reported in this report have been statistically evaluated using SAS Institute programs (SAS 1989). A 15% spline function was used to smooth the average daily temperatures for graphing purposes only. The Scheffe test was used to evaluate the statistical differences between the treatments.
Results and discussion
General observations regarding the lysimeters
The first lysimeter study was started in 1989 in Deersdale, New Brunswick. Over a period of 4 years, since their installation, over 97% of the lysimeters have functioned very well. The failure of the other 3% was caused by mice chewing on the tygon tubing connected to the lysimeters; the mice shelter in and around the fiberglass tubs. These small (6 cm across) lysimeters, therefore, appear well suited to long-term monitoring of soil solution chemistry without disturbing the soil above. It should, however, be pointed out that at times, when the soil above the lysimeters had dried out, the vacuum system appeared to fail. However, the problem corrected itself after rainfall. This was particularly true in the case of lysimeters at the interface of organic and mineral horizons.
Soil temperature
The impacts of harvesting methods on the soil temperature are expressed in terms of hourly means within a day and daily mean temperatures during the growing season.
Hourly temperature
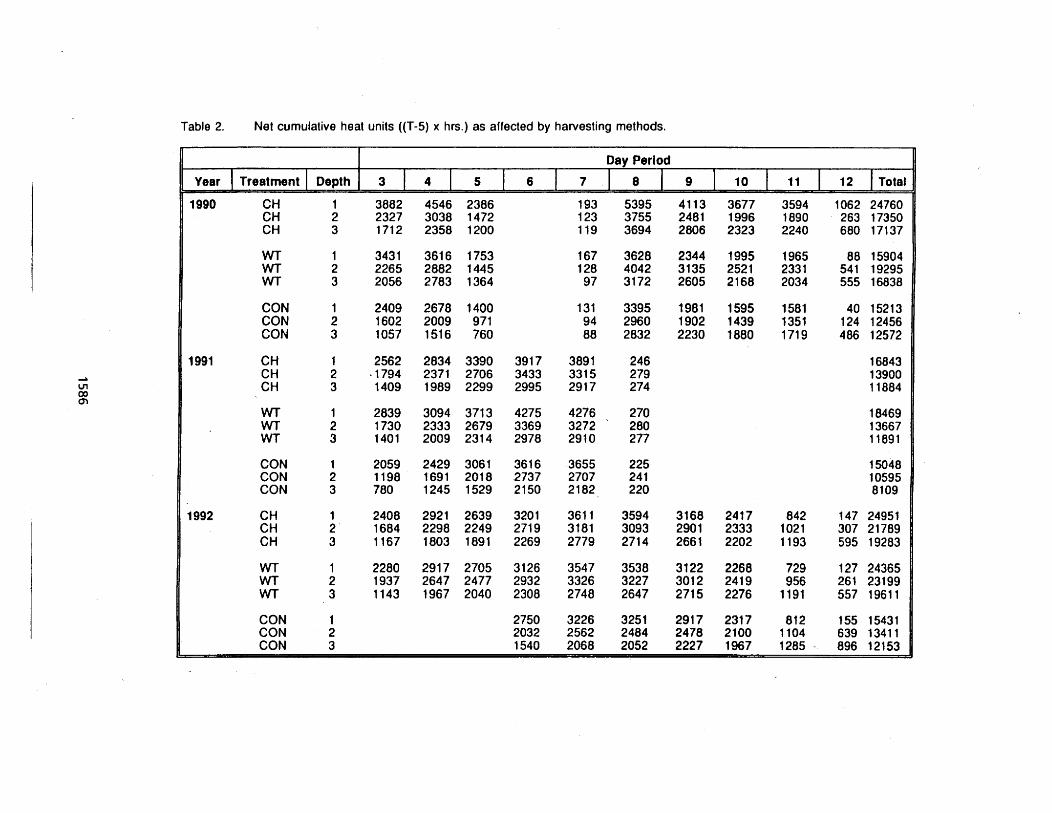
Table 2. Net cumulative heal units ((T-5) x hrs.) as affected by harvesting methods.
Day Perlod
4
1990 CH 1 3882 4546 2386 193 5395 41 13 3677 3594 1062 24760 CH 2 2327 3038 1472 123 3755 2481 1996 1890 263 17350 CH 3 1712 2358 1200 119 3694 2806 2323 2240 680 17137
WT 1 3431 3616 1753 167 3628 2344 1995 1965 88 15904 2265 2882 1445 128 4042 3135 2521 2331 2056 2783 1364 97 3172 2605 2168 2034 555 16838
2409 2678 1400 131 3395 1981 1595 1581 1602 2009 971 94 2960 1902 1439 1351 1057 1516 760 88 2832 2230 I880 1719 486 12572
2562 2834 3390 3917 3891 .I794 2371 2706 3433 3315 279 1409 1989 2299 2995 2917 274
2839 3094 3713 4275 4276 1730 2333 2679 3369 3272 280 1401 2009 2314 2978 2910 277
2059 2429 3061 3616 3655 225 1198 1691 2018 2737 2707 24 1 780 1245 1529 2150 2182 220
2408 2921 2639 3201 361 1 3594 3168 2417 1684 2298 2249 2719 3181 3093 2901 2333 1021
2280 2917 2705 3126 3547 3538 3122 2268 729 127 24365 1937 2647 2477 2932 3326 3227 3012 2419 956 261 23199 1143 1967 2040 2300 2748 2647 2715 2276 1191
5 6 7 8 9 10 11
The average hourly temperatures observed during May 1992 at the McIntyres Mountain study site (location number 7 in Figure 1) are presented in Figure 3. These values indicate the temperatures observed during the first year following the application of treatments and installation of thermistors. The patterns shown in Fig. 3 are similar to those observed during 1992 in Deersdale, N.B., where thermistors were installed 3 years earlier. In Figure 3, the chart represents the hourly mean temperature observed at the interface between the organic and mineral horizons. Charts b and c respectively, represent the observed hourly mean temperature at the midpoint and bottom of the rooting zone. The charts in Figure 3 are representative of the data showing the treatment effects at all the lysimeter study sites in the region.
The temperature at the interface of the organic and mineral horizons shows distinct patterns in diurnal temperature variations. The observed patterns (Figure 3a) also reflect the normal diurnal air temperature variations. However, the hour of day when maximum temperatures were recorded appears to be affected by the treatments (harvesting methods). In the control area, the diurnal variation resembled that of air temperature. The temperatures in the whole-tree harvested plots were higher than those in control and CH plots, reaching a maximum later in the day. The peak values of temperature observed in the WT plots are more than five (5) degrees greater than those observed in the CH plots with slash on the ground. Thus, the soil temperature in the WT plots stays warmer for longer periods of time than in CH plots. During the early morning hours of May and part of June, the temperature in the WT plot appears to be lower than that in the CH plots. This pattern, however, changes during August-September and reflects the insulating effect of slash on the ground in the CH plots.
The normal Q,, value of 2 for all the biochemical reactions means that for each 10" rise in temperature the rate of reactions will double. The observed 5°C difference between the peak temperatures in the WT plots and CH plots suggest that the rate of organic matter decomposition in the WT plots would be 100% higher than that in the CH plots. This translates into a great loss of organic carbon from the soil surface. Drying of the surface layer of the organic horizon, however. can have a moderating effect on the process.
The patterns observed at the interface of organic and mineral horizons are also evident in the soil temperature measured at the midpoint and bottom of the rooting zone. The differences between the peak temperature observed in the WT and CH plots however are not as large. Nonetheless, it is important to note that the treatment effects are discernible at the bottom of rooting zone (about 50-60 cm below the soil surface). These differences persisted until the middle of September or until frost persisted during days and nights.
For statistical evaluation of treatment effects on the hourly mean temperatures, the 24-hour period was divided into four equal parts of 6 hours, such that the peak-and low temperature values were matched respectively. The results of the Scheffe test indicate that, for a period of 3 months starting from May, the soil temperature in the WT plots was significantly higher than in CH plots. Starting from the end of August, the differences were small and, in September, the peak temperature values in CH plots were warmer than those in WT plots. These patterns were more noticeable at depth 1 (below the organic horizons) than at depths 2 & 3.
The treatment effects on the diurnal patterns of soil temperature at each depth are noticeable four growing seasons after the harvesting treatments were implemented. It is anticipated that the temperature differences due to treatments will be detectable for another 8-12 years (until crown closure). Hence the monitoring of soil temperature at each of the sites will be continued.
Daily mean temperature
Representative daily mean temperatures observed during a 3-year period at the Deersdale study site are included in Figure 4. As in the case of the hourly mean temperature, figure 4a represents the
- temperature recorded at the organic and mineral horizon interface. The values in figures 4b and 4c, respectively, represent the temperatures recorded in the middle and bottom of the rooting zone. Discontinuity in the graphs indicates the period when the data logger failed to record the temperatures. For plotting these graphs, the temperature data were processed with 15% spline function (SAS 1989) to smooth the lines.
In general. the soil temperature was higher in the WT plots than in CH or control plots. This was true for each depth. For statistical comparison of the treatment effects, the Scheffe test was used for the data divided into 15-day intervals. For example. the soil temperatures observed from May 15 to May 30 were compared separately; followed by the next 15-day period. At the beginning of spring, the temperatures in the CH plots were significantly higher than those in either the WT or control plots. The temperatures in the WT plots were certainly higher than those in the control plots. Starting from the end of June, the temperatures in the WT plots were significantly higher than in CH plots. Starting from the middle of August, however. the soil temperature in the CH plots were higher than those in WT plots. During the early spring and fall, slash left on the ground in the CH plots had an insulating effect. The biggest treatment effects however, were observed during the period mid-June to mid-August when the soil temperatures in the WT plots were higher than in the CH plots. These patterns were observed at all depths, although the differences due to treatment effects were smaller in the middle and bottom of the rooting zone than at the organic and mineraI soil interface.
The daily mean temperature patterns recorded at the Deersdale study site were also observed in all the other study sites. The differences in the soils or the comp'osition of the stands in terms of dominant tree species did not affect the temperature pattern.
Heat units
A single statistical evaluation of the treatment effects on soil temperature was not possible because of crossing over of the lines representing the observed data in the CH and WT plots. Therefore, heat units accumulated in the CH, WT, and control plots were calculated. Heat units were calculated using the formula (T-5) multiplied by the number of hours. Below 5°C the microbial activity is negligible, hence only the values above 5°C were considered treatment responses. For calculating heat units, the discontinuity of data points in the graphs again posed a problem. To avoid under estimation of heat units in the cases with discontinuous data, only periods for the temperatures were available for all the plots were used to calculate the number of heat units.
Table 2 contains data showing the calculated cumulative heat units for different 15-day periods. As stated above no values are plotted for periods with missing temperatures. There is a consistent trend in the data showing larger heat units accumulated in the WT plots than in the CH plots. The heat units accumulated in the control plots are the smallest throughout. It is clear that the patterns of heat units accumulated in the orgalic-mineral horizon interface are similar to those in the middle and bottom of the rooting zone. This pattern was observed in all the study sites with temperature recorders.
Presented in the last column of Table 2 are the sums of net cumulative heat units accumulated in each study site. There is a significant difference between heat units accumulated in the WT plots and those in the CH plots at each site. The data, therefore, strongly support the hypothesis that wholetree harvesting raises the soil temperature and probably increases the rate of soil organic matter decomposition throughout the solum (rooting zone).
Soil soiution chemistry
Data processing on the chemistry of soil solutions collected with the lysimeters is complete up to 1991. Only at the Deersdale site are data available for 1992. No statistical evaluation has been camed out on any of the soil solution chemistry. Hence the data for aluminum (Al) and nitrate (NO,) for the Deersdale study site are presented in Figures 5 and 6. In these graphs,the data for the select cut plots (Sel) and the lysimeters installed in the skidrows (Skr) of the WT plots are also included.
Aluminum
Presented in 5a are the concentrations (micrograms per litre) of A1 observed in the leachates collected at the organic and mineral horizon interface. Note that the A1 levels in the CH plots are the highest. The high level of A1 in the CH plots is most probably derived from the slash left on site. The leachates collected from plastic trays located in the field under slash materials also show increased A1 concentrations. Thus, it is logical to conclude that the high level of A1 in the leachates from the organic horizon of CH plots is attributable to the presence of readily leachable A1 in the slash materials. In the leachates from Skr lysimeters the A1 levels were significantly higher than those in the leachates from WT plots with undisturbed organic horizons. In the Skr plots, the temperature and the rate of decomposition are apparently higher than in the WT plots. This is clearly demonstrated by the presence of a significantly high concentration of A1 in the leachate from the middle and the bottom of the rooting zone.
Nitrate
The data for the nitrate levels in the soil solution (Figure 6) appear to be a mirror image to the data for Al. The concentrations of nitrate in the CH plot are the highest. Again this seems to have been derived from the decomposing slash materials, and may not be due to the production of nitrate from the native organic matter. Leachates from trays located below the slash materials have produced nitrate although the concentrations are slightly lower than those in the soil solution. The concentrations of nitrate in the leachates from Skr plots are higher than in any other plots. This is true for each depth, strongly suggesting the movement of nitrate down beyond the rooting zone.
At this time, the data have not been completely processed. Also no calculations have been camed out to convert concentrations of nutrients into quantitative units. The results, however, strongly support the logic that whole-tree harvesting increases soil temperature up to the bottom of the rooting zone more than the conventional harvesting operations. The difference between the effects of WT and CH treatments on the quantities of heat units accumulated is statistically significant. Therefore, it can be inferred that the higher heat units in WT plots have resulted in the rate of decomposition of organic matter that ultimately results in nitrification taking place more in the WT than in the CH plots. Higher levels of A1 and nitrates in the two lysimeters installed in the mineral horizons are good indicators of these reactions.
Acknowledgements
The authors would like to express their most sincere appreciation to various people who worked extra hours and beyond the call of duty. These people include, in alphabetical order: Liz Clarke, Nancy Hay, Daren Johnson, Kyle LeBlanc, Richard Morin, Caroline Simpson, and Denise Storey.
- References
Anderson, F. 1990. Effects of whole-tree harvesting on long-term site productivity - some Swedish views. In Proc. of the Conf. on the impacts of Intensive Harvesting, Fredericton, N.B., Jan. 22, 1990. Comps. - M.K. Mahendrappa, C.M. Simpson, and G.D. van Raalte.
Dyck, W.J., and M. F. Skinner. 1990. Potential for productivity decline in New Zealand radiata pine forests. &. 31 8-332 Sustained Productivity of Forest Soils. a Gessel, lacate, Weetman, and Powers - Proceedings of the 7th North Am. For. Soils Conf., held at the University of British Columbia, Canada
in July 1988. UBC, B.C.
Foster, N.W., and I. K. Morrison. 1982 Nutrient cycling with respect to whole-tree harvesting in natural stands. PJ. 60-65 The Sixth International FPRS Industrial Wood Energy Forum, 1982. Forest Products Research Society, Madison, WI.
Freedman, B. 1981. Intensive forest harvest: A review of nutrient budget considerations. For. Can. - Marit. Reg. In.. Rep. M-X-121.
Hornbeck, J.M. 1990. Nutrient depletion: A problem for forests in New England and eastern Canada. & Proc. of the Conf. on the Impacts of Intensive Harvesting, Fredericton, N.B., Jan. 22, 1990. Comps. M.K. Mahendrappa, C.M. Simpson, and G.D. van Raalte. (In press.)
Kimmins, J.P., D. Blinkley, L. Chattarpaul, and J. de Catanzaro. 1985. Biogeochemistry of temperate forest ecosystems: literature on inventories and dynamics of biomass and nutrients. For. Can. - PNFI Inf. Rep. PI-X-47 E/F.
Lundkvist, H. 1988. Ekological effects of whole tree harvesting - some results from Swedish field experiments. PJ. 131-140 Predicting Consequences of Intensive Forest Harvesting on Longterm Productivity by Site ~lassification. Proceedings of a workshop held a t Hobcaw Barony, Georgetown, S.C., U.S.A., on Oct. 2-9, 1987. j& T.M. Williams and C.A. Gresham.
Mahendrappa, M.K., S. M. Maliondo, and G. D. van Raalte. 1988. Potential acidification of sites due to intensive harvesting in New Brunswick. Pp. 110-1 14 In_ Proceedings of Sixth Canadian Bioenergy R & D Seminar, held at Richmond, B., 16-18 Feb. 1987 (EcJ. Cecile Granger). B.C. Research Canada.
Mahendrappa, M.K., G. D. van Raalte, and S. M. Maliondo. 1989. Forest biomass and nutrient inventories in New Brunswick. PJ. 21 1-215 In Proceedings of the Seventh Canadian Bioenergy R & D Seminar, held at Ottawa, April 24-26, 1989 (Ed. Hogan) N.R.C.C., Ottawa.
Maliondo, S.M. 1989. Possible effects of intensive harvesting on continuous productivity of forest lands. For. Can. - Marit. Reg. Inf. Rep. M-X-171.
Maliondo, S.M., M. K. Mahendrappa, and G. D. van Raalte. 1990. Distribution of biomass and nutrients in some New Brunswick forest stands: possible implications of whole-tree harvesting. For. Can. - Marit. Reg. Inf. Rep. M-X-170.
McCormack, M. 1990. Overview. Proc. qf the Conf. on the Impacts qf Intensive Hanjesting, Fredericton, N.B., Jan. 22, 1990. Comps M.K. Mahendrappa, C.M. Simpson, and G.D. van Raalte.
Rennie, P.J. 1955. Uptake of nutrients in mature forest trees. Plant Soil 7: 49-95.
Riekerk, H. and L. A. Morris. 1983. A constant potential soil water sampler. Soil Sci. Soc. Am. J. 47: 606-608.
SAS Institute Inc. 1989. SASISTAT User's Guide , Version 6, Fourth Edition, Volume 1, Cary.
Smith, C.T., C. W. Martin, and L. M. Tritton. 1986. Proceedings of the ,1986 symposium on the productivity of northern forests following biomass harvesting, held at Univ. N.H., Durham, Mayl-2,1986. USDA For. Serv. NE - GTR - 115.
Smith, C.T., 1990. Intensive harvesting at Weymouth Point, Maine: An evaluation of watershed and microsite impacts. Proc. of the Con& on the Impacts of Intensive Hanpesting, Fredericton, N.B., Jan. 22, 1990. Comps. M.K. Mahendrappa, C.M. Simpson, and G.D. van Raalte.
Tamrn, C.O. 1979. Nutrient cycling and productivity of forest ecosystems. PJ. 2-21 Proceedings of the Impacts of Intensive Harvesting on Forest Nutrient Cycling; a symposium held at Syracuse, N.Y., August 13-16, 1979. State Univ. N.Y., Syracuse, N.Y.
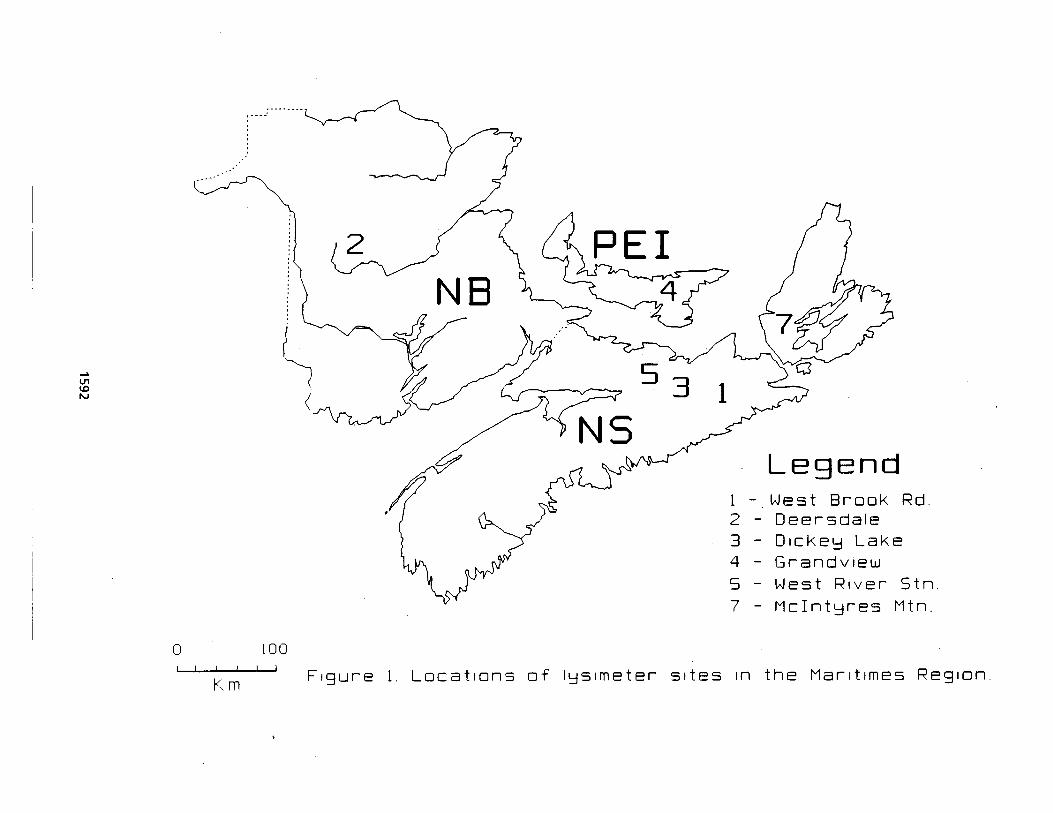
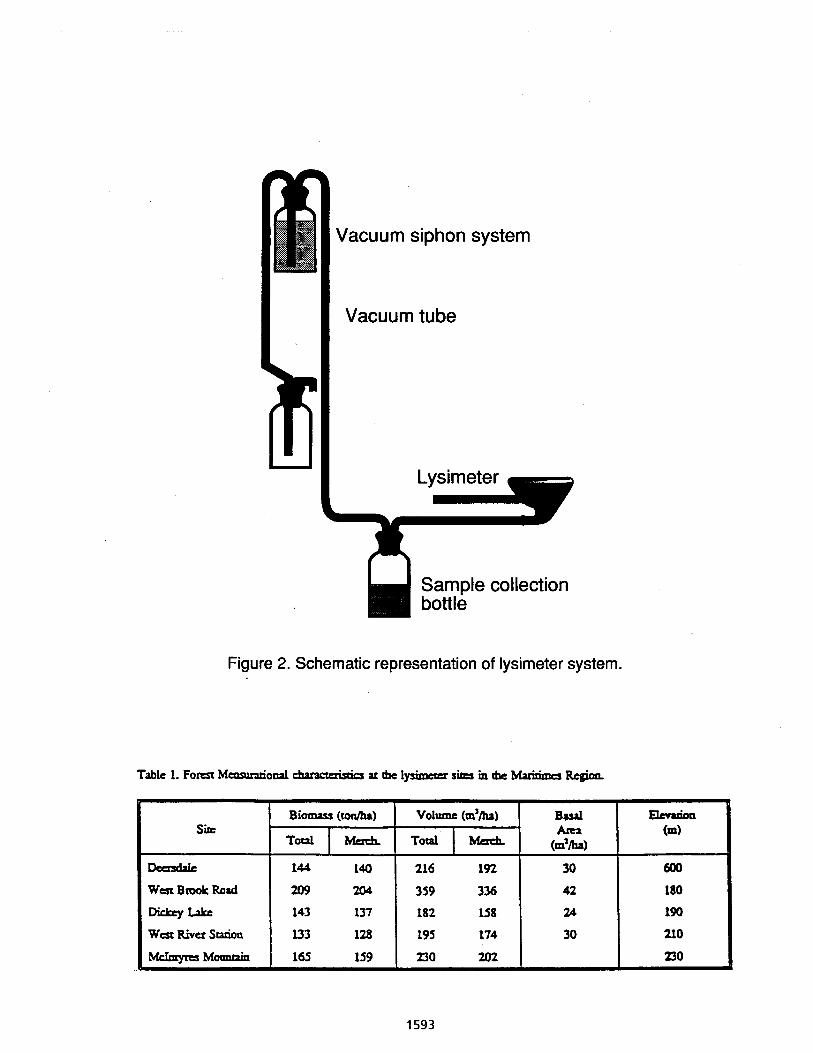
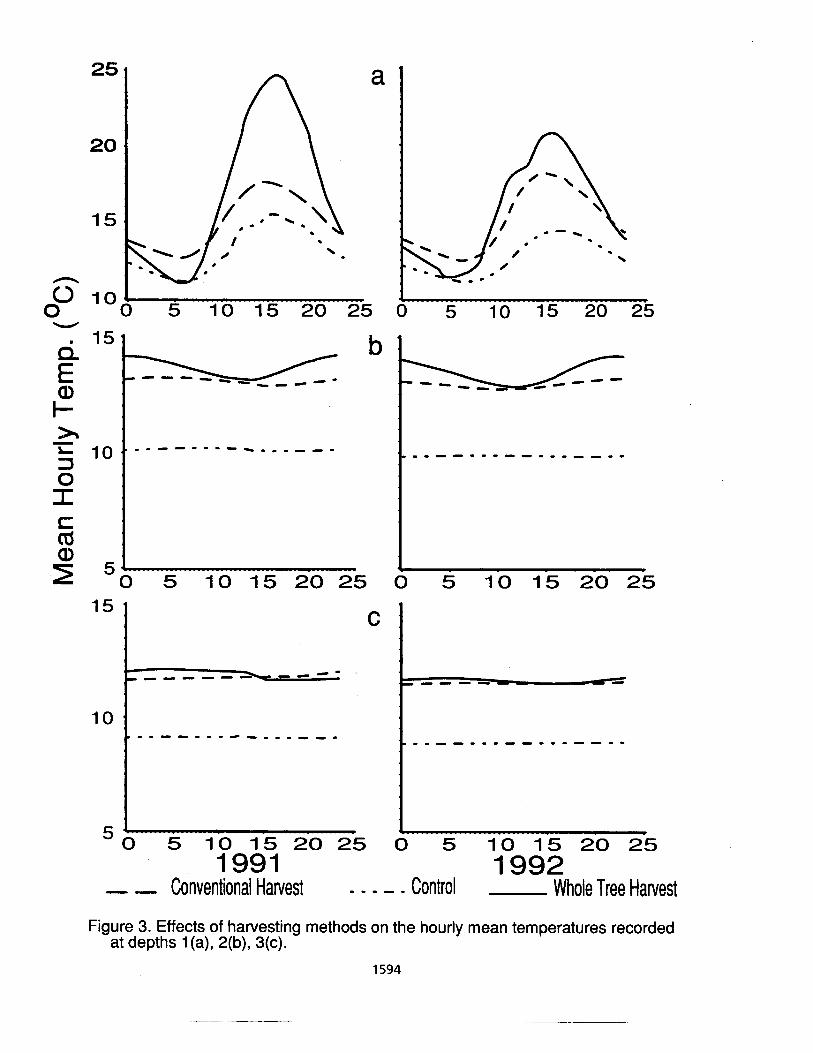
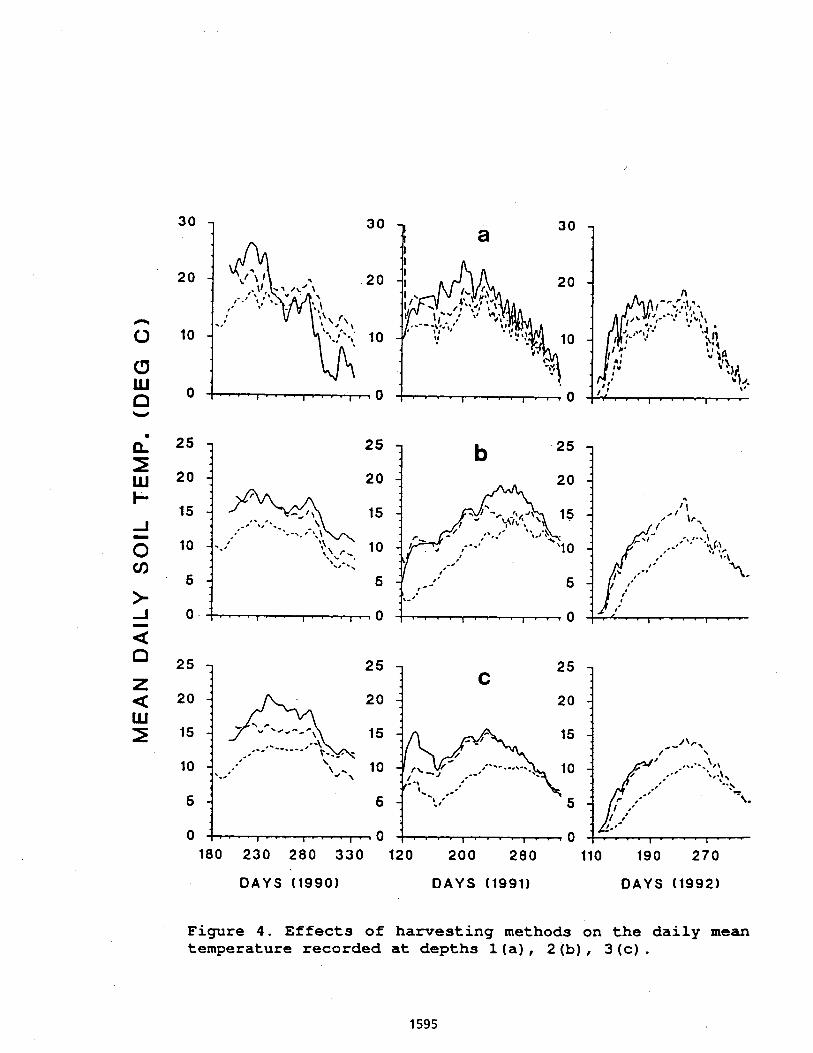
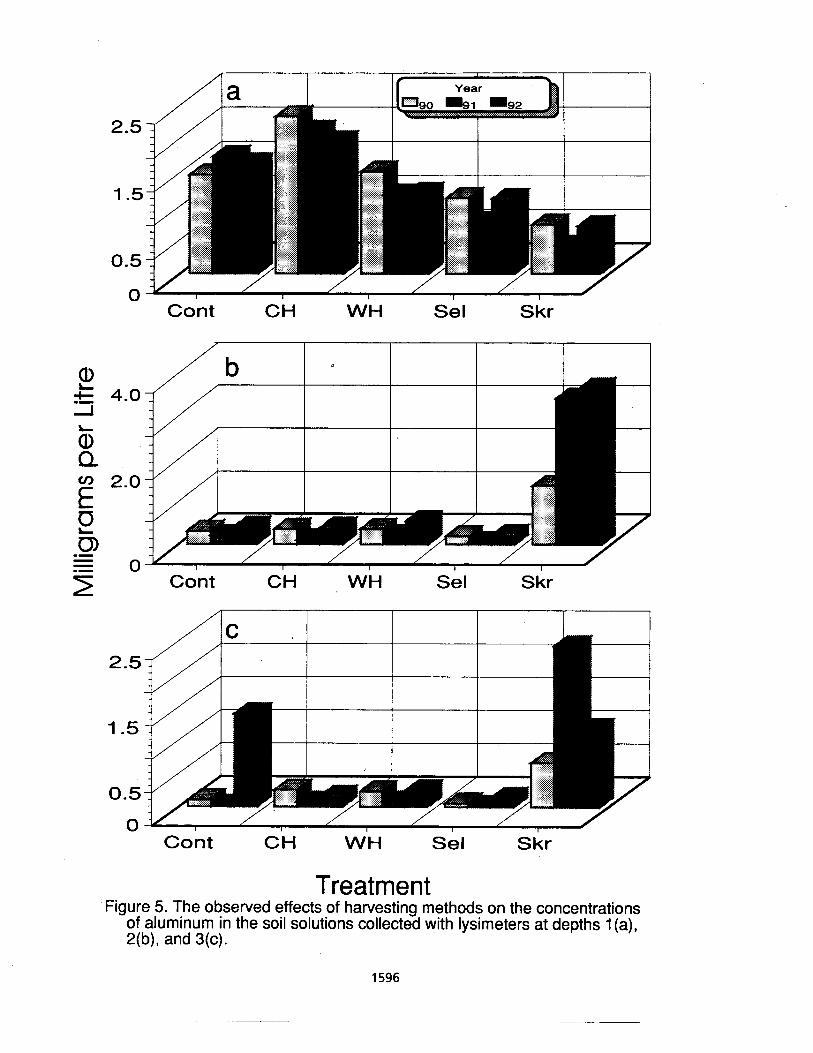
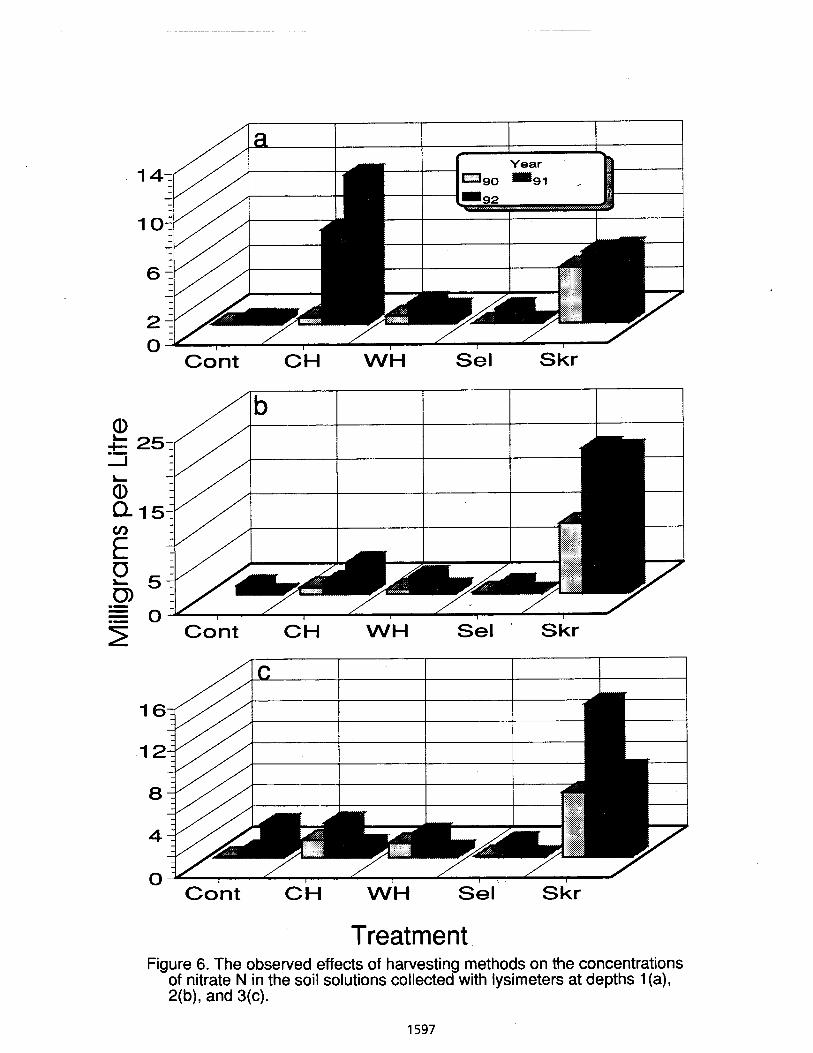
FUELING DIESEL ENGINES WITH METHYL-ESTER SOYBEAN OIL
Leon G. Schumacher William G. Hires Steven C. ~orgelt*
University of Missouri Columbia, MO 65211
ABSTRACT
Two 5.9 liter Curnrnins engines were fueled for a combined total of more than 80,467 km (50,000 miles). One truck, a 1991 Dodge, has been driven approximately 48,280 krn (30,000 miles). The other, a 1992 Dodge, has been driven approximately 32,187 krn (20,000 miles). Fueling these engines with soydiesel increase engine power by 3 percent (1991 engine) and reduced power by 6 percent (1992 engine). The pickups averaged more than 7.1 km/L (16.7 mpg). Analysis of used engine oil samples indicated that the engines were wearing at normal rate. The black exhaust smoke normally observed when a diesel engine accelerates was reduced as much as 86 percent when the diesel engine was fueled with 100% soydiesel. Increased EPA exhaust emissions requirements for diesel engines have created much interest in the use of soydiesel as a fuel for diesel engines.
KEY WORDS. Biofuels, Biodiesel, Methyl-ester, Horsepower, Emissions, Fuel efficiency, Transesterification.
. -.
'L.G. Schumacher, Assistant Professor of Agricultural Education/Engineering, W.G. Hires, Associate Professor of Agricultural Engineering, and S.C. Borgelt, Assistant Professor of Agricultural Engineering, Agricultural Engineering Department, University of Missouri, Columbia, 6521 1
INTRODUCTION
Previous research conducted with diesel engines during the early 1980s in Illinois, Idaho, Missouri, and North Dakota showed that diesel engines could be fueled with vegetable oils (ASAE, 1982). Much of this research, however, was conducted using raw, degummed vegetable oils with engines operating at a constant RPM. An over-the-road (OTR) diesel engine operates under conditions other than those used in these early tests. Such an engine operates under varying loads, with starts and stops, with acceleration and deacceleration, idling, and variable speeds. Very little engine wear and exhaust emissions analysis have not been investigated for OTR vehicles fueled with methyl-ester soybean oil.
RELATED LITERATURE
Romano (1982). stated that fatty acids react readily with metals such as tin, lead, cobalt and manganese at elevated temperatures. Modem diesel engines operate at temperatures that could promote reactions with these metals which are commonly found in diesel engines. He further cautioned that after 200 to 250 hours of operation the crankcase oil of diesel engines fueled with methyl-ester vegetable oils lost lubrication qualities. According to Romano, (1982, p. 114) "a gelatinous deposit caused the metals to wear out." Hassett and Hasan (1982) expressed concerns about the dilution of the lubricating oils.
Kusy (1982) found engine torque and power dropped five percent when fueled with ethyl-ester soybean oil and that visible smoke was similar to operation on diesel fuel. According to Ventura, Nascimento and Bandel (1982, p.397), recorded engine parameters were normal during engine testing. The engine lubricating system, however, approached collapse since the lubricating oil started to thicken. Preliminary observations suggested that engine exhaust smoke emissions would tie lower than predicted by Kusy. Engine testing both in and out of the laboratory were needed to substantiate these visual observations.
PURPOSE AND OBJECTIVES
The purpose of this investigation was to determine the effects of fueling a diesel enginawith methyl- ester soybean oil as compared to fueling the engine with diesel fuel. Factors investigated were: (1) fuel efficiency, (2) engine wear, (3) horspower, and (4) exhaust emission levels.
METHODOLOGY
A 1991 and a 1992 Dodge pickup equipped with direct injection turbocharged 5.9 L diesel engines were the OTR vehicles used in these tests. The pickup engines were fueled'with diesel fuel during the first months of operation. Fueling with soydiesel began after 4,827 km (3000 miles) of operation (199 1 pickup) and after 2.41 3.5 km (1500 miles) of operation (1992 pickup).
Horsepower determinations were made using a chassis dynamometer with the engine operating at 1700, 1900, 2 100,2300, 2500, and 2700 RPM.
Engine exhaust emissions were recorded in an EPA certified laboratory at Cummins Engine Company.
Initially the 1991 pickup engine lubricating oil (Mopar 15w-40) and the engine lubricating oil filter (Mopar) were changed at approximately 4,023 km (2,500 mile) intervals. Engine lubricating oil was sampled at 805 km (500 mile) intervals and analyzed by MFA Oil Company Laboratories. The engine lubricating oil sampling interval and the oil change interval were subsequently lengthened to 1,609 km (1,000 miles) and 4,827 km (3,000 miles) based on recommedations made by MFA Oil Company Laboratory analysists. The 1992 pickup engine lubricating oil sampling procedures and change intervals have remained at 1,609 km (1,000 miles) and 4,827 krn (3,000 miles) intervals.
The engine was examined internally using a horoscope by a John Fabick Tractor Company technician to determine engine wear. Engine oil analysis, broscoping, power measurement, and emissions measurements were conducted by industry specialists. MFA technicians used m atomic absorbtion spectrphotometer when analyzing the lubricating oil samples. The boroscope was a CAT 8T9290. The chassis dynamometer used by John Fabick tractor company was a Super Flow Corporation model SF-601 Vehicle Test System.
Vehicle Modifications:
The engines were not modified. The fuel storage md delivery systems of the trucks were modified. Nitrile rubber-based components in the OEM fuel lines deteriorated when exposed to soydiesel. These components were replaced with either aluminum or nylon reinforced tubing. Original equipment manufacturer (OEM) fuel lines were replaced and the new lines were insulated. -Fuel heaters were installed to warm the fuel when the engine was operating and when the vehicle was not in use. The
- engines were operated on diesel fuel five minutes before shut down and ten minutes after startup in extremely cold weather (-23" C. (- 10" F.).
The soydiesel gelled at 3.30" C (38" F). Stainless steel heat exchangers were installed in the fuel tank and activated during operation in cold weather. These devices were an after-market product that is commonly installed on OTR trucks to prevent diesel fuel from gelling during engine operation. Fuel lines md soydiesel fuel tank were insulated, and two 110V thermostaticly controlled flat mat heating pads were placed beneath the soydiesel tank. The flat mat heating pads were operated in during cold weather. The insulation and flat mat heating pads kept the fuel from gelling when the engine was not running.
The fuel economy while the vehicles were operating on diesel fuel was 9.7 km/L (22.8 mpg). Soydiesel fueling began August 13, 1991 and May 27, 1992. Fuel efficiency during soydiesel fueling fluctuated, depending on how the pickup was operated. The pickups averaged 7.09 km/L (16.7 mpg - 1991) and 7.3 km/L (17.2 mpg - 1992). Fuel efficiency was nearly identical to that obtained when the engine was fueled with diesel fuel under comparable conditions. These information are summarized in Tahle I.
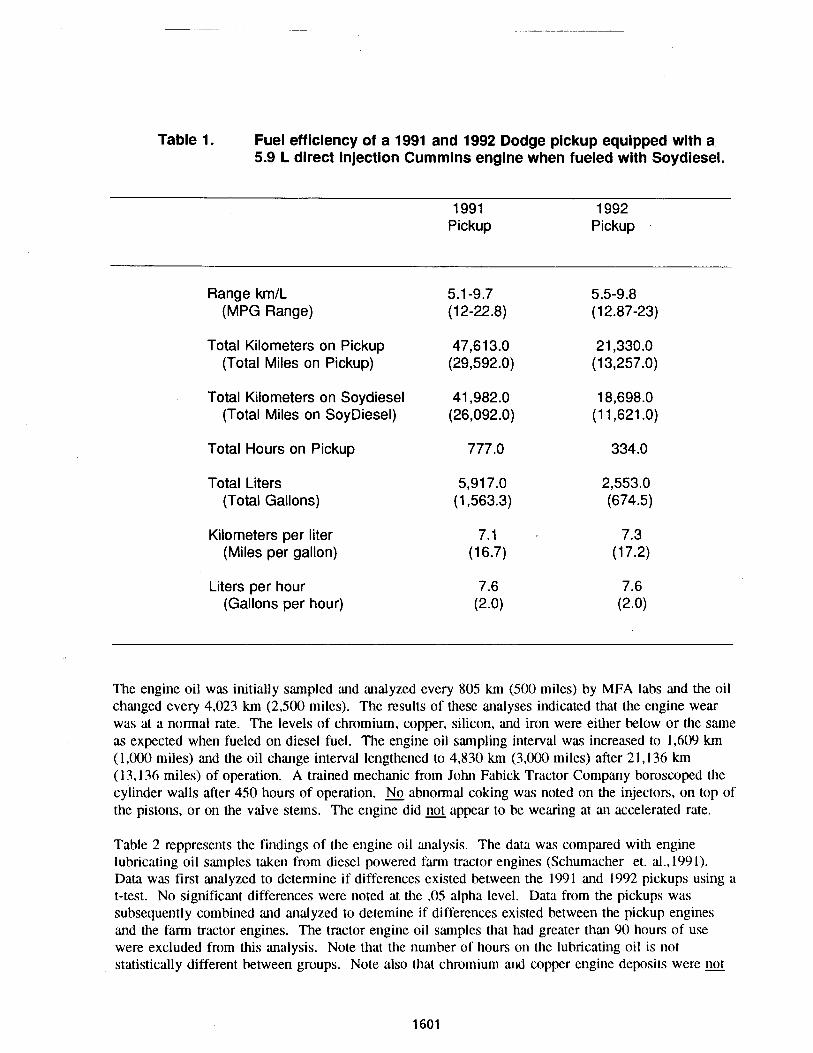
Table 1. Fuel efficiency of a 1991 and 1992 Dodge pickup equipped with a 5.9 L direct injection Cummins engine when fueled with Soydiesel.
1991 1992 Pickup Pickup
Range km/L (MPG Range)
Total Kilometers on Pickup (Total Miles on Pickup)
Total Kilometers on Soydiesel (Total Miles on SoyDiesel)
Total Hours on Pickup
Total Liters (Total Gallons)
Kilometers per liter (Miles per gallon)
Liters per hour (Gallons per hour)
The engine oil was initially sampled and analyzed every 805 km (500 miles) by MFA labs and the oil changed every 4,023 km (2,500 miles). The results of these analyses indicated that the engine wear was at a normal rate. The levels of chromium, copper, silicon, and iron were either below or the same as expected when fueled on diesel fuel. The engine oil sampling interval was increased to 1,609 km (1,000 miles) and the oil change interval lengthened to 4,830 km (3,000 miles) after 21,136 km (13,136 miles) of operation. A trained mechanic from John Fabick Tractor Company boroscoped the cylinder walls after 450 hours of operation. No abnormal coking was noted on the injectors, on top of the pistons, or on the valve stems. The engine did not appear to be wearing at an accelerated rate.
Table 2 reppresents the findings of the engine oil analysis. The data was compared with engine lubricating oil samples taken from diesel powered fann engines (Schumacher et. al.,1991). Data was first analyzed to determine if differences existed between the 1991 and 1992 pickups using a t-test. No significant differences were noted at the .05 alpha level. Data from the pickups was subsequently combined and analyzed to dete~nine if differences existed between the pickup engines and the farm engines. The tractor engine oil samples that had greater than 90 hours of use were excluded from this analysis. Note that the number of hours on the lubricating oil is not statistically different between groups. Note also that chromium and copper engine deposits were not
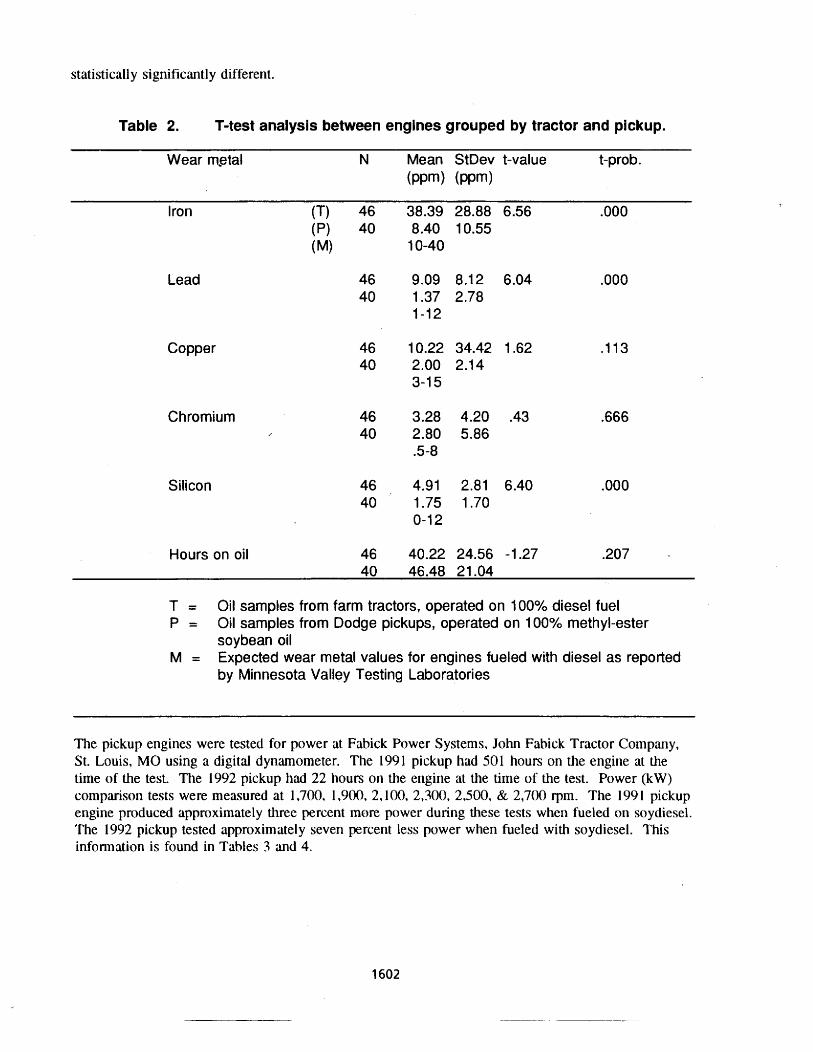
statistically significantly different.
Table 2. T-test analysis between engines grouped by tractor and pickup.
Wear mptal N Mean StDev t-value t-prob. ( P P ~ ) ( P P ~ )
I ron
Lead
Copper
(T) 46 38.39 28.88 6.56 (p) 40 8.40 10.55 (M) 1 0-40
Chromium 46 3.28 4.20 .43 ,666 / 40 2.80 5.86
.5-8
Silicon 46 4.91 2.81 6.40 .OOO 40 1.75 1.70
0-1 2
Hours on oil 46 40.22 24.56 -1.27 .207
T = Oil samples from farm tractors, operated on 100% diesel fuel P = Oil samples from Dodge pickups, operated on 100% methyl-ester
soybean oil M = Expected wear metal values for engines fueled with diesel as reported
by Minnesota Valley Testing Laboratories
The pickup engines were tested for power at Fabick Power Systems, John Fabick Tractor Company, St. Louis, MO using a digital dynamometer. The 1991 pickup had 501 hours on the engine at the time of the test. The 1992 pickup had 22 hours on the engine at the time of the test. Power (kW) comparison tests were measured at 1,700, 1,900, 2,100, 2,300, 2,500, & 2,700 rpm. The 1991 pickup engine produced approximately three percent Inore power during these tests when fueled on soydiesel. The 1992 pickup tested approximately seven percent less power when fueled with soydiesel. This information is found in Tables 3 and 4.
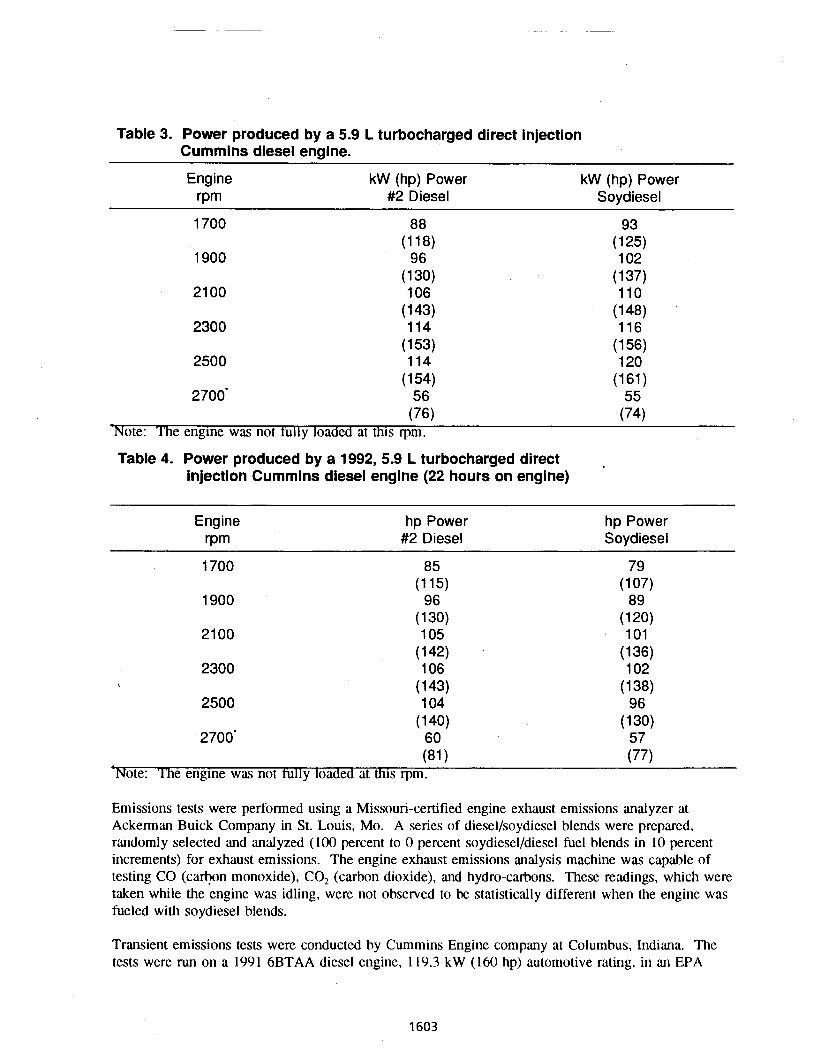
Table 3. Power produced by a 5.9 L turbocharged direct injection Cummins diesel englne.
Engine kW (hp) Power kW (hp) Power rPm #2 Diesel Soydiesel
1700 88 93 (1 18) (125)
1900 96 102 (130)
21 00 106 (137) 110
(143) (148) 2300 114 116
(1 53) 2500 114
(1 56) 120
(154) 2700' 56
(161) 55
(76) (74) ?Vote: The engine was not fully loaded at this rpm.
Table 4. Power produced by a 1992, 5.9 L turbocharged direct p
injection Cummins diesel engine (22 hours on engine)
Engine hp Power hp Power rPm #2 Diesel Soydiesel
1700 85 79 (1 15) (107)
1900 96 8 9 (130) (120)
2100 1 05 101 (142) (136)
2300 106 1 02 \ (143) (138)
2500 1 04 96 ( 140)
2700' 60 (130)
57 (81 (77)
?Vote: The engine was not hlly loaded at this rpm.
Emissions tests were performed using a Missouri-certified engine exhaust emissions analyzer at Ackerman Buick Company in St. Louis, Mo. A series of diesel/soydiesel blends were prepared, randomly selected and analyzed (100 percent to 0 percent soydiesel/diesel fuel blends in 10 percent increments) for exhaust emissions. The engine exhaust emissions analysis machine was capable of testing CO (carbon monoxide), CO, (carbon dioxide), and hydro-carbons. These readings, which were taken while the engine was idling, were not ohserved to be statistically different when the engine was fueled with soydiesel blends.
Transient emissions tests were conducted hy Cummins Engine company at Columbus, Indiana. The tests were run on a 1991 6BTAA diesel engine, 119.3 kW (160 hp) automotive rating, in an EPA
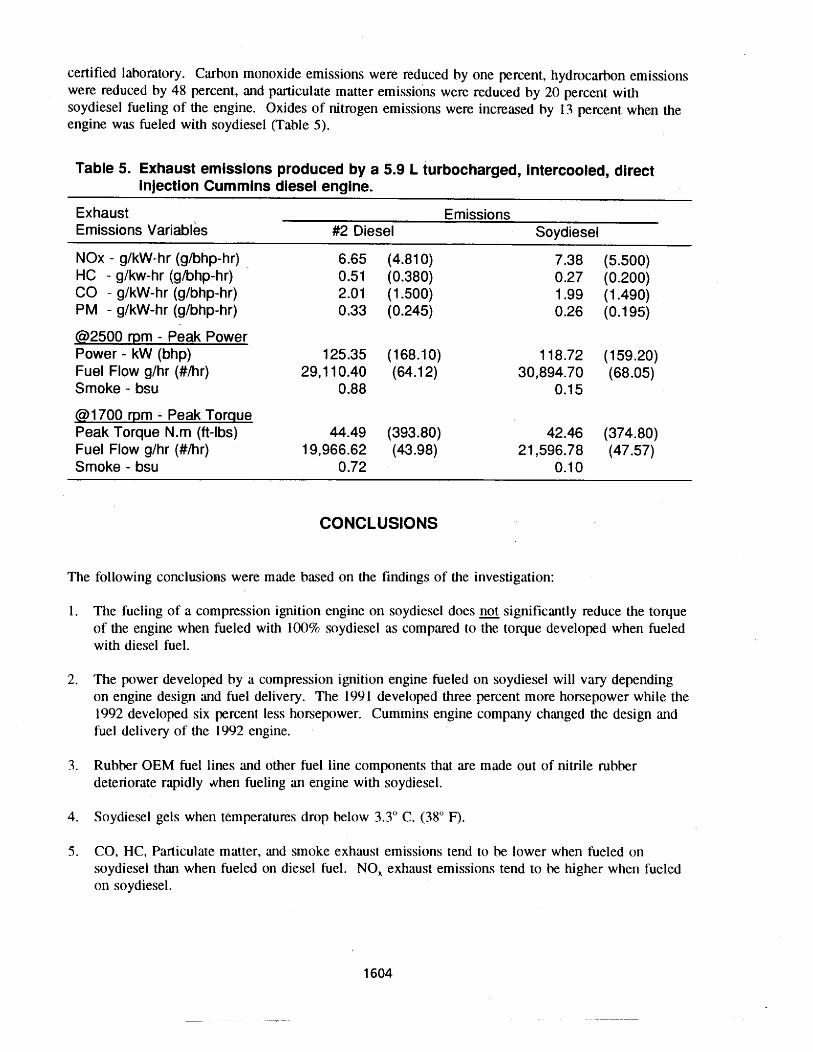
certified laboratory. Carbon monoxide emissions were reduced by one percent, hydrocarbon emissions were reduced by 48 percent, and particulate matter emissions were reduced by 20 percent with soydiesel fueling of the engine. Oxides of nitrogen emissions were increased by 13 percent when the engine was fueled with soydiesel (Table 5).
Table 5. Exhaust emissions produced by a 5.9 L turbocharged, intercooled, direct injection Cummins diesel engine.
Exhaust Emissions Emissions variables #2 Diesel Soydiesel
NOx - g1kW-hr (glbhp-hr) HC - glkw-hr (glbhp-hr) CO - g/kW-hr (glbhp-hr) PM - g1kW-hr (glbhp-hr)
@2500 rnm - Peak Power Power - kW (bhp) 125.35 (168.10) 118.72 (159.20) Fuel Flow glhr (#/hr) 29,110.40 (64.1 2) 30,894.70 (68.05) Smoke - bsu 0.88 0.1 5
@I700 rpm - Peak Torque Peak Torque N.m (ft-lbs) 44.49 (393.80) 42.46 (374.80) Fuel Flow glhr (#/hr) 1 9,966.62 (43.98) 21,596.78 (47.57) Smoke - bsu 0.72 0.1 0
CONCLUSIONS
The following conclusions were made based on the findings of the investigation:
1. The fueling of a compression ignition engine on soydiesel does not significantly reduce the torque of the engine when fueled with 100% soydiesel as compared to the torque developed when fueled with diesel fuel.
2. The power developed by a compression ignition engine fueled on soydiesel will vary depending on engine design and fuel delivery. The 1991 developed three percent more horsepower while the 1992 developed six percent less horsepower. Curnmins engine company changed the design and fuel delivery of the 1992 engine.
3. Rubber OEM fuel lines and other fuel line components that are made out of nitrile rubber deteriorate rapidly ahen fueling an engine with soydiesel.
4. Soydiesel gels when temperatures drop below 3.3" C. (38" F).
5. CO, HC, Particulate matter, and smoke exhaust emissions tend to be lower when fueled on soydiesel than when fueled on diesel fuel. NO, exhaust emissions tend to be higher when fueled on soydiesel.

6. Materials from engine wear are found to be significantly lower as measured by analysis of the engine lubricating oil (Fe, Pb, Si) when the engine is fueled on 100 percent soydiesel as compared to #2 diesel fuel. Fueling of the engines on 100 percent soydiesel did not increase the amount of engine wear materials normally found in the engine lubricating oil.
1. Rubber OEM fuel lines and other rubber fuel line components should be replaced before fueling an engine with soydiesel. Research should be conducted that examines fuel line component compatiblity with soydiesel.
2. Heating devices must be used to prevent gelling of soudiesel fuel when ambient temperatures drop below 3.33' C. (38' F). Research must be conducted to analyze the effectiveness of existing pour point enhancers on soydiesel.
3. Research must be conducted to determine the most efficient means of reducing NO, exhaust emissions. Concurrent research must be conducted to determine how HC, CO, and PM emissions will change when the engine has been optimized for NO, emissions.
4. Engine lubricating oil analysis data collection should be replicated. Preliminary findings suggest that the engine is not out wearing more rapidly Wan if it were fueled with #2 diesel fuel.
BIBLIOGRAPHY
1982. "Vegetable Oil Fuels." In Proceedin~s of the International Conference on Plant and Vegetable Oils as Fuels--Fargo, North Dakota. St. Joseph, MI. : American Society of Agricultural Engineers.
Hassett, D. J. and Hasan, R. A. 1982. "Sunflower Oil Methyl Ester as a Diesel Fuel." In Proceedings of the International Conference on Plant and Vegetable Oils as Fuels--Fargo, North Dakota. St. Joseph, MI: American Society of Agricultural Engineers.
Kusy, P. F. 1982. "Transesterification of Vegetable Oils for Fuels." in Proceedings of the International Conference on Plant and Vegetable Oils as Fuels--Far~o, North Dakota. St. Joseph, MI: American Society of Agricultural Engineers.
Romano, S. 1982. "Vegetable Oils: A New Alternative." In Proceedings of the International Conference on Plant and Vegetable Oils as Fuels--Furgo, North Dakota. St. Joseph, MI: American Society of Agricultural Engineers.
Schumacher, L. G., Frisby, J . C. & Hires, W. G. 199 1. "Tractor PTO Horsepower, Filter Maintencame and Tractor Engine Oil Analysis." Applied ~ngineerink in Agriculture, 7:625-629.
Ventura, L. M., Nascimento, A. C. & Bandel, W. 1982. "First Results With Mercedes-Benz DI Diesel Engines." In Proceedings of the International Confrrence on Plant and Vr~etable Oils as Fuels--Fargo, North Dakota. St. Joseph, MI: American Society of Agricultural Engineers.
HAZARDOUS EMISSIONS, OPERATING PRACTICES, AND AIR REGULATIONS AT
INDUSTRIAL WOOD-FIRED FACILITIES IN WISCONSIN
A. J. Hubbard, P.E. Bureau of Air Management
Wisconsin Department of Natural Resources Madison, Wisconsin 53703
Abstract
Since October of 1988 the State of Wisconsin Department of Natural Resources has regulated over four hundred substances as hazardous air pollutants. The rule regulates new as well as existing sources of air pollution in Wisconsin. Consequently, all permits to operate an air pollution source in Wisconsin must address the hazardous air emissions potential of the source.
While widely perceived as a clean-burning fuel, wood is often burned in a manner which clearly results in significant emissions of very hazardous air pollutants. Research conducted on a 20 million BTU per hour wood-fired spreader stoker boiler in northern Wisconsin showed that this boiler has the potential to emit 0.022 pound of benzene and 0.012 pound of formaldehyde per ton (lblton) of wood fired. Recent stack tests at more than a dozen other small industrial wood-fired facilities in Wisconsin show a range of formaldehyde emissions of 0.0007 - 0.1950 lblton.
Work at Birchwood Lumber & Veneer showed that the benzene and formaldehyde emission rates under good firing conditions are an order of magnitude lower than the benzene and formaldehyde emission rates under poor firing conditions. This finding has supported Wisconsin's regulatory approach of encouraging wood-fired facilities to enhance the quality of the combustion process as a technique to minimize the hazardous air pollution potential of industrial wood combustion. The Wisconsin strategy is to define "good combustion technology" through easily measurable combustion parameters rather than emission standards.
This paper presents several techniques in use in Wisconsin to comply with "good combustion technology" for industrial wood-fired furnaces. These techniques include fuel blending, overfire air, furnace insulation, and proper grate design.
Introduction
On October 1, 1988 the State of Wisconsin Department of Natural Resources promulgated a rule regulating hazardous air pollutants. This rule, which appears as chapter NR 445, Wisconsin Administrative Code, regulates new as well as existing sources of air pollution in Wisconsin. Consequently, all permits to operate an air pollution source in Wisconsin must address the hazardous air emissions potential of the source.
Especially in the northern areas, Wisconsin has a significant population of wood-fired boilers. Wood is a convenient source of energy in Wisconsin and has appeal if for no other reason than it 'is renewable. While widely perceived as a clean-burning fuel, wood is often burned in a manner which clearly results in significant emissions of very hazardous air pollutants. Residential wood stoves, for example, emit approximately 0.5 pound of formaldehyde per ton of wood fired according to U.S. EPA (1). But wood stoves are not industrial furnaces, so the question for air pollution engineers is ''What is the hazardous air pollution potential of industrial wood combustion?"
This paper presents Wisconsin's regulatory strategy toward hazardous air pollutants emitted from wood-burning facilities. When good combustion practices are applied to wood, the hazardous air pollutants which result from incomplete combustion are minimized, which is a form of pollution prevention. The paper also cites examples of measures taken by several wood-fired facilities to achieve "good combustion technologyt', as defined by the Wisconsin Department of Natural Resources (DNR). To establish the rationale for DNR's regulatory strategy, the paper first summarizes the results of the wood combustion study conducted by the Wisconsin DNR at Birchwood Lumber & Veneer during the first week of April, 1991. The new wood-fired boiler at Birchwood Lumber & Veneer represents a common size and type of boiler for northern Wisconsin.
Summary of Results of the Birchwood Study
During the first week of April, 1991 the Wisconsin Department of Natural Resources conducted a series of air emissions tests of a small industrial wood-fired boiler located at Birchwood Lumber & Veneer in northern Wisconsin. (2) The boiler was firing a virgin hogged wood/wood waste fuel with a moisture content of about 35 percent. The pollutants measured were particulates, nitrogen oxides, carbon monoxide, total hydrocarbons, benzene, formaldehyde, polycyclic organic matter (POM, e.g. benzo (a) pyrene), aldehydes, and trace metals.
It is apparent from the testing at Birchwood that wood-fired furnace CO and oxygen levels are inversely related and that a properly operating wood-fired furnace can sustain a relatively steady combustion condition even with oxygen fluctuations. The testing at Birchwood also showed that the CO concentration within a wood-fired furnace can vary over nearly three orders of magnitude. This is significant because the results of this study also
suggest that the emissions of products of incomplete combustion, such as benzene and polycyclic organic matter, tend to follow CO concentration.
The study at Birchwood examined the correlation between the oxygen (O,), carbon monoxide (CO), and total hydrocarbon (THC) concentrations in the flue gas, and furnace temperature and levels of hazardous air pollutants. Emissions data for benzene, formaldehyde, and polycyclic organic matter measured during the testing of Boiler No. 3 (the new boiler) are contained within the results. That carbon monoxide concentration indicates the hazardous emission potential of wood combustion is well illustrated by the plot of benzene emission rate as a function of CO. This correlation is less evident for formaldehyde and POM emissions.
When the benzene, formaldehyde, and POM emissions data are plotted versus combustion air ratio, a family of concave upwards curves results. In other words, Birchwood's boiler apparently may be set up with a combustion air configuration which minimizes hazardous air ~ollution. This result is especially true for benzene and POM emissions. If the balance of combustion air heavily favors underfire air, there is apparently insufficient combustion air in the upper furnace to complete the combustion of the products of incomplete combustion (PICs) which are formed during the early stages of combustion. Conversely, with excessive overfire air, the flame quenching effect of too much combustion air in the upper furnace appears to suppress the combustion of the PICs at that stage of the combustion process. In addition, PIC formation may have been exacerbated by the relatively starved combustion conditions at the fuel bed resulting from the shift of combustion air from the lower furnace to the overfire air ports.
The hazardous air pollution-minimizing behavior described above is generally not exhibited by trace metal emissions. On the other hand, the emissions of front-half particulate matter were found to correlate fairly well with carbon monoxide concentration.
The study compares the formaldehyde emissions from an existing Birchwood boiler and the new boiler. It is evident that the older boiler emitted formaldehyde at a significantly higher rate, but the general trend of increasing formaldehyde emissions with increasing CO concentration is exhibited by both boilers.
The study generated two sets of non-criteria pollutant emission factors for wood combustion. (ibid) The emission factors under the heading "Gbod Combustion Value" represent the arithmetic average of the measured emission rates when the boiler was operating normally. When the boiler was in an upset or unsteady condition, the quality of the combustion was poor, resulting in excessive emissions. This peak value for a given pollutant represents the emission potential for that pollutant measured during the study.
The study contains a comparison of the potential emissions of hazardous pollutants from the combustion of virgin wood with the rules regulating such emissions in Wisconsin. Chapter NR 445 of the Wisconsin Administrative Code regulates hazardous pollutants in various ways, but only if the potential emissions (before controls are applied) exceed particular de rninirnw emission rates. For example,, if a wood-fired furnace emits more than
300 pounds of benzene in a year, the furnace must control those benzene emissions to the extent consistent with ''lowest achievable emission rate" (LAER).
The study offers a comparison of published hazardous air pollutant emission factors for industrial wood combustion with the emission factors derived from the Birchwood study. In almost every case the published emission factor is based on data from woodstoves. The results of the Birchwood study show that such woodstove data generally overestimate the hazardous emission potential of industrial wood combustion. In some cases, the difference spans several orders of magnitude.
I
Conclusions from the Birchwood Study
There were seven principal conclusions to draw from the 1991 wood combustion study at Birchwood Lumber & Veneer.
1. The ratio of overfire to underfire air appears to play a very important role in the hazardous emission potential of wood firing, especially for emissions of benzene and polycyclic organic matter (POM).
2. Carbon monoxide flue gas concentration is well correlated with benzene, arsenic, lead, and front-half particulate emissions, and reasonably well with most of the other hazardous emissions measured.
3. A set of emission factors to predict non-criteria pollutant emission levels from virgin wood fired under good combustion conditions is available from this study.
4. A set of emission factors to predict non-criteria pollutant emission levels from virgin wood fired under poor combustion conditions is available from this study.
5. The benzene and formaldehyde emission rates under good firing conditions are an order of magnitude lower than the benzene and formaldehyde emission rates under poor firing conditions.
6. For polycyclic organic matter and trace metal emissions, the difference between the emission rates under good and poor firing conditions is a factor of two to five.
7. Under the hazardous air pollution rules in Wisconsin, and based on the emission factors derived from this investigation, a wood-fired boiler with a maximum continuous heat input of less than 18 million BTU per hour represents an insignificant source of hazardous air contaminants.
Regulating Hazardous Air Pollutants From Wood-Fired Facilities in Wisconsin
Concern about potentially hazardous emissions from wood combustion has led the Wisconsin Department of Natural Resources to regulate these emissions. The regulations for hazardous air pollutants from existing air pollution sources provide an exemption for combustion processes which employ "good combustion technology". (3) That is, sources which maintain at the furnace exit a maximum CO concentration of 600 parts per million (ppm) (500 ppm for large units) corrected to 7 percent 0,, a minimum gas temperature of 1250 OF, and a minimum furnace gas residence time of 1 second by definition have "good combustion technology".
This regulatory approach does not favor one furnace design over another, since the Department's definition of "good combustion technology" is a performance-based approach based on the "three T s of combustion", namely time, temperature, and turbulence. As long as the furnace can satisfy the good combustion criteria, the exemption applies, and the Department does not require BACT (best available control technology) or LAER (lowest achievable emission rate) for the hazardous air emissions. In this way, Wisconsin DNR is implementing a regulatory strategy based on the pollution prevention concept.
Techniques to Minimize Products of Incomplete Combustion
Not all wood-fired furnaces in Wisconsin were able to satisfy the good combustion technology (GCT) criteria when the regulation was introduced. A variety of operating techniques and furnace modifications have been developed in Wisconsin to bring wood combustion sources into compliance with the GCT criteria. Because CO is a surrogate for other products of incomplete combustion, many of which are carcinogenic, the reduction of furnace CO emissions to the level required under GCI' has allowed these combustion units to successfully address the concerns about hazardous emissions.
Emission Reduction by Fuel Blending
The Bay Front Generating Station of Northern States Power Company (NSP), located in Ashland, Wisconsin, has shown that it can substantially reduce CO emissions from its wood-fired boilers by blending a high heating value fuel with the wood. A fuel mixture of 5 percent bituminous coal or shredded tires with 95 percent wood (by weight) resulted in furnace CO emissions an order of magnitude lower than during wood-only operation. Bituminous coal and tires have heating values of about 12,000 and 15,000 BTU per pound, whe~eas wood has a heating value of about 5500 BTU per pound.
Figures 1 and 2a through 2c illustrate the dramatic CO emissions reduction achieved through adding coal to wood at Bay Front's Boiler No. 2, a 275 MMBTU/hr spreader stoker type utility boiler. Similar emission reductions were achieved when shredded tires were added to the wood.
The presence of the higher heating value fuel on the grate appears to alter the nature of the combustion in this particular furnace. A hotter flame at the fuel bed promotes better combustion at that location, and a hotter flame propagating through the furnace results in more effective combustion in the upper regions of the furnace. Since CO is a product of incomplete combustion, it is clear that the use of the high heating value fuel enhances the quality of the combustion process in this furnace.
Emission Reduction by Overfire Air and Furnace Insulation
A furnace is not always able to complete the conversion of intermediate combustion products to carbon dioxide (CO,) and water vapor. kany wood-fired furnace flame fronts encounter an inadequate supply of oxygen above the grate or enough of a heat sink to cause flame cooling sufficient to retard the progress of combustion. In either situation, the combustion process proceeds well for a relatively short distance above the fuel bed, meaning that the products of incomplete combustion (PICs) which are formed in the middle furnace never have a chance to react to form CO, and water. As a result, these PICs are emitted from the furnace and to the atmosphere via the stack.
Several boilers in Wisconsin have undergone furnace modifications to address this upper furnace problem, including Boilers 1 and 2 at the Bay Front Generating Station. The approach at Bay Front was to optimize the delivery of overfire combustion air to these boilers. While these stoker boilers were equipped with overfire air ports originally, it was apparent that the original system was unable to deliver combustion air effectively to all parts of the furnace. As a result, the engineering consulting firm Stone & Webster was retained by NSP to design a new overfire air system for Bay Front Boilers 1 and 2. Figure 3 illustrates this design. Once the new overfire air systems were in place, NSP was able to complete the furnace optimization process and significantly improve the air pollution performance of these units.
Provision for adequate combustion air in the upper furnace allows the combustion process to complete before the gases actually leave the furnace. Consequently, the emissions of CO and other products of incomplete combustion (including formaldehyde and benzene) are reduced relative to the starved upper furnace combustion condition in the absence of overfire air.
Modifications to furnace refractory surfaces and exterior insulation may enable the furnace to maintain a fireside wall temperature sufficient to reduce the flame ,cooling effect associated with bulk to wall thermal gradients. If conductive heat transfer through the furnace wall can be reduced, then the flame heat loss by radiation will also be reduced since the fireside wall temperature will be increased.
While it is essential to provide an adequate supply of combustion air to the upper furnace, it is possible to provide too much. Excessive amounts of combustion air serve as a heat sink, especially if this combustion air is not preheated to a temperature approaching the furnace gas bulk temperature. This convective cooling effect hinders the ability of the
flame front to complete the combustion process in this region of the furnace, which leads to excessive emissions of CO and other products of incomplete combustion.
Emission Reduction by Proper Grate Design
Several wood-fired boilers in Wisconsin have applied the technique of grate hole sizing for the purpose of enhancing the efficiency of combustion. As wood sits on a grate and burns, combustion air is generally supplied through the grate holes from underneath the grate by a forced draft fan. This underfire air theoretically provides an adequate supply of air for the initial stages of combustion throughout the fuel bed. If the underfire air is unevenly 'distributed, however, pockets of incomplete combustion will be established and the furnace's CO emissions will be excessive. If the underfire air is generally insufficient, the combustion as a whole will suffer due to the starved combustion condition. Therefore, proper grate hole design is very important for effective combustion.
St. Croix Valley Hardwoods operates a small new wood-fired boiler in northwest Wisconsin. To reduce this boiler's CO emissions to the level prescribed for "good combustion technology", the grate design was modified to allow for more uniform pressure drop and air distribution across the fuel bed. In this situation, the CO emissions were reduced from approximately 1800 ppm to 200-400 ppm. Furnace arch modifications also aided the CO reduction by altering the furnace flow pattern so as to improve the quality of upper furnace combustion. By turning the upper furnace gas back on itself, additional opportunities for completion of combustion become available with the net effect of reducing emissions of CO and other products of incomplete combustion from the furnace.
The Bay Front Generating Station also considered grate hole size modifications, but only after first establishing an effective system of overfire combustion air. The grate hole sizing technique was a technique proposed for fine tuning the quality of combustion of the boilers at Bay Front, once the overfire air system was working properly.
Conclusions
By encouraging wood-fired facilities to employ good combustion practices, Wisconsin DNR is applying the pollution prevention concept to the regulation of hazardous air pollutants.
Several techniques to reduce emissions of CO and other products of incomplete combustion from wood combustion have been successful in Wisconsin. Blending a high heating value fuel, such as coal or shredded tires, with wood does not involve any physical changes to the furnace and dramatically reduced CO emissions at a utility wood-fired boiler. Optimizing the system of overfire combustion air has been a very effective means of increasing the overall combustion effectiveness of several furnaces. A small wood-fired boiler in Wisconsin substantially reduced CO emissions by improving the furnace grate design and furnace flow pattern.
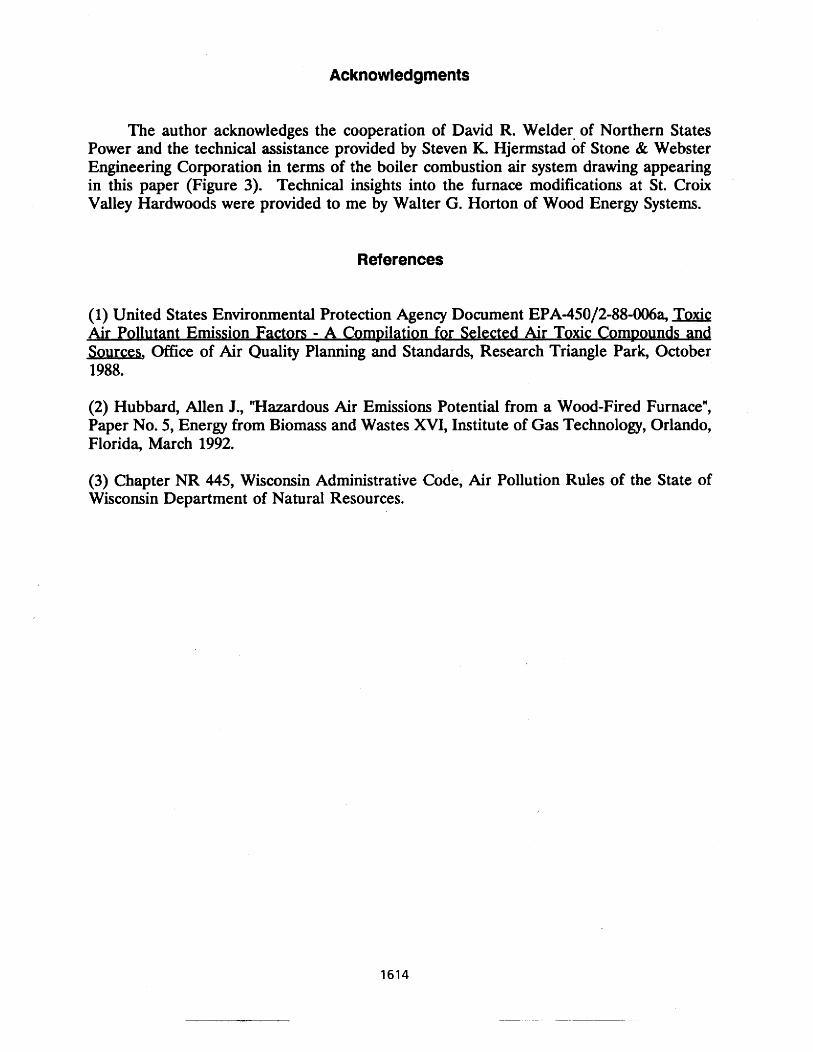
Acknowledgments
The author acknowledges the cooperation of David R. Welder of Northern States Power and the technical assistance provided by Steven K. Hjermstad of Stone & Webster Engineering Corporation in terms of the boiler combustion air system drawing appearing in this paper (Figure 3). Technical insights into the furnace modifications at St. Croix Valley Hardwoods were provided to me by Walter G. Horton of Wood Energy Systems.
References
(1) United States Environmental Protection Agency Document EPA-45012-88-006a, Air Pollutant Emission Factors - A Compilation for Selected Air Toxic Compounds and Sources, Office of Air Quality Planning and Standards, Research Triangle Park, October 1988.
(2) Hubbard, Allen J., "Hazardous Air Emissions Potential from a Wood-Fired Furnace", Paper No. 5, Energy from Biomass and Wastes XVI, Institute of Gas Technology, Orlando, Florida, March 1992.
(3) Chapter NR 445, Wisconsin Administrative Code, Air Pollution Rules of the State of Wisconsin Department of Natural Resources.
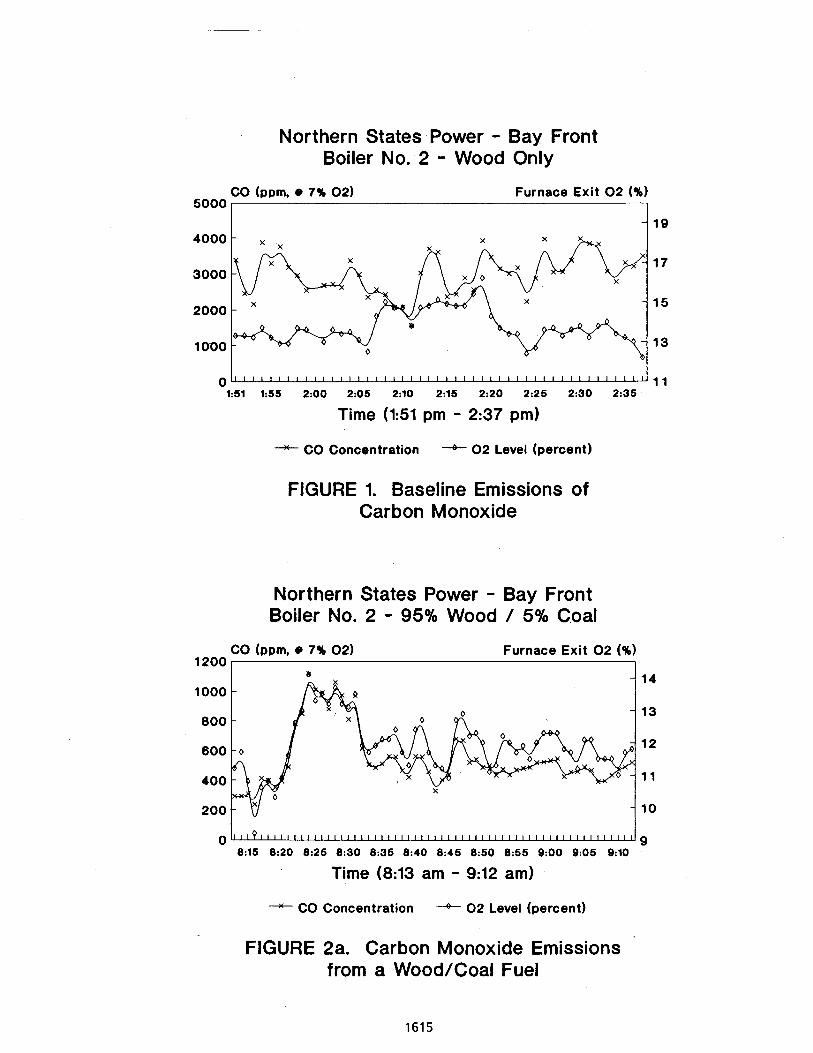
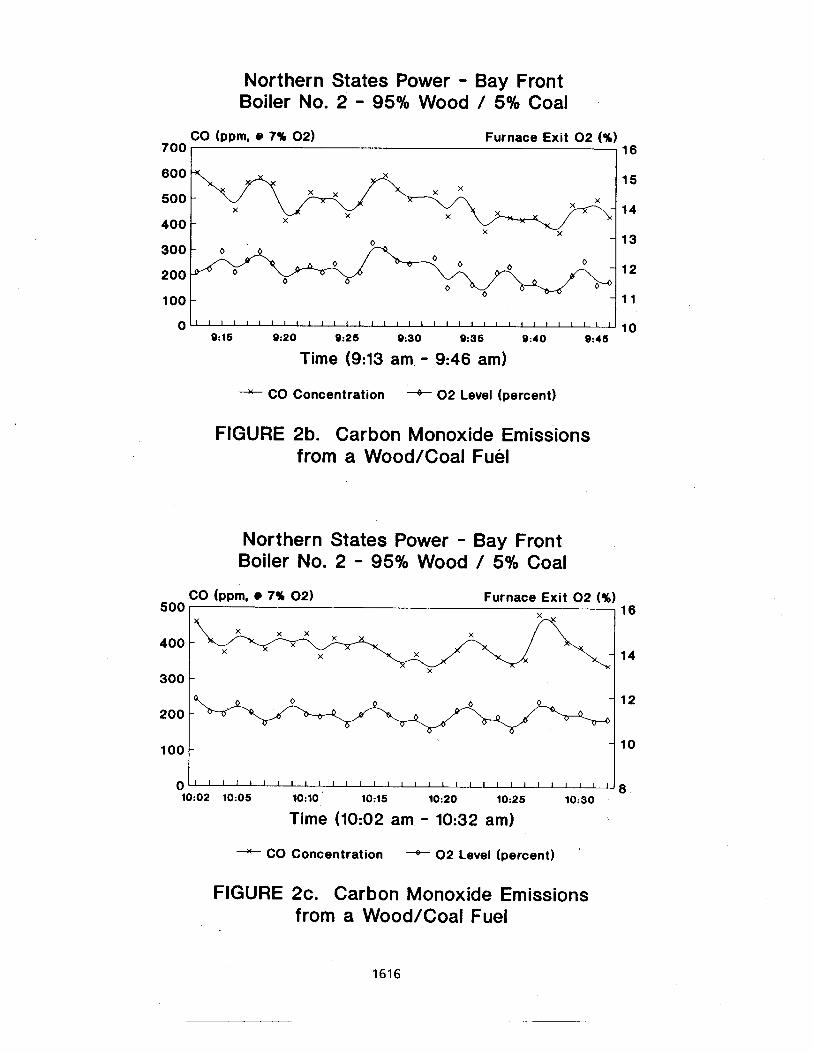
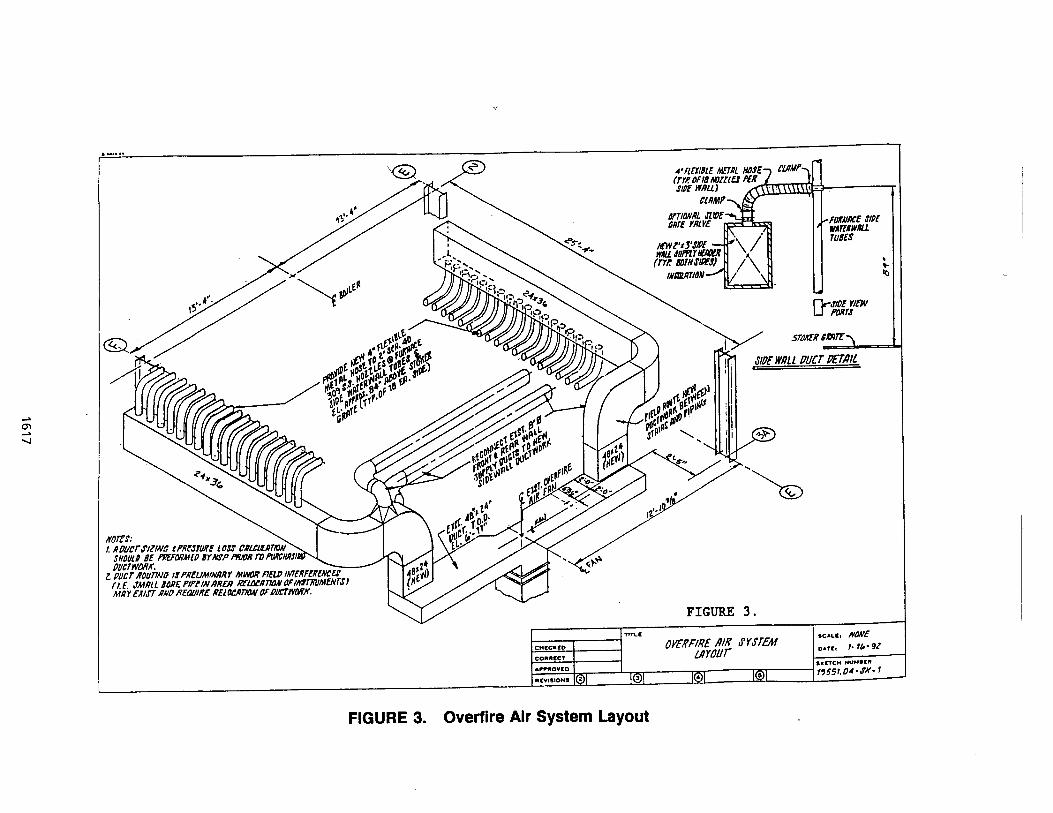
BIOMASS GROWTH ASPECTS DURING BlORECLAMATlON OF CONTAMINATED SOILS
Maria Elektorowicz, Ph.D.. Eng., Prof. of Concordia University 1455 Maisonneuve Blvd W., Montreal, P.Q., H3G 1 M8
Raymond N.Yong, Ph.D., Eng., Director of Geotechnical Research Centre of McGill University. Montreal, P.Q.. H3A 2K6
Abstract
Some microorganisms can metabolize petroleum compounds and this phenomena are hown for a hundred years. Under favourable circumstances, the development of microorganisms can be used to reclamation of contaminated soils. The reduction of contaminants is carried out by the biochemical processes that occur in polluted soil, if favourable environmental conditions are provided. The aim of each bioreclamation technique is to improve these conditions in order to accelerate microorganism activity in the soil. In practice, bioreclamation on an industrial scale is induced through the controlled growth of indigenous microorganisms or through inoculating the soil with specific microorganisms, developed in a lab. These two techniques can be applied either in-situ or ex-situ in the excavated soils, by placing them in cells specially devised for this.
d
Generally, the growth process includes six phases: the lag phase, the acceleration phase, the exponential phase, the growth decline phase, the stationary phase and the endogenous phase. The goal of each technique is to diminish the time lag, increase the acceleration phase, extend the stationary phase and delay the endogenous phase. However, during the bioreclamation phase, the biochemical processes may postpone the treatment by slowing down its growth, and by reducing bioreclamation. Very often, the advanced techniques developed in the laboratory does not equate with efficiency on the site itself. On the site, the biomass growth decreases faster then expected because of various interaction processes taking place in contaminated soil. The numerous works done in laboratories and on contaminated sites show which factors influenced the biomass growth.
The principal factors described in paper which are delaying in the growth of microorganisms capable of reclaiming petroleum products concentrates on the following aspects: competition among microorganisms, unavailability of nutrients, variation of the pH, inadequate moisture, temperature variation, sorption, toxicity of by-products, mutation and impact of additives. The most of the factors are insufficiently recognize, however, impact of some parameters is observed when additives as sawdust and nutrients are added. In similar cases the feasibility studies are necessary before implementation of any technique on industrial scale.
Principal factors influenced the biomass growth
The tellurian microflora is made up of species from the following groups: bacteria, actinomycetes, fungi, algae and protozoans. Viruses are not tellurian microorganisms: since they are strictly intracellular parasites; nevertheless, they play an indirect role in the soil. It is obvious that the soil's-fauna (Nematodes, Arthropods., Annelids), plays also an indirect role in the ecosystem's interactive processes.
It is recognized that the fungi indicating a high activity in petroleum products are the Cladosporium resinae, Fusarium sp., Stysanus sp. and Alternuria sp. Moderate activity is represented by the Cephalosporines sp., Cladosporium sp. (or Cladosporium resinae), Aspergillus sp. and the Penicilliwns sp. Among non-active microorganisms, we find the Pullularia sp. and the varied actinomycetes. Many of these are found in the soil medium.
In the soil, bacteria are the most widespread population. Among these bacteria, 65% are Corynebacteriacians, 25% are Sponslate bacteria. The best-known bacteria, such as the Agrobacterium, Nitrobacter, Azotobacter, Achromobacter, are only 10 % . The distribution of these microorganisms depends on both: the type of site and the depth. The total bacterial density and the vertical distribution reflect the distribution of organic matter in the soil. Therefore, in theory, soil bacteria, which are mostly heterotrophs, are capable of deep penetration, using hydrocarbon as a source of energy. However, their distribution is so little known that the feasibility tests must be carried out before implanting the technology on the site. These tests can detect the presence of the microorganisms active in the bioreclamation of hydrocarbon.
Taking into account the complex processes, we should rather say that the good bioreclamation technique "controls" the interactive processes in the soil's ecosystem. Developing a technique must, therefore, lead to an approach of the knowledge of the interactions between the microorganisms and the soil, of the interactions between the microorganisms and the contaminants, and of the interactions between the tellurian microorganisms themselves.
This competition is especially important in two cases: 1) the inoculation in-situ of microorganisms able to reclaim hydrocarbon, 2) the introduction of additives. In a first instance, the lab-developed microorganisms, which were submitted to the impact of autochthonous tellurian microorganisms, fail to compete. In a second instance, the additives used during the pretreatment, to change the environment's structural parameters, introduce new interactions into the environment. The new microorganisms can, therefore, win the competition by reducing the level of bioreclamation. Such cases are so frequent, that it seems odd that some appliers of the method avoid feasibility studies before going to the site.
In the environment of contaminated soils, petroleum products offer a rich source of carbon; however, their quantity must be in exact proportion to that of other nutrients. Microbian activity occurs mostly conditional upon the amount of nutrients --phosphorus, nitrogen, potassium and mineral salts-- and upon the presence of electron acceptors. The most frequently utilized proportion between carbon, nitrogen and phosphorus is 100: 10: 1. To increase the activity of indigenous tellurian microorganisms, the development of the aerobic bioreclamation technique consists in assuring the above mentioned conditions. The nutrients are used in liquid or solid
form; the electron acceptor is injected in gaseous form (air, oxygen, ozone) or in liquid form (hydrogen peroxide). This supply is fairly easy in soils with high permeability; but, in cases of low permeability, the situation becomes more complicated. Clayey soils, for example, do not let in easily nutrients, and minimize their contact with the microorganisms. The pretreatment of clayey soils is, therefore, necessary before carrying out the bioreclamation. This operation is profitable, but can also cause problems by slowing down the bioreclamation process.
Cooling conditions have a very limited impact on the viability of fungi (Hill, Thomas, 1975). The spores of Cladosporiwn resinae and Aspergillus fwnigatus can survive exposure to temperatures as extreme as 8oC or -32OC in fuels. In the cases of spores that were plunged in water, their resistivity was decreased; the extreme temperature under which spores can survive long is 60°C (Thomas, 1977). Raising the temperature by 2OC (from 18OC to 20°C) quadrupled the biomass's growth in contaminated sandy soil (Elektorowicz, 1987).
The distribution of H+ ions in the soil is very heterogenous unlike what occurs in the usual culture environments. A soil, which classical methods determine to have a pH of 6,0, can contain microsites where the pH is locally higher (for example 10,O) or lower (for example 2,O). According to studies by Hattori and Hattori (1 963), the optimum average activity of microbian cells absorbed by electronegative surfaces (clayey particles) is recorded when the pH reaches 7,9. On the other hand, this optimum, in the case of non-adsorbed free microbian cells, is recorded when the pH is about 5,9. The extreme variation of the pH can reduce the activity of the bacterial species capable of reclaiming hydrocarbon.
Average moisture, with a water suction pressure from 0,01 to 4 bars @F from l,0 to 3,6) is characteristic of most soils. These conditions are favourable to the activity of aerobic or microaerophilic microorganisms. Low moisture occurs when there is water suction pressure between 4 and 400 bars (Pf between 3,6 and 5,6). In the course of soil drying, when tension reaches the 15 bar threshold (Pf = 4,2), tellurian microorganisms still display a not negligible activity. Yet, increasing suction pressure beyond 15 bars leads to a preferential development of actinomycetes and fungi in relation to bacteria. Consequently, microorganisms, which are not active in the hydrocarbon's environment, develop. The limit for microbial activity is 400 bars (Pf =5,6). According to several sources, the most often applied pressure value is 0,3. Others consider a moisture level of 20% the optimal value. The authors's personal expertise demonstrated that activity is just as high with a water content level between 20% and 50% (Elektorowicz, 1992).
Saturation of the soil does not lead necessarily to the exclusive development of anaerobic processes in the soil. In fact, in submerged soils, exist all the types of microbial metabolism, from the typical aerobic metabolism to the strictly anaerobic metabolism.
The metabolism of the oxygenated organisms of hydrocarbon can produce by-products such as alcohols, fatty acids, esters, nucleic acids, proteins, pigments and vitamins. Some of these are used by other organisms from the same environment. The composition of the by-products influences the growth of bioreclaimable microorganisms, especially those which were inoculated into the contaminated environment. The situation becomes complicated in the case of the additives's biochemical processes. The products of the reactions can have a great influence on
the activity of microorganisms reclaiming hydrocarbon.
The fate of contaminants in the soil is determined mostly by the physio-chemical processes: advection, diffusion and sorption. Based upon previous experiences, sorption of organics, both in the liquid and gaseous phases at the surface of soil particles, can play an important role in the activity of microorganisms. Such role is not well understood, although observation of the TCE bioreclamation confirms this argument. The partition coefficients seem to be the first parameters requiring verification before applying the method. This aspect of bioreclamation still demands thorough studies.
Mutagenesis seems to be one of the most important biochemical processes taking place during bioreclamation. This phenomenon's importance is particularly noticeable when microorganisms are inoculated, and in long-term bioreclamation processes. The additives can also produce processes which accelerate mutation of microorganisms. These approaches were realized in labs, and, until now, no study of this kind was ever carried out in-situ.
Pretreatment and additives
Quite often, in the course of on-site pretreatments, the previously excavated compact clods of clayey soil are ground into pellets with a diameter of less than 2 cm. To assure the easy penetration of the injected substances, it is necessary to both change the density and transmissibility of the treated mass.
The impact of additives on' the bioreclamation process of soils can be seen using, as an example, the utilisation of sawdust as additive. Sawdust or wood chips can insure a low density and a high transmissibility of the treated mass. This additive is a residue very abundant in areas where the pulp and paper industry developed. The chemical composition of sawdust diverges according to the type of wood, a specific distinction being made between softwoods and hardwoods. This diversity in composition can influence the bioreclamation process; the origin and quality of the sawdust used must be well established.
Wood matter is heterogeneous; nevertheless three main components stand out: cellulose, hemicellulose and lignin. These form the cell structures of complex polymerized chains. Besides these chief elements, wood contains a very small quantity of inorganic elements and a large variety of extractable organic components. Among these, we may mention almost all the series of organic components. The quantity of extractable elements may vary from 1% to 50% depending on the type of wood. In cases where dust is added to 10% of the total mass of the contaminated soil, the components mentioned earlier may change the interactive processes in the soil, and, therefore, the bioreclamation itself.
Wood can easily yield to the reclamation induced by brown rots or white rots. The first group using the enzymic system hydrolyses the cellulose, but leaves the lignin intact. The organisms likely to release lignin from enzymic matter are above all: the Letinus lepidus, the Poria vaillanties, and the Lenzites separia. The residue then changes colour and becomes brown. White rot decomposes all the elements in the wood, including lignin; and the white-coloured residue is observed. Most of , the microorganisms which reclaim wood belong to the
Basidiomycetes. Some fungi are also classified as Acomycetes. The microorganisms isolated in the soil and capable of reclaiming wood are: the Falvobacterium, the P. versicolour and the F. formentarius.
At certain stages of reclamation, vanillin is produced by the alkaline hydrolysis of lignosulfonic acid (Buckland, 1987), and by the hydroxydihydroconiferaldehyde released by the hydrosulfonic confieraldehyde structure (as noted later by Kratzl and Hofbauer, 1957). This transformation produced vanillin and acetaldehyde. The bioreclamation of sawdust provokes a loss of the concomitant methoxyl groups and the formation of the phenolic hydroxyl. Exposed to air, the amount of hydroxyl, of phenolic groups, of carboxyl and carbonyl increases, while the quantity of vanillin decreases.
The formation of the ammonia, amines and the fixation of nitrogen are possible. Such conditions may influence the value of the pH. During studies done on soil mixed with sawdust, pH growth was recorded in the treatment's initial period. The initial value of the pH from the mixed soil was 6,8; however, after a 50 day treatment, the value of the pH reached 9,2 (Elektorowicz, 1992). The average pH found in the soil (separated from the mix) varied around 8, l ; at the same time the average pH of the separated sawdust was 10,2.
Conclusions
The reclamation process of hydrocarbon found in soil offers a great potential in the field of contaminated site restoration. The success of this technique depends on knowing several physical, chemical and biological processes. Nevertheless, knowledge in this field remains insufficient for the estimation of, a priori, the efficiency of the technique on the site. It is necessary, in each particular case, to carry out the feasibility studies --on a small scale or in labs-- to eliminate many negative interactions of the environment on the efficiency of the reclamation. ~he'temperature, the moisture and the pH must be strictly controlled. Each innovation in the treatment, as well as the addition of additives, must be studied and verified, taking into account their impact on microbial activity. The distribution of nutrients must be well thought to provide a sufficient nutrient availability in relation to carbon. Long-term treatment should be controlled to find out possible mutation of microorganisms. The quality of products should be evaluated in each case.
References
1. Buckland,I.K. Tomlison,G.H., Hibbert,H., (1937), Jour. of Chem. Soc., 59 2. Elektorowicz,M., Hadjinicolaou,J., Yong,R.N., (1992), Proc. 1992 Congress CSCE, 217 3. Elektorowicz, M., (1987), Internal Report of Industrial Project 4. Hattori,R. , Hattori,T., (1963), Ecological Review, 16 (1) 5. Hill,E.C., Thomas, A.R., (1975), 3 Int. Biodeterioration Symp. Rhode Island, 157 6. Kartzl,K., Hofbauer,G., (1956), Monat. Chem, 87 7. Thomas,A.R., Hill,E.C., (1977), Int. Biodeterioration Bul., 13 (1)
WOODY BIOMASS PRODUCTION IN A SPRAY IRRIGATION WASTEWATER TREATMENT FACILITY IN NORTH CAROLINA
Douglas Frederick, Russ Lea and Ray Milosh, Respectively: Professor, Associate Dean for Research,
and Graduate Research Assistant Department of Forestry, North Carolina State University
Box 8008, Raleigh NC 27695-8008, USA
Abstract
Application of municipal wastewater to deciduous tree plantations offers a viable opportunity to dispose of nutrients and pollutants, while protecting water quality. Production of woody biomass for energy or pulp mill furnish, using wastewater is feasible and markets exist in many parts of the world for this biomass. Plantations of sycamore (Platanus occidentalis L.), and sweetgum (Liauidambar styraciflua L.), have been established in Edenton, North Carolina for application of municipal wastewater. Research describing the dry weight biomass following the fifth year of seedling growth is presented along with future estimates for seedling and coppice yields. Ongoing and future work for estimating nutrient assimilation and wastewater renovation are described and discussed.
Introduction
Plantations of deciduous hardwoods grown under short rotations are attractive for fiber and energy production. Such plantations when sprayed with municipal wastewater can outproduce non-irrigated plantations and remove many of the nutrients contained in wastewater. Wastewater disposal using hardwood plantations has vast and immediate application to industry, municipalities, and even private lands in the United States and other parts of the world.
In many parts of the world, communities and industries that are facing wastewater disposal problems must shortly adopt a land application system. In many cases, deciduous hardwood plantations are the most effective alternative for disposing of wastewater especially since large amounts of biomass can be concurrently produced thereby off-setting wastewater disposal costs.
A range of land reclamation and biomass production projects involving direct forest land application have been undertaken (Sopper, et al., 1982; Nutter and Red, 1985, 1986; Hart et al., 1988). Most studies have used natural forests rather than plantations, but there is need for information and procedures using deciduous hardwood plantations. Extensive justification for using forests for wastewater disposal have been itemized by Cole, et al., (1983) and include: 1) the large area of forestland available which is well drained and not subject to flooding, 2) forestland sites are nutrient deficient and are capable of assimilating large amounts of nutrients through microbial conversion and soil absorption, 3) forests are not considered food chain crops, 4) forests have high potential for nutrient immobilization, 5) tree cover minimizes surface runoff, and 6) trees have perennial root systems which allow year round uptake of nutrients and enhance infiltration. Effects of wastewater on forests include dramatic growth increases, shortened rotations, and increased site stability.
Deciduous hardwood plantations have numerous advantages over natural forests and other plant crops for wastewater disposal. Species can be matched to site to ensure rapid growth, growth response of hardwoods to irrigation and nutrients from wastewater is high and hardwoods rapidly concentrate nutrients in juvenile tissues. Under short rotations, the trees can be whole-tree harvested removing the nutrients from the site in a non-food chain product. Hardwoods will then resprout (coppice) from established root systems and thus continue to produce large amounts of aboveground biomass and function to concentrate nutrients without replanting.
Land Treatment Site and Wastewater Treatment
The wastewater treatment facility used for this research is supplied with municipal wastewater from the city of Edenton, NC. Approximately 145 ha of sycamore, sweetgum, and loblolly pine were planted in February 1987 to serve as the sprayfield. The system became operational in January 1989. The trees have completed 5 growing seasons. Loblolly pine comprised less than 10 percent of the planting area and was not included in this summary.
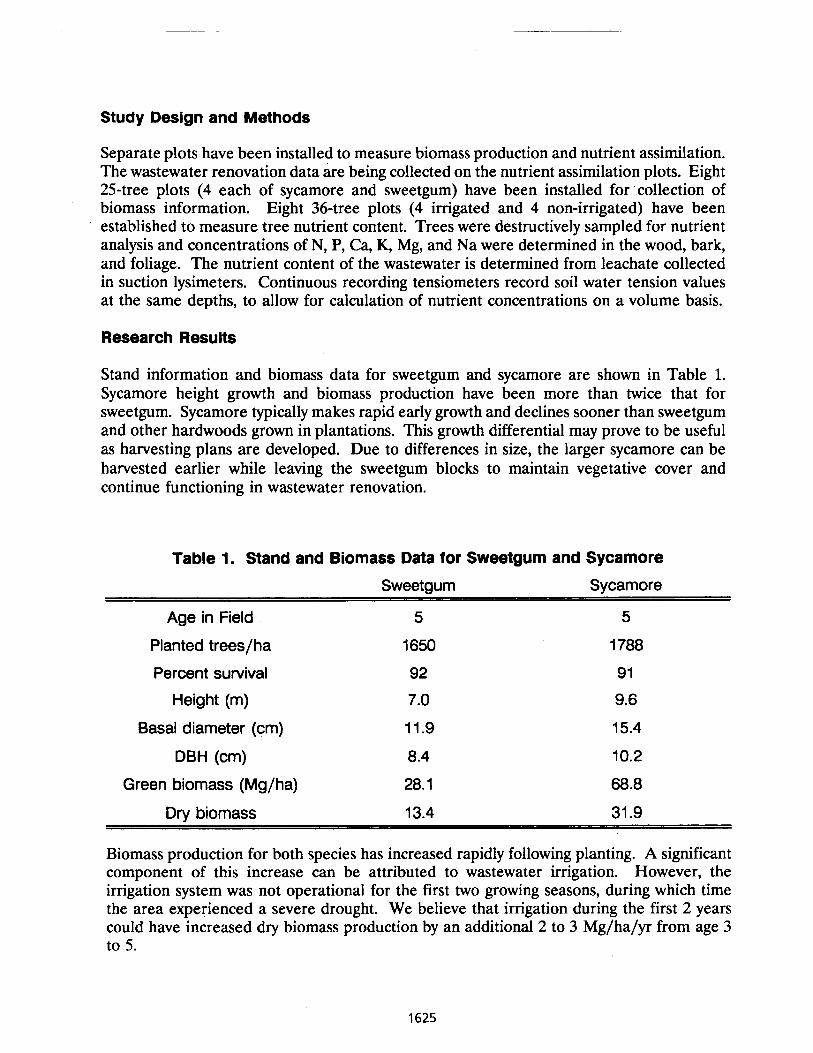
Study Design and Methods
Separate plots have been installed to measure biomass production and nutrient assimilation. The wastewater renovation data are being collected on the nutrient assimilation plots. Eight 25-tree plots (4 each of sycamore and sweetgum) have been installed for collection of biomass information. Eight 36-tree plots (4 irrigated and 4 non-irrigated) have been established to measure tree nutrient content. Trees were destructively sampled for nutrient analysis and concentrations of N, P, Ca, K, Mg, and Na were determined in the wood, bark, and foliage. The nutrient content of the wastewater is determined from leachate collected in suction lysimeters. Continuous recording tensiometers record soil water tension values at the same depths, to allow for calculation of nutrient concentrations on a volume basis.
Research Results
Stand information and biomass data for sweetgum and sycamore are shown in Table 1. Sycamore height growth and biomass production have been more than twice that for sweetgum. Sycamore typically makes rapid early growth and declines sooner than sweetgum and other hardwoods grown in plantations. This growth differential may prove to be useful as harvesting plans are developed. Due to differences in size, the larger sycamore can be harvested earlier while leaving the sweetgum blocks to maintain vegetative cover and continue functioning in wastewater renovation.
Table 1. Stand and Biomass Data for Sweetgum and Sycamore
Sweetgum Sycamore
Age in Field
Planted trees/ha
Percent survival
Height (m)
Basal diameter (cm)
DBH (cm)
Green biomass (Mg/ha)
Dry biomass
Biomass production for both species has increased rapidly following planting. A significant component of this increase can be attributed to wastewater irrigation. However, the irrigation system was not operational for the first two growing seasons, during which time the area experienced a severe drought. We believe that irrigation during the first 2 years could have increased dry biomass production by an additional 2 to 3 Mg/ha/yr from age 3 to 5.
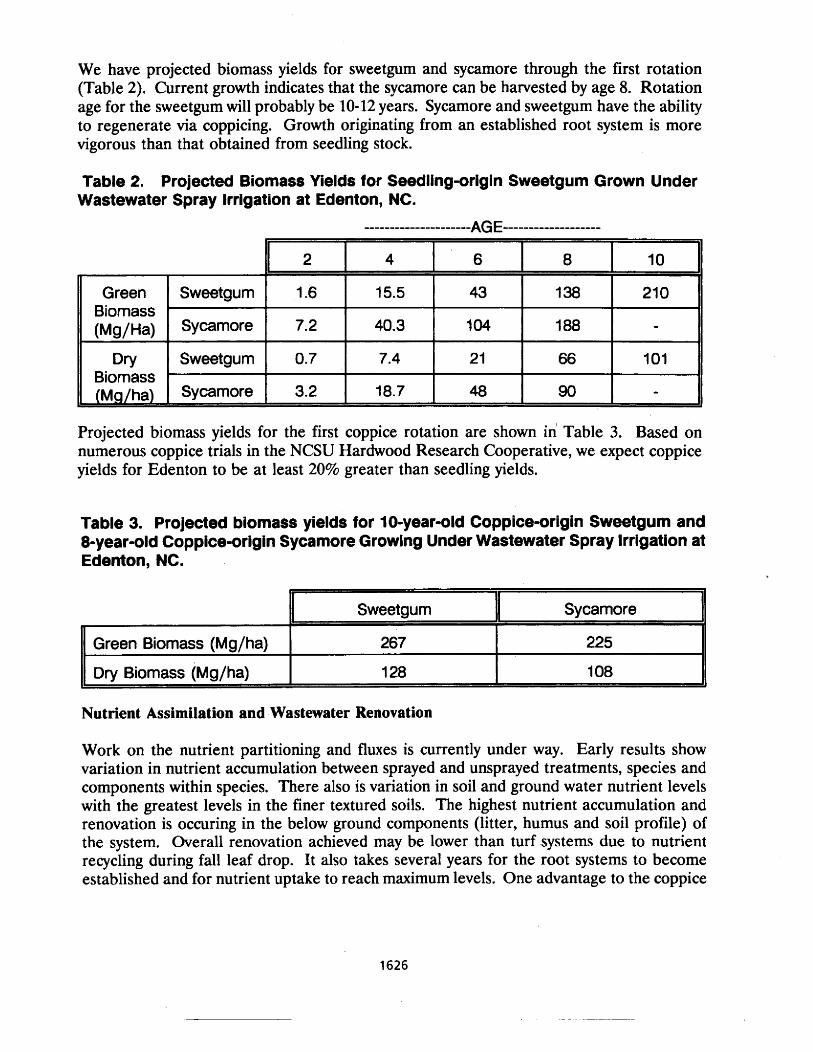
We have projected biomass yields for sweetgum and sycamore through the first rotation (Table 2). Current growth indicates that the sycamore can be harvested by age 8. Rotation age for the sweetgum will probably be 10-12 years. Sycamore and sweetgum have the ability to regenerate via coppicing. Growth originating from an established root system is more vigorous than that obtained from seedling stock.
Table 2. Projected Biomass Yields for Seedlingorigin Sweetgum Grown Under Wastewater Spray Irrigation at Edenton, NC.
..................... AGE- -em--------------- - --- - - - - -
Projected biomass yields for the first coppice rotation are shown in Table 3. Based on numerous coppice trials in the NCSU Hardwood Research Cooperative, we expect coppice yields for Edenton to be at least 20% greater than seedling yields.
Table 3. Projected biomass yields for 10-year-old Coppiceorigin Sweetgum and 8-year-old Coppice-origin Sycamore Growing Under Wastewater Spray lrrigation at Edenton, NC.
Green Biomass (Mg/Ha)
Dry Biomass (Mq/ha)
2
1.6
7.2
0.7
3.2
Sweetgum
Sycamore
Sweetgum
Sycamore
Nutrient Assimilation and Wastewater Renovation
Work on the nutrient partitioning and fluxes is currently under way. Early results show variation in nutrient accumulation between sprayed and unsprayed treatments, species and components within species. There also is variation in soil and ground water nutrient levels with the greatest levels in the finer textured soils. The highest nutrient accumulation and renovation is occuring in the below ground components (litter, humus and soil profile) of the system. Overall renovation achieved may be lower than turf systems due to nutrient recycling during fall leaf drop. It also takes several years for the root systems to become established and for nutrient uptake to reach maximum levels. One advantage to the coppice
4
15.5
40.3
7.4
18.7
b
Sweetgum
267
1 28
Green Biomass (Mg/ha)
Dry Biomass (~g /ha)
6
43
104
21
48
. Sycamore
225
108
8
1 38
188
66
90
10
21 0 !
-
101
-
method of regeneration will be that subsequent rotations will have well-established root systems and nutrient uptake following harvest will be higher than that achieved with seedling regeneration methods. Whole-tree harvesting at the end of the growing season will remove all above-ground biomass (including foliage) from the site.
Conclusions
Land application of municipal wastewater on forest plantations is a viable alternative to other types of land application systems. Biomass production in wastewater-irrigated plantations currently exceeds that observed in non-irrigated plantations, and biomass from coppice rotations should exceed that produced from seedlings. Deciduous hardwood plantations show great promise for renovating municipal wastewater.
Acknowledgements
We wish to thank the Energy Division of the North Carolina Department of Economic and Community Development for the funding they are providing to conduct this research. We also wish to acknowledge the support of the North Carolina State University Hardwood Research Cooperative.
References
Cole, D. W., C. L. Henry, P. Schless and R. J. Zasoski. (1983). Forest systems, Proc. 1983 Workshop on Utilization of Wastewater and Sludge on Land. Edited by: A. L. Page a A, Univ. of California, Riverside. p. 125-143.
Hart, J. B., P. K. Nguyen, D. H. Urle and D. G. Brockway. (1988). Silvicultural use of wastewater sludge. J. For. 86: 17-24.
Nutter, W. L. and J. T. Red. (1985). Treatment of Wastewater by Application to Forest Land. TAPPI: 68: 114-1 17.
Nutter, W. L. and J. T. Red. (1986). Future Directions: Forest Wastewater Application. IN: The Forest Alternative for Treatment and Utilization of Municipal and Industrial - Wastes. Edited by: D. W. Cole A, Univ. of Washington Press, Seattle. p. 55-69.
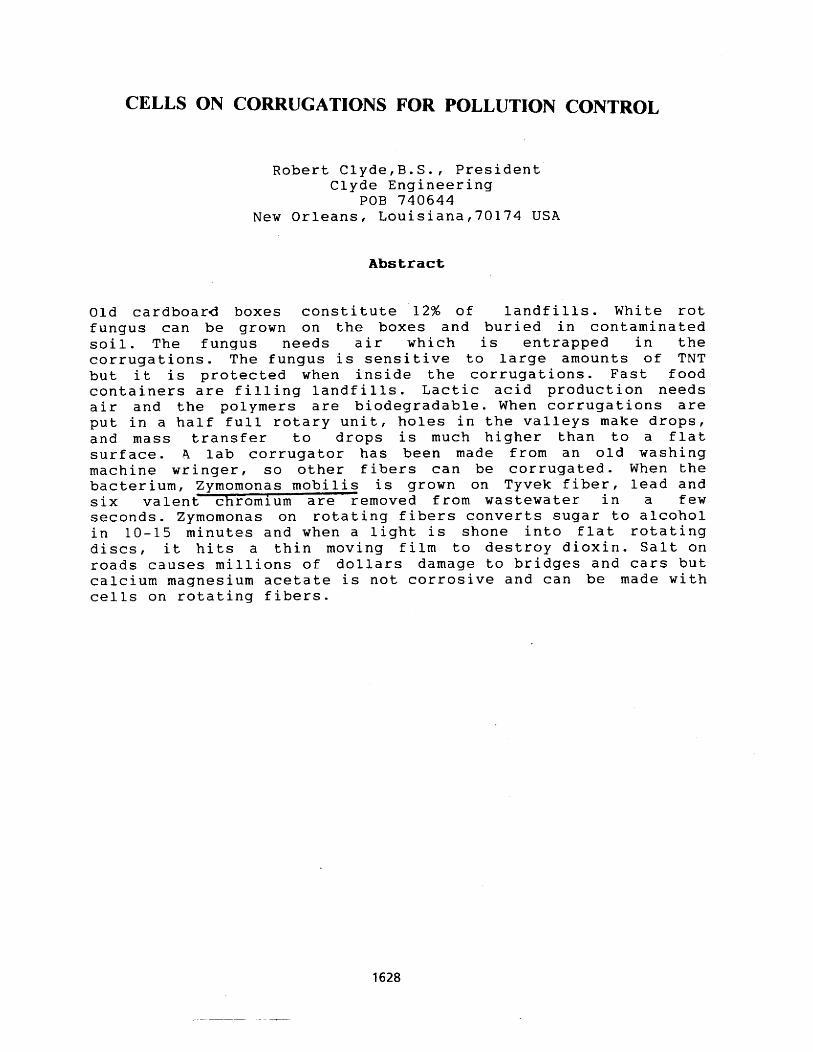
CELLS ON CORRUGATIONS FOR POLLUTION CONTROL
Robert Clyde,B.S., President Clyde Engineering
POB 740644 New Orleans, Louisiana,70174 USA
Abstract
Old cardboard boxes constitute 12% of landfills. White rot fungus can be grown on the boxes and buried in contaminated soil. The fungus needs air which is entrapped in the corrugations. The fungus is sensitive to large amounts of TNT but it is protected when inside the corrugations. Fast food containers are filling landfills. Lactic acid production needs air and the polymers are biodegradable. When corrugations are put in a half full rotary unit, holes in the valleys make drops, and mass transfer to drops is much higher than to a flat surface. A lab corrugator has been made from an old washing machine wringer, so other fibers can be corrugated. When the bacterium, Zymomonas mobilis is grown on Tyvek fiber, lead and six valent chromium are removed from wastewater in a few seconds. Zymomonas on rotating fibers converts sugar to alcohol in 10-15 minutes and when a light is shone into flat rotating discs, it hits a thin moving film to destroy dioxin. Salt on roads causes millions of dollars damage to bridges and cars but calcium magnesium acetate is not corrosive and can be made with cells on rotating fibers.
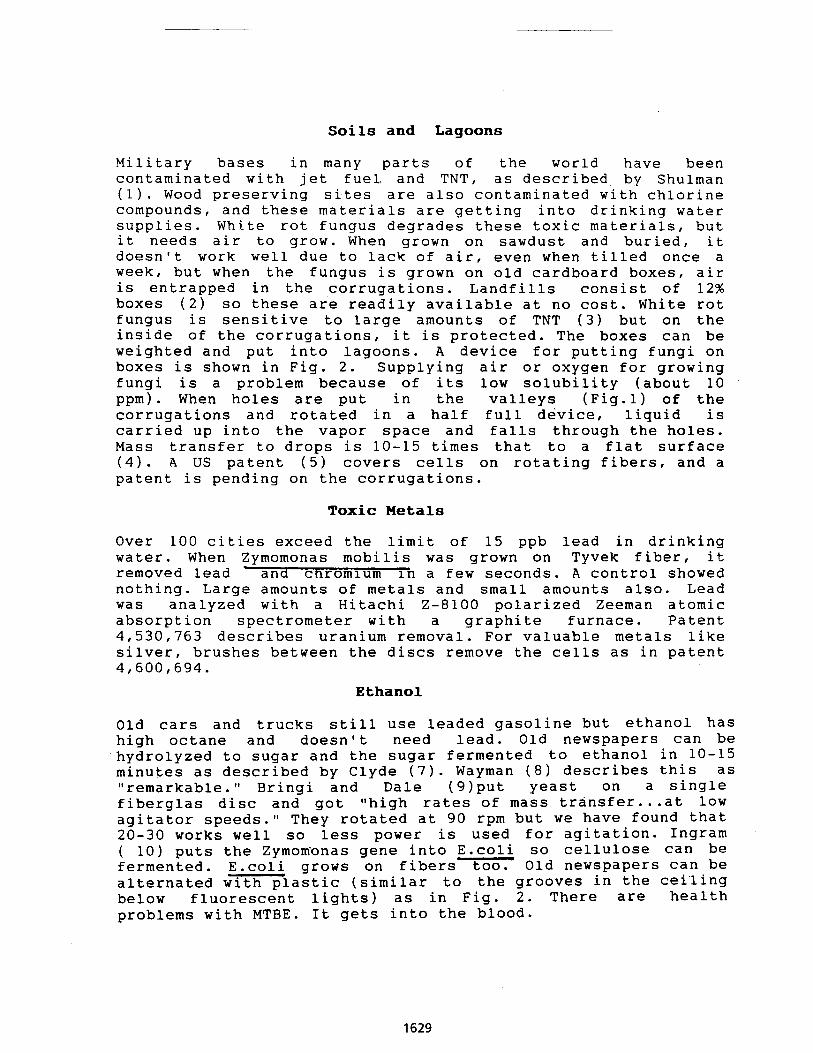
Soils and Lagoons
Military bases in many parts of the world have been contaminated with jet fuel, and TNT, as described by Shulman (1). Wood preserving sites are also contaminated with chlorine compounds, and these materials are getting into drinking water supplies. White rot fungus degrades these toxic materials, but it needs air to grow. When grown on sawdust and buried, it doesn't work well due to lack of air, even when tilled once a week, but when the fungus is grown on old cardboard boxes, air is entrapped in the corrugations. Landfills consist of 12% boxes (2) so these are readily available at no cost. White rot fungus is sensitive to large amounts of TNT (3) but on the inside of the corrugations, it is protected. The boxes can be weighted and put into lagoons. A device for putting fungi on boxes is shown in Fig. 2. Supplying air or oxygen for growing fungi is a problem because of its low solubility (about 10 ppm). When holes are put in the valleys (Fig.1) of the corrugations and rotated in a half full device, liquid is carried up into the vapor space and falls through the holes. Mass transfer to drops is 10-15 times that to a flat surface (4). A US patent (5) covers cells on rotating fibers, and a patent is pending on the corrugations.
Toxic Metals
Over 100 cities exceed the limit of 15 ppb lead in drinking water. When Zymomonas mobilis was grown on Tyvek fiber, it removed lead - and cnromlum In a few seconds. A control showed nothing. Large amounts of metals and small amounts also. Lead was analyzed with a Hitachi 2-8100 polarized Zeeman atomic absorption spectrometer with a graphite furnace. Patent 4,530,763 describes uranium removal. For valuable metals like silver, brushes between the discs remove the cells as in patent 4,600,694.
Ethanol
Old cars and trucks still use leaded gasoline but ethanol has high octane and doesn't need lead. Old newspapers can be hydrolyzed to sugar and the sugar fermented to ethanol in 10-15 minutes as described by Clyde (7). Wayman (8) describes this as "remarkable." Bringi and Dale (9)put yeast on a single fiberglas disc and got "high rates of mass transfer...at low agitator speeds." They rotated at 90 rpm but we have found that 20-30 works well so less power is used for agitation. Ingram ( 10) puts the Zymom'onas gene into - E.coli so cellulose can be fermented. E.coli grows on fibers too. Old newspapers can be alternated with (similar to the grooves in the cei'ling below fluorescent lights) as in Fig. 2. There are health problems with MTBE. It gets into the blood.
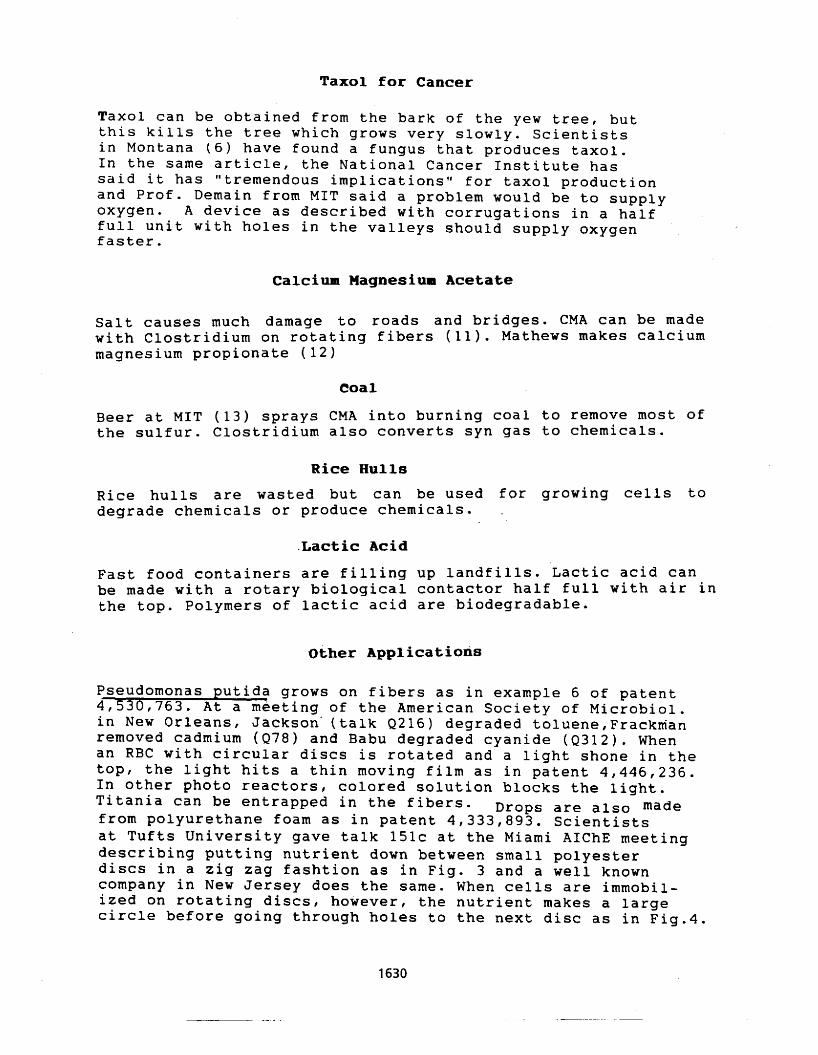
Taxol for Cancer
Taxol can be obtained from the bark of the yew tree, but this kills the tree which grows v e r y slowly. Scientists in Montana (6) have found a fungus that produces taxol. In the same article, the National Cancer Institute has said it has "tremendous implications" for taxol production and Prof. Demain from MIT said a problem would be to supply oxygen. A device as described with corrugations in a half full unit with holes in the valleys should supply oxygen faster.
Calcium Magnesium Acetate
Salt causes much damage to roads and bridges. CMA can be made with Clostridium on rotating fibers (11). Mathews makes calcium magnesium propionate (12)
Coal
Beer at MIT (13) sprays CMA into burning coal to remove most of the sulfur. Clostridium also converts syn gas to chemicals.
Rice Hulls
Rice hulls are wasted but can be used for growing cells to degrade chemicals or produce chemicals.
Lactic Acid
Fast food containers are filling up landfills. Lactic acid can be made with a rotary biological contactor half full with air in the top. Polymers of lactic acid are biodegradable.
Other Applications
Pseudomonas putida grows on fibers as in example 6 of patent 4,530,763. At a meeting of the American Society of Microbiol. in New Orleans, ~ackson' (talk Q216) degraded tbluene, fracknian removed cadmium (Q78) and Babu degraded cyanide (Q312). When an RBC with circular discs is rotated and a light shone in the top, the light hits a thin moving film as in patent 4,446,236. In other photo reactors, colored solution blocks the light. Titania can be entrapped in the fibers. Drops are also made from polyurethane foam as in patent 4,333,893. Scientists at Tufts University gave talk 151c at the Miami AIChE meeting describing putting nutrient down between small polyester discs in a zig zag fashtion as in Fig. 3 and a well known company in New Jersey does the same. When cells are immobil- ized on rotating discs, however, the nutrient makes a large circle before going through holes to the next disc as in Fig.4.
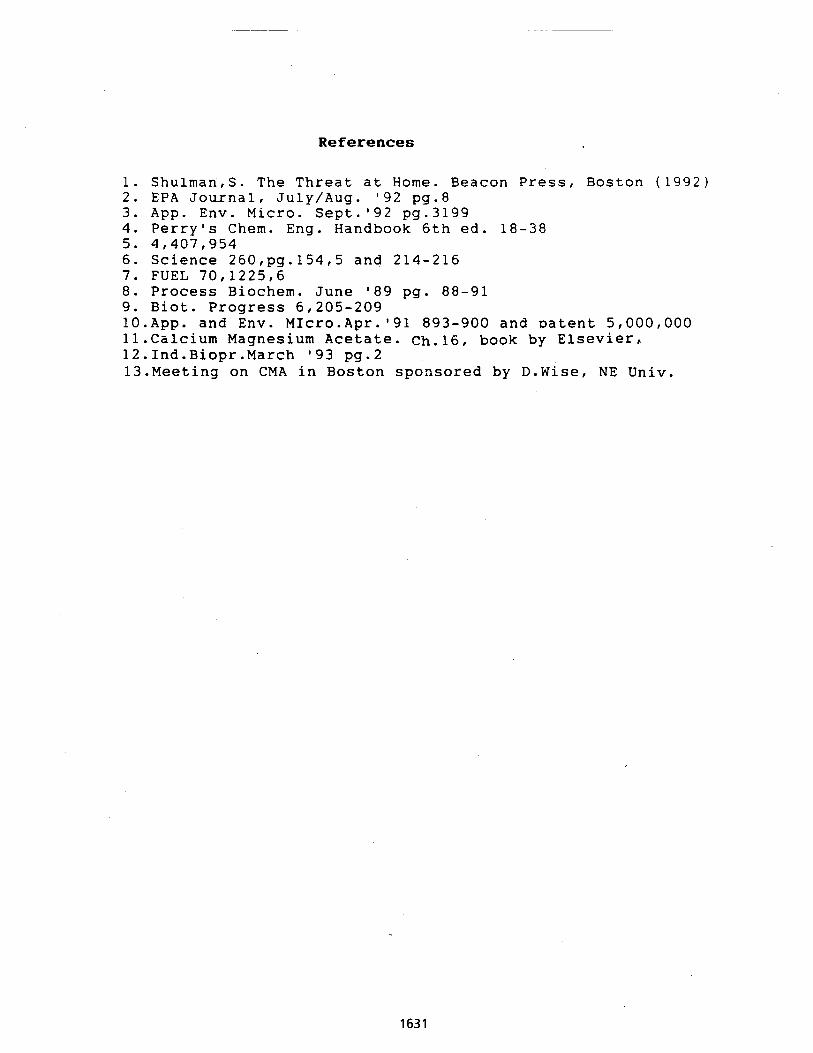
References
1. Shulman,S. The Threat at Home. Beacon Press, Boston (1992) 2. EPA Journal, July/Aug. '92 pg.8 3. App. Env. Micro. Sept.'92 pg.3199 4. Perry's Chem. Eng. Handbook 6th ed. 18-38 5. 4,407,954 6. Science 260,pg.154,5 and 214-216 7. FUEL 70,1225,6 8. Process Biochem. June '89 pg. 88-91 9. Biot. Progress 6,205-209 10.App. and Env. MIcro.Apr.'91 893-900 and ~atent 5,000,000 11.Calcium Magnesium Acetate. ch.16, book by Elsevier, 12.Ind.Biopr.March '93 pg.2 13.Meeting on CMA in Boston sponsored by D.Wise, NE Univ.
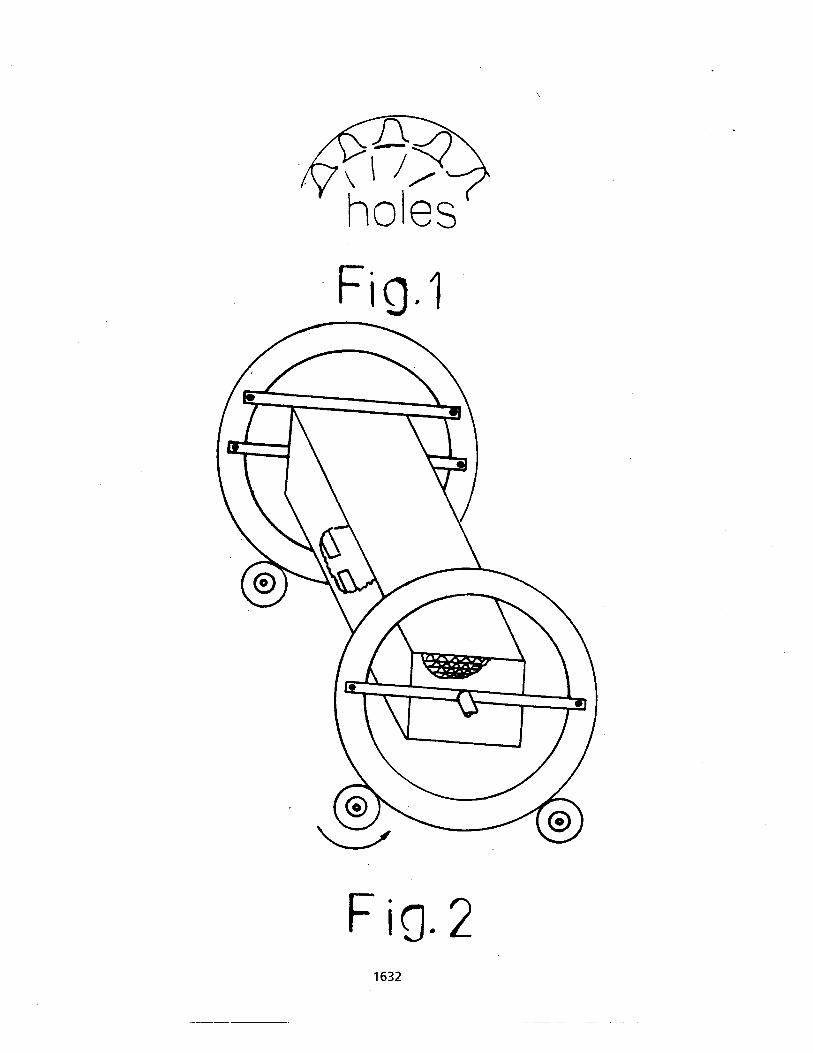
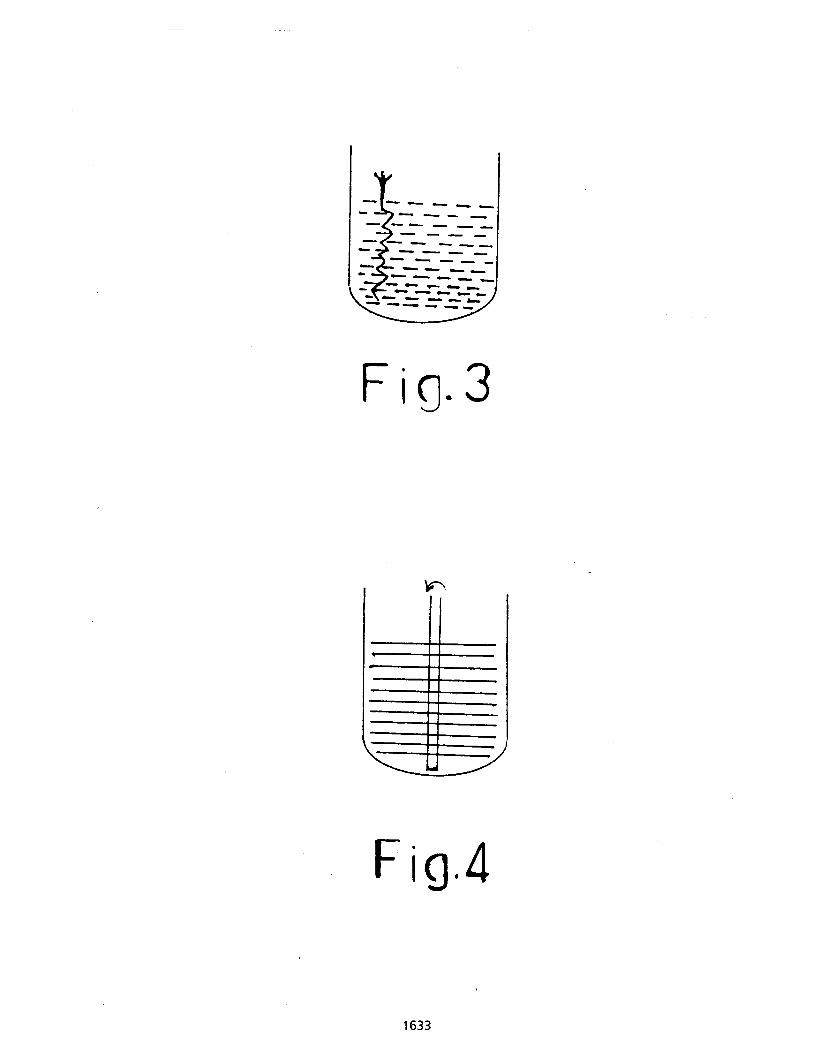
SUITABLE WOODY SPECIES FOR A LAND APPLICATION ALTERNATIVE TO PULP AND PAPER MILL WASTEWATER
DISPOSAL
Mohamadou Aw, Graduate Research Assistant; Michael R. Wagner, Ph.D., Professor
School of Forestry, Northern Arizona University Flagstaff, Arizona 8601 1 U.S.A
Abstract
Saline pulp and paper wastewater produced by Stone Container Corporation in Snowflake, Arizona was used to irrigate 32 different species/genotypes/hybrids of woody plants to test their suitability as an alternative treatment to the current wastewater disposal method. Suitability was measured in terms of survival and height growth. Among the 32 species, six were found to be a very good choice for wastewater treatment and biomass production. Their suitability is further justified by the fact that some have salt tolerance and others fix nitrogen. These species are Tamarix ramosissima, Atrblex canescens, Robinia pseudoacacia, Eleagnus angustifolia, Ulmus purnila, and Populus deltoides x Populus nigra. Three other species are possible candidates. These include Caragana arborescens, Gleditsia triacanthos and Populus deltoides var. siouxland. In general, conifers performed poorly because of the harsh environment and other silvicultural problems.
Introduction
The disposal of wastewater in general and of pulp and paper mill wastewater in particular, has become a serious concern for the general public and the paper industry. Tough environmental laws limit waste disposal options and increase the cost of treating wastewater. In order to find a less costly and environmentally sound alternative, a land application system is being developed by Northern Arizona University (N.A.U.) in conjunction with Stone Container Corporation to reclaim saline pulp and paper mill wastewater produced by Stone Container Corporation pulp and paper mill in Snowflake Arizona (Aw et. a1 1993). The major contaminant of the wastewater is salt. The average sodium content is about 585.56 mgll, the electroconductivity about 3.2 mmhos/cm and the SAR about 15 (Tecle et. a1 1993).
One objective of the N.A.U. project is to identify suitable woody biomass species that can successfully treat the saline wastewater and produce wood biomass for fuel andlor pulpwood (Aw et al. 1993). Survival and growth are among the criteria used to determine the suitability of a species to reclaim wastewater and survive the harsh environmental conditions at the site.
Methods
To achieve this objective we established in spring 1991 an 18 acre plantation located about 22 miles south of Holbrook, Arizona, in the North-central part of Arizona. The legal description of the site is Navajo County, Arizona, T 14N, R 19E, Section 7 (Gila and Salt River Baseline and meridian). The soil in the experimental fields are very high in clay (Tecle et. a1 1993).
In total, 32 different species/hybrids/genotypes were tried in this experiment using a randomized block design. The plantation was divided into four blocks according to location. Species were used as the treatment factor. Each block was divided into 30 plots. Each of the 29 out of the 30 plots contains 36 plants of one species planted on a 12 feet x 12 feet spacing. The species were randomly assigned to the plots. One plot was left empty for soil sampling purposes. Each species was replicated in all four blocks except six species that were only replicated in two blocks due to non-availability of plants. These six species will be discussed in a separate section later in the paper.
Most of the species included in this experiment have been chosen because of their ability to survive the environmental conditions of the site (mainly cold tolerance) and/or for their salt tolerance (Aw et al. 1993).
Data Collected
All data were collected only on the 16 interior plants of each plot. The reason for this is the border plants of one plot are competing not only with the same plot plants but also with the plants of neighboring plots. In each plot we obtained first year growing season survival, overwintering survival, and two year survival by counting the live plants among
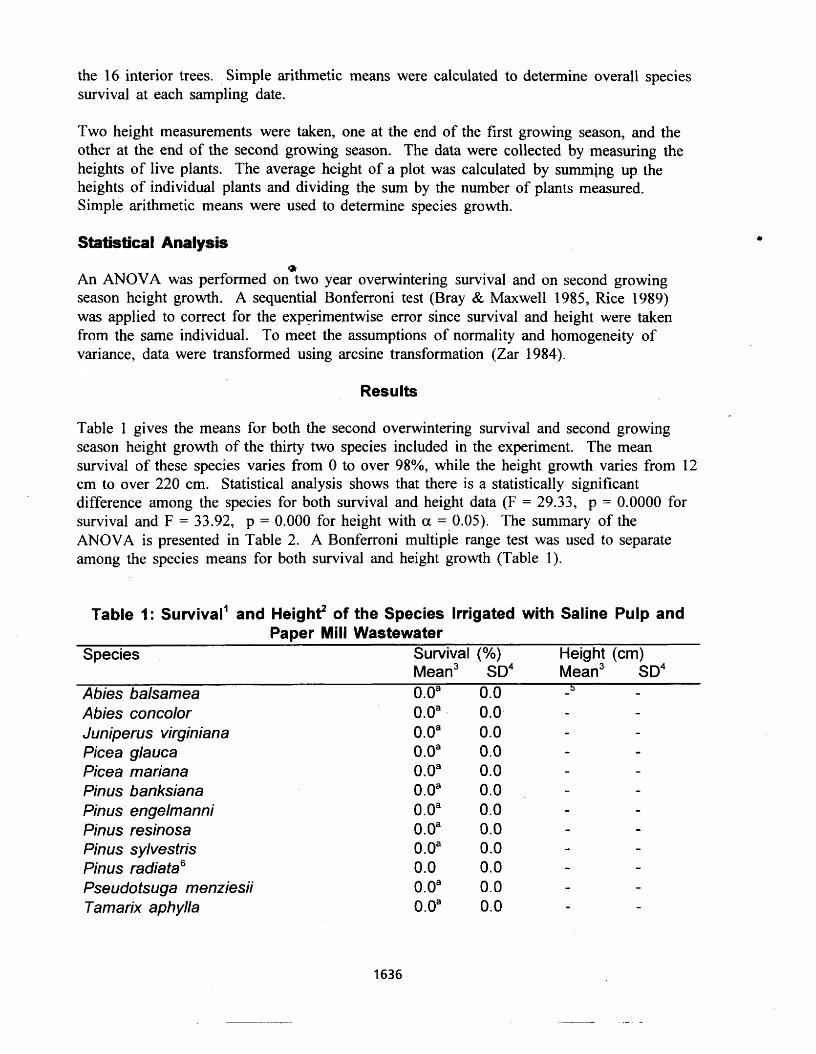
the 16 interior trees. Simple arithmetic means were calculated to determine overall species survival at each sampling date.
Two height measurements were taken, one at the end of the first growing season, and the other at the end of the second growing season. The data were collected by measuring the heights of live plants. The average height of a plot was calculated by summing up the heights of individual plants and dividing the sum by the number of plants measured. Simple arithmetic means were used to determine species growth.
Statistical Analysis ak
An ANOVA was performed on two year overwintering survival and on second growing season height growth. A sequential Bonferroni test (Bray & Maxwell 1985, Rice 1989) was applied to correct for the experimentwise error since survival and height were taken from the same individual. To meet the assumptions of normality and homogeneity of variance, data were transformed using arcsine transformation (Zar 1984).
Res u I ts
Table 1 gives the means for both the second overwintering survival and second growing season height growth of the thirty two species included in the experiment. The mean survival of these species varies from 0 to over 98%, while the height growth varies from 12 cm to over 220 cm. Statistical analysis shows that there is a statistically significant difference among the species for both survival and height data (F = 29.33, p = 0.0000 for survival and F = 33.92, p = 0.000 for height with a = 0.05). The summary of the ANOVA is presented in Table 2. A Bonferroni multiple range test was used to separate among the species means for both survival and height growth (Table 1).
Table 1: ~uwival ' and ~ e i g h f of the Species Irrigated with Saline Pulp and Paper Mill Wastewater
Species Survival (%) Height (cm) ~ e a n ~ SD4 ~ e a n ~ S D ~
Abies balsamea 0. Oa 0.0 - - 3
Abies concolor 0.0" 0.0 - - Juniperus Virginian a 0.0" 0.0 - -
Picea glauca 0.0" 0.0 - - Picea mariana 0.0" 0.0 - -
Pinus banksiana 0.0" 0.0 - - Pinus engelmanni 0.0" 0.0 - .., Pinus resinosa 0.0" 0.0 - - Pinus sylvestris 0.0" 0.0 - - Pin us radia ta 0.0 0.0 - -
Pseudotsuga menziesii 0.0" 0.0 - - Tamarix aph ylla 0.0" 0.0 - -
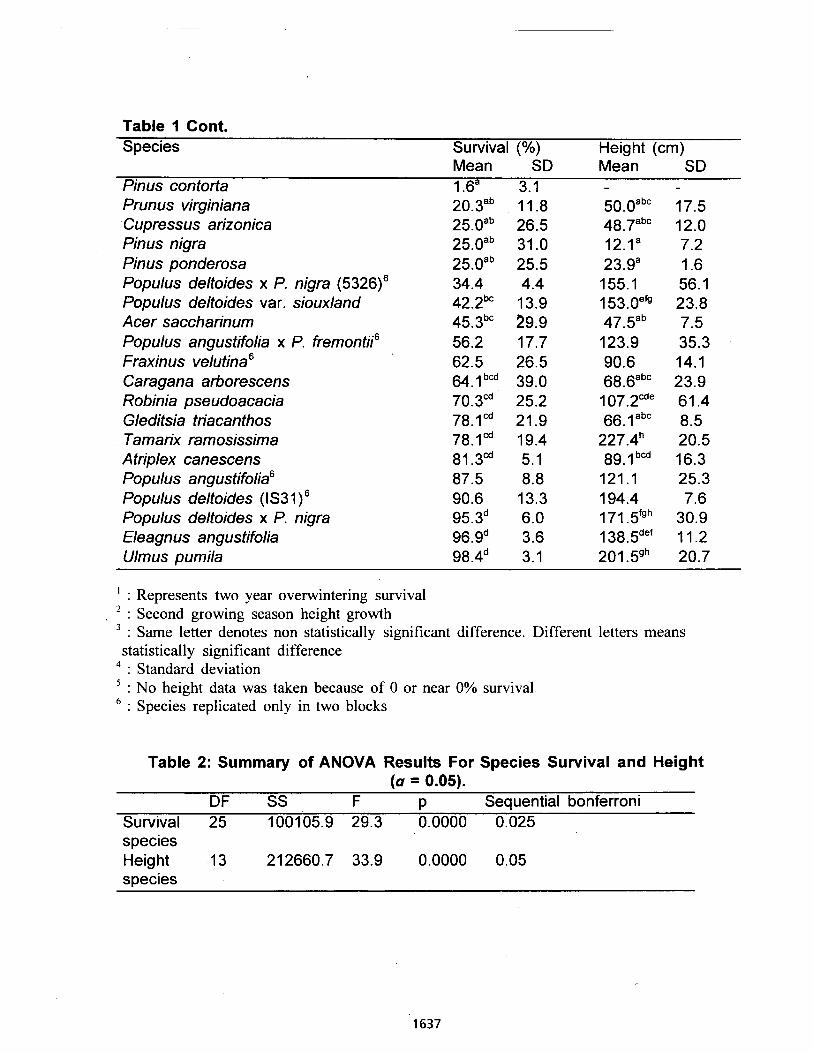
Table 1 Cont. Species Survival (%) Height (cm)
Mean SD Mean SD Pinus contorta 1 .6" 3.1 - - Prunus virginiana 20.3"~ 11.8 50.0abC 17.5 Cupressus arizonica 25.0ab 26.5 48.7abc 12.0 Pinus nigra 25.0ab 31.0 12.1" 7.2 Pinus ponderosa 25.0"~ 25.5 23.9" 1.6 Populus deltoides x P. nigra (5326)6 34.4 4.4 155.1 56.1 Populus deltoides var. siouxland 42.2bC 13.9 153.0"" 23.8 Acer saccharinum 45.3bC 29.9 47.5ab 7.5 Populus angustifolia x P. fremontii6 56.2 17.7 123.9 35.3 Fraxinus velutina 62.5 26.5 90.6 14.1 Caragana arborescens 64.1 39.0 68.Gabc 23.9 Robinia pseudoacacia 70.3* 25.2 1 07.2'~" 61.4 Gleditsia triacanthos 78.1Cd 21.9 66.1 abc 8.5 Tamarix ramosissima 78.1Cd 19.4 227.4h 20.5 Atriplex canescens 81.3* 5.1 89.1 16.3 Populus angustifolia6 87.5 8.8 121 . I 25.3 Populus deltoides (I S3 1 ) 90.6 13.3 194.4 7.6 Populus deltoides x P. nigra 95.3d 6.0 171 .5fgh 30.9 Eleagnus angustifolia 96.gd 3.6 1 38.5def 11.2 Ulmus pumila 98.4d 3.1 201 .5~~ 20.7
I : Represents two year overwintering survival , * : Second growing season height growth
3 : Same letter denotes non statistically significant difference. Different letters means statistically significant difference
4 : Standard deviation 5 : No height data was taken because of 0 or near 0% survival 6 : Species replicated only in two blocks
Table 2: Summary of ANOVA Results For Species Survival and Height (a = 0.05).
DF SS F P Sequential bonferroni Survival 25 1001 05.9 29.3 0.0000 0.025 species Height 13 212660.7 33.9 0.0000 0.05 seecies
Discussion
From the multiple range test on both survival and height growth, six species distinguish themselves from the rest. These species are Robinia pseudoacacia, Tamarix ramosissima, Atriplex canescens, Populus deltoides x Populus nigra, Eleagnus angustifolia, and Ulmus pumila (survival rate of over 70% to over 98% and height growth of 89 cm to over 220 crn). We believe that these species are potentially useful for wastewater reclamation. In addition to good growth and survival Tamarix ramosissima and Atriplex canescens are two species known for their salt inclusion ability. These species will remove the salt from the soil allowing other species of lower salt tolerance to survive, grow and provide biomass. Nitrogen-fixation is also important because it has been found that application of wastewater decreases essential nutrients in the soil (Tecle et. a1 1993). Robinia pseudoacacia and Eleagnus angustrfolia are known to be nitrogen fixing species. They will help replenish the soil with nitrogen which is a major limiting soil nutrient. This will benefit other species that are unable to fix nitrogen. Another feature of Robinia pseudoacacia is its salt resistance (Dirr 1976).
Three other species may have some promise in tolerating wastewater irrigation. Even though Caragana arborescens and Gleditsia triacanthos have somewhat moderate height growth (68 and 66 cm respectively), they are still considered to be very good candidates because of their high survival rate (64% and 78% respectively). Caragana arborescens also fixes nitrogen. The third species is Populus deltoides var. siouxland. Even though this species has a moderate survival rate (42%), we think that it will make a good candidate since it has consistent survival through time (from 65% at the end of the first growing season to 42% after the second winter) and good height growth (153 cm).
The remaining 26 species performed poorly in the experiment. Five species have survival rates between 20 and 45%. Among the twelve remaining species, most of them conifers, only one species survived. Most of the failure of these species is probably due to a combination of factors including cultural problems, harsh environmental conditions, and lack of the appropriate mycorrhizal association. One important cultural problem was the irrigation system. Some parts of the fields were flooded for days while others remained without water.* There were some occasions where the fields went several weeks without getting water. A second problem was the poor condition of the planting stock. Prunus virginiana and Pinus sylvestris were two species that failed because of poor planting stock. The planting date could also be the cause of failure of some of the species. Environmental conditions such as the cold winter and high clay soil may have played an important role in the failure of some species. The 100% mortality of Tamarix aphylla after the first winter is due to cold intolerance. The lack of proper mycorrhizal association is probably responsible for the poor performance of Pinus ponderosa.
Six species that were not included in the statistical analysis were those replicated in only two blocks. Four of these species show promise to be very good reclamation candidates. Their survival rate ranges from 56.2% to 90.6% and height growth from 90.6 to over 194 cm (Table 1). Populus dekoides x Populus nigra (5326) had a very low survival but it is interesting to note that this low survival of 34.4% is not related to the species itself but
entirely to cultural problems. The only complete failure in this group of species is Pinus radiata which we believe died due to cold intolerance.
A larger project is underway in which several species from this experiment and many additional species are being tested (a total of 59) for their survival and growth when irrigated with wastewater. Chemical analyses on both soil and vegetation will be conducted to see whether or not there is any significant difference in the species ability to treat the wastewater and the soil. Tests will also be done to assess if there are any differences in the nitrogen content of the plants and soil under nitrogen fixing trees and non-nitrogen fixing trees.
We can conclude that suitable species exist for reclamation of saline pulp and paper mill wastewater and for production of biomass for fuel and/or pulpwood. Combination of different species with different attributes would be the best reclamation strategy. Some species are known to be salt tolerant and most importantly to be salt includers. These species can be used to extract salt from the water and the soil and to produce biomass. Other species can be used to replenish the soil with nitrogen and reduce, if not eliminate, chemical fertilizer application to the soil. A third group of species can be used exclusively for biomass production. Populus species are famous for their widespread use in short rotation energy plantations. Even though these species are not known to be very salt tolerant, mixing them with salt including species and nitrogen fixing trees may provide suitable conditions for the Populus species to grow well and produce biomass. Species diversification will also reduce the likelihood of insect or disease outbreaks and provide variable habitats for many wildlife species.
Literature Cited
Aw, M.; Wagner, M.R.; Tecle, A. & Avery, C.C. 1993. Land application system to treat pulp and paper mill wastewater in Arizona. p. 68-73. In: Proceedings of the Pulpmill Waste Utilization in the Forest Conference. Alberta, Canada, April 1993.
Bray, J.H., & Maxwell, S.E. 1985. Univariate contrasts. p. 52-53. In: Multivariate Analysis of Variance. SAGE University Paper; SAGE Publications, Inc., Beverly Hills, California. U.S.A. 80 pp.
Dirr, M.A. 1976. Selection of trees for tolerance to salt injury. Journal of Arboriculture. 52(2): 209-21 6.
Rice, Williams, R. 1989. Analyzing tables of statistical tests. Evolution, 43(1): 223-225.
Tecle, A.; Wagner, M.R. & Avery, C.C. 1993. Wastewater reuse for biomass irrigation. Second Annual Report Submitted to Stone Container Corporation Snowflake Mill Arizona. (unpublished).
Zar, J.H. 1984. Data Transformation. 71 8 pp. In Biostatistical Analysis (2"d edition). Prentice-Hall, Inc., Englewood Cliffs, New Jersey, U.S.A.
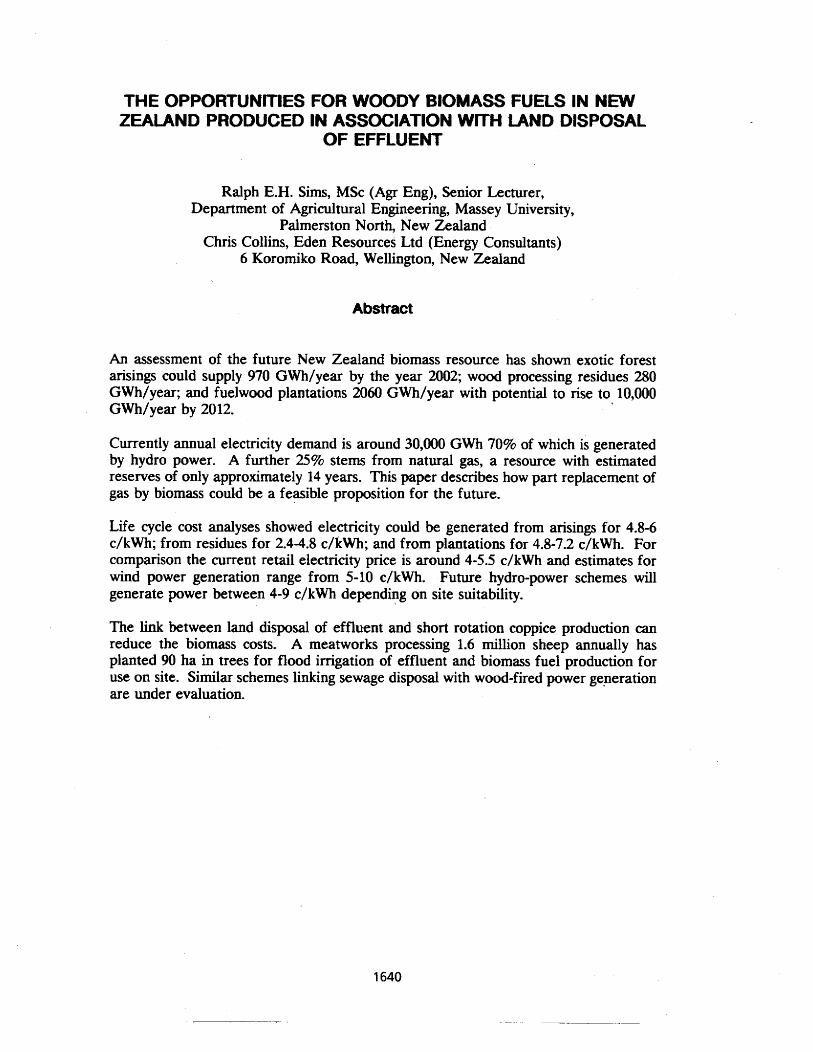
THE OPPORTUNrrlES FOR WOODY BIOMASS FUELS IN NEW ZEALAND PRODUCED IN ASSOCIATION wrrH UND DISPOSAL
OF EFFLUENT
Ralph E.H. Sims, MSc (Agr Eng), Senior Lecturer, Department of Agricultural Engineering, Massey University,
Palmerston North, New Zealand Chris Collins, Eden Resources Ltd (Energy Consultants)
6 Koromiko Road, Wellington, New Zealand
Abstract
An assessment of the future New Zealand biomass resource has shown exotic forest arisings could supply 970 GWh/year by the year 2002; wood processing residues 280 GWh/year; and fuelwood plantations 2060 GWh/year with potential to rise to 10,000 GWh/year by 2012.
Currently annual electricity demand is around 30,000 GWh 70% of which is generated by hydro power. A further 25% stems from natural gas, a resource with estimated reserves of only approximately 14 years. This paper describes how part replacement of gas by biomass could be a feasible proposition for the future.
Life cycle cost analyses showed electricity could be generated from arisings for 4.8-6 c/kWh; from residues for 2.4-4.8 c/kWh; and from plantations for 4.8-7.2 c/kWh. For comparison the current retail electricity price is around 4-5.5 c/kWh and estimates for wind power generation range from 5-10 c/kWh. Future hydro-power schemes will generate power between 4-9 c/kWh depending on site suitability.
The link between land disposal of effluent and short rotation coppice production can reduce the biomass costs. A meatworks processing 1.6 million sheep annually has planted 90 ha in trees for flood irrigation of effluent and biomass fuel production for use on site. Similar schemes linking sewage disposal with wood-fired power generation are under evaluation.
Background
A recent detailed study on "Renewable energy opportunities for New Zealand" (Collins et al, 1993) outlined potential for further development of these technologies. Currently . hydro-electricity provides over 75% of the power demand and around 20% of the country's total energy supply. Further schemes will be subject to stringent environmental audit. Geothermal power is also produced and supplies 3-4% of electricity. The remainder comes from natural gas, coal and oil-fired power plants.
The study aimed to see how far national supply curve data (being the quantities of energy available at different costs) could be evaluated for different renewable resource- technology application packages based on existing information. Biomass was included.
The focus of the study was on renewable resources that could displace fossil fuel sources of heat and power. Transport fuels were not considered to the same degree. The renewable energy resources included further sources of hydro and geotherm-al, wind, active solar, passive solar, wave, biogas, landfill gas and biofuels from agriculture and forest products. This paper concentrates on these biomass fuels (including domestic firewood) and provides a summary of the detailed analysis.
National supply m e data provided the various amounts of different types of energy (GWh of power or GJ of heat) that can be obtained at different costs (c/kWh or $/GJ). (Note: US$'s used).
The study for the Ministry of Commerce, was motivated by fossil fuel resource depletion, security of supply, and responsibilities to future generations. Technological innovation in biomass applications and growing environmental standards are combining to make biomass sources progressively viable economically. This is particularly so if short rotation forest crops (e.g. coppice eucalyptus) can be grown in association with the land disposal of waste water from sewage treatment or industrial processes.
Biomass energy guantity estimates
The present and potential energy quantities supplied from biomass sources are shown in fig 1. The energy levels shown allow for the variable moisture contents of the fuels.
The current plantation forest area of 1.3 million hectares of Pinus radiata is dominated by younger age classes so double the present wood production is anticipated by 2005. Recoverable biomass was estimated to be 1 9% by weight of present stem harvest levels (Sims et al, 1991).
Currently around 505 of the 3.9 million m3 of bark, chips, sawdust and savings is used for energy production on site by wood processors. This will increase as competitive energy prices increase and greater volumes are produced.
It is evident that the greatest potential source of biomass fuels comes from energy plantations. The uptake by growers will depend on future demand for fuelwood and competition for land by traditional pastoral products. Yields of 20 oven dry tonnes/ha/year were assumed based on current field trials but work on species selection and improvement would be beneficial in increasing yields.
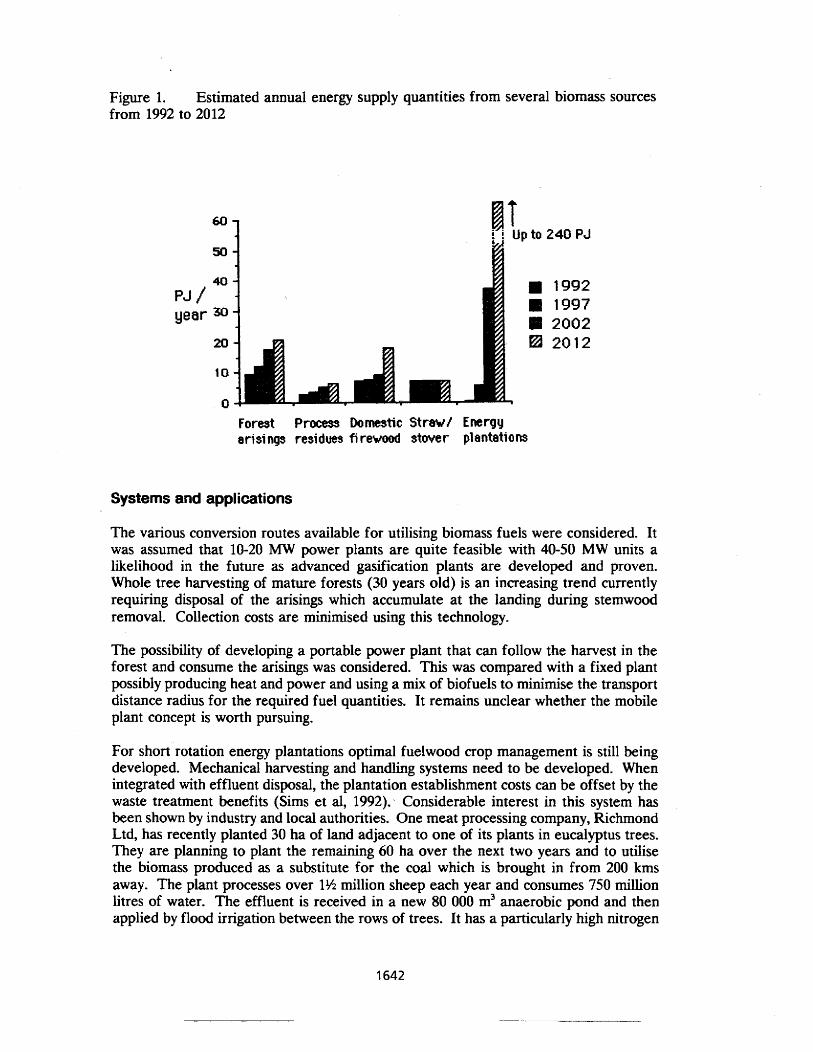
Figure 1. Estimated annual energy supply quantities from several biomass sources from 1992 to 2012
PJ / year
Forest Process Domestic Straw/ Energy arisings residues fi rewood stover plantations
Systems and applications
The various conversion routes available for utilising biomass fuels were considered. It was assumed that 10-20 MW power plants are quite feasible with 40-50 MW units a likelihood in the future as advanced gasification plants are developed and proven. Whole tree harvesting of mature forests (30 years old) is an increasing trend currently requiring disposal of the arisings which accumulate at the landing during stemwood removal. Collection costs are minimised using this technology.
The possibility of developing a portable power plant that can follow the harvest in the forest and consume the arisings was considered. This was compared with a fixed plant possibly producing heat and power and using a mix of biofuels to rninirnise the transport distance radius for the required fuel quantities. It remains unclear whether the mobile plant concept is worth pursuing.
For short rotation energy plantations optimal fuelwood crop management is still being developed. Mechanical harvesting and handling systems need to be developed. When integrated with effluent disposal, the plantation establishment costs can be offset by the waste treatment benefits (Sims et al, 1992). Considerable interest in this system has been shown by industry and local authorities. One meat processing company, Richmond Ltd, has recently planted 30 ha of land adjacent to one of its plants in eucalyptus trees. They are planning to plant the remaining 60 ha over the next two years and to utilise the biomass produced as a substitute for the coal which is brought in from 200 kms away. The plant processes over 1% million sheep each year and consumes 750 million litres of water. The effluent is received in a new 80 000 m3 anaerobic pond and then applied by flood irrigation between the rows of trees. It has a particularly high nitrogen

content but trials on 6 ha of land over 5 years have shown no adverse effects on most of the species tested. The evaluation is continuing and a study of harvesting, processing, drying and storing the biomass for use as a fuel is underway. Growing the fuel close to the heat and power demand centre is a major advantage in reducing transport and transmission costs and losses. The fuel is available all year round and a study to ascertain if harvesting throughout the year without affecting coppice regrowth can be accomplished is showing promise.
There is considerable research yet to complete before confidence can be attached to any least cost supply data relating to biomass utilisation. However progress is promising and the fact that a commercial organisation is willing to invest heavily in the concept to overcome its effluent disposal problems .will increase the knowledge base substantially.
Biomass development costs
Life cycle cost analyses were undertaken using the best available information on the technology in question. A discount rate of 10% was employed and all costs are tax inclusive. Inflation was not considered nor were environmental externalities from using fossil fuels.
A range of actual development costs was evident in the analysis due to specific circumstances such as location, soil types etc. For example the cost of biomass fuels varied from zero for some wood processing residues to $2.40/GJ for chips sourced from the more expensive of the fuelwood plantations. Factors such as using higher utilisation levels of the conversion plant, and trading off higher operation and maintenance costs for lower capital costs tended to lower costs.
A summary of the performance data is given in table 1. The capital cost of conversion plant was based on existing plant installed overseas (except for domestic firewood stoves which are manufactured in New Zealand). The costs of procuring the fuel depends on the resource type and distance from source to conversion point. Typical conversion efficiency was taken to be 20% though the potential to increase this to 40% using direct gasification plants was noted. The operation and maintenance costs were based on typical boiler steam turbine units. The overall life cycle cost depends very much on the input fuel cost.
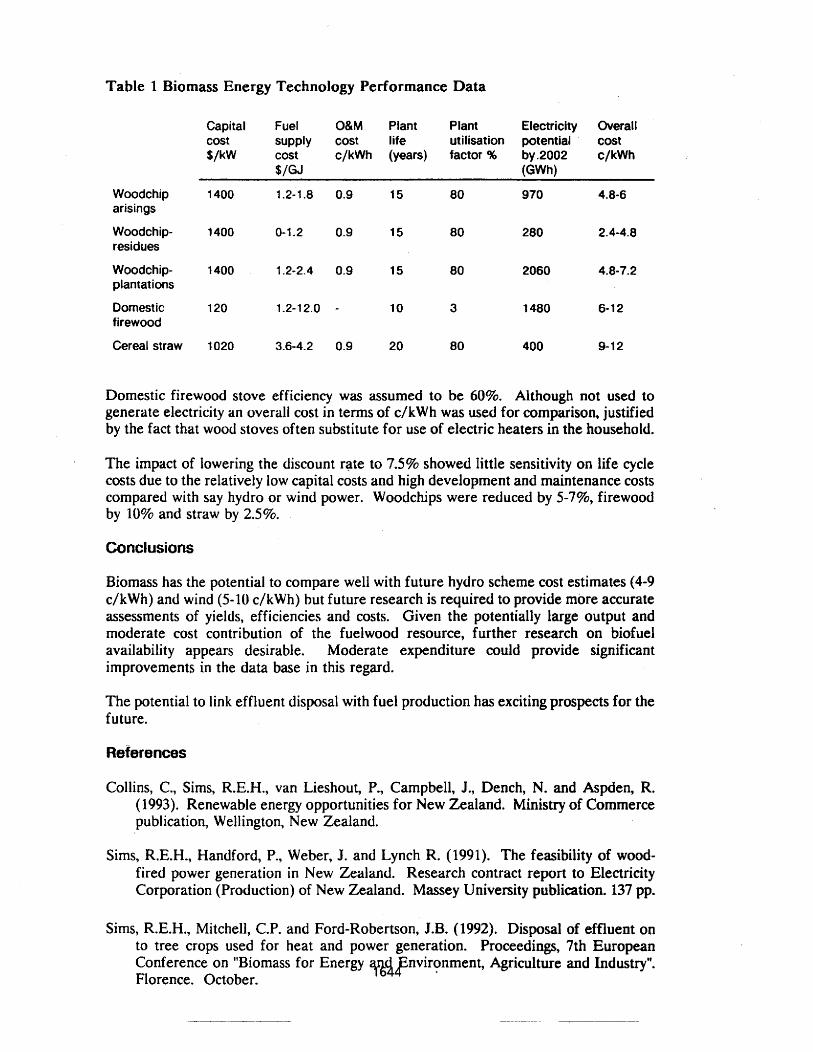
Table 1 Biomass Energy Technology Performance Data
Capital Fuel O&M Plant Plant Electricity Overall cost supply cost life utilisation potential cost $/kW cost c/kWh (years) factor % by.2002 c/kWh
$/GJ (GWh)
Woodchip 1400 1.2-1.8 0.9 15 80 970 4.8-6 arisings
Woodchip- 1400 0-1 -2 0.9 15 80 280 2.4-4.8 residues
Woodchip- 1400 1.2-2.4 0.9 15 80 2060 4.8-7.2 plantations
Domestic 120 1.2-12.0 - 10 3 1480 6-1 2 firewood
Cereal straw 1020 3.6-4.2 0.9 20 80 400 9-1 2
Domestic firewood stove efficiency was assumed to be 60%. Although not used to generate electricity m overall cost in terms of c/kWh was used for comparison, justified by the fact that wood stoves often substitute for use of electric heaters in the household.
The impact of lowering the discount rate to 7.5% showed little sensitivity on life cycle costs due to the relatively low capital costs and high development and maintenance costs compared with say hydro or wind power. Woodchips were reduced by 5-7%, firewood by 10% and straw by 2.5%.
Conclusions
Biomass has the potential to compare well with future hydro scheme cost estimates (4-9 c/kWh) and wind (5-10 c/kWh) but future research is required to provide more accurate assessments of yields, efficiencies and costs. Given the potentially large output and moderate cost contribution of the fuelwood resource, further research on biof uel availability appears desirable. Moderate expenditure could provide significant improvements in the data base in this regard.
The potential to link effluent disposal with fuel production has exciting prospects for the future.
Collins, C., Sims, R.E.H., van Lieshout, P., Campbell, J., Dench, N. and Aspden, R. (1993). Renewable energy opportunities for New Zealand. Ministry of Commerce publication, Wellington, New Zealand.
Sirns, R.E.H., Handford, P., Weber, J. and Lynch R. (1991). The feasibility of wood- fired power generation in New Zealand. Research contract report to Electricity Corporation (Production) of New Zealand. Massey University publication. 137 pp.
Sims, R.E.H., Mitchell, C.P. and Ford-Robertson, J.B. (1992). Disposal of effluent on to tree crops used for heat and power generation. Proceedings, 7th European Conference on "Biomass for Energy a&Jhvironment, Agriculture and Industry". Florence. October.
WASTEWATER SLUDGE FERTILIZATION: BIOMASS PRODUCTIVITY
AND HEAVY METAL BIOACCUMULATION IN TWO SALlX SPECIES
GROWN IN SOUTHERN QUEBEC (CANADA)
Traian I. Teodorescu, Engineer in Agriculture, Research Scientist; Michel Labrecque, P h. D. , Research Scientist;
Stephane Daigle, Statistician, Research Support Specialist; Guylaine Poisson, B.S. , Research Support Specialist
lnstitut de recherche en biologie v@etale, Jardin Botanique de Montreal, 41 01 Sherbrooke Est, Montreal, Quebec, Canada, H I X2B2
Abstract
More than other kind of trees, fast giowing tree species, such as willows, can profit fiom sludge application. While'sludges are good fertilizers, they may also contain heavy metals which could reduce productivity and cause risks to the environment. The main aims of the present research were to study: i) the production capacity of W i x ~ z . F c o ~ ~ ? ' and Salix viminafis when supplied with various amounts of dried and pelleted sludge; ii) the uptake,and accumulation of heavy metals. Unrooted cuttings were planted on sandy soil in large plastic pots and grown in outdoors for 20-week period. Five doses of sludge were applied: equivalent of 200 (TI), 160 (T2), 120 (T3), 80 (T4) and 40 (T5) kg N per ha. Trees wich received the largest amount of sludge showed the best growth results. The stem-branch biomass was significantly higher for ,%fix vimiraali,~. The relationship between the total yeld biomass Y (tha) and the rate of fertilisation X (kg Nfha) is linear. The regression equations of prediction biomass production were established as following: Salix discolor Y = 1.807 + 0.037X and .%zfix viminafi.~ Y = 2.578 + 0.042X. For both species, greatest stems-branch biomass per gram of N applied were produced by treatments 1 and 2. The amount of nitrogen per leaf area (NILA) and per leaf dry weight (N/LW), were higher for ,Wrx viminali.~ which leads us believe that its photosynthetic activity was better. The m f e r coefficient did not vary between the species but was significantly dierent for Cd and Zn. The plants were able to absort, Cd and Zn but less of Ni, Hg and Cu and Pb. It was concluded that the dried and pelleted sludge can be a good fertilizer. The treatment is beneficial when ,%f ix Ifr~cofor and particulary SaIix virnirmfi.~ are used as vegetation filters for westewater sludge purification and production purposes.
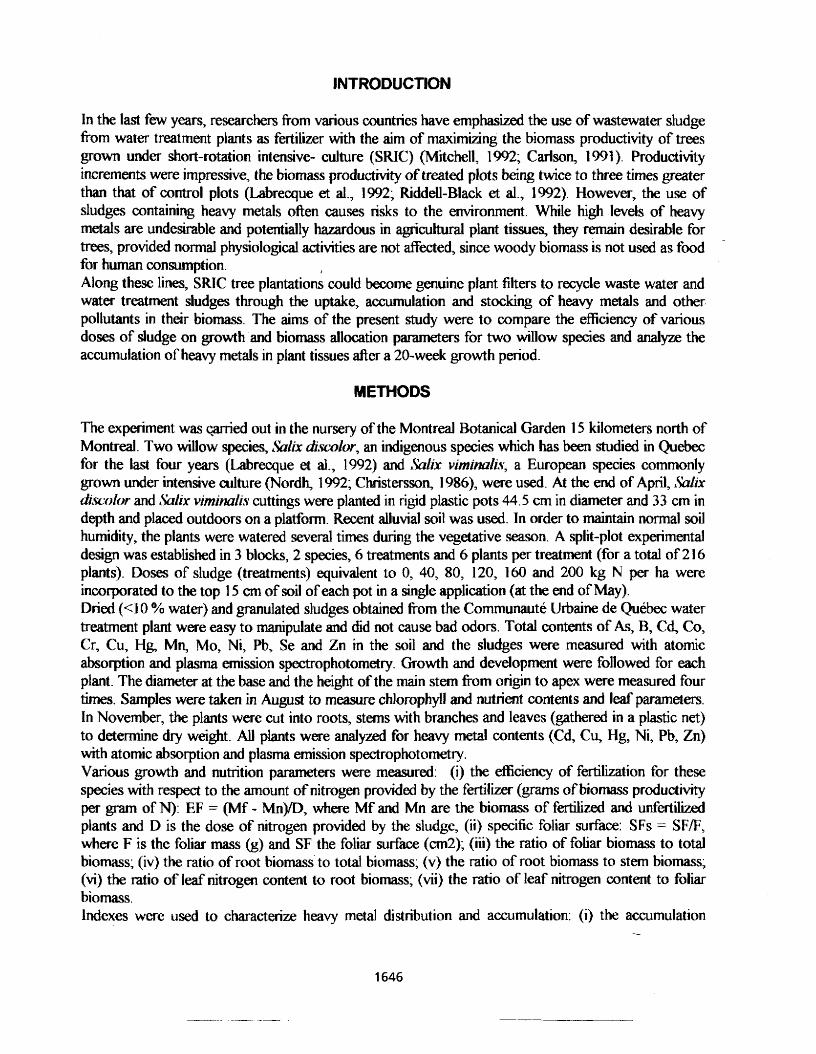
In the last few years, researchers from various countlies have emphasized the use of wastewater sludge from water treatment plants as fertilizer with the aim of maximizing the biomass productivity of trees grown under short-rotation intensive- culture (SRIC) (Mitchell, 1992; Carlson, 1991). Productivity increments were impressive, the biomass productivity of treated plots being twice to three times greater than that of control plots (Labrecque et al., 1992; Riddell-Black et id., 1992). However, the use of sludges containing heavy metals often causes risks to the environment. While high levels of heavy metals are undesirable and potentially hazardous in agricultural plant tissues they remain desirable for trees, provided normal physiological activities are not aEected, since woody biomass is not used as food
-
for human consumption. I
Along these lines, SRIC tree plantations could become genuine plant filters to recycle waste water and water treatment sludges through the uptake, accumulation and stocking of heavy metals and other pollutants in their biomass. The aims of the present study were to compare the efficiency of various doses of sludge on growth and biomass allocation parameters for two willow species and analyze the accumulation of heavy metals in plant tissues after a 20-week growth period.
The experiment was qanied out in the nursery of the Montreal Botanical Garden 1 5 kilometers north of Montreal. Two willow species, Salx d.woZor, an indigenous species which has been studied in Quebec for the last four years (Labrecque et al., 1992) and IIb l i~ vimilmlrs, a European species commonly gown under intensive culture (Nordh, 1992; Christersson, 1986), were used. At the end of April, S'aIix d.scolor and W x viminaIi.s cuttings were planted in rigid plastic pots 44.5 cm in diameter and 33 cm in depth and placed outdoors on a platform. Recent alluvial soil was used. In order to maintain normal soil humidity, the plants were watered several times during the vegetative season. A split-plot experimental design was established in 3 blocks, 2 species, 6 treatments and 6 plants per treatment (for a total of 21 6 plants). Doses of sludge (treatments) equivalent to 0, 40, 80, 120, 160 and 200 kg N per ha were incorporated to the top 1 5 cm of soil of each pot in a single application (at the end of May). Dried (< I0 % water) and granulated sludges obtained from the Communaute Urbaine de Quebec water treatment plant were easy to manipulate and did not cause bad odors. Total contents of As, B, Cd, Co, Cr, Cu, Hg Mn, Mo, Ni, Pb, Se and Zn in the soil and the sludges were measured with atomic absorption and plasma emission spstrophotometiy. Growth and development were followed for each plant. The diameter at the base and the height oft he main stem from origin to apex were measured four times. Samples were taken in August to measure chlorophyll and nutrient contents and leaf parameters. In November, the plants were cut into roots, stems with branches and leaves (gathered in a plastic net) to determine dry weight. All plants were analyzed for heavy met . contents (Cd, Cu, Hg, Ni, Pb, Zn) with atomic absorption and plasma emission spectrophotometry. Various growth and nutrition parameters were measured: (i) the efficiency of fertilization for these species with respect to the amount of nitrogen provided by the fertilizer (grams of biomass productivity per g ~ a m of N): EF = (Mf - Mn)/D, where Mf and Mn are the biomass of f&ed and unfertilized plants and D is the dose of nitrogen provided by the sludge, (ii) specific foliar surface: SFs = SFR, where F is the foliar mass (g) and SF the foliar surface (cm2); (iii) the ratio of foliar biomass to total biomass; (iv) the ratio of root biomass to total biomass; (v) the ratio of root biomass to stem biomass; (vi) the ratio of leaf nitrogen content to root biomass; (vii) the ratio of leaf nitrogen content to foliar biomass. lndexes were used to characterize heavy metal distribution and accumulation. (i) the accumulation
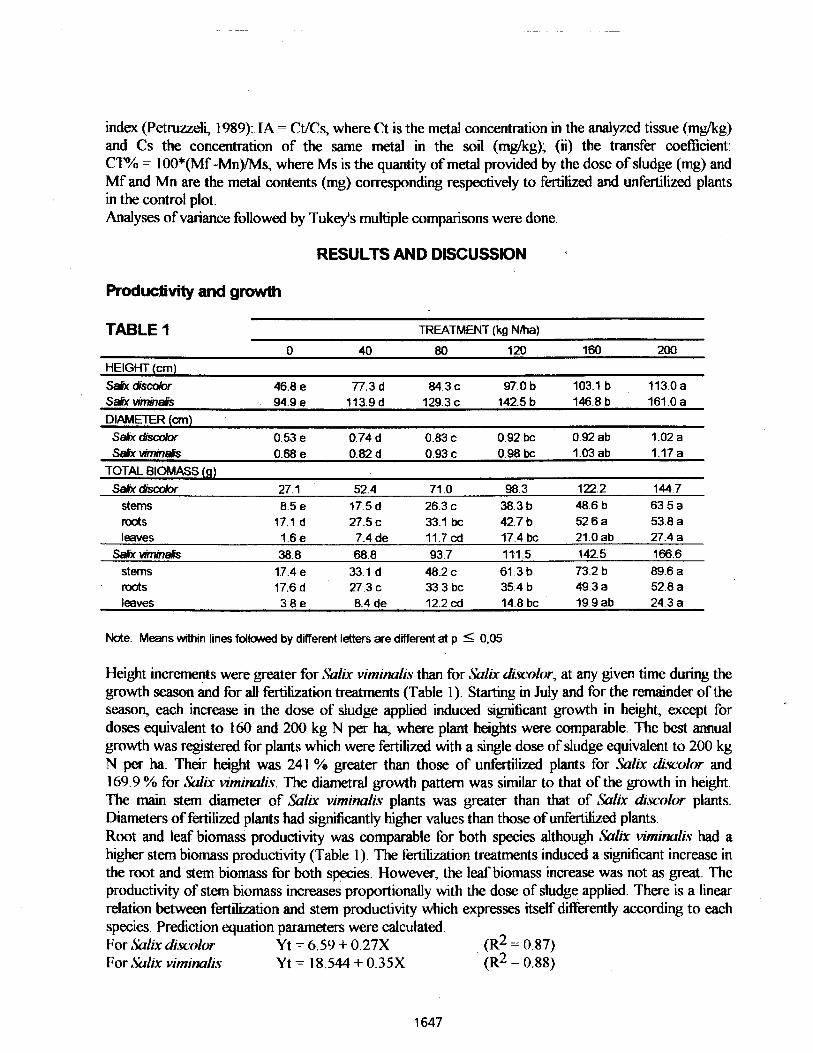
index (Petruzzeli, 1989): IA -= Ct/Cs, where Ct is the metal concentration in the analyzed tissue (mgkg) and Cs the concentration of the same metal in the soil (mgkg); (ii) the transfer coefficient: CT% = 1 OO*(Mf -Mn)/Ms, where Ms is the quantity of metal provided by the dose of sludge (mg) and Mf and Mn are the metal contents (mg) corresponding respectively to fertilized and unfertilized plants in the control plot. Analyses of variance followed by Tukey's multiple comparisons were done.
RESULTS AND DISCUSSK)N
Productivity and growth
TABLE 1 TREATMENT (kg Ntha)
0 40 80 120 160 200 HEIGHT (cm) S&dscdor 46.8 e 77.3 d 84.3 c 97.0 b 103.1 b 113.0 a SaSx vimhds 94.9 e 113.9d 129.3 c 142.5 b 146.8 b 161.0 a DIAMETER (an)
SaSx dscdor 0.53 e 0.74 d 0.83 c 0.92 bc 0.92 ab 1.02 a Sebc biminaSs 0.68 e 0.82 d 0.93 c 0.98 bc 1.03 ab 1.17 a
TOTAL BIOMASS (g)
Sdxdismbr 27.1 52.4 71 .O 98.3 1Z .2 144.7 stems 8.5 e 17.5 d 26.3 c 38.3 b 48.6 b 63.5 a mots 17.1 d 27.5 c 33.1 bc 42.7 b 52.6 a 53.8 a leaves 1.6 e 7.4 de 11.7 cd 17.4 bc 21.0 ab 27.4 a
Sdx Mn&s 38.8 68.8 93.7 111.5 142.5 166.6 stems 17.4 e 33.1 d 48.2 c 61.3 b 73.2 b 89.6 a rods 17.6 d 27.3 c 33.3 bc 35.4 b 49.3 a 52.8 a leaves 3.8 e 8.4 de 12.2 cd 14.8 bc 19.9 ab 24.3 a
Note: Means within lines followed by different letters are different at p ZZ 0,05
Height increments were greater for l'ialix viminali.~ than for ,%fix discolor, at any given time during the growth season and for all fertilization treatments (Table 1). Starting in July and for the remainder of the season, each increase in the dose of sludge applied induced significant growth in height, except for doses equivalent to 160 and 200 kg N per ha, where plant heights were comparable. The best annual growth was registered for plants which were fertilized with a s@e dose of sludge equivalent to 200 kg N per ha. Their height was 241 % greater than those of unfertilized plants for I%lix d.wofor and 169.9 % for ,%fix viminaiis. The diarnetral growth pattern was similar to that of the growth in height. The main stem diameter of ,%fix vimirmlis plants was greater than that of .%fix cfiscolor plants. Diameters of fertilized plants had sigruficantly higher values than those of unfdued plants. Root and leaf biomass productivity was comparable for both species although ,%fix virninaii.~ had a higher stem biomass productivity (Table 1). The fertilization treatments induced a significant increase in the root and stem biomass for both species. However, the leaf biomass increase was not as great. The productivity of stem biomass increases proportionally with the dose of sludge applied. ~here-is a linear relation between fertiliion and stem productivity which expresses itself ditkently according to each species. Prediction equation parameters were calculated. For ,%fix di~scolor Yt = 6.59 + 0.27X ( R ~ = 0.87) For ,%fix vimina1i.s Yt = 18.544 + 0.35X ( R ~ = 0.88)
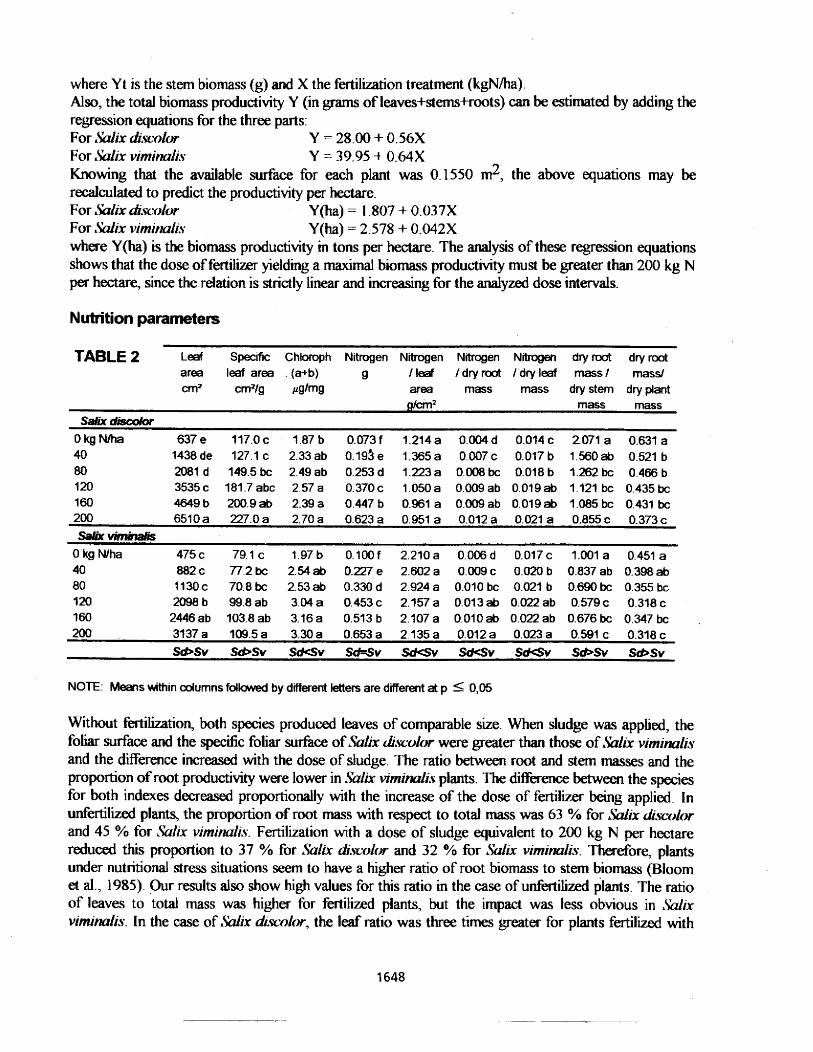
where Yt is the stem biomass (g) and X the fertilization treatment (kgN/ha). Also, the total biomass productivity Y (in grams of leaves+stems+roots) can be estimated by adding the regression equations for the three parts: For M i x cfr.~colw Y = 28.00 + 0.56X For ,%fix v m i ~ ~ ~ i i . s Y = 39.95 + 0.64X Knowing that the available d a c e for each plant was 0.1550 m2, the above equations may be recalculated to predict the productivity per hectare. For ,Wix &As~(~hr Y(ha) = 1.807 + 0.037X For ,%fix vimirmiis Y(ha) = 2.578 + 0.042X where Y(b) is the biomass productivity in tons per hectare. The analysis of these regression equations shows that the dose of fertilii yielding a maximal biomass productivity mu st be greater than 200 kg N per hectare, since the relation is strictly linear and increasing for the analyzed dose intervals.
Nutrition parameters
TABLE 2 ~eaf Specific Chtoroph Nitrogen Nitrogen Nitrogen Nit- dry root dry root area leaf area . (a+b) 9 /leaf /dry root /dry leaf mass/ mass/ cm2 crn2/g p g h g area mass mass dry stem dry plant
NOTE: M m s within cdurnns fdlcrwled by different letters are different at p 5 0,05
Without fktilization, both species produced leaves of comparable siie. When sludge was applied, the foliar surface and the specific foliar surfice of ,..li;r &.~coIor were greater than those of ,(;aiix vzmiy~iis and the difference increased with the dose of sludge. The ratio between root and stem masses and the proportion of root productivity were lower in Sola v i r n i d i s plants. The difference between the species for both indexes decreased proportionally with the increase of the dose of fertilizer being applied. In unfertilized plants, the proportion of root mass with respect to total mass was 63 % for ,Sullx CtrscoIor and 45 % for SuIix virnina~i.~. Fertilization with a dose of sludge equivalent to 200 kg N per hectare reduced this proportion to 37 % for Sala d.5y:olrK and 32 % for ,.'iblix vzmimIiLs. Therefore, plants under nutritional stress situations seem to have a higher ratio of root biomass to stem biomass (Bloom et al., 1985). Our results also show high values for this ratio in the case of unfertilized plants. The ratio of leaves to 'total mass was higher for fertilized plants, but the impact was less obvious in Siziix vimimlzs. In the case of M i x ( t i ~ l t w , the leaf ratio was three times greater for plants fertilized with
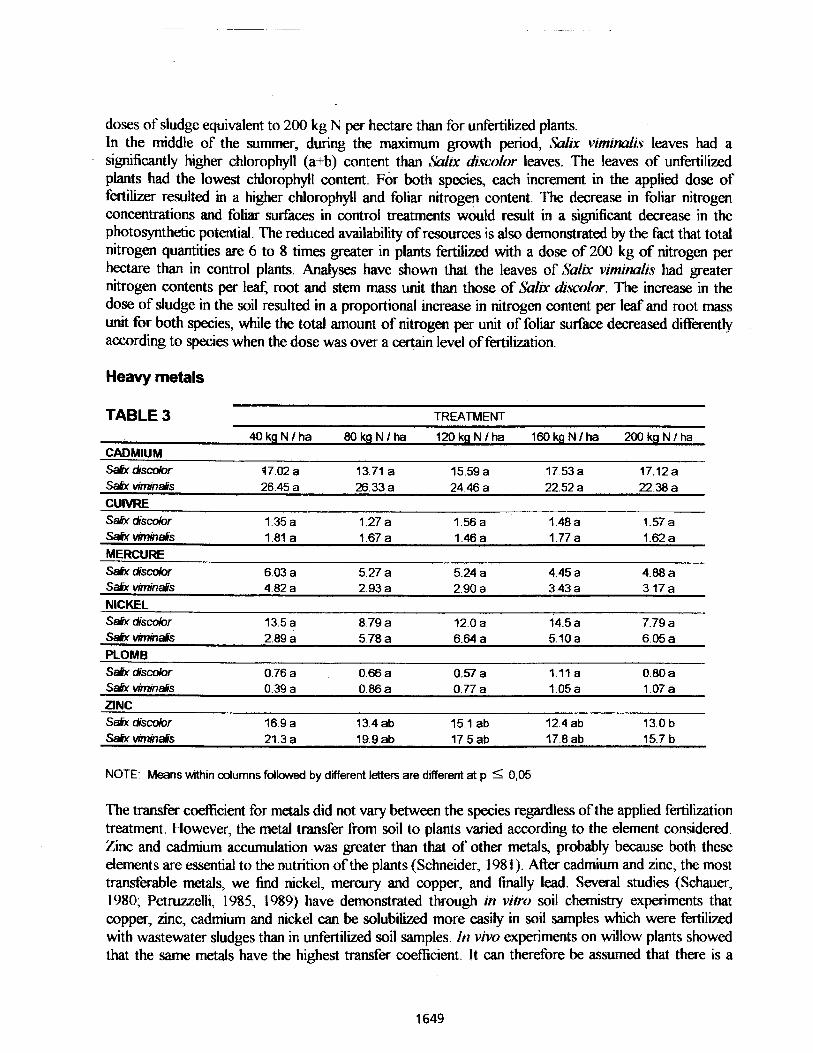
doses of sludge equivalent to 200 kg N per hectare than for unfertilized plants. In the middle of the summer, during the maximum growth period, Salix viminalis leaves had a significantly higher chlorophyll (a+b) content than Salix discolor leaves. The leaves of unfertilized plants had the lowest chlorophyll content. or both species, each increment in the applied dose of fertilizer resulted in a higher chlorophyll and foliar nitrogen content. The decrease in foliar nitrogen concentrations and foliar surfaces in control treatments would result in a significant decrease in the photosynthetic potential. The reduced availability of resources is also demonstrated by the fact that total nitrogen quantities are 6 to 8 times greater in plants fertilized with a dose of 200 kg of nitrogen per hectare than in control plants. Analyses have shown that the leaves of Salix vimim1i.s had greater nitrogen contents per leaf, root and stem mass unit than those of ,%iix Jlscolor. The increase in the dose of sludge in the soil resulted in a proportional increase in nitrogen content per leaf and root mass unit for both species, while the total amount of nitrogen per unit of foliar surface decreased differently according to species when the dose was over a certain level of fertilization.
Heavy metals
TABLE 3 TREATMENT
40kgNlha 80kgNlha 120kgNIha 160kgNIha 200kgNJha CADMIUM Sdx discdor 17.02 a 13.71 a 15.59 a 17.53 a 17.12a Safx vimn&s 26.45 a 26.33 a 24.46 a 22.52 a 22.38 a
c u m S& djscolor 1.35 a 1.27 a 1.56 a 1.48 a 1.57a Sdx W & s 1.81 a 1.67 a 1.46 a 1.77 a 1.62 a
MERCURE S& dis& 6.03 a 5.27 a 5.24 a 4.45 a 4.88 a Sah viminefs 4.82 a 2.93 a 2.90 a 3.43 a 3.17a
NICKEL Sah djscolor 13.5 a 8.79 a 12.0 a 14.5 a 7.79 a Sdx vknm6s 2.89 a 5.78 a 6.64 a 5.10 a 6.05 a
PLOMB Sedx disrolor 0.76 a 0.66 a 0.57 a 1.11 a 0.80 a Sab! vimin&#s 0.39 a 0.86 a 0.77 a 1.05 a 1.07a ZlNC
NOTE: Means within columns followed by different letters are different at p 5 0,05
The m f e r coefficient for metals did not vary between the species regardless of the applied fertilization treatment. However, the metal transfer from soil to plants varied according to the element considered. Zinc and cadmium accumulation was greater than that of other metals, probably because both these elements are essential to the nutrition of the plants (Schneider, 198 1 ). After cadmium and zinc, the most transferable metals, we find nickel, mercury and copper, and finally lead. Several studies (Schauer, 1 980; Petruzzelli, 1985, 1989) have demonstrated through m vi&o soil chemistry experiments that copper, zinc, cadmium and nickel can be solubilized more easily in soil samples which were fertilized with wastewater sludges than in unfertilized soil samples 111 vivo experiments on willow plants showed that the same metals have the highest transfer coefficient. It can therefore be assumed that there is a
direct link between metal solubility and their transferability into tissues.
The use of a dose of sludge equivalent to 200 kg nitrogen per hectare resulted in impressive productivity increases, the stem biomass of the plants being five to eight times greater than that of control plants. However, maximal productivity should be reached with a higher dose of sludge, since prediction equations are linear and strictly increasing for the fertilization interval studied. L'Salix vzrnimlis took up more nutrients than .%Ik di,rcolor, which allowed a better utilization of the sludge and resulted in greater productivity. . The ratio between foliar nitrogen contents and foliar mass, as well as the chlorophyll content of the leaves, could characterize the nutritional status of vegetative plants, since they are easy to establish and apply. The normal physioiogical activity of the plants did not seem to have been affected by metal absorption. Our results indicate that heavy metal absorption in the biomass is proportional to solubility. Both species accumulated the same heavy metals in their biomass, but Shfix ~irninali~~ seems to have a preference for zinc and lead. Between 50 and 80 % of the m d s found in the biomass at the end of the season were accumulated in the roots and stems, which means they had been removed from the system for a long period. This decreases contarnination risks due to the movement of pollutants in the environment.
BIBLIOGRAPHY
BLOOM, A.J., CHAPIN, F.S. 111 and MOONEY, H. A. 1985. Resource tunrtati<m in plants-an economic analogy. h u . Rev. Ecol. Syst. '16, pp. 363-392. C A W O N , M. 199 1. Municipal efluent irrigation af &st pwbg hybrid paplar pkmtihms near Vernon, British Cdumbia. Poplar Cmcil of Canada and the Unded States joint meettng. August 261h-2%, Ottawa. CHRLSTERSSON, L. 1986. hgh tdmology biomass produdion by .%Zix clam on a sandy soil in southern Swab, Tree Physiology, 20, pp. 261-277. LABRECQUE, M., TEODORESCU, T.I. and DAIGLE, S. 1992. mad of herba-s cornpe~ion and dramage amdhcm on the produdimty of willows under short-r&hm lntslsive ahme. Biomass & Bioenew in press. MITCHELL, C. P., SIMS, R-E.H. and FORD-ROBERTSON J.B. 1992. Disposal of effluent onto tree crops used for heat and p w r generation. 7th Eumpm mnkmce on biomass fbr mergy and mvkmmnt, agriculture and industry. 5-9 October, 1 992. Florence, b l y . p. 05.64 NORDH, N.-E. 1992. Testtog of Sblix clmes m variety test. 7th Eu- cmfkmce on biomass for energy andenvironmag agricultureand industry. 5-9 October* 1992. Florence, italy. p. 05.23. PEiTRUZZELLI, G., LUBRANO, L. and GUIDl G. 1985. Heavy m ~ a l extmctabih. Biocycle, 26, pp. 46- 49. PETRUZZELLI, G. 1 989. Recycling wastes in agriculture: heavy metal bioavailabilrty . Agriculture, Eoosystem and Envimnment, 27, pp. 493-503. Elsevier Science Publishers B. V., Amsterdam. RIDDELLBLACK, D. and HALLET, J . 1 992. Sewage sludge as a fertilrser for short rotation wood craps. 7th European mfermce on biomass hr energy and e n v i m a r t , a~~ and industry, 5-9 odober, 1992. Florence, Italy, p. 05.30. SCHAUER, P.S., WRIGHT, W.R. and PELCHAT, J. , 1980. Sludge borne heavy metal availability and uptake by vegetable crops under field d o n s . J. hviran. Qual., 9, pp. 69-73. SCHNEIDER, K. R., W[T1WER, R.F. and CARPENTER, S. B. 1981. Trees respond to sewage sludges in refbrestaticm of acid sporls. S w i m an surfhce mining hydrology, sxhentoL08y and reclamation. Univwslty of Kentucky, pp. 29 1-296.
AN OVERVIEW OF THE EFFECT OF FUEL PROPERTIES ON EMISSIONS FROM BIOMASS FUELS
Michael S. Graboski Colorado School of Mines
Golden, CO 80401
Abstract
Biofuels are considered to be environmentally benign since they are composed primarily of carbon, hydrogen and oxygen. The emissions resulting from biofuel use are dependent, however, on the system employed and how key fuel properties interact with the system. Two case studies are presented to demonstrate this fact. First, gasification and combustion of urban waste wood to produce electric power is investigated. Second, ethanol and ethanol derivatives are examined as reformulated gasoline additives.

Biomass based fuels have been reported to, in general, represent an environmentally benign approach to meeting conventional fiiel needs for a variety of industrial and commercial needs. Biomass based fuels are, or can be, utilized in a variety of ways including directly, or they may be processed to yield gaseous, liquid and solid forms. Each has potentially important uses but presents environmental issues. The purpose of this paper is to discuss the general relationships between the fuel properties and emissions resulting from their utilization. An important objective is to show, with two case studies, how the fuel and system interact to produce emissions.
All biomass fuels are derived from feedstocks which were living material. The most abundant feedstocks are cellulose based and consist of grasses , woody materials and municipal wastes. These feedstocks can be used as a whole or can be further processed to extract energy. In the first case, the file1 might be directly burned. In the latter case, it might be extracted, fermented or pyrolyzed to remove a high quality liquid which might be further processed to a fuel.
Biomass Feedstocks
Table I presents some fuel analysis data for a variety of solid biofuels. The basic composition of the fuel and the scheme being employed can significantly effect the emissions. An unregulated emission of growing importance is total greenhouse gases. As Table I shows, the majority of the fuel is always composed of carbon, hydrogen and oxygen which result ultimately in emissions of carbon dioxide and water vapor. These are environmentally acceptable since the original fuel carbon source was atmospheric carbon dioxide. Thus, unlike fossil fuels, biomass fuels are not as likely to contribute potentially to global change through the increase of carbon dioxide emissions in the atmosphere, except to the extent that fossil fuels are used in their, growing, harvesting, transportation and conversion.
This is not to say that such fuels themselves are environmentally benign. Incomplete combustion will result in carbon monoxide and hydrocarbon (VOC) emissions. In fuel combustion, nitrogen oxides can be generated thermally at temperatures above about 2700F. In addition, most biomass fuels contain traces of bound organic nitrogen. Bound nitrogen can be converted to nitrogen oxides (NOx) in very high yields under favorable processing conditions. Nitrogen oxides represent an important species in the formation of summer ground level ozone.
Biomass fuels often contain sulfur in small concentrations. Sulfur is important because it is converted to hydrogen sulfide in reducing atmospheres in gasification or sulfur dioxide in oxidizing environments.
The most important emission precursors in biomass fuels come from the ash residue which almost is always associated with biomass solids. This ash is present as both an integral part of the biomass substrate and as an admixed material. Most woody solid biomass is inherently low in integral ash. Biomass fuels derived from grasses can be quite high in this integral ash.
Dirt and other physically mixed materials can raise the ash content significantly. In addition, these ash niater ids often contain toxic heavy metals, and reactive halogens and phosphorus. Under the proper conditions, metals and other reactive elements can yield toxic organic emissions from combustion and gasification systems.
Woody materials might contain several tenths of a percent ash. Urban waste wood, because of paint, associated wall board, nails and dirt, might be 5% ash.
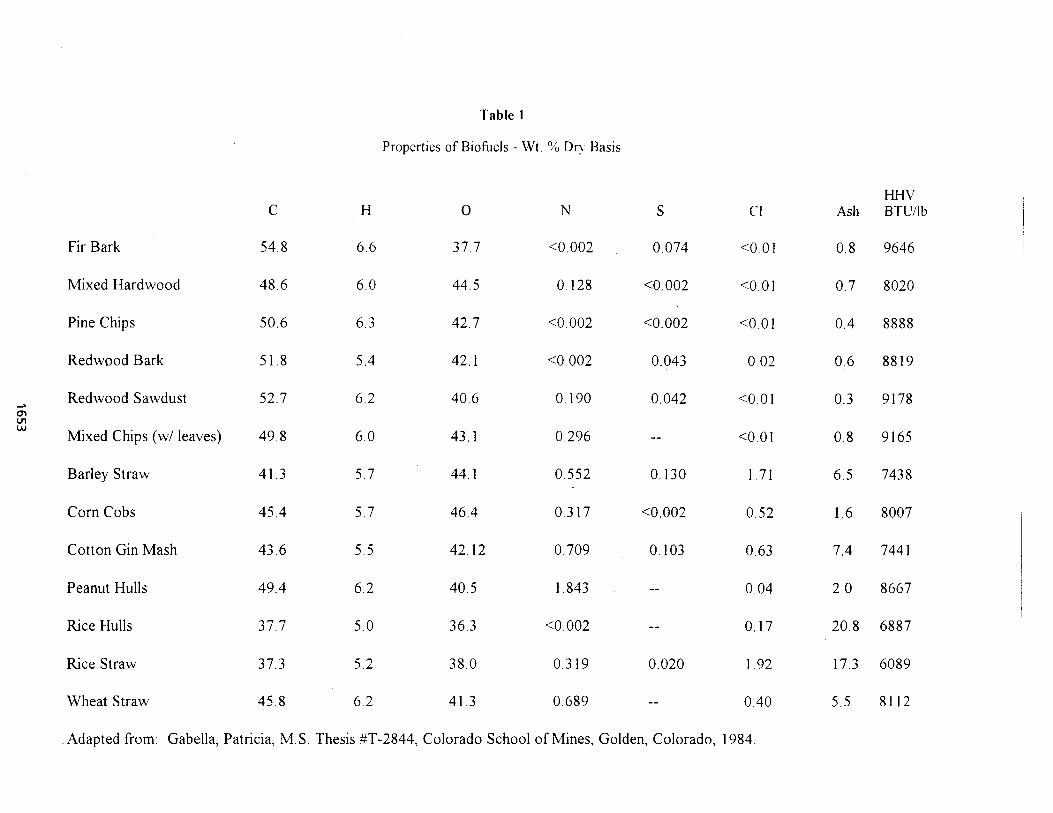
Table 1
Properties of Biofuels - Wt. 94 Dn. Basis
Fir Bark
HHV C H 0 N S C I Ash BTUIlb
Mixed Hardwood 48.6 6.0 44.5 0 128 <0.002 cO.0 1 0.7 8020
Pine Chips 50.6 6.3 42.7 <O 002 <0.002 <O 01
R e d w ~ o d Bark 51.8 5.4 42.1 <O 002 0.043 0 02
A Redwood Sawdust 52.7 6.2 40.6 0.190 0.042 <0.01 cn cn W
Mixed Chips (w/ leaves) 49.8 6.0 43.1 0.296 -- <0.01
Barley Straw 4 I .3 5.7 44.1 0.552 0.130 1.71
Corn Cobs 45.4 5.7 46.4 0.3 17 <0.002 0.52
Cotton Gin Mash 43.6 5.5 42.12 0.709 0.103 0.63
Peanut Hulls 49.4 6.2 40.5 1.843 -- 0.04
Rice Hulls 37.7 5.0 36.3 <O. 002 -- 0.17
Rice Straw 37.3 5.2 38.0 0.319 0.020 1.92
Wheat Straw 45.8 6.2 41.3 0.689 - - 0.40
Adapted from: Gabella, Patricia, M.S. Thesis #T-2844, Colorado School of Mines, Golden, Colorado, 1984.

MSW wastes may contain large amounts of ash and in particular these feedstocks can contain substantial amounts of metals including trace toxic metals like lead, mercury, arsenic and cadmium
Ash is often emitted as fine particulate which in itself often represents a PM-10 problem. The ash will contain any metals present in the ash. In addition, certain metals like mercury and arsenic are vaporized at modest temperatures and can preferentially be removed from the ash residue during combustion or gasification.
The ash itself must be disposed,of in an appropriate landfill. Disposal of hazardous ashes is expensive and represents a long term corporate liability. For most projects to be feasible, non-hazardous solid waste is mandatory. Ash disposal is a major problem associated with MSW facilities.
In order to environmentally permit a biomass conversion process, trace components of the fuel take on an important role. To simplify the permitting process, which is important in smaller biomass plants, it is important to have a well defined feedstock. Waste plants firing select waste are much more acceptable, for example to the public, than those firing MSW.
Power Generation and Gaseous Fuels
The emissions from the use of biomass fuels are process dependent as well as fuel dependent. Thus, in any case study, the utilization of the fuel and the technology employed requires the treatment of the system as a whole.
The most widespread use of biomass for electric power generation today is by direct combustion, primarily using spreader-stoker boiler technology. Spreader-stokers can handle a wide variety of fuel moisture contents and particulate sizes efficiently. However, there is limited ability to control emissions using stoker technology. Particulate control is usually accomplished using ESP or baghouse units. However, carbon monoxide emissions and nitrogen oxide emissions are very difficylt to manage.
In the early and mid- 1 9801s, I was actively involved in a company, Syngas, Inc., which was attempting to commercialize a moving bed downdraft low BTU gasification process to produce electricity from a biomass based fuel. Because of economic constraints, the feedstock of interest was "urban waste wood". Unlike whole tree chips which are available only at a significant cost, this material is available in and near urban areas at a zero or negative cost since it represents a landfill waste disposal problem. In fact, Syngas found that very attractive projects could be developed in the US Northeast based upon 10 to 20 MW power plants using gasification based technology and urban wood feedstocks.
Urban waste wood is a renewable resource. It is primarily composed of demolition wood removed from urban renewal projects and waste wood from land clearing. The fuel has very desirable properties from a fixed bed gasification or spreader-stoker perspective. First it is very dry. Second, it is present as large pieces. Comminution by hammer milling produces very little in the way of sawdust. The large particle size of the feed limits particulate carryover from the gasifier or combustor and allows for high throughput due to its low pressure drop and low moisture characteristics.
Technology Considerations
Ease of environmental permitting is a prime driver in the development of any new project. Small power plants are regulated by local authorities as stationary sources. In the greater New York metropolitan area, Syngas' Port Jefferson small power project (20 MW) fueled with urban waste wood chips met the minor source definition of under 250 MM BTUIhr of thermal output. Under this requirement in 1988, as Figure I shows, a project could receive a new air source emission permit as
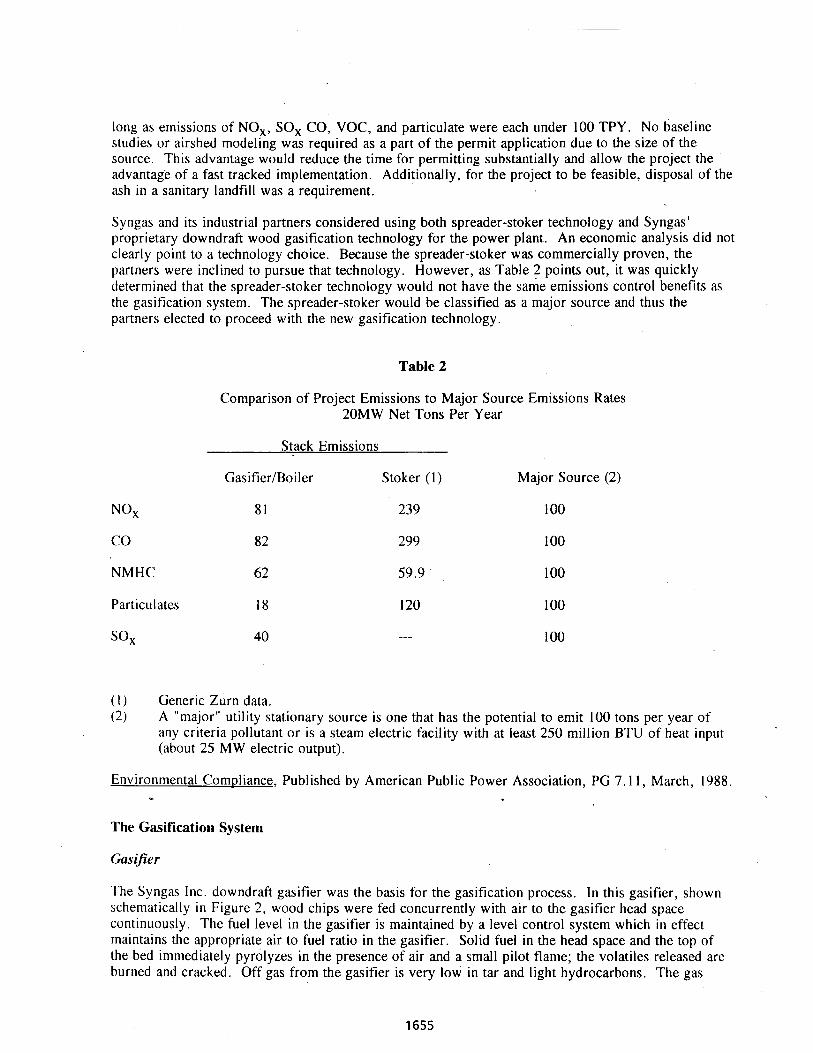
long as emissions of NO,, SO, CO, VOC, and particulate were each under 100 TPY. No baseline studies or airshed modeling was required as a part of the permit application due to the size of the source. This advantage would reduce the time for permitting substantially and allow the project the advantage of a fast tracked implementation. Additionally, for the project to be feasible, disposal of the ash in a sanitary landfill was a requirement.
Syngas and its industrial partners considered using both spreader-stoker technology and Syngas' proprietary downdraft wood gasification technology for the power plant. An economic analysis did not clearly point to a technology choice. Because the spreader-stoker was commercially proven, the partners were inclined to pursue that technology. However, as Table 2 points out, it was quickly determined that the spreader-stoker technology would not have the same emissions control benefits as the gasification system. The spreader-stoker would be classified as a major source and thus the partners elected to proceed with the new gasification technology.
Table 2
Comparison of Project Emissions to Major Source Emissions Rates 20MW Net Tons Per Year
Stack Emissions
GasifierIBoiler Stoker (1) Major Source (2)
NO,
CO
NMHC
Particulates
SOX 40 --- loo
( 1 ) Generic Zurn data. (2) A "major" utility stationary source is one that has the potential to emit 100 tons per year of
any criteria pollutant or is a steam electric facility with at least 250 million BTU of heat input (about 25 MW electric output).
Environmental Com~liance, Published by American Public Power Association, PG 7.11, March, 1988. w
The Gasification System
Gasifier
The Syngas Inc. downdraft gasifier was the basis for the gasification process. In this gasifier, shown schematically in Figure 2, wood chips were fed concurrently with air to the gasifier head space continuously. The fuel level in the gasifier is maintained by a level control system which in effect maintains the appropriate air to fuel ratio in the gasifier. Solid fuel in the head space and the top of the bed immediately pyrolyzes in the presence of air and a small pilot flame; the volatiles released are burned and cracked. Off gas from the gasifier is very low in tar and light hydrocarbons. The gas
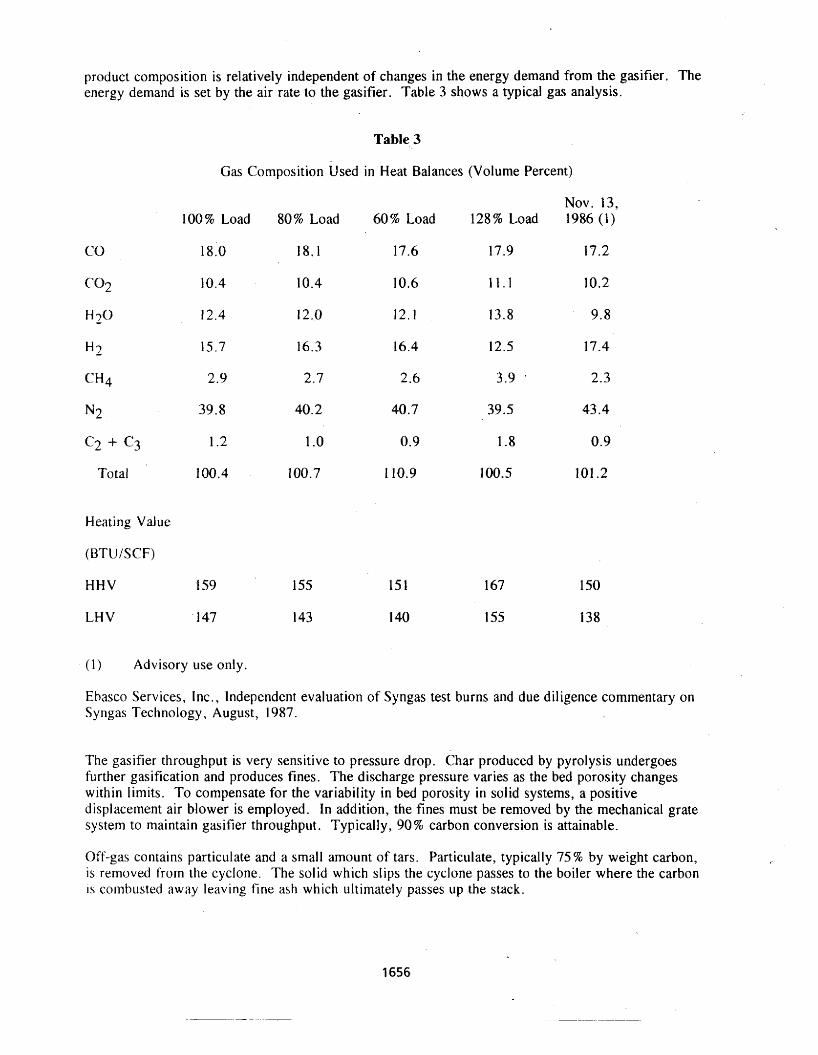
product composition is relatively independent of changes in the energy demand from the gasifier. The energy demand is set by the air rate to the gasifier. Table 3 shows a typical gas analysis.
Table 3
Gas Composition Used in Heat Balances (Volume Percent)
Nov. 13, 100% Load 80% Load 60% Load 128% Load 1986 (1)
CO
C02
H 2 0
'42
'344
N2
c2 + c3 Total
Heating Value
(BTUJSCF)
H H V .1 59 155 151
LHV '147 143 1 40
( 1 ) Advisory use only.
Ebasco Services, Inc., Independent evaluation of Syngas test burns and due diligence commentary on Syngas Technology, August, 1987.
The gasifier throughput is very sensitive to pressure drop. Char produced by pyrolysis undergoes further gasification and produces fines. The discharge pressure varies as the bed porosity changes within limits. To compensate for the variability in bed porosity in solid systems, a positive displacement air blower is employed. In addition, the fines must be removed by the mechanical grate system to maintain gasifier throughput. Typically, 90% carbon conversion is attainable.
Off-gas contains particulate and a small amount of tars. Particulate, typically 75% by weight carbon, is removed from the cyclone. T h e solid which slips the cyclone passes to the boiler where the carbon is cotnbusted away leaving fine ash which ultimately passes up the stack.
System
The gasification system design was developed to minimize the key emissions and included the following steps:
1 . Receipt of hammer milled, "dry" urban wood from the over-the fence supplier. The fuel was screened to remove fines which were sent to the landfill with the waste charlash.
2. Gasification of the waste wood to produce a hot (1600F) 150 BTUISCF fuel gas.
3 . Removal of unreacted wood char and ash from the gasifier by a mechanical grate and from the hot gas stream by cyclones. The char was to be quenched with a water spray and disposed of in a landfill.
4. Combustion of the product gas in a gas-fired steam boiler using a specially designed low-NOx burner. High pressure, superheated steam was to be used to drive a steam turbine.
5 . A design that employed no wet scrubbers or dirty water condensers which would create a water disposal problem. Water was used to quench the ash loadout from the gasifier. This was disposed of as a part of the solid char waste stream.
In order to confirm this design, Syngas operated two pilot gasifier units. A 2000 lblhr pilot unit was operated in Golden Colorado on a wide variety of wood and select MSW fuels. A commercial prototype tinit was installed at Orangeburg, SC to convert 10,000 Ib/hr of urban wood waste to gas in late 1989. In the commercial Port Jefferson project, five units of this size were to be operated in parallel to produce boiler feed gas. Waste wood was transported to South Carolina from Long Island, NY. The prototype testing centered on three issues. These were unit output, mechanical integrity, and emissions. Emission issues are discussed in the following paragraphs.
Particulate
In the gasification scheme, particulate emissions could be reduced to very low levels by sampling downstream of the gasifier hot gas cyclone by EPA method 5 isokinetic sampling of the product gas stream. Repeated testing demonstrated a particulate loading of about 0.125 grains1SCF from the hot cyclone. 75% of this material is carbon. In the boiler, the majority of the carryover particulate was removed by combustion of the carbon associated with the ash. In fact, a carbon burnout guarantee of greater than 95% was offered by the boiler vendor for particulate loadings below 1 gr/SCF and char particle sizes below 20 microns. Thus, relative to the stoker which would require expensive stack gas cleaning, the gasifier system could produce particulate emission levels as low as 18 TPY, less than 20% of the standard without controls.
Nitrogen Oxides
A second major concern with the stoker was the release of high levels of nitrogen oxides due to irncontrolled burning in the freeboard. Since urban waste wood is relatively dry, carbon monoxide emissions could probably be controlled in the stoker, but NO, emissions might be even higher.
The n~acroscopic properties of the fuel which Syngas received in a test demonstration program in which some 500 tons of urban waste wood was gasified in the commercial prototype demonstration were relatively constant. However, fuel nitrogen in the urban wood waste fuel was very high, often greater than 0 .5%. The source of this nitrogen was not discovered, but was assumed to result from nitrogen fixation by bacteria or fungus involved in rotting the wood. Nitrogen is a potential problem
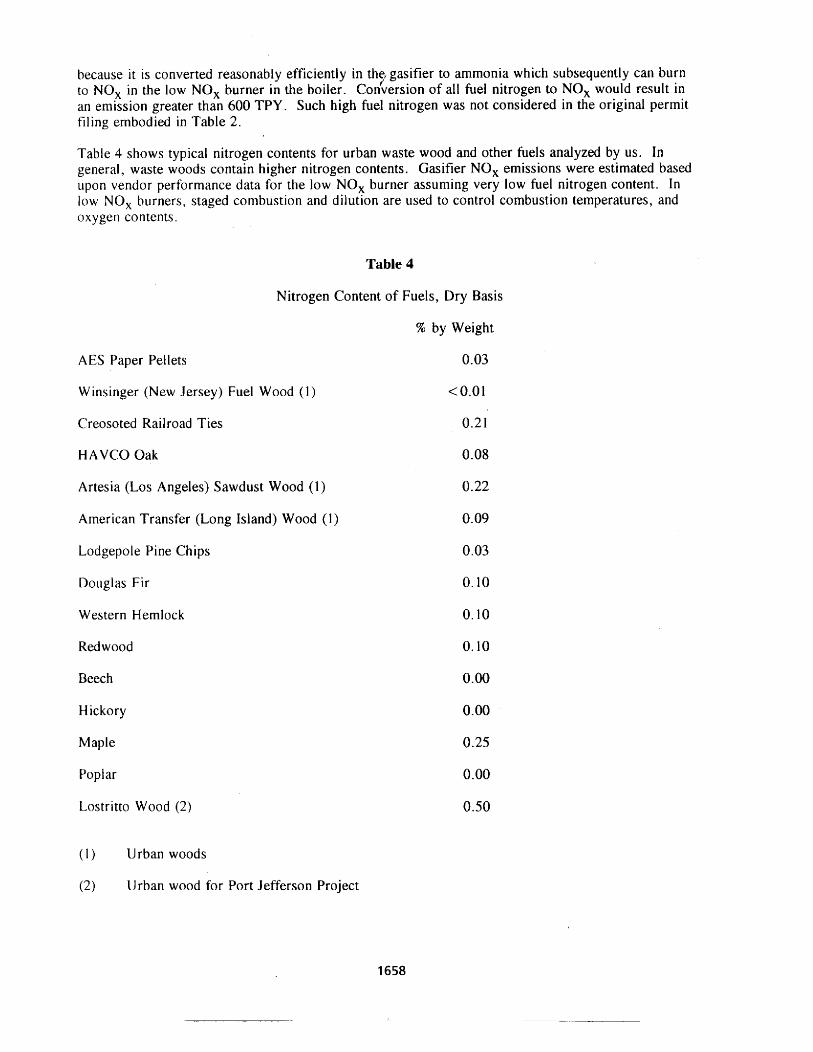
because it is converted reasonably efficiently in thy gasifier to ammonia which subsequently can burn to NOx in the low NOx burner in the boiler. Conversion of all fuel nitrogen to NOx would result in an emission greater than 600 TPY. Such high Fuel nitrogen was not considered in the original permit filing embodied in Table 2.
Table 4 shows typical nitrogen contents for urban waste wood and other fuels analyzed by us. In general, waste woods contain higher nitrogen contents. Gasifier NOx emissions were estimated based upon vendor performance data for the low NO, burner assuming very low fuel nitrogen content. In low NOx burners, staged combustion and dilution are used to control combustion temperatures, and oxygen contents.
A ES Paper Pel lets
W insinger (New Jersey) Fuel Wood ( 1 )
Creosoted Railroad Ties
HAVCO Oak
Artesia (Los Angeles) Sawdust Wood ( I )
American Transfer (Long Island) Wood (1)
Lodgepole Pine Chips
Douglas Fir
Western Hemlock
Redwood
Beech
Hickory
Maple
Poplar
Lostritto Wood (2)
Table 4
Nitrogen Content of Fuels, Dry Basis
% by Weight
0.03
< 0.01
0.21
0.08
0.22
0.09
0.03
0.10
0.10
0.10
0.00
0.00
0.25
0.00
0.50
( I ) Urban woods
(2) Urban wood for Port Jefferson Project
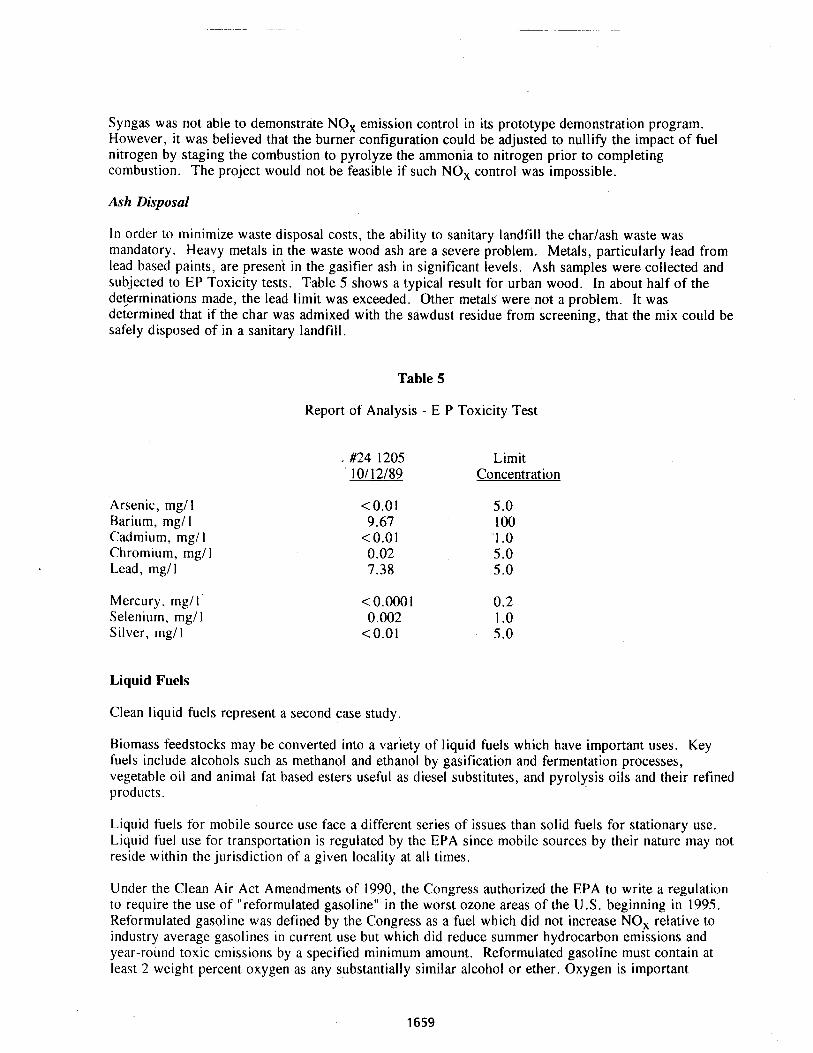
Syngas was not able to demonstrate NOx emission control in its prototype demonstration program. However, it was believed that the burner configuration could be adjusted to nullify the impact of fuel nitrogen by staging the combustion to pyrolyze the ammonia to nitrogen prior to completing combi~stion. The project would not be feasible if such NOx control was impossible.
Ash Disposal
In order to minimize waste disposal costs, the ability to sanitary landfill the charlash waste was mandatory. Heavy metals in the waste wood ash are a severe problem. Metals, particularly lead from lead based paints, are present in the gasifier ash in significant levels. Ash samples were collected and subjected to EP Toxicity tests. Table 5 shows a typical result for urban wood. In about half of the determinations made, the lead limit was exceeded. Other metals were not a problem. It was determined that if the char was admixed with the sawdust residue from screening, that the mix could be safely disposed of in a sanitary landfill.
Table 5
Report of Analysis - E P Toxicity Test
. #24 1205 Limit ' 10112189 Concentration
Arsenic, rngl 1 Barium, mgll Cadmium, mgll Chromium, mgl l Lead, rngl 1
Mercury, mgl I ' Selenium, mgl l Silver, mgll
Liquid Fuels
Clean liquid fuels represent a second case study
Biomass feedstocks may be converted into a variety of liquid fuels which have important uses. Key fuels include alcohols such as methanol and ethanol by gasification and fermentation processes, vegetable oil and animal fat based esters useful as diesel substitutes, and pyrolysis oils and their refined products.
Liquid fuels for mobile source use face a different series of issues than solid fuels for stationary use. Liquid fuel use for transportation is regulated by the EPA since mobile sources by their nature may not reside within the jurisdiction of a given locality at all times.
Under the Clean Air Act Amendments of 1990, the Congress authorized the EPA to write a regulation to require the use of "reformulated gasoline" in the worst ozone areas of the U.S. beginning in 1995. Reformulated gasoline was defined by the Congress as a fuel which did not increase NOx relative to industry average gasolines in current use but which did reduce summer hydrocarbon emissions and year-round toxic emissions by a specified minimum amount. Reformulated gasoline must contain at least 2 weight percent oxygen as any substantially similar alcohol or ether. Oxygen is important
because it reduces exhaust hydrocarbon emissions. Gasolines high in sulfur and aromatics also exhibit higher NOx and VOC emissions.
NO, emissions from vehicles are emitted from the vehicle tailpipe. VOC emissions come from both the tailpipe and from the fuel system as evaporative emissions. In 1995, EPA estimates that 213 of the VOC emissions are evaporative in nature.
The most widely used biofuel is ethanol produced currently by fermentation of corn. From a purity perspective, ethanol is certainly ash free, and contains no trace polluting materials. However, because of the Gay that the proposed rule has been constructed, several very important properties of ethanol might preclude its use from summer reformulated gasoline.
Ethanol does not mix "ideally" with gasoline. Because of the highly polar nature of the alcohol, lnixtirres of ethanol and gasoline exhibit elevated vapor pressures relative to gasoline mixed with other oxygenates such as MTBE. This is important because reformulated gasoline must be "oxygenated".
Evaporative emissions are strongly dependent on the fuel vapor pressure. Because of the non-ideal mixing characteristics of ethanol, evaporative emissions from ethanol made with the same base gasoline as used with MTBE tend to be much higher. This yields a non-complying fuel.
The vapor pressure problem is further aggravated by what EPA has termed the commingling issue. Ethanol elevates the vapor pressure as much at several percent by volume concentrations as it does at 105 concentration. Thus mixing of ethanol gasolines in the fuel tank with non-ethanol gasolines can elevate the vapor pressure of the whole batch thus reducing the emission reduction potential of the non- ethanol portion of the mixture.
Modeling of fuel-emission characteristics by the Colorado School of Mines and USDA has shown that ethanol has a NOx emission problem as well. The addition of oxygen to a fuel increases the NOx emission measured by the Federal Test Procedure. In addition, our model shows that reducing the distillation temperature of the fuel, especially for the first 30 volume percent can increase NOx emissions. Ethanol, by its non-ideal mixing with gasoline decreases the front end boiling point of the gasoline significantly, thus increasing NOx emissions.
Ethanol can be readily converted to an ether derivative called ETBE. ETBE has been found to mix ideally with gasoline and because it has a very low vapor pressure, it reduces the evaporative emission potential of a given gasoline. It also mixes ideally with gasolines containing other ethers.
ETBE contains oxygen which does contribute to the NO, emission problem. However, it impacts the distillation curve differently than ethanol, by increasing the quantity of heavier material in gasoline which does not raise the NOx emission. Since ETBE must be mixed in larger volumes than ethanol to make the same weight percent oxygen in the fuel, its dilution properties are greater. By reducing aromatics and fuel sulfur by dilution, the oxygen impact on NOx is offset.
CONCLUSIONS
Biomass fuels are potentially environmentally beneficial. However, their use must take into account both trace constituents and the system in which they are used. In the case of solid fuels, a technology based upon gasification was demonstrated to exhibit significant environmental benefits relative to conventional technology. In a liquid fuel case, conversion of ethanol to ETBE offers significant environmental benefits in reformulated gasolines due to its more gasoline-like nature.
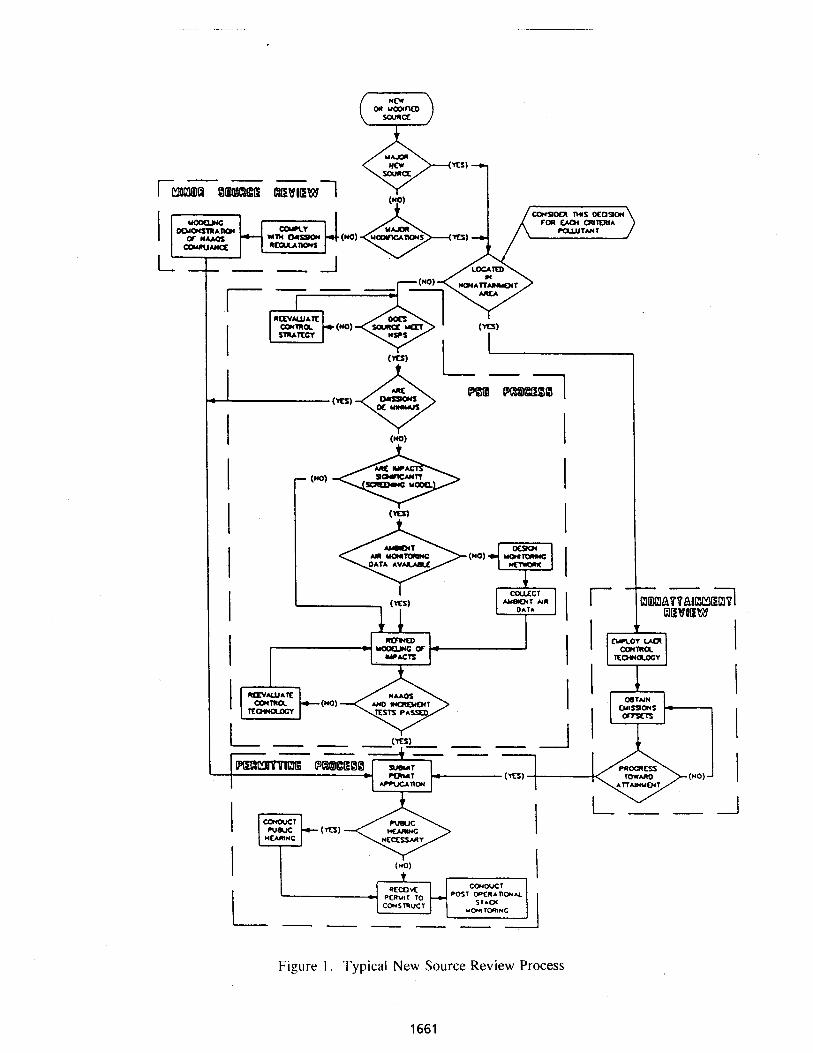
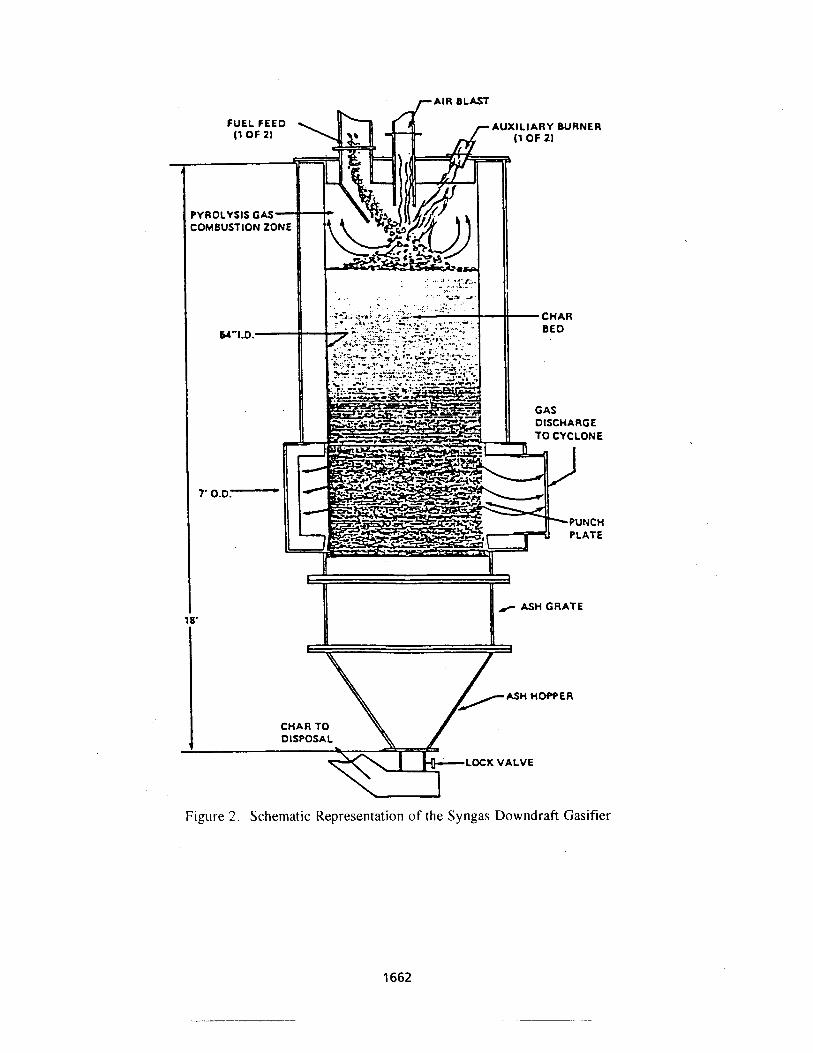
REPORTING OF FUEL PROPERTIES WHEN TESTING DIESEL ENGINES WITH ALTERNATIVE FUELS
AN ASAE ENGINEERING PRACTICE
Charles L. Peterson1, Ph.D., Professor, Agricultural Engineering University of Idaho, Moscow, ID 83844-2060
Abstract
At the American Society of Agricultural Engineers copference on Liquid fuels in December 1992 a rap session was held to discuss the development of standards for diesel fuel substitutes made from vegetable oils and animal fats. The outcome of that meeting was the development of this preliminary document which suggests fuel specifications to report when conducting tests with alternative fuels. This is a second draft of the document but there are still missing data; i t is anticipated that there are yet a number of changes to be made before i t is adopted.
This Engineering Practice establishes a minimum set of fuel specifications which must be included with the report of diesel engine performance on any vegetable or animal oil, including blends of these oils with diesel fuel. A variety of these oils from many plant and animal sources have been proposed as possible diesel engine fuels. These oils are collected and processed using a variety of methods, which can influence physical and chemical properties. In addition, they are tested in diesel engines using a range of procedures. To facilitate comparison of test data, i t is essential that some reference point or baseline be established. This Engineering Practice is designed to provide a consistent set of data for fuels when used as diesel fuel replacements and will help to identify deviations from normal expected fuel characteristics which have been established for petroleum derived fuels.
Development of this Engineering Practice as been the effort of a subcommittee of ASAE FPE-709 Biomass Energy,and Alternate Products.
Introduction
At the American Society of Agricultural Engineers conference on Liquid fuels in December 1992 a rap session was held to discuss the development of standards for diesel fuel substitutes made from vegetable oils and animal fats. The outcome of that meeting was the development of this preliminary ASAE Engineering Practice (EP) document which suggests fuel specifications to report when conducting tests with these alternative fuels. This is a second draft of the document and there are still missing data; it is anticipated that a number of changes will be made before it is adopted. Development of ASTM Standards for these fuels is also underway. Preliminary specifications have been proposed and comments solicited. It is anticipated that a t least preliminary standards will be proposed a t the ASTM meeting in June, 1993. A ballot on the ASAE Engineering Practice will be proposed sometime in the third quarter of 1993.
Suggested Additional Revisions
A first draft of the Engineering Practice has been circulated. Most of the suggested revisions have been incorporated into the document. A few additional suggestions for modifications have not yet been included. It is anticipated that these suggestions will be discussed and solutions proposed a t a meeting of the subcommittee June 23, 1993 during the ASAE meeting in Spokane, Washington. The additional items of discussion are included below. Those with other items of discussion should bring them to the attention of the committee.
1. Properties which shall be included in 3.3 requirements for each batch of fuel and section 3.4 requirements for each classification of fuels must be finalized. This is a very important distinction as tests which must be made on each batch of fuel add significant additional cost to the research or development work.
2. It has been suggested that standards of the American Oil Chemist' Society (AOCS) be included as options or as standards since most suppliers of fats and oils may be more familiar with AOCS methods.
3. It was suggested that we may need another category to account for fuels of other biological origins, such as higher alcohols and lipids produced from micro-organisms. For example, butanol from Clostridium acetobutylicum.
4. Paragraph 3.4.3 Boiling point is not consistent with the properties of fats, oils or esters.
5. The heading "ASTM Standard Value for Number 2 Dieselt1 is incorrect for most of the data presented. It would be appropriate to have separate columns specifying Diesel-2 (ASTM D 975-91), methyl ester and formulated "ester fueltt. The formulated fuel might consist of a range of ester from about 5% up to 25%.

6. In view of problems experienced when attempting to determine cetane number (ASTM D613) it may be more reasonable to require that a 1 gallon portion of test fuel be set aside for determination of cetane number pending results of other studies.
7. Should mono, di, and triglycerides be used instead of Free Glycerol and Total Glycerine and what are appropriate test procedures.
8. Some test specifications have not yet been identified, they are listed by procedure such as "Gas Chromatography". Procedures need to be more clearly identified.
9. A reference should be provided for the source for data obtained for the sample of RME. Perhaps similar data should be presented for soy methyl esters, tallow methyl esters and maybe others.
10. Properties which are unneeded or inappropriate should be dropped from the list.
Conclusions
Complete data on fuel specifications is often lacking when test results are published. An Engineering Practice for reporting fuel properties when testing alternative fuels will be of value to all segments of the alternate fuel community including researchers, manufacturers and consumers. The EP will assure that test results are comparable and reproducible. While some work remains before the EP is ready for publication as an official standard, it can be used now as an interim standard by those planning to publish test results to jumpstart the process. It is anticipated that the basic philosophy is in place, only fine tuning of the instrument is required.
ASAE Engineering Practice: ASAE EP X552
REPORTING OF FUEL PROPERTlES m N TESTING DIESEL ENGINES WlTH ALTERNATIVE FUELS
SECTION 1 - PURPOSE AND SCOPE
This Engineering Practice establishes a minimum set of fuel specifications which must be included with the report of diesel engine performance on any vegetable or animal oil, including blends of these oils with diesel fuel. A variety of these oils from many plant and animal sources have been proposed as possible diesel engine fuels. These oils are collected and processed using a variety of methods, which can influence physical and chemical properties. In addition, they are tested in diesel engines using a range of procedures. To facilitate comparison of test data, it is essential that some reference point or baseline be established. This Engineering Practice is designed to provide a consistent set of data for fuels when used as diesel fuel replacements and will help to identify deviations from normal expected fuel characteristics which have been established for petroleum derived fuels.
1.2 This Engineering Practice specifies which fuel properties must be reported and lists the procedure which must be used to measure this property. It does not establish a requirement for any fuel property. The minimum documentation of every engine test should include at least those items which are listed in Section 3. The total data set (Sections 3 and 4) should be reported whenever possible although it is recognized that some data are difficult to obtain on every batch of fuel. It should clearly be indicated whether the data are typical for the particular class of fuel or whether the batch of fuel was specifically tested for the test being reported.
1.3 This engineering practice does not specify an engine test procedure, however, it is expected that a complete description of the test procedure will be provided with the test report.
SECTION 2 - DEFINITION OF TERMS
2.1 Vegetable oil: any oil derived from plant material. .
2.2 Animal oil: any oil derived from animal tissue.
2.3 Classification: Designation that identifies the oil source and production procedure. For example, oil expressed from rapeseed and transesterified with methyl alcohol in the presence of a catalyst is referred to as rape methyl ester (RME). Any oil derived from rapeseed (cultivar, production region, oil extraction method) and transesterified with methyl alcohol is classified as RME. However, not d l oils from rapeseed, soybean or sunflower, etc. are equal. For example, some rapeseed oils may contain large quantities of erucic acid, although others may contain essentially no erucic acid.
2.4 Batch: Quantity of fuel stored in a single container fi.om which samples are drawn for the engine test. A batch is further defined as having been made from, and representative of, a single run of the process or one shipment from the fuel manufacturer.
2.5 Additive: Any compound added to the fuel to modify its properties. Residual compounds from processing are not additives.
SECTION 3 - FUEL SPECIFICATIONS.
3.1 The classifxation shall be reported. It is understood that a previously undisclosed process may be proprietary. When a process is proprietary, a general description of the process, identifying it as a new and different process, should be clearly noted. In the case of transesterification, the alcohol and catalyst used, as well as conditions pertaining to the process, needed for reproducing the fuel, should be described. Other processes should be similarly described. If neat esters are used, this should be stated.
3.2 Additives shall be listed as a percentage of fuel mass. Fuel specifications shall include those properties listed in Sections 3.3 and 3.4 and shall be reported for the fuel with additives as used in the engine tests. Maor fuel components, such as diesel-1 or diesel-2 should not be considered additives. However, the component and blend ratio by weight should be stated..
3.3 The following properties shall be reported for each batch of neat ester fuel. These properties shall be measured in accordance with the listed procedure. Deviations from these procedures shall be clearly stated.
3.2.1 Fatty Acid Composition
3.2.2 Heat of Combustion 3.2.3 Viscosity 3.2.4 Pour Point 3.2.5 Cloud Point 3.2.6 Cold Filter Plugging 3.2.7 Flash Point 3.2.8 Density 3.2.9 Water and sediment 3.2.10 Carbon residue 3.2.11 Ash 3.2.12 Sulfur
3.2.13 Percent Esterification 3.2.14 Free Glycerol
3.2.15 Total Glycerine
Units
MJ/L CW40 ' C ' C 'C 'C 'C g/cms @I5 ' C % by vol. %, mass %, mass %, mass
%, mass %,mass
%, mass
Procedure
Gas chromatography ASTM Dl983 ASTM Test D240 ASTM Test D445 ASTM Test D97 ASTM Test D2500 ASTM Test D4539 ASTM Test D93 ASTM Test D1298AI1217 ASTM Test Dl796 ASTM Test D189JD524 ASTM Test D482 ASTM Test D2622AI129 lD1552lD4294 gas chromatography Enzymatic method or gas chromatography Enzymatic method or gas
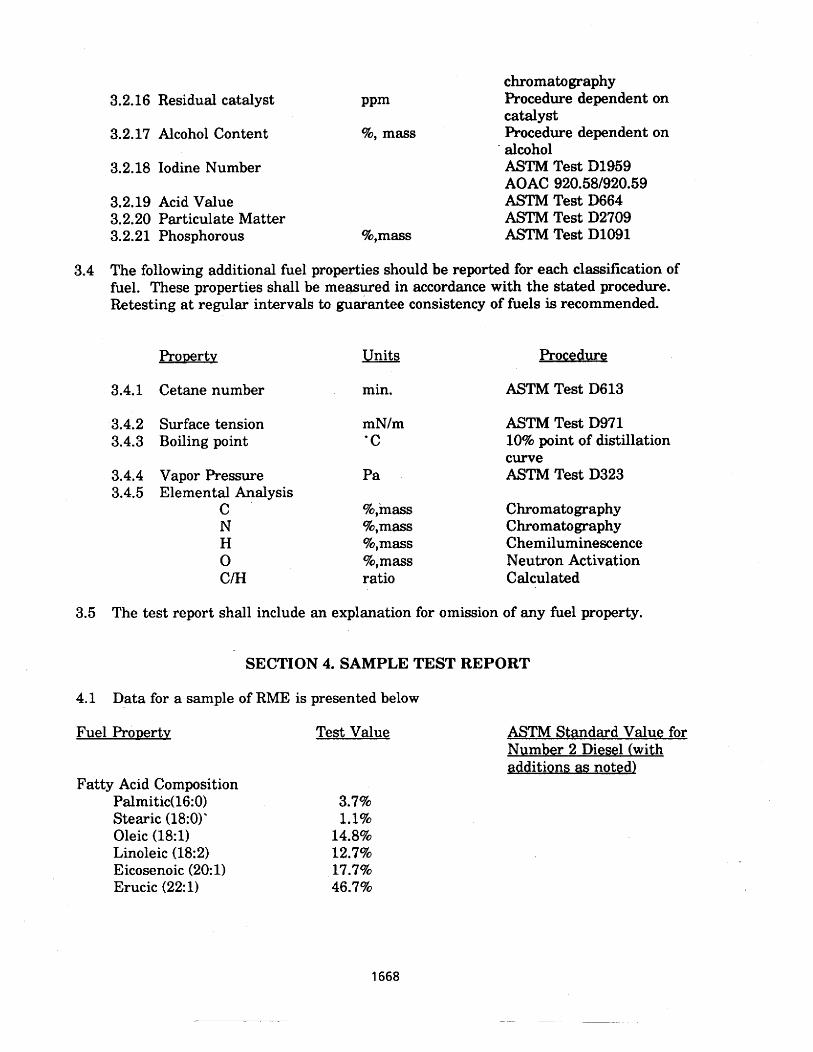
PPm
%, mass
chromatography 3.2.1 6 Residual catalyst Procedure dependent on
catalyst 3.2.17 Alcohol Content Procedure dependent on
- alcohol 3.2.18 Iodine Number ASTM Test Dl959
AOAC 920.581920.59 3.2.19 Acid Value ASTM Test D664 3.2.20 Particulate Matter ASTM Test D2709 3.2.21 Phosphorous %,mass ASTM Test Dl091
3.4 The following additional fuel properties should be reported for each classification of fuel. These properties shall be measured in accordance with the stated procedure. Retesting a t regular intervals to guarantee consistency of fuels is recommended.
Pro~er tv Units Procedure
3.4.1 Cetane number min. ASTM Test D613
3.4.2 Surface tension mN/m 3.4.3 Boiling point 'C
3.4.4 Vapor Pressure Pa 3.4.5 Elemental Analysis
C %,'mass N %,mass H %,mass 0 %,mass CIH ratio
ASTM Test D971 10% point of distillation curve ASTM Test D323
Chromatography Chromatography Chemiluminescence Neutron Activation Calculated
3.5 The test report shall include an explanation for omission of any fuel property.
SECTION 4. SAMPLE TEST REPORT
4.1 Data for a sample of RME is presented below
Fuel Property
Fatty Acid Composition Palmitic(l6:O) Stearic (18:O)' Oleic (18:l) Linoleic (18:2) Eicosenoic (20: 1) Erucic (22: 1)
Test Value ASTM Standard Value for Number 2 Diesel (with ~ddi t ions as noted)
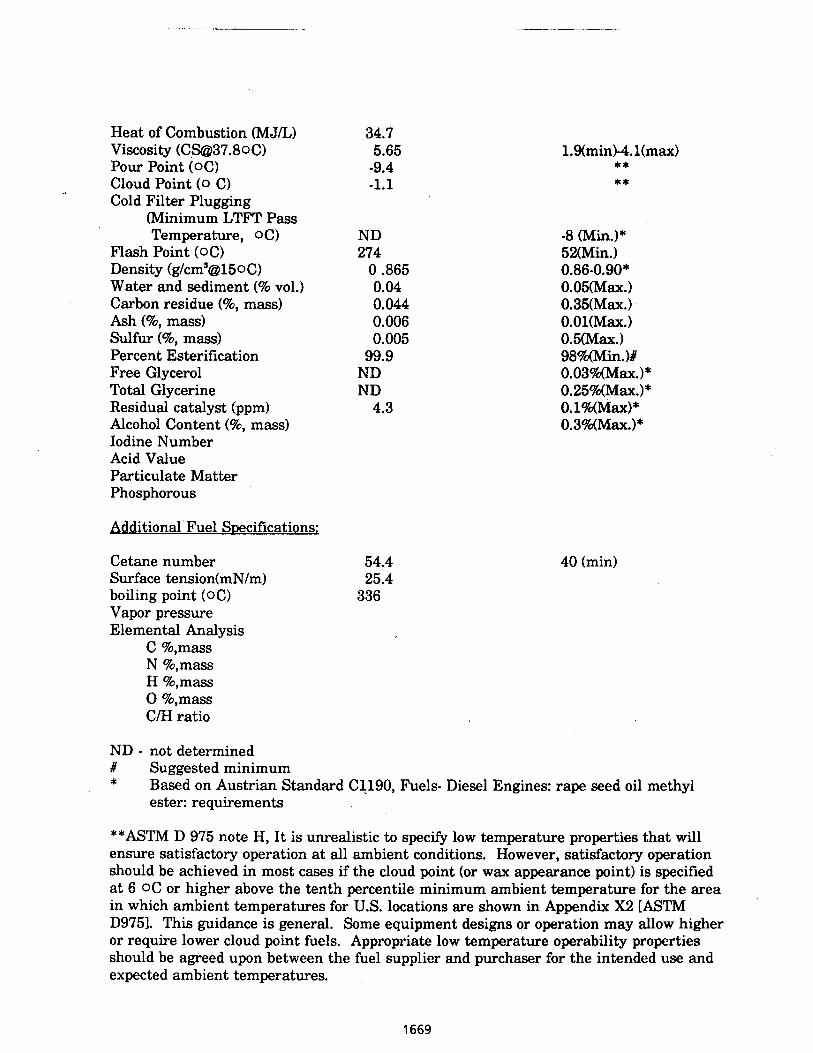
Hqat of Combustion (MJIL) Viscosity ([email protected]) Pour Point (OC) Cloud Point (0 C) Cold Filter Plugging
(Minimum LTFT Pass Temperature, oC)
Flash Point (OC) Density (g/cms@150C) Water and sediment (% vol.) Carbon residue (%, mass) Ash (%, mass) Sulfur (%, mass) Percent Esterification Free Glycerol Total Glycerine Residual catalyst (ppm) Alcohol Content (%, mass) Iodine Number Acid Value Particulate Matter Phosphorous
Additional Fuel S~ecifications:
Cetane number 54.4 Surface tension(mN/m) 25.4 boiling point (oC) 336 Vapor pressure Elemental Analysis
C %,mass N %,mass H %,mass 0 %,mass C/H ratio
ND - not determined # Suggested minimum * Based on Austrian Standard C1190, Fuels- Diesel Engines: rape seed oil methyl
ester: requirements
**ASTM D 975 note H, I t is unrealistic to specify low temperature properties that will ensure satisfactory operation at all ambient conditions. However, satisfactory operation should be achieved in most cases if the cloud point (or wax appearance point) is specified a t 6 OC or higher above the tenth percentile minimum ambient temperature for the area in which ambient temperatures for U.S. locations are shown in Appendix X2 [ASTM D9751. This guidance is general. Some equipment designs or operation may allow higher or require lower cloud point fuels. Appropriate low temperature operability properties should be agreed upon between the fuel supplier and purchaser for the intended use and expected ambient temperatures.
SECTION 5 - CITED STANDARDS:
5.1 Based on the ASTM standards indicated for petroleum oils or AOAC official test methods except as noted.
D93 Test Method for Flash Point by Pensky-Martens Closed Tester. D-97 Standard Test Method for Pour Point of Petroleum Oils. D-129 Standard Test Method for Sulfur in Petroleum Roducts (General Bomb
Method) D-189 Standard Test Method for Conradson Carbon Residue of Petroleum Products. D-240 Standard Test Method for Heat of Combustion of Liquid Hydrocarbon F'uels
by Bomb Calorimeter. D-323 Standard Test Method for Vapor Pressure of Petroleum Products W i d
Method). D-445 Standard Test Method for Kinematic Viscosity of Transparent and Opaque
Liquids (and the Calculation of Dynamic Viscosity). D-482 Test Method for Ash fkom Petroleum Products. D-524 Standard Test Method for Ramsbottom Carbon Residue of Petroleum Products D-613 Test Method for Ignition Quality of Diesel Fuels by the Cetane Method. D-664 Test Method for Neutralization Number by Potentiometric Titration D-971 Standard Test Method for Interfacial Tension of Oil Against Water by the
Ring Method D-975 Standard Specification for Diesel Fuel Oils D-1091 Test Methods for phosphorus in Lubricating Oils and Additives D-1217 Test Method for Density and Relative Density (Specific Gravity) of Liquids by
Bingham Fycnometer D-1298 Standard Practice for Density, Relative Density (Specific Gravity), or API
Gravity of Crude Petroleum and Liquid Petroleum Products by Hydrometer Method.
D-1552 Test Method for Sulfur in Petroleum Products (High Temperature Method) D-1796 Test Method for Water and Sediment in Fuel Oils by the Centrifuge Method
(Laboratory Procedure). D-1959 Test Method for Iodine Value of Drying Oils and Fatty Acids D-1983 test Method for Fatty Acid Composition by gas-Liquid Chromatography of
Methyl Esters D-2709 Test Method for Iodine Value of Drying Oils and Fatty Acids D-2500 Test Method for Cloud Point of Petroleum Oils. D-2622 Test Method for Sulfur in Petroleum Products by X-ray Spectrometry. D-4294 Test Method for Sulfur in Petroleum Products by Non-Dispersive X-Ray
Fluorescence Spectrometry D-4539 Standard Test Method for Filterability of Diesel Fuels by Low-Temperature
Flow Test.
AOAC 920.581920.59 Iodine Absorption Number
FUEL CHARACTERIZATION REQUIREMENTS FOR COFlRlNG BIOMASS IN COAL-FIRED BOILERS
David E. Prinzing, P.E. Senior Process Engineer Ebasco Environmental
Sacramento, CA
N. Stanley Harding, PhD Vice President, RE1 Corporation
Salt Lake City, UT
David A. Tillman, PhD Sacramento Operations Manager
Ebasco Environmental Sacramento, CA
ABSTRACT
The cofiring of biofuels with coal in existing boilers, or the cofiring of biofuels in combined cycle combustion turbine (CCCT) systems presents significant potential benefits to utilities, including reductions in SO2 and NO, emissions as a function of reducing the mass flow of sulfur and nitrogen to the boiler; reducing C02 emissions from the combustion of fossil fuels; potentially reducing fuel costs both by the availability of wood residues and by the fact that biofuels are exempt from the proposed Btu tax; and providing support to industrial customers from the forest products industry. At the same time, cofiring requires careful attention to the characterization of the wood and coal, both singly and in combination.
This paper reviews characterization requirements associated with cofiring biofuels and fossil hels in boilers and CCCT installations with particular attention not only to such concerns as sulfur, nitrogen, moisture, and Btu content, but also to such issues as total ash content, baselacid ratio of the wood ash and the coal ash, alkali metal content in the wood ash and wood fuel (including converted fuels such as low Btu gas or pyrolytic oil), slagging and fouling indices, ash fusion temperature, and trace metal contents in the wood and coal. The importance of each parameter is reviewed, along with potential consequences of a failure to adequately characterize these parameters. The consequences of these parameters are reviewed with attention to firing biofuels with coal in pulverized coal (PC) and cyclone boilers, and firing biofuels with natural gas in CCCT installations.
INTRODUCTION
Cofiring refers to the combustion of multiple fuels in a single boiler, with one being a primary fuel and the second being the "co-fired" firel. In recent investigations, biomass and fossil fbel cofiring have been considered. In these cases biomass or a biomassderived fbel is used along with another fuel such as coal, oil, or natural gas. Such cofiring operations offer a method for generating electricity from renewable biomass fbels without incurring the expense and delay associated with designing and building a new power plant capable of using the biomass firel. However, cofiring wood with another fossil fuel does present opportunities where particular attention must be given to the fuel blend in order to prevent potential boiler problems. In addition, since the use of a biomass fuel as a cofired fuel does not provide for any new generating capacity, the costs of installing the equipment needed for cofiring must be amortized by savings produced from the cofiring operation rather than by the full value of the electricity produced.
The benefits of cofiring to a utility, its customers, and its service territory lie in the following areas:
Accomplishing convenient or low cost disposal of wood wastes from customer industries, thereby stimulating the local economy and reducing community problems;
Establishing an early market for biomass, thereby encouraging local industry or agriculture to produce new supplies of these renewable fbels;
Reducing SO2 and potentially NOx emissions;
Requiring low capital investments relative to building new power plants; and
Converting wood (or other biomass fbels) to electricity at higher thermal efficiencies compared to existing wood fired power plants.
Importance of Fuel Characterization
To be successhl in cofiring biomass with coal, the fbels must be completely characterized. Characterization of these firels and &el blends is necessary to assess the following:
Understanding the locally available he1 provides the only means for determining the probable fbel blends to be employed, and subsequently estimating the expected performance of the boiler in terms of efficiency, flame temperature, ability to maintain superheat, and other related parameters;
QuantifLing the ash chemistry of the locally available wood, along with the base case coal provides the only means for precisely anticipating any slagging or fouling in PC boilers as a function of alkali metal content in the wood;
Quantifying the ash chemistry and overall fbel composition of the locally available wood, combined with the base case coal, provides the only accurate means for anticipating any improvements or problems in maintaining the slag layer in the cyclone barrel, and ensuring other performance characteristics; and
Quantifying the ash chemistry of the locally available wood fbel, along with the base case coal, provides the most accurate means for anticipating changes in fly ash chemistry, with associated problems in flyash utilization or disposal.
The importance of cofiring is sufficient that it has been investigated by numerous utilities including Georgia Power, Santee-Cooper, Northern States Power, East Kentucky Cooperative, Delmarva, Wisconsin Power and Light, and others. Cofiring has been employed by several of these utilities, such as Northern States Power, using wood and coal. Other utilities have cofired coal-based electricity generating stations with refuse derived fuels (RDF), tire derived fuels (TDF), and other unconventional energy sources. Organizations such as Tacoma, WA Public Utilities have repowered stations with fluidized beds designed to bum multaple fuels. Industrial installations such as Weyerhaeuser-Longview, WA consistantly cofire wood, coal, and in-plant residuals in the cogeneration of process steam and electricity.
Cofiring Issues
Cofiring is commonly accomplished on grates, in stoker-fired boilers. Alternatively, cofiring is not unusual in fluidized bed applications. The current emphasis in cofiring involves pulverized coal (PC) and cyclone- fired boilers. In such installations, fuel specifications can be more critical.
Primary Issues
There were several issues addressed by the Ebasco-RE1 team in evaluating the potential for wood cofiring at Allen and Kingston units. Three of these will be discussed in this paper, namely, boiler performance, deposition, and flyash chemistry.
Boiler Pedorrnance
Boiler performance may be affected by wood cofiring for several reasons. First, the wood fuel usually has a much higher moisture content than the coal, and therefore results in an efficiency penalty. In addition, the moisture, being an energy absorber, reduces the flame temperature somewhat. Adiabatic flame temperature calculations show that for a 15% wood cofiring rate (based on heat input), the flame temperature decreases by only about 70-100°C. Depending upon the particle size of the wood and the injection location, the temperature profiles in the boiler may be altered. This 'might affect steam conditions or required attemperation sprays.
Deposition
One of the major concerns with cofiring two or more fuels is the potential for deposition. The blend may or may not perform according to either of the single fuels if fired separately. Because of segregation in the fuel pipe, burner, or flame, characteristics of each fuel and the blend must be evaluated to assure a successful bum.
Several fuel characteristics are used to evaluate the potential for deposition. Among the most common are the base-to-acid ratio, the alkali metal contents, the ash fusion temperatures, and the slagging and fouling indices. The base-to-acid ratio is the ratio of basic constituents (Na20 + K20 + Fe203 + MgO + CaO) to acidic constituents (A1203 + SiO2 + TiO2). In general, the nearer this ratio approaches 1.0 from either side, the lower the ash fusion temperature of the material. In the case involved with this study, the base-to- acid ratio for the coal fuels was approximately 0.3-0.4, for the wood it was 0.8, and the projected blends the base-to-acid is 0.4-0.5. As can be seen, the addition of wood to the coal has caused the base-to-acid ratio to increase slightly towards 1 .O.
The alkali metal concentrations in the fuel blend are important as they are an indication of the potential for fouling of heat transfer surfaces in the convection section of the boiler. Many deposition studies have
shown that relatively low melting eutectics form with calcium or sodium or potassium and sulfur. These alkali metal sulfates tend to produce the "glue" whlch attaches to boiler tubes and results in reduced heat transfer to the steam.
The ash fusion temperature is a measurement of the melting tendencies of the fuel. It was developed originally to understand ash melting characteristics for coal fired stoker boilers, but has been used to estimate ash behavior in cyclone and pulverized coal fired boilers. While there are actually eight ash fision temperatures determined d u ~ g a complete ash fusion temperature analysis, the most commonly used one is the softening temperature measured under reducing conditions. The lower the value, the more readily the ash material tends to melt. It is important to understand the ash fusion characteristics of the wood and coal and wood/coal blend since there will be locations within the boiler where all will be present. If there is low melting material in the boiler, some localized slagging can occur. Once a melted material has formed on the boiler walls or steam tubes, any ash material can then stick and decrease the heat transfer to the stem.
The slagging and fouling indices are used to estimate the potential for deposition to occur in the radiant section of the boiler (slagging) or the convection section of the boiler (fouling). These correlations have been developed on coal fired boilers and are calculated as follows:
Slagging Factor: Base/Acid Ratio * %S in coal
Fouling Factor: Base/Acid Ratio * %Na20 in ash
The factors are then classified according to their tendency to slag or foul; the categories are low, medium, high, or severe. These are general guidelines and must be evaluated carefblly. Because of the low sulfiir content in the wood, the slagging factor decreases even though the baselacid ratio is higher. The foufing factor increases due to the increase in alkali content of the ash and the baselacid ratio.
Flyash Chemistry
Understanding the chemistry of the flyash resulting fiom blends of wood and coal is necessary to determine whether the ash material is salable. If the original flyash fiom straight coal firing is an economic asset to the plant, the addition of wood ash must not change this revenue source. Also, the flyash chemistry needs to be evaluated to address any changes which might affect the air pollution control devices, i.e,, electrostatic precipitators.
Cofiring Studies
All of these considerations are brought to bear in co-firing studies. Among the most recent of such studies is the EPRVDOE/TVA analysis of cofiring at PC and cyclone boilers of TVA. This study, performed by Ebasco as supported by Reaction Engineering International, evaluated all of the TVA coal-fired boilers as candidates for cofiring, focused upon the Allen (cyclone), Shawnee (wall-fired PC) and Kingston (tangentially-fired PC) boilers. The issues considered in this paper have been evaluated for those units.
In performing the TVA assessment, and in performing other combustion studies, it has become apparent that increasing attention needs to be paid to techniques for evaluating cofiring of biofuels with coal, and the pursuit of techniques that apply not only to the biofbeVcoal cofiring cases but also to other alternative fuel conditions. Consequently this paper largely addresses wood and coal, but considers analytical method01ogies that apply to a wide range of fbel blending opportunities.
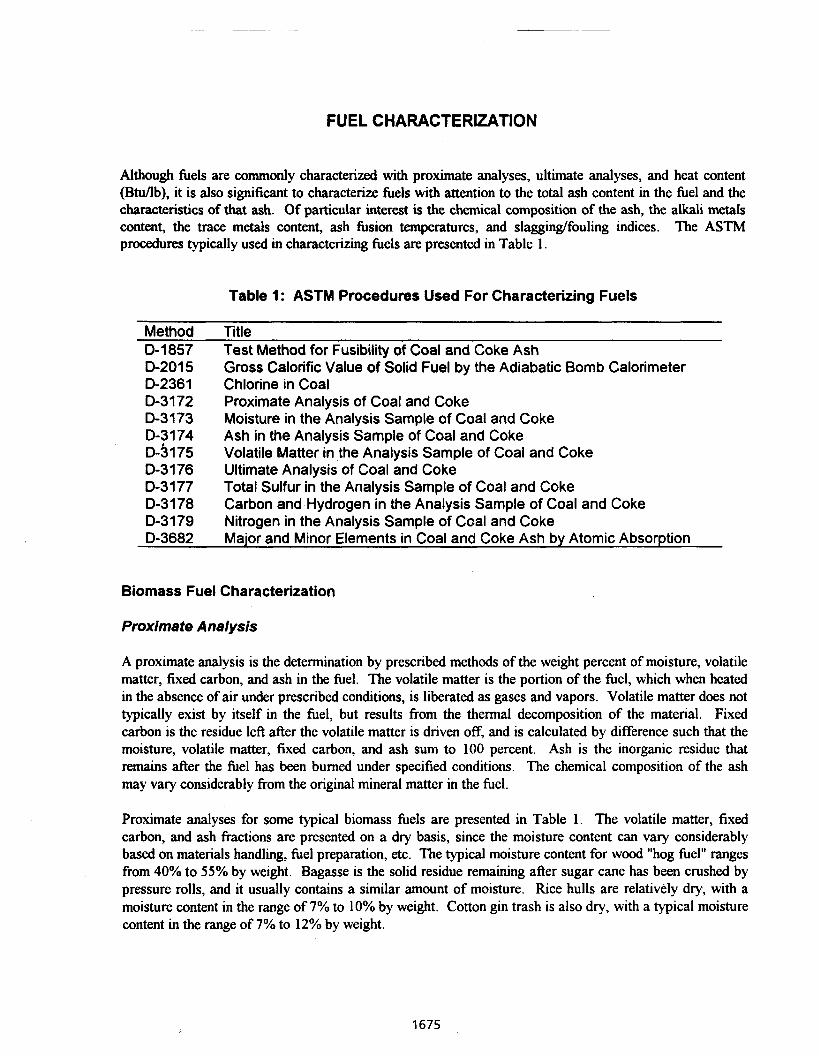
FUEL CHARACTERIZATION
Although fuels are commonly characterized with proximate analyses, ultimate analyses, and heat content (Btu/lb), it is also significant to characterize fuels with attention to the total ash content in the fuel and the characteristics of that ash. Of particular interest is the chemical composition of the ash, the alkali metals content, the trace metals content, ash fusion temperatures, and slagginglfouling indices. The ASTM procedures typically used in characterizing fuels are presented in Table 1.
Table 1 : ASTM Procedures Used For Characterizing Fuels
Method Title 0-1857 Test Method for Fusibility of Coal and Coke Ash D-2015 Gross Calorific Value of Solid Fuel by the Adiabatic Bomb Calorimeter D-2361 Chlorine in Coal 0-3172 Proximate Analysis of Coal and Coke D-3173 Moisture in the Analysis Sample of Coal and Coke D-3174 Ash in the Analysis Sample of Coal and Coke D-3175 Volatile Matter in the Analysis Sample of Coal and Coke D-3176 Ultimate Analysis of Coal and Coke 0-3177 Total Sulfur in the Analysis Sample of Coal and Coke 0-3178 Carbon and Hydrogen in the Analysis Sample of Coal and Coke D-3179 Nitrogen in the Analysis Sample of Coal and Coke 0-3682 Major and Minor Elements in Coal and Coke Ash by Atomic Absorption
Biomass Fuel Characterization
Proximate Analysis
A proximate analysis is the determination by prescribed methods of the weight percent of moisture, volatile matter, fixed carbon, and ash in the fuel. The volatile matter is the portion of the fuel, which when heated in the absence of air under prescribed conditions, is liberated as gases and vapors. Volatile matter does not typically exist by itself in the fuel, but results from the thermal decomposition of the material. Fixed carbon is the residue left after the volatile matter is driven off, and is calculated by difference such that the moisture, volatile matter, fixed carbon, and ash sum to 100 percent. Ash is the inorganic residue that remains after the fuel has been burned under specified conditions. The chemical composition of the ash may vary considerably from the original mineral matter in the fuel.
Proximate analyses for some typical biomass fuels are presented in Table 1. The volatile matter, fixed carbon, and ash fractions are presented on a dry basis, since the moisture content can vary considerably based on materials handling, fuel preparation, etc. The typical moisture content for wood "hog fuel" ranges from 40% to 55% by weight. Bagasse is the solid residue remaining after sugar cane has been crushed by pressure rolls, and it usually contains a similar amount of moisture. Rice hulls are relatively dry, with a moisture content in the range of 7% to 10% by weight. Cotton gin trash is also dry, with a typical moisture content in the range of 7% to 12% by weight.
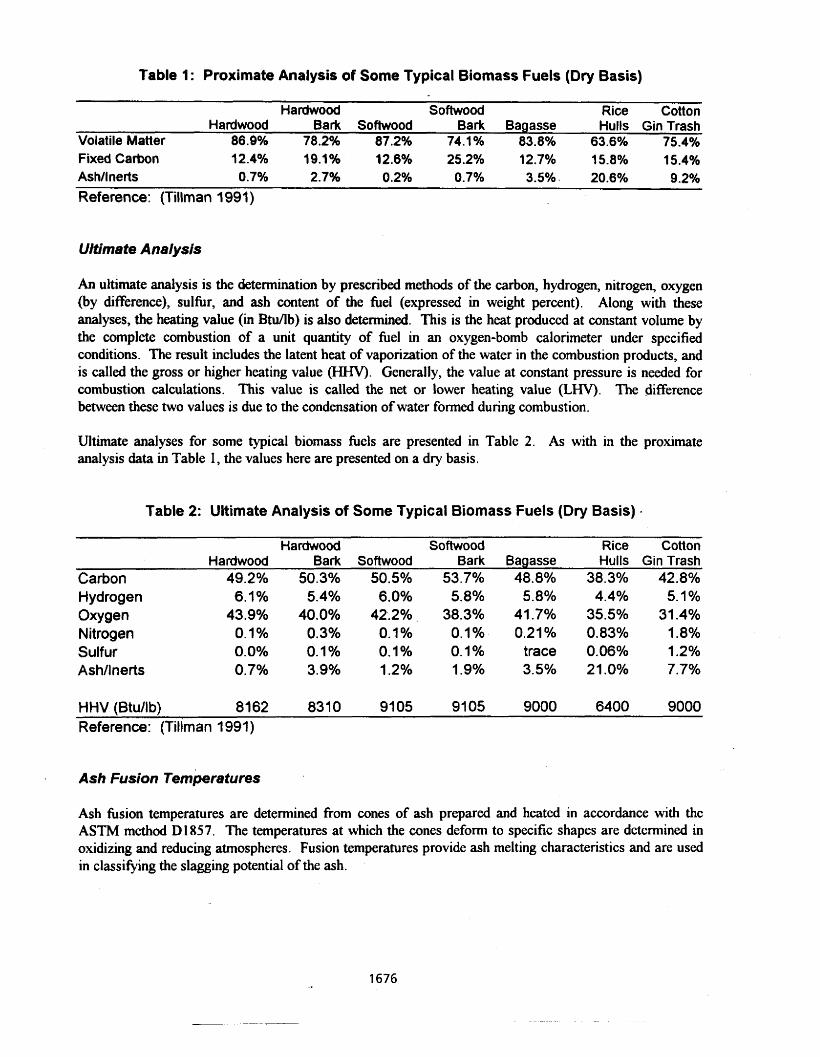
Table 1 : Proximate Analysis of Some Typical Biomass Fuels (Dry Basis)
Hardwood Softwood Rice Cotton Hardwood Bark Softwood Bark Bagasse Hulls Gin Trash
Volatile Matter 86.9% 78.2Oh 87.2% 74.1% 83.8% 63.6% 75.4% Fixed Carbon 12.4Oh 19.1% 12.6% 25.2% 12.7% 15.8% 1 5.4% Ash/l nerts 0.7% 2.7% 0.2% 0.7% 3.5%. 20.6% 9.2%
Reference: (Tillman 1991)
Ultimate Analysis
An ultimate analysis is the determination by prescribed methods of the carbon, hydrogen, nitrogen, oxygen (by difference), sulfur, and ash content of the fuel (expressed in weight percent). Along with these analyses, the heating value (in Btu/lb) is also determined. This is the heat produced at constant volume by the complete combustion of a unit quantity of &el in an oxygen-bomb calorimeter under specified conditions. The result includes the latent heat of vaporization of the water in the combustion products, and is called the gross or higher heating value (HHV). Generally, the value at constant pressure is needed for combustion calculations. This value is called the net or lower heating value (LHV). The difference between these two values is due to the condensation of water formed during combustion.
Ultimate analyses for some typical biomass fbels are presented in Table 2. As with in the proximate analysis data in Table 1, the vaIues here are presented on a dry basis.
Table 2: Ultimate Analysis of Some Typical Biomass Fuels (Dry Basis) .
Hardwood Softwood Rice Cotton Hardwood Bark Softwood Bark Bagasse Hulls Gin Trash
Carbon 49.2% 50.3% 50.5% 53.7% 48.8% 38.3% 42.8% Hydrogen 6.1% 5.4% 6.0% 5.8% 5.8% 4.4% 5.1% Oxygen 43.9% 40.0% 42.2% 38.3% 41.7% 35.5% 31.4% Nitrogen 0.1 % 0.3% 0.1 % 0.1% 0.21% 0.83% I .8% Sulfur 0.0% 0.1 % 0.1% 0.1% trace 0.06% 1.2% Ash/lnerts 0.7% 3.9% 1.2% I .9% 3.5% 21.0% 7.7%
HHV (Btu/lb) 8162 831 0 9105 9105 9000 6400 9000 Reference: (Tillman 1991)
Ash Fusion Temperatures
Ash fusion temperatures are determined from cones of ash prepared and heated in accordance with the ASTM method D1857. The temperatures at which the cones deform to specific shapes are determined in oxidizing and reducing atmospheres. Fusion temperatures provide ash melting characteristics and are used in classieing the slagging potential of the ash.
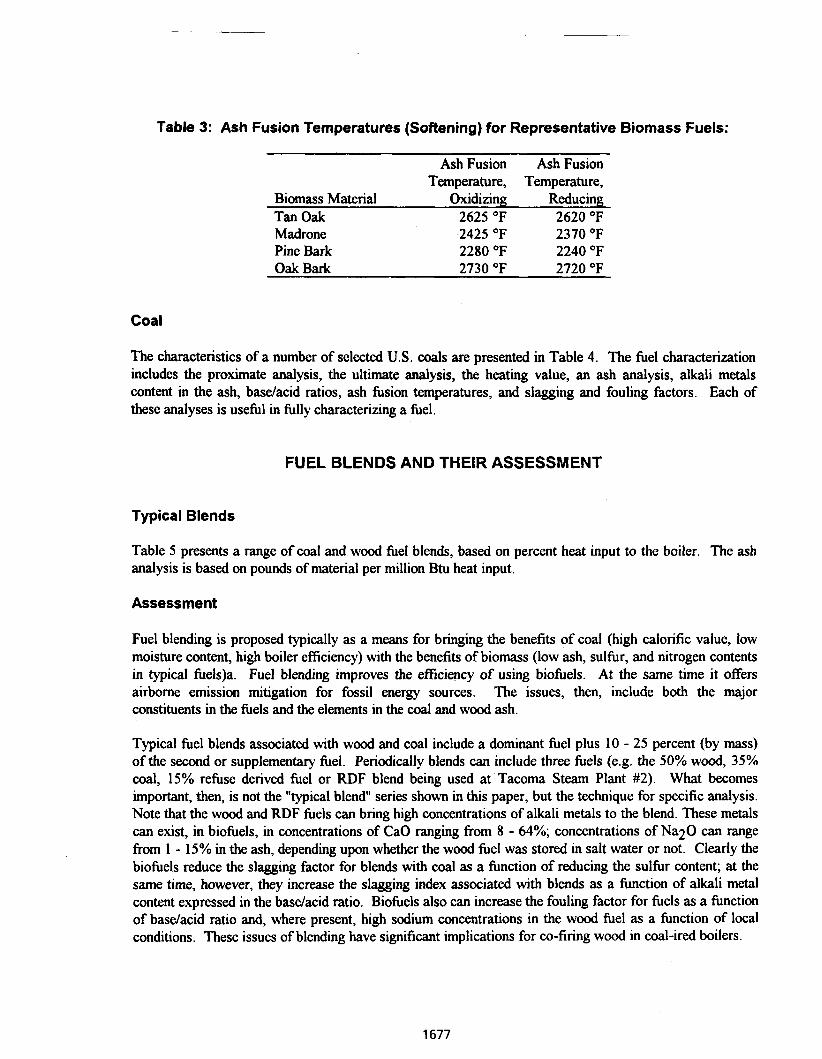
Table 3: Ash Fusion Temperatures (Softening) for Representative Biomass Fueb:
Ash Fusion Ash Fusion Temperature, Temperature,
Biomass Material Oxidizing Reducing Tan Oak 2625 OF 2620 OF Madrone 2425 OF 2370 OF Pine Bark 2280 OF 2240 OF Oak Bark 2730 OF 2720 OF
Coal
The characteristics of a number of selected U.S. coals are presented in Table 4. The fuel characterization includes the proximate analysis, the ultimate analysis, the heating value, an ash analysis, alkali metals content in the ash, baselacid ratios, ash fusion temperatures, and slagging and fouling factors. Each of these analyses is useful in fully characterizing a fuel.
FUEL BLENDS AND THEIR ASSESSMENT
Typical Blends
Table 5 presents a range of coal and wood fuel blends, based on percent heat input to the boiler. The ash analysis is based on pounds of material per million Btu heat input.
Assessment
Fuel blending is proposed typically as a means for bringing the benefits of coal (high calorific value, low moisture content, high boiler efficiency) with the benefits of biomass (low ash, sulfur, and nitrogen contents in typical fuels)a. Fuel blending improves the efficiency of using biofuels. At the same time it offers airborne emission mitigation for fossil energy sources. The issues, then, include both the major constituents in the fuels and the elements in the coal and wood ash.
Typical fuel blends associated with wood and coal include a dominant fuel plus 10 - 25 percent (by mass) of the second or supplementary fuel. Periodically blends can include three fuels (e.g. the 50% wood, 35% coal, 15% refuse derived fuel or RDF blend being used at Tacoma Steam Plant #2). What becomes important, then, is not the "typical blend" series shown in this paper, but the technique for specific analysis. Note that the wood and RDF fuels can bring high concentrations of alkali metals to the blend. These metals can exist, in biofuels, in concentrations of CaO ranging from 8 - 64%; concentrations of Na20 can range from 1 - 15% in the ash, depending upon whether the wood fuel was stored in salt water or not. Clearly the biofuels reduce the slagging factor for blends with coal as a function of reducing the sulfur content; at the same time, however, they increase the slagging index associated with blends as a function of alkali metal content expressed in the baselacid ratio. Biofuels also can increase the fouling factor for fuels as a function of baselacid ratio and, where present, high sodium concentrations in the wood fuel as a function of local conditions. These issues of blending have significant implications for co-firing wood in coal-ired boilers.
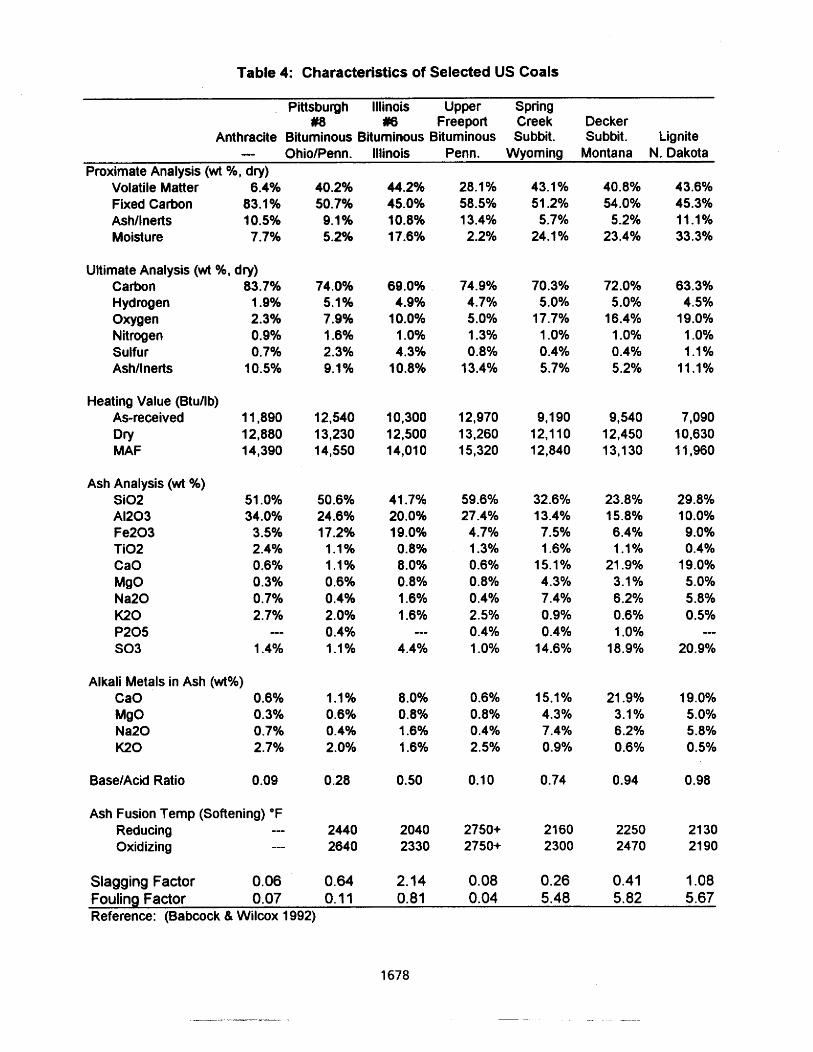
Table 4: Characteristics of Selected US Coals
Pittsburgh Illinois Upper Spring #8 M Freeport Creek Decker
Anthracite Bituminous Bituminous Bituminous Subbit. Subbit. Lignite -- OhioIPenn. Illinois Penn. Wyoming Montana N. Dakota
Proximate Analysis (wt O h , dry) Volatile Matter 6.4Oh 40.2% 44.2% 28.1 % 43.1% 40.8% 43.6% Fixed Carbon 83.1% 50.7% 45.0% 58.5% 51.2% 54.0% 45.3% Ash/lnerts 10.5Oh Q.1% 10.8Oh 13.4% 5.7% 5.2% 11 .I% Moisture 7.7Oh 5.2% 17.6% 2.2% 24.1% 23.4% 33.3%
Uitimate Analysis (wt %, dry) Carbon 83.7Oh 74 .O% 69.0% 74.9% 70.3% 72.0% 63.3% Hydrogen 1.9% 5.1 % 4.9% 4.7% 5.0% 5.0% 4.5% Oxygen 2.3% 7.9% 1 0.O0h 5.0% 17.7% 16.4% 19.0% Nitrogen 0.9% 1 -6% 1 -0% 1.3% 1 .O% 1 .O% 1.0% Sulfur 0.7% 2.3% 4.3Oh 0.8% 0.4% 0.4% 1 . l% Ashllnerts 10.5% 9.1% 10.8% 13.4% 5.7% 5.2% 11.1%
Heating Value (Btullb) As-received 11,890 12,540 10,300 12,970 9,190 9,540 7,090 Dry 12,880 13,230 12,500 13,260 12,1 I 0 12,450 10,630 M AF 14,390 14,550 14,Of 0 15,320 12,840 13,130 11,960
Ash Analysis (wt Oh) Si02 A1203 Fe203 Ti02 CaO MgO Na20 K20 P205 SO3
Alkali Metals in Ash (wt%) CaO 0.6% 1 .lOh 8.0% 0.6% 15.1% 21.9% 19.0°h MgO 0.3% 0.6Oh 0.8Or6 0.8O/o 4.3% 3.1 % 5.0% Na20 0.7% 0.4Oh 1.6Oh 0.4% 7.4% 6.2% 5.8% K20 2.7% 2.0% 1.6% 2.5% 0.9% 0.6% 0.5%
BaseIAcid Ratio 0.09 0.28 0.50 0.1 0 0.74 0.94 0.98
Ash Fusion Temp (Softening) O F Reducing --- 2440 2040 27SO+ 2160 2250 21 30 Oxidizing --- 2640 2330 2750+ 2300 2470 2190
Slagging Factor 0.06 0.64 2.14 0.08 0.26 0.41 1.08 Fouling Factor 0.07 0.1 1 0.81 0.04 5.48 5.82 5.67 Reference: (Babcock & Wilcox 1992)
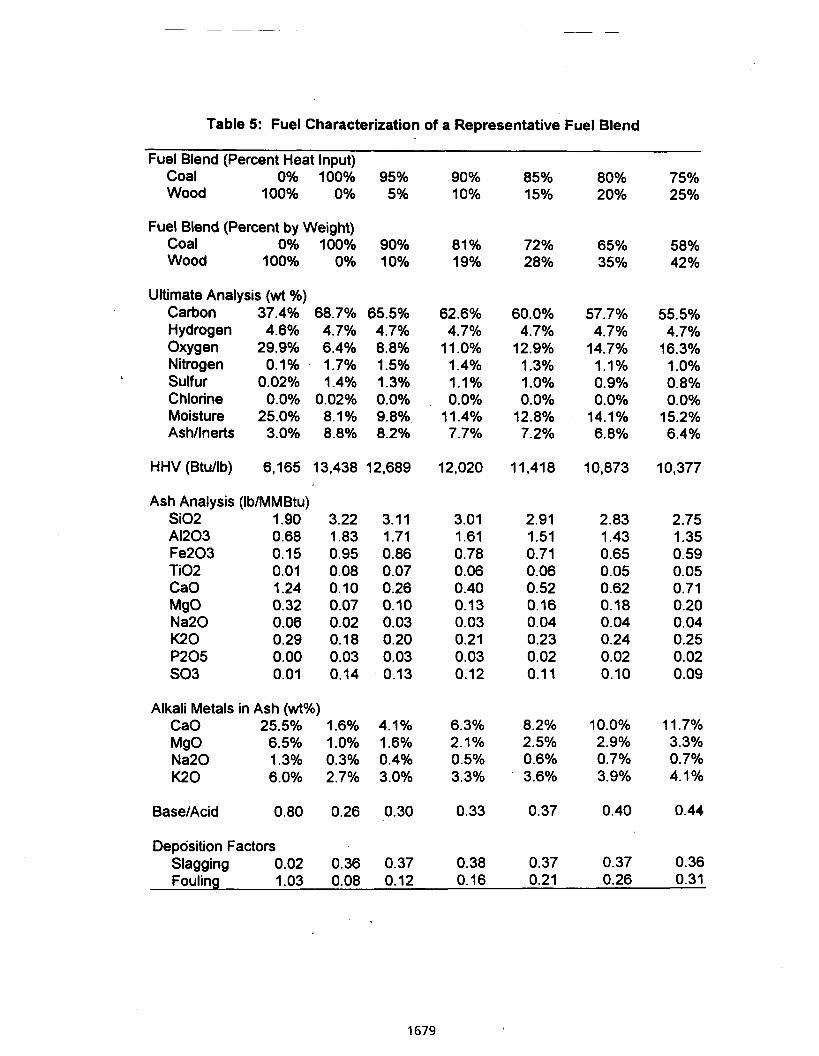
Table 5: Fuel Characterization of a Representative Fuel Blend
Fuel Blend (Percent Heat Input) Coal 0% 100% 95% 90% 85% 80% Wood 100% 0% 5% 10% 15% 20%
Fuel Blend (Percent by Weight) Coal OYO 100% 90% 81 % 72% 65% Wood 100% 0% 10% 19% 28% 35%
Ultimate Analysis (wt %) Carbon 37.4% 68.7% 65.5% Hydrogen 4.6% 4.7% 4.7% Oxygen 29.9% 6.4% 8.8% Nitrogen 0.1% 1.7% 1.5% Sulfur 0.02% 1.4% 1.3% Chlorine 0.0% 0.02% 0.0% Moisture 25.0% 8.1% 9.8% Ashllnerts 3.0% 8.8% 8.2%
HHV (Btullb) 6,165 13,438 12,689 12,020 11,418 10,873
Ash Analysis (IbIMMBtu) Si02 1.90 3.22 3.11 A1203 0.68 1.83 1.71 Fe203 0.15 0.95 0.86 Ti02 0.01 0.08 0.07 CaO 1.24 0.10 0.26 MgO 0.32 0.07 0.10 Na20 0.06 0.02 0.03 K20 0.29 0.18 0.20 P205 0.00 0.03 0.03 SO3 0.01 0.14 0.13
Alkali Metals in Ash (wt%) CaO 25.5% 1.6% 4.1% 6.3% 8.2% 10.0% MgO 6.5% 1.0% 1.6% 2.1 % 2.5% 2.9% Na20 1.3% 0.3% 0.4% 0.5% 0.6% 0.7% K20 6.0% 2.7% 3.0% 3.3% 3.6% 3.9%
Deposition Factors Slagging 0.02 0.36 0.37 0.38 0.37 0.37 Fouling 1.03 0.08 0.12 0.16 0.21 0.26
Firing Blends in Pulverized Coal (PC) Boilers
Firing blends of fuels in PC boilers merits consideration of the he1 preparation requirements for both the woodmiofuel and the coal. With respect to the wood, dry he1 is required. Similarly, pulverized wood he1 is essential to the success of the program. Attention must be paid to transport properties of both fbels, along with flame speed for the biofbels (typically on the order of 5,000 Wsec). Attention also should be paid to the fact that the blended fuel takes on characteristics of the blend as a single fuel, and of the blend elements as distinct and separate fuels.
Firing blends of biomass and coal in PC boilers has some modest impacts on boiler flame temperature, the molecular weight of the gaseous combustion products, and the volume of combustion products generated per million Btu fired. The increase in volume of combustion products is modest, and results fram the lower calorific content of the biohel along with the typically higher moisture content of this material, even when prepared for PC firing.
With respect to flyash, blending merits careful attention. The ability of wood and biomass to increase the slagging and fouling factors of fuel blends by increasing the baselacid ratio and the potential for high sodium content is of concern when considering cofiring biohels with coal in PC installations. Eutectic mixtures in the flyash can reduce the ash fusion temperatures, as can the increasing of the B/A ratio and the driving of that ratio towards 1 .O. Mitigating against being overly cautious is the fact that wood typically contains on the order of 3% ash, where coal can contain significantly higher percentages of noncombustible materials.
t
Beyond the combustion process itself the specific coal(s), wood fbel(s), and blends must be evaluated with attention to flyash characteristics. This issue becomes significant if the flyash fiom the unit is sold as pouolanic material or as other raw material for product manufacture. Stability in the flyash chemistry is of critical importance in the sale of such combustion biproduct.
Firing Blends in Cyclone Boilers
The impact of biohels on cyclone firing involves less wood preparation and may not require wood drying, or hogging below 412" particle size. The cyclone combustion process is very intense, and results in minimal changes in performance characteristics of the unit as a function of fuel blend firing. At the same time, however, the increased concentrations of alkali metals combined with the higher BIA ratios and the lower sulfbr contents of the fuel contribute to desirable slag formation in the cyclone barrel. Similarly the volatility of the biofuel, measured by volatile/fixed carbon ratios, supp~rts the increased use of wood/coal blends in these combustion systems. The only problems are readily apparent if the moisture content of the blend exceeds 20%, if the ash content of the blend is less than about 6%, and if the cyclone unit is feeder limited.
Cyclone boilers generate less flyash than PC boilers, however the issues associated with flyash chemistry in support of flyash disposition remain critical. These considerations merit carefbl attention on a case-by-case basis in order to support rather than compromise the economics of electricity generation at any given power station.
CONCLUSIONS
Biofuels, coal, RDF, and other fuels are characterized by significantly different compositions with respect to major components (e.g. carbon, hydrogen, oxygen, moisture, ash), minor constituents (including elements in the ash), and trace elements. They vary as a function of oxygen content, calorific value, heteroatoms causing airborne emissions, and ash chemistry.
Few generalizations can be made which govern all situations. Blends must be evaluated for each generating station and for each proposed fuel mixture with attention to:
impact on boiler efficiency, flame temperature, and volume of gaseous combustion products;
impact on slagging and fouling in the boiler, particularly the PC boiler, or on slag formation h the cyclone barrel; and
impact on flyash chemistry, and other associated economic issues.
In evaluating these blends it is important to recognize that each fuel particle will retain characteristics of its parent fuel (e.g. coal, wood), and the blend will also exhibit characteristics of the mixture as a single fuel. It is the interplay of these forces which governs the utility of specific blends in support of the most cost- effective and environmentally sound electricity generation at any given location.
REFERENCES
Babcock & Wilcox. 1992. Steam. Its Generation and Use. 40th Ed. Barberton, Ohio: The Babcock and Wilcox Company.
Tillman, D. A. 1991. The Combustion of Solid Fuels and Wastes. San Diego: Academic Press.
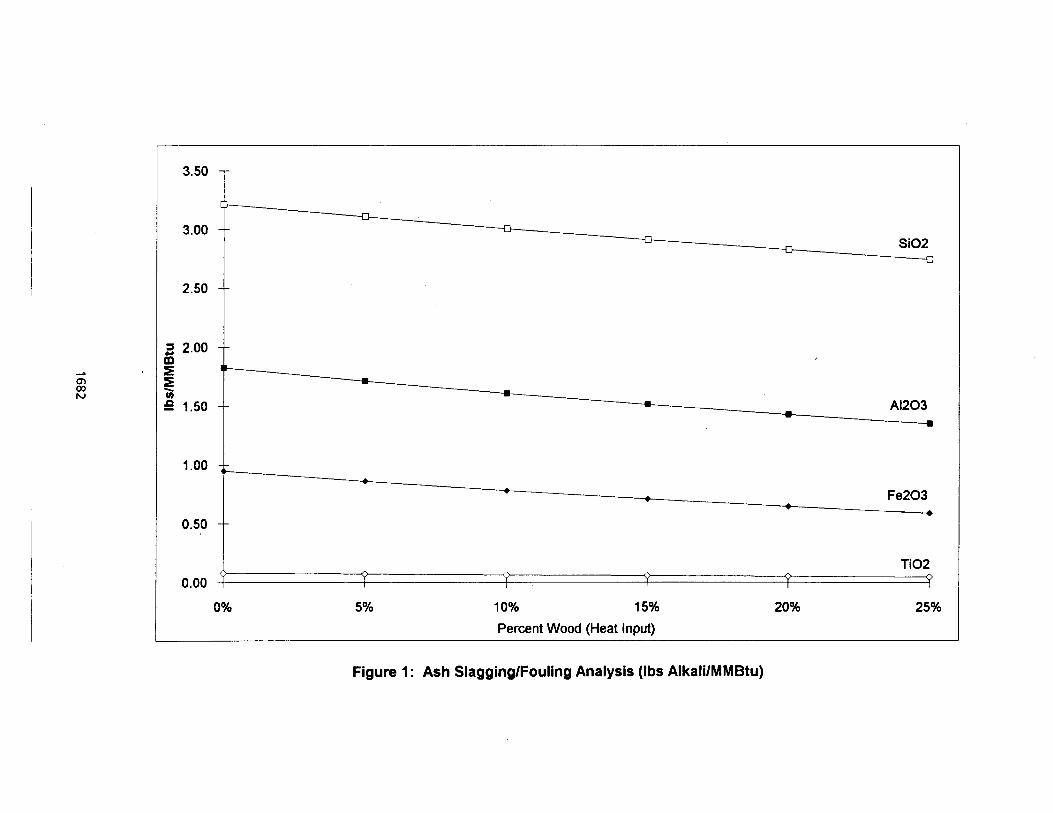
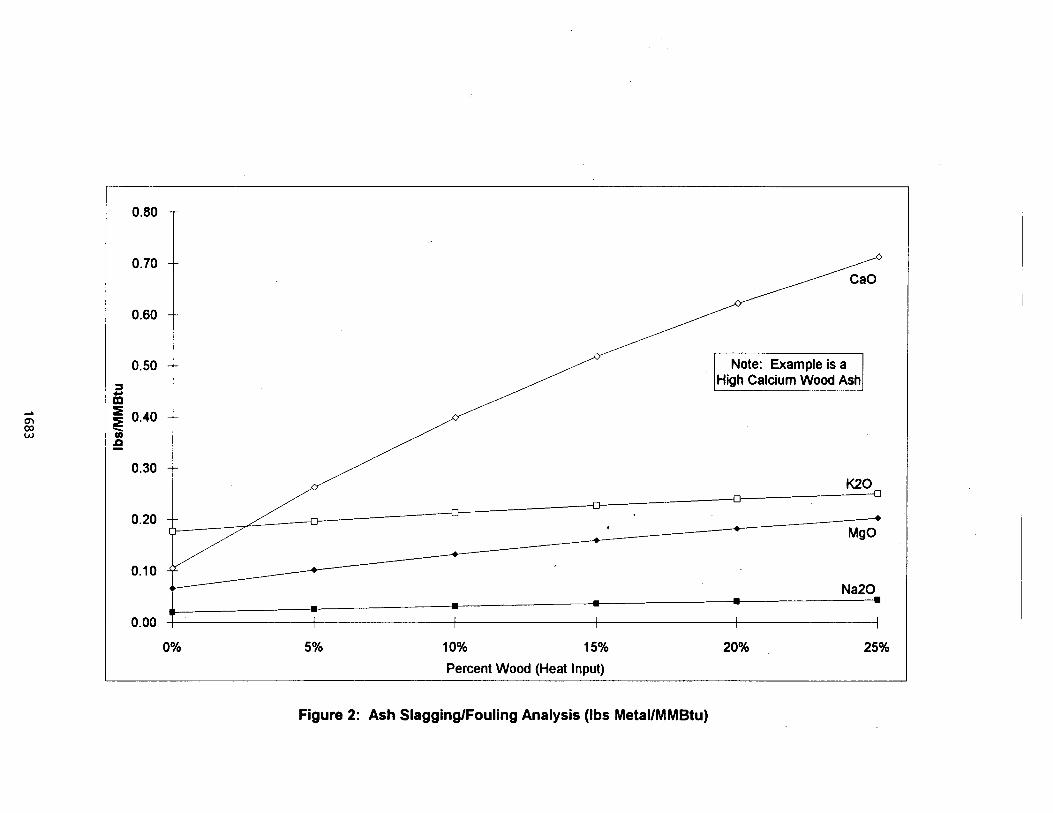
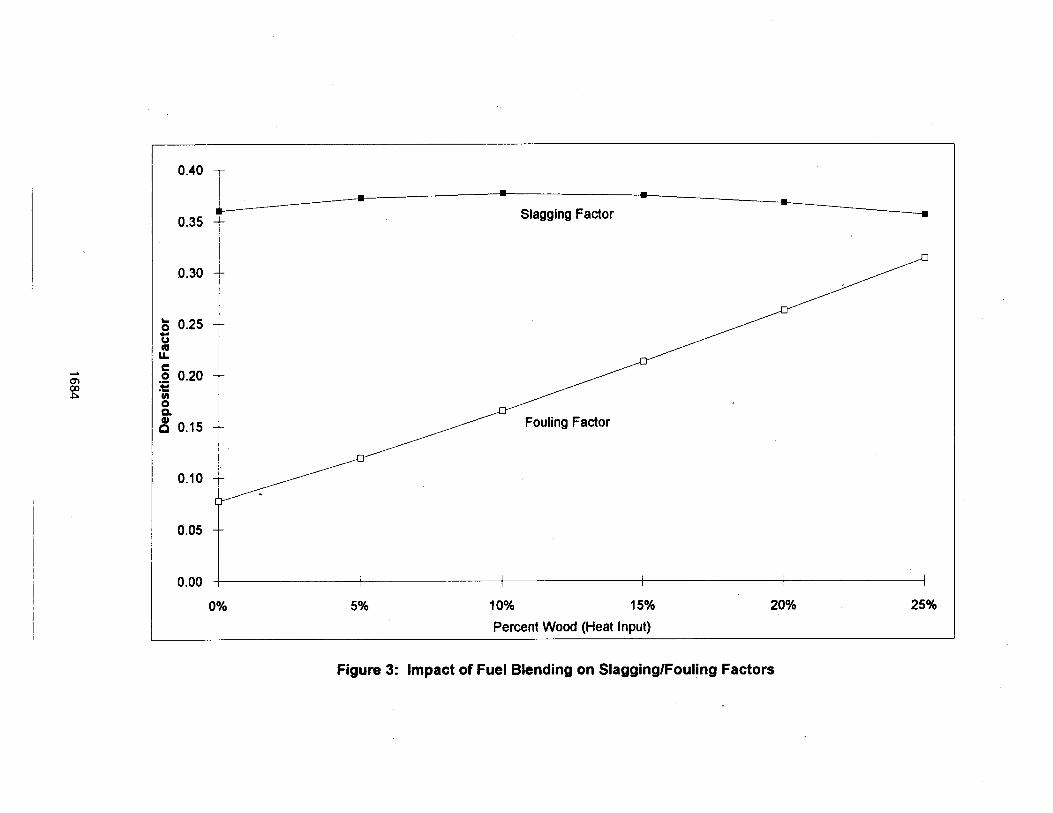
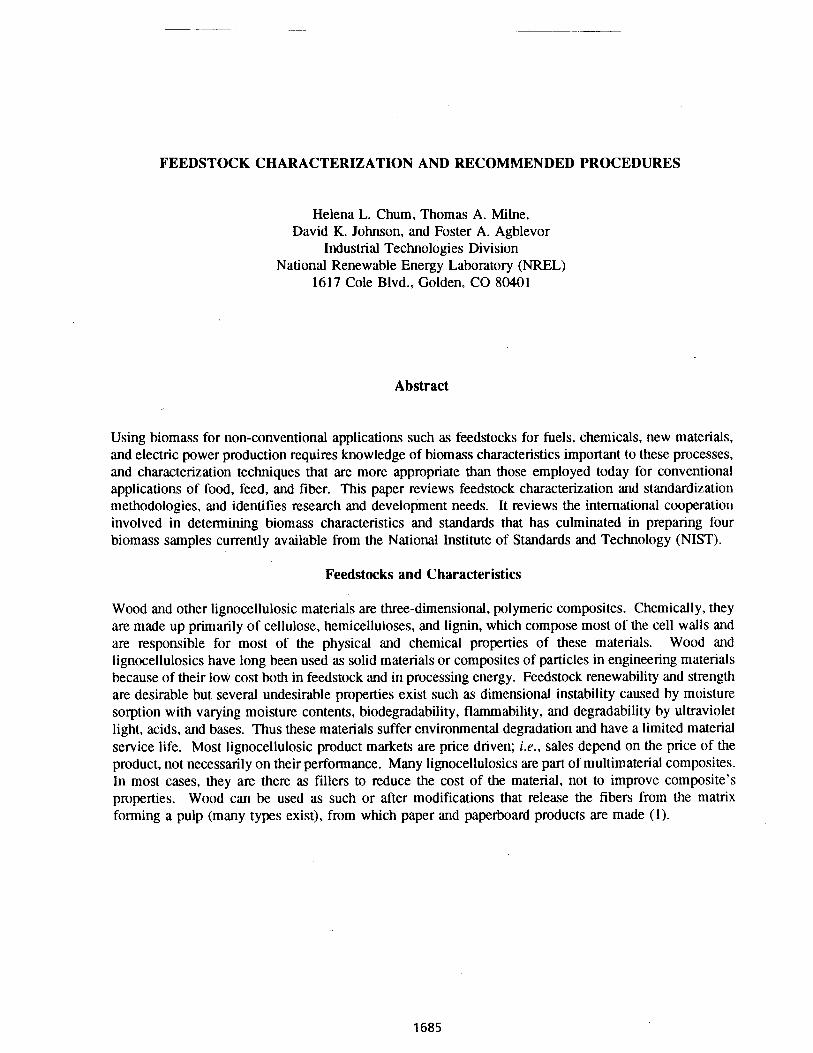
FEEDSTOCK CHARACTERIZATION AND RECOMMENDED PROCEDURES
Helena L. Chum, Thomas A. Milne, David K. Johnson, and Foster A. Agblevor
Industrial Technologies Division National Renewable Energy Laboratory (NREL)
16 17 Cole Blvd., Golden, CO 80401
Abstract
Using biomass for non-conventional applications such as feedstocks for fuels, chemicals, new materials, and electric power production requires knowledge of biomass characteristics important to these processes, and characterization techniques that are more appropriate than those employed today for conventional applications of food, feed, and fiber. This paper reviews feedstock characterization and standardization methodologies, and identifies research and development needs. It reviews the international cooperation involved in determining biomass characteristics and standards that has culminated in preparing four biomass samples currently available from the National Institute of Standards and Technology (NIST).
Feedstocks and Characteristics
Wood and other lignocellulosic materials are three-dimensional, polymeric composites. Chemically, they are made up primarily of cellulose, hemicelluloses, and lignin, which compose most of the cell walls and are responsible for most of the physical and chemical properties of these materials. Wood and lignocellulosics have long been used as solid materials or composites of particles in engineering materials because of their low cost both in feedstock and in processing energy. Feedstock renewability and strength are desirable but several undesirable properties exist such as dimensional instability caused by moisture sorption with varying moisture contents, biodegradability, flammability, and degradability by ultraviolet light, acids, and bases. Thus these materials suffer environmental degradation and have a limited material service life. Most lignocellulosic product markets are price driven; i.e., sales depend on the price of the product, not necessarily on their performance. Many lignocellulosics are part of multimaterial composites. In most cases, they are there as fillers to reduce the cost of the material, not to improve composite's properties. Wood can be used as such or after modifications that release the fibers from the matrix forming a pulp (many types exist), from which paper and paperboard products are made (1).
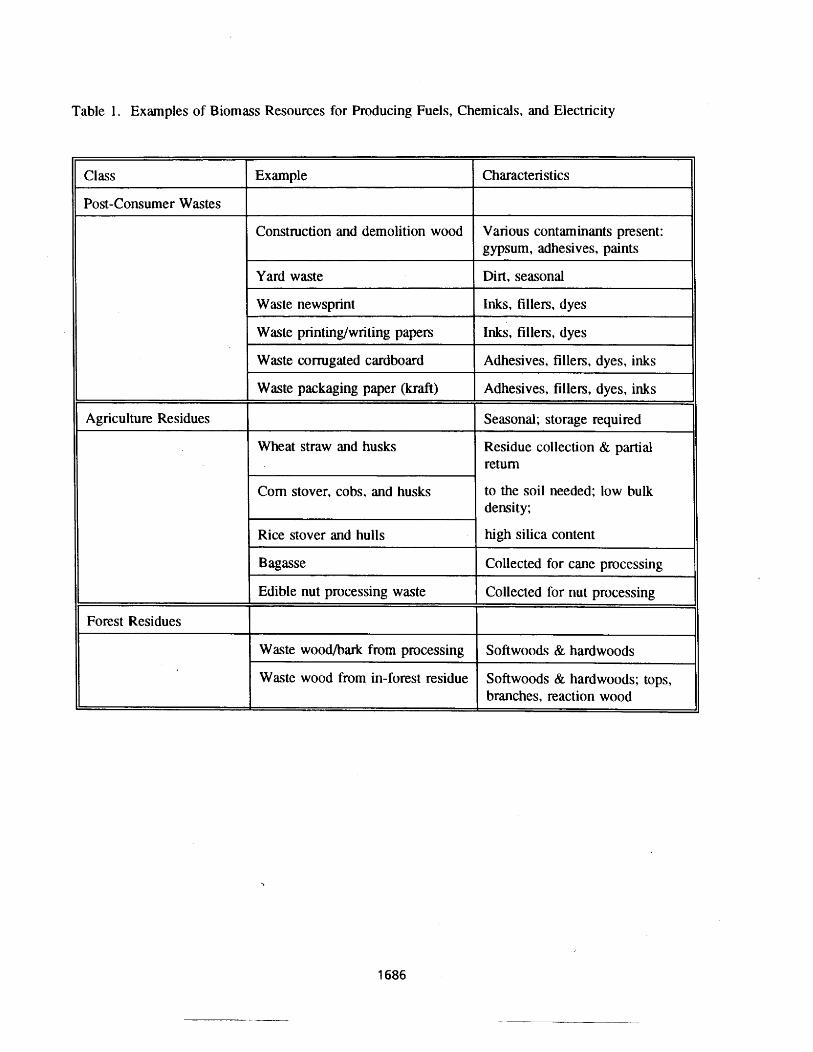
Table 1. Examples of Biomass Resources for Producing Fuels, Chemicals, and Electricity
Characteristics
Various contaminants present: gypsum, adhesives, paints
Dirt, seasonal
Inks, fillers, dyes
Inks, fillers, dyes
Adhesives, fillers, dyes, inks
Adhesives, fillers, dyes, inks
Seasonal; storage required
Residue collection & partial return
to the soil needed; low bulk density;
high silica content
Collected for cane processing
Collected for nut processing
Softwoods & hardwoods
Softwoods & hardwoods; tops, branches, reaction wood
Class
Post-Consumer Wastes
Agriculture Residues
Forest Residues
I
Example
Construction and demolition wood
Yard waste
Waste newsprint
Waste printingwriting papers
Waste corrugated cardboard
Waste packaging paper (kraft)
Wheat straw and husks
Corn stover, cobs, and husks
Rice stover and hulls
Bagasse
Edible nut processing waste
Waste woodbark from processing
Waste wood from in-forest residue
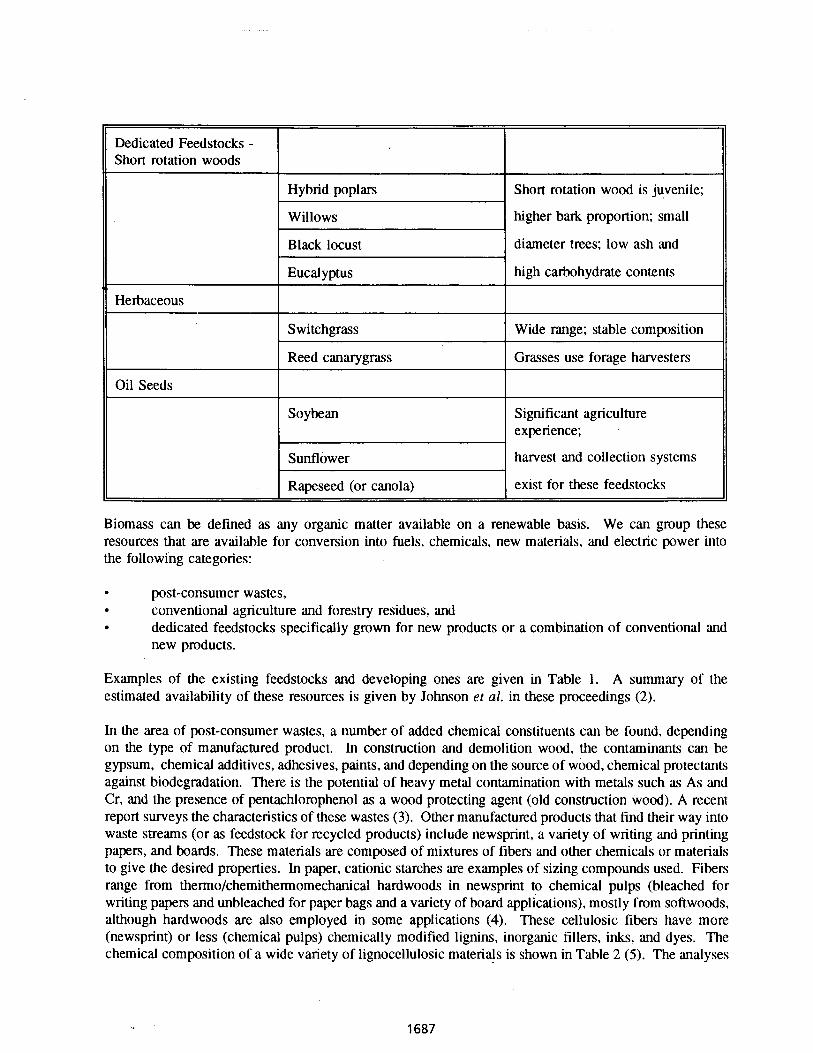
Biomass can be defined as any organic matter available on a renewable basis. We can group these resources that are available for conversion into fuels, chemicals, new materials, and electric power into the following categories:
Dedicated Feedstocks - Short rotation woods
Herbaceous
Oil Seeds
-
post-consumer wastes, . conventional agriculture and forestry residues, and dedicated feedstocks specifically grown for new products or a combination of conventional and new products.
Examples of the existing feedstocks and developing ones are given in Table 1. A summary of the estimated availability of these resources is given by Johnson et al. in these proceedings (2).
Hybrid poplars
Willows
Black locust
Eucalyptus
Switchgrass
Reed canarygrass
Soybean
Sunflower
Rapeseed (or canola)
In the area of post-consumer wastes, a number of added chemical constituents can be found, depending on the type of manufactured product. In construction and demolition wood, the contaminants can be gypsum, chemical additives, adhesives, paints, and depending on the source of wood, chemical protectants against biodegradation. There is the potential of heavy metal contamination with metals such as As and Cr, and the presence of pentachlorophenol as a wood protecting agent (old construction wood). A recent report surveys the characteristics of these wastes (3). Other manufactured products that find their way into waste streams (or as feedstock for recycled products) include newsprint, a variety of writing and printing papers, and boards. These materials are composed of mixtures of fibers and other chemicals or materials to give the desired properties. In paper, cationic starches are examples of sizing compounds used. Fibers range from thermo/chemithermomechanical hardwoods in newsprint to chemical pulps (bleached for writing papers and unbleached for paper bags and a variety of board applications), mostly from softwoods, although hardwoods are also employed in some applications (4). These cellulosic fibers have more (newsprint) or less (chemical pulps) chemically modified lignins, inorganic fillers, inks, and dyes. The chemical composition of a wide variety of lignocellulosic materials is shown in Table 2 (5). The analyses
Short rotation wood is juvenile;
higher bark proportion; small
diameter trees; low ash and
high carbohydrate contents
Wide range; stable composition
Grasses use forage harvesters
Significant agriculture experience;
harvest and collection systems
exist for these feedstocks
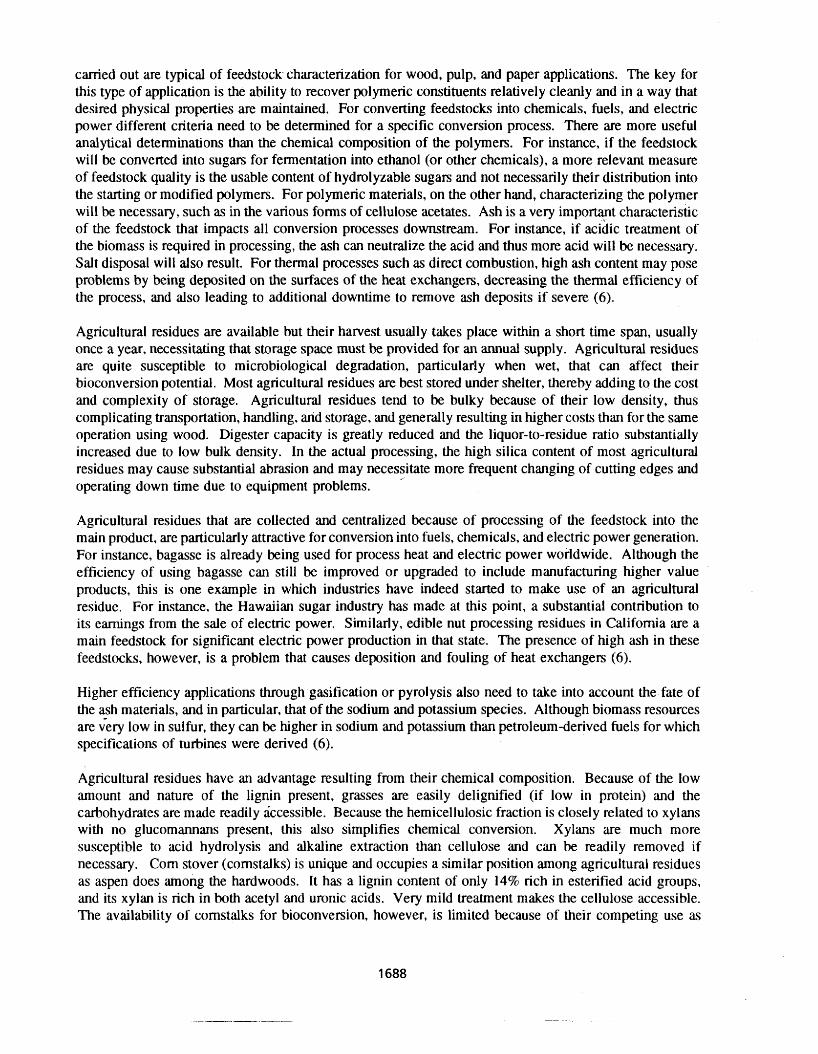
carried out are typical of feedstock characterization for wood, pulp, and paper applications. The key for this type of application is the ability to recover polymeric constituents relatively cleanly and in a way that desired physical properties are maintained. For converting feedstocks into chemicals, fuels, and electric power different criteria need to be determined for a specific conversion process. There are more useful analpcal determinations than the chemical composition of the polymers. For instance, if the feedstock will be converted into sugars for fermentation into ethanol (or other chemicals), a more relevant measure of feedstock quality is the usable content of hydrolyzable sugars and not necessarily their distribution into the starting or modified polymers. For polymeric materials, on the other hand, characterizing the polymer will be necessary, such as in the various forms of cellulose acetates. Ash is a very important characteristic of the feedstock that impacts all conversion processes downstream. For instance, if acidic treatment of the biomass is required in processing, the ash can neutralize the acid and thus more acid will be necessary. Salt disposal will also result. For thermal processes such as direct combustion, high ash content may pose problems by being deposited on the surfaces of the heat exchangers, decreasing the thermal efficiency of the process, and also leading to additional downtime to remove ash deposits if severe (6).
Agricultural residues are available but their harvest usually takes place within a short time span, usually once a year, necessitating that storage space must be provided for an annual supply. Agricultural residues are quite susceptible to microbiological degradation, particularly when wet, that can affect their bioconversion potential. Most agricultural residues are best stored under shelter, thereby adding to the cost and complexity of storage. Agricultural residues tend to be bulky because of their low density, thus complicating transportation, handling, and storage, and generally resulting in higher costs than for the same operation using wood. Digester capacity is greatly reduced and the liquor-to-residue ratio substantially increased due to low bulk density. In the actual processing, the high silica content of most agricultural residues may cause substantial abrasion and may necessitate more frequent changing of cutting edges and operating down time due to equipment problems.
Agricultural residues that are collected and centralized because of processing of the feedstock into the main product, are particularly attractive for conversion into fuels, chemicals, and electric power generation. For instance, bagasse is already being used for process heat and electric power worldwide. Although the efficiency of using bagasse can still be improved or upgraded to include manufacturing higher value products, this is one example in which industries have indeed started to make use of an agricultural residue. For instance, the Hawaiian sugar industry has made at this point, a substantial contribution to its earnings from the sale of electric power. Similarly, edible nut processing residues in California are a main feedstock for significant electric power production in that state. The presence of high ash in these feedstocks, however, is a problem that causes deposition and fouling of heat exchangers (6).
Higher efficiency applications through gasification or pyrolysis also need to take into account the fate of the ash materials, and in particular, that of the sodium and potassium species. Although biomass resources are very low in sulfur, they can be higher in sodium and potassium than petroleum-derived fuels for which specifications of turbines were derived (6).
Agricultural residues have an advantage resulting from their chemical composition. Because of the low amount and nature of the lignin present, grasses are easily delignified (if low in protein) and the carbohydrates are made readily iccessible. Because the hemicellulosic fraction is closely related to xylans with no glucomannans present, this also simplifies chemical conversion. Xylans are much more susceptible to acid hydrolysis and alkaline extraction than cellulose and can be readily removed if necessary. Corn stover (cornstalks) is unique and occupies a similar position among agricultural residues as aspen does among the hardwoods. It has a lignin content of only 14% rich in esterified acid groups, and its xylan is rich in both acetyl and uronic acids. Very mild treatment makes the cellulose accessible. The availability of cornstalks for bioconversion, however, is limited because of their competing use as

silage. In fact, a fraction of all these agricultural residues needs to be left in the field to protect the soil against erosion and to provide organic matter (7).
The primary manufacturing residues of the pulp and paper industry are debarking residues, sawdust, and sanderdust. Bark, especially from thick barked softwood species, is not readily adaptable to nor desirable for wood carbohydrate use. Suitable uses for bark and developing chemical processes for its conversion to new materials are needed. In certain regions, much more sawdust is produced than can be consumed in the pulping industry; often sanderdust is also available. The primary impediment to their use is the type of lignin present in softwoods. Not only is delignification more difficult than with hardwoods, but opening the cell wall structure and providing access to the cellulose is more difficult. On the average, softwoods have less total carbohydrate and slightly less cellulose than the hardwoods. The hemicellulose fraction is also more complex, with less pentosan available.
Softwoods have considerable value as construction lumber and pulpwood, and using this raw material for biomass conversion might not be economically feasible unless the value of the end product is very high. However, the pulp and paper industry has large amounts of logging and manufacturing residues that could serve as feedstocks for conversion to other materials, because they are usually unsuitable for use in normal cellulose pulp production. Branches and tops constitute most of the logging residues. Because of the higher density of branch wood, diffusion of pulping liquor into the cell wall is difficult. The probable presence of compression wood in branches also is a problem because the higher and more condensed lignin content of compression wood together with a thicker cell wall makes any adequate delignification difficult. Compression wood also has a lower total carbohydrate content (especially cellulose), making it less desirable as a raw material for pulp production. The tops of trees have many branches and may have considerable juvenile wood in the main stem. Because juvenile wood has a low density and thin cell walls, it would be overreacted before the branch wood could be adequately treated. Therefore, logging residues probably are best used as a fuel source or could serve as feedstocks for thermochemical processes (5) .
Hardwoods could become an excellent raw material for conversion into chemicals, fuels, and electricity because of their availability and desirable properties. Although some hardwoods are valuable and much in demand, many are considered a silvicuitural problem because of their abundance and low use potential. Often the trees are of small diameter and without a usable trunk, consequently the trees are frequently removed to make space available for plantations, usually softwoods, The advantages of using hardwood material for conversion to other products include the high density of many species; relative ease of delignification and accessibility of the wood carbohydrates; and practically only one hemicellulose, xylan, can be easily removed. Reaction wood in hardwoods also has additional cellulose that is readily available, and tension wood lignin does not present problems in delignification. Other advantages include low ash content, particularly silica, and slightly higher total carbohydrate and cellulose content. The possibility of byproduct use is great, especially when compared to softwoods. Hardwoods have a higher acetyl content than softwoods and most grasses and would yield more acetic' acid. A small amount of glucomannan hemicellulose is also present. Experience is beginning to accumulate with short rotation hardwoods for conventional pulping applications (8).
Dedicated feedstocks are crops selected for their high yield, low fertilizer and moderate water input, and suitability for conversion into one or more of the energy products such as liquid fuels, chemicals, or electric power production. They can provide farmers with diversified types of crops and markets to sell to in addition to food and feed. In this way, farmers can gain a measure of protection from some of the more extreme downswings in the agricultural economy and better manage land with crops that provide erosion protection. A well designed strategy to increase alternative use of the crops complementing food,
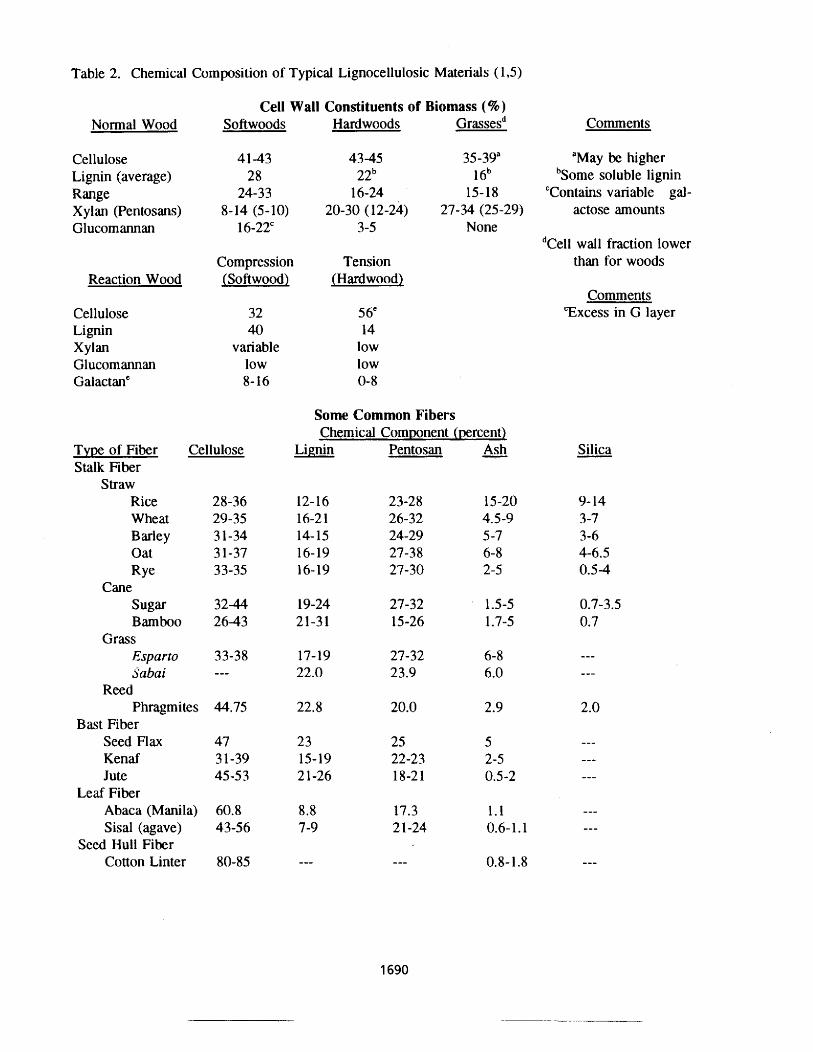
Table 2. Chemical Composition of Typical Lignocellulosic Materials ( 1,5)
Cell Wall Constituents of Biomass (% ) Normal Wood Softwoods Hardwoods ~ r a s s e s ~ Comments
Cellulose Lignin (average) Range Xylan (Pentosans) Glucomannan
Reaction Wood
Cellulose Lignin Xylan
Compression (Softwood)
32 40
variable
Tension (Hardwood)
56" 14
low Glucomannan low low Gaiactane 8- 16 0-8
Some Common Fibers
35-39a 'May be tugher 1 6b b Some soluble lignin
15-18 'Contains variable gal- 27-34 (25-29) actose amounts
None dCell wall fraction lower
than for woods
Type of Fiber Cellulose Stalk Fiber
Straw Rice 28-36 Wheat 29-35 Barley 3 1-34 Oat 3 1-37 Rye 33-35
Cane S U ~ W 32-44 Bamboo 26-43
Grass Esparto 33-38 h'abai ---
Reed Phragmites 44.75
Bast Fiber Seed Flax 47 Kenaf 3 1-39 Jute 45 -5 3
Leaf Fiber Abaca (Manila) 60.8 Sisal (agave) 43-56
Seed Hull Fiber Cotton Linter 80-85
Chemical Component (percent) Lignin Pentosan - Ash
Comments "Excess in G layer
Silica -
9- 14 3-7 3-6 4-6.5 0.5 -4
0.7-3.5 0.7
--- - --
2.0
--- --- ---
--- ---
---
feed, and fiber applications, can boost employment and strengthen a region's industrial base. Two major types of crops are contemplated and have been colon tested but are not completely developed: Short rotation woody crops, which are fast growing trees, and herbaceous energy crops, which are perennials or annuals.
Short rotation woody crops are mostly hardwoods. Trees are planted in a similar way to an orchard, following land preparation by clearing, cutting trees at regular intervals, with spacings of about eight feet or less. Fertilizers are applied depending on the quality of the soil. Weeds are controlled with herbicides during the first years only to insure that these crops outcompete weeds. The crop will be harvested after a 6-8 years depending on the species and soil conditions. Low soil erosion follows this type of plantation because soils are rarely disturbed by tilling. Because the trees produced are smaller in diameter than those from conventional forestry, efforts are still necessary in developing cost-effective harvesting methods.
Herbaceous energy crops of the annual varieties are more prone to high soil erosion rates compared to perennials, and annual row crops are similar to current commercial agriculture. A good example of a herbaceous crop is switchgrass, a perennial, which is deep-rooted, persistent, and less affected by drought than many other potential crops. These perennial species are characterized by low soil erosion. Another advantage of herbaceous species is that farmers already have most of the equipment necessary to plant, tend, harvest and store crops, in a similar way to what is done with alfafa and other commercial forage crops. Once the perennial species plantations are established, they can remain productive for many years, or the area can be quickly converted into other crops. if necessary.
Selected Methods of Analyses
Milne et al. (9) have collected the methods of analyses germane to biomass and biomass conversion processes. That reference and the original literature sources should be consulted for references to a wide number of specific methods. We present a summary of the most relevant analytical problems and the methods that are being used, with some comments. The materials presented address conversion routes of these lignocellulosic materials into fuels, chemicals, and electricity as main processes. Because the
' conversion processes themselves are quite varied, the best analytical methods are also dependent on the specific types of routes taken and the information necessary to optimize these processes. For instance, required feedstock characteristics for combustion differ significantly from those for bioconversion processes. Even within thermal conversion processes, detailed feedstock characteristics will be more important for pyrolysis than for gasification or combustion. In general, feedstock sensitivity will be higher for bioconversion processes than for thermal conversion ones.
Because of their importance, we will summarize the methods for feedstock sample preparation, ultimate analysis, ash (including mineral matter and dirt), and moisture content (Tables 3-7). Reference 9 should be consulted for additional references on other methods. The tables contain comments as to the usefulness of the methods cited. Some of the NREL methods of analyses are described, with modified sample size to increase the precision and accuracy of the determinations.
In the ash determination area, the content of potassium and sodium ions is of great importance in applications that generate electric power using turbines. Because those are the highest efficiency options, it is important that the ash content reveals the full content of these ions, without losses. It is not very clear from the data obtained so far that the ashing methodology does not lead to loss of some of these elements. In the area of elemental analyses, likewise, there have been no specific methods developed for lignocellulosic biomass. Most of the methods available are adapted from coal or refuse derived fuel analysis. There have been attempts at using nuclear magnetic resonance methodologies for determing the
hydrogen content of a number of oil-derived samples, but their results have not been adapted to lignocellulosic materials.
NIST Samples and IEA Round Robins Summary
As a result of the NREL activities that were sponsored by the International Energy Agency in the Voluntary Standards activities, NIST has four biomass reference materials: pine from New Zealand, poplar from Kentucky, sugar cane bagasse from Hawaii, and wheat straw from Colorado. These samples can be purchased from NIST in 50 g mylar bags. Costs are nominal. A description of the sample preparation and their analyses is given in references 10-1 1. Randomly selected samples of the NIST biomass reference materials were tested at NREL for within and between bag variation using the Klason lignin determination. The sarhple bags were found to be uniform within f2%. NREL, in consultation with Professor Olof Theander (University of Uppsala, Sweden) and other participating countries, selected a methodology for the round robin analysis of the materials. NREL distributed the NIST biomass samples, standards, reagents, a detailed method of analysis and a spreadsheet to 25 laboratories from 1 1 countries who signed up for the round robin. Nineteen laboratories provided results prior to November 199 1, which are related in references 10-1 1. Helena L. Chum (NREL) and Goran Gellerstedt (Royal Institute of Technology, Stockholm, Sweden) organized the IEA Pre-Symposium on Modem Methods of Analyses of Wood, Annual Plants, and Lignins, that took place in New Orleans in November 199 1. These IEA Round Robin results were presented and discussed at that meeting where 110 participants congregrated from more than 20 countries. The special emphasis of the meeting was on using multivariate analysis techniques to correlate various analytical data from different laboratories with similar or different types of data.
Statistical analysis of the initial round robin data on whole feedstocks showed that the variation of samples within a laboratory was small, whereas the vaiiation between laboratories was statistically significant, indicating that the method employed still left significant operational variability. The composition of the magor components was well established although the composition of the minor constituents could not be as well established at this time. A tighter methodology has been developed and partially tested at NREL, and a second round robin is under way to improve the precision and accuracy of the data generated.
Other round robin activities have involved specific samples of wheat straw, a feedstock of particular interest to the European communities. C. Nielsen is the activity leader, and the participating countries are Austria, United Kingdom, Italy, Sweden, and Denmark. The goal is to coordinate the existing and developing R&D programs in energy from agricultural residues. The activity spans harvesting, handling, pretreatment, conversion processes, handling and removing ash, and the environmental impact of the overall use of agricultural residues. This task carried out two analytical round robins on straw and straw ashes. Six laboratories were involved. A very small, 3 kg sample of wheat straw was air dried, size reduced, and sieved. About 95% of the materials were >I25 microns and 88% of the material were made into 330 g samples forwarded to the six participating laboratories. No testing of sample homogeneity was made. Each laboratory volunteered their analytical methods and made a non-equal number of determinations for the various properties. Repeatability and reproducibility, within laboratory and between laboratories, cannot be easily assessed. Minor heavy metal components had content variabilities of 0.5 to 10 ppm from laboratory to laboratory.
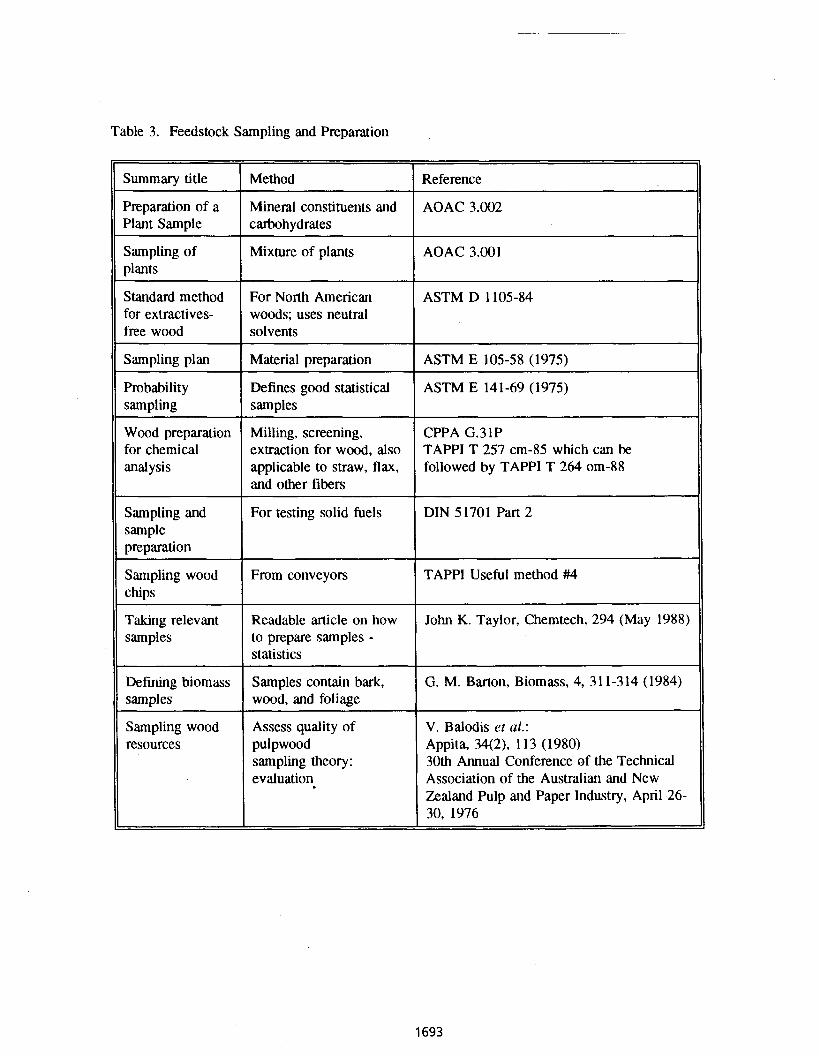
Table 3. Feedstock Sampling and Preparation
Summary title
Preparation of a Plant Sample
Sampling of plants
Standard method for extractives- free wood
Sampling plan
Probability sampling
Wood preparation for chemical analysis
Sampling and sample preparation
Sampling wood chips
Taking relevant samples
Defining biomass samples
Sampling wood resources
Method
Mineral constituents and carbohydrates
Mixture of plants
For North American woods; uses neutral solvents
Material preparation
Defines good statistical samples
Milling, screening, extraction for wood, also applicable to straw, flax, and other fibers
For testing solid fuels
From conveyors
Readable article on how to prepare samples - statistics
Samples contain bark, wood, and foliage
Assess quality of pulpwood sampling theory: evaluation
Reference
AOAC 3.002
AOAC 3.001
ASTM D 1 105-84
ASTM E 105-58 (1975)
ASTM E 141-69 (1975)
CPPA G.31P TAPPI T 257 cm-85 which can be followed by TAPPI T 264 om-88
DIN 51701 Part 2
TAPPI Useful method #4
John K. Taylor, Chemtech, 294 (May 1988)
G. M. Barton, Biomass, 4, 31 1-314 (1984)
V. Balodis et al.: Appita. 34(2), 1 1 3 (1980) 30th Annual Conference of the Technical Association of the Australian and New Zealand Pulp and Paper Industry, April 26- 30, 1976
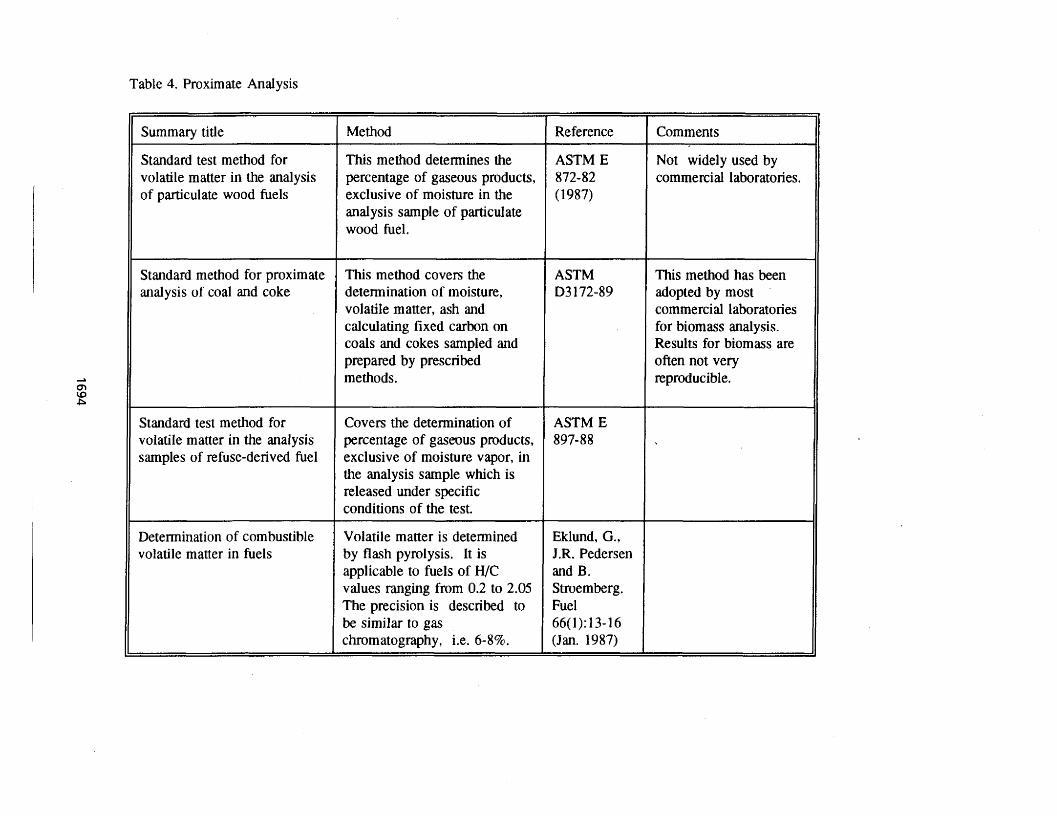
Table 4. Proximate Analysis
11 Summary title I Method ( Reference
11 Standard test method for I This method determines the ( ASTM E
Comments
volatile matter in the analysis of particulate wood fuels
Not widely used by 11 percentage of gaseous products, exclusive of moisture in the analysis sample of particulate
commercial laboratories.
Standard method for proximate analysis of coal and coke
This method covers the determination of moisture, volatile matter, ash and calculating fixed carbon on coals and cokes sampled and prepared by prescribed methods.
ASTM D3 172-89
This method has been adopted by most '
commercial laboratories for biomass analysis. Results for biomass are often not very reproducible.
Standard test method for volatile matter in the analysis samples of refuse-derived fuel
Determination of combustible volatile matter in fuels
Covers the determination of percentage of gaseous products, exclusive of moisture vapor, in the analysis sample which is released under specific conditions of the test.
Volatile matter is determined by flash pyrolysis. It is applicable to fuels of H/C values ranging from 0.2 to 2.05 The precision is described to be similar to gas chromatography, i.e. 6-8%.
Eklund, G., J.R. Pedersen and B. Stmemberg. Fuel 66(1): 13-1 6 (Jan. 1987)
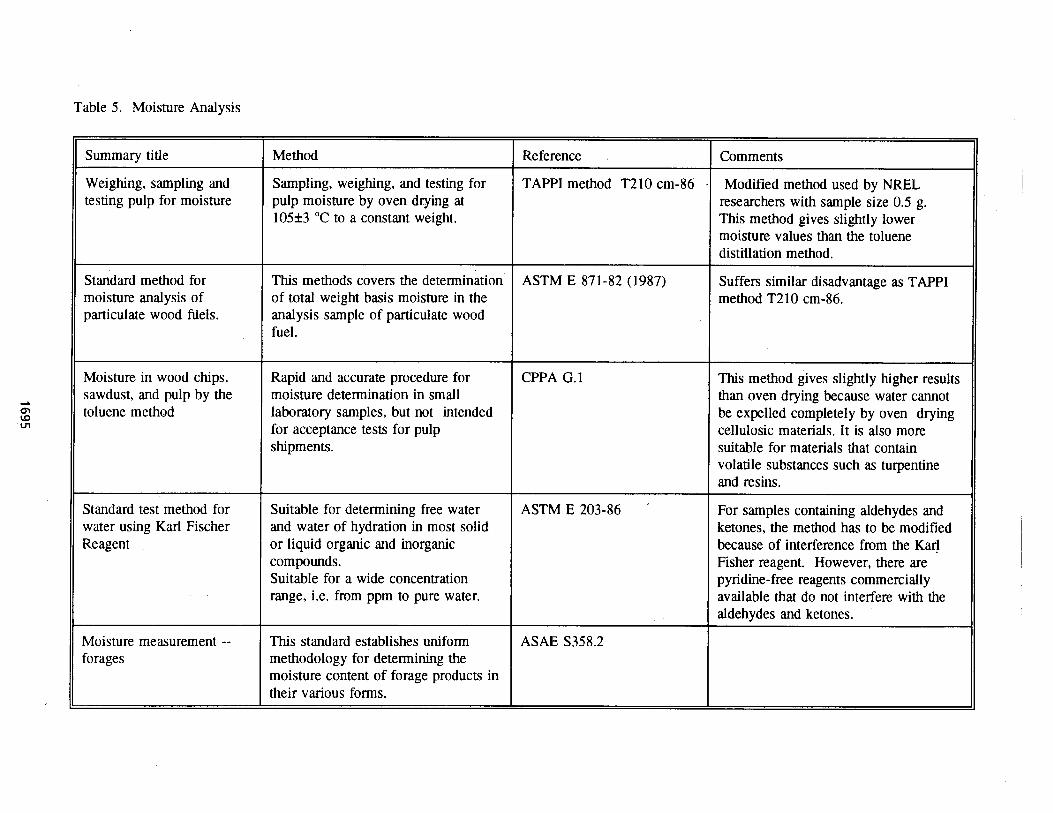
Table 5. Moisture Analysis
Summary title
Weighing, sampling and testing pulp for moisture
Standard method for moisture analysis of particulate wood ftiels.
Moisture in wood chips, sawdust, and pulp by the toluene method
Standard test method for water using Karl Fischer Reagent
Moisture measurement -- forages
Method
Sampling, weighing, and testing for pulp moisture by oven drying at 105f 3 "C to a constant weight.
This methods covers the determination of total weight basis moisture in the analysis sample of particulate wood fuel.
Rapid and accurate procedure for moisture determination in small laboratory samples, but not intended for acceptance tests for pulp shipments.
Suitable for determining free water and water of hydration in most solid or liquid organic and inorganic compounds. Suitable for a wide concentration range, i.e. from ppm to pure water.
This standard establishes uniform methodology for determining the moisture content of forage products in their various forms.
Reference
TAPPI method T210 cm-86
ASTM E 871-82 (1987)
CPPA G. 1
ASTM E 203-86
ASAE S358.2
Comments
Modified method used by NREL researchers with sample size 0.5 g. This method gives slightly lower moisture values than the toluene distillation method.
Suffers similar disadvantage as TAPPI method T210 cm-86.
This method gives slightly higher results than oven drying because water cannot be expelled completely by oven drying cellulosic materials. It is also more suitable for materials that contain volatile substances such as turpentine and resins.
For samples containing aldehydes and ketones, the method has to be modified because of interference from the Karl Fisher reagent. However, there are pyridine-free reagents commercially available that do not interfere with the aldehydes and ketones.
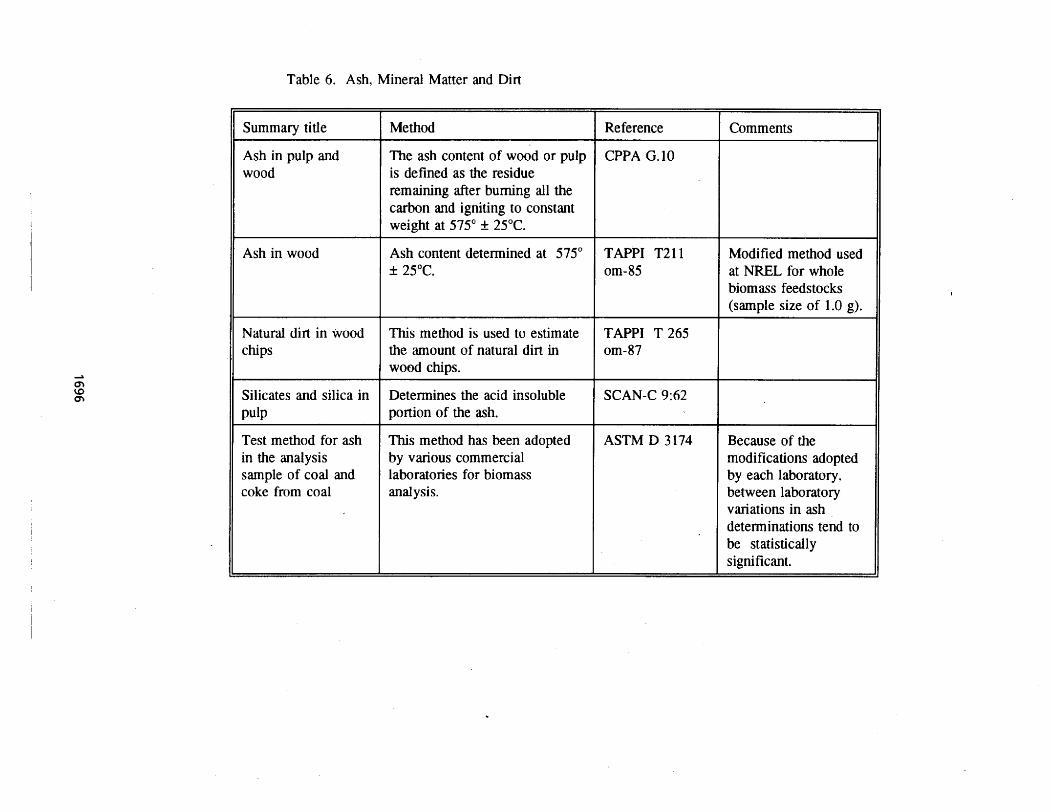
Table 6. Ash, Mineral Matter and Dirt
I
Summary title
Ash in pulp and wood
Ash in wood
Natural dirt in wood chips
Silicates and silica in P U ~ P
Test method for ash in the analysis sample of coal and coke from coal
Method
The ash content of wood or pulp is defined as the residue remaining after burning all the carbon and igniting to constant weight at 575" 4: 25°C.
Ash content determined at 575" f 25°C.
This method is used to estimate the amount of natural dirt in wood chips.
Determines the acid insoluble portion of the ash.
This method has been adopted by various commercial laboratories for biomass analysis.
Reference
CPPA G. 10
TAPPI T211 om-85
TAPPI T 265 om-87
SCAN-C 9162
ASTM D 3174
Comments
Modified method used at NREL for whole biomass feedstocks (sample size of 1.0 g).
Because of the modifications adopted by each laboratory, between laboratory variations in ash determinations tend to be statistically significant.
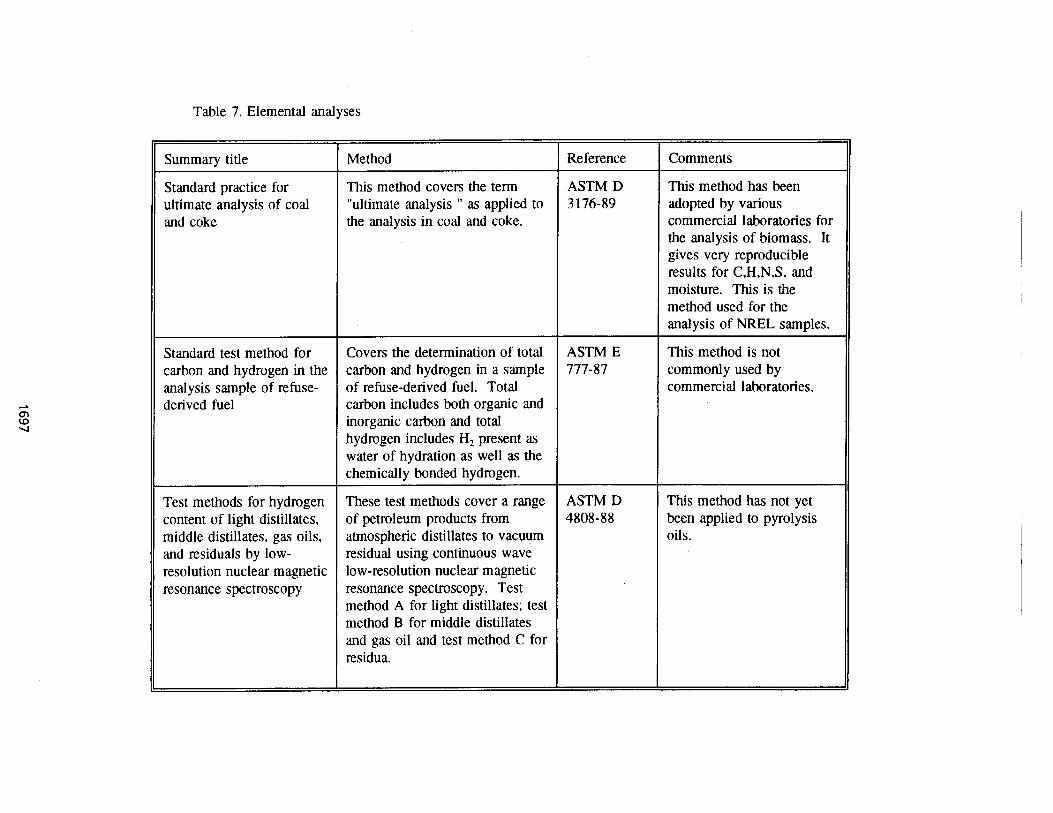
Table 7. Elemental analyses
Summary title
Standard practice for ultimate analysis of coal and coke
Standard test method for carbon and hydrogen in the analysis sample of refuse- derived fuel
Test methods for hydrogen content of light distillates, middle distillates, gas oils, and residuals by low- resolution nuclear magnetic resonance spectroscopy
Reference
ASTM D 3176-89
ASTM E 777-87
ASTM D 4808-88
Method
This method covers the term "ultimate analysis " as applied to the analysis in coal and coke.
Covers the determination of total carbon and hydrogen in a sample of refuse-derived fuel. Total carbon includes both organic and inorganic carbon and total hydrogen includes H, present as water of hydration as well as the chemically bonded hydrogen.
These test methods cover a range of petroleum products from atmospheric distillates to vacuum residual using continuous wave low-resolution nuclear magnetic resonance spectroscopy. Test method A for light distillates; test method B for middle distillates and gas oil and test method C for residua.
Comments
This method has been adopted by various commercial laboratories for the analysis of biomass. It gives very reproducible results for C,H,N,S, and moisture. This is the method used for the analysis of NREL samples.
This method is not commonly used by commercial laboratories.
This method has not yet been applied to pyrolysis oils.

Analytical ash results were also highly variable and probably reflect that the samples sent for analyses were not well homogenized. They also reflect the variability of the methods of analyses employed. Several methods were considered not very good for some analytical determinations. Because a standard material was not used at the time the experiments were carried out it was not possible to make better comparisons of different methodologies ( 12).
Role of Multivariate Analysis and Need for Fast Analytical Methods
Most of the analytical methods described are time consuming and difficult to implement for process control in conversion plants. In the past five years, significant progress has been made with fast spectroscopic techniques and multivariate analysis for controlling feedstock quality and for correlating feedstock with the properties of the resulting conversion products (such as pulp quality. digestibility or nutritional content, etc.). Significant advances have occurred in using near infrared spectroscopy where the quality of forage materials as a feed is being assessed commercially (13,14). Biomass for fuels, chemicals, and electricity needs to amve at similar situations where feedstock quality can be judged quickly to facilitate significant penetration of these technologies. Operating year round at 1000-2000 tons/day or more may require using multiple feedstocks from many different sites. If the quality of the feedstock from the different sites is not the same, then the process will have to be adjusted accordingly. Fast analytical methods will allow process control and feedback to the operation. Many different products may also be made at some point, emulating the corn processing industry in its capacity to produce various products from the feedstock. It is necessary to quickly analyze these feedstocks for characteristics that are critical to performing certain conversion processes. Also, correlations between feedstocks and the properties of the end products are essential. They may establish the value of the feedstocks, in a similar situation to the Brazilian sugar cane industry where the value of cane is not proportional to weight delivered but to the concentration of sugars in the cane delivered.
One example of a fast analytical technique is pyrolysis mass spectrometry coupied with multivariate analysis. This technique has been demonstrated for herbaceous biomass using pyrolysis coupled with molecular ,beam mass spectrometry (MBMS) (1 1,15). Although herbaceous species are complex biopolymers consisting of mostly carbohydrates and lignins and small quantities of nitrogenous compounds, when pyrolyzed between 500 and 600 "C, the pyrolysis mass spectra is approximately equivalent to the sum of the pyrolysis spectra of pentosans (C5 sugars), hexosans (C6 sugars), lignins, nitrogenous compounds (mostly proteins), and phenolic acid residues. Except for pentosans and hexosans where there is a significant overlaps of some peaks, the pyrolysis mass spectra of these biopolymers contain enough unique information that multivariate analysis techniques such as discriminant analysis and factor analysis can be used to analyze the biomass feedstocks. Both quantitative and qualitative analysis can be carried out on these feedstocks by the above multivariate statistical techniques. The methods are also sensitive enough to detect changes in the composition of the biomass feedstocks during storage.
When appropriately executed, multivariate analysis can be used to resolve pyrolysis spectra into chemical components (16). This provides two important items of information: the relative concentrations of various chemical components in the feedstocks or the absolute composition of the feedstock if suitable calibrations mixtures are available. Figures 1 and 2 illustrate these applications. In Figure I, the relative concentration of the total carbohydrates and nitrogen contents in different feedstocks are estimated from the factor scores of the resolved pyrolysis component spectra. Clearly the effect of weathering on the composition of each feedstock can be seen. This information can be used to modify the biomass processing parameters. In Figure 2, the quantitative application of multivariate analysis to biomass feedstock analysis is illustrated. In this case, the availability of suitable calibration standards has clearly demonstrated that multivariate analytical approach to biomass analysis can produce results with reproducibility comparable to conventional wet chemical analysis.

In conclusion, feedstock characterization has progressed significantly in the past ten years. However, additional work is needed to confirm the validity of the methods developed for coal/oil feedstocks and to develop better and faster spectroscopic methods of analyses. The IEA Round Robins have made significant progress for the components present in large amounts but not for the minor constituents. Therefore, a tighter method has to be tested, which NREL has begun to develop. The second round of round robins on the feedstocks should start in Summer 1993. However, there are only four standards that cover two types of wood, bagasse, and wheat straw. Standards for herbaceous samples such as switchgrass need to be prepared and analyzed. NREL has started to prepare the switchgrass standard in collaboration with NIST. Parties interested in participating in this analytical effort should write to the authors of the paper.
Acknowledgments
This work was sponsored by the U. S. Department of Energy through the following programs: Biofuels program (R. Moorer, R. Costello, and G. Santos-Leon), Biomass Power program (G. Burch, M. Reed, and S. Gronich), and through the IEA activities in Voluntary Standards.
References
R. Rowel1 in Polymersffom Biobased Materials, H. L. Chum editor, Noyes Data Corp., Park Ridge, N. J. (1991)
Johnson, D. A.; Maclean, D.H.; Chum, H. L. and Overend, R. P.; Ablative Fast Pyrolysis: Conversion of Wood and Agricultural Wastes and Crops into Energy and Chemicals, these proceedings.
Environmental Risk Ltd. and C. T. Donovan Assoc., Inc. Wood Products in the Waste Stream: Characterization and Combustion Emissions, New York State Energy Research and Development Authority Report 92-8 in two volumes prepared for the contract 153 1 -ERER-ER-9 1 (1992).
Dils, M. L. (ed) North American Fact Book of the Pulp and Paper Industry. Miller Freeman Inc., San Francisco, (199 1).
Chum, H. L.; Douglas, L. J.; Feinberg, D. A. and Schroeder, H. A.; Evaluation of Pretreatments of Biomass for the Enzymatic Hydrolysis of Cellulose, SERIPX 23 1-2 183 (1985)
U.S. Department of Energy. Electricity from Biomass: A Development Strategy. Report No. DOE/CH/10093-152, April 1992.
Moms, D. and Ahmed, I.; 1992. The Carbohydrate Economy: Making chemicals and Industrial Materials from Plant Matter. Institute for Local Self-Reliance, Washington, D.C. p.66.
Mortha, G.; Sarkanen, K. V.; and Gustafson, R.; Alkaline Pulping Kinetics of Short-rotation Intensively Cultured Hybrid Poplar, Tappi J., 75 (1 l), 99-104 (1993).
Milne, T. A.; Breman, A. H. and Glenn, B. H.; Sourcebook of Methods of Analysis for Biomass and Biomass Conversion Processes. Elsevier Applied Science, New York (1990).
Milne, T. A.; Chum, H. L., Agblevor, F, and Johnson, D. K.; Standardized Analytical Methods. Biomass and Bioenergy, 2 (1-6) 341-366 (1992)
Agblevor, F.A.; Chum, H. L. and Johnson, D. K.; (1992), Compositional Analysis of NIST Biomass Standards from the IEA Whole Feedstock Round Robin. Proceedings, Energy from Biomass and Wastes XVI, Orlando, FL, March 2-6, 1992.
IEA Round Robin Analysis of Straw and Straw Ashes, 1992.
Givens, D. I. and Baker, C. W.; Regions of Normalized NIR Difference Spectra Related to the Rumen Digestion of Cell Walls of Untreated and Sodium Hydroxide Treated Straws. In abstracts of the International Symposium on Forage Cell Wall Structure and Digestibility, 7-10 Oct., Madison WI, US Dairy Forage Center, Madison, WI, (1991).
USDA Agricultural Handbook No 643, Near Infrared Reflectance Spectroscopy (NIRS): Analysis of Forage Quality. U.S. Department of Agriculture Handbook 643, U.S. Government Printing Office, Washington D.C . (1989).
(15) Agblevor, F. A.; Rejai, B.; Wang, D.; Wiselogel, A.; Chum, H. L. and Keany, F.; Thermochemical Conversion of Biomass to Fuels and Chemicals: The Eflect of storage Conditions on Pyrolysis Products. In Proceedings of an Alternative Energy Conference: Liquid Fuels from Renewable Resources, 14- 15, December, J.S. Cundiff, editor, American Society of Agricultural Engineers, St. Joseph, MI, p.201 (1991).
(16) Windig, W.; McClennen. W. H. and Muezelaar, H. L. C.; Determination of Fractional Concentrations and Exact Component Spectra by Factor Analysis of Pyrolysis Mass Spectra of Mixture, J. Anal. Appl. Pyrol. 6, 233-250 (1984).
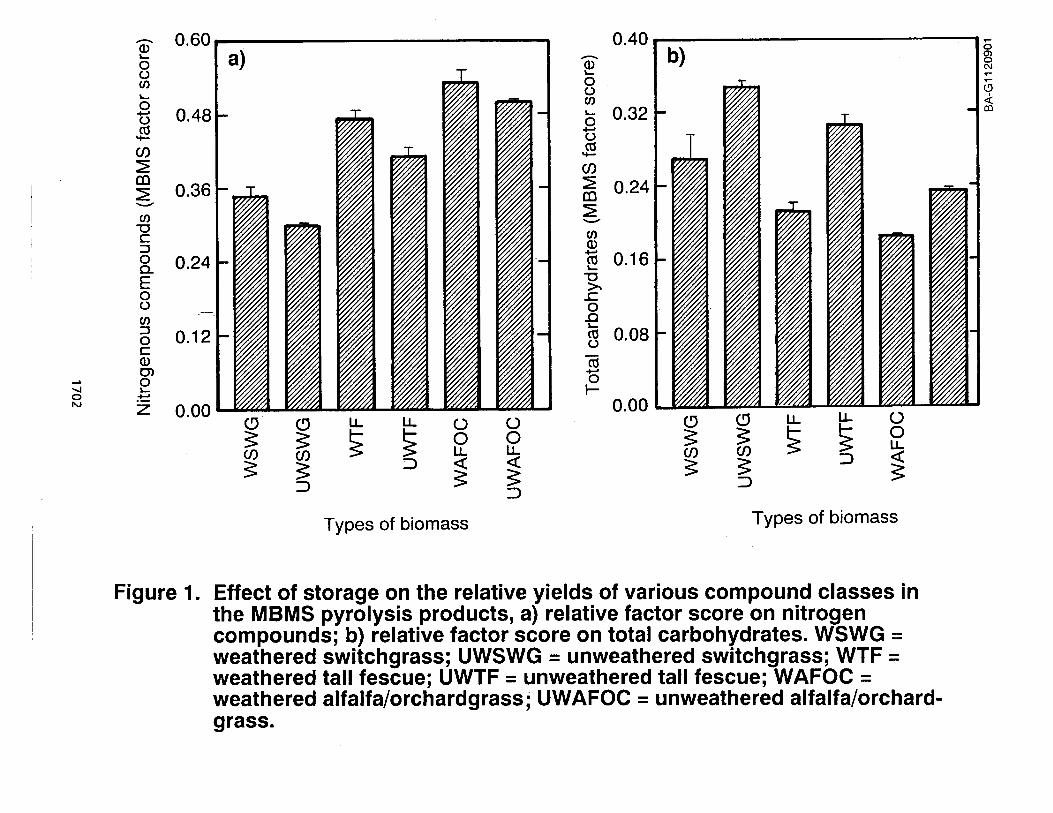
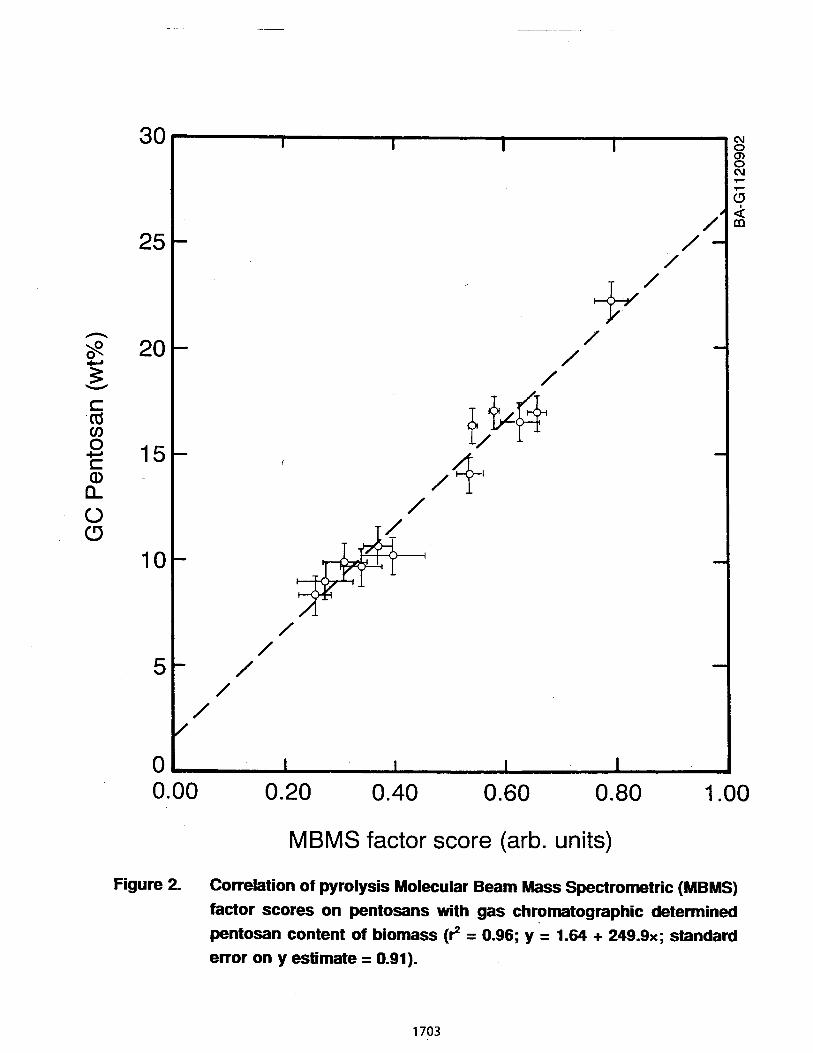
COMING ON STREAM: FINANCING BIOMASS AND ALTERNATIVE-FUEL PROJECTS IN THE 1990s
E. Bruce Mumford, Jr. Managing Director, Lease Capital Group
Continental Bank 231 South LaSalle Street
Chicago, IL 60697
Abstract
Biomass-energy and alternative-fuels projects make environmental sense, but do they make economic sense? In the current project-finance environment, moving ideas off the drawing board and transforming them into reality takes more than vision and commitment; it takes the abiiity to understand and address the financial markets' perception of risk.
This paper examines the state of the project-finance market, both as it pertains to biomass and alternative-fuels projects and in more general terms, focusing on what project sponsors and developers need to do to obtain both early-stage and construction/term financing, and the role a financial adviser can play in helping ensure access to funds at all stages.
Introduction
The 1990s have been accompanied by fundamental changes in the project-financing marketplace, when it comes to obtaining both early-stage financing and the construction and term financing needed to bring projects on-line. The pool of available risk capital has been reconfigured, as venture capitalists and other development-capital providers take a much closer look at real project risks and become much more selective. In general, they are much less willing to invest solely in "big ideas," however promising they may initially appear. Likewise, as a result of constrictions in the senior (bank) debt market, project sponsors looking for later-stage financing are being asked to invest more of their own equity or to raise third-party equity or subordinated debt to fund a greater percentage of a project's total cost.
These developments not only place a burden on smaller, undercapitalized sponsors looking to raise early-stage capital and 100 percent non-recourse term financing, but they also are forcing financially strong developers to examine the capital structure of projects more closely, particularly the level of their own equity participation. And they present all sponsors with new challenges in developing projects in ways that minimize overall financing risks and costs.
Clearly, the stakes are high. In a market in which projects are using new, costly, and often unproven technologies, careful front-end planning and financial structuring to minimize potential risks can mean millions of dollars in present-value savings to project sponsors, and often make the difference between projects that are successfully commercialized and those that fall by the wayside.
With respect to biomass project developers, the balance of the decade should provide some exciting opportunities. The Energy Policy Act of 1992 increased the visibility of "environmentally conscious" energy projects and provided for a wide variety of tax incentives to encourage development. The Clinton Administration also is striving to create a supportive environment for such projects.
What follows presents some of the central factors that biomass-project sponsors and other independent energy developers should consider both in obtaining early-stage financing and in developing an optimal term financing package.
Early-Stage Financing
Developing biomass power and alternative-fuel projects to the point that permanent financing can be arranged usually requires substantial capital, ranging from hundreds of thousands to millions of dollars. Given the perceived risks involved in getting these projects off the ground, early-stage financing almost always must be raised in the venture-capital or related risk-capital markets-from venture capitalists, investment banks, joint-venture development partners such as contractors or steam hosts who may benefit from the project, or government grants for technology development.
While payback periods and hurdle rates of return differ from investor to investor, in general, development-stage investors are looking to double or triple their money in a relatively short period, typically two-to-three years. What does it take for biomass and alternative-fuel project sponsors and developers to have a reasonable chance at raising funds in this market? In the current, risk-sensitive market, four factors are critical in attracting investment: a commercially viable technology, a reliable fuel source, appropriate siting, and dependable sales contracts for the project's output.
Commercially Viable Technology
The greatest issue facing many biomass and alternative-fuel project sponsors in raising early-stage financing is that they are dealing with unproven or less-well-known technologies. (From a venture capitalist's perspective, "unproven" doesn't mean technically untested, but simply that a given process or form of power production doesn't have a clear operating track record demonstrating the ability to produce power or other outputs at projected costs over time.) Many biomass and alternative-fuel technologies are only beginning to develop the operating histories that allow investors to realistically evaluate longer-range risks. As a result, projects that successfully attract development financing tend to be those that take steps to mitigate two types of risk: construction risk and operating risk.
In terms of construction risk, which is assessed case-by-case, the projects most likely to obtain early-stage financing are those with simpler designs and technical requirements, backed by financially strong contractors, both willing to provide performance guarantees and sureties and able to live up to them.
In terms of operating risk, the most attractive projects tend to be those based on technologies or processes with demonstrable efficiency levels and whose operating and management expenses can be forecast reasonably well. Here, biomass and alternative-fuel projects may be at something of a disadvantage compared with projects based on more traditional technologies, as a result of special operating considerations. Not only do these projects face certain issues involving fuel and waste handling, their expected life cycles also are uncertain due to obsolescence or changes in the law. For example, the implementation of an energy tax could have a profound effect on long-term project economics. Sponsors will need to demonstrate the likelihood of continued efficiency and cost control in what is shaping up as a more demanding operating environment in the 1990s.
Fuel Source
Another major factor in the investment decision is the proposed project's fuel supply arrangements. While these arrangements are generally assessed in terms of their impact on project margins and in conjunction with the facility's legal structure and other contract arrangements, development investors are likely to focus on the extent to which increases in fuel costs can be kept in line with output sales prices, either through contractual hedging or by passing cost increases along to purchasers.
These factors take on particular importance in light of some well-known project problems. Many biomass fuel sources-for example, wood-waste-may sound inexpensive and reliable at the outset, but rising demand and limits on supply can, as several facilities in California found, lend a commodity-like volatility to fueI prices. The lesson has not been lost on development investors, who now generally look for some sort of contractual hedge against fuel-price risk.
Siting
With siting, a host of permitting and environmental issues may come into play, which again are assessed case-by-case. Most communities recognize the broad social value of biomass and alternative-fuel projects, but these facilities still often involve volatile issues, ranging from the need for high-power tension lines to concerns over noise, odors, and other emissions, and even-as some wind-power sponsors have found-visual pollution. A project's siting and the likelihood of avoiding long and costly delays are evaluated very carefully by risk-capital providers and sponsors should conduct at least a Phase I audit to evaluate prior industrial use and review historic site issues. For .
example, at least one project has been delayed as a result of the discovery of historical Indian artifacts on the site.
Power or Output Sales Contracts
The stability of projected revenue streams is critical in obtaining early-stage financing, and this hinges on the structure of a project's power or output-sales contracts. While venture capitalists recognize that few sponsors will be able to afford to formally hedge selling prices in the futures market, most look for, and some insist, on a strong and dependable linkage between projected revenues and expenses. In general, the fewer conditions on terms, pricing, and plant availability that sales contracts contain and the more favorable the state regulatory environment, the better a project's prospects of obtaining early-stage financing. Furthermore, take-or-pay-style contracts with investment-grade buyers are the norm expected by project investors, who also require that the initial term of the sales contract be at least a year or two longer than the final maturity of the senior debt financing.
Business Plan Development
Given the difficulties in assessing the prospects for most biomass and alternative-fuel projects, project sponsors and developers should have developed a detailed business plan before approaching the market for financing.
The topics covered above should, of course, be discussed in detail. Two additional sections, however, are also critical:
The experience of the development~construction/operating team; and
Pro forma financial projections, including an assessment of construction and term-funding costs and the sensitivity of the project to reasonable worst-case changes in ouiput and fuel prices, as well as availability, performance degradation, and maintenance costs.
In developing the plan, it makes sense to involve an experienced financial adviser at the earliest possible stage. Involving a financial adviser alongside independent engineers, environmental consultants, and fuel supply consultants can be extremely useful in ensuring that the plan adequately reflects current investor requirements and concerns, as well as in tailoring the proposal to the needs of specific investors.
Just as important, many financial advisers-investment banks, merchant banks, and the investment banking arms of commercial banks-often are willing to step in to projects that appeal to them as investors, potentially providing a significant source of development financing themselves and certainly preparing the way for obtaining permanent financing.
ConstructionITerm Financing
Like the development-stage financing market, the permanent project finance market has changed in significant ways over the last few years.
The market for non-recourse project debt traditionally has been a bank market, with some participation from institutional investors. This has been particularly true for projects of $100 million or less, and to a large extent it remains so. Project finance, for the most part, has proven too complex to be financed efficiently in the public markets.
Banks, however, are operating under much tougher capital and regulatory constraints than they have in the past. In response to problems in other sectors of their loan portfolios (notably real estate and highly leveraged debt), many banks have been forced to reevaluate the resources they allocate to project finance. Some have pulled back from the market, and a few have pulled out altogether. The banks that remain committed to the market for the most part are taking a much closer look at project risks. As a result, sponsors are likely to face tougher pricing and terms than was previously the case. For example, banks are:
Seeking borrowing rates and front-end fees at least 100 basis points higher than they were two or three years ago
Requiring higher projected debt-service coverage ratios (typically a minimum of 1.5X)
Insisting on a substantial equity investment from the sponsor or other project participants (a minimum of 10-to-20 percent of total project costs)
Favoring sponsors with a proven track record and/or backed by investment-grade corporations and utilities with deep pockets
Shortening term periods from 12-to-1 5 years to five-to-seven years, often with a balloon payment obtained by refinancing at the agreed payout date
Paying more attention to both operating and management budgets and the financial strength and staying power of fuel providers
Syndicating loans in smaller pieces to many banks; club deals have, in most-case, replaced single-bank underwritings, driving more complex and costly negotiations
These developments have made life more difficult for sponsors, particularly those whose projects involve new or complex technologies. However, encouraging signs on the horizon suggest that conditions in the bank market may gradually ease.
Most important, bank profitability is improving as problem-loan levels subside, and many financial institutions are actively seeking to add high-quality, high-yielding assets to their portfolios. At the same time, the Clinton administration seems to have recognized the need for new bank lending and is encouraging a less constrictive regulatory and supervisory approach. As a result of these developments, many banks that had left the project-finance marketplace are returning, joined by new, nonbank institutions with different portfolio requirements, permitting the development of new structures for financing projects.
An additional positive for the project-finance market has been an increase in the number of sophisticated institutional investors willing to participate in senior-debt financing for projects. Such investors are willing to provide longer maturities compared to commercial banks, often in the range of 15-to-20 years or more. It is, therefore, not uncommon for commercial banks and institutional investors to team up, or form a club, in financing larger projects.
Another encouraging factor is the increasing development of the market for public offerings of project debt, specifically the 144a placement market, which allows sophisticated institutions to trade unregistered, essentially private debt in a quasi-public market. While these markets are still developing when it comes to project finance, over time they may provide sponsors with a significantly wider range of financing sources.
A caveat is in order here. Even projects with long operating histories are subject to unforeseen and unforeseeable risks; that's particularly true for biomass and alternative-fuel projects. When problems arise, a committed lender with a vested interest in a project's long-term performance may be more likely to be willing to put up the funds needed to fix them than an essentially passive investors, who tend to be concerned primarily with portfolio returns. Of course, banks also like to see knowledgeable equity investors involved in projects-investors with the willingness and ability to invest in fixing troubled projects. Reflecting that, unregulated utility subsidiaries can be good financing sources.
Finally, projects which provide for solid-waste disposal also qualify for tax-exempt financing. Power projects with non-traditional fuel sources (for example, wood by-products or agricultural waste) are able to issue tax-exempt bonds to cover project costs associated with the removal of solid waste. The definition of solid waste is fairly broad; "solids" may include sludges, and "waste" includes all materials for which there is no local market. Feedstocks, comprised of other materials or several components, may qualie for tax-exempt financing as long as 65 percent of the feedstock is considered "solid waste."
Equity and Subordinated Debt
As a result of those positives, project-finance terms and pricing may loosen somewhat in the near term. One factor in the senior debt market isn't likely to change anytime soon, however: the need for sponsors to invest more of their own equity or raise it from third parties. How can sponsors and developers assemble the optimal financing package?
In many cases, the answer boils down to balancing the advantages of equity against those of subordinated debt.
Equity
The cost of third-party project equity-sourced from unregulated utility subsidiaries, development companies, institutional investors, and investment funds-remains high relative to debt-financing in the current interest rate environment. After-tax returns for completed projects have, on balance, held firm in the low-to-mid teens, with projects involving development or construction risk commanding premiums.
Why have equity rates remained high? Three reasons are paramount:
Reduced supply. A number of institutions have curtai-led their project-finance investing as the weak economy has reduced both available cash and corporate earnings to shelter such investments. While traditional sources of third-party equity-suppliers, contractors, joint-venture partners-have been complemented by a broad range of institutional investors willing to consider project investments, the overall pool of equity allocated to project finance has been reduced.
Project riskpremiums. Many equity investors have experienced project problems, and the market's better insight into project risks has translated into substantial risk premiums.
Reduced tax benefirs. The reduction of many of the tax benefits associated with project ownership also has affected the cost of equity. The Tax Reform Act of 1986 phased out tax credits and lengthened depreciation schedules for many technologies. As a result, project sponsors have had to direct more of a project's cash flow to equity investors to meet their investment return requirements. In fact, pretax, cash-on-cash returns to equity investors have been in the 20 percent range for even the most standard projects.
While biomass projects and waste-to-energy, renewable-resource technologies are treated more favorably under the tax code, overall the elimination of tax credits and the extension of useful lives provide the most compelling economic reasons for sponsors to use more of their own equity, supplemented by subordinated debt, especially in projects based on conventional technologies. Still, third-party equity can provide an attractive financing source, if raised-from appropriate investors for certain kinds of projects. Such investments usually are structured as leveraged leases, in which the equity investor assumes ownership of the project for tax purposes, or as limited partnerships or general ownership investments, in which the investor acquires an interest in the project's cash flows and tax attributes.
Subordinated Debt
The market for subordinated debt has experienced significant growth over the past few years, stimulated in part by the shrinkage in the equity market. Subordinated debt is junior in claim on assets and cash flow to senior debt, and has limited rights of acceleration and foreclosure. Senior lenders have generally accepted a tranche of subordinated debt as a source of additional capital, which can benefit sponsors by reducing the required equity investment and possibly improving equity returns. It also enables the sponsor to retain more ownership and control and more fully participate in the residual upside of a project. Subordinated debt is versatile and can be used to finance a project's development, construction, cost over-runs, working capital, and partner loans. For the most robust projects with strong cash flow, sponsors have successfully arranged subordinated debt to completely replace equity in the capital structure.
Subordinated debt generally costs less than equity, but its pricing is a function of rights and risks-that is, the risks inherent in a project, the maturity of the loan, and the extent of the subordination. In general, the deeper the subordination-that is, the more closely the rights of debt holders approximate those of equity investors-the greater will be the cost and the higher the likelihood that the financing will include equity-like components such as contingent interest and residual sharing. On the other hand, more liberal covenants and provisions reduce the costs of subordinated debt.
Subordinated debt rates also tend to track closely with pretax equity rates in situations where the subordinated lender is asked to accept equity-level risks. For example, transactions in which the subordinated lender funds development expenses or irrevocably commits to fund its investment at a certain date, whether or not the project is successfully completed, usually are viewed as surrogates for equity and are priced accordingly.

The terms and conditions of subordinated debt are not standardized. Each transaction represents an opportunity to customize the debt agreement to suit all parties. However, subordinated debt generally is amortized no more rapidly than senior debt, unless the project's capital structure contains a significant layer of equity. The rate can be fixed or floating. If necessary, equity-like enhancements can be structured as additional payments out of free cash flow after payment of the base rate established for the issue. Such enhancements may continue beyond the term of the loan.
While subordinated debt can be raised from many sources, including project participants (contractors, vendors, partners, pension funds, insurance companies, financial institutions, and other institutional investors), senior lenders generally prefer to see equity as opposed to subordinated debt in a project's capital structure, for several reasons. Equity investors are viewed as "deeper pockets," more likely to invest the money necessary to fix a problem. As discussed previously, equity has fewer rights in the event of a foreclosure or restructuring of debt. This preference is likely to continue regardless of whether the senior debt is financed by commercial banks, by institutional investors, or in the public market.
The Role of Financial Advisers
In light of the foregoing considerations, it is clear that obtaining development financing and framing the optimal term financing structure won't be simple matters for any project sponsor in the years ahead. Since many biomass and alternative-fuel projects are based on newer technologies, sponsors will need to use special creativity in developing a financing mix that meets their long-range and short-term goals. Sorting through financing options and evaluating costs and risks won't be easy, and many will find it essential to engage a financial adviser for several reasons.
Most important, advisers understand the financial markets. Most have lived through several project-finance cycles, and know what techniques and structures are likely to appeal to investors under a given set of market conditions.
At the same time, advisers'structuring expertise can help sponsors access the widest range of financing markets and sort through their financing options. Advisers7 investor contacts likewise can make the financing more efficient; instead of wasting time and energy trying to attract investors, advisers can take deals to a carefully targeted group of investors whose portfolio requirements suit the sponsor's transaction. Finally, advisers can help sponsors build the long-term relationships with investors on which projects' success increasingly depends.
Given the current complexities of the project finance market, engaging a financial adviser can help sponsors ensure that their proposals and projects make economic as well as environmental sense.
TAX ISSUES AND INCENTIVES FOR BIOMASS PROJECTS
Keith Martin Chadbourne & Parke
1101 Vermont Avenue, N.W. Washington, D.C. 20005
Abstract
The federal government offers a number of tax incentives to developers of biomass projects.
This paper describes each tax benefit, explains what conditions must be met before the benefit is available, and offers practical insights gained from working for over 10 years in the field. Understanding what tax benefits are available is important because the more tax benefits a developer can qualify for in connection with his project, the less expensive the project will be to build and operate and the easier it will be to arrange financing because there will be higher returns in the project for potential investors.
Text
There are at least seven federal tax benefits for projects that use biomass as fuel. Each has its own peculiarities. Early in the development process, a developer should review this list, decide which benefits his project might qualify for, and be careful to structure the project in a manner that makes it eligible for as many as possible.
Unconventional Fuels Credit
If biomass can be converted to gas before using it as a fuel, then the project might qualify for a tax credit of 95.36 an mmBtu on the gas under section 29 of the Internal Revenue Code. This can be a very significant benefit, given that delivered prices for natural gas are currently in the range of $1.73 to $2.62 an mrnBtu depending on quality and location of the fuel.
The tax credit is claimed by the person producing the gas. He must sell the gas to an "unrelated person." This means that the equipment that produces the gas and the power plant or other facility that will use it must be owned by separate legal entities. The Internal Revenue Service has ruled that there can be up to 50% overlapping ownership. For example, in a private letter ruling in 1984, the agency ruled that a joint venture of four corporations formed to produce gas could sell the gas to the corporations that were partners in the joint venture and still qualify for the credit. The corporations were "unrelated" to the joint venture, since the interest of each in the joint venture was less than 50%.
The amount of the credit is adjusted each year for inflation. The figure 95.36 was the credit for gas produced during 1992. The IRS is not expected to announce the credit for gas produced this year until April 1994.
There are three important deadlines to meet. First, the facility that produces the gas must be placed in service by December 1996. "Placed in service" is a term of art meaning that the facility has been tested and shown capable of operating for its intended purpose, even if it is not actually in operation.
Second, the facility must be placed in service "pursuant to a binding written contract in effect" by December 1995. This means that it is important to sign a binding construction contract for the project before placing it in service. What's considered "binding" for tax purposes is a term of art. For example, a contract that limits liquidated damages by the project developer in the event of a default to less than 5% of the total contract price is not a binding contract. Similarly, a contract is not binding if material terms are left to the discretion of the developer. In the past when Congress has required a binding contract, it has
denied tax benefits to anyone who "substantially modifies" his contract before placing the project in service. (That's because the original contract that was his basis for tax relief no longer exists.) It is unclear whether such a rule will apply here. It would not make any sense, except for projects placed in service during 1996.
Third, assuming the other two deadlines are met, then gas produced at the facility will qualify for the credit through the year 2007.
One practical problem with the unconventional fuels credit is that it cannot be used to offset liability under the alternative minimum tax. Since many corporations pay "minimum" taxes today rather than regular income taxes, this can be a significant impediment to realizing on the value of the credit. The federal government has essentially two' different income tax systems for corporations. A corporation must calculate its regular income tax at a 34% rate and its alternative minimum tax at a 20% rate but using a broader tax base and pay essentially whichever amount is greater. The tax credit is only of limited value to a company on the alternative minimum tax. It can be carried forward and used once the company is back on regular taxes, but it cannot used in the meantime to reduce regular tax liability below the point where the minimum tax takes hold.
There have been many companies in the market in recent years interested in "selling" their section 29 tax credits, but relatively few buyers. In the last few years, efforts have been made to tap into individual investors by offering individuals the chance to invest in partnerships that own gas gathering systems at landfills, since individuals are less likely than the large corporations that have traditionally been a source of equity for projects to be minimum taxpayers. In the last year, at least two "royalty trusts" have also appeared on the market. These are grantor trusts in which indivuduals can invest. Each grantor trust is organized by a corporation that owns a portfolio of gas producing properties. The corporation retains the properties, but transfers the trust a right to receive royalties or a share of net profits from sales of gas. A number of tax issues are raised by the royalty trust structure, including whether the trust is entitled to any tax credit if it holds only a royalty interest in the gas.
Production Tax Credit
Taxpayers are allowed a tax credit of 1.5& a kilowatt hour for electricity generated from "closed-loop biomass" under section 45 of the Internal Revenue Code. This credit is available for 10 years starting when the power project is placed in service. However, the project must be in service by June 1999 to qualify.
"Closed-loop biomass" means plants that are grown "exclusively" for use as fuel in a power plant. Congress had in mind so-called electricity farms where plants are grown specifically to be burned as fuel. A Congressional committee report said when this tax credit was enacted,
"Accordingly, the credit is not available for use of waste materials (including, but not limited to, scrap, wood, manure, and municipal or agricultural waste) to generate electricity. Moreover, the credit is not available to a taxpayer who uses standing timber to produce electricity."
A number of special rules are worth noting. The credit is adjusted for inflation. It starts phasing out if the "reference price" for electricity ever exceeds 86 a kwh (also adjusted for inflation). The electricity must be sold to an unrelated party. The credit applies only to ele-ctricity generated in the United States or a U.S. possession, although there is apparently no restriction on its sale across the border.
The credit is reduced if the power project benefits from any government grants or tax-exempt financing -- even indirectly. An example of an indirect subsidy is a government program that rewards banks "for extending low-interest loans to taxpayers who purchase or construct qualifying facilities." Only subsidies paid by a government in the United States are taken into account. Thus, for example, export credits from Sweden or Germany on equipment purchased in those countries would apparently not reduce the 1.5& a kwh credit.
Congress may have inadvertently ruled out lease financing for projects that want to claim the credit. The statute makes it a condition for claiming the credit that the person producing and selling the electricity must also own the power plant.
Accelerated Depreciation
Equipment in a power plant or other facility that uses biomass or disposes of "wasteM may qualify for an unusually generous depreciation allowance.
Certain equipment in an electric generating plant that uses biomass £or fuel qualifies for depreciation over five years using the 200% declining-balance-method, provided the plant is a "qualifying small power production facility" within the meaning of the Public Utility Regulatory Policies Act. There may be a limit of 80 megawatts on sizePo£ the generating unit, depending on whether the fuel is classified as "biomass" or "waste" by the Federal Energy Regulatory Commission.
The following equip.ment qualifies: boilers, burners, pollution control equipment required by law to be installed, and equipment for "the unloading, transfer, storage, reclaiming from storage and preparation" at the place where the biomass will be used as fuel. This is basically all equipment up to the point where electricity is produced.
The ability to depreciate an asset over five years is a valuable benefit. Equipment in a power plant is normally depreciated over 15 or 20 years. Each dollar of. depreciation deductions spread over 20 years produces a tax savings of 136 in present-value terms, while the same dollar deducted over five years produces a tax savings of 25& -- almost twice as large. If the developer cannot use the tax benefits himself, he may be able to.transfer the tax benefits to another company that can use them in exchange for equity to help finance the project.
Be careful of two things. First, the power plant must burn biomass directly -- not a "synthetic fuel." A synthetic fuel is a fuel that differs significantly in chemical composition from the original biomass. Thus, biomass can be pelletized, dried, compacted or liquefied before it is used. However, a process that results in defiberization goes too far. Methane gas from a landfill is not biomass -- the raw garbage is. Thus, a power plant can burn garbage and qualify for 5-year depreciation, but not methane produced by decomposition. -
Second, be careful of any involvement in the project by a government or tax-exempt entity. If they are viewed as "using" the project, then the IRS will insist that depreciation be stretched out and claimed on a straight-line basis over anywhere from 10 to 28 years, depending on the type of equipment.
The fuel does not have to be entirely biomass. It is enough for biomass to be the "primary" fuel, meaning more than 50% of the fuel mix measured in terms of Btu content.
Equipment that does not qualify for depreciation over five years because the project is not a "qualifying small power production facility" may still qualify for 7-year, 200% declining-balance depreciation. This is available on
"assets used in the conversion of refuse or other solid waste or biomass to heat or to a solid, liquid, or gaseous fuel. Also includes all process plant equipment and structures at the site used to receive, handle, collect, and process refuse or other solid waste or biomass to a solid, liquid or gaseous fuel or to handle and burn refuse or other solid waste or biomass in a waterwall combustion system, oil or gas pyrolysis system, or refuse derived fuel system to create hot water, gas, steam and electricity. Includes material recovery and support assets used in refuse or solid refuse or solid waste receiving, collecting, handling, sorting, shredding, claSsifying, and separation systems. "
Tax-Exempt Financing
The federal government allows roads, schools, hospitals and other public facilities to be financed in the tax-exempt bond markets. However, private projects and government-owned facilities where there is more than 10% "private business use" are allowed into the tax-exempt bond markets for financing only in limited circumstances. An example of private business use is where a garbage-burning power plant is owned by a local government, but it is leased to a private company.
Assuming there is more than 10% private business use, most biomass projects will qualify for tax-exempt financing only if they fit into one of two categories:
- Two-county rule. A project can be financed in the tax-exempt bond markets if it supplies gas or electricity to an area no larger than two contiguous counties or one city and a contiguous county. (New York City is considered one city for this purpose, notwithstanding that it has five boroughs.) A common problem with power plants that burn waste wood, garbage, rice hulls or other forms of biomass is that they sell to a utility that serves too large a service territory. The IRS will look through the utility in such cases so that the project is disqualified. Also, many utilities are tied into regional gr'ids. If they sell more than a g& minimis amount of electricity into the regional grid, this is also grounds for disqualification.
- Solid waste disposal facility. Tax-exempt financing can be used for a project that disposes of "solid waste." "Solid waste" means "useless, unused, unwanted, or discarded solid material which has no market or other value at the place where it is located." The IRS has ruled privately that "culrn" -- a byproduct of anthracite coal mining -- is solid waste for this purpose so that a power plant using culm for fuel qualifies as a "solid waste disposal facility." A word of practical advice: anyone planning to claim his fuel is solid waste should be careful to structure contracts so that nothing is paid for the fuel. Money can be paid to the supplier to transport the fuel, but not for the fuel itself.
Only two parts of a project qualify for tax-exempt financing as a "solid waste disposal facility." One is the part up to where the first marketable product is produced. For example, consider a cogeneration facility where garbage is burned to produce steam. The steam is run through a steam turbine to generate electricity. Some of the steam is then sold to a local food processor and the rest is put into a condenser and returned to the boiler. Steam is the "first marketable product." Tax-exempt financing can be used for the equipment that converts the garbage to steam, but not for later equipment that generates electricity.
d
The other part is the equipment at the back end that disposes of ash and other solid pollutants. Some developers have argued that as much as 25% of the capital cost of their projects falls into this category.
There is a trade-off to using tax-exempt financing -- accelerated depreciation and certain tax credits must be forfeited. Equipment financed in the tax-exempt bond markets must be depreciated using the straight-line method over the "class life." This is 10 years for most biomass projects, although it may be as long as 28 years in some cases. The unconventional fuels credit and production tax credit are reduced to the extent the facility has been financed with tax-exempt bonds.
Each state is limited in the amount of tax-exempt bonds it can issue each year to finance private projects. The limit is $50 times the population or $150 million, whichever is greater. However, there is no volume cap for bonds issued to finance a solid waste disposal facility that a government will own. The facility can be leased to a private company for a term of up to 20 years or -- if longer -- 80% of the reasonably expected economic life of the facility. The private company cannot have an option to purchase the facility at a fixed price.
1.5& Cash Subsidy
The Energy Policy Act last fall authorized a program of "incentive payments" of 1.56 a kwh by the Department of Energy for power plants that use sunlight, wind, biomass or goethermal energy for fuel. However, Congress must still appropriate funds for the program before the Department of Energy has any nioney to spend.
(There is a two-step process in Congress to spending money. A program is first "authorized," as this one is in the Energy Policy Act. The next step is for Congress to "appropriate" money.)
The incentive payments will be subject to the following conditions if the program ever gets off the ground: The power plant must be owned by a state or local government or nonprofit electric coop. The payments can be made to the owner or the operator. A project qualifies for the payments only if it is "first usedw during the period October 1993 through September 2002. The electricity must be "for sale in, or affect[], interstate commerce." Once approved for a project, the incentive payments will continue'for 10 years.
Applicants should contact the Department of Energy. However, the Energy Policy Act merely "authorizesn money for this program and then only for the next three years. Unless Congress also "appropriates" money, the program will not get off the ground. Power plants that burn "municipal solid waste" are ineligible for the payments.
Investment Credit
It is still possible for some power plants that burn garbage to qualify for a 6.5% investment tax credit. Congress repealed the investment credit for most equipment in 1986. However, the credit remained available for another four years for inany power plants. A special "grandfather" rule in the Tax Reform Act of 1986 authorizes the credit for certain power projects that burn garbage collected from the general public -- with no deadline for placing the projects in service.
In order to qualify under this special rule, one of two things must have happened by March 1, 1986. A government or "service recipient" must have made a "financial commitment of at least $200,000 for the financing and construction" of the project. An example of a "service recipient" is a paper mill that will receive steam from the facility. Alternatively, the project must have a contract signed by that date to sell electricity or steam or to take in the garbage that will be used as fuel.
In a ruling in 1989, the IRS told a developer he could count toward the $200,000 that must have been incurred by March 1986 general spending by a municipaligy on studying, garbage disposal options. The IRS said it would count money spent on a general symposium a municipal agency held to gather information about feasbility of different garbage disposal technologies, public opinion polls to gauge local attitudes toward garbage disposal options, payments to a consultant who was hired to collect and evaluate bids from private companies that were interested in building projects, and money spent on a project that was later abandoned. The taxpayer represented that a significant amount of value from spending on the abandoned project carried over to the new project .
The IRS issued a similar private ruling in 1990 covering a project that was an outgrowth of a resource recovery task force that a county set up in the early 1980's to study
whether to build a refuse-to-energy facility, rather than continue to bury all its refuse in landfills. The county finally got around to collecting bids from private developers to build the refuse-to-energy facility in 1990.
Btu Tax
The Btu tax -- if enacted in the form it was being debated in Congress in early June -- would create an incentive to use biomass and other "renewables" as fuel. As proposed, a tax would be collected
- on gas at 26.76 an mcf at the point where the gas leaves the "pipeline." "PipelineN is defined broadly to include local distribution systems.
- Coal would be taxed at 26 .86 an mmBtu when the coal is received at a facility that will burn it as fuel.
- Refined petroleum products would be taxed at 616 an mmBtu -- with some significant exceptions -- and this tax would have to be paid by the refiner at the refinery tailgate or terminal rack.
However, if fuel is used in a ,power plant to generate electricity, it would be exempted from tax. Rather, the tax would be collected on the electricity when it is sold at retail to consumers. The House Ways and Means Committee debated whether to collect the tax on electricity at a uniform national rate times kilowatt hours or to make each utility collect a different amount in tax depending on its fuel mix. The House opted for the latter approach. The House bill would require each utility to monitor its fuel mix and adjust the amount it collects in tax from ratepayers per kwh once a month.
To the extent that biomass and other "renewables" are part of the fuel mix, this reduces the tax burden on ratepayers. These fuels are exempted from the Btu tax.
The House also exempted landfill gas from tax, but it adopted a complicated scheme for making this exemption work. The problem is that as much as a quarter of landfill gas is put into transmission pipelines where it gets mixed with gas from other sources and becomes impossible to distinguish at

other end where the gas is taxed ( i . e . , when it leaves the pipeline). Therefore, the House worked out a complicated scheme where any landfill gas producer putting his gas into a pipeline would be paid a "refund" equal to the tax that would be collected when the gas exits the pipeline, It is unclear whether the other three quarters of landfill gas that is not put into transmission pipelines would also receive refunds. That's because the bill leaves it to the IRS to decide whether "gathering systemsw are considered a "pipeline." Refunds will only be paid only on landfill gas that is put into a "pipeline."
THE ECONOMICS O F PRODUCING ENERGY CROPS
Hosein S hapouri James Duffield
U.S. Department of Agriculture, Office of Energy Washington, D.C. 20250
Abstract
The U.S. agricultural sector has an immense supply of natural resources which can be used to produce energy. Production of energy from these resources could stimulate economic growth, improve environmental quality, and enhance energy security. However, producing feedstocks and converting biomass to energy require large amounts of capital, equipment, labor, and processing facilities. This paper looks at the costs and benefits of producing energy crops for fuel conversion. A review of studies and crop data show that the cost of growing and converting various feedstocks with current technology is greater than the cost of producing conventional fuels. Conventional motor fuels have a price advantage over biofuels, but market prices don't always reflect the cost of negative externalities imposed on society. Government decisions to invest in alternative energy sources should be based on research that includes the environmental costs and benefits of energy production. The future of biofuels will depend on the continuation of government research and incentive programs. As new technologies advance, the costs of processing energy crops and residues will fall, making biofuels more competitive in energy markets.
Introduction
U.S. agriculture has traditionally been a multiple product sector, but in the 1940s it began to lose many of its nonfood markets to the emerging petrochemical industry. For example, the original nylon was made from corn cobs and it is now all petroleum based. Latex paints have replaced paints that were made with vegetable oils and synthetic fibers have gained major inroads in textile markets. This trend has been turning around in recent years due to government policies and technological developments which are helping agribusiness and farmers derive new products from agricultural raw materials. In the near future, U.S. agriculture could greatly expand its production capabilities and transform itself into a more diverse producer of food, fuels, medicines and industrial products.
Surpluses of basic food commodities in the past few decades has also encouraged interest in developing new uses for agricultural materials. In addition, increased competition from abroad is making it tougher for U.S. grains, soybeans and other crops to compete in global markets. Farmers are searching for better ways to utilize agricultural commodities. Simultaneously, policymakers and consumers are demanding products that will reduce our dependence on petroleum imports and find substitutes for products that are harmful to the environment.
Processing agricultural products into energy may be on the verge of becoming a promising new industry. Advances in conversion technology discovered in the past 10 years has markedly increased the economic feasibility of replacing gasoline and diesel fuel with biofuels made from corn and soybeans. Research is also underway to develop new technologies that will allow the use of celIu~osic material such as wood, grasses, and wastes to make alcohol fuels. The purpose of this paper is to; 1) look at agriculture's ability to produce energy feedstocks; 2) present energy production cost estimates for a number of selected crops and residues; and 3) discuss the benefits of investing in alternative energy sources.
Background
The interest in commercial alcohol fuel dates back to the early 1900s with the production of ethanol for transportation fuel. The modern ethanol industry, however, began with the oil embargo in 1973. Concern over the nation's dependency on foreign sources of energy and spiraling inflation driven by higher oil prices, initiated a search for more reliable domestic sources of energy. Ethanol production as an alternative supplement to gasoline gained public attention as a solution to the "energy crisis". Although interest in alternative fuels waned in the 1980s with lower gas prices, the domestic ethanol industry continued to grow at a moderate rate. Currently, about one billion gallons of ethanol is produced annually -- less than 1 percent of U.S. motor fuel consumption (U.S. Department of Energy, 1992).
Today's ethanol industry emerged from a combination of new conversion technologies and national policies related to energy, environment and agriculture. Ethanol and other biofuels have been supported through a mix of Federal and State incentives designed to narrow the competitive disadvantage of alternative fuel re!ative to conventional fuels. Legislation has established tax incentives and loan programs to develop and use domestically-produced biofuels in an effort to improve environmental quality, reduce dependence on foreign oil, and strengthen national security.
Recent policies related to energy use and alternative fuels include the Clean Air Act Amendment of 1990 (CAA) and the Energy Policy Act of 1992. The oxygen requirements mandated
by the CAA spurred a market for oxygenates and created new market opportunities for ethanol. The Oxygenated Fuels Program targets 39 cities that do not meet National Ambient Air Quality Standards for Carbon monoxide (CO). CAA mandates the addition of oxygen to gasoline to reduce CO emissions. Control periods vary by city because most CO violations occur during the winter season. The average control period is about 4 months. The most widely used oxygenate in the market today is methanolderived ether, MTBE which is made mostly from natural gas. However, the majority of major gasoline refiners are also using ethanol to meet gasoline oxygenate content requirements.
The Clean Air Act also requires the use of oxygenated fuels as part of the reformulated gasoline program for controlling ground-level ozone formation. Beginning in January 1995, reformulated gasolines are required to be sold in 9 ozone nonattainment areas. There are also provisions in the CAA that allow as many as 90 other cities with less severe ozone pollution to "opt- in" to the Reformulated Gasoline Program. Under a total opt-in scenario, as much as 70 percent of the Nation's gasoline could be reformulated. This program could provide a major stimulus to ethanol production as a component in reformulated gasoline. However, certification procedures for reformulated gasoline has not been completed and the ethanol's role in the program has not been fully determined.
The Energy Policy Act of 1992 was designed to improve energy efficiency, strengthen national energy security and reduce environmental degradation. It could have a profound effect on biofuel development through a series of regulations and incentive programs involving vehicle fleet standards, alternative fuels, energy conservation and tax credits. It ensures that the Federal government use alternative fueled vehicles (e.g., engines fueled with methanol, electricity, ethanol and other biofuels). The Federal fleet program begins in 1993 and by the year 2000, 75 percent of government vehicles will be capable of running on alternative fuels. A program was also established for the private sector, to promote the development and use of domestic replacement fuels in light duty motor vehicles. The goals of the program are to use at least 10 percent replacement fuels by the year 2000; and at least 30 percent by 2010. Section 2024 of the Act establishes a biofuels user facility to expedite industry adoption of biofuels technologies including production of alcohol fuels from biomass. It also establishes a program on the production and use of diesel fuels from vegetable oils or animal fats.
Agricultural policies and research are also playing a major role in biofuel development. The U.S. Department of Agriculture (USDA) is studying the effects of ethanol-blended gasoline on emissions and ethanol's potential role in the reformulated gasoline program. A biofuels program has been initiated to increase the use of biofuels made from domestic renewable farm and forestry resources. The program focuses on the energy efficiency of converting feedstocks into biofuels, economic feasibility, rural development opportunities and job creation.
The U.S. agricultural sector may be on the threshold of becoming an important energy producer. There are many opportunities for using agricultural resources to improve our current energy situation and increase economic opportunities. The emergence of new technologies and government polices are creating new uses and new markets for agricultural products. The income generated from the sale of energy feedstocks and production of biofuels could make the United States less dependent on energy imports, contribute to rural development and stimulate the domestic economy.
Feedstock and Conversion Costs
Biomass consists of vegetation, residues, and waste materials containing large amounts of organic matter. Input materials used in making energy are called feedstocks. Feedstocks can be burned in direct combustion for process heat, steam and electricity. They can be gasified for heat or
electricity, or processed into a biofuel such as ethanol and biodiesel. The primary sources of biomass for energy use are, agricultural crops and residues, forestry products and residues, animal products and wastes,, aquatic plants and municipal solid wastes. The energy stored in biomass may be converted to usable energy in several forms, including: 1) liquid fuels made from fermentation of starchy crops such as corn and wheat; 2) sugar crops such as sugarcane; 3) herbaceous crops such as switchgrass, sericae lespedeza and bermuda grass; 4) oil extracted from oilseeds and animal fat; and 5) short-rotation woody crops. In addition, agricultural residues can be used as a source of energy. Residues mainly consist of agricultural materials left in the fields after harvest such as corn stover, wheat straw, and tree prunings and thinnings. Wastes from agricultural processing are also used for energy production such as nut shells and sugarcane waste (bagasse). The largest biomass source used to produce energy is waste wood from logging operations and paper mills.
Presently the energy generated form biomass accounts for only about 2.8 quads or 3.5 percent of total U.S. energy production. About 2.7 quads are from wood feedstocks and ethanol (mostly from corn) provides about - 1 quads of energy. However, the United States has a vast supply of untapped renewable resources that some day may be economically feasible to convert into various forms of energy. There are a variety of energy crops produced annually in the United States in addition to native forest and grasslands. Availability of energy crops vary by regions due to differences in the climate and soil types (figure 1). Also, agricultural and forest residues with energy use potential are located throughout the country (figure 2).
Grains
Feed grains (e.g., corn, barley, and milo), and food grains (e.g., wheat and rice) can be used as feedstocks in ethanol production. The U.S. is the world's largest producer of grains, producing about 353 million tons in 1992. Grains are produced in almost every state, however corn is concentrated in the upper-midwest states like Iowa, Illinois, and Indiana. Major wheat producing states include Kansas, North Dakota, and Oklahoma. Among the grains, corn is by far the largest source of biofuel feedstock produced in the United States -- more than 95 percent of ethanol fuel produced is made from corn. Corn has several advantages over other grains. It is by far the dominant grain produced in the U.S. and farmers often produce annual surpluses (table 1). Corn yields have increased from 38.2 bushels in 1950 to about 130 bushels per acre in 1992. The corn refining industry has adopted the most advanced technologies to process corn starch into high fmctose corn syrup and ethanol (table 2). The coproducts of corn ethanol such as distillers dried grains (DDGS) corn gluten feed, corn gluten meal, and corn oil are high value by-products which reduces the net cost of aIcohol production (table 2).
In 1992, about 400 million bushels of corn were used to produce alcohol fuel -- accounting for less than 5 percent of total corn production for the 1987188 to 1992193 growing seasons. The two main processes by which alcohol fuel is processed from corn are wet and dry milling. Each process produces 2.5 to 2.6 gallons of ethanol from a bushel of corn. Wet millings accounts for 60 percent of the total fuel alcohol production in the United States. Dry-milling plants cost less to build but the value of coproducts is less (Hohmann and Redleman, 1993). Dry-milling produces about 17.5 pounds of distillers dried grains (DDGS) for every bushel of corn converted to ethanol. Wet milling produces about 2.65 pounds of corn gluten meal, 13.5 pounds of corn gluten feed, and 1.56 pounds of corn oil. DDGS, corn gluten feed, meal, and oil are substitutes for soybean meal and oil. These coproducts represent an important source of revenue for the ethanol industry, averaging over 50 percent of the cost of corn.
Costs of corn-ethanol production can be divided into 4 categories: feedstock cost, net feedstock cost, capital, and operating costs. Feedstock cost is the price ethanol producers must pay
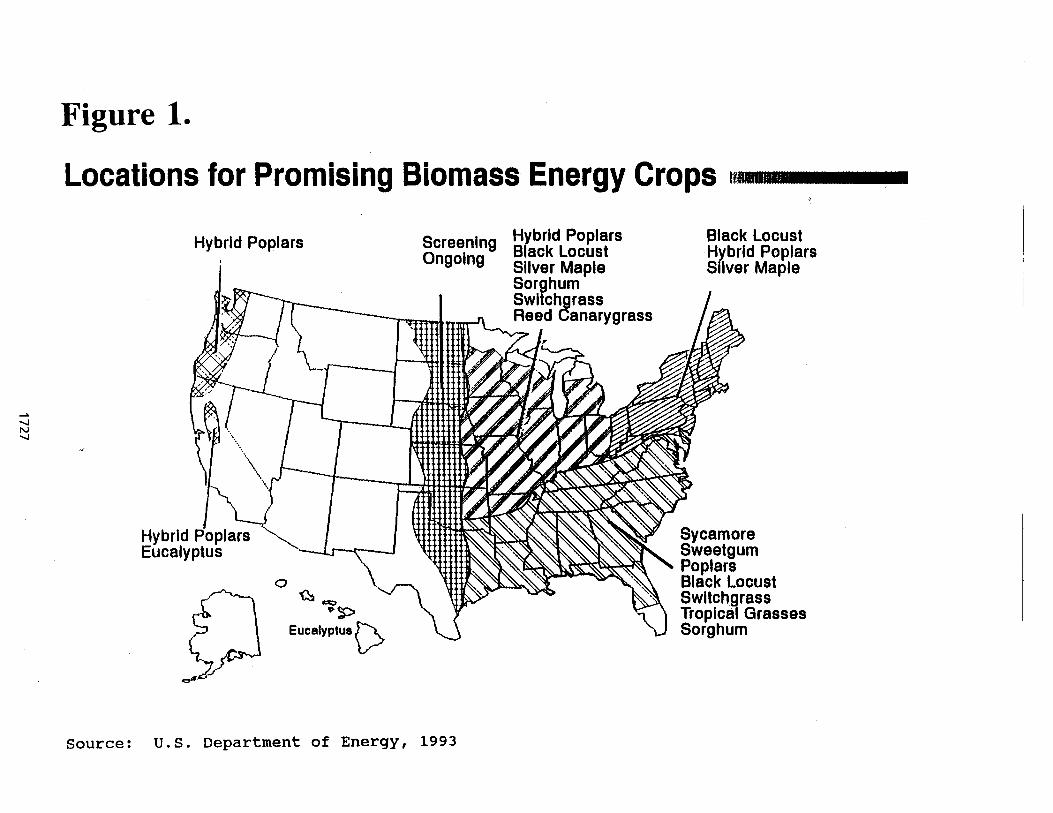
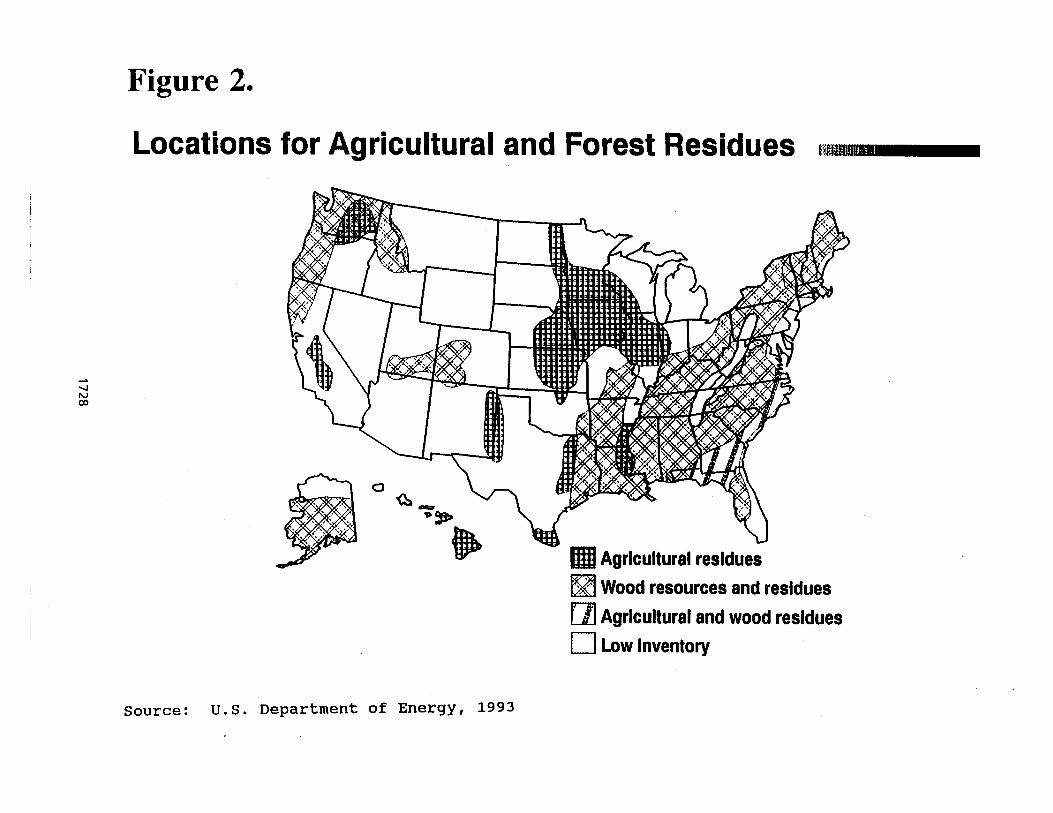
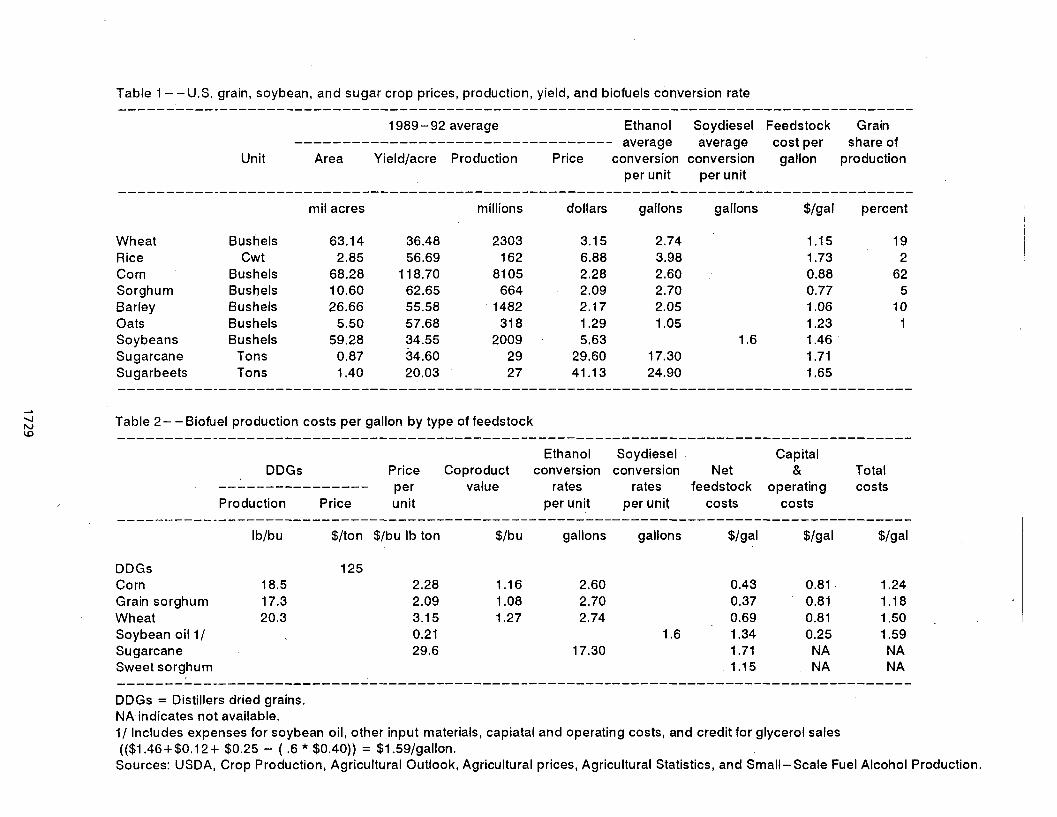
Table 1 - - U.S. grain, soybean, and sugar crop prices, production, yield, and biofuels conversion rate
1989 - 92 average Ethanol Soydiesel Feedstock Grain ---------------------------------- average average cost per share of
Unit Area Yield/acre Production Price conversion conversion gallon production per unit per unit
mil acres millions dollars gallons gallons $/gal percent
Wheat Rice Corn Sorghum Barley Oats Soybeans Sugarcane Sugarbeets -------
Bushels Cwt
Bushels Bushels Bushels Bushels Bushels
Tons Tons
-------
A
d N Table 2- -Biofuel production costs per gallon by type of feedstock cD -------------------------------------------------------------------------------------
Ethanol Soydiesel Capital DDGs Price Coproduct conversion conversion Net & Total
---------------- Per value rates rates feedstock operating costs Production Price unit per unit per unit costs costs
Ib/bu $/ton $/bu lb ton $/bu gallons gallons $/gal $/gal $/gal
DDGs 125 Corn 18.5 2.28 1.16 2.60 0.43 0.81 1.24 Grain sorghum 17.3 2.09 1.08 2.70 0.37 0.81 1.18 Wheat 20.3 3.1 5 1.27 2.74 0.69 0.81 1.50 Soybean oil I / 0.21 1.6 1.34 0.25 1.59 Sugarcane 29.6 17.30 1.71 NA N A Sweet sorghum 1.15 N A N A ------------------------------------------------------------------------------------- DDGs = Distillers dried grains. NA indicates not available. 1/ Includes expenses for soybean oil, other input materials, capiatal and operating costs, and credit for glycerol sales (($1.46+$0.12+ $0.25 - ( .6 * $0.40)) = $1.59/gallon. Sources: USDA, Crop Production, Agricultural Outlook, Agricultural prices, Agricultural Statistics, and Small-Scale Fuel Alcohol Production.
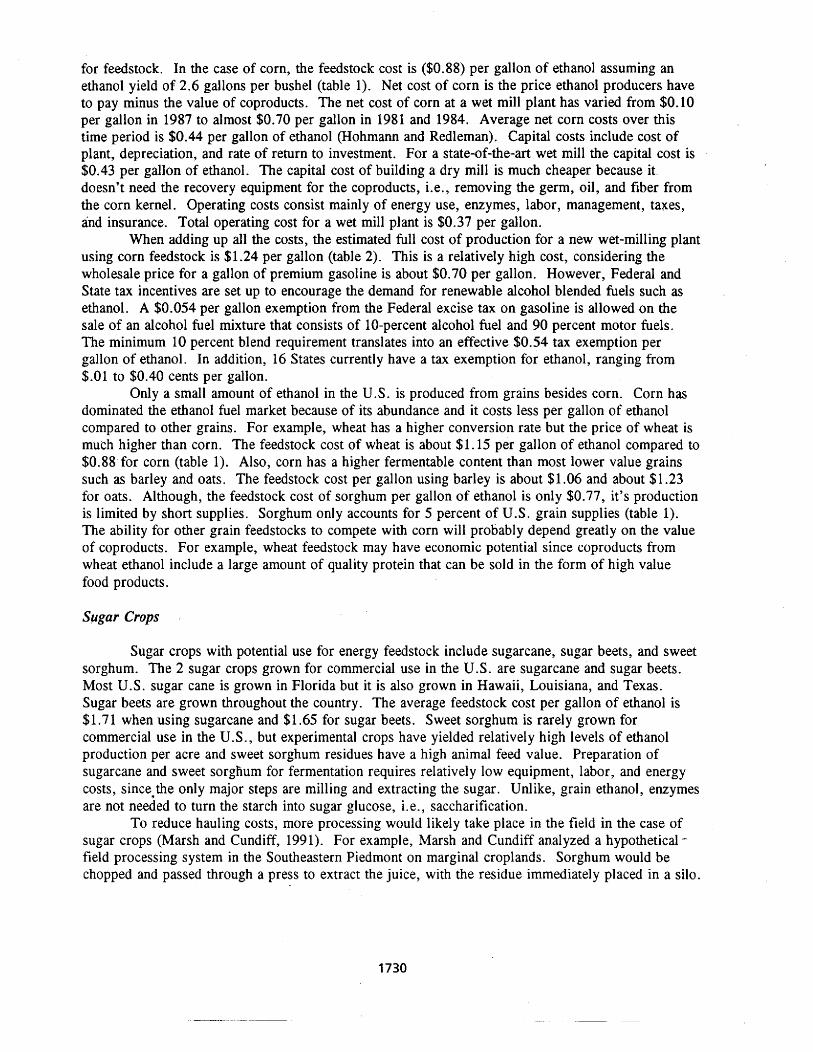
for feedstock. In the case of corn, the feedstock cost is ($0.88) per gallon of ethanol assuming an ethanol yield of 2.6 gallons per bushel (table 1). Net cost of corn is the price ethanol producers have to pay minus the value of coproducts. The net cost of corn at a wet mill plant has varied from $0.10 per gallon in 1987 to almost $0.70 per gallon in 1981 and 1984. Average net corn costs over this time period is $0.44 per gallon of ethanol (Hohmann and Redleman). Capital costs include cost of plant, depreciation, and rate of return to investment. For a state-of-the-art wet mill the capital cost is $0.43 per gallon of ethanol. The capital cost of buiIding a dry mill is much cheaper because it doesn't need the recovery equipment for the coproducts, i.e., removing the germ, oil, and fiber from the corn kernel. Operating costs consist mainly of energy use, enzymes, labor, management, taxes, and insurance. Total operating cost for a wet mill plant is $0.37 per gallon.
When adding up all the costs, the estimated full cost of production for a new wet-milling plant using corn feedstock is $1.24 per gallon (table 2). This is a relatively high cost, considering the wholesale price for a gallon of premium gasoline is about $0.70 per gallon. However, Federal and State tax incentives are set up to encourage the demand for renewable alcohol blended fuels such as ethanol. A $0.054 per gallon exemption from the Federal excise tax on gasoline is allowed on the sale of an alcohol fuel mixture that consists of 10-percent alcohol fuel and 90 percent motor fuels. The minimum 10 percent blend requirement translates into an effective $0.54 tax exemption per gallon of ethanol. In addition, 16 States currently have a tax exemption for ethanol, ranging from $.01 to $0.40 cents per gallon.
Only a small amount of ethanol in the U.S. is produced from grains besides corn. Corn has dominated the ethanol fuel market because of its abundance and it costs less per gallon of ethanol compared to other grains. For example, wheat has a higher conversion rate but the price of wheat is much higher than corn. The feedstock cost of wheat is about $1.15 per gallon of ethanol compared to $0.88 for corn (table 1). Also, corn has a higher fermentable content than most lower value grains such as barley and oats. The feedstock cost per gallon using barley is about $1.06 and about $1.23 for oats. Although, the feedstock cost of sorghum per gallon of ethanol is only $0.77, it's production is limited by short supplies. Sorghum only accounts for 5 percent of U.S. grain supplies (table 1). The ability for other grain feedstocks to compete with corn will probably depend greatly on the value of coproducts. For example, wheat feedstock may have economic potential since coproducts from wheat ethanol include a large amount of quality protein that can be sold in the form of high value food products.
Sugar Crops
Sugar crops with potential use for energy feedstock include sugarcane, sugar beets, and sweet sorghum. The 2 sugar crops grown for commercial use in the U.S. are sugarcane and sugar beets. Most U.S. sugar cane is grown in Florida but it is also grown in Hawaii, Louisiana, and Texas. Sugar beets are grown throughout the country. The average feedstock cost per gallon of ethanol is $1.71 when using sugarcane and $1.65 for sugar beets. Sweet sorghum is rarely grown for commercial use in the U.S., but experimental crops have yielded relatively high levels of ethanol production per acre and sweet sorghum residues have a high animal feed value. Preparation of sugarcane and sweet sorghum for fermentation requires relatively low equipment, labor, and energy costs, since,the only major steps are milling and extracting the sugar. Unlike, grain ethanol, enzymes are not needed to turn the starch into sugar glucose, i.e., saccharification.
To reduce hauling costs, more processing would likely take place in the field in the case of sugar crops (Marsh and Cundiff, 1991). For example, Marsh and Cundiff analyzed a hypothetical - field processing system in the Southeastern Piedmont on marginal croplands. Sorghum would be chopped and passed through a press to extract the juice, with the residue immediately placed in a silo.
, The juice would be transported by tanker truck to a centralized ethanol production plant and fermented directly or concentrated into syrup for storage. The total cost for this system (excluding fermentation cost), assuming silage and rind-leaf hay are sold for animal feed is $2.59 per gallon of ethanol. If silage and rind-leaf hay is sold for cellulose conversion to ethanol, the estimated total cost is $2.98 per gallon of ethanol. This compares to $2.50 per gallon of ethanol when using sugar cane as a feedstock and assuming current processing practices in Louisiana sugar mills with a zero value for sugar milling coproducts (Marsh and Cundiff).
Oilseeds and Animal Fats ,
The U.S. is one of the world's largest producers of oilseeds, specifically soybeans. About 2 billion bushels of soybeans are produced in the U.S. each year. Oilseeds are produced mainly for the production of vegetable oils used for cooking, and high protein meal for livestock feed. Vegetable oil and animal fat can also be used to make biodegradable engine oil, lubricants and a fuel substitute for diesel called biodiesel. Biodiesel can be produced from a wide variety of feedstocks including: soybean oil; the oil from minor oilseed crops such as rapeseed, sunflower, canola, and crambe; and waste vegetable oil, such as deep fat-frying oil (yellow grease). Animal fat, lard, tallow, and butter can also be converted to biodiesel. Biodiesels are made by removing glycerine from ~ i l or fats thorough a process called transesterification. Fuel grade esters from these fats and oils are made by adding alcohols like methanol and ethanol to the oil and reacting them with the aid of a catalyst.
Fueling engines directly with biodiesel and blending it with various mixtures of conventional diesel fuels is currently in the experimental stage. However, recent changes in Federal clean air policy has spurred interest in commercializing alternative fuels for use in areas that fail to meet national air quality standards. New regulations will restrict emissions from diesel vehicles such as urban buses, small utility engines, and large marine engines. These regulations may encourage engine manufacturers and equipment operations to convert to alternative fuels, such as biodiesel, that are cleaner burning than conventional diesel fuel.
Performance data on biofuels are limited but preliminary test results suggest that biodiesel have some environmentally related advantages over conventional diesel fuel. Biodiesel appears to reduce particulate emissions, volatile organic compounds (VOC), and sulfur without significantly reducing horsepower, gas mileage or engine durability. In addition carbon monoxide (CO) emissions from biodiesel are one-third the level of diesel fuel (Gavett and Van Dyne, 1992). Information on nitrogen oxide emissions is inconclusive at this time.
Currently biodiesels are not economically competitive with diesel fuels. For example, the feedstock cost of using soyoil to produce soydiesel varied between $0.15 per pound and $0.30 per pound from 1976 to 1992. Capital and operating costs range between $0.25 and $0.30 per gallon of soydiesel. And the coproduct value for glycerol has varied between $0.15 and $6.48 per gallon of soydiesel. Thus, the total cost of producing a gallon of soydiesel varies from $1.00 per gallon to over $2.00 per gallon. Future commercialization of biodiesels will depend on market placement and cost reduction. Potential users of soydiesel will likely come from companies and local governments that operate fleets of vehicles and are looking for economical alternative fuels to meet the new clean air standards.
Herbaceous Energy Crops 1
Herbaceous energy crops have more variety and greater versatility then many other energy crops. Some are annual crops with thick stems like sorghum and others are perennial with thin-stems like switchgrass. Depending on conditions, they can be either grown in mono-culture or inter-seeded
with more than one species in a stand. They can also be double-cropped with other energy crops or with conventional agricultural crops. Herbaceous energy crops include many of the grasses farmers use to feed livestock such as bahiagrass, berrnudagrass, eastern gamagrass, reed canarygrass, napiergrass, rye, sudangrass, switchgrass, tall fescue, timothy, and weeping lovegrass. Also included are legumes such as alfalfa, birdfoot trefoil, crownvetch, flatpea, clover, and sericae lespedeza.
A number of grasses and legumes are being evaluated for their potential as energy crops at a number of sites around the country. There are several advantages of using these crops for energy production. Management and production practices and the equipment needed to grow these crops are already part of the farmers' knowledge and capital base. Also, these crops can grow on marginal soils and still achieve moderate yields and protein levels. Fertilizer, energy, and water requirements are low, and year-round ground cover slows erosion. However, bulkiness, post harvest losses, and other intensive cultivation practices hamper the economic feasibility of producing these crops for energy.
Growing herbaceous crops for ethanol production is not economically justifiable at this time. With current technology, experimental data indicate that 1 ton of feedstock can be converted to about 60 gallons of ethanol. Feedstock costs for grasses and legumes range between $0.66 and $1 .SO per gallon (Bransby and Sladden, 1991; and English and Bhat, 1991). The capital and operating cost have been estimated at $1 -50 per gallon (Ackerson et al., 1391). Thus, the total cost for ethanol production using grasses and legumes would range between $2.16 to $3.00 per gallon.
Shod Rotation Woody Crops
Species of trees suitable for energy crops must produce large quantitih of wood in a short period of time with possibility of 1 to 2 coppicing after the first cut. Scientists call such species "short rotation woody species" because they are grown and harvested within 5 to 10 years. USDA and DOE are field testing several short rotation woody species, including hybrid poplar, black locust, eucalyptus, silver maple, sweetgum, and sycamore. Research projects are being conducted in many regions of the United States to develop trees that are adapted to specific locations. Experimental systems are yielding about 82 gallons of ethanol per ton of wood. The feedstock cost of wood ranges between $40 to $50 per ton. And estimates for capital and operating costs are about $1.50 per gallon.
There are a number of improvements that must be made before short rotation woody species become an economical source of energy: higher yield per acre, increase number of coppicings, increase resistance to insects and weeds, and better harvesting and handling techniques. In addition research is needed to address problems such as soil erosion, high production costs and long term capital investment in new machinery and equipment. Also-there are higher risks associated with the production of woody crops because of the start-up-time -- it takes 5-10 years before the crop is established and can be harvested.
Crop Residues
Millions of tons ofaenergy are stored in crop residues produced in the U.S. each year. They are byproducts of a variety of crops grown throughout the country and many can be collected with conventional harvesting equipment. Crop residues with a significant amount of energy are corn stover, wheat straw, stalks, sugarcane tops and leaves left in the field after harvesting. The major drawback of using residues for energy feedstock is their relatively low energy value per unit volume and the costs of handling bulky materials. For example, the energy content in corn stover is only about 12.5 percent of the energy found in a similar volume of wood (Keeney and DeLuca, 1992). To
reduce hauling costs, crop residues should be converted to liquid at the farm and than transported to an ethanol facility.
Another major concern with removing crop residues is that it exposes soil to wind and water erosion. If energy crops and crop residues are to be'renewable, minimum tillage and other conservation practices must be used to maintain sufficient soil cover. It is recommended that up to 1,000 pounds of crop residues per acre be left on the soil surface, in drder to provide a sufficient amount of erosion protection. This implies that a major portion of available residues should not be utilized for energy feedstocks.
Crop residues can produce energy through combustion or converted to ethanol. Crop residues ares composed mainly of cellulose. 'As with starch, cellulose must be broken down into sugar units before it can be used by yeast to make ethanol. The cost of collecting, transporting, storing residues varies by crop type, topography, labor availability and other inputs. Studies indicate that in some cases, residues can be collected and transported economically (Hall et al., 1993). For example, a study conducted in Thailand found that it costs about $43 per ton to collect and haul sugarcane residue to a nearby factory (Jakeway, 1991). However, converting liquefied cellulose into fermentable sugars is very expensive and commercial equipment that can economically produce ethanol from residues is not yet available.
Benefits of Alternative Fuels
Government incentive programs and research funds are paving the way for alternative fuels. These programs are contributing to technological advances that are raising conversion rates and economic efficiency levels of producing biofuels. Ideally, the efficiency of producing biofuels from corn and other agricultural feedstocks will reach a point where they can affectively compete in the energy market without subsidies. The issue is: will the benefits received from developing biofuels outweigh the costs?
Alternative fuels offer numerous benefits related to the environment, national security, and economic opportunity. One objective of the 1990 Clean Air Act Amendment and the Energy Policy Act is to encourage the use of alternative fuels to help reduce air pollution. When ethanol is blended with conventional gasoline auto emissions from CO are reduced. For example, when E-10 (10 percent ethanol and 90 percent gasoline) is used in place of conventional gasoline, emissions of CO are reduced by 15 to 25 percent. Switching to E-10 also reduces refinery emissions of potentially dangerous compounds such as benzene and butadiene. Biodiesels have the potential to reduce particulate emissions, VOC, CO, and sulfur. Biodiesel is also biodegradable and nontoxic.
The benefits derived from pollution abatement are hard to quantify because there are no market mechanisms to determine the price of clean air. In addition, since air is common property it has been treated as a free good. Until recently, individuals and businesses were not liable for polluting the air. Consequently, air pollution became a major problem in many parts of the country. Society pays the costs of air pollution in the form of health problems related to toxic air and environmental degradation. Economists refer to these costs as negative "externalities". They argue that firms that generate negative externalities should have to pay for the entire marginal cost they impose on society. When the price system fails to charge for resources, the government should impose taxes or use some other mechanism to internalize the costs of externalities. Society benefits from the Clean Air Act and other clean air regulations because they encourage people to use cleaner fuels and reduce the social costs of pollution by forcing firms to pay for their negative externalities.
Replacing oil imports with domestic energy sources could result in significant savings related to national defense. The more energy self sufficient the U.S. becomes the less military spending is needed to assure an uninterrupted supply of imported oil. In addition, substituting U.S. biofuel
production for imported fuel improves the balance of trade account. Increases of biofuel production by 1 billion gallons leads to about $1 billion improvement in the balance of trade account. The 1 billion gallons biofuel production could replace 52 million barrels of imported oil valued at $19 per barrel.
Developing alternative energy markets at home will stimulate the U.S. economy, particularly in rural areas where energy feedstocks are grown. Using land for energy crop production, collecting agricultural residues and transporting biomass feedstocks to conversion ,facilities will increase farm income and stimulate rural industries and employment. For example, increasing annual ethanol production by 4 billion gallons is estimated to create 139,000 jobs nationwide; 34,000 direct and indirect jobs from ethanol processing, 14,000 temporary jobs from construction, and 91,000 jobs from added agricultural production.
Creating alternative markets for farm products can raise farm prices and diminish the need for Federal farm assistance programs such as the Acreage Reduction Program (ARP). The ARP was adopted in the early 1970s as a supply control measure using target prices and set-aside rates. To receive the target price, farmers were required to set-aside a certain percentage of their farmland. The goals of the program were to control agricultural surpluses and provide income support for farmers. Increases in ethanol production decrease farm program costs by raising grain prices. For every 100-million-bushel (250 million gallons of ethanol) increase in corn demand raises the price of corn by $0.04 to $0.06 per bushel. And higher corn prices translate into farm commodity program savings -- every 1 cent increase in the price of corn reduces deficiency payment and saves taxpayers $50 million in program costs. Furthermore, fewer farmers would participate in the ARP,' reducing the number of acres idled by the set-aside requirements. About 19.7 million acres were included in the ARP in 1992193.
Developing biofuels could also have an effect on Federal payments to participants in the Conservation Reserve Program (CRP). The CRP was authorized by the 1985 farm act to remove highly erodible land from production. Producers are paid an annual rental payment plus half the cost of establishing a conserving land cover in exchange for retiring highly erodible or other environmentally sensitive land from crop production. Producers have voluntarily placed over 36 million acres in the program. Ninety three percent of CRP land is planted to grass or trees under 10 year contracts. CRP land covers 8 percent of U.S. crop land. Annual rental payments average $50 per acre, with and annual $1.8 billion dollar Federal government outlay (Osborn and Heimlich, 1993). Starting in 1993, the program was modified to let participants plant certain alternative perennial including walnut trees, shrubs, vines, and bushes. Nuts and foliage may be harvested only after the contract expires. Analysts have suggested that the program be modified further and allow producers to grow cover crops for energy production. With proper stewardship, renewable grasses and pastures could be produced for energy feedstocks without reducing environmental benefits. Revenue from harvesting crops on CRP land could be used to offset CRP rental rates and reduce the cost of the program. However, this option in still in the hypothetical stage and needs to be studied.
Summary and Conclusions
The U.S. agricultural sector has an immense supply of natural resources which can be used to produce energy. Production of energy from these resources could stimulate economic growth, improve environmental quality, and enhance energy security. However, producing feedstocks and converting biomass to energy require large amounts of capital, equipment, labor, and processing facilities. Corn-ethanol conversion rates are increasing with advances in technology, however it still costs more to produce corn ethanol than conventional fuels. And biofuels made from oil seeds,

herbaceous crops and other agricultural feedstocks are even further away from becoming economic alternatives. As a result, a very large share of agriculture's biomass resources remain unutilized.
The environmental benefits of producing biofuels relative to fossil fuels have not been adequately addressed. Conventional motor fuels have a price advantage over biofuels, but market prices don't always reflect the true cost to society. Government policies for developing alternative energy, sources should consider the environmental costs and benefits of biofuels compared to conventional fuels. The future of biofuels will depend on the continuation of government research and incentive programs. As new technologies advance, the costs of processing energy crops and residues will fall, making biofuels more competitive in energy markets. However, more research is needed to determine the economic feasibility of growing and marketing alternative energy feedstocks. The most productive and least cost feedstocks can be identified with farm budgeting tools and benefit- cost-analysis. And regional studies are needed to locate potential energy markets and coordinate energy production with energy use.
References
Ackerson, M., Clausen, E., and J. Gaddy. 1991. "Production of Ethanol From NSW Via Concentrated and Hydrolysis ofthe Lignocellulosic Fraction. " In Proceedings of the Energy from Biomass and Wastes XV, 1-1 1 . Hyatt Regency, Washington, D.C.
Bransby, D., and S. Sladden. 1991. ''A 5-year Status Report on the Screening of Herbaceous Energy Crops in the Southeastern United States." In Proceedings of the Energyfrom Biomass and Wastes XV, 1 - 1 1. Hyatt Regency, Washington, D. C.
English, B., and Mahadev Bhat. 199 1. "Economic and Environmental Aspects of Producing Selected Energy Crops." In Proceedings of the American Agricultural Economic Association Meeting. Manhattan, Kansas.
Gavett E., and D. Van Dyne. 1992. "The Economic Feasibility of Biodiesel." In Proceedings of l3e American Society of Agricultural Engineers. Charolette, North Carolina.
Hall, D., Rosillo-Calle, F., Williams, R., and Jeremy Woods. 1993. Renewable Energy, Sources for Fuels and Electricity. "Biomass for Energy: supply Prospects, 593-648. Washington, D.C.: Island Press. Editor, Laurie Burnham.
Hohmann, H., and C. Rendleman. 1993. Emerging Technologies in Ethanol Production, U. S . Department of Agriculture, Economic Research Service, AIB number 663.
Jakeway , L. 199 1. "Cane Energy Recovery. " In Proceedings of the International Conference on Energy from Cane. Winrock International, Arlington, Virginia.
Keeney, D., and T. DeLuca. 1992. '4~iomass as an Energy Source for the Midwestern U.S." American Journal of Alternative Agriculture, 7: 137- 144.
Marsh, L., and J . Cundiff. Forthcoming. 1991. "Sugar Canne/Sweet Sorghum as an Ethanol Feedstock in Louisiana and the Piedmont." In Proceedings of the Energyfrom Biomass and Wastes XV, 1-1 1. Hyatt Regency, Washington, D.C.
Osborn, C., and R. Heimlich. 1993. Expiration of Conservation Reserve Program Contracts, U.S. Department of Agriculture, Economic Research Service, AIB number 664-2.
U.S. Department of Agriculture. 1993. Crop Production, 1992 Summary. National Agricultural Statistics Service, Agricultural Statistics Board, Washington, D. C.
U.S. Department of Agriculture. 1993. Agricultural Outlook. AO-197, Economic Research Service.
U .S . Department of Agriculture. 1992. Agricultural Prices, 1991 Summary. National Agricultural Statistics Service, Agricultural Statistics Board, Washington, D.C.
U.S. Department of Agriculture. 1980. Small-Scale Fuel Alcohol Production. Washington D .C. Prepared with the assistance of Development Planning and Research Associates, Inc. Manhattan, Kansas 66502.
U.S. Department of Agriculture. 199 1. Agricultural Statistics, 1991. United States Government Printing Office, Washington, D. C.
U.S. Department of Energy. 1992. Monthly Energy Review. Energy Information Administration, EIA-0035.
U.S. Department of Energy. 1993. Electricity From Biomass, National Biomass Power Program, Five-year Plan, FY 1994-Fy 1998. Office of Solar Energy Conversion, Washington D.C.
INCOME TAX CREDITS AND INCENTIVES AVAILABLE FOR PRODUCING ENERGY FROM BIOMASS
Gregory A. Sanderson, LL.M., J.D., Attorney Gomel & Davis, Attorneys at Law
Atlanta, GA 30303 U.S.A.
Abstract
In the 1970's the U. S. became interested in the development of energy from biomass and other alternative sources. While this interest was stimulated primarily by the oil embargoes of the 1970ts, the need for environmentally friendly alternative fuels was also enhanced by the Clean Water Act and the Clean Air Act, two prominent pieces of environmental legislation. As a result, Congress created several tax benefits and subsidies for the production of energy from biomass. Congress enacted biomass energy incentives in 1978 with the creation of excise tax exemptions for alcohol fuels, in 1980 with the enactment of the IRC §29 nonconventional fuel credit provisions and the IRC §40 alcohol fuel credits, and recently with the addition of favorable biomass energy provisions as part of the Comprehensive National Energy policy Act of 1992. This article focuses on the following specific tax credits, tax benefits and subsidies for biomass energy:
(1) IRC §29 credit for producing gas from biomass, (2) IRC §45 credit for producing electricity from biomass, (3) Incentive payments for electricity produced from biomass, (4) Excise tax exemptions for alcohol fuels, (5) IRC § 4 0 alcohol fuels credits, and (6) IRC S179A special deduction for alcohol fuels property.
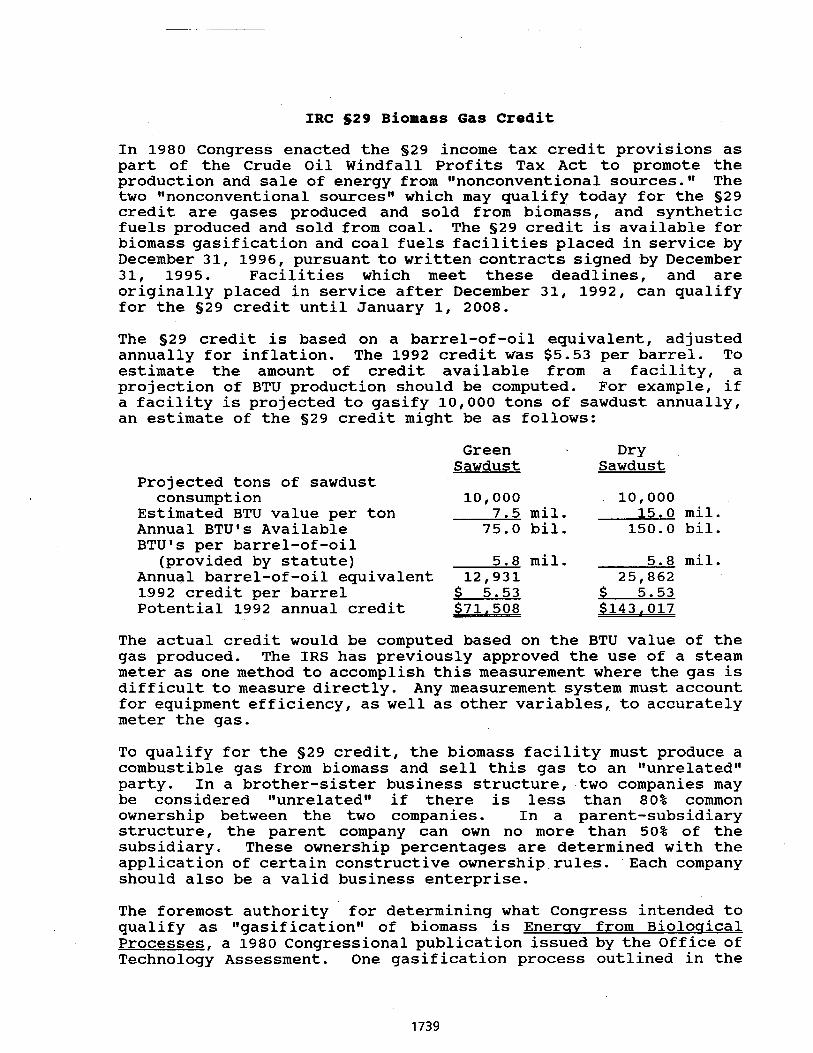
IRC 529 Biomass Gas Credit
In 1980 Congress enacted the §29 income tax credit provisions as part of the Crude Oil Windfall Profits Tax Act to promote the production and sale of energy from unonconventional sources.gg The two "nonconventional sourcesM which may qualify today for the S29 credit are gases produced and sold from biomass, and synthetic fuels produced and sold from coal. The §29 credit is available for biomass gasification and coal fuels facilities placed in service by December 31, 1996, pursuant to written contracts signed by December 31, 1995. Facilities which meet these deadlines, and are originally placed in service after December 31, 1992, can qualify for the §29 credit until January 1, 2008.
The S29 credit is based on a barrel-of-oil equivalent, adjusted annually for inflation. The 1992 credit was $5.53 per barrel. To estimate the amount of credit available from a facility, a projection of BTU production should be computed. For example, if a facility is projected to gasify 10,000 tons of sawdust annually, an estimate of the S29 credit might be as follows:
Projected tons of sawdust consumption
Estimated BTU value per ton Annual BTUgs Available BTUgs per barrel-of-oil
(provided by statute) Annual barrel-of-oil equivalent 1992 credit per barrel Potential 1992 annual credit
Green Sawdust
10,000 7.5 mil. 75.0 bil.
5.8 mil. 12,931
$ 5.53 $71,508
Dry Sawdust
10,000 15.0 mil. 150.0 bil.
5.8 mil. 25,862
$ 5.53 $143,017
The actual credit would be computed based on the BTU value of the gas produced. The IRS has previously approved the use of a steam meter as one method to accomplish this measurement where the gas is difficult to measure directly. Any measurement system must account for equipment efficiency, as well as other variables, to accurately meter the gas.
To qualify for the §29 credit, the biomass facility must produce a combustible gas from biomass and sell this gas to an ggunrelatedw party. In a brother-sister business structure, two companies may be considered "unrelatedM if there is less than 80% common ownership between the two companies. In a parent-subsidiary structure, the parent company can own no more than 50% of the subsidiary. These ownership percentages are determined with the application of certain constructive ownership rules. Each company should also be a valid business enterprise.
The foremost authority for determining what Congress intended to qualify as "gasificationIg of biomass is Enerav from Biolosical Processes, a 1980 Congressional publication issued by the Office of Technology Assessment. One gasification process outlined in the

publica for the process partial
tion, and subsequently approved in IRS rulings as qualifying credit, is essentially a two-staged gasification/combustion . In the first stage, biomass feedstock is cooked, or ly burned, in a chamber with an oxygen level which is too
low for complete combustion to occur. As a result, combustible gases are derived from the biomass. In the second sfage, these gases are withdrawn into a second chamber, or combustion area, where a separate source of oxygen is, blended with the gases and where complete combustion of the blend occurs. When properly structured, this process may qualify where gasifier units are close-coupled, or directly connected, to boilers or furnaces for immediate gas consumption. Other technologies which may qualify include landfill gas facilities and lagoon digesters that produce methane from agricultural wastes or other biomass.
The S29 credit is phased-out when oil prices exceed a certain level, which is adjusted annually for inflation. The 1992 credit would have begun to phase-out if oil prices had exceeded $43.31 per barrel. The credit is reduced by the amount of grants or subsidized financing used to fund a particular project, and is coordinated with certain other tax credits to prevent double usage of credits. The S29 credit, however+ is not part of the general business credit of IRC 538, and, therefore, is not subject to the general business credit limitations.
The 529 credit will not offset alternative minimum tax, and will offset regular tax liability only to the extent it exceeds tentative minimum tax. Any unused credit in a particular year may not be carried backward or forward to any other year, unless the credit is not used due to a n alternative minimum tax limitation, in which case the disallowed portion will increase the minimum tax credit carryover.
IRC s45 ~lectricity From'Biomass Credit
The comprehensive National Energy Policy Act of 1992 added an income tax credit under IRC § 4 5 for production of electricity from certain wind and biomass facilities. Under this new S45 , a credit of 1.5 cents is allowed for each kilowatt hour of electricity produced from wind or vvclosed-loopvf biomass facilities if the electricity is sold to an vvunrelatedvu party. MClosed-loopu biomass is defined as any organic material derived from a plant which is planted for the exclusive purpose of being used to produce electricity. The ~ongressional Committee Reports state that this credit will not be available for electricity produced from scrap wood and agricultural waste, or from standing timber. The definition of an "unrelated" party for purposes of S 4 5 is the same as that for IRC §29. The credit is phased-out as the national average price of electricity exceeds a threshold price range of 8 cents to 11 cents per kilowatt hour. Both the 1.5 cent credit amount and this phase-out range will be adjusted annually for inflation.
The S45 electricity production credit may generally be carried forward 15 years and backward three years. However, the
electricity credit may not be carried back to a taxable year ending before January 1, 1993 for biomass facilities, and before January 1, 1994 for wind facilities. Similar to the IRC S29 credit, the electricity credit is coordinated with certain other credits to prevent double usage, and is reduced by grants or subsidized financing used to finance a project. The S45 credit is part of the IRC S38 general business credit, and, as such, is limited to tax liability reduced by the greater of either (1) tentative minimum tax, or (2) 25% of tax liability in excess of $25,000 (after reduction for certain other credits). The S45 credit applies to kilowatt hours produced by a biomass facility placed in service after December 31, 1992 and before July 1, 1999, and to electricity produced by a wind facility placed in service after December 31, 1993 and before July 1, 1999.
Electricity Pro \ uction Incentive In addition to the IRC S45 electricity credit, the 1992 Energy Act also added an incentive payment provision under 42 U.S.C. 1331, entitled "Renewable Energy Production IncentivetW for electricity generated and sold from solar, wind, biomass or geothermal energy. This electricity incentive amount is 1.5 cents per kilowatt hour, adjusted annually for inflation, and is available to states, political subdivisions (e.g., agencies, authorities, etc.), any corporation or association which is wholly owned (directly or indirectly) by states or political subdivisions, and to nonprofit electrical cooperatives. Payments may be received by making application to the Secretary of Energy. Unlike the IRC §45 credit, the electricity production incentive appears to be available for all forms of biomass, except that burning municipal solid waste and producing energy from certain dry steam geothermal reservoirs will not qualify.
The incentive is scheduled to expire at the end of the 20 fiscal year period beginning after October 24, 1992. To qualify the facility must be first used during the 10 fiscal year period beginning after October 24, 1992, and a facility may not receive payments for more than 10 fiscal years, beginning with the first year in which the electricity from the facility is first eligible for the payments. Appropriations to fund these incentive payments were authorized by the statute for 1993, 1994 and 1995.
Excise Tax Exemptions for Alcohol Fuels
Several tax incentives exist in the Internal Revenue Code for alcohol fuels. Perhaps the most important alcohol fuels incentive, however, is the exemption of methanol and ethanol fuel blends from excise taxes levied on gasoline, diesel and aviation fuels under IRC SS4041, 4081 and 4091. The tax exemptions are generally equal to 5.4 cents per gallon of fuel, and apply when the fuel mixtures consist of at least 10% qualifying alcohol. The exemption amount may exceed 5.4 cents per gallon where a fuel contains at least 85% alcohol.
The 1992 Energy Act extended the scope of the exemption for gasoline to mixtures containing 7.7% qualifying alcohol, and to mixtures containing 5.7% qualifying alcohol. The exemption amount in these cases is reduced to 4.16 cents per gallon and to 3.08 cents per gallon, respectively.
Alcohol may generally qualify if it is methanal or ethanol, which is not produced from petroleum, natural gas, or coal (including peat), and is at least 190 proof (determined without regard to any added denaturants). These exemptions are available until September 30, 2000.
IRC 540 ~lcohol Fuels credits
In addition to the excise tax exemptions for alcohol fuels, three types of alcohol fuel income tax credits exist under IRC S40. These credits are (1) the alcohol mixture credit, (2) the alcohol production credit, and (3) the small ethanol producer credit. Whereas, the small ethanol producer credit applies only to ethanol, either ethanol or methanol may qualify for the alcohol mixture credit and the alcohol production credit, as long as the ethanol or methanol is not produced from petroleum, natural gas, or coal (including peat).
These 540 alcohol credits are cumulative, meaning that a taxpayer may qualify for one, two or all three credits in any given year. The §40 credits are simply added together on IRS Form 6478 and r.eported as a single "credit for alcohol used as a fuelt1 on IRS Form 3800.
The first 540 credit, contained in 540 (a) (1) , is for the mixture of alcohol fuels. The amount of the alcohol mixture credit is generally 60 cents per gallon for alcohol which is at least 190 proof, and 45 cents per gallon for alcohol which is of a proof ranging between 150 to 190. In the case of ethanol, however, the alcohol mixture credit is reduced to 54 cents for 190 proof ethanol, and to 40 cents for ethanol of a proof between 150 and 190. To qualify there must be a mixture of alcohol and gasoline (or any other liquid fuel which is suitable for use in an internal combustion engine), and the mixture must be either sold for use as a fuel or used as a fuel by the person producing the mixture. Additionally, the credit is not allowed unless the sale or use of the mixture is in connection with a trade or business.
The second S 4 0 alcohol credit is found in §40(a) (2), and is available for the actual production of alcohol. The amount of credit allowed for alcohol production is identical to that allowed for alcohol mixture. The alcohol production credit is granted for each gallon of alcohol produced, which is not mixed with gasoline or other fuels (other than denaturants), and which is either used in the producerls business, or sold by the producer at retail and placed in a fuel tank of the retail purchaser.
The third §40 alcohol credit exists under §40(a) ( 3 ) , and is available only for small ethanol producers. The credit amount is
10 cents per gallon for up to 15 million gallons of ethanol produced per year by a "small producer. @I A small ethanol producer is a producer with an alcohol production capacity which does not exceed 30 million gallons per year.
As in the case of the IRC S45 electricity credit, the $40 alcohol credits are subject to the general business credit limitations. Pursuant to the general business creditprovisions, the $40 alcohol credits may be carried backward for three taxable years, and would be eligible for a 15 year carryforward, except that the $40 credits are scheduled to expire on December 31, 2000 and may not be carried forward beyond three taxable years following expiration. Additionally, the §40 alcohol credits are offset by certain other credits and by the alcohol excise tax exemptions to prevent double usage of tax benefits.
IRC S179A Special Deduction for Alcohol Fuels Property
The 1992 Energy Act added under IRC $179A a special income tax deduction provision for certain equipment which would otherwise have to be capitalized and depreciated over a term of years. The special deduction may be used on "qualified clean-fuel vehicle propertyw and on Itqualified clean-fuel vehicle refueling property." "Clean-fuelw includes, natural gas, liquefied natural gas, liquefied petroleum gas, hydrogen, electricity, and any fuel which is at least 85% methanol, ethanol or any other alcohol. "Refueling property1@ is generally property used for storage or dispensing of clean-fuel into a tank of a motor vehicle.
Section 179A contains several deduction limitations. Generally, all qualified clean-fuel vehicles receive a $2.,000 deduction, but larger vehicles may receive an increased deduction amount. A truck or van.with a gross vehicle weight rating greater than 10,000 pounds may,qualify for a $5,000 deduction, and a truck or van with gross vehicle weight rating greater than 26,000 pounds may qualify for a $50,000 deduction. A bus with a seating capacity of at least 20 adults (not including the driver) may also qualify for the $50,000 deduction. Refueling property may qualify for a $100,000 deduction, but this $100,000 amount is reduced by the total deduction taken under $179A for clean-fuel vehicles placed in service at the refueling location for all preceding taxable years. The deduction amount for all property is also limited, of course, by the cost of the property.
The S179A deduction may be taken by making an election on the tax return for the taxable year in which the equipment is placed in service. The election must specify the items of property (and the portion of costs of such property) which are to be taken into account for determining the refueling property deduction. The $179A deduction is scheduled to be phased-out by 25% in 2002, by 50% in 2003, and by 75% in 2004. The provision does not apply to property placed in service after December 31, 2004.
Legislative Factors lnfluencing the Use of Ethanol in t he United States
Victoria 1. Putsche, Barbara J. Goodman, and Charles E. Wyman
Alternative Fuels Division National Renewable Energy Laboratory
Golden, CO 80401 U.S.A.
Abstract
As a transportation fuel, ethanol can be blended with gasoline as a fuel extender, an octane enhancer, and an oxygenate, or it can be used directly as a neat fuel. In the United States, the demand for ethanol as a direct blending component has grown considerably in recent years. In 1981, ethanol represented about 0.1 % of the transportation fuel market; in 1992, this demand had grown to almost 1.0 % or approximately 3.8 billion liters (1 billion gallons). Much of the increased interest and growth in ethanol usage can be attributed to its domestic production and favorable environmental properties. Recently, however, some controversy has arisen about the environmental impacts of ethanol usage.
Several legislative actions including federal tax incentives, the Clean Air Act Amendments of 1990, the Environmental Protection Agency's regulatory negotiations for reformulated gasoline, and the Bush Administration Initiative have influenced the use and acceptance of ethanol as a transportation fuel. These actions wiU be outlined and their impact on the current controversy will be summarized.
Introduction
Ethanol can be used as a fuel in different forms: as a nearly pure or "neat" fuel (e.g., E95, E85, or hydrous ethanol), or in blends with gasoline (e.g., gasohol). It may also be used to produce fuel additives such as ethyl tertiary butyl ether (ETBE) and tertiary amyl ethyl ether (TAEE). Each fuel option exhibits different properties, resulting in differing automobile performance characteristics and environmental impacts. Each option is also affected differently by a variety of regulations. A brief discussion of the regulations affecting the ethanol use, as well as of the controversy surrounding that use, is provided below.
Federal Tax Incentives
The federal tax incentives are the most important factors affecting the use of ethanol as a transportation fuel. Fuels with a renewable ethanol content of at least 10% are exempted from a portion of the federal excise tax on gasoline equivalent to $0.014/liter ($0.054/gallon) of gasoline or $O.l4/liter ($0.54/gallon) of ethanol. Recently, the tax exemption was extended to gasohe blends with 7.7 % and 5.7 % ethanol, specifically, as well as for the range between 9.8 % and 10 % ethanol; the amount of the exemption is prorated based on the ethanol content of the fuel.
Tax credits are also available for renewable ethanol fuel blends (blenders' tax credit) and straight ethanol fuel. These tax credits total $0.14/liter ($0.54/gallon) for ethanol of at least 190 proof and $O.lO/liter ($0.40/gallon) of ethanol between 150 proof and 190 proof. Blenders are eligible for the tax credit if the blend is used as a motor fuel in a trade or business owned by the blender or is sold as a fuel. The straight ethanol fuel tax credit is available to retail sellers of ethanol fuel. Blenders of ETBE may also receive a tax credit of $0.16/liter ($0.60/gallon) for the renewable ethanol used to produce the ETBE. Facilities cannot take both the tax exemption and the blenders7 credit. Generally, profitable facilities take the exemption because the credit is considered taxable income; after taxes, the value of the credit is roughly one-third the value of the exemption.
To promote the purchase of alternative-fueled vehicles (AFVs), an income tax deduction (up to $2,000) has recently been extended for the purchase of alcohol-fueled vehicles.
Clean Air Act Amendments of 1990
The Clean Air Act Amendments (CAAA) of 1990 also have an important impact on the use of ethanol. Under Title 11, Section 229 of the CAAA, specific areas in the United States are required to use oxygenated and/or reformulated gasoline (RFG). Oxygenated gasoline is required during the winter in the 39 areas that exceed the National Ambient Air Quality Standards (NAAQS) for carbon monoxide (CO). Oxygenated gasoline must contain at least 2.7% oxygen by weight. RFG is required year round in the nine areas with ambient ozone concentrations of greater than 0.16 ppm and a population of greater than 250,000; other areas that exceed the NAAQS for ozone may also "opt-in" to this program. RFG must contain at least
2.0% oxygen by weight and has several other formulation requirements. In addition, vehicles using RFG must meet several performance-based emission standards, including the reduction of volatile organic compound (VOC) emissions by 15 % on a mass basis. Oxygenated fuel regulations took effect in the winter of 1992; RFG regulations will take effect in 1995.
Ethanol is an oxygenate and can be used as a direct blend or as an ether (e.g., ETBE, TAEE) to meet the oxygen requirements for oxygenated and reformulated gasoline. As a direct additive, it can be blended at volumes of 10% (3.5 wt % oxygen) and less and stiU meet the definition of "substantially similar" (Federal Register, 1991); ether blends are considered "substantially similar" at an oxygen content of 2.7 wt % and below (Federal Register 199 1). The substantially similar ruling prohibits the use of or the increase in concentration of any fuel or fuel additive for use in light duty vehicles which is sig~icantly different from fuel certified by EPA (Federal Register 199 1).
As noted earlier, the properties of the ethanol fuel formulations vary. One property that has generated significant controversy is the increase in Reid vapor pressure (RVP) of 3.5-6.8 kPa (0.5-1 -0 psi), which occurs when ethanol is blended with gasoline at volumes of roughly 4%- 10 % . When ethanol is blended at concentrations of greater than 10 %, the vapor pressure decreases (Jaffoni 1993). In fact, at ethanol concentrations of approximately 25 % and higher, the vapor pressure of the blend is lower than that of the original blending stock; pure ethanol has a vapor pressure (1 5.9 kPa) that is considerably less than that of conventional gasoline (55.1 - 103.4 kPa). The composition of ethanol-gasoline blends for use in conventional vehicles, however, is limited to ethanol concentrations of 10 % or less by the substantially similar ruling mentioned above.
The CAAA made provision for this RVP increase in its oxygenated fuel regulations by extending a 6.8 kPa (1 psi) waiver for fuels blended with ethanol since ethanol is used in the winter when smog formation is not generally a problem. No similar waiver, however, was extended under the RFG provisions because of the required 15 1 reduction in mass emissions of VOCs.
Regulatory Negotiations
Soon after the CAAA's were adopted, the Environmental Protection Agency (EPA) initiated a regulatory negotiation (reg-neg) process with all interested parties to develop specific proposals for implementing the RFG program. By getting the stakeholders to agree to the specifics of a regulation before its implementation, EPA hoped to avoid the expensive and lengthy court battles that usually accompany implementation of new regulations.
In August 1991, all the committee members signed an Agreement in Principle that outlined the RFG proposal. In general, the RFG program was based on two models (simple and complex) to evaluate the impact of emissions on atmospheric ozone formation. The simple model is based on the fuel's RVP and formulation and would be used for the f ~ s t four years of the RFG program. The complex model is based on the fuel's formulation as well as any other parameters, such as reactivity, which could be shown to affect ozone formation. In April 1992,
EPA published a Supplemental Notice of Proposed Rulemaking, which incorporated the Agreement in Principle.
Members of the ethanol industry disagreed with the interpretation of the Agreement in Principle because they felt that the CAAA did provide a 6.8 kPa (1 psi) waiver for RFG blended with ethanol. Industry representatives asserted that if ethanol were not granted a 6.8 kPa (1 psi) RVP waiver, the industry would effectively be shut out of the RFG market for at least four years until the complex model could be employed. Furthermore, because of market considerations, this lock-out from the RFG market would likely be permanent and would also limit ethanol's role in the oxygenated fuel market. According to members of the industry, limiting the field of potential oxygenates for use in RFG, and potentially eliminating the use of ethanol, was clearly not the intent of the CAAA.
Another argument put forth by members of the ethanol industry against the Agreement in Principle is that the full emissions-reducing benefits of ethanol blends would not be considered when using the simple model. Fuels such as ethanol which reduce CO emissions may also reduce the formation of ozone in the atmosphere, but because the simple model certifies fuels primarily on their vapor pressure, the trade-off between reducing CO emissions and increasing VOC emissions on the formation of ozone would not be evaluated. This omission would unfairly limit the use of ethanol and would do so at the expense of overall air quality.
Bush Initiative
To ensure that ethanol would not be excluded from the oxygenated and RFG markets, President Bush released "The President's Program to Encourage Ethanol Use in Meeting the Environmental Goals of the Clean Air Act" (The Bush Initiative) in October 1992. Under this initiative, gasoline blended with ethanol was granted a 6.8 kPa (1 psi) RVP waiver in northern cities required to use RFG as well as those that opt-in to the program. Southern cities that opt-in to the RFG program may participate in the original program (i.e., no RVP waiver for ethanol) or may choose the program with the ethanol waiver.
As much as 30% of the total RFG market in the northern cities could adopt the waiver. To compensate for the increased evaporative emissions (and meet the mandated 15 % reduction in VOC mass emissions) when using ethanol, however, the volatility of gasoline in these cities would be decreased by 2.0 Wa to 53.0 kPa (0.3 psi to 7.8 psi). States may choose to extend the RVP waiver to a greater portion of the gasoline pool, but the RVP of the gasoline must decrease accordingly (e.g., 50% of the market with a waiver corresponds to an RVP decrease of 3.4 kPa [0.5 psi]).
In southern cities that opt-in to the program, 20% of the gasoline could be blended with ethanol and the volatility of the gasoline would be reduced by 1.4 kPa (0.2 psi). A greater portion of the gasoline pool can be voluntarily reformulated in this region as well, if there is a corresponding decrease in the RVP of the gasoline.
This initiative also decreased the development period for the complex model, requiring that it be available for use when the RFG regulations become effective in 1995. As noted earlier, this model must evaluate all of the emissions-reducing benefits of ethanol and determine how they would affect ozone formation. Finally, to provide greater flexibility in the oxygenate market and thereby increase the likelihood of ethanol's inclusion, the initiative directed EPA to establish a trading program for RVP credits within each ozone non-attainment area.
EPA recently (February 26, 1993) published a revised proposed rule that incorporates all the provisions of the Bush Initiative. During the subsequent comment period, questions arose regarding the effects of mixing or "commingling" ethanol-blended RFG with RFG blended with other oxygenates; successful implementation of the regulations was also a concern because of their complexity. Ethanol opponents contend that commingling of ethanol-blended RFG and RFG without ethanol in consumers' gas tanks will result in an increase in the vapor pressure of the mixture because ethanol tends to affect the most volatile components (Oxy-Fuels News 1993). Many ethanol proponents also felt that the proposal was flawed and that the regulations should be simplified (Oxy-Fuels News 1993). At this time, the future of ethanol as a component of RFG is uncertain. The final ruling regarding RFG is expected in mid-September.
Alternative Motor Fuels Act
In 1988, Congress passed the Alternative Motor Fuels Act (AMFA), which is designed to encourage the development and widespread use of methanol, ethanol, and natural gas as transportation fuels. AMFA also promotes the use of dedicated vehicles utilizing these fuels. Initially, most of these fuels and vehicles will be developed for use in federal fleets. In 1993, 10% of the federal fleet (or 5,000 vehicles) will be AFVs; by 1998, 50% of the-federal fleet (or 25,000 vehicles) will be AFVs.
Energy Policy Act of 1992
The Energy Policy Act (EPACT) of 1992 also has several provisions regarding the potential use of ethanol. In 1993, the U.S. Department of Energy (DOE) will establish a State and Local Incentives Program to accelerate the introduction and use of alternative fuels (Onstad and Lambrides 1993). It will also establish a low-interest loan program to partially alleviate the costs of AFVs to small businesses.
To further promote the use of alternative fuels and AFVs, EPACT calls for voluntary supply commitments from suppliers and consumers. Alternative fuel suppliers are asked to commit to providing alternative fuels as well as the required infrastructure; owners of 10 or more vehicles are asked to use alternative fuels and AFVs. Finally, EPACT requires that 30% of the new vehicles purchased by businesses whose principal activities are in alternative fuels handling, electricity generation, transmission and importing, and petroleum importing must be AFVs; the required percentage increases annually until 1999 when AFVs must represent 90% of new vehicle purchases (Onstad and Lambrides 1993).
EPACT also establishes petroleum reduction goals. In 2000, EPACT calls for 10% of projected fuel consumption to be replaced by alternative fuels, rising to 30% by 2010.
As mentioned previously, EPACT provided for the excise tax exemptions for ethanol blends of 7.7 % and 5.7 % and the income tax deduction for alcohol-fueled vehicles. These blends were selected to correspond to the oxygen requirements of 2.7 wt % and 2.0 wt % required for oxygenated gasoline and RFG under the CAAA.
Conclusions
Ethanol may be used as a transportation fuel in several forms. Each of these forms is affected by several articles of legislation, including tax incentives, the CAAA, EPACT, and M A . The controversy surrounding the- environmental impacts of one form, ethanol-gasoline blends, has affected the percepkn of the environmental impacts of all forms. Once all of the regulations that affect the use of ethanol as a transportation fuel have been fmalized, it is expected that this perception can be overcome, allowing ethanol to continue to meet the nation's energy needs in an economic and environmentally sound manner.
References
Federal Register. (1991). 56 FR 5352, February 11.
Jaffoni, T. (1993). "Ethanol and ETBE Play Growing Role for Refiner Clean Air Compliance," presented at the 1993 World Conference on Refrnery Processing and Reformulated Gasohes, San Antonio, TX. I
Onstad, J. W. and M.S. Lambrides. (1993). "The Energy Policy Act (EPACT) of 1992 - Impacts for the Biofuels System Division," Prepared for the National Renewable Energy Laboratory, Prepared by the Fuel and Transportation Division, Meridian Corporation, January.
Oxy-Fuels News. (1993). "EPA Hearing: Ethanol Issues Challenge to RFG Rulemaking," Volume V, Number 2, April 19.
Environment, Bioenergy and Politics in Norway
Dr. polit cand, Mrs. Randi Veiberg, University of Oslo. Center for Development and Environment
P.O. Box 1 1 16, Blindern, N-0317 Oslo 3. Norway Tlf: 47.2285891 6 Fax: 47.22858920
Abstract
The Purpose of the Work
The goal is to inform about 6 groups of barriers in the use of biomass (VEIBERG 87) and the realistic types of efforts (VEIBERG 1988) against these barriers. One main effort is to build up a system of energy security with increased use of bioenergy and less use of hydropower and oil products (VEIBERG & AL 1991).
The paper gives an overview of different efforts made to lower technological, economic and political barriers which hinder the use of processed or highly processed woodhiomass as sources of energy and heat.
The paper shows how to quantify energy, preparedness and stability of various bioenergy systems and describes their level of energy security. The paper suggests possible methods and strategies $ich can be utilized in energy planning directed towards use of alternative energy sources, particularly! bioenergy . Conventional energy prices, as well as environmental and regional variables, are taken into consideration in the analyses. The paper shows details on how an energy plan is made and how it is implemented.
Method of Approach
A methodological combination of qualitative and quantitative interviews are used in the registration work. The project is part of the investigation BOE- program in Norway (bioenergy, economy and society). Various proposals will be presented including both users of wood biomass and planners within agriculture, environmental groups on the energy sector on the national, regional and the local level. Certain key persons with expertise on the use of processed wood biomass are included. The method focuses on investment proposals, but other types of proposals .are also evaluated. For example, for those places where district heating based on wood biomass is socioeconomically feasible, suggestions are given for reducing the price gap between biomass heating and the conventional energy price. Other proposals include bioenergy in combination with district heating, oil, surplus energy from hydropower, waste heat or gas. These combinations should undergo a thorough cost-benefit analysis before being implemented. In cooperation with the University of Wisconsin (Madison), we have built up a woodburning and energy-preparedness model (TEB-model) with the LOTUS 1,2,3, and EXCEL-program, that are also used on the regional, municipal level. (Part one in the project "Biomass and energy security". 1990191.)
In one part of the project, scenario technics will be presented and connected to one project in our investigation program. (Veiberg, Kristiansen, Selvig, York. 1990191.) The working method is incorporated in a greater method that deals with mapping and registering of the bioenergy potential in Norway.
Results
The TEB-Model is useful in a methodological combination of scenario-technics. In this project, we have built up biomass-scenarios in which energy preparedness against capacity-, energy- and environmental- breakdown are the leading parameters. The results from these scenarios show as:
a) it is economically advantageous to investigate and use bioenergy systems,
b) it is environmentally favorable to direct efforts on bioenergy systems with regard to C02, SO2 or NOx,
c) energy preparedness for all types of capacity- and energy-breakdown is economically easier to maintain with a combination of a biomass and petroleum + electricity system, than it is with a petroleum + electricity system.
Other results show that there is a need for greater governmental initiative in leading the sector towards greater use of energy combinations. Effective methods for realizing this include judicial and administrative tools. This would have an impact on the types of investments and other efforts being made. An overview of different efforts made to lower technological, economic and political barriers that hinder the use of processed or highly processed wood biomass as sources of energy and heat is given. The results give concrete and practical advice to those who are involved in work in the biomass sector. Economic and technical barriers reduce desirable growth in use of biomass in heat production. Results include information and realistic advice to pilot projectors as well as planners and others who work for the increased use of flexible energy systems. The results should be useful for ongoing and further research within agricultural, environmental, industrial and energy issues. The report gives an overview of the
employment in the bioenergy industry, stockbuilding, and the management of the system of preparedness towards the year 2010.
Conclusions
The goal of this project is to show how to work with energy, environment, and agricultural questions and increase the understanding of environmental problems and solutions by planners. Another goal is to show how agriculture can help solve the energy and environmental questions. A third goal is to show that land use must be planned to protect agriculture and land, and at the same time increase the number of employed people in the sector. The questions of biomass energy systems, agriculture, industry and environment are holisticly connected to each other. The report presents one case that shows this fact.
One conclusion is that there are many unsolved problems regarding energy and the environment. In general, one may say that the main conflict is going on between quantitative and qualitative values in society. Because the environmental interest groups in general try to maintain the qualitative values, they will often be met by skepticism. Too many think that "what you cannot count, does not count.'"at is why quantitative values more easily get acceptance than the non-quantified. Paradoxically, that is why the nature and environmental sector is not always accepted in society.
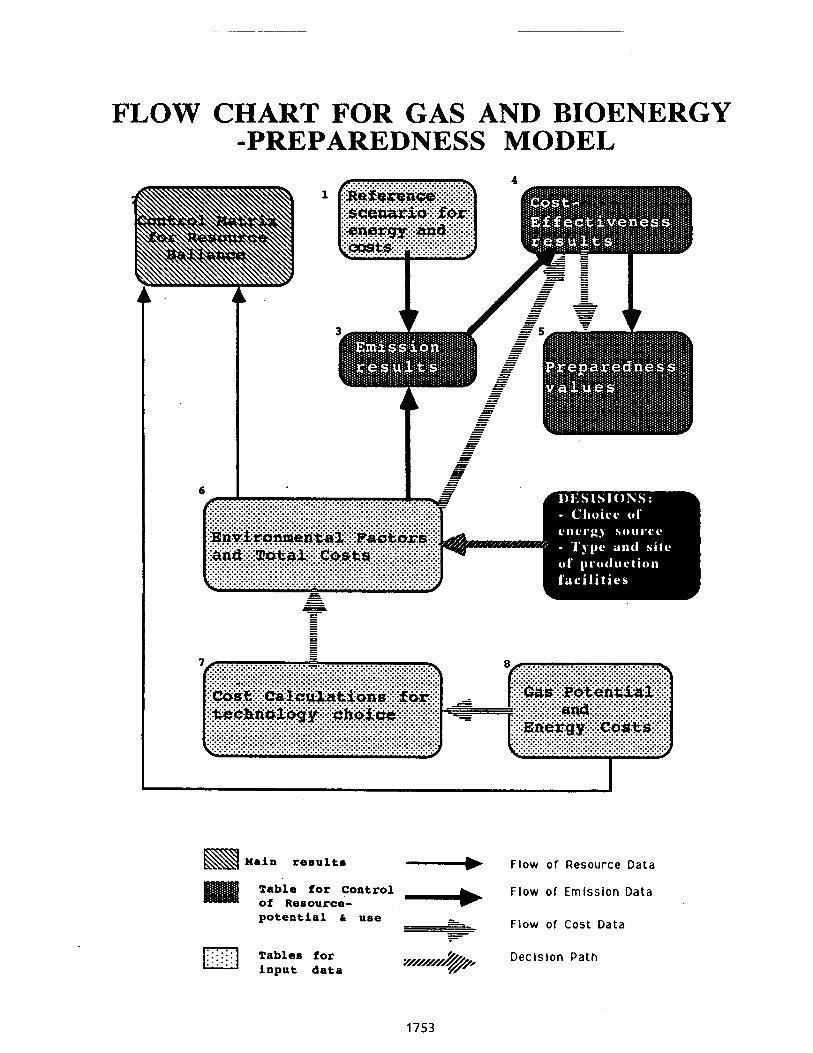
THREE BIOMASS POWER PLANTS XN NEW ENGLAND FIRST FIVE YEARS OF CHALLENGES AND SOLUTIONS
Joseph D. LeBlanc Vice President, Power Plant Operations Thermo Energy Systems Corporation
8 1 Wyman Street P.O. Box 9046
Waltham, MA 02254-9046
Abstract
Generating electricity from biomass fuels, through stand-alone power plants, represents a renewal of a half-century old plus, renewable technology. New England has generated its electricity sequentially, and still in parallel, from hydro, coal, oil, and nuclear sources during this period, and most recently during the 1980's, from a mixture of various alternate technologies including wood waste fuels and domestic waste fuels.
Three plants located in New Hampshire and Maine, of identical power-island design, were constructed in eighteen months, and began operation in the period December, 1987 through March, 1988. These plants almost from the start have experienced an outstanding record of operation, dependability, and reliability.
This paper will describe how each plant has fit into its respective location and environment, the personnel, technical and administrative support required, the biomass wood waste production and supply infra-structure which has developed around these facilities; and the technical problems and challenges which arose and were resolved in the process of handling a cantankerous, bulk fuel and turning .it into a reliable supply of electricity.
These plants are designed around a zero discharge concept. The author will discuss the design features built in, and operating practices which have evolved, to effectively use waste water internally, minimize air emissions, and recycle 100% of its solid waste as an effective fertilizer and soil conditioner.
During 1987 and 1988. Thermo Energy Systems (TES) placed three 16 MW wood waste fueled power plants into operation in New England. TES is a developer and operator of independent power and cogeneration plants with facilities in New Hampshire, Maine, California and Florida. In the mid 1980's, when the engineering for these plants was in progress, experience with
biomass fueled electric generating plants was limited. Since that time, this mini-segment of the power industry has steadily grown and proven the viability of the biomass fuel option. Granted, there have been operational surprises and challenges involved but the engineers and operators have answered the call.
The combustion of wood, simple as it may seem, requires significant technical and operational skill to maintain a high plant performance and profitability. This requires working with varying fuel qualities, continuously improving maintenance techniques and constantly meeting environmental regulations.
This paper addresses some of the challenges and resolutions associated with the operation of these wood fueled, stoker type boiler power plants during the past five years.
PLANT DESCRIPTION
Each of the plants are located on approximately 50 acres of land within close proximity to a power transmission line, a water supply and a major highway. Access to a non-restricted highway in New England is essential to maintaining dependable deliveries by fuel truck during winter and spring months.
The boilers, steam turbines and steam plant auxiliaries were identical for the three plants. The boilers are 140,000 lblhr, 900 psiaI900 F, Babcock & Wilcox Controlled Combustion Zone (CCZ), Detroit Hydrograte stoker units. Plant locations in Southern New Hampshire (Springfield), Northern New Hampshire (Whitefield) and Central Maine (Athens) dictated the use of different types of wood fuel, fuel handling systems and other site related design features.
The plant fuel handling systems consist of truck dumpers, storage facilities, feed conveyors and boiler feedsurge bins. The Athens and Whitefield plants have "A" frame type fuel storage structures capable of storing approximately 5000 tons of material, while the Springfield plant has two concrete storage silos with 2000 tons total storage capacity. Covered fuel storage is essential to smooth operation in New England. Each plant also has 3-4 weeks of outdoor fuel storage area.
Wood fuel is available in New England in several forms and from a multitude of sources. For power production, the major typeslsources include:
o Waste wood chips - Chips are basically an in-forest manufactured fuel. The tree tops, branches, crooked and low quality trees are processed through a mobile chipper that produces a 2-3 inch chip of wood that is then loaded into a tractor trailer truck and transported out of the forest. Production of waste wood chips is an adjunct business to saw timber and papermill chip operations.
o Sawmills and wood processing plant wastes - Mills producing lumber, plywood, veneer, and secondary processing plants producing such items as furniture, cabinets modular homes and pallets generate substantial quantities of wood waste that is suitable for fuel.
o Bark - Debarking operations at pulp and paper mills, and sawmills produce this waste material. Bark, in New England, typically has a high moisture content, 50-70 96, and is a stringy, sand imbedded material. Often bark is stored on site at the mill, sometimes decomposing and frequently is contaminated with rocks, oversize pieces, etc.
The Springfield plant is adjacent to a large sawmill and bums approximately 15 % .mill waste and 85 1 waste wood chips. A 650 Hp whole tree chipper is located in the fuel yard and on-site fuel
, storage (in addition to the two silos) is in the form of 20-30 foot poor-quality, reject logs.
The Whitefield Plant in Northern New Hampshire plant, is in the heart of the forest industry area and bums approximately 98 1 waste wood chips ahd 2 % mill waste. A chip pile provides on-site outdoor, long-term storage.
The plant in Athens, Maine bums one-third bark, one third waste wood chips and the remainder consists of sawdust and other wood mill residue. Upon start-up the bark gave a considerable challenge to the fuel handling system and combustion system. The plant operators quickly found the reason that this material was a relatively inexpensive, unpopular fuel. The stringy, high moisture substance can be shaped into a baseball . . . that holds its shape.. . . . . with tobacco juice to boot!
The FHS for the three plants were engineered and furnished by the same company, and the project engineer was an experienced wood handling, hands-on type person who believed in the solid fuel handling adage - Keep it rugged, Keep it simple. The systems have performed well, but as in most plants, each individual system had to be tailored and fine-tuned to accommodate the actual fuel encountered at that specific site.
Some of the FHS problems faced and solutions found by the operating staff are as follows:
F'uel Truck Dummr Receiving Homer
The receiving hopper equipment is the first of the key links in the FHS chain. After the truck trailer is raised, and the load is dumped, the fuel falls into the hopper. The floor of the hopper has five flights of drag chain conveyor that essentially cover the entire area, and are designed to move the fuel forward, to a front-wall, metering gate and then to the plant feed belt conveyor. The adjustable metering gate extends across the entire width of the hopper discharge. The operators quickly found out that while the other fuels handled very well through this metering system, the mill bark, with its odd shapes, many long, stringy pieces, and high moisture content passed through the gate with much difficulty - unevenly, randomly and usually in chunks of tightly packed bark. At times
the bark was literally moved forward, en-masse, as a large lump, via bottom drag chain conveyor, and tried to push through the hopper front wall.
The plant was designed with a back-up truck dumper which dumps directly to grade. When the bark problem occurred, bark shipments were temporarily re-directed to this alternate truck dumper, while the hopper - bark handling problem could be analyzed. TES operations and plant management visited several paper mills who had tried to bum this cantankerous bark fuel in their process boilers. The investigation revealed that much work had been done to beef up the receiver hopper at most of these facilities, ie., break up the bark, slowing the fuel handling speed (which consequently delayed truck turn around). However, their ultimate solution was in each case to limit the use of unprocessed bark and substitute alternate wood waste fuels.
Since one-third of our fuel supply was committed to bark fuel, substitution was not a practical alternative for the Athens facility. Substitute fuels were simply not available in the necessary quantities, at the same price.
Working with our wood fuel handling system supplier, a "Rakeback" system was designed and constructed as a modification to the receiving hopper. It consisted of a heavy-duty, rugged, high torque, low speed, paddle-wheel, adjustable height-type device. The device travels vertically, approximately in parallel with the front wall of the hopper. As the chain conveyor moved the fuel forward in the hopper, the leading edge of the moving fuel pile would make contact with the Rakeback paddles, continually carrying the front of the pile in an upward direction.
This tends to lift the front of the pile upwards and roll the excess fuel back over the top of the advancing fuel pile. This feature also promotes a degree of fuel mixing or blending, as a secondary benefit of the design.
While the desired pile height, below the Rakeback paddles, could now move freely forward, it still tended to fall in lumps, even though the flow had significantly evened out. This was remedied by the installation of a 60 RPM pin roll which consisted of a shaft with short (6"-8") protruding pins. As the fuel moved under the roll the pins carved through the advancing metered fuel, breaking it up, which then evenly distributed itself onto the discharge belt conveyor.
In addition to the receiving hopper, fuels can be dumped to grade, and moved by mobile, front- bucket loaders to separate fuel piles in the fuel yard. The fuel can then be blended in various ratios in the fuel yard much like you'd make a cake. The recipe changes as different kinds of alternate wood waste fuels come into the yard. This blending process, incidentally, is a black art, requiring much patience and trial by experience. As the saying goes, "Process the fuel before it gets to the boiler feed - or else be prepared for the operational consequences". This blended yard fuel is then fed through an auxiliary hopper and conveyor onto the receiving hopperlplant feed conveyor, thus, another degree of blending takes place. The auxiliary hopper was originally intended as a back-up fuel feed system, but has proven to be an important blending tool as well.
Start-up of the Athens plant was in December, 1987, well into the frigid Maine winter. The fuel was literally sliding back down the conveyor belts, as the preceding bark left behind a portion of its moisture, which promptly turned to ice. The fuel handling operators were getting quite discouraged, but as all good operators, they were also getting wiser. Ethylene glycol or antifreeze, applied to the belts, provided a temporary fix and kept the fuel moving upwards,- in the direction we preferred, until a permanent fix could be devised. Antifreeze, of course, is not recommended for long-term use, as it will shorten belt life. The design angle of these conveyors, less than 14 degrees, was considered quite conservative for the anticipated fuel, but no one planned on 70% or more moisture in one-third of our fuel supply. The permanent fix was installing chevron belts to replace the smooth belts on three conveyors. The following winter conditions demonstrated the success of this change. The replacement of the belt cleaning - brush system was also required to accommodate the new, uneven chevron belt surface. This is a very important p a . of conveyor system on-line preventative maintenance, which keeps the belt idlers, as well as head and tail pulleys clean, promotes proper belt alignment, and also extends belt life by reducing abrasion wear.
Meterine/Sur~e Bin
Processed fuel can be fed from covered fuel storage or the fuel yard itself. The boiler feed conveyor feeds this fuel to a "negative-sloped wall" meteringlsurge. The bottom of this bin has twelve large, counter-rotating, variable speed screw augers which cover the entire bottom of the bin. There is about twenty minutes storage in the metering bin, which provides immediate "surge" capacity for the boiler.
A similar challenge existed in the metering bin as was found in the receiving hopper. As the screw augers moved the fuel forward, in response to boiler demand, the leading edge of the fuel pile moved into the negatively sloped front wall which then transmitted compressive load back down through the fuel pile. The bottom 12" of fuel flow is designed to pass under a gate, and then fed to three fuel chutes. Instead, the fuel tended to bind up at the gate, and that fuel which made it to the fuel chutes, often would fall in lumps down the chutes, sometimes binding the chutes, and at best tended to be unevenly distributed across the fuel grates. More about that later.
Operations, working with the system supplier, designed a positively sloped leading edge on the front of the metering bin. The bottom of the leading edge, was set at metering gate height, approximately 12" above the top of the screw augers. As the fuel advanced into the leading edge, the top of the fuel pile was shaved off and moved upward, which at its highest pint, would then fall back onto the advancing fuel pile. In effect, the advancing fuel above the lowest 12" would slowly rotate and mix with the fuel advancing behind it. Because this fuel was sized and processed, and contained little or no long, stringy pieces anymore, it tended to act independently as it moved upward with this passive, top-skimming device, thus un-weighing the fuel below it. The 12" of metered fuel now un-weighted, was free to expand, and did so up from its com-pressed 12", to up to 18" above the screw augers.
A Pin Roll was installed at the metering bin discharge. This roll breaks up the fuel lumps, as the fuel moves through the gate, before discharging into the fuel chutes. A secondary beneficial effect also resulted as the loading on th_e screw augers decreased, requiring less ampere draw to move the same amount of fuel.
A swinging distribution "flapper" was also installed at the top of the Athens surge bin to kick the fuel coming off the bin feed belt, to the left and right. This action gives an even loading of fuel across the width of the bin, which decreases fuel bridging and avoids unloading of the outside screws.
Boiler Fuel Feed SDOU@ 0
The wood fuel is designed to drop from the surgelmetering bin into the fuel chuteslspouts, where service air propels it across the length of the boiler grate. The air pressure varies over a controlled cycle such that the "throw" distance continually varies, thus evenly distributing the fuel over the desired area of the grate and optimizing the available combustion surface. Initially the wet, coarse fuel did not travel to the back end of the grate. The lip of the fuel chute/spouts was modified with installation of a "ski- jump" lower edge, which gave more lift to the fuel as it was blown forward by the air supply. This significantly improved fuel distribution, improving efficiency, minimizing carbon in the ash, and reducing CO missions.
The early experience at the Athens facility benefitted the two plants in New Hampshire of similar design. The "ski-jump", fuel chute lip modification was made at both plants with the same beneficial result.
BOILER SUPERHEATER TUBES
A total of seven secondary superheat section tube leaks have occurred due to spacertsupport failure in two of the three New England plants, although all three boilers have experienced significant "attachment" failures. The failures have occurred in conjunction with the Croloy 2% tubes, the attached stainless steel spacerslsupports and the Inconel ("Inco Weld A") weld. The thermal-induced expansion of these dissimilar metals caused the majority of the welds to fail.
In most cases, it was a "clean" break, but in a few cases the cracWfailure precipitated into the tube material itself, causing a tube leak.
Steps taken to combat this problem included:
o Reducing heat up and cool down rates to 75 % of boiler manufacturer recommendations.
o Installation of support straps to maintain tube alignment and substitute, to a large degree, for the tube support lost due to the weld failures. These were installed in the Spring of 1992 at one of these plants and our subsequent October, 1992 inspection showed
support strap integrity, proper tube alignment, and little or no mechanical fretting or wear on the tubes. All three plants are now operating with these support straps.
We are installing an experimental unloaded bundle support arrangement in one boiler in April 1993 , to determine the mechanical effectiveness. If successful, we may consider, in the future, attaching the cantilevered end of the tube bundle to a roof support through a "flexible" hangar arrangement, to provide additional bundle support. An independent, major boiler tube manufacturer and supplier had recommended an additional cantilever-end roof supported hangar arrangement in their proposed replacement tube bundle design. We are currently evaluating the merit of this additional superheater tube bundle support feature, which if properly designed, with sufficient flexibility to sustain the heat-up and cool-down transients, may provide additional beneficial tube bundle support.
During our tube spacerlsupport failure inspections in 1992, we observed some pitting on the superheater tubes. Tube material samples were analyzed for attack mechanism and tube wall penetrationldepth measurements, and we continue to monitor this condition. Analysis of surface deposits showed some presence of chlorides in a few of the deposits tested.
We have also fabricated test specimens including 304L, 310, 316L and 321 SS materials which are designed to "strap on" to a cleaned tube surface. These are thin-walled to approximate the actual tube wall temperature as closely as possible. Each of the specimens will be located on the front wall tubes of the secondary superheater in one of the boilers during the Spring, 1993 annual outage. This location represents the hottest surface area, and the area where the higher chloride deposits were found. These will be removed later and analyzed as part of our material selection data input process. We recognize that these test specimens may produce conservative (or less conservative) results as the actual exposed temperature regime will be slightly hotter than the actual tube external surface due to decreased cooling.
If tube bundle replacement is required, we may elect to stay with the original boiler manufacturer's existing material, or based on further analysis, select a material which is concluded to be more compatible with both elimination of the spacerlsupport metal problem addressing conclusions regarding the thermal-chemicalldeposit environment which we anticipate existing in the future.
Finally, we have discussed the spacer/support weld failures in depth with the boiler manufacturer and independent consultants. These identical failures have occurred with this spacer/ suppodweld design in other boilers designed and built by the manufacturer (B&W). The high frequency of weld failures/low frequency of tube failures in other boilers has paralleled our experience.
Furthermore, the weld failures which are going to occur, in all likelihood have occurred, during the various heat-up/cool-down transients which our plants have experienced over their first five years of operation. This has been the general experience of these other manufacturer's boilers, as well, according to .B&W.
ASH HANDLING AND CONDITIONING
The three plants were designed with a pneumatic ash handling system, which would convey precipitator fly ash from the hopper bottom to the Ash Conditioning System. The winter start- up, almost simultaneously, of the Athens and Springfield facilities, quickly revealed that the high moisture 'inlet air to the compressed airlpneumatic system reacted with the fly ash, in the conveying piping causing partial and sometimes full blockages. Recognizing the significance of an interrupted fly ash removal system, a mechanical screw auger, temporary ash conveying system was quickly designed and installed at both plants over a two-week period. Conditioned ash is normally conveyed to ash containers for off-site transport to its ultimate destination. As part of the temporary ash handling system, a double sloping roof was designed, complete with built-in ash distribution auger, which would fit over these standard, 30 cubic yard, 15 ton capacity ash transport containers. A heat-traced, regulated water spray was fitted out at the front end of the "roof-top" screw auger over these containers, to mix with the ash to a minimum of 25 % moisture, to preclude fugitive dust during transport and off-site handling. This roof-top lid, was raised and lowered in place by two chain falls, holding the lid in balance as full ash containers were removed, and empty containers moved in place under the lid.
Detailed design work began immediately thereafter for a permanent ash handling system consisting of ruggedized ash screw auger conveyors over the small angle distances, and a heavy- duty drag chain conveyor over an extended 75 foot, approximate 18" angle to the top of the permanent ash conditioners. Engineering and Operations worked closely during the design, construction and implementation phase, resulting in a reliable, rugged system, which was constructed at both the Athens and Springfield plants during full-power operation, and cut in during the next scheduled outage at these respective facilities.
This permanent system was also procured and installed on an expedited timetable, such that the Whitefield plant had the upgraded Ash Handling system in place and operating prior to start-up.
WOOD ASH RECYCLING
The potential beneficial uses of wood ash as an inexpensive fertilizer and soil conditioner, was recognized early on, as a result of discussions between Operations and Resource Conservation Services (RCS). RCS was embarking on a fledgling wood ash recycling program/business at the very time our three New England plants were starting up. Operation's long-time knowledge of Bill Ginn's (RCS President) relationship with Maine environmental organizations and the respect he had with Maine regulatory agencies, combined with a practical conservative approach, convinced us that wood ash recycling was a prudent, beneficial application for this material.
Our first contract negotiation took place in a cold, unheated room in Springfield, New Hampshire, in late Fall, 1987 with Bill and several of his then small technical staff. Driven by survival and self-preservation from the cold, we came to agreement in concept, quite quickly. The formal Agreement took a bit longer.
Recycling this beneficial wood ash fertilizer just made too much sense. We also contracted for reserved, storage capacity, in licensed landfills in both Maine and New Hampshire, as a backup
to our recycling program. Each plant's yard area was modified to accommodate these heavy steel-w heeled ash containers.
o Concrete roll off/handling pads were poured, with imbedded steel plates, to accept the concentrated wheel loading.
o Accommodations were made to transfer these 30 cu. yd./15 ton capacity ash containers to RCS roll-on/roll-off trucks for off- site transport.
o Ash conditioning controls were experimentally adjusted and modified through a very painstaking learning period at each plant following initial operations, to produce an "earth-like" ash consistency, which could be spread by farm/commercial-grade fertilizer spreaders.
o Foreign objects which find their way in with the waste wood - pieces of barbed wire, occasional nails, bucket teeth, chipper blades, etc, were unacceptable to the farmers. Plant operators made the following changes:
- Screening devices were fabricated at each plant in the ash building as a final QA step, before the ash left the site to remove any foreign objects and any lumpy ash. Stepped-up diligence by plant staff personnel enhanced this policinglfinal QA phase.
- Incoming woad to the plant was carefully monitored for any signs of foreign material.
- Electro-magnets had already been designed into the wood in-feed system. Equipment was modified to lower and more evenly distribute the wood waste fuel over the conveyor belt. This permitted lowering the magnet closer to the conveyed wood stream, significantly improving its ferrous-metal removal effectiveness.
- Metal detectors have been also installed in the wood infeed system to detect the presence of non-ferrous metals. These detectors automatically shutdown the wood in-feed flow, and are restarted locally by the operator, at the detector location, once the foreign object has been removed.
This concerted effort combined with a strong, mutually beneficial working relationship with RCS at the plant staff and management level, have resulted in a very successful Ash Recycling Program over the past five years which have:
o benefitted local area f m e r s by providing an inexpensive fertilizer and soil replacement material, and
o provided a bulking agent and odor neutralizing material for sewage treatment plant sludge.
The process of finding new, beneficial uses for this material is never-ending, with RCS taking their lead in a mutually beneficial program.
PLANT WATER SUPPLY
Water quality and quantity from deep, rock well sources was determined to be insufficient at the Springfield plant during the site development phase of this project. As an alternative, a fresh water supply system consisting of six shallow wells in a low area was designed and implemented at the site to meet the boiler, cooling tower and other plant requirements. This system has consistently provided the quantity of water required, but the Total Dissolved Solids, Conductivity,and Iron varied significantly between the six wells. See Table 1. Since the wells feed through a common point to the plant, the less desirable aspects of the water supply chemistry was seen by both the cooling tower, which is relatively insensitive to these variations in water quality, and the water treatment system which supplies demineralized makeup water to the boiler.
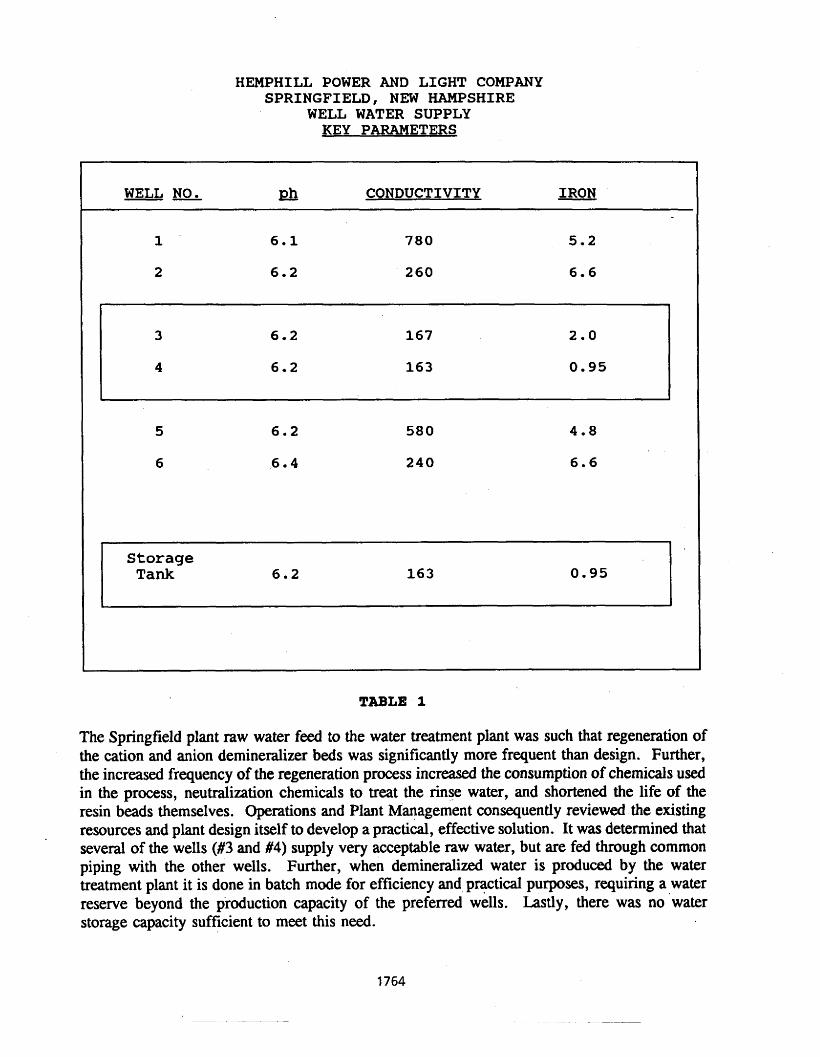
HEMPHILL POWER AND LIGHT COMPANY SPRINGFIELD, NEW HAMPSHIRE
WELL WATER SUPPLY KEY PARAMETERS
WELL NO. Ell CONDUCTIVITY IRON
1 6.1 780 5.2
2 6.2 260 6.6
3 6.2 167 2 .0
4 6.2 163 0.95
5 6.2 580 4.8
6 6.4 240 6.6
Storage Tank 6 .2 163 0.95
i-
TABLE 1
The Springfield plant raw water feed to the water treatment plant was such that regeneration of the cation and anion demineralizer beds was significantly more frequent than design. Further, the increased frequency of the regeneration process increased the consumption of chemicals used in the process, neutralization chemicals to treat the rinse water, and shortened the life of the resin beads themselves. Operations and Plant Management consequently reviewed the existing resources and plant design itself to develop a practical, effective solution. It was determined that several of the wells (#3 and #4) supply very acceptable raw water, but are fed through common piping with the other wells. Further, when demineralized water is produced by the water treatment plant it is done in batch mode for efficiency and practical purposes, requiring a water reserve beyond the production capacity of the preferred wells. Lastly, there was no 'water storage capacity sufficient to meet this need.
A 250,000 gallon raw water storage tank had been constructed however, as part of the independent fire protection system for the plant. This tank was also provided makeup water by a common header from the six shallow wells.
A plan was developed whereby, each evening when cooling tower demand is low, the plant staff would manually feed raw water from the best quality wells, #3 and #4, to the raw water storage tank. As part of this scheme, the raw water source to the water treatment plant was re-piped, such that it drew Q.& from the tank in normal operation. This significant improvement in the raw water source water quality not only significantly reduced demineralizer resin bed exhausting and consequent regeneration, but also improved the consistent demineralized water output quality with decreased chemical consumption. Equally important, it was another step in reducing the overall waste water generating and handling requirements at this plant.
The new dual-use of the storage tank for both fire protection and water treatment plant water makeup was very compatible. Approximately 7,000 gallons are required each day for boiler makeup from the tank, which already included a substantial reserve margin over designed fire protection requirements.
WASTE WATER MINIMIZATION PROGRAM
A typical power plant uses water to generate electricity and consequently has several sources of waste water to deal with, treat, and/or dispose of as part of this process. This includes cooling tower and boiler blowdown to maintain water chemistry specifications; water treatment regenerative wastes; minor system valve stem, etc., leaks; wash/housecleaning water; boiler upset and cooling tower maintenance draining requirements, and other process drains in the plant.
The three New England plants were designed with a central collection point for turbine boiler building drains, which also collects cooled, boiler blowdown. Any overflow from this floor sump is piped to an outside, lined storage pond which was principally designed to hold the water from a drained boiler, and/or cooling tower sump.
During high moisture seasons, this storage pond also collects rainwater and snow. The challenge was, what to do with all this water? Operations took a systematic "zero discharge" approach, and embarked on administrative/procedural controls, and in some cases minor system/ piping modifications, to effectively utilize all of this water in the plant process itself.
o Turbine Floor sum^ Water
The turbine floor sump typical waste water was analyzed and found to have a lower ph than the cooling tower. It's chemical content was also favorable, relative to cooling tower water. Consequently, pumping from this turbine floor sump/ central collection point was introduced as partial makeup to the cooling tower. Care was taken to assure oil wastes, if any, are separated out before this water is pumped.

Water Treatment Plant Waste Water and Solia,
The waste neutralization tank water was also analyzed. This tank collects all water treatment plant waste water including demineralized regenerative waste liquids. These analyses demon-strated that any chemicals collected in this tank were relatively benign, once routine neutralizing has been completed. At the same time, solids produced from a 2% bypass treatment system on the cooling tower system was also analyzed with the same benign result.
These results were submitted to the New Hampshire and Maine State environmental agencies, with a proposal to use the water treatment plant waste water to condition the fly ash, as part of the routine fugitive dust control program for handling of wood ash.
At the same time, permission was obtained to mix the cooling tower bypass treatment solids with the wood ash. These solids had a lower ph than wood ash, and contained principally diatomaceous earth, used as a solid filter material, and otherwise material found in nature, which were benign, inert and/or contributed nutrient value to the fly ash itself. The relative quantities of these solids were quite small when compared to the wood ash produced (0.4%).
The ash conditioning systems were subsequently modified to use the water treatment plant waste water as its primary supply, with the originally designed raw water converted to an automatic- standby backup supply role.
Each plant has also employed various approaches to combine and mix the water treatment plant solids with the fly ash, before off-site removal of this wood ash.
Outdoor Storape Pond Waste Water
As mentioned before, each plant was designed with a lined, outdoor storage pond to primarily receive water from a drained boiler andlor drain cooling tower sump. Further, cooling tower basin high water levels drain to this outdoor storage pond. Following analyses of the storage pond water, a policy was established to use this storage1 waste water in moderate quantities, based on routine sampling, as makeup to the cooling tower basin, using the same line originally designed to drain the cooling tower in the opposite direction.
This approach has maintained these storage ponds at a managed level, which assures available capacity for its originally intended purpose.
AIR EMISSIONS IMPROVEMENTS
Burning wood fuel dates back more than half a century, when no one thought much about CO and NO,. It' s re-birth required a re-familiarization , re-education , and re-experiencing for qualified power plant operators and managers in wood burning technology. When we first started staffing our three new plants we were able to hire a total of two individuals for our two plants in New Hampshire with a grand total of about two years prior wood experience each.
In Maine, we had two or three individuals that had any wood-fired experience. Today, a whole infrastructure has developed of quality plant managers, operating personnel and technical staff who have painstakingly mastered the vagaries of reliable consistent, wood burning. These people are the real key.
They have learned what "jet fuel" is - clean white chips; what fuel should be rejected and not burned at the plant; how fuels which individually cannot be burned at the plant safely, or will put out a fire on the grate, or will definitely cause CO or NO, or Opacity exceedances, can be blended and combined to produce an acceptable fuel. Sawdust, wet bark, super-dry mill wastes, and a sizable quantity of just-right waste wood chips are the ingredients for a fuel which sustains reliable, continuous, full-power operation while maintaining emission standards. Constant diligence continues to be the key to meeting CO and NO, standards, while burning a moisture- varying, seasonally-changing fuel, which has a mind of its own.
Our other major area of focus for wood-burning emissions control has been Opacity.
Our modem pollution control equipment includes:
o a double-bustle boiler, with designed primary and secondary combustion areas for cleaner burning, NO, control;
o mechanical dust collection; and a
o high efficiency electrostatic precipitator.
These plants remove 99.7% of the particulate matter before flue gas effluent release. Typical steady state emissions at full power are 3 % to 5 % Opacity. However, plant transients, including scheduled start-ups and shutdowns are another matter. We have found quite painfully that even at full load, precipitator fires are an ever-present potential concern when burning wood. Replacement costs for precipitator internals including redesign, materials, special cranes, labor, and lost generation revenues in one of these facilities approaches one-half million dollars. The precipitator fire, that causes this degree of damage, lasts two to ten minutes.
Plant design was such that during plant transients, because of the great danger of fire in the presence of Oxygen (0.J over 6%, the precipitator electrode power is automatically cut off. This occurred at approximately 72% power when decreasing load, and approximately 79% increasing load, when the 0, again drops below 6%. Below these power levels, during plant transients, we have experienced exceedances of Opacity over 20%.
Working with the electrostatic precipitator equipment supplier, Research Cottrell, we have modified the power controls such that we can now employ a low voltage setting, which in turn reduces the electric field around the collecting electrodes. The low voltage setting is set at the plant during an actual start-up transient. In effect, the equipment engineer continually monitors the presence.of any spark, during this start-up transient as plant power level is increased. The precipitator control power is manually reduced below the point where any sparking occurs. As plant power level continues to rise, the precipitator control power is continually further reduced,
until beyond the plant power level where the flue gas, 4 level is less than 696, and normal high voltage is permissible. Once established by this method, at that particular plant, the lowest/ non- sparking e low voltage setting is "permanently" set in the equipment.
During any follow-on shutdowns or plant trip transients, the precipitator control power will automatically switch from high voltage to low voltage at a preestablished point. Subsequently, during plant start-up, the precipitator control power will automatically switch back from low to high voltage during the increasing power level transient.
The result is a minimum level of particulate collecting in the precipitator at all times during operating transients. Since this modification has been implemented on a trial basis at this plant, the maximum Opacity to date, after several shutdown - start-up sequences, has been 5 % - 7% Opacity. We are moving cautiously in this area, and have installed additional 0, monitoring equipment in the flue gas stream to assure detection of any unexpected air in-leakage, such as at precipitator ductwork expansion joints. We have also had administration procedures in effect since early 1988 such that any indication of increasing (or any presence of) ash level in the precipitator hoppers: high level alarm, high temperature alarm, physical observation through inspection ports of ash not moving, requires an immediate plant shutdown, purging, and safe entry into the precipitator, to inspect the hopper and determine the problem. Only when the problem is identified and resolved, is the plant allowed to return to power.
OPERATIONAL RESULTS
The preceding discussions reviewed some of the key challenges the staff of the three facilities have addressed during the initial five years of operation, here in New England.
This document does not discuss the excellent performance of the many major and minor pieces of equipment, pumps, valves, dampers, switches or controls in these well-designed and constructed power plants.
We reviewed some of the painstaking dedication of key managers and engineers and plant staff who worked with the fuel handling equipment and learned through much experimental trial, the proper ingredients for an acceptable fuel blend operationally and environmentally; who mastered the literally "black" art of proper ash conditioning; who have contributed their singular and synergistic ideas to come up with subtle modifications and improvements which have smoothed operations and maintained and improved equipment reliability. The "bottom line" is the result of all these individual and team efforts.
Table 2 shows the Net Plant Capacity Factors for the three plants during the first five years of operations. As you can see they have been successful performers, and rank with the best of any fossil-fueled power plant operation in this country. The most recent three years (1990, 1991 and 1992) are a mpure of excellence by any standard and certainly a credit to the operating staff!
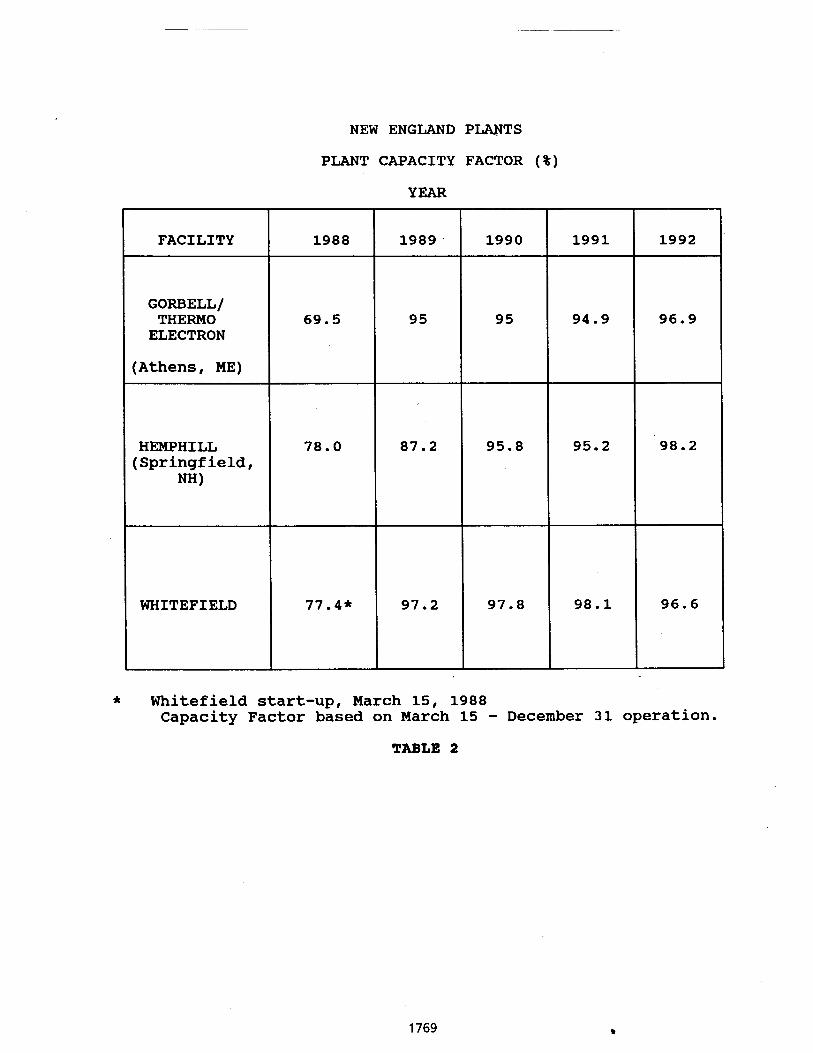
NEW ENGLAND P W T S
PLANT CAPACITY FACTOR (%)
YEAR
* Whitef ield start-up, March 15, 1988 Capacity Factor based on March 15 - December 31 operation.
TABLE 2
1992
96.9
98.2
96.6
FACILITY
GORBELL/ THERMO ELECTRON
(Athens, ME)
HEMPHILL (Springfield,
NH)
WHITEFIELD
1
1990
95
95.8
97.8
1988
69.5
78.0
77.4*
1991
94.9
95.2
98.1
1989
95
87.2
97.2
CASE HISTORY OF MSW-TO-ENERGY FlNANClNGS
David L. Barrett Privatization Capital Group
1008 Harding Plymouth, MI 48170
(31 3) 453-6600
A discussion of the role of development and project capital in the development of solid waste treatment facilities.
Introduction
The development of solid waste treatment facilities is dependent upon the developer having sufficient resources to fund the development of a project and the ability of the project to be financed. The access to capital to develop, construct and operate a.facilitv is the kv component ofthe development process. I'm not diminishing the need for long-term waste agreements, the advantages of a superior technology or the benefit of experience. However, without capital, a project will never be initiated and the other components are immaterial.
This paper will review development financing with a case study of an environmental development company with a new technology and project financing with a comparison of four financings of Waste to Energy (WTE) facilities. Prior to reviewing the financings, the components of a project including the participants, agreements, and cash flows will be discussed to establish a foundation for thelater discussion. The analysis is not intended to be directly applicable to material recovery and composting facilities, however, many issues are common to all environmental facilities.
Development and project capital will be differentiate. Development capital refers to the funds necessary to progress the project to the point contracts are in place and construction can commence. Project capital refers to the long-term financing for the construction and operation of the project. Development and project capital are both critical to the development of a project, however, they play significantly different roles, are provided by different funding sources, and have different risk profiles.
The role and need of development capital is growing as the market shifts away from the development of large WTE facilities to the inclusion of smaller recycling, composting, or alternative technology facilities. WTE was developed by corporations with significant internal sources of funds to finance development. With the shift in the market, many smaller entrepreneurs are attempting to initiate projects and the majority will be resource constrained.
Project capital can be segmented by project phase (construction and term financing), by seniority of security, (senior debt, subordinated debt and equity funds) with debt further differentiated by tax treatment (tax-exempt and taxable), and by security (corporate or project secured). The financing structure utilized for each project will vary with parties, project parameters and the market.
Project Components
Each project is unique with specific nuances, however the major components of a project are similar. In general, projects are developed in partnership with municipal- entities. The facility's size, location and operations are designed to specifically treat the waste of a community or group of communities. The following summarizes the components of a project by reviewing the participants, agreements, cash flow, risks and offsets, and a summary of project economics.

A. Participants
The major participants in a project are:
Developer The developer's role will be to initiate, coordinate, negotiation and manage the operations of the project. A special purpose subsidiary will normally be created to manage the project.
General Contractor The contractor will be responsible for the construction of the facility including being a subcontractor for the installation of the various equipment components.
Operator The Operator may or may not be the developer, however, it is necessary for the operator to bring experience, credibility and the ability to guarantee performance.
Suppliers The participants that provide components to the facility.
Service Recipient The service recipient will be a municipality(ies) or an authority comprised of two or more municipalities.
Financing Parties Debt The construction and term financings will be non-recourse project debt. The majority of the debt will most likely be tax-exempt, however, the mix of taxable and tax-exempt debt will be variable and determined on a project by project basis. Equity Project equity may be required by the debt or the service recipient. This component will be reduced to the smallest amount possible because it is the highest cost funds.
Guarantor The economics of the transaction may be enhanced if a financial guarantor is utilized to wrap the transaction.
Other Participants Purchasers of by-products The developer will enter into an agreement with outside parties to purchase the by-products such as electricity. steam, or potentially a marketable fuel. Residue disposal The developer will enter into an agreement with an landfill owner to take any by-pass waste that is unable to be processed at the facility. Site Owner The developer will either lease or buy the facility site. Recycled Products Purchaser Scrap metal and other marketable materials will be sold.

B. Project Agreements
The major agreements and contractual arrangements provide for ( i ) the construction of the facility and acquisition of equipment, (ii) the financing of the project, (iii) commitment of waste and disposal fees, (iv) the sale of by-products and recycled goods, and (v) disposal of nonprocessible waste. The primary agreements are:
Service Agreements Participants: Developer
Service Recipient, a municipality, several municipalities or an authority
Purpose: The service agreement secures the flow of MSW, and the cost of disposal. This agreement is the prime security of the transaction. Normally, the service fee is comprised of several components including a capital charge, insurance and tax pass-through costs, by-pass disposal costs, and an operating fee.
Construction Agreement Participants: Developer
General Contractor
Purpose: The construction agreement sets the costs, terms, and specifications of the construction of the facility.
Equipment Purchase Agreements Participants: Developer
Suppliers
Purpose: Each agreement will delineate the terms and conditions of the equipment to be purchased. In addition to the purchase agreement, the equipment suppliers may sub-contract with General Contractor to oversee the installation of the equipment. The common construction entity can be vital to insure the various components of the facility are properly integrated.
Loan Agreement Participants: Developer
Lender(s)
Purpose: The loan agreement(s) will be with the debt participants. The developer will secure the highest level of debt possible and within the debt portion of the financing the highest level of tax-exempt financing possible. The level of debt is dependent upon the security of the service agreement and the structure of the financing.
Investment Agreement Participants: Developer
~ ~ u i t ~ ' 1 n v e s t o r
Purpose: If the facility is privately-owned (as opposed to municipal ownership), equity may be required by either the service recipient or the lenders. If the equity investment is from a passive third-party, the financing structure normally takes one of two forms, a limited partnership or leveraged lease. Each has distinct advantages and serves the purpose structuring an investment in the facility.

Operating Agreement Participants: Developer
Operator
Purpose: The facility may be operated by a third-party and the operating agreement will delineate the terms of the operation. The agreement will primarily set the performance standards and the specifics of the operating fees.
Outtake Agreement Participants: Developer
By-Product Purchaser
Purpose: A by-product such as electricity, steam or a usable he1 may be produced by the facility and generate revenue for the project.
Recycled Goods Purchase Agreement Participants: 'Developey
Recycled Goods Purchaser
Purpose: The recovered ferrous material and other products may be separated from the wastestream and sold. The revenue from the sale or recycled goods are not normally critical to the profitability of the project.
Disposal Agreement Participants: Developer
Landfill Owner
Purpose: Nonprocessible waste (volume varies with technology) is sent to a landfill for disposal. The disposal agreement will establish landfill availability and the cost of disposal.
Site Purchase / Lease Agreement Participants: Developer
Site Owner
Purpose: The facility site will either be purchased or leased. A key component in the agreement will be receiving the proper indemnification for prior environmental contamination.
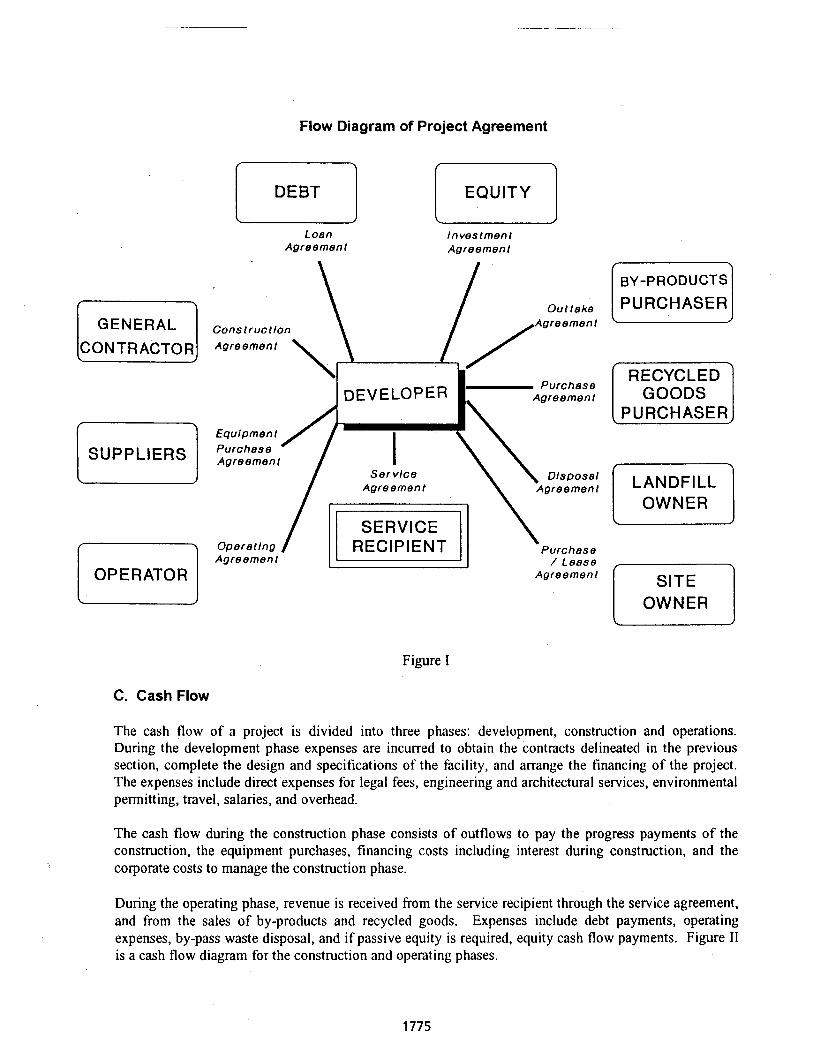
GENERAL
SUPPLIERS E l OPERATOR L?
Flow Diagram of Project Agreement
Loan Agreement
EQUITY E l Investment Agreement
Out take
Conslruct lon Agreement Agreement
DEVELOPER Purchase
Agreement
Equlpmen t Purchase Agreement
Ser vlce Dlsposel Agreement Agreement
Operatlng Purchase Agreement / Lease
RECIPIENT a Agreement
BY-PRODUCTS
PURCHASER
RECYCLED GOODS
LANDFILL OWNER
OWNER rl Figure I
C. Cash Flow
The cash flow of a project is divided into three phases: development, construction and operations. During the development phase expenses are incurred to obtain the contracts delineated in the previous section, complete the design and specifications of the facility, and arrange the financing of the project. The expenses include direct expenses for legal fees, engineering and architectural services, environmental permitting, travel, salaries, and overhead.
The cash flow during the construction phase consists of outflows to pay the progress payments of the construction, the equipment purchases, financing costs including interest during construction, and the corporate costs to manage the construction phase.
During the operating phase, revenue is received from the service recipient through the service agreement, and from the sales of by-products and recycled goods. Expenses include debt payments, operating expenses, by-pass waste disposal, and if passive equity is required, equity cash flow payments. Figure I1 is a cash flow diagram for the construction and operating phases.
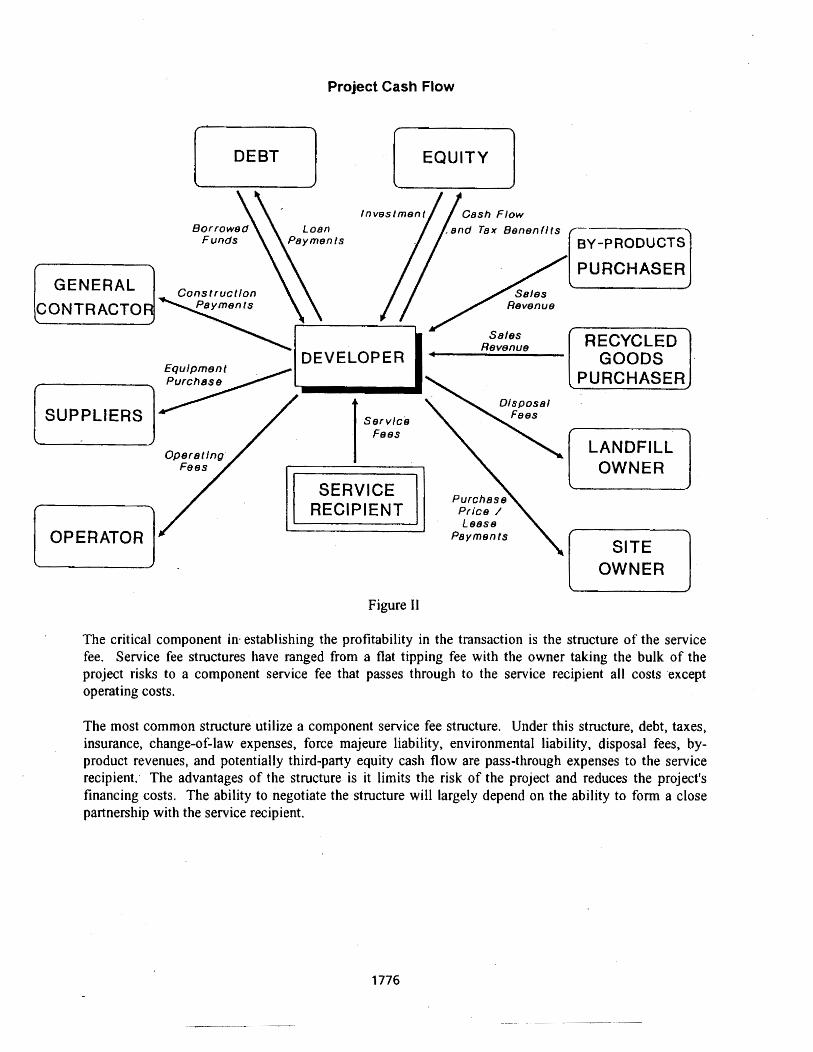
Project Cash Flow
GENERAL
SUPPLIERS C_)
OPERATOR E Figure I1
LANDFILL OWNER
OWNER m The critical component in. establishing the profitability in the transaction is the structure of the service fee. Service fee structures have ranged from a flat tipping fee with the owner taking the bulk of the project risks to a component service fee that passes through to the service recipient all costs except operating costs.
The most common structure utilize a component service fee structure. Under this structure, debt, taxes, insurance, change-of-law expenses, force majeure liability, environmental liability, disposal fees, by- product revenues, and potentially third-party equity cash flow are pass-through expenses to the service recipient. The advantages of the structure is it limits the risk of the project and reduces the project's financing costs. The ability to negotiate the structure will largely depend on the ability to form a close partnership with the service recipient.
D. Project Risks
The major risks of a project are:
Technology Risk The technological risk of a system, especially if the process is the implementation of a new technology, is the primary risk of a project. Mitigating the risk will be past performance of the process, simplicity of system design, and corporate guarantees.
Operational Risks There are both performance and cost risk associated with operation of a facility. .These risks will be mitigated by the application of tested process designs and contractual performance standards. The first risk is the ability of the facility to met volume and other performance standards and the second is the ability to maintain costs while meeting those standards. Contracts with operators (both internal and third-party) with board operations experience and sufficient financial strength to provide operational warranties and will stabilize the project.
Project Development Risk The risks of developing projects are similar across many industries. Time, money and effort must be expended before a project's viability is confirmed. In addition, when dealing with political entities the development process can be protracted. These costs will be recovered if the project is completed, however the costs will be lost if development is not completed. To reduce this risk, the developer will need to be selective in choosing projects, selecting those where the technology has a significant advantage.
Environmental Risk Environmental liability, including s u p e h n d liability, can be broad and encompassing and cannot be eliminated. The risk can be significantly mitigated contractually and through sound operating practices. The developer should receive appropriate environmental indemnities. not take title to waste processed, not accept hazardous material and institute state-of-the-art environmental controls.
Credit Risk The credit risk is the potential lack of creditworthiness of the project participants. The participants to be analyzed include participating municipalities and the varity of project guarantors. The credit risk of the municipalities is a much smaller risk than that of the private entities. Most of the project will have long term obligations and it is ofien difficult to predict the financial stability of an entity over a period of twenty years or more.
Development Financing - A Case Study
The project development tasks to be carried out by the developer are numerous and complex. They can and do vary widely for each specific development; however, they can be grouped into four general categories:
Organization, Roles, Responsibilities and Relationships. Business Development, Services and Products.
Final Engineering, RFP/Proposals, and Permitting. Project Economies, Developer Structure and Project Financing.
Time, like content, varies widely, and schedules must allow for the vagaries of local government productivity. Experience indicates that post-letter of intent, pre-construction project development activities requires at least twelve to fifteen months. This estimate is based on having strong political supporl.
To review the needs and sources for development capital a case study of Entropic Technologies Corporation will be utilized. Entropic is at a transition stage, moving from research and development to product implementation. For the past eight years, Entropic has refined a patented application of twin- screw extrusion technology to municipal solid waste ("MSW"). The process converts MSW to a synthetic coal product. The synthetic coal product is similar to a western coal but with improved BTU, sulfbr and moisture characteristics and is capable of being commingled with natural coal and burned in existing coal fired boilers. The technology is environmentally superior, compatible with recycling and composting, economically competitive, and should be more acceptable to the public than either incinerators or landfills.
A. The Company
En tropic Technologies Corpora tion Formed as a C corporation in the State of Michigan in 1984. By charter, authorized ten thousand shares of common stock. Engaged in applied research and development in solid waste management technology. R&D primarily financed by solid waste research strategy grants from Michigan State Government. R&D and subsequent engineering successfblly accomplished by forming a multi-disciplinary team from internationally recognized finns. Technology is new, process engineering based firmly on proven, industrial equipment manufactured by reliable firms. Process and products underwent a strenuous EPA environmental testing regimen dictated by the Michigan Department of Natural Resources as an integral part of the grants. Entropic progressed from R&D through engineering design, pilot plant testing and has commenced marketing. Holds exclusive licenses to U.S. and foreign counterpart patents and patent applications to the Entropic technology.
Competitive Advantages of Entropic Technology Diversion of up to 85% by weight of MSW from landfills. Recovery of approximately 95% of the potential energy contained in MSW.
- Production of a high quality, solid fuel, which can be combusted at a time and place of choice in any boiler that accepts coal. No incineration of MSW in the process. Accomplished in compliance with all government environmental standards, in many cases by orders of magnitude. Accomplished at competitive or better economics than alternative disposal systems.
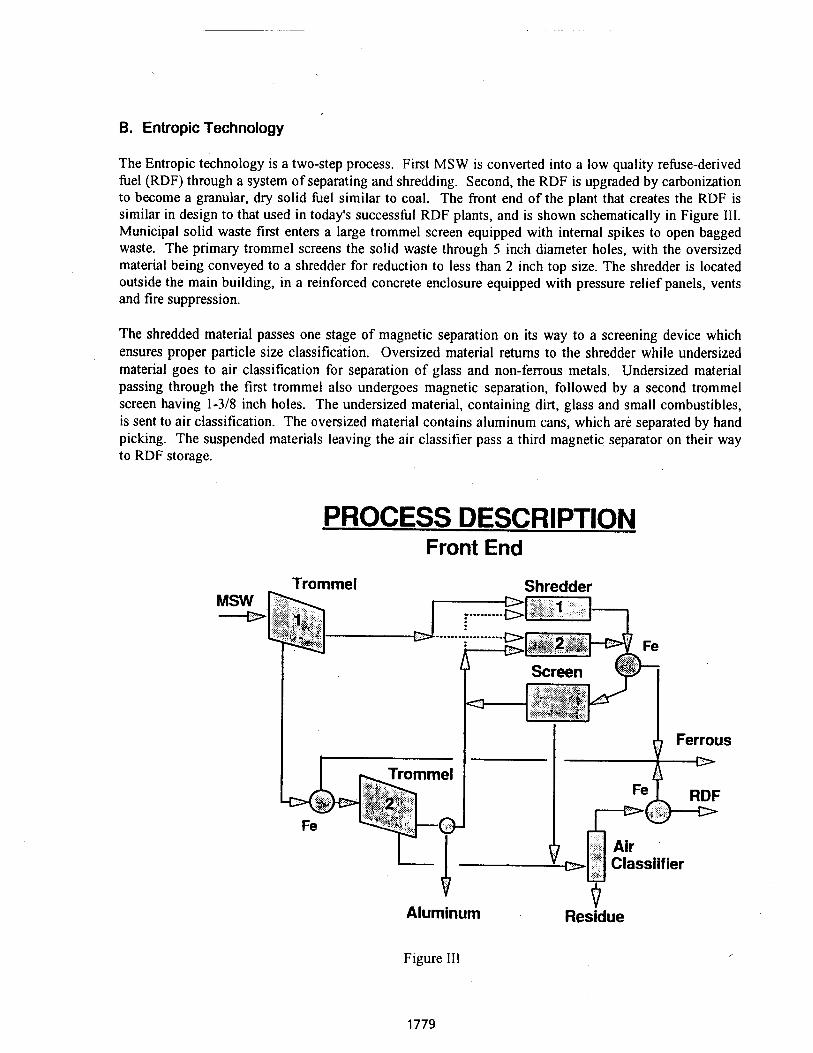
B. Entropic Technology
The Entropic technology is a two-step process. First MSW is converted into a low quality refuse-derived fuel (RDF) through a system of separating and shredding. Second, the RDF is upgraded by carbonization to become a granular, dry solid fuel similar to coal. The front end of the plant that creates the RDF is similar in design to that used in today's successful RDF plants, and is shown schematically in Figure 111. Municipal solid waste first enters a large trommel screen equipped with internal spikes to open bagged waste. The primary trommel screens the solid waste through 5 inch diameter holes, with the oversized material being conveyed to a shredder for reduction to less than 2 inch top size. The shredder is located outside the main building, in a reinforced concrete enclosure equipped with pressure relief panels, vents and fire suppression.
The shredded material passes one stage of magnetic separation on its way to a screening device which ensures proper particle size classification. Oversized material returns to the shredder while undersized material goes to air classification for separation of glass and non-ferrous metals. Undersized material passing through the first trommel also undergoes magnetic separation, followed by a second trommel screen having 1-318 inch holes. The undersized material, containing dirt, glass and small combustibles, is sent to air classification. The oversized material contains aluminum cans, which are separated by hand picking. The suspended materials leaving the air classifier pass a third magnetic separator on their way to RDF storage.
PROCESS DESCRIPTION Front End
Trommel
Aluminum Residue
Figure 111
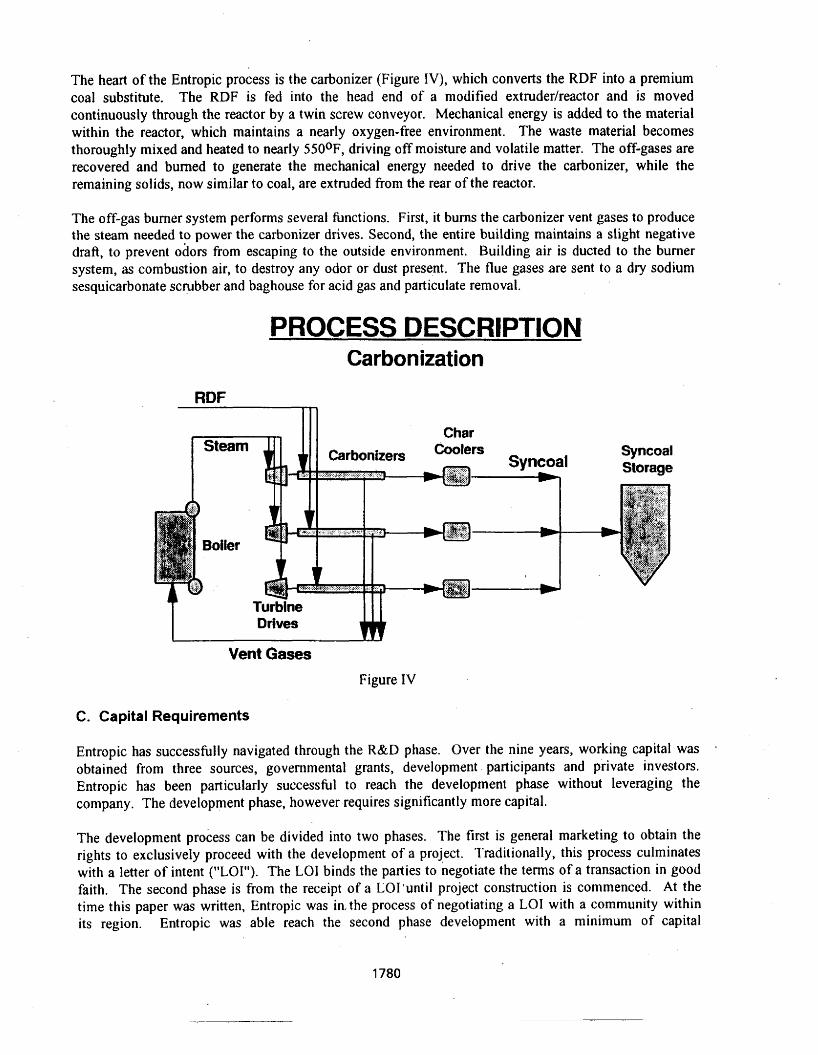
The heart of the Entropic process is the carbonizer (Figure IV), which converts the RDF into a premium coal substitute. The RDF is fed into the head end of a modified extruderlreactor and is moved continuously through the reactor by a twin screw conveyor. Mechanical energy is added to the material within the reactor, which maintains a nearly oxygen-free environment. The waste material becomes thoroughly mixed and heated to nearly 550°F, driving off moisture and volatile matter. The off-gases are recovered and burned to generate the mechanical energy needed to drive the carbonizer, while the remaining solids, now similar to coal, are extruded from the rear of the reactor.
The off-gas bumer system performs several functions. First, it bums the carbonizer vent gases to produce the steam needed to power the carbonizer drives. Second, the entire building maintains a slight negative draft, to prevent odors from escaping to the outside environment. Building air is ducted to the bumer system, as combustion air, to destroy any odor or dust present. The flue gases are sent to a dry sodium sesquicarbonate scrubber and baghouse for acid gas and particulate removal.
PROCESS DESCRIPTION' Carbonization
RDF rn
- 1 1 1 Char I Steam 1 Coolers Syncoal
Storage
Vent Gases
Figure I V
C. Capital Requirements
Entropic has successfblly navigated through the R&D phase. Over the nine years, working capital was -
obtained from three sources, governmental grants, development participants and private investors. Entropic has been particularly successful to reach the development phase without leveraging the company. The development phase, however requires significantly more capital.
The development process can be divided into two phases. The first is general marketing to obtain the rights to exclusively proceed with the development of a project. Traditionally, this process culminates with a letter of intent ("LOI"). The LO1 binds the parties to negotiate the terms of a transaction in good faith. The second phase is from the receipt of a LOI'until project construction is commenced. At the time this paper was written, Entropic was in.the process of negotiating a LO1 with a community within its region. Entropic was able reach the second phase development with a minimum of capital
expenditures by concentrating on regional communities and using self-hnded marketing representatives worldwide.
The capital requirements for the next phase will fund:
Architectural and engineering fees to obtain detailed plans for the construction of a facility. Legal fees to negotiate and draft the documents previously mentioned. Consultant fees for waste stream analysis. Salaries and corporate overhead. Travel and entertainment. Environmental permitting.
Depending on the project, these expenses can reach $3 million. Entropic has the additional burden of drafting plans for its first project, detailed drawings are not on the shelf.
D. Funding Alternatives
To fund the capital requirements Entropic has the following alternatives listed in the order of preference.
Vendor Financing Financing obtained from the major project participants. These include, equipment suppliers, the general contractor, the operator and the law firm. Financing may come as a direct investment of cash or work-in- kind.
Availability The extent vendor financing is available is dependent upon the size of the project, the vendor's and project's profitability, the potential for repeat business. In general the greater the opportunity for the vendor the greater its interest.
Cost Venddr financing will be the least costly. The lower cost is because the vendor will be receiving profits from other portions of the project. A vendor may choose to participate at a level equivalent to its profitability in the project and if the project is secure, the vendor receives a sound investment as its upside in the project. The major advantage of vendor financing is the ability of the vendor to participate by internally funding or providing work-in-kind for portions of the project. If fees for engineering or legal services can be deferred until the project is under construction Entropic will receive real cash flow savings. The return to the investor can either be a priority return of investment, ownership in the project or ownership in the developer.
Advantages The main advantage of vendor financing is commonalty of purpose of the parties and the overlapping benefits of jointly participating.
Private Investors Private investors are high net worth individuals that have an appetite for venture capital. Private investors are differentiated from corporate and institutional investors because they have greater flexibility, will potentially assume greater risk, are not bound by the corporate restraints, but do not have the resource to match corporate entities.

A vaila bili fy Private funds are available, however, may be difficult to obtain. Normally contact is obtained through personal relationships with the participants or others connected with the developer. There is not as defined market to access individual as with corporate entities.
Costs The costs of the private funds will be cheaper than other third-party investors. Individuals will often have higher levels of acceptable risk and do not carry the burden of high overhead costs and corporate inefficiencies. Investors will be seeking high returns and therefore prefer equity interests and will want a share of the developer.
Advantages The advantages of private investors are their ability to adapt to the needs of a project, higher risk profiles and no overhead.
Developer Financing By differentiating developer financing my intent is to segregate third-party entities that are not project participants, but are involved in project development. The entity may or may not be a competitor. Other developers will have greater attraction as participants than passive parties because (i) they understand the development process and need less education, (ii) participating with other entities may within their business plan, (iii) synergy may be obtained and (iv) they may bring added value to the projects. The downside of developer financing is the ability to preserve control of your entity. The downside of participating with other developers is the struggle to maintain control of the entity. Often the objective of another developer will be to control if not engulf the original entity.
A va ila bility The availability of participating developers is dependent on the upon the stage of project development, the industry, and the level of control the party seeking hnds wishes to preserve. In general, the greater your market, the more unique your product and the more control you are willing relinquish, the greater the potential market.
Cost The cost will be loss of significant ownership in the entity or the projects developed. Other developers are not interested in loaning money but want upside income potential. One method of preserving your corporate ownership is to offer ownership in specific projects. This strategy may have an appeal to the investor because the projects, not the company, are the revenue producers. This will be particularly attractive to developers such as Entropic that have a new technology and will create the greatest value through proving its technology rather than through ownership of the first facility.
Advantages The advantages of another development entity being the investor are: (i) the partner will understand the business if not the industry, (ii) the due diligence period should be shorter and (iii) the money will be cheaper than passive equity.
institutional and Corporate Passive Equity Passive equity are venture capitalist and others that are not in the business of development or participating in the operations of the entity, but purely desire a return on their investment. The participant can take the form of financial institution, a finance subsidiary of a industrial corporation, an
investment fund, or a pension find. These parties, however, do not have a high risk appetite and usually require significant portions of project negotiations to be completed prior to their participation.
Availability These investors are available but have a narrow focus. Their mandate is often limited and prevents the entities from participating in many projects. For example, a couple funds limit themselves to companies with operating environmental facilities and the prospects of going public in a three to four year horizon, another wants small power facilities, while an institutional investor desires projects only after full contracts have been obtained.
Cost The capital is expensive. Usually at least a 25% after tax return and a share of the company. The entity may institute control of the group and prevent incremental financing. In addition, most passive investors require extended due diligence periods and outside advisors to review a transaction. Unlike others mentioned, they may limited knowledge of an industry and are under strict management control.
Advantages The primary advantage is the capital, albeit expensive, may save a project. The other advantage is they will permit the entity to be preserved and have a like incentive for success.
Entropic Strategy
The strategy to obtain capital will follow a priority list. First, obtain as much vendor support as possible, even to the extent of selecting those suppliers who offer the greatest potential for support. For this support, project ownership, future participation and the ability to develop the technology in other locations can be offered. As a minimum, obtain work-in-kind commitments from the vendors. Second, work with private investors to obtain internal working capital giving the participant equity and a priority distribution of capital if the project collapse and the technology is sold. Third, work with other developers to obtain any remaining funds. And fourth, be self-funded by deferring compensation if necessary and instituting tight financial controls.
Two other sources of funds were not mentioned are government grants and initial public offerings. With respect to Entropic, grant money has already been utilized thorough the R&D phase and an IPO before a track record for the technology would be premature.
Project Financing
A project financing provides capital for the construction and operation of a facility. The phrase "project" denotes the investors security is solely from the revenue generated from the project and not a corporate credit. An analogy is a revenue bond issue as compared to a general obligation. To secure investments in projects, investors will seek structural security to stabilize the project cash flow and reduce the project's risk. Structural methods include operator and equipment guarantees, long-term agreements with all parties, reserve funds, and third-party financial guarantees. The benefits of the financing to the developer are: ( i ) funds are provided by external sources for the full capital cost of the facility, ( i i ) the financing is off-balance sheet for the developer and repayment of debt and equity can be accounted as current obligations, (iii) liability is isolated, (iv) efficiently passes tax benefits of ownership, and (v)
developer may not have a strong balance sheet and the project structure affords the ability to obtain financing.
Components
The components of a financing are generally categorized as either debt or equity. Debt is senior to equity and has returns commensurate with the risk. Debt can be differentiated by security through establishing tiers with some components senior and others subordinate. It can also be segmented by maturity with tranches for construction ( 1-2 years), medium-term (up to 10 years) and long-term (up to 25 years). Debt providers can either be the public or financial institutions with issues either tax-exempt or taxable.
Equity can be provide by the developer or a third-party. Often third-party financing is utilized to free the developers equity for fbrther development and to efficiently pass on the tax benefits of ownership. If third party equity is used, either a partnership or leveraged lease structure is utilized. Characteristics of a lease are: (i) structure and tax law are well defined and known; (ii) term, payment schedule, renewals and purchase options, and amount of investment are restricted by tax law and accounting standards; (iii) both
, Lessee and lessor receive favorable tax treatment and (iv) preferred structure by investors. Limited partnership's characteristics are: (i) great structural flexible, ( ii) less favorable book accounting for investor, (iii) residual value can flip back to developer, (iv) preferred structure of developer.
Case Studies
WTE facilities in the 1980's established the market for utilizing project financing for privately-owned environmental facilities. Reasons why project financing was applicable are: (i) the facilities served an essential governmental purpose, Cii) long-term contracts were available, (iii) developers and investors pursued financings and (iv) facilities possessed favorable tax benefits. Space does not permit extensive discussion on each of the four projects to be review, therefore I will summarize the major components and illustrate the unique features of the financings. Each project was unique and so the financings reflected the features of the project. In project financing, many general parameters apply, however, each project must be uniquely structured to match the transaction and the participants. For this reason, the financing structure is appropriate if the transaction is large (a minimum of $10 million, preferably $25 million in capital cost) to amortize the fixed fees, the parties are sophisticated, and the proformas show a
- high probability of long-term profitability. Of the projects listed, all were and are successful investments.
Case I
Asset size:
Technology :
Structure:
Participants :
$3 10 million capital cost, 1,800 tons per day capacity.
RDF, selling electricity only.
Sale-lease, leveraged lease. The municipality was the initial owner of the facility and sold it to the investor. The developer and operator was converted to lessee.
Municipality as service recipient Municipality as seller of facility Municipality as lender Third-party investor as lessor Developerloperator as lessee
Guarantees:
Comments:
Case 11
Asset size:
Technology:
Structure:
Participants:
Guarantees:
Comments:
Case 111
Asset size:
Technology:
Structure:
Performance guarantees from parent of operator and limited guarantee from seller
The truly unique aspect was the sale-lease structure and the role the municipality as lender. This was not the original structure of the financing but was used to convert a municipally owned facility to private ownership. Originally general obligation debt was sold by the municipality to pay for the construction of the facility. When the facility was sold, the debt had a claim on the GO of the municipality but not the asset. Therefore, the municipality was free to offer and structure a seller's note for the roughly 80% of the purchase price. The investor provide cash for the remaining amount. An analogy would be an individual builds a home on a signature loan and not a mortgage. Later, helshe sells the home and offers the purchaser a land contract.
$180 million capital cost, 1,500 tons per day capacity.
Mass-bum, selling electricity only.
Sale-leaseback, leveraged lease. The developer built facility under separate financing and secured long-term financing with equity investor and insurance companies as lenders. The developer was the lessee.
Multiple municipalities as service recipients Developer as lessee and sister entity as operator Multiple insurance companies as lenders Third-party investor as lessor
Performance guarantees from parent of operator.
This project is unique because it is a merchant facility. The project was developed without contracting the capacity on a long-term basis. The developer selected an area that needed waste disposal services, found a municipality willing to allow a facility to be sited in turn for a sweetheart disposal contract and found another municipality to allow the same for an ash monofill. Then approached other communities to fill the capacity. This is the opposite of the norm where the municipality selects vendors rather than the vender selecting municipalities. The merchant aspect was exemplified by one-half of the capacity contracted for under short-term agreements (3-5 years). The cash flow was significantly at risk for changes in market conditions. The project was able to be financed because the project cash flows, even in significant downside scenarios, supported both debt and equity payments.
$260 million capital cost, 2,250 tons per day capacity.
Mass-burn, selling electricity only.
Sale-leaseback, leveraged lease. Tax-exempt was issued to build the facility and converted into term debt.
Participants:
Guarantees:
Comments:
Authority as service recipients Developer as lessee and sister entity as operator Tax-exempt public debt as lenders Third-party investor as lessor
Lessee obligations guaranteed by parent
This is not a pure project financing. The lessee's parent guaranteed the obligations of the lessee which sets it apart from the other transactions and because an authority was established as the service recipient. The authority was utilized to ban several communities together. The benefit of the authority was that payment obligations were joint and several on the participating communities. If one community failed to make a payment, the other communities would pay its share to preserve the financing and then have remedies against the default member. Without this provision the financing would be significantly more complicated, risky and costly.
Case IV
Asset size: $50 million capital cost, 510 tons per day capacity.
Technology: Mass-burn, selling electricity only.
Structure: Sale-Iease, leveraged lease.
Participants: County as service recipients Developer as lessee and sister entity as operator Tax-exempt public debt as lenders Third-party investor as lessor
Guarantees:
Comments:
Performance guarantees from parent of operator.
This project is not a pure project financing because of the parent guarantee of the lessee obligations including payment obligations. However, the structure is also a bifurcated credit, meaning if the county did not hlfill its obligations to make payments and this causes a default by the lessee, the investor can only pursue remedies against the county and not the lessee. The investor has remedies against the lessee, however, if the failure of the county to make payments is the result of failure of the lessee to perform. therefore, the guarantee does not cover county defaults.
CASE STUDY: 1-95 LANDFILL GAS RECOVERY PROJECT FAIRFAX COUNTY, VIRGINIA
M. J. McGuigan, P.E. and E.R. Peterson, P.E. SCS ENGINEERS
11260 Roger Bacon Drive Reston, Virginia 22090
J. M. Smithberger County of Fairfax
Division of Solid Waste Disposal and Resource Recovery 12000 Government Center Parkway, Suite 324
Fairfax, Virginia 22035
W.L Owen Michigan Cogeneration Systems, Inc.
25000 Novi Road Novi, Michigan 48375
Abstract
This paper presents a case study of the landfill gas (LFG) recovery project at the 1-95 Landfill in Fairfax County, Virginia. The project originally was conceived more than 10 years ago and has overcome numerous obstacles enroute to its present success. The efforts of the landfill owner (Fairfax County) and the project developer (Michigan Cogeneration Systems, Inc.) to surmount these obstacles are presented.
introduction and General Overview
The 1-95 Landfill Gas-to-Electricity project was developed in two phases with commercial operation beginning in January 1992 for Phase I and February 1993 for Phase 11. Each phase of the project consists of four (4) Caterpillar 3516 spark-ignited engines, located in adjacent structures at the 1-95 Sanitary Landfill in Fairfax County, Virginia. Each facility utilizes landfill gas (LFG) as its only fuel source and produces 3,200 kW gross. After internal parasitic losses, each facility nets approximately 3,050 kW for export to the local utility, Virginia Power. The combined 1-95 facility exports approximately 6,000 kW of power to Virginia Power.
This paper reviews the project in detail, providing the perspective of both the County of Fairfax (landfill operator) and Michigan Cogeneration Systems (project developer) and identifying impediments to project development specific to this site and to the industry in general.
Fairfax County
History of the Landfill
In 1971, a Memorandum of Understanding between the District of Columbia (the District) and Fairfax County (the County), Virginia, established a joint landfilling operation on District- controlled property in the southern part of Fairfax County. The landfill operated as an interim sanitary landfill until 1983, when Fairfax County assumed all responsibility for the operation of the facility. Since this date, the 1-95 Sanitary Landfill has been the only municipal waste disposal facility in the Northern Virginia region, including the District of Columbia.
The facility, with its official title of the 1-95 Resource Recovery and Land Reclamation Project, occupies nearly 300 acres of a 3,000-acre complex controlled by the District of Columbia.
From the late 1970s through mid-1984, the 1-95 Landfill accepted municipal sewage sludge, co- disposed with the municipal solid waste. The sludge volume approached nearly 400 tons per day (average 25 percent solids) co-disposed with 5,000 to 6000 tons per day of municipal solid waste. The co-disposal of sludge was halted in 1984, as sanitaly landfill disposal of sludge was no longer accepted by the Commonwealth of Virginia's Health Department. The daily tonnage of municipal solid waste climbed to nearly 7,500 tons per day through the late 1980s. The landfill has nearly 17.5 million tons of refuse in place.
An Energy Resource Recovery Facility has been constructed at the 1-95 Landfill and was placed into service in June 1990. The facility currently bums 3,000 tons per day of the refuse stream, significantly reducing the amount of raw waste being landfilled. The plant presently produces 70 MW of power for sale to Virginia Power. At present, the landfill receives primarily by-pass waste materials at a rate of 300 to 500 tons per day.
History of the LFG Project
The first evaluation of the feasibility of LFG recovery at the 1-95 Landfill was conducted by SCS Engineers. This evaluation was performed under a grant by the Department of Energy to the District of Columbia in 1982. A pump test program was conducted to estimate the gas generation from the landfill and a sulvey of nearby energy users was conducted. At that time, energy recovery was concluded to be technically and economically feasible.
The energy users identified included three District of Columbia prisons near the landfill that could utilize landfill gas as boiler fuel. In addition, generation of electricity from landfill gas with sales to Virginia Power were deemed viable. However, landfill gas recovery was not pursued further at that time due to several issues, including:
Landfill operations and ownership made it unclear who owned the gas rights as the County took over control of the landfill in 1984; and
The District entered long-term energy contracts with a natural gas utility during that time period, which made landfill gas as an alternative fuel less desirable.
Subsequently (since the early-1980s), the County endeavored to work with several developers to utilize the landfill gas resources at the 1-95 Landfill. A Request for Proposal (RFP) originally was issued in 1985 and a developer was selected. The developer chose high Btu conversion of gas to pipeline-quality natural gas as the utilization method. However, economic conditions halted the project while still in the planning stages; and the contract eventually was cancelled.
In February 1990, the County issued a new RFP for gas recovery at the 1-95 Landfill. The County had gathered a great deal of information regarding public/private landfill gas projects since the original contract several years earlier, and a sizable effort was given to tailoring a new RFP specifically for the 1-95 Landfill facility. The RFP that was issued has several unique requirements:
1. The County would retain control over the gas extraction wells, and the developer could not install any wells at the site.
2. The County would operate the well field for the developer for a set yearly fee.
3. The developer could only have a set amount of gas-rights, not those to the whole facility.
4. A rigorous performance schedule also was required from the developer.
Michigan Cogeneration Systems (MCS) was selected as the most qualified proposer from the RFP process; and in December 1990, MCS and the County executed an agreement giving MCS gas rights at the landfill. The agreement further established operating criteria for the MCS facility. A key success factor in the MCS proposal was their fast-tracked construction schedule.
Landfill Gas Collection System * . The front end of any landfill gas recovery project is the collection system. At the time of development of this project, the County already was operating a perimeter collection system consisting of approximately 50 vertical wells along the southern boundary of the landfill. This system is operated to provide off-site landfill gas migration protection and has extraction wells both within and outside the refuse. A ground flare is operated continuously and has the capability of handling 1,300 scfm of landfill gas.
An additional main collection system, consisting of 15 vertical wells, was installed to supplement landfill gas to the Phase I MCS facility. The wells varied in depth from 50 to 100 feet and all are located within the refuse. This system is coupled with the perimeter collection network, and
can transfer gas to either the flare or MCS, as needed. This collection system has provided 100 percent of the Phase I power plant's fuel requirements. Each of the Phase I and I1 power plants consumes approximately 1,150 cfm of landfill gas, with a gas quality maintained at approximately 55 to 58 percent methane.
An additional 65 vertical wells have been installed and are in the process of being connected to the overall collection system. The additional gas fuels the MCS' Phase I1 facility and supplementary flares operated by the County.
As mentioned previously, the contract between MCS and the County stipulated that the collection system be maintained under County control. This is a somewhat unusual condition in a recovery project as the developer normally wants complete control of his fuel supply. At this site, however, the more critical issues from the County's perspective were to maintain migration and odor control through consistent operation of the collection system.
Due to the fast-track nature of the project, diverting gas from the perimeter collection system was necessary, thereby precluding the possibility of separate migration control and recovery collection systems. To make the project work, the County had to take the initiative to operate the collection system while both relieving the developer of LFG migration liabilities, and guaranteeing a minimum fuel supply quantity and quality.
MCS' Development Process
Prior to the execution of the Gas Rights Agreement between MCS and the County, MCS accomplished several development activities in an effort to streamline the project development process. The following summary describes the development activities that occurred before and after the signing of the Gas Rights Agreement with the County.
Utility Contract: MCS successfully negotiated a Power Sale Agreement with Virginia Power in December 1989, thereby establishing a market for the energy that would be generated by the project.
Air Permit: MCS submitted its application to the Virginia Department of Air Pollution Control in August 1990. MCS received the "authority to constructt' in late December 1990.
Contract Signing: MCS and the County executed the Gas Rights Agreement in December 1990.
Site Preparation: The only site available to MCS was a narrow ravine that was adjacent to the landfill. The site preparation proved to be a significant challenge after trash was encountered while installing the storm drain that was to run under the site. The presence of the trash was unexpected to MCS, since the site was assumed to be on virgin soil. Dynamic compaction was performed to consolidate the in-place soils and refuse. The site was then monitored for settlement by the County over the next 120 days with no settlement detected during the monitoring period.
Engineering and Construction: MCS hired an engineering and construction firm in February 1991 to provide engineering, procurement, and construction for the project.
- Engineering: The project plans were submitted to the County Building Department in June 1991. The plans were approved in late August. The approval process took over 3 months.
- Construction: Due to delays encountered as part of the engineering process, the construction schedule was expedited. The construction for Phase I began on September 3, 1991. On November 14, 1991, the facility successfully paralleled and exported power to Virginia Power. The local construction company as well as the on-site construction manager were relentless in achieving the goal of being operational by mid-November (72 days after breaking ground).
Plant Design Philosophy
MCS spent considerable time examining other landfill gas-to-electricity projects in an effort to establish a clear design philosophy from which the plant could be built. The investigation results revealed that many projects that were encountering problems had paid insufficient attention to the proper selection of equipment for the LFG application. The utilization of used and/or outdated equipment for the sake of capital savings appeared to be a fundamental reason for project problems at a variety of sites. MCS determined that the design philosophy would include utilization of equipment of proven design that had been adapted specifically for use on landfill gas.
In addition, Fairfax County desired an attractive facility and worked in tandem with MCS to provide a showcase system. The building is constructed of split-face block and provides an eye- pleasing facade near the landfill entrance. Inside, the four engine-gensets are well-spaced among an array of clearly-labeled pipes, conduits, and appurtenances. Such features are important from a public relations standpoint and highlight the benefits that can be obtained from a landfill, which the public normally views as a nuisance.
Landfill Gas Handling and Preprocessing
The Phases I and I1 power plants are virtually identical in every regard. The main consideration relative to the gas handling system was to provide the Caterpillar engines with gas at a minimum of 2 psi, filtered, and free of liquids. This meant that other than providing good filtering of the gas to remove silica and particulates, no "processing" of the gas would be required. A flow schematic is presented in Figure 1. LFG first enters a primary filter separator which removes free liquids as well as particulates down to 1.0 micron. The gas then enters the 100 hp blower where it is compressed to approximately 6 psig. Then the gas is cooled in a air-to-air heat exchanger. The liquids which precipitate during the cooling process are removed by a trap and collected in a condensate storage tank. The gas then passes through a temperature control valve where its temperature is maintained at a preset level for emissions control. The gas then enters the final gas filter where any free liquids are once again removed as well as particulates down to 0.3 microns. The gas is then transported by a stainless steel header to each of the engines1 generators. Due to corrosion concerns, all gas piping in the plant is stainless steel.
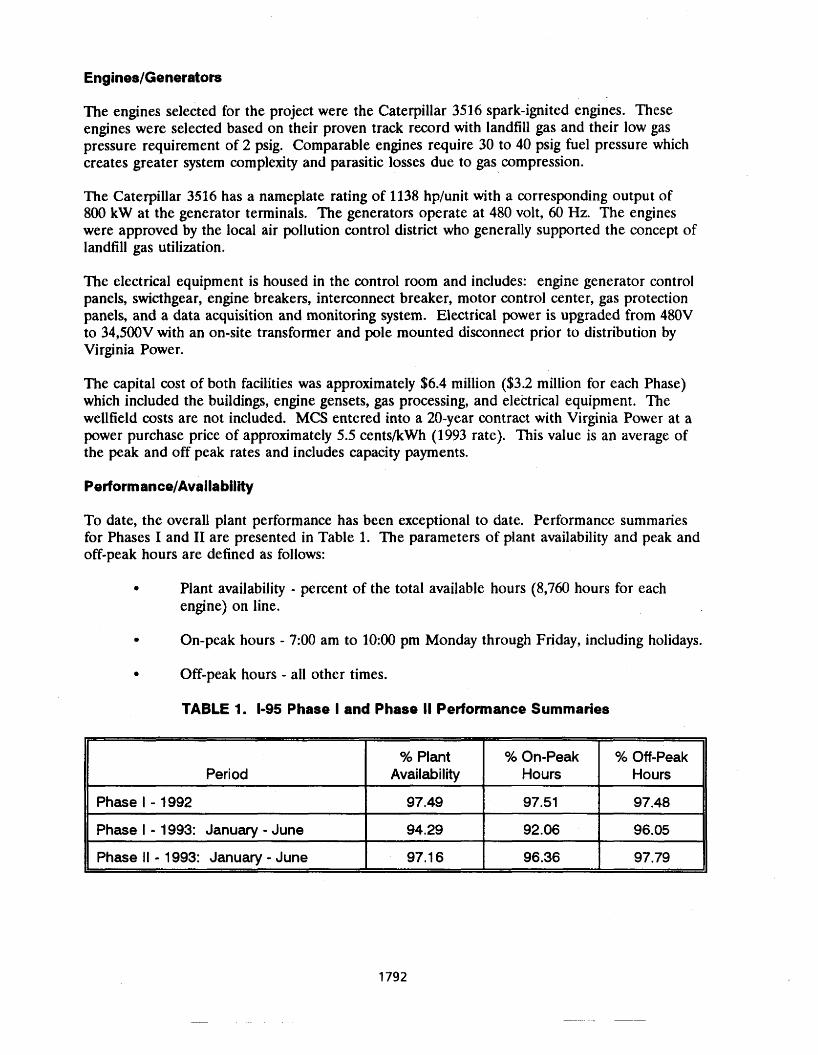
The engines selected for the project were the Caterpillar 3516 spark-ignited engines. These engines were selected based on their proven track record with landfill gas and their low gas pressure requirement of 2 psig. Comparable engines require 30 to 40 psig fuel pressure which creates greater system complexity and parasitic losses due to gas compression.
The Caterpillar 3516 has a nameplate rating of 1138 hp/unit with a corresponding output of 800 kW at the generator terminals. The generators operate at 480 volt, 60 Hz. The engines were approved by the local air pollution control district who generally supported the concept of landfill gas utilization.
The electrical equipment is housed in the control room and includes: engine generator control panels, swicthgear, engine breakers, interconnect breaker, motor control center, gas protection panels, and a data acquisition and monitoring system. Electrical power is upgraded from 480V to 34,500V with an on-site transformer and pole mounted disconnect prior to distribution by Virginia Power.
The capital cost of both facilities was approximately $6.4 million ($3.2 million for each Phase) which included the buildings, engine gensets, gas processing, and electrical equipment. The wellfield costs are not included. MCS entered into a 20-year contract with Virginia Power at a power purchase price of approximately 5.5 cents/kWh (1993 rate). This value is an average of the peak and off peak rates and includes capacity payments.
To date, the overall plant performance has been exceptional to date. Performance summaries for Phases I and I1 are presented in Table 1. The parameters of plant availability and peak and off-peak hours are defined as follows:
Plant availability - percent of the total available hours (8,760 hours for each engine) on line.
On-peak hours - 7:00 am to 10:OO pm Monday through Friday, including holidays.
Off-peak hours - all other times.
TABLE I . 1-95 Phase I and Phase I1 Performance Summaries
Period
Phase 1 - 1992
Phase 1 - 1993: January - June
Phase 11 - 1993: January - June
% Plant Availability
97.49
% On-Peak Hours
97.51
% Off-Peak Hours
97.48
96.05 94.29 92.06
97.1 6 96.36 97.79
These high levels of performance are attributed to:
The County's willingness to modify the collection system to supply sufficient fuel.
The selection of proven equipment designed for LFG application.
The performance of a meticulous routine maintenance program by MCS' plant operator during off peak hours.
The operator's compensation package includes performance incentives.
The maintenance is being performed by MCS according to Caterpillar's recommended maintenance procedures and intervals. Oil changes have been performed at between 650 to 750 hours per engine.
Environmental Emissions
The engines are permitted by the Virginia Department of Air Pollution Control for the following limits:
Nitrogen oxides 2.0 grams/hp/hr Carbon monoxide 2.04 grams/hp/hr Non-methane hydrocarbons 0.461 grams/hp/hr
In order to maintain the engines emissions at a constant level, the combustion air-to-fuel ratio must be controlled by maintaining both the air inlet temperature and the gas inlet temperature to the engine at preset levels. These temperatures are maintained by use of temperature control valves. By controlling these parameters, the air-to-fuel ratio and, therefore, the engine emissions remain constant, regardless of ambient temperature changes.
System Expansion
At present, no plans have been made to further expand the LFG-to-electricity project, despite the availability of excess quantities of LFG. The limiting factor to expansion is a recent decision by Virginia Power to reduce the plant capacity of independent power producers from 3,MW to 100 kW for capacity payments. This new capacity ceiling virtually eliminates expansion at the I- 95 Landfill as well as any new LFG-to-electricity projects in other parts of Virginia.
A second limitation on expansion is the new nitrogen oxide (NO,) limits for defining a major source in ozone non-attainment areas, per the Clean Air Act amendments. These new limits became effective in November 1992, and require major sources of NO, (greater than 50 tons per year [tpy]) to provide offset emissions equal to 1.2 times the NO, emissions. This 50-tpy threshold limits the size of an LFG-to-electricity power plant (using lean burn technology) to . approximately 2 MW.
Due to these impediments, the County now is considering alternative LFG uses for the future. One possible use is to fuel a sludge incinerator at the County's Lower Potomac Wastewater Treatment Plant.
Conclusion
Overall, the 1-95 LFG Recovery Project has been successful. LFG recovery has provided significant revenue to MCS and the County in addtion to controlling odors and off-site gas migration. As has been discussed, the project has had its share of hurdles to overcome. In fact, under present conditions with Virginia Power's altered contract requirements and federal emissions limits, the project might not have succeeded.
The key ingredient to solving the project's problems and making the project work has been the joint commitment by the County and MCS. The combined determination of both parties to the successful project completion was exemplified by:
The County's persistent pursuit of a recovery project, even after the failed efforts of the initial developer;
The willingness of MCS to yield control of the collection system to the County to permit the County to maintain its goal of odor and gas migration control;
The County's cooperation to assure MCS of an adequate fuel supply, including installation of temporary pipelines to connect remote wellfields to the MCS plants; and
MCS' careful advance planning and organization, including securing the power sales agreement and the required air permits for the project.
Although LFG recovery projects differ regarding their technical requirements and site-specific impediments, the above elements of cooperation and planning can contribute greatly to any project's success.
References
Michigan Cogeneration Systems, Inc. 1990. County of Fairfax 1-95 Landfl Gas Utilization Proposal. San Diego, CA.
Owen, W. June 1992. "1-95 Gas to Electricity Project Utilizing Caterpillar 3516 Engines." Landfill Gas Energy Utilization: Technology Options and Case Studies, EPA-600/R- 92- 1 1 6. San Jose, CA: EMCON Associates.
Smithberger, J. M., and W. L. Owen. 1992. "1-95 Landfill Gas to Electricity Project Fairfax County, Virginia." In Proceedings of the Fifleenth Annual Landw Gas Symposium, 3/24-26. Arrington, VA: Solid Waste Association of North America.
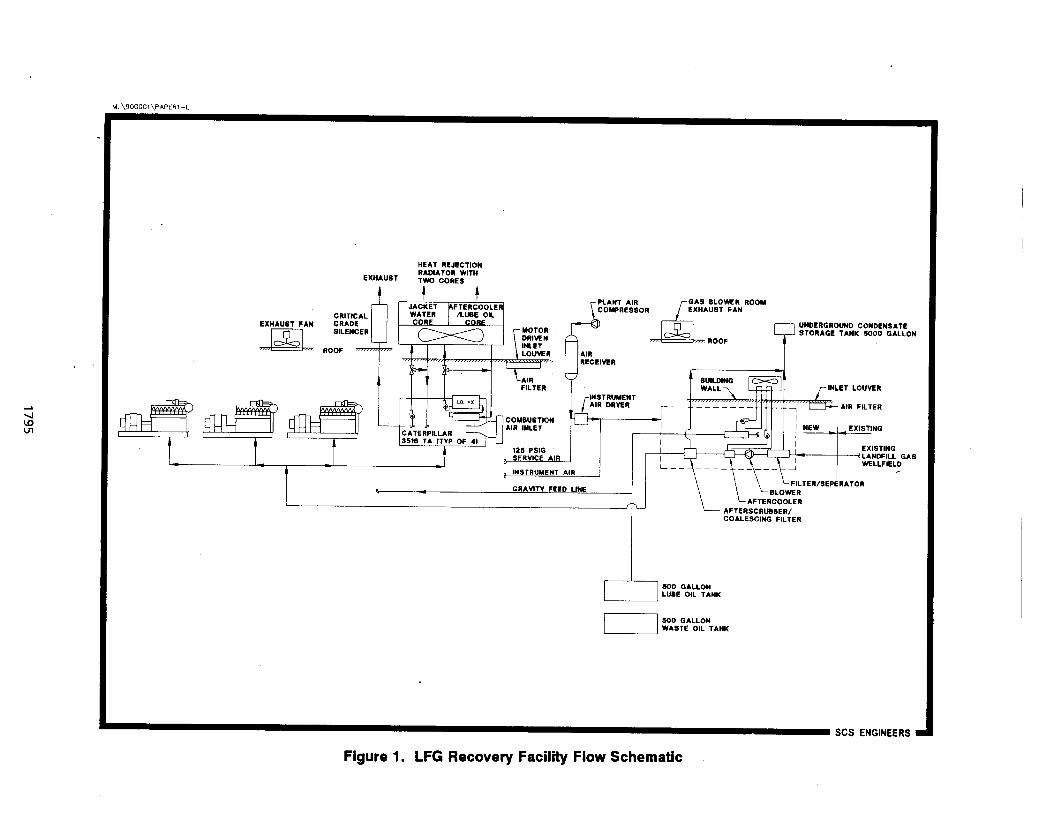
Power from Municipal Solid Waste
Adriano Fidalgo dos Reis, BSEE, Project Manager CESP - Companhia Energetica de S l o Paulo
P.O. BOX 30.776 - SAO PAULO, BRAZIL
Abstract
This paper evaluates the energy production potential from urban wastes for several cities in Latin America.
Technologies available for transforming wastes into energy are reviewed and the high efficiency and low pollution levels obtained are discussed based on some very successful examples in the developed countries.
*
Several criteria to help plan a plant and choose its location and appropriate size are presented under the framework of environmental and energy constraints. Economic and financial feasibility, barriers to the introduction of new technologies and their transfer to developing countries, and political obstacles created by the lobby that is taking advantage of the present situation are presented.
Management of such plants can be carried out by private enterprise, the public sector, or a mix of both. Models to manage such activity are presented that take into account different forms of ownership.
The route for implementing such plants requires that a social communication program be well designed to touch and inform the public about the importance of the plants; it should also emphasize the gains to society. Marketing strategies are presented that will highlight life quality improvement and preservation of the environment to decision makers and the public.
A case study for the city of Sio Paulo, Brazil, will be discussed in detail, showing how several levels of decision makers are involved in the preparation of the feasibility study and in raising financial resources both inside and outside the country. The study is for a large plant with a capacity of 1,800 ton/day and the generation of 27 M W of electric power.
Introduction
The residential and commercial solid waste collected by the Urban Cleaning Department of the Municipalities (MSW) in metropolitan areas of at in America is composed of more than 50% organic matter (such as vegetables, table scraps, and fruit peels). , That means biomass-a renewable fuel.
Thus, the purpose of this paper, in accordance with the objectives of the First Biomass Energy Conference of America, is to support the development of a viable biomass industry.
Emphasis will be given to the thermal process of steam production and/or electric energy production at the commercial scale, but other processes are being developed that produce liquid and gas fuel from MSW and should also be mentioned.
In fact, the expression "recycling material to energy" is the terminology adopted nowadays to replace the old term "incineration," and indeed, "treatment of waste with recovery of energy" is an appropriate phrase.
By the way, it should be remembered that preventing epidemics caused by waste (which is a source of food to rats and insects, the propagators of diseases) is not a new process, and that the first plant was built in 1876 in Manchester, England.
Energy Production Potential
Looking at statistics of MSW produced by the population of the Metropolitan Areas or large cities of Latin America, it may be stated, within the error margin compatible with the nature of this valuation, that MSW production averages 0.75 kg per inhabitant per day.
Similarly, we refer to the city of Tokyo, Japan, where, in 1989, around 60% of the MSW generated was recycled into energy (85% in Paris, France, in 1985), taking into consideration that no more area is available for sanitary landfills or the landfills are located far from the production districts, which increases the transportation costs and the traffic density.
Based on analyses of MSW, feasibility studies and basic designs of MSW treatment plants with energy recovery have been carried out by the R&D Department of CESP - COMPANHIA ENERGETICA DE SAO PAULO, BRAZIL, since 1977. According to these studies, the average net rate production per ton of MSW, with a low heating value of 1500 kcalkg, may be assumed as 1.4 t of steam (42 bars gauge, 400°C) and 0.3 MWh of electric energy (13.8 kV, 60 Hz).
A combination of the above-mentioned rates applied to a total estimated population of 30 million inhabitants in the main large cities of Latin America, may assume that 60% of the MSW production can be recycled into energy, resulting in a potential, per day, of about 18,900 t of steam or 4,050 MWh of electric energy.
This steam production is equivalent to a crude oil production of 9,600 barrels per day, based on a rate of 14 kg of steam per kg of fuel oil, viscosity 80,000; this means significant savings on fossil or non- renewable fuel for heating or industrial processing.
As far as electric energy production is concerned, it is equivalent to the generation capacity of a 200 MWe Power Plant operating at full load 90% of the year; in the same way, regarding steam production, significant savings on fossil or non-renewable fuel for electric generation can be reached.
~ransformin~ this potential into available energy is a question more of socio-political decisions than it is of technological or even economical concerns, as can be seen in the following chapters.
Technologies Available
The most widely used, efficient, and commercially available technologies for waste treatment with energy recovery that produce combustion, hot water, steam andlor electric energy, and use mechanical stokers, are the following:
MARTIN and VON ROLL SYSTEM, with a water-wall furnace; VOLUND SYSTEM, with a rotating kiln and a boiler separate from the furnace;
1797
DUSSELDORFER SYSTEM, with grates consisting of rotating cylinders in cascade.
In all of these systems, the combustion and electric energy are stable and the fly ash volume production is low; the efficiency for steam production is about 71 % and the total efficiency for electricity generation is about 20%.
There are also other technologies with minor numbers of plants in operation, or under way, as follows:
FLUIDIZED BED SYSTEM, with no moving parts in the combustion chamber, but requiring crushers to prepare the MSW for its feeding;
VACUUM OR OPEN PYROLYSIS, with the hydrocarbon recovery producing liquid or gaseous fuels;
ANAEROBIC DIGESTION of MSW with sewer (organic matters) producing biogas (65% CH4, 33% C02), in pilot plants such as in Pompano Beach, Florida, USA and PT, SAo Paulo, Brazil.
Concerning the protection of the environment against the pollution originated by the combustion effluents, technologies are available that follow the standards of both local environmental agency and financing international agencies.
The combustion effluents are gas, solids, and liquids; their composition depends mainly on the MSW components and on the combustion control system.
The contents of the gaseous effluents may be particulates, carbon monoxide, sulfur dioxide, nitrogen dioxide, dioxines, fbranes, heavy metal, and others; through electrostatic precipitators or fabric filters and flue gas scrubbing equipment, the pollutants can be removed to satisfy emission patterns.
The solid effluents are mainly bottom ash or slag and fly ash. The slag comes out of the combustion grates, is cooled by water and may have the ferrous metals contents separated by electromagnets. The fly ash comes out of the flue gas through the air pollution control equipment. Both effluents must be withdrawn from the plant by trucks or by train for further utilization. The slag may be used in sanitary landfills as cover material, or as an aggregate for molded concrete, or as a base for road construction. The fly ash may be mixed with cement powder for use in civil construction; if the ash has significant heavy metals contents, special treatment or landfill deposit is necessary.
The liquid effluents result mainly from the waste storage pit (leachate), boiler blow-down, floor cleaning, ash quenching, and gas scrubbing; through water treatment and recycling systems, the amount of water discharge in the sewer network can be greatly minimized.
As described above, all the pollutants resulting from the waste treatment in the plant can be controlled and monitored, while in the sanitary landfills and in the air of the cities, which is polluted by cars and trucks, nobody can assure appropriate control.
Planning Criteria
During the preparation of the master plan for the MSW disposal of a town or metropolitan area, the size and site selection for one or several plants must be considered by the decision maker of the waste management system.
To subsidize that decision, techniques of linear programming that optimize the total cost of the MSW transportation and disposal system can be used.
This analysis considers the sizes, operational costs, and restrictions in feasible locations of the existing installations and the alternatives, foreseen on the planning horizon.
Considering that the final decision concerning the site of the plant is subject to the energy and environmental protection authorities' approval and the agreement of the population of the influenced area, studies and reports about the impacts of the plant, with site alternatives, must be prepared at the same time as the feasibility studies.
Depending on the size and the local conditions, the construction period, including commissioning and start-up for such a plant, may take 30 to 36 months after the contract signature; considering the time required for studies, basic design, procurement and the above-mentioned approvals, the total implementation period may reach 5 to 6 years.
In some circumstances, barriers may arise that extend the time or even interrupt the project. Such problems might be
conflict of interests between the contractors related to the existing MSW managements system and the contractors related to the construction of such plants, that put political influence on the decision-makers;
fear of the population of the operation of such plants because they are unaware of the benefits of the plant, the efficiency of the pollution control systems, and the monitoring of the system;
difficulties with the transfer of technology to some developing countries, because of the fear of disrespecting the right of patents or restriction to the remittance of local currency;
Considering the above-mentioned questions, it is very important, in the planning phase of project implementation, to get the compliance of all the related decision-makers at government/industry/population levels.
Economics
There are two main questions regarding this matter:
raising funds for implementing the project
the negotiations with the clients of the plant for definition of revenues.
To solve the first question, it is necessary to present feasibility studies to institutions like BIRD, BID, and OECF, in accordance with their guidelines for financing environmentally sound projects. They can support the main part of the cost with low interest rates and a long term for reimbursement, and also offer grace periods that cover the time up to the first years of commercial operation. However, other resources are necessary to support the part not financed, interests during the grace period, taxes and other costs, and inflation. To raise these funds, one must resort to local development banks or even to the society, including private enterprises; this requires negotiation with the participants in the investments regarding the remuneration and the guarantee to finance the contract until the definitive model of the entrepreneur becomes established.
To solve the second question, it is necessary to prepare an appraisal report that evaluates the needed revenues to be charged to the accepted MSW (tip fee per ton), the delivery of steam (price per ton), andlor electric energy (price per MWh), &~d eventually, the sale of materials recovered from slag and fly ash, if a market is available. To evaluate the revenues that are needed to reach the internal rate of return
1799
required by the entrepreneur for its investment, it is necessary to estimate the expenditure along the construction period and the life span of the plant (25 to 30 years).
Naturally, both questions and solutions described above are interconnected, because the financial institutions only approve a project that complies with the model of the entrepreneur and has revenues that are reliable and satisfactory, respectively.
For the negotiations with the clients of the plant some criteria may be considered:
the municipality may compare the tip fee proposed with its economy in investment and cost of operation, including transportation of the same MSW quantity during the life span of the plant;
the industry that will buy the steam may make comparisons in the same way, having as reference the fuel oil consumed;
the users who buy the electric energy, also in the same way, have as reference an equivalent power plant in the same site.
For reference only, the capital cost for medium-sized plants were in the range of $90,000 to $100,000 per ton of MSW capacity and the average tip fee is $40.00 per ton in U.S. dollars (EPA, November 1989).
I
Social and Political Feasibility Plan
The entitled plan consists of information, dialogue and negotiation with the social groups involved with the plant installation, in order to institutionalize the participation of the society during the decision process. This is necessary because of an increased social awareness in regard to environment protection, which results in more critical positions to alternatives adopted by the decision maker.
Lack of dialogue with the society, and specifically, with the social groups involved with the impact resulting from the construction of such a plant, as well as disregarding the demands and expectations of some groups in the planning process may jeopardize the political feasibility of the project.
So, the program must be oriented to the different social groups-the people inside and outside the entrepreneur organization with whom the entrepreneur intends to establish dialogue and negotiations to make the project feasible. The political reality, the opposing and favorable interests to the project, and the political sectors and their different representative levels may produce information (social and political diagnosis) about the eventual political support and pressures the entrepreneur may have to face in the region, and an awareness of the eventual conflicts in the area.
As a consequence, the entrepreneur sees how to develop social communication, link interagency programs; prepare supporting material, organize events, and develop cooperative programs, agreements, etc.
S&o Paulo Metropolitan Area Project
The Sb Paulo metropolitan area, with a population of more than 17 million and a MSW production of more than 12,000 tons/day in 1990, justifies at least one plant of 1,800 tons/day, mainly because of lack of areas for large sanitary landfills, transportation economy of MSW, and the need to protect areas for water sources.
In 1991, an analysis of Sb Paulo City MSW provided the following information on MSW contents: organic matter4 1.96%, paper and cardboard-1 0.06%, plastics-1 1.15%, clothes/leather/rubber-5.22%, others-8.61 %. Mix these MSWs with the refuse of composting, and a low heating value of 1,500 kcal/kg
1800
is expected and the following preliminary data are obtained: treatment of 630,000 tonsl)i.ear, a net production of 185,000 MWNyear, and a generation capacity of 27 MW.
The cost estimate, based on May 1992 figures, was $227 million U.S. dollars, including taxes, price escalation and contingencies; the operational and maintenance costs are estimated $5 million U.S. dollars per year.
Negotiations are in progress with the OECF - THE OVERSEAS ECONOMIC COOPERATION FUND in Japan to sign a loan agreement for financing 60% of the total with 7 years of grace period, 22 semiannual installments, interest rates of 3.25% per year for consulting services and of 5% per year for equipment, civil works and erection.
The executing agency is a state company (CESP - COMPANHIA ENERGETICA DE SAO PAULO) reporting to the Energy Secretariat, and other Secretariats such as Planning, Environmental, Sanitation and Finance are involved.
Conclusions
There is a large potential for thermal recycling of MSW into steam andlor electric energy, in Latin America.
The technology transfer, including flue gas cleaning, associated with financing the construction of plants would develop the biomass industry and produce energy, thus sparing the non-renewable fuels.
Therefore, it is necessary that the biomass industry, as a marketing strategy and with the back-up of financial institutions, provide information to the populations and the governments about implementating such projects.
1 also believe that events like this Conference will contribute to the goal of providing power from municipal solid waste.
THE ROLE OF NATURAL RESOURCE AND ENVIRONMENTAL ECONOMICS IN DETERMINING THE TRADE-OFFS IN CONSUMPTION AND PRODUCTION OF
ENERGY INPUTS: THE CASE OF BIOMASS ENERGY CROPS
Mark Downing and Robin L. Graham Environmental Sciences Division Oak Ridge National Laboratory
PO Box 2008 Oak Ridge, TN 37831-6352
Abstract
Natural resource economics issues deal with flows and funds of renewable and nonrenewable resources over time. These issues include topics concerned with management of fisheries, forests, mineral, energy resources, the extinction of species and the irreversibility of development over time. Environmental economics issues deal with regulation of polluting activities and the valuation of environmental amenities. In this study we outline a framework for studying both natural resource and environmental economics issues for any renewable or nonrenewable resource. Valuation from both the cost and benefit sides are addressed as they relate to the valuation of environmental programs or policies. By using this topdown approach to analyze and determine the costs and benefits of using renewable or nonrenewable resources, policy-makers on the global, national and local scales may be better informed as to the probable nonmarket and market ramifications of their natural resource and environmental policy decisions.
This general framework for analysis is then focused to address biomass energy crops and their usage as inputs to energy production. As with any energy technology, a complete analysis must include an examination of the entire fuel cycle; specifically both production and consumption sides. From a production standpoint, market valuation bsues such as crop management techniques, inputs to production, and community economics issues must be addressed as well as nonmarket valuation issues such as soil erosion, ground water effects and carbon sequestration. On the consumption side, market valuation considerations such as energy fuel efficiency and quality, cost of conversion and employment of labor are important factors while the critical nonmarket valuation factors are ambient air visibility, greenhouse gas release, and disposal of the by-products of conversion and combustion.

Introduction
Natural resource economics typically applies dynamic optimization methods (such as provided by mathematical programming techniques) to problems of intertemporal resource usage. Specific topics that have been considered are the management of forestry, fishery and mineral resources, the concept of pollution or injury to both humans and ecology, a specific natural resource or an environmental habitat in general, and the irreversibility of development over time. In contrast, environmental economics issues attempt to deal with valuation of environmental amenities and the regulation of polluting activities. Economics provides an analytical framework for researching the relationship between economic and political systems and the environment. By examining economics, natural, and social science ideologies, we may better understand and explain why, when identical facts are compared by two individuals, different conclusions are reached. An examination of these idealogies affords insight as to the strong and weak points of economic analyses as they are applied to environmental problems.
Environmental problems are considered to exist when inefficient resource allocations exist or future generations are expected to be left worse off. There are many specific ecological and environmental issues being examined today. What level of water pollution is acceptable in freshwater streams and rivers? What are important issues in regulating chemicals and how will these issues affect a toxic substances policy? What is a hazardous waste; what are critical issues in hazardous waste management and how can we improve monitoring and enforcement? What role do property rights play in riparian water issues? How should we allocate water for recreation, direct household consumption or industrial use? What are the important issues for utilities in power generation? Are these issues important in terms of production (trade-off of inputs to power production) or by-products emitted by consumption of power production inputs or emissions due to electric power use? These issues, both specific and general, appeal to economic theory for solution because simple social solutions that involve value judgements ("we can no longer tolerate the current level of aquifer and groundwater usage") are no longer valid; we find ourselves appealing to economic decision-making as providing a more socially acceptable and potentially optimal solution to problems involving resource allocation.
Any economic system does not always force or allow efficient allocation of resources. Inefficient allocations may be due to market failure (failure of markets that exist within these economic systems) such as when food is in abundant supply but there are insufficient roads, fuel or transportation to deliver it to consumers. Some reasons for market failure are existence of externalities, improperly defined property rights systems, imperfect markets such as monopolies, and divergent social and private discount rates. The maximization of the present value of a net benefit cannot be maximized when these conditions exist.
A political system itself (marxism, communism or democracy) can produce market inefficiencies as well. Ill-conceived implementation of otherwise efficient plans and rent-seeking behavior by special interest groups are two causes. Voter ignorance on critical issues is another, especially when combined with public goods issues, can fail to provide maximization of the social net benefit.
Figure 1 (Tietenberg 1988) shows how economic systems interact with the environment. From this diagram, it is clear that there is interaction between consumers and producers, but also direct interaction between raw natural resources and consumers and producers. Economics uses two analyses to increase our understanding of this overall interaction. We use positive economics to assist in describing facts and quantification of what really "is". We use normative economics to describe what "ought" to be. Controversy in positive economics is solved by appealing to facts, while disagreements in normative economics involve value judgements and cannot be solved by simply
appealing to facts. The remainder of this paper is organized as follows. The second section discusses the natwal
resource economics. Section three outlines a framework for examining environmental economics issues in three sections: value concepts and measurement methods, application of economic valuation methods to ecosystems, and policy and the environment. The next section applies the aforementioned framework to a specific analysis of relevant issues and details to do with the trade-offs of using coal vs biomass to produce electricity from both the cost, benefit and consumption, production sides. We examine both existing data and their interpretation as well as data needs and possible solutions. The final section concludes with some discussion about the role of economics.
The Economics of Natural Resources '
Natural resburce economics involves the study of the allocation of scarce resources over time across competing interests. Although resource scarcity can be mitigated by exploration and discovery, technological processes and by substitution, all resources are not considered as being on equal footing. Scarce resources are quantified in different ways based on their flows in use and the existing levels of available stocks (Tietenberg 1988).
Depletable, non-recyclable energy resources consist of such commodities as coal, gas, oil and uranium. Oil and natural gas supply nearly 67 percent of all energy consumed in the United States Tietenberg 1988). Some economic models predict these transition fuels to be efficiently allocated until the marginal cost of further use exceeds the marginal cost of substitute resources - either more abundant depletable resources such as coal, or renewable resources such as solar energy or biomass.
Depletable, recyclable resources may be considered as minerals such as mercury, cobalt, copper and aluminum. -Market mechanisms automatically create pressures for recycling and reuse which tend to be headed socially in the correct direction, though not always of correct intensity. Higher disposal costs and increasing mineral scarcity create a larger demand for recycling. But there are a number of imperfections in the market that suggest that the degree of recycling may be less than optimal efficiency. One important source of imperfection - externalities - have notable examples such as environmental damage due to littering, air and water pollution, and strip mining. When a product is produced from virgin materials rather than recycled or reusable materials, and the cost of the associated environmental damage is not internalized, both positive and negative externalities may be created. Government intervention may be necessary (Tietenberg 1988).
A replenishable but depletable resource is water. The earth's renewable water supply is governed by the hydrologic cycle whose available supplies are derived from two rather different sources - surface water and ground water. Each of these two sources must be taken into consideration separately in order to determine the efficient allocation of scarce water among competing uses.
Reproducible private-property resources such as food are important to examine because we can study persistent global scarcity in the allocation and growth of food, the maldistribution of that food among and within nations, and the temporary shortages that are caused by weather and other natural causes. .
Storable, renewable resources focus on the forest resource. Forests provide a variety of services. In many parts of the world, wood is an important source of fuel. Trees cleanse the air by absorbing carbon dioxide and adding oxygen. Forests provide a habitat for a diversity of flora and fauna. Recreation is another contribution of forests. The timber resource has some special attributes that make it unique. First, timber is both a capital good and an output. Second, the time period for management for planting to harvesting is especially long. Third, forests are subject to many
externalities which make it difficult to define what an efficient allocation is. Renewable common-property resources are best described by the fisheries resource. Fisheries
are stocks of resources that can be continually replenished. If these resources are not managed effectively, (along with other living resources such as forests), they can become exhaustible. These resources are not always efficiently managed by markets. This is the case in particular with fisheries having extremely low extraction costs.
These six categories (Tietenberg 1988) used to describe natural resources are essential to analyzing resource scarcity issues. Resource scarcity is an economic issue. Several economic indicators of resource scarcity are provided by examining relative prices of raw materials. Further analysis, however, must be used, as the price system does not reveal all information about the social cost (real cost) to society of providing a resource. The real cost of raw materials could be examined on the grounds that this cost would be an indication of increasing scarcity. Because price emerges from scarcity alone, it is often called rent. Considering rents or the real prices of resources in situ while also taking into account the cost of extraction and processing is critical. A perfect economic indicator of scarcity should track the real price of resources in situ. Unfortunatefy resource rents can seldom be directly observed, so this perfect indicator is not currently available.
There is therefore, some concern that the economic evidence (the real price) is unavailable. The economic evidence does contain more information than just measures of physical quantities. An economic analysis should involve, however, not only raw materials, their extraction and procurement costs as has been discussed here, but damages involved in extraction and processing. In addition as Randall (1987) has recommended, the scope of the resource (whose real price determination seems to be elusive) should be expanded to include some larger entity called the environment.
Environmental Economics
Value Concepts and Measurement Methods A resource has value to individuals (of whom society is composed) to the extent that it
provides services yielding satisfaction, through direct or indirect consumption. Consumption is broadly defined so as to include consumptive uses which physically alter a resource and the resulting services it can provide in the future, as well as, non-consumptive uses which do not alter the physical characteristics of the resource or its future ability to provide services.
The concept of total resource value includes use and nonuse values which may occur at the resource site or off-site, and which may be related to expectations of future use (although present use does not occur) or which may relate to altruistic motivations to provide the resource for others or "for its own sake" (Randall 1987). A synopsis of the relationship between these sources of value is provided in Figure 2 and a brief set of value definitions is provided in Figure 3.
When one considers ecosystem service valuation, it is likely that nonmarket valuation techniques will necessarily be used. For some subset of such services, market decisions will yield economic value measures or inferences from market related decisions and can be used to obtain economic value estimates. However, many of these ecosystem services will not be reflected in the market and the use of the travel cost and contingent valuation methods will be necessary (Figure 4). The travel cost method is in actuality a subset of inferential techniques, the broader group of which includes hedonic valuation methods. The travel cost method uses inferences from travel related expenditures to use the resource base for the purpose of making inferences about the value of the services the resource base provides. For example, the travel costs incurred by a recreational angler in order to go fishing (gasoline expenses, overnight lodging and food) are used to infer the value of the fishing experience. A moment's thought will result in the recognition that this method is useful for

obtaining estimates of on-site usage of resource services. A limitation of the approach is that it is not amenable for estimation of off-site resource service usage values or for non-use resource service values.
The contingent valuation (CV) method utilizes the construction of contingent markets, i.e., based upon contingencies, to elicit valuation responses. These markets take the form of iterated or non-iterative questioning regarding willingness-to-pay or willingness-to-sell (or accept) under altering resource conditions, i.e., to elicit values for alternative resource (ecosystem) scenarios. Because these markets are constructed by the researcher, they are not limited by the requirement that the resource service to be valued must have existing expenditures associated with its use (consumption). That is, the method can be used to value not only on-site resource service usage but also off-site usage and non-use values. Thus it is more broad in terms of its potential range of application. This is not to imply that there is no cause for concern in its application. It is also much more complicated to apply well. There are many areas of research regarding potential application problems as with the travel cost method. We do not intend to address these problems herein for either method, only wishing to state that the general acceptance of these methods by the research community indicates that they have been improved over time, while there is need for work on continuing that improvement. In terms of estimating the value of ecosystem services, since these services are often not directly consumed or well-understood, the contingent valuation method will likely be much more frequently applicable.
Application of Economic Valuation Methods to Ecosystems As with any economic analysis, one must first establish the context of the problem and the
resource values which are appropriate. In the case of ecosystem services, this means the ecosystem services must be identified and that set (or subset) of services must clearly be delineated. Having done so, a valuation method must be selected, much work must be done to design the valuation instrument (survey questionnaire) prior to implementation, a sample population must be selected for instrument administration, information collected must then be compiled into databases and empirical estimation procedures conducted. The resultant output is a set of value estimates for individuals or an aggregate of individuals, i.e., a population.
This basic discussion of the valuation study process glosses over the real work which takes place in any economic valuation study (Figure 5). In a valuation study, the design, administration, and analysis may take place over a period of several years, involving many persons and considerable work. The survey instrument may be tens of pages long, have several different versions to allow greater usage of valuation scenario variation and provide more data analysis options, and achieve a mail response rate of about 60 percent.
There are several issues to be confronted in ecosystem applications. The following should be items considered in application of valuation methods for ecosystem valuation studies.
What is the exact commodity to be valued? The specific level of ecosystem service(s) and specific change(s) in the level(s) of ecosystem service(s) should be stated.
Can the individual respondent identify (understand) the ecosystem service(s) to be valued? What are the exact components of the ecosystem and its services(s) which are important and which are to be valued? Are all aspects of the ecosystem and its services included, or is only a subset of the services to be involved? An ecosystem can be viewed as a very complex multifaceted good and an individual must understand all aspects of the ecosystem which are relevant.
Can the ecosystem be described more fully to the individual prior to a valuation response? An identification of the information that would be necessary to do so and ability to convey this information in an unbiased manner is necessary.
How much information is legitimate in such situations? Too much information can lend meaninglessness to valuation metrics as indicators of population values. Values elicited from uninformed populations may or may not be desirable from a policy standpoint.
What offer amounts should be used in the CV markets for ecosystem scenarios? The standard

in CV ecosystem service valuation should be a practice of scenario variation. This approach should be useful in ecosystem service value estimation for policy analysis, i.e., scenario variation, to isolate values for components of ecosystems and the associated services they provide.
Policy and the Environment In the economic arena, there are many sources of conflict. Given an economist's definition of
market failure (imperfections that involve the failure to efficiently allocate scarce goods, services and other resources) there appear several causes for this market failure. Monopolies, existence of externalities, existence of public goods, congestible goods, and several combinations of these are a few reasons for market failure. The most widely considered is the concept of the externality. Externalities may have good or bad effects, but it is the external diseconomy or bad that we wish to focus on. An external diseconomy refers to situations in which one party creates an annoyance for others and does not take any account of that annoyance. This activity, if allowed to continue unchecked, would have deleterious effects on resource allocation and social cohesion as the group of affected persons remained unprotected by continued and relentless activities. Examples of problems often analyzed as external diseconomies include polluting emissions and effluent from industrial processes, non-point source pollution from construction sites and farming operations, polluting emissions from consumptive activities, and any activity that imposes noise, ugliness, or other offensive impacts on affected parties.
Both positive and normative economics has much to contribute to improved programs for the control of pollution. In some respects, existing policy has been of some concern to environmentalists and economists as well, and there is a renewed interest in the effectiveness of alternative approaches to environmental protection. A wider use of economic incentives can significantly increase effectiveness of measures for pollution control both in terms of attaining environmental targets and in doing so with enormous cost savings relative to current command-and-control policies. For example, installation of effluent fees may not be the better policy for optimizing the benefits to both the consumers and producers. There exist a substantial range of policy instruments, each with particular strengths and weaknesses. Enlightened environmental programs must combine these instruments into an integrated set of policies that draws on their combined strengths and avoids the weaknesses of individual policy measures.
Several policy instruments that may be used are the Pigouvian tax (typically a tax placed on each unit of effluent emitted), and other alternative instruments to this tax such as subsidies for pollution abatement, deposits for damaging materials, and systems of marketable emission permits. Taxes imposed to equal the "marginal social damage" do not comprise the totality of environmental regulation. Only in the presence of full information (buyers and sellers have all the decision-making information they need) does a Pigouvian tax equal the marginal social damage and sustain an efficient market in a competitive setting. But there is uncertainty as to the magnitude of social damages and of abatement costs, in the presence of, say, imperfectly competitive markets in the economy, and this leads to serious doubts as to the usefulness of a simplistic Pigouvian tax.
Baumol and Oates provide an application of economic analysis for the design of effective environmental policy. They point out that the design and implementation of policy measures in a typical administrative setting involves the environmental authority first determining a set of environmental standards or targets (allowable concentration of pollutants) and then establishing a framework to attain these standards. Systems of fees and of marketable emissions permits are examined for their effectiveness of achieving predetermined standards for environmental quality. Subsidies, although attractive to the regulator, have a serious allocative deficiency compared to fees or permits. There are other important issues in the determination of a feasible and effective program for environmental management and the distributive implications of environmental measures, international dimensions of environmental policy, and the structure of regulatory authority all play important meaning and roles among different levels of government. Therefore, there are important
roles for both national, state and local governments in the environmental arena.
The Case of Biomass vs Coal
To analyze the effects of substituting biomass from energy crops for coal, at least in the production of electricity, economists must evaluate the benefits and costs of changes in environmental quality that may result. Because coal is considered a depletable, non-recyclable energy resource and biomass (using wood biomass, for example) is classified as a storable, renewable resource, a comparison is not straightforward; primary and secondary effects of conversion are unclear and sometimes overlapping. Figures 6 and 7 portray some effects on the environment of producing electricity from coal and biomass, respectively. Our ability to place dollar values on these environmental quality effects is limited and imprecise (Cropper and Oates 1992). One part of evaluating a pollution control strategy is to evaluate the benefits and costs of individual components of the entire fuel cycle.
To supply inputs to a cost-benefit analysis, economists are often asked to value environmental amenities and they appeal to commodity markets to answer questions about pricing. For example, the cost to transport coal from the mine mouth to the conversion facility is reflected in the costs incurred in transportation such as diesel fuel, vehicles, and roads (although the entire cost of roads is not derived nor internalized for the transport of coal). Using commodities traded in the market, an appeal can be made to the price system for explicitly posted prices. One example of explicitly posted prices observed in the production of woody biomass is the price of fertilizer applied. The cost of custom application of fertilizer may also be directly observed.
Figure 6 portrays another aspect in the coal fuel cycle. An example of costs that are not readily observable are those associated with primary or secondary effects of emissions. Although there are emissions associated with coal extraction, Nitrous oxide (NOx) is an emission which has caused concern and results from the burning or conversion of coal to electricity. The complete costs of NOx emissions are not known; however, some of the costs represent negative externalities. Negative externalities are implicated because various negative effects of the emissions have been , noted. Positive correlations have been observed between the emission of NOx as a by-product of the burning of coal and the incidence of lung cancer and emphysema. In a nonmarket sense, the cost of health care implies some cost of the emitted NOx. It does not imply that all health care problems resulting in lung disease should be internalized in the cost of burning coal; it does however, indicate coal burning as a contributing factor to this particular cost of the externality. Even if known, it would be difficult to determine how to add the cost of NOx emission into the production function for electricity.
Another way to determine the value of NOx emissions is to conduct a survey which poses questions concerning what the public would be willing to pay for cleaner air. This endeavor is a time-consuming task; in order to conduct a survey, a perceived problem must be identified, potential respondents must have some level of understanding of the electric power production process, and must be able to relate their willingness to pay to some trade-off in lost goods and services such as health or reduced visibility for viewing scenic landscapes. Then, once a value has been derived, it is not clear that this price should be charged against the production function for electricity. The conversion of biomass to energy involves combustion emissions and the additional area of concern of displacement of conventional agricultural crops from agricultural lands by the production of woody biomass crops such as hybrid poplar and sweetgum. There ark several differential effects that are expected to be relevant; labor supply effects, changes in erosion levels, and relative levels of nitrate in runoff are a few. It is difficult to directly value (or place a value on) the immediate effects of
erosion and the issue becomes more difficult to address over time. In-stream effects of erosion may be determined by quantitative evaluation of changes in fish populations, which may be translated into changes in recreational fishing levels, and the differential sedimentation level of reservoirs. Nonmarket values of these changes are also difficult to determine.
These values of costs and benefits are only one part of the evaluation of an environmental program. The emissions differentials from burning biomass vs coal must in some way be related to air or water quality. The change in air or water quality must then be related to health or other outcomes by way of a dose-response function. Then, health outcomes must be evaluated (Cropper and Oates 1992).
Environmental regulation itself involves costs. There are costs associated with regulation of externalities from the installation of effluent fees, subsidies, and marketable emission permits. These remedies are put in place to achieve some standard or target set to attain some level of environmental quality and the attainment of that standard must be assessed. These and other policy instruments have been analyzed by Bohm and Russell (1985). Each policy has advantages and disadvantages to polluters, regulators, the environment, and the general public affected by pollution.
An additional complicated issue to be faced involves transboundary externalities. Transboundary refers to the international aspect of spillover effects of certain externalities from one country, with one institutional governmental structure, to another country with perhaps a different structure. Although acid rain issues certainly are not new, they point to the need for examining global scale environmental effects of switching from coal to biomass inputs for the production of electricity.
Economic analyses are helpful in determining the magnitudes of costs and benefits of environmental amenities. It is also important that costs and benefits be weighed when determining the effects of enactment of regulatory policies. Some of the estimation procedures involved are not very sophisticated, but they do provide a means of determining economic trade-offs as a result of specific policy measures.
Discussion and Recommendations
What does economics have to offer for ecosystem analysis and valuation? Paraphrasing Kenneth Boulding, 'terms of reciprocity are everywhere around us .... whether we recognize it or not ... be they implicit or explicit ... life is full of trade-offs and there is no way around it'. The most important contribution which economics has to offer is a way of looking at the problem of trade-offs in utilization of natural resources. That is, economic analysis is a process of evaluating the trade- offs.
Economics cannot claim to be able to quantify everything. Nor can economists always claim to quantify everything they do quantify, well. This is unfortunate but not always bad. In some instances a different way of looking at the trade-offs may lead to a productive solution or a different analysis of an alternative regulatory policy, and that is a contribution as well. For example, if a new input fuel will alter part of an ecosystem having impacts on an endangered species' habitat, we may have a hard time quantifying the value of the endangered species. Alternatively, we can also ask ourselves what it would cost to use another fuel input in a manner which would not impact the habitat. Having answered this question, we can then rephrase the original question as "Is the endangered species habitat worth at least the additional cost of using an alternative fuel electricity production input?" In some cases this may simplify the evaluation problems.
It is important that economists not determine policy, nor should others expect this of them. Economists don't determine policy, they contribute (as do ecologists and other scientists) to the making of more informed decisions. To the extent that this can be done, economists are successful.
Economics has much to contribute to environmental management decision-making. The organized structure of natural resource economics and the framework of analysis outlined in environmental economics can assist in local or global decision-making efforts involved with production and consumption trade-offs. Economists however, rely greatly on engineers, ecologists, biologists, environmentalists and other social scientists for inputs to and feedback from their analyses.
Acknowledgements
Research sponsored jointly by the Biofuels Systems Division, U.S. Department of Energy, under contract DE-AC05-840R21400 with Martin Marietta Energy Systems, Inc. and Tennessee Valley Authority W A ) under Memorandum of Understanding, Contract No. TV-87041V (DOE No. 1610- F031-A1). This document has not been subjected to TVA review and therefore does not necessarily reflect the views of TVA and no official endorsement should be inferred.
References
Bohm, Peter and Clifford Russell. 1985. "Comparative Analysis of Alternative Policy Instruments. " in Handbook of Natural Resource and Energy Economics. Volume I . Eds. : Allen Kneese and James Sweeney . Amsterdam: North-Holland .
Cropper, Maureen and Wallace Oates. 1992. "Environmental Economics: A Survey. " Journal of Economic Literature, 30:675-740.
Downing, Mark and Robin L. Graham. 1993. "The Role of Natural Resource and Environmental Economics in Determining the Trade-offs in Consumption and Production of Energy Inputs: The Case of Biomass Energy Crops." In these Proceedings of the First Biomass Conference of the Americas. Burlington, VT.
English, B. C., R. R. Alexander, R. Graham, M. G. Bhat, and Mark Downing. 1992. Supply of Shon Rotation Woody Crop Biomass to the Watts Bar Power Facility. Unpublished Report, Knoxville, TN: University of Tennessee Department of Agricultural Economics and Rural Sociology.
Graham, Robin L. and Mark Downing. 1993. "Renewable Biomass Energy: Understanding Regional Scale Environmental Impacts." In these Proceedings of the First Biomass Conference of the Americas. Burlington, VT.
Randall, Alan. 1987. Resource Economics, Znd, ed. New York: John Wiley and Son.
Tietenberg, Tom. 1988. Environmental and Natural Resource Economics. 2nd. ed. Glenview, IL: Scott, Foresman and Company.
"The Mbnned m~laapt h. b m authored by a contractor of ths U.S. Govannent udar contract Nb. DE- AC05-84CM2 1400. Accotch@y. the U.S. Govsrnmsnt ramins a noleaduurn. roy.hy-free I*;snse to pubhh a r q x O a n e the pubbhd form of thrs contnbukm. a aHow others to do so, for U.S. Govsrnment MwpwaJ.-
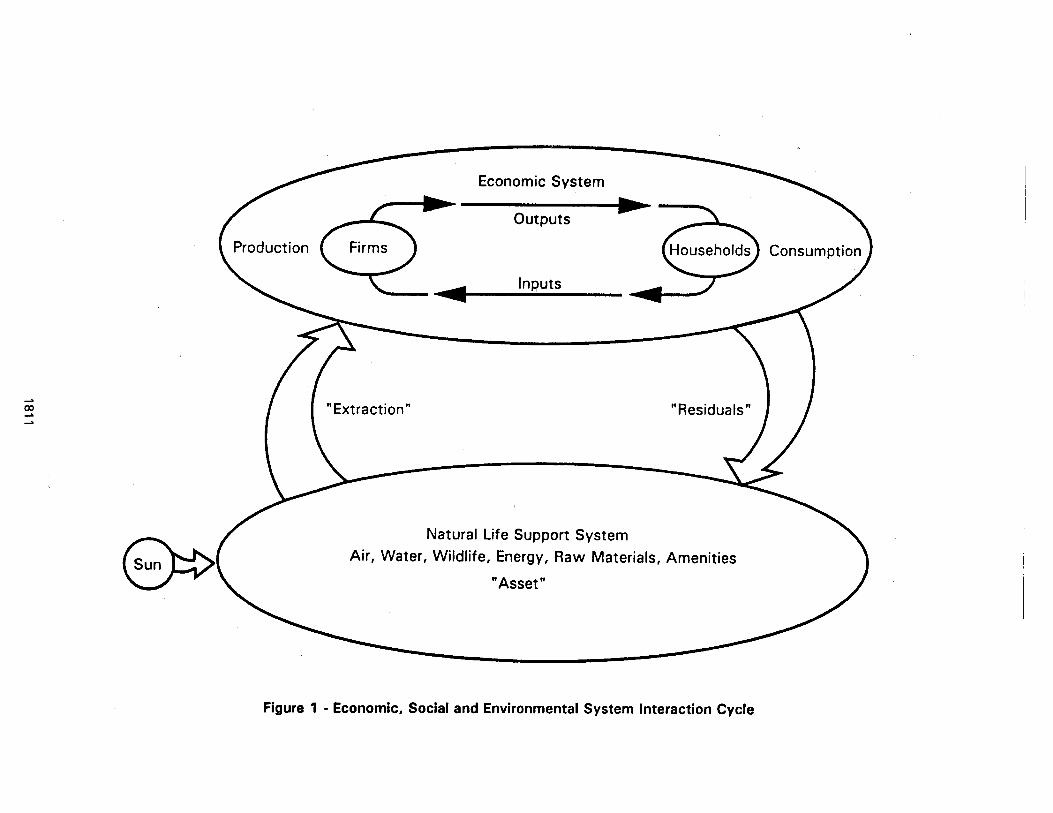
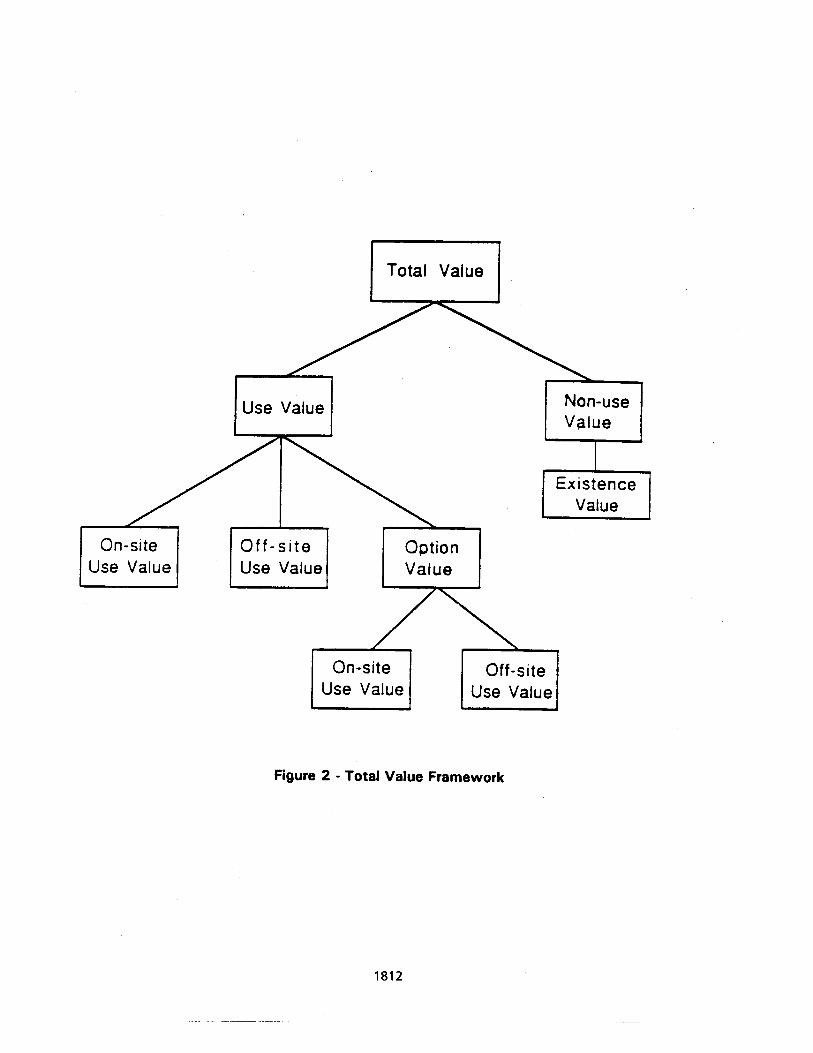
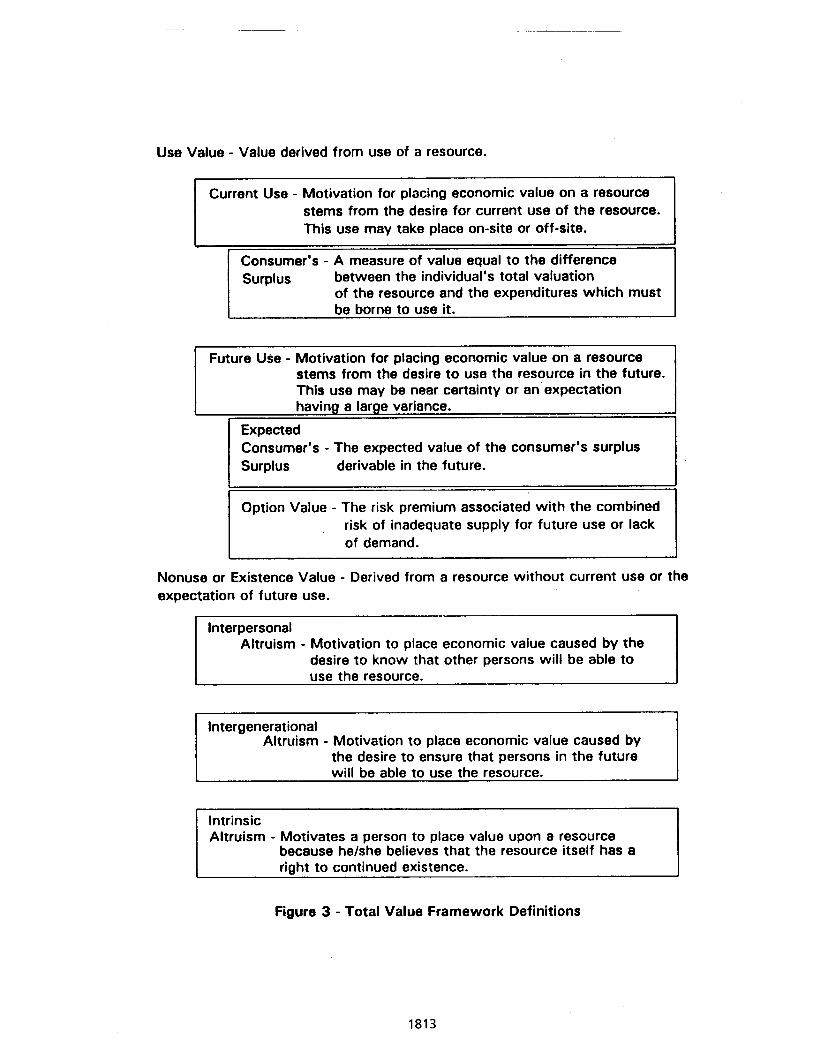
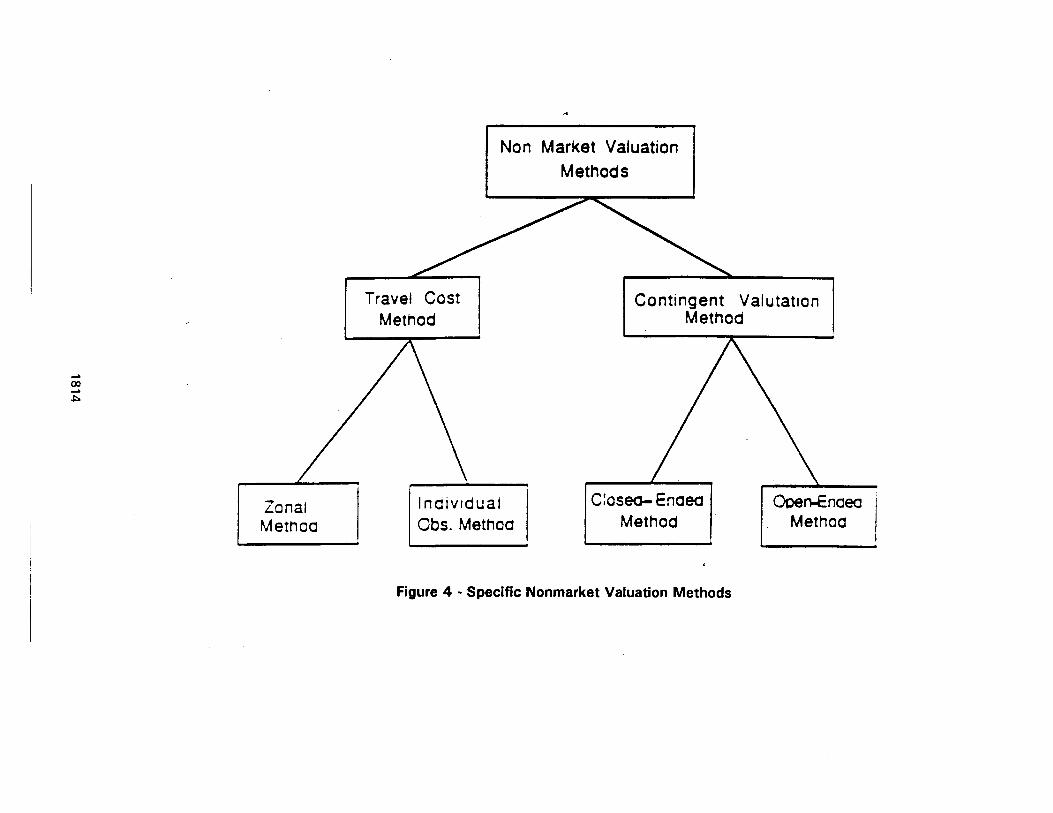
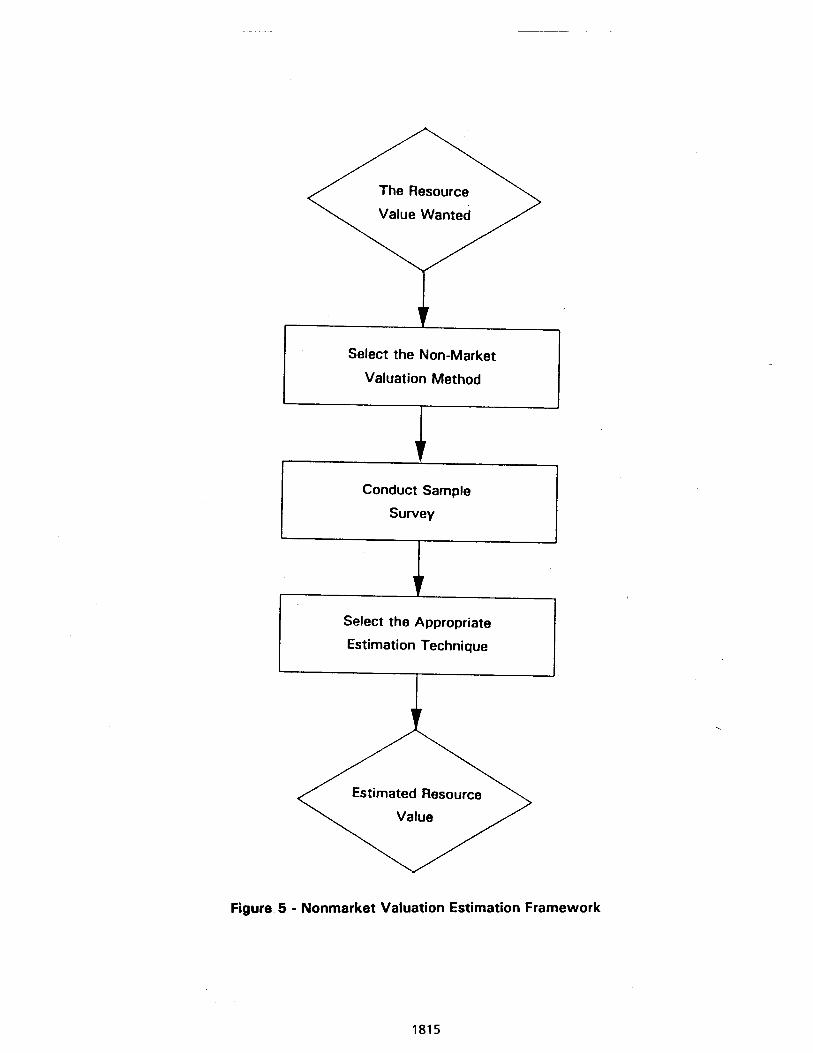
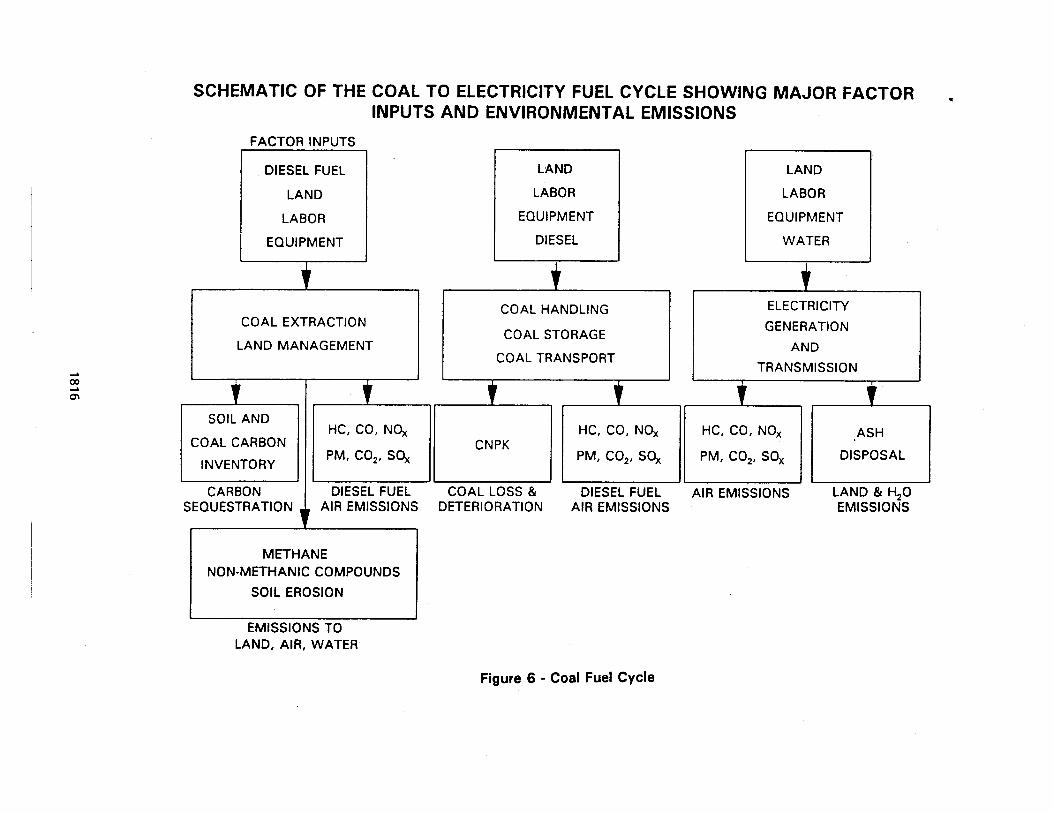
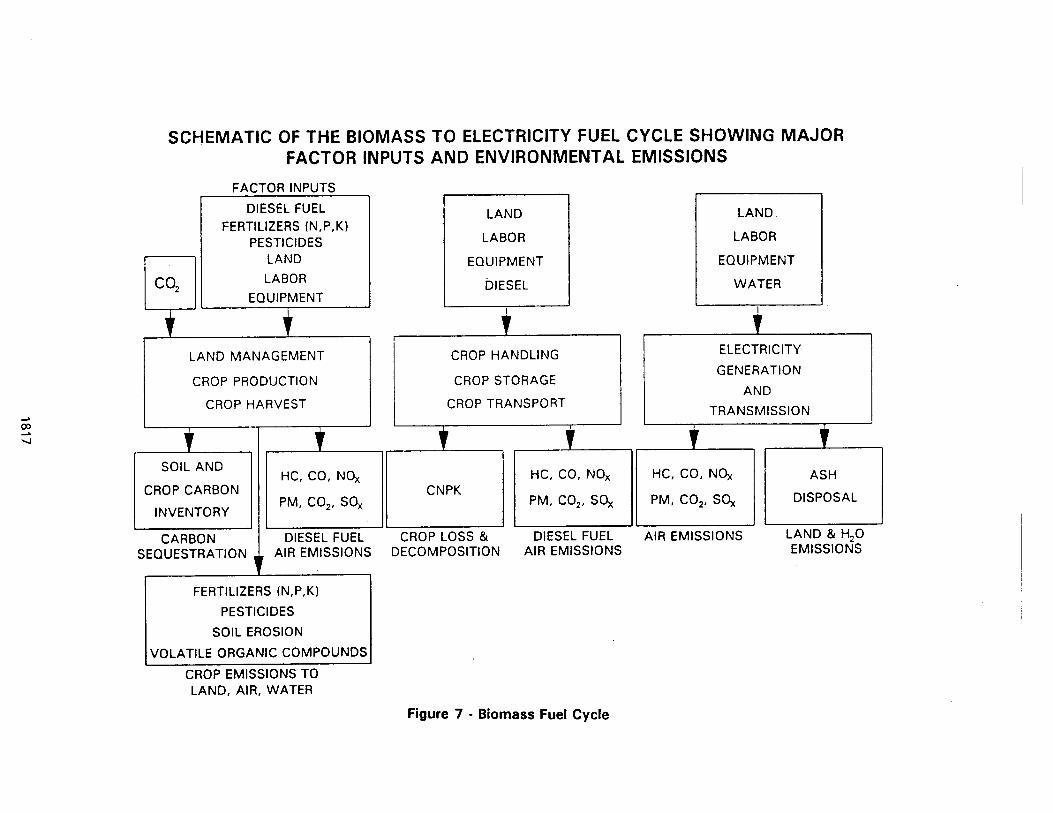
An Inventory Control Model for Biomass Dependent Production Systems
S.C. Grado and C.H. Strauss School of Forest Resources, The Pennsylvania State University
University Park, PA 16802
ABSTRACT
The financial performance of a biomass dependent production system was critiqued based on the development and validation of an inventory mnml model. Dynamic programming was used to examine the constraints and capabilities of producing ethanol from various biomass crops. In particular, the model evaluated the plantation, harvest, and manufacturing components of a woody biomass supply system.
The optimum wood to ethanol production scheme produced 38 million litres of ethanol in the harvest year, a 13.6 million litre increase over the least optimal policy as demonstrated in the dynamic programming results. ?he system produced ethanol at a delivered cost of $0.38 L-I which was consistent with the unit costs from other studies. Nearly 60% of the delivered costs were in ethanol production. The remaining costs were attributed to growing biomass (14%), harvest and shipment of the crop (18%), storage of, the raw material and finished product (7%) and "lost sales" (2%). Inventory control, in all phases of production, proved to be an important cost consideration throughout the model.
The model also analyzed the employment of alternative harvesting policies and the use of different or multiple feedstocks. A comparison between the least cost wood system and an even cut wood system further revealed the benefits of using an inventory control system.
INTRODUCTION
An inventory control model was developed to determine a least cost solution for producing a final product from a biomass dependent manufacturing scheme. In particular, the model evaluated the plantation, harvest, and manufacturing components of a woody biomass to ethanol supply system. An allied concern was to evaluate the policy implications from the model output, specifically, the impact of harvesting limitations, storage deterioration, material losses, shortages and market influences. The analysis also looked at the comparative costs for various biomass production, harvest, and ethanol manufacturing systems.
PROCEDURES
Model Description
The model used in this study consisted of three components: (1) a biomass plantation, (2) biomass harvesting and transport, and (3) the manufacturing of an end product. All components identified specific tasks, various types of inventories and the associated costs. The plantation component described the availability of the raw material resource such as standing trees. This input required a lead time for growth and used investment analysis to determine the least cost rotation length of the plantation. The harvest component identified the harvest method and the transport and storage options for raw materials. The manufacturing component detailed the process for converting raw materials into a final product and their subsequent storage or sale. While each component was the impetus for a particular inventory, there was a considerable overlap of inventories within each component. For example, standing trees, harvested raw materials and liquid fuel inventories could all coexist within the same time period.
Certain assumptions and parameters were associated with the general inventory control model. The model was capable of handling up to three different raw material or feedstock types (e.g. woody biomass, agricultural crops, fossil fuels) within a system subject to a multi-echelon demand pattern throughout the year. The first demand echelon described the raw material requirements, which are a direct result of the processing capacity of the manufacturing facility, and can be constrained to any amount for a given time frame. The processing of on-hand raw material inventories was on a first in, first out (FIFO) basis. All inventories were subject to a periodic review whereby the order quantities varied but the interval between reviews remained constant. When raw material replenishments were required, there was an immediate entry (no leadtime) into the system at the beginning of a time period. However, replenishment opportunities may be seasonal within the annual cycle due to harvesting constraints. The second demand echelon reflected the market demand for the end product. This parameter could also be set at any level for a given period of time. Eventually, the final product leaves the system from one period to another according to a variable market demand pattern. All demands were uniform or constant within a given time period. The time periods in the model were programmed as months of the year, although they could be any length.
Inventory replenishment was another parameter within the model. This included such features as the uncut quantity of biomass after completion of a growing season (standing inventory), the net quantity harvested and delivered at the beginning of a current period, the cumulated raw material inventories at the beginning of a current period, the loss of raw materials in storage during the period, and the final product in storage after processing and sales transactions.
The last group of properties were the costs associated with the biomass plantation, harvest, and manufacturing tasks. These model costs were structured under an accounting format that identified all investment and operating expenses (Strauss et al. 1989). All machinery operations were based on time and motion studies. Variable costs were based on assigned levels of operation and included repairs, maintenance, fuel materials and labor. The fixed costs represented the depreciation of equipment, interest charges, insurance and shelter. Each expense, viewed as an average annual capitalized cost for a unit of output, was recorded in the year that harvesting and manufacturing of associated yields took place. For example, standing trees were considered an asset to the system until harvested, at which point they become a cost. At this juncture the establishment and maintenance costs were added to the harvest and transport costs. Whenever rotation lengths were considered in the model, costs and plantation yields were subject to change and this in turn could adjust the unit costs of each task. All costs associated with the inventory process were developed in U.S. dollars (1990) per metric ton of input, oven dry (Mg-'(OD)) or per litre

(L-') of output. While generating a solution from the program, the task costs were summed both for each time
period and then incrementally over the annual cycle. Alongside these cost calculations was a coinciding output unit cost indicating the respective contributions by each task to the output cost. Costs were also realigned to describe the feedstock and manufacturing costs and the basic inventory costs. The major inventory costs were classified as: (1) ordering (replenishment) or manufacturing, (2) carrying or holding and (3) shortage, which included deterioration and feedstock substitution costs (Naddor 1966; Hillier and Lieberman 1986). Ordering or replenishment costs described expenses attributed to the initiation of inventories, including set-up and processing costs (Hillier and Liebeman 1986). Carrying costs for inventories pertain to any expenses which relate to the holding of inventories for any time period. Shortage costs traditionally relate to shortfalls or "lost sales" resulting from the final product and market demand. Ghare and Schrader (1963, p. 241) used penalty costs to represent loses of sales and goodwill for any time that a product was out of stock. Using "lost sales" to represent a system cost is a technique often used in economic inventory models (Naddor 1966, p. 38; Silver 1981, p. 631; Taha 1982, p. 494; Hillier and Lieberman 1986). However, shortages can be incurred during the input or pmduction phase of an operation. "Lost sales" assaciated with fwdstock inputs are unique to this study and are used to gauge the efficiency of operations associated with raw material procurement. The model was constructed so a penalty cost to the system could be incorporated for each missed opportunity attributed to the input and/or the output. In the former instance, for shortages due to harvesting inefficiencies and storage deterioration, it included a penalty cost, expressed as the difference between the selling price per litre and the cost of producing the final product, minus the cost of processing. For shortages related to the output it included the loss of final product sales, excluding harvest and deterioration losses, expressed as the selling price per litre minus the total cost of production. Therefore, since demands in the system were not backlogged, the model would sustain a penalty cost for "lost sales" above and beyond harvest and storage deficiencies. This is known as the unsatisfied demand cost.
The general cost model included all of the above costs as they occur during the predetermined time periods of an annual cycle. The cost of any operational policy alternative was the summation of all the costs up to and including any period. The model solution would determine: (1) the harvesting schedule within a year, (2) the remaining standing inventories and stored raw material and final product inventories at the end of any interval within a year and at the end of an annual cycle, (3) a recommended inventory policy for raw materials and the final product, (4) how well the existing supplies meet demand for specific manufacturing processes, and (5) the optimum cost of a specific plantation, harvest and manufacturing system which would permit comparisons with alternative plantation, harvest, and manufacturing systems.
Programmlng Approach
The inventory control model used deterministic dynamic programming to solve for the least cost alternative of a plantation and harvesting strategy affiliated with a specific manufacturing process. In general, inventory models axt characterized by the type of demand schedule. A deterministic DP procedure is used when the demand for an item is deterministic (known with a high degree of certainty) (Taha 1982, p. 494). In the current model, although the raw material demand was held constant, the demand for the final product was both deterministic and dynamic. The tern dynamic implies a demand, though known with certainty, that is variable from one time period to another f l h 1982, p. 495). While this programming approach ignored the element of risk in the inventory model it permitted a consideration of seasonal trends in demand, which for analytic and computational difficulties cannot be included in a probabilistic model (Taha 1982, p. 495). Little theory has been developed for multi-echelon models with probabilistic demands (Peterson and Silver 1979; p. 481). All model formulations, and calculations employed by the DP algorithm, were written into a Spreadsheet format.
Model Valldatlon
Model validation is necessary to increase confidence in the model and ensuxe that it accurately predicts the outcomes of alternatives (Buffa and Dyer 1981, p. 3 1). The validation procedure determined the reliability of the model and gave direction for an in depth review of biomass dependent supply systems. In most instances model validation implies that there is ~al-world data from an existing system available to assess the performance of the model (Schmidt and Davis 1987, p. 12). In the case of converting agricultural crops, such as corn into products like corn syrup, the final costs were in agreement with those of commercial enterprises. However, there was no comparable commercial data for woody biomass. In
this case, model validation rested upon judgments of the modeler and agreement with the results of similar studies (Schmidt and Davis 1990).
A recommended validation procedure was used (Buffa and Dyer 1981). First, the model was run while fixing the decision variables and logical relationships at a certain level so that the solution can be compared to a hand calculated answer. Second, the model must be run several times to ensure that the logical relationships and mathematical analysis were comctly programmed in the computer (Buffa and Dyer 1981). Last, the output from model runs were compared to other study results to detect any major discrepancies. Technical and cost data inputs for the validation model are described in the following sections.
Technical and Cost Inputs to the Model
The model analysis described an ethanol production facility with a self-owned woody biomass plantation supply system (Tables 1 and 2). The DP format appropriately organized the structure of the model. All data was entered into the model equations and used within the DP framework to amve at specific optimal prescriptions under given sets of assumptions.
Plantation Component
The plantation component encompassed the silvicultural aspects and availability of the raw material resource as standing trees. The model was capable of considering different types and yields of forest biomass grown under varying rotation lengths. A fixed plantation size of about 9020 ha was used as an .,.
estimate on land availability for tree production within an area defined by a 40-km transport radius. A plantation unit size was considered totaling 1503 hectares (ha) of hybrid poplar for a six-year
rotation. Based upon previous studies of short rotation tree plantations the yield for nonfertilized plantations was estimated at 73.8 Mg(0D) ha-' at the end of a six-year rotation (Perlack et al. 1986; Hansen 1988). Thus the total available wood from the 1503 ha unit during the harvest year was approximately 110,922 Mg(0D).
Plantation establishment expenses included the field preparation tasks of mowing, disking, spraying and harrowing. Also included were the costs of cuttings and the planting operation. Establishment costs amounted to $3.06 Mg-'(OD). Maintenance and administrative expenses included the biennial spraying of fungicides and insecticides, land rent and the annual costs of management. The total cost of maintenance tasks over six years was $14.31 Mgl(OD). Spraying costs were 12.8% of total maintenance, land rent and taxes were 52.8%. and managerial costs were the remaining 34.4% (Grado and Strauss 1993).
Harvest Component
The main features of concern for the harvesting component involved the harvesting, transport and raw material inventory practices. Plantation harvests were influenced by feedstock and end product demand rates. The harvesting window in the model was set at six months, from October to March. When a harvest occurs the raw material was transported into storage and/or processing at the beginning of the next respective period, from November to April. There were no raw materials on-hand at the beginning of the harvest window.
The system used a tractor-pulled harvesting unit which reflected cumnt technological trends, favoring smaller-scale equipment. The capability of the harvesting system was entered to the model as a discrete variable. The model used a value of 19.85 Mg(green) h-I, for a low density tree spacing. This value was derived from the capabilities of prototype machines developed for short-rotation forestry (Meridian Corp. 1984, p. 69; Stokes et al. 1986). It was assumed that a machine would operate for an entire month and that additional machine capacity would act as a buffer in case of machinery breakdown or to compensate for inclement weather. The minimum harvest, in any period when one occurs, was 10%. After harvest, the trees were moved off the site and brought to a chipper.
The model considered a utilization rate for supplying raw materials to a storage site and processing plant. This was the percentage of total biomass removed from the growing site which a harvester and its associated equipment could deliver to the point of storage or manufacture. The model employed a utilization
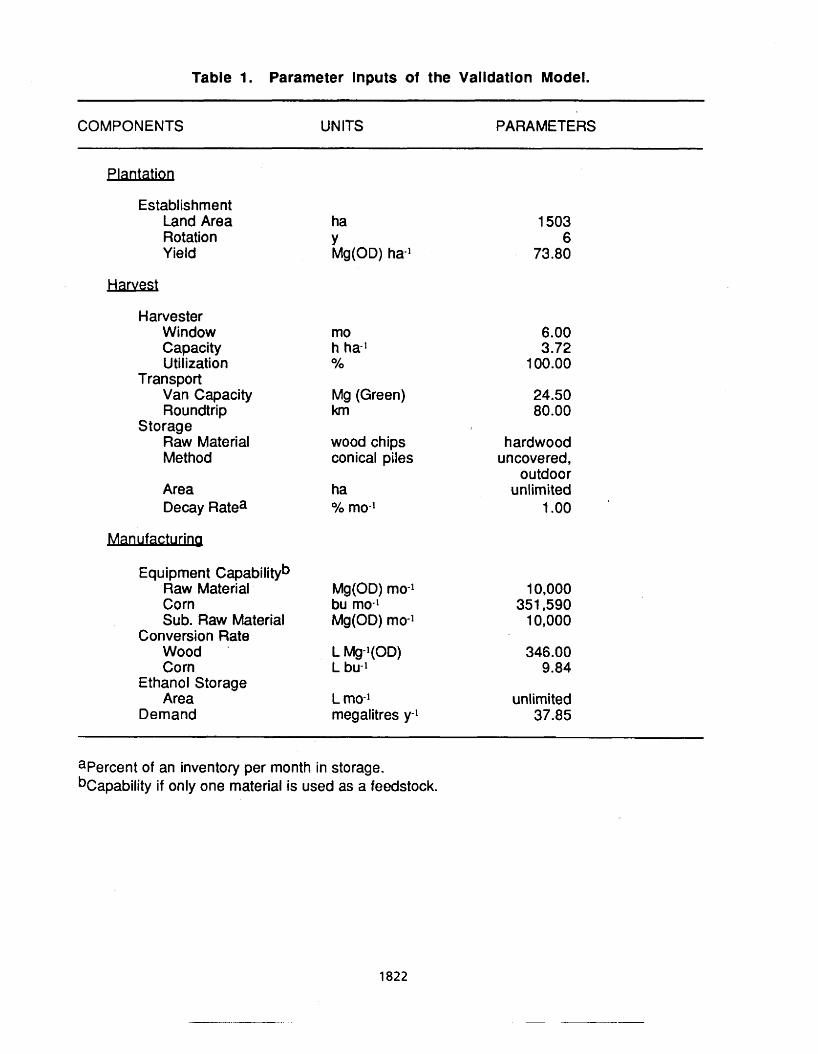
Table 1. Parameter Inputs of the Validation Model.
COMPONENTS UNITS PARAMETERS
Establishment Land Area Rotation Yield
Harvester Window Capacity Utilization
Transport Van Capacity Roundtrip
Storage Raw Material Method
Area Decay Ratea
Equipment capabilitYb Raw Material Corn Sub. Raw Material
Conversion Rate Wood .
Corn Ethanol Storage
Area Demand
Mg (Green) km
wood chips conical piles
hardwood uncovered,
outdoor unlimited
t .OO
L mo-I unlimited megalitres y-l 37.85
apercent of an inventory per month in storage. b~apability if only one material is used as a feedstock.
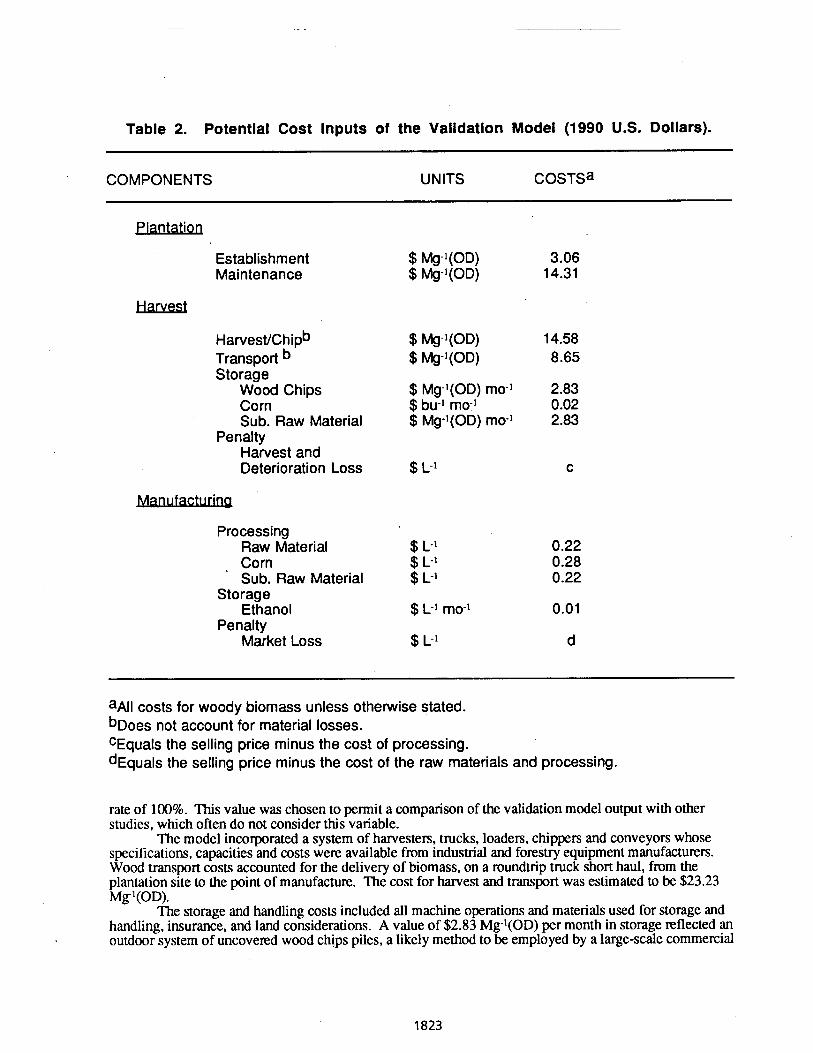
Table 2. Potential Cost inputs of the Validation Model (1990 U.S. Dollars).
COMPONENTS UNITS COSTSa
Establishment Maintenance
Harvest
~arves t l~h ipb Transport Storage
Wood Chips Corn Sub. Raw Material
Penalty Harvest and Deterioration Loss
Processing Raw Material $ L-I 0.22
, Corn $ L-* 0.28 Sub. Raw Material $ L-I 0.22
Storage Ethanol $ L-1 mo-I 0.01
Penalty Market Loss $ L-I d
aAll costs for woody biomass unless otherwise stated. b ~ o e s not account for material losses. CEquals the selling price minus the cost of processing. d ~ ~ u a l s the selling price minus the cost of the raw materials and processing.
rate of 100%. This value was chosen to permit a comparison of the validation model output with other studies, which often do not consider this variable.
The model incorporated a system of harvesters, trucks, loaders, chippers and conveyors whose specifications, capacities and costs were available from industrial and forestry equipment manufacturers. Wood transport costs accounted for the delivery of biomass, on a roundtrip truck short haul, from the plantation site to the point of manufacture. The cost for harvest and transport was estimated to be $23.23 Mgl(OD).
The storage and handling costs included all machine operations and materials used for storage and handling, insurance, and land considerations. A value of $2.83 Mg-'(OD) per month in storage reflected an outdoor system of uncovered wood chips piles, a likely method to be employed by a large-scale commercial
enterprise. The validation model solution included penalty costs associated with litre production foregone from harvest losses or storage deterioration.
Manufacturing Component
The general manufacturing pmcess used in the model to convert wood into ethanol was hydrolysis/fermentation. The technical inputs represented a process that contributed to a higher level of biomass conversion through yeast xylose fermentation (Wayman et al. 1987; Wright 1988; Hinman et al. 1989). The model required information on the delivered form and condition of stored woody biomass materials prior to conversion into a product. Variations in the feedstock alter the yields for a particular manufacturing system. The conversion rate used was 346 l i t ~ s of ethanol for each Mg(0D) of woody biomass, in the fonn of hardwood chips, available fmm the plantation (Wayman et al. 1987). This represented a conversion efficiency of 27%. In the model, all biomass was directed to a plant capable of processing 10,000 Mg(0D) of woody biomass equivalent per month to meet a coinciding target demand of 37,850,000 litres of ethanol per year (ten million gallons). This latter parameter was indicative of a borderline market demand for a small to medium size production plant (Kane and Reilly 1988) and provided a point of origin for further embellishments to the processing capacity.
For the validation model, the firm was only permitted to acquire raw materials that were self-owned and without any internal borrowing of feedstocks from other plantation units. After raw material processing was completed, the final product was either stored or sold. Thus, there could potentially be shortages of raw materials at the processing level and/or litres of ethanol in the open market. The model disallows backlogging, therefore, the former instance would denote "lost sales" related to the system input and the latter, "lost sales" related to the system output. No inventory of finished product existed at the initiation of the model run.
Storage of ethanol was set at an unlimited capacity. Ethanol demand, though subject to a uniform rate of flow throughout a month, varied on a month-to-month basis in accordance with fuel demand. Average monthly demand rates were calculated based on historical data for gasoline over the last 10 years (USDOE 1990). It was assumed ethanol was intended for use as a gasoline additive, therefore the demand for ethanol in a particular month was associated with gasoline demand. Schuler and Nguyen (1989) used a similar association for ethanol and gasoline. Furthermore, since gasoline demand occurred in the month of use, a lag of one month was employed for the ethanol required for gas production. For example, the month of November would have October's harvest but December's demand rate for gasoline.
Wood to ethanol processing facilities have seldom gone beyond the experimental stage, however, conversion costs have been estimated in feasibility studies, particularly for medium size plants (Wright 1988; Hinman et al. 1989; Lynd 1990). The hydrolysis/fermentation process cost, used in this model, was $0.22 L-I of production, exclusive of feedstock and ethanol storage costs. The costs for storing ethanol on- site are rarely discussed or distinguished from the other costs of manufacturing. The cost of storing ethanol was closely tied to that of gasoline and estimated at $0.01 L - I mo-I (David 1978; NPC 1984).
Finally, there were no credits attributed to by-products in the analysis. While it is recognized that by-products are most ofien a part of processing, the types of products and amounts are uncertain for each conversion process. The omission of by-products, beyond simplifying the analysis, permitted a clearer assessment of the viability of a particular system and the relationships within it.
System Comparisons
The model was capable of incorporating alternative raw materials into a conversion process. Woody biomass, identical to the main feedstock, but purchased on the outside, could be conside~d when shortages exist. Another option is to purchase a similar product (e-g. another type of wood) and/or substitute feedstock (e.g. corn) when technically allowable. These features were incorporated into the programming of the model to eventually show the impacts of handling more than one feedstock. By altering the model constraints for these raw material acquisitions, it is then possible to obselve the various impacts on system shortages.
The model evaluated a variety of bioconversion opportunities to compare the efficiency and supply potential of these biomass dependent systems. One widely discussed example included the use of alternative or multiple biomass feedstocks for a specific conversion process. The use of corn as a feedstock for ethanol conversion is the most prevalent process on the market today. Several comparisons were made among systems that use wood only, corn only and a combination of both feedstocks.
The first comparison was to assess the use of wood versus corn exclusively. The technical
parameters for wood were from the low density, six-year rotation system (Table 1). The corn system also used the parameters set forth in Table 1. The processing costs for corn, were for a medium size processing facility (Kane and Reilly 1988). The storage costs for corn were based on commercial scale operations (Carson 1988). Table 3 listed the cost inputs when using wood and/or corn in an ethanol process.
A second comparison judged the impact on biomass fed systems when supplementing with alternative feedstocks during periods of raw material shortages at the processing site. The analysis implemented an even cut wood system, having identical harvests during the harvest window. The comparison was illustrated between this wood system, both with and without corn.
In the systems where corn was used, the model purchased corn to offset processing facility deficits in the month they occur. Corn was purchased to the point of avoiding "lost sales." In other words, corn was ordered as needed and never stored for more than a month at a time.
Last, a comparison was made between the optimal solution for the harvest of a low density, six- year rotation system versus an even cut harvest when producing ethanol from these plantations.
RESULTS AND DISCUSSION
The General Model
The validation model was assembled, under the assumptions summarized in Tables 1 and 2, for the purpose of verifying the relationships among model variables and the accuracy of the resulting outputs for woody biomass dependent systems. A model solution to the inventory control problem was achieved using dynamic programming.
The wood-to-end-product system under consideration was capable of producing 37.8 million litres of ethanol in the harvest year, a 13.6 million L increase over the least optimal policy as demonstrated in the dynamic programming results. The harvest policy for the system solution was to cut 10% of the plantation land area in each of the first five months and 50% in the sixth month of the harvest period. These cuts point to the required number of harvest/transport units needed in a harvest period. Certain constraints may necessitate a less than optimal use of equipment.
The model validation costs by component and task, from the DP solution, are listed in Table 4. The system produced ethanol at a delivered cost of $0.38 L-1, without consideration of by-product credits. The largest cost for the entire system was for the manufacturing of harvested raw materials into ethanol. This represented 59.0% of the total cost. The harvest, chipping, and transport tasks contributed 18.0% to the total cost. This was followed by plantation maintenance and establishment at 14.1%. The storage costs for woody biomass and ethanol represented 4.3% and 2.4% of the total cost, respectively. Penalty costs for deterioration and market losses were a combined 2.2%.
The feedstock considerations (plantation, harvest/transport, and chip storage), for woody biomass alone, consisted of 37.2% of the total cost for the end product, whereas manufacturing concerns were responsible for 62.8%. On an inventory cost basis carrying costs were 19.3%, replenishment costs were 78.8% and shortage costs were 1.9% of the total cost, respectively.
The validation step gave reasonable results for the wood-to-end product system under investigation and enabled a continuation of the analysis. The least cost result from the validation model ($0.38 L-I) was consistent with the unit costs from other studies. Schuler and Nguyen (1989) predicted an ethanol production cost range of $0.54 to $1.05 L-l, using traditional wood supplies and depending on facility size. However, a target range of $0.16 to $0.39 L-I was viewed as feasible, through improvements in the conversion process (Schuler and Nguyen 1989). Lynd (1990) summarized several of the current and future trends in ethanol production from wood and foresaw a likely cost range of $0.20 to $0.70 L-l.
Although feedstock costs based upon plantation wood and wood chip storage tend to be higher than from previous studies, the cost breakdown for feedstock and manufacturing in the validation model was fairly consistent to other studies using wood. The validation model found 37.2% of the total cost devoted to the feedstock and 62.8% attributed to manufacturing. Schuler and Nguyen (1989) reported a base case breakdown of 24% and 76%. respectively, for a forest residue and waste wood fed system. However, this also included a by-product credit for lignin. Strauss et al. (1990) reported on several wood to ethanol systems where feedstock inputs represented 44-48% of the total product cost, with a potential of decreasing raw material costs to 20%. A review of recent process designs for ethanol production from wood found feedstock costs approaching 30 to 40% and manufacturing costs 70 to 60% (Lynd 1990).
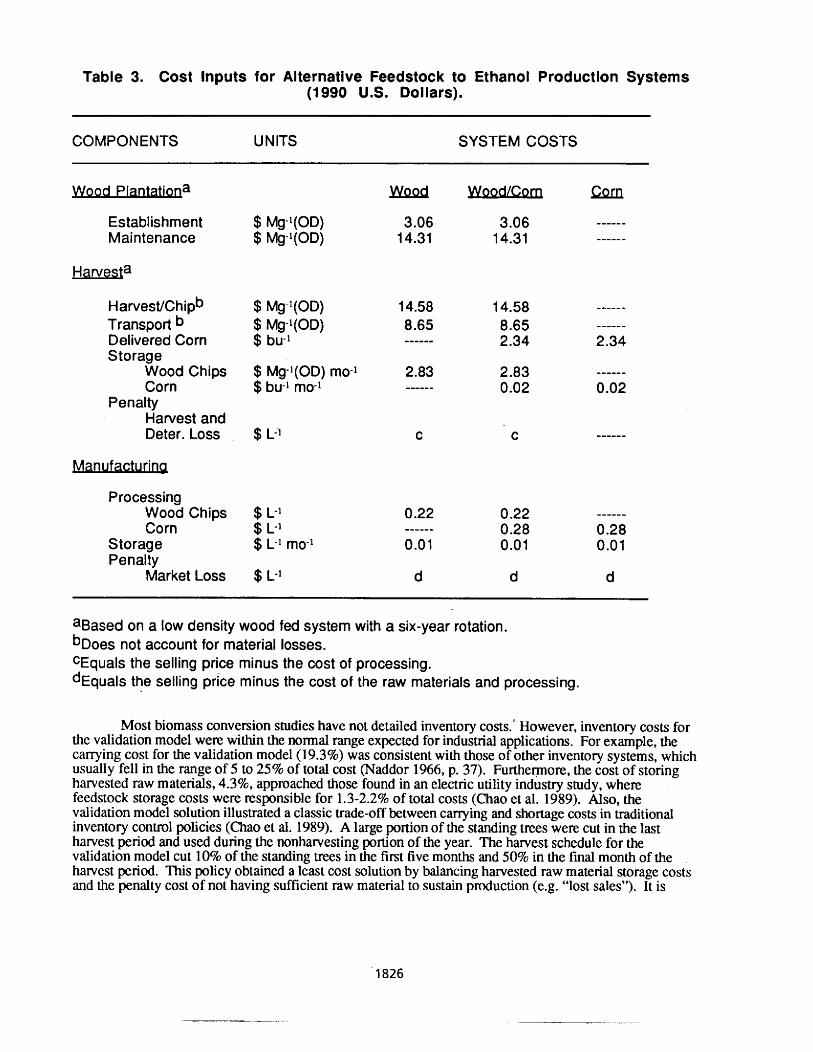
Table 3. Cost Inputs for Alternative Feedstock to Ethanol Production Systems (1990 U.S. Dollars).
COMPONENTS UNITS SYSTEM COSTS
ood Plarlfcatlqna Wood
Establishment Maintenance
tiarvest/chipb Transport b Delivered Corn Storage
Wood Chips Corn
Penalty Harvest and Deter. Loss
Processing Wood Chips Corn
Storage Penalty
Market Loss
aBased on a low density wood fed system with a six-year rotation. b ~ o e s not account for material losses. CEquals the selling price minus the cost of processing. d~cquals the selling price minus the cost of the raw materials and processing.
Most biomass conversion studies have not detailed inventory costs.' However, inventory costs for the validation model were within the normal range expected for industrial applications. For example, the carrying cost for the validation model (19.3%) was consistent with those of other inventory systems, which usually fell in the range of 5 to 25% of total cost (Naddor 1966, p. 37). Furthermore. the cost of storing harvested raw materials, 4.3%. approached those found in an electric utility industry study, where feedstock storage costs were responsible for 1.3-2.2% of total costs (Chao et al. 1989). Also, the validation model solution illustrated a classic trade-off between carrying and shortage costs in traditional inventory control policies (Chao et al. 1989). A large portion of the standing trees were cut in the last harvest period and used during the nonharvesting portion of the year. The harvest schedule for the validation model cut 10% of the standing trees in the first five months and 50% in the final month of the hawest period. This policy obtained a least cost solution by balancing harvested raw material storage costs and the penalty cost of not having sufficient raw material to sustain production (e.g. "lost sales"). It is
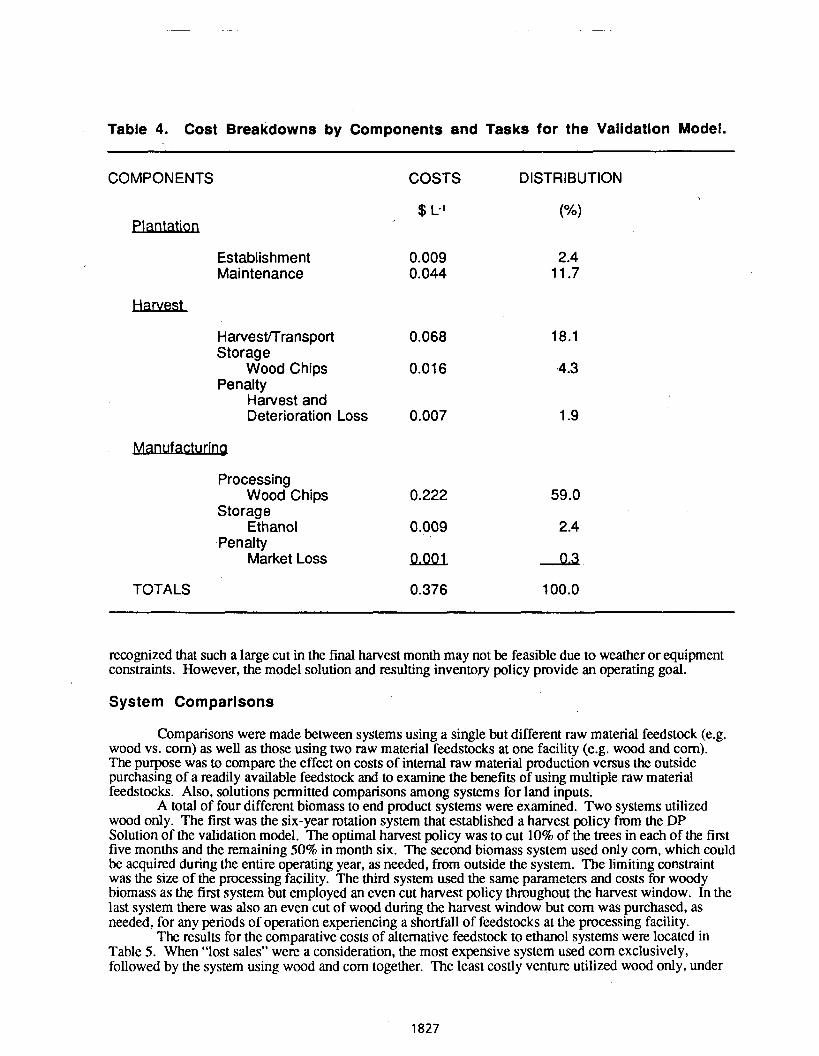
Table 4. Cost Breakdowns by Components and Tasks for the Valldatlon Model.
Establishment Maintenance
- --
COMPONENTS
Plantation
Harvest
COSTS DISTRIBUTION
Harvestrrransport 0.068 Storage
Wood Chips 0.01 6 Penalty
Harvest and Deterioration Loss 0.007
Processing Wood Chips 0.222 59.0
Storage Ethanol 0.009 2.4
Penalty Market Loss QJJQl 0.3
TOTALS 0.376 100.0
recognized that such a large cut in the final harvest month may not be feasible due to weather or equipment constraints. However, the model solution and resulting inventory policy provide an operating goal.
System Comparisons
Comparisons were made between systems using a single but different raw material feedstock (e.g. wood vs. corn) as well as those using two raw material feedstocks at one facility (e.g. wood and corn). The purpose was to compare the effect on costs of internal raw material production versus the outside purchasing of a readily available feedstock and to examine the benefits of using multiple raw material feedstocks. Also, solutions permitted comparisons among systems for land inputs.
A total of four different biomass to end product systems were examined. Two systems utilized wood only. The first was the six-year rotation system that established a harvest policy fmm the DP Solution of the validation model. The optimal harvest policy was to cut 10% of the trees in each of the first five months and the remaining 50% in month six. The second biomass system used only corn, which could be acquired during the entire operating year, as needed, from outside the system. The limiting constraint was the size of the processing facility. The third system used the same parameters and costs for woody biomass as the first system but employed an even cut harvest policy throughout the harvest window. In the last system there was also an even cut of wood during the harvest window but corn was purchased, as needed, for any periods of operation experiencing a shortfall of feedstocks at the processing facility.
The results for the comparative costs of alternative feedstock to ethanol systems were located in Table 5. When "lost sales" were a consideration, the most expensive system used corn exclusively, followed by the system using wood and corn together. The least costly venture utilized wood only, under
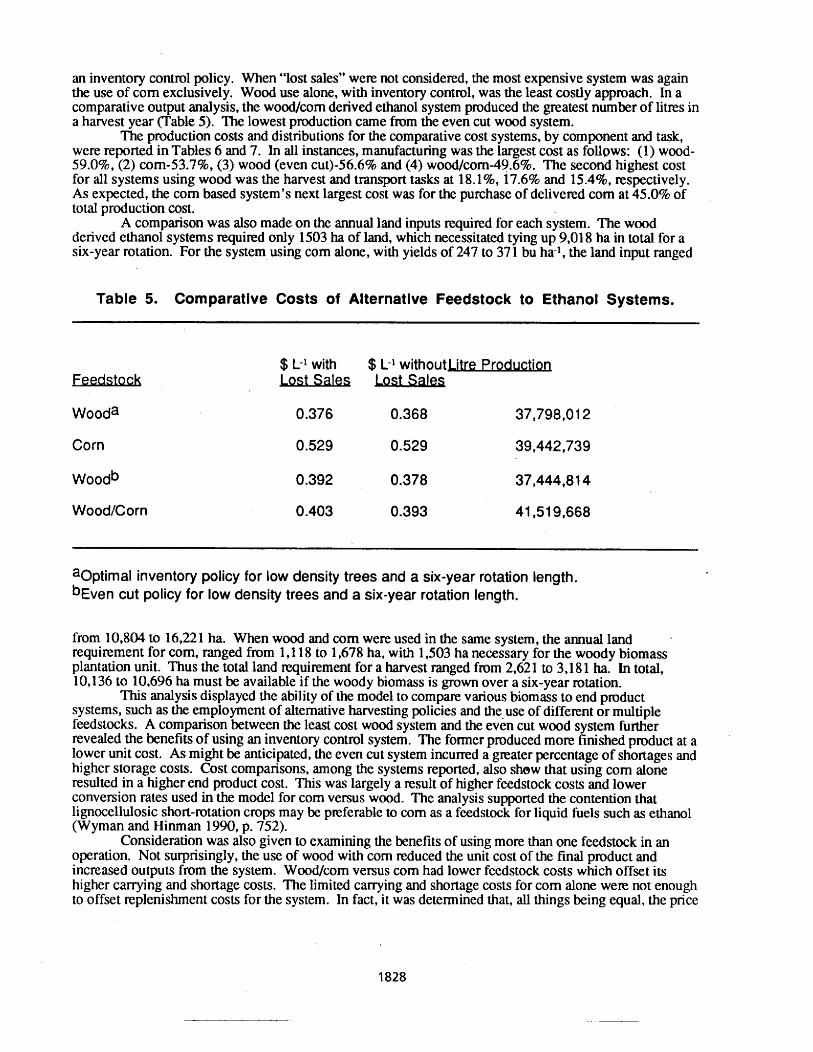
an inventory control policy. When "lost sales" were not considered, the most expensive system was again the use of corn exclusively. Wood use alone, with inventory control, was the least costly approach. In a comparative output analysis, the wood/corn derived ethanol system produced the matest number of litres in a harvest year (Table 5). The lowest production came from the even cut wood system.
The production costs and distributions for the comparative cost systems, by component and task, were reported in Tables 6 and 7. In al l instances, manufacturing was the largest cost as follows: (1) wood- 59.0%, (2) corn-53.7%, (3) wood (even cut)-56.6% and (4) wood/com-49.6%. The second highest cost for all systems using wood was the harvest and transport tasks at 18.1%, 17.6% and 15.4%, respectively. As expected, the corn based system's next largest cost was for the purchase of delivered corn at 45.0% of total production cost.
A comparison was also made on the annual land inputs required for each system. The wood derived ethanol systems tequired only 1503 ha of land, which necessitated tying up 9,018 ha in total for a six-year rotation. For the system using corn alone, with yields of 247 to 371 bu ha-l, the land input ranged
Table 5. Comparatlve Costs of Alternatlve Feedstock to Ethanol Systems.
$ L-I with $ L-I withoututre Production Lost lJsG&s
Corn 0.529 0.529 39,442,739
aOptimal inventory policy for low density trees and a six-year rotation length. h e n cut policy for low density trees and a six-year rotation length.
from 10,804 to 16,221 ha. When wood and corn were used in the same system, the annual land requirement for corn, ranged from 1, 118 to 1,678 ha, with 1,503 ha necessary for the woody biomass plantation unit. Thus the total land requirement for a harvest ranged fmm 2,621 to 3,181 ha. In total, 10,136 to 10,696 ha must be available if the woody biomass is grown over a six-year rotation.
This analysis displayed the ability of the model to compare various biomass to end product systems, such as the employment of alternative harvesting policies and the-use of diffe~nt or multiple feedstocks. A comparison between the least cost wood system and the even cut wood system further revealed the benefits of using an inventory control system. The former produced more finished product at a lower unit cost. As might be anticipated, the even cut system incurred a greater percentage of shortages and higher storage costs. Cost comparisons, among the systems reported, also shew that using corn alone resulted in a higher end product cost. This was largely a result of higher feedstock costs and lower conversion rates used in the model for corn versus wood. The analysis supported the contention that lignocellulosic short-rotation crops may be preferable to corn as a feedstock for liquid fhels such as ethanol (Wyman and Hinman 1990, p. 752).
Consideration was also given to examining the benefits of using more than one feedstock in an operation. Not surprisingly, the use of wood with corn reduced the unit cost of the final product and increased outputs from the system. Wood/com versus corn had lower feedstock costs which offset its higher canying and shortage costs. The limited carrying and shortage costs for corn alone were not enough to offset replenishment costs for the system. In fact, it was determined that, all things being equal, the price
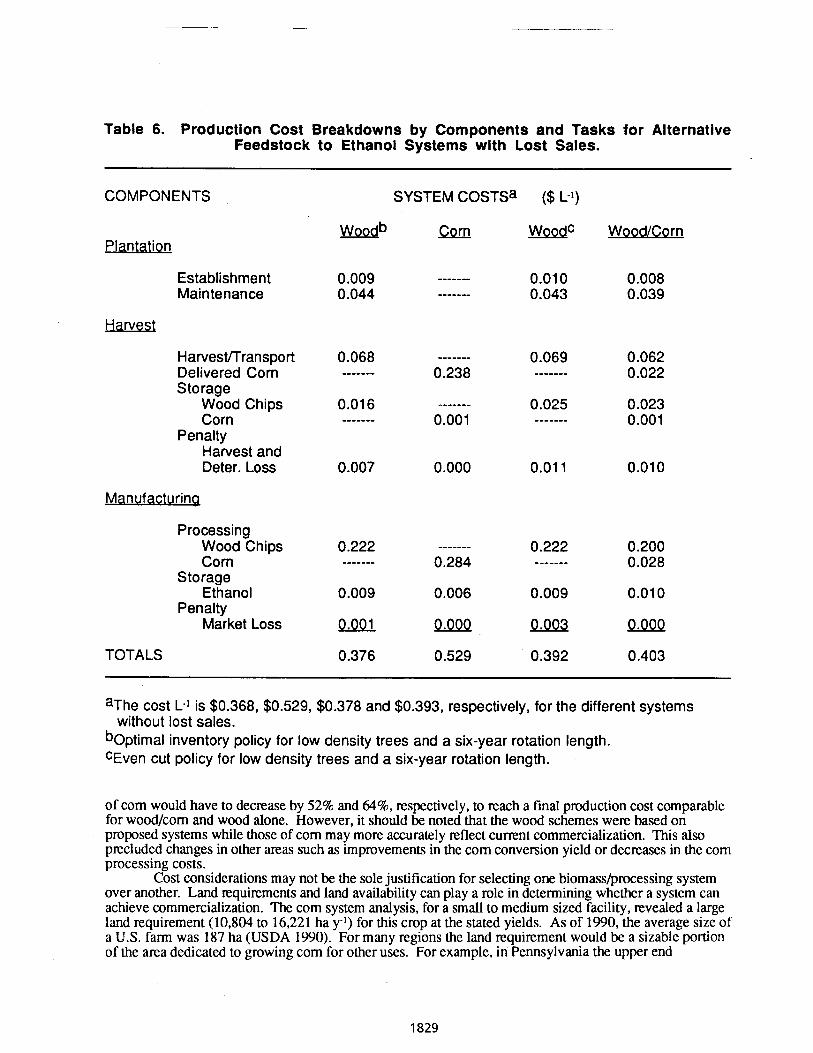
Table 6. Production Cost Breakdowns by Components and Tasks for Alternative Feedstock to Ethanol Systems with Lost Sales.
COMPONENTS
Plantation
Establishment Maintenance
Harvest
Harvestfrransport Delivered Corn Storage
Wood Chips Corn
Penalty Harvest and Deter. Loss
Manufacturing
Processing Wood Chips Corn
Storage Ethanol
Penalty Market Loss
TOTALS
SYSTEM COSTSa ($ L-I)
Woodb Corn WoodC
aThe cost L-I is $0.368, $0.529, $0.378 and $0.393, respectively, for the different systems without lost sales.
b~pt ima l inventory policy for low density trees and a six-year rotation length. CEven cut policy for low density trees and a six-year rotation length.
of corn would have to decrease by 52% and 64%, respectively, to reach a final production cost comparable for wood/com and wood alone. However, it should be noted that the wood schemes were based on proposed systems while those of corn may more accurately reflect current commercialization. This also precluded changes in other areas such as improvements in the corn conversion yield or decreases in the corn processing costs.
Cost considerations may not be the sole justification for selecting one biomass/processing system over another. Land requirements and land availability can play a role in determining whether a system can achieve commercialization. The corn system analysis, for a small to medium sized facility, revealed a large land requirement (10,804 to 16,221 ha y-I) for this crop at the stated yields. As of 1990, the average size of a U.S. farm was 187 ha (USDA 1990). For many regions the land requirement would be a sizable portion of the area dedicated to growing corn for other uses. For example, in Pennsylvania the upper end
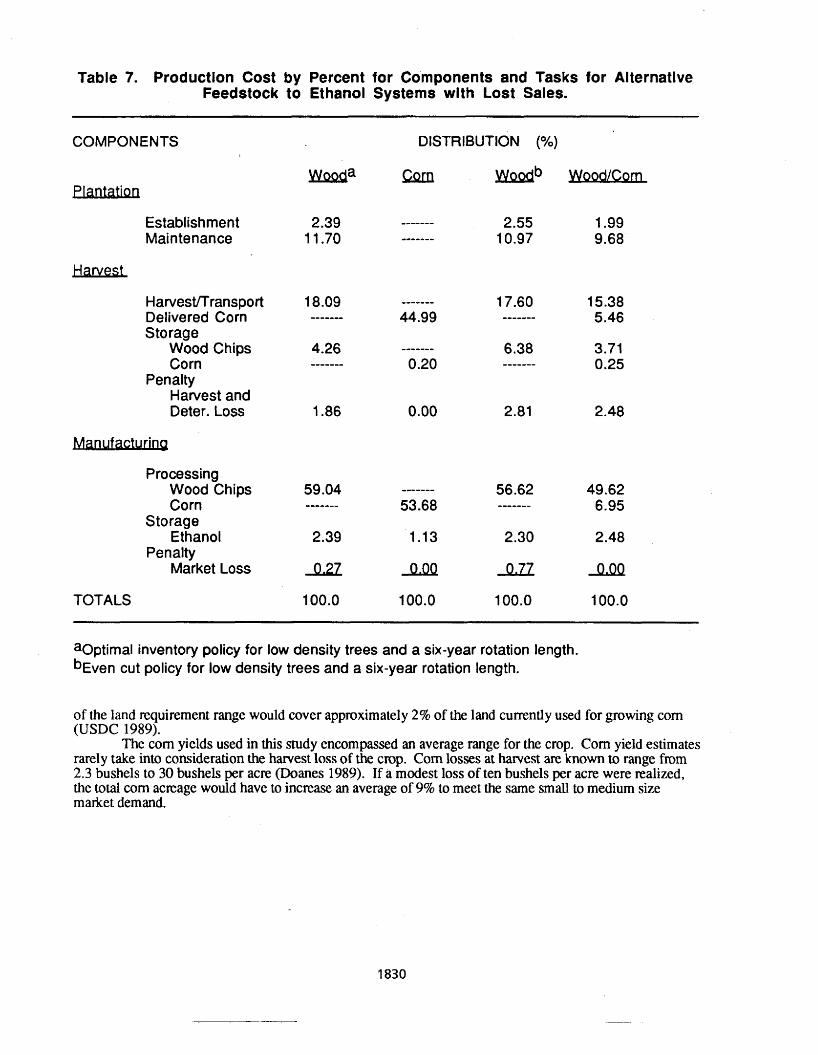
Table 7. Production Cost by Percent for Components and Tasks for Alternative Feedstock to Ethanol Systems with Lost Sales.
- -
COMPONENTS DISTRIBUTION (%)
Establishment 2.39 2.55 1.99 Maintenance 1 1.70 ------- 10.97 9.68
HarvestITransport Delivered Corn Storage
Wood Chips Corn
Penalty Harvest and Deter. Loss
Processing Wood Chips Corn
Storage Ethanol
Penalty Market Loss
TOTALS
aOptimal inventory policy for low density trees and a six-year rotation length. b ~ v e n cut policy for low density trees and a six-year rotation length.
of the land requirement range would cover approximately 2% of the land currently used for growing corn (USDC 1989).
The corn yields used in this study encompassed an average range for the crop. Corn yield estimates rarely take into consideration the harvest loss of the crop. Corn losses at harvest are known to range from 2.3 bushels to 30 bushels per acre (Doanes 1989). If a modest loss of ten bushels per acre were realized, the total corn acreage would have to increase an average of 9% to meet the same small to medium size market demand.
CONCLUSIONS
The validation model performed as expected and passed the inspection process. Additionally, when an optimal solution was amved at using dynamic programming, the model showed that inventory control reduced biomass deterioration and lowered the unit costs of the final product. A balance was necessary between the carrying of inventories and incumng of shortages in order to lower total costs. Most importantly, processing systems using biomass feedstocks can lower unit production costs by operating efficiently. Inventory control is one way of achieving this goal.
To avoid shortages, an enterprise may be forced to look for several diverse feedstocks to supply its processing facility. An internal source of raw material may be necessary to achieve feedstock security and reliability of raw material quality. For example, a wood-burning facility producing steam can use stored biomass during power surges. Finally, biomass feedstocks may be necessary to mitigate environmental concerns where restrictions based on traditional feedstocks, such as fossil fuels, may be cost prohibitive.
REFERENCES
Euffa, E.S. and J.S. Dyer. 1981. Management Science1 Operations Research: Model Formulations and Solution Methods. 2nd ed. John Wiley and Sons, New York, N.Y. 718 pp.
Carson, J.M. 1988. Calculations Used in storing and Drying Corn. Coop. Ext., Coll. of Agric., Penn. State Univ., Univ. Park., Penn. Ext. Circ. 360. 7 pp.
Chao, H-P., S.C. Chapel, C.E. Clark, Jr., P.A. Moms, M.J. Sandling and R.C. Grimes. 1989. "ERPI reduces fuel inventory costs in the electric utilities industry." Interfaces. 19(1):48-67.
David, M.L., G.S. Hammaker, R.J. Buzenberg and J.P. Wagner. 1978. Gasohol: Economic Feasibility Study. Prepared for Energy Research and Development Center, U. of Nebr., Lincoln, Nebr. 210 pp.
Doane's Agricultural Report. 1989. Doane's Agricultural Service, Inc. St. Louis, Mo. Vol. 52, No. 23- 5. p.324
Ghare, P.M. and G.F. Schrader. 1963. "A model for an exponentially decaying inventory." J. Indust. Eng. 14(5):238-243.
Grado, S.C. and C.H. Strauss. 1993. "An Inventory Control Model for Supplying Biomass to a Processing Facility." Appl. Biochem. and Biotech. 391405-25.
Hansen, E.A. 1988. "SRIC Yields: A Look to the Future." In Economic Evaluations of Short-Rotation Biomass Energy Systems. International Energy Agency, Duluth, Minn., pp. 197-207.
Hillier, F.S. and G.J. Lieberman. 1986. Introduction to Operations Research. Holden-Day Inc., Oakland, Calif. 4th. ed. 888 pp.
Hinman, N.D., J.D. Wright, W. Hoagland and C.E. Wyman. 1989. "Xylose fermentation: An economic analysis." Appl. Biochem. and Biotech. 20121 :391-401. Kane, S.M. and J.M. Reilly. 1988. Economics of Ethanol Production in the United States. USDA. Resources and Tech. Div., Econ. Res. Serv., Agric. Econ. Rep. No. 607, Wash., DC, 20 pp.
Lynd. L.R. 1990. "Large-scale fuel ethanol from lignocellulose." Appl. Biochem. and Biotech. 24/25 1695-7 17.
Meridian Corp. 1984. Energy Wood Harvesting Technology: A Review of the State of the Art. U.S. DOE, (Con. No. DE-AC01-83CE-30784). Springfield, Vir. 108 pp.
Naddor, E. 1966. Inventory Systems. John Wiley and Sons, New York, N.Y. 341 pp.
NPC. 1984. Petroleum Inventories and Storage Capacity: A Report of the National Petroleum Council. Prepared for the Dept. of Energy. Wash., DC, 44 pp.
Perlack, R.D., J.W. Ranney, W.F. Barron, J.H. Cushman and J.L. Trimble. 1986. "Short-rotation intensive culture for the production of energy feedstocks in the U.S.: a review of experimental results and remaining obstacles to commercialization." Biomass. 9(2): 145-I 59.
Peterson, R. and E.A. Silver. 1979. Decision Systems for Inventory Management and Production Planning. John Wiley and Sons, New York, N.Y. 799 pp.
Schmidt, J.W. and R.P. Davis. 198 1. Foundations of Analysis in Operations Research. Academic Press, New York, N.Y. 383 pp.
Schuler, A.T. and Q. Nguyen. 1989. "Bioconversion opportunities and strategies: a pragmatic approach." For. Prod. J. 39(4):33-38.
Silver, E.A. 198 1. "Operations research in inventory management: a review and critique." Opns. Res. 29(4):629-645.
Stokes, B.J., D.J. Frederick and D.T. Curtin. 1986. "Field trials of the short-rotation biomass feller buncher and selected harvesting systems." Biomass. 1 l(3): 1 85-204.
Strauss, C.H., S.C. Grado, P.R. Blankenhorn and T.W. Bowersox. 1989. "Developing financial and energy accounting models for woody biomass systems." Solar Energy. 42(5):379-386.
Strauss, C.H., S.C. Grado, P.R. Blankenhorn and T.W. Bowersox. 1990. "Financial selection of rotation age for SRIC plantations." B w m s . 23(1):55-69.
Taha, H.A. 1982. Operations Research: An Introduction. Macmillan Pub. Co., New York, N.Y. 848 pp.
USDA. 1990. Agricultural Statistics 1990. U.S. Gov. Printing Off., Wash., DC.
USDC. 1989. 1987 Census of Agriculture. Geo. Area Series: Penn. State and County Data. AC87-A-38. U.S. Gov. Printing Off., Wash., DC.
USDOE. 1990. Consumption of Energy by the Transportation Sector. Monthly Energy Review. Energy Infor. Admin., Off. of Energy Markets and End Use. Wash., DC.
Wayman,.M., C. Seagrave and S.R. Parekh. 1987. "Ethanol fermentation by Pichia sti~itis of combined pentose and hexose sugars from lignocellulosics prehydrolysed by SO:! and enzymatically saccharified." Process Biochem. 22(2):55-59.
Wright, J.D. 1988. "Evaluation of Enzymatic Hydrolysis Processes." In Inst. of Gas Tech. Symposium: Energy from Biomass and Wastes XII . New Orleans, La. 30 pp.
Wyman, C.E. and N.D. Hinman. 1990, "Ethanol." Appl. Biochem. and Biotech. 24/25:735-753.
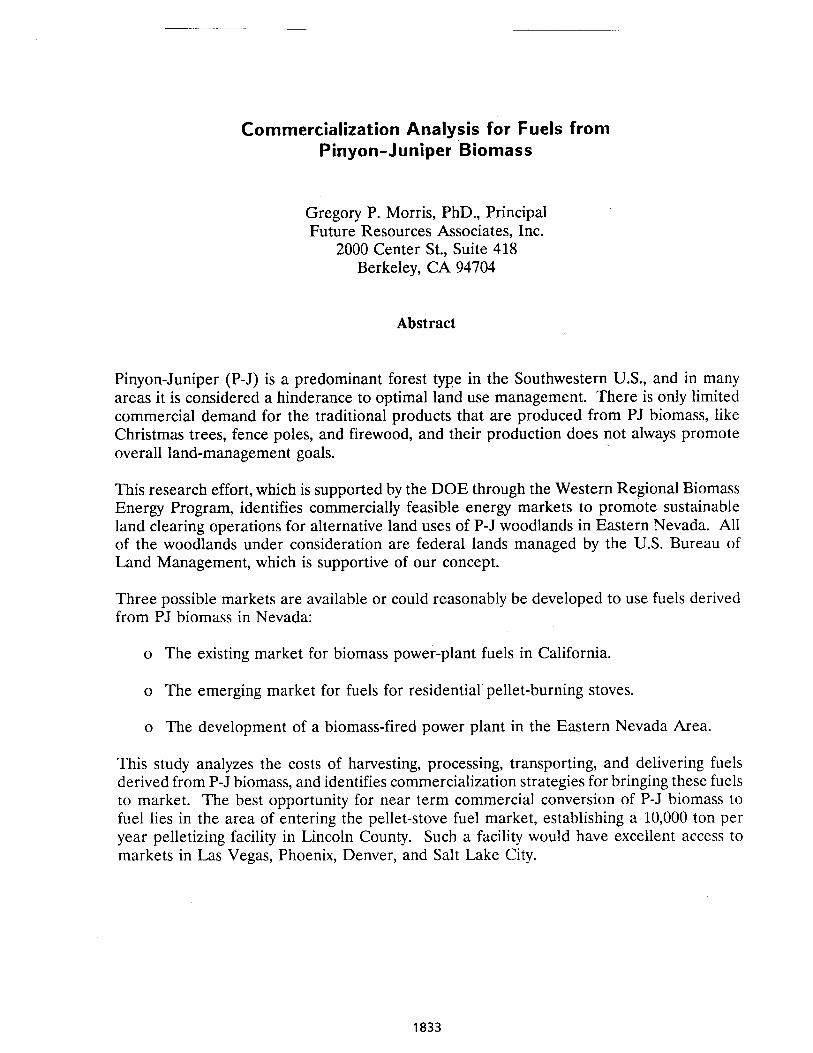
Commercialization Analysis for Fuels from Pinyon-Juniper Biomass
Gregory P. Morris, PhD., Principal Future Resources Associates, Inc.
2000 Center St., Suite 418 Berkeley, CA 94704
Abstract
Pinyon-Juniper (P-J) is a predominant forest type in the Southwestern U.S., and in many areas it is considered a hinderance to optimal land use management. There is only limited commercial demand for the traditional products that are produced from PJ biomass, like Christmas trees, fence poles, and firewood, and their production does not always promote overall land-management goals.
This research effort, which is supported by the DOE through the Western Regional Biomass Energy Program, identifies commercially feasible energy markets to promote sustainable land clearing operations for alternative land uses of P-J woodlands in Eastern Nevada. All of the woodlands under consideration are federal lands managed by the U.S. Bureau of Land Management, which is supportive of our concept.
Three possible markets are available or could reasonably be developed to use fuels derived from PJ biomass in Nevada:
o The existing market for biomass power-plant fuels in California.
o The emerging market for fuels for residential pellet-burning stoves.
o The development of a biomass-fired power plant in the Eastern Nevada Area.
This study analyzes the costs of harvesting, processing, transporting, and delivering fuels derived from P-J biomass, and identifies commercialization strategies for bringing these fuels to market. The best opportunity for near term commercial conversion of P-J biomass to fuel lies in the area of entering the pellet-stove fuel market, establishing a 10,000 ton per year pelletizing facility in Lincoln County. Such a facility would have excellent access to markets in Las Vegas, Phoenix, Denver, and Salt Lake City.
Introduction
Pinyon-Juniper (P-J) woodlands cover large areas in the American Southwest, and in many cases are considered an undesirable land cover. There is a great deal of federal and state interest in the concept of developing energy markets for P-J biomass in Eastern Nevada that would allow environmentally beneficial P-J clearing at no cost. I report here on a study of the commercialization potential for the production of fuels from P-J biomass in Eastern Nevada. The extent of the resource base is examined, and technology for harvesting and processing is analyzed. Energy markets for the P-J biomass are considered, and the commercialization potential and development pathways to reach that potential are determined.
Resource Potential
Pinyon-Juniper woodlands are a predominant forest type in middle elevations (3,000 - 10,000 ft.) of the U.S. Southwest that receive moderate amounts of precipitation. The mountains of Eastern Nevada, particularly in Lincoln and White Pine Counties, have vast expanses of P-J woodlands, some of it in dense stands containing as much as 45 tons per acre (green basis) of woody biomass. Pinyon and Juniper are non-native, invasive species in this area, and the BLM, which manages over 90 percent of the land in both of these counties, is interested in seeing some of this material cleared on a regular basis, provided that the clearing is done in an environmentally sound manner.
Figure 1 shows the acreages of P-J woodlands in the two Eastern Nevada Counties of Lincoln and White Pine. P-J acreages are classified by volume class, where volume is defined as the amount of harvestable cordwood per acre. There are more than 3.6 million acres of productive P-J woodlands in the two Counties, about equally distributed between the two. Almost 30 percent of the total, more than one million acres, are stocked with at least 600 cubic feet per acre of cordwood, which is equivalent to a minimum of 14 tons per acre of total harvestable biomass.
Figure 1 also shows the estimated biomass fuel resources in Lincoln and White Pine Counties, expressed in terms of harvestable bone-dry tons (BDT). The total resource base in the two counties is estimated at nearly 37 million BDTs, with 50 percent of the total tonnage located on the 30 percent of the land that is stocked with at least 600 cubic feet per acre of cordwood. The acreage in the highest volume class, greater than 1,000 cubic feet per acre, makes up 8 percent of the total P-J woodlands, but holds a full 184 percent of the total biomass resource base, more than 6.8 million BDTs. These densely stocked areas are precisely the ones that the BLM is most interested in having cleared, and the ones that could be most economically harvested for fuel.
Any harvesting of the P-J woodlands will have to be done on a sustainable basis, with rotations long enough to allow cleared lands to cycle through the stages of growth of grass lands through to regrowth of the P-J forest. It is generally thought that the total necessary rotational time for these slow growing woodlands is in the range of 60 - 150 years. Since only the most productive woodlands would be targeted for fuel production, it is felt that a
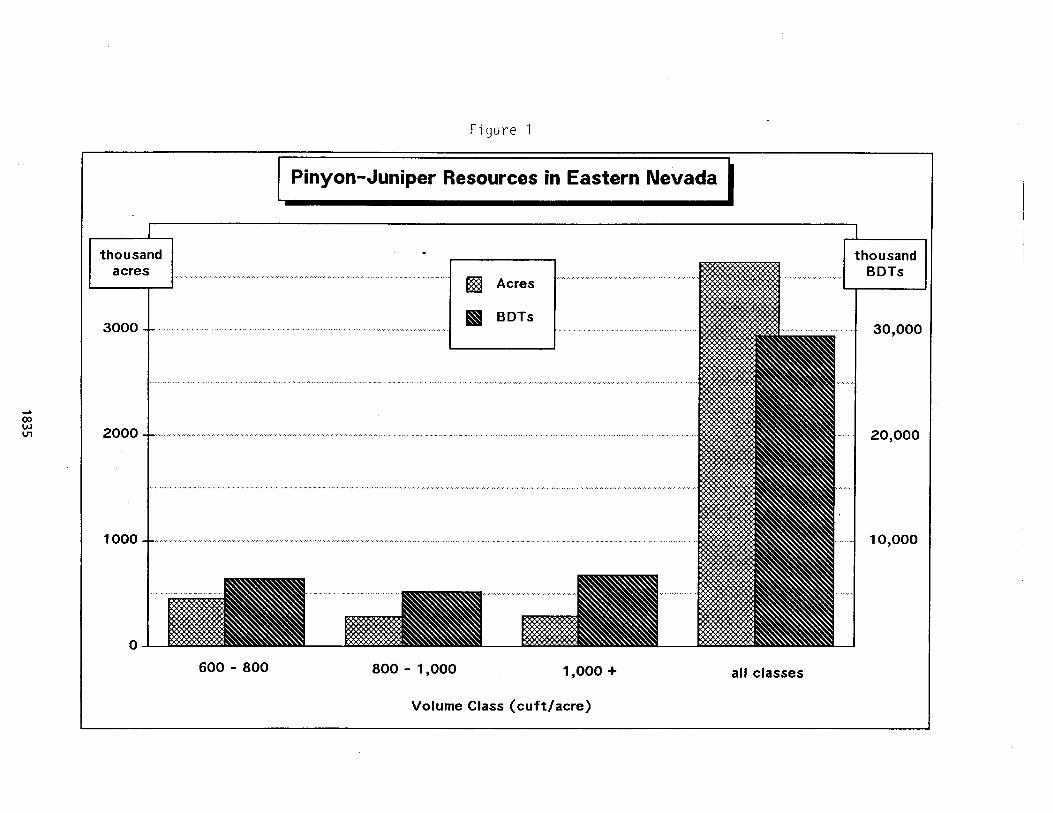
rotational period of 100 years would be adequate and reasonable. This means that the available resource base expressed on an annual, sustainable basis, for woodlands with at least 600 cubic feet per acre of cordwood, is approximately 185 thousand BDT/yr, enough to supply a 25 MW power plant.
Harvesting and Processing Technology
Large-scale fuels production from the Pinyon-Juniper woodlands will require mechanized harvesting and processing technologies to be used. The development of the biomass power industry over the past ten to fifteen years in regions like the Northeast U.S., Scandinavia, and California, has spawned the development of a variety of new technologies for the mechanized harvesting and processing of trees, producing whole-tree wood chips suitable for power-plant use. Technology is available for both selective harvesting and for full land clearing, for a variety of forest types and topographies. In the case of the Pinyon-Juniper woodlands of Eastern Nevada, most of the fuel production probably will involve land- clearing operations on rolling hills.
The first step in harvesting Pinyon-Juniper biomass is to cut the trees. Cutting is usually accomplished using shears mounted near ground level on a tractor. Some operations use feller-bunchers, which both cut the trees and grab them in order to haul the trees to a landing. Other operations simply cut the trees and knock them over, leaving them for later pick-up by other equipment. After cutting, the trees can either be chipped on-site using some type of mobile chipping or grinding equipment, or hauled to a fixed processing facility for chipping.
Trees in the Eastern Nevada Pinyon-Juniper woodlands tend to be fairly short and broad in form, with stiff branches sticking straight out from the trunk. There are few trees taller than thirty feet. Feller-bunchers are best suited for use with tallish, slender trees, and would be very difficult to adapt to use on the Pinyons and Junipers. Thus, the most likely method for cutting the trees will be to cut them in place and leave them for later pick-up and chipping. On-site chipping probably will be desirable. A heavy duty, broad-mouthed chipper will be required, due to the form of the trees. A wide variety of grinding and chipping equipment is commercially available, so finding suitable equipment should not be too difficult.
The size and form of the Pinyon and Juniper trees, as well as their planting density (trunks per acre, tons per acre) is similar to that of many California orchard tree crops, particularly almonds. Modern orchard clearing operations, which have been optimized for fuel production in California over the past five years, provide a better model for the harvesting and processing of Pinyon and Juniper woodlands in Eastern Nevada than, for example, forest-thinning operations in New England do. In a typical California orchard removal/fuel production operation, two converted forklifts are used to pick up the snipped trees and load them onto a conveyor to the chipper. The chipper is connected directly to a chip van, so fuel chips are blown directly into the van and ready for transport. Our current estimates are that one full mechanized harvesting crew would be able to produce on the order of 50,000 - 75,000 BDT per year of fuel.
Market Assessment
There is no existing market in the Eastern Nevada region that could absorb the quantities of materials that could be produced from the Pinyon-Juniper woodlands using modern, efficient, mechanized methods. Several options exist for developing a market for the material that could be produced. The major options include:
o The existing, nearly fifteen million ton-per-year biomass fuels market in neighboring California.
o The emerging market for residential pellet fuels in Las Vegas.
o Development of a local biomass power plant, either by a local utility company or as a private power producer.
The passage of the Federal PURPA legislation in 1978, and the implementation of a variety of policies and incentives in California during the 1980s, promoted the development there of the largest biomass-fueled power generating industry in the world. Almost 900 MW of capacity has been built and placed into service in California, and there are facilities located in all areas of the state.
The California biomass fuels market is currently a fairly mature market, with over fifty power generating facilities commissioned and in operation. Access to the market for Nevada's P-J biomass will require rail transportation of the fuel from Eastern Nevada. Several facilities in the San Joaquin and Imperial Valleys have good rail access, and could receive P-J fuel. All of the facilities purchase fuel from the same highly competitive market. Current market prices for biomass fuels in this region of California are in the range of $36 - 40 per BDT, with typical fuel sources being orchard removals and wastewood reclaimed
from landfills. The high Btu value and low ash content expected of Pinyon-Juniper fuels means that they would probably be able to earn a premium price at these facilities.
The city of Las Vegas, which is about 150 miles away from the Pinyon-Juniper woodlands of Nevada, has been experiencing rapid growth, with its population currently approaching one million. The city is also experiencing increasing air-pollution problems, and has begun to institute voluntary restrictions on the use of traditional wood-burning appliances, as well as considering banning the installation of traditional appliances in new residential construction. Modern pellet-burning stoves, which produce far less pollution than either fireplaces or air-tight wood stoves, are exempted from all restrictions. Pellet burning stoves increasingly are being installed in Las Vegas, where the market for fuel pellets is growing. A typical household that depends on a pellet stove for !heating in the Las Vegas area will consume pellet fuel at the rate of approximately one ton per year. Current prices for pellet fuels in the Las Vegas market are on the order of $250 per ton.
As an alternative to hauling fuelwood chips to the distant California market, it might be feasible to establish a demand for biomass power plant fuels in the Eastern Nevada area. Development of a biomass power plant in Eastern Nevada could be done either by one of

the local municipal utilities, or as a private power producer selling power to Nevada Power. Biomass power plants owned by municipal utilities currently are eligible for the federal renewable energy credit without the restrictions placed on other biomass facilities.
Commercialization of Fuels from Pinyon- Juniper Biomass
The cost of producing fuels from P-J biomass in Eastern Nevada can only be estimated at this time. A good deal of work needs to be done in the field before realistic values can be determined. Nevertheless, the costs of harvesting and processing P J biomass into a chipped form are expected to be in the range of $20 - 25 per BDT. Transportation costs into California would be in excess of $20 per BDT, leaving little possibility of California being a suitable long-term market for Eastern Nevada's P-J fuel.
Either of the two Nevada markets, the pellet fuel market or a local wood-burning power plant, has the potential to be a profitable market for the production of biomass fuels from P-J biomass. The pellet fuel market offers significant advantages for near-term application, as it allows start-up at a much smaller scale, and is a higher-valued market. A 10,000 BDT per year pellet mill could probably be supplied with wood by a full-scale chipping operation running for six to eight weeks in the summer, which coincides with the off-season for agricultural operations in ~alifornia. Thus it would be sensible to hire a California fuel processor to set up in Nevada each summer for a couple of months in order to supply the pellet mill. This would allow the costs and techniques for harvesting P-J biomass to be determined without having to invest in any new harvesting equipment.
Once a well managed pelletizing facility of can be established, and the costs and productivity of harvesting proven, consideration can be given to the development of a power plant that would require on the order of 50,000 - 75,000 BDT per year of fuel. The power plant would allow the permanent installation of a resident chipping operation in Nevada.
AN ECONOMIC EVALUATION OF FOREST IMPROVEMENT OPPORTUNITIES AND IMPACTS FROM THE EMERGENCE OF A BIOMASS FUEL MARKET IN SOUTHWESTERN NOVA SCOTIA
PHASE 1. Development of Framework and Methodology
Alexander L. Manley, MF, Forest Resources Consultant, Truro, N.S. Canada
Graham D. Savage, MF, Forest Economist, Forestry Canada, Fredericton, N.B. Canada
Abstract
In 1991, Nova Scotia's public power utility initiated a process to purchase privately produced electrical power. A proposal was received to produce 20-25 megawatts from the burning of 350 to 400 000 tqnnes annually of wood residue and forest biomass in a co-generation facility in southwestern Nova Scotia, Canada. This proposal has been proceeding and is nearing the construction phase.
As a result of this potential market, there is an opportunity for increasing the scope and extent of forest improvement operations. Options for a closer integration of planning, harvesting, and silviculture activities will emerge. Optimum end .use allocation could occur and enhance overall economic efficiency . The objective of this project is to assess the effect that this emerging market for forest biomass could have on forest management in the supply area.
This project has two phases. Phase 1, presented here, develops the framework and methodology. Phase 2 will apply a linear programming-based analytical model for evaluation.
Phase 1 accumulated the required data and information for both the current management and marketing situation and that including the emerging biomass market. Growth and yield of the natural stand types were calculated for a mixture of conventional roundwood products and chip equivalents. Management regimes, based on current forest type, site class, and appropriate silviculture treatments, were established. Expected multi- product yields, by regime, were estimated. Silviculture and harvest costs along with product revenues were used to calculate standing timber and soil expectation values. In Phase 2, a stand-based optimization model will be developed to explore and evaluate the long term opportunities and differences between the present and emerging management and market situations.
Introduction
Forest management activities generally are subdivided into three distinct categories: planning, harvesting, and silviculture. Planning generally focuses on locating, accessing, and harvesting stands of size and quality sufficient to meet wood demand. Harvesting activities are more engineering oriented, and focus on cutting and delivering wood in the form required by the secondary processing facility, at least cost. Silviculture activities focus on bringing harvested sites back into production as rapidly as possible, growing timber of the desired species composition and form to meet future demands.
Traditional primary forest products demanded by resource users in southwestern Nova Scotia include softwood sawlogs, softwood and hardwood pulpwood, hardwood fuelwood and small volumes of other speciality products. Due to the nature of this product demand, past harvesting practices, and inroads by fire, insects, and diseases, a number of areas require extensive silvicultural treatments to become more productive. But, in many cases, site conditions are not conducive to economically efficient rehabilitation because markets do not exist for "waste" material such as tops and limbs, low quality remnants of desired species, and low quality species.
A real opportunity to assess the effect that a market for waste material could have on forest management could be emerging in southwestern Nova Scotia. In early 1991, the Nova Scotia Power Corporation requested proposals to purchase a total of 50 MW of privately produced electrical power. One of the 12 proposals short-listed was a 21 MW co-generation facility from the Polsky Energy Corporation to be located next to the Bowater Mersey Paper Company (BMPC) newsprint mill, near Liverpool, N.S. BMPC would purchase the steam generated by the plant and would provide up to 50% of the estimated 350-400,000 tonnes of fuel required, in the form of bark and general wood waste. The balance of the fuel requirements would be procured in the area. The total fuel supply would include 20% to 30% whole tree chips.
Much opportunity for increasing the scope and extent of forest improvement operations could occur if a regional market for low grade material existed. Treatments such as site rehabilitation for older partial cutovers and high-graded sites, mixed stands of silvicultural "junk", and old field white pine may be greatly increased. The potential for stand improvement through thinning and various improvement cuttings could be enhanced. Utilization of the large quantities of slash might be possible.
The objective of this project is to assess the forest improvement opportunities and economic benefits which could accrue if a regional market for low grade "waste" material were developed. Options for a closer integration of planning, harvesting, and silviculture activities could be greatly enhanced with the widening of the scope and level of primary forest product demand. Optimum end use allocation could occur and overall economic efficiency would be enhanced. The effectiveness of planning and implementing forest management strategies could be substantially improved.
A two phase approach is being applied to the attainment of objectives. Phase 1 developed the framework and methodology. This phase is essentially. an accumulation and preliminary analysis of relevant and required information. The following is a summary report on the different components of Phase 1. Phase 2 will develop and apply a linear programming based analytical model to evaluate the impact of the additional required whole tree chip fuel supply on forest improvement opportunities and the overall economic value of the forest.
Background Information.
The study area encompasses two counties in southwestern Nova Scotia, Lunenburg and Queens. This is roughly equivalent to the potential fuel supply area for whole tree chips trucked to the co-generation facility. Conversion facilities in the area currently producing conventional forest products include an integrated pulp and newsprint mill, one large sawmill, four medium size sawmills, 33 other small sawmills and a large hardboard mill. There is also production of numerous other small scale specialty products and significant consumption of hardwood for domestic fuelwood.
Production of primary forest products in the study area as an average of the most currently available three year period shows annual consumption of softwood to be approximately 777 500 m3Jyear. Total average hardwood production was over 208 000 m3Jyear. Total wood fibre production for the study area averaged close to 1 000 000 m3Jyear for the three year period. Anticipated additional consumption of whole tree chips for the new co-generation plant is estimated at 100 000 m3 per year.
The study area lies in the forest section A.ll - Atlantic Uplands of the Acadian Forest Region of Rowe (1972). The forest is dominated by softwood mixtures, mainly red spruce and white pine, with lesser components of balsam fir and eastern hemlock. Red maple and red oak are among the predominant hardwoods.
The current age class distribution for the major covertypes shows a heavy imbalance towards the immature, pole, and mature developmental stages (age classes 41-60 years, 61-80, and 81-100). The forest land ownership pattern shows small private holdings (< 400 ha) account for 54% of the area, with large private holdings (>400 ha) at 26%, and provincial Crown at 17%. Lunenburg County is predominantly small private with the large blocks of large private and Crown located in Queens County.
Harvesting activities in the study area are mainly a mixture of clearcutting and partial cutting carried out by independent contractors. These may be the landowners themselves in the case of many small private woodlots. Logging systems vary from manual fell, buck, and limb for skiddinglforwarding to roadside to the more highly mechanized variations of manual fell and skid for roadside processing. Mechanical harvesters are not currently common. Roadside debarkinglchipping is increasing. Harvesting is generally more mechanized on the larger private holdings and less so on smaller holdings.
Silviculture treatments currently practised in the forest types in the area include mechanical site preparation and planting, the spacing and cleaning of young stands, and the commercial thinning of older stands for volume growth and regeneration establishment. All current silviculture is carried out to enhance the growth and yield of the major softwood species, particularly spruce.
Approach and Methodology.
The approach used in the development of the framework and methodology is as follows: 1) A detailed sample of the current forest inventory for the study area was obtained. This consisted of data from permanent sample plots distributed throughout the study area. Seven stand level variables and 13 individual tree variables were provided for each of 209 plots and 5500 trees, respectively. These data were analyzed and current forest conditions as well as growth and yield patterns for the major stand types were established. These patterns were established for conventional softwood and hardwood roundwood products and for, chip equivalents. 2) Data on type, extent, and cost of silviculture treatments carried out in the study area were obtained and analyzed. 3) Distinct management regimes were established for each of the major stand types in the area, based on silviculture treatments site capability, and current forest type. 4) Growth and yield estimates were developed for each of the management regimes, for conventional roundwood products and chip equivalents. 5) Soil expectation values (SEV) were established for each management regime. They were based on anticipated costs and revenues for silviculture and harvesting. 6) For each current stand type in the study area, total value was calculated. This was arrived at by summing the present net worth of the existing stand and the SEV of the appropriate management regime. This was done for conventional roundwood products and the chip equivalent.
Forest Inventory, Growth and Yield.
A detailed breakdown of the age class distribution and site capability of the major stand types is as follows. High site areas account for 17% of the productive forest or 70 000 ha. Areas of medium-site account for 83% or 346 000 ha. Mixed softwood is the predominant and most commercially important stand type in the area. It makes up 45% of the productive forest or 186 000 ha. Mixedwood stands make up 31% of the area or 130 000 ha. Pine and hardwood stand types make up 5% and 14% or 22 000 ha and 58 000 ha, respectively. Areas currently classified as NSR (not satisfactorily regenerated) number 20 000 ha or 5%.
Growth and yield developmental patterns for the major stand types were developed. Growth and yield in volume (m3/ha) by 20 year age classes was developed for conventional roundwood products, softwood sawlogs, softwood pulpwood, hardwood sawlogs, and hardwood pulpwood. Growth and yield in weight (green tonnes/ha) was
developed for chips for the equivalent of the conventional roundwood products and for softwood crowns and hardwood crowns. The chip equivalents were calculated using the appropriate biomass equations of Ker (1980a, 1980b).
Silviculture.
Data on the type, extent, and costs of silviculture treatments carried out in the study area during the past 10 years (1982-1991) were obtained from the N.S. Department of Natural Resources. These data were analyzed and the areas treated and average costs calculated. There appears to be an increasing tendency away from plantation establishment treatments (site preparation and planting) towards intermediate cuttings (thinnings) and natural regeneration treatments (shelterwoods).
Management Regimes.
Using a combination of potential silviculture treatments, site capability, and current stand type, management regimes for the productive forest in the study area were established. Eight regimes, for extensive and intensive management, were identified. The regimes most prominent in terms of area are No. 2 - Clearcut - Natural Regeneration - Cleaning, which could cover 192 000 ha or 46% and No. 6 - Clearcut - Natural Regeneration, which could cover 100 000 ha or 24%.
The potential growth and yield developmental patterns for the management regimes was established. Potential yield in terms,of conventional roundwood products and of chip equivalents of the roundwood products plus the crown components was calculated. The chip equivalents were calculated using age class - sensitive factors, based on the individual tree inventory data and the biomass equations of Ker (1980a, 1980b).
Soil Expectation Values.
Soil expectation values (SEV) for a continuous series of rotations were established for each of the eight management regimes. The SEVs were arrived at by the following process: Net values (roadside revenues - roadside costs) were compounded to the rotation age to get future value; Future values were then discounted to the present. The interest rate used was 4%. Detailed calculations for each of the management regimes were carried out for conventional roundwood products and for a combination of roundwood and chip products. The silviculture incentives used are 90% of the treatment costs. Local standard operating harvest and silviculture costs and revenues were used in the calculations.
Forest and Stand Evaluation.
An initial forest and stand evaluation was completed by summing the present net worth of the existing stand and the SEV of a continuing series of rotations by management
regime. The interest rate used was 4%. Present net worth was calculated using the projected yield from natural stands at a rotation age of 90 years. SEV for the management regime was calculated from the point in time the existing stand would be harvested (age 90) and the continuing series of rotations would begin. Initial forest and stand evaluation for conventional roundwood and chip products were carried out.
Summary and Subsequent Activities
The preceding sections illustrate the framework and methodology required for an economic evaluation of forest management opportunities arising from the emergence of a biomass market. The calculation of the growth and yield of multiple products for natural and managed stands is described. Management regimes are established and soil expectation values calculated. A system for base-level calculation of the economic evaluation of stands over time is described. Phase 2 will involve the evaluate, over time, the scope and extent of the harvest and investment in silviculture which, taken together, could result in greater economic return.
An algorithm will be constructed to calculate the optimization of economic activity for the supply area, subject to a number of constraints. These constraints will involve: 1) the production of the amount of conventional roundwood products presently required; 2) the production of the required additional quantities of forest biomass; 3) the investment of reasonable and appropriate amounts in silviculture treatments; and 4) the requirement to operate on a sustainable basis. Certain of the price and quantity values will be varied to determine sensitivities.
Parallel analyses will be carried out to project and compare the present management and marketing situation with that which includes the emergence of the additional biomass market. Cross comparisons will enable the economic evaluation of the effects of this new market on forest management options and overall economic activity. It is anticipated that this approach to management planning could have a broad range of operational and policy applications.
Literature Cited.
Ker, M.F. 1980a. Tree biomass equations. for ten major tree species in Cumberland County, N.S. Envirohment Canada, Canadian Forestry Service, Information Report M-X- 108, pp. 26.
Ker, M.F. 1980b. Tree biomass equations for seven tree species in southwestern New Brunswick. Environment Canada, Canadian Forestry Service, Information Report M-X- 114, pp. 18.
Rowe, J.S. 1972. Forest Regions of Canada. Environment Canada, Canadian Forestry Service, Publication No. 1300, pp. 172.
GREAT LAKES REGIONAL BIOMASS ENERGY PROGRAM
Frederic Kuzel, B.S., Program Director Council of Great Lakes Governors, Chicago, IL 60601
Abstract
The Great Lakes Regional Biomass Energy Program (GLRBEP) was initiated in September, 1983, with a grant from the Office of Energy Efficiency and Renewable Energy of the U.S. Department of Energy DOE). The program provides resources to public and private organizations in the Great Lakes region (Illinois, Indiana, Iowa, Michigan, Minnesota, Ohio, and Wisconsin) to increase the utilization and production of biomass fuels.
The objectives of the GLRBEP are to:
improve the capabilities and effectiveness of biomass energy programs in the state energy offices; assess the availability of biomass resources for energy in light of other competing needs and uses; encourage private sector investments in biomass energy technologies; transfer the results of government-sponsored biomass research and development to the private sector; eliminate or reduce barriers to private sector use of biomass fuels and technology; prevent or substantially mitigate adverse environmental impacts of biomass energy use.
The Council of Great Lakes Governors manages the GLRBEP under contract with the U.S. DOE. The Program Director is employed by the Council and is responsible for the day-to-day activities of the GLRBEP as well as for implementing program mandates. A 40 member Technical Advisory Committee (TAC) sets priorities and recommends projects which will address the biomass needs of the region. The governor of each state in the region appoints a member to the Steering Council, which acts on recommendations of the TAC and sets basic program guidelines.
The GLRBEP is divided into three separate operational elements. The State Grants component provides funds and direction to the seven state energy offices in the region to increase their capabilities in biomass energy. State-specific activities and interagency programs are emphasized in this component. The Subcontractor component involves the issuance of solicitations (Requests for Proposals) to undertake projects that address regional needs, as identified by the Technical Advisory Committee. The Technology Transfer component includes the development of non- technical biomass energy publications and reports by Council staff and contractors, and the dissemination of information at conferences, workshops and other events.
Recently Completed Projects
Biogas Systems Casebook
This book contains nine case studies of biogas projects in the Great Lakes region ranging from on-farm systems to large-&e waste water treatment plants. The purpose is to educate industries or local governments about the benefits and pitfalls of biogas technology, and to advance the commercialization of biomass energy technologies in general by educating policy makers and the public alike about the readiness of these technologies to help serve the energy needs of the region and the nation.
Potential for Co-Firing Coal and Biomass in Energy Facilities
This assessment reviews the status and potential for mfiring of biomass with coal in the Great Lakes region. It is based on literature review, extensive interviewing, and detailed case studies of facilities that are co-firing or are capable of doing so. Of special interest is the finding that burning wood with coal can contribute to the mitigation of air emissions, especially by reducing sulfur emissions.
Solid Waste Incineration: Can Removing Materials Before Incineration Reduce Environmental Impacts?
This decision makers guide includes a list of questions that should be considered in deciding on a material separation strategy to use with a waste-to-energy facility. It discusses waste components, air pollution control systems, and separation technologies and programs. A highlight of the project was the development of SePrOM, a computer model designed to help decision-makers determine the effect various options will have on the amount of specific substances in the solid waste fuel, the cost per ton of implementing various strategies, and the change in heating value of the remaining waste.
Assessment of Biomass Cogeneration
his book contains a selection of case studies that provide examples of how to successfully overcome the array of barriers and disincentives which exist for sale of biomass-generated electricity to utilities. A primary focus of these case studies is to examine issues related to the Public Utilities Regulatory Policy Act (PURPA) with regard to contracts for utility interconnections. The book targets current or potential future biomass-fueled cogenerators in the Great Lakes region.
Ongoing Projects
Increasing the Efficiency of Ethanol Production Through the Use of a Membrane Technology
The objective of this project is to design a continuous process for the conversion of liquefied corn starch into glucose with the goal of reducing saccharifntion time and reducing enzyme
costs . This is being accomplished with the use of a Continuous Membrane Reactor (CMR) developed at the University of Illinois. Following optimization at the laboratory, the CMR has been scaled-up and is now being evaluated at Pekin Energy Company's ethanol production facility.
E-85 Fleet Demonstration
This purpose of this project is to demonstrate the demand for E-85 Variable Fuel Vehicles for the Great Lakes to the auto industry, thereby encouraging them to produce more of these vehicles. Funds were be made available for the purchase of E-85 Chevrolet Luminas for state fleet operation. Funds were used to cover incremental costs of vehicle purchase and operation, fuel purchase, and emissions and operations testing. Illinois and Wisconsin have been operating the vehicles since June, 1992, and have found emissions and performance to be very favorable. The other Great Lakes states received E-85 vehicles in 1993.
Ethanol-Fueled Heavy Engine Development
The major heavy engine manufacturers are located in the Great Lakes region. This project is aimed at developing, testing, andlor certifying an ethanol-fueled heavy-duty engine for use in over-the-road trucks and/or transit buses. Detroit Diesel was the successful applicant, and is currently working to convert its 8V-92 engine for use with 95% ethanol fuel.
Wood Manufacturing Directories
State directories of primary (sawmills) and secondary (furniture, pallets, small wood items, etc.) wood manufacturers are being developed. Information will be useful to wood energy project developers, as a source of available wood residue supplies that may be used for energy.
New Projects (Beginning September, 1993)
Regional Wood-Fired Power Plant Siting
The objective of this project is to assist in the siting of up to four wood-fired power plants in the Great Lakes region. Analyses based on local wood resources, transportation services, utility capacity needs, and economic climate will be undertaken.
Biomass Energy Conferences
A number of biomass energy related technical and policy events are taking place across the Great Lakes region, many by "grass roots" organizations with limited financial resources. This project provides limited assistance to non-profit organizations to plan and conduct biomass energy related conferences, tours, workshops, or similar events.
Neat Ethanol Vehicle Research
This project will examine the emissions, fuel economy, and driveability characteristics of a neat ethanol fueled automotive engine compared to one fueled with regular gasoline. It will also determine the cost effectiveness of converting engines to neat ethanol fuel.
Reducing the Costs of Producing Ethanol
This project will fund the development and commercialization of new technologies that will help reduce ethanol production costs. The technology must be available for adoption by January, 1995, and must reduce the cost of production by at least 3%. Projects that develop markets for ethanol co-products will also be considered.
Urban Wood Waste and Pallets to Fuel
This project will identify the types, current disposition, and energy potential of urban wood waste in large metropolitan areas of the region. Potential energy markets will also be identified. Special attention will be given to the economic and technical feasibility of processing and utilizing waste wood pallets for fuel. A closed loop relationship between pallet and fuel producers and pallet and fuel users will be demonstrated.
case Studies of Air Emissions and Ash Disposal Regulations of Wood Burning Facilities
One of a series of case study publications, this will include a summary of state air and solid waste regulations pertaining to wood energy systems &d up to three case studies per state. there will be an emphasis on dealing with environmental regulations.
Small Engine Ethanol Utilization Program
This program will study and demonstrate the effects of the use of different levels of ethanol on small off-road engine (lawn mowers, power saws, etc.) performance, in order to educate manufacturers, dealers, and mechanics that a 10 % (or higher) blend of ethanol is a quality fuel and should be recommended wherever possible.
Wood Ash Testing
A compositional analysis of bottom and fly ash produced at firms burning wood with energy recovery will be performed. The feedstock will consist of 50-10096 wood and wood waste. Samples from up to 10 locations will be analyzed (stratified by percentage of wood in the feedstock, amount of ash generated, and feedstock composition).
PUBLIC BELIEFS THAT MAY AFFECT BIOMASS DEVELOPMENT
Harold M. Draper, D.Sc., Biomass and Waste Management Analyst Tennessee Valley Authority
Norris, Tennessee 37828 U.S.A.
Abstract
The Tennessee River chip mill controversy involves the expansion of the pulp and paper industry rather than the biomass energy industry; however, the concerns expressed by environmentalists are likely to be the same for biomass projects that propose use of privately-owned land. It may be incorrect to assume that private landowners will have more flexibility in forest management techniques than public agencies. In fact, when faced with a potentially large new demand source for wood, environmentalists will try to stop the project while pushing for stringent regulation of harvesting.
This paper describes and analyzes beliefs about forest management (related to biomass energy) taken from the 1200 letters and 200 public hearing statements received by TVA on the chip mill environmental impact statement. The chip mill controversy suggests that there is a potential for strong coalitions to form to stop new biomass demand sources. As much as possible, the biomass industry will need to anticipate and address land management issues. New concepts such as landscape ecology and ecosystem management should be considered. Even so, increased use of non-dedicated biomass resources will require more public acceptance of the concept that ecosystems and their biomass resources can tolerate increased levels of management.
Background
Beginning in 1990, TVA and the U.S. Army Corps of Engineers received requests from three companies proposing to build barge terminals on a 12-mile reach of the Tennessee River in Alabama and Tennessee. These terminals would serve adjacent wood chip mills. Chip mills are part of the pulp and paper industry. They procure timber from the surrounding area and produce pulp chips to the specifications required their customers. They tend to be located along waterways, railroads, or near major highways which can be used to transport the chips to market. Under Section 26a of the TVA Act, TVA approval is required to build facilities such as barge terminals which would be obstructions affecting navigation, flood control, or public lands on the Tennessee River. In addition, in some cases, TVA must decide whether to sell or grant easements to cross federal property to access barge terminals. The U.S. Army Corps of Engineers has jurisdiction over similar facilities nationwide. Section 10 of the Rivers and Harbors Act of 1899 prohibits the alteration or obstruction of any navigable waters of the U.S. without authorization. Section 404 of the Clean Water Act of 1977 requires permits for the discharge of dredge or fill material in waters of the U.S.
Due to the close proximity of the three proposals, and the fact that chip mills would represent a large new biomass demand source, controversy quickly developed. A1 though TVA initially planned to limit its environmental review to the impacts of the barge terminals and adjacent industrial site, most of the public comments that were received focused on the potential impacts of timber harvesting to supply the mills. In addition, EPA and the U.S. Fish and Wildlife Service demanded that an environmental impact statement (EIS) be prepared and stated that it should evaluate timber harvesting impacts.
As a result of these comments, TVA decided to prepare an EIS in cooperation with the U. S. Army Corps of Engineers and the U.S. Fish and Wildlife Service. A draft EIS was released 14 months from the notice of intent to prepare an EIS. During the subsequent public comment period, 1200 letters and 200 public hearing statements were received. Those comments were analyzed and addressed in the final EIS. The cooperating agencies responded to the comments by modifying the text of the EIS, or in a separate comment volume. Because of the number of comments received, the agencies chose to summarize and categorize the written and oral comments, then follow the comments with a response. This resulted in 1214 comments. The author has extracted comments which are especially relevant to biomass energy development for discussion in this paper. Comment letters were about evenly divided between supporters of chip mill development and opponents. However, the entire environmental community was uniformly opposed and their comments are the ones that are discussed below. Comment numbers are the ones used in Tennessee Valley Authority, U.S. Army Corps of Engineers et al. 1993c.
It is often assumed that biomass development will be environmentally benign since biomass use recycles carbon and eliminates methane emissions, reduces waste, and reduces acid gas emissions. For example, see Weinberg and Williams 1990. However, the scale of potential biomass development has led to the defeat of several proposed power plants (Frankema 1989), and proposals for large-scale energy plantations have raised other concerns such as
biodiversity (Cook, Beyea et al. 1991). Thus, in spite of its potential benefits when compared with fossil fuels, biomass will have to address forestry and land management issues to remain viable.
Beliefs
A consistent body of beliefs about forestry and land management developed in the environmental community as the controversy developed. The typical response of agencies to issues raised is to discuss the scientific evidence to support the allegation. However, this evidence ,is often inconclusive or in any event science cannot provide 100 percent certainty that there is no risk. Thus, many comments are philosophical in nature and ultimately can only be addressed by a political process. Many of the issues raised were addressed in the draft chip mill EIS; however, most commenters chose to dispute the conclusions reached, especially those concerning forest management.
Forest and Wildlife Management
By far the major concern expressed in the chip mill controversy was that increased levels of harvest would devastate forest resources. Inclu'ded in this general concern is an interrelated series of cumulative impacts, including soil erosion, impairment of water quality, increased flooding, wetland destruction, wildlife habitat damage, fragmentation of forests, impacts on unique geological features such as caves, impairment or reduction in recreation, destruction of natural beauty, loss of biological diversity, noise, and air quality (comment 14 1). These effects are especially equated with clearcutting or even-aged management. In fact, clearcutting is widely assumed to be the same as deforestation (296, 410, 41 1). As a result, it was asserted that there would be global warming and global change impacts (69 1,695). Clearcutting is almost uniformly considered in the environmental community as representing poor forest management (419, 429, 430, 437), and the species that do regenerate are not considered to be valuable (467, 473). In fact, natural regeneration is considered by commenters as unlikely to produce a better grade of timber (456, 475). Following clearcutting, harvested forests will never return to normal productive growth rates, stated commenter (459), in part due to nutrient depletion and other problems (633, 634).
Although commenters felt that natural regeneration of hardwoods was ineffective or would not occur, they expressed even greater alarm that replanting in pines might occur. In the South, planted pines are considered by commenters to be tree farms, and tree farms are not considered to be forests (432, 545, 546, 548, 549, 551, 553, 554). With widespread pine conversion, one commenter even stated that chip mills would eliminate fall colors (56 1).
Many commenters felt that selective harvesting would represent good forestry (437,440,44 1 , 619,861,862,863); however, others felt that only by absolute exclusion of man for hundreds of years could we improve our current forest (468). Wildlife issues echoed the concerns about clearcutting. Clearcutting was considered undesirable because of the alleged loss of biodiversity, food for animals (mast), forest fragmentation, and harm to neotropical birds (798, 829, 835, 849, 853, 854, 855, 860, 869, 871, 874, 889, 890).
Forest sustainability was a major concern (343). New biomass demand centers like chip mills would deplete the forest faster than it would be regenerated, according to many commenters (493,536). Of special concern was that a chip market would not allow growing stock for future industries to mature (539), and that harvest of less valuable trees would disrupt nutrient cycling (382). The fact that the pulp and paper industry was expanding was taken as evidence that its practices were not sustainable (542) (editorial 1992; Haldeman 1993) . It was also stated that forests have many stresses and do not need additional ones (349) and that forests are in a general state of decline (517, 605). Concern was also expressed that forest destruction would be permanent as in Greece, Rome, and North Africa (626).
In many ways, the beliefs about forest management described above mirror those of the . general public. About half of the general public in the 201-county Tennessee Valley Region feel that clearcutting should be prohibited on land owned by individuals or forest products industries. Fear that the trees will not grow back, and of soil erosion and aesthetic loss are typical reasons for being against clearcutting. About half of the general public also feels that forests in general are declining in the region. They also feel that too many acres of hardwood forests are being converted to pine (Bliss, Brooks et al. 1993).
Forest Industry and Regulation
In the chip mill controversy, some of the existing solid wood industry chose to ally with the environmental community to fight the pulp and paper interests. Chief among their arguments was that the existing industry was practicing sustainable forestry, and that increased demands would turn the forests into pulpwood lots (1 158), which would result in the loss of jobs (1 128, 1 175, 1 173, 1 180, 1 181,1182) and the end of a sustainable economy (1 179, 1189, 1190). Removal of growing stock would worsen the situation (1 183, 11 88, 1193). Local industries, in contrast to chip mills, were believed to add value locally (1 166, 1194). In fact, a lack of economic benefits was an important part of most opposition commentaries (323). Local governments were seen as having to spend more money to maintain infrastructure resulting from the new industries (332). Opponents put the burden of proof on the new industry in showing that there woyld actually be economic benefits (149, 152, 1184). Since many commenters were convinced that there would be few economic benefits, they wished to discourage industry by not paving roads, by denying access to waterways, and by elimination of other subsidies (143, 333, 335) (Tennessee Valley Authority, U.S. Army Corps of Engineers et al. 1993a).
The lack of ability to determine ..exactly where and in what time frame private forests would be harvested was used as a major reason to deny approvals by many commenters (1 32, 153). These uncertainties extended to the lack of regulation of forest practices, which led to a major effort to emphasize that forestry Best Management Practices (BMPs) were ineffective, since they were voluntary. Since use of BMPs could not be guaranteed (236, 269), there was no assurance that water quality would be protected (108, 109,607,608,584, 610). The resulting nutrient, sedimentation, and stream temperature problems were emphasized by many comrnenters (616, 714,733,734,928, 93 1).
Commenters also were concerned about the uncertain actions of private landowners. These comments ranged from the sentiment that landowners would be at the mercy of unscrupilous industries (278) to the statement that' landowners who are not responsible will harm neighboring landowners (276).
Endangered and Threatened Species
The lack of regulation of forest practices and the inability to determine where and when impacts such as erosion would occur, were key factors 'in the Biological Opinion on the chip mill draft EIS (Tennessee Valley Authority, U.S. Army Corps of Engineers et al. 1993b). This document concluded that implementation of any action alternative would likely jeopardize the existence of 16 or 17 endangered and threatened species and result in the destruction or adverse modification of designated critical habitat for three species. The large number of endangered, threatened, or candidate species found on private lands in the area also allowed commenters to focus on uncertainties of protection (167). One commenter assumed that some of these species would become extinct as a result of chip mills, and expressed concern about which species would replace the ecosystem functions performed by extirpated species (979).
General Observations
Many of the objections raised in the chip mill controversy are not usually considered when the benefits of biomass are being sold; however, environmentalists are likely to raise these types of issues when biomass facilities are being proposed. As much as possible, they should be anticipated and addressed in advance before a proposal is made. Even though other land uses may cause greater impacts, forestry activities are perceived as major contributors to environmental problems in Lral areas. As a result, any increase beyond current levels of harvest would harm the already stressed forests of the planet and directly compete with existing industries, according to this line of reasoning. Forestry research results, especially those that support even-aged management, are not likely to be trusted.
New resource-using industries will have uncertain impacts. This uncertainty can be used to build opposition to them, and calls will be made to prohibit them until the full effects are known. For those impacts that are known and could be minimized, opponents will likely argue that funding and manpower are not likely to be available to adequately enforce existing laws.
The strong opposition to any new activities in natural forests, regardless of scientific validity, cannot be ignored by the biomass industry. When faced with a large new source of biomass demand, there is potential for the formation of powerful coalitions of environmentalists, existing industries, tourism industries, and other interest groups to prohibit local, state, and federal approvals needed to proceed. Statements that wood energy industries will benefit forest quality are likely to be viewed with suspicion by these groups.
It is probably somewhat puzzling to natural resource managers that agricultural monocultures of short rotation trees, perennial herbs, or even annual herbs are viewed with
less concern by environmentalists (16). In fact, kenaf and hemp are often recommended by environmental groups as desirable substitutes for paper from wood ( 17) (Tennessee Valley Authority, U.S. Army Corps of Engineers et al. 1993a), and dedicated energy crops are preferred to wood energy from forest management. In general, these interests believe that natural forests, even if they have been harvested three or four times, continue to be diverse and healthy ecosystems, often harboring endangered and threatened species. In contrast agricultural lands are regarded as degraded ecosystems. Whether biomass is managed in an agricultural setting (short rotation energy crops) or in a forestry setting (wood chip procurement from managed forests), the biomass industry should consider accepting new land management concepts such as landscape ecology and ecosystem management.
References
Bliss, J. C., R. T. Brooks Jr. and M. D. Larsen. (1993). Attitudes in the Tennessee Valley Reeion Toward Forest Practices and Policies. Tennessee Valley Authority, Auburn University, and Gallup Organization, Inc.
Cook, J. H., J. Beyea and K. H. Keeler. (1991). "Potential Impacts of Biomass Production in the United States on Biological Diversity." Annual Review of Energy and the Environment 16: 401-43 1.
Editorial. (1992). "Stop the Chippers. " The Chattanooga Times, May 1 1, A4.
Frankema, F. (1 989). "Public Controversies Reveal Major Social Changes: Wood-Fired Electric Power Plants. " Journal of Forestry 87(5): 18-23.
Haldeman, D. (1993). Letter to Norman A. Zigrossi , President, Resource Group, Tennessee Valley Authority.
Tennessee Valley Authority, U.S. Army Corps of Engineers and U.S. Fish and Wildlife Service. (1993a). Final Environmental Impact Statement: Chip Mill Terminals on the Tennessee River. Volume 1.
Tennessee Valley Authority, U.S. Army Corps of Engineers and U.S. Fish and Wildlife Service. (1 993b). Final Environmental Impact Statement: Chip Mill Terminals on the Tennessee River. Volume 2. Appendices.
Tennessee Valley Authority, U.S. Army Corps of Engineers and U.S.. Fish and Wildlife Service. (1993~). Final Environmental Impact Statement: Chip Mill Terminals oli the Tennessee River, Volume 3. Response to Public Comments.
Weinberg, C. J. and R. H. Williams. (1990). Energv from the Sun. Scientific American, September. 147- 155.
CONSIDERATIONS IN IMPLEMENTING INTEGRATED BIOMASS ENERGY SYSTEMS IN DEVELOPING COUNTRIES
Robert D. Perlack, Ph.D.; Energy Division J. Warren Ranney, Ph.D.; Environmental Sciences Division
Oak Ridge National Laboratory, Oak Ridge, Tennessee 37831 U.S.A.
Abstract
Biomass energy is emerging as a real option for satisfying power needs (both grid- connected and isolated) in developing countries. Development experience has shown beyond question that improvements in GDP are directly linked to increased consumption of energy. Biomass energy can also be environmentally and developmentally beneficial where it will be both grown and used. For example, biomass production can offset deforestation and reduce soil erosion, increase rural employment, and stimulate development. Moreover, when biomass is grown renewably there is no net buildup of atmospheric carbon. In this paper, we discuss the issues and barriers associated with implementing integrated biomass energy systems in developing countries. An integrated biomass energy system is dependent on sustainably grown and managed energy crops, is supportive of rural development, is environmentally beneficial (locally and globally), is adapted to local conditions, takes advantage of by- and co-products, and uses conversion technologies that have been optimized for biomass. A preliminary evaluation of a biomass to electricity project relying on plantation grown feedstocks in rural Yunnan Province in Southwest China provided some financial/economic results, general conclusions, and an initial framework for conducting such assessments. Results indicate that biomass could be grown and converted to electricity at costs lower than alternatives and yield an internal rate of return of about 15%. When one measure of environmental benefits was estimated, the IRR based on a social or economic perspective rose to about 24%. Our assessment indicates that social and environmental benefits are substantial and that investment in the facility is well-justified. However, there are so many considerations to take into account when assessing biomass energy systems that their evaluation is exceedingly complex. These considerations are grouped into biomass production, biomass logistics and transport, and biomass conversion. Implementing such systems requires another grouping of considerations into energy and economics, institutional and social issues, and environmental issues. These are further defined in an effort to establish a framework of evaluation and assessment for other such projects. The conclusions that such a project would be viable in rural China is shadowed by many site-specific circumstances and highlights the need for systematic and integrated appraisal.
INTRODUCTION
Although most biomass is used traditionally for domestic cooking and space heating, new opportunities are emerging for biomass energy to satisfy small-scale power needs (both grid-connected and isolated) in developing countries. Where the resource conditions are favorable, decentralized, small power systems based on biomass energy can be financially competitive with conventional fossil-based alternatives. Relative to conventional rural grid extension, these small power systems would require smaller increments of capital, and the shorter lead-times for construction reduce financing charges, making it easier t o mobilize resources and local financial support.
Returns are even more attractive if one views a biomass energy system from an economic or social perspective. There are additional benefits, which do not show up in financial assessments, in the form of off-season employment of underutilized labor (tree planting and maintenance, use of tree co- and by-products); increased agricultural productivity through soil stabilization, less water runoff, improvements in local microclimates; and increased opportunities for industrial development through the availability of peak and dry season power. The availability of power can encourage the development of small-scale industries and rural commerce, increase the productivity of agriculture through irrigation and post harvest processing, and make modern conveniences (e.g., lighting and potable water pumping) available to many more rural residents. In addition, the availability of electricity can lead to a host of other improvements. For example, electricity can provide for social and nutritional advancement by promoting better education (e.g, lighting), improving access to health services (e.g., vaccine refrigeration), and contributing to greater social cohesion.
The environmental benefits of biomass energy are also of major importance, especially if biomass is grown renewably. Recent concerns about global warming have raised an awareness that the use of biomass fuel can reduce the rate of CO, buildup in the atmosphere by sequestering carbon and by substituting for fossil fuels. When grown renewably, biomass has no net buildup of atmospheric carbon because the carbon released during burning is extracted from the atmosphere during photosynthesis. At the local environmental level, biomass production can help to offset deforestation, reduce soil erosion, and provide a means to restore degraded lands.
A biomass energy system therefore has the potential to offer a wide range of local, regional, and even, global benefits. However, the evaluation of the magnitude of these benefits and how a biomass energy system would be actually implemented is extremely complex much more so than other renewable energy or conventional fossil- fueled technologies. The complexity of the evaluation and implementation issues are further compounded by a high dependency of the biomass energy system on adaptation to local conditions. In the remainder of this paper, we explore some of
these issues. We use an example from Southwest China, an area in which the author's have participated in a feasibility assessment of a biomass to electricity project based on plantation grown biomass on degraded lands.
INTEGRATED BIOMASS SYSTEMS IN RURAL CHINA
Like most areas in China, rural Yunnan Province is suffering from a critical shortage of energy. Energy problems in Yunnan have resulted in pervasive environmental degradation from biomass fuel collection. In the household sector, the labor and effort required in the collection of fuelwood has prompted many of the rural poor to use inferior fuels (e.g., crop residues) and to cut back on basic energy needs. The unavailability and unreliability of electric power during the dry season has idled industrial production and has constrained the development of new rural industry. For these commercial energy users, there are shortages and no economically viable substitutes. Coal is in limited supply, and, if available, is expensive because it must be transported over severely constrained roads. There is considerable hydroelectric potential in Yunnan, but low-head projects have highly seasonal output (monsoon conditions) and there is competition for water between energy production and irrigation. The results of site visits to Yunnan Province identified land to produce sufficient biomass feedstocks to fuel small biomass facilities in each of several rural counties.
The financial evaluation indicated that plantation trees could be grown and converted to electricity at costs lower than alternatives and could yield internal rates of return of about 15% (Fig. 1 ). That is, the marginal private benefits would exceed marginal private costs at real discount rates below 15%. This financial or private perspective evaluation was based on current prevailing factor input prices and wages, local taxes, and all costs from tree seedling production through power generation including the use of tree by-products.
As discussed at the outset, there are major environmental and developmental benefits associated with biomass energy systems. Locally, the planting of trees on degraded slopes could greatly reduce erosion and the associated impacts on agriculture and water resources. However, estimating the magnitude of these benefits is difficult especially in a rural developing country setting. One approach is to use the cost of planting perennial grasses as a proxy for the soil erosion benefits. Figure 1 shows marginal benefits and costs valued from an economic or social perspective with the addition of soil stabilization benefits. Relative to the financial perspective, costs are much lower because of the use of a shadow wage rate to account for seasonal unemployment (offseason agricultural labor), the exclusion of taxes (transfer payments), and the addition of a small rent to account for the opportunity cost of the land. The marginal benefits are identical to those of the financial case except for the
cost o f growing a perennial grass crop. In this case, the internal rate of return increases to about 24%. Inclusion of other environmental benefits (e.g., CO, sequestration) as well as those associated with the development objectives of the project would increase this return even higher.
The results of the feasibility assessment concluded that the productive use, household consumption (basic needs), development, infrastructure, and environmental benefits were large and showed rates of return that would dominate alternatives for generating power. The development of Integrated biomass energy projects would also be consistent with Chinese policy on CO, emission reduction, energy and rural development, and reforestation and environmental protection. Moreover, there appeared to be strong incentives to develop local power generation. The feasibility assessment also revealed a number of obstacles and potential risks that would have to be addressed if projects were to proceed to an implementation phase. For example, sensitivity analyses on key variables revealed that the cost of feedstocks were relatively unimportant. However, the availability of feedstocks (assurance of adequate supplies) to keep the conversion facility operating at a high capacity factor would be extremely important for low-cost power production. This fact suggests that the biomass production operation should be oversized to account for supply disruptions. Further, it suggests that more diversity in trees to lower risks should be pursued even under lower biomass productivity and consequently higher feedstock costs. It may even suggest that herbaceous crops be planted to increase the resource supply base. Finally, the assessment revealed that the development of small-scale, independent power production institutions would be required to acquire external financing and aid in the expansion t o other sites.
NEED FOR AN INTEGRATING ASSESSMENT FRAMEWORK
The authors' experience in China as well as with numerous biomass energy assessments in both developed and developing countries has led to the realization that a process or formalized framework for integrated assessment and the requirements for implementation of biomass energy systems is needed. As discussed earlier, a biomass energy system that is dependent on sustainably grown and managed energy crops, supportive of rural development, culturally appropriate, environmentally beneficial (locally and globally), adapted to local conditions (i.e., takes advantage of by-products and recognizes supply logistics and assurances), and optimized for biomass feedstock handling and conversion requires the consideration of a multitude of energy, economic, and environmental issues. In some situations, the consideration of social, political, and even cultural issues would be required.
A framework for the integrated assessment and design of a biomass energy system should include the considerations as itemized in Tables 1 and 2.
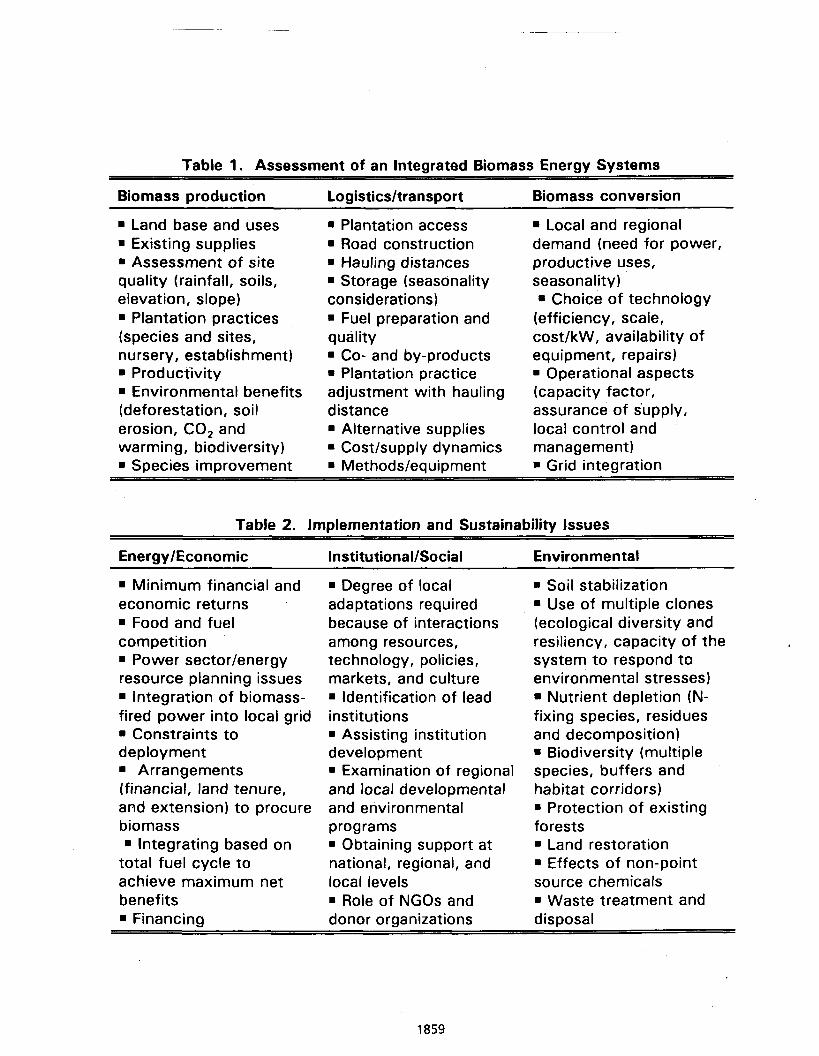
Table 1. Assessment of an Integrated Biomass Energy Systems
Biomass production Logisticsltransport Biomass conversion - -- - . Land base and uses . Plantation access 8 Local and regional . Existing supplies Road construction demand (need for power, . Assessment of site 9 Hauling distances productive uses,
quality (rainfall, soils, Storage (seasonality seasonality elevation, slope) considerations) 8 Choice of technology . Plantation practices Fuel preparation and (efficiency, scale, (species and sites, quality costlkw, availability of nursery, establishment) . Co- and by-products equipment, repairs)
Productivity 9 Plantation practice Operational aspects Environmental benefits adjustment with hauling (capacity factor,
(deforestation, soil distance assurance of supply, erosion, CO, and Alternative supplies local control and warming, biodiversity) Cost/supply dynamics management) . Species improvement . Methodslequipment Grid integration
Table 2. Implementation and Sustainability Issues
EnergyIEconomic InstitutionalISocial Environmental . Minimum financial and . Degree of local Soil stabilization economic returns adaptations required Use of multiple clones
Food and fuel because of interactions (ecological diversity and competition among resources, resiliency, capacity of the . Power sectorlenergy technology, policies, system to respond to resource planning issues markets, and culture environmental stresses) . Integration of biomass- . Identification of lead Nutrient depletion (N- fired power into local grid institutions fixing species, residues 9 Constraints to . Assisting institution and decomposition) deployment development Biodiversity (multiple . Arrangements Examination of regional species, buffers and (financial, land tenure, and local developmental habitat corridors) and extension) to procure and environmental Protection of existing biomass programs forests . Integrating based on = Obtaining support at Land restoration total fuel cycle to national, regional, and Effects of non-point achieve maximum net local levels source chemicals benefits Role of NGOs and Waste treatment and . Financing donor organizations disposal
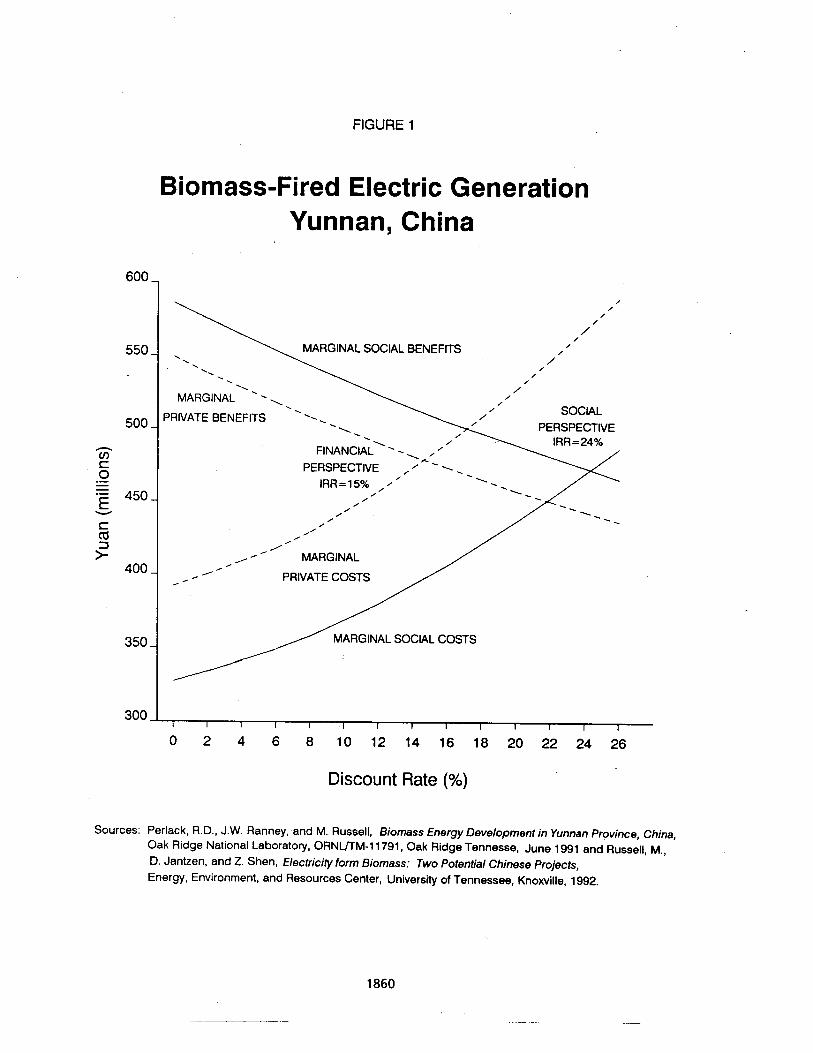
Evaluating Energy-system Alternatives in the Context of Sustainable ~evelopment'
Deborah Wilson, Ph.D., Visiting Research Scholar, Environmental and Energy Systems Studies, Lund University, Lund, Sweden
Abstract
Growing awareness of the negative social, environmental and economic impacts caused by the production, distribution and end-use consumption of energy has led the search for alternatives to become increasingly urgent and complex. The need for analytical methods and tools for evaluating options and opportunities is particularly acute in rapidly developing countries. The aim of this article is to illustrate the broad range of issues and impacts that are important for evaluating and comparing energy-system alternatives in the context of sustainable development. The feasibilrty of producing and utilizing biomass- based ethanol as an alternative transportation fuel in Thailand is explored herein to provide examples and a forum for discussion of these issues. Scenarios describe the conditions under which a significant potential for fuel-switching to domestically-produced ethanol appears to exist. Harnessing this potential could lead to important improvements in the energy system's impacts on human health, Thailand's economy, and the environment. Achieving these improvements, however, would require comprehensive and long-term planning and support on the part of the Thai government.
Based, summarily, upon, 0. Wilson, 'Evaluating Alternatives: Aspects of an integrated approach - using ethand in Thailand's transportation sector,' IMES/EESS Report no. 9, Environmental and Energy Systems Studies, Lund University, April 1993. This work was supported by the Stockholm Environment Institute (SEI). The views and opinions herein do not necessarily reflect those of SEI. The author accepts full responsibility for the accuracy of the data disclosed.
Introduction
Long-term transportation planning should involve comparisons of the results from studies of a wide variety of atternatives. This study provides descriptions of elements of a broad- based integrated approach to preparing evaluations of individual alternatives for use in such comparisons. A range of issues are addressed, including health, social and environmental impacts, from the perspective of sustainable development. Aspects of the approach are explored through examples describing the potential to fuel-switch to biomass-based ethanol as an alternative fuel for the transportation sector in Thailand.
Ethanol is a promising biomass-based fuel that could be important in countries that have agricuttural production capacities in excess of that required to feed their current and projected populations and the physical resources required to grow sugar and/or starch crops. A large-scale ethanol industry requires adequate access to land and water, sustainable industrialized agricultural practices, reliable crop supplies, and a fuel-supply system and vehicle fleet prepared to distribute and consume its product. Thailand's abillty to achieve its physical and economic potential to produce and use ethanol as an abrnative transportation fuel depends on its abilrty to provide sustained support for the development of such an industry. As with any biomass-based energy strategy, this would require agricuttural, industrial, planning and pricing reforms.
Evaluation Criteria
Expectations regarding economic implications are commonly one of the foremost- considerations of policymakers exploring new policy paths. Economic analyses are used to examine those direct costs which are internal to the market, such as capital for investment, raw materials and labor as well as the public sector costs of promoting the alternative. They may also include commercial benefits or credits, such as sales of byproducts. Measures that can move environmental protection issues from the debit to the credit side of the net cost equation should also be sought out and included. There are additional costs and benefits inherent to any such option which are external to the energy market. These are often central to the decision-making criteria of public policymakers. Any evaluation intended to support comparisons for public policy purposes should, therefore, integrate information describing market-external costs and benefits.
Ethanol as a transportation fuel
Ethanol can be used by itself, as a neat fuel (hydrous ethanol) or blended with gasoline (anhydrous ethanol) as gasohol. There are trade-offs in the choice between blending anhydrous ethanol with gasoline and using hydrous ethanol as a neat automotive fuel. Gasohol blends are clearly the simplest solution from an end-use perspective. The quantity of ethanol used in gasohol blends can be increased gradually as the national capacrty for manufacturing the fuel increases over time. On the production side, however, the energy input requirements for producing anhydrous ethanol are significantly larger than those for producing hydrous ethanol and gasohol distribution and storage systems must be tighter than gasoline and neat-alcohol systems.
Prospective Fuel-switching Strategies
Light-duty vehicles and Buses
A program to support the domestic production and consumption of ethanol as a transportation fuel might start with niche markets for neat-ethanol and anhydrous ethanol as an octane enhancer in the unleaded gasoline market. Gradual movement toward higher ethanol content gasohol could follow, before eventually considering the option of moving into the general passenger car market for neat-ethanol. Fleets of vehicles with their own refueling stations provide natural niches for budding alternative-fuel programs. Using diesel-ethanol blends of up to 20°!6 (by volume) anhydrous ethanol in Bangkok's bus fleet would provide an annual market for up to 25 million liters of anhydrous ethanol at 1991 levels of fuel-efficiency and delivered service. A 30% blend in Bangkok's diesel fuel for buses would create demand for 38 million liters of ethanol annually. A full-blown effort to promote the use of ethanol as a transportation fuel in Thailand could result in demand for as much as 5.8 billion liters of hydrous ethanol and 2.3 billion liters of anhydrous ethanol per day by the year 2006. This would absorb an annual production of 116 million tonnes of cane with a feedstock to ethanol conversion rate of 70 liters ethanol per tonne of sugarcane (I/tc).
Prospective Fuel Supply Strategies
Sugar products that can be sold to export markets are considerably more valuable, from the perspective of the national trade balance, than ethanol made from cane juices to displace domestic oil consumption would be. Whether or not sugarcane production in Thailand can be increased beyond demand for domestic and export sugar production in 2006 depends on the amount of land that can be made available for growing sugarcane and the crop yields achievable on those lands.
Land use patterns, Sugarcane yields and Crop switching
The agricultural sector in Thailand grew rapidly during the period from 1960 to the mid 1980s, largely due to expansion of cultivated land area at the expense of the forests. Dwindling forest resources along with expansion of the urban and industrial sectors put a stop to the growth-by-expansion period in Thai agriculture. The only remaining potential for increasing agricultural production is through intenstfying annual crop production on currently cultiiated land. Thailand's historical reliance on growth through expansion, however, resulted in very little attention being paid to crop yields. Agricultural productivity in general, and specifically for sugarcane, is low and yield fluctuations are serious2
The only way to increase sugarcane production beyond the levels achievable
T. Onchan (ed.), A Land Pdicv Study, Research Monograph no. 3., The Thailand Development Research Institute UDRI), Bangkok, 1990.

through yield improvements is to grow cane on land currently devoted to other crops. Much of the agricultural production in Thailand is cash crops. Several of these are agriculturally interchangeable. Farmers' decisions regarding which crop to grow are made to a large extent based on e'mnomic criteria. Land devoted to growing cassava root may provide a significant potential for crop-switching in the medium-term Mure. The general expectation of Thai officials and researchers is that the export market for Thai cassava will be gradually reduced in the future, creatingfenlarging a surplus of Thai cassava production.3 A cassava root surplus could be incorporated into an ethanol supply scenario by converting the cassava to ethanol in the off-season for sugarcane, or by converting suitable land from cassava to cane production. Crop switching from cassava to sugarcane would clearly involve decisions regarding social development, as many small farmers may be incapable of growing cane.
Utilizing sugarcane crop residues
When cane is crushed to extract the sugarcontaining juices, the cane fiber -- bagasse - remains onsite as a residual from the process. Bagasse is an important energy resource. In energy-efficient plants, some of the bagasse can be used as the primary energy source for providing onsite steam and elecbicrty requirements while large quantities of excess bagasse can be put to use for other purposes. If the tops and leaves -- barbojo -- of the sugarcane plant can be economically collected and delivered to alcohol distilleries or cogeneration plants without leading to soil degradation in the cane fields, they can provide another important energy resource. In an ethanol-producing strategy for Thailand, excess sugarcane crop residues could be put to use to fuel the distillery in the off season and convert surplus cassava to ethanol, or to produce surplus electricity that could be sold to the Electricity Generating Authority of Thailand (EGAT). Net revenue gains from such sales could be counted as credits against ethanol production costs, thus lowering the total cost of an ethanol fuel program.
Ethanol and electricity supply scenarios
In scenarios developed in this study, two methods of supplying sugarcane for ethanol production are explored; 1) increasing yields on land already devoted to cane production and 2) converting some cassava lands to cane production. An alternative use of cassava - converting it directly to ethanol -- is also explored. Both bagasse and barbojo are assumed to be available as fuels for cogenerating steam and electricity in each case. Demand is prioritized as follows: 1) hydrous ethanol sufficient to meet the demand estimated for an ethanol bus fleet in Bangkok; 2) anhydrous ethanol sufficient to produce gasohol blends up to 20% of the entire base case scenario for gasoline demand; 3) hydrous ethanol to be used as a neat fuel in automobiles.
Personal communications: Professor Chirapol Sintunawa. Mahid University. Bangkok, January 26, 1993; Mr. Sopon Chomchan, Land Development Department, Bangkok, January 27,1993 and Dr. Poonsook Atthasam punna, Thailand Institute of Scientific and Technological Research, bngkok, February 4, 1993.
Potential Energy-market-external Impacts Health impacts
The transportation sector is a primary source of several urban air pollutants of concern to human health. Among these are suspended particulate matter (SPM), carbon monoxide (CO) and lead. Road transportation is a major contributor to emissions of all of these pollutants. Evaluations of the Bangkok population's exposure to health risks from such emissions were included in a study published in 1990.~ In this study, SPM and lead were both found to be high risk pollutants in Bangkok. Airborne CO was ranked as medium risk, whereas airborne sulfur dioxide, nitrogen dioxide and ozone fell into the lower risk category.
Additional data from controlled measurements of emissions for comparable gasoline, gasohol, and neat-ethanol vehicles are needed in order to quantlfy emissions of urban air pollutants and resolve inconsistencies regarding them in the literature. It is clear, however, that combusting ethanol results in no sulfur emissions, and no net carbon dioxide (C02) emissions when the feedstocks for ethanol production are grown on a sustainable basis. These characteristics provide clear environmental advantages for ethanol and gasohol over gasoline.
Trade balance improvements
The immediate benefit of measures that reduce oil and petroleum-product imports are easily measured, as the product of the quantity of avoided import and current market price. The future impact on Thailand's trade balance of any measure aimed at reducing oil imports, however, is as unpredictable as future oil and petroleum-product prices in the international market. The trade balance value of such measures can only be seen, therefore, in terms of their ability to the reduce the risks associated with oil market instability and higher oil and petroleum-product prices, and perceptions of the extent or magnitude of those risks. The same arguments can be made for biomass-based fuel programs and their impact on the volatility of international cash crop markets. Quantitative estimates can be made as to the fraction of the farming community for whom income reliance could be shifted from the international market to a more stable domestic one. The minimum societal value of providing opportunities to make that shii is implicitly expressed in the already-established policies through which ongoing efforts to protect farmers have been directed.
Global Warming
Researchers from the Thailand Development Research Institute estimate that 156 million net tonnes of carbon dioxide (C02) - less than 1% of the world total - were emitted in Thailand in 1989, of which 51.5% came from deforestation and 44.8% came from energy
Abt. Associates Inc. and Sobotka & Co. Inc., "Ranking Environmental Health Risks in Bangkok, Thailand, Volumes I and 11,' USAID, Washington, D.C., December 1990.
con~um~t ion .~ These emissions are expected to >nearly double by the year 2006, with energy sector emissions growing in importance. The ethanol supply scenarios in this study imply potentials to avoid from 2.7 to 7.4 million tonnes (MT) of transportation CO, emissions annually by the year 2006. Together, providing the electriccty and ethanol supplies in the scenarios could avoid up to 17.5 MT of CO, emissions annually.
Conclusions
The scenarios presented herein indicate that the potential to produce ethanol is large enough to warrant further evaluation if sugarcane yields can be improved. Under the combined ethanol and electricity production scenarios, a program to develop an ethanol industry could provide significant potential to avoid oil and coal imports and reduce the negative impacts of the country's energy systems on human health and the environment.
How large a percentage of total energy consumption this potential might represent depends on future growth rates in energy demand. These depend in turn on the extent to which other actions (such as policies to promote demand-side management) succeed in limiting growth in energy demand. Measures that reduce growth in demand would increase ethanol's potential role.
Beyond physical potential, There is a growing consensus that sustainabilrty and contribution to sustainable development must be overriding considerations in the appraisal of energy options. A comprehensive economic analysis would be necessary for evaluating the potential to meet development goals by implementing a program to promote the production and use of ethanol in Thailand. A simple comparison of gasoline versus ethanol production costs on a USD/gigajoule basis is not sufficient, however, for evaluating ethanol's potential role in putting Thailand on a sustainable development path. Integrating the societal impacts of alternatives - such as impacts on human heatth, the national economy, employment and the health of the planet -- into our evaluation criteria is the only way to ensure that they become positive planned consequences of the paths we choose rather than unanticipated negative side effects.
Ethanol is one of several alternative transportation fuels that can be produced on a renewable basis. However, the ethanol path is not inherently sustainable. Nor is any other fuel path for that matter. Ensuring sustainabillty requires active measures, such as controlling and monitoring disposal of distillery waste products. Unlike many conventional energy paths, ethanol can be produced on a sustainable basis. The successful promotion of ethanol or any biomass-based resource as an alternative transportation fuel in Thailand would require a comprehensive government program that provided consistent long-term planning and support and addressed the fact that current trends in both the transportation and agricultural sectors are unsustainable. A program that successfully did all of these things would surely represent a contribution to sustainable development.
Thailand Development Research Institute FDRI), 'Greenhouse Gas Emissions: Initial Inventory for Thailand,' Natural Resources and Environment Program, TDRI, presented at the workshop 'Global Climate Change and Development Policy in Thailand,' Pattay, Thailand, January 30, 1993. TDRl's inventory for the energy sector does not include emissions frorn energy production, transmission, storage and distribution. The total and percentage share of emissions frorn this sector would be higher if emissions from those sources were accounted for.
NORTHEASTERN STATES SHARPEN BIOMASS FOCUS
Philip D. Lusk, Principal Resource Development Associates Washington, D.C. 20002 U.S.A.
Abstract
Excluding black liquor wastes produced at pulping operations, wood energy use in 11 states located in the northeastern region of the USA currently replaces an estimated annual equivalent of 45-50 million barrels of oil. Including municipal wastes and recovered methane emissions for regional landfills, total biomass contribution to the energy economy is over 70 million barrels of oil equivalent annually. A reasonable consensus in the region suggests that wood alone could replace the equivalent of bver 300 million barrels of oil each year on a sustainable basis over the next two decades.
Beyond energy security, the use of biomass creates jobs. Based on one economic impacts model, over 60,000 total jobs are now provided in the region by the wood energy industry. In the long-term, the model indicates that over 375,000 total jobs could be generated by the wood energy industry. About 65,000 of these jobs would be direct "first round" employment in the harvesting, transportation, and end-use operations of the wood energy industry.
Biomass producers must be committed to sustainable development by necessity. Sound forest management practices that keep residual stand damage from wood harvesting to a minimum can create positive impacts on the region's forests. Harvesting low quality, previously unmerchantable wood in thinning operations improves conditions for the growth of the higher quality trees which remain. When combined with a balanced energy policy, the conditional use of wood energy can play a modest, but still significant, role in reducing air emissions.
Depletion of traditional energy resources creates "bubble" benefits which will be exhausted after a generation. Sustainable development of biomass can create inexhaustible wealth for generations, and does not pose the risk of sudden ecological disruption. While the choice between policy options is not mutually exclusive, the interrelationship between energy security, economic growth and environmental quality clearly favors biomass.
The environmental benefits and the economic growth impacts of biobased products produced by the northeastern states are considerable. The 11 states located in the northeastern USA should intensify their efforts to work with industry and investors to expand markets for industrial biobased products, either produced from local feedstocks or manufactured by companies operating in the region.
Key Words: Biomass energy, renewable energy potential, sustainable development, employment impacts, environmental quality, technology transfer.
INTRODUCTION
The Regional Biomass Energy Program (RBEP) is a federally-supported program in five regions of the USA to encourage the application of biomass technologies. The scope and direction is specified by the US Congress. The RBEP carries out activities related to technology transfer, industry support, and matches local resources to conversion technologies. The RBEP's major focus is the transfer of current, reliable information to potential biomass users. Emphasis is placed on information and technologies best-suited to near-term use, and includes economic as well as technical information. The RBEPs are managed at the US Department of Energy (USDOE) by the Office of National Programs.
The eleven states participating in the Northeast RBEP' have refocused their commitment to developing the regions most significant renewable energy resource--wood. After a five-year decline, a modest trend of increased use of wood energy has developed, even after oil prices have stabilized at a relatively low level. Some states have increased the percentage of wood used for power generation above the rate of increase in Gross National Product, which often can be attributed to new power plants. Other states find small-scale industrial users more interested in biomass, because of the need for waste reduction.
As delineated in Figure 1, total wood use2 in the northeast region currently replaces an estimated 45-50 million barrels of oil equivalent annually (BOEA). About two-thirds 'of the total amount of wood energy is used by residential appliances as a primary or secondary source of home heating. The remaining third powers over 400 industrial (including commercial and institutional) facilities3. This estimate excludes black liquor wastes produced by pulping operations because of inconsistencies in the reporting format at the state-level. Regionally, black liquor wastes are estimated to provide between 30-35 million BOEA~.
Another large contributor to the region's overall biomass portfolio is the conversion of municipal solid wastes into electricity and steam. The conversion of municipal solid wastes at approximately 70 facilities5 probably contributes another 20-25 million BOEA. Although a relatively small contributor, landfill gas (LFG) is of increasing interest due to changes in regulations under the Clean Air Act Amendments of 1990 and the Energy Policy Act of 1992 which focus on the recovery of all forms of methane. The recovery of LFG at 35 facilities6 across the region provides nearly 2 million BOEA.
When aggregated, these four biomass resources are estimated to provide the 11-state region about 7 1 million BOEA. Total energy consumption in the region for 19907 was 2,450 million BOEA. The contribution of biomass to the 11-state energy economy is therefore currently estimated at about 2.9 percent. The other significant renewable energy resource in the region is hydroelectricity, which provided 76 million BOEA. Together, the two renewable resources provide the northeast with around 6.0 percent of total energy demand.
Figure 2 provides the total biomass energy in million BOEA for each -of the 11 state in the northeastern region. New York, the largest state in the region in terms of population, leads with nearly 15.5 million BOEA. Pennsylvania is second with 12.2 million BOEA.
Massachusetts (7.3 million BOEA), Maine (7.2 million BOEA) and Maryland (7.0 million BOEA) are the next leading states in terms of total biomass usage.
To normalize the effects of population and thereby provide a more consistent regional perspective, total biomass usage was divided by the number of federal congressional districts in each states. As shown in Figure 3, the states of Maine and Vermont lead the region in population adjusted biomass usage at 3.6 million BOEA per congressional district. The state of New Hampshire is third at 2.6 million BOEA per congressional district. These three relatively small northern New England states have an average biomass usage five times that of the average of the remaining eight states. Among other reasons which explain the difference in biomass usage9, each of the northern New England states1' took specific legislative and regulatory initiatives in the early 1980's to promote the investment in and the development of local renewable resources like biomass.
Figure 4 details the percentage contribution of each resource to the overall biomass portfolio for each state. New Hampshire leads in the percentage provided by industrial wood (68%), Maryland in the percentage provided by residential wood (72%), Massachusetts in the percentage provided by municipal solid wastes (72%) and, Rhode Island in the percentage contributed by the recovery of landfill gas (20%).
FUTURE PROSPECTS FOR BIOMASS ENERGY DEVELOPMENT
Surplus growth in the region's forests" and improvements in harvesting and processing practices like the Massahake-method1' have the capacity to provide from two to four times the volume of woodfuels now utilized annually, without jeopardizing the region's vigorous pulp, paper and wood products industries. There are also millions of tons of waste wood and other cellulosic wastes that are now disposed of in the region's limited landfills as well.
For example, one study13 indicates that over 5.72 Gg-callmin (400 mW) of power could be derived annually from the waste wood generated by New York City alone. A reasonable con~ensus '~ suggests that wood alone could replace the equivalent of over 300 million barrels of oil each year on a sustainable basis over the next two decades. Averaged on a daily basis, this yield is roughly equal to 825,000 barrels of oil, equivalent to slightly more than 10 percent of current USA oil production".
Beyond increased energy security, the use of biomass provides positive economic benefits to the region as well. The use of biomass energy creates jobs. Based on one economic impacts model16, over 60,000 total jobs are now provided in the 11 northeastern states by the wood energy industry alone. The economic impacts model takes into account the direct, indirect and induced employment effects, jobs displaced in traditional fuel industries affected by the substitution of wood energy, as well as jobs lost outside the region.
In the long-term, if wood replaced the equivalent of 300 million barrels of oil, a plausible inference is that a net of over 375,000 total jobs could be created in the region. About 65,000 of these jobs would be direct "first round" employment in the harvesting, transportation, and end-use operations of the biomass industry. The remaining jobs would be
created by the indirect and induced impacts that result from re-spending the income earned by employees involved in biomass-related enterprises. The jobs displaced in traditional fuel industries affected by the substitution of wood energy and all jobs lost outside the region as a result are subtracted from total employment. The northeastern region lost nearly 690,000 total jobs since 1987.
With respect to environmental quality, biomass producers must be committed to sustainable development by necessity. Harvesting wood in large quantities for energy purposes can be accomplished without harm to forestlands17. Sound forest management practices that keep residual stand damage from woodfuel harvesting to a minimum can create positive impacts on the region's forests1*. Harvesting low quality, unmerchantable wood in thinning operations can improve conditions for the growth of the remaining higher quality trees.
In the long-run when combined with a balanced energy policy that promotes energy conservation and efficiency, the conditional use of biomass can play a modest, but still significant, role in reducing greenhouse gas emission^'^. The region's contributions to reductions in carbon dioxide emissions can be made possible through the use of a more efficient combustion technology and advanced solid waste management practices such as source reduction, recycling and composting. Thus, accumulating levels carbon dioxide and methane, associated with global warming, can be reduced on a "no regrets" basis with the sustainable use of biomass.
How does sustainable biomass development in the Northeast compare to other potential sources of energy the USA could consider developing? It is estimated that 9.2 billion barrels of oil can be extracted from the coastal plain of the Arctic National Wildlife Refuge (ANWR) in Alaska. SupportersZ0 of developing ANWR contend that it has the potential to produce one million barrels of oil per day for 25 years. According to one source, opening ANWR to development would "stimulate USA investment, moderately temper the growth in world oil prices and significantly reduce USA petroleum imports and improve the USA trade balance." It was estimated that developing ANWR would create as many as 735,000 total jobs by the year 2005.
SUMMARY AND CONCLUSIONS
An initial comparison of Northeastern biomass potential and the oil resources of undeveloped north slope of-Alaska is strikingly similar with respect to energy content and economic growth impacts. Shading those comparisons, however, leads to far different conclusions. Depletion of north slope oil reserves creates "bubble" benefits which will be exhausted after a generation. Sustainable development of biomass can create inexhaustible wealth for generations, and does not pose the risk of sudden ecological disruption. While the choice between policy options is not mutually exclusive, the interrelationship between energy security, economic growth and environmental sustainability clearly favors biomass.
The future for biologically-based products has never been brighter. Competitive biobased products, including products like motor fuels, oils, and starch-based superabsorbents, are already in the marketplace. Biobased products are now being developed as feedstocks for
intermediate products consumed by the petroleum, chemical, and pharmaceutical industries. During the next decade products like paints, laminates, insulation materials, computer chips, plastics, texturizers, preservatives, food flavorings, and colorings could all be made from renewable agricultural and forestry materials. The environmental benefits and the economic growth potentials of biobased products are considerable. The 11 states located in the northeastern USA should intensify their efforts to work with industry and investors to expand markets for industrial biobased products, either produced from local feedstocks or manufactured by companies operating in the region.
Programs like the RBEP which provide a crosscutting interdisciplinary focus in carrying out activities related to industry support and to matching local resources to conversion technologies are essential to achieve the full resource potential. The RBEP's major focus is the transfer of current and reliable information to potential biomass users with an emphasis placed on information and technologies best-suited to near-term use. The transfer of technology from the research and development laboratory to the states is a necessary condition to the effective implementation of a renewable energy policy which encourages the use of biomass. Beyond the transfer of theoretical and applied knowledge to scientists and industry, increasing general public awareness and support of biomass energy must be accomplished through educational efforts, information dissemination and training programs if the fuIl promise of the biomass energy opportunity is to be realized.
REFERENCES AND NOTES
1. The eleven states are Connecticut (CT), Delaware @E), Maine (ME), Maryland (MD), Massachusetts (MA), New Hampshire (NH), New Jersey (NJ), New York (NY), Pennsylvania (PA), Rhode Island (RI), and Vermont 0. Each state and the region's three USDOE Support Offices has a representative on the Northeast RBEP Steering Committee which provides guidance in achieving overall program goals and objectives.
2. Citizens Conservation Corporation (1 992) Mission * Accomplishments * Prospects. Northeast RBEP, CONEG Policy Research Center, Washington, DC. This report listed millions of tons of industrial and wood fuel use for the 11 participating states, which was then converted into million barrels of oil equivalent annually (BOEA) using two conversion factors: (1) that 2.66 KG of wood fuel equals the energy content of 1 liter (22.2 pounds/gallon) of distillate fuel oil, and (2) that there are 6.1 44 GJ (5,825,000 Bus) per barrel of distillate fuel oil.
3. Maine Audubon Society (1989) Northeast Directory of Biomass Enerqy Facilities. Northeast RBEP, CONEG Policy Research Center, Washington DC.
4. Personal communication with Robert Lowe, Energy Information Administration, May 1993.
5. Supra Note 2. This report lists MSW recovery facilities in a tons per day rated capacity for the 11 participating states, which was then converted into million BOEA using three conversion factors: (1) that the conversion facilities have a capacity factor of 90 percent, (2) that one tonne of MSW has an average content of 8.517 GJ (8.9 million Btuhon), and (3) that there are 6.144 GJ (5,825,000 Btus) per barrel of distillate fuel oil.
6. Personal communication with Michael J. McGuiggan, SCS Engineers, -Reston VA, December 1992. This communication provided LFG recovery facilities in million cubic feet per day rated capacity for the 11 participating states, which was then converted into million BOEA using three
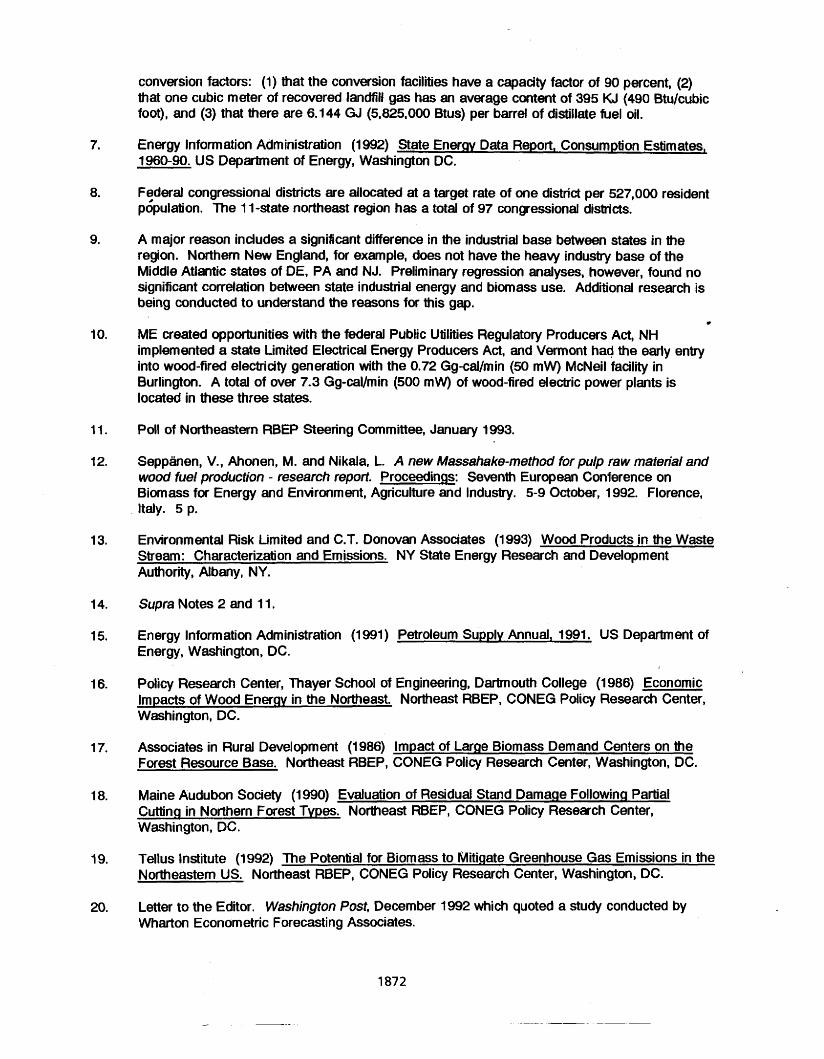
conversion factors: (1) that the conversion facilities have a capacity factor of 90 percent, (2) that one cubic meter of recovered landfill gas has an average content of 395 KJ (490 Btujcubic foot), and (3) that there are 6.144 GJ (5,825,000 Btus) per barrel of distillate fuel oil.
Energy Information Administration (1 992) State Ener~y Data Report, Consumption Estimates, 1960-90. US Department of Energy, Washington DC.
Federal congressional districts are allocated at a target rate of one district per 527,000 resident p6pulation. m e 1 1-state northeast region has a total of 97 congressional districts.
A major reason indudes a significant difference in the industrial base between states in the region. Northern New England, for example, does not have the heavy industry base of the Middle Atlantic states of DE, PA and NJ. Preliminary regression analyses, however, found no significant correlation between state industrial energy and biorn ass use. Additional research is being conducted to understand the reasons for this gap.
* ME created opportunities with the federal Public Utilities Regulatory Producers Act, NH implemented a state Limited Electrical Energy Producers Act, and Vermont had the early entry into wood-fired electricity generation with the 0.72 Gg-callmin (50 mW) McNeil facility in Burlington. A total of over 7.3 Gg-cal/min (500 mW) of wood-fired electric power plants is located in these three states.
Poll of Northeastern RBEP Steering Committee, January 1993.
Seppmen, V., Ahonen, M. and Ni kala, L. A new Massahake-method for pulp raw material and wood fuel production - research report. Proceedings: Seventh European Conference on Biomass for Energy and Environment, Agriculture and Industry. 5-9 October, 1992. Florence, Italy. 5 p.
Environmental Risk Limited and C.T. Donovan Associates (1993) Wood Products in the Waste Stream: Characterization and Emissions. NY State Energy Research and ~evelopment Authority, Albany, NY.
Supra Notes 2 and 1 1.
Energy lnformation Administration (1 991) Petroleum Supply Annual, 1991. US Deparbnent of Energy, Washington, DC.
Pdicy Research Center, Thayer School of Engineering, Dartmouth College (1986) Economic Impacts of Wood Energy in the Northeast. Northeast RBEP, CONEG Policy Research Center, Washington, DC.
Associates in Rural Development (1986) Impact of Large Biomass Demand Centers on the Forest Resource Base. Northeast RBEP, CONEG Policy Research Center, Washington, DC.
Maine Audubon Society (1 990) Evaluation of Residual Stand Damage Following Partial Cutting in Northern forest Types. Northeast RBEP, CONEG Policy Research Center, Washington, DC.
Tellus Institute (1992) The Potential for Biomass to ibliti~ate Greenhouse Gas Emissions in the Northeastern US. Northeast RBEP, CONEG Policy Research Center, Washington, DC.
Letter to the Editor. Washington Post, December 1992 which quoted a study conducted by Wharton Econometric Forecasting Associates.
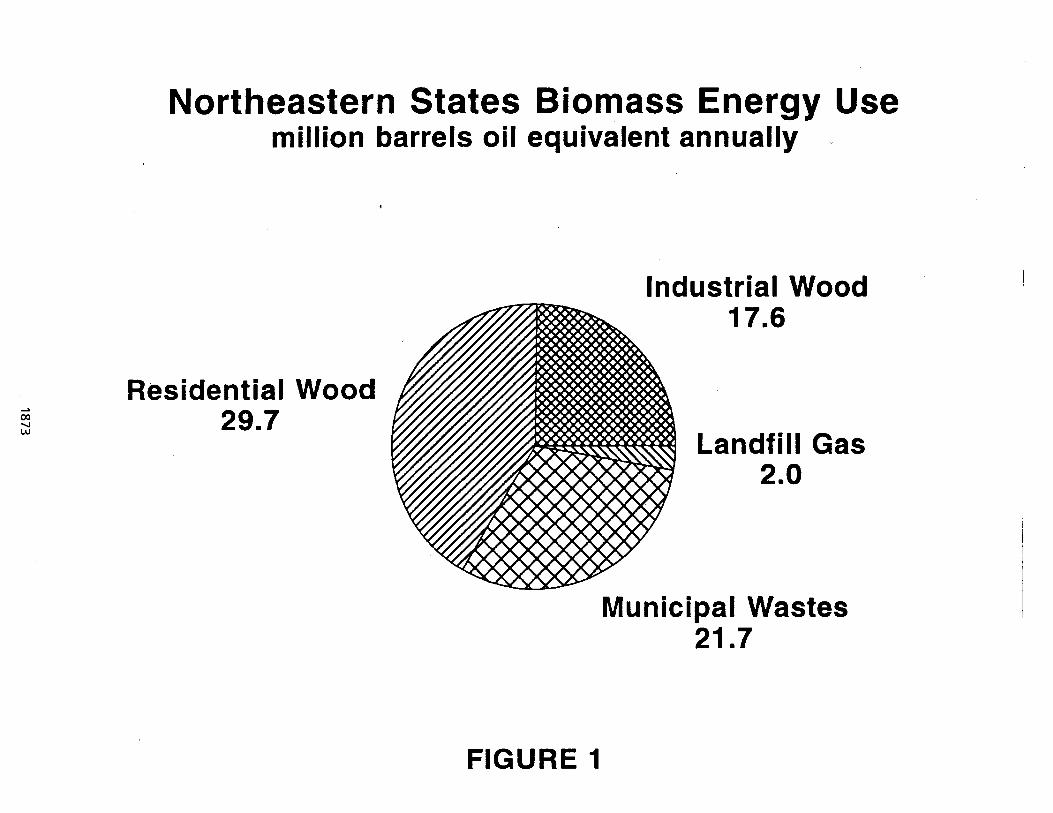
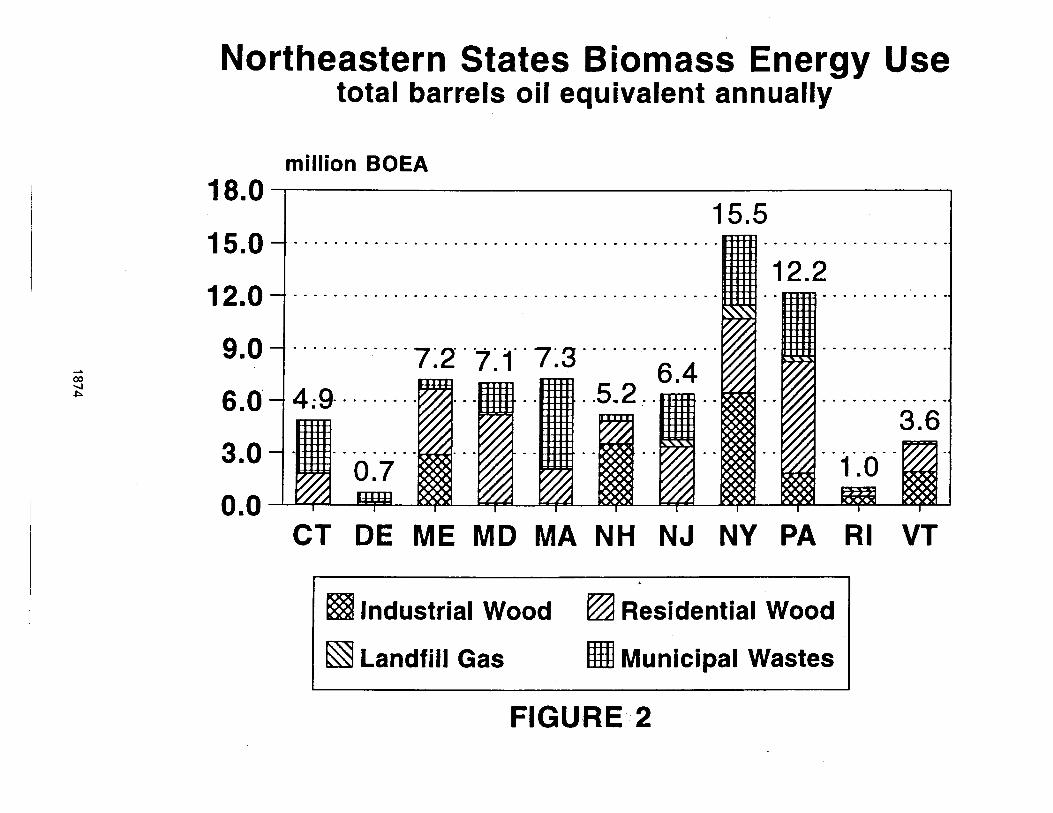
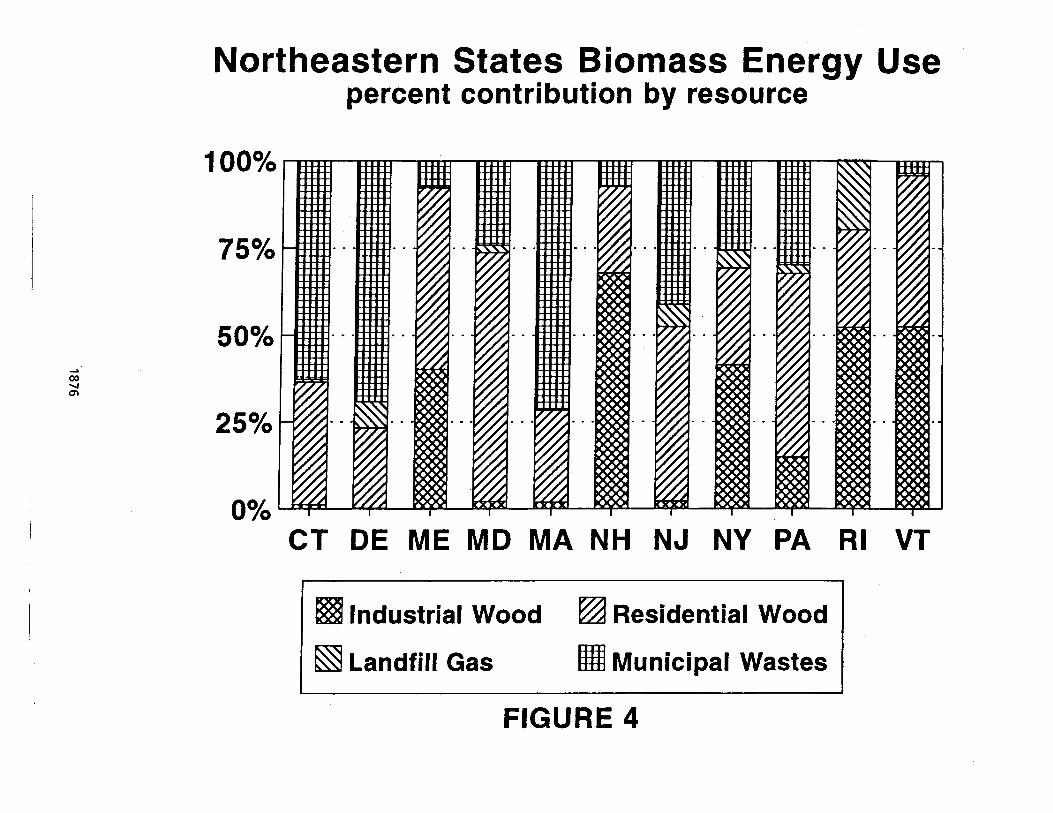
BIOMASS IN LATIN AMERICA - OVERVIEW
Wayne R. Park Senior Energy Specialist
Organization of American States Washington D.C., 20006
Abstract
The paper discusses the interest of the Organization of American States as a participant in this hemispheric conference on biomass, provides an introduction to the Latin American experience in biomass energy through "snapshotsN of various country activities, and concludes with a discussion of four conditions that form strong incentives for new north/south and south/north ventures in the biomass energy and chemical arena in this hemisphere.
INTRODUCTION
During the decade of the 80Js, under mandate of its General Assembly, the Organization of American States (OAS) was most active in biomass energy technical assistance activities throughout the hemisphere. Although covering many varied biomass energy topics, the OAS supported programs in the island states of the Eastern Caribbean, the Dominican Republic, all the countries of Central America and Panam6, Ecuador, Suriname, Brazil, Bolivia and Uruguay.
With the fall in world energy prices in 1987, in their mandates to the OAS General Secretariat for direction for its technical assistance activities, the member states of the OAS replaced the topic of energy with other more pressing areas of concern. However, the issues of biomass energy still are of interest and application to what our institution performs, in its important
activities in the environmental area, in natural resource management, in integrated regional development and in natural hazard mitigation. Moreover, the OAS holds a hemispheric responsibility in the betterment of relationships and understanding among the countries of this hemisphere.
It may be more in this latter context that we are involved in this conference. The countries south of the United States borders have a wealth of experience in the subject of biomass energy that is generally not well-known in the north. In many biomass topics, Latin America has more hands-on actual experience than anywhere in the United States and Canada and very often, than anywhere else in the world. It is this experience and the outgrowth of what this experience and opportunity may provide that draws the OAS to an involvement in this meeting. In short, the south has a lot to offer which the north doesn't know much about and which can lead to effective synergism between what both the north and south need and have to offer.
In this session we have presentations from four distinguished professionals from Latin America, all with extensive experience in the biomass chemical/energy field. The objective of their combined presentations is to give a summary of the resource potential, the history and current activities in biomass utilization and insight into the future potential of biomass development throughout the Latin American region. I do not wish to take away the impact of their story. What I wish to do is to provide more of a setting for the picture that they will paint and also to share some likely impacts in the biomass arena of the fascinating changes that are occurring in the region that should be promising for hemispheric biomass energy and chemical development.
SOME SNAPSHOTS OF BIOMASS EXPERIENCE IN LATIN AMERICA
In spite of the serious deforestation problems that are evident throughout specific regions of Latin America, the area still has one of the largest biomass reserves in the entire world. Population densities throughout most of these forested areas are very low. This enticing condition has drawn many in the energy area to seek ways in which biomass, with its ideal growing conditions and local availability, could become an effective fuel source for the substitution of petroleum fuels, especially in those areas in Latin America where petroleum is either a drain on the economy as an import requirement or in those conditions where petroleum transportation is difficult and exceedingly expensive.
In some areas of Latin America, such conditions have led to a booming commercial biomass industry. In others, in spite of the seemingly positive opportunities, ventures have not been successful or have failed to move forward.
By far, the country with the most extensive experience in biomass
1878
energy is Brazil. Its very extensive fuel ethanol program was started in the 1970s as a mechanism to provide substantial substitution of very high priced imported petroleum, to provide some national energy self-sufficiency in liquid fuels and also to provide relief and significant labor generation to a faltering sugar industry. Today the industry continues, not only providing ethanol gasoline blends but fuel grade ethanol for a whole fleet of vehicles designed and produced to run on that specific fuel. Some aspects of the program are still controversial, but without a doubt the Brazilian ethanol fuel program is the largest such program in the world and is likely to continue. We will hear much more about this program from Dr. Trindade.
The need for a low-priced reducing agent for the processing of iron ore and steel has led Brazil into a very extensive system for the production of charcoal. This effort includes a vast practical experience in the development and operation of energy plantations and production of charcoal with all levels of technological sophistication.
Brazil supports a mature industry dealing with the hardware aspects of biomass energy. Besides the array of companies that produce boilers, burners, ovens, etc. , of special note is the fact that Brazil has a very extensive small thermal gasifier manufacturing industry.
Brazil maintains the largest land holding in the entire Amazon Basin. Although serious problems of Amazon deforestation have been occurring, the region still has the largest biomass reserve in the world. The country participants in the Treaty for Amazon Basin Cooperation are working among themselves with international agency support in the formulation of sustainable development models for the many ecosystems that exist within this region. The opportunity for effective and sustainable biomass energy/chemical development in this region has yet to be fully explored.
Uruguay has no known petroleum resources. The country is unique throughout Latin America in the sense that Uruguay historically has set petroleum product pri6es significantly above international price levels. The high prices have provided the incentive for an impressive commercial wood energy industry. Eucalyptus, the primary wood source, grows well in the gently rolling prairie and ranch land environment. Ranchers have made good income from the planting of eucalyptus wood lots.. There is extensive labor generation in wood cutting and transportation. Industry, the major consumer of fuelwood, primarily uses wood as a fuel oil substitute in wood-fired industrial boilers. The fuel price differential has resulted in some very interesting fuelwood uses: the meat plant in Tacuaremb6 gasifies wood and bqrns the hot gases in its steam boiler. Some of the country's agricultural driers for rice, corn and other grains are based on fuelwood. In some plants, tobacco is cured using wood burners and chimney ducting through the drying barns; others use wood-fired boilers and steam heaters. Wood wastes are used for commercial wood drying. A country cement
factory uses rice husks as a partial fuel source for the calcining process. The same plant has a boiler which is fired with rice husks.
In addition to industrial use, Uruguay supports a substantial residential fuelwood demand. Wood is used for both heating and cooking. Many restaurants throughout Uruguay have large braziers for fuelwood cooking of specialty meats. However, with all of the commercial fuelwood use, it is interesting to note that Uruguay has no significant biomass-based electricity generation. Electricity is principally hydro-based with oil-fired peaking and 'backup generators. The electricity company sees its greatest non-hydro renewable energy source as wind and not biomass.
In the Dominican Republic, where sugar production is still prevalent, bagasse is still an important energy source in modern sugar refineries. However, the major biomass energy consumption is charcoal. Produced mostly in dry forest lands using artisan technology, charcoal follows an intricate truck-based market system to the major communities where it is sold directly to residential consumers as cooking fuel. In a concerted effort to reduce the extensive deforestation caused by charcoal production, the Government of the Dominican Republic has heavily subsidized the price of liquif ied petroleum gas (LPG) being the closest cooking fuel alternative to charcoal. It is interesting to note that the subsidy of LPG is common throughout Latin America, first for social reasons to provide the public with a low-cost cooking fuel and secondly as a policy to reduce deforestation caused by fuelwood cutting.
Throughout Latin America, biomass-based electricity generation is principally a byproduct of other activities: from bagasse-burning boilers in the case of sugar production and recuperative boilers burning wood wastes in the pulp and paper industry. However, two fascinating wood-fired electric generation systems are in use today in the very isolated Mennonite communities of Lorna Plata and Filadelfia in the dry forested Chaco region of northwest Paraguay.
Since 1983, the Lorna Plata electric utility has been successfully operating two downdraft wood gasifiers feeding two (plus one backup) engine/generator sets rated at 420 KW each. Although the gasifiers have required significant modification to control throat temperatures and a charcoal filter has been added to the gas clean up system, the overall operation is quite reliable. However, regular maintenance is expensive and critical. Gas tubing must be broken down once every two weeks for cleanout. Hogger blades require sharpening every week. Filter charcoal has to be replaced every three months. The gasifier body requires replacement once a year. The success of this operation is highly dependent on the dedication and discipline of the plant operators.
The Filadelfia plant is of more standard steam technology with a wood-fired boiler feeding a 2.2 MW steam turbine generator. Steam is also used for an agroprocessing facility adjacent to the
electric generation facility.
Although a notable success story for biomass energy utilization in Latin America, plans are underway now for extension of the Paraguayan National Grid to this region. It is not known what will be the decision on the use of these biomass systems when such a connection is made.
One would think that biomass-based electric generation systems would have made a greater inroad in Latin America, especially in isolated areas where diesel-based generation is very expensive. International organizations were very much involved with technical assistance to countries of Latin America during the 80s in attempts to develop biomass-based electric generation systems for isolated communities. In the case of gasifier technology, the answer was clear: technology was simply not adequate. There are gasifier (for electricity generation) skeletons throughout Latin America testifying to this conclusion. Among others, the work underway in Brazil and the Big GT demonstration project will be a welcome new step in attempts to eliminate these technological barriers. For more traditional steam powered technology, biomass-based electric generation systems are not prevalent for a number of reasons. Important on the list is the tradeoff between size and efficiency. Units need to attain at least the 1 to 2 MW size to achieve any acceptable fuelwood use levels. More critical among the reasons are those that are both political and institutional. Dendrothermal plants of this size typically require operation under the direction of national electricity companies. These companies have not been enthusiastic about their entry into new fuel technology, especially requiring management of energy plantations. The political risks of any activity that involves the cutting of trees is huge and very difficult to accept by a government institution.
OPPORTUNmES FOR NORTH/SOUTH AND SOUTH/NORlH COOPERATION
A number of conditions involving Latin America are changing rapidly and may have a significant impact on the future for the use of biomass resources for energy and other purposes throughout the region.
First, the World Bank in its baseline forecasts for economic development throughout the world to the year 2002 expects the majority of growth to occur in the now so-called developing countries. Whereas the G-7 country GDP is expected to grow 2.2 percent annually in the period 1992-2002, in Latin America, this growth is expected to average just under 4 percent. Such economic growth will imply similar levels of commercial energy growth. The market for energy development in Latin America is significant and just beginning to be understood. It is quite reasonable to assume that biomass energy will have a growing role in this energy development scenario.
Second, countries of Latin America during the 1970s and 80s placed a huge portion of their national financial commitments into the energy sector. Financially, the decade of the 80s was a disaster for Latin America, with huge debt burdens and capital flight. National electric companies became financially insolvent, under the condition that electricity tariffs, under the control of national political bodies, were highly subsidized. Monies were not only not available to provide for new plant requirements, but also not available to deal with normal maintenance requirements.
It is most interesting to note that within the last few years, countries in Latin America are beginning to deal directly with these difficulties. Chile has converted its national electric company into a fully private sector institution. Argentina has and is continuing to privatize its regional electricity companies. Chile, Argentina and Peru, as an incentive to private sector investment, have established laws to force the adjustment of electricity tariffs to match market criteria. Other countries are actively considering similar measures.
Chile, the outstanding success story in economic recovery in Latin America, is taking advantage of the private sector market opportunities in the energy sectors of its sister countries. Chile's electricity company is working with local private sector companies and tying in with the international private banking communities to establish private holding of regional electric companies in ~rgentina. Such an operation is underway for the private electric company now generating electricity for Buenos ~ires. Chile's electricity company is working on similar relationships in Peru.
Although on a smaller scale, governments from other areas of Latin A m e r i c a are beginning to give private industry a role in the generation of electricity under profitable pricing conditions.
Third, the worldwide concerns about environment and natural resource protection as expressed and agreed upon at the recent Rio Summit should have an important impact for the consumption of biomass as fuel in the future. Biomass energy consumption based on energy plantation technology or at least a totally sustainable resource base provides for a complete carbon cycle, one that other combustion technologies and fuels cannot achieve. Along with the biomass resource base, growing conditions and land area benefits prevalent in Latin America, the complete carbon cycle nature of biomass energy systems should be an additional significant incentive to their future growth.
Last, and possibly more important than all of the above, is that stability, both political and economic, is appearing in Latin America. Once noted for its almost predictable political coups, military juntas, corrupt and weak democratic systems, ati in America is coming of age in its own realization of its necessary future to be competitors in the growing world economy. In 1990, at the OAS General Assembly in Chile, the member countries unanimously
committed themselves to a mutual responsibility for upholding democratically elected governments in this hemisphere, requiring a common response in the case of takeovers of duly elected governments. There has been international supervision of elections in Nicaragua, El Salvador, Paraguay and Suriname and strong international response to takeovers in Haiti, in Peru and recently in Guatemala. Local governments are taking action against identified corruption. The concrete steps that have been taken for the strengthening of democracy just within the last few years are truly astonishing. With stability comes investment and with investment, economic progress.
The drastic price reduction of world petroleum that occurred in 1987 has had a negative impact on all kinds of alternative energy ventures throughout the world. It is evident however, that with increased demand for petroleum products and expected long-term limitations in supply, that petroleum price increases are likely. Biomass will have its future role throughout the regzion, some economically justified now and much more as this process continues.
Each of these factors makes for most interesting market possibilities in Latin America. Latin America has the resource base, has exceptional history in biomass energy and chemical production, and now has a growing factor of economic and political stability that invites private sector participation. The opportunity for sharing south to north and north to south have never been so interesting. The technology base of the north needs the market opportunity the south can provide. The south can effectively use the technology base and innovation that the north can provide.
It is our hope that, as the presenters that follow share the Latin American picture of the biomass resources, the experience in use and the potential for the future, many of you will see a growing new paradigm in south/north and north/south cooperation in the field of biomass utilization.
The World Bank, ItGlobal Economic Prospects and the Developing Countries 1993t1, Washington D.C., April 1993.
The World Bank, "World Development Report 1992, Development and the Environment, World Development IndicatorsM, Oxford University Press, New York, New York, May 1992.
Ministerio de Industria y Energia, Direcci6n Nacional de Energia, "La Leiia como Combustible en Uruguayw, Montevideo, Uruguay, November 1985.
Organizaci6n de 10s Estados Americanos, "Estudio de Factibilidad de la Planta Dendrotgrmica de Pedernalesw, Santo Domingo, Repiiblica
Dominicans, January 1986.
OrganizaciBn de 10s Estados Americanos, "Gasif icador de LeRa - Loma Plata, Paraguay", Washington D.C., September 1987.
organization of American States, "Integrated Energy Development - ~xperiences of the organization of American States", Washington D.C., 1988.
0rganizaci6n de 10s Estados Americanos, "La CBscara de Arroz en Tacuarernb6 - Opciones y Recomendaciones para su Uso EnergBtico", ~ontevideo, Uruguay, May 1988.
ETHANOL FUELS IN BRAZIL
The World's Most Extensive Experience With Non-Fossil, Environmentally Sound, C02 Recycling, Transportation Fuels
Sergio C. Trindade S E ~ T International , Ltd.
Scarsdale, N.Y.
Introduction
The largest alternative transportation fuels program in the
world today is Brazil's Proalcool Program. About 6.0 million
metric tons of oil equivalent (MTOE) of ethanol, derived
ma 1 n 1 y from sugar cane, were consumed as t ransportat 1 on
fuels In 1991 (equivalent to 127,000 barrels of crude oil
per day). Total prlmary energy consumed by the Brazil Ian
economy in 1991 was 184.1 million MTOE, and approximately
4.3 mlllion vehicles - about one thlrd of the total vehlcle
fleet or about 40 percent of the total car population - 'run on hydrous or "neatH ethanol at the azeotropic composltlon
(96 percent ethanol, 4 percent water, by volume). Additional
transportation fuels available in the country are diesel and
gas01 lne, the latter of which is def lned by three grades.
Gasoline A (regular, leaded gas) has virtually been replaced
by gasoline C, a blend of gasollne and up to 22 percent
1885
anhydrous ethanol by volume, and gasol lne B (pternlum
gasoline) has been discontinued as a result of neat ethanol
market penetration.
The Proalcool Program
There have hlstor!cally been a number of stakeholders in the
Brazlllan transportation/fuel lndustry - the government, ,
ethanol and automobl I e manufacturers and dlstr lbutors, the
petroleum/natural gas and sugar cane lndustrles, and
Brazilian and international consumers. The economic
interests of these stakeholders are often intertwined both
in the natlonal and international marketplaces.
For example, ethanol has been used as an automot 1 ve f u e l I n
Brazil since the 1920s. Up untlll 1975, when Proalcool was
launched, ethanol was used occasionally In blends of varylng
composition with gasoline to protect the Important sugar
industry from the vagarles of the internatlonal market. The
product 1 on of ethanol absorbed part of the sugar product ion
that was not economically feaslble for export , and the
government thereby guaranteed a market for ethanol,
By 1957. transnat lonal corporat I on3 had begun 1 ocal car
production, and Brazil's automobl1e industry has since
grown, contrlbutlng ln the range of 8-12 percent of the
lndustrlal GNP and taklng Its place as one of the 12 largest
auto industries in the world.
Stakeholders and Government Pollcy
The lntroductlon of the Proalcool program in 1975 colnclded
wl th a convergence of the lnterests of the key stakeholders
in Brazil's transport fuel economy. The program was
originally conceived to Implement the new pollcy of
pr0rnt:ttiny t h e market penetratlon of ethanol as a
transportation fuel vla gasollne C, thus dlsplaclng gasoline
A. The rationale behind the policy was the concern over
prices and availability of liquid fuels for transportation
in connection with the first oil crisis of 1973.
These concerns were exarcebated in 1979 wlth the onset of
the Iranian oil crisis, and the Iran-Irak conflict, which
led the Brazilian government to implement pollcies
support lng a more radlcal approach to promote ethanol, in
the form of neat ethanol, as a transportation fuel - In
addltlon to gasoline C. Ethanol moved from Its earller role
of gasoline extender to belng a fuel In Its own rlght.
At the root of the Proalcool initiative were government
concerns with the securlty of supply of transportation fuels
refined In Bra211 from predominantly Imported crude 0 1 1 .
Furthermore, the 0 1 1 prlce hlkes of 1973 and 1980 put
considerable pressure on the country's balance of payments.
011 Imports' share of total lmports Jumped from 9.8 percent
in 1973 to 43.3 percent In 1985. (Tables 1 and 2 provide a
more comprehensive picture of the impact of 0 1 1 imports on
Brazil's international trade and finances.) Ethanol 1s
produced from domestic resources paid for in local currency.
Its use therefore saves precious foreign exchange.
In founding Proalcool, the government was convinced that the .
expansion of the ethanol Industry could also help Brazll's
economic growth. I t would provide the automobile industry
with a more rellable source of domestlc fuel based on the
well-established sugar cane agriculture. Direct and indirect
Job creatlon connected wlth ethanol productlon would offer
growth opportunities for the rural areas and a1 low the
reduction of economic imbalances between the dlverse regions
of such a vast country as Brazil.
Background of t h e Key Stakehol ders
At its peak, Brazil had some 600 distilleris capable of
producing about 16 mi1 lion m3 (4.2 bill ion gal Ions) of
ethanol. On an energy content basis, ethanol's share of
1 iquid fuels used for ground transportation (which employs
both Diesel and Otto engines) increased from 0.5 percent in
1973 to a peak of 22 percent in 1988 and 1989. The pace of
market penetration of ethanol fuels is better illustrated
however, by the displacement of gasoline from the Brazilian
domestlc market, as both ethanol and gas01 lne are used
prlmarlly in Otto engines. On an energy basis, the share of
ethanol In this market Increased from 0.9 percent to a peak
of 52 percent during the perlod from 1975 to 1988 whlle the
market for Diesel fuel practically doubled In slze from 8.1
to 15.9 MTOE as the ratio of Dlesel fuel to Otto fuels moved
from 73 percent to 141 percent. Meanwhlle, Otto fuels
(ethanol and gasoline) grew only 20 percent to 11.3 MTOE.
Since 1989, Dlesel fuel continue to grow, gasollne regalned
market lost to ethanol , and ethanol establ 1 lzed (see Table
3).
The large market expansion of ethanol as a transportation
fuel stimulated the development of technologies aimed at
lmprovlng sugar cane ylelds, more efficient conversion from
sugar cane Juice and molasses into ethanol, and hlgher
engine efflclency. After all, the ethanol production
technology avallable at the lnceptlon of Proalcool was
geared to the low volume, hlgh value-added, and traditional
potable ethanol market. Hlstorlcally, Otto englne
technology, although orlglnal ly developed wlth alcohols
<ethanol, methanol) in mind, was later optimized for
hydrocarbon fuels.
To expedl te the 1 aunch 1 ng of Proal coo1 , the government
resorted to subsldles for the development of sugar cane
agrlbuslness and ethanol production. These subsidies have
practically been removed. Meanwhile, Brazil has been
undergoing for over a decade an acute inflation. While
inflation has not entirely impeded economic growth, it has
severely dlsorganized both public and private finances and
distorted relative prices in the economy.
A s a result, Petrobras - the main ethanol distributor to all
marketers and a company wlth a former longstanding tradition
of profitablllty in Its 40 years of existence - has suffered substantial losses in the dlstrlbution of ethanol.
Under Inflatlonary conditions and wlth prlces for ethanol
ex-distillery and ethanol CIF-retailers set by dlfferent
government agencies at dlfferent tlmes, the dlstrlbutor
often ends up buylng ethanol from producers at a higher
prlce than I t can sell to retailers. The slow adJustment of
oil product prices under the inflationary regime of the past
decade has a1 so compounded Pet robras' 1 osses.
On the other hand, sugar and ethanol industry has grown
extraordinarily with Proalcool and has a large stake in the
program's further growth. Yet, the industry has suffered
from the pr ice-set t lng and cormercial mechanisms of ethanol
sales, and often finds itself at odds wlth Petrobras, the
main ethanol buyer. And on recent occasions of higher
international sugar prices, the industry has switched to a
considerable extent to more sugar and less ethanol output,
as in the years before ProaIcoo1. During such occasions,
some ethanol producers who do not make sugar, shut down
production for lack of economlc lncentlve.
Currently, the automobile industry is relatively indifferent
to the type of fuel available - neat ethanol or gasollne - as its large gasoline englne and vehicle export program
makes It posslble to supply vehicles for both fuels to the
domestic market. Vehicle owners, however, are very sensltlve
to retail fuel price differences between ethanol and
gasoline, and consider total vehicle operation costs. In
addition, consumer perception of fuel availability is
crucial in determining type of vehicle purchase. In this
latter context the opinion of taxi drivers a1 1 over the
country is crucial.
The above Issues have led to a sltuatlon that challenges the
continuation of Proalcool. The reintroduction of gasollne to
the market has a1 levlated the excess of ref Inery output
relatlve to dcnnestic demand. Occasions of short dmestlc
supply of ethanol have led Petrobras to import methanol and
ethanol to f i l l the gap. A new transportation fuel - ethanol/methanol/gasollne blend <60, 33, and 7 percent by
volume, respectively> - has appeared on the Brazlllan market
In early 1990.
As of September 1992, retail prices for autornotlve fuels In
BrazII at the official commercial exchange rate were US
$0.35 per liter (US S1.32 per gallon) for gasoline C , US
$0.26 per 1 iter (US a0.98 per gal l o n ) for neat ethanol and
US S 0 . 2 6 per I lter (US S0.98 per gallon) for Diesel fuel.
International comparisons with Brazilian domestic prices
expressed in US * can be tricky, given, inter alia, that
inflation and currency devaluation vary at different rates,
Government Macroeconomlc Objectives
Sl nce 1975, Proal cool has genera 1 l y met government
objectives - although not necessarily b y its own devlces.
Concerns over the securlty of supply and high prlces of
fuels have abated due to the retaxatfon of international oil
markets and to the lncrease In domestlc crude product ion,
which near1 y quadrupled from 1975 to 1987, reaching a
plateau thereafter, and has resulted in over 50 percent oil
self-sufficiency.
The ensuing decrease in imported oi 1 prlce and the overal l
export drive of Brazil has considerably improved the trade
balance, but unfortunately, the parallel increase in foreign
debt and debt servlce has offset the trade surpluses. The
growth in oil prices since 1973 is one of the causes ,of the
outstanding Brazilian debt.
The rate of economic growth has fluctuated slnce 1975.
Nevertheless, most analyses Indicate that agricultural
employment and industrial activities connected with ethanol
fuel production, distribution, and utilization benefitted
substantially from Proalcool.
Economics as If the Envlronment Mattered
Despite significant technological developments In ethanol
product ion, by the end of 1985 the best ethanol producer in
Brazil was barely cost-competltlve with gasoline at a crude
price of US a28 per barrel. On the other hand, straight
economic comparisons do not take lnto consideration ( i ) the
value of ethanol in reducing oil imports in a country as
highly Indebted as Brazil; ( 1 1 ) the hlgher value of ethanol
as an octane booster, and ( 1 1 1 ) ethanol superior
environmental characteristics. As the long-term marginal
cost of oil Is likely to increase, which wlll be translated
lnto market economic terms, ethanol can become a ratlonal
economic option for some countries.
The environment was not an expl iclt concern in the
formulation of Proalcool, but as the program evolved, the
costs and benefits to the environment became evldent. The
distillation of ethanol produced from the fermentatfon of
sugar cane julce and/or molasses ylelds a large volume of
1 iquld effluent (:st1 1 lage) with a hlgh bIologica1 oxygen
demand/chemlcal oxygen demand tBOD/COD> content. Each volume
of ethanol yields 13 to 15 volumes of stlllage. A t the
outset of Proalcool, I t was traditional to dispose of raw
stlllage In bodles of water. Thls process became untenable
as ethanol output expanded. The domlnant approach today is
t o return stlllage to the sugar cane flelds for
fertilization and irrigation purposes. In this application,
stillage 1s valued for its potassium content, which is
usually sufficient to pay back the required investment
within a commercfally acceptable t i m e .
Ethanol burning in Otto engines has a generally beneficial
effect on emlsslons. The actual effect depends on a variety
of factors including electronic Injection, compression
ratlo, tuning, ethanol content In the blend, catalytlc
proces s ing of tall ptpe off-gases, and drlving cycle. The
major negatlve effect 1s the lncrease In aldehyde ernlsslons
(particularly acetaldehyde) In relation to gasoline.
A s of November 1991, lead compounds were complete1 y phased
out of Brazilian gasollnea. N o additlon of aromatics was
necessary t o compensate for the loss of octane, as the
ethanol content of up to 22 percent by volume, In gasol lne,
brlngs In the requlred octane rate to a mlnlmurn of 80 Motor
Octane Number (MON).
The addition of ethanol to gasoline cuts down the blend
content of sulfur, aromatics and olef Ins, thereby reducing
emlsslons of sulfur and toxic and photochemically reactive
substances into the atmosphere. The leaning effect of
ethanol in the gasoline blend cuts down the emission of
carbon monoxide and gum deposits in the englnes. In the USA,
ethanol and other oxygentes are being added to gas01 ine
blends for the latter purpose. in conformity wlth the 1990
ammendments of the Clean Air Act.
Aldehyde emlsslons of neat ethanol-fueled vehicles are
typically three times larger than gasollne-fueled vehicles.
Ethanol related aldehyde emissions are dominated by
acetaldehyde ( 8 5 percent). whereas gasollne related aldehyde
emissions are prlnclpally composed of formaldehyde, a much
more toxic substance. Formaldehyde is a known carcinogen and
has a photochemical reactivity 70 percent higher than
acetaldehyde, a feature directly related to the bulld up of
photochemical smog. It Is interesting to note that the
aldehyde emissions of Diesel-fueled vehicles is of the same
order of magnitude of neat ethanol-fueled vehicles. Diesel
related aldehyde emissions are more toxic than ethanol
related emlsslons, and contrlbute to the unpleasant aroma of
Dlesel exhaust gases.
Aldehyde emisslons of neat ethanol vehicles have been
gradually decreasing in recent years. Typically for 1992
models, aldehyde emisslons are 0.03 g/km for neat ethanol
vehicles and 0.01 g/km for gasollne blends containing 22
percent ethanol by volume. Improved neat ethanol vehicles
wlth catalytic convertors and/or electconlc injection have
aldehyde emissions of the same level as conventional
gasoline vehlcles (wlth carburator, no catalytic convertor),
and lower than Dlesel fueled vehlcles of similar power.
A 1990 study of the Sao Paula State envlronmental agency
(CETESB), has confirmed that acetaldehyde makes about 70
percent of the aldehydes measured in the atmosphere of the
clty of Sao Paulo - a sprawling megalopolis wlth over 10
million Inhabitants. Acetaldehyde concentrations varied in
the range of 4 - 47 ppb (parts per bllllon) in open air. The rnax lmum observed concentrat ion was measured tnside a major
tunnel, at 132 ppb. As a reference, the World Heal th
Organization acetaldehyde llmlt of occupational tolerance 1s
1000 ppb.
Furthermore, emlsslons of unburned fuel of neat ethanol
vehicles CbasIcally ethanol) Is much less tox lc and less
photochemically reactive than unburned hydrocarbons. Neat
ethanol combustLon yields much less soot than hydrocarbon
burning, which causes less respiratory troubles in the
populat.ion and provides for better dt'mosferlc visibility.
Regarding nitrogen oxide emissions, the advantages of
ethanol's large latent heat of vaporizat ion and higher
thermodynamic ef f lclency are offset by the higher
compression ratio of neat ethanol vehicles, thus resulting
in NOx emissions similar to gasoline vehicles, but much
lower than Diesel vehicles.
Studies with guinea pigs and rats conducted by the
University of Sao Paulo have demonstrated that ethanol
vapors and tailpipe gases are less toxic than those of
gasoline, in terms of acute toxicity. Although there are
presently no data on chronic toxicity of ethanol vapors and
combustion gases, over a decade of extensive utilization of
ethanol fuels has not revealed evidence of negative health
effects, even wlth gas station workers, who are more
intensively exposed. Studies by CETESB showed that the
maximum concentratlons of ethanol In the clty of Sao Paulo
reach no higher than 2.3 ppm, which compares we1 1 with the
WHO llmlt on occupational tolerance at 1000 ppm.
The recent concerns over the net contribution of fossi 1
fuels to the level of carbon dioxide In the atmosphere and
the ensuing greenhouse effect on cl lmate change have glven
sugar cane ethanol an unexpected environmental value. Sugar
cane ethanol Is the only commercial transportation fuel that
can claim a zero net contribution of carbon dioxide to the
atmosphere.
Conclusf ons
Government policymakers, in Brazil and elsewhere, must
arbitrate inherent conflicts between the main stakeholders
In any a1 ternat ive transportat Ion fuels program. In the
Brazilian case the relevant stakeholders and thelr posltlons
are: Petrobras, which produces domestic 0 1 1 , refines the
totallty of the crude, transports and distributes ethanol
and petrol eum products; ethanol producers, wh ich take most
of the value added generated by the Proalcool program, but
are exposed to sudden bankruptcy as a result sf uneven
pricing policies or severe inflation; and autmakers, who
depend upon the availability of various fuels.
The reintroduction of gasoline into the domestic market
beginning in 1989, after years of gasoline market erosion,
reflected an attempt to avoid expensive investment in
refining to match market demand for crude slate under a
pollcy of self-sufflclency In refining. The automobile
Industry output of gasoline-fueled vehlcles has been growlng
fast since 1989 In response to thls change In pollcy.
Ethanol capacity Is likely to remain at the current level in
the foreseeable future, a1 though actual ethanol output wl l 1
depend on the react ion of producers to the pr lclng pol icies
of the government and the practlces of Petrobras In
comrnercializlng ethanol. Ethanol and methanol Imports, by
Petrobras, are already fl11Ing the gap left by domestic
ethanol producers who are unwllllng to sell at prlces they
do not conslder remunerat 1 ve - part lcul ar 1 y those who have
the optlon of swltchlng to other products, such as sugar.
A new consensus among key stakeholders has emerged to
replace the.understand1ng achieved durlng 1975-1980. There
1s a new transportatlon fuels market emerglng In Brazll, and
the gas01 ine C share is fast increasing. However, this new
consensus, as Its predecessor, Is subject to dynamlc change,
and It remalns to be seen how much value can be attributed
to the carbon dioxide recycling feature of sugar cane
ethanol - or biomass-derived ethanol in general, as well as
the net posltlve environmental qualities of ethanol fuels.
Other countries can learn from the Brazlllan Proalcool
experlence that a delicate balance between key stakeholders
Is germane to the successful lmplementatlon of alternatlve
transportatlon fuels programs. Other lessons Include:
* Declslons on alternatlve transportatlon fuels must be seen In the long-term perspective.
* Domestlc production of a1 ternative fuels cannot be
entlrely dependent on uncertain and unpredlctable oil
prlces. ( I t may be better and safer to spend two dollars In
local currency at home than one dollar on Imports, glven
heavy lndebtness and soft currency.)
* Consumers respond most favorably to: economic incentives
which mltigate cost of motor vehicle ownership and
operation; consistent and farslghted policies; and the
initial reputation of vehicles powered by alternative fuels,
(The caotlc initial introduction of neat ethanol englnes
into the market and their later withdrawal, shown in Fig, 1,
illustrate the point).
Stakeholders' consensus Is crltlcal for the stable
implementation of an alternative fuels program. However,
consensus achieved at program launch must be checked and
renegotiated periodically throughout the 1ffe of the
program.
u Alr quality can be improved and a total recycle of carbon
dioxide emissions can be achieved.
Under current and foreseeable econornlc supply conditions,
very few countries in the world should actually embark on an
ethanol fuels program. The optimal candidates are countries
with biomass surpluses and energy deflcits that are
land-locked and wlthout their own oil resources. Examples
are: Paraguay and ~arthern ArgentIna In South America;
Kenya, Uganda, Zimbabwe, Malawi, Zambia in Afrlca. This
scenario offers a more viable economic prospect for the
penetration ethanol In the transportation fuel market. In
the USA and Europe, the ernerglng market for oxygenated
1900
gas01 lnes, bul l t on the demand for a better envlronment and
for octane boosters, provides an opportunlty for ethanol to
compete with other oxygenates, such as methanol and methyl
ter-butyl ether - MTBE. The total carbon dioxide recycle
feature of biomass-derlved ethanol adds a new dlmenslon to
the future prospect of thls non-fossll transportatlon fuel.
Acknowledgements
This artlcle draws heavlly from Reference 7 below.
The authors wlsh to thank Arnaldo Vlelra de Carvalho Jr, of
Promon, Rlo de Janelro; Alberto Mortara of Sao Paulo; Julio
Borges of Copersucar, Sao Paulo; Lulz Celso de Castro Leal
of Dyna, Rio de Janeiro, for providing most of the data
contained in the tables and In Figure 1, and to Ake
Brandberg, of Eco-Traffic, Stockholm, for his corments on an
earller draft. The detailed Information on the air quallty
impact of ethanol fuels is due to Alfred Szwarc of CETESB,
Sao Pau 1 o.
References
1 . Polltlca de Combustlvels Llquldos Automotlvos
("Automotive Llquld Fuels Policyw>. CNE - Brazlllan Natlonal - Energy Council, Brasilia, Brazil (1988).
2. Sperllng, Danlel. 'BrazlI, ,Ethanol and the Process of
System Change," Energy 12, no. f ( 1 9 8 7 ) : 11-23.
3, Trindade, Serglo C- and Vieira de Carvalho, Jr., Arnaldo.
"Transportation Fuels Policy Issues and Options: The Case of
Ethanol Fuels In Brazilu In Sperling, Daniel, ed.,
Alternative Transportation Fuels - An Environmental and
Energy Solution, Quorum, New York, NY, USA (1989): 163-186.
4. Trl ndade, Serglo C. Oxygenated Transport Llquld Fuels:
The Total System, World Energy Councll Monograph, London, UK
< 1989) .
5. Trlndade, Serglo C, Brazlllan Alcohol Fuels: An
International Multfsponsored Program, Rlo de Janelro, Brazll
(1984) .
6. Brazil ian Automotive Industry Statistical Yearbook,
1957-1991. ANFAVEA, Sao Paulo <1992>.
7. Trlndade, Serglo C. MNonfossil Transportation Fuels: The
Brazlllan Sugar Cane Ethanol Experience1' in Tester,
Jefferson, et. a1 . , eds. Energy and the Environment in the
21st. Century, MIT Press, Carnbrldge, HA (1991): 277-284,
8. Yang, V . , S. C, Trindade, and J.R. Castello Branco. "How
Brasil Grows Motor Fuel," CHEMTECH 11, no. 3 (1981):
168-172.
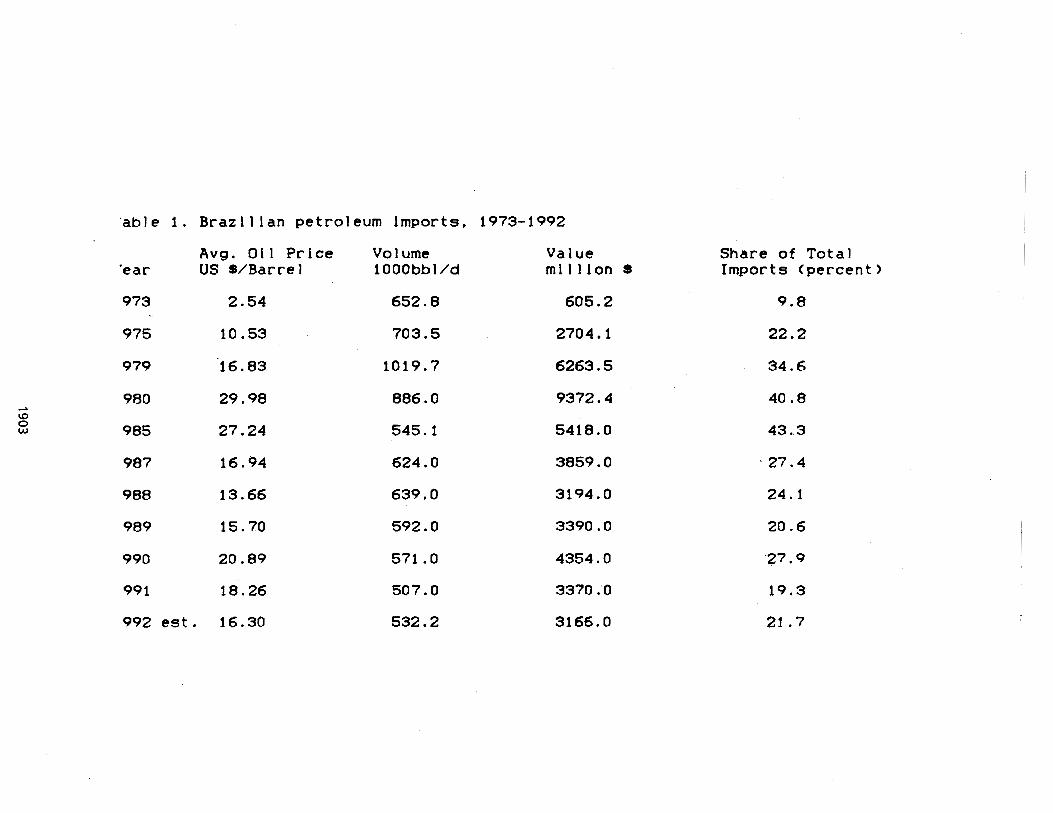
'able 1 . Brazilian petroleum imports, 1973-1992
Avg. Oil Price Vo 1 ume Va 1 ue 'ear US WBarrel 1000bbI/d million
979
980
985
987
988
989
990
991
992 est.
Share of Total Imports (percent)
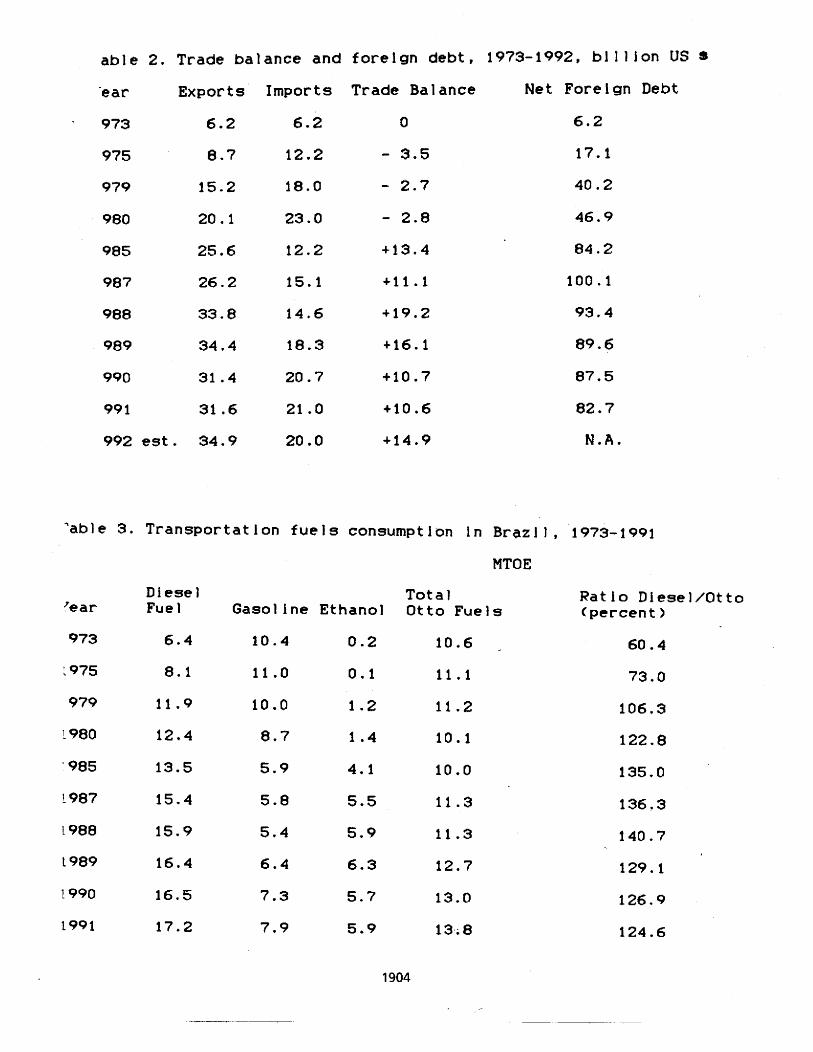
able 2 . Trade balance and forelgn debt, 1973-1992. bllllon US s
'ear Exports Imports Trade Balance Net Forelgn Debt
9 3 . 4
89.6
87 .5
82.7
N . A .
'able 3. Transportat Ion fuels consumption in Brqzl 1 , 1973-1991
MTOE
Diesel Total Ratio Diesel/Otto 'ear Fue l Gasol ine Ethanol Otto Fuels (percent)
973 6.4 10.4 0 . 2 10 .6 60 .4
; 975 8 .1 11 .O 0 . 1 11 .1 73,O
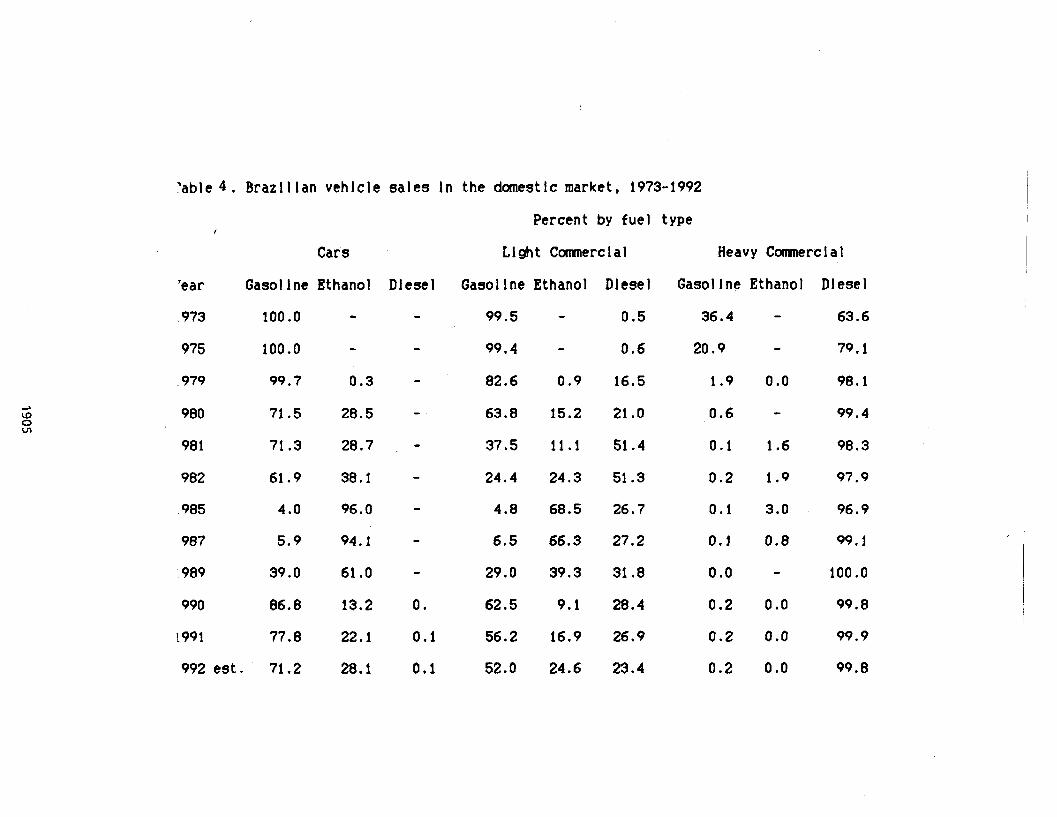
'able 4. Brazll Ian vehlcle sales In the dmestlc market, 1973-1992
'ear
.973
975
979
980
98 1
982
985
Cars
Gasollne Ethanol Dlesel
100 .o - -
100.0 - - 99.7 0.3 - 71.5 28.5 - 71.3 28.7 - 61.9 38.1 - 4.0 96.0 -
Percent by fuel type
Llght Comnercial Heavy Comnercial
Gasollne Ethanol Dlesel Gasollne Ethanol Dlesel
99.5 - 0.5 36.4 - 63.6
99.4 - 0.6 20.9 - 79.1
82.6 0.9 16.5 1.9 0.0 98.1
63.8 15.2 21.0 0.6 - 99.4
37.5 1 1 .I 51.4 0.1 1.6 98.3
24.4 24.3 51.3 0.2 1.9 97.9
4.8 68.5 26.7 0.1 3.0 96.9
987 5.9 94.1 - 6.5 66.3 27.2 0.1 0.8 99.1
989 39.0 61 .O - 29.0 39.3 31.8 0 .O - 100 .O
990 86.8 13.2 0. 62.5 9.1 28.4 0.2 0.0 99.8
1991 77.8 22.1 0.1 56.2 16.9 26.9 0.2 0.0 99.9
992 est . 71.2 28.1 0.1 52.0 24.6 23.4 0.2 0.0 99.8
BIOMASS AS FEEDSTOCK FOR CHEMICALS AND ENERGY ON THE THRESHOLD OF THE 21st. CENTURY,
Roberto E. Cunningham Ibcro American Prognni of Science & Technology for Development
and Arscntinc Petroleum Institute
Maipu 645, 3rd. floor ( 1006) Bucnos Aires, Argentina
ABSTRACT -
A historical background is first givcn in which the role of biomass is described in relation to its competition with fossil biomass for the production of cbcmicals and cnergy.
Occurc~~ccs of rcscrvcs fro111 both sourccs are tlia~ compared.
Petrochemical and bio~nnss routcs are tl1c11 nnalyzcd in tcrti~s of thcir relative competitive advantages.
The olcocl~etnical and biotcchnology cnscs are analyzed in more dctnil as exa111ples of biomass utilization.
Latin Amcricnn eunmplcs of ind~istrial ~iinn~~fncturing of bio~ilass derived chemicals are then provided. Alcocl~cmicnls are nnnlyzcd it1 dctnil as \vcll ns essential oils and other chemicals.
Finally, rcfcrenccs arc: mndc to rcgional Latiti Anierican initiatives regarding biomass and the objectives, organization and nntilrc of thc inicint ive arc prescntcd.

INTRODUCTION
Historically speaking. biomass has represented the main source of fuels and chemicals for man. Wood, leather, bones, essential oils, fats and carbobdrates, among others, are examples of the biomass contribution.
The Twentieth Ccntury represents tlie arrival of fossil biomass as a source of massive amounts of new fhels and chemicals.
Coal first, and then cnrde oil and natural gas started to replace biomass in a steadily progressive fashion.
After the '30s, pctroclie~iiistry (developed by Americans) turned to replace carbochemistry (developed by Germans) in the chemicai industry scenario. Advantages in the access and transportation of massive volumes of feedstocks as well as process econoniics were the main reasons for replacement of bio~iiass by fossil coal first, and of fossil coal by cn~dc oil aftenvards.
As a consequence, new, previously unknown materials, appeared and other ones (which had been mere laboratory curiosities) started to be produced at industrial scale. Needless to say, this relegated the role played by biomass.
However, the oil crisis of the '70s led again to co~isidcr biomass as an alternative source of fhels and chemicals, but this time facing tlie challc~igc of hundreds of cheniicals and niaterials being produced at industrial scale, in tlie scope of a world consuming energy in a continuously increasing demand.
No significant changes in tlic role played by biomass, ho\vevcr, arc seen in the '90s.
This is mainly due to two reasons: crude oil price did not increase as forecasted, and the future role of bioniass was misinterpreted in some cases.
To day, at thc threshold of 2 1st. century, the question regarding biomass still remains open.
In that sense, it is believed that the correct approach to the problem is to establish the reciprocal co~iipetitivc advantages of oil and biomass.
Should an answer to this point be found. it would be possible to set solid grounds for future developments and applications regarding biomass.
So far, the current analysis will procccd as follows.
+ Feedstocks occurrence will be first analyscd. + Process routes and products involvcd. in tcr~i~s of the competition between themselves, will then
be considered.
Afier that, some Latin American examples of industrial applications of biomass, as well as regional initiatives in the field. \vill be provided.
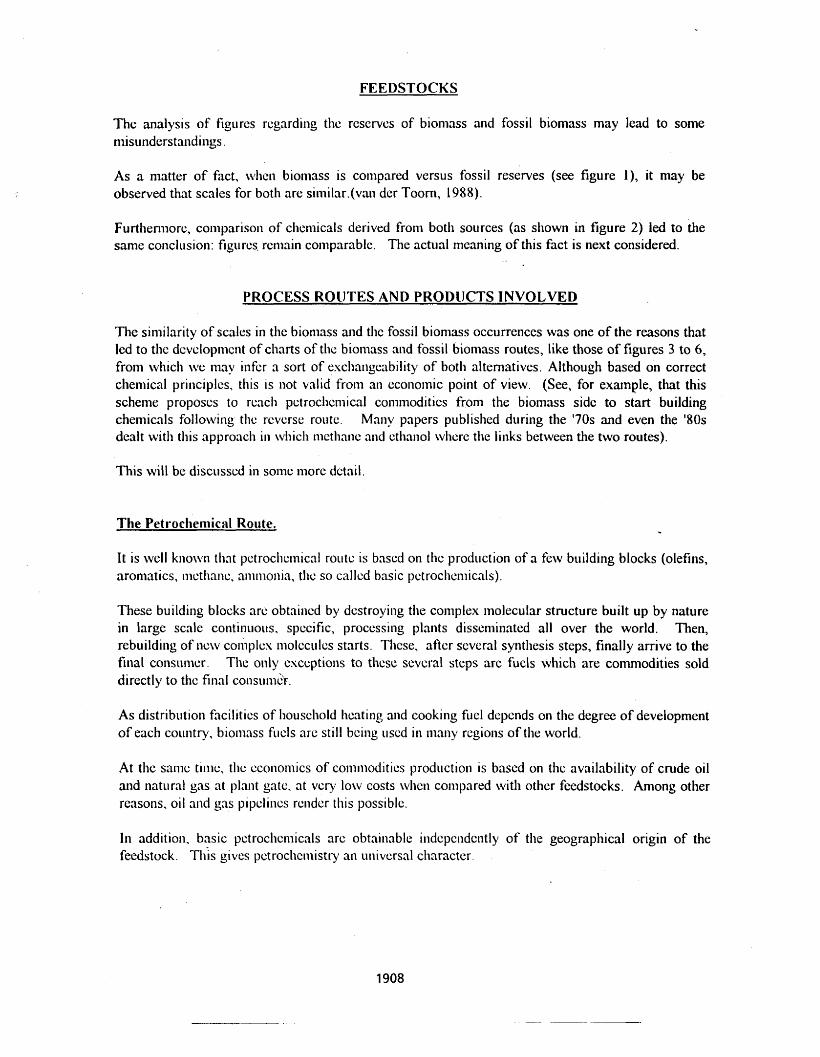
FEEDSTOCKS
The analysis of figures rcgarding the rcscrvcs of biomass and fossil biomass may lead to some nlisunderstandings.
As a matter of fact, when bionlass is compared versus fossil reserves (see figure I ) , it may be observed that scales for both are similar.(van der Toorn, 1988).
Furthennore, con~parison of chemicals derived from both sources (as shown in figure 2) led to the same conclusion: figurcs, rcli~ain compnrablc. The actual meaning of this fact is next considered.
PROCESS ROlJTES AND PRODUCTS INVOLVED
The similarity of scales in tlic biomass and tlic fossil biomass occurrences was one of the reasons that led to the dcvclopmcnt of charts of the biolnass and fossil biomass routes, like those of figures 3 to 6, from which we may infer n sort of escllangenbility of both alternatives. Although based on correct chemical principles, this is not valid fro111 an cconomic point of view. (See, for example, that this scheme proposes to reach pctroclicmical con~modities from the biomass side to start building chemicals folloiving tlic rcvcrse route. Many papers published during the '70s and even the '80s dealt with this approach in whicll methanc and cthnnol whcre the links between the two routes).
This will be discilsscd in soiilc nlore dctail.
The Pet~.ochemical Route.
It is well known t1iat yetroclic~nical routc is bnscd on the production of a few building blocks (olefins, aromatics, nlctha~ic, alntiio~lia, tlic so callcd basic pctrochcn~icals).
These building blocks arc obtnillcd by destroying the complex molecular structure built up by nature in large scale continuoits, specific, processing plants disseminated a11 over the world. Then, rebuilding of ncw coiiiplcs molcculcs starts. Thcse, aftcr scveral synthesis steps, finally arrive to the final consumer. Thc oillp csccptioils to thcsc sevcrnl steps are fuels which are commodities sold directly to thc final cons~lmi'~.
As distribution facilities of household hcnting and cooking fuel depends on the degree of development of each co~rntry, biomass filcls arc still bcing irscd in many regiolls of the world.
At the sanlc time, thc cconomics of commodities production is bnscd on the availability of crude oil arid natural gas at plant gatc, at vcry lo\v costs whcn corn pared with other feedstocks. Among other reasons, oil arid gas pipclillcs rc~idcr this possible.
In addition, basic yctroclicmicals arc obtainable indcpcndct~tly of the geographical origin of the feedstock. TI& givcs pctrochcmistry an universal cl~nracter.
The Biomass Route
Regarding feedstocks, two main diffcrcnces bcco~iic evident when oil (or natural gas) is compared to biomass: 1) biomass diversity 2) tlie higher costs involved in collecting and transporting biomass. This makes tlie replacement of tlie basic pctroclicmicals production for tlie biomass route to appear unpractical, ilnlcss vcry special conditions are nict (*).
So far, it might be asked \\3ictlier the routc through the chemical coniniodities is unavoidable in order to reach tlic final chemicals. The ans\ver is obviously negative, provided market can be satisfied in tenis of product perfor~iiancc, quality, volume and price.
This is, prcciscly, the cliallcnge for biomass.
In principle, tlicrc are two \\lays of meeting this goal: 1) to find low cost, intermediate chemicals from biomass and transfonii them by co~ivc~itional organic sqmtliesis steps. This is the case of the so called oleochemical routc shown in figure 7 (frequently uscd by Prof. H.A. Wittcoff in his lectures), and, 2) to find a new routc to obtain final clicmicals. This is tlie case of biotcchnology.
We ,observe that in all tlicsc csaniplcs. tlie molecular conlplesity developed by nature is respected. Naniely, we take advantage of this complesity by applying it for its perforniance (like in a dye, a coating, a flavour or n fragrance) or by cmploying tlie niolecule as an unavoidable synthesis intermediate.
In other \\fords. biomass dcmonstratcs to be competitive when it provides the uniqueness of a niolccular structure to start some application wit11 it.
In turn, biotechnology lias nddcd a lie\\ routc capable of employing biomass as a raw material for low volume production of Ii~gli priced coliiplcs molcculcs with process yields inipossible to achieve by other means.
In effect, biotcclinolog\~ lias niadc possible that ~iiolcculcs already produced by living organisms at low concentratio~is and rates bc manubctured industrially (like interpheron or human insulin) at the same time that it lias developed new molcculcs (like biopolqmers). Besides, new processes and applicatio~is are opal thanks to tlic production of enzymes. Gcnctic engineering plays an important role in all tlicsc issucs. @
These two options arc nest cotisidcrcd in more dctail
The Oleochemical Ci~se
Feedstocks to produce surfnctants for personal care products and detergents are nioving to vegetable oils due to cnvironnicntnl ~ssucs.(Dn\vson, 1990).
(*) OIIC of tllcsc csccl)lio11;11 C;ISCS is ( I I C ill~prcssi\~c ~ C V C ~ O ~ I I I C I I I of alcocl~et~~ic;~ls in Brazil, as a conscqucncc of rhc clh;~nol progr;llll k l ~ o ~ v n ;IS PROALCOOL. A Inore dc1;lilcd rcfercllce lo i t will be made in the sccoud part of this p;lpcr.
At the same time it is necessary to reduce tlie volatile organic coniponent emrnissions. This leads to an increasing demand for hidl perfoniinnce surfactants in water-based coating inks and adhesives.(Dansic. 1 99 1 ).
The naturally derived ingredients offer low- or non- irritant (preservative-free) products, which are also biodegmdablc and lack of impurities.
Most of the capacity growth is expected to be for natural alcohol, especially in developing countries. Figure 8 is a good examy lc of this situation.
It is known (scc figure 7 for the olcoc1~cniicals tree) that palm oil, palm kernel oil, and coconut oil are the main sourccs of natural fatty alcohols.
In that sense, plantations growing 011 lands forliicrly occrlpied by rain forests represent fbture expansion.
Next section will show t11c cstcl~t up to \i11iich biotccl~liology and oleoclie~iiicals are related.
Regarding other applications, the European Associntiou of Fatty Acid Producing Companies (APAG) understands that it will be possiblc to rcplnce up to 50 % of all petrochemical derived lubricants for products based on olcocl~cmicals . (Eisbcrg, 1 990).
In that resycct, n nc\v niclic is crambc whicli is a new sollrce (other than rapessed) for erucic acid. Erucic oils can bc c~nploycd ns lubricants i l l continuous stccl casting, in forniulated lubricants and in the nianufactrlrc of nibbcr additi\lcs.(Santos. 1992).
Finally, in thc ficld of frlcls. ~ ~ ~ u i t i o n may be made of biodiescl fuel, created by reacting crude vegetable oil and nicthnnol in thc prcserice of a catalyst to picld methyl ester.(Humer, 1992).
The Biotechl~oloey Cilse
This new rorltc mnm~facturcs products wl~ich supply scctors like pharmaceuticals, health care products. chcmicnls. ngricul tit re. food atid ctlcrgy .
Agriculture and food arc tllc ~iiorc rclntcd to our concer~i.
By using b io~~~nss as fccdstock. the mnrkct makes biotcchnology to manufacture products emphasizing quality rather quantity.(OECD, 1989). Food is a typical csaniple of this trend. Bcttcr tastc and aroma or fewer chemical residues from agrochcmicnls reprcsclit this clial lcngc.
Another chnllcnyc lics on the source itself. Gcnctic engineering plays an important role in that respect. A good csati~plc is tllc m vilro cloning and subscqucnt plnntillg of new plantations of palm species This llinkcs possiblc considcrnblc higher prod~~ctivity and easier harvesting.
Finally, we may mcntion the manufacture of biodegradable polymers such as pullulane, biopol or bacterial cellulosc.(Rosc, 1992). (Tcclinical Insights, 1992).
The Biomass vs The Crude Oil Route
In the nest fi~ture, tlie scenario, for these two alteniatives will be dominated by two main driving forces:
+ Cn~de oil global prospccts (see tablc I). + Environmental issues.
Since a trade-off bctwccn tlicsc two driving forces exists, it is to be expected that:
+ In the arca of cncrgy production (\\/here massive production of biomass fuels is not economic), efforts will be devoted to dcvclop clean non-convcntionaI energy sources.
+ In the arca of clicmicals production (wlicre biomass is favoi~red by the green wave), efforts will be devoted to find new biomass market niclics.
However, currcnt crude oil prospccts arc quite different from those apocalyptic predictions dominating the '70s. For that reason, the horizon for oil replacement is still moving steadily forward. So, figure 9 secnis to be liiore realistic than figures 3 to 6.
SOME LATIN AMERICAN EXAMPLES
Basic Chemicals, Ethanol and Alcochemistry
Figures 2 and 3 show that chcmical transformation of carbohydrates may lead to produce basic cheniicals at a volume comparablc to that one of petrochemistry.
This is tlie casc of ethanol
It is well known tliat studies on bioctlianol production were promoted during the '70s due to oil crisis. The main conclusion of tlicsc studies is tliat proccss economics conipetitiveness strongly depend on feedstock pricc.
In CYTED's (Ibcro A~iicrica~i Program for Science and Tcclinology Development) Subprogram "Biomass as Feedstock for Chemicals and Energy", a project was developed for ethanol production from lignoccllulosic materials. Tlic project involved the analysis of production costs from various sources. From tlie analysis. it \iras concludcd that, unless tlie raw material be a by-product or a waste it is diff~cult to produce cthnnol \\?it11 competitive intcniational costs.(Cunningham, 1990).
The only cxamplc of massivc succcss for an etlianol venturc is Brazil, where ethyl alcohol produced from sugar cane is used as a substit\~tc for gnsolinc, as well as a chcmical feedstock.
The importance of tbc Brazilian ethanol program can be u~idcrstood when we observe that from 1934 to 1976 Brazil produccd 14,025,123 1113 of ethanol (yearly average 326,166 m3) from which 5,273,179 were consumcd as fi~el. During the following seven years Brazil manufactured 24,968,574 n13 of ctha~~ol (ycnrly average 122,632 1113, eleven times more than the average of the preceding 43 yearsH.Currcnt prodoction amoonts to 13 million rn3/year.
Meanwhile, thc alcochcmical industry in Brazil dates back to early '20s when Rhodia began to produce ethylchloride, acetic aldehyde, acetic acid and ctliyl ether.
In 1958 and 1959 two ethylcnu i~nits. besides ~111its for butyl acetate, ethyl acetate, acetic aldehyde, vinyl acetate a id chloral, started operations.
With PROALCOOL implcmentntion in 1975 this sitnation changed dramatically as wn be observed froni table 2 and figii res 10 and I 1 . ( AB IQUI M, 1 992).
It is i~nportant to remind that, for the most part, this has been possible thanks to governmental incentives.
In Arge~~ti~m. Rliodia was nlso the pioncer in alcochcmical production. In this case ethanol is produccd from molnsscs from siigar rcfining Thc low cost of raw material leads to competitive production costs though prodi~ction volu~ncs are much lowver tha~i those of Bnzil (see table 3).
Intermediate and Final Chemicnls
Biolnass geographical diversity has bccn taken as a compctitive advantage in some Latin American areas. This is thc cnsc. for cramplc. for tbc succcssfill production of some essential oils and oleoresins as shown in tablc 4.(UNCTAD/GAIT, 1986) (CYTED, 1992 a).
Brazil is one of thc \vorld's lcading produccrs and exporters of essential oils and natural aromatic con~pounds. As an csportcr it ranks fifth in ternls of value after U.S.A., France, China and United Kingdoni and before Indonesia.
Brazil's owvn co~~sumption of tliese products is considerable since it supplies various domestic manufacturing industries. including a ircll-dcvelopcd aromatic chetilicals industry which transforms the cn~de materials into morc co~nplcs products by extraction or synthesis for use as componenis i n perfi~mcry and food flavouritlg.
The dyna~nism of Brazilia~i produccrs is shown by tl~c scale of CLI ttivation of certain aromatic plants, the modernity and cficicncy of thc lnrgc processing units and the active presence of most of the major intcn~ntional con~pan~cs.
Mexico is nlso n 111njor producer of csscntinl oils. mainly exporting lime oil.
Other principal produccrs in Latin Amcricn arc Haiti. Paraguay, Pen1 and Argentina.
In these cases, tlic complcs liiolectllcs built up by nature are sold directly (after extraction and refining) without fiirtlicr clicmical transfoniiations. For tlie cases in which transforniation is also involved, tables 5 and 6 show Brazilian biomass production of intermediate and final clien~icals.(ABIQUIM, 1992).
REGIONAL LATIN AMERICAN INlClATlVES REGARDING BIOMASS
The lbero American Proo,r;~~ii of Scierice and Tecliliology for Development (CYTED)
This Program was cstabllslicd 111 I984 tliroilgh a Foillidatlon Agreelnent slgned by Argentina, Bollvla, Brazll, Colonibla, Costa Rlca, Cube, Clillc, Ecuador, El Salvador, Guatemala, Honduras, Mexlco, N~caragua, Panama. Paraguay, Peril, Portugal, Repilbllca Domlnlcana, Spaln, Uruguay and Venezuela (CYTED, 1992 b)
There arc, besides. three Institutional Observers: CEPAL, UNESCO and OEA
Its General Secretariat scats in Madrid. The Program is organized on the basis of several Subprograms (like Biotlicclinology. Catalysis and Adsorbcnts, New Sources of Energy Conservation,
.Materials Tcclinology, ctc.) ariiong \\~liicli tlicrc is Biomass as Feedstock for Chemicals and Energy. Each Subprogram is directed by an International Coordinator and may perfomi three different activities: Precompctitivc R & D Pro.jccts, Rcscarchcrs Networks and Innovation P-rojccts.
Precompctitivc Projects arc pcrfor~iicd by R & D centres of several countries supcwised by a Project Manager. They have to ncliicvc ;I result \\;it11 sonic possibilitics of transfcrcncc to the industry after 3 to 5 years.
Researchers Nct\\/orks link \\.orking groups in a given field in order to enhance communications and training and arc supcrviscd by a Coordinator.
Finally, Innovation Pro.jccts (called Ibcrockn) rcquirc tlic participation of industrial companies together with R & D groilps.
Currently, the Biomass subprogram has thrcc Prccompctitivc Projects ("Upgrading of Lignins", "Developing a New Tccli1io10gy for Vitnniili D2I1, and "Manufacture of Propionic Acid from Lignocellulosic Materials"). plus tlircc Nct\\lorks ("PhytochcmicnIs Industrial Applications", "Utilization of Agriculti~ral Wastes" and "Rational Esploitation of Forest Resources").
One of the Prccompctit~\lc Prqjccts has bccn colnplctcd. I t dcalt \\lit11 "Ethanol Production from Lignoccllulosic Matcrials". The liiodcl for tlic ethanol production plant was exhibited in tlie Expo- Scvilla during tlic celebration of the fifth centennial of the discovery of the Americas.
Executive Secretariat of Andl-is Bello Apreement (SECAB)
This is an Agrecliicnt signed among Bolivia, Colombia, Chile, Ecuador, Panama, Peru, Spain and Venezuela giving support to activities in the fields of eductation, science and culture.
A principal area in sc ic~~cc is that of vcgetablc resources, of which catalogs and nlonographies had becn published on promising vcgctablc spccics in thc Andean Region.
The Executive Sccrctnrint opcratcs in Bogota.
Latin American Associatio~l of Pl~ytoc11emist1-y
This association nsscnibles Latin Atiicr~cnn rcscarcllcrs. Its Secretariat operates in Montevideo. It publishes a Ncwslcttcr joil~tly \\lit11 CYTED.
ABIQUIM. 1992. (;111cr c k l lnch/.s~r.ltr H ~ ( I . Y ~ / L ' I I ^ I I .
Cunninghan~ R. E. 199 1 . Ohlcnc/On ckc /<lano/ cr /lot-irr de Mntcriolcs Lignocelul6.szcos. Estudio Ticnico t;Contit?llco ( ' ~ I ~ I L ' I - C I C I I . CYTED.
CYTED (a). 1992. l'hj~/ochcmictrl.v 1nclii.strinl A/?j?/~cntion.s Network Mcctrng (Asuncion).
CYTED (b). 1992. Nr~~trrnlczcr. Or,qcrnizncrOn y (;c.siicin ckcl I),-ogromn ('YTEL,.
Dansie J . I 9 I . "Su rfnctarlts Gcnrcd to Grccn Challenge". 1'crfOrrnnncc (.'hcmiculs, August/Septcn~bcr: 3 8-42.
Dawson J . I 990. "Sector Activity Raises the Froth on Su rfnctants". Pcrfiwmonce C'hrrnicals, August/Scptcnibcr: I 8-22.
Eisberg N . 1990. "Olcochc~nicnls Looscn Tics wit11 Agricult~lrc". liltropeon (.'hemica1 News. 17/24 December: 23.
Hurner C. 1992. "Vcgct:~blc Oils Play Role in Altcrlintivc Fuels Industry". (,'hcmicol Morkcting Rcportcbr. April 6 : 5- 1 1 .
OECD. I 989. H~o~cchnolo,q\~ l.'conot~~ic rmd Wider 1n1poci.v. Paris: 0 E C D Pu blications.
Rose J . 1992. "Nc\v Mntcl-inls arc Cropping Up". ('hctni.s/ry (i: Indllstry, April 20: 284-285.
Technical Insights. 1902. 'l'li,cn~,v I~ivc lJr)~cr,q~n,q 'l'cchno1ogic.s. Technical Iiisi~hts Inc.
UNCTA DIG ATT. I 9 86. I:.\.scn/rrrl Oils ond 0leorcsin.s: A :Y/rrdv q#'.S~llcctcd r)rodrrccrs and Major Morkc,.~, Il~tcrrlnt ional Trndc Cent rc.
van dcr Toorn B. I O X X . S / r l l l c l , q ) ,fi)r H~omtrss ('onvcrs~on. Solcctcd Papers, Shcll International Pctrolcunl Coml~n~l!,
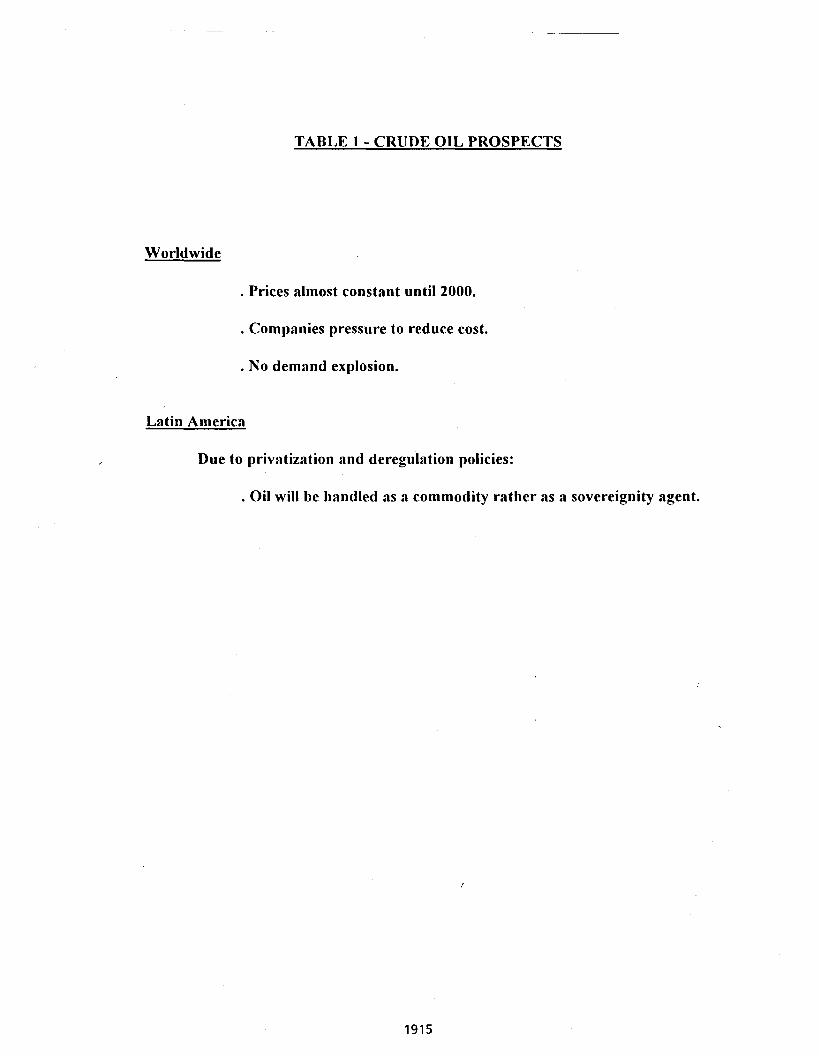
TABLE 1 - CRUDE OIL PROSPECTS
Worldwide
. Prices almost constant until 2000.
. Companies pressure to reduce cost.
. No demand explosion.
Latin America
Due to privatization and deregulation policies:
. Oil will be handled 21s a commodity rather as a sovereignity agent.
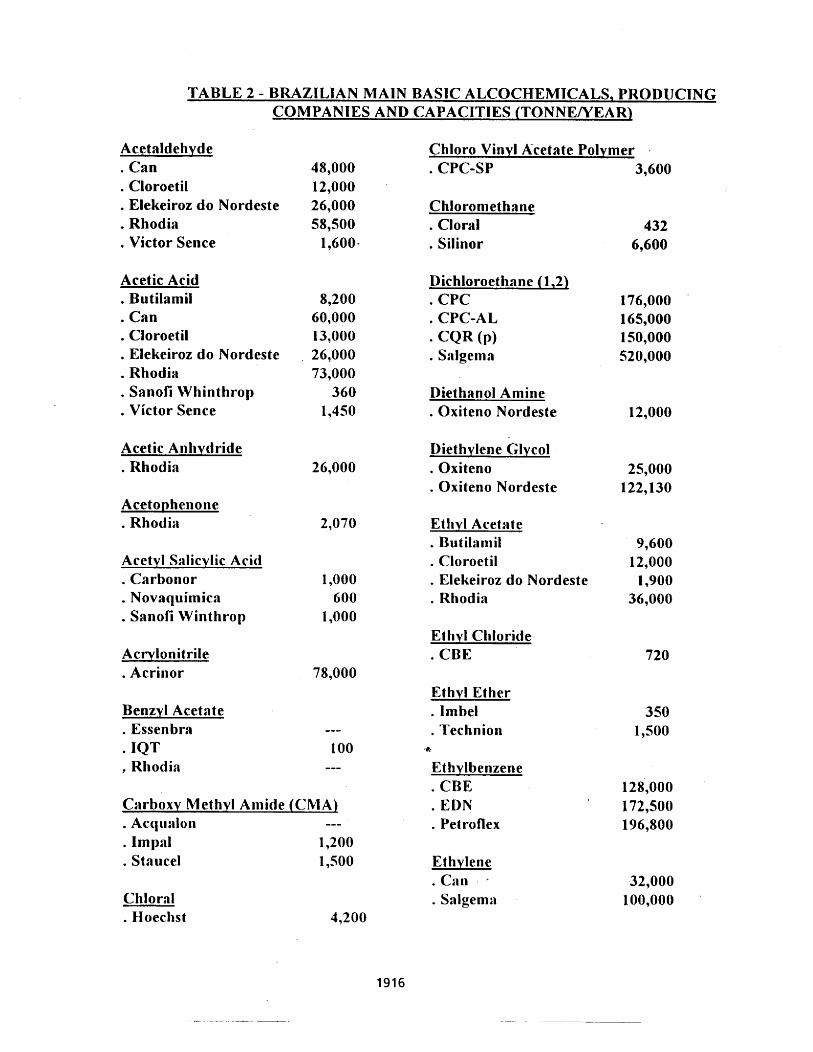
TABLE 2 - BRAZILIAN MAlN BASIC ALCOCHEMICALS, PRODUCING COMPANIES AND CAPACITIES (TONNENEAR)
Acetaldehyde . Can . Cloroetil . Elekeiroz do Nordeste . Rhodia . Victor Sence
Acetic Acid . Butilamil . Can . Cloroetil . Elekeiroz do Nordeste . Rhodia . Sanofi Whinthrop . Victor Sence
Acetic Anllydride . Rhodia 26,000
Acetophenone . Rhodia
Acetyl S:~licylic Acid . Carbonor 1,000 . Novaquimica 600 . Sanofi Winthrop 1,000
Acrylonitrile . Acrinor
Benzyl Acetate . Essenbra . IQT
Rhodia
Chloro Vinyl Acetate Polymer ,
. CPC-SP 3,600
Chloromethane . Cloral 432 . Silinor 6,600
Dichloroet hane (1,2) . CPC 176,000 . CPC-AL 165,000 - CQR (P) 1~0,000 . Salgema 520,000
Diethanol Amiiie . Oxiteno Nordeste 12,000
Diethylene Glycol . Oxiteno 25,000 . Oxiteno Nordeste 122,130
Ethyl Acetate . Butil;imil 9,600 . Cloroetil 12,000 . Elekeiroz do Nordeste 1,900 . Rhodia 36,000
Ethyl Chloride . CBE
Carboxy Methyl A~nide (CMA) . Accjl1i11011 --- . ImpaI 1,200 . Staucel 1,500
Chloral . Hoechst
Ethyl Ether . lmbel 350 . Technio~l 1,500
'* Ethylbenzene . CBE 128,000 . EDN 172,500 . Petroflex 196,800
Ethylene . c:1n , - . Salgemn
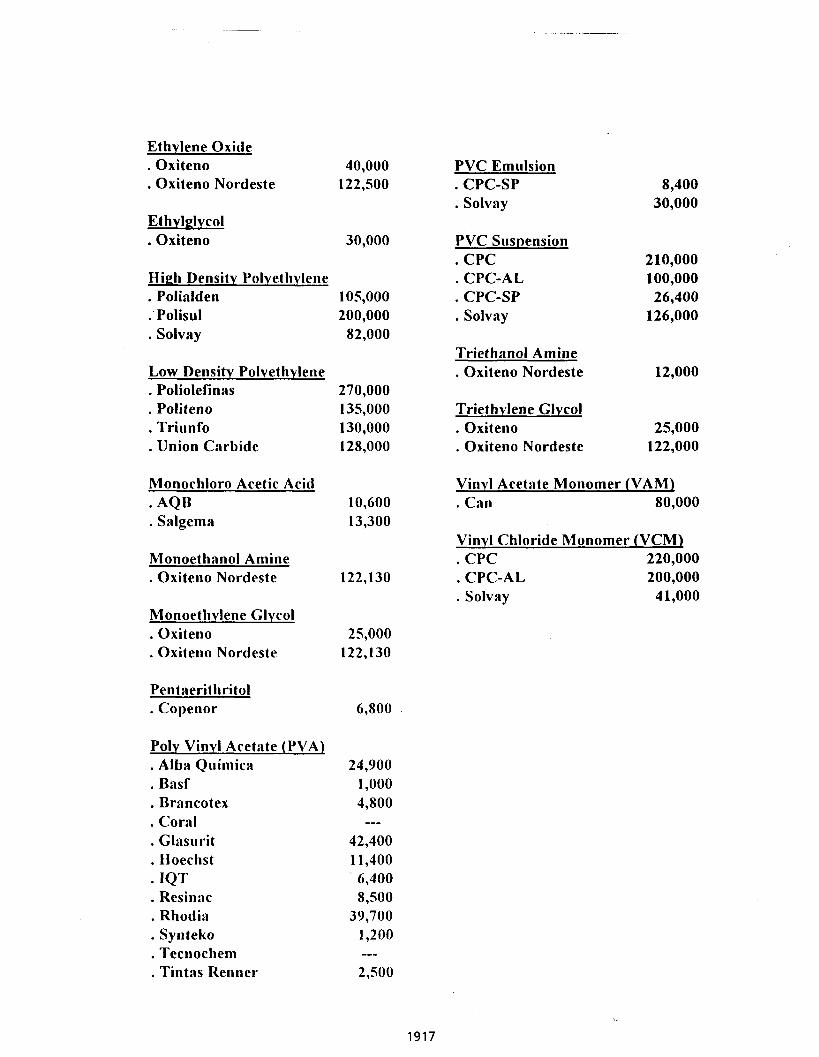
Ethvlene Oxide . Oxiteno 40,000 . Oxiteno Nordeste 122,500
Ethvlelvcol . Oxiteno 30,000
High Densitv Polvetliylene . Polialden 105,000 . Polisul 200,000 . Solvay 82,000
Low Densitv Polvethvleae . Poliolefinas 270,000 . Politeno 135,000 . Triunfo 130,000 . Union Carbide 128,000
Monochloro Acetic Acid . AQB 10,600 . Salgema 13,300
Monoethanol Amine . Oxiteno Nordeste 122,130
Monoetlivlene Glycol . Oxiteno 25,000 . Oxiteno Nordeste 122,130
Pentaerithritol . Copenor
Polv Vinvi Acetate (PVA) . Alba Quiniica . Basf . Brancotex . Coral . Glasurit . Hoechst . IQT . Resinac . Rhodia . Synteko . Tecnochern . Tintas Renner
PVC Eml~lsion . CPC-SP 8,400 . Solvay 30,000
PVC S~~snens ion . CPC .2 10,000 . CPC-AL 100,000 . CPC-SP 26,400 . Solvay 126,000
Triethanol Amine . Oxiteno Nordeste 12,000
Triethylene Glycol . Oxiteno 25,000 . Oxiteno Nordeste 122,000
Vinyl Acetate Monomer (VAM) . Can 80,000
Virivl Chloride Monomer (VCM) . CPC 220,000 . CPC-AL 200,000 . Solvay 4 1,000
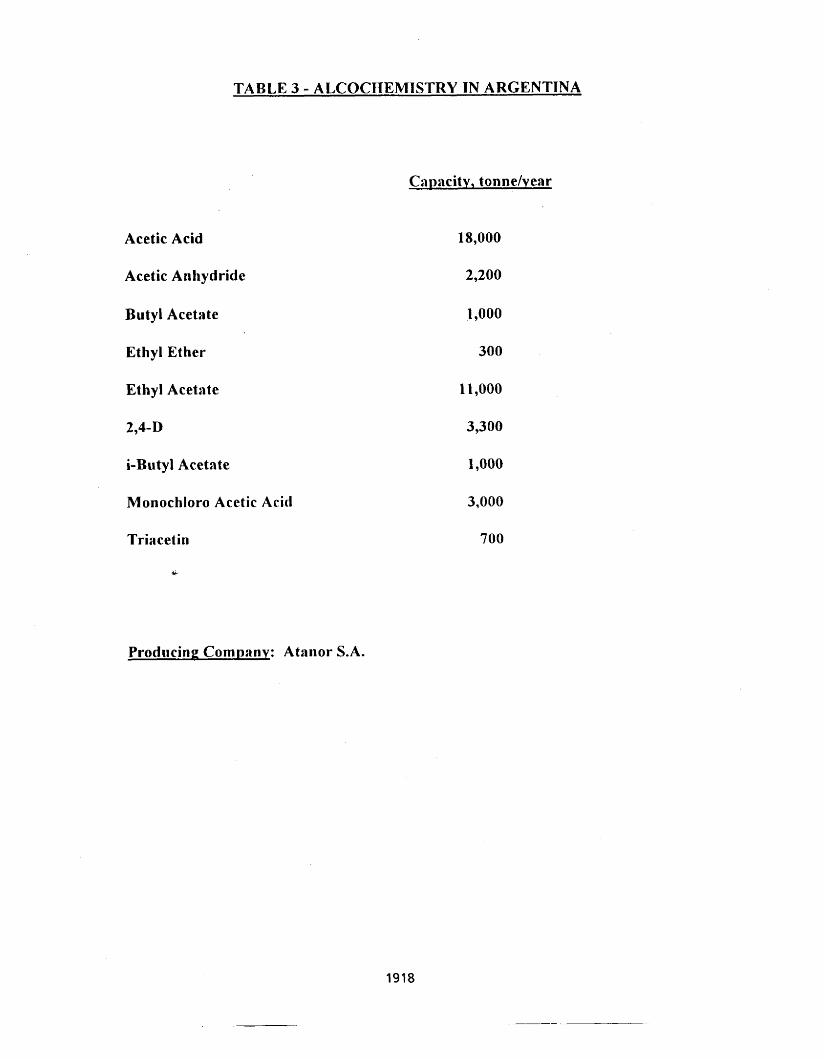
TABLE 3 - ALCOCHEMISTRY IN ARGENTINA
Capacity, tonne/year
Acetic Acid
Acetic Anhydride
Butyl Acetate
Ethyl Ether
Ethyl Acetate
2,4-D
i-Butyl Acetate
Monochloro Acetic Acid
Triacetin
%
Producing Cornllany: Atanor S.A.
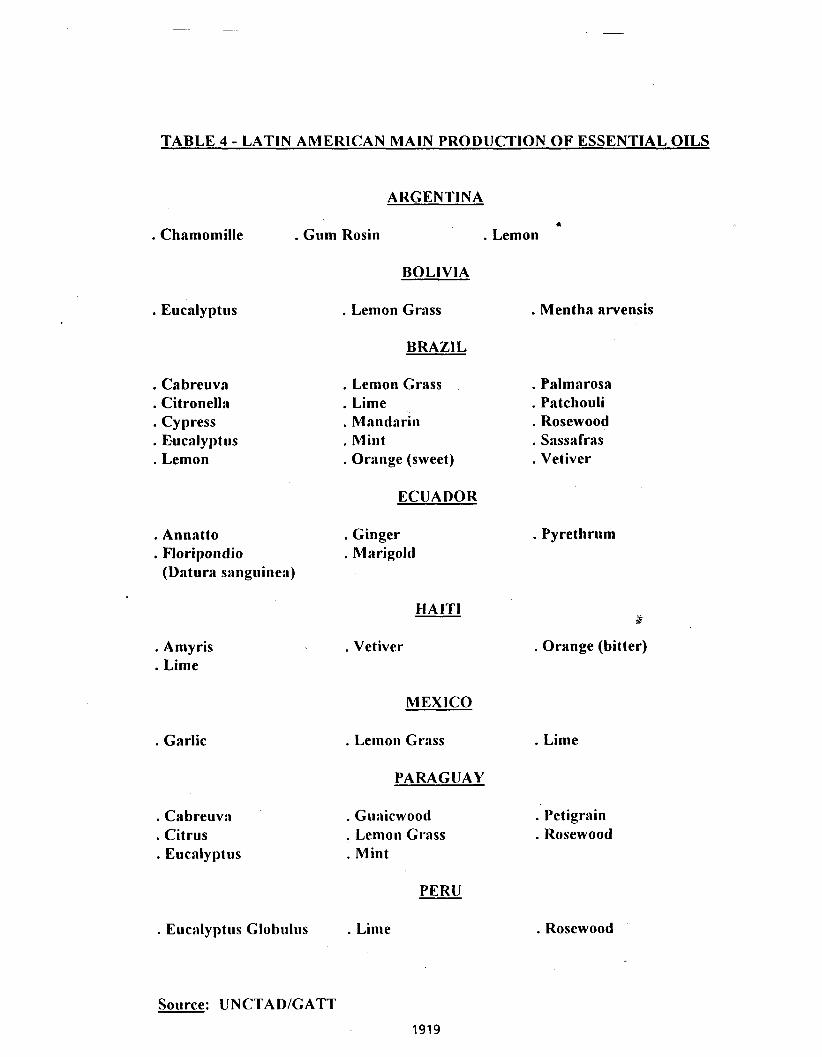
TABLE 4 - LATIN AMERICAN MAIN PRODUCTION O F ESSENTIAL OILS
ARGENTINA
. Chamomille
. Cabreuva
. Citronella
. Cypress
. Eucalyptirs
. Lemon
I . Gum Rosin . Lemon
BOLIVIA
. Lemon Grass
BRAZIL.
. Lemon Grass
. Lime
. Mandarin
. Mint
. Orit~tge (sweet)
ECUADOR
. Annatto . Ginger
. Floripondio . M;trigold (Datura sanguineit)
. Amyris . Vetiver
. Lime
MEXICO
. Garlic . Lemon Gr:tss
. Cabreuv:r
. Citrus
. Eucalyptus
PARAGIJAY
. Gu;ticwood
. Lenlon GI-~ISS
. Mint
PERU
. Mentha arvensis
. Balmarosa
. Patchouli
. Rosewood
. Sassafras
. Vetiver
. Pyrethrum
I
. Orange (bitter)
. Lime
. Petigrain
. Rosewood
. Rosewood
Source: UNCTADIGATT
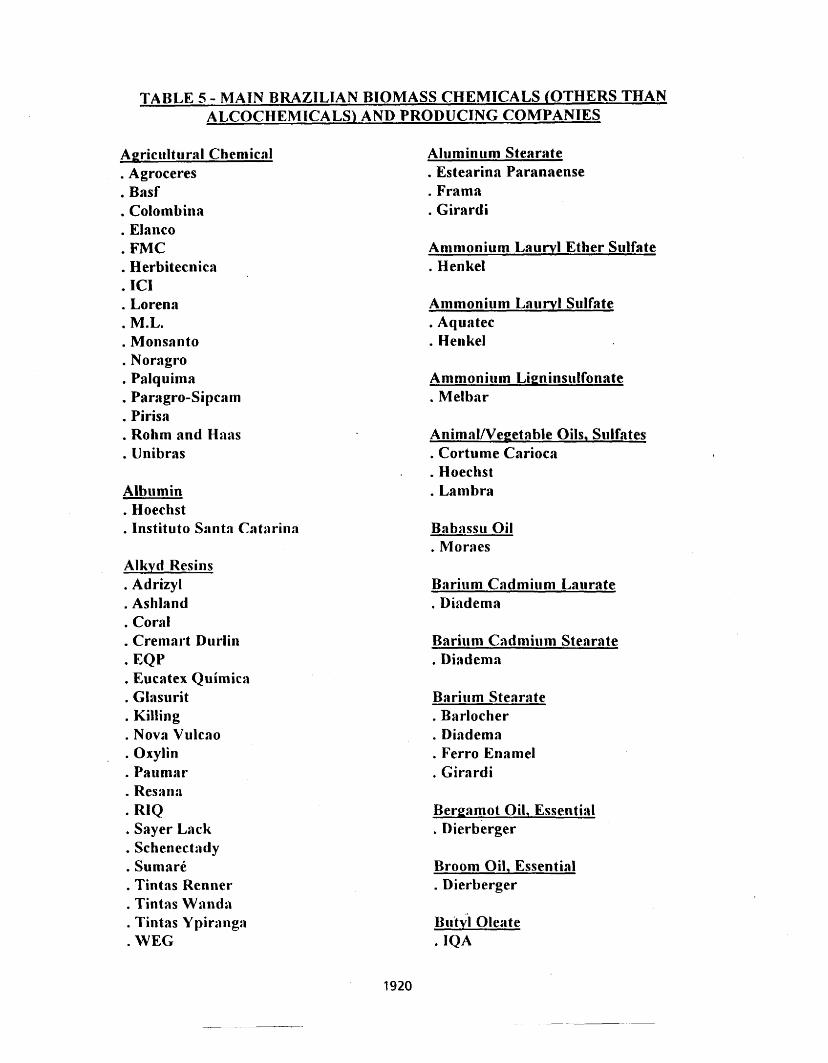
TABLE 5 - MAIN BRAZlLlAN BIOMASS CHEMICALS (OTHERS THAN ALCOCHEMICALS) AND PRODUCING COMPANIES
Agrictrltura-1 Chemical . Agroceres . Basf . Colornbina . Elanco , FMC , Herbitecnica ICI
. Lorena
. M.L.
. Monsanto
. Noragro
. Palquima
. Paragro-Sipcam
. Pirisa
. Rohm and Haas
. Unibras
Albi~min , Hoechst . Institute Santn Catitrina
Alkyd Resins . Adrizyl . Ashland . Coral . Cremart Durlin
EQP Eucatex Quimica
. GIasurit
. KilIing
. Nova VuIcr70
. Oxylin Psumar
. Resana RIQ
. Sayer Lack
. Schenectady Sumari , Tintns Renner . Tintas Wanda . Tintas Ypirarlg:~ . WEG
. Estearina Paranaense
. Frama
. Girardi
Ammonium Lauryl Ether Sulfate . Henkel
Ammonium Lauryl Sulfate . Aquatec . Henkel
. Melbar
Animaf/Vegetable Oils, Sulfates . Cortume Carioca . Hoechst . Lambra
Babassu Oil . Moraes
Barium Cadmium Latrrate . Diadema
Barium Stearate . Barlocher . Diadema . Ferro Enamel . Girardi
Bergamot Oil, Essential . Dierberger
Broom Oil, Essential . Dierberger
~ l r t y l Oleate . IQA
Butyl Stearate . Aquatec . Lavios . Praid
Cadmium Oleate . Barlocher
Cadmium Stearate . Barlocher . Ferro Enamel
Calcium Oleate . Barlocher
Calcium Sodi i~m Stearate . Akzo
Calcium Stearate . Barlocher . Ceralit . Diadema . Estearina . Frama
Castor Oil, Dehydrated . Braswey . Ceralit . Inove . Ricinor
Cellulose Esters, Eml~lsions . Cortume Carioca
Ce\lolose, M icrocrvstal\ine . Blanver
Cellulose, M icropalverized . Staucel
Cellulose, Whitened Linter . Imbel
Citral - . Dierberger
Decyl Stearate . Lavios
Dibutvl Sebacate . Ricinor
Dioctvl Azelate . Sc;~ndiflex
Dioctyl Palmitate . Henkel . Polytechno
Erythromycin Stearate . Cibran
Ethvleneglvcol Monostearate . Aqi~ntec . Herikel . Polytechno . Quiminasa
Eucalvptol . Dierberger
Eoc;tlvr~tus Oils, Essential . Citriodora . Dierberger . Reiyu . Sanrisil . Tres Barras
Eugenol . Givaudan . IFF
F;~tty Acids . An;lst;tcio . Braido . Braswey . Bressiani . Cagigo . Campineira . CS Pesquisa . Estearina . F.C. Lang

Fatty Acids (cont.) . Lambra . Miracema-Nuodex
Fatty Ac'ids, Amides . Akzo
Alfa ENQ
Fattv Acids, Dehydrated . Ricinor
Fatty Acids, Diethanolamides . Aquatec . Henkel . Hoechst . Lambra . Neoquim . Polytecb~~o . Quin1i11:lsil
Fatty Acids, Dielycerides . Aquatec
Fatty Acids, Ethanolaniides . Henkel . Hoechst
Fatty Acids, Ethoxylated . Henkel . Hoectlst . Ultraquimicr
Fatty Acids, Lanolin . Croda
Fatty Acids, Methyl Esters . Braswey . Miracema-Nuodex
Fatty Acids, Mo~~oglycerides . Aquatec . Grinsted
F:~tty Acids, Esters . Hoechst . Lavios
Fatty Alcohols, Ethoxvlated . Aquatec . Henkel . Hoechst . Ultraquimica
Fatty Alcohols, Sulfated . Herga . Hoechst
Fatty Amines . Kenkel . Hoechst
Fatty Amines, Ethoxylated . HenkeI . Hoechst . Ultraquirnica
Fatty Amines, Quaternary . Akzo . Hergn . Hoechst . Polytechno . Quiminasa
Gelatine Edible . Leiner Paulista
Gelatine, Pharmacel~ticaI . Leiner Paulista
Gelntine, Technical . Leiner Paulista
Geraniol . Dierberger . Givaudan . IFF
Fatty Acids, Polydiet hilnolamides . He~ikel
Geranyl Acetate . Dierberger . Divaudan . IFF
Glycerin . Alimonda . Anastacio . Braido . Brasil Maraschin . Bressiani . Cagigo . Campineira . Ceralit . Colgate-Palmolive . Dal'mas . Estearina . F.C. Lang . Fontana . Frigorifico Anglo . Gessy Lever . Girardi . Inove . Matarszzo Oleos . Melyany . Memphis . Moraes . Quimica Ampar . Ricinor . Sambrig . Sanbra . Siqueira, Gurgel . UFE
Glycerin, Distilled . Braswey . Colombina . Inove . Miracema - Nuodex
Glycerin Mo~ioln~lr i~ te . Henkel
Glycerin Monoole~te . Henkel . Polyteclino
Glycerin Monostearate . Aquatec . Concentrados Nacionais . Grindsted . Henkel . Polytechno . Proaroma . Quiminasa
Glycerin Monost.earate . Citrate . Henkel
Glyceril Ricinoleate . Henkel
Hydroxycitronellal . Dierberger
Hydroxystearic Acid . Braswey . Ceralit . Henkel . Inove . Ricinor (p)
H ydroxystearic Methyl . Braswey
lsoei~genol . Givaudan
lsopropyl Lanrate . Henkel
Iso~~ropyl Mvristate . Henkel . Polytechno
lsopropyi Palmitate . Henkel . Polytechno
Isosorbide Dinitrate . IQT
Liver Extract . Billi Lactose
. Polenghi
Lanolin . Valuruguai
Lanolin, Anhvdrorrs (USP) . Croda
Lanolin, Based Products . Croda
Lanolin, Technical . Croda
Lauric Acid . Henkel
Laurvl Thiodipropionate . Nitronor
Lead Stearate . Diadema . Girardi
Lead Steari~te, Dibasic . Diadema
Lead Stear;rte Morrob;~sic . Barlocher . Cerslit . Ferro Enamel
Lemon Oit, Essenti;d . Aripe . Citro-Pectini~ . Citrosuco . Dierberger . Frutropic . IFF . Reunidas Jarzrgu:~
Lemon Terpene Free-Oil, Essenti;~l . Reunidas Jaragua
Lynest renol . Proquimio
Mapnesium Lnurvl Sulffite . Aquatec
Magnesium Stearate . Ceralit . Estearina . Frama . Girardi
Mannitol . Cetec
, Leitd Stearate . Diadema
Mentl~ol . Braswey . Essenbra . Givaudan . Reiyn . Si~nrisil
Menthol, Crystal . Brasfanta
Menth,yl Acetate . Givnudan
Methyl Ricinolate IFF
Mint Oil, Essential . Braswey . Reiyu
Mint Oil, Mentholess . Brashnta
Mint Tri-Rectified Oil, Essential . Brasfanta . Essenbra
Monoethanolamine Laurvl Ether Sulfate . Henkel
Monoethanolan~ine Laurvl Sulfate . Aquatec . Henkel
Monoglycervde Cetyl Palmitate . Henkel . Polytechno
Nitrocell~~lose . Imbel . Nitro Quimica
Oils,Fats, Hydrogenated . Braswey . Cagigo . Ceralit
Oils, Fats, S r ~ l f o n ~ t e d . Alkallis . Baleia . Galquimica . Henkel . Lambra . Machad . Miracema-N uodex . Oxidex . Quimatex
Oleic Acid . Anastacio . Braido . Bressiani . Cagigo . Campineiril . D;~l'mas . Estearin;~ . F.C. L;lng
. Girardi
. Henkel
. Proquima
Orange Oil, Essential . Citro-Pectins . Citrosuco . Frutropic . Givaudan
Palmarosa Oil . Dierberger
Palmitic Acid . Henkel
Palm Kernel Oil . 0p:llma
Palm Oil . 0p:llllla
Pa~min , ~ e f i n e d . Wallerstein
Pine Oil . Encatex Quimica . Harima . Reiyu
Polyethyleneglycol La t~ rv l Ether . Aquatec . Henkel . Hoechst . Illtraquimica
~ol~e thvleneglycol Monooleate . Polytechno
Polyglycerol Esters . Aquatec . Grindsted
Potassir~rn Oleate . Quiminas

Potassium Ric.inolate . CleanIine . Praid
Potassiu~n Stearate . Estearina
Pro~vleneefvcol . Monoestearate . Aquatec . Henkel . Polytechno
Ricinoleic Acid . Braswey . Proquiaor
Rosin - . Art Pinnirs . Ashland . Brasili~c . Breoql~imic:~ . Cocelpa . EQP . Eucatex Quinlica . Harima . Hercules . Klabin . Mehlpar . Resana . Resinas Brasil . Resinas Yser . Roveda . Tintas e Verr~izes "RR" . Ultr:~quimicr . WEG
Rosin Derivatives . EQP . Resitec . Ultraqaimica
Rosin Esters . Adrizyl . Concentl*ados N;~cionais . EQO
. EucatexQuimica
. Hercules
. Killing
. Proaroma
. Resann
. Weg
Rosin Resinate . Adrizyl . Coral . EQP . Harima . Hercules . Mehlpar . Res;lna . RIQ . Sandoz
S;~ssaf'ras Oil, Essential . Br~rno Heidrich . Denecke . Hercilio Koprowski . Ociebrecl~t . Reiyu
Sebacic Acid . Ricir~or
Sodir~m Lairrvl Ether Sulfate . Aquatec . Bo~nbril . Henkel . Hoechst
Sodii~M Lauryl Phosphate . Henkel
Sodium Ligninsulfonate . Melbar
Sodium Ligninsulfonate, Sugarless . Melbar
Sodir~m Stearate . Estenrina . Frimox
Snecial Oils . Alkallis . Chemlub . Dial-Drin . Frimox . Horrlington . Implastec . IQA . Kauri Quimica Fina . Kluber . Lotus . Mobil . Molypart . Nalco . Partington . Petroquimica . Quaker , . Tirreno
Starch, Food Grade . Lorenz . Refinacoes de Milho Brasil
Starch, lndrlstrial Grade . Impal . National . Refinacoes de Milho Brasil
Starch, Modified . National . Refinacoes de Milllo Brasil
Starch Pre-Gelatinizated . Refinacoes de Milho Brasil
Starch Sodium Glvcolate . Blanver
Stearic Acid . Anastacio . Braido . Braswey . Bressiani . Cagigo . Campineira . Ceralit
. Dal'mas
. Estearina
. F.C. Lang
. Girardi
. Henkel
. Sanbra
Stearovl-2-Lactvl Calcium Lactate . Sintesis e Fermentacoes
Stearovl-2-Lactvl Sodium Lactate . Sintesis e Fermentacoes
Stearyl Dimethvl Benzvl Ammonium Chloride . Henkel
Tallow, Fatty Diamine Acetate . Akzo
T;lllow. Hvdrogenated . Campineira . Hen kel
Tallow, Industrial . Braido . Celgol . C S Pesquisa . Dal'mas
Tangerine Oil, Essential . Aripe . Citrosuco . Dierberger . Frutropic . IFF . Reunidas Jaragua
Tannic Acid . Veronese
Tar. Vegetable . Br;~silac . Carvorite . EQP . Nipocarbon

Terpineol . Eucatex Quiniica . Givaudan . IFF
Tridecyl Stear8te . Lavios
Triethanolamine Laawl Ether Sulfate . Henket
Triethanolamine Lauryl Sulfate . Aquatec . Henkei
Triglvceride Cetvl Palmitate . Henkel . Polytechno
Trimethvlpropiine Neopen tyl Glycol *
Animal Fat Ester . Quaker
Turpentine . Art Pinnus . Ashland . Brasilac . Breuquimica . Cocelpa . EQP . Eucatex Qr~irnica . Harirna . Hercules . Klabin . Mehlpnr . Reiy u . Resana . Resinas Brasil . Resinas Yser . Resitec . Roveda . Tintss e Vertlizes "RR" . Ultraquimic;, . Weg
Vegetable Oils, Ethoxvlated Henkel
. Hoechst
. Ultraquimiea
Zinc Stearate . Barlocher . Ceralit . Estearina . Frama
Frimox . Girardi . Royalplas

TABLE 6 - MAIN BRAZILIAN FINE CHEMICALS FROM ALCOCHEMICALS
p Acetaminophenol . Nitroclor
p Acetami~~osalicylic Acid . Quimisintesa
Acetanilide . Hoechst . Sulfaquimica
Acetazolamide . Fina
Acetylmethionine . Byk
Acetyl Snlfamethox;~zole . Sulfabras
Alumininm Acetate . Queluz
Amino;tcetonitrile . Metacril
Amino Ethyl Ethanolaniine . Quimic;~ Da Bahia
Ammonir~m Acetate . F. Maia . Quirios . Rhodia
Barium Acetate . Glob;~l
Be~izyl Salicyl;bte . Essenbra . Rhodia
Butyl Acetate . Butilaniil . Cloroetil . Oxiteno . Petroquima . Quimpil . Rhodia . Victor Sence
Bu tyldiglycol . Oxiteno Nordeste
Butyldilycol Acetate . Oxiteno
Tert-Butvl Peracetate . Akzo
Butyltin Acetate . Croniex Quimica
Calcir~m Acetate . Colombina
Cel l~~lose Acetate . Rhodia
Cobalt Acetate . Colombina . Resimapi . Victoria Quimica
Copper Acetate . Colombina . Resimapi
2,4 - D Ester Br~tyl . Dow Q~iimica

2,4 - D Ester Isooctvl . Dow Quimica
Diblityltin Acetate . Cromex Quimica
Dicofol . Noragro
Diethylamine . Quimica Da Ballirl
Diethylene Glycol . Oxiteno . Oxiteno Nordeste
Diethylene Glycol Benzoate . Liquid Quin~ica
Diethylene Glycol Dibenzoate . Liquid Quimica
Dimethyl Octnnol Acetate . Dierberger
Ethoxylnted Fatty Acid Esters . Henkel . Ultraquimica
Ethylarnine . Quimica DQ B;thi:t
Et h yldiglycol . Oxiteno
Ethyleneditinline . Quimica D;I B;ltlii~
Ethylenedinn~ine Tet r;r;lcetic Acid . Adkzo . Ciba Geigy dit B;thia
Ethylglycol Acetate . Oxiteno
Glycine . Metacril
o-Hydroxybenzaldehvde . Essenbra
Iminodiacetic Acid . Metacril . Nortox
Isoamyl Acetate . Givaudan . Haarmann e Reimer . Oxiteno . Quimpil
Isobu tyldi~lycol . Oxiter-lo Nordeste
l sopro~y l Acetate . Rhodia
Isopropyl~lycol . Union Carbide
Lead Acetate . Diadema Agro Industrial
Manganese Acetate . Colombina . Rkodia
Metllyl Acetate . Givaud;tn
Methylgiycol . Oxiteno
Monochloroacetic Acid . Sa1gem;t . AQB
Alpha-Nanht:llene Acetic Acid . Microbiologica
Alpha-Nanhtalene Acetic Acid Amide . Microbiologica
beta-Nanhthoxy Acetic Acid . Microbiologica
Nickel Acetate . Quirios . Resimapi
N i t r o f ~ ~ r f i ~ r a l Diilcetate . Plestin
Nonylphenol,Etl~oxylate~l,S~~f;lted . Hoechst
Peracetic Acid . Peroxidos Do Brasil
Phenoxy Acetic Acid . Sandoz
Phenyelycol . Oxiteno
Polyethyleneglycol Etoxylate . Hoechst
Potassium Acetate . Colombina . Diadema Agro Industrial . Frama
Sodium Acetate . Carvas . Colombina . F. Maia . Frama . Quimibras . Rhodia . Usiquimica
Snlfachloro . Sulfaquim
Ternhenyl Acetate . Eucatex Quimica . Givaudan . IFF
Viridine . Givaudan
Salicyclic Acid . Carbonor . essenbr;~ . Novaquimic;~ . Rhodia
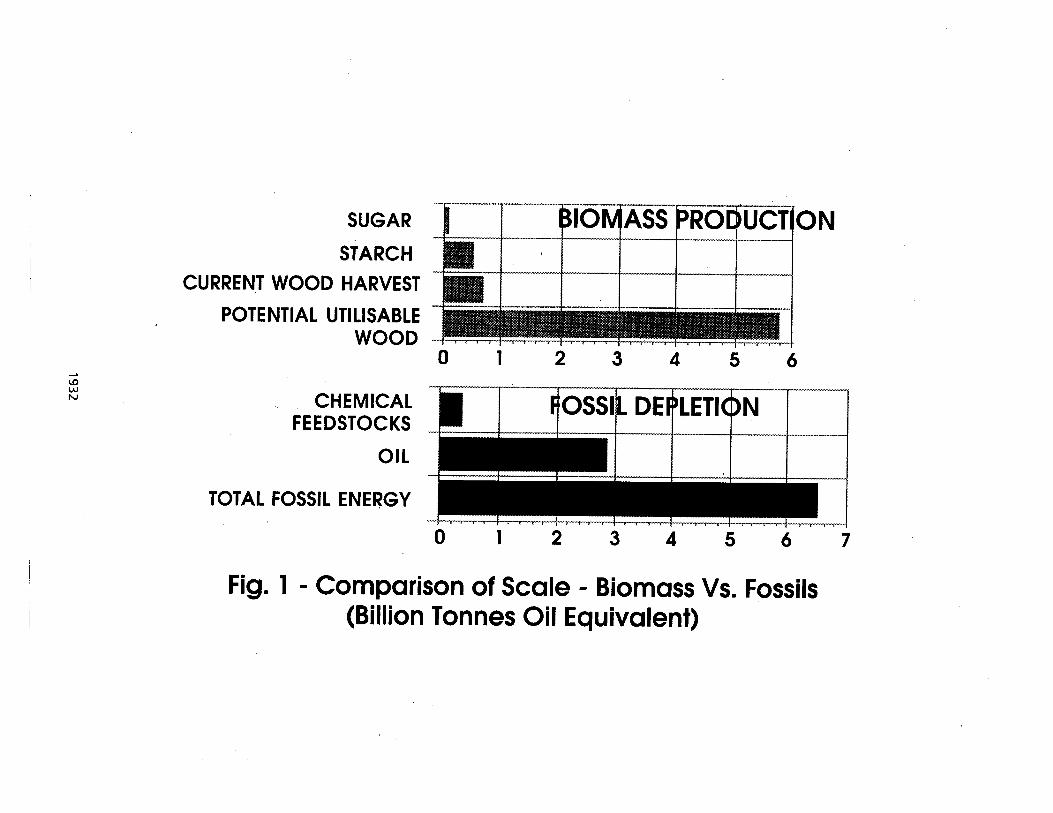
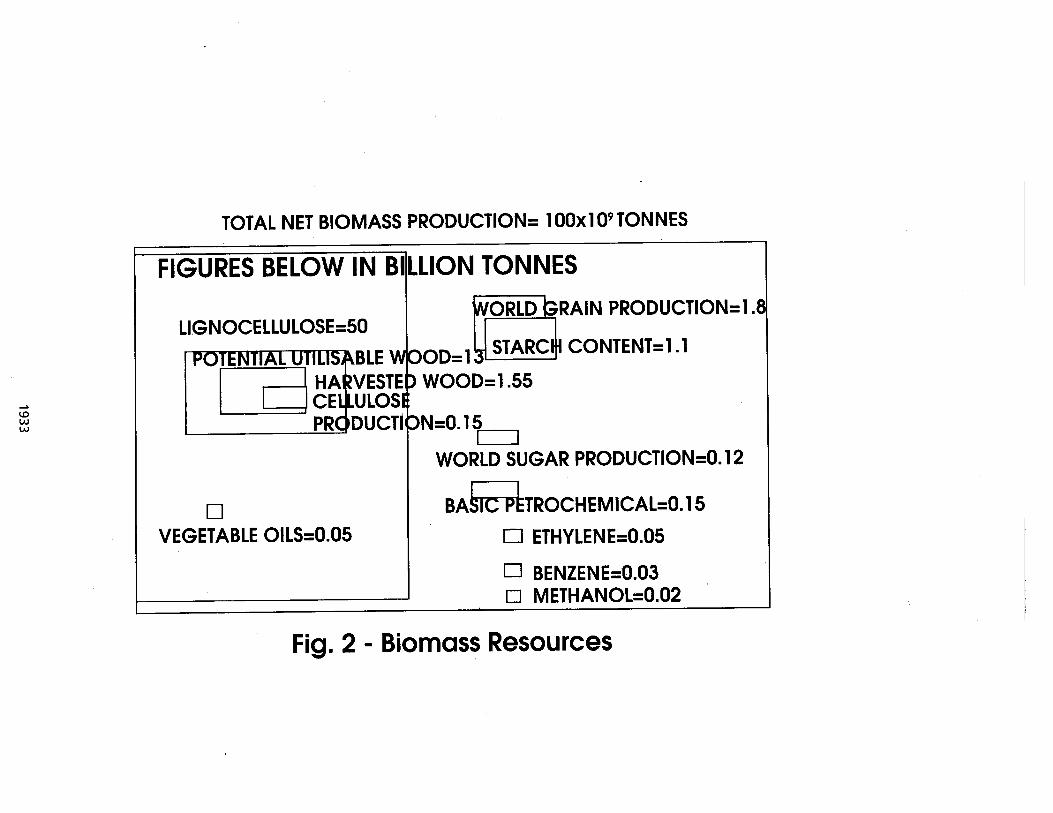
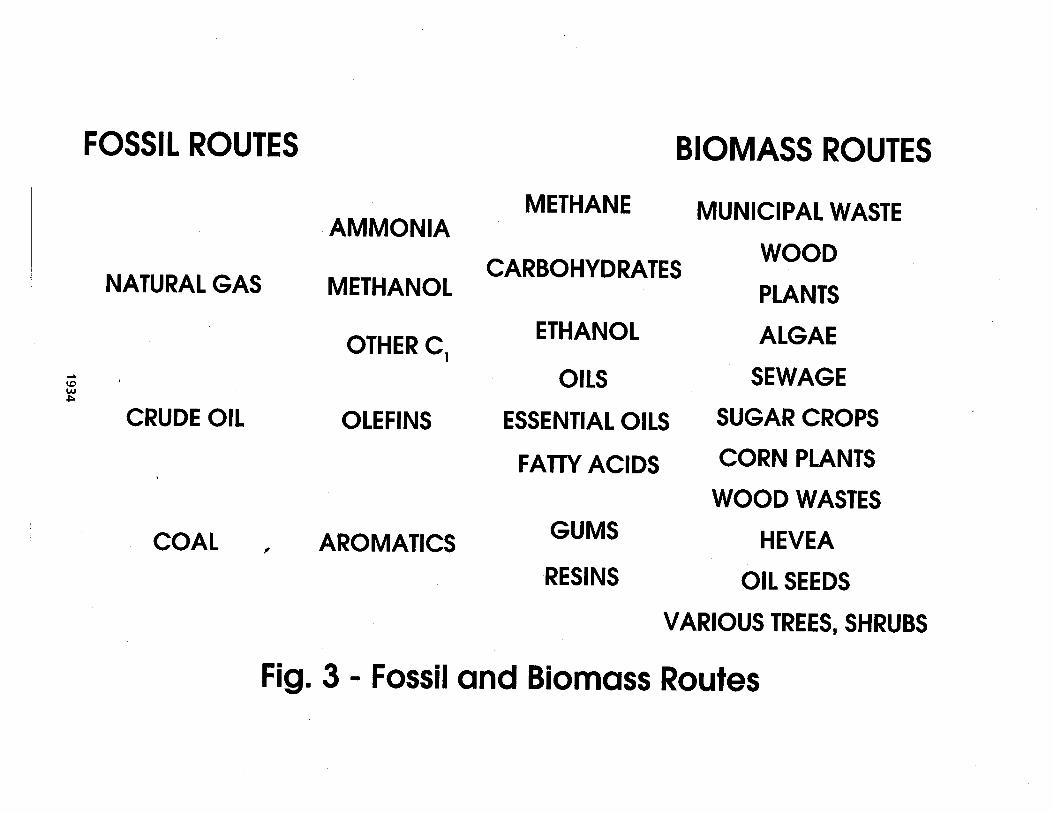
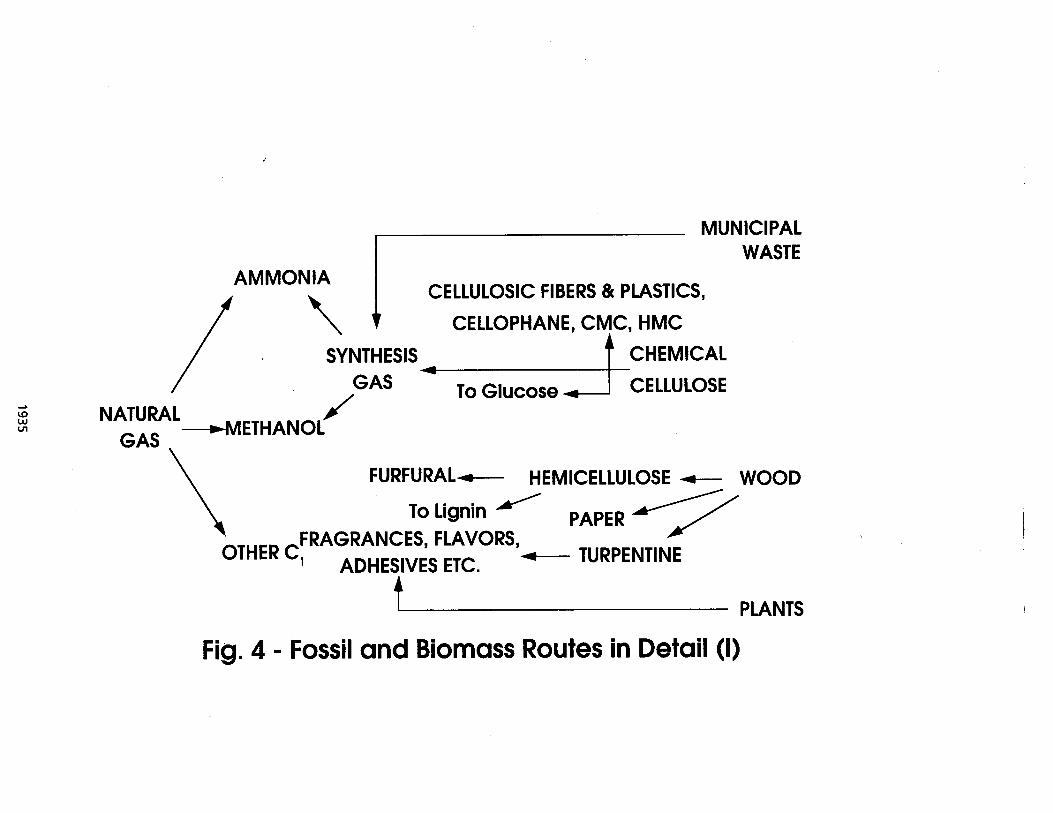
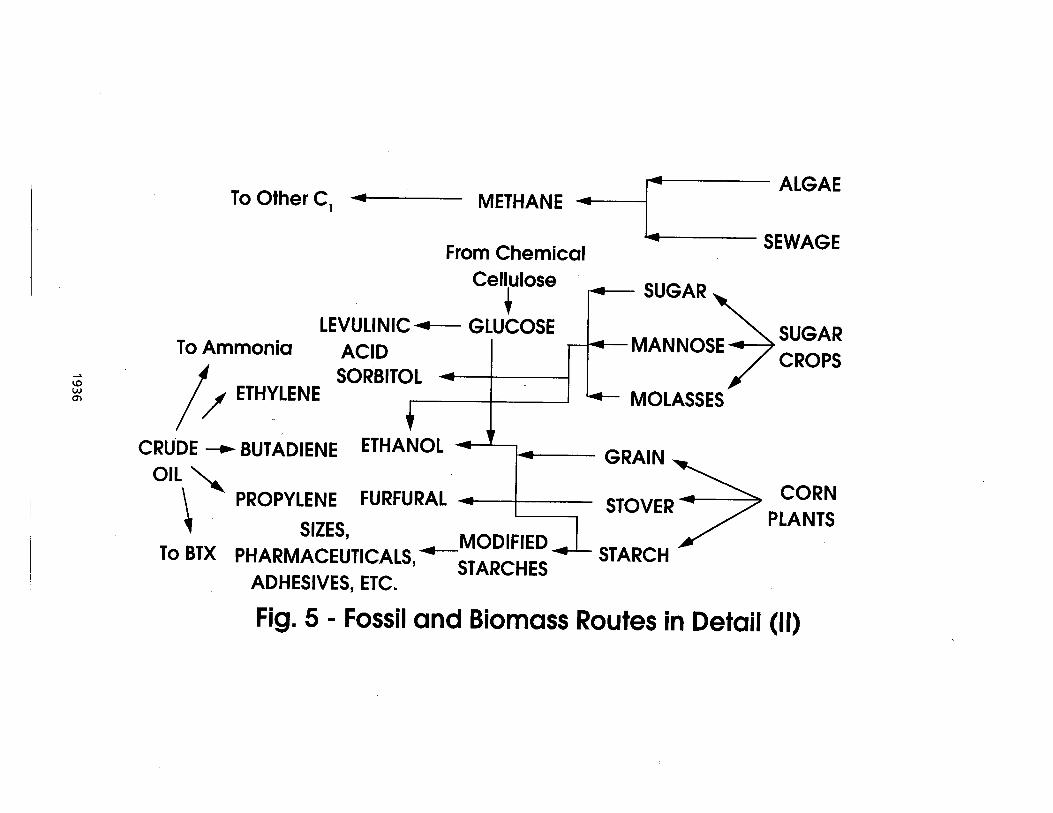
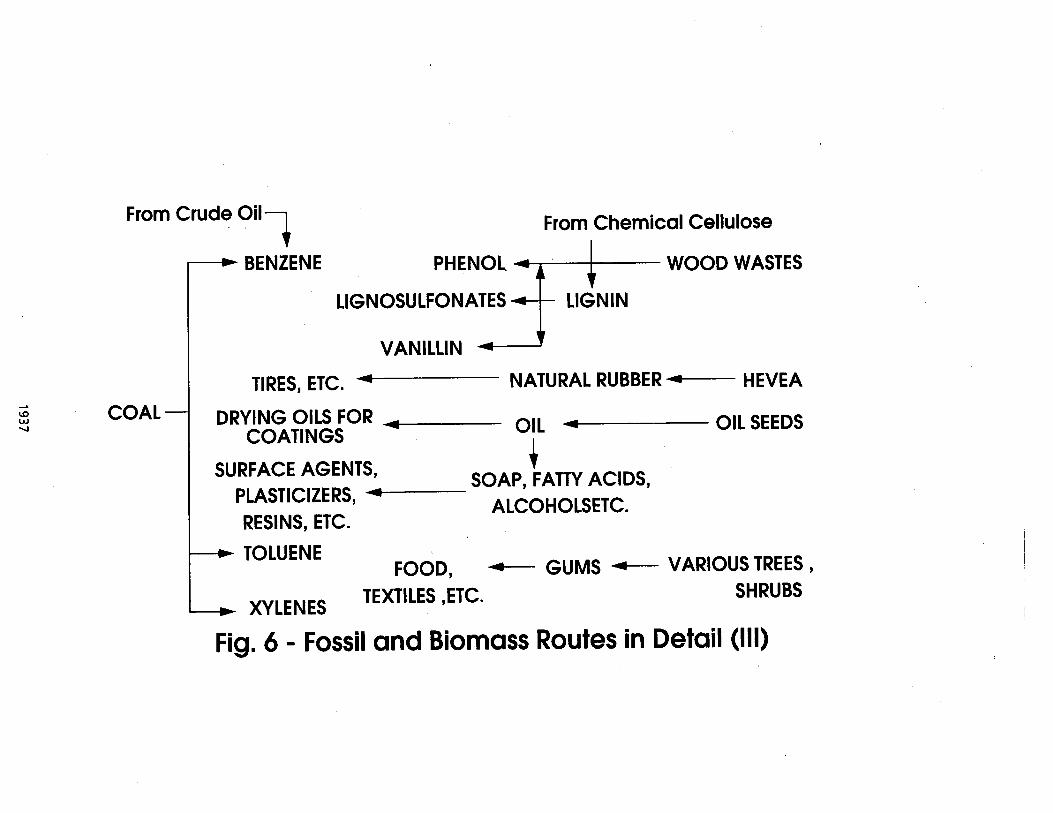
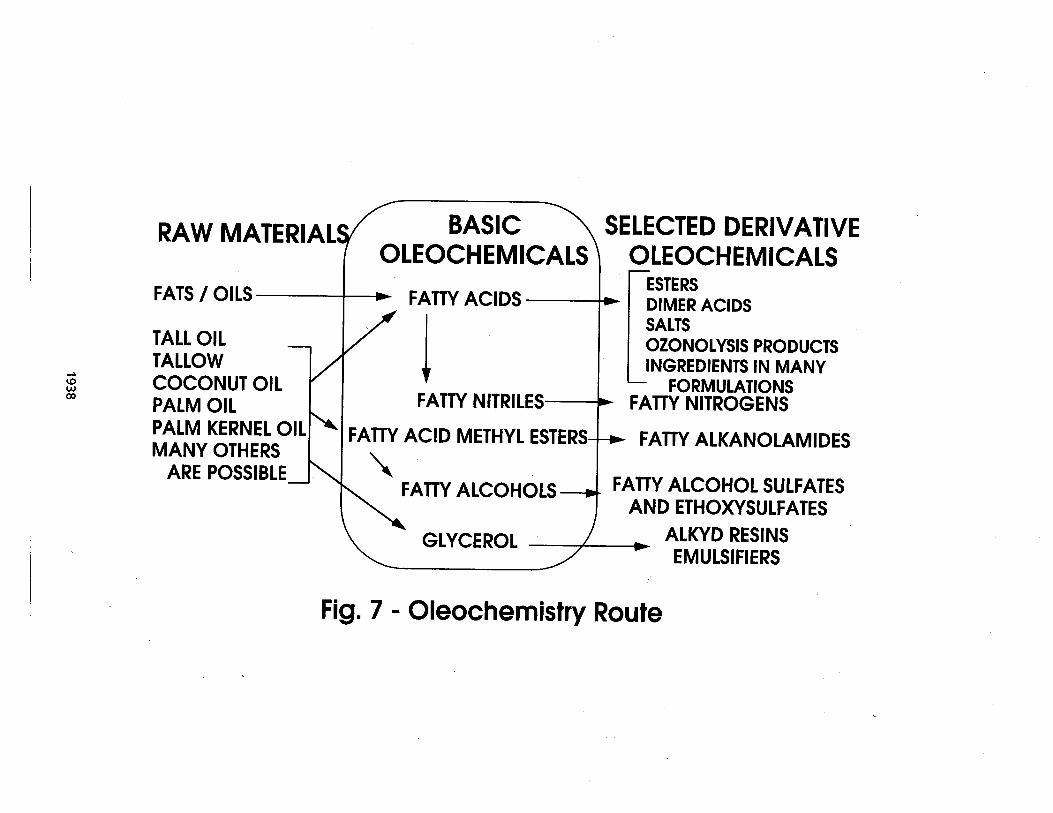
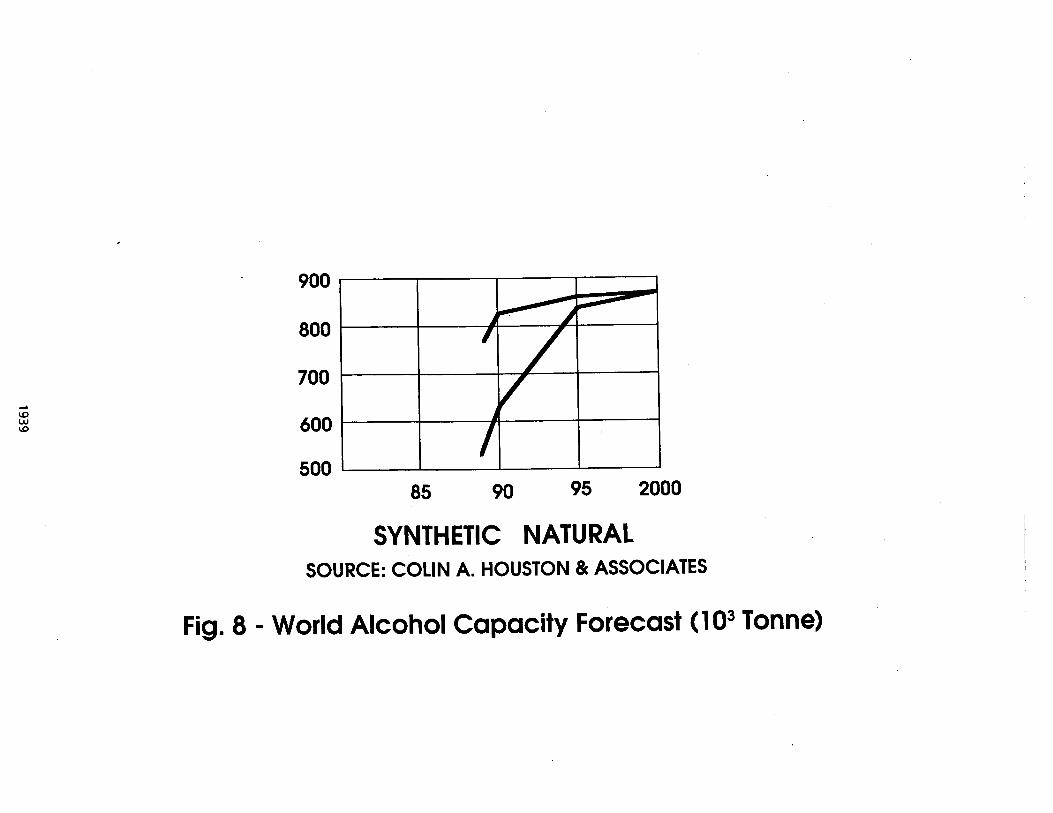
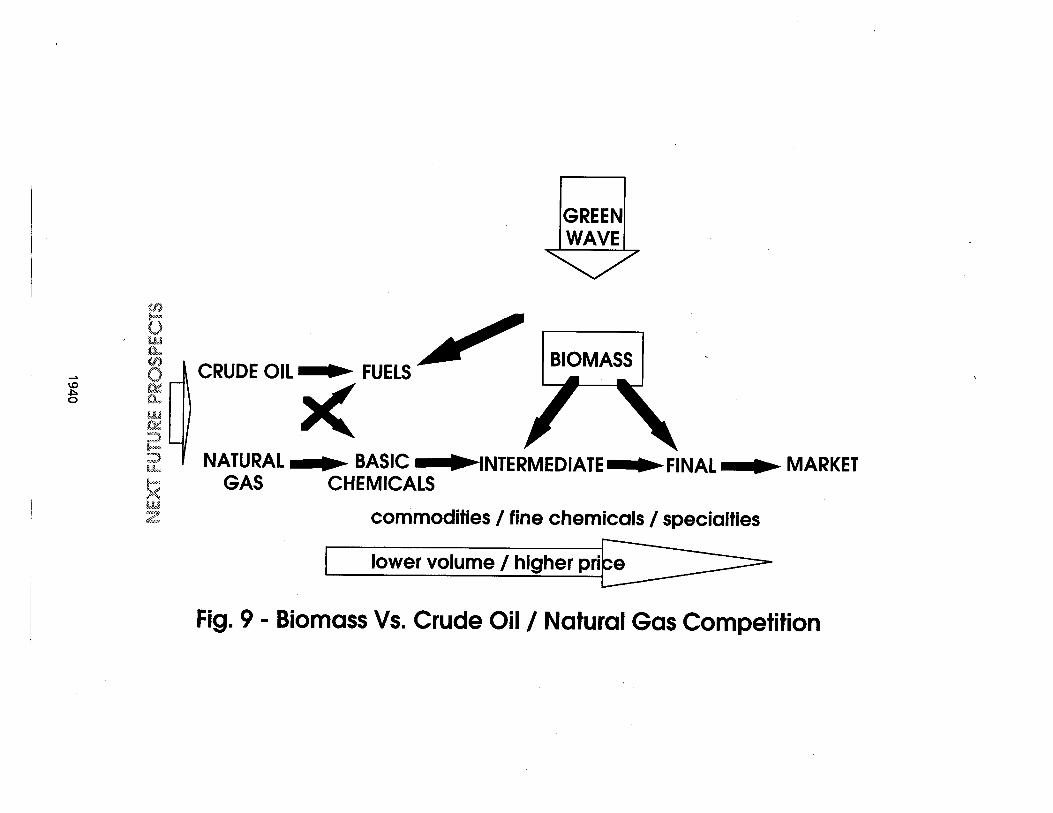
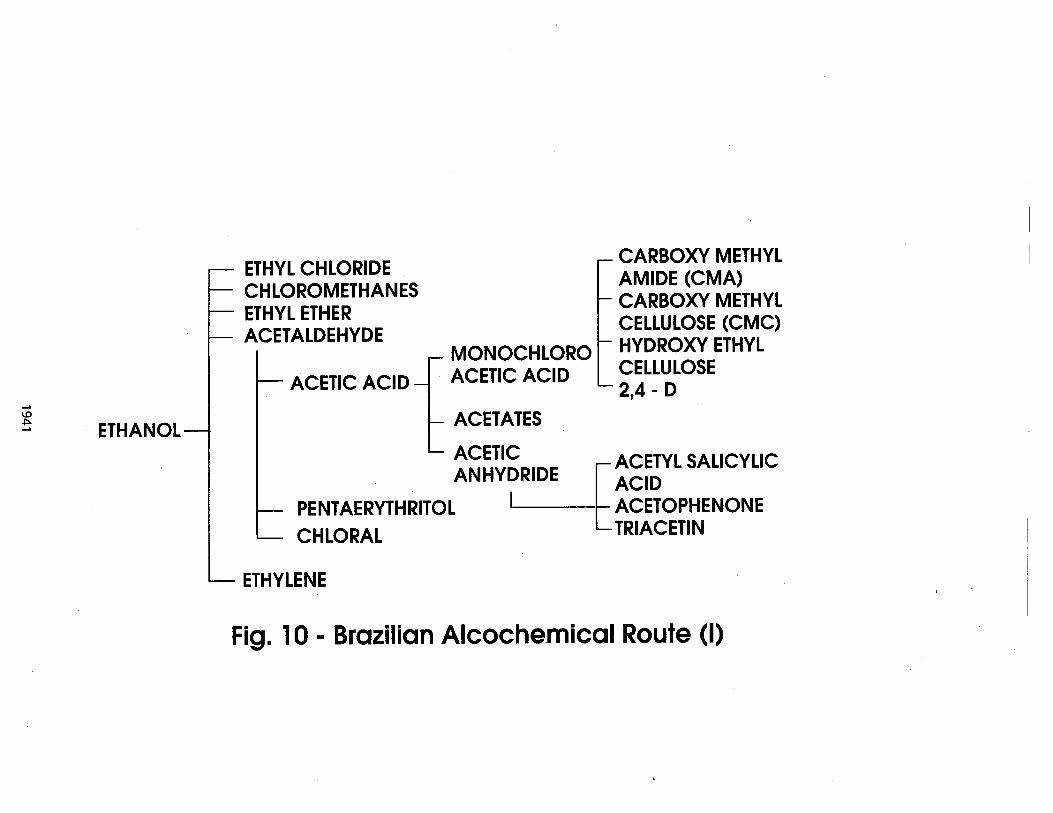
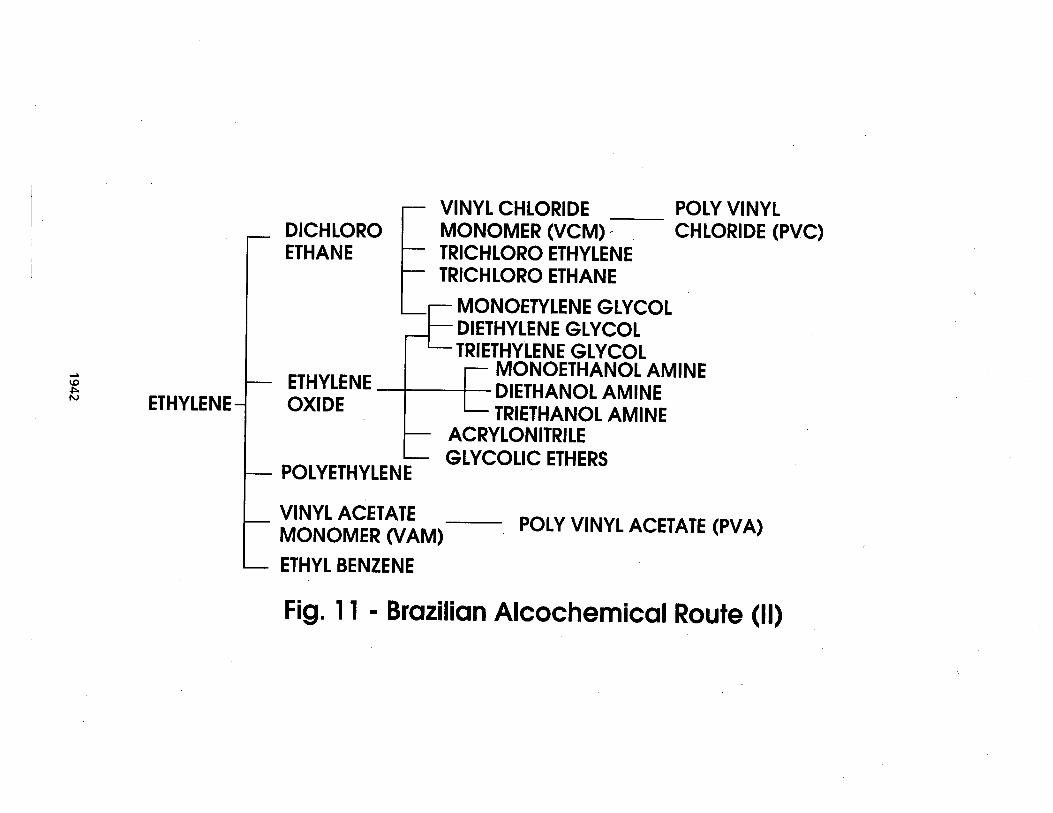
Sponsored by:
U.S. Department of Energy Energy, Mines, and Resources Canada
U.S. Department of Agriculture Environmental Protection Agency
National Renewable Energy Laboratory 161 7 Cole Boulevard
Golden, Colorado USA 80401 -3393
NRELICP-200-5 768 DE93010050
UC Category: 241
NREL is operated for the U.S. Department of Energy by Midwest Research Institute.
*) Cwer: printed with renewable source ink on paper containing at least 50% waste paper \$ Interior: printed on paper produced from the kenaf plant, made and grown in the United States/recyclable.