semi-permeable flow barriers: the methodology for their early detection
TRANSCRIPT

Canadian Journal of Remote Sensing, 41:101–112, 2015Copyright c© CASIISSN: 0703-8992 print / 1712-7971 onlineDOI: 10.1080/07038992.2015.1042542
Semipermeable Flow Barriers: Methodologyfor Early Detection
Mir Karger1,∗, Dmitry Trofimov2, Adalat Eminov3, Ivan Myasnikov4,and Alexander Zakharov5
1TIM Energy LLP, Office 11, 43 Bedford St., WC2E 9HA London, UK2Recenoil JSC, 17/1 Kaliningradskaya St., 141071 Korolev, Moscow, Russia3Azneft PU, 39 Aga-Nematulla St., AZ1033 Baku, Azerbaijan4Complex Geochemical Investigations LTD, 4 Berezovaya St., 142432 Chernogolovka, Moscow, Russia5Institute of Radioengineering and Electronics RAS, 1 Vvedenskogo Sq., 141190 Fryazino,Moscow, Russia
Abstract. The faults are universal in the petroleum reservoirs. Some of them are Semipermeable Filtration Barriers (SPFBs) suchthat an SPFB can change its permeability performance during production from “permeable” to “sealing,” or vice versa. Thismay cause sudden changes in reservoir structures and, eventually, result in negative impacts on production. This article dealswith early SPFB detection and characterization. We consider some case studies of reservoirs with SPFBs, and present a newmethodology for SPFB detection that is aimed at investigation of the “green fields.” This includes SAR interferometry and surfacegeochemical survey as the basic methods for mapping the surface responses to deep geodynamic and fluid-dynamic events, andsome techniques for separation of SPFBs from other dislocations. The methodology implementation is demonstrated with the casestudy of underground gas storage.
Resume. Les failles sont universelles dans les reservoirs petroliers. Certaines d’entre elles sont des barrieres de filtration semi-permeables «Semipermeable Filtration Barriers» (SPFBs) telle qu’une SPFB peut, lors de la production, changer sa performancede permeabilite de « permeable » a « etanche », ou vice versa. Ce qui peut provoquer des changements soudains dans les structuresdu reservoir et eventuellement entraıner des impacts negatifs sur la production. Ce document traite de la detection precoce desSPFBs et de leur caracterisation. Nous considerons certaines etudes de cas de reservoirs avec des SPFBs, et nous presentons unenouvelle methode pour la detection des SPFBs qui vise a l’etude des champs verts «green fields». Cela comprend l’interferometrieRSO et les leves geochimiques de surface comme methodes de base pour cartographier les reponses de surface a des evenementsprofonds geodynamiques et dynamiques des fluides, et certaines techniques de distinction des SPFBs d’autres types de dislocations.La mise en œuvre de la methodologie est demontree par l’etude de cas de stockage souterrain de gaz.
INTRODUCTIONAlmost all natural hydrocarbon reservoirs are tectonized by
tectonic dislocations (faults), each being a fracture, discontinu-ity, fissure or joint resulted from paleostress strain relief. Gen-erally, there are two rock blocks displaced relative to each otheralong the fault. Faults are filled with fault rocks, which areclastic and abraded wall rocks such as fault gouge, clay smear,breccia, deformation bands, etc.
Consider some facts about the faults, which are of importancein the context of this article.
It is well known that almost each reservoir incorporatesstressed-deformed faults. Meanwhile, the stressed-deformedstate of these faults changes through time; it oscillates under theimpact of compression–expansion impulses, lasting from sev-
Recevied 22 September 2014. Accepted 25 February 2015.∗Corresponding author e-mail: [email protected]
eral hours of tidal forces to several years of new-tectonic moves(Cloetingh et al. 2007). Existing faults may act as conduitsfor fluid upflow. Buoyancy, barometric pumping, and dilatantpumping triggered by the aforementioned oscillations might fa-cilitate the upward migration of formation fluids (Nilson et al.1991; Liu et al. 1998; Cameron et al. 2004; Svensen 2012). As aconsequence, light formation fluids might reach Earth’s surface(of course, if the respective fluid-conducting fault fails “reachout” of the surface).
Hosted by the reservoirs, existing faults could act as tecton-ics barriers—in other words, they can create baffles, curbingfree drainage of formation fluids; henceforth, we will call themflow barriers. Flow barriers can worsen the reservoir connectiv-ity, leading to reservoir compartmentalization into blocks. Thisphenomenon can heavily affect oil and gas production. For thisreason, the tectonic faults are a significant focus of attention forgeologists and reservoir engineers.
101
Dow
nloa
ded
by [
Mir
Kar
ger]
at 2
2:52
17
July
201
5

102 CANADIAN JOURNAL OF REMOTE SENSING/JOURNAL CANADIEN DE TELEDETECTION
Our ability to discover and to characterize a fault dependsbasically on the resolution capacity of subsurface surveyingmethods (first of all, on seismic survey), and on geometric pa-rameters of faults such as fault extent, displacement amplitude,fault and faulted zone thickness, etc. Relatively large faults,whose parameters are above the seismic resolution, can be iden-tified and characterized using high-resolution seismic methodsinvolving available exploration and production-well data. In thecourse of exploration and preproduction periods, the explorersdevelop a well-established solution for verifying the faults asfluid permeable faults or as filtration barriers.
We have a completely different situation if we deal withrelatively small faults, including those that lie below the seis-mic resolution, so-called subseismic faults. Generally, the smallfaults avoid direct observations. In rare cases, when they comein sight of a researcher (see, e.g., Karger 1994), it becomesapparent that the small faults are active elements of tectonicsystems. In particular, they play a significant role in Earthdegassing.
Well-known and widely applied are various prediction andallocation methods of small faults and prediction of their flowproperties (Maerten et al. 2006; Verscheure et al. 2012; Nilsenet al. 2012; Endres et al. 2008). Meanwhile, it is well knownthat the faults are distributed in compliance with the powerlaw: in other words, the smaller the size of the faults is, themore abundant they are (Karger and Sandomirsky 1982; Chenand Sinding-Larsen 1994; Lillestøl et al. 2012). We can statewith confidence that small faults (in most instances) remaineither undetected or identified but not characterized within thecourse of both exploration period and preproduction period.The production process, accompanied by reservoir fluid flowand by fluctuations of formation pressure represents a “finalexamination” for sealing properties of faults. It happens oftenthat, during production, the small and hidden faults surprisinglymanifest themselves as flow barriers.
This article focuses on the faults that happen to change theirpermeability performance during production from “permeable”to “sealing” barriers, or vice versa. Most often, this behav-ior is typical for the aforementioned small and hidden faults.For brevity, we refer to such kinds of faults as semiperme-able flow1 barriers (SPFBs) and recognize two types of SPFBs,which are distinguished by the reverse direction: “permeable →sealing” barrier (SPFB 1) and “sealing → permeable” barrier(SPFB 2).
Our interest in this phenomenon is inspired by the fact thatSPFBs routinely occur at mature petroleum pools, with com-pleted development systems. The SPFBs suddenly change thereservoir anatomy. This can decrease the efficiency of the de-velopment system and, finally, negatively affect the ultimate
1In Karger et al. (2014) we used “filtration” instead of “flow” as a linguisticcalque of Russian term.
recovery factors. A consequence is the necessity of the SPFBearly detection.
The following section deals with some case studies of gaspools with hosted SPFBs at Gazli (Uzbekistan), Yamburg (WestSiberia), and Qaradag (Azerbaijan) gas fields. It demonstratesthe need for early SPFB detection. Hereafter, the section brieflyoutlines several geodynamics topics, staying inside the scopeof this article. In the subsequent section, a methodology forhandling the problem of early SPFB detection is presented.In the last section, the case study of Qaradag gas pool servesto look into the SPFB’s distinctive features, and to illustrateimplementation of the technology.
PETROLEUM POOLS WITH SPFB: CASE STUDIESEvents associated with “revitalized” faults are documented
in almost all mature petroleum pools. We, with L. Berman andV. Neyman, composed a specified list of SPFB manifestations inthe petroleum pools (Berman et al. 2010). The following SPFBmanifestations are characteristic of the gas pools:
• After gas production interruptions, there are pressuregradients remaining between gas production zones andbuffer zones without producing wells.
• The pressure difference between the gas productionand buffer zones remains constant at different rates ofgas withdrawals.
• The pressure sinks occur in the production zones,though the initial pressure remains in buffer zones.
• The reservoir flow resistance factor increases.• The drainage volume of depletion-driven gas pool
changes during production.
It seems to be easy to identify that the above or similarsymptoms can be observed within the margins of almost allbrown fields.
Hereafter in this section we consider several examples of howthe SPFBs make themselves evident during production of gasreservoirs. Why do we take gas fields as the examples? Becausethe effects induced by SPFBs in the gas pools show up in amostly unambiguous manner.
By way of SPFB examples, we take the following gaspools (see Table 1): Horizon IX at the Gazli field, Cenomanianreservoir of the Yamburg field, and Horizon VII+VIIa ofthe Qaradag field, former oil-rimmed gas-condensate pool,currently the underground gas storage (UGS). The first twoobjects have been under our study for a long time (Bermanet al. 1987, 2010). The third has been in the focus of UGSrehabilitation project within recent years. These circumstanceswere helpful in detection and investigation of SPFB 1 in thefirst two cases and SPFB 2 in the third.
Horizon IX, the Gazli Gas FieldThe Gazli gas field is located about 100 km northwest of
Bukhara city, Uzbekistan. The basic parameters of the reservoir
Dow
nloa
ded
by [
Mir
Kar
ger]
at 2
2:52
17
July
201
5

VOL. 41, NO. 2, APRIL/AVRIL 2015 103
TABLE 1Outline of Gazli, Yamburg, and Qaradag gas pools
Field Parameter Gazli Yamburg Qaradag
Structure type; Trap type Anticline. Layer-arch Anticline. Massive Homocline. Lithologically sealedLength x Width, km 38 x12 160 × 45 6 × 3Pool Horizon IX Cenomanian Horizon VII+VIIaReservoir age K2cm K2cm N2
Depth, m 680–880 1,080–1,210 2,600–4,000Thickness 100 m 60 m–110 m 100 mInitial pressure, MPa 7.2 11.5 30–40.5Average porosity, % 19.6 27 14Average permeabily, mD 1,170 470 85
considered, Horizon IX, are given in Table 1. The event thattriggered the occurrence of SPFBs was an emergency flowingfrom a production well located at the crestal position of HorizonIX. The emergency flowing happened prior to the start of theproduction period and lasted for about 21 months. Throughthis period of time, gas losses amounted up to 2 % of initialreserves. The production started one year after the breakdownelimination.
The reservoir pressure field was fairly even before the break-down, in average 7.2 MPa. Reservoir pressure monitoring re-vealed that a lateral cross-flow took place throughout the flowingperiod, and, in addition, about 6 months afterward. Finally, thereservoir pressure field resulted as the three shelves radiatedoutward from the troubled well (Berman et al. 1987), thus re-vealing the two impermeable barriers that divided the reservoirinto three autonomous blocks.
Note the recent geological and geochemical regional scalesstudies (Djunin and Korzun 2010; Perevozchikov 2012) showedthat the Gazly field is tectonized in some way. The field is tran-spierced by a linear anomaly of hydrogen content in groundwater (G. Perevozchikov, personal communication 2014). Thus,with the availability of such information, the risk of compart-mentalization of Gazli field might be timely assessed.
To summarize briefly, the above barriers had been gas perme-able before, during, and sometime after the emergency flowingperiod, as evidenced by the far lateral gas cross-flow and thepressure-drop throughout the gas pool. The pressure drop wasirregular over the pool area; the maximal pressure drop occurredin proximity to the troubled well and the minimal one far apartfrom it. It is reasonable to say that the irregular pressure dropinduced inhomogeneous rock compaction across the pool. Asthe result, the differential subsidence of fault walls happened,triggering the fault and fault zone compaction. Finally, thesefaults turned out to be gas impermeable; in other words, theyconverted into SPFB 1.
Thus, irregular compaction of fault walls triggering the com-paction of faults and fault zones seems to be interpreted as anevent, facilitating the origination of SPFB 1.
The Yamburg Gas FieldThe Yamburg gas field, one of world-class gas giants, is
located at the Lower Ob region, West Siberia. The basic param-eters of the considered gas pool are given in Table 1.
The initial reservoir pressure was consistent with the hydro-static pressure, and there were no signs of any tectonic het-erogeneity of the pool. In virtue of the above, a hydrodynamichomogeneity concept of the pool initially prevailed. Based onthis concept, the pool has being producing over the years withdrilled wells draining from the pool roof (characterized by amaximal thickness of the net pay gas-bearing zone).
The production drawdown period began very early, whenthe ultimate gas recovery factor (UGR) was just 0.3. By thetime UGR reached ≈ 0.6, about one third of the reserves werecontained in the bypassed zones screened by the SPFBs. At thetime, there was a pressure sink (see Figure 1) in the recoveryzone where the reservoir pressure dropped down to one third ofwhat it was initially. In bypassed zones, the reservoir pressureremained nearly at the initial level.
Evidently, the mechanism of SPFB formation was the sameas in Gazli case study: some barriers turned into impermeableSPFBs 1 due to inhomogeneous compaction of the reservoir,which resulted from the nonuniform pressure drop. In this case,the SPFBs are concentrated in the area, which is a part of a cer-tain concentric zonal structure of cosedimentary genesis. TheSPFB area is a transitional zone (grey-dashed in Figure 1) be-tween the near-crest zone of highly productive sandy reservoirsand the near-bottom zone of low productive silty reservoirs(Berman et al. 1987).
It should be noted that similar things happened in Urengoi,Medvezhye, and other West-Siberian gas giants (Berman et al.2010). In all of them, the production drawdown period began atvery low UGR values. Significant volume of reserves remainedin the bypassed zones behind the barriers of SPFB 1 type, lo-cated in transitional zones. Note that we have observed similartransition zones in many oil and gas fields in Timan-Pechora,Volga-Urals, and other provinces (Berman et al. 1987). Theyappear to be highly-fractured and directly related to known sur-
Dow
nloa
ded
by [
Mir
Kar
ger]
at 2
2:52
17
July
201
5

104 CANADIAN JOURNAL OF REMOTE SENSING/JOURNAL CANADIEN DE TELEDETECTION
FIG. 1. Block maps of the Yamburg Senomanian gas pool at UGR ≈ 0.6: the top structure (at the bottom) and reservoir pressure.Red and blue dots: production and observation wells, respectively.
face circular atmogeochemical and geophysical anomalies (e.g.,Sikka and Shives 2002).
The UGS QaradagQaradag multihorizontal field (Durmishian 1967) is located
about 30 km southwest from Baku, Azerbaijan. It is confined tothe SE flank of a complex fold, with a mud volcano at its crest.The oil-rimmed gas-condensate pool of Horizon VII+VIIa (seeTable 1 and Figure 2) represents a lithologically screened mon-ocline dipping eastward at 50◦ the gas column is about 1 km.There is a remarkable fault confined to the northeast segment ofthe horizon (see Figure 2). During production period, a pressuredifference of the order 4 MPa–5 MPa was documented acrossthis fault.
The pool started operation in the early 1950s in the depletionmode up to the 1980s. At the time the apical reservoir pressurewas about 0.4 MPa, i.e., 10 times less than initially. Soon after,the underground gas storage (UGS) was established at this pool.Thereafter, the reservoir pressure underwent regular rises anddrops, with pressure difference of about 0.6 MPa during UGSfledging years and 1.2 MPa at the present time.
In the initial stage of the UGS exploitation, it was discoveredthat the aforementioned fault turned into a permeable pattern(i.e., it converted into SPFB 2). As with the Gasli and Yam-burg cases, there is a good reason to believe that the SPFB 2occurred because of changes in the fault stress condition. How-ever, this time the reservoir pressure fluctuations caused thecompression release rather than compaction of the fault and faultzone.
The Qaradag field will be the subject of closer examinationin the last section of this article.
SPFB IDENTIFICATION METHODOLOGY
Geodynamic and Geochemical PrerequisitesThrough the past few decades, an extensive body of knowl-
edge has been accumulated on geodynamics activity of Earth’supper crust and related phenomena. It is beyond the scope ofthis article to review these subjects. Following, we list thesesdirectly addressing the topic of this study.
• Monitoring of Earth’s surface by various methods(surface or space geodetic leveling, geotechnical
Dow
nloa
ded
by [
Mir
Kar
ger]
at 2
2:52
17
July
201
5

VOL. 41, NO. 2, APRIL/AVRIL 2015 105
FIG. 2. The top structure of Horizon VII+VIIa, the Qaradag field (after 3D seismic survey). Black lines: the seismic scale tectonicfaults. Black and blue dots, respectively: field wells of the former oil-rimmed gas-condensate pool and operating wells of thecurrent UGS.
monitoring of deformations of underground construc-tions, etc.) has provided an idea of the oscillating move-ment of Earth’s upper crust and related stress and strain(Kuzmin 1996; Sashourin et al. 2001; Stemberk et al.2010).
• Modern “theory of geogas.” which embraces abundantatmogeochemical evidences, considers the geogas mi-crobubbles as the main carrier of both the gas phaseand solid nanoparticles from the interior to Earth’s sur-face (Kristiansson and Malmqvist 1982; Putikov andWen 2000; Noble et al. 2013).
• Materials dealing with statistics of geological phenom-ena indicate that scale invariance, or self-similarity, isa fundamental property of many multiscale geologicalassemblies, with the power law well-suitable for de-scription of this property. Power law models providea powerful instrument for distinguishing populationsof faults, geochemical anomalies, etc., which differin power-law relationships (Karger and Sandomirsky1982; Chen and Sinding-Larsen 1994; Carranza 2009;Cheng 2012).
• Geochemical monitoring of tectonic faults of differ-ent scales leads to viewing them as basic geogas-uplift channels. Combined geochemical and geotech-nical monitoring scenarios of observed faults gives usa strong ground to believe that the fault opening fluc-tuations form a basic mechanism of pumping geogasupward from the fault (Gold and Soter 1985; Sugisaki1987; Putikov and Wen; 2000; Etiope and Martinelli2002; Cameron et al. 2004; Klusman 2009; Cao et al.2009).
• The results of numerous surface gas surveys demon-strate that every petroleum field is accompanied by thesurface anomalies of gaseous and volatile hydrocar-bons (Sokolov 1971; Tomkins 1990; Liu et al. 1998).
The above postulates make up a basis for following geodynamicsand geochemical backgrounds of the suggested technology.
In all the geological settings, Earth’s upper crust is sub-ject to vertical oscillations under the action of the tidal andtectonic forces. The tidal forces give rise to the relativehigh-frequency component of these oscillations (hours, days);
Dow
nloa
ded
by [
Mir
Kar
ger]
at 2
2:52
17
July
201
5

106 CANADIAN JOURNAL OF REMOTE SENSING/JOURNAL CANADIEN DE TELEDETECTION
neotectonic forces are the driving force for long-periodoscillations.
These oscillations activate the perturbation of the stress con-dition of geologic media. The stress energy dissipates throughfaults by its transformation to frictional energy and fracturepropagation. In other words, these perturbations result in recip-rocal displacements of the adjacent rock blocks hosted alongthe faults. Under compression release, the faults open out.
Gaseous and volatile hydrocarbon seepage occurs at all thepetroleum reservoirs along the near vertical tectonic faults. Thegeogas upflows reach Earth’s surface in portions during thefault decompression periods, governed by neotectonic or bytidal forces. Dimensions of such “portions” are closely relatedto dimensions of faults.
Other factors being equal, both the fault extent at the daysurface and extent and intensity of surface geochemical anoma-lies follow power-law distribution. There are grounds to assumethat SPFBs fall within the left part of this distribution, whichrepresents the small (incl. subseismic) faults.
Using this line of reasoning, we are led to the followingsummarized prerequisites to the presented methodology:
1. The adjacent tectonic rock blocks are always differentiallymobile;
2. The borderlines between the adjacent rock blocks periodi-cally become well-transmissive for formation fluids;
3. The fluid-transmitted geochemical signal is detectable at thesurface;
4. The aforementioned prerequisites are well presented in oiland gas objects, being demonstrated in the near real-timescale.
The MethodologyThe proposed methodology rests on the concept of cosed-
imentary phenomena and permanent neotectonic activity ofpetroleum-bearing structures. It uses various methods groupedas follows.
(1) Mapping of land-deformational and geochemical anomaliesas surface responses to deep geodynamic and fluid-dynamicevents using synthetic aperture radar (SAR) interferome-try, surface atmogeochemistry, and other morphotectonicmethods.
(2) 3D-mapping of both seismically mapped and subseismicfaults in the reservoir and adjacent formations. The geologicmodeling uses a wide range of geology, geophysics, andfield-test data, including seismic survey data, well-logging,well tests (if available).
(3) Identification of SPFBs among other dislocations by usingreservoir pressure analysis, fluids geochemistry, cross-holeexploration, etc.
The methods (1) run efficiently with complete absence of theexploration data. They can yield the first approximation of the
SPFB framework of a prospect area. Experience has shown thatthe SAR interferometry and the surface gas geochemical surveyare the most informative methods under such conditions.
The methods (2) run effectively at the preproduction stage.Relying on the exploration data, including bore-hole surveyingand seismic ones, the static stress-and-strain models of Earthcan be constructed, with the “seismic” space resolution. Mostof the faults with displacement amplitudes smaller than 5 m–7 musually escape these models. The small faults can be detectedduring production by way of revealing the temporal changesin reservoir pressure and fluid flows, i.e., by the use of themethods (3).
THE METHODOLOGY TRIAL TEST AT UGS QARADAGThe UGS Qaradag problem related to the operating experi-
ence problems of Horizon VII+VIIa. The operating experienceindicated its strong heterogeneity (see above). Clearly, therewere flow barriers in the UGS, calling for detection and charac-terization.
All available data derived from the field and UGS Qaradagwere invoked and reinterpreted. So they included seismic, fieldgeophysical, production data, etc. The SAR interferometry andthe surface gas survey were carried out for the first time at thearea. Thus, they deserve some explanation.
SAR InterferometryWithin the UGS Qaradag area, we used a series of Phased
Array-type L-band Synthetic Aperture Radar (ALOS PAL-SAR) data (23 cm wavelength, SAR observation angle 34.3◦)obtained by the repeated orbits interferometry in observationgeometry. The standard Differential Interferometric SyntheticAperture Radar (DInSAR) technique (Rosen et al. 2000) wasimplemented to generate the differential interferograms, withtopographic phase to be subtracted from interferogram accord-ing to the Shuttle Radar Topography Mission, Digital Eleva-tion Model (SRTM DEM; Farr et al. 2007; Shuvaeva et al.2012). The PALSAR interferometric pairs were selected withregard to injection/withdrawal seasons, over which the dynam-ics manifestation might be most prominent, because the prefer-ence was also given to the pairs with the shorter interferometricbaselines.
We used five interferometric pairs acquired during2007–2010. Table 2 presents details of data acquisition andweather conditions during SAR sessions, as well as the UGSregimes during time intervals between data pairs acquisition.The data pairs selected for our analysis were acquired at pos-itive near surface temperatures, consequently undesirable soildeformations because of thaw/freeze effects might be excludedfrom consideration. Interferometric pairs with shortest baselineswere selected from the Japan Aerospace Exploration Agency
Dow
nloa
ded
by [
Mir
Kar
ger]
at 2
2:52
17
July
201
5

VOL. 41, NO. 2, APRIL/AVRIL 2015 107
TABLE 2Characteristics of PALSAR data acquisition over the UGS Qaradag area
Interferometric Pairs Near Surface Air Interferometric BaselineUGS regime Observation Dates Temperature, ◦C (Perp. Component), M
Gas withdrawal 12/14/2007 +10 55603/15/2008 +10
Gas withdrawal 11/03/2009 +14 108403/21/2009 +7
Gas injection 06/18/2009 +14 27109/18/2009 +36
Gas withdrawal 11/06/2010 +8 97012/22/2010 +10
Gas injection 03/21/2010 +8 135412/22/2010 +10
(JAXA) archive2 in order to minimize distortions of differentialinterferograms because of SRTM DEM errors.
In standard DInSAR interferometry technique, we subtractedtopographic phase according to SRTM DEM. In order to de-crease phase noise the one-look interferograms were averagedin a 4 × 8 pixels window and filtered with the Goldstein adap-tive filter (Goldstein and Werner 1998) with 32 × 32 windowsize. Because of such a strong averaging, the phase noise is verylow on the differential interferograms. Our estimations of thenoise effects over the flat areas show that the standard deviationof phase is below 10◦, which corresponds to the surface radialdisplacement errors of about 3 mm.
A set of facts related to our object under study shouldbe pointed out. This is the UGS, whose “life” is the cyclicalternation of gas injection and gas withdrawal in summerand winter seasons, respectively. The seasonal amounts of in-jected/withdrawn gas differ from one year to another, as the gasdistribution among the individual UGS wells changes from oneseason to another (Tek 1997). The 3 ± 0.5 km thick rock massthat conveys the gas-pressure pulses from the reservoir to thesurface acts as a system of soft ripples rather than ridged pis-tons. This system induces the lateral pressure dissipation, with aconsequent distortion and smoothing of the surface deformationfields.
From these facts it transpires that the surface deformationsgenerated by the UGS reservoir are periodic. As this takes place,the momentary surface deformation field might not copy thatof the reservoir pressure. And the seasonal surface deforma-tion pattern might not faithfully recur from year to year. Un-der these conditions, our preference was given to the follow-ing multitemporal interferograms scenario: a revealing of thestable boundaries between the movable blocks of the surface,plus experimental verification of the boundaries by independenttechniques.
2http://jda.jaxa.jp/en/
Figure 3 presents the interferograms, which reflect the sur-face dynamics during the three gas withdrawal and one gasinjection periods. Cold and warm colors correspond to upliftingand subsiding areas, respectively. For better clarity, the interfer-ograms were contrasted to keep surface displacement values inthe range ± 3 cm. Looking ahead to comparison convenience,we added the SPFBs to these images.
As can be seen, the interferograms in Figure 3 are alike incontours of moving areas located inside the UGS rectangle.The contours match substantially to the point that they can beconsidered to be formed by the same mechanisms.
Gas Geochemical SurveyAt the Qaradag UGS area, the surface gas geochemical sur-
vey was carried out at the sampling grid 200 × 100 m. Totally,450 samples were retrieved. The gas survey was conducted dur-ing the gas injection period, i.e., against the reservoir pressureincrease. The bedrock at depth 1 to 1.2 m was the media tested,with both sorbed phase and subsoil air to be sampled. The needfor synchronization of the survey data with the injection sched-ule was the cause for subsoil air sampling.
The sampling itself, sample preservation, and preparation foranalysis (including thermal vacuum degassing procedure) arerealized, using the classic methodology by Zubayraev (1986)with some trivial modifications. Subsoil air and desorbed gaswere analyzed, using gas chromatographic method for satu-rates, alkenes, and aromatics, falling into the range of C1–C15;meanwhile, detection limits amounted to some units of ppb.
The field sampling of 2 weeks in duration has been carriedout at the territory of operating UGS during the gas injectionperiod, i.e., under risk that the geochemical survey outcomescould be affected by the drift of injection parameters (injectionpressure, etc.). For this effect to be minimized, we mappedconcentration percentiles instead of concentrations themselves.Each particular percentile value was calculated on the samplestaken within a 3-day sliding window centered at the current day.
Dow
nloa
ded
by [
Mir
Kar
ger]
at 2
2:52
17
July
201
5

108 CANADIAN JOURNAL OF REMOTE SENSING/JOURNAL CANADIEN DE TELEDETECTION
FIG. 3. The differential interferograms of the UGS Qaradag area (rectangle) and adjacent areas. The interferograms characterizethe surface dynamics over the gas withdrawal periods (clock faces): (a) 12/14/2007 to 03/15/2008. (b) 11/03/2009 to 03/21/ 2010.(c) 11/06/2010 to 12/22/2010. (d) 06/18/2009 to 09/18/2009. Blue, green, and yellow-red colors correspond to uplifting, stable,and subsiding areas, respectively. MV: the mud volcano. Blue lines: the SPFBs.
As mentioned, the rock mass overlaying the UGS gas reser-voir acts as some kind of a spreader of geogas ascending fromthe depth to the surface. Not only does this the rock mass conductupward geogas flows, it also induces the lateral gas dispersion,which results in distortion and smoothing of surface atmogeo-chemical anomalies. This fact should be taken into account wheninterpreting the geochemical maps in what follows.
RESULTS AND DISCUSSIONThe interferogram of Figure 3b is presented in Figure 4 on
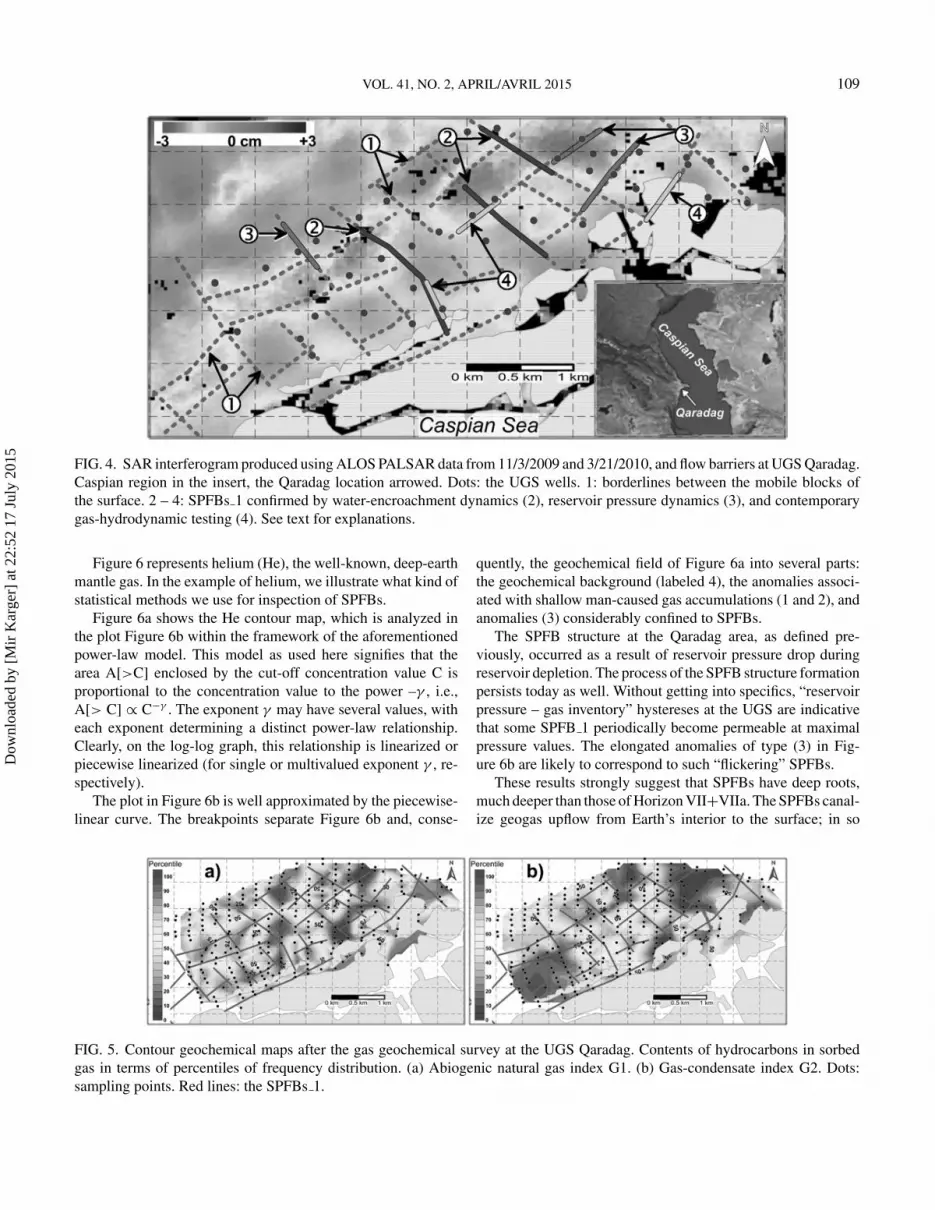
an enlarged scale. The lines labeled by 1 are the borderlinesbetween the differentially mobile blocks of the surface. Theyare averaged from all the interferograms, with due regard forgeochemical and other data considered below.
The lines 1 in Figure 4 represent the surface extensions ofthe flow barriers existing in the UGS pool. Most of them arethe SPFBs 1, whose existence was proved by direct tests. Thefollowing is evidence of this assertion.
There has been no signpost for the existence of any flowbarrier during the pre-UGS production period. It is well docu-mented that the pool was fully drained at UGR ≈ 0.5. Today,most barriers 1 are completely sealed as retrospective and con-temporary data demonstrates. The gas-impermeability is provedby the retrospective data of water-encroachment dynamics (la-beled 2 in Figure 4), by reservoir pressure dynamics (3), andby contemporary gas-hydrodynamic testing (4), such as wellinterference testing.
As for the genesis of the SPFBs, we can judge it from theresults of the lithofacies analysis. The near north-east (on thestrike) lines are the consedimentary small-displacement flex-ures; some of them are slightly seismically expressed. The nearnorth-west (across the strike) lines are limited to transition zonesat the edges of the delta-front facies. They are mostly the sub-seismic discontinuities.
Figure 5 represents the geochemical maps resulted from gas-geochemical survey. The following geochemical indices aremapped in Figure 5a, b:
G1 = C2H6 + C2H4 + C3H8 + C3H6 + C4H10
G2 = zC5H10 + C6H6 + zC6H12 + C6H14 + 2iC6H12-1 +2.2iC7H16 + 2iC7H16 + C7H16
Index G1, which is a sum of light alkanes and alkenes withoutmethane, characterizes the abiogenic natural gas, (i.e., today’sUGS-operated gas). Index G2 is a sum of volatile compoundsof gasoline fraction. As such, it shows traces of original gas-condensate that could still be kept in the bypassed zones.
The 2 features of geochemical anomalies have engaged ourattention primarily in Figure 5. First, the anomalies of bothG1 and G2 indices are shaped by the SPFB lines. Second, theanomalies of G1 and G2 indices are separated in space, thusdemonstrating a geochemical specialization of different UGSparts. In particular, the lower-left anomaly in Figure 5b evi-dences that on the South-West part of the area, there is a by-passed zone of gas, originally contained in Horizon VII+VIIa.
Dow
nloa
ded
by [
Mir
Kar
ger]
at 2
2:52
17
July
201
5
VOL. 41, NO. 2, APRIL/AVRIL 2015 109
FIG. 4. SAR interferogram produced using ALOS PALSAR data from 11/3/2009 and 3/21/2010, and flow barriers at UGS Qaradag.Caspian region in the insert, the Qaradag location arrowed. Dots: the UGS wells. 1: borderlines between the mobile blocks ofthe surface. 2 – 4: SPFBs 1 confirmed by water-encroachment dynamics (2), reservoir pressure dynamics (3), and contemporarygas-hydrodynamic testing (4). See text for explanations.
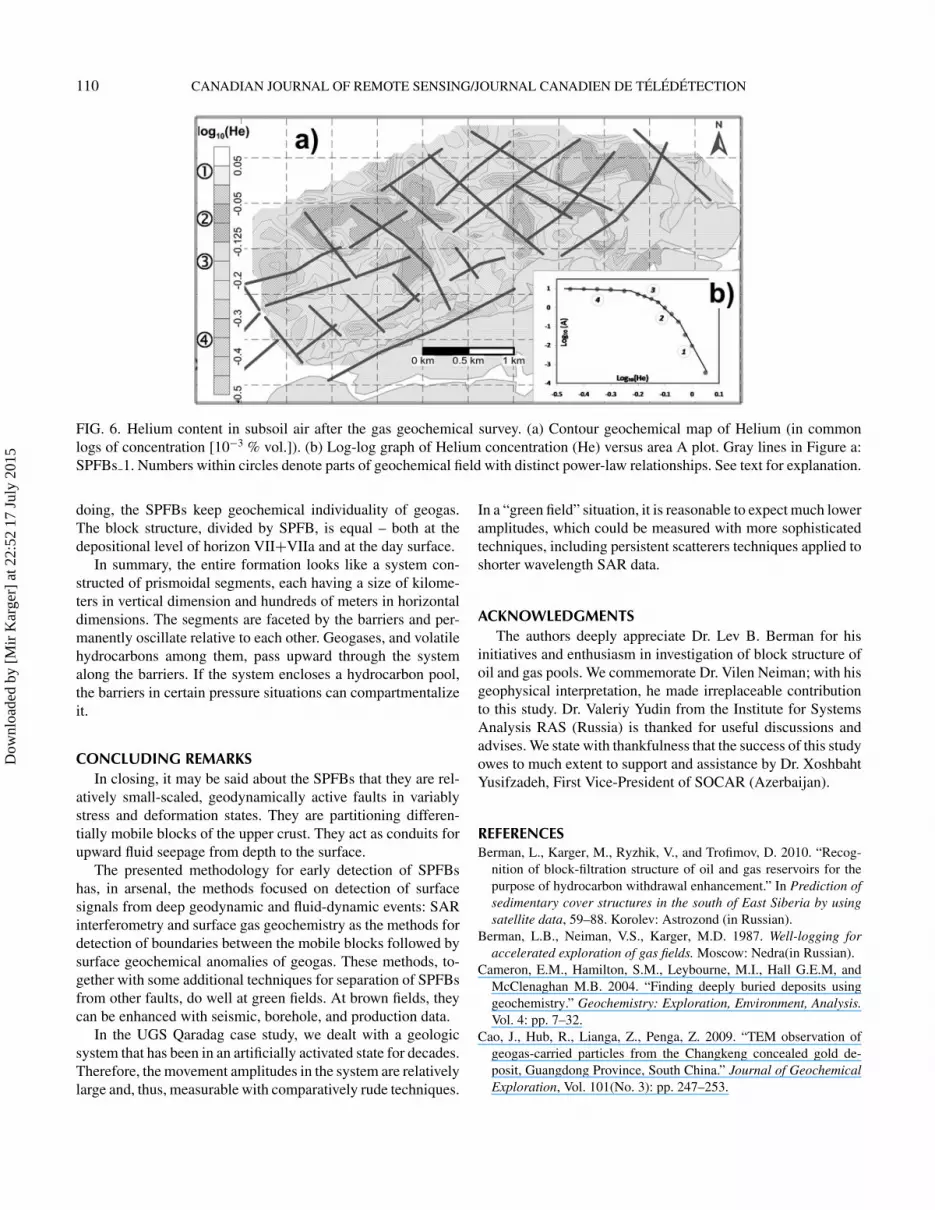
Figure 6 represents helium (He), the well-known, deep-earthmantle gas. In the example of helium, we illustrate what kind ofstatistical methods we use for inspection of SPFBs.
Figure 6a shows the He contour map, which is analyzed inthe plot Figure 6b within the framework of the aforementionedpower-law model. This model as used here signifies that thearea A[>C] enclosed by the cut-off concentration value C isproportional to the concentration value to the power –γ , i.e.,A[> C] ∝ C−γ . The exponent γ may have several values, witheach exponent determining a distinct power-law relationship.Clearly, on the log-log graph, this relationship is linearized orpiecewise linearized (for single or multivalued exponent γ , re-spectively).
The plot in Figure 6b is well approximated by the piecewise-linear curve. The breakpoints separate Figure 6b and, conse-
quently, the geochemical field of Figure 6a into several parts:the geochemical background (labeled 4), the anomalies associ-ated with shallow man-caused gas accumulations (1 and 2), andanomalies (3) considerably confined to SPFBs.
The SPFB structure at the Qaradag area, as defined pre-viously, occurred as a result of reservoir pressure drop duringreservoir depletion. The process of the SPFB structure formationpersists today as well. Without getting into specifics, “reservoirpressure – gas inventory” hystereses at the UGS are indicativethat some SPFB 1 periodically become permeable at maximalpressure values. The elongated anomalies of type (3) in Fig-ure 6b are likely to correspond to such “flickering” SPFBs.
These results strongly suggest that SPFBs have deep roots,much deeper than those of Horizon VII+VIIa. The SPFBs canal-ize geogas upflow from Earth’s interior to the surface; in so
FIG. 5. Contour geochemical maps after the gas geochemical survey at the UGS Qaradag. Contents of hydrocarbons in sorbedgas in terms of percentiles of frequency distribution. (a) Abiogenic natural gas index G1. (b) Gas-condensate index G2. Dots:sampling points. Red lines: the SPFBs 1.
Dow
nloa
ded
by [
Mir
Kar
ger]
at 2
2:52
17
July
201
5
110 CANADIAN JOURNAL OF REMOTE SENSING/JOURNAL CANADIEN DE TELEDETECTION
FIG. 6. Helium content in subsoil air after the gas geochemical survey. (a) Contour geochemical map of Helium (in commonlogs of concentration [10−3 % vol.]). (b) Log-log graph of Helium concentration (He) versus area A plot. Gray lines in Figure a:SPFBs 1. Numbers within circles denote parts of geochemical field with distinct power-law relationships. See text for explanation.
doing, the SPFBs keep geochemical individuality of geogas.The block structure, divided by SPFB, is equal – both at thedepositional level of horizon VII+VIIa and at the day surface.
In summary, the entire formation looks like a system con-structed of prismoidal segments, each having a size of kilome-ters in vertical dimension and hundreds of meters in horizontaldimensions. The segments are faceted by the barriers and per-manently oscillate relative to each other. Geogases, and volatilehydrocarbons among them, pass upward through the systemalong the barriers. If the system encloses a hydrocarbon pool,the barriers in certain pressure situations can compartmentalizeit.
CONCLUDING REMARKSIn closing, it may be said about the SPFBs that they are rel-
atively small-scaled, geodynamically active faults in variablystress and deformation states. They are partitioning differen-tially mobile blocks of the upper crust. They act as conduits forupward fluid seepage from depth to the surface.
The presented methodology for early detection of SPFBshas, in arsenal, the methods focused on detection of surfacesignals from deep geodynamic and fluid-dynamic events: SARinterferometry and surface gas geochemistry as the methods fordetection of boundaries between the mobile blocks followed bysurface geochemical anomalies of geogas. These methods, to-gether with some additional techniques for separation of SPFBsfrom other faults, do well at green fields. At brown fields, theycan be enhanced with seismic, borehole, and production data.
In the UGS Qaradag case study, we dealt with a geologicsystem that has been in an artificially activated state for decades.Therefore, the movement amplitudes in the system are relativelylarge and, thus, measurable with comparatively rude techniques.
In a “green field” situation, it is reasonable to expect much loweramplitudes, which could be measured with more sophisticatedtechniques, including persistent scatterers techniques applied toshorter wavelength SAR data.
ACKNOWLEDGMENTSThe authors deeply appreciate Dr. Lev B. Berman for his
initiatives and enthusiasm in investigation of block structure ofoil and gas pools. We commemorate Dr. Vilen Neiman; with hisgeophysical interpretation, he made irreplaceable contributionto this study. Dr. Valeriy Yudin from the Institute for SystemsAnalysis RAS (Russia) is thanked for useful discussions andadvises. We state with thankfulness that the success of this studyowes to much extent to support and assistance by Dr. XoshbahtYusifzadeh, First Vice-President of SOCAR (Azerbaijan).
REFERENCESBerman, L., Karger, M., Ryzhik, V., and Trofimov, D. 2010. “Recog-
nition of block-filtration structure of oil and gas reservoirs for thepurpose of hydrocarbon withdrawal enhancement.” In Prediction ofsedimentary cover structures in the south of East Siberia by usingsatellite data, 59–88. Korolev: Astrozond (in Russian).
Berman, L.B., Neiman, V.S., Karger, M.D. 1987. Well-logging foraccelerated exploration of gas fields. Moscow: Nedra(in Russian).
Cameron, E.M., Hamilton, S.M., Leybourne, M.I., Hall G.E.M, andMcClenaghan M.B. 2004. “Finding deeply buried deposits usinggeochemistry.” Geochemistry: Exploration, Environment, Analysis.Vol. 4: pp. 7–32.
Cao, J., Hub, R., Lianga, Z., Penga, Z. 2009. “TEM observation ofgeogas-carried particles from the Changkeng concealed gold de-posit, Guangdong Province, South China.” Journal of GeochemicalExploration, Vol. 101(No. 3): pp. 247–253.
Dow
nloa
ded
by [
Mir
Kar
ger]
at 2
2:52
17
July
201
5

VOL. 41, NO. 2, APRIL/AVRIL 2015 111
Carranza, E.J.M.. 2009. “Geochemical anomaly and mineral prospec-tivity mapping in GIS.” In Handbook of Exploration andEnvironmental Geochemistry, Vol. 11 edited by G.J.S. Govett. Am-sterdam: Elsevier Science BV.
Chen, Z., and Sinding-Larsen, R. 1994. “Estimating number and fieldsize distribution in frontier sedimentary basins using a Pareto model.”Natural Resources Research, Vol. 3(No. 2): pp. 91–95.
Cheng, Q. 2012. “Singularity theory and methods for mapping geo-chemical anomalies caused by buried sources and for predictingundiscovered mineral deposits in covered areas.” Journal of Geo-chemical Exploration, Vol. 122: pp. 55–70.
Cloetingh, S.A.P.L., Ziegler, P.A., Bogaard, P.J.F., et al. (33 authors).2007. “TOPO-EUROPE: The geoscience of coupled deep Earth-Surface processes.” Global and Planetary Change, Vol. 58(No. 1–4):pp. 1–118.
Djunin, V.I., and Korzun, A.V. 2010. Hydrogeodynamics of Oil andGas Basins. Dordrecht-Heidelberg-London- New York: Springer.
Durmishian, A.G. 1967. Gas Condensate Deposits in Azerbaijan.Baku: Azgosizdat (in Russian).
Endres, H., Samiee, R., Lohr, T., Krawczyk, C.M., Tanner, D.C.,Trappe, H., Thierer, P.O., Oncken, O., and Kukla, P.A. 2008. “Quanti-tative fracture prediction from seismic data.” Petroleum Geoscience,Vol. 14(No. 4): pp. 369–377.
Etiope, G., and Martinelli, G. 2002. “Migration of carrier and tracegases in the geosphere: an over-view.” Physics of the Earth andPlanetary Interiors, Vol. 129: pp. 185–204.
Farr, T.G, Rosen, P.A., Caro, E., et al. 2007. “The shuttle radar to-pography mission.” Reviews of Geophysics, Vol. 45(No. 2) (paperRG2004).
Gold, T., and Soter, S. 1985. “Fluid ascent through the solid lithosphereand its relation to earth-quakes.” Pure and Applied Geophysics, Vol.122: pp. 492–530.
Goldstein, R.M., and Werner, C.L. 1998. “Radar interferogram filteringfor geophysical applications.” Geophysical Research Letters, Vol.25(No. 21): pp. 4035–4038.
Karger, M., Trofimov, D., Eminov, A., Myasnikov, I., and Zakharov, A.2014. “The early detection of semi-permeable filtration barriers byusing SAR interferometry.” In Proceedings of the IEEE InternationalGeoscience & Remote Sensing Symposium and 35th Canadian Sym-posium on Remote Sensing, IGARSS2014, 250–253. Quebec City,Canada: IGARSS/IEEE.
Karger, M.D. 1994. “Investigation of a small tectonic dislocation.”Geoecology, Vol. 4: pp. 132–140 (in Russian).
Karger, M.D., and Sandomirsky, S.A. 1982. “Random censoring of de-posit and fault distributions.” In Express-Inform. Ser. Math. methodsin geology. VIEMS, Moscow, Issue 3, pp. 1–9.
Klusman R.W. 2009. “Transport of ultratrace reduced gases and par-ticulate, near-surface oxidation, metal deposition and adsorption.”Geochemistry: Exploration, Environment, Analysis, Vol. 9(No. 8):pp. 203–213.
Kristiansson, K., and Malmqvist, L. 1982. “Evidence for non-diffusivetransport of 222Rn the ground and a new physical model for thetransport.” Geophysics, Vol. 47: pp. 1444–1452.
Kuzmin, Yu. O. 1996. “Contemporary super-intensive deformationsof the Earth surface at the zones of platform faults.” In Geologich-eskoe izuchenie I ispol’zovanie nedr (The Earth entrails geologicstudy and use), Vol. 4. pp. 43–53. Moscow: Geoinformmark (inRussian).
Lillestøl, J., Sinding-Larsen, R., and Hood, K.C. 2012. “Distributionswith beta properties as a model for the parent size distribution ofgrown oil and gas pools.” Paper presented at the Ninth InternationalGeostatistics Congress, Oslo, Norway, June 11–15.
Liu, Q., Cheng, T., and Liu, S.H. 1998. “Comprehensive evaluation ofmechanism of ‘chimney effect’ using principles of magnetism, geo-chemistry and mineralogy.” Chinese Science Bulletin, Vol. 43(No.9): pp. 743–748.
Maerten, L., Gillespie, P., and Daniel, J.M. 2006. “Three-dimensionalgeomechanical modelling for constraint of subseismic fault simula-tion.” AAPG Bulletin, Vol. 90: pp. 1337–1358.
Nilsen, H.M., Lie, K.-A., and Natvig, J.R. 2012. “Accurate modellingof faults by multipoint, mimetic, and mixed methods.” Society ofPetroleum Engineers Journal, Vol. 17(No. 2): pp. 568–579.
Nilson, R.H., Peterson, E.W., Lie, K.H., Burkhard, N.R., and Hearst,J.R. 1991. “Atmospheric pumping: a mechanism causing verticaltransport of contaminated gases through fractured permeable me-dia.” Journal of Geophysical Research: Solid Earth, Vol. 96: pp.21933–21948.
Noble, R.R.P., Lintern, M.J., Townley, B., Anand, R.R., Gray, D.G.,and Reid, N. 2013. “Metal migration at the North Miitel Ni sulphidedeposit in the southern Yilgarn Craton: Part 3, gas and overview.”Geochemistry: Exploration, Environment, Analysis, Vol. 13:pp. 99–113.
Perevozchikov, G.V. 2012. “The hydrogen field at the Gazli field.”Neftegazovaya geologiya. Teoriya I praktika (Oil-gas geology. The-ory and practice), Vol. 7(No. 1): p. 13 (in Russian).
Putikov, O.F., and Wen, B. 2000. “Geoelectrochemistry and stream dis-persion.” In Geochemical Remote Sensing of the Subsurface, editedby M. Hale, pp. 17–122. Amsterdam: Elsevier.
Rosen, P.A., Hensley, S., Joughin, I.R., Li, F.K., Madsen, S.N.,Rodrıguez, E., Goldstein, R.M. 2000. “Synthetic aperture radarinterferometry.” Proceedings of the IEEE, Vol. 88(No. 3):pp. 333–382.
Sashourin, A.D., Panzhin, A.A., Kostrukova, N.K., and Kostrukov,O.M. 2001. “Field investigation of dynamic displacement in zone oftectonic breaking.” In Rock Mechanics - A Challenge for Society:Proceedings of the ISRM Regional Symposium EUROK 2001, pp.157–162. Balkema/CRC Press.
Shuvaeva, M., Trofimov, D., and Zakharov, A. 2012. “Structural modelof oil field limestone reservoir in Denisov depression based on ALOSPALSAR images and seismic exploration data.” In Proceedings ofIGARSS12, pp. 2726–2728. IGARSS/IEEE.
Sikka, D.B., and Shives, R.B.K. 2002. “Radiometric surveys of theRedwater oil field, Alberta: Early surface exploration case his-tories suggest mechanisms for the development of hydrocarbon-related geochemical anomalies.” In AAPG Studies in Geol-ogy, No. 48 / SEG Geophysical References Series, No. 11:pp. 243–298.
Sokolov, V.A. 1971. Geochemistry of Natural Gases. Moscow, Nedra(in Russian).
Stemberk, J., Kostak, B., Cacon, S. 2010. “A tectonic pressurepulse and increased geodynamic activity recorded from the long-term monitoring of faults in Europe.” Tectonophysics, Vol. 487:pp. 1–12.
Sugisaki, R. 1987. “Behavior and origin of helium, neon, argon andnitrogen from active faults.” Journal Geophysical Research, Vol. 92(No. B12): pp. 12523–12530.
Dow
nloa
ded
by [
Mir
Kar
ger]
at 2
2:52
17
July
201
5

112 CANADIAN JOURNAL OF REMOTE SENSING/JOURNAL CANADIEN DE TELEDETECTION
Svensen, H. 2012. “Geochemistry: Bubbles from the deep.” Nature,Vol. 483(No. 7390): pp. 413–415.
Tek, M.R. 1997. Natural Gas Underground Storage. Inventory andDeliverability. Nashua, NH: PennWell.
Tomkins, R. 1990. “Direct location technologies: a unified theory.” Oiland Gas Journal, Sept. 24: pp. 126–134.
Verscheure, M., Fourno, A., and Chiles, J.P. 2012. “Joint inversion offracture model properties for CO2 storage monitoring or oil recoveryhistory matching.” Oil & Gas Science and Technology. Rev. Institutfrancais du petrole Energies nouvelles, Vol. 67(No. 2): pp. 221–235.
Zubairayev, S.L. (Ed.), 1986. Simulation of Geochemical Fields of Oiland Gas Fields. Moscow: VNIIYAGG (in Russian).
Dow
nloa
ded
by [
Mir
Kar
ger]
at 2
2:52
17
July
201
5