an experimental investigation of runoff production in permeable soils
TRANSCRIPT

VOL. 6, NO. 2 WATER RESOURCES RESEARCH APRII, 1970
An Experimental Investigation Runol Production in Permeable Soils
THOMAS DUNNE
McGill University, Montreal, Canada
RICHARD D. BLACK
Cornell University, Ithaca, New York
Abstract. In an area of low intensity rainfall and permeable soils, three hillside plots were instrumented for a study of runoff-producing mechanisms. Runoff from the plots was meas- ured at the ground surface, the base of the root zone, and in the zone of perennial gro.und- water seepage. Data on soil moisture, water-table elevation, and piezometric head were also collected during natural and artificial storms. The data showed that, as the infiltration capacity of the soil exceeded the rainfall intensities that occurred and that were applied, overland flow generated by the mechanism described by Horton did not occur. Although soils and topography were those generally thought to be conducive to subsurface stormflow, the runoff produced by this mechanism was too small, too late, and too insensitive to fluctuations of rainfall intensity to add significantly to stormflow in the channel at the base of the hillside. When the water table rose to the surface of the ground, however, overland flow was generated on small areas of the hillside. Only when this overland flow occurred were significant amounts of stormflow contributed to the channel by the hillside. The return periods of storms that would produce such overland flow were found to be very large.
INTRODUCTION
Overland flow on large areas of hillside, de- scribed by Horton [1945] and others, has not been observed in the 43-square-mile watershed of the Sleepers River in northeastern Vermont. Infiltration capacities of the forested and pas- tured soils of the area exceed the vast majority of measured rainfall intensities. Total yields of storm runoff are small. The maximum recorded
rate of runoff on the Sleepers River Experi- mental Watershed was 0.10 inches per hour re- sulting from a rainfall of 3.37 inches in 38 hours on a 16-square-mile catchment. Runoff hydro- graphs, however, have the same general features as those from other areas where overland flow
is observed. They have the same general shape, and respond quickly to rainfall. They show many of the same kinds of relationships be- tween rainfall, runoff, and watershed condition as are recognized in areas known to experience overland flow.
In the absence of evidence of overland flow
to supply storm hydrographs, many hydrolo- gists have postulated the mechanism of subsur-
face stormflow. Whipkey [1965, p. 74] defined subsurface stormflow as underground, storm-pe- riod flow that reaches the stream channel with-
out entering the general groundwater zone. Kirkby and Chorley [1967, p. 7] used the term 'throughflow' to denote 'flow which takes place physically within the soil profile.' Hewlett and Hibbert [1965] described their concept of 'translatory flow.' They wrote, 'Above the zone of saturation, we may regard such movement as due to thickening of the water films sur- rounding soil particles and a resulting pulse in water flux as the saturated zone is approached.'
AIMS OF THE PRESENT STUDY
The magnitude and timing of subsurface con- tributions to channel runoff and the conditions
under which significant amounts of subsurface stormflow are produced are generally unknown. In the absence of universally accepted theoreti- cal tools and detailed information on the physi- cal characteristics of soils and cha•nels, the phenomena listed above can be determined only from intensive field study. To this end, a small
478

Runoff Production
catchmerit in the glaciated upland of the Sleepers River Experimental Watershed near Danville, Vermont, was selected for a detailed study of runoff production in an area of low intensity rainfall and highly permeable soils. The following report will deal only with data on contributions to streamflow from the perme- able soils of the steep hillslopes during natural and artificial rainstorms.
TI-IE EXPERIMENTAL AR•A
The watershed in which the study was con- ducted is a õ0-acre basin, carved into a glacio- lacustrine terrace that lies against a steep, till- covered hillside of well-jointed, calcareous schist. Within this watershed, a hi]lside was chosen for intensive study (Figure 1). The 0.6- acre hillside has a southerly slope that varies from 30% to 100% and has a relief of 60 feet. The surface outlet for the watershed drains the
toe of the slope. The hillside receives no drain- age from above as it is separated by a narrow, fiat-topped divide from an equally steep slope on its northern side. It has a relatively simple profile and consists of three sections which dif- fer in plan form. To the west is a section whose
479
contours are convex (plot 1); in the center is a concave portion (plot 2); and to the east the contours are straight (plot 3). Hack and Goodlett [1960], Troeh [1964], and others have suggested that there is a relationship between soil drainage and slope shape. Topography, should, therefore, be reflected in the pattern of antecedent soil moisture which is generally con- sidered to be a major control of runoff pro- duction.
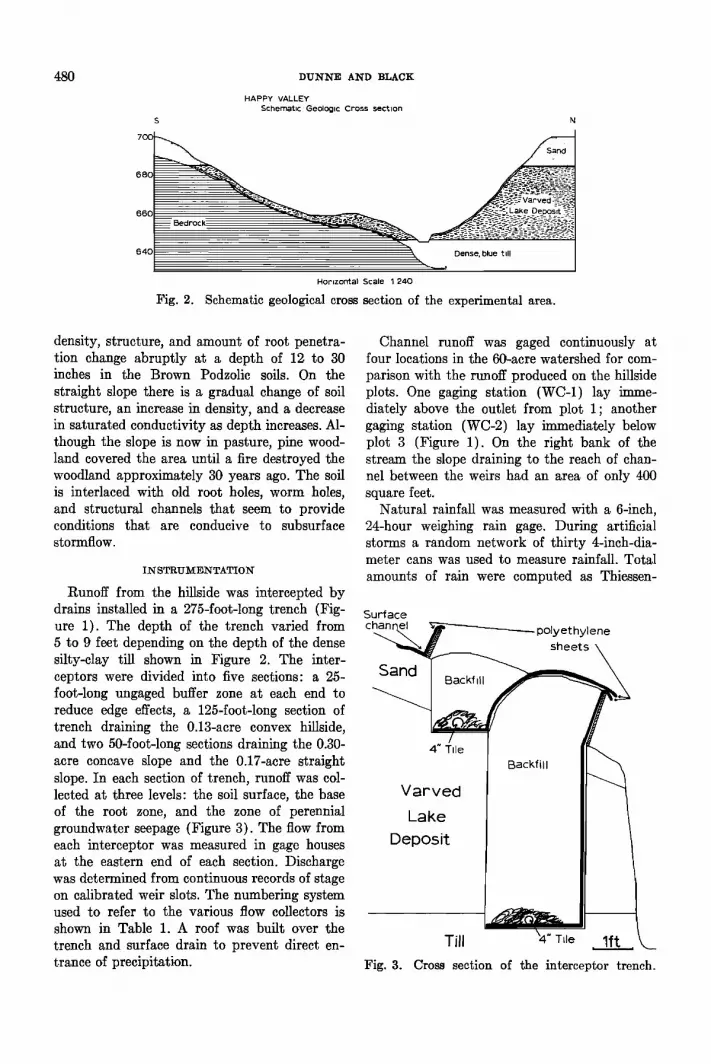
Geologically the slope is part of a dissected lake bed (Figure 2) and consists of a 22-foot- thick layer of sand (containing less than 50.% silt) overlying 38 feet of varved silt and fine sand (more than 65% silt), which in turn is founded on silty clay till. Dissection and subse- quent mass movement of sandy material down- slope has resulted in deposition of a 1- to 3- foot-thick layer of highly permeable material over the lower silt loam.
The soils of the slope are well-drained Brown Forest sandy loams on the straight, eastern section, and well-drained Brown Podzolic sandy loams on the concave, central, and convex west- ern portions. The major difference between these soils is that the saturated conductivity, bulk
TRENCH
7 /
• Weir sites
ß GH-2 Gage houses for tiles
•---' Plot boundary
0 Soil-moisture tubes & piezometers
X Wells
o 5o
Scale (ft)
ORai gh-5
Fig. 1. Map of the hillside studied.
480 DUI•'NE AND BLACK
s
700
68(
66(
640.
HAPPY VALLEY
Schernabc Geologic Cross section
Bedrock' ' '
•,•, Dense, blue till Horizontal Scale 1 240
Fig. 2. Schematic geological cross section of the experimental area.
density, structure, and amount of root penetra- tion change abruptly at a depth of 12 to 30 inches in the Brown Podzolic soils. On the
straight slope there is a gradual change of soil structure, an increase in density, and a decrease in saturated conductivity as depth increases. Al- though the slope is now in pasture, pine wood- land covered the area until a fire destroyed the woodland approximately 30 years ago. The soil is interlaced with old root holes, worm holes, and structural channels that seem to provide conditions that are conducive to subsurface
stormflow.
I N STRUM EN TATI 0 N
Runoff from the hillside was intercepted by drains installed in a 275-foot-long trench (Fig- ure 1). The depth of the trench varied from 5 to 9 feet depending on the depth of the dense silty-clay till shown in Figure 2. The inter- ceptors were divided into five sections: a 25- foot-long ungaged buffer zone at each end to reduce edge effects, a 125-foot-long section of trench draining the 0.13-acre convex hillside, and two 50-foot-long sections draining the 0.30- acre concave slope and the 0.17-acre straight slope. In each section of trench, runoff was col- lected at three levels: the soil surface, the base of the root zone, and the zone of perennial groundwater seepage (Figure 3). The flow from each interceptor was measured in gage houses at the eastern end of each section. Discharge was determined from continuous records of stage on calibrated weir slots. The numbering system used to refer to the various flow collectors is shown in Table 1. A roof was built over the
trench and surface drain to prevent direct en- trance of precipitation.
Channel runoff was gaged continuously at four locations in the 60-acre watershed for com-
parison with the runoff produced on the hillside plots. One gaging station (WC-1) lay imme- diately above the outlet from plot 1; another gaging station (WC-2) lay immediately below plot 3 (Figure 1). On the right bank of the stream the slope draining to the reach of chan- nel between the weirs had an area of only 400 square feet.
Natural rainfall was measured with a 6-inch, 24-hour weighing rain gage. During artificial storms a random network of thirty 4-inch-dia- meter cans was used to measure rainfall. Total
amounts of rain were computed as Thiessen-
Surface
ch_ann•el • polyethylene
_• '- •he-e•s •
V ar'ved I II _ I It
Till
Fig. 3. Cross section of the interceptor trench.

Runoff Production 481
weighted averages of the water caught in these cans.
A nuclear depth probe was used to measure soil moisture. Three access tubes, 7 feet deep, were placed in each plot (Figure 1): one at the base of the slope, one halfway up the slope, and one three-quarters of the way up the slope. Readings were taken weekly throughout the year, daily during snowmelt, before and after natural rainstorms, and several times during and after artificial rainstorms.
Measurements of water-table elevations were
made in •-inch pipes at the 12 locations shown in Figure 1. Readings were taken weekly throughout the year, several times daily during snowmelt, and every few minutes during natural and artificial rainstorms. Soil water pressure was measured in •-inch diameter piezometers at the locations shown in Figure 1. A set of four piezometers at depths of 10, 8, 6, and 4 feet was located at each station. Two-foot-
deep piezometers were also installed at locations 1 and 2. Piezometric readings were made at the same time as the water-table measurements.
EVENTS STUDIED
Data were collected in the following types of events:
1. Summer storms.
2. Large, natural autumn storms on unusu- ally wet antecedent conditions.
3. Simulated rainstorms of high return pe- riod.
4. Natural rainstorms that occurred so soon
after the simulated storms that they could be considered as a part of the same event.
RESULTS
Summer Storms
Thirty-five storms ranging in amount up to 1.09 inches were recorded during the course of the study. The maximum 5-minute and 30- minute intensities of these storms were 3.12
inches and 1.18 inches per hour respectively. The return periods of the storms were less than two years. A larger, more intense storm occurred after one of the artificial rainstorms, but this will be discussed separately.
No significant storm runoff was produced on the hillside in these storms. Neither overland flow nor flow from the base of the root zone
TABLE 1. Numbering System Used in Referring to the Various Flow Collectors in the Interceptor
Trench
Plot
Level of Convex Concave Straight Collector (1) (2) (3)
Surface 1-1 2-1 3-1 Base of root zone 1-2 2-2 3-2
Zone of perennial seepage 1-3 2-3 3-3
were measured. Flow from the lower tiles oc-
curred throughout the summer but did not usually respond to individual rainstorms. Groundwater discharge began to respond slightly after a period of rainy days, but the maximum outflow rate during the summer of 1967 was only 0.0009 cfm per foot of channel, (equivalent to 1.31 cfm for a drainage density of eight miles per square mile, which is an aver- age for the subwatersheds of the Sleepers River Experimental Watershed). As it is a central thesis of this paper that runoff production is spattally nonuniform, to express runoff in inches and inches per hour would therefore be mislead- ing, especially for very small watersheds. In this paper, runoff volumes are expressed in cu- bic feet and runoff rates are expressed in cubic feet per minute (cfm).
The reasons for the lack of runoff were the
high infiltration capacity and storage capacity of the soils on the hillside. The infiltration ca-
pacity of these soils was measured to be greater than 3.15 inches per hour. From June 1, 1967, to October 1, 196.7, the storage capacity of these soils exceeded any rainfall event that has been measured at a nearby gage in the last 76 years. Measurement of soil moisture before and after
storms showed that rainwater was stored in the
upper three feet of soil during the storm and drained slowly to the water table during the next few days. Throughout the summer months, the water table stood 4 to 5 feet below the cen-
ter of plot 2. It appears, therefore, that summer storms
having a recurrence interval of less than two years do not exceed the soil moisture deficit and replenish the water table during the course of a storm. Nor does rainfall occur with sufficient
intensity and duration to form a perched water table within the root zone. Yet streamflow in

482 DUNhIE AND BLACK
the watershed responds quickly to every one of these storms.
Large, Natural Autumn Sio.rms
In the early part of October 1967 the soil gradually became wetter, and the water table stood closer to the surface than in the preceding summer months. It was therefore more probable that rainfall would displace soil water in the vadose zone [Horton and Hawkins, 1965], caus- ing a response of the water table and conse- quent subsurface stormflow. Conditions were made even more favorable for this process by adding water to the slope during the testing of an irrigation system and during artificial storms.
In spite of the wet antecedent condition of the hillside, the response of runoff to heavy rains was slight. On October 10, 1967, a 1.35- inch rainstorm with a maximum 30-minute in-
tensity of 0.62 inches per hour (recurrence in- terval of less than two years) occurred when the water table at well D was only 2.1 feet below the ground surface. Table 2 shows the amounts and lag times of stormflow generated by this rainfall on each of the plots. The total
amounts o.f rain falling on each plot are included for comparison. The data demonstrate that even when the antecedent soil moisture is abnormally high, heavy rains produce a negligible amount of subsurface storm runoff, and that this run- off lags the beginning of rainfall by one or more hours. During the same 10-hour period covered by the data in Table 2, 377 cubic feet of chan- nel runoff were generated between weirs WC-1 and WC-2. Similar results were obtained in
other autumn storms.
Another characteristic of the stormflow from
this slope was its lack of sensitivity to changes in rainfall intensity, despite the sensitivity of streamflow at the base of the slope. Figure 4 presents a summary of data on rainfall intens- ity, water-table elevations, and runoff for the 0.70-inch storm of October 18, 1967. This storm occurred on soils that were extremely wet be- cause of irrigations and heavy rains during the preceding two weeks. The water-table depths in wells C, D, and E before the storm were 1.3 feet, 1.35 feet, and 2.7 feet respectively. In spite of the proximity of the water table to the ground surface, only in well D did the water table begin to respond during the first hour of
TABLE 2. Amounts of Rainfall and Stormflow, and the Time Lags between the Beginning of Rainfall and the Initial Response of Flow from each of the Tiles on the Trenched Slope during the 1.35-inch Rain-
storm of October 10-11, 1967
Stormflow,* Stormflow,* Time Lag, cubic feet inches minutes
Convex hillside
Plot l Rainfall 628. 1.35
Channel 1-1 1.7 0. 004 36 Tile 1-2 2.8 0.006 204 Tile 1-3 33.4 0.072 80
Concave hillside
Plot 2 Rainfall 1470. 1.35
Channel 2-1 8.0 0.007 54 Tile 2-2 15.2 0. 014 195 Tile 2-3 12.0 0.012 142
Straight hillside Plot 3
Rainfall 679. 1.35 Channel 3-1 0 0 Channel 3-2 0 0 Channel 3-3 1.7 0.003 260
* Stormflow is defined as total flow minus base flow for the 10-hour period from 1900, October 10 to 0500, October 11.

Runoff Production 483
rainfall. Discharge from tile 2-3 followed the same pattern as that of the water-table eleva- tions. It began to increase after channel runoff had declined and did not show the marked
sensitivity to changes of rainfall intensity dem- onstrated by the flow from weir WC-2. Neither overland flow nor flow from the base of the
root zone occurred in this storm. The storm
produced only 15 cubic feet of stormflow out of the 1516 cubic feet of rain that fell on the
three plots.
Large Artificial Rainstorms
Data from natural rainstorms showed that
even the concave plot (2) with its steep slope, shallow impeding layer, and unusually wet soil conditions could not produce significant amounts of subsurface stormflow to supply the respon- sive channel hydrograph in the vast majority of storms that occur on this area. Artificial
storms were therefore produced on plots 2 and 3 to study the processes that would occur in rare large storms. The return period of these storms varied from two to greater than 100 years. It is difficult to judge the return period of the antecedent soil moisture conditions, since only one year of soil moisture and ground- water data are available. Weather during that year was normal, however, and conditions be- fore each storm can be roughly compared with those during the rest of the year. The reactions of the plots were different because of the differ- ences in soils and topographic form. Space does not permit presentation of all the data on which the following description is based. For further details the reader is referred to a report by Dunne [1969].
On October 25, 196.7, a 1.72-inch storm last- ing two hours delivered 1902 cubic feet of water to the concave plot (2) at the rate of 15.8 cfm. The return period of this rainfall in the study area is approximately 25 years [U.S. Weather Bureau, 1955]. Because of heavy rains and irri- gations in the previous month the soil was as wet as it had been during the snowmelt period, which is the wettest time of the year in this area. Before the storm, depths to the water ta- ble at wells C, D, and E were 2.1 feet, 1.6 feet, and 2.2 feet respectively.
Measurements of water-table elevations, piez- ometric head, and soil moisture [Dunne, 1969.] showed that within half an hour of the onset of
'• i • Rainfall Intensi[y i i •' ' i .... '•'• i 2000 2200
ee9 I/l///////////////////////////////////// 668 1 Well E
• 2000 2200
65S •//////////////////////////////////////. ,,• /Well D •• -- , 657 -I • I • r- i i i
2000 2200
Well C
2OOO 2 O0
Tile No. 2-$
i C)•)O i i ! 2 2200
_
O5
0 i 2&O i 2•00 ' T,me (hrs)
Fig. 4. Rainfall, changes in water-table eleva- tion, and runoff fro.m tile 2-3 and weir WC-2 during and after the 0.70-inch rginstorm of Oc- tober 18, 1967.
rain a perched water table began to develop in plot 2. The water table rose to the surface over the central depression below well E. Runoff data presented in Figure 5 show the marked difference in response of stormflow from the various horizons of the soil. After rain had been
falling for 75 minutes, flow from the lower tile (2-3) began to increase slowly from its initial rate of 0.023 cfm to 0.319 cfm two hours after
the end of rainfall. Flow from the base of the
root zone (tile 2-2) began at the same time as the initial response of tile 2-3. Discharge in- creased abrupfiy to a maximum of 0.776 cfm at the end of rainfall and declined more slowly. The flow from the root zone was associated
with the rapid rise of the water table into the permeable, sandy horizon at the base of the slope.
A small trickle of water, deposited directly in the channel by the sprinklers flowed from the surface channel (2-1) during the first 65 min- utes of the storm. There was, however, no gene-

484 DLTNNE AND BLACK
I
0'50
0 25
,
• [ ! i ! t [ i i [ [ i i i i
1300 1400 1500 1600
Tile
I/! - I •- I I l"'l t I I l" t I I I I I I I I I I I 0
I'•00 1400 1500 1600 1700
o 75
0 50
025
Tile
1500 1400 1500 1600 1700
T•rne (hrs)
Fig. 5. Discharge from the three tiles drain- ing plot 2 (concave) during and after the artificial storm of October 25, 1967.
ration of Itortonian 'precipitation excess' on the slope as the rainfall intensity did not exceed the infiltration capacity of the soil to produce overland flow. Flow from channel 2-1 suddenly began to increase 65 minutes into the storm. In the 70 minutes from 1330 to 1440 the flow rate
increased from 0.027 cfm to 5.615 cfm, and 270 cubic feet of water flowed from the surface
channel. Ten minutes after the end of rainfall, the flow began to decline even more rapidly than it had risen. Water emerged from the soil surface over most of the central depression of the plot. The seepage was particularly obvious below slight breaks of slope where the sandy loam thinned.
The water that was measured as overland
flow was a combina. tion of 'return flow' from
the upper horizon of the soil and of rain that had fallen directly onto the saturated area that developed over a small portion of the hillside in the central concavity of the plot where the water table had reached the ground surface. An attempt was made to estimate the contributions to surface runoff from the two sources men-
ticned. The area over which water was seen
flowing at the ground surface at the end of the storm was mapped. The rate of rainfall onto this area was calculated to yield the contribu- tion of direct precipitation. By the end of the 'storm 1.364 cubic feet of runoff per minute (24.3% of the peak surface runoff rate) were being produced in this way, while 4.264 elm were produced by water that had emerged from the soil surface in the central hollow of the
concave slope. It is probable that the area covered by overland flow was underestimated, since it was difficult to see some of the thin
films of overland flow around the margins of the saturated area. Apart from the possibility of this error, however, the data give values for the separate contributions that are reasonable in the light of similar calculations made for one of the natura.1 storms that produced overland flow (see later).
In the 2-hour period of the artificial storm, plot 3 received 1.94 inches (1096 cubic feet) of water. The return period of a rainfall of this magnitude in the Sleepers River Watershed is approximately 50 years [U.S. Weather Bureau, 1955]. In the absence of an impeding layer, a perched water table did not form. The water table varied in depth from 4 to 7 feet in the lower half of the plot and percolation and dis- placement of water in the unsaturated zone were so slow that the water table did not be-
gin to rise until the end of rainfall. It never reached the ground surface and so no signifi- cant stormflow was produced. The only source of runoff was that from the lower tile, which rose to a peak of 0.143 elm nine hours after the end of the storm.
Overland flow from 8'% of the irrigated area completely dominated the pattern of runoff pro- duction on the hillside during the 1.72-inch ar- tificial storm, as Figures 6 and 7 show. Al- though some of the flow had subsurface origins, and may be classified as 'interflow' according to the definition of Lindey et d. [1949], the fact that it ran over the surface was of major impor- and calculation of velocities of subsurface flow
rance. Measurement of overland flow velocities
showed that on emerging from the soil surface, the speed of the water increased by a factor of 100 to 500. This allowed a much larger quan- tity of water to be supplied to the stream chan- nel than could have been removed by subsur-

Runof] Production 485
face stormflow. The establishment of surface
runoff on this and other slopes (during other rainfalls), in effect, caused an increase in the drainage density of the watershed which drasti- cally reduced the distance which water had to travel through the soil before it reached the surface. Since velocities of subsurface flow are
so slow, even on slopes as steep and permeable as the one described in this report, the distance that water must travel through the soil is an important control of storm runoff production. If the rain had been insufficient to raise the
water table to the surface, little storm runoff would have been produced on this slope. Even when the permeable A-horizon was saturated throughout its depth, it could only convey run- off to the channel at the rate of 0'.0.16 cfm per foot of channel. This figure is small by compari- son with actual rates of channel runoff produc- tion in this 60-acre watershed. Any increase in the efficiency of the evacuation of water would therefore have a large effect on runoff produc- tion.
On October 16, 1967, a 1.14-inch artificial storm lasting two hours with a return period of three years yielded similar results. Figure 8 shows that overland flow dominated the storm
hydrograph. Soil moisture profiles and water- table elevations showed that the processes were the same as those observed on October 25. The
differences in timing and in peak flow rates could be explained in terms of differences of antecedent conditions and rainfall intensity. A 2.41-inch storm lasting two hours was produced on July 17, 1968. Although the return period of this storm is greater than 100 years and ante- cedent moisture conditions were wetter than
normal for early summer, very little storm run- off was produced. A perched water table de- veloped in plot 2, but only intersected the ground surface over a small area near the base of the concavity. By the end •f the storm the rate of surface runoff from channel 2-1 was ris-
ing rapidly, but the peak rate was only 0.802 cfm. The slope seemed to have just attained the threshold condition at which further rainfall
would produce large amounts of runoff. A nat- ural storm occurring immediately after the irri- gation confirmed this. On October 5, 1967, an artificial storm occurred in which the important threshold of saturation was not reached. The
1.03-inch storm lasted for one hour on soil con-
Time (hrs)
Fig. 6. Combined hydrograph of flows from plot 2 (concave) during the artificial storm of October 25, 1967.
ditions that were wetter than normal for early autumn. The amounts of stormflow produced by this and the other artificial storms described are listed in Table 3.
Natural Storms Following Artificial Storms
Two of the artificial storms described pre- viously were followed within a short, time by large natural storms. These storms were of shorter duration and higher intensity than the artificial storms, and they occurred on antece- dent conditions that were much wetter than
those normally encountered by the intense rains of summer. Figure 9 shows the response of run- off at various levels in plot 2 during a 0.88-inch rain that occurred 10 hours after the artificial
storm of October 25, 1967. Runoff rates and water-table elevations were receding after the artificial storm, but well readings showed that the water table rose to the surface over the
central concavity before the main burst of rain. Overland flow again dominated the hydrograph (Table 4).
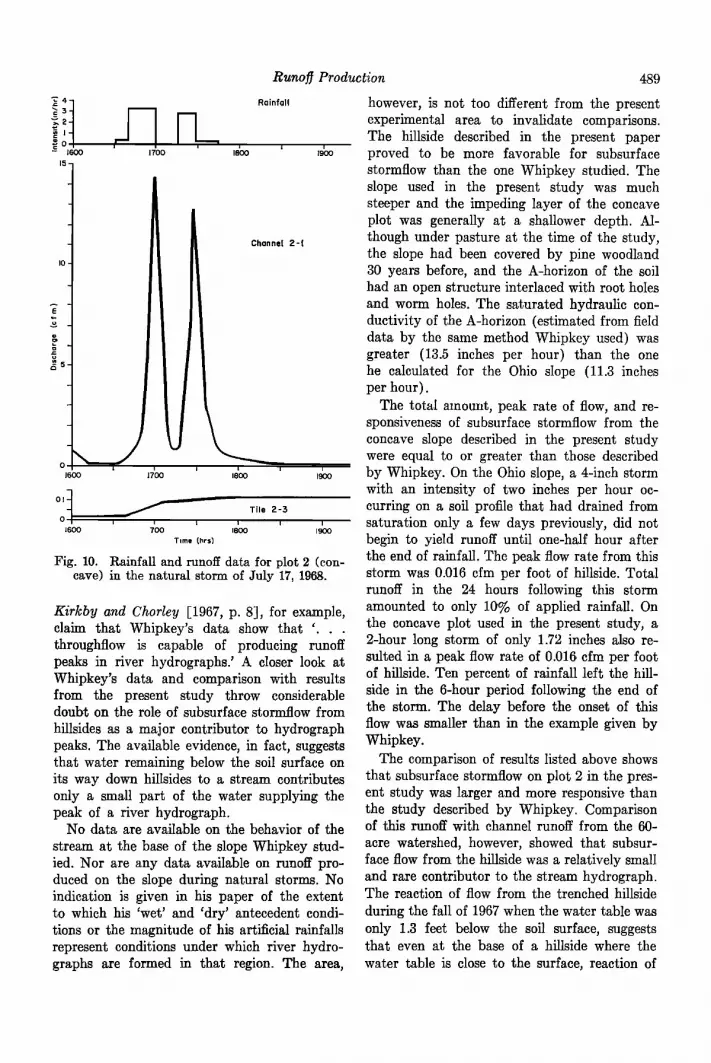
One-half hour after the end of the 2.41-inch
artificial storm of July 17, 1968, 1.83 inches of rain fell in two bursts; one burst of 3.15 inches per hour lasted for 21 minutes, and the second burst of 2.75 inches per hour lasted for 13 minutes (Figure 10). The return period of this

486 DUNATE AND BLACK
5oo
200
2-t
2-3
2-2
3-3
N ,.oo ,8•o ' ' 2,'oo ' ' & T,me (hrs)
Fig. 7. Cumulative flow for the tiles producing runoff during and after the storm of October 25, 1967.
Fig. 8.
125 -
i oo
'•075
_
• 050
025
i i i i i
• ,5•o ' Ti•e (•)
Combined hydrograph of runoff from plot 2 during the storm of October 16, 1967.

TABLE 3.
Runof• Production 487
Amounts of Stormflow in Cubic Feet Produced on Plots 2 and 3 in Artificial Rainstorms*
October 5, October 16, October 25, July 17, Source 1967 1967 1967 1968
Plot 2
Rainfall l Runoff 1139 1261 1902 1462
Channel 2-1 0 32 309 24 Tile 2-2 0 14 78 ? Tile 2-3 11 46 123 2
To tal 11 92 510 26
Plot 3 Rainfall l Runoff 494 536 1096 1109
Channel 3-1 0 0 0 0 Tile 3-2 0 0 0 0 Tile 3-3 1 6 21 0
Total 1 6 21 0
* Stormflow is defined as total flow minus base flow for the period from the beginning of rainfall until six hours after the end of rainfall in the case of the October storms. The stormflow period for the July storm is from the beginning of rainfall until one-half hour after the end of rainfall, when a large natural rainstorm began.
l See text for amounts of rainfall expressed in inches.
storm is approximately 50 years. If the natural and artificial storms are considered as one event, the return period for the combined storm is several hundred years [U. S. Weather Bureau, 1955]. Antecedent conditions were abnormally wet for an intense summer storm. The natural
rainstorm reinforced the effect of the preceding irrigation on the outflow from tile 2-3. Total stormflow from the lower part of the soil pro- file, however, was still negligible. Tile 2-2 was leaking during this storm so that no runoff could be collected. Previous irrigations when the root zone was fully saturated, however, had shown that a peak discharge rate of no more than 0.6 cfm to 0.8 cfm could be expected from tile 2-2.
Surface runoff from plot 2 reached the high- est level recorded during the study, increasing from 0.060 cfm at the beginning of the storm to 14.30,5 cfm at the end of the first intense
pulse of rain 30, minutes later (Figure 10). After a rapid recession, runoff increased from 0.802 cfm to 12.934 cfm in the second burst of rain.
Overland flow was again produced by a com- bination of return flow and direct precipitation onto the saturated area of the hillside. Mapping of the saturated area allowed a rough calcula- tion of the contributions from both sources. At the end of the first period of intense rain the approximate rate of runoff produced by direct
precipitation was 8.289 cfm, while return flow contributed runoff at the rate of 6.016 cfm. By the end of the second burst of rain the contri-
butions were 7.220 cfm from direct precipita- tion and 5.714 cfm from return flow. The contri-
bution from direct precipitation was controlled by the intensity of the rain and the area of the soil that had become saturated. As this satu-
rated area expanded throughout the storm, the area of the slope over which water could emerge from the ground surface and run quickly down- slope increased, resulting in an increase of the contribution to the hydrograph from this source.
In both natural storms, runoff from plot. 3 was negligible. Water-table elevations were 5 to 10 feet below the ground surface., and although the water table and piezometric levels rose sharply towards the end of each storm, little subsurface stormflow was measured. The data
demonstrated the extreme damping effect of unsaturated percolation and of storage and transmission in the groundwater body. Over- land flow did not occur because the water table
did not rise to the ground surface. Conse- quently only a few cubic feet of stormflow were produced.
DISCUSSION
The data collected in this Vermont watershed do not support some of the claims that have

488 DUNNE AND BLACK
O2
OI
0
Rainfall Intensity
0200 0 O0 0 O0
2-!
' • ' i i i ' o•oo ' o4•o 0600
2-2
t ol
o o•oo ' ' ' o•'oo ' ' ' o•oo
T,me (hrs)
Fig. 9. Rainfall and runoff data from plot 2 for the 0.88-inch natural storm of October 26, 1967.
been made in the recent literature on subsurface
runoff production in humid areas. Subsurface stormflow, as defined by the writers quoted in the introduction to this paper, was not an im- portant contributor to the storm hydrograph in this watershed, despite soil conditions that are generally considered ideal for such a mechan- ism. A similar study carried out on a shallow, poorly drained soil in the same catchment [Dunne, 1969] and in another basin in the same area confirmed this conclusion.
On the hillside described in this report, sub- surface stormflow produced virtually no runoff during natural storms, in spite of the fact that in the autumn of 1967 the water table was only one or two feet below the ground surface along the central concavity. Even when the water ta- ble was so close to the surface, there was a considerable volume of pore space available for storage of rainfall, and very little soil water was displaced into the stream. Storms that generally occur in this region are not of sufiq- cient magnitude to fill this storage capacity and contribute to the water table at rates sufiqcient
to produce large amounts of storm runoff. Even extreme events such as the 3.Sl-inch rainfall of
July 17, 1968, failed to produce stormflow from the straight hillside. On the concave plot, how- ever, the combination of a shallower water ta- ble and an impeding layer did allow the genera- tion of subsurface stormflow during irrigations. The runoff produced, however, was remarkable more for its small magnitude and late response than for its importance to total storm runoff. The only runoff-producing mechanism which ap- proached channel runoff in amount and sensitiv- ity was overland flow on a small concave por- tion of the hillside that comprised 5% to 10'% of the total area of plots 2 and 3. This runoff was produced by a combination of return flow and direct precipitation onto the saturated area. Only when water was released from the extreme damping effect of unsaturated and saturated subsurface percolation by breaking through the ground surface could it contribute to channel runoff at a significant rate.
The data on the relative unimportance of subsurface stormflow from the hillside are sur-
prising in view of some recent papers on this subject. Whipkey [1965] measured subsurface flow from a 36-inch-deep sandy loam forest. soil in Ohio. Although Whipkey did not claim as much, the results he obtained have been ac- cepted as proving that subsurface stormflow is a major contributor to stream hydrographs.
TABLE 4. Amounts of Stormflow in Cubic Feet Produced on Plots 2 and 3 by Natural Rainstorms
Following Artificial Rainstorms*
October 26, July 17, 1967 1968
Plot 2
Rainfall t 973 2023
Channel 2-1 64 346 Tile 2-2 46 ? Tile 2-3 45 40
Total 155 386
Plot 3
Rainfall I 511 1114
Channel 3-1 0 19 Tile 3-2 6 43 Tile 3-3 37 25
Total 43 87
* Stormflow is defined as total flow minus base
flow for the period from the beginning of rainfall until six hours after the end of rainfall.
I See text for amounts of rainfall expressed in inches.
Runo)• Production 489
- 1600
15-
1700 1800
o
1600
1600
Rainfall
Channel 2-!
,
1900
Fig. 10. cave) in the natural storm of July 17, 1968.
• Time
o I o 19oo
Time (hrs)
Rainfall and runoff data for plot 2 (con-
Kirkby and Chorley [1967, p. 8], for example, claim that Whipkey's data show that '... throughflow is capable of producing runoff peaks in river hydrographs.' A closer look at Whipkey's data and comparison with results from the present study throw considerable doubt on the role of subsurface stormflow from
hillsides as a major contributor to hydrograph peaks. The available evidence, in fact, suggests that water remaining below the soil surface on its way down hillsides to a stream contributes only a small part of the water supplying the peak of a river hydrograph.
No data are available on the behavior of the
stream at the base of the slope Whipkey stud- ied. Nor are any data available on runoff pro- duced on the slope during natural storms. No indication is given in his paper of the extent to which his 'wet' and 'dry' antecedent condi- tions or the magnitude of his artificial rainfalls represent conditions under which river hydro- graphs are formed in that region. The area,
however, is not too different from the present experimental area to invalidate comparisons. The hillside described in the present paper proved to be more favorable for subsurface stormflow than the one Whipkey studied. The slope used in the present study was much steeper and the impeding layer of the concave plot was generally at a shallower depth. Al- though under pasture at the time of the study, the slope had been covered by pine woodland 30 years before, and the A-horizon of the soil had an open structure interlaced with root holes and worm holes. The saturated hydraulic con- ductivity of the A-horizon (estimated from field data by the same method Whipkey used) was greater (13.5 inches per hour) than the one he calculated for the Ohio slope (11.3 inches per hour).
The total amount, peak rate of flow, and re- sponsiveness of subsurface stormflow from the concave slope described in the present study were equal to or greater than those described by Whipkey. On 'the Ohio slope, a 4-inch storm with an intensity of two inches per hour oc- curring on a soil profile that had drained from saturation only a few days previously, did not begin to yield runoff until one-half hour after the end of rainfall. The peak flow rate from this storm was 0.016 cfm per foot of hillside. Total runoff in the 24 hours following this storm amounted to only 10% of applied rainfall. On the concave plot used in the present study, a 2-hour long storm of only 1.72 inches also re- sulted in a peak flow rate of 0.016 cfm per foot of hillside. Ten percent of rainfall left the hill- side in the 6-hour period following the end of the storm. The delay before the onset of this flow was smaller than in the example given by Whipkey.
The comparison of results listed above shows that subsurface stormflow on plot 2 in the pres- ent study was larger and more responsive than the study described by Whipkey. Comparison of this runoff with channel runoff from the 60-
acre watershed, however, showed that subsur- face flow from the hillside was a relatively small and rare contributor to the stream hydrograph. The reaction of flow from the trenched hillside
during the fall of 1967 when the water table was only 1.3 feet below the soil surface, suggests that even at the base of a hillside where the
water table is close to the surface, reaction of

490 DUNNE AND BLACK
the saturated zone was slow by comparison with that of streamflow. Channel runoff data
incorporated into another report [Dunne, 1969] confirm this.
Signifibant amounts of stormflow were pro- duced on the hillside by return flow and by di- rect precipitation onto the saturated area that developed over a small portion of the hillside where the water table reached the ground sur- face. Although the return flow had the same origin as the flow that remained below the soil surface, its emergence from the ground caused it to have features that were lacking in its sub- surface counterpart. The first of these was its greater velocity, which was 100 to 500 times greater than the calculated velocities of sub- surface flow. This allowed more water to travel
from a larger contributing area in the time available than did the velocity of subsurface flow. The second important feature of the re- turn flow was its greater sensitivity to fluctua- tions of rainfall intensity, which could be accounted for by the short distance of flow beneath the soil. Only when the water table in- tersected the soil surface and established condi-
tions suitable for overland flow could large areas of the slope supply water to the channel with- out the impedance of many feet of subsurface flow. The generation of stormflow by direct pre- cipitation onto the saturated area was also sensi- tive to fluctuations of rainfall intensity and to the duration of the storm. At the end of rain-
fall, water drained from the surface and upper few inches of the soil within minutes, and the rate of runoff was drastically reduced. A similar process was observed during artificial storms on an area of shallow, poorly drained soils in the same watershed. In these soils subsurface storm-
flow contributed between 1% and 5% of the peak runoff rate, while direct precipitation and return flow each contributed almost 50% of the peak rate.
CONCLUSIONS
The findings of this study are in general agreement with the 'partial-area' concept of storm runoff production [Betson, 1964; Ragan, 1967]. Significant amounts of storm runoff were only produced on small areas of hillside where the water table reached the surface. Subsurface
stormflow occurred in large storms but was not an important contributor to total storm runoff
despite conditions favorable for its existence. The importance of an area of hillside as a pro- ducer of storm runoff depended on its ability to generate overland flow. This latter was the only form of runoff that occurred in sufficient amounts to make a substantial contribution to
channel runoff during storms. Furthermore, it was the only form of runoff which exhibited sensitivity to changes of rainfall intensity in a manner similar to channel runoff. A comparison of data from the two irrigated plots also con- firms the 'partial-area' concept of storm runoff production.
Acknowledgment. This study was made while the authors were employed at the USDA Sleepers River Experimental Watershed, Danville, Ver- mont.
REFERENCES
Betson, R. P., What is watershed runoff?, J. Geophys. Res., 69(8), 1541-1551, 1964.
Dunne, Thomas, Runoff production in a humid area, Ph.D. dissertation, Johns Hopkins Univer- sity, Baltimore, Maryland, 1969.
Hack, J. T., and J. C. Goodlett, Geomorphology and forest ecology of a mountain region in the Central Appalachians, 66 pp., U.S. Geol. Survey Pro•. Pap. 347, 1960.
Hewlett, J. D., and A. R. Hibbert, Factors af- fecting the response of small watersheds to precipitation in humid areas, Proc. Int. Symp. Forest Hydrol., Pennsylvania State University, University Park, 1965.
Horton, J. H., and R. H. Hawkins, Flow path of rain from the soil surface to the water table, Soil Sci., 100 (6), 377-383, 1965.
Horton, R. E., Erosional development of streams and their drainage basins, Geol. Soc. Amer. Bull., 56, 275-370, 1945.
Kirkby, M. J., •nd R. J. Chorley, Overland flow, throughflow and erosion, Int. Assoc. Sci. Hydrol. Bull., 12(2), 5-21, 1967.
Linsley, R. K., M. A. Kohler, and J. H. L. Paulhus, Applied Hydrology, 689 pp., McGraw- Hill, New York, 1949.
Ragan, R. M., An experimental investigation of partial area contributions, Berne Symposium, International Association of Science and drology, 1967.
Troeh, F. R., Landform parameters correlated to soil drainage, Soil Sci. Soc. Amer. Proc., 23, 808-812, 1964.
U.S. Weather Bureau, Rainfall intensity-duration- •'• frequency curves for selected stations in the
United States, Alaska, Hawaiian Islands and Puerto Rico, 53 pp., Tech. Pap. 25, 1955.
Whipkey, R. Z., Subsurface stormflow from forested slopes, Int. Ass. Sci. Hydrol. Bull., 10(2), 74-85, 1965.
(Man.uscript received August 6, 1969; revised December 29, 1969.)