reclamation of saline soils by partial ponding: simulations for different soils
TRANSCRIPT

www.VadoseZoneJournal.org | 4862010, Vol. 9
Reclama on of Saline Soils by Par al Ponding: Simula ons for Diff erent SoilsA tradi onal method of reclaiming salt-aff ected soils involves ponding water on a fi eld and leaching salts from the soil through a subsurface le drainage system. Because water and salts move more slowly in areas midway between drain lines than in areas near the drains, achieving a desired level of desaliniza on across the en re fi eld requires that ponding con- nue long a er areas close to the drains are already free of salts, thus causing an ineffi cient
leaching process that wastes water. A par al ponding method of leaching was recently suggested to improve the leaching effi ciency by up to 85%. In this study, we tested the par al ponding method for its poten al to save water and me by simula ng the leach-ing of salts from salt-aff ected profi les with various soil textures, le-drain depths, and soil depths. Simula ons for laboratory sand tanks and fi eld condi ons both showed that trans-port veloci es midway between drains are greater under par al ponding than under total ponding because the local hydraulic head gradient is larger under par al ponding condi- ons. As the ponded area increases toward the drain, water origina ng from areas near the
drain moves faster than water from midway between the drains. By adop ng par al pond-ing, water and me savings of 95 and 91%, respec vely, were found possible for a sandy soil. The method also showed water savings of 84% when applied to a loam soil and 99% for a layered sand over loam soil but only 13% when applied to a layered loam over sand soil.
Problems of soil saliniza on and sodifi ca on are increasing in many irrigated arid and semiarid regions where rainfall is insuffi cient to leach out salts from the vadose zone. An estimated 45 million ha out of a total 230 million ha (19.5%) of irrigated land worldwide, and 32 million out of 1500 million ha (2.1%) of dry land, are salt aff ected to varying degrees (Ghassemi et al., 1995). Some 0.25 to 0.5 million ha of land around the world are lost from production every year as a result of soil salinization (FAO, 2002).
Salinity problems in Pakistan mirror these global trends. Irrigated agriculture in Pakistan is mainly confi ned to the Indus plains. About 33 million Mg of salt per year is moved into these plains by the Indus River and its tributaries. Of this total, about 24 million Mg is retained in the Indus basin each year, with 13 million Mg staying in the Punjab province and 10 million Mg in the Sindh province (Mughal, 2002). Th ese provinces are experienc-ing severe irrigation-induced salinity problems. Approximately 6.3 million ha of land are aff ected by salinity (Alam et al., 2000), 3.45 million ha due to irrigation (Pakistan Ministry of Food, Agriculture and Livestock, 2005). Productive land in Pakistan is being damaged by salinity at a rate of about 40,000 ha yr−1 (Alam et al., 2000). Th is suggests that fertile land is being converted into unproductive, salt-aff ected soils at a rate of about 110 ha d−1. Soil salinity may be depriving Pakistan of about 25% of its potential production of major crops (World Bank, 1992)
A common practice in Pakistan and elsewhere is to leach salts from aff ected soils. Small ridges (called bunds) are constructed around an entire fi eld, good-quality water is ponded on the soil surface, and the salts are leached from the root zone to deep groundwater or to nearby surface waters, either directly or via tile drains. Because of more rapid infi ltration and shorter travel distances, areas above the drains in tile-drained systems are leached far more quickly using this method than areas midway between the drains (Youngs and Leeds-Harrison, 2000). Th us, to achieve a desired level of desalinization across an entire fi eld, ponding needs to continue long aft er areas close to the drains are already free of salts. Th is process wastes large amounts of good-quality water that could be used for irrigation or other purposes.
Complete surface ponding of tile-drained fi elds is an ineffi cient method of leaching salts because of large diff erences in infi ltra on that exist across the field. Simulations with HYDRUS-2D/3D were used to inves -gate an alterna ve, water-conserving, par al ponding, leaching strategy for various soil textures and profi les.
A.A. Siyal, Dep. of Land and Water Mana-gement, Sindh Agriculture Univ., Tandojam, Pakistan; T.H. Skaggs, U.S Salinity Lab., 450 W. Big Springs Rd., Riverside, CA 92507; and M.Th. van Genuchten, Dep. of Mechanical Engineering, COPPE/LTTC, Federal Univ. of Rio de Janeiro, Rio de Janeiro, RJ 21945-970, Brazil. *Corresponding author ([email protected]).
Vadose Zone J. 9:486–495doi:10.2136/vzj2009.0129Received 19 Sept. 2009.Published online 3 May 2010.
© Soil Science Society of America5585 Guilford Rd. Madison, WI 53711 USA.All rights reserved. No part of this periodical may be reproduced or transmi ed in any form or by any means, electronic or mechanical, including photo-copying, recording, or any informa on storage and retrieval system, without permission in wri ng from the publisher.
Original Research
A.A. Siyal*T.H. SkaggsM.Th. van Genuchten
www.VadoseZoneJournal.org | 487
Calculations by Youngs and Leeds-Harrison (2000), using an analytical solution for seepage to a tile drain, revealed that more uniform and effi cient leaching can be achieved by dividing the salt-aff ected fi eld into strips separated by bunds, and then fl ood-ing the fi eld incrementally, starting from strips located midway between the drains and progressing toward strips located over the drains. Termed partial ponding, this method progressively increases the area of the fi eld under ponding. For the conditions studied, Youngs and Leeds-Harrison (2000) found that the partial ponding method required as much as 84% less water to leach a soil than uniform ponding and 76% less time. While their theo-retical analysis was for coarse-textured soils, they suggested that the methodology should also be suitable for fi ne-textured soils. Th e partial ponding concept was recently tested by Mirjat et al. (2008) and Mirjat and Rose (2009) using laboratory sand tanks. Th eir results were relatively close to the theoretical predictions by Youngs and Leeds-Harrison (2000). Th e experiments by Mirjat and Rose (2009) and Mirjat et al. (2008), however, were limited to uniform sand. A need exists to test the partial ponding concept for fi ne-textured and layered soil profi les. Computer models such as HYDRUS-2D/3D (Šimůnek et al., 2006) that simulate water and solute transport in two-dimensional, variably saturated media would be appropriate tools for such an analysis.
Th e objective of this study was to use variably saturated fl ow mod-eling to evaluate the partial ponding leaching technique (Youngs and Leeds-Harrison, 2000; Mirjat and Rose, 2009). We used HYDRUS-2D/3D to evaluate the leaching of salts from sand tanks as studied by Mirjat et al. (2008), as well as to perform several leaching simulations for fi eld conditions. Th e simulations considered full and partial ponding, initially saturated and unsatu-rated conditions, and various drain and soil depths, soil textures, and soil layering.
Numerical Simula onsGoverning Flow and Transport Equa onsSimulations of the partial leaching problem using HYDRUS-2D/3D were based on the standard Richards equation for fl ow and the equilibrium advection–dispersion equation for solute transport in a two-dimensional, variably saturated medium. For a two-dimensional isotropic medium, the Richards equation is given by
( )( ) ( )
⎡ ⎤⎢ ⎥−⎢ ⎥⎢ ⎥⎣ ⎦
∂θ ∂ ∂=∂ ∂ ∂ 2ij i
i j
hh h
ht x x
KK [1]
where θ is the volumetric water content [L3 L−3], h is the soil water pressure head [L], t is time [T], xi (i = 1,2) are spatial coordinates [L] with x = x1 and z = x2 in this study representing the hori-zontal and vertical (positive downward) coordinates, respectively, and Kij(h) is the soil hydraulic conductivity tensor [L T−1]. For an isotropic medium, the off -diagonal entries of Kij are zero, while the
main diagonal entries (K11 and K22) are equal to the unsaturated hydraulic conductivity, K(h). For the soil hydraulic properties θ(h) and K(h), we used the equations of van Genuchten (1980):
( ) ( )θ −θθ = θ + = −
⎡ ⎤+ α⎢ ⎥⎣ ⎦vg
s rr vg
vg
1 11 | |
mnh m n
h [2]
( ) ( )⎡ ⎤= − −⎢ ⎥⎢ ⎥⎣ ⎦
21/
s e e1 1mmK h K S S [3]
where θr and θ s are the residual and saturated water contents, respectively [L3 L−3], αvg [L−1] and nvg (dimensionless) are empiri-cal shape parameters, Ks is the saturated hydraulic conductivity [L T−1], and Se is the eff ective saturation:
( )( )θ −θ
=θ −θes r
rhS h [4]
Assuming no sorption or decay reactions, the standard advection–dispersion equation for solute transport is given by
( ) ⎛ ⎞∂ θ ∂ ∂ ⎟⎜ ⎟⎜= θ − ⎟⎜ ⎟⎜∂ ∂ ∂ ⎟⎜⎝ ⎠ij i
i j
C CC
t x xD q [5]
where C is the solution concentration [M L−3]; Dij is the disper-sion coeffi cient tensor [L2 T−1], described here using standard expressions (e.g., Bear, 1972) involving the longitudinal (εL) and transverse (εT) dispersivities [L] but without the contribution of diff usion in the liquid phase; and qi is the volumetric fl uid fl ux density vector [L T−1] given by the Darcy–Buckingham law.
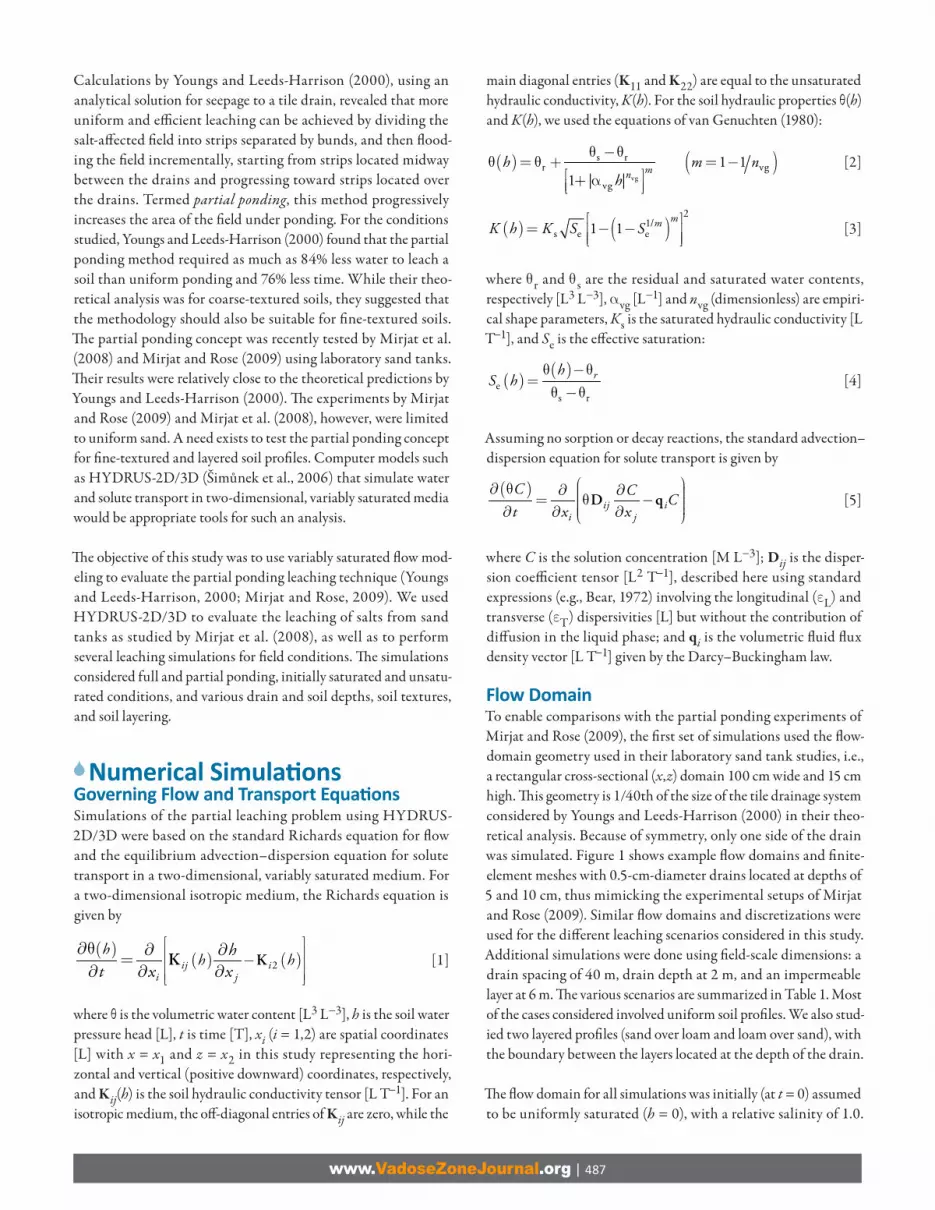
Flow DomainTo enable comparisons with the partial ponding experiments of Mirjat and Rose (2009), the fi rst set of simulations used the fl ow-domain geometry used in their laboratory sand tank studies, i.e., a rectangular cross-sectional (x,z) domain 100 cm wide and 15 cm high. Th is geometry is 1/40th of the size of the tile drainage system considered by Youngs and Leeds-Harrison (2000) in their theo-retical analysis. Because of symmetry, only one side of the drain was simulated. Figure 1 shows example fl ow domains and fi nite-element meshes with 0.5-cm-diameter drains located at depths of 5 and 10 cm, thus mimicking the experimental setups of Mirjat and Rose (2009). Similar fl ow domains and discretizations were used for the diff erent leaching scenarios considered in this study. Additional simulations were done using fi eld-scale dimensions: a drain spacing of 40 m, drain depth at 2 m, and an impermeable layer at 6 m. Th e various scenarios are summarized in Table 1. Most of the cases considered involved uniform soil profi les. We also stud-ied two layered profi les (sand over loam and loam over sand), with the boundary between the layers located at the depth of the drain.
Th e fl ow domain for all simulations was initially (at t = 0) assumed to be uniformly saturated (h = 0), with a relative salinity of 1.0.
www.VadoseZoneJournal.org | 488
For the sand tank simulations, a constant pressure head of 0.5 cm (i.e., 0.5 cm of water ponding) was imposed on all or part of the soil surface boundary, depending on the invoked leaching scenario, and zero fl ux on the remainder. For the fi eld-scale simulations, the ponding depth was 20 cm. A third type (Cauchy type) boundary condition was used to prescribe the concentration fl ux along the ponded surface, with the incoming water being salt free (C = 0). Th e bottom, right, and left boundaries were assumed to be zero-fl ux boundaries for both water and salt. Th e drain boundary was specifi ed as a seepage face for water fl ow and as a zero concentra-tion gradient for solute transport.
Soil Hydraulic and Solute Transport ParametersFor the sand tank simulations, we assumed hydraulic proper-ties similar to those of the Mirjat et al. (2008) experiments. Th e hydraulic parameters in Eq. [2] and [3] were estimated with the Rosetta pedotransfer functions (Schaap et al., 2001) using as input soil texture (sand) and bulk density (1.63 g cm−3) as reported by Mirjat et al. (2008) to obtain the following estimates: θr = 0.05, θs = 0.34, Ks = 0.89 cm min−1, αvg = 0.031 cm−1, and nvg = 4.43. Th e values for θ s and Ks estimated in this way compared favor-ably with the porosity (0.37) and saturated conductivity (0.84 cm min−1) values estimated by Mirjat et al. (2008) (they did not esti-mate unsaturated hydraulic parameter values). For simulations on the loam soil, we used soil textural class averages as estimated by Carsel and Parrish (1988): θr = 0.078, θs = 0.43, Ks = 0.017 cm min−1, αvg = 0.036 cm−1, and nvg = 1.56.
For the solute transport simulations, we assumed that for the simu-lated fl ow velocities and transport times, molecular diff usion was negligible relative to hydrodynamic dispersion (Skaggs and Leij, 2002). Th e longitudinal dispersivity was set equal to one-tenth of the depth of the fl ow domain (i.e., εL = 1.5 or 3.0 cm), which
is consistent with various studies indicating that εL is about one-tenth the scale of a transport experiment (Beven et al., 1993; Cote et al., 2003). Th e transversal dispersivity (εT) was assumed to be one-tenth of the longitudinal dispersivity (e.g., Hanson et al., 2006). Solute sorption or decay were not considered.
Leaching Time Required with Complete PondingWith complete ponding, hydraulic head gradients along the surface are much greater in the vicinity of the drain than elsewhere, such that most of the drain fl ow originates from the area above the drain (Kirkham, 1949). Consequently, the area above the drain leaches much more quickly than the area midway between drains. Let n be the fraction of the total drain fl ow that originates from a narrow section of the fi eld that is midway between drain lines, has a width of Δs, and is parallel to the drain line. Th en, assuming piston fl ow, the depth of leaching below the section during time t will be z = nQt/fΔs, where f is the saturated water content of the soil and Q is the drainage fl ux [L2 T−1]. If Z is the targeted depth of leaching, then the time T required for desalinization is
Δ=
f sZT
nQ [6]
Th e parameters n and Q can be computed with HYDRUS for a given Δs and ponding depth. Note that in the case of complete ponding, the target depth of leaching refers to the area midway between drains.
Leaching Times Required with Par al PondingTh e partial leaching approach by Youngs and Leeds-Harrison (2000) is based on the premise that more effi cient and uniform leaching can be achieved by dividing the soil surface into strips
Fig. 1. Typical geometries and fi nite element meshes for the fl ow domains used in the HYDRUS-2D/3D salt leaching simulations.
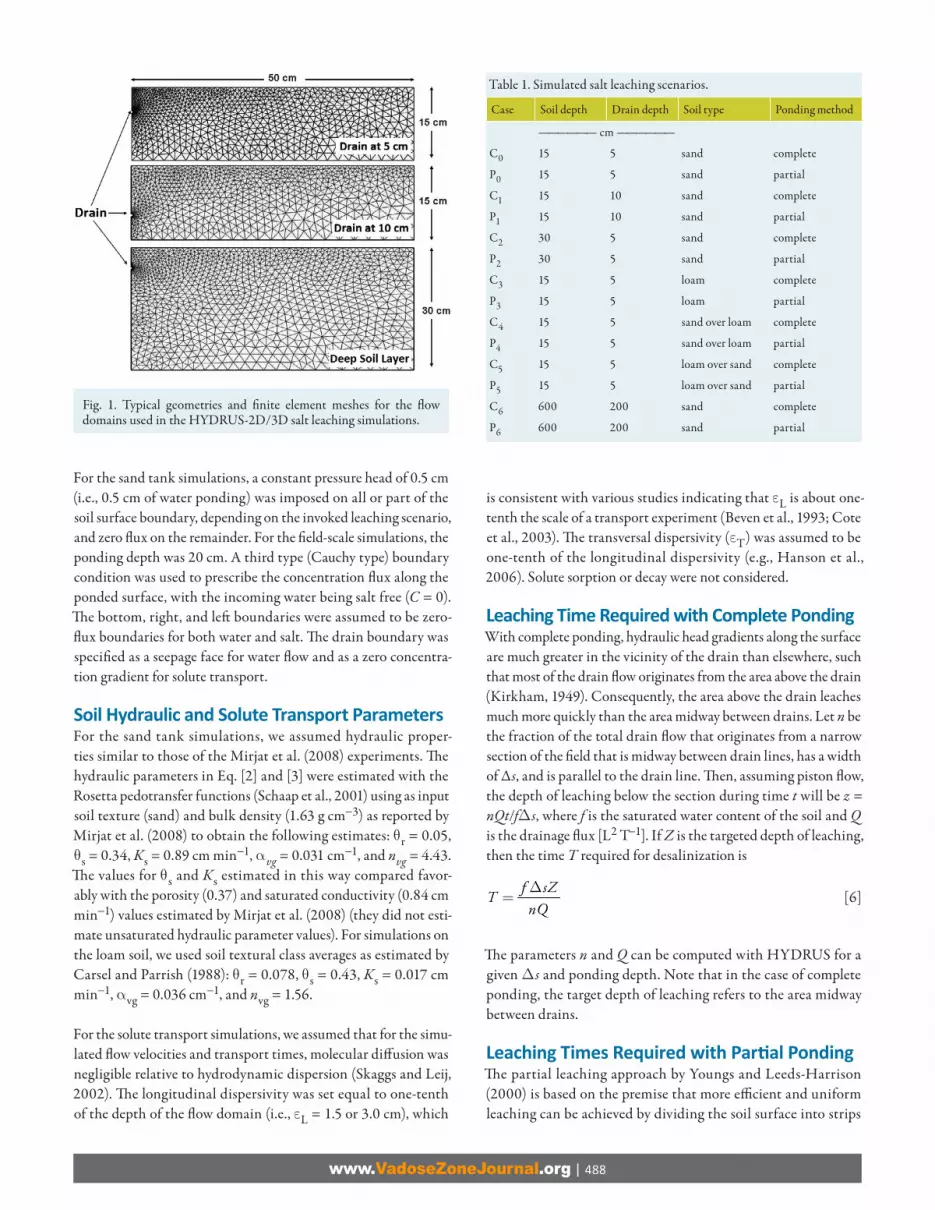
Table 1. Simulated salt leaching scenarios.
Case Soil depth Drain depth Soil type Ponding method
—————— cm ——————
C0 15 5 sand complete
P0 15 5 sand partial
C1 15 10 sand complete
P1 15 10 sand partial
C2 30 5 sand complete
P2 30 5 sand partial
C3 15 5 loam complete
P3 15 5 loam partial
C4 15 5 sand over loam complete
P4 15 5 sand over loam partial
C5 15 5 loam over sand complete
P5 15 5 loam over sand partial
C6 600 200 sand complete
P6 600 200 sand partial
www.VadoseZoneJournal.org | 489
separated by bunds, and progressively increasing the fl ooded area from strips midway between the drains toward the drains until the whole area is fl ooded. Implementing this approach requires estimates of the leaching times for each stage such that at the end of the fi nal stage the cumulative leaching in each strip will equal the desired target depth, Z. Youngs and Leeds-Harrison (2000) and Mirjat and Rose (2009) provided a procedure for calculat-ing the required fl ooding times, which we summarize here. For more detail, see Youngs and Leeds-Harrison (2000) and Mirjat and Rose (2009).
Assume that the drains are separated by a distance 2D and that the area between the drains is divided into 2N strips, such that the strips have a width D/N. According to the strategy of Youngs and Leeds-Harrison (2000), the fi rst strip midway between the drains is fl ooded for a time period t1, aft er which the bund between the fi rst and second strip is broken to allow fl ooding of the second strip. Strips 1 and 2 are kept ponded for a time period t2, aft er which the third strip is included and the three strips are fl ooded together for a time period t3. Th e fourth strip is incorporated next, with the process continuing until all N strips are included and the whole area is fl ooded.
Th e times ti needed to obtain uniform removal of salt to a target depth Z across the whole area can be estimated from the system of equations (Youngs and Leeds-Harrison, 2000)
( )( )== =
∑ ,1,...,
Ni j i ii j n Q t
Z j ND N f
[7]
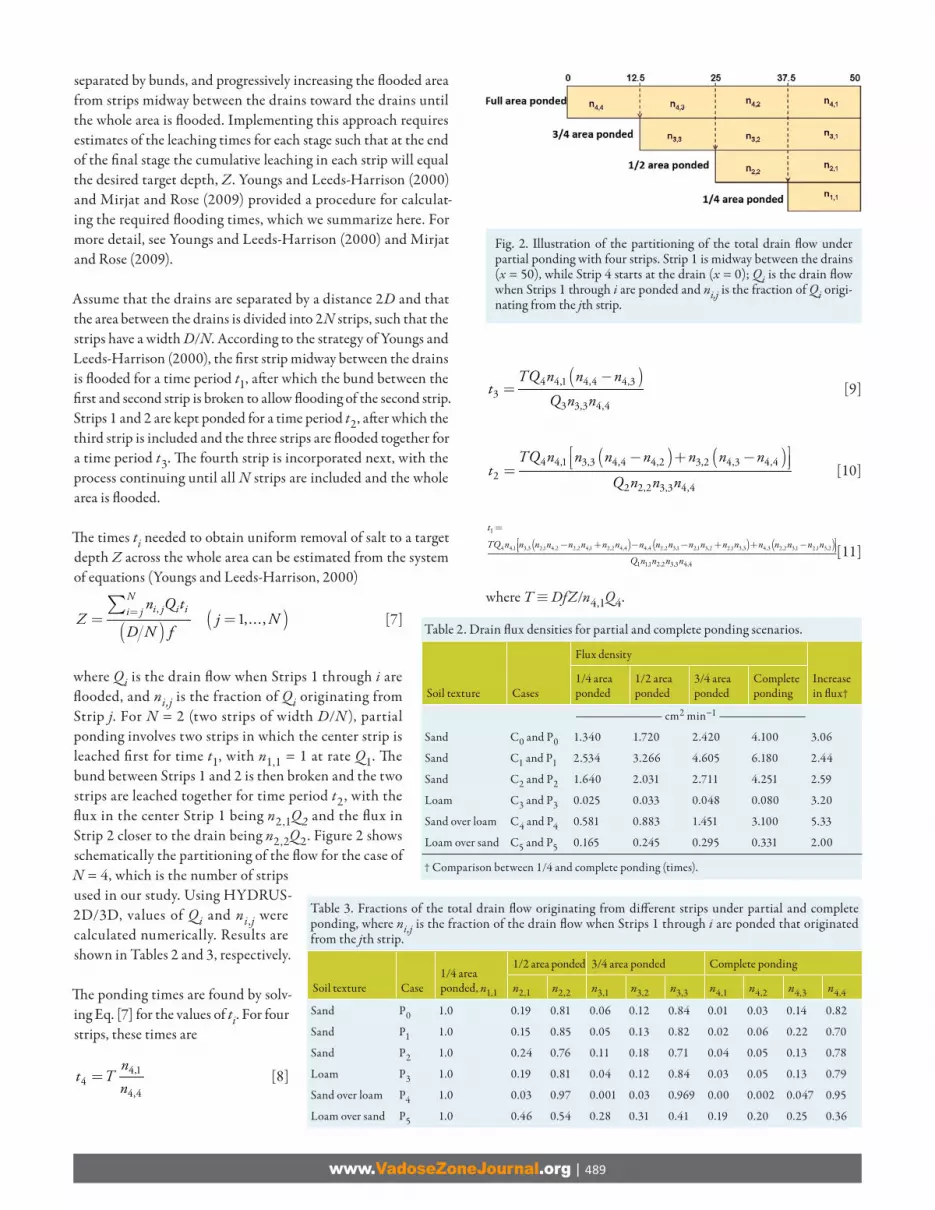
where Qi is the drain fl ow when Strips 1 through i are fl ooded, and ni,j is the fraction of Qi originating from Strip j. For N = 2 (two strips of width D/N), partial ponding involves two strips in which the center strip is leached fi rst for time t1, with n1,1 = 1 at rate Q1. Th e bund between Strips 1 and 2 is then broken and the two strips are leached together for time period t2, with the fl ux in the center Strip 1 being n2,1Q2 and the fl ux in Strip 2 closer to the drain being n2,2Q2. Figure 2 shows schematically the partitioning of the fl ow for the case of N = 4, which is the number of strips used in our study. Using HYDRUS-2D/3D, values of Qi and ni,j were calculated numerically. Results are shown in Tables 2 and 3, respectively.
Th e ponding times are found by solv-ing Eq. [7] for the values of ti. For four strips, these times are
= 4,14
4,4
nt T
n [8]
( )−= 4 4,1 4,4 4,3
33 3,3 4,4
TQ n n nt
Q n n [9]
( ) ( )⎡ ⎤− + −⎢ ⎥⎣ ⎦=4 4,1 3,3 4,4 4,2 3,2 4,3 4,4
22 2,2 3,3 4,4
TQ n n n n n n nt
Q n n n [10]
( ) ( ) ( )=
⎡ ⎤− + − − + + −⎢ ⎥⎣ ⎦4 4,1 3,3 2,1 4,2 2,2 4,1 2,2 4,4 4,4 2,2 3,1 2,1 3,2 2,1 3,3 4,3 2,2 3,1 2,1 3,2
1
1 1,1 2,2 3,3 4,4
t
TQ n n n n n n n n n n n n n n n n n n n n
Q n n n n
[11]
where T ≡ DfZ/n4,1Q4.
Fig. 2. Illustration of the partitioning of the total drain fl ow under partial ponding with four strips. Strip 1 is midway between the drains (x = 50), while Strip 4 starts at the drain (x = 0); Qi is the drain fl ow when Strips 1 through i are ponded and ni,j is the fraction of Qi origi-nating from the jth strip.
Table 2. Drain fl ux densities for partial and complete ponding scenarios.
Soil texture Cases
Flux density
Increase in fl ux†
1/4 area ponded
1/2 area ponded
3/4 area ponded
Complete ponding
————————— cm2 min−1 —————————
Sand C0 and P0 1.340 1.720 2.420 4.100 3.06
Sand C1 and P1 2.534 3.266 4.605 6.180 2.44
Sand C2 and P2 1.640 2.031 2.711 4.251 2.59
Loam C3 and P3 0.025 0.033 0.048 0.080 3.20
Sand over loam C4 and P4 0.581 0.883 1.451 3.100 5.33
Loam over sand C5 and P5 0.165 0.245 0.295 0.331 2.00
† Comparison between 1/4 and complete ponding (times).
Table 3. Fractions of the total drain fl ow originating from diff erent strips under partial and complete ponding, where ni,j is the fraction of the drain fl ow when Strips 1 through i are ponded that originated from the jth strip.
Soil texture Case1/4 area ponded, n1,1
1/2 area ponded 3/4 area ponded Complete ponding
n2,1 n2,2 n3,1 n3,2 n3,3 n4,1 n4,2 n4,3 n4,4
Sand P0 1.0 0.19 0.81 0.06 0.12 0.84 0.01 0.03 0.14 0.82
Sand P1 1.0 0.15 0.85 0.05 0.13 0.82 0.02 0.06 0.22 0.70
Sand P2 1.0 0.24 0.76 0.11 0.18 0.71 0.04 0.05 0.13 0.78
Loam P3 1.0 0.19 0.81 0.04 0.12 0.84 0.03 0.05 0.13 0.79
Sand over loam P4 1.0 0.03 0.97 0.001 0.03 0.969 0.00 0.002 0.047 0.95
Loam over sand P5 1.0 0.46 0.54 0.28 0.31 0.41 0.19 0.20 0.25 0.36
www.VadoseZoneJournal.org | 490
Leaching Simula onsTo simulate partial ponding in the sand tanks, the soil surface was divided into four equal strips of 12.5 cm each. At the beginning of the simulation, the central strip midway between the drain lines (37.5–50 cm) was ponded for a period of time t1, aft er which the ponded area was increased to 25 to 50 cm for a time period t2. Th e fl ooded area was next increased to 12.5 to 50 cm and then to 0 to 50 cm, with leaching proceeding for times t3 and t4, respectively. Th e calculated pressure head and salinity distributions obtained with HYDRUS-2D/3D at t1 for the 1/4 area ponding scenario were used as initial conditions for the 1/2 area ponded calcula-tions. Similar distributions obtained at t2 for the 1/2 area ponding case were used as the initial conditions for the 3/4 area ponding, and so on. Th e procedure for the fi eld-scale simulations was the same except that the dimensions were 40 times larger, including the ponding depth (20 cm).
For the complete ponding simulations, the entire surface of the fl ow domain was ponded at a constant pressure head (0.5 cm in the sand tank simulations and 20 cm in the fi eld-scale simulations). Th e HYDRUS code was executed for the leaching times given by Eq. [6] to reach the targeted leaching depth Z, with Z = 2 cm and Δs = 12.5 cm for the sand tank simulations and Z = 80 cm and Δs = 500 cm for the fi eld-scale simulations.
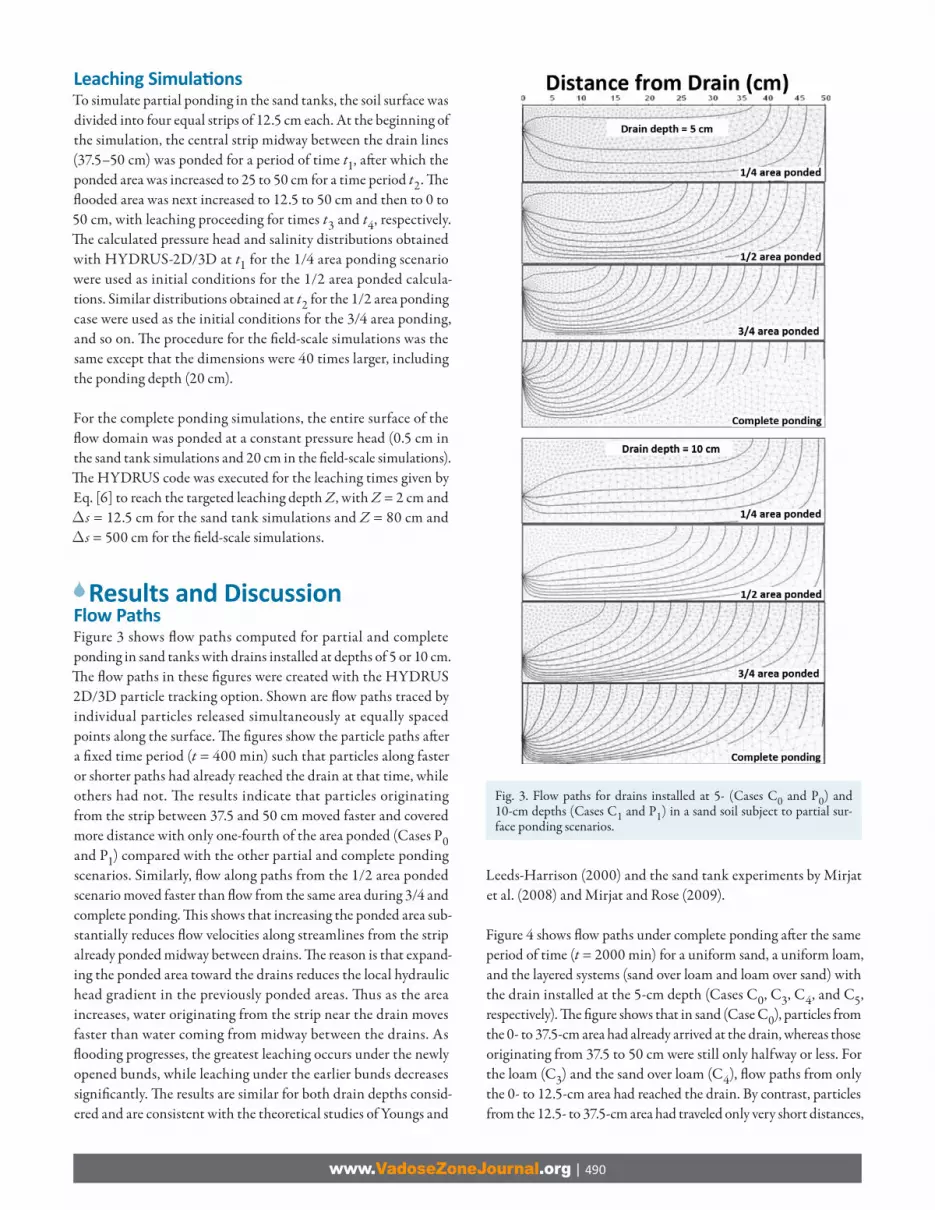
Results and DiscussionFlow PathsFigure 3 shows fl ow paths computed for partial and complete ponding in sand tanks with drains installed at depths of 5 or 10 cm. Th e fl ow paths in these fi gures were created with the HYDRUS 2D/3D particle tracking option. Shown are fl ow paths traced by individual particles released simultaneously at equally spaced points along the surface. Th e fi gures show the particle paths aft er a fi xed time period (t = 400 min) such that particles along faster or shorter paths had already reached the drain at that time, while others had not. Th e results indicate that particles originating from the strip between 37.5 and 50 cm moved faster and covered more distance with only one-fourth of the area ponded (Cases P0 and P1) compared with the other partial and complete ponding scenarios. Similarly, fl ow along paths from the 1/2 area ponded scenario moved faster than fl ow from the same area during 3/4 and complete ponding. Th is shows that increasing the ponded area sub-stantially reduces fl ow velocities along streamlines from the strip already ponded midway between drains. Th e reason is that expand-ing the ponded area toward the drains reduces the local hydraulic head gradient in the previously ponded areas. Th us as the area increases, water originating from the strip near the drain moves faster than water coming from midway between the drains. As fl ooding progresses, the greatest leaching occurs under the newly opened bunds, while leaching under the earlier bunds decreases signifi cantly. Th e results are similar for both drain depths consid-ered and are consistent with the theoretical studies of Youngs and
Leeds-Harrison (2000) and the sand tank experiments by Mirjat et al. (2008) and Mirjat and Rose (2009).
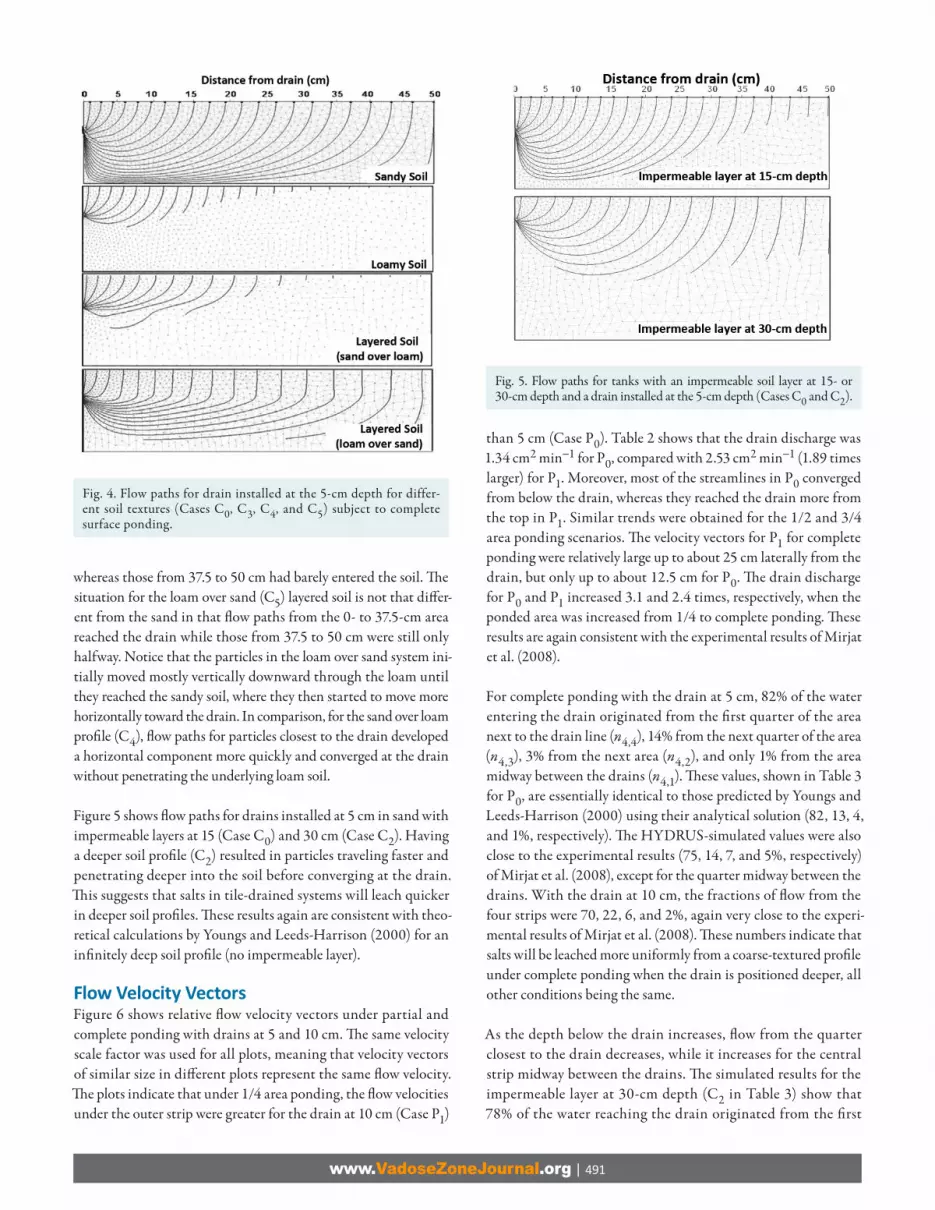
Figure 4 shows fl ow paths under complete ponding aft er the same period of time (t = 2000 min) for a uniform sand, a uniform loam, and the layered systems (sand over loam and loam over sand) with the drain installed at the 5-cm depth (Cases C0, C3, C4, and C5, respectively). Th e fi gure shows that in sand (Case C0), particles from the 0- to 37.5-cm area had already arrived at the drain, whereas those originating from 37.5 to 50 cm were still only halfway or less. For the loam (C3) and the sand over loam (C4), fl ow paths from only the 0- to 12.5-cm area had reached the drain. By contrast, particles from the 12.5- to 37.5-cm area had traveled only very short distances,
Fig. 3. Flow paths for drains installed at 5- (Cases C0 and P0) and 10-cm depths (Cases C1 and P1) in a sand soil subject to partial sur-face ponding scenarios.
www.VadoseZoneJournal.org | 491
whereas those from 37.5 to 50 cm had barely entered the soil. Th e situation for the loam over sand (C5) layered soil is not that diff er-ent from the sand in that fl ow paths from the 0- to 37.5-cm area reached the drain while those from 37.5 to 50 cm were still only halfway. Notice that the particles in the loam over sand system ini-tially moved mostly vertically downward through the loam until they reached the sandy soil, where they then started to move more horizontally toward the drain. In comparison, for the sand over loam profi le (C4), fl ow paths for particles closest to the drain developed a horizontal component more quickly and converged at the drain without penetrating the underlying loam soil.
Figure 5 shows fl ow paths for drains installed at 5 cm in sand with impermeable layers at 15 (Case C0) and 30 cm (Case C2). Having a deeper soil profi le (C2) resulted in particles traveling faster and penetrating deeper into the soil before converging at the drain. Th is suggests that salts in tile-drained systems will leach quicker in deeper soil profi les. Th ese results again are consistent with theo-retical calculations by Youngs and Leeds-Harrison (2000) for an infi nitely deep soil profi le (no impermeable layer).
Flow Velocity VectorsFigure 6 shows relative fl ow velocity vectors under partial and complete ponding with drains at 5 and 10 cm. Th e same velocity scale factor was used for all plots, meaning that velocity vectors of similar size in diff erent plots represent the same fl ow velocity. Th e plots indicate that under 1/4 area ponding, the fl ow velocities under the outer strip were greater for the drain at 10 cm (Case P1)
than 5 cm (Case P0). Table 2 shows that the drain discharge was 1.34 cm2 min−1 for P0, compared with 2.53 cm2 min−1 (1.89 times larger) for P1. Moreover, most of the streamlines in P0 converged from below the drain, whereas they reached the drain more from the top in P1. Similar trends were obtained for the 1/2 and 3/4 area ponding scenarios. Th e velocity vectors for P1 for complete ponding were relatively large up to about 25 cm laterally from the drain, but only up to about 12.5 cm for P0. Th e drain discharge for P0 and P1 increased 3.1 and 2.4 times, respectively, when the ponded area was increased from 1/4 to complete ponding. Th ese results are again consistent with the experimental results of Mirjat et al. (2008).
For complete ponding with the drain at 5 cm, 82% of the water entering the drain originated from the fi rst quarter of the area next to the drain line (n4,4), 14% from the next quarter of the area (n4,3), 3% from the next area (n4,2), and only 1% from the area midway between the drains (n4,1). Th ese values, shown in Table 3 for P0, are essentially identical to those predicted by Youngs and Leeds-Harrison (2000) using their analytical solution (82, 13, 4, and 1%, respectively). Th e HYDRUS-simulated values were also close to the experimental results (75, 14, 7, and 5%, respectively) of Mirjat et al. (2008), except for the quarter midway between the drains. With the drain at 10 cm, the fractions of fl ow from the four strips were 70, 22, 6, and 2%, again very close to the experi-mental results of Mirjat et al. (2008). Th ese numbers indicate that salts will be leached more uniformly from a coarse-textured profi le under complete ponding when the drain is positioned deeper, all other conditions being the same.
As the depth below the drain increases, fl ow from the quarter closest to the drain decreases, while it increases for the central strip midway between the drains. Th e simulated results for the impermeable layer at 30-cm depth (C2 in Table 3) show that 78% of the water reaching the drain originated from the fi rst
Fig. 5. Flow paths for tanks with an impermeable soil layer at 15- or 30-cm depth and a drain installed at the 5-cm depth (Cases C0 and C2).
Fig. 4. Flow paths for drain installed at the 5-cm depth for differ-ent soil textures (Cases C0, C3, C4, and C5) subject to complete surface ponding.

www.VadoseZoneJournal.org | 492
quarter of the area next to the drain line, while 13, 5, and 4% originated from the next three quarter sections. Th ese results agree with those obtained by Youngs and Leeds-Harrison (2000) for an infi nitely deep soil.
Figure 7 shows the eff ects of soil texture (sand vs. loam) and layer-ing (sand over loam vs. loam over sand) on the fl ow velocity for complete ponding when the drain is again at 5 cm. For sand, the velocity vectors from the 0- to 25-cm area were much larger than those coming from the 25- to 50-cm area. Th e drain fl ow rate from the sand (4.10 cm2 min−1) was much higher than that from the loam soil (0.080 cm2 min−1). Th e loam had low fl ow velocities throughout the profi le except very close to the drain. For complete ponding of the loam soil, 79% of the drain discharge came from the fi rst quarter section near the drain, followed by 13, 5, and only 3% from the next three quarters (Table 3, Case P3).
Velocity vectors in the sand-over-loam layered soil were large only in the fi rst quarter section (Fig. 7) and were very small in the remaining part of the soil profi le. Th e drain discharge in this case was still relatively large (3.10 cm2 min−1), but with nearly all of the water (95%) coming from the fi rst quarter section near the drain (Table 3, Case P4) and very little (only 0.001%) from the area midway between the drains. By comparison, the velocity vectors in the loam-over-sand layered soil were much more uniform, except in the sand just below the drain (Fig. 7). Th is case (P5 in Table 3) exhibited the most uniform leaching pattern throughout the entire cross-section, with 36, 25, 20, and 19% originating from the four quarters, starting with the area near the drain.
Salt LeachingFigures 8 and 9 show the relative salt concentrations remaining in the profi le aft er leaching for the time period needed to leach salt to a target depth of 2 cm (recall that the target depth applies to the entire fi eld with partial ponding and to the region midway between the drains with compete ponding). To uniformly leach the soil to 2 cm, 13.3% of the salt initially present needed to be leached from the sand and loam profi les (i.e., the salts initially present in the top 2 cm of the 15-cm-deep profi le). Th e fi gure of 13.3% is a useful benchmark for assessing leaching for the diff erent scenarios. As expected, leaching was not uniform for the complete ponding scenarios, with salts in areas next to the drains leached to much greater depths than those midway between the drains. At the time the targeted depth midway between drains was reached, salts in areas next to the drain were leached to depths that were
Fig. 6. Relative fl ow velocity in a sand soil with drains installed at 5 or 10 cm under various partial and complete ponding scenarios.
Fig. 7. Relative fl ow velocities in tanks having diff erent soil textures, with drains at 5 cm and the soils subject to complete surface ponding.

www.VadoseZoneJournal.org | 493
5.7, 6.8, 4.0, 8, 10, and 3.1 times deeper than the targeted depth for cases C0, C1, C2, C3, C4, and C5, respectively. As a result, 44 to 67% of the initial salts had leached out of the tank during the optimum leaching time period. Th is extra leaching wasted much good-quality water. By comparison, far more uniform leaching was achieved with the partial ponding method, where only 27 to 33% of the initial salts had leached below the targeted depth of 2 cm.
Time and Water Savings with Par al PondingFigure 10 summarizes the potential for water and time savings with partial ponding. Desalinization of a 15-cm-deep, uniform sand with the drain at 5 cm using the partial ponding method required 95% less water and 91% less time than the complete ponding method. Desalinization of a 30-cm-deep sand resulted in water and time savings of 87 and 78%, respectively. Th ese results are very close to those obtained by Youngs and Leeds-Harrison (2000) for their fi eld
scenario, which had a spatial scale about 40 times larger (drain spac-ing of 40 m and drain depth at 2 m). Th ey calculated 98 and 92% water and time savings, respectively, for uniform sand with an imper-meable layer at 6 m, and 84 and 75% water and time savings for an infi nitely deep soil profi le. Even more water and time savings (up to 99%) were possible with partial ponding for the loam-over-sand case, but only 13% for the sand-over-loam layered profi le.
Field and Laboratory ScalesOur calculations thus far used a scaled-down version of the fi eld case considered by Youngs and Leeds-Harrison (2000) so that we could compare our results directly with the laboratory sand tank experimental data of Mirjat and Rose (2009). We did additional simulations for the larger scale, however, and found results that
Fig. 8. Relative salt concentration profi les in sand tanks aft er leaching for pre-determined times for diff ering drain and soil profi le depths. White areas correspond to completely leached soil. Fig. 9. Relative salt concentration profi les in tanks with diff erent soil
textures aft er leaching for a predetermined time with drains installed at 5 cm. White areas correspond to completely leached soil.

www.VadoseZoneJournal.org | 494
were essentially identical or very similar at the two scales. As an example, Fig. 11 shows the results for complete and partial ponding (C6 and P6) for both the fi eld scale (sand soil texture, drain spacing of 40 m, drain depth at 2 m, impermeable layer at 6 m) and the laboratory scale (C0 and P0) of Mirjat and Rose (2009). Th e labora-tory results are for 500 min of leaching and the fi eld simulations for 20,000 min. Th e solute concentration profi les for the two scales in the fi gure are basically scaled versions of one another.
Several other simulations using partial ponding produced very similar results. Th ese simulations included a case where, contrary to the experiments by Mirjat and Rose (2009), the soil was initially unsaturated. For that example, we assumed a hydrostatic pressure head profi le in equilibrium with a water table at the depth of the drain (2 m). Th e initial water contents in the case of the sand ranged from 0.34 at and below the water table to a value of 0.07 at the soil surface. Th e results of the simulation showed initially a much more uniform leaching pattern, mostly because the initial
infi ltration rates were the same across the fi eld. As the leaching process proceeded and drainage started, however, the partial pond-ing method again became more effi cient, producing essentially the same results in terms of salts being leached to the targeted depth of leaching midway between the drains. When initially unsaturated, 67% of the initial salts were leached to the targeted depth with full ponding vs. 29% with partial ponding. Th is compares with values of 66 and 29% for full and partial ponding, respectively, when the soil was initially saturated. Simulated salinity profi les for this example were approximately the same as those shown in Fig. 11.
Th e work of Miller et al. (1965) suggested an interesting possibility for further increasing the effi ciency of partial ponding under fi eld conditions. In fi eld experiments, Miller et al. (1965) found that the leaching effi ciency was higher when intermittent ponding was used instead of continuous ponding. A probable reason for this fi nding is that with continuous ponding, part of the water will fl ow continuously through preferential fl ow paths, with limited contribution to salt leaching. With intermittent ponding, however, more time would be available for solutes to diff use from relatively immobile water to the preferential fl ow paths, thus increasing con-centrations in the main fl ow paths when ponding would restart. A leaching strategy that should be investigated in the future would be to implement the partial ponding using intermittent ponding at each stage of the leaching process rather than continuous ponding.
ConclusionsWe used HYDRUS-2D/3D to analyze a partial ponding method of leaching (Youngs and Leeds-Harrison, 2000) that saves consid-erable amounts of water and time to leach salts from the surface horizons of tile-drained, salt-aff ected soils. Th e method was tested for its potential to save water by simulating the leaching of salts from a fl ow domain with various soil textures, tile-drain depths,
and soil depths. Th e simulation results showed that streamlines originating from midway between the drains trav-eled faster under 1/4-area ponding than those from the same area under 1/2, 3/4, and complete ponding. Th e reason is that the hydraulic head gra-dient midway between drains is larger during partial ponding. When pond-ing was expanded to include the entire fi eld, water from areas near the drain moved faster than water from midway between the drains. Compared with complete ponding, partial ponding of coarse-textured soils resulted in water and time savings of 95 and 91%, respec-tively. The method also led to water savings of 84% for a loam soil, and 99%
Fig. 10. Predicted water and time savings with partial ponding for diff erent soil textures.
Fig. 11. Comparison of salt concentration profi les for the full fi eld case (drain spacing of 40 m, drain depth at 2 m, impermeable layer at 6 m) and the scaled-down laboratory setup. Results are for com-plete (Cases C0 and C6) and partial (Cases P0 and P6) ponding. White areas correspond to completely leached soil.

www.VadoseZoneJournal.org | 495
for a sand-over-loam layered soil but only 13% for a loam-over-sand soil. Our numerical computations for fl ow in coarse-textured soils under partial ponding were in very good agreement with previ-ous analytical results given by Youngs and Leeds-Harrison (2000). Our results indicate that partial ponding can be used to effi ciently leach salts not only from coarse-textured soils but also from fi ne-textured and layered soils.
AcknowledgmentWe acknowledge with gratitude Dr. Jirka Šimůnek, Univ. of California, Riverside, for valuable suggestions regarding the HYDRUS-2D/3D simulations.
ReferencesAlam, S.M., R. Ansari, and K. Athar. 2000. Saline agriculture and Pakistan.
Available at www.pakistaneconomist.com/issue2000/issue19&20/i&e3.htm (verifi ed 1 Feb. 2010). Pakistan Economist, 8–21 May.
Bear, J. 1972. Dynamics of fl uids in porous media. Elsevier, New York.Beven, K.J., D.E. Henderson, and A.D. Reeves. 1993. Dispersion parameters
for undisturbed par ally saturated soil. J. Hydrol. 143:19–43.Carsel, R.F., and R.S. Parrish. 1988. Developing joint probability distribu ons
of soil water reten on characteris cs. Water Resour. Res. 24:755–769.Cote, C., K. Bristow, P. Charlesworth, F. Cook, and J. Thorburn. 2003. Analysis
of soil we ng and solute transport in subsurface trickle irriga on. Irrig. Sci. 22:143–156.
FAO. 2002. Crops and drops: Making the best use of water for agriculture. FAO, Rome.
Ghassemi, F., A.J. Jakeman, and H.A. Nix. 1995. Salinisa on of land and water resources: Human causes, extent, management and case studies. CAB Int., Wallingford, UK.
Hanson, B.R., J. Šimůnek, and J.W. Hopmans. 2006. Evalua on of urea–am-monium-nitrate fer ga on with drip irriga on using numerical modeling. Agric. Water Manage. 86:102–113.
Kirkham, D. 1949. Flow of ponded water into drain tubes in soil overlying an impervious layer. Trans. Am. Geophys. Union 30:369–385.
Miller, R.J., J.W. Biggar, and D.R. Nielsen. 1965. Chloride displacement in Panoche clay loam in rela on to water movement and distribu on. Wa-ter Resour. Res. 1:63–73.
Mirjat, M.S., and D.A. Rose. 2009. Streamline pa ern and salt leaching through progressive fl ooding between subsurface drains. Irrig. Drain. 58:199–208.
Mirjat, M.S., D.A. Rose, and M.A. Adey. 2008. Desalinisa on by zone leach-ing: Laboratory inves ga ons in a model sand-tank. Aust. J. Soil Res. 46:91–100.
Mughal, F.H. 2002. Irriga on-induced salinity: Environmental impacts. Avail-able at dawn.com/2002/05/06/ebr11.htm (verifi ed 1 Feb. 2010). Daily Dawn: Business (Karachi, Pakistan), 6 May 2002.
Pakistan Ministry of Food, Agriculture and Livestock. 2005. Agricultural sta- s cs of Pakistan 2004–2005. Government of Pakistan, Ministry of Food,
Agriculture and Livestock, Islamabad.Schaap, M.G., F.J. Leij, and M.Th. van Genuchten. 2001. ROSETTA: A com-
puter program for es ma ng soil hydraulic proper es with hierarchical pedotransfer func ons. J. Hydrol. 251:163–176.
Šimůnek, J., M. Šejna, and M.Th. van Genuchten. 2006. The HYDRUS so -ware package for simula ng two- and three-dimensional movement of water, heat, and mul ple solutes in variably-saturated media. Technical manual, Version 1.0. PC Progress, Prague, Czech Republic.
Skaggs, T.H., and F.J. Leij. 2002. Solute transport: Theore cal background. p. 1353–1380. In J.H. Dane and G.C. Topp (ed.) Methods of soil analysis. Part 4. SSSA Book Ser. 5. SSSA, Madison, WI.
van Genuchten, M.Th. 1980. A closed-form equa on for predic ng the hy-draulic conduc vity of unsaturated soils. Soil Sci. Soc. Am. J. 44:892–898.
World Bank. 1992. Irriga on planning with environmental considera on. Tech. Pap. 166. World Bank, Washington, DC.
Youngs, E.G., and P.B. Leeds-Harrison. 2000. Improving effi ciency of desalini-za on with subsurface drainage. J. Irrig. Drain. Eng. 126:375–380.