compressibility and collapse characteristics of arid saline sabkha soils
TRANSCRIPT
E L S E V I E R Engineering Geology 39 (1995) 185-202
ENGENEEIRIING GEOLOGY
Compressibility and collapse characteristics of arid saline sabkha soils
Omar Saeed Baghabra A1-Amoudi, Sahel N. Abduljauwad Department of Civil Engineering, King Fahd University of Petroleum and Minerals, Dhahran 31261, Saudi Arabia
Received 20 October 1994; accepted 27 February 1995
Abstract
Arid saline soils are well-distributed over the globe, with a variety of nomenclature. Along the seaboard of the Arabian Gulf, these soils exist widely and are known as "sabkhas". Despite the cemented and saline characteristics of the sabkha matrix, a recent investigation indicated that flooding the saline sabkha with distilled water in the conventional oedometer apparatus was incapable of producing a sudden reduction in volume and/or a significant collapse. This study proposes a modification to the conventional oedometer to allow water to percolate through the consolidating specimens under a constant head. Tests were, therefore, conducted on undisturbed sabkha specimens to assess their compressibility and collapse potential whereby percolation of water was commenced under two pressures to evaluate the role of sustained pressure on the collapse mechanisms.
Despite the low compressibility of sabkhas, results of these tests indicated that these arid, saline soils possess a high collapse potential attributable primarily to dissolution of sodium chlorides, leaching of calcium ions and soil grain adjustment. The collapse potential increases with an increase in the acting pressure at which percolation of water takes place. In contrast to other typical soils, the collapse of arid, saline soils is not instantaneous but requires sufficient volume of water to percolate in order to enhance the dissolution of the cementing agents.
1. Introduction
Prediction of the settlements of structures in the field is primarily based on a method of extrapolat- ing laboratory test results. The laboratory tests commonly used are almost solely based on the one-dimensional Terzaghi theory of consolidation, irrespective the validity of the assumptions that this theory is based on (Lambe, 1951). Such a prediction is typically established using two types of oedometers: the floating-ring oedometer and the fixed-ring oedometer. Typical consolidation tests are usually conducted on undisturbed samples in accordance with ASTM D 2435 (ASTM, 1988), where samples are initially loaded with a prescribed pressure until the change in volume is ceased then
0013-7952/95/$09.50 © 1995 Elsevier Science B.V. All rights reserved SSDI 0013-7952(95)00016-X
they are flooded with water. This is essential to study the collapse and/or swell potential as well as to determine the consolidation parameters that include the compression index, swelling index, overconsolidation ratio, etc.
Collapsible soils are generally characterized by a sudden and rather large volume decrease at usually a constant stress when exposed to water (Lutenegger and Saber, 1988). In other words, the volume decreases accompanying the increases in water content at essentially constant total stresses in loose, partly saturated soils are termed collapse, hydrocompact ion or hydroconsolidation (Lawton et al., 1989). Accordingly, the collapse potential can be detected at the flooding stage when the prescribed pressure is sustained in the consolida-
186 O.S.B. ALAmoudi, S.N. Abduljauwad/Eng#wering Geology 39 (1995) 185 202
tion test. A review of literature indicates that there are principally four pre-requisite conditions for collapse to occur in a soil (Lawton et al., 1989): (a) An open, partially unstable, partially satu- rated fabric. (b) A relatively high sustained (i.e. acting) total stress to make the structure metastable. (c) A sufficiently large soil suction or the presence of bonding or cementing agents to stabilize the soil in its partly-saturated condition. (d) The addition of water to the soil to reduce the soil suction or to soften or destroy the bonding agents, thereby causing shear failures at the inter- granular contacts.
A recent investigation has indicated that the addition of water to an arid saline soil in the oedometer failed to produce a sharp and sudden reduction in volume, despite its open, metastable structure and the presence of soluble cementing agents (A1-Amoudi et al., 1992). The present paper, therefore, proposes a modification to the conventional oedometer to allow water to perco- late through the consolidating specimens thereby dissolving the cementing agents and causing the soil to collapse. In addition to assessing the col- lapse potential, such a modification brought about other features such as the ability to measure the rate of flow during loading, unloading and reloading.
2. Geology of sabkha
The formation of the Arabian Gulf sabkhas is related to the transgression of the Gulf waters in the Late Pleistocene (about 400,000 Y.B.P.) during which most of the present-day coastal areas were submerged by the Gulf waters. During the latest Pleistocene (about 100,000 Y.B.P.), glaciation led to a worldwide lowering of the sea level, thereby causing the Gulf waters to drop down to a level of 120 m below its present-day mean (E1-Naggar, 1988). This phase of water regression reached its climax at about 20,000 Y.B.P. leaving behind salt flats and depressions which formed the ancient inland sabkhas (Juillie and Sherwood, 1983). The post-glacial transgression (between 20,000 and 7000 Y.B.P.) resulted in a gradual rise of the sea
level and the re-infilling of the Arabian Gulf basin. This was followed by oscillations in the eustatic sea level which brought in marine transgressions during the early and middle Holocene (7000 to 4000 Y.B.P.). As a result of these transgressions, the sands and silts were reworked by the waters and intermixed with the newly forming marine sediments, thereby resulting in the formation of carbonate sands and silts, the bioclastic sands, the grey muds and some of the clays (Akili and Ahmed, 1983). The most notable process occurring nowadays is the deposition of wind-transported sands over coastal and continental sabkhas. This has produced quartzitic sand layers over the origi- nal marine-derived or marine-affected muds. Secondary minerals (aragonite, calcite, gypsum, halite and anhydrite) have formed within the host sediments (sand, silt, clay) by precipitation from the concentrated brines or by reaction between the brine and the host sediments (Akili and Ahmed, 1983).
3. Characteristic of sabkha soils
Hot and arid climates, with much more evapora- tion than precipitation, are conducive to saline "evaporitic" soils. A review of the global distribu- tion of sabkha indicates its extensive presence in the Middle East, including Egypt, Sudan, Libya, Tunisia, Algeria and Ethiopia. Sabkha also exists in India, Australia and southern Africa (Ellis, 1973, Renfro, 1974). Contrary to expectations, sabkha and sabkha-like sediments occur also in relatively cold climates, such as in Mexico, California, Utah and Texas in the U.S.A. Aridity, therefore, seems to play a more fundamental role than hot weather in the formation of sabkha. The active and potential (i.e. in the process of forma- tion) locations of sabkha around the world are shown in Fig. 1, where the potential locations include some sites in North and South America as well as in what was previously the Soviet Union (A1-Amoudi, 1994a).
Along the western and southwestern shores of the Arabian Gulf, these soils are generally viewed as unconsolidated, heterogeneous, layered or unlayered sediments, that are bathed in highly

O.S.B. AI-Amoudi, S.N. Abduljauwad/Engineering Geology 39 (1995) 185-202 187
o l 135 ° 90 ° 180 °
A r t A VTlt" . , "~' PACIFIC 4N
INDIAN ~.,,v~, " ; oCEAN
ACTIVE ~, _ _ LOCATIONS ~ "* • POTENTIAL
LOCATIONS
180 ° 135 ° 90* t,.50 O* t,.5* 90* 135" 180*
Fig. 1. Map of the world showing active and potential sabkha locations (Al-Amoudi, 1994a).
concentrated brines (AI-Amoudi et al., 1991). Their outer surfaces are generally composed of hygroscopic salts which, when dampened, can render the normally stable surface crust impassable (Ellis, 1973; Johnson et al., 1978). These character- istics make the sabkha susceptible to collapse upon flooding.
Surficial undisturbed sabkha samples from the Ras Al-Ghar vicinity in eastern Saudi Arabia were retrieved and used in this investigation. This soil has recently been subjected to an extensive labora- tory program. Based on their results, AI-Amoudi et al. (1992) characterized this sabkha as cohesion- less, non-plastic and classified it as A-2-4 and SW-SP according to the AASHTO and USCS systems, respectively. Its specific gravity was found to be 2.73 and the permeability of its undisturbed specimens ranged from 1.24 x 10 -6 to 3.2 x 10 -5 m/s. The natural water content of the surficial layers ranged from 16 to 22%, and the ground water table was observed at a depth of 0.8 m (A1- Amoudi, 1994b). Fig. 2 shows an X-ray diffracto- gram for the sabkha used in this investigation. Semi-quantitative analysis (A1-Amoudi, 1992) indicates that the following mineral phases are present: quartz (44.2%), halite (15.3%), orthoclase (11.9%), aragonite (11.1%), calcite (9.1%), gypsum (6.5%) and traces of anhydrite. The presence of a significant quantity (about 42%) of diagenetic min-
erals (i.e. halite, aragonite, calcite, gypsum and anhydrite) indicates that there is an active genesis in this sabkha system whereby the formation of these and other minerals seems to be going on. This is also evidenced by the chemistry of the sabkha brine (Table 1); the concentrated nature of the brine is reflected by a total dissolved solids of as much as four to five times that present in a typical sea water (AI-Amoudi et al., 1992).
Despite the "salt-full" and cemented matrix of sabkha, a recent investigation (A1-Amoudi et al., 1992) indicates that typical consolidation tests conducted on such soils using the conventional oedometers showed a negligible reduction in void ratio upon flooding with either distilled water or sabkha brine. The main reasons for such an unex- pected behavior were attributed to the profound desiccation, aging and cementation in these surfi- cial samples which could not be disrupted or destroyed (Abduljauwad and AI-Amoudi, 1995). This reasoning was supported by the high overcon- solidation ratio exhibited by these surficial soils (Hossain and Ali, 1988; AI-Amoudi et al., 1992; Ismael and A1-Sanad, 1993). Another contributing factor is that distilled water only wets the sabkha but can not flow continuously through the consoli- dating specimens, unlike, for example, the constant and variable head permeability tests (AI-Amoudi and Abduljauwad, 1994b). Therefore, the evapo-

188 O.S.B. AI-Amoudi, S.N. Abduljauwad/Engineering Geology 39 (1995) 185-202
H
Q= QUARTZ
G = GYPSUM
H = H A L I T E
A = ARAGONITE
C = CALCITE
O = ORTHOCLASE {FELDSPAR)
G
0 G O
' ' 8 ' ' ' ' o ' ' ' ' 8 ' ' ' ' ' 4 0 3 36 34 32 3 28 26 4 22 0 I 16 14 12 I0 6
2 0 , Degrees
Fig. 2. X-ray diffraction pattern tbr the Ras AI-Ghar sabkha soil (A1-Amoudi, 1994b).
Table 1 Chemical analysis of the Ras AI-Ghar sabkha brine and sea-
water from eastern Saudi Arabia (AI-Amoudi et al., 1992)
Ions Ras AI-Ghar Brine b Beach Seawater b
Na ÷ 78.8 20.7 Mg 2+ 10.32 2.30
K ÷ 3.06 0.73 Ca 2+ 1.45 0.76
Fe 2 + Trace Trace Sr 2 + 0.029 0.013
C1- 157.2 36.9 Br 0.49 0.121
(SO4) 2 5.45 5.12
( HCO 3 ) 0.087 0.128
pH 6.9 8.3
Conductivity" 208,000 46,200
aMicrosiemens. bValues are in mg/1 (i.e. parts per thousand).
ritic and cemented matrix of such soils was margin- ally affected by the soaking process in the conventional oedometers and, consequently, the collapse potential could not be properly evaluated. It is argued, therefore, that water has to percolate
through the consolidating specimen in order to accurately assess the collapse potential of sabkha. This is essential to facilitate the dissolution of the soluble, cementing salts, thereby enhancing the reduction in void ratio (A1-Amoudi and Abduljauwad, 1994a).
4. Modification to the conventional oedometer
It was suggested by Lambe ( 1951 ) that the fixed- ring oedometer could be modified to measure the permeability of soils (both constant head and variable head). Even earlier, Taylor (1948) had discussed the use of a standpipe and a pressure line attached to the bottom drainage connection to allow the use of the consolidometer as an upward flow permeameter and, consequently, per- mitting direct determination of the sample perme- ability. In this investigation, this idea was adapted in a such way that the oedometer could function as a permeameter under a constant head test without the application of any external pressure (AI-Amoudi and Abduljauwad, 1994a). This was

O.S.B. AI-Amoudi, S.N. Abduljauwad/Engineering Geology 39 (1995) 185-202 189
accomplished by making two holes below the consolidating specimen, an inlet for the water supply and an outlet for the overflow of excess water in order to keep the head constant, as schematically shown in Fig. 3. A reservoir of water (Fig. 4) was regulated to allow water to flow into the consolidation cell via the inlet valve. The volume of water in the reservoir should be more than the seeping water through the consolidating specimen; the excess water being drained from the outlet valve. This way of design insures a constant level of water in the consolidation cell. From the
two bottom holes, the percolating water could be collected using a graduated cylinder. The volume of this water can be measured over regular intervals, thereby measuring the rate of flow with respect to both time and sustained pressure during loading, unloading and reloading cycles. Preliminary tests (AI-Amoudi, 1992) revealed that the small water head in this modified oedometer was enough to permit water percolation through the consolidating specimens and, therefore, there was no need to apply any external pressure/vacuum to enhance water circulation, as
Water tank --__---
LVOT --
,~ 1 Io wA'$~ ~Am(
Graduated ~mnlt,aaamA6t I ~ fln----/--~-- l [ - - ~ ' + .... ~ II 1
• I ( < + + ,
i +.-:° EOMPLETE SETUP DEOOMETER DETAIL.
Fig. 3. Schematic diagram of the modified oedometer,

190 O.S.R Al-Amoudi. .SIN. .4bdMjauwad:Engmeering (ieoh~l, 39 (1995) 185 202
Fig. 4, An overall vie~ sho~.ing the modilied-oedometer setup.
suggested by Lambe (1951) and l 'aylor (1948). The distilled water was de-aerated prior lo its addition to the soil samples. Back pressure was not used, since no membrane was used to contain the sample and to minimize the sample disturbance.
The main reason l\)r designing the modilied oedometer was the inability of conventional oedo- meters to measure the accurate collapse potential of sabkha due to flooding with distilled water. In fact, this is similar, in essence, to percolation of rain water or storm tide through surficial sabkha layers (Al-Amoudi and Abduljauwad, 1994a). Therefore, the relevance of this development to sabkha soil is to allow distilled water to flow through sabkha samples. The percolation of water induces salt dissolution which can be established by chemical analysis of the permeating liquid and, following this, the collapse potential can be measured.
The objective of this experimental research pro- gram was to quantify the collapse potential of
surficial sabkha layers via the use of both the modified and conventional oedometers. The mech- anisms of collapse of these saline cemented soils were also elucidated.
5. Experimental program
Iwo modified oedometer tests were conducted on undisturbed sabkha samples; the first was con- sidered as a trial test to verify the ability of this apparatus to induce collapse at a relatively high pressure (233 kPa) and to see whether water could pass through the consolidating specimen voids at this high pressure. In this test, normal consolida- tion testing was conducted, starting with the over- burden pressure. Thereafter. the sample was soaked with distilled water and kept under the overburden pressure for a period presumably sufficient for the settlement to cease (i.e. two days). The pressure was then raised incrementally until a pressure of 233 kPa was sustained for 48 h. The
O. S.B. Al-Amoudi, S.N. Abduljauwad/Engineering Geology 39 (1995) 185-202 191
inlet valve was thereafter opened, allowing the head of water to increase to the drainage valve which was kept open and, simultaneously, the other valve connected with the two holes below the consolidating sabkha sample was also opened. Percolation commenced after four minutes, which was sufficient to saturate the specimen and to fill the tubes. This continued until the change in settlement was nearly constant, after about 3 days. Then, the pressures were again increased incremen- tally up to 1800 kPa. Unloading and reloading cycles were performed until a reloading pressure of 1800 kPa was achieved. It should be mentioned that once the flow of water commenced, it contin- ued until the end of the test. Samples of the passing water through the consolidating specimen were collected during the various stages of the test. These samples were subjected to chemical analysis to see if there was any salt leaching and/or dissolu- tion of ions. Calcium, magnesium and sodium ion concentrations were determined using atomic absorption spectrophotometer (AAS), Perkin Elmer 4000, while chloride ion concentration was determined by titrating against standard mercuric nitrate solution (APHA, 1985). Furthermore, measurements of the volume of water were taken over selective periods and, consequently, the flow rate was determined. The volumes of percolating water were measured by a graduated cylinder (Fig. 3) while the change in height of the consoli- dating specimen was measured with an LVDT connected to a portable data logger.
The second modified oedometer test was intended to develop a systematic procedure to produce as much relevant and conclusive data as possible. Therefore, percolation of distilled water was allowed to commence just after the soaking (submergence) stage, when the specimen ceased to develop any settlement under the overburden pres- sure, in an attempt to compare the soaking condi- tion (i.e. the same as a conventional oedometer) and percolation condition and, consequently, esti- mate the collapse potential if any. The measure- ments of flow were also taken at regularly consecutive periods so that the change in flow with time could be determined during each cycle. This data was used to evaluate an average flow for each loading cycle by totalling the volumes of percolat-
ing water over a period of one day to give a representative average flow rate value under each acting pressure.
It should be mentioned that for both the trial and systematic tests, companion specimens were also tested using the conventional oedometer in order to develop a relative comparison between the two oedometers.
6. Results and discussion
6.1. Trial test results
The data developed within the context of the trial test was used to verify the ability of the modified oedometer to detect the collapse potential of cemented sabkha soil, to quantify the collapse potential, and to establish thereafter a consistent procedure in order to develop more comparative results by the use of this oedometer. The data developed from the trial test are summarized in Figs. 5-9.
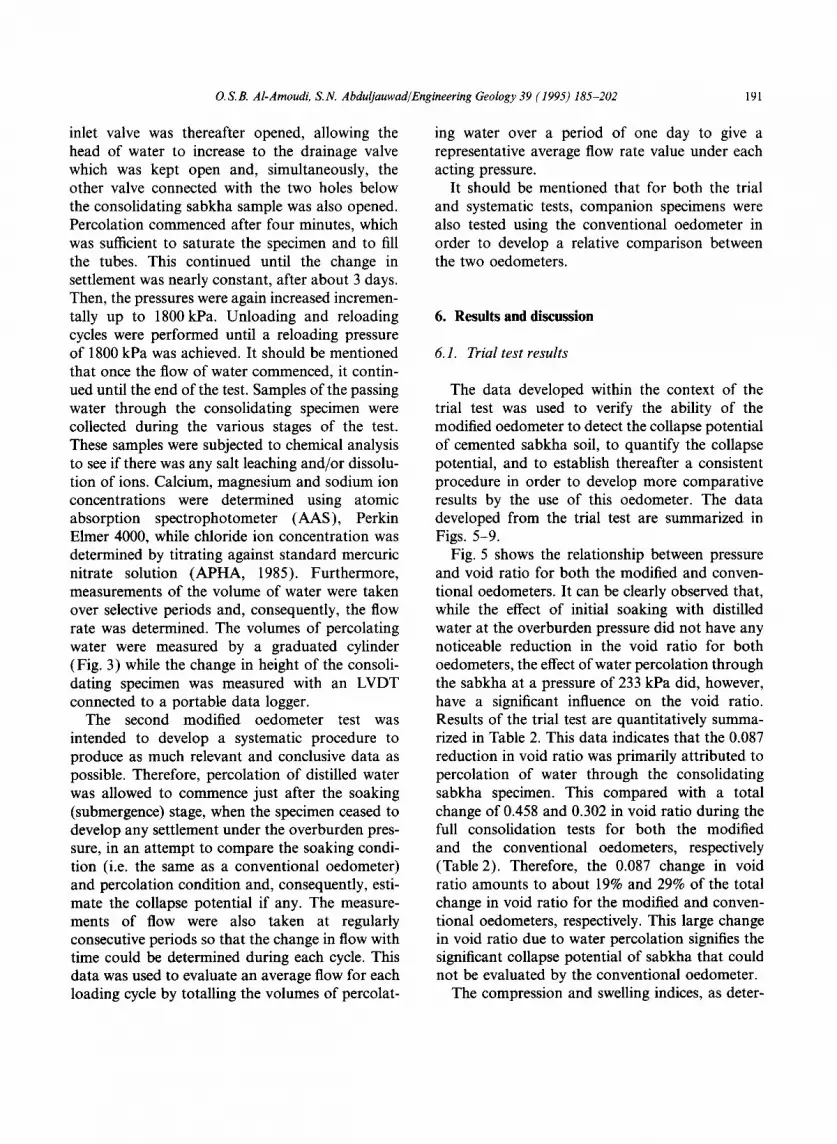
Fig. 5 shows the relationship between pressure and void ratio for both the modified and conven- tional oedometers. It can be clearly observed that, while the effect of initial soaking with distilled water at the overburden pressure did not have any noticeable reduction in the void ratio for both oedometers, the effect of water percolation through the sabkha at a pressure of 233 kPa did, however, have a significant influence on the void ratio. Results of the trial test are quantitatively summa- rized in Table 2. This data indicates that the 0.087 reduction in void ratio was primarily attributed to percolation of water through the consolidating sabkha specimen. This compared with a total change of 0.458 and 0.302 in void ratio during the full consolidation tests for both the modified and the conventional oedometers, respectively (Table 2). Therefore, the 0.087 change in void ratio amounts to about 19% and 29% of the total change in void ratio for the modified and conven- tional oedometers, respectively. This large change in void ratio due to water percolation signifies the significant collapse potential of sabkha that could not be evaluated by the conventional oedometer.
The compression and swelling indices, as deter-

192 O.S.B. Al-Amoudi, S.N. Abduljauwad/Engineering Geology 39 (1995) 185-202
1.00 I
0.90-
i
0.80-
.o ,-~ 0.70_1
c ,
0.60-
0.~
I . . . . . ~ Conventiona____~i Oedo______meter
~ Oed0meter
"o.
I I I I I I I I I I I I
1E+01 2 4 6 1 E+O2 2 4 5 1E+D3
Pressure, kPe Fig. 5. Void ratio-pressure test results for series # 1 (trial test).
Table 2 Summary of the trial and systematic test results
Test characteristics Trial test
Conventional
Systematic test
Modified Conventional Modified
Initial void ratio Change in void ratio due to flooding Void ratio at commencement of percolation Change in void ratio due to percolation Final void ratio Total change in void ratio C' c (compression index) C', (swelling index) Collapse potential ( 1 ) Collapse potential (2)
0.930 0.952 0.883 0.913 0.006 0.008 0.006 0.006
0.784 0.907 0.087 0.032
0.628 0.494 0.630 0.514 0.302 0.458 0.253 0.399 0.18 0.19 0.16 0.18 0.017 0.017 0.019 0.016
4.9% 1.7% 4.5% - 1.7%
mined f rom Fig. 5, for the modified and conven- tional oedometers are 0.19 and 0.017 for the former and 0.18 and 0.017 for the latter (Table 2). It is, therefore, interesting to note that the effect o f water percolation did not significantly alter the compression and swelling indices.
Results o f the measurement o f water percolation through sabkha with time, under the initially sus- tained pressure o f 233 kPa, are shown in Fig. 6. It is obvious that the flow o f water, and, therefore, the permeability, tends to decrease with time. This is at tr ibuted to the percolation o f water through
the consolidating specimen whereby the passage o f water causes salt dissolution which creates voids and, because o f the sustained loading upon the specimen, these voids are compressed and, conse- quently, the void ratio decreases. Another impor- tant contr ibutor to such a high reduct ion in void ratio is the significantly high pressure that was acting when percolation o f water commenced. This phenomenon has recently been observed by Lutenegger and Saber (1988), Lawton et al. (1992) and Basma and Tuncer (1992) who found that the collapse potential increases approximately linearly

o. s.B. Al-Amoudi, S.N. Abduljauwad/Engineering Geology 39 (1995) 185-202
0.60 t
I
4 6 1E-I.OO 2 4- 6 1E+Ol 2 4
Time, Days Fig. 6. Flow-time data for the trial test.
193
with increasing pressures up to a limiting stress level.
It is worth mentioning that the reduction in flow occurred very much in the early period of water percolation through the specimen when the salts were present at their full concentration. Thereafter, the rate of flow was much reduced. Fig. 6 shows that about two days of water percolation were required to significantly reduce the permeability; thereafter, the reduction was not very much affected. Quantitatively, Fig. 6 indicates that the flow of water for more than 36 days decreased from about 0.20 to 0.05 cm3/min (a total reduction of 0.15 cma/min) compared to a reduction from 0.50 to 0.20cma/min due to water percolation during the first two days (a total reduction of 0.30 cm3/min); that is, twice the reduction in flow during the latter 36 days. This large reduction in flow is another manifestation of the collapse of the microstructure that resulted in an enhanced impermeability of the sabkha sample.
The ups and downs in flow values shown in Fig. 6 after about 15 days of water flow were mainly attributed to the loading, unloading and reloading cycles during the full consolidation test. This point will be discussed in detail in the system- atic test.
The effect of pressure on the flow is presented in Fig. 7. It was observed that, except for the first two loading cycles, i.e. 233 and 460 kPa, the flow- pressure relationship follows almost exactly the classical void ratio-pressure trend during loading, unloading and reloading cycles. The flow is more affected by the initial loading cycles when the specimen was percolated by water and, thereafter, the increase in flow during unloading cycles and the decrease during reloading cycles was only marginal in spite of the large variation in pressure (from 1810 kPa to 37 kPa). This indicates that the void ratio would decrease with an increase in the pressure thereby leading to a dense, impermeable fabric. Upon unloading, the void ratio increased only marginally (Fig. 5) and so did the flow (Fig. 7). As expected, flow of water is correlated very well with the corresponding void ratio.
In order to develop a reasoning for the causes of the observed high collapse potential, chemical analyses were conducted on samples obtained from the seeping water. Fig. 8 shows the results of these tests, where it can be observed that the variation of magnesium ions during the full period of the test was insignificant while that of calcium (Ca 2 +) did not change significantly at the early stage and then reduced after about four days and continued

194 O.S.B. AI-Amoudi, S.N. Abduljauwad/Engineering Geology 39 (1995) 185 202
0250
0200-
------ 0.150- E
? E
0.100-
0.050-
0.000
G'- O
\
\ \
I I I I I [ I I I
4 6 1E-1-02 2 4 6 1E+03
Pressure, kPu
Fig. 7. H o w - p r e s s u r e test resul t s f o r the t r ia l test .
1,200
1,000-"
:=~ 800- t m t m
600-
200-
i
Chloride
-~- Magnesium
Calcium
• * Sodium
. . . . ~ ........ ~. ....... ~ ... . . . . . . . . ~ ... . . . . . . . R . . . . . . . . . . . . . . I I I r I I I I I I I I I I
1E-01 2 4 6 1E+O0 2 4 6 1E-I-01 2 4
Time, Days
Fig. 8. Resu l t s o f c h e m i c a l a n a l y s e s o f p e r c o l a t i n g w a t e r .
to reduce up to the end of the test. This high concentration of calcium ( C a 2 + ) ions in the seeping water, which was about five to six times those of Na +, Mg 2+ and CI-, might be attributed to the high content of calcium-based soluble materials in the parent sabkha soil, i.e. gypsum, calcium car- bonate (i.e., calcite and aragonite) and anhydrite,
as was documented in Fig. 2. Although the solubil- ity of each of these phases is relatively very low (the solubility of gypsum, calcite, aragonite and anhydrite is 2310, 14.0, 15.3 and 2090 ppm, respec- tively), their total solubility is greater than the highest concentration of calcium ions (1123 ppm) in the percolating water (A1-Amoudi and

O.S.B. Al-Amoudi, S.N. Abduljauwad/Engineering Geology39 (1995) 185-202 195
Abduljauwad, 1994a). Fig. 8 indicates a similarity in the concentration of both sodium (Na ÷) and chloride (CI-) ions while their variation with time indicates that both reduced significantly during the first two days of the test and thereafter remained fairly constant at very small levels. Comparison of these results with those of the flow versus time presented in Fig. 6 reveals the fact that the amount of flow, and consequently the permeability of sabkha, is correlated very well with the concen- tration of the sodium and chloride ions, and as these ions reduced after the initial two days to very small amounts (about 15 ppm), the flow was also significantly reduced. This can perceptibly be explained by the fact that these ions form halite (NaCI, sodium chloride) and, due to the large amount of flow during the first two days, the dissolution of halite was highly manifested. It can, therefore, be argued that, at this initial stage of flow, it was the dissolution of halite that resulted in the collapse potential of sabkha. As will be discussed later, the effect of both halite dissolution and high sustained pressure will lead to readjust- ment of the particles, thereby resulting in reduction in voids and consequently leading to reduction in permeability.
This phenomenon of chloride dissolution has recently been observed by Ismael (1993) during leaching tests on similar salt-bearing soils in Kuwait. It is noteworthy that halite, comprising 15wt% of the soil investigated, as confirmed by the X-ray diffraction pattern in Fig. 2, forms one of the major cementing agents in surficial sabkha matrix (A1-Amoudi, 1994b; Fookes et al., 1985; Johnson et al., 1978). Another contributing factor to the collapse potential was the significant leach- ing of Ca 2 +. Despite the fact that the Ca 2 ÷ concen- tration remained fairy constant during the first four days of percolation, its high concentration in the percolating water means that significant inter- facial vacancies were left, which were compressed by the high sustained pressure thereby leading to soil grain adjustment and to a denser structure. In summary, the observed collapse potential of arid, saline soils, such as sabkhas, might be attributed to an interplay of salt dissolution, mainly NaCI, Ca 2÷ leaching and soil grain adjustment.
Fig. 9 shows the conductivity of the seeping water which is known to reflect the total amount of total dissolved solids (TDS) in any liquid. The conductivity data follow more or less the calcium ion concentration presented in Fig. 8. This is
o
e - -
I I I I I I I I I I I I I I
1E-01 2 4 6 1E-I-O0 2 4 6 1E+(]I 2 4
Time, Days Fig. 9. Conductivity test results of percolating water.

196 O.S.B. AI-Amoudi, S.N. Abduljauwad/Engineering Geology 39 (1995) 185-202
because the concentration of C a z + was the highest in the seeping water and, therefore, constitutes most of the TDS.
6.2. S y s t e m a t i c tes t resul t s
Once the trial test results showed vividly the significant collapse potential of the sabkha soil, further testing was conducted in order to develop an evidence of the versatility of the modified oedometer in detecting the collapse potential under a subsequent overburden pressure as well as to measure the permeability and its variation with time during the full consolidation test.
The results pertinent to usage of distilled water in the soaking and percolation stages are shown in Figs. 10-14. The void ratio-pressure relation- ship is presented in Fig. 10, which again clarifies the fact that soaking the sabkha samples with water did not cause any noticeable reduction in void ratio. It can be observed that once percolation of water commenced, a relatively significant reduc- tion in void ratio occurred. The reduction in void ratio amounts to 0.032 after three days of water percolation. Since the pressure used in this test was quite small, 9.9 kPa, the reduction in void ratio was primarily attributed to salt dissolution,
and this is why the reduction in void ratio in the present test was smaller than in the trial one.
Comparison of the compression and swelling indices likewise indicates that these parameters are not very much affected by the usage of the modified oedometer, as previously observed in the trial test. These parameters (i.e., C'c and C's) are not very much affected by the percolation of water through sabkha soil. The ratio of C' c to C's is about 10 for all sabkha samples (see Table 2). According to Saeedy and Mollah (1990), if this ratio ranges from 8 to 12, the soil will possess low to moderate compressibility. Furthermore, C'~ is often assumed to be 5-10% of C'c for typical soils (Holtz and Kovacs, 1981), while in this case is about 10% of C'~. Typical values of C'~ range from 0.015 to 0.035; the lower values are for soils of low plasticity and low ovexconsolidation ratio (Leonards, 1976). Thus, the present sabkha falls within the lower limit of this value range. It can be concluded, therefore, that the surficial eastern Saudi sabkha has low compressibility (A1-Amoudi et al., 1992).
The change in flow with time during each load- ing cycle was measured after about 10, 30, 60, etc. minutes. This is essential for delineating how the flow changes with time and with pressure. Fig. 11 shows the flow-time data for the eight loading
1.00 I
°'°i 0.80 -
''d 0.70-
-x2_ o
0.60-
0.50-
0.40
I i ~ Conventional Oedometer
i , !-e- Modified Oedometer
I I I I T l I l ] I ] I T
6 1E+01 2 4 6 1E+02 2 4 6 1E+O3 2
Pressure, kPG Fig. 10. Void ratio pressure test results for series # 2 (systematic test).

O.S.B. Al-Amoudi, S.N. Abduljauwad/Engineering Geology 39 (1995) 185-202 197
3~0-
3 2 0 -
2.80-
2.40- . E
-,~E 2.00-
E
~ 1 .N-
120-
0 ~ -
0.411-
0110-
Looding Pressures
• B 1655.9 kPo .R 4-16.4 kPol'e 111.5 kPo ,.e 35.3 kPe
-=-B22.9kPo ÷213.2kPo ,e-60.7kPc -*-9.9kPo
A
° ° ° O . ~
° ' ° ~ o °
" ° ~ . . . . . O ° . . ° ° O °
~ ° . ~
O. . . . . . . . . "O.
. . . . . . . . . . . . . . . . . . . . . . . . ,n
. . . . . . . . . . [ ] . . . . . . D T . . . . . E ] ~ ° " ° '1~ " . . . . . Et v . . . . ~ . . . . . . . . . m_l ~" --
I I I I I I I I I I I I I
1E-I'01 2 4 6 1E+02 2 4 6 1E+03 2 4
Time, Minutes Fig . 11. F l o w - t i m e d a t a d u r i n g l o a d i n g cycles .
6 B
cycles imposed on the sabkha sample during the consolidation test using the modified oedometer. This figure indicates that the flow decreased very smoothly with each loading cycle. However, in the case of the first two loading cycles (i.e. at loading pressures of 9.9 and 35.3 kPa), the reduction in flow was more than that observed for the other loading cycles and continued to decrease over a longer period. This can be explained by the fact that during the initial loading cycles, the pressures were relatively small and, therefore, the effect of salt dissolution was more predominant than soil grain adjustment. Because the sample possessed a high salt reserve at these low pressures, the dissolu- tion of salt continued for longer periods, thereby leading to more reduction in flow with time. At higher pressures, the situation was different, as the salt had already been washed out, thereby leading to less salt dissolution and, consequently, the effect of soil grain adjustment would be more effective. This explains why the change in flow during the initial loading cycles was more than that during the latter loading cycles.
A closer examination of the curves in Fig. 11 reveals that the flow at the beginning of each
loading cycle was higher than that observed at the end of the previous loading cycle for all loading cycles. This might be attributed to the generation of pore-water pressure at the beginning of each loading cycle. This generated pore-water pressure enhanced the flow and, because of the sandy nature of the present sabkha soil, the dissipation of this pressure was manifested by an increase in flow.
The flow measurements during unloading cycles are presented in Fig. 12. This data indicates a completely different trend from that observed for the loading cycles. The flow tended to increase with unloading (i.e. stress release) up to a period of about 300 min with an unloading pressure of 822.9 kPa and up to a period of only 60-80 min with all lower pressures. The increase in flow is a consequence of an increase in void ratio due to the unloading phenomenon (refer to Fig. 10), thereby resulting in an increase in flow. This increase in flow persists for a certain period and thereafter two mutual factors influence the flow. These factors are void ratio increase and sustained pressure. As the increase in void ratio during unloading cycles was very small for the case of the present sabkha soil for which the swelling index

1 9 8 O, S, B. A l-Amoudi, S.N. AbduOauwad/Engineering Geology 39 (1995) 185-202
0.325 , I
0.275~ ! i
E
k , _
0200-
0.175-
OJSO
Unloading Pressures
,.0 35.2 kPa .e, 213.2 kPe . e 822.9 kPo
!--,-60.7 kPo .--.- 416.4 kPo ~ 16,~5.9 kPa
" " " "" " " ~ . . . . . . . . ~ ' . . . . . . 0 . . . . . . 0
t + t I t t I l I 1 "t' I L [ l
1E+01 2 4 6 1[+02 2 4 6 t[+03 2 4 6
Time, Minutes Fig. 12. Flow-time data during unloading cycles.
(Cs') was only 0.017 (i.e. refer to Figs. 5 and 10), the former factor did not seem to change after a certain period and, consequently, the effect of sustained loading tended to control the flow there- after. The duration of this period in which the flow started to decrease was longer in the case of the 822.9 kPa pressure compared to all other lower pressures, as discussed before• This can be attrib- uted to the significant reduction in pressure (from 1635.9kPa to 822.9 kPa), thereby leading to a relatively larger increase in void ratio compared to the other lower pressures• Therefore, more time was required for the sustained load effect to domi- nate. From another perspective, the effective stress is known to increase if the flow is downward (Lambe and Whitman, 1969), i.e. with gravita- tional forces, and as the effect of void ratio would cease to be effective after a certain period, the increase in effective stress would certainly reduce the flow.
Unexpectedly, the flow during the reloading cycles of pressures tends to follow the same trend as that during the unloading cycles. This is clearly seen in Fig. 13, where the flow was observed to increase up to a period of about 80 min and
thereafter tends to decrease. The reasoning here is somewhat different from that during the unloading cycles. The specimen during the reloading cycles was overconsolidated and had experienced all pre- vious loading cycles and, therefore, was not sig- nificantly affected by the reloading pressures. Moreover, the pore-water pressure was generated to higher percentages of the applied pressures at the instant of reloading compared to the loading cycles and, because the specimen was very well compacted (i.e. lower permeability) at this stage, the dissipation of pore-water pressure required more time than the loading cycles. As a conse- quence of this increase in pore-water pressure, flow tended to increase to a period of about 80 to 90 min. This period might be enough for most of the pore pressure to dissipate and the decrease in flow was associated with an increase in effective stress.
Fig. 14 depicts the flow-pressure results, where it is observed that the reduction in flow was much more pronounced during the first three loading cycles (i.e. 9.9, 35.3 and 60.7 kPa) than the remain- ing loading cycles. The flow was reduced from 3040cm3/day at the overburden pressure to 1085 cm3/day at 60.7 kPa, after which the flow was

0.300-
0.275 -
.___ 0.2,50- E
E 0.225-
o "':-0.200-
0.175-
0.150-
0.125-
E
1,000-
• ~ 1635.9 kPo . e 416.4 kPa -~. 60.7 kPa
-4- 822.9 kPo 213.2 kPo -*- 35.3 kPa
8 . . . . . . . . . . . "[} . . . . . . . . 4] . . . . . . . '1} . . . . . . .. "8 . . . . . . . B . . . . . . . -I]...
" " ' 8
- - T - - - T - - ' I - - [ T T--'-'I'-- 1E+01 2 4 6 1E+02 2 4 6 1E+03 2 4 6
Time, Minutes Fig. 13. Flow-time data during reloading cycles.
199
6 I I I I I I I I I I I I I
1E+01 2 4 6 1E+02 2 4 6 1E+03 2
Pressure, kPe
O.S.B. Al-Amoudi, S.N. Abduljauwad/Engineering Geology 39 (1995) 185-202
Reloading Pressures 0.325 -
Fig. 14. Flow-pressure test results for the systematic test.
reduced to 237cm3/day at a pressure of 1635.9 kPa. This trend is very consistent with the trial test results reported in Fig. 7, in spite of the fact that in the present test only 9.9 kPa was initially applied compared with a pressure of
233 kPa in the trial test. Therefore, it can be concluded that the flow was significantly reduced during the early stages of water percolation through the specimen when two concomitant phen- omena prevail: (a) the relatively high initial void

200 O.S.B. Al-Amoudi, S.N. Abduljauwad/Engineering Geology 39 (1995) 185-202
ratio, and (b) the significantly high salt dissolution. When the effect of these two factors diminishes. the change in flow is significantly retarded.
6.3. Collapse potential assessment of sabkha soils'
The collapse potential can generally be calcu- lated using one of the following equations:
( A e c ~x i ~ l = \ l + e ~ / 100 (1)
and:
•
i~2 = ~,l~-eoeo J x 100 (2)
where: icl=collapse potential (1), ic2=collapse potential (2), Ae~=reduction in void ratio upon wetting, el = void ratio at beginning of saturation, and eo = initial void ratio.
Collapse potential ( 1 ) is related to the void ratio at the beginning of the flooding (i.e. soaking) process, while collapse potential (2) is related to the void ratio at the beginning of the consolidation test. Others, however, suggest that the collapse potential be measured at specified pressures• For example, Knight (1963) suggested that the collapse potential be measured using the double oedometer tests in which two identical specimens are tested, one at the natural water content and the other under saturated condition. The two tests are then compared and the collapse potential of the soil, which is defined as the percentage change in volume (i.e. or change in void ratio) upon wetting under a pressure of 200 kPa, is determined. The following correlation is proposed by Jennings and Knight ( 1975):
Collapse Potential (%) Severity of Problem 0 1 No problem 1 5 Moderate trouble 5 10 Trouble 10-20 Severe trouble above 20 Very severe trouble
The data pertinent to collapse potential ( 1 ) and collapse potential (2) in Table2 indicates that there is no noticeable difference between these two criteria for both the trial and systematic test results.
On the other hand, the sabkha sample tested in the trial test showed a much higher collapse poten- tial compared to the one tested in the systematic series; an average collapse potential of 4.7% for the former (i.e. the collapse potential is very close to the "trouble" classification) and only 1.7% for the latter (i.e. within the "moderate trouble" col- lapse potential), which is solely indicative of the significant effect of the magnitude of sustained pressure at which percolation of water took place. The enhanced collapse potential with an increase in the acting pressure has been observed by several investigations for different types of soils (gutenegger and Saber, 1988; Basma and Tuncer, 1992; Lawton et al., 1992). Consequently, an appropriate pressure should be chosen when the collapse potential is to be measured. This pressure should be based on the foundation pressure or any other design pressure and its value should be reported with the magnitude of collapse potential.
An eventual comment is related to the "defini- tion" of collapsible soils and its intimate relation- ship with a sudden and large volume decrease upon saturation. The sudden volume change comes about via a large scale particle re-arrangement in the initial soil structure that typically consists of bulky-sized particles (sand and silt particles) which are weakly bonded by clays, silts or water in a relatively unstable manner (Abduljauwad and A1-Amoudi, 1995; Koerner, 1984; Barden et al., 1973). Collapse and large volume decrease, there- tore, will occur if the soil is saturated or vibrated. For the case of arid, saline soils, such as sabkha, collapse occurs via the combined effect of dissolu- tion of soluble salt and soil grain adjustment. The collapse of sabkha, therefore, does not occur sud- denly, as in typical collapsible and loessial soils for example, but requires enough time as well as continuous percolation of water to dissolve the salty-cemented matrix of sabkha soils. It is interes- ting to report that Clemence and Finbarr (1981) have denoted, without any experimental evidence, that collapse in strength is slow when the grains are held together by chemical cementing; a situa- tion that typically prevails in arid saline soils. This could be the main reason for the inability of conventional oedometers to detect the collapse potential of such a soil.

O. S.B. A l-Amoudi, S.N. Abduljauwad/Engineering Geology 39 (1995) 185-202 201
7. Conclusions
Due to the inability of the conventional oedo- meter to detect the collapse potential of sabkha, a modified oedometer was used to assess the collapse potential attributable to distilled water percolation through saline sabkha specimens under a constant head. Results of the two series of consolidation tests on sabkha using both the conventional and modified oedometers revealed the following main observations: (1) The modified oedometer seems very suitable to detect the collapse potential of sabkha whereby the collapse is jointly attributed to salt dissolution, mainly NaC1, Ca 2÷ leaching and soil grain adjustment. (2) Soil grain adjustment was attributed to perco- lation of water and resulted in a more compact and impermeable structure thereby leading to an enhanced reduction in void ratio with a consecutive increase in loading pressures. This situation caused the flow to decrease under sustained pressures. (3) If percolation commenced at higher pressures, collapse potential would be higher than that occur- ring at lower pressures due to the combined effect of salt dissolution and soil grain adjustment. (4) The compression and swelling indices were unaffected by either soaking or percolation of distilled water through sabkha specimens. These indices also indicate that sabkha possesses low compressibility. Therefore, the fear of collapse potential, rather than the compressibility of sabkha, should be a prime consideration for geotechnical engineers. (5) The collapse potential of arid, saline soils is principally related to the dissolution of salts. This is why the collapse of these soils does not occur instantaneously.
Acknowledgment
The assistance provided by Mr. Hasan Zakariya and late Essam EI-Deeb, at the Department of Civil Engineering, King Fahd University of Petroleum and Minerals, during the course of this investigation is greatly appreciated. Thanks are extended to Mr. Efren C. Superales for typing this
manuscript. Part of this paper (Figs. 5, 6 and 8) has been recently reported in AI-Amoudi and Abduljauwad (1994a).
References
Abduljauwad, S.N. and A1-Amoudi, O.S.B., 1995. Geoteclmical behavior of saline sabkha soils. Geotechnique, 45(4).
Akili, W. and Ahmed, N., 1983. The sabkhas of eastern Saudi Arabia: Geotectmical considerations. Proc. 1st Saudi Engi- neering Conf., Jeddah, ¥ol. II: 300-322.
Akpokodje, E.G., 1985. The stabilization of some arid zone soils with cement and lime. Q.J. Eng. Geol., 18: 173-180.
A1-Amoudi, O.S.B., 1992. Studies on soil-foundation inter- action in the sabkha environment of Saudi Arabia. Ph.D. diss., Dep. Civ. Eng., King Fahd Univ. Petroleum and Min- erals, Dhahran, Saudi Arabia.
AI-Amoudi, O.S.B., 1994a. A state-of-tbe-art report on the geotechnical problems associated with sabkha soils and methods of treatment. Proc. ASCE-SAS 1st Reg. Conf. Exhib., Bahrain, Sept. 18-20, pp. 53-77.
A1-Amoudi, O.S.B., 1994b. Chemical stabilization of sabkha at high moisture contents. Eng. Geol., 36(3/4): 279-291.
A1-Amoudi, O.S.B. and Abduljauwad, S.N., 1994a. Modified oedometer for arid, saline soils. ASCE J. Geotech. Eng., 120(10): 1892-1897.
A1-Amoudi, O.S.B. and Abduljauwad, S.N., 1994b. Suggested modifications to ASTM standards when testing arid, saline soils. ASTM Geotech. Test. J., 17(2): 243-253.
A1-Amoudi, O.S.B., Abduljauwad, S.N., E1-Naggar, Z.R. and Rasbeeduzzafar, 1992. Response of sabkha to laboratory tests: a case study. Eng. Geol., 33: 111-125.
A1-Amoudi, O.S.B., Abduljauwad, S.N., E1-Naggar, Z.R. and Safar, M.M., 1991. Geotechnical considerations on labora- tory and field testing of sabkha. Proc. Symp. Recent Advances in Geotechnical Engineering--III, Singapore, pp. 1-6.
APHA-AWAA-WPCF, 1985. Standard methods for the exami- nation of water and waste water. Am. Public Health Assoc. (APHA), Washington, D.C., USA, 16th ed.
ASTM, 1988. Standard test method for one-dimensional consolidation properties of soils. Am. Soc. Testing and Materials, Philadelphia, Part 19, Vol. 4.08, D 2435-80, pp. 278-282.
Barden, L., McGown, A. and Collins, K., 1973. The col- lapse mechanism in partly saturated soil. Eng. Geol., 20: 49-60.
Basma, A.A. and Tuncer, E.R., 1992. Evaluation and control of collapsible soils. ASCE J. Geotech. Eng., 118(10) 1491-1504.
Clemence, S.P. and Finbarr, A.O., 1981. Design considerations

202 O.S.B. Al-Amoudi. S.N Abduljauwad/Engineering Geology 39 (1995) 185-202
for collapsible soils. ASCE J. Geotech. Eng., 107(GT3): 305-317.
Ellis, G.I., 1973. Arabian salt-bearing soil (Sabkha) as an engi- neering material. TRLL Rep. LR 523, Crowthorne, Berkshire.
E1-Naggar, Z.R., 1988. Foundation problems in sabkha depos- its. In: Short Course on Foundation Engineering for Practic- ing Engineer. Dep. Civ. Eng., King Fahd Univ. Petroleum and Minerals, Dhahran, SD1-SD54.
Fookes, P.G., French, W.J. and Rice, S.M.M., 1985. The influ- ence of ground and groundwater geochemistry on con- struction in the Middle East. Q.J. Eng. Geol., 18: 10l 128.
Holtz, R.D. and Kovacs, W.D., 1981. An Introduction to Geotechnical Engineering. Prentice-Hall, Inglewood Cliffs, N.J.
Hossain, D. and All, K.M., 1988. Shear strength and consolida- tion characteristics of obhor sabkha, Saudi Arabia. Q.J. Eng. Geol., 21:347 359.
Johnson, H., Kamal, M.R., Pierson, G.O. and Ramasy, JB., 1978. Sabkhas of eastern Saudi Arabia. In: S.S. AI-Sayyari and J.G. Zotl (Editors), Quarternary Period in Saudi Arabia. Springer, Berlin, pp. 84-93.
Juillie, Y. and Sherwood, D.E., 1983. Improvement of sabkha of the Arabian Gulf Coast. Proc. 8th Eur. Conf. Soil Mech- ancis and Foundation Engineering, Helsinki, Vol. 2, Session 7-21, pp. 781 -788.
lsmael, N.F., 1993. Laboratory and filed leaching tests on coastal salt-bearing soils. ASCE J. Geotech. Eng., 119(3 ): 453 470.
Ismael, N.F. and A1-Sanad, H.A., 1993. Plate loading tests on weakly cemented surface desert sands. Geotech. Eng., 24( 2 ): 133 150.
Jennings, J.E. and Knight, K., 1975. A guide to construction
on or with materials exhibiting additional settlement due to "'collapse" of grain structure. Proc. 6th Reg. Conf. Africa on Soil Mechanics and Foundation Engineering, pp. 99 105.
Knight, K., 1963. The origin and occurrence of collapsing soils. Proc. 3rd Reg. Conf. Africa on Soil Mechanics and Founda- tion Engineering, Vol. 3:127-130.
Koerner, R.M., 1984. Construction and Geotechnical Methods in Foundation Engineering. McGraw-Hill, New York, N.Y.
Lambe, T.W., 1951. Soil Testing for Engineers. Wiley, New York, N.Y.
kambe, T.W. and Whitman, R.V., 1969. Soil Mechanics. Wiley, New York, N.Y.
Lawton, E.C., Fragaszy, R.J. and Hardcastle, J.H., 1989. Col- lapse of compacted clayey sand. ASCE J. Geotech. Eng., 115(9): 1252-1267.
Lawton, E.C., Fragaszy, R.J. and Hetherington, M.D., 1992. Review of wetting-induced collapse in compacted soil. ASCE J. Geotech. Eng., 118(9): 1376-1394.
Leonards, G.A., 1976. Estimating consolidation settlements of shallow foundations on overconsolidated clays. TRB Spec. Rep. 163: 13-16.
Lutenegger, A.J. and Saber, R.T., 1988. Determination of col- lapse potential of soils. ASTM Geotech. Test. J., 111(3): 173 178.
Renfro, A.R., 1974. Genesis of evaporite-associated stratiform metalliferous deposits - - a sabkha process. Econ. Geol., 69(1): 33 45.
Saeedy, H.S. and Mollah, M.A., 1990. Geotechnical study of the North and Northwest Coast of the Arabian Gulf. Eng. Geol., 28: 27-40.
Taylor, D.W., 1948. Fundamentals of Soil Mechanics. Wiley, New York, N.Y.