saline water management for irrigation in india
TRANSCRIPT
Saline Water Management for Irrigation
(3rd Revised Draft)
Work Team on Use of Poor Quality Water for Irrigation (WT-PQW)
Compiled by
Dr. B.S. Tanwar Former Director, Haryana Irrigation Research and
Management Institute, Kurukshetra, India
International Commission on Irrigation and Drainage (ICID) New Delhi, India
August 2003
CONTENTS Chapter 1: GLOBAL WATER RESOURCE PERSPECTIVE
1.1 Introduction 1.2 Land, Water and Irrigation 1.3 Irrigation and Drainage Methods 1.4 International Initiatives in Water Sector Reforms
Chapter 2: GLOBAL SALINE ENVIRONMENT
2.1 Introduction 2.2 Land and Water Salinization 2.3 Saline Water Irrigation Development 2.4 Research, Development and Training
Chapter 3 : GLOBAL TRENDS IN SALINE WATER USE
3.1 Introduction 3.2 Example of World Countries Using Saline Water for Irrigation 3.3 Algeria 3.4 Argentina 3.5 Australia 3.6 Bahrain 3.7 Brazil 3.8 Central Africa 3.9 China 3.10 Cyprus 3.11 Egypt 3.12 Ethiopia 3.13 Germany 3.14 India 3.15 Iran 3.16 Iraq 3.17 Israel 3.18 Italy 3.19 Japan 3.20 Jordan 3.21 Kazakhstan 3.22 Kenya 3.23 Kuwait 3.24 Latin America 3.25 Lebanon 3.26 Morocco 3.27 North Africa 3.28 Oman 3.29 Pakistan 3.30 Palestine 3.31 Saudi Arabia 3.32 Somalia 3.33 South Africa 3.34 Southeast Asia-Thailand 3.35 Soviet Union and Commonwealth of Independent Sates 3.36 Spain 3.37 Sudan 3.38 Syria 3.39 Tunisia
3.40 Turkey 3.41 United Arab Republic 3.42 United Kingdom 3.43 United States of America 3.44 Yemen
Chapter 4 : SALINE WATER EXPLORATION AND ASSESSMENT
4.1 Introduction 4.2 The Saline Water Irrigation Problem 4.3 The Sodic Water Irrigation Problem 4.4 Origin of Salinity in Soils and Ground Waters 4.5 Waterlogging and Salinity 4.6 Exploration and Evaluation Approach 4.7 Evaluation of Shallow Saline Water Aquifer 4.8 Evaluation of Deep Saline Water Aquifers 4.9 Drainage Investigations in Saline Waterlogged Soils 4.10 Participatory Irrigation Appraisal
Chapter 5 : TECHNOLOGY ADVANCEMENT IN SALINE WATER MANAGEMENT
5.1 Introduction 5.2 Water Management 5.3 Soil Management 5.4 Crop Management 5.5 Management Issues on Saline Water Use 5.6 Peoples Participation in Saline Water Management
Chapter 6 : SALINE WATER USE IN AGRICULTURE
6.1 Introduction 6.2 Agricultural Uses of Water 6.3 Classification of Saline Waters 6.4 Water Quality Assessment Parameters 6.5 Guidelines for Saline Water Irrigation 6.6 Guidelines for Crop Salt Tolerance Limits 6.7 Water Quality Guidelines for Livestock
Chapter 7 : DRAINAGE WATER REUSE IN AGRICULTURE
7.1 Introduction 7.2 Agricultural Use of Drainage Water 7.3 Classification of Drainage Waters 7.4 Quality Assessment Parameters 7.5 Drainage Water Reuse 7.6 Guidelines for Drainage Water Reuse Management
Chapter 8 : WASTEWATER USE IN AGRICULTURE
8.1 Introduction 8.2 Common wastewater Uses 8.3 Classification of Wastewaters 8.4 Wastewater Quality Parameters in Agricultural Use 8.5 Major Wastewater Constituents 8.6 Wastewater Treatment 8.7 Guidelines for Wastewater Irrigation and Protection of Health 8.8 Common Wastewater Irrigation Methods 8.9 Wastewater Use in Aquaculture

8.10 Wastewater Use in Aquifer Recharge 8.11 Examples of Wastewater Reuse Practices in Agriculture 8.12 Wastewater Use Policy Implications
Chapter 9 : PARTICIPATORY MANAGEMENT STRATEGY
9.1 Introduction 9.2 The PIM Concept 9.3 World PIM Issues 9.4 PIM-A New Paradigm 9.5 International Network on Participatory Irrigation
Management (INPIM) 9.6 PIM and Saline Water Management for Irrigation 9.7 Participatory Drainage Management 9.8 Women’s Participation in Saline Water Management
Chapter 10 : ENVIRONMENTAL AND SOCIOECONOMIC IMPACTS OF SALINE WATER USE
10.1 Introduction 10.2 Environmental Impacts of Saline Water Use 10.3 Socio-Economic Impacts of Saline Water Use
References and Bibliography

Chapter 1
GLOBAL WATER RESOURCE PERSPECTIVE
1.1 Introduction The food security coupled with the water security of the many developing nations is a
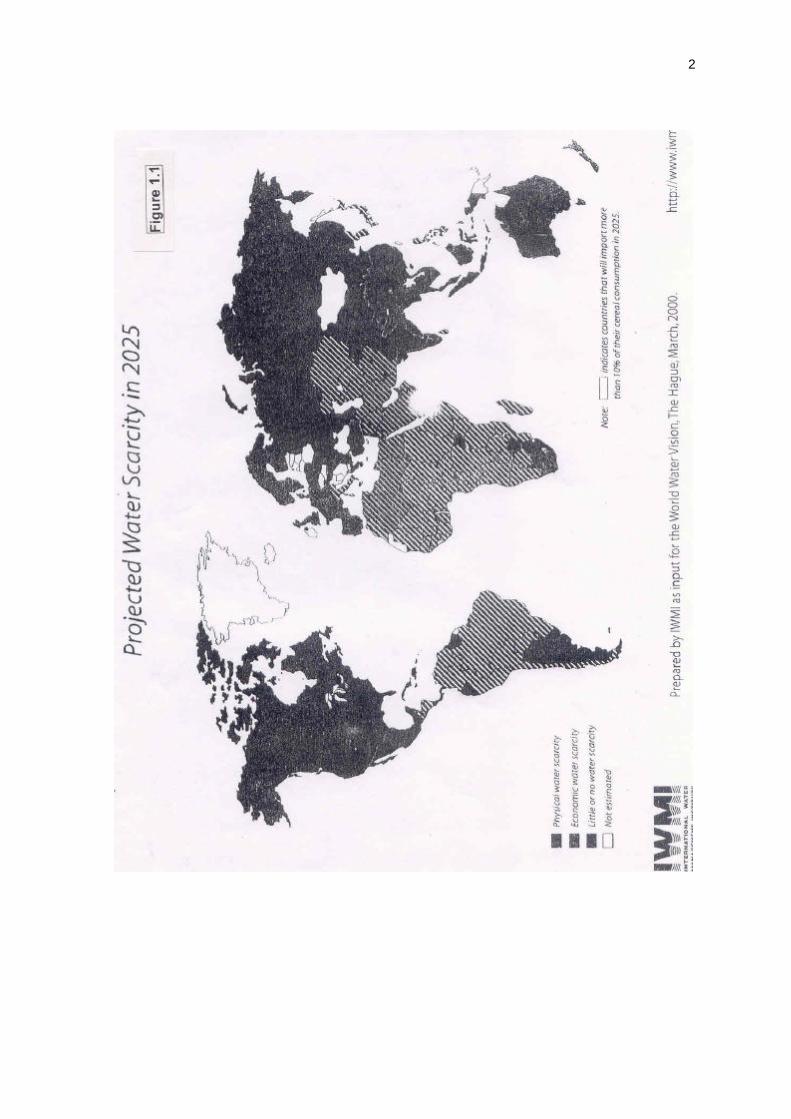
cause of serious concern. The land irrigation is playing the world over a major role in increasing the food production. 8 Mha irrigated land in the year 1800 has increased to more than 230 Mha by the year 2000 and this irrigated area compared to 1500 Mha of dry land agriculture has produced nearly 40% of the world’s food supplies. The contribution by irrigated agriculture to the world’s total agricultural output is around 50% (Wolf and Hubener 1999). Under the present scenario, about 75 % of the irrigated land lies presently in the developing countries, but the natural resources base of the land and fresh water has been decreasing per capita with the fast rate of rise in population. The world population has exceeded 6 billion mark in the year 2000. It is likely to become 8.5 billion by the year 2025 (UN 1990). There will be about 60% increase in population in the developing countries and 20% increase will take place in developed nations by the year 2025 (World Bank 1988, UN 1991). The International Water Management Institute (IWMI) has projected the water scarcity for the World in year 2025 (Figure 1.1). The depletion and pollution of limited freshwater resources and competing demands of water in developing and developed nations as well as between different sectors of the agriculture, industry and urban development constrain the expansion of irrigation. The increasing demand of water requires more intensive management of water resources including fresh and saline water in the inland areas and the desalination of sea water in the coastal areas.
The United Nations Conference on Environment and Development in Agenda 21,
chapters 10,14 and 18 have highlighted the challenge of securing water supply in the 21st Century (UNCED 1992). ICID is playing a cardinal role to achieve objectives of the Agenda 21. The UNO has also declared 2003 as the 'fresh water year' to attract the attention of the world people about the severe scarcity of fresh water. The enhanced greenhouse effect may increase the severity and variability of weather and disrupt established systems of production. The problem is more serious in the continents facing semiarid and arid climate with high occurrence of saline water and severe population environment crisis (World Bank 1994).
The irrigation water availability could be enhanced through the scientific use of saline
water, the recycling of drainage water and the reuse of wastewater (World Bank 1986, FAO 1992, Rhoades 1998). The concept for the use of saline water for irrigation to increase food production has been advocated by many research scientists, organisations, institutions and authorities for the last more than five decades. The considerable amounts of poor quality waters are available in many countries of the Asia and African continents, Australia, North and South America and the dryland areas of Europe. The possibilities of wastewater treatment and disposal through land application gained increasing attention as it was seen a method of preventing the river pollution and increasing the water resource for the agricultural development and economic benefits in the water scarcity areas of the semiarid and arid regions. The use of saline water and the reuse of drainage water and wastewater was promisingly viewed as the useful resources in the USA, Australia, Latin America, North Africa and the Middle East, South East Asia, China, Soviet Union and Common Wealth of States (FAO 1992, Tanji 1994, ICID 1998, IPTRID 1995, World Bank 1994, WRI 1994, Ghassemi et al 1995).
The present ICID document is a contribution towards further projecting and promoting
the promising use of saline water and reuse of drainage and waste waters for developing irrigation, which has to be environmentally sustainable, economically viable and socially acceptable with an assurance of the food security to the international community, particularly in the semiarid and arid regions of the world.
2
3
1.2 Land, Water and Irrigation 1.2.1 Land Resource The land area of the globe is around 13077 Mha. The potentially arable land is limited and unevenly distributed. Some 3190 Mha (24.49%) of the world’s land are potentially arable with maximum in Africa 734 Mha (23%), South America 681 Mha (21.3%), Asia 627 Mha (19.7%), North America 465 Mha (14.6%), former USSR 356 Mha (11.2%), Europe 174 Mha (5.5%), and Oceania including Australia 153 Mha (4.7%). Table 1.1 provides the total land area, arable land, cultivated land and irrigated land of the world continents (US Report 1967 and FAO 1989).
Table 1.1 Total land area, potential arable land and cultivated land
of the world by continent
Continent Land area(a)
(Mha)
Potential arable and(a)
(Mha)
Cultivated land(b) (Mha)
Irrigated land(b) (Mha)
Africa 2964 734 185 11 Asia 2679 627 451 142 Oceania 843 153 49 2 Europe 473 174 140 17 North America 2138 465 274 26 South America 1753 681 142 9 Former USSR 2227 356 233 20 Total 13077 3190 1474 227
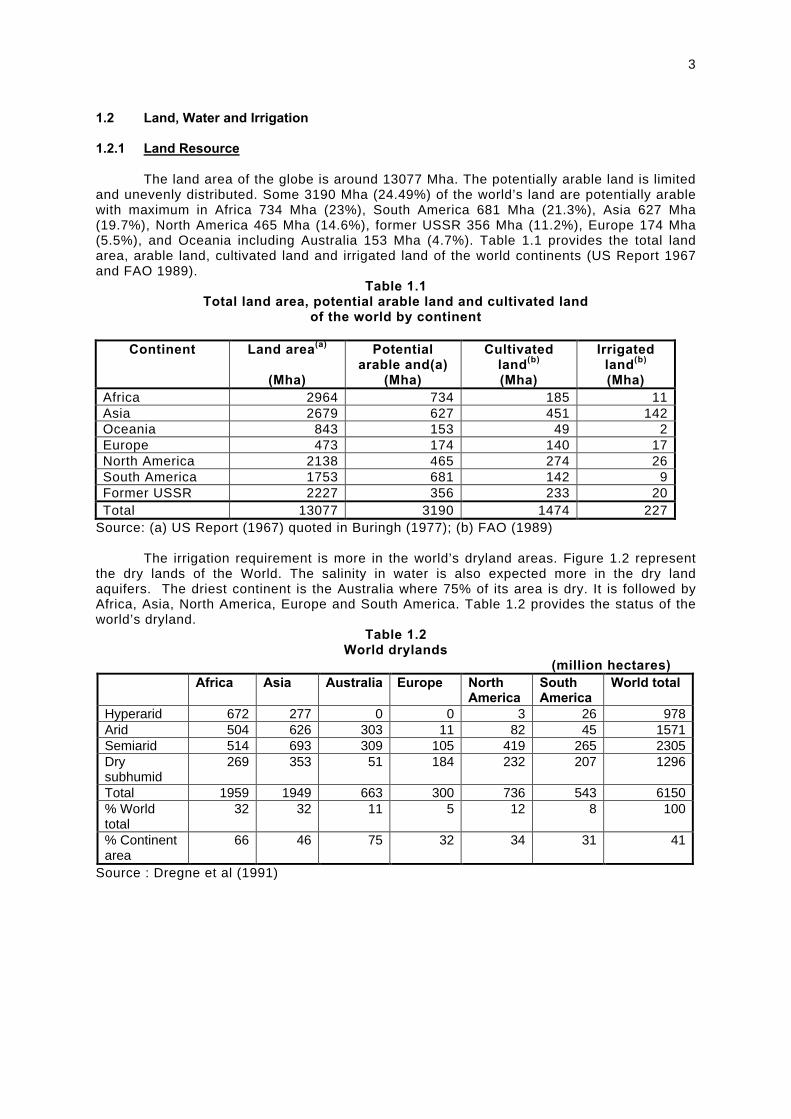
Source: (a) US Report (1967) quoted in Buringh (1977); (b) FAO (1989) The irrigation requirement is more in the world’s dryland areas. Figure 1.2 represent the dry lands of the World. The salinity in water is also expected more in the dry land aquifers. The driest continent is the Australia where 75% of its area is dry. It is followed by Africa, Asia, North America, Europe and South America. Table 1.2 provides the status of the world’s dryland.
Table 1.2 World drylands
(million hectares) Africa Asia Australia Europe North
America South America
World total
Hyperarid 672 277 0 0 3 26 978 Arid 504 626 303 11 82 45 1571 Semiarid 514 693 309 105 419 265 2305 Dry subhumid
269 353 51 184 232 207 1296
Total 1959 1949 663 300 736 543 6150 % World total
32 32 11 5 12 8 100
% Continent area
66 46 75 32 34 31 41
Source : Dregne et al (1991)
4
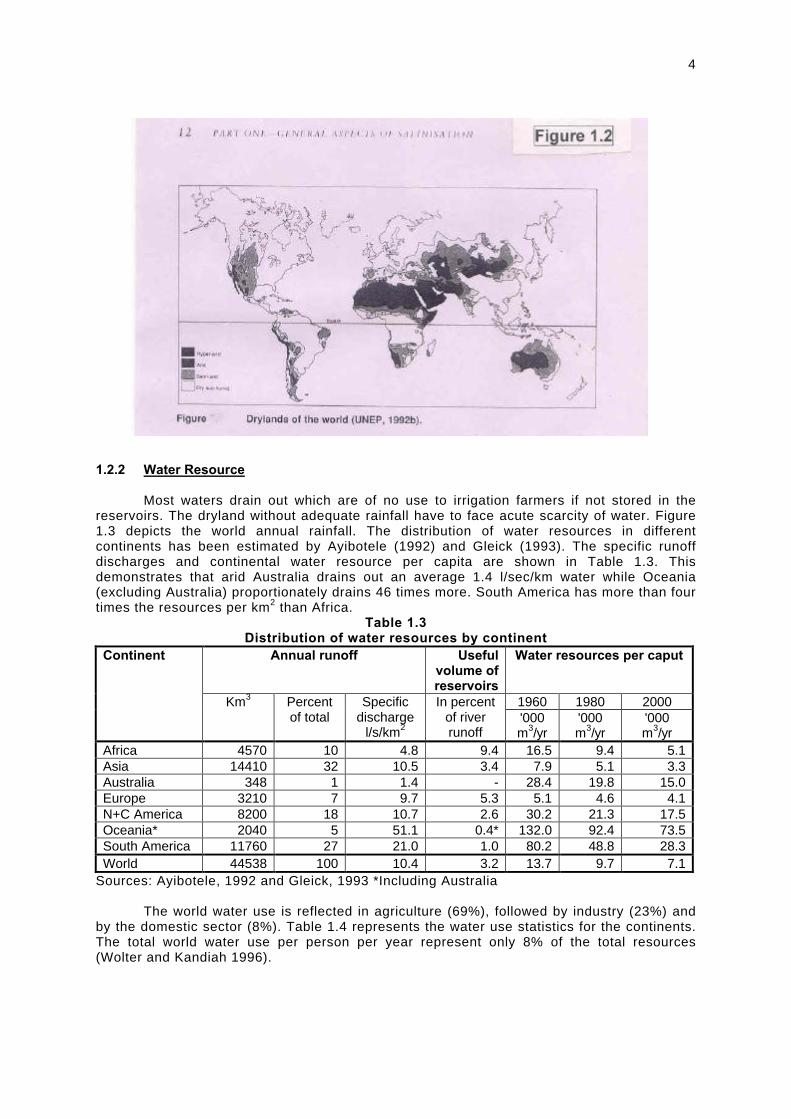
1.2.2 Water Resource Most waters drain out which are of no use to irrigation farmers if not stored in the reservoirs. The dryland without adequate rainfall have to face acute scarcity of water. Figure 1.3 depicts the world annual rainfall. The distribution of water resources in different continents has been estimated by Ayibotele (1992) and Gleick (1993). The specific runoff discharges and continental water resource per capita are shown in Table 1.3. This demonstrates that arid Australia drains out an average 1.4 l/sec/km water while Oceania (excluding Australia) proportionately drains 46 times more. South America has more than four times the resources per km2 than Africa.
Table 1.3 Distribution of water resources by continent
Annual runoff Useful volume of reservoirs
Water resources per caput
1960 1980 2000
Continent
Km3 Percent of total
Specific discharge
l/s/km2
In percent of river runoff
'000 m3/yr
'000 m3/yr
'000 m3/yr
Africa 4570 10 4.8 9.4 16.5 9.4 5.1 Asia 14410 32 10.5 3.4 7.9 5.1 3.3 Australia 348 1 1.4 - 28.4 19.8 15.0 Europe 3210 7 9.7 5.3 5.1 4.6 4.1 N+C America 8200 18 10.7 2.6 30.2 21.3 17.5 Oceania* 2040 5 51.1 0.4* 132.0 92.4 73.5 South America 11760 27 21.0 1.0 80.2 48.8 28.3 World 44538 100 10.4 3.2 13.7 9.7 7.1
Sources: Ayibotele, 1992 and Gleick, 1993 *Including Australia The world water use is reflected in agriculture (69%), followed by industry (23%) and by the domestic sector (8%). Table 1.4 represents the water use statistics for the continents. The total world water use per person per year represent only 8% of the total resources (Wolter and Kandiah 1996).
5
Table 1.4 Water use by continent (1990)
Percentages Total Continent
Agriculture Domestic Industries km3 m3/pers/yr
% of wat. Res.
Africa 88 7 5 144 245 3 Asia 86 6 8 1531 519 15 Former USSR 65 7 28 358 1280 8 Europe 33 13 54 359 713 15 N+C America 49 9 42 697 1861 10 Oceania* 34 64 2 23 905 1 South America 59 19 23 133 478 1 World 69 8 23 3240 644 8 Source: WRI, 1994 * Including Australia Hydrologists consider the country or an area water scarce where the indigenous water supplies exist on an average less than 1000 m3 per person per year. More than 230 million people living in some 26 countries, 11 of them in Africa and 9 in the Near East, already fall in
6
this category. Table 1.7 gives the water availability versus population of the selected 20 countries, which broadly fall in the category of the water scarce countries. The use of saline water opportunity becomes of great relevance in these countries.
Table 1.5
Water Scarce Countries in the year 2000
Water Availability (m3/person) Country Internal renewable
water resources Including river
flows from other countries
Population (million)
Egypt 29 934 62.4 Saudi Arabia 103 103 21.3 Libya 108 108 6.5 UAE 152 152 2.0 Jordan 153 240 4.6 Mauritania 154 2843 2.6 Yemen 155 155 16.2 Tunisia 384 445 9.8 Syria 430 2008 17.7 Kenya 436 436 34.0 Burundi 487 487 7.4 Algeria 570 576 33.1 Hungary 591 11326 10.1 Rwanda 604 604 10.4 Botswana 622 11187 1.6 Malawi 760 760 11.8 Oman 880 880 2.3 Sudan 905 3923 33.1 Morocco 943 943 31.8 Somalia 1086 1086 10.6
Source: FAO calculations based on the World Bank and other data (FAO irrigation and Drainage Paper 52)
1.2.3 Irrigation The global percent compounded rates of increase in irrigation was 4.1% in 1960, 3.5% in 1970, 2.3% in 1980 and 1% in 1984 (Jensen 1990). The expansion of the world’s irrigated area per year since 1800 was 0.3 Mha (1800-1900), 1 Mha (1900-1940/45), 5 Mha (1940/45-1970), 4 Mha (1970-1980) and 2 Mha (1980-1990) (Smedma 1995). The rate of increase in irrigation fell below the rate of increase in population beginning about the year 1979 (World Watch Institute, 1997). In 1990, the ten leading countries of the world in irrigation were (1) China, (2) India, (3) former USSR, (4) USA, (5) Pakistan, (6) Indonesia, (7) Iran, (8) Mexico, (9) Thailand, and (10) Romania, comprising the highest from about 45 Mha irrigated land in China to the lowest about 3 Mha irrigated land in Romania. 1.3 Irrigation and Drainage Methods 1.3.1 Irrigation Methods Irrigation systems are classified into four groups: 1) surface irrigation, 2) sprinkler irrigation, 3) drip or trickle irrigation and 4) subsurface irrigation. In early times, the crops were flooded through water applications in Asia and Southern Europe, but at later times the different irrigation methods at high efficiency load have been developed and the irrigation technology at highly advanced stage. Table 1.6 gives the classification of different methods of irrigation (FAO 1995, World Bank 1994). Among four methods of irrigation, the surface irrigation is done in borders, basins and furrows. The world owns to it account for more than 90% of the irrigated area. The sprinkler
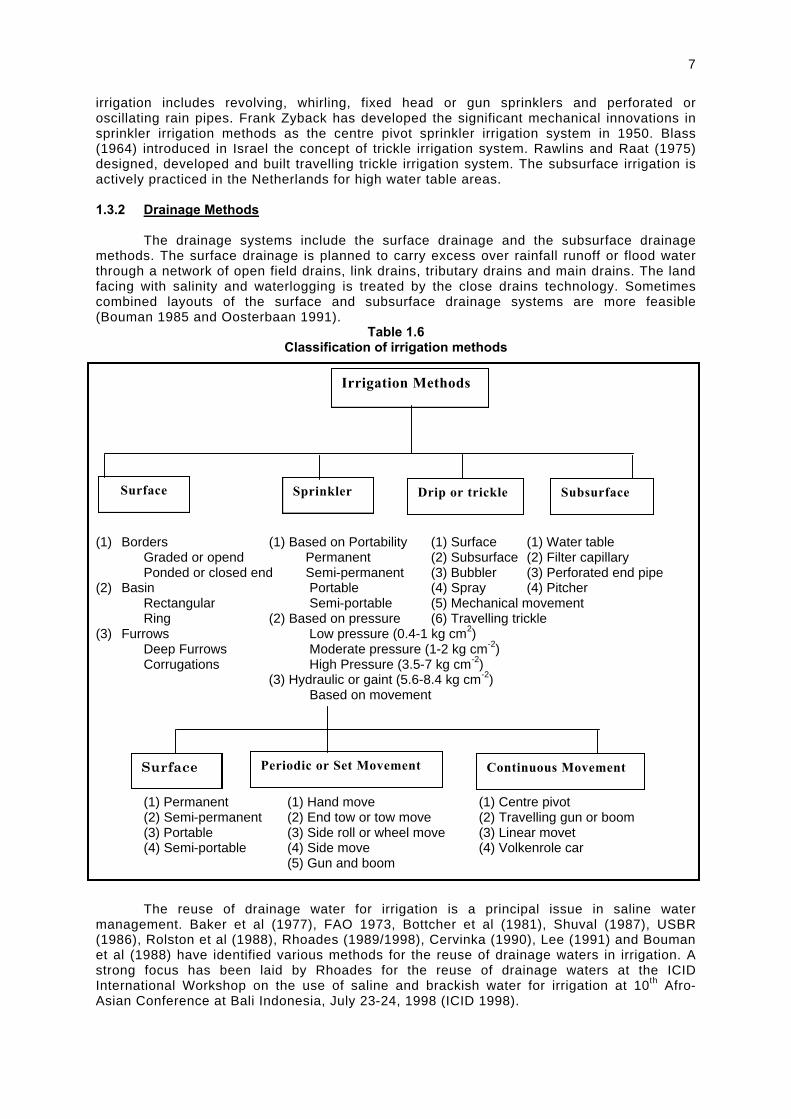
7
irrigation includes revolving, whirling, fixed head or gun sprinklers and perforated or oscillating rain pipes. Frank Zyback has developed the significant mechanical innovations in sprinkler irrigation methods as the centre pivot sprinkler irrigation system in 1950. Blass (1964) introduced in Israel the concept of trickle irrigation system. Rawlins and Raat (1975) designed, developed and built travelling trickle irrigation system. The subsurface irrigation is actively practiced in the Netherlands for high water table areas. 1.3.2 Drainage Methods The drainage systems include the surface drainage and the subsurface drainage methods. The surface drainage is planned to carry excess over rainfall runoff or flood water through a network of open field drains, link drains, tributary drains and main drains. The land facing with salinity and waterlogging is treated by the close drains technology. Sometimes combined layouts of the surface and subsurface drainage systems are more feasible (Bouman 1985 and Oosterbaan 1991).
Table 1.6 Classification of irrigation methods
(1) Borders (1) Based on Portability (1) Surface (1) Water table
Graded or opend Permanent (2) Subsurface (2) Filter capillary Ponded or closed end Semi-permanent (3) Bubbler (3) Perforated end pipe
(2) Basin Portable (4) Spray (4) Pitcher Rectangular Semi-portable (5) Mechanical movement Ring (2) Based on pressure (6) Travelling trickle
(3) Furrows Low pressure (0.4-1 kg cm2) Deep Furrows Moderate pressure (1-2 kg cm-2) Corrugations High Pressure (3.5-7 kg cm-2)
(3) Hydraulic or gaint (5.6-8.4 kg cm-2) Based on movement
(1) Permanent (1) Hand move (1) Centre pivot (2) Semi-permanent (2) End tow or tow move (2) Travelling gun or boom (3) Portable (3) Side roll or wheel move (3) Linear movet (4) Semi-portable (4) Side move (4) Volkenrole car (5) Gun and boom The reuse of drainage water for irrigation is a principal issue in saline water management. Baker et al (1977), FAO 1973, Bottcher et al (1981), Shuval (1987), USBR (1986), Rolston et al (1988), Rhoades (1989/1998), Cervinka (1990), Lee (1991) and Bouman et al (1988) have identified various methods for the reuse of drainage waters in irrigation. A strong focus has been laid by Rhoades for the reuse of drainage waters at the ICID International Workshop on the use of saline and brackish water for irrigation at 10th Afro-Asian Conference at Bali Indonesia, July 23-24, 1998 (ICID 1998).
Irrigation Methods
Surface Sprinkler Drip or trickle Subsurface
Surface Periodic or Set Movement Continuous Movement

8
1.4 International Initiatives in Water Sector Reforms The UN sponsored International conference on Water and Environment (UNICWE) held in Dublin, Ireland from 26 to 31 January 1992 called for innovative approaches to the assessment, development and management of water resources and provided policy guidance for the UN Conference on Environment and Development (UNCED). Later the Earth Summit was held in Rio de Janeiro, Brazil, in June 1992. UNCED highlighted the need for water sector reforms throughout the world under Agenda 21. The Earth Summit has set formidable challenges for the development of water resources and agricultural production to ensure food security and environmental protection. Agenda 21 endorsed by the leaders of 178 nations, sets the targets for increasing sustainable crop production at 3 to 4 percent per annum including the increase in productivity of existing irrigation schemes. Apparently, the use of saline water is essentially needed for crop production where the fresh water is deficient and the environmental protection is required to be maintained. The International Commission on Irrigation and Drainage (ICID) at 15th ICID congress in the Hague from 6-11 September 1993 called upon its member countries worldwide to take up the prime responsibility and play a role to display the real commitment to achieve the Agenda 21 prescription and its main objectives. The Hague ICID Declaration presented in Table 1.7 has become the policy framework for the ICID to persue agenda 21.
Table 1.7 The Hague ICID declaration (1993)
Sr. No.
Declaration
1 ICID will promote new programs for water savings in agriculture to enable the release of water for other emerging high priority uses.
2 ICID will encourage irrigation and drainage agencies to optimize the use of resources and adopt holistic and multi-disciplinary approaches to the planning of irrigation and drainage systems which in large measure, are the keys to attaining sustainable schemes.
3 ICID will promote programs to enhance the productivity of water at both the farm and system levels and to ensure equity in the distribution of irrigation water, the sustainability of development and the protection of the environment.
4 ICID will launch public awareness and participation programs in association with other agencies on the annual World Water Day, 22nd March, as established by the United Nations.
5 Irrigation and drainage agencies will be encouraged to increase participation of farmer organizations in the operation, maintenance and management of irrigation and drainage systems.
6 ICID will promote international cooperation in the management of international river basins.
7 ICID will promote special programs in irrigation, drainage and water management in Africa and other water-stressed areas.
8 ICID will develop areas oriented plans for the management of droughts and floods. 9 ICID and its National Committees will broaden their membership and develop young
professionals from whom future leaders will emerge. 10 Programs will be undertaken to exchange appropriate technology among National
Committees, planners, designers and managers of irrigation systems. The world Bank supported International Program for Technology Research in Irrigation and Drainage (IPTRID) aims to improve the technology of irrigation and drainage in the developing countries with the objective of increasing food productions with due regard to sustainability. The need of this initiative is more important in the light of issues highlighted
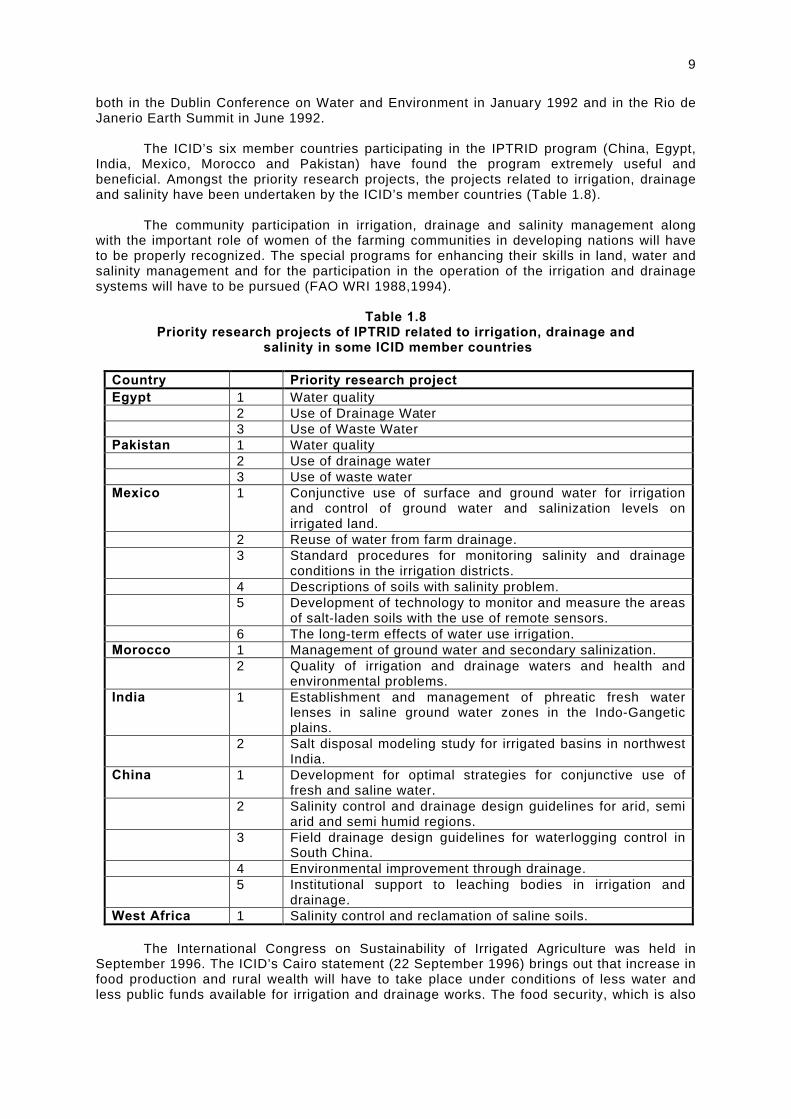
9
both in the Dublin Conference on Water and Environment in January 1992 and in the Rio de Janerio Earth Summit in June 1992. The ICID’s six member countries participating in the IPTRID program (China, Egypt, India, Mexico, Morocco and Pakistan) have found the program extremely useful and beneficial. Amongst the priority research projects, the projects related to irrigation, drainage and salinity have been undertaken by the ICID’s member countries (Table 1.8). The community participation in irrigation, drainage and salinity management along with the important role of women of the farming communities in developing nations will have to be properly recognized. The special programs for enhancing their skills in land, water and salinity management and for the participation in the operation of the irrigation and drainage systems will have to be pursued (FAO WRI 1988,1994).
Table 1.8
Priority research projects of IPTRID related to irrigation, drainage and salinity in some ICID member countries
Country Priority research project Egypt 1 Water quality 2 Use of Drainage Water 3 Use of Waste Water Pakistan 1 Water quality 2 Use of drainage water 3 Use of waste water Mexico 1 Conjunctive use of surface and ground water for irrigation
and control of ground water and salinization levels on irrigated land.
2 Reuse of water from farm drainage. 3 Standard procedures for monitoring salinity and drainage
conditions in the irrigation districts. 4 Descriptions of soils with salinity problem. 5 Development of technology to monitor and measure the areas
of salt-laden soils with the use of remote sensors. 6 The long-term effects of water use irrigation. Morocco 1 Management of ground water and secondary salinization. 2 Quality of irrigation and drainage waters and health and
environmental problems. India 1 Establishment and management of phreatic fresh water
lenses in saline ground water zones in the Indo-Gangetic plains.
2 Salt disposal modeling study for irrigated basins in northwest India.
China 1 Development for optimal strategies for conjunctive use of fresh and saline water.
2 Salinity control and drainage design guidelines for arid, semi arid and semi humid regions.
3 Field drainage design guidelines for waterlogging control in South China.
4 Environmental improvement through drainage. 5 Institutional support to leaching bodies in irrigation and
drainage. West Africa 1 Salinity control and reclamation of saline soils.
The International Congress on Sustainability of Irrigated Agriculture was held in September 1996. The ICID’s Cairo statement (22 September 1996) brings out that increase in food production and rural wealth will have to take place under conditions of less water and less public funds available for irrigation and drainage works. The food security, which is also

10
closely linked with water security, will have to be achieved under conditions of natural variability in supply and climate change (ICID 1996). The World Bank has also issued a comprehensive policy paper defining its new objectives for the water sector. FAO has established an International Action Programme on Water and Sustainable Agriculture Development (IAP-WASAD). Likewise, the UN specialized agencies, international Non-governmental Organizations (NGOs) and bilateral assistance agencies are all coordinating or participating in special program related to water resources. The water is increasingly scarce and valuable resource and its growing scarcity and misuse poses serious threat to the sustainable development. The future of water is the future of human civilization. The water of varying quality including saline water, saline drainage water and waste water with varying degree of contamination needs proper planning, investigation, monitoring, development and management in all the countries over the world with high focus on the semi arid and arid regions.
Chapter 2
GLOBAL SALINE ENVIRONMENT
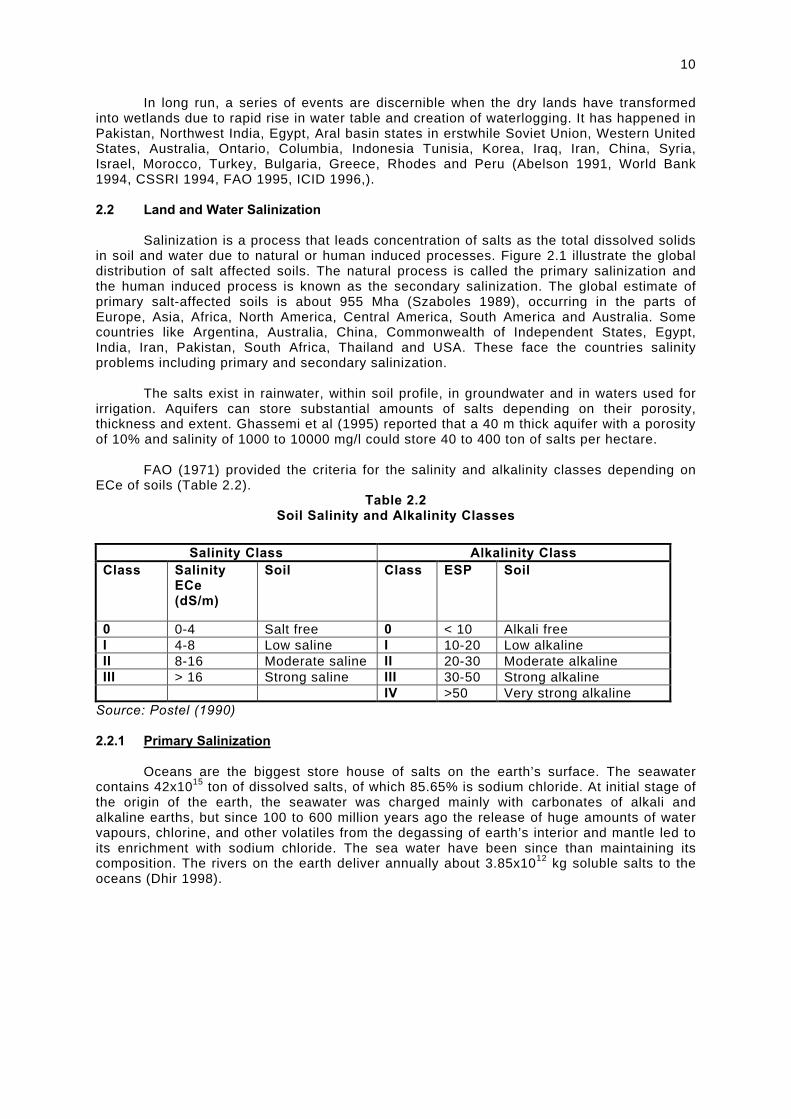
2.1 Introduction The fresh water is about 2.5 percent of the total global waters and the salt water is about 97.5 percent. While the world’s oceans may seem unbounded, the amount of fresh water virtually available to the mankind is most finite (Table 2.1).
Table 2.1
Distribution of global fresh water and salt water
Distribution of fresh water quality Quality Global distribution (%) Location Million km3 Percentage
Glaciers & snow lakes 24.6 69.0 Fresh Water
2.5 Lakes & rivers 0.09 0.3 Soil moisture etc. 0.34 0.7 Salt
water 97.5 Ground water 10.53 30.0
Source: Igor Shiklomanov “World Fresh Water Resources” in Peter H. Gleck, ed., Water in Crisis: A Guide to the World’s Fresh Water Resources, 1993
Human use of fresh water has increased more than 35 fold over the past three centuries. The inland saline water has now great potential for the use in irrigation with the application of the adaptable water use technologies as a non conventional water resource. Beneath many of the world’s deserts are reserves of saline water. Many surface waters estuaries, coastal lagoons, and locked lakes, and irrigation return flows – contain fairly large amounts of salts. The coastal zones display a variety of complex environments. The salinity may range from essentially fresh water in estuaries to extreme hypersaline lagoons. Some beaches and tidal inlets are continuously modified by waves and water currents. Incidentally, the world’s 1/3rd of the population is concentrated within 100 km of the coastlines. Largest cities of the world are mostly situated close to the seas. The surface water under tidal influence being mostly saline, the ground water resource from the coastal aquifers meet the bulk of water requirements. The coastal aquifers if depleted beyond certain limits, become a subject to the adverse situation of the saline water intrusion from sea. The inland subhumid, semiarid and arid areas endowed with salinity in ground waters and soils reflect the inland saline environment. Though the density of population is generally low in these areas, its sustenance depends upon the use of saline waters, the rain being very scanty. The native hydrological and geohydrological conditions depict the fast changes on an interbasin transfer of the surplus surface water in such areas leading to the waterlogging and salinity (Tanwar and Kruseman 1985). River waters generally contain low salt load (< 0.05 dS/m) but their use at the rate of 1 hectare meter (ham) may annually add about 1-2 ton soluble salts, which over the passing time leads to the salt build-up especially in the closed basins (Tanwar 1979). In arid areas, like Iran, the river waters contain greater salt load causing more problems. The salinity in the river waters, lakes and soil crust constitute the surface saline environment. Areas underlain by the saline ground water aquifers or having salts in the soil profile constitute the subsurface saline environment. The saline water environment exists in (1) coastal areas, (2) inland semiarid and arid areas, and (3) waterlogged and saline areas in the canal commands (Kovda 1973). The requirement of irrigation is more in the inland semiarid to arid areas and the coastal belts, while the waterlogged areas need more drainage applications in conjunction with limited irrigation facilities (USDA 1991).
10
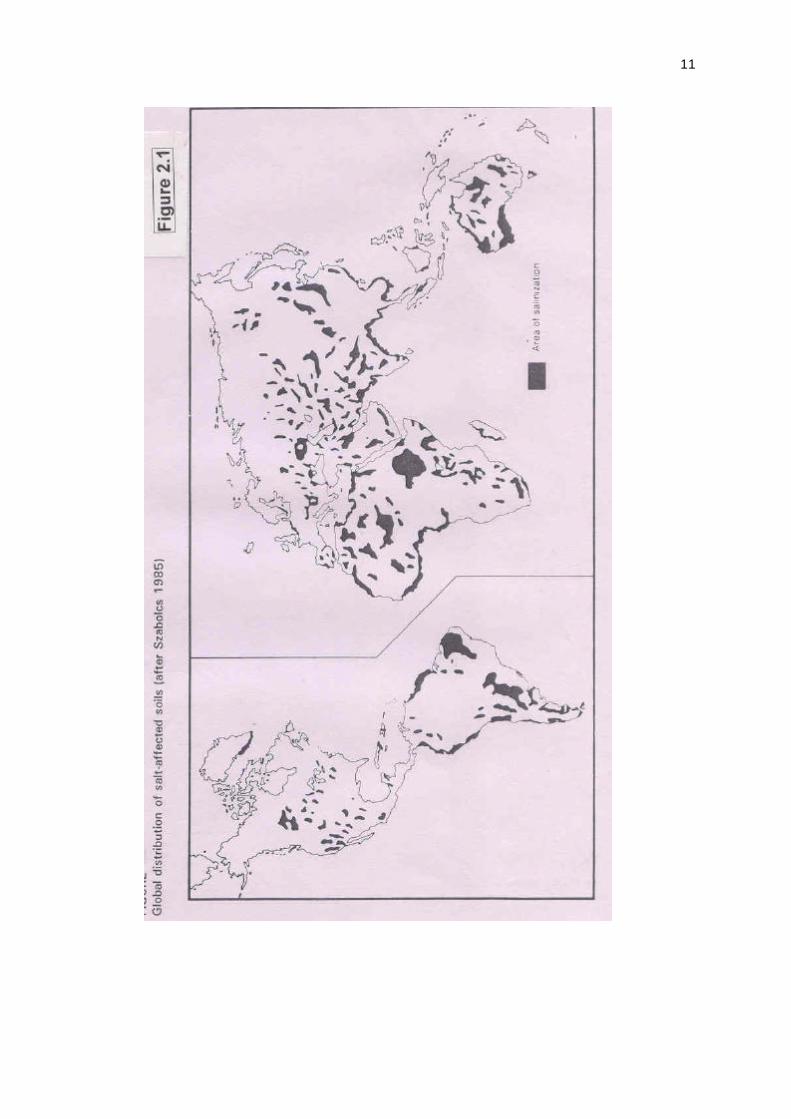
In long run, a series of events are discernible when the dry lands have transformed into wetlands due to rapid rise in water table and creation of waterlogging. It has happened in Pakistan, Northwest India, Egypt, Aral basin states in erstwhile Soviet Union, Western United States, Australia, Ontario, Columbia, Indonesia Tunisia, Korea, Iraq, Iran, China, Syria, Israel, Morocco, Turkey, Bulgaria, Greece, Rhodes and Peru (Abelson 1991, World Bank 1994, CSSRI 1994, FAO 1995, ICID 1996,). 2.2 Land and Water Salinization Salinization is a process that leads concentration of salts as the total dissolved solids in soil and water due to natural or human induced processes. Figure 2.1 illustrate the global distribution of salt affected soils. The natural process is called the primary salinization and the human induced process is known as the secondary salinization. The global estimate of primary salt-affected soils is about 955 Mha (Szaboles 1989), occurring in the parts of Europe, Asia, Africa, North America, Central America, South America and Australia. Some countries like Argentina, Australia, China, Commonwealth of Independent States, Egypt, India, Iran, Pakistan, South Africa, Thailand and USA. These face the countries salinity problems including primary and secondary salinization.
The salts exist in rainwater, within soil profile, in groundwater and in waters used for
irrigation. Aquifers can store substantial amounts of salts depending on their porosity, thickness and extent. Ghassemi et al (1995) reported that a 40 m thick aquifer with a porosity of 10% and salinity of 1000 to 10000 mg/l could store 40 to 400 ton of salts per hectare. FAO (1971) provided the criteria for the salinity and alkalinity classes depending on ECe of soils (Table 2.2).
Table 2.2 Soil Salinity and Alkalinity Classes
Salinity Class Alkalinity Class
Class Salinity ECe (dS/m)
Soil Class ESP Soil
0 0-4 Salt free 0 < 10 Alkali free I 4-8 Low saline I 10-20 Low alkaline II 8-16 Moderate saline II 20-30 Moderate alkaline III > 16 Strong saline III 30-50 Strong alkaline IV >50 Very strong alkaline
Source: Postel (1990) 2.2.1 Primary Salinization Oceans are the biggest store house of salts on the earth’s surface. The seawater contains 42x1015 ton of dissolved salts, of which 85.65% is sodium chloride. At initial stage of the origin of the earth, the seawater was charged mainly with carbonates of alkali and alkaline earths, but since 100 to 600 million years ago the release of huge amounts of water vapours, chlorine, and other volatiles from the degassing of earth’s interior and mantle led to its enrichment with sodium chloride. The sea water have been since than maintaining its composition. The rivers on the earth deliver annually about 3.85x10¹² kg soluble salts to the oceans (Dhir 1998).
11
12
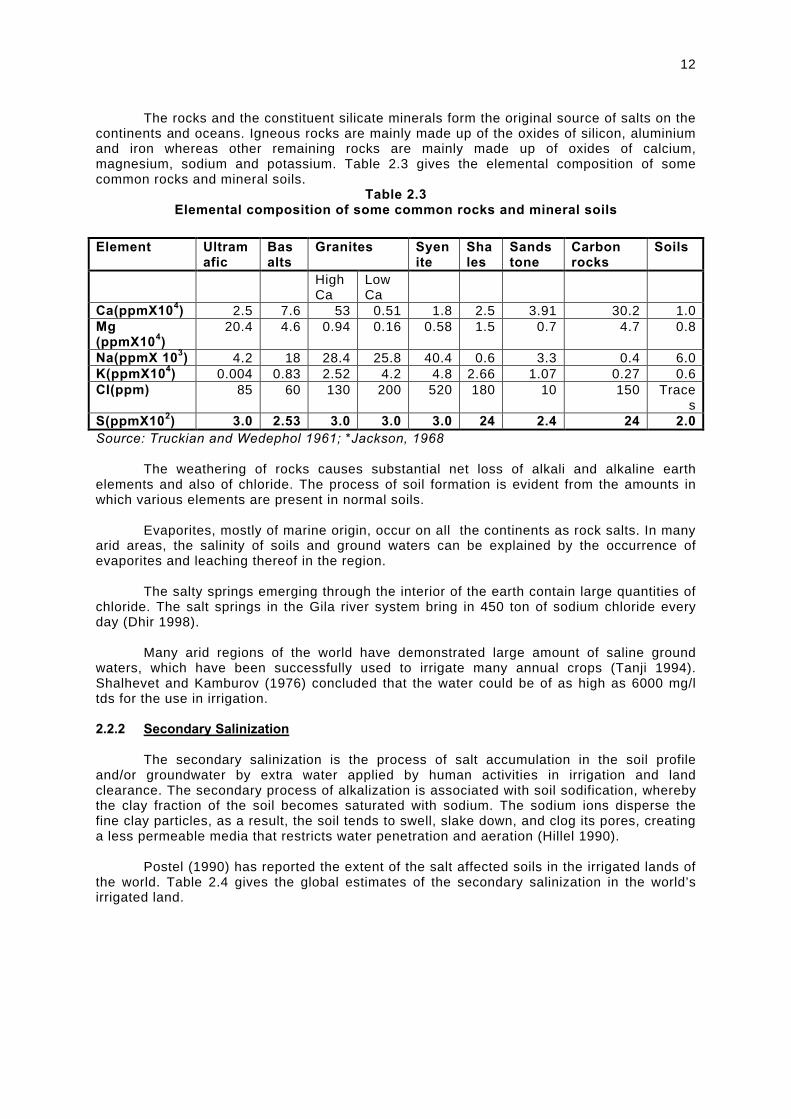
The rocks and the constituent silicate minerals form the original source of salts on the continents and oceans. Igneous rocks are mainly made up of the oxides of silicon, aluminium and iron whereas other remaining rocks are mainly made up of oxides of calcium, magnesium, sodium and potassium. Table 2.3 gives the elemental composition of some common rocks and mineral soils.
Table 2.3 Elemental composition of some common rocks and mineral soils
Element Ultram
afic Basalts
Granites Syenite
Shales
Sandstone
Carbon rocks
Soils
High Ca
Low Ca
Ca(ppmX104) 2.5 7.6 53 0.51 1.8 2.5 3.91 30.2 1.0 Mg (ppmX104)
20.4 4.6 0.94 0.16 0.58 1.5 0.7 4.7 0.8
Na(ppmX 103) 4.2 18 28.4 25.8 40.4 0.6 3.3 0.4 6.0 K(ppmX104) 0.004 0.83 2.52 4.2 4.8 2.66 1.07 0.27 0.6 CI(ppm) 85 60 130 200 520 180 10 150 Trace
s S(ppmX102) 3.0 2.53 3.0 3.0 3.0 24 2.4 24 2.0 Source: Truckian and Wedephol 1961; *Jackson, 1968 The weathering of rocks causes substantial net loss of alkali and alkaline earth elements and also of chloride. The process of soil formation is evident from the amounts in which various elements are present in normal soils.
Evaporites, mostly of marine origin, occur on all the continents as rock salts. In many
arid areas, the salinity of soils and ground waters can be explained by the occurrence of evaporites and leaching thereof in the region. The salty springs emerging through the interior of the earth contain large quantities of chloride. The salt springs in the Gila river system bring in 450 ton of sodium chloride every day (Dhir 1998). Many arid regions of the world have demonstrated large amount of saline ground waters, which have been successfully used to irrigate many annual crops (Tanji 1994). Shalhevet and Kamburov (1976) concluded that the water could be of as high as 6000 mg/l tds for the use in irrigation. 2.2.2 Secondary Salinization The secondary salinization is the process of salt accumulation in the soil profile and/or groundwater by extra water applied by human activities in irrigation and land clearance. The secondary process of alkalization is associated with soil sodification, whereby the clay fraction of the soil becomes saturated with sodium. The sodium ions disperse the fine clay particles, as a result, the soil tends to swell, slake down, and clog its pores, creating a less permeable media that restricts water penetration and aeration (Hillel 1990). Postel (1990) has reported the extent of the salt affected soils in the irrigated lands of the world. Table 2.4 gives the global estimates of the secondary salinization in the world’s irrigated land.
13
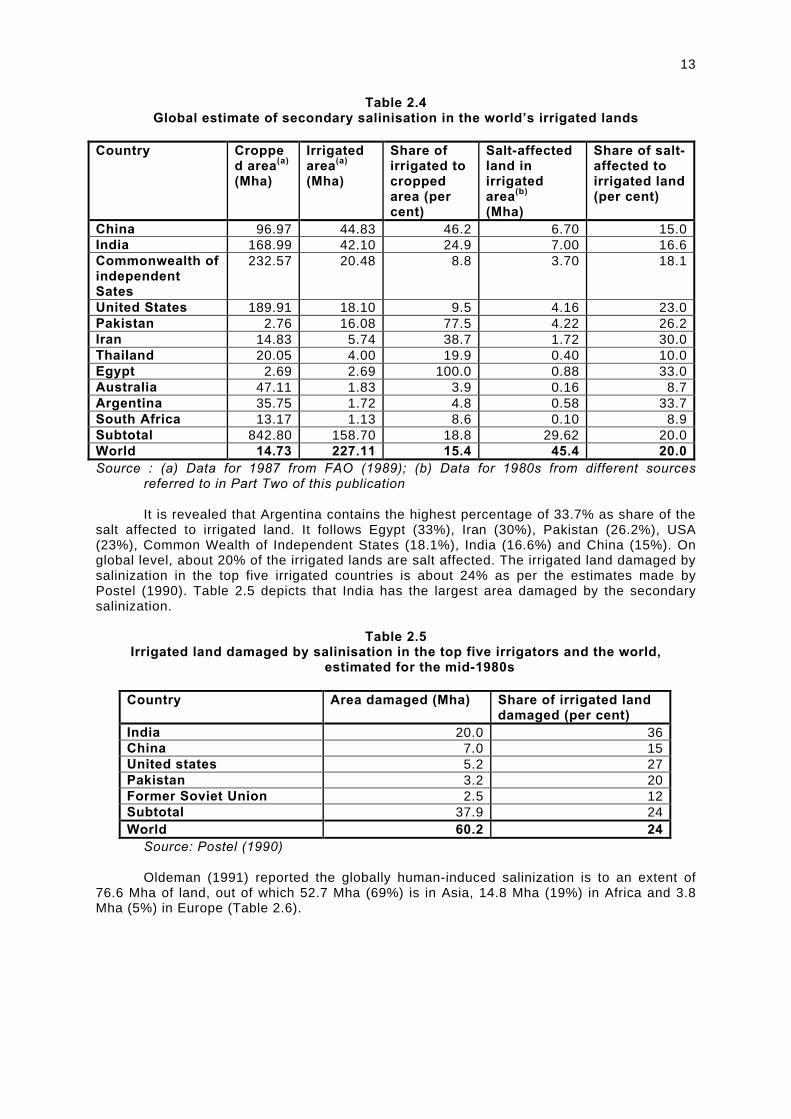
Table 2.4 Global estimate of secondary salinisation in the world’s irrigated lands
Country Croppe
d area(a) (Mha)
Irrigated area(a) (Mha)
Share of irrigated to cropped area (per cent)
Salt-affected land in irrigated area(b) (Mha)
Share of salt-affected to irrigated land (per cent)
China 96.97 44.83 46.2 6.70 15.0 India 168.99 42.10 24.9 7.00 16.6 Commonwealth of independent Sates
232.57 20.48 8.8 3.70 18.1
United States 189.91 18.10 9.5 4.16 23.0 Pakistan 2.76 16.08 77.5 4.22 26.2 Iran 14.83 5.74 38.7 1.72 30.0 Thailand 20.05 4.00 19.9 0.40 10.0 Egypt 2.69 2.69 100.0 0.88 33.0 Australia 47.11 1.83 3.9 0.16 8.7 Argentina 35.75 1.72 4.8 0.58 33.7 South Africa 13.17 1.13 8.6 0.10 8.9 Subtotal 842.80 158.70 18.8 29.62 20.0 World 14.73 227.11 15.4 45.4 20.0 Source : (a) Data for 1987 from FAO (1989); (b) Data for 1980s from different sources
referred to in Part Two of this publication It is revealed that Argentina contains the highest percentage of 33.7% as share of the salt affected to irrigated land. It follows Egypt (33%), Iran (30%), Pakistan (26.2%), USA (23%), Common Wealth of Independent States (18.1%), India (16.6%) and China (15%). On global level, about 20% of the irrigated lands are salt affected. The irrigated land damaged by salinization in the top five irrigated countries is about 24% as per the estimates made by Postel (1990). Table 2.5 depicts that India has the largest area damaged by the secondary salinization.
Table 2.5
Irrigated land damaged by salinisation in the top five irrigators and the world, estimated for the mid-1980s
Country Area damaged (Mha) Share of irrigated land
damaged (per cent) India 20.0 36 China 7.0 15 United states 5.2 27 Pakistan 3.2 20 Former Soviet Union 2.5 12 Subtotal 37.9 24 World 60.2 24
Source: Postel (1990) Oldeman (1991) reported the globally human-induced salinization is to an extent of 76.6 Mha of land, out of which 52.7 Mha (69%) is in Asia, 14.8 Mha (19%) in Africa and 3.8 Mha (5%) in Europe (Table 2.6).
14
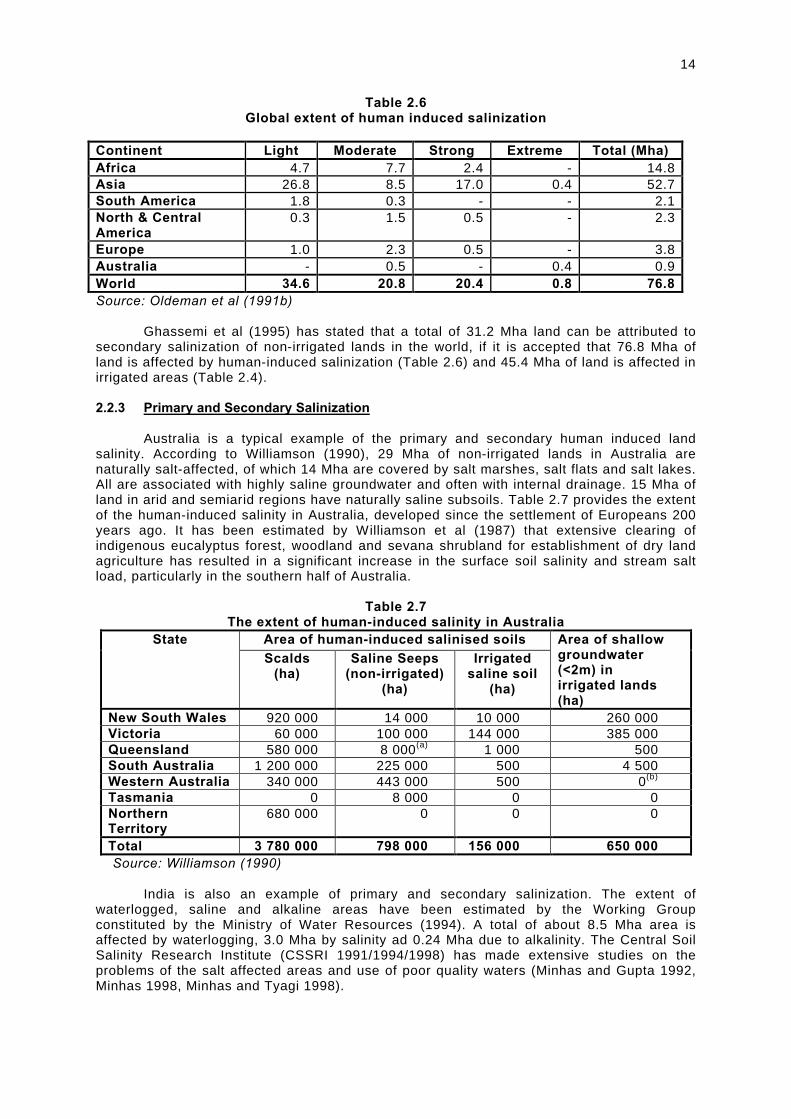
Table 2.6 Global extent of human induced salinization
Continent Light Moderate Strong Extreme Total (Mha) Africa 4.7 7.7 2.4 - 14.8 Asia 26.8 8.5 17.0 0.4 52.7 South America 1.8 0.3 - - 2.1 North & Central America
0.3 1.5 0.5 - 2.3
Europe 1.0 2.3 0.5 - 3.8 Australia - 0.5 - 0.4 0.9 World 34.6 20.8 20.4 0.8 76.8 Source: Oldeman et al (1991b) Ghassemi et al (1995) has stated that a total of 31.2 Mha land can be attributed to secondary salinization of non-irrigated lands in the world, if it is accepted that 76.8 Mha of land is affected by human-induced salinization (Table 2.6) and 45.4 Mha of land is affected in irrigated areas (Table 2.4). 2.2.3 Primary and Secondary Salinization Australia is a typical example of the primary and secondary human induced land salinity. According to Williamson (1990), 29 Mha of non-irrigated lands in Australia are naturally salt-affected, of which 14 Mha are covered by salt marshes, salt flats and salt lakes. All are associated with highly saline groundwater and often with internal drainage. 15 Mha of land in arid and semiarid regions have naturally saline subsoils. Table 2.7 provides the extent of the human-induced salinity in Australia, developed since the settlement of Europeans 200 years ago. It has been estimated by Williamson et al (1987) that extensive clearing of indigenous eucalyptus forest, woodland and sevana shrubland for establishment of dry land agriculture has resulted in a significant increase in the surface soil salinity and stream salt load, particularly in the southern half of Australia.
Table 2.7 The extent of human-induced salinity in Australia
Area of human-induced salinised soils State Scalds
(ha) Saline Seeps
(non-irrigated) (ha)
Irrigated saline soil
(ha)
Area of shallow groundwater (<2m) in irrigated lands (ha)
New South Wales 920 000 14 000 10 000 260 000 Victoria 60 000 100 000 144 000 385 000 Queensland 580 000 8 000(a) 1 000 500 South Australia 1 200 000 225 000 500 4 500 Western Australia 340 000 443 000 500 0(b) Tasmania 0 8 000 0 0 Northern Territory
680 000 0 0 0
Total 3 780 000 798 000 156 000 650 000 Source: Williamson (1990) India is also an example of primary and secondary salinization. The extent of waterlogged, saline and alkaline areas have been estimated by the Working Group constituted by the Ministry of Water Resources (1994). A total of about 8.5 Mha area is affected by waterlogging, 3.0 Mha by salinity ad 0.24 Mha due to alkalinity. The Central Soil Salinity Research Institute (CSSRI 1991/1994/1998) has made extensive studies on the problems of the salt affected areas and use of poor quality waters (Minhas and Gupta 1992, Minhas 1998, Minhas and Tyagi 1998).
15
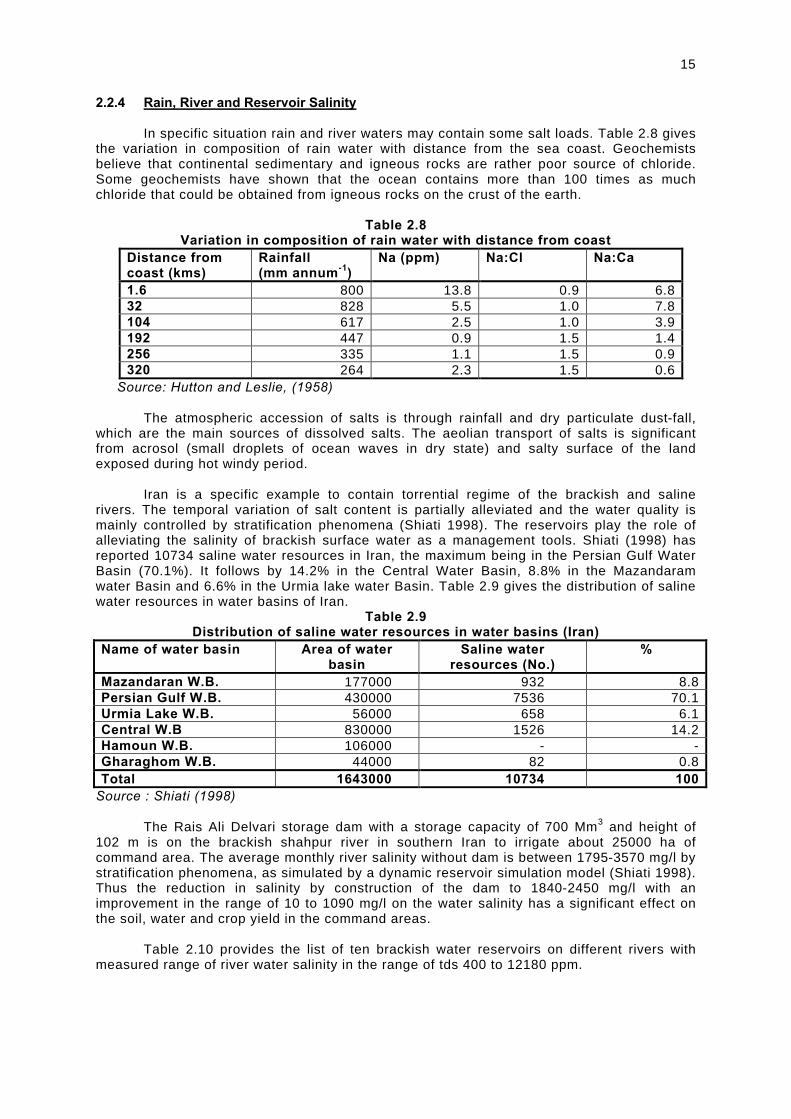
2.2.4 Rain, River and Reservoir Salinity In specific situation rain and river waters may contain some salt loads. Table 2.8 gives
the variation in composition of rain water with distance from the sea coast. Geochemists believe that continental sedimentary and igneous rocks are rather poor source of chloride. Some geochemists have shown that the ocean contains more than 100 times as much chloride that could be obtained from igneous rocks on the crust of the earth.
Table 2.8
Variation in composition of rain water with distance from coast Distance from coast (kms)
Rainfall (mm annum-1)
Na (ppm) Na:Cl Na:Ca
1.6 800 13.8 0.9 6.8 32 828 5.5 1.0 7.8 104 617 2.5 1.0 3.9 192 447 0.9 1.5 1.4 256 335 1.1 1.5 0.9 320 264 2.3 1.5 0.6
Source: Hutton and Leslie, (1958) The atmospheric accession of salts is through rainfall and dry particulate dust-fall, which are the main sources of dissolved salts. The aeolian transport of salts is significant from acrosol (small droplets of ocean waves in dry state) and salty surface of the land exposed during hot windy period. Iran is a specific example to contain torrential regime of the brackish and saline rivers. The temporal variation of salt content is partially alleviated and the water quality is mainly controlled by stratification phenomena (Shiati 1998). The reservoirs play the role of alleviating the salinity of brackish surface water as a management tools. Shiati (1998) has reported 10734 saline water resources in Iran, the maximum being in the Persian Gulf Water Basin (70.1%). It follows by 14.2% in the Central Water Basin, 8.8% in the Mazandaram water Basin and 6.6% in the Urmia lake water Basin. Table 2.9 gives the distribution of saline water resources in water basins of Iran.
Table 2.9 Distribution of saline water resources in water basins (Iran)
Name of water basin Area of water basin
Saline water resources (No.)
%
Mazandaran W.B. 177000 932 8.8 Persian Gulf W.B. 430000 7536 70.1 Urmia Lake W.B. 56000 658 6.1 Central W.B 830000 1526 14.2 Hamoun W.B. 106000 - - Gharaghom W.B. 44000 82 0.8 Total 1643000 10734 100
Source : Shiati (1998) The Rais Ali Delvari storage dam with a storage capacity of 700 Mm3 and height of 102 m is on the brackish shahpur river in southern Iran to irrigate about 25000 ha of command area. The average monthly river salinity without dam is between 1795-3570 mg/l by stratification phenomena, as simulated by a dynamic reservoir simulation model (Shiati 1998). Thus the reduction in salinity by construction of the dam to 1840-2450 mg/l with an improvement in the range of 10 to 1090 mg/l on the water salinity has a significant effect on the soil, water and crop yield in the command areas. Table 2.10 provides the list of ten brackish water reservoirs on different rivers with measured range of river water salinity in the range of tds 400 to 12180 ppm.
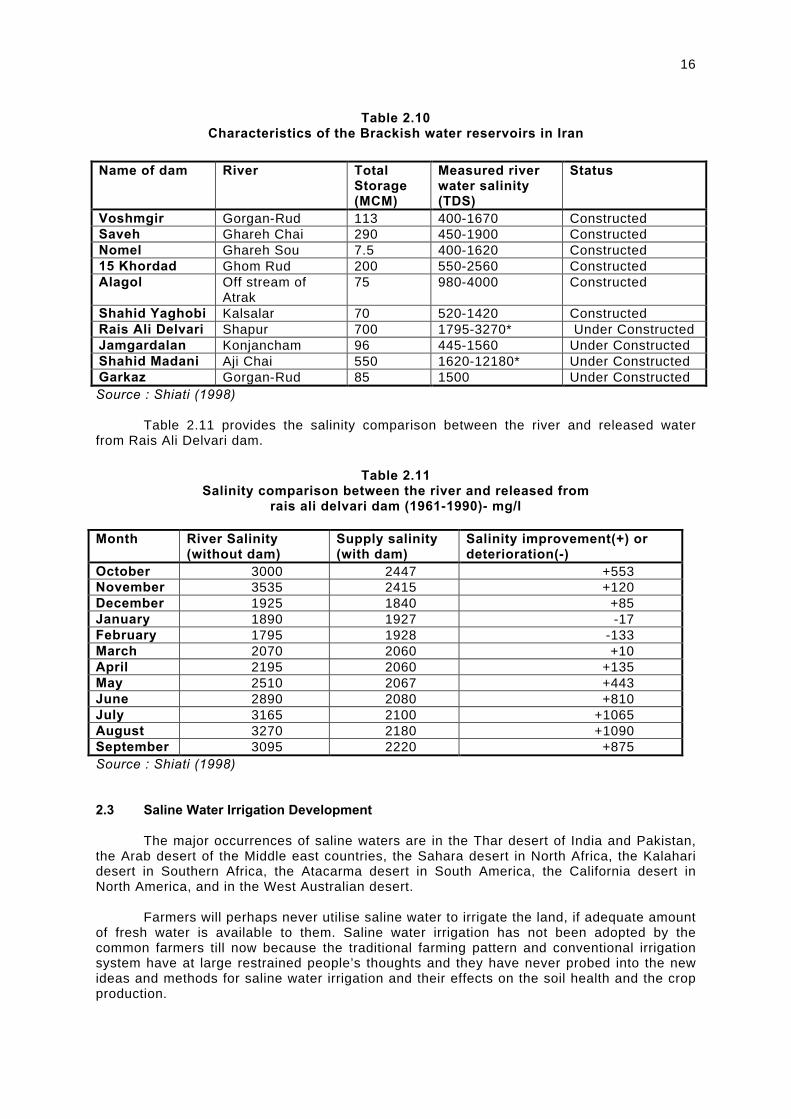
16
Table 2.10
Characteristics of the Brackish water reservoirs in Iran Name of dam River Total
Storage (MCM)
Measured river water salinity (TDS)
Status
Voshmgir Gorgan-Rud 113 400-1670 Constructed Saveh Ghareh Chai 290 450-1900 Constructed Nomel Ghareh Sou 7.5 400-1620 Constructed 15 Khordad Ghom Rud 200 550-2560 Constructed Alagol Off stream of
Atrak 75 980-4000 Constructed
Shahid Yaghobi Kalsalar 70 520-1420 Constructed Rais Ali Delvari Shapur 700 1795-3270* Under Constructed Jamgardalan Konjancham 96 445-1560 Under Constructed Shahid Madani Aji Chai 550 1620-12180* Under Constructed Garkaz Gorgan-Rud 85 1500 Under Constructed Source : Shiati (1998) Table 2.11 provides the salinity comparison between the river and released water from Rais Ali Delvari dam.
Table 2.11
Salinity comparison between the river and released from rais ali delvari dam (1961-1990)- mg/l
Month River Salinity
(without dam) Supply salinity (with dam)
Salinity improvement(+) or deterioration(-)
October 3000 2447 +553 November 3535 2415 +120 December 1925 1840 +85 January 1890 1927 -17 February 1795 1928 -133 March 2070 2060 +10 April 2195 2060 +135 May 2510 2067 +443 June 2890 2080 +810 July 3165 2100 +1065 August 3270 2180 +1090 September 3095 2220 +875 Source : Shiati (1998) 2.3 Saline Water Irrigation Development The major occurrences of saline waters are in the Thar desert of India and Pakistan, the Arab desert of the Middle east countries, the Sahara desert in North Africa, the Kalahari desert in Southern Africa, the Atacarma desert in South America, the California desert in North America, and in the West Australian desert.
Farmers will perhaps never utilise saline water to irrigate the land, if adequate amount
of fresh water is available to them. Saline water irrigation has not been adopted by the common farmers till now because the traditional farming pattern and conventional irrigation system have at large restrained people’s thoughts and they have never probed into the new ideas and methods for saline water irrigation and their effects on the soil health and the crop production.
17
The adaptability of irrigation with saline water is decided by: (1) crop salt tolerance limit, (2) nature of soil, (3) quality of saline water, (4) intensity of rainfall, (5) leaching characteristics, (6) availability of fresh water, (7) method for application of irrigation water, (8) climate of the area, (9) soil-water-crop-environment and human resource management practices, and finally (10) the saline water irrigation economics. Rhoades (1972 to 1998) has done remarkable work for the use of saline water in irrigation. Mass (1976 to 1990) has produced the exhaustive research data for the limits of the salt tolerance of plants. Ayers and Westcot (1973 and 1985) have created the standard water quality criteria for saline water irrigation, which have been published in FAO Irrigation and Drainage Paper 29 (1976) and 29 Rev. 1 (1985). Ragab (1998) has critically examined the possibilities and constraints in the use of soluble brackish water for irrigation and the merits of sprinkler and drip irrigations for the saline water use. Kandiah (1998) has derived strategies to minimize adverse environmental impacts of the saline water use in agriculture.
The saline water irrigation program also includes the irrigation with the drainage
effluent water and the wastewater, which have been alternatively developed in many countries (FAO 1992).
The river salinity management is a top priority in most intensively irrigated basins.
Westcot (1988) has reported the examples of the Colorado River and San Joaquin River Basins in the USA, the Murray-Darling River Basin in Australia, the Indus River Basins in India and Pakistan, the Tigris and Euphrates River Basins of Syria and Iraq, and the Nile River Basins of Sudan and Egypt. The main causes of river salinity that result from the irrigated agriculture appear to be (1) reduced dilution capacity of the river due to upstream diversions; (2) carrying significant quantities of salts with imported water in new areas, and (3) increased salt load from expanded irrigation, development and drainage projects. At present dilution by discharge to usable water supplies is the most widely practiced disposal alternative of higher salinity subsurface drainage water. There is a need to adopt improved on farm irrigation management to reduce the volume of drainage water. Many countries have alternatively included wastewater reuse as an important dimension of the water resources use planning, design and management in irrigation. FAO (1992) reported the wastewater irrigation in USA, Australia, Jordan, Saudi Arabia and China. The world bank (1986) in its Technical Paper no. 51 (Shuval et al 1986) reported the wastewater reuse for irrigation in United Kingdom, USA, Israel, India, Federal Republic of Germany, Latin America, Republic of South Africa, North Africa and the Middle East, Central Africa, Japan, Soviet Union, China and Australia. The experts predict a severe shortage of fresh water in the 21st century and it is predicted that the wars may be fought for the water needs between different countries. Thus the alternative development of the saline water irrigation is now considered as an imperative necessity for the sustainable agricultural development, which includes the use of saline river water, saline ground water, saline drainage water and sewage wastewater for irrigation. 2.4 Research, Development and Training The research agenda to the problems of irrigation sustainability in the saline environment is to include water delivery performance and scheduling, hydrosalinity and salt transport modeling, soil-water-salinity and plant interactions, crop-water-salinity production functions, water use technologies for saline and alkali waters, nutrient management in irrigated soils with physical constraints, survey and monitoring of soil properties and vapour transpiration, prevention and control of waterlogging and salinity, and socioeconomic considerations. The development of saline water management technology for sustainable agriculture has to be a continuing process in the saline environment. The saline water irrigation holds exciting possibilities for the future but it does not promise the conversion of vast stretches of the semiarid and arid lands into cultivated fields owing to inherent limitations. Many crops cannot tolerate salts. Indiscriminate use of saline water without prevention of the salt accumulation may severely damage the soil. The natural
18
drainage is not often sufficient to allow leaching of the salts where saline water is added to soils with clay subsoil layers and the dangerous salt build up levels in the root zone will place crops at risk.
Soil and climate do not always coincide suitable for the saline water use together with
the availability of advanced management knowledge and skills of irrigation and drainage technologies under variable socioeconomic conditions. The behaviour of the saline water sources viz., ground water, river water, lake water, drainage water and wastewater, is dependent on several factors.
These all factors need appropriate applied research and development base (R&D) for
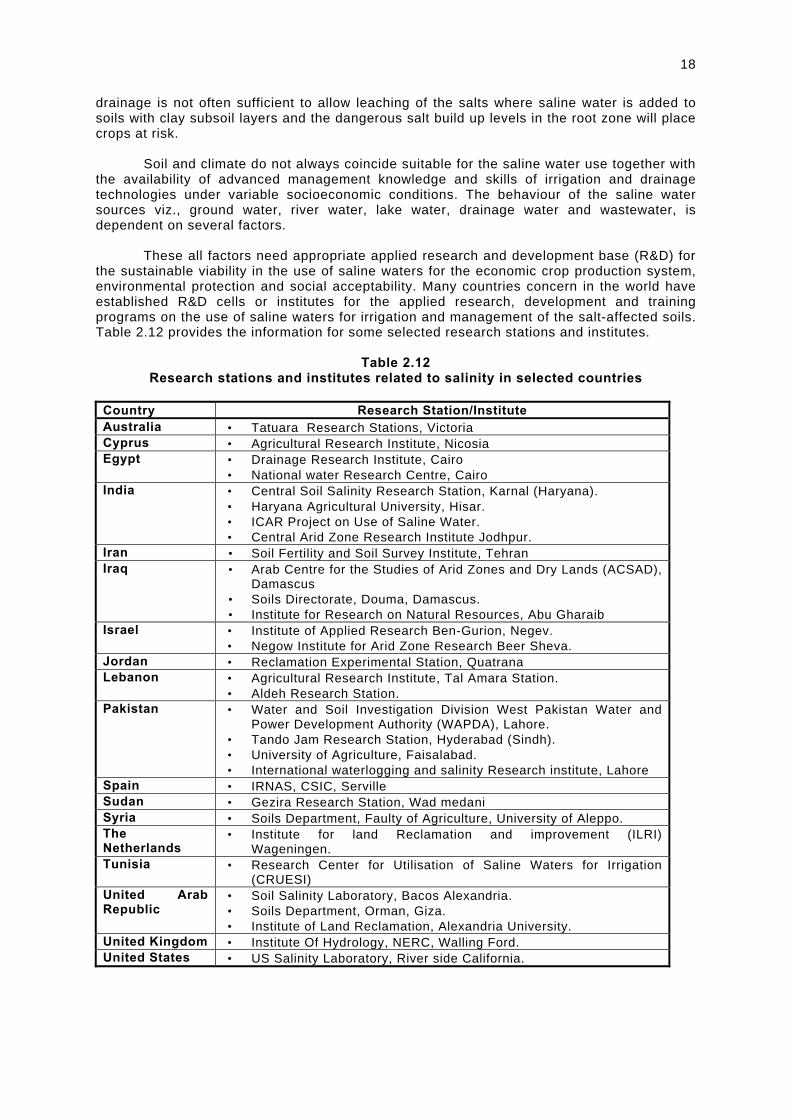
the sustainable viability in the use of saline waters for the economic crop production system, environmental protection and social acceptability. Many countries concern in the world have established R&D cells or institutes for the applied research, development and training programs on the use of saline waters for irrigation and management of the salt-affected soils. Table 2.12 provides the information for some selected research stations and institutes.
Table 2.12
Research stations and institutes related to salinity in selected countries
Country Research Station/Institute Australia • Tatuara Research Stations, Victoria Cyprus • Agricultural Research Institute, Nicosia Egypt • Drainage Research Institute, Cairo
• National water Research Centre, Cairo India • Central Soil Salinity Research Station, Karnal (Haryana).
• Haryana Agricultural University, Hisar. • ICAR Project on Use of Saline Water. • Central Arid Zone Research Institute Jodhpur.
Iran • Soil Fertility and Soil Survey Institute, Tehran Iraq • Arab Centre for the Studies of Arid Zones and Dry Lands (ACSAD),
Damascus • Soils Directorate, Douma, Damascus. • Institute for Research on Natural Resources, Abu Gharaib
Israel • Institute of Applied Research Ben-Gurion, Negev. • Negow Institute for Arid Zone Research Beer Sheva.
Jordan • Reclamation Experimental Station, Quatrana Lebanon • Agricultural Research Institute, Tal Amara Station.
• Aldeh Research Station. Pakistan
• Water and Soil Investigation Division West Pakistan Water and Power Development Authority (WAPDA), Lahore.
• Tando Jam Research Station, Hyderabad (Sindh). • University of Agriculture, Faisalabad. • International waterlogging and salinity Research institute, Lahore
Spain • IRNAS, CSIC, Serville Sudan • Gezira Research Station, Wad medani Syria • Soils Department, Faulty of Agriculture, University of Aleppo. The Netherlands
• Institute for land Reclamation and improvement (ILRI) Wageningen.
Tunisia • Research Center for Utilisation of Saline Waters for Irrigation (CRUESI)
United Arab Republic
• Soil Salinity Laboratory, Bacos Alexandria. • Soils Department, Orman, Giza. • Institute of Land Reclamation, Alexandria University.
United Kingdom • Institute Of Hydrology, NERC, Walling Ford. United States • US Salinity Laboratory, River side California.

19
Thus, because of advances in knowledge, technologies and skills, the users of the saline waters will have to ensure that information upon which they rely is up to date with the latest 'Research and Development' support of the appropriate institution, agencies and organization through users independent adviser. The saline irrigation water has to contain acceptable salinity levels for all vegetable, fruit, field and forage crops to be raised by irrigators under a particular saline environment. For this purpose, the irrigation too need to undertake suitable training programs to avoid risks in using saline water for irrigation.
Chapter 3
GLOBAL TRENDS IN SALINE WATER USE 3.1 Introduction The suitability for safe use of saline water for irrigation has been realized the world over under variety of factors, viz., crop salt tolerance, cultural practices, climate, favourable soil profile, salt index of fertilizer, topography to permit effective leaching, drainage, prevention of salt accumulation, irrigation water management skills and environmental protection measures. The different countries have proposed various water classification schemes and different saline water management strategies (Cyclic or Blending) in light of the local sources of saline waters and fresh waters, which constitute different levels of salinity, sodacity, specific ion toxicity, local climate, soil and crop practices. Irrigation in the world however need to adequately understand under their respective saline environments the specific significance of the water quality, phenomena of the build-up of soil salinity, salinity effect on soils and crops, management of salinity problems, drainage, salinity control by leaching, land development for salinity control, crop tolerance to salinity, cultural practices, soil amendment, traditional to changing methods of advanced irrigation and appropriate means of blending water supplies. 3.2 Examples of World Countries Using Saline Water for Irrigation The information for saline water use on the global perspective is presented for 43 countries which are using saline waters for irrigation in one or other form. These countries are virtually from the semiarid and arid regions of the world, except some developed nations which make use of the wastewater for irrigation. 3.3 Algeria Agricultural development in the Algerian Sahara region is affected by severe constraints due to evaporative condition, low soil fertility and water salinity. Development of agriculture with the saline water use in the Gassi-Touil region of Algeria has led to strong soil salinization and a yield reduction of 50% in five years. The careful selection of farm sites, irrigation methods, controlled use of water, and monitoring of irrigated zones are among the measures proposed for controlling soil salinization, preserving the environment and ensuring sustainable, and productive agriculture (Daoud and Halitrim 1994). 3.4 Argentina Groundwater has higher concentration of dissolved salts in many places of Argentina. Trace elements are present in groundwater, viz. arsenic, fluorine, vanadium and uranium. Alkali cations are dominant. The data of geochemical study of ground water of the Pampa in the province of Cordoba are indicative of water contamination (Nicolli et al 1989). The saline ground water of differt salt levels in used for irrigation. 3.5 Australia Salinity has long been recognized as a problem in man parts of Australia, and many irrigation have to consider using marginally saline quality ground waters. Australia has 465 mm of average annual rainfall with 11% runoff. The country is divided into 12 drainage divisions. The Murray-Darling is the major river system (Murray 2500 km and Darling 2500 km) in the southeastern/southern region. Ground water occurs in sedimentary, surficial and fractured rock aquifers. The country is divided into 69 ground water provinces. Many areas locally in arid, semiarid, temperate and tropical zones are heavily dependent on ground water, although it contributes 18% and surface water contributes 82% of water use in Australia. In many parts of South Australia there are vast supplies of saline water near the surface.
19
Ground water is maximum used in the Perth province, followed by the Great Artesian Basin. Bore well yields in sedimentary and shallow alluvial aquifers range from 1-100 lps, while bore yield in fractured rock aquifers is less than 3 lps. The water quality is defined into four salinity classes: (1) fresh tds < 500 mg/l, (2) marginal tds 500-1500 mg/l, (3) brackish tds 1500-5000 mg/l, and (4) saline tds > 5000 mg/l. The divertible brackish and saline groundwater is about 30% of the total ground water resource (Ghassemi et al 1995). The salinity problems are mainly associated with high ground water levels. Rapid and widespread salinization of dry land and annual pastures in areas with high ground water levels in Victoria are predicted (Trewhella et al 1994). Native Eucalyptus woodlands on the flood plains of the lower river Murray are with shallower water tables and reduced flooding (Slavich et al 1999). Lakebed cropping (Seventy cultivation permits, 80% lakes larger than 2000 ha) is done in New South Wales. The Shepparton land and water management plan in Victoria envisaged the irrigation with saline water (Sampson 1996). Australia faced the greiving process among the community (Shock, denial, anger and acceptance) in northern Victoria and southern New South Wales for the use of saline water for irrigation during 1960-70, acceptance began to appear as the government intervened with Salinity Management Plans. The large circles are irrigation areas using centre pivot sprinkler system. In western Australia, wind erosion harms the agricultural land and over half of the divertible surface water is affected by salinity. Water upto 3500 mg/l tds is satisfactory for apples and short term irrigation of wines. In northern Australia, twenty-two species of mangrove were identified in the Adelaide river flood plain in relation to salinity and waterlogging conditions. At Ahuchr reclamation station, 22% yield reduction was found for ECe increase from 4.8 to 15 dS/m for irrigation of sugar beet crop. At Half Tappch while ECe was higher than 5 dS/ m, a 50% yield reduction was found for sugarcane crop. Irrigation is carried out on extensive alluvial plans. Inherent high salinity of some of these soils has resulted in the development of shallow regional saline ground water. The drainage waters are reused by pumping into canal systems, used in irrigation. Australia has been one of the pioneers of wastewater irrigation. The Werribbes farm established at Melbourne in 1898 is still in operation with waste water irrigation. 3.6 Bahrain Bahrain, an island on the east coast of Saudi Arabia, has an arid climate modified by maritime influences. Rainfall is scanty, an average 70 mm. The cultivated land totals about 3700 hectares under Date palms planting followed by alfalfa and vegetable crops. The ground water irrigation salinity ranges from 3.25 to 4.95 dS/m with low boron content. The vegetable yield increased by use of greenhouses or plastic tunnels. Table 3.1 indicates the crops that have been grown successfully with saline water in comparison to other locations in the world.
Table 3.1
Crops that have been grown successfully in various locations in the world using saline water including Bahrain
Crop Locations ECw ECw threshold Reference (dS/m) (dS/m) Alfalfa Bahrain 3.3-5.0 1.3 Ayers and Westcot (1985) Colorado, USA 2.3-7.8 Miles (1977) Tunisia 1.3-4.7 Ayers and Westcot (1985) Cabbage Bahrain 3.3-5.0 1.2 Ayers and Westcot (1985) Carrots Bahrain 3.3-5.0 0.7 Ayers and Westcot (1985) Cauliflower Bahrain 3.3-5.0 1.9 Ayers and Westcot (1985) Celery Bahrain 3.3-5.0 1.2 Ayers and Westcot (1985)
20
Cotton Israel
Uzbekistan, 4.6 5.1 Frenkel and Shainberg
(1975) USSR 7.8-9.4 Bressler (1979) Onions Bahrain 3.3-5.0 0.8 Ayers and Westcot (1985) Peppers Bahrain 3.3-5.0 1.0 Ayers and Westcot (1985) Sorghum Colorado, USA 2.3-7.8 4.5 Miles (1977) Tunisia 1.3-4.7 Ayers and Westcot (1985) Tomato UAE 2.3 1.7 Ayers and Westcot (1985) Wheat Colorado, USA 2.3-7.8 4.0 Miles (1977) India 15.0 Dhir (1976)
Source : FAO (1997) 3.7 Brazil Fruit plants are mostly grown in Brazil with saline water irrigation: pineapple, banana, muskmelon, smooth cayenne and sugar beats. The Brazil has the semiarid conditions in Petrolina region. The crystalline region is located in the northeast Brazil which contains water of high sodium chloride level. Appreciable crop yields 29 to 26 t/ha of sugar beat have been obtained with saline waters of 4 to 8 dS/m respectively (Oliveria et al 1998). The pepper and coconuts are grown with saline water under protected conditions. 3.8 Central Africa No major information is available. However, some reports indicate that wastewater is used for irrigation in a number of areas of central Africa where the cities have central sewerage system (World Bank 1986). 3.9 China China comprises 32 % humid land, 15% semihumid, 22% semiarid and 31% arid area. Southeast part is humid to semihumid, while northwest part is arid to semiarid. In North China Plain, the ground water levels are falling down with intensive irrigation of rice and wheat crops, as well the salinity increases in the area. Agricultural sector, as a main consumer of ground water, switches over totally almost to surface water irrigation (Hantke 1988). Surface water use in china is about 89% and ground water about 11%. The ground water in coastal plains is highly salinised. About 100 Mha land is available with 48 Mha irrigated. The salt affected land is about 20 Mha, of which about one fifth is alkaline. There is marked variation in the salinity of ground water. The piedmont contains freshwater with a salinity less than (1000-3000 mg/l). Highly saline water predominates in the coastal area, generally greater than 5000 mg/l (some times in excess of 30 000 mg/l). Saline ground water covers 100 000 km2 of the plain (1/3rd of the regions total area). Secondary, salinization occurs throughout arid and semiarid regions of China (Ghassemiet at 1995). In China, sugarcane is produced in three varieties (NICO, F-164 and F-166) on irrigation with water of EC 2-2.5 dS/m at the rate of 120 t/ha, but on 5 years irrigation with ECe 6.5 to 8.0 dS/m reduced in yield to 50%. Leaching may restore original yield. 3.10 Cyprus Cyprus is the third-largest island in the Mediterranean with an area of 9251 km2. It includes agricultural land 2160 km2 and irrigated land 350 km2 (16.2% of the total agricultural land). Excess ground water use is expected to invite serious seawater intrusion.
In semiarid region the irrigation with the marginal waters causes soil salinity. The
pressure irrigation with sprinklers and mini-sprinklers is a common practice. The modern irrigation system permits the use of saline water in irrigation and fertilization. The greenhouse

21
crops are grown with ECw of 2 to 3 dS/m with high yields. The winter rainfall is a good source of leaching of salts. Extensive research has been undertaken for evaluating the effects of sulphate waters for irrigation on soil and crops (Papadopoulous 1984/1998). Leaching of salts was achieved by winter rainfall, river water or water of the same borehole. The scarcity of water is a serious constraint in Cyprus. Because of this, the municipal treated effluent is considered as an integral part of the water resources. It is believed that 6% of the cultivated land could be irrigated with municipal treated effluent. Cyprus has formulated the wastewater quality guidelines for irrigation (Table 3.2).
Table 3.2
Wastewater quality guidelines for irrigation in Cyprus Irrigation of: BOD
mg/l SS
mg/l Faecal
Coliforms/100 ml
Intestinal worms/l
Treatment required
Amenity areas of unlimited access
10* 15**
10* 15**
50* 100**
Nil Secondary and Tertiary and disinfection
Crops for human consumption. Amenity areas of limited access
20* 30* B)-
30* 45** -
200* 1000** 200* 1000**
Nil Nil
Secondary and storage>1 week and disinfection, or Tertiary and disinfection Stabilisation-maturation ponds total retention time>30 days or Secondary and storage>30 days
Fodder crops 20* 30** B)-
30* 45** -
1000* 5000** 1000*
Nil Nil
Secondary and storage>1 week or Tertiary and disinfection Stabilisation-maturation ponds total retention time>30 days or Secondary and storage>30 days
Industrial crops
A)50* 70** B)-
- - -
3000* 10000** 3000* 10000*
- - - -
Secondary and Disinfection Stabilisation-maturation ponds total retention time>30 days or Secondary and storage>30 days
Source: Bahri (1998) *These values not be exceeded in 80% of samples per month ** Maximum value allowed Note 1. Irrigation of vegetables is not allowed Note 2. Irrigation of ornamental for trade purposes in not allowed Note 3. No substances accumulating in the eatable parts of crops and proved to be toxic to humans or animals are allowed in effluent TDS : total dissolved solids SM : suspended matter COD : chemical oxygen demand SAR : sodium adsorption ratio (in molalities) TC : total coliforms FC : faecal coliforms FS : faecal streptococci 3.11 Egypt Egypt consists 90% desert with 1.01 Mkm2 area, 2900 km of coastline and 35600 km2 (4%) land area under cultivation predominantly an arid country. The main physiographic divisions are the Nile Valley delta, the Western Libyan desert, the Eastern Arabian desert and the Sinai Penisula with highest peak of 2642 m. Alexandria, the Wettest part of Egypt receives 191 mm rainfall, and it rapidly decreases to south. The Nile river flow provides 97% of the water requirement, only 3% comes from ground water and rainfall. The Nile river is the longest river in the world (6700 km). The water quality of the river is overall good not exceeding 350 mg/l tds. The Valley and Delta constitute one of the world’s
22
longest ground water reservoir. The thickness of the Delta zone increases towards the north from 100 m in Cairo to 900 m to the Mediterranean coast. In some areas, the piezometric head is so high that groundwater flows in an upward directions. Ground water quality varies with the seawater intrusion, which has extended to 130 km from the Mediterranean sea (Ghassemi et al 1995).
The existing irrigation system consists of two dams at Aswan, and seven major
barrages on the Nile and its branches which divert water into 31000 km of main canals. Seepage from canals causes water table rise and soil salinity problem. Inadequate drainage is a serious problem with nearly 33% of the irrigated land is salt-affected. Two principal approaches adopted to the use of saline water in irrigation: 1) mixing and 2) alternate substitution of saline water with fresh water at certain rations. Alternate irrigation treatment as substitution with minimum fresh water of total volume (20 to 40%) at lower ratios are regularly experimented. Drainage Research Institute, Delta Barrage, Cairo in Egypt conducts regular investigation to evaluate the effect of saline irrigation water on different crops. The drainage water is in use for irrigation. The direct use of drainage water for irrigation with salinity from 2 to 3 dS/m, is common in the districts of Northern Delta. The drainage water has disposal into the Mediterranean sea and coastal lakes. The average salinity of drainage water in the middle Delta was between 750-2000 mg/l tds. The drainage water with salinity to an average of 930 mg/l is used in existing reuse projects. An annual quality of 2.9 x10⁹ m3 of drainage water is used on reuse projects, and the almost equal quantity is reused every year by the farmers at their own (Ghassemi et al 1995). Intensive studies have been carried out on reuse of drainage water. Sensitive crops of maize, pepper, onion and alfalfa are grown in rotation with fresh water. Moderately sensitive crops of tomato, lettuce, potato, sunflower etc. are irrigated with drainage water but of the seedling establishment with the fresh Nile water. Salt tolerant crops of wheat, cotton sugar beet etc. are irrigated directly with drainage water. Cairo has had a sewage farm since 1915 and waste water irrigation is practiced. Saline ground waters from 2 to 4 dS/m have been successively used for decades to irrigate a variety of crops in large areas of scattered farms in the Nile valley and Delta. Crops are mostly forage, cereals and vegetables. Ground water in used in the New valley with EC 0.5 dS/m to 6 dS/m to irrigate 17 000 to 60 000 ha. Siwa Oasis contains the largest naturally flowing springs (once about 1 000 springs) of salinity ranging from ECw 2 to 4 dS/m which were used successfully to irrigate olive and date-palm orchard, with some scattered forage areas (FAO 1992). The reuse of drainage water with average ECw 6 dS/m with SAR 10 to 15 is made after blending with good quality ground water (EC 0.4 dS/m with SAR of 5) or in cyclic use. Egypt has a policy to use brackish and saline waters from natural flowing springs, use of saline ground water with EC upto 4.5 dS/m and reuse of drainage ground water with ECw 6 dS/m with SAR values 10 to 15 in blending or cyclic mode with good quality water (Abu-Zeid 1988, FAO 1992). 3.12 Ethiopia The irrigation potential of Ethiopia is about 3.63 Mha and the utilized potential with area under irrigation is 0.18 Mha (5.2%). The Awash River is a major source of irrigation water for crop production. ECw ranges from 0.2 to 0.7 dS/m. The suspended sediment contained in the river water is a major concern to most projects. The sediment load varies from 0.5 g/l in dry months to 15-20 g/l during heavy floods. The desilting of primary canals is required every year. The sediment content reduces the soil permeability and creates surface crusting, which causes poor seed germination. The sediment content in water (Amibara Irrigation Project) is one of the important quality criteria that should be considered in evaluating irrigation water (Ayers and Westcot, 1985 FAO).
23
The southeastern part of Ethiopia depicts desertic terrain underlain by saline waters. The area has very low density of populations. The saline water use is investigated. 3.13 Germany The Federal Republic of Germany needed 8% supplemental irrigation. About 3% of the total quantity of wastewater collected in sewerage system in, Federal Republic of Germany is then disposed of by irrigation. Many of the rivers carry heavy loads of partly or fully treated wastewater. The vegetables for human consumptions are not irrigated with wastewater under legal regulations (World Bank 1986). Treated wastewater is used in Braunschweig for 115 years for irrigation. Water is distributed to about 300 farmers through a 100 km pipeline in about 3000 ha. Wells have been installed to augment dry summer flow. The cropping pattern in treated wastewater use area is 25% winter grain, 30% spring grain, 20% sugar beets, 10% asparagus, 10% grass land, and 5% potato (FAO 1985). 3.14 India India is a vast country with an area of 328.78 Mha with a coastline of 5690 km. It has five main physiographic divisions: (1) the Himalayan Mountains, (2) the Indo-Gangetic Plains, (3) the Great Indian Desert, (4) the Deccan Plateau, and (5) the coastal Mountain Belts. India supported a population of 1000 million in 2000. The average annual rainfall is 1170 mm. Cherrapunji, in the state of Meghalaya, receives the highest rainfall of more than 9000 mm a year and the lowest rainfall 150 mm a year in the western Rajasthan (Thar desert). India has a total of about 31.70 Mha of arid land spread over to Rajasthan 61.9%, Gujarat 19.6%, Punjab 4.6%, Haryana 4%, Maharashtra 0.4%, Karnataka 2.7% and Andhra Pradesh 6.8%. India is divided into 14 major river systems. The Ganga River has a main catchment of 76 Mha area with the river length 2525 km. The Brahmanputra River has the maximum annual flow 591 billion m3 (31.2%) followed by the Ganga River 557 billion m3 (29.2%) and the west coast rivers 218 billion m3 (11.5%). Ground water resources play a major role in irrigation and other water supplies. Nearly 48% of the irrigation is provided by ground water and 52% by surface water. According to CGWB, the ground water levels have dropped 5-15 m in many areas of India as a result of over exploitation of fresh water.
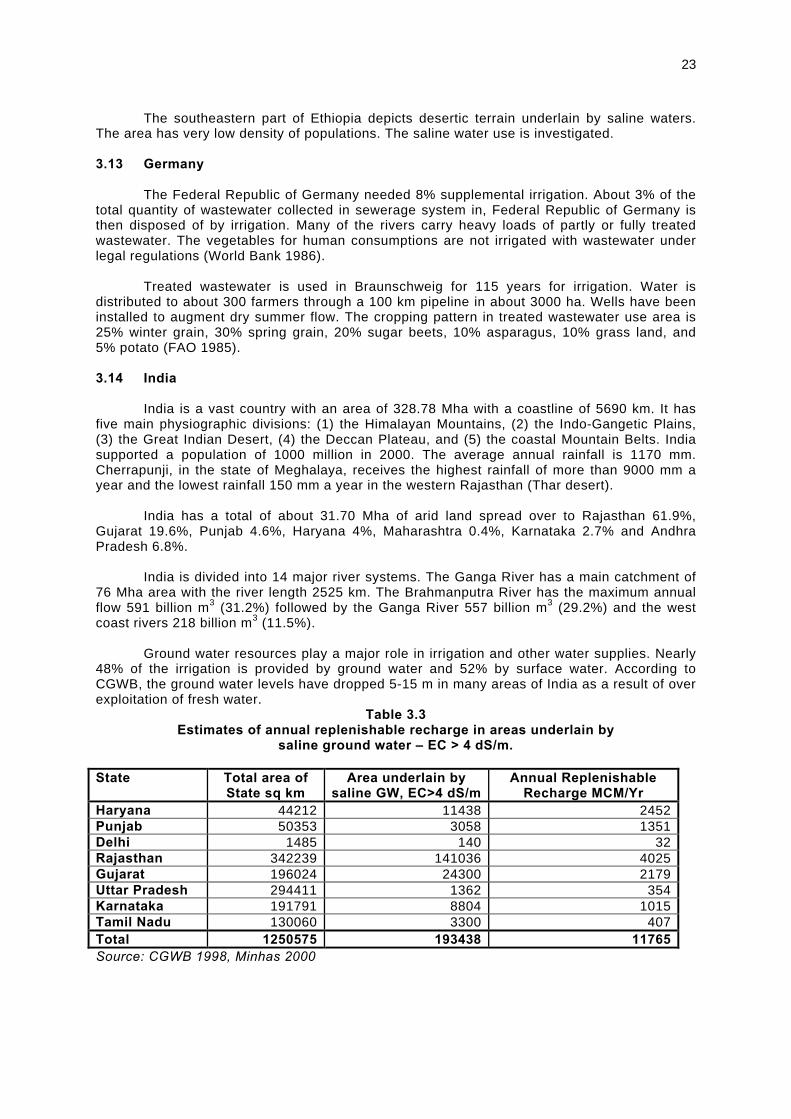
Table 3.3 Estimates of annual replenishable recharge in areas underlain by
saline ground water – EC > 4 dS/m.
State Total area of State sq km
Area underlain by saline GW, EC>4 dS/m
Annual Replenishable Recharge MCM/Yr
Haryana 44212 11438 2452 Punjab 50353 3058 1351 Delhi 1485 140 32 Rajasthan 342239 141036 4025 Gujarat 196024 24300 2179 Uttar Pradesh 294411 1362 354 Karnataka 191791 8804 1015 Tamil Nadu 130060 3300 407 Total 1250575 193438 11765 Source: CGWB 1998, Minhas 2000
24
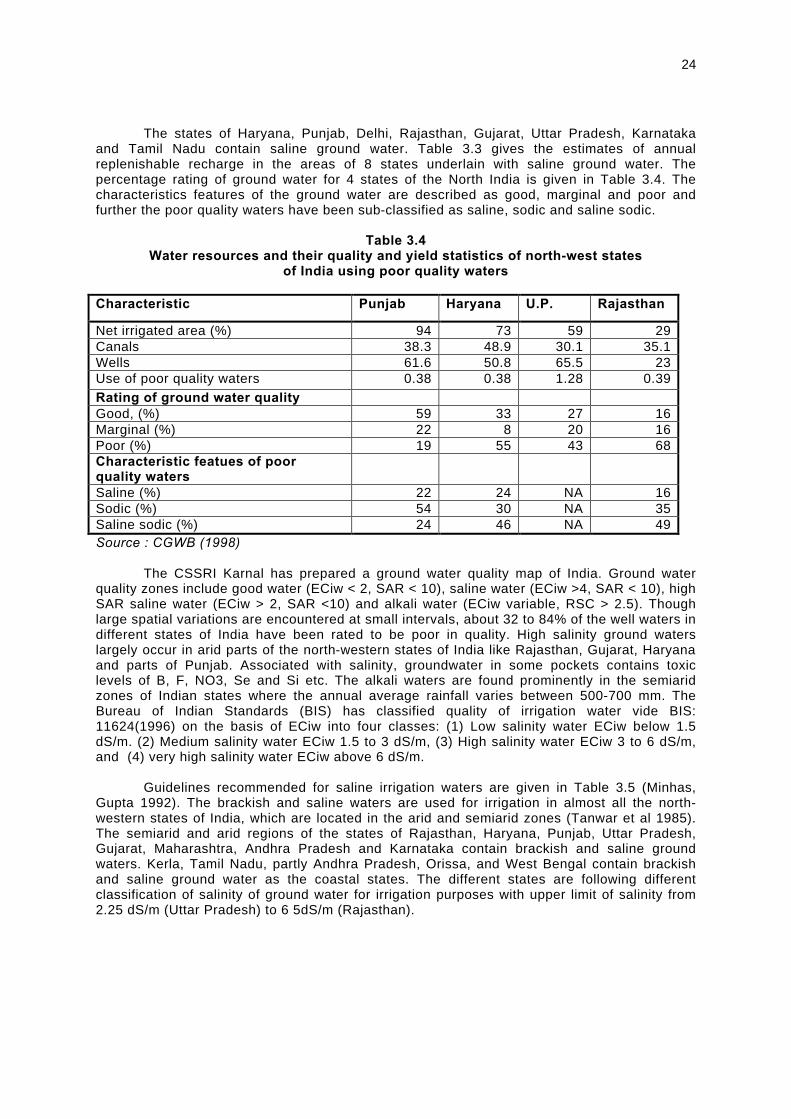
The states of Haryana, Punjab, Delhi, Rajasthan, Gujarat, Uttar Pradesh, Karnataka and Tamil Nadu contain saline ground water. Table 3.3 gives the estimates of annual replenishable recharge in the areas of 8 states underlain with saline ground water. The percentage rating of ground water for 4 states of the North India is given in Table 3.4. The characteristics features of the ground water are described as good, marginal and poor and further the poor quality waters have been sub-classified as saline, sodic and saline sodic.
Table 3.4
Water resources and their quality and yield statistics of north-west states of India using poor quality waters
Characteristic Punjab Haryana U.P. Rajasthan
Net irrigated area (%) 94 73 59 29 Canals 38.3 48.9 30.1 35.1 Wells 61.6 50.8 65.5 23 Use of poor quality waters 0.38 0.38 1.28 0.39
Rating of ground water quality Good, (%) 59 33 27 16 Marginal (%) 22 8 20 16 Poor (%) 19 55 43 68 Characteristic featues of poor quality waters
Saline (%) 22 24 NA 16 Sodic (%) 54 30 NA 35 Saline sodic (%) 24 46 NA 49 Source : CGWB (1998) The CSSRI Karnal has prepared a ground water quality map of India. Ground water quality zones include good water (ECiw < 2, SAR < 10), saline water (ECiw >4, SAR < 10), high SAR saline water (ECiw > 2, SAR <10) and alkali water (ECiw variable, RSC > 2.5). Though large spatial variations are encountered at small intervals, about 32 to 84% of the well waters in different states of India have been rated to be poor in quality. High salinity ground waters largely occur in arid parts of the north-western states of India like Rajasthan, Gujarat, Haryana and parts of Punjab. Associated with salinity, groundwater in some pockets contains toxic levels of B, F, NO3, Se and Si etc. The alkali waters are found prominently in the semiarid zones of Indian states where the annual average rainfall varies between 500-700 mm. The Bureau of Indian Standards (BIS) has classified quality of irrigation water vide BIS: 11624(1996) on the basis of ECiw into four classes: (1) Low salinity water ECiw below 1.5 dS/m. (2) Medium salinity water ECiw 1.5 to 3 dS/m, (3) High salinity water ECiw 3 to 6 dS/m, and (4) very high salinity water ECiw above 6 dS/m. Guidelines recommended for saline irrigation waters are given in Table 3.5 (Minhas, Gupta 1992). The brackish and saline waters are used for irrigation in almost all the north-western states of India, which are located in the arid and semiarid zones (Tanwar et al 1985). The semiarid and arid regions of the states of Rajasthan, Haryana, Punjab, Uttar Pradesh, Gujarat, Maharashtra, Andhra Pradesh and Karnataka contain brackish and saline ground waters. Kerla, Tamil Nadu, partly Andhra Pradesh, Orissa, and West Bengal contain brackish and saline ground water as the coastal states. The different states are following different classification of salinity of ground water for irrigation purposes with upper limit of salinity from 2.25 dS/m (Uttar Pradesh) to 6 5dS/m (Rajasthan).
25
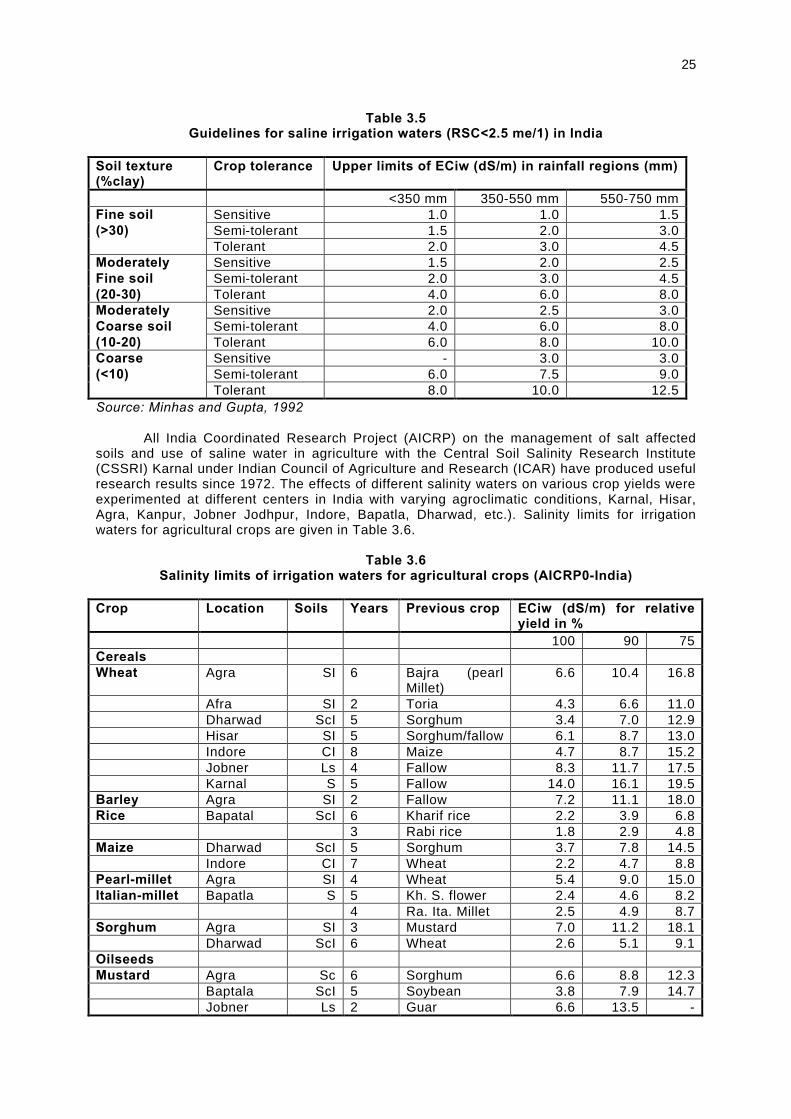
Table 3.5 Guidelines for saline irrigation waters (RSC<2.5 me/1) in India
Soil texture (%clay)
Crop tolerance Upper limits of ECiw (dS/m) in rainfall regions (mm)
<350 mm 350-550 mm 550-750 mm Fine soil Sensitive 1.0 1.0 1.5 (>30) Semi-tolerant 1.5 2.0 3.0 Tolerant 2.0 3.0 4.5 Moderately Sensitive 1.5 2.0 2.5 Fine soil Semi-tolerant 2.0 3.0 4.5 (20-30) Tolerant 4.0 6.0 8.0 Moderately Sensitive 2.0 2.5 3.0 Coarse soil Semi-tolerant 4.0 6.0 8.0 (10-20) Tolerant 6.0 8.0 10.0 Coarse Sensitive - 3.0 3.0 (<10) Semi-tolerant 6.0 7.5 9.0 Tolerant 8.0 10.0 12.5 Source: Minhas and Gupta, 1992 All India Coordinated Research Project (AICRP) on the management of salt affected soils and use of saline water in agriculture with the Central Soil Salinity Research Institute (CSSRI) Karnal under Indian Council of Agriculture and Research (ICAR) have produced useful research results since 1972. The effects of different salinity waters on various crop yields were experimented at different centers in India with varying agroclimatic conditions, Karnal, Hisar, Agra, Kanpur, Jobner Jodhpur, Indore, Bapatla, Dharwad, etc.). Salinity limits for irrigation waters for agricultural crops are given in Table 3.6.
Table 3.6
Salinity limits of irrigation waters for agricultural crops (AICRP0-India)
Crop Location Soils Years Previous crop ECiw (dS/m) for relative yield in %
100 90 75 Cereals Wheat Agra SI 6 Bajra (pearl
Millet) 6.6 10.4 16.8
Afra SI 2 Toria 4.3 6.6 11.0 Dharwad ScI 5 Sorghum 3.4 7.0 12.9 Hisar SI 5 Sorghum/fallow 6.1 8.7 13.0 Indore CI 8 Maize 4.7 8.7 15.2 Jobner Ls 4 Fallow 8.3 11.7 17.5 Karnal S 5 Fallow 14.0 16.1 19.5 Barley Agra SI 2 Fallow 7.2 11.1 18.0 Rice Bapatal ScI 6 Kharif rice 2.2 3.9 6.8 3 Rabi rice 1.8 2.9 4.8 Maize Dharwad ScI 5 Sorghum 3.7 7.8 14.5 Indore CI 7 Wheat 2.2 4.7 8.8 Pearl-millet Agra SI 4 Wheat 5.4 9.0 15.0 Italian-millet Bapatla S 5 Kh. S. flower 2.4 4.6 8.2 4 Ra. Ita. Millet 2.5 4.9 8.7 Sorghum Agra SI 3 Mustard 7.0 11.2 18.1 Dharwad ScI 6 Wheat 2.6 5.1 9.1 Oilseeds Mustard Agra Sc 6 Sorghum 6.6 8.8 12.3 Baptala ScI 5 Soybean 3.8 7.9 14.7 Jobner Ls 2 Guar 6.6 13.5 -
26
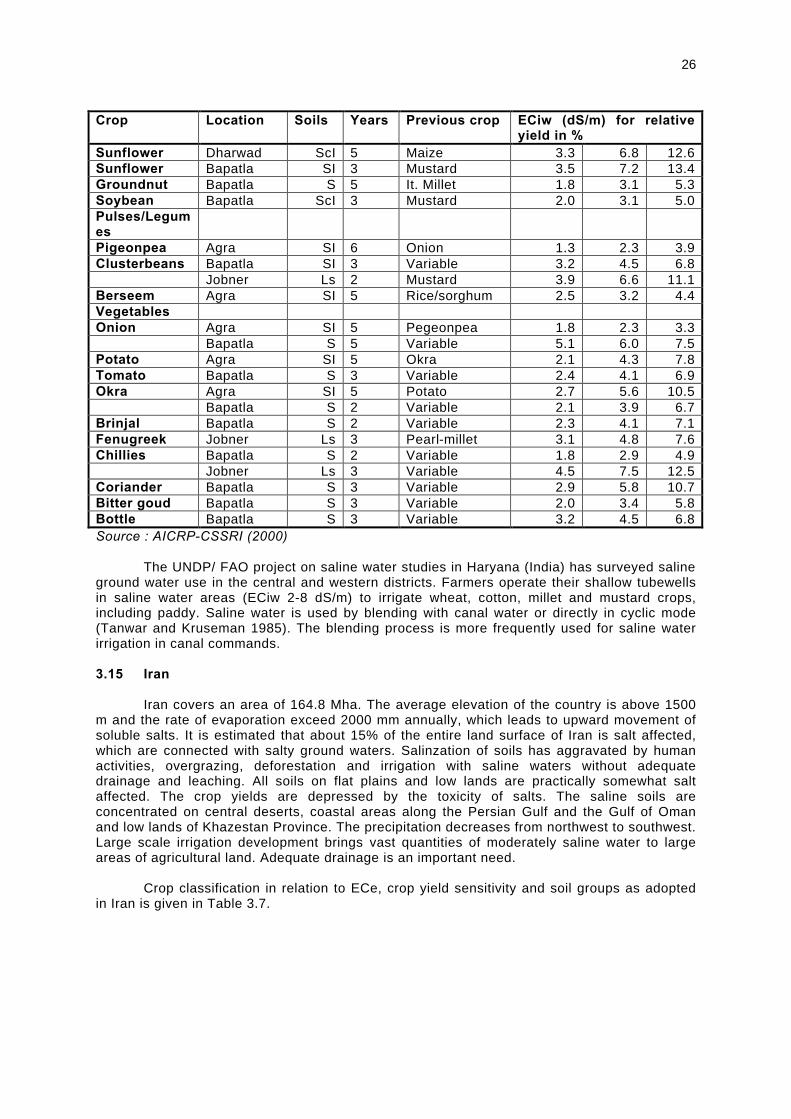
Crop Location Soils Years Previous crop ECiw (dS/m) for relative
yield in % Sunflower Dharwad ScI 5 Maize 3.3 6.8 12.6 Sunflower Bapatla SI 3 Mustard 3.5 7.2 13.4 Groundnut Bapatla S 5 It. Millet 1.8 3.1 5.3 Soybean Bapatla ScI 3 Mustard 2.0 3.1 5.0 Pulses/Legumes
Pigeonpea Agra SI 6 Onion 1.3 2.3 3.9 Clusterbeans Bapatla SI 3 Variable 3.2 4.5 6.8 Jobner Ls 2 Mustard 3.9 6.6 11.1 Berseem Agra SI 5 Rice/sorghum 2.5 3.2 4.4 Vegetables Onion Agra SI 5 Pegeonpea 1.8 2.3 3.3 Bapatla S 5 Variable 5.1 6.0 7.5 Potato Agra SI 5 Okra 2.1 4.3 7.8 Tomato Bapatla S 3 Variable 2.4 4.1 6.9 Okra Agra SI 5 Potato 2.7 5.6 10.5 Bapatla S 2 Variable 2.1 3.9 6.7 Brinjal Bapatla S 2 Variable 2.3 4.1 7.1 Fenugreek Jobner Ls 3 Pearl-millet 3.1 4.8 7.6 Chillies Bapatla S 2 Variable 1.8 2.9 4.9 Jobner Ls 3 Variable 4.5 7.5 12.5 Coriander Bapatla S 3 Variable 2.9 5.8 10.7 Bitter goud Bapatla S 3 Variable 2.0 3.4 5.8 Bottle Bapatla S 3 Variable 3.2 4.5 6.8 Source : AICRP-CSSRI (2000) The UNDP/ FAO project on saline water studies in Haryana (India) has surveyed saline ground water use in the central and western districts. Farmers operate their shallow tubewells in saline water areas (ECiw 2-8 dS/m) to irrigate wheat, cotton, millet and mustard crops, including paddy. Saline water is used by blending with canal water or directly in cyclic mode (Tanwar and Kruseman 1985). The blending process is more frequently used for saline water irrigation in canal commands. 3.15 Iran Iran covers an area of 164.8 Mha. The average elevation of the country is above 1500 m and the rate of evaporation exceed 2000 mm annually, which leads to upward movement of soluble salts. It is estimated that about 15% of the entire land surface of Iran is salt affected, which are connected with salty ground waters. Salinzation of soils has aggravated by human activities, overgrazing, deforestation and irrigation with saline waters without adequate drainage and leaching. All soils on flat plains and low lands are practically somewhat salt affected. The crop yields are depressed by the toxicity of salts. The saline soils are concentrated on central deserts, coastal areas along the Persian Gulf and the Gulf of Oman and low lands of Khazestan Province. The precipitation decreases from northwest to southwest. Large scale irrigation development brings vast quantities of moderately saline water to large areas of agricultural land. Adequate drainage is an important need. Crop classification in relation to ECe, crop yield sensitivity and soil groups as adopted in Iran is given in Table 3.7.
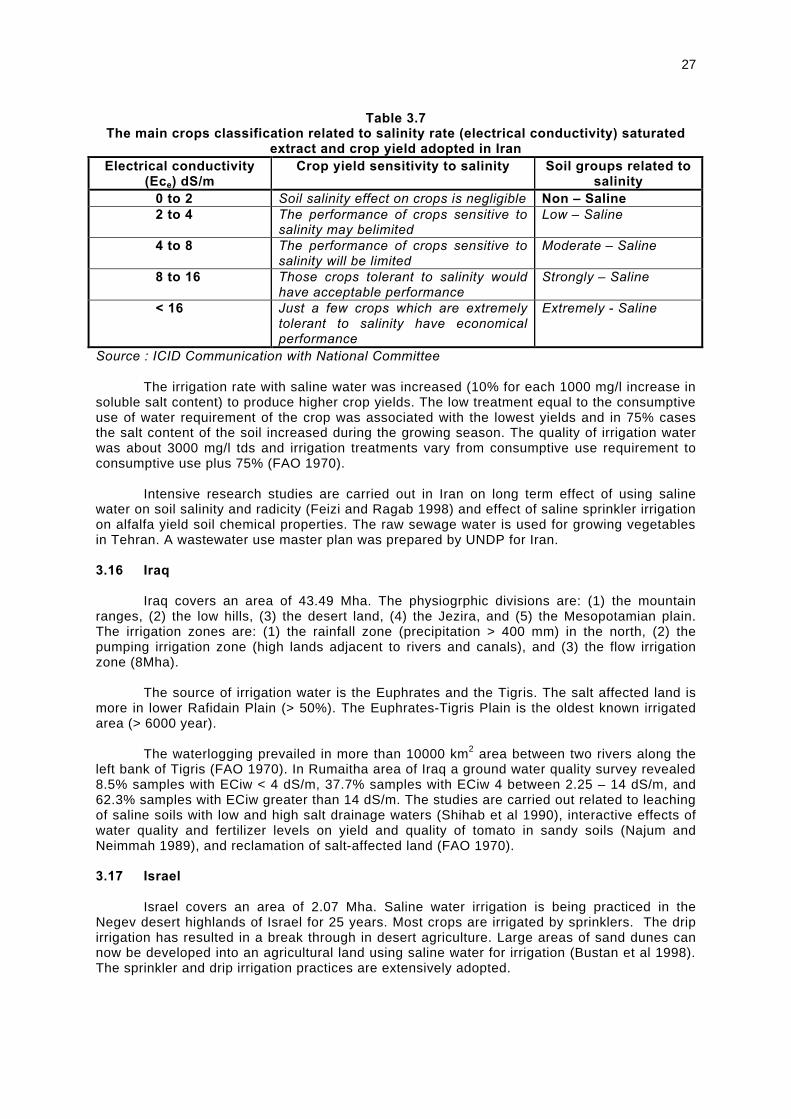
27
Table 3.7 The main crops classification related to salinity rate (electrical conductivity) saturated
extract and crop yield adopted in Iran Electrical conductivity
(Ece) dS/m Crop yield sensitivity to salinity Soil groups related to
salinity 0 to 2 Soil salinity effect on crops is negligible Non – Saline 2 to 4 The performance of crops sensitive to
salinity may belimited Low – Saline
4 to 8 The performance of crops sensitive to salinity will be limited
Moderate – Saline
8 to 16 Those crops tolerant to salinity would have acceptable performance
Strongly – Saline
< 16 Just a few crops which are extremely tolerant to salinity have economical performance
Extremely - Saline
Source : ICID Communication with National Committee The irrigation rate with saline water was increased (10% for each 1000 mg/l increase in soluble salt content) to produce higher crop yields. The low treatment equal to the consumptive use of water requirement of the crop was associated with the lowest yields and in 75% cases the salt content of the soil increased during the growing season. The quality of irrigation water was about 3000 mg/l tds and irrigation treatments vary from consumptive use requirement to consumptive use plus 75% (FAO 1970). Intensive research studies are carried out in Iran on long term effect of using saline water on soil salinity and radicity (Feizi and Ragab 1998) and effect of saline sprinkler irrigation on alfalfa yield soil chemical properties. The raw sewage water is used for growing vegetables in Tehran. A wastewater use master plan was prepared by UNDP for Iran. 3.16 Iraq Iraq covers an area of 43.49 Mha. The physiogrphic divisions are: (1) the mountain ranges, (2) the low hills, (3) the desert land, (4) the Jezira, and (5) the Mesopotamian plain. The irrigation zones are: (1) the rainfall zone (precipitation > 400 mm) in the north, (2) the pumping irrigation zone (high lands adjacent to rivers and canals), and (3) the flow irrigation zone (8Mha).
The source of irrigation water is the Euphrates and the Tigris. The salt affected land is
more in lower Rafidain Plain (> 50%). The Euphrates-Tigris Plain is the oldest known irrigated area (> 6000 year). The waterlogging prevailed in more than 10000 km2 area between two rivers along the left bank of Tigris (FAO 1970). In Rumaitha area of Iraq a ground water quality survey revealed 8.5% samples with ECiw < 4 dS/m, 37.7% samples with ECiw 4 between 2.25 – 14 dS/m, and 62.3% samples with ECiw greater than 14 dS/m. The studies are carried out related to leaching of saline soils with low and high salt drainage waters (Shihab et al 1990), interactive effects of water quality and fertilizer levels on yield and quality of tomato in sandy soils (Najum and Neimmah 1989), and reclamation of salt-affected land (FAO 1970). 3.17 Israel Israel covers an area of 2.07 Mha. Saline water irrigation is being practiced in the Negev desert highlands of Israel for 25 years. Most crops are irrigated by sprinklers. The drip irrigation has resulted in a break through in desert agriculture. Large areas of sand dunes can now be developed into an agricultural land using saline water for irrigation (Bustan et al 1998). The sprinkler and drip irrigation practices are extensively adopted.
28
The majority of the saline ground water is used in the ECw range of 2 to 8 dS/m. Average annual rainfall exceeds 200 mm in over half of the country and is about 500 mm in main agricultural area. Most of the rainfall occurs in the winter season. The saline water is diluted before use as much of the saline water is introduced into the national water carrier system. Extra water, equivalent to about 25 to 30% in excess of evapotranspiration is typically given for leaching.
Israel follow the general recommendations: (1) light and medium textured soils can be
irrigated with saline water in the range of the salt tolerance of the crops, and (2) heavy soils can be irrigated with waters having ECw values of upto 3.5 to 5.5 dS/m under artificial drainage system and with application of gypsum (FAO 1992). 3.18 Italy
Certain field experiments have been conducted on irrigation with brackish and saline
water by the Sperimentale Agronomic Institute (Bari), Italy. A study on effect of saline water irrigation on soil strength (affecting root growth and crop productivity) has been made in Basilicata region of Southern Italy with different crop irrigation treatments fresh (ldS/m), saline (4 dS/m) and fresh/saline water. The soil structure along vertical profile upto 0.52 m was not significantly altered by the effects due to saline irrigations (1999-2000). In another experiment by Mediterranean Agronomic Institute, Valenzano (Bari) the use of soil conditioners has been made under saline irrigation as a management tool in different ratios “Barbary Plant G2 Polymer” (Control, 10, 20 and 30 g 1-1 soil) along with 4 levels of saline irrigation (0.9, 3, 6 and 9 dS/m) on the wheat yield, which was found better in terms of quantity and quality. Grain production was three times greater with high salt concentrations (9 dS/m) than that recorded in the absence of the soil conditioner and irrigation practiced with fresh water (0.9 d S/m). Thus the mixing the soil with the BP polymer resulted in a notable increase in the grain yield. Normally, reuse of drainage water in a cyclic management strategy is considered better in Italy than blending different salinity water for irrigation.
3.19 Japan The emphasis is in Japan is on water reuse for industrial purposes. Mostly the river water being used for irrigation has high level of wastewater flow. Many areas of Japan do not have central sewerage system.
Certain experiments on effects of furrow irrigation with saline water under different bed
shapes and soil textures on the growth of maize (EC= 8 dS/m) are conducted (Saga). The germination on slopes is obtained much healthy as compared to the top peak of the furrow bed. 3.20 Jordan The desert area of Jordan makes about 78% of the total area of the country. The soils of the desert area are calcareous and saline-alkali. Available surface water resources are almost exhausted and ground water abstraction has already exceeded the safe yield. Ground water used in irrigation is saline. Drainage as well as leaching of salts is necessary for the irrigation development of the desert lands. Sunflower and cotton crops are grown with saline water (Karam 1999, Abdelgawad 1999). A leaching fraction of 30% during the peak water consumption period reduced the impacts of saline irrigation on both soil and plant. Sunflower seed yield was almost 30% lower than on loam. Jordan has a serious shortage of good quality water for domestic and agricultural consumption. Soils have the additional problems of salinity, sodality, poor stability, surface crust, accumulation of heavy metals and pesticide residues. The poor quality water produced at Kahirbit Es- Samra treatment plants is used after mixing with fresh runoff water collected in the King Talal Reservoir. Saline water is highly valuable source of water for irrigation. It is estimated that within one or two decades, the proportion of saline and treated wastewater will be more than 30% of the total available water resources for irrigation.

29
Irrigation of sweetcorn crop with saline water of less than 3.5 dS/m has not caused significant reduction in yield. The tolerance threshold soil salinity of relative onion yield varies from 2.43 to 3.6 dS/m. The drainage water is used in irrigation for garlic and onion production with careful management. The department of Agricultural Research and Environment as well as Soils and Irrigation in Agriculture Faculty of the University of Jordan carryout research activities on the use of saline drainage waters. The “Wadi Dhuleil” is the longest ground water irrigation project in Eastern Jordan for an area of about 1560 ha. The water quality deteriorated from ECw of 0.43 dS/m in 1971 to 2.52 dS/m in 1977 and more deterioration has been noticed in the subsequent years. Crops of greater salt tolerance under adequate leaching practices are considered feasible. 3.21 Kazakhstan The vast land reclamation and water resources development after World War-II have the lower basin of the Aral Sea. The ground water quality has deteriorated due to agricultural chemicals and nutrients. Rice is cultivated in rotation of barley and alfalfa. The subsurface irrigation is done for non-rice crops (Ogion et al 1998). 3.22 Kenya Brackish water containing tds 5 to 20 g/l is considered to be the least explored resource, because salinity is too high to produce conventional crops. The halophytic plants as fodder crop and other forage crops are taken with saline water irrigation of 5 to 20 g/l tds. Small-scale irrigated agriculture is practiced on the Njemps flats since mid-ninetieth Century, which has markedly increased by the process of leaching. Water salinity is well within accepted quality standards but there was enough sodium for a slight to moderate sodification hazard. 3.23 Kuwait The wastewater from a municipal treatment plant in Kuwait city is used for irrigation. Fodder crops are grown in a 9000 ha sewage farm. Some vegetables are cultivated under controlled conditions. The Kuwait Group and the Dammam limestone aquifers are the main brackish ground water resources which are being over exploited. The Kuwait Group Aquifer exists in thickness range of 150-400 m with salinity increasing in regional flow direction. The Kuwait Group Aquifer consists of Miocene - Pliocene sediments. Brackish water occurs in Al-Abdali and Al-Wafra fields, while fresh water well fields are located in Al-Rawdhatain and Umm Al-Aish aquifers. Salinity in brackish water ranges between 4000 to 18000 mg/l in the direction of regional flow. Low salinity ground water occurs in the southwest Al-Rawdhatain and Umm Al-Aish. Fresh water aquifers are kept as strategic reservoirs while the brackish ground water of AL-Abdali and AL-Warfra is being used for irrigation although the percent Na, tds and EC are above recommended levels. 3.24 Latin America The wastewater irrigation is practiced in Latin America. Three irrigation districts near Mexico City receive wastewater to irrigate 41500 ha with raw sewage. The raw wastewater from the city of Santiago in Chile constitutes almost 100% of the dry weather flow in the Rio Mapocho River. Some 16000 ha land is irrigated from this wastewater, thirty-one reuse projects have been launched in the Peruvian desert coastal area. Many of which use stabilization pond effluents. The fish and giant prawn are also developed in saline waters following a UNDP Resource Recovery Project.
30
3.25 Lebanon The Bekaa Valley area demonstrates the waterlogging and salinity hazards. The Lebanon coast has a problem of seawater intrusion. The high water level of the Litani River during first part of the growing season makes the evacuation of the excess water more difficult. The soils in the Northern Bekaa are in the rainfall zone of 200-300 mm. In the citrus growing area along the Lebanese coast, a number of walls have been dug down the depth exceeding in general sea level. Farmers put pressure on the Government irrigation projects to supply good quality surface water. Despite farmers own investment for ground water use, they use it in limited cases with reservations. 3.26 Morocco Poor soil physical conditions, soil salinity, water quality and water stress are some of the major limitations for successful cultivation of crops in arid ecosystem. Halophytes to grow in saline conditions, within a threshold conditions of + 10 dS/m are developed. Aromatic and medicinal plants show promise for salt-affected soils and moisture stress conditions. The pivot irrigation is practiced in the Bahira region of central Morocco for 10 years, irrigation caused rapid salinization and alkalization of the soils under high evapotnarspiration. In clay soils, solidification of the soil has increased with increase of SAR of irrigation water. Irrigation caused a significant positive effect on the annual variation rate of EC, ESP, exchangeable sodium and magnesium, and permeability. Atriplex halimus (halophyte) plants grow in saline condition (ECiw = 1 to 20 dS/m) within threshold salinity of +10 dS/m. The use of freshwater irrigation before the main supply is a means of growing the plant in very saline environment (Choukr-Allah 1997). Raw water and treated wastewater were experimented in comparison with ground water (central) for crop production under arid and saline conditions with different irrigation methods. Treated wastewater application instead of saline ground water attenuted the detrimental effect of water salinity on the crops, and “Bas Rhone” system of drip irrigation instead of “Rain Bird” drip system displayed the highest irrigation performance and crop yields (El-Hamouri et al 1996). 3.27 North Africa The wastewater irrigation is developing in North Africa. The use of saline water is practiced in semiarid to arid climate with soil and water management practices. 3.28 Oman The Sultanate of Oman is interested in effluent reuse in agriculture. Effluent appears to be used mainly in drip irrigation system for shrubs and ornamental trees. The use of wastewater can help improve some irrigation. The sea water is treated for water supply system to the cities. 3.29 Pakistan Pakistan receives below 254 mm rainfall in about 69% of the whole area, 508-672 mm rainfall in about 5% area and more than 762 mm rainfall in remaining about 4% area. The Thar dessert in the southeast of the lower Indus plain is part of the ‘Great Indian Desert’ which extends into Pakistan from India, and has salt lakes in its depressions. Ground water quality deteriorates in the Indus plain as one traverses the plain from upstream to downstream towards the Arabian sea. Ground water with a tds value of more then 3000 mg/l within a depth of 110 m is classified as saline ground water in the Indus plain.
31
The Water and Power Development Agency (WAPDA) has undertaken since 1956 the activities under SCARP projects for drainage of area of saline ground water, to lower the level of saline ground water and to protect the useable freshwater zones against the intrusion of saline ground water (Ghassemi et al 1995). Because of the low overall efficiency of irrigation water application, available water is less than requirement.
Seepage from the water conveyance, distributive systems as well as deep percolation
from precipitation and irrigation have produced a thin fresh water layer over the saline water in most of the irrigated areas especially in the Indus Basin. To check the upcoming of saline water drainage pumping, skimming wells are used. Temporal variation in skimmed ground water quality was not significant. The water quality is variable from tubewells installed in five Salinity Control and Reclamation Projects (SCARP) areas. Tubewells pump brackish water which is harmful due to upconing of salts. Pakistan has a huge canal irrigation system. The waterlogging and salinity is a serious problem. Some studies on drainage water salinity of tubewells and pipe drains reveal that tubewells have an inferior drainage water than pipe drains. ECw of tubewell waters near Faisalabad is on an average is about 3.2 dS/m against ECw of pipe drains as 2.5 dS/m (Kelleners and Choudhry, 1998). Major efforts of Pakistan are oriented towards engineering solutions to combat waterlogging and salinity. Some efforts have been mode towards plantation of salt tolerant plants and Kaller grasses (Australian grass), which can survive at very high salinity of 40 dS/m, but remains economical upto a level of 20 dS/m. Kallar grasses are useful as forage species. Farmers have been encouraged to plant trees like Prosopis Juliflora, Eucalyptes Comaldulensis and Tamarix aphylla which are grown on sandy soils using highly saline ground water with EC values of 10 to 15 dS/m (Qhassemi et al 1995). 3.30 Palestine Water is used extensively in irrigated agriculture in Palestine, where 30% of the cultivated land is irrigated in Gaza Strip. Water quality is deteriorated in Gaza and Jordan valley due to seawater intrusion in Gaza Strip, over pumping of aquifers, low rainfall, extensive use of pesticides and pollution due to flow of raw waste water. Total dissolved solid in Jordan Valley Wells reaches average of 3000 mg/l and in Gaza Well 5000 mg/l. But, the water is still used for irrigation. The per capita total water consumption is 139 m3 in West Bank and 172 m3 in Gaza (Sheih 1998). 3.31 Saudi Arabia Saudi Arabia makes ample use of saline water for irrigation. Intensive studies are done on various aspects of the saline water use. These include: effects of saline water on soils, date palms, beans, barley, wind break trees, halophytes, and water and irrigation management aspects. The water quality of 388 wells in 6 regions of Saudi Arabia (Riyadh, Qassim, Hail, Western, Northern and Southern) demonstrated tds range 180 to 9350 mg/l, NO3 (nitrate) 0-95 mg/l and nitrite 0-1.5 mg/l. The wastewater irrigation is done to sorghum and maize. In western Saudi Arabia, the over exploitation of ground water in Wadi Fatimah has led to the appearance of upcoming, salinization and saline water encroachment. In Central Saudi Arabia, the use of saline ground water tds 210-8200 mg/l with an average of 2.4 mg/l has resulted into salt deposits into soils between 16.6 and 83 ton salt/ha. Extensive programme of water extraction caused a significant increasment in SO4 : Cl ratio (Abdel-Ael 1997). Researches are being conducted on germination and growth of barely with saline waters (EC 3 to 16 dS/m), faba bean, alfalfa, date palm, and prosopis juliflora, casuariana eqnisetifolia and eucalyptus camaldulensis.
32
3.32 Somalia The Wadi Shebelle River originates in the highlands of Ethiopia, flows south through the ogadan plateau of Ethiopia and Somalia and discharges into the Indian Ocean. ECw of the river water varies from 0.75 to 2.5 dS/m and occasionally ECw exceeds 2.5. Somalia makes use of brackish water from the river irrigation. The river water quality changes significantly in the periods late April until early June an again in October and November due to runoff from the Ogadan plateau which consist of rock formations of marine origin (FAO 1985). 3.33 South Africa The effects of soil water salinity on ionic concentration in mangrove trees are studied due to saline water irrigation. The Orange River water and the Great Fish River water in Republic of South Africa pose problems of salinity. The salt marshes of the Longebaan Logoon comprise over 30% of South Africa’s salt marsh areas. South Africa has an average rainfall 464 mm. 21% between 200 mm and 600 mm, while only 31% more than 600 mm (total area of country 1.22 million km2). The semiarid to arid western two thirds of the country is largely dependent on ground water for domestic and irrigation supplies (Ghassemi et al 1995). The natural leaching of salts from soils in the semiarid and arid regions causes salinity build up in river flows and eventually in surface reservoirs. Waterlogging and land salinization occur on some irrigation projects, which is much less than many other countries. Ground water occurs in hard rock formations over more than 80% of the area of South Africa. 3.34 Southeast Asia-Thailand The wastewater reuse studies are made in Thailand for beneficial irrigation. Thailand has a plan to use wastewater for irrigation. 3.35 Soviet Union and Commonwealth of Independent States Municipal effluent is widely used for irrigation in Soviet Union. A sewage farm was established in Moscow back in 1900. Odessa is reported to have a sewage farm in 1930. Irrigated area in Russia makes upto 5 Mha. The significant part of 0.74 Mha is either salted or situated in swamping zone.
The horizontal pipe drainage has been constructed on 25% of the total area. The
drainage water volume for irrigated lands makes upto 54% of the water withdrawals for irrigation which causes pollution of surface and subsurface water resources, submergence of land and causes ground water lands to rise, thus the problem is to find ways and means to utilize drainage flows. One mean for use of drainage flow is subirrigation (CSSRI 1997). The commonwealth of independent states as a former territory of the Soviet Union have annual average rainfall of about 531 mm, ranging form 100 mm in desert areas to 250 mm in the mountain districts of Caucasus. Many inland seas and lakes occur in the territory of the commonwealth of independent states, with some 200 rivers longer than 500 km. The largest lakes are Caspian sea and the Aral sea. Irrigation has been a mainstay of agriculture in the Central Asia for thousands of years (Framji et al 1983). Total length of the permanent irrigation network exceeds 530 000 km. Saline and alkaline soils occur one-quarter of the 954.8 Mha of the world’s saline and alkaline soils (Szaboles 1998). The region faces serious salinity and environmental problem. The Aral Basin is facing a huge environment crisis, because of major river diversions and erroneous strategy of development. The discharge of sizeable drainage runoff and wastewater to the rivers has sharply increased the level of salinity and polluted water. Alleviation of salinity problem needs to consider the strategy for removal of saline soils, reduction in crop area of rice and cotton, and plantations of trees to improve local microclimate.
33
3.36 Spain The drained and irrigated marshes in south west Spain are formed on soils of alluvial origin with high clay content, high salinity and a shallow saline water table. The irrigation with saline water reduced the cotton growth to reduce yield. Soils of the Ebro Valley (NE Spain) are degraded in the semiarid irrigated areas. The saline water quality of the Ter River in Spain is affected by the land use (Sabater et al 1990). The middle Ebro river basin area is of semiarid nature. Irrigation with saline water (ECw 2.5, 3 and 3.5 dS/m) of mixtures of soil and sewage sludge and worm humus increases the NO3 content in the media, harmful to crops. Lemon trees irrigated with saline water ECw 1.2 to 5.3 dS/m. Juice content was not affected, but quality was affected with more soreness. 3.37 Sudan The Democratic Republic of Sudan enjoys a variety of climatic conditions (Lat 0 to 22 North). Annual rainfall ranges from over 1500 mm in the far south to less than 10 mm in the far north. Temperature ranges from 15°C to 49°C. Soils are mostly calcareous and fine textured. The water table is deep and the runoff is negligible.
The salinity problem appears to increase from south to north (FAO 1971). The Northern
Province along the River Nile in the north of the country has three types of soils: (1) Gerif soils, (2) Karu soils and, (3) High Terrace soils. Gerif soils are of alluvial origin with low salts. Karu soils exceed clay content 60%. High terrace soils depict high degree of heterogeneity but rich in calcium carbonate concretions. Gypsum is also present. These are arid soils, high in salinity and alkalinity hazards. Large region of high terrace soils is available for cultivation not far form the main course of Nile and hence reclamation of these soils is essential. 3.38 Syria Syria covers an area of 18.48 Mha. The physiographic regions are: (1) flood plains of the Euphrate River, (2) Recent terraces, (3) Sub-recent terraces and, (4) Wadi pan and outwash. About 9 Mha land is arable, 6.6 Mha cultivated and 0.5 Mha was irrigated in 1971. Euphrates dam now covers 80%. The salinity increases with distance from the river reach to sub-terraces. The causes of salinity are irrigation methods, irrigation and quality of ground water. Insufficient irrigation with poor quality of water contributes to soil salinization. Ground water at the end of the cotton seasons was at 1.75 m causing salinity because of capillary rise in heavy textured soils. In uncultivated areas of plateau, the ground water levels are 15-20 m deep (FAO 1971). The increasing salinity is related to presence of the subterraces, parallel to Enphrates river at its southern edge (few metres to 10 km distance), irrigation methods and quality of ground water. 3.39 Tunisia Tunisia has a area of 16.41 Mha. The saline Medjerda River carries water of ECw 3.0 dS/m (annual average). The river water is used to irrigate date palm, sorghum, barley, alfalfa, ry grass and artichokes. The soils are calcareous heavy clays with CaCO3 upto 35% with low infiltration rates. The annual rainfall varies from 90 to 420 mm. The irrigation water is saline with tds range from 2000 to 6500 mg/l. The SAR varies below 10. The better soil and water management practices are required to make sustainable use of saline water (FAO 1992). The Tunisian Research Center for the utilization of saline waters for irrigation has been carrying on R&D activities since 1960. The canal irrigation in central Tunisia has increased salinization in clay soils while drip and sprinkler irrigation have inversed salinization in all soil types. The over exploitation of ground water for irrigation use increases salinization EC of ground water varies between 1 and
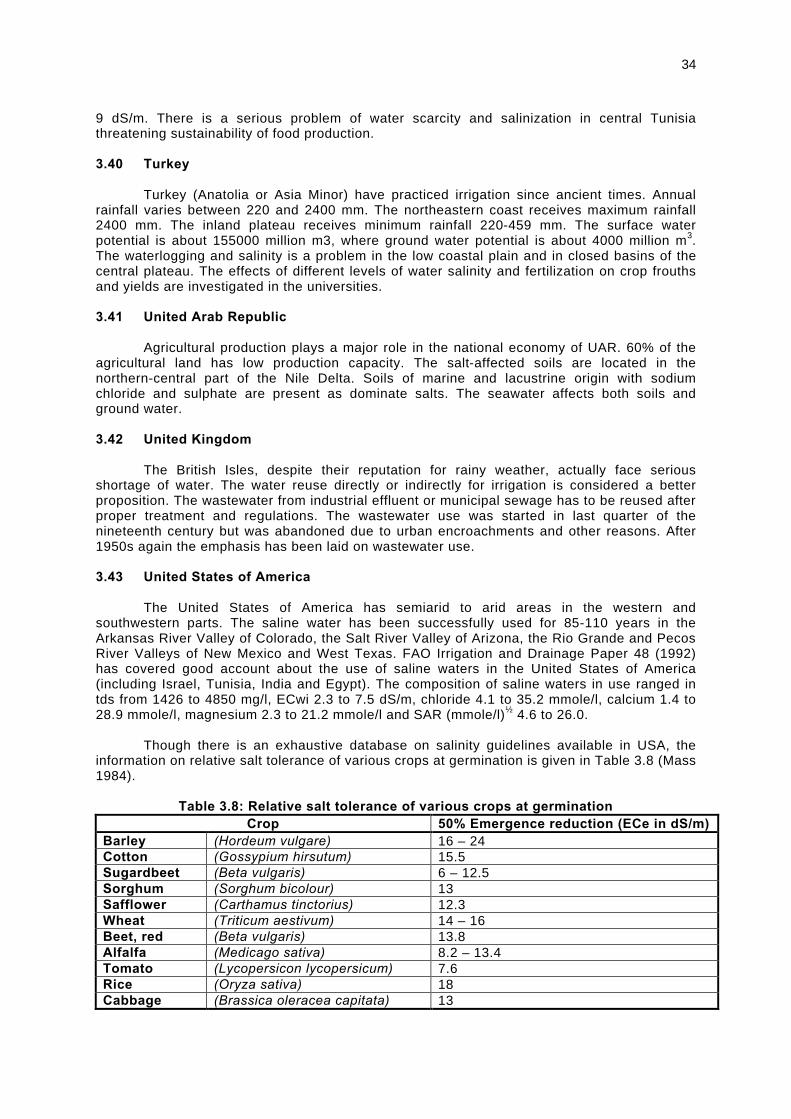
34
9 dS/m. There is a serious problem of water scarcity and salinization in central Tunisia threatening sustainability of food production. 3.40 Turkey Turkey (Anatolia or Asia Minor) have practiced irrigation since ancient times. Annual rainfall varies between 220 and 2400 mm. The northeastern coast receives maximum rainfall 2400 mm. The inland plateau receives minimum rainfall 220-459 mm. The surface water potential is about 155000 million m3, where ground water potential is about 4000 million m3. The waterlogging and salinity is a problem in the low coastal plain and in closed basins of the central plateau. The effects of different levels of water salinity and fertilization on crop frouths and yields are investigated in the universities. 3.41 United Arab Republic Agricultural production plays a major role in the national economy of UAR. 60% of the agricultural land has low production capacity. The salt-affected soils are located in the northern-central part of the Nile Delta. Soils of marine and lacustrine origin with sodium chloride and sulphate are present as dominate salts. The seawater affects both soils and ground water. 3.42 United Kingdom The British Isles, despite their reputation for rainy weather, actually face serious shortage of water. The water reuse directly or indirectly for irrigation is considered a better proposition. The wastewater from industrial effluent or municipal sewage has to be reused after proper treatment and regulations. The wastewater use was started in last quarter of the nineteenth century but was abandoned due to urban encroachments and other reasons. After 1950s again the emphasis has been laid on wastewater use. 3.43 United States of America The United States of America has semiarid to arid areas in the western and southwestern parts. The saline water has been successfully used for 85-110 years in the Arkansas River Valley of Colorado, the Salt River Valley of Arizona, the Rio Grande and Pecos River Valleys of New Mexico and West Texas. FAO Irrigation and Drainage Paper 48 (1992) has covered good account about the use of saline waters in the United States of America (including Israel, Tunisia, India and Egypt). The composition of saline waters in use ranged in tds from 1426 to 4850 mg/l, ECwi 2.3 to 7.5 dS/m, chloride 4.1 to 35.2 mmole/l, calcium 1.4 to 28.9 mmole/l, magnesium 2.3 to 21.2 mmole/l and SAR (mmole/l)½ 4.6 to 26.0. Though there is an exhaustive database on salinity guidelines available in USA, the information on relative salt tolerance of various crops at germination is given in Table 3.8 (Mass 1984).
Table 3.8: Relative salt tolerance of various crops at germination Crop 50% Emergence reduction (ECe in dS/m)
Barley (Hordeum vulgare) 16 – 24 Cotton (Gossypium hirsutum) 15.5 Sugardbeet (Beta vulgaris) 6 – 12.5 Sorghum (Sorghum bicolour) 13 Safflower (Carthamus tinctorius) 12.3 Wheat (Triticum aestivum) 14 – 16 Beet, red (Beta vulgaris) 13.8 Alfalfa (Medicago sativa) 8.2 – 13.4 Tomato (Lycopersicon lycopersicum) 7.6 Rice (Oryza sativa) 18 Cabbage (Brassica oleracea capitata) 13
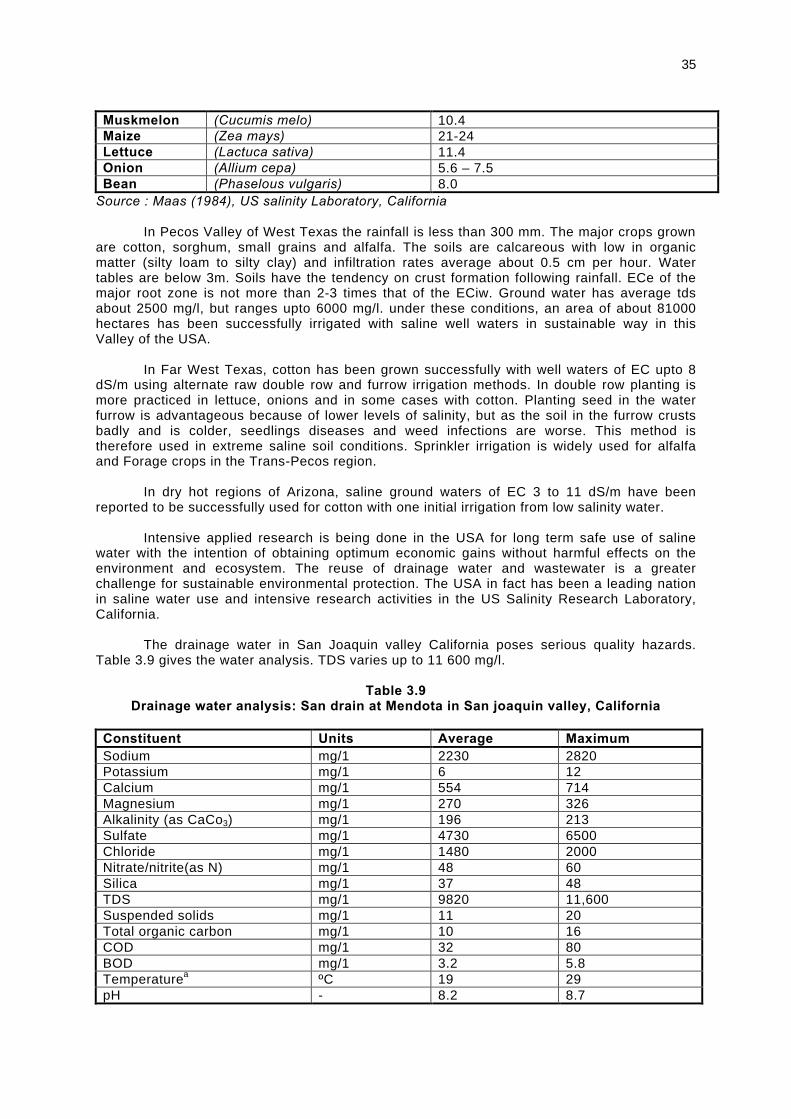
35
Muskmelon (Cucumis melo) 10.4 Maize (Zea mays) 21-24 Lettuce (Lactuca sativa) 11.4 Onion (Allium cepa) 5.6 – 7.5 Bean (Phaselous vulgaris) 8.0
Source : Maas (1984), US salinity Laboratory, California In Pecos Valley of West Texas the rainfall is less than 300 mm. The major crops grown are cotton, sorghum, small grains and alfalfa. The soils are calcareous with low in organic matter (silty loam to silty clay) and infiltration rates average about 0.5 cm per hour. Water tables are below 3m. Soils have the tendency on crust formation following rainfall. ECe of the major root zone is not more than 2-3 times that of the ECiw. Ground water has average tds about 2500 mg/l, but ranges upto 6000 mg/l. under these conditions, an area of about 81000 hectares has been successfully irrigated with saline well waters in sustainable way in this Valley of the USA. In Far West Texas, cotton has been grown successfully with well waters of EC upto 8 dS/m using alternate raw double row and furrow irrigation methods. In double row planting is more practiced in lettuce, onions and in some cases with cotton. Planting seed in the water furrow is advantageous because of lower levels of salinity, but as the soil in the furrow crusts badly and is colder, seedlings diseases and weed infections are worse. This method is therefore used in extreme saline soil conditions. Sprinkler irrigation is widely used for alfalfa and Forage crops in the Trans-Pecos region. In dry hot regions of Arizona, saline ground waters of EC 3 to 11 dS/m have been reported to be successfully used for cotton with one initial irrigation from low salinity water. Intensive applied research is being done in the USA for long term safe use of saline water with the intention of obtaining optimum economic gains without harmful effects on the environment and ecosystem. The reuse of drainage water and wastewater is a greater challenge for sustainable environmental protection. The USA in fact has been a leading nation in saline water use and intensive research activities in the US Salinity Research Laboratory, California. The drainage water in San Joaquin valley California poses serious quality hazards. Table 3.9 gives the water analysis. TDS varies up to 11 600 mg/l.
Table 3.9 Drainage water analysis: San drain at Mendota in San joaquin valley, California
Constituent Units Average Maximum Sodium mg/1 2230 2820 Potassium mg/1 6 12 Calcium mg/1 554 714 Magnesium mg/1 270 326 Alkalinity (as CaCo3) mg/1 196 213 Sulfate mg/1 4730 6500 Chloride mg/1 1480 2000 Nitrate/nitrite(as N) mg/1 48 60 Silica mg/1 37 48 TDS mg/1 9820 11,600 Suspended solids mg/1 11 20 Total organic carbon mg/1 10 16 COD mg/1 32 80 BOD mg/1 3.2 5.8 Temperaturea ºC 19 29 pH - 8.2 8.7
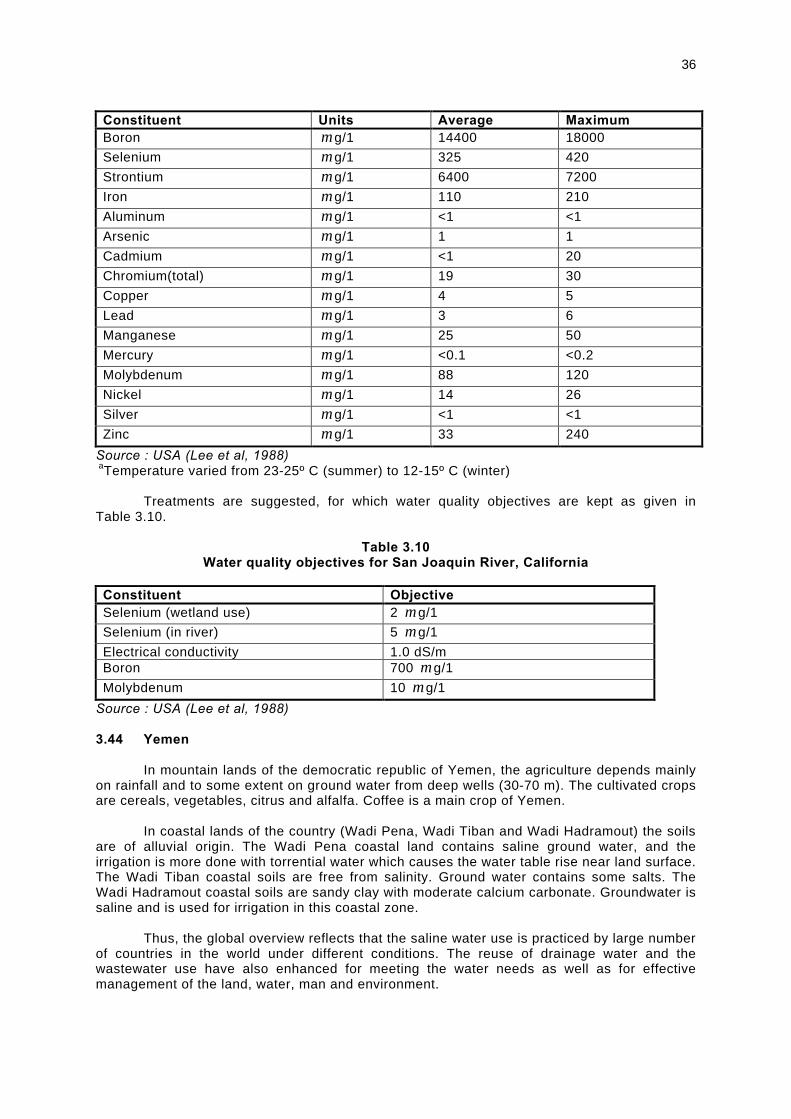
36
Constituent Units Average Maximum Boron µ g/1 14400 18000
Selenium µ g/1 325 420
Strontium µ g/1 6400 7200
Iron µ g/1 110 210
Aluminum µ g/1 <1 <1
Arsenic µ g/1 1 1
Cadmium µ g/1 <1 20
Chromium(total) µ g/1 19 30
Copper µ g/1 4 5
Lead µ g/1 3 6
Manganese µ g/1 25 50
Mercury µ g/1 <0.1 <0.2
Molybdenum µ g/1 88 120
Nickel µ g/1 14 26
Silver µ g/1 <1 <1
Zinc µ g/1 33 240
Source : USA (Lee et al, 1988)
aTemperature varied from 23-25º C (summer) to 12-15º C (winter) Treatments are suggested, for which water quality objectives are kept as given in Table 3.10.
Table 3.10
Water quality objectives for San Joaquin River, California
Constituent Objective Selenium (wetland use) 2 µ g/1
Selenium (in river) 5 µ g/1
Electrical conductivity 1.0 dS/m Boron 700 µ g/1
Molybdenum 10 µ g/1
Source : USA (Lee et al, 1988)
3.44 Yemen In mountain lands of the democratic republic of Yemen, the agriculture depends mainly on rainfall and to some extent on ground water from deep wells (30-70 m). The cultivated crops are cereals, vegetables, citrus and alfalfa. Coffee is a main crop of Yemen. In coastal lands of the country (Wadi Pena, Wadi Tiban and Wadi Hadramout) the soils are of alluvial origin. The Wadi Pena coastal land contains saline ground water, and the irrigation is more done with torrential water which causes the water table rise near land surface. The Wadi Tiban coastal soils are free from salinity. Ground water contains some salts. The Wadi Hadramout coastal soils are sandy clay with moderate calcium carbonate. Groundwater is saline and is used for irrigation in this coastal zone. Thus, the global overview reflects that the saline water use is practiced by large number of countries in the world under different conditions. The reuse of drainage water and the wastewater use have also enhanced for meeting the water needs as well as for effective management of the land, water, man and environment.
Chapter 4
SALINE WATER EXPLORATION AND ASSESSMENT 4.1 Introduction A common source of saline water is ground water. Arid and semiarid areas of many countries are mostly underlain by saline ground water. In many regions, rivers or canals flow from humid and subhumid areas to semiarid and arid areas, where fresh and saline water exist in a close proximity. In sea coastal areas, fresh and saline waters also occur in proximity. The pumping of fresh ground water invites encroachment or upcoming of salts in inland areas while sea water intrusion occurs in coastal irrigation (Kovda 1973, Tanwar and Kruseman 1985, UNESCO/UNDP 1970). Ground waters render low in quality by the natural process of mineralization, contamination and pollution owing to human activities. Besides variation in quality, groundwater also varies in quantity as per the aquifer framework characteristics and intensity of recharge sources. It is imperative to carry out scientific investigation, exploration and assessment for the use of saline water in various situations.
In order to use saline water for irrigation, one needs to understand how saline or sodic
water affects the plant, causes of salinity in soils and waters, exploration of saline aquifer geometry, what levels of salinity acceptable, monitor salinity levels to ensure they stay within the acceptable range, participatory resource appraisal, and one needs to be prepared to accept lower than average crop yields. 4.2 The Saline Water Irrigation Problem The harmful effects of saline water irrigation are mainly associated with accumulation of salts in the soil profile and are manifested through reduced availability of water to plants, poor to delayed germination and slow growth rate (Feizi 1998, Shalhevet 1994, Letey et al 1990, Mass 1990, CSSRI 1998). Osmosis is a normal process with the fresh water irrigation. But, if the irrigate water is saline, the plant has to work harder to absorb water from the soil. Excessive salts in the soil induces early wilting and the effects are almost similar to those of drought. Some of the visual symptoms of saline water irrigation are that the plants look stunted and leaves are smaller but thicker and have often-dark green colour as compared to plants growing in a salt free soil irrigated with good quality (Bernstein 1964, Van Hoorn 1971, Minhas 1998). If the irrigation water is highly saline, the process of osmosis can become reversed. Where the solution outside the plant roots is higher in salt concentration than that of the root cells, water will move from the roots into the surrounding solution. The plant loses moisture and thus suffers stress. The symptoms of high salt damage are similar to those from high moisture stress damage. If saline water is sprayed directly on leaves, it can cause salt scorch and uaf damage even at lower salinities. The salt concentration takes place more than two times in fine textured clay and clay loam soils. Saline water of a high salt concentration having ECw of 12 dS/m may be used for growing tolerant and semitolerant crops in coarse textured loamy sand and sandy soils under normal rainfall of more than 400 mm. But, in fine textured soils of clay and clay loam nature, waters with ECw more than 2 dS/m would often create salinity problem (Tyagi 1998, Abrol 1982, Kandiah 1990). The saline water of ECw more than 4 dS/m will cause salt toxicity in most of the crops in areas with annual rainfall less than 250 mm. 4.3 The Sodic Water Irrigation Problem The alkali or sodic water also constitute a significant proportion of groundwater in arid and semiarid areas. ECw is less than 4 dS/m. Relative proportion of calcium and magnesium salts is much smaller as compared to sodium salt, which constitutes more than 70 percent of the total cations. The alkali/sodic waters usually have sodium bicarbonate as predominant salt
38
and in certain cases the calcium salts may be nearly absent (Eaton 1950, Hem 1970 Abrol 1972). The prolonged use of these waters in irrigation immobilizes soluble calcium and magnesium in the soil by precipitating them carbonates. Consequently, the concentration of sodium in the soil solution vis-à-vis on the exchange complex increases and leads to the development of alkali or sodic soil conditions, and that adversely affects the physical properties of soils. The harmful effects of alkali/sodic water irrigation are mainly associated with increased exchangeable sodium percentage (ESP) and reduced infiltration (Oster and Schroer 1979, Bajwa 1998). Long term use of water leads to breakdown of soil structure due to swelling and dispersion of clay particles (Richard 1954, CSSRI 1994, Bingham et al 1979). Fine texture soils remain disposed and puddle when wet and then hard when dry. It does not attain proper soil moisture condition for activation. A thin crust formed at the surface of soil acts as a barrier to penetrating irrigation water to the soil and to the emergence of seedling (Minhas 1998, CSSRI 1988). The increase in soil pH reduces availability of a number of plant nutrients like nitrogen, zinc, iron etc. Calcium and magnesium find decrease, and toxicity of sodium increases and consequent toxicity also increases of elements like boron, molybdenum, fluorine, lithium and selenium etc. The use of alkali/sodic waters in irrigation plants suffer from poor soil physical conditions, reduced nutrient availability and increase in toxicity of certain ions (Bottcher et al 1981, FAO 1992). The gypsum application becomes necessary to neutralize the effect of alkali/sodic waters. Agricultural grade gypsum (70% purity) at the rate of about 90 kg/ha is normally needed per irrigation of 7.5 cm depth for 1 me/l. 4.4 Origin of Salinity in Soils and Ground Waters In the light of the general characteristics of saline and alkali waters discussed in the preceeding section, the saline water exploration and assessment leads to economical venture in overall saline water irrigation management (Mjelde et al 1990). The salinity problem in soil water occurs if salts from the applied irrigation water accumulate in the crop root zone. The salinity problem may also exist due to upward movement of water and salts from the groundwater. In shallow water table area, the water evaporates from the soil and causes salt concentration in the soil profile. The appearance of waterlogging and salinity in soils of irrigation commands has accentuated the gravity and urgency of the problem all over the world (Tanji 1990). However, in all the scientific endeavors, emphasis has been on assessment and characterization of the soils and aquifers, identification of causative failures and development of a control or management approach to tackle the problem of the waterlogging and salinity. The process of groundwater mineralization with aquifer salinization is more active in the arid and semiarid areas, which continuously increase the salinity in water under the process of evaporation and deposition of salts (Crag 1980, Dhir 1998). The salinity of ground water in inland closed basins is reported upto 55 dS/m (Tanwar 1981, UNDP/FAO 1985, CSSRI 1998). The issue, like the origin and mechanism of initial concentration of salts in subsoil strata or ground water in the first place, has received scanty attention, except that the geochemistry of landscape, regional salt balance and dynamics of salts have, however, drawn some attention in the Western World (Agino 1983, Ayer and Westcot 1985, Abrol 1982). There are several reasons for lack of attention: (1) the salt enrichment process is spread over to thousands of million years during which the determining parameters of rainfall, hydrology and other climatic factors have not remained constant, and (2) the salt being very mobile often concentrate far from the source and diffused and stored over a large area. Rainfall, wind and stream waters are the significant original natural courses as vehicles for redistribution of the already existing salts.
39
The study of the origin of salinity is important for long term management of salinity problem and to foresee the durability of costly reclamation projects which depend upon a proper understanding of the regional climate, hydrology, geohydrology, geochemistry, salts input through mineral weathering process, rainfall, and redistribution and sink mechanism processes. (Doneen 1958, Shalhevet and Kamburov 1976, Rhoades 1977, Singh 1998). The Western USA, Western Europe, Asian deserts, North African continent, etc. have evaporites. These evaporites are mainly made up of halite and anhydrite, with occasional presence of potash beds. Leaching of salts from these salt formations forms an immediate source of salinity in the adjoining areas. In many arid areas, the salinity of soils and ground waters can be explained by the occurrence of evaporites in the region. The salty springs could be sources of salinity in some regions. 4.5 Waterlogging and Salinity Waterlogging occurs due to surface flooding (surface waterlogging) or due to rise in water table (sub-surface waterlogging) or due to both surface flooding and rise in water table as a common waterlogging phenomenon. The excess water inflow as compared to outflow may be either on account of excess rain, over irrigation and congestion of drainage. The waterlogging occurs due to rise in water table to an extent that the soil pores in the root zone of crop become saturated, resulting in restriction of the normal circulation of the air, decline in the level of oxygen and increase in the level of carbon dioxide. The water table which is considered harmful would depend upon the type of crop, type of soil and the quality of water, the actual depth of water table when it starts affecting the yield of the crops adversely, may vary over a wide range from zero for rice about 1.5 m for other crops.” The excess soils soil moisture due to waterlogging in the root zone affects the crop productions in several ways: (1) prevents growth of soil micro-organism that help in the development of plants, (2) plant diseases and parasites develop in humid environment, (3) high water table limits root penetration, (4) prolonged saturation adversely affects soil structure, (5) salts, if present in the soil or ground water, tend to concentrate in the root zone or at the soil surface, (6) evaporation from wet soils lower soil temperature, which in turn affects the seed emergence and plant growth, and (7) excess soil moisture hinders timely farm operation. The development of waterlogging and salinity is common problem more or less in the several irrigation commands in the world, unless the drainage system has been laid, operated and efficiently maintained (Oster and Rhoades 1975, FAO 1971, Ghassemi et al 1995). The saline waterlogged areas are tackled with the drainage projects in countries like Egypt, Pakistan, Iraq, Iran, Tunisia, USA, Canada, and USSR. The pipe drainage is common as it tackles waterlogging and salinity both and generates less saline effluent over the time and drainage water can possibly be reused. (FAO 1992/1995, CWC 1992, FAO/UNDP 1985, Rhoades 1977, Tanwar 1998). The world over important source of saline water are: (1) seawater intrusion in coastal regions, (2) tidal influence of sea on coastal surface water, (3) ground water mineralization in rock formations, (4) process of evaporation/evapotranspiration more so in arid and semiarid regions and enrichment of salts in surface and ground water, (5) waterlogging and secondary salinization of soils, (6) drainage effluent, and (7) sewage effluent. Numerous investigations have shown that water within sedimentary rocks becomes increasingly saline. The subsurface regime with increase in depth, reflects sulphate rich water near the surface, saline barcarbonate water at an intermediate level, and more concentrated chloride water at greater depth (Crag 1980, FAO 1992). 4.6 Exploration and Evaluation Approach In arid and semiarid regions the use of saline water is essential due to (1) non availability of fresh water in arid and semiarid areas, (2) control of rising water table in irrigation command with the accompanying risks of waterlogging and soils salinization, and (3)
40
reclamation of the waterlogged and saline lands (FAO/UNDP Saline Water Studies in Haryana, India during 1982-1985). Thus the exploration and evaluation of saline water is imperative to make its gainful use for irrigation. The following steps can be planned and adopted in saline ground water exploration and assessment in semiarid or arid areas with of without waterlogging conditions. (FAO/UNDP 1985): (1) Collection of available data relevant to the investigation and assessment, (2) Preparation of working document series on general statistics, geology, climatology, environment, hydrology, hydrogeology, water quality, soils, water distribution system, agriculture, agroeconomic degradation and drainage system, (3) Baseline survey and monitoring of water table, water quality and stream flows, (4) Remote sensing survey, establishing typography, drainage, nature of soils, land use, land cover and monitoring of streams, lakes and available natural resources, (5) Geoelectrical survey and hydrogeological study, (6) Augerhole measurements and soil sampling, (7) Thilling for ground water exploration, (8) Water quality analysis, (9) Water budget analysis and water balance, (10) Possible use of saline water for irrigation in conjunction with existing fresh water resources, (11) Evaluation of soil profile, and aquifer and well characteristics, (12) Well design parameters along with pipe drain design, (13) Environmental impact assessment, (14) Management of water table control measures and disposal of drainage effluent, (15) Simulation and hydrosalinity management modeling, (16) Agroeconomic evaluation, and (17) Project formulation for development and management of saline water areas and use of saline water for irrigation 4.7 Evaluation of Shallow Saline Water Aquifers The exploration and evaluation of shallow aquifer framework can aim at three objectives of: (1) use of saline groundwater for irrigation, and (2) vertical drainage to control rising water table and, (3) disposal. The primary interest in ground water investigation is the information on aquifer geometry, hydraulic characteristics of the aquifer materials, water table or piezometric surface levels and fluctuations, and water quality. This information can be obtained from geologic logs of wells drilled in the area, samples of materials from wells, well pump tests, record of levels of the water table or piczometric surface, and chemical analysis of water samples. The ground water organization or drilling agencies in the area may be the sources of data. 4.8 Evaluation of Deep Saline Water Aquifers Geological formations with saline water occurrence can be deciphered by surface geophysical mapping and subsurface exploration drilling. The quantitative assessment is possible by installation of exploratory tubewells and pumping test analysis for determination of aquifer parameters in terms of hydraulic conductivity, transmissibility and storativity. The water quality evaluation for individual aquifers can be achieved by the individual aquifer tests. Aquifer types include: (1) unconfined aquifers, (2) composite and leaky aquifers, and (3) confined aquifers (Tanwar 1998, CGWB 1998, FAO/UNDP 1985). It is advisable to run the electrical logs, gamma-ray logs and temperature logs on exploratory boreholes for demarcation of aquifers and possible changes in water quality. The time-domain electromagnetic (TDEM) soundings may be useful to map conductive ground water zones. The dynamic storage based on annual water cycle phenomena is estimated along with secular or fixed water storage in aquifers. The specific well design material and pumping sets are decided to avoid deterioration and corrosion. The illustrations of water table or piezometric surface maps, aquifer thickness maps, fence diagrams, hydrgeological profiles, water quality maps, and water table fluctuation maps carry practical importance (Tanwar and Kruseman 1985). 4.9 Drainage Investigations in Saline Waterlogged Soils Most irrigation projects in the world, including those of Asia, Middle East, Australia, USA, are adjacent to big rivers in alluvial plains. In most cases the lands irrigated are alluvial soils. These alluvial lands are usually flat. On introduction of irrigation, the process of water
41
conveyance and distribution through canals involves huge water losses to the ground water aquifers which amount in to about 30 to 50% of the total water diverted. The water table level rises and in a few years becomes very close to the ground surface. This situation of waterloggers is very harmful for the development of crops because of : (1) the limiting depth of the root system which prevents the crop growth and (2) soil salinization by capillary action (Oster and Rhoades 1990, Smedma 1995 FAO 1971). The drainage operations are planned for removal of excess ground water to maintain a favourable water and salt regime in to the root zone for sustained crop production. The remedial measures are called land drainage, agriculture drainage or reclamation of waterlogged and saline lands. Drainage measures are generally location specific and vary according to soil, climate, irrigation method, geohydrological conditions and cropping pattern (Rhodes 1974, Oosterbaan 1991). In planning drainage measures the information is needed on geologic profile of impermeable and permeable layers, infiltration characteristics of soils, water table fluctuations, hydraulic conductivity, drainage porosity, shallow aquifer parameter, fresh water supplies from canals or other sources, soil salinity, quality of surface and subsurface waters, surface drainage network, availability of drainage outlets and rainfall (Bouwer 1969, Boumans et al 1988, Tanwar 1998). In addition, the information on drainage requirements of different crops and drainage design criteria is vital. The predrainage investigations include reconnaissance, semi-detailed and detailed survey (Oosterbaan 1991). The reconnaissance survey includes land topography, geomorphology, geology, soils, land use, irrigation, rainfall, hydrology, surface drainage, disposal outlets, salinity, ground water conditions, water quality, drain ability and hydrautic conductivity. The semi-detailed surveys aim to topographic and soil maps at 1:25000 or 1:10000 scales with contour interval of 0.03m, including information on nature of salts in soil and groundwater and flooding conditions. The semi-detailed studies correspond to ‘feasibility studies’ which enable to decide the optimal plan for execution. The detailed surveys includes all database and comprehensive field investigations or determine hydraulic conductivity by auger hole methods, anisotropy, water table changes, porosity, and aquifer parameters. The subsurface pipe drainage design criteria mainly include: (1) water table depth and (2) drainage cofficient. Piezometers are installed for monitoring of water quality (Oosterbaan 1991). The horizontal drainage system is laid at a depth of 0.75 to 3m at different spacings of laterals and collectors. The perforated corrugated PVC pipes with perforation in grooves are used which have least resistant factor of 0.05 to 0.1 as against 0.4 to 2 for clay and concrete pipes, and 0.4 to 0.6 for smooth plastic pipes. In view of the instability of sub-soil, the filter envelope around the perforated pipe is essential, which is of nylon fibers or geotextile. The optimum life of subsurface drainage system is bout 50 years and hence proper operation and maintenance is essential to achieve full life span of the drainage system (FAO 1971, CSSRI 1994)). The disposal of the saline drainage effluent is a major constraint in areas with poor quality waters. The disposal of treated water could be in rivers through surface drains, evaporation ponds and canals (if permitted). The drainage effluent can be reused in irrigation depending of the quantity and quality criteria. There can be possibilities for reuse of saline drainage waters for irrigation: (1) mixing with canal water (2) cyclic or rotational use of canal and saline water and (3) direct use of saline drainage water. The selection of salt tolerant crop, pre-sowing irrigation with fresh water, adequate availability of subsurface drainage water and drain quality need to be considered. (Lee 1991, Rhoades 1984, Boumans et al 1988, Tanwar 1994). 4.10 Participatory Irrigation Appraisal The water management activities are lacking the world over owing to needed participation of stakeholders. Efficiency and economics of water use are also adversely affected because of non-participation or inadequate participation of the people in the water management projects (Dinar and Zilberman 1991). The people’s participation is imperative

42
from the stage of planning investigation and appraisal to the stages of design, development and management level. The Participation Irrigation Appraisal (PIA) and Participatory Irrigation Management (PIM) methods have been evolved and are now under application stage in many countries like Mexico, Turkey, Pakistan, Nepal, India, Indonesia, Malaysia, USA, Egypt, China and other countries. The World Bank has established an international network on Participatory the Irrigation Management (INPIM) as an international non-governmental organisation. Different countries have also established national PIM units. It would be beneficial to involve the people (affected of soil salinity and saline water problem) in different related functions of planning, design, development and management and specifically in the decision making process of the saline water use (Tanwar 1998).
Chapter 5
TECHNOLOGY ADVANCEMENT IN SALINE WATER MANAGEMENT
5.1 Introduction The sustainability of irrigated agriculture with saline water is a real challenge. The concept of improvement and maintenance of the crop productivity at economic level is the core idea of sustainability. In saline environment, the major issues involved are: (1) the effect of saline water irrigation on crop productivity, (2) the economics of the saline water use, and (3) the environmental protection to safe guard the soil crop and human health. Advanced technology needs application in saline water irrigation to prevent excessive accumulation of salts in the root zone to meet leaching requirement and ET requirement of crop. Once the soil solution has reached the maximum salinity level compatible with the cropping system, the excess salt needs to be removed from the root zone through adequate leaching process. At the same time the precipitation and irrigation water infiltrated into the soil excess over the crop demand or any other excess water that flows as surface or subsurface into the area that must find a drainage outlet to avoid excessive soil salinization and waterlogging. If natural drainage is missing in the area, artificial surface or subsurface drainage system or an integrated drainage system may be employed. Additional pertinent issues could be stated as: (1) the effect of saline water irrigation on environment, (2) the economics of saline water use and, (3) the equity of saline water irrigation. There are various bottlenecks in the implementation of the saline water use policies, plans and programs. Advanced technologies including digital models are in use to identify the stages at which greater motivation is required to speed up the saline water management for irrigation with appropriate level of the peoples participatory management. (UNESCO UNDP 1970, Tanwar and Kruseman 1985 Ayers are Westcot 1985, UNEP 1991, Oster 1994, FAO 1996, USAID 1996, Bower 1998, Ragab 1998). 5.2 Water Management The water management is a crucial component in saline water use strategy for irrigated agriculture. To maintain a viable and permanent irrigated agriculture it is imperative to: (1) protect water quality, (2) adopt adequate leaching and drainage measures to prevent excessive soil salinization and salt loading of surface and ground waters, (3) practice irrigation processes in graded land to increase efficiency and uniformity of water applications, to decrease salt loading and to utilize benefit of shallow water table conditions, (4) intercept, isolate and reuse drainage water for irrigation, and (5) adopt scientific surface and subsurface harvesting technology and skimming well designs in an area of fresh water floating over saline aquifers. 5.2.1 Water Quality and Environmental Protection Water quality is defined by certain physical, chemical and biological characteristics. Specific uses have different water quality needs. The hierarchical complexity of agriculturally related water quality problems is depicted in Figure 5.1. There have been a number of different water quality guidelines related to irrigated agriculture as per the respective agroclimatic conditions, type of crops and methods of the irrigation and drainage practices. Each new set of guidelines is build upon the previous set to improve the productive capability. The soil permeability and tilth problem is assessed in terms of both the salinity of the infiltrating water and the exchangeable sodium percentage (or its equivalent SAR value) and the pH of the top-soil (Figure 5.2). The phenomena of repulsion between soil particles (swelling), dispersion (release of individual clay platelets from aggregates) and slaking (breakdown of aggregates into subaggregate assemblages) cause changes in soil permeability and tilth. The swelling occurs at relatively high ESP values in excess of 15. Conversely, the dispersion and slaking can occur at relatively low ESP values less than 15, provided the
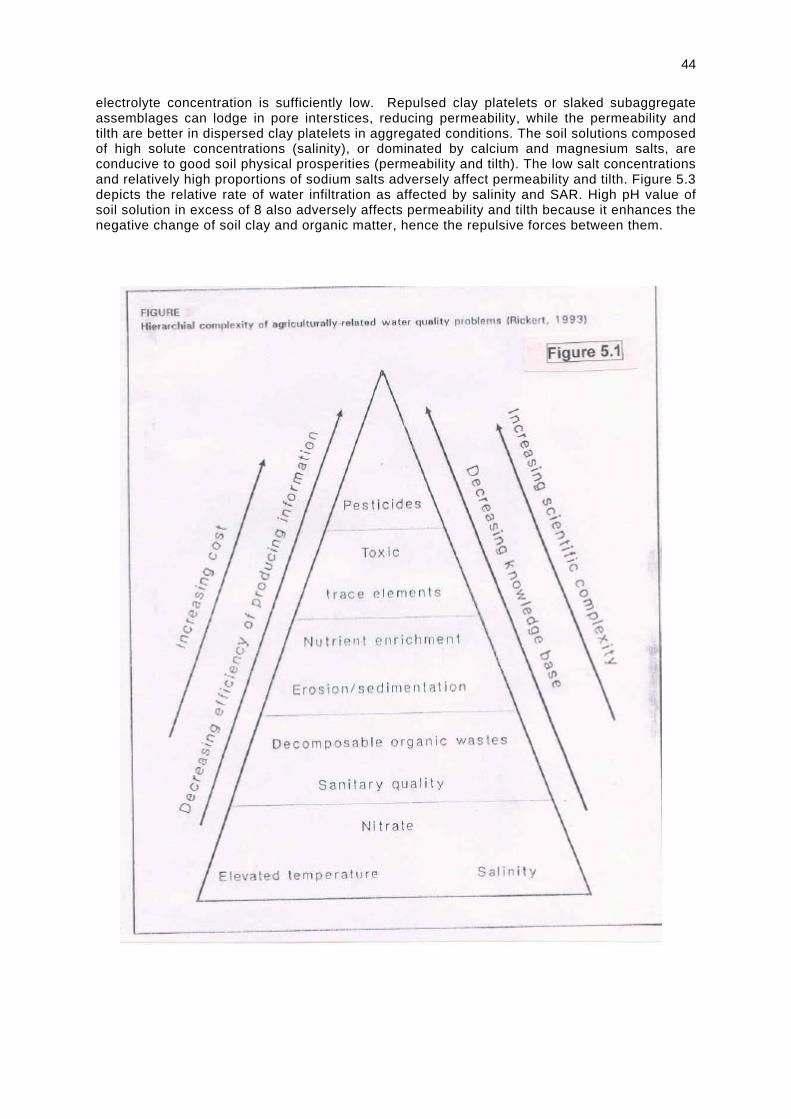
44
electrolyte concentration is sufficiently low. Repulsed clay platelets or slaked subaggregate assemblages can lodge in pore interstices, reducing permeability, while the permeability and tilth are better in dispersed clay platelets in aggregated conditions. The soil solutions composed of high solute concentrations (salinity), or dominated by calcium and magnesium salts, are conducive to good soil physical prosperities (permeability and tilth). The low salt concentrations and relatively high proportions of sodium salts adversely affect permeability and tilth. Figure 5.3 depicts the relative rate of water infiltration as affected by salinity and SAR. High pH value of soil solution in excess of 8 also adversely affects permeability and tilth because it enhances the negative change of soil clay and organic matter, hence the repulsive forces between them.
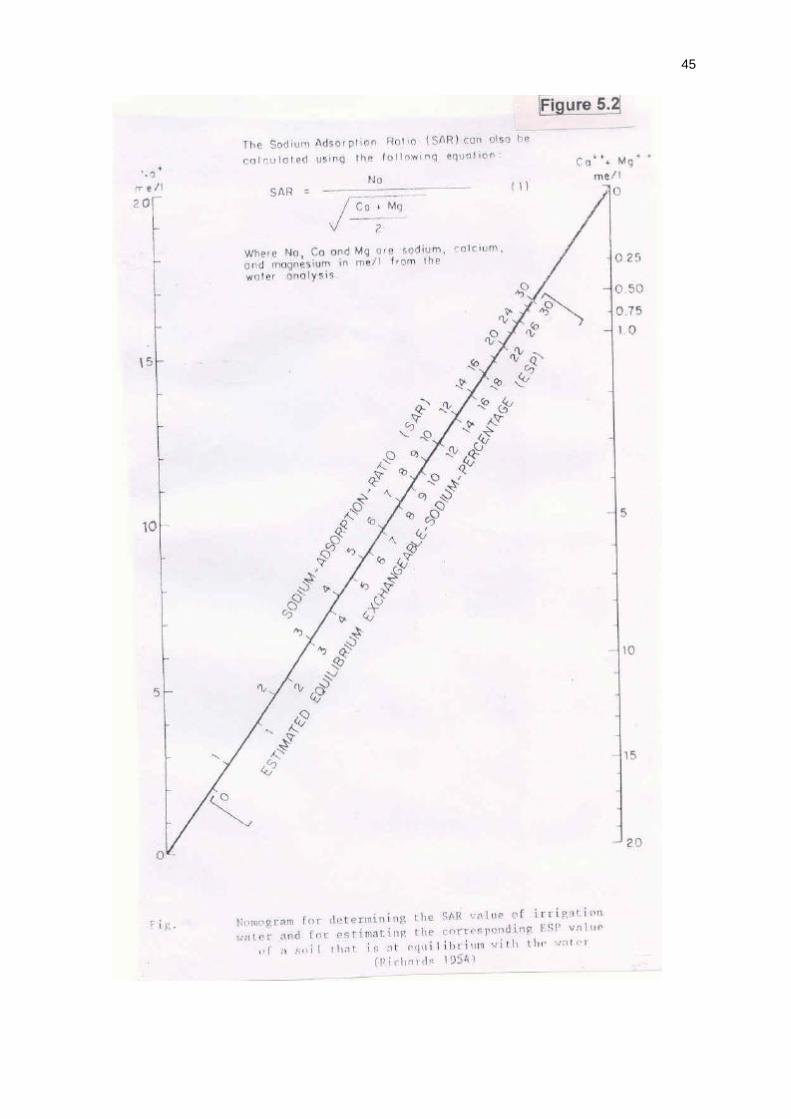
45
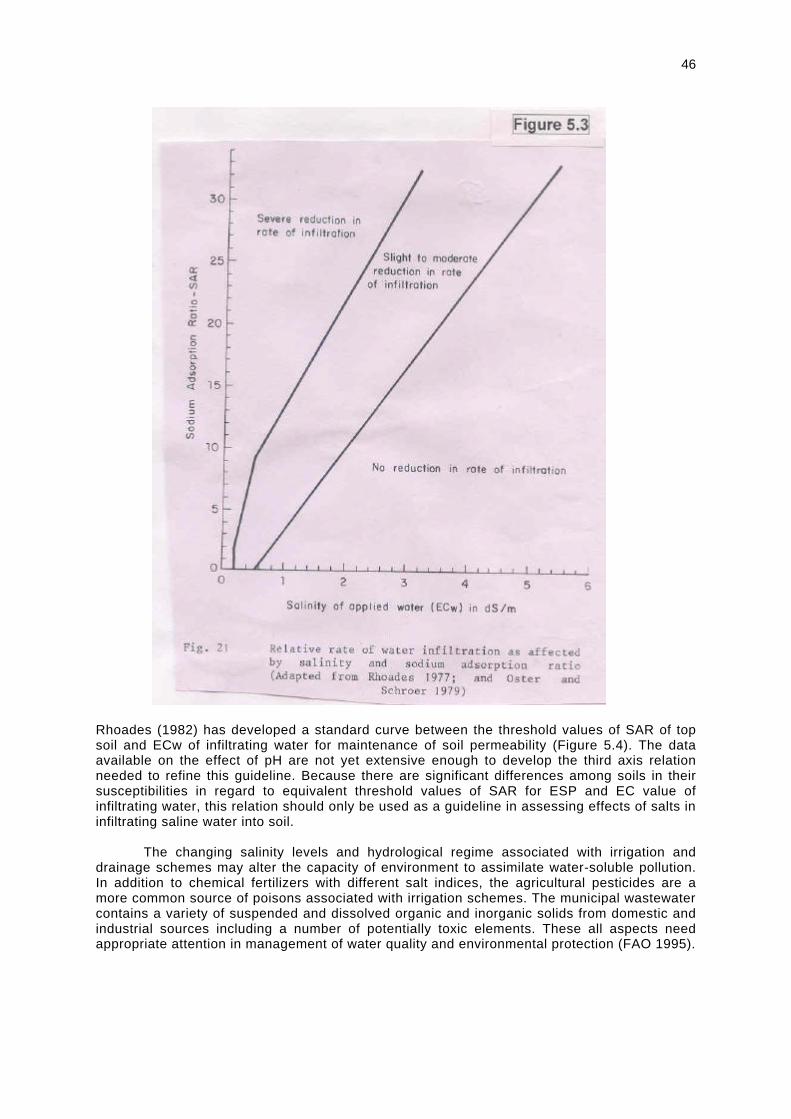
46
Rhoades (1982) has developed a standard curve between the threshold values of SAR of top soil and ECw of infiltrating water for maintenance of soil permeability (Figure 5.4). The data available on the effect of pH are not yet extensive enough to develop the third axis relation needed to refine this guideline. Because there are significant differences among soils in their susceptibilities in regard to equivalent threshold values of SAR for ESP and EC value of infiltrating water, this relation should only be used as a guideline in assessing effects of salts in infiltrating saline water into soil. The changing salinity levels and hydrological regime associated with irrigation and drainage schemes may alter the capacity of environment to assimilate water-soluble pollution. In addition to chemical fertilizers with different salt indices, the agricultural pesticides are a more common source of poisons associated with irrigation schemes. The municipal wastewater contains a variety of suspended and dissolved organic and inorganic solids from domestic and industrial sources including a number of potentially toxic elements. These all aspects need appropriate attention in management of water quality and environmental protection (FAO 1995).
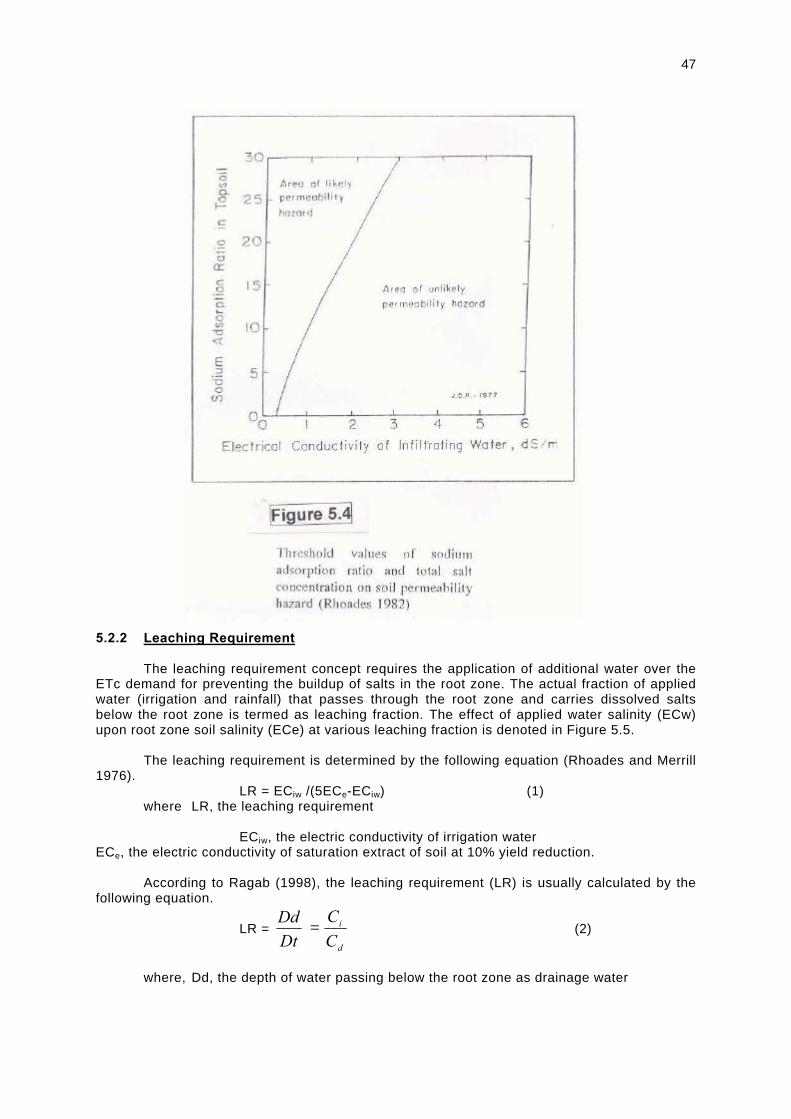
47
5.2.2 Leaching Requirement The leaching requirement concept requires the application of additional water over the ETc demand for preventing the buildup of salts in the root zone. The actual fraction of applied water (irrigation and rainfall) that passes through the root zone and carries dissolved salts below the root zone is termed as leaching fraction. The effect of applied water salinity (ECw) upon root zone soil salinity (ECe) at various leaching fraction is denoted in Figure 5.5.
The leaching requirement is determined by the following equation (Rhoades and Merrill
1976). LR = ECiw /(5ECe-ECiw) (1) where LR, the leaching requirement ECiw, the electric conductivity of irrigation water ECe, the electric conductivity of saturation extract of soil at 10% yield reduction.
According to Ragab (1998), the leaching requirement (LR) is usually calculated by the
following equation.
LR = d
i
CC
DtDd
= (2)
where, Dd, the depth of water passing below the root zone as drainage water
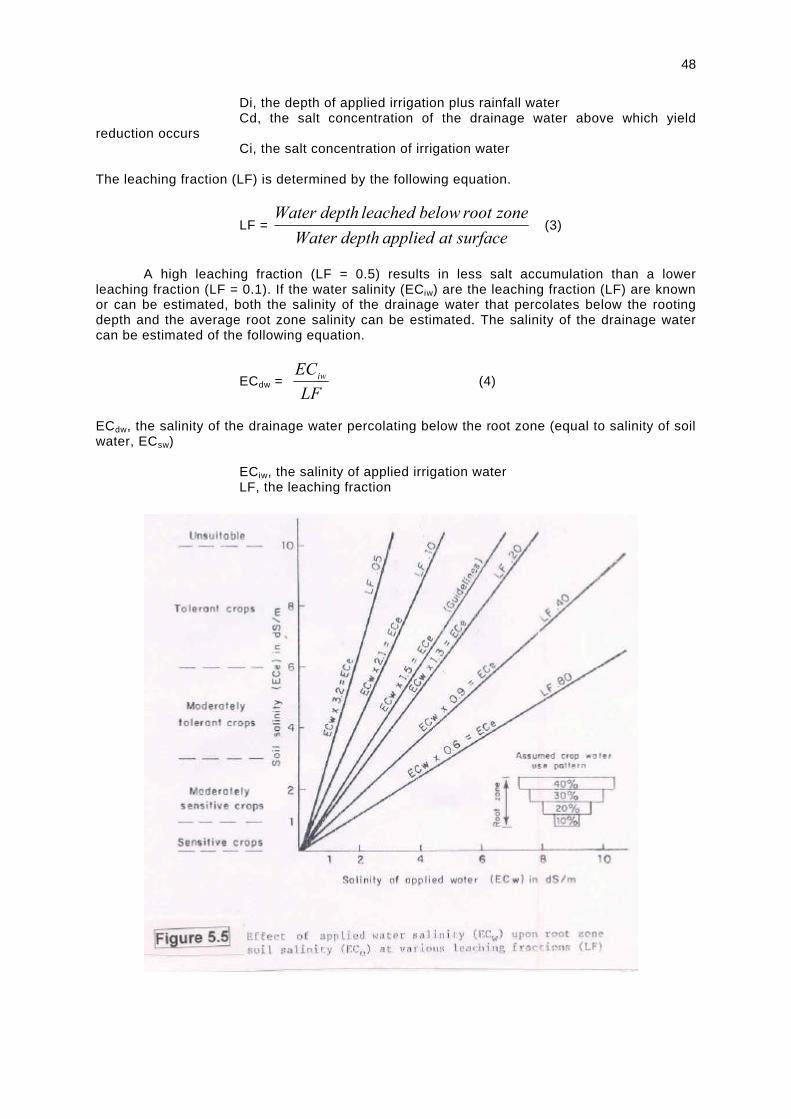
48
Di, the depth of applied irrigation plus rainfall water Cd, the salt concentration of the drainage water above which yield
reduction occurs Ci, the salt concentration of irrigation water
The leaching fraction (LF) is determined by the following equation.
LF = surfaceatapplieddepthWater
zonerootbelowleacheddepthWater (3)
A high leaching fraction (LF = 0.5) results in less salt accumulation than a lower leaching fraction (LF = 0.1). If the water salinity (ECiw) are the leaching fraction (LF) are known or can be estimated, both the salinity of the drainage water that percolates below the rooting depth and the average root zone salinity can be estimated. The salinity of the drainage water can be estimated of the following equation.
ECdw = LF
ECiw (4)
ECdw, the salinity of the drainage water percolating below the root zone (equal to salinity of soil water, ECsw) ECiw, the salinity of applied irrigation water LF, the leaching fraction
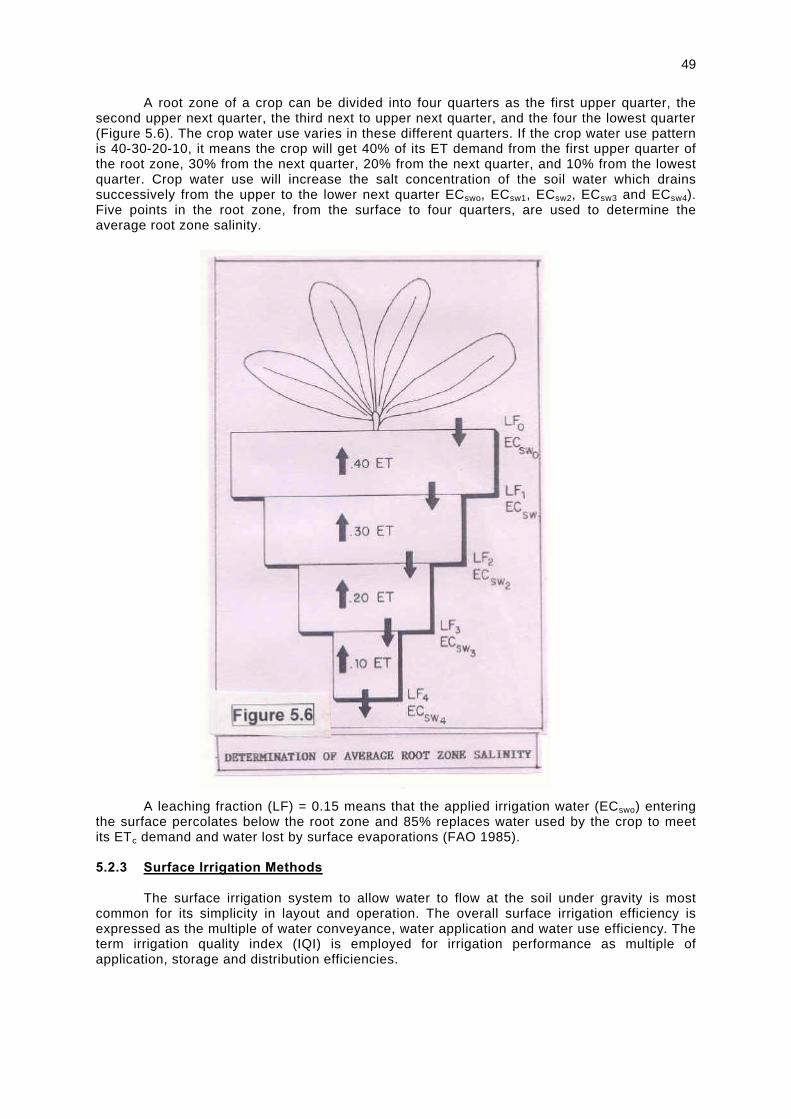
49
A root zone of a crop can be divided into four quarters as the first upper quarter, the second upper next quarter, the third next to upper next quarter, and the four the lowest quarter (Figure 5.6). The crop water use varies in these different quarters. If the crop water use pattern is 40-30-20-10, it means the crop will get 40% of its ET demand from the first upper quarter of the root zone, 30% from the next quarter, 20% from the next quarter, and 10% from the lowest quarter. Crop water use will increase the salt concentration of the soil water which drains successively from the upper to the lower next quarter ECswo, ECsw1, ECsw2, ECsw3 and ECsw4). Five points in the root zone, from the surface to four quarters, are used to determine the average root zone salinity. A leaching fraction (LF) = 0.15 means that the applied irrigation water (ECswo) entering the surface percolates below the root zone and 85% replaces water used by the crop to meet its ETc demand and water lost by surface evaporations (FAO 1985). 5.2.3 Surface Irrigation Methods The surface irrigation system to allow water to flow at the soil under gravity is most common for its simplicity in layout and operation. The overall surface irrigation efficiency is expressed as the multiple of water conveyance, water application and water use efficiency. The term irrigation quality index (IQI) is employed for irrigation performance as multiple of application, storage and distribution efficiencies.

50
In surface irrigation method, the uneven water distribution need not cause loss of crop under normal conditions of soil and water quality, but if the irrigation water is saline and the salt concentration approaches the level of plant tolerance, irregular water distribution in plant root zone causes serious salinity hazard (FAO 1988, Framji 1976). The local over irrigation with saline water results in greater salt accumulation and leaching of plant nutrients, and too little water causes higher salt concentration. In furrow or corrugation irrigation, water applied to the field moves towards the top of the ridge through capillary rise, causing salt accumulation in the ridge tops. The management of saline or sodic soil requires the ponding of larger depth of water at soil surface for longer duration, so that water can leach downward into the soil. The rectangular check basins with almost level soil surface and 30 to 50 cm high bunds are most suitable for ponding of water for leaching, and uniform water penetration (Stewart 1981, Gupta 1990, Hansen et al. 1980, Singh 1998). Saline soil ‘bed peaks’ can be de-topped to prevent exposure to emerging shoots. The double row beds shoulders are normally free of salt. The sloping beds are best suited (Rhoades 1998). The furrow irrigation with single row of seeds causes excessive leaching of salts that leads to leaching of nutrients. The quantity of salts that can be stored in the root zone before leaching and the leaching frequency requirements that should be applied are debatable issues (Hoffman et al. 1990). Generally leaching can be applied for each irrigation or less frequently such as seasonally or at even longer inter provided that the soil salinity level is kept below the threshold value. 5.2.4 Sprinkler Irrigation Methods The sprinkler irrigation system distributes water droplets over the land surface like rainfall through an integrated system of sprinklers, laterals, submains and main lines operated on pumps under adequate pressure energy (Oster et al. 1972).
The sprinkler irrigation is useful under the conditions of sandy soils with steep slope,
irregular topography and water scarcity. The sprinkler irrigation is advantageous because of: (1) water channels and bunds not required, (2) easy movement of farm machinery, (3) efficient application of fertilizers, pesticides, herbicides and fungicides, and (4) crop and soil cooling both possible (Singh 1998).
The salt accumulation is low in sprinkler irrigation as compared with surface irrigation
due to the controlled rate of water application. The water moves through micro-pores with sprinkler irrigation, whereas under surface irrigation much of water moves through cracks and macro-pores (Marsh 1974, Shathevet and Shainberg 1984, Daniel 1997). 5.2.5 Drip Irrigation Methods The chip irrigation system provides slow application of water in the form of discrete continuous drops, tiny streams or miniature sprays through mechanical devices of emitters, drippers or applications, located at selected points along small diameter water delivery tubes or lines. The water is applied in plant root area at a rate approaching water consumptive use. The irrigation water pumped into the drip irrigation system flows through valves, filters and laterals and then it is discharged almost at atmospheric pressure near the plants through point source (emitters, dripers, bubblers, microtubes and micro-sprinklers) or line source as porous tubes or perforated pipes. There is no movement of water at the soil surface. The flow regime is two or three dimensional and water holding capacity of soils is of less importance due to frequent irrigation. The drip irrigation is efficient in better management of saline or sodic waters (Ragab 1998). The drip water is applied frequently and continuously leaching the wet bulb where most of the roots are concentrated. The system maintains high matrix potential and low salt accumulation at the wetting front. The rooting zone has the lowest possible salinity and the leaching is not needed, except of the harvest and before the next crop is sown (Ragab 1998). The crop yields are higher with better water quality, reduced weed growth, uniformity of
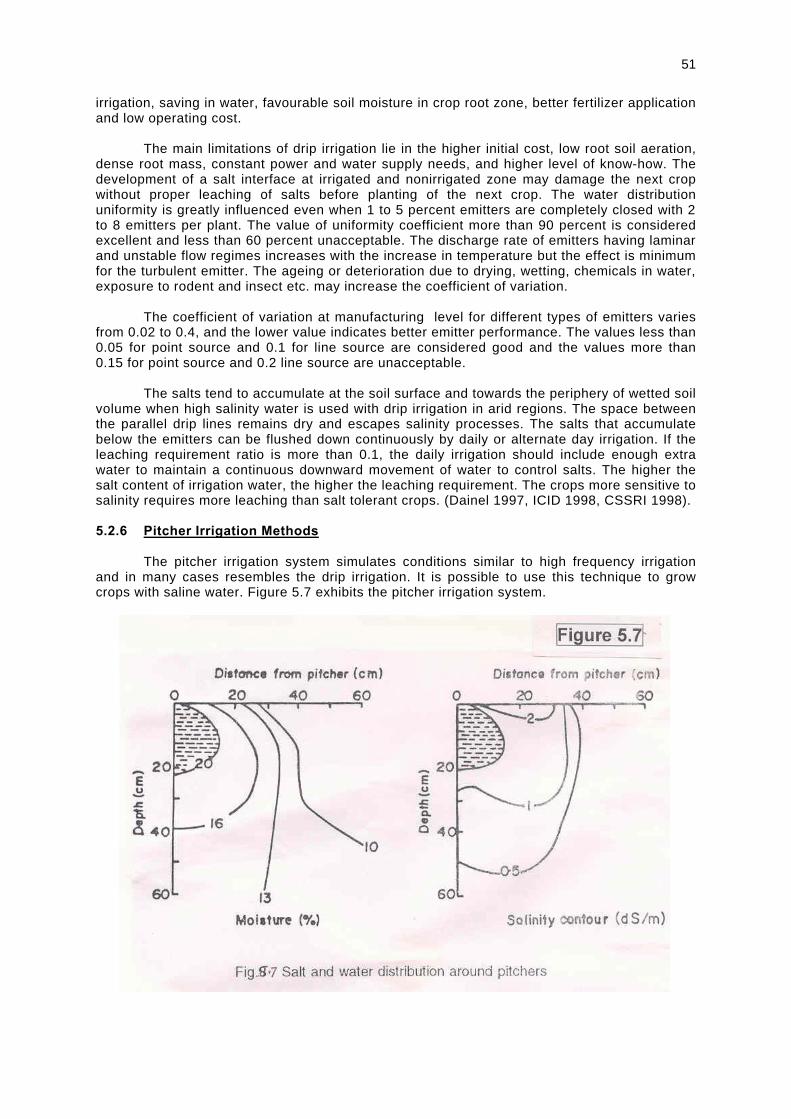
51
irrigation, saving in water, favourable soil moisture in crop root zone, better fertilizer application and low operating cost.
The main limitations of drip irrigation lie in the higher initial cost, low root soil aeration,
dense root mass, constant power and water supply needs, and higher level of know-how. The development of a salt interface at irrigated and nonirrigated zone may damage the next crop without proper leaching of salts before planting of the next crop. The water distribution uniformity is greatly influenced even when 1 to 5 percent emitters are completely closed with 2 to 8 emitters per plant. The value of uniformity coefficient more than 90 percent is considered excellent and less than 60 percent unacceptable. The discharge rate of emitters having laminar and unstable flow regimes increases with the increase in temperature but the effect is minimum for the turbulent emitter. The ageing or deterioration due to drying, wetting, chemicals in water, exposure to rodent and insect etc. may increase the coefficient of variation. The coefficient of variation at manufacturing level for different types of emitters varies from 0.02 to 0.4, and the lower value indicates better emitter performance. The values less than 0.05 for point source and 0.1 for line source are considered good and the values more than 0.15 for point source and 0.2 line source are unacceptable. The salts tend to accumulate at the soil surface and towards the periphery of wetted soil volume when high salinity water is used with drip irrigation in arid regions. The space between the parallel drip lines remains dry and escapes salinity processes. The salts that accumulate below the emitters can be flushed down continuously by daily or alternate day irrigation. If the leaching requirement ratio is more than 0.1, the daily irrigation should include enough extra water to maintain a continuous downward movement of water to control salts. The higher the salt content of irrigation water, the higher the leaching requirement. The crops more sensitive to salinity requires more leaching than salt tolerant crops. (Dainel 1997, ICID 1998, CSSRI 1998). 5.2.6 Pitcher Irrigation Methods The pitcher irrigation system simulates conditions similar to high frequency irrigation and in many cases resembles the drip irrigation. It is possible to use this technique to grow crops with saline water. Figure 5.7 exhibits the pitcher irrigation system.
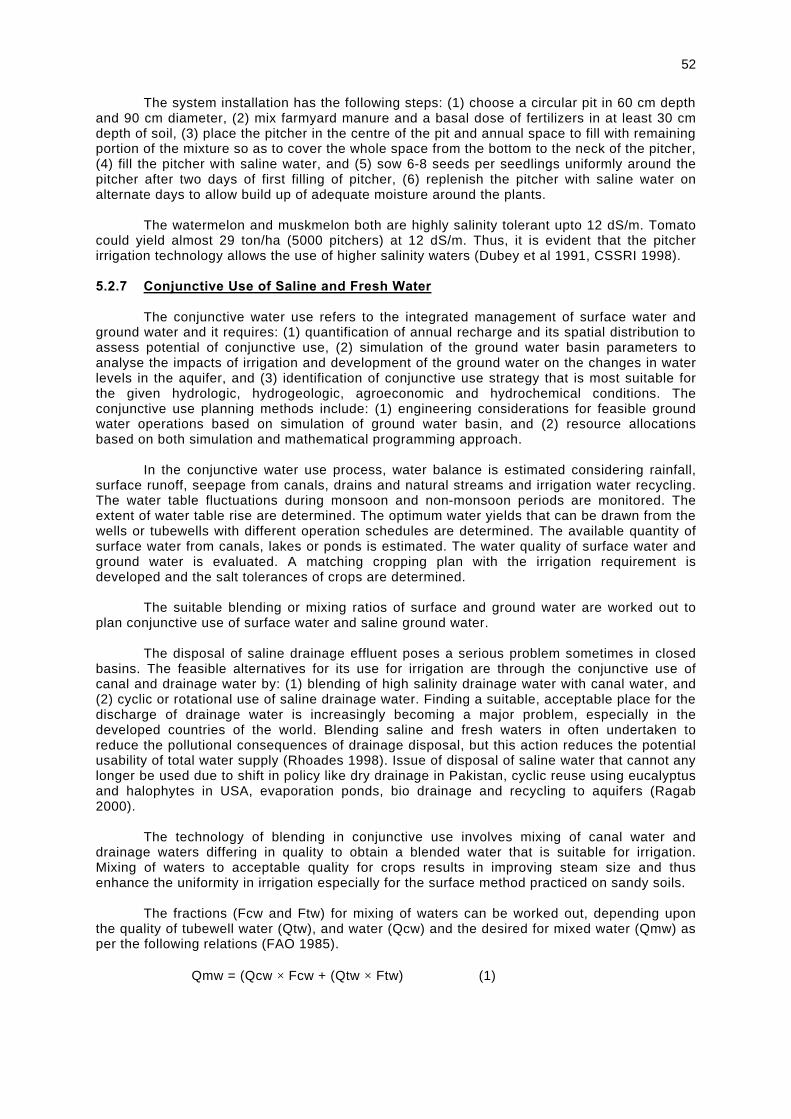
52
The system installation has the following steps: (1) choose a circular pit in 60 cm depth and 90 cm diameter, (2) mix farmyard manure and a basal dose of fertilizers in at least 30 cm depth of soil, (3) place the pitcher in the centre of the pit and annual space to fill with remaining portion of the mixture so as to cover the whole space from the bottom to the neck of the pitcher, (4) fill the pitcher with saline water, and (5) sow 6-8 seeds per seedlings uniformly around the pitcher after two days of first filling of pitcher, (6) replenish the pitcher with saline water on alternate days to allow build up of adequate moisture around the plants.
The watermelon and muskmelon both are highly salinity tolerant upto 12 dS/m. Tomato
could yield almost 29 ton/ha (5000 pitchers) at 12 dS/m. Thus, it is evident that the pitcher irrigation technology allows the use of higher salinity waters (Dubey et al 1991, CSSRI 1998). 5.2.7 Conjunctive Use of Saline and Fresh Water The conjunctive water use refers to the integrated management of surface water and ground water and it requires: (1) quantification of annual recharge and its spatial distribution to assess potential of conjunctive use, (2) simulation of the ground water basin parameters to analyse the impacts of irrigation and development of the ground water on the changes in water levels in the aquifer, and (3) identification of conjunctive use strategy that is most suitable for the given hydrologic, hydrogeologic, agroeconomic and hydrochemical conditions. The conjunctive use planning methods include: (1) engineering considerations for feasible ground water operations based on simulation of ground water basin, and (2) resource allocations based on both simulation and mathematical programming approach.
In the conjunctive water use process, water balance is estimated considering rainfall,
surface runoff, seepage from canals, drains and natural streams and irrigation water recycling. The water table fluctuations during monsoon and non-monsoon periods are monitored. The extent of water table rise are determined. The optimum water yields that can be drawn from the wells or tubewells with different operation schedules are determined. The available quantity of surface water from canals, lakes or ponds is estimated. The water quality of surface water and ground water is evaluated. A matching cropping plan with the irrigation requirement is developed and the salt tolerances of crops are determined. The suitable blending or mixing ratios of surface and ground water are worked out to plan conjunctive use of surface water and saline ground water. The disposal of saline drainage effluent poses a serious problem sometimes in closed basins. The feasible alternatives for its use for irrigation are through the conjunctive use of canal and drainage water by: (1) blending of high salinity drainage water with canal water, and (2) cyclic or rotational use of saline drainage water. Finding a suitable, acceptable place for the discharge of drainage water is increasingly becoming a major problem, especially in the developed countries of the world. Blending saline and fresh waters in often undertaken to reduce the pollutional consequences of drainage disposal, but this action reduces the potential usability of total water supply (Rhoades 1998). Issue of disposal of saline water that cannot any longer be used due to shift in policy like dry drainage in Pakistan, cyclic reuse using eucalyptus and halophytes in USA, evaporation ponds, bio drainage and recycling to aquifers (Ragab 2000). The technology of blending in conjunctive use involves mixing of canal water and drainage waters differing in quality to obtain a blended water that is suitable for irrigation. Mixing of waters to acceptable quality for crops results in improving steam size and thus enhance the uniformity in irrigation especially for the surface method practiced on sandy soils. The fractions (Fcw and Ftw) for mixing of waters can be worked out, depending upon the quality of tubewell water (Qtw), and water (Qcw) and the desired for mixed water (Qmw) as per the following relations (FAO 1985). Qmw = (Qcw × Fcw + (Qtw × Ftw) (1)
53
The SAR of mixed water (SARmw) can be calculated as per the following relation.
SARmw = [ ]
[ ] 21
)()(
)()(
twtwcwcwa
twtwcwa
FMgCaFMgC
FNaFN
×++×+
×+× (2)
An example for calculation of these parameters is given in Table 5.1.
Table 5.1
Example of calculation of different parameters of mixed water
Constituent Canal Water Tubewell Mixing ratio EC (dS/cm) 0.2 6.0 1:3 Ca 1.2 2.0 Mg 1.3 1.8 Na 0.6 50.0 Cl 0.6 43.0 HCO3 2.7 11.0 RSC - 7.2 SAR - 34.0 Calculations : Canal water Tubewell water
= (0.1 × 0.2) + (0.3 × 6) 1. ECmw
= 1.82 dS/m Canal water Tubewell water 2. RSCmw = (0.1 × 2.7 + 0.3 × 11) – (0.1 × 2.5 + 0.6 × 3.8) = 3.57 – 2.53 = 1.04 me/1 (0.1 × 0.6 + 0.6 × 50) 3. SARmw = 2/)8.36.05.21.0( ×+×
= 30 1.26 = 26.8 (mmol/1)½
5.2.8 Strategy in Blending and Cyclic Use of Saline Water Blending and cyclic use strategies have been adopted as a means of achieving conjunctive use of saline and fresh waters. Rhodaes (1998) stressed that blending of waters should be avoided for irrigation or disposal, and observed that water users will suffer less benefit in the “blending” philosophy of drainage water reuse and water quality protection. The practice of blending or diluting excessively saline waters with good quality water supplies should only be undertaken if the consideration is given as to how it affects the volumes of consumable water in the combined and separated supplies. The merit of blending should be evaluated on a case-by-case basis.
Rhoades (1992) has utilized the steady state salt balance theory to highlight the
advantage of cyclic use strategy over the blending mode strategy. But in the monsoon climatic conditions like in India and other countries, every year salt balance is in a dynamic state. Ragab (1998) observed that there are three strategies of using waters of different salinity levels: (1) water network dilution through blending and mixing of different quality waters, (2) soil water dilution through alternate (series/cyclic) use of good and poor quality waters according to water availability and crop needs, and (3) switching the use of water qualities during the growing season according to the critical stages of growth.
The best strategy of irrigation is to use the nonsaline water during the early sensitive
stage and the saline water during later stages of growth, provided two water sources of different salt concentration are available and crop is not sensitive to foliar drainage by salinity.
54
The network blending and the mixing of water in the soil profile have similar effect on yield and may be advantageous only with water of low to moderate salt content. Blending and cyclic use strategies have been adopted as a means of achieving conjunctive use of saline and fresh waters. In spite of several plus and minus points infavour or against each strategy, both are at par as long as the threshold salinity of the blended water is kept below a threshold salinity for the given crop. If this salinity is exceeded, then probably one needs to consider other plus and minus points. Both these strategies are widely used all over the world. Cyclic use is a favourable practice in USA, while blending is widely used in India, Pakistan, Egypt, Syria, Iraq, Iran and other countries of similar agroclimatic conditions.
5.2.9 Strategy for Drainage Measures in Saline Waterlogged Areas The waterlogging and salinity problem in irrigated agriculture is frequently associated with an uncontrolled rise in water table to the ground surface. The history records that several early civilizations based on irrigated agriculture eventually failed because irrigators did not know how to control salinity and waterlogging, and the land became barren.
The waterlogging and salinity problem is serious in Pakistan, Iraq, Iran, Afghanistan,
UAR, Syria (Euphrates valley), Egypt, China and India, and even in USA and Russia. The gradual deterioration of the land owing to waterlogging and salinity followed the introduction of perennial canal irrigation (FAO 1971). The waterlogged areas require efficient irrigation management and installation of proper drainage system which includes open drains, closed pipe drains and drainage wells. - Drainage is imperative in humid and subhumid areas, arid and semiarid irrigated areas, and in low lying coastal areas. In humid and subhumid areas, the main aim of the drainage is the removal of excess rainwater or surplus irrigation water and control of the ground water table. In arid and semiarid areas, the drainage aims to remove excess water applied during irrigation to ensure appropriate salt balance in the soil and to maintain a most suitable depth of the ground water table for agricultural crops. In low-lying coastal areas, there is virtually no dry land without drainage. Ø Surface Drainage The surface drainage system removes water before it enters into the soil. The system is simple to plan, design and construct and is less expensive. All possible excess water bondage should be removed before it percolates to he groundwater table to create and intensify a more expensive subsurface drainage system. The surface drainage system includes: (1) random drains when the topography is irregular with wet depressions scattered over the area, (2) parallel drains not necessarily equidistance when the topography is flat and regular, and (3) cross slope or diversion drains when the land is sloping and prevent accumulation of water from higher land. Ø Subsurface Drainage The subsurface drainage system consists of the buried tube drains or drainage wells installed to control or lower the high water table in an area. The subsurface drainage falls into two classes: (1) relief drainage consisting of field laterals, collectors and main drains, and (2) interception vertical drainage to intercept and reduce the flow and lower the flow line of the water in the problem area.
In subsurface horizontal drains the gradient required for water transport is about 0.01
percent in surface ditches and 0.1 percent in pipe drains. The buried drains may be fabricated from clay concrete, bitumenised fibre, metal, plastic plain or corrugated pipes. Layouts are classified into: (1) parallel, (2) herring bone, (3) double main, and (4) random network.
55
Drainage wells or tubewells with pumping sets comprise the vertical drainage system, which is suitable in flat land with shallow water table conditions in large area, absence of gravity drainage, need of water table lowering beyond 2.5 m and saline groundwater.
Ø Skimming Well Drainage Pumping ground water to meet increasing domestic, industrial and irrigation requirement is causing seawater intrusion in coastal areas and upconing of saline water in inland arid and semiarid irrigated areas. The ground water quality deteriorates due to intrusion and encroachment or upconing of saline ground water.
It is advantageous to skim of fresh water accumulated over the native saline ground
water through conventional shallow wells or some modified form of vertical drainage. Various skimming well configurations include single well, multi strainer well, radial
collector well, scavenger (compound) well, recirculation well, and hybrid well. Economic designs of skimming structures are required for adoption by small farmers. A ‘Doruvu’ skimming well technology has been developed in the coastal area of Andhra Pradesh, India (CSSRI 1998). 5.2.10 Saline Water Irrigation Planning and Management Models A couple of models are developed to predict long term behaviour of ground water, root-zone salinity index, desalinization of a tile drained soil profile, quality of ground water and drainage, efficient solute transport, crop water requirement and crop response models to simulate crop production. Some computer models are indicated as follows: SIWATRE Computer Model: It was developed in ILRI, the Netherlands for simulation of water management system in arid regions (unsaturated flow model) which has the components as sub-model design for water allocation to the intakes of the major irrigation canal, sub-models WDUTY for estimation of water requirement at farm level, sub-mode REUSE for the water losses to the atmosphere, and WATDIS sub-model for water distribution within the command. SGMP Computer Model : It was developed in ILRI, the Netherlands as a numerical ground water simulation model to quantify the amount of recharge from the top system to the aquifer and its spatial variation and to assess its effects on water table depths. SALTMOD Computer Model : It was developed in ILRI, the Netherlands to predict long term effects of ground water conditions, water management options, average water table depth, salt concentration in the soil, ground water use, drain and well water yields, dividing the soil-aquifer system into four resources surface reservoir, soil reservoir (root zone), an intermediate soil reservoir (vadose zone), and a deep reservoir (aquifer). UNSATCHEM Computer Model: It was developed in US Salinity Laboratory in USA and is one dimensional solute transport model, which simulates variably saturated water flow, heat transport, carbon dioxide production and transport, solute transport and multi-component solute transport with major ion equilibrium and kinetic chemistry. UNSATCHEM package may be used to analyse water and solute movement in the unsaturated, partially saturated, or fully saturated porous media. Flow and transport can occur in the vertical, horizontal, or in an inclined direction. This package is a good tool to understand the chemistry of unsaturated zone in case of saline water use and development of analytical model to predict the changes in ground water and soil quality. SWASALT/SWAP Computer Model: It was a package on an extended version of SWATRE model. The depth and time of irrigation applied, quality of irrigation water used, soil type and initial soil quality can be modified and the effects on crop performance, soil salinization and desalinization process, soil water storage (excess/defecit) can be obtained from the model output.
56
WATSUIT Computer Model: It was developed in US Salinity Laboratory USA is a transient state model and is used for assessing water suitability for irrigation which can incorporate the specific influences of the many variables that can influence crop response to salinity, including, climatic, soil properties, water chemistry, irrigation and other management practices. CROPWAT Computer Model: It was developed to calculate crop water requirement and irrigation water requirement including irrigation schedules for different management conditions and calculation of water supply scheme for different cropping patterns (FAO 1992). CLIMWAT program is available to obtain the required climatic data for CROPWAT (FAO 1991). 5.3 Soil Management The suitability of soils for cropping depends heavily on the readiness with which they conduct water and air (permeability) and on aggregate properties which control the friability of the seedbed (tilth). Poor permeability and tilth are often the major primary problems in irrigated land. A build-up of soluble salts in the soils may influence their behaviour for crop production through changes in the proportions of exchangeable actions, soil reactions, physical properties and the effects of osmotic and specific ion toxicity. Salt related properties of soils are subject to rapid change. Salt affected soils under the influence of two common types of salts (neutral and alkali salts) on soil properties and plant growth, are broadly grouped as: (1) saline soils, and (2) alkali soils (Szabolcs 1989, Abrol 1982, Kovda 1983, FAO 1992). Saline soils formed under the influence of NACl, CACl, MGCl, and sulphates are low characterized by pH (> 8.5) and low ESP (< 15). Alkali or sodic soils formed under the influence of Na2 CO3 and Na HCO3 are characterized by high pH (>7.85) and excess exchangeable sodium percentage (ESP > 15) throughout the soil profile and adverse soil physical properties in saline soils when chlorides and sulphates of Ca and Mg are the predominant salts. The SAR usually remains less than 15, Predominance of Na invariably results in soil solution SAR > 15, such soils are termed as saline-sodic soils. 5.3.1 Soil Degradation Rhoades (1993) has reported that the world is loosing at least 3 ha of arable land every minute to soil salinization (about 1.6 Mha per year), second only to erosion as the leading worldwide cause of soil degradation. About 43 Mha. of irrigated land in the world’s dry area are affected by various processes of degradation, mainly waterlogging, salinization, and alkanization. The world is losing about 1.5 Mha of irrigated land each year due mainly to salinization. Ghassemi, et al (1975) reviewd and estimated that about 20% of the total estimated 227 Mha of irrigated land (45.4 Mha) are salt affected. Serious salt related problems occur in at least in 75 countries, which include Australia, China, Egypt, India, Iraq, Mexico, Pakistan, former Soviet Union, Syria, Turkey, and United States. Soil Map of the world (Mashli 1995) depicts that 83.4 Mha of land area in the near East region (not necessary arable land) is salt affected, mostly affected by human induced soil salinization. Salt affected soils occur extensively under natural condition while the majority of soil degradation problem through the world is caused due to inefficiency in the distribution and application of irrigation water and poor drainage management. In fact the interception of drainage waters percolating below root zones and their reuse for irrigation should reduce the soil degradational processes associated with excessive deep percolation, salt mobilization, waterlogging and secondary soil salinization that typically operate in irrigated lands (FAO 1992). The soil taxonomy classifies different soils as Aridisol and Entisol (dessert soils), Entisols and Inceptisols (alluvial soils), vertiosls and their association (black soils) and Alisols, Oxisoles, Ultisols, Inceptisols etc. (laterite soils). Aridisols, Entisols and Inceptisols under irrigated agriculture in arid and semiarid areas world over are mostly under the influence of secondary soil salinization.
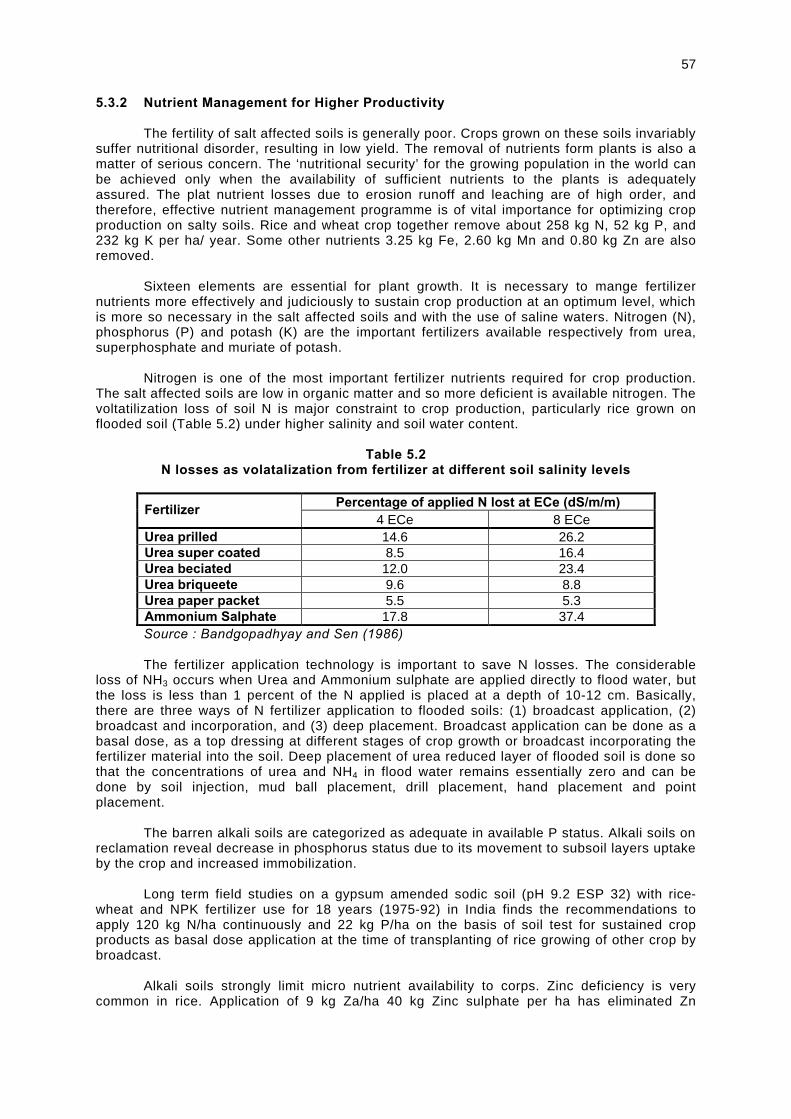
57
5.3.2 Nutrient Management for Higher Productivity The fertility of salt affected soils is generally poor. Crops grown on these soils invariably suffer nutritional disorder, resulting in low yield. The removal of nutrients form plants is also a matter of serious concern. The ‘nutritional security’ for the growing population in the world can be achieved only when the availability of sufficient nutrients to the plants is adequately assured. The plat nutrient losses due to erosion runoff and leaching are of high order, and therefore, effective nutrient management programme is of vital importance for optimizing crop production on salty soils. Rice and wheat crop together remove about 258 kg N, 52 kg P, and 232 kg K per ha/ year. Some other nutrients 3.25 kg Fe, 2.60 kg Mn and 0.80 kg Zn are also removed. Sixteen elements are essential for plant growth. It is necessary to mange fertilizer nutrients more effectively and judiciously to sustain crop production at an optimum level, which is more so necessary in the salt affected soils and with the use of saline waters. Nitrogen (N), phosphorus (P) and potash (K) are the important fertilizers available respectively from urea, superphosphate and muriate of potash. Nitrogen is one of the most important fertilizer nutrients required for crop production. The salt affected soils are low in organic matter and so more deficient is available nitrogen. The voltatilization loss of soil N is major constraint to crop production, particularly rice grown on flooded soil (Table 5.2) under higher salinity and soil water content.
Table 5.2
N losses as volatalization from fertilizer at different soil salinity levels
Percentage of applied N lost at ECe (dS/m/m) Fertilizer 4 ECe 8 ECe
Urea prilled 14.6 26.2 Urea super coated 8.5 16.4 Urea beciated 12.0 23.4 Urea briqueete 9.6 8.8 Urea paper packet 5.5 5.3 Ammonium Salphate 17.8 37.4 Source : Bandgopadhyay and Sen (1986)
The fertilizer application technology is important to save N losses. The considerable loss of NH3 occurs when Urea and Ammonium sulphate are applied directly to flood water, but the loss is less than 1 percent of the N applied is placed at a depth of 10-12 cm. Basically, there are three ways of N fertilizer application to flooded soils: (1) broadcast application, (2) broadcast and incorporation, and (3) deep placement. Broadcast application can be done as a basal dose, as a top dressing at different stages of crop growth or broadcast incorporating the fertilizer material into the soil. Deep placement of urea reduced layer of flooded soil is done so that the concentrations of urea and NH4 in flood water remains essentially zero and can be done by soil injection, mud ball placement, drill placement, hand placement and point placement. The barren alkali soils are categorized as adequate in available P status. Alkali soils on reclamation reveal decrease in phosphorus status due to its movement to subsoil layers uptake by the crop and increased immobilization.
Long term field studies on a gypsum amended sodic soil (pH 9.2 ESP 32) with rice-
wheat and NPK fertilizer use for 18 years (1975-92) in India finds the recommendations to apply 120 kg N/ha continuously and 22 kg P/ha on the basis of soil test for sustained crop products as basal dose application at the time of transplanting of rice growing of other crop by broadcast. Alkali soils strongly limit micro nutrient availability to corps. Zinc deficiency is very common in rice. Application of 9 kg Za/ha 40 kg Zinc sulphate per ha has eliminated Zn

58
deficiency in rice grown on gypsum pyrites, farm yard manure (FYM) and rice husk treated alkali soils. It has also raised the Zn status to meet requirement of subsequent 2-3 crops. The continuos submerged conditions of rice crop favour greater mobilization of native and applied fertilizer nutrients and their uptake. The nutrient management for wheat and other upland crops like barely, bajra, linsed, chilli and cotton is difficult in wet land conditions. These crops are sensitive to waterlogging which is a common phenomena is sodic and heavy textured coastal and other saline soils. The integrated nutrient management is crucial in future because of increasing complexities of nutritional problem and environmental hazards.
5.3.3 Management of Seedbeds and Grading Fields to Prevent Accumulation of Salinity Salts tend to accumulate under furrow irrigation in the raised beds or ridges where water flows converge and evaporates, and salts tend to accumulate progressively towards the surface of the raised bed or ridges. This problem is magnified when a single row of seeds is planted in the central position of the raised beds or ridges, and the saline water is used for irrigation (Brenstein 1964). Excessive salt accumulation can be greatly damaging to germination and seedling establishment. The seedbed shape, seed location and irrigation procedures along with appropriate field grading should be managed to minimize or prevent excessive localized accumulation of salts (Rhoades 1998, FAO 1992). The decapping techniques is used for modification of the raised beds of ridges into double row flat- topped beds with shoulders on both sides. The seeds can be safely planted on the slope below the zone of high salt accumulation. Figure 5.8 illustrates the salt accumulation process in the single and double row beds and the sloping bed. Planting in furrows or basins is satisfactory from the point of view salinity control but can be unfavorable for the emergence of many row crops due to crusting and poor aeration. Pre-emergence irrigation by sparkles or chip lines placed close to the seed is used to keep the soluble salts concentration low in the seedbed during germination and seeding establishment. Special temporary furrow is used in place of drip lines. Establishment of seedling and new furrows are made between the rows. In case of the sodic soils, to maintain good tilth the chemical amendment (gypsum) or green maturing is used.
59
The grading of land is essential to make uniform application of water to achieve better salinity control especially when the irrigation is practiced by flood or furrow irrigation method. Barren or poor areas need careful land grading. In the case of perennial crops, planting is doubled after land grading for one or tow years and in intervening period annual crops can be grown and fill area allowed to settle prior to grading for the perennial planting. 5.3.4 Monitoring of Soil Salinity Periodic collection of data and information on soil salinity is a more meaningful measure of salt status and trend then traditional indirect methods. The Salt Balance Index (SBI) and Leaching Requirement (LR) estimated by indirect methods do not provide the absolute level of salinity within the root zones of any crop of specific field within on irrigated target area. The trend of salinity towards an increase or decrease should be known periodically. The effectiveness of irrigation and drainage design and of water table and salinity control management can better be achieved by the periodic collection of information on soil salinity level and distribution within the crop root zones and project area, regularly desired in the field rather than solely depending upon LR and SBI concepts. 5.3.5 Special Soil Management Measures Some special soil management measures (physical, chemical and biological) help facilitate the safe use of saline water in crop production: (1) tillage, (2) deep ploughing, (3) sand mixing, (4) chemical amendments to decrease ESP and SAR, (5) timing and placement of mineral fertilizers, (6) organic and green manures and mulching, (7) operating delivery system efficiently, and (8) irrigating efficiently (FAO 1992). Tillage is a mechanical operation that helps adequate preparation of seed bed, improvement in soil permeability, breaking surface crust, and improve rate of infiltration. Deep ploughing from 40 to 150 cm is most beneficial on stratified soils with intermittent impermeable layers to loosen the aggregates (60 cm), improve physical conditions of soil layers and increase soil water storage capacity. Sand mixing helps improve soil texture of fine soils permitting higher air and water permeability and deeper root penetration, which facilitates leaching by saline sodic water. Chemical treatment of gypsum helps to neutralize soil reaction, to react with sodic soils and decrease ESP of soil and SAR of irrigation water. Gypsum results with calcium carbonate in sodic soil and replaces exchangeable sodium by calcium. Calcium chloride can be a satisfactory amendment when added to irrigation water. Timely application of mineral fertilizers facilitates the safe use of saline water. Type of fertilizer should preferably be arid and contain Ca rather than Na taking into consideration complementary presence of anions. Application of organic and green manures and multching into the saline sodic soils with high SAR facilitates improvement of soil permeability and release of carbon dioxide and certain organic acids during decomposition. This will help lowering of pH, releasing calcium by solubilization of CaCO3 and other minerals, and replacement of exchangeable Na by Ca and Mg which lowers the ESP. Over irrigation must be avoided in the use of saline water for irrigation to check he salinity buildup, drainage requirement and rise in water table and waterlogging Hence, water delivery and distribution system must be operated efficiently to facilitate the irrigation water supply in right quantitative at right times. Timing and amount of water applied to the root zone should be carefully controlled to obtain good water use efficiency and crop yield, especially, irrigating with saline water (FAO 1972 and 1992).
60
5.4 Crop Management Crop production function using particular irrigation water can range from 100% down to zero but there are often other factors than water quality which affect crop yield. Osmotic and toxic effects of salts restrict the crop growth and crop yield potential. Plants extract water from the soil by exertering an absorptive force greater than that which holds the water to the soil (surface tension). If the plant cannot make sufficient internal adjustment and exert enough force to uptake water from the soil, it is not able to extract sufficient water and will suffer “water stress”. This happens when the soil becomes too dry or soil contains salty water. The additional force to he exerted by plants is referred as the osmotic effect or ‘osmotic potential’ of plants.
The plants can extract and use more water from the salt free soil than from the salty
soil. Salts have an affinity for water. If water contains salts, more energy per unit of water uptake must be expended by the plants to absorb relatively pure water from a salty soil water regime. The added energy required by plants to absorb water from the salty soil (soil osmotic potential) is additive to the energy required to absorb water from a salt free soil (soil water potential). Not all growth depression of plants can be ascribed to the effect of osmotic pressure of the soil solution and decrease of moisture availability. Salinity may also affect the plants by the toxicity of specific salt, either through its effect surface membrane to plant roots or in the plant tissues or through its effect on intake or metabolism of essential nutrients. Toxicity occurs within the plants themselves and is not caused by water deficit. Toxicity often accompanies or complicates a salinity or infiltration problem although it may appear even though salinity is low. In addition to sodium, chloride and boron, many trace elements are toxic to plants at very low concentration like arsenic (As), cadmium (Cd), copper (Cu), manganese (Mn), nickel (Ni), lead (Pb), selenium (Se), vanadium (V), and Zinc (Zn), Overhead sprinkling of sensitive crops can cause toxicities not encountered, while irrigating by surface methods changes in micro biological processes too take place under saline water irrigation. The soil salinity may be a main limiting factor, but other factors may also limit crop production or modify crop salt tolerance. These factors may include: (1) climate, (2) production potential of soil with level of soil fertility, soil structure, aeration capacity, and intensity of soil moisture regime, (3) crop plant variety and growth stages, (4) crop cultural practices, and (5) application of irrigation methods. The crop management is an important aspect in addition to water management and soil management to obtain optimum crop production by irrigation with saline water. 5.4.1 Crop Tolerance to Salinity Crop plants greatly vary in their ability of germinate, develop and produce yield under saline environment. Some crops are very sensitive to salinity, while others are very tolerant. Figures 5.9 and 5.10 demonstrate that the effect of salinity adversely affects the water availability to crops and the relative effect of salinity increase on plants. It is the crops sensitivity or tolerance to salinity which defines the salinity of soil or soil water. A soil may be too saline for one crop but quite suitable and productive for another crop. Salt tolerance of many crops are determined in various developed and developing countries, facing the problem of salinity, under variety of conditions. Mass and Hoffman of the US salinity laboratory, Riverside, California, USA summarized the worldwide literature on salt tolerance of selected crops and their yield potential as influenced by irrigation water salinity (ECiw) or soil salinity (ECe). They presented the information in standard tabular forms, giving the salinity at which crop yield begins to decline (threshold values) and rate of crop yield decline with increased salinity.
The divisions for relative salt tolerance ratings of agricultural crops are shown in Figure
5.11 (Mass 1984). Shannn et al (1997) have shown the relative crop yields of barley, wheat, corn and bean on the diagram (Figure 5.12).
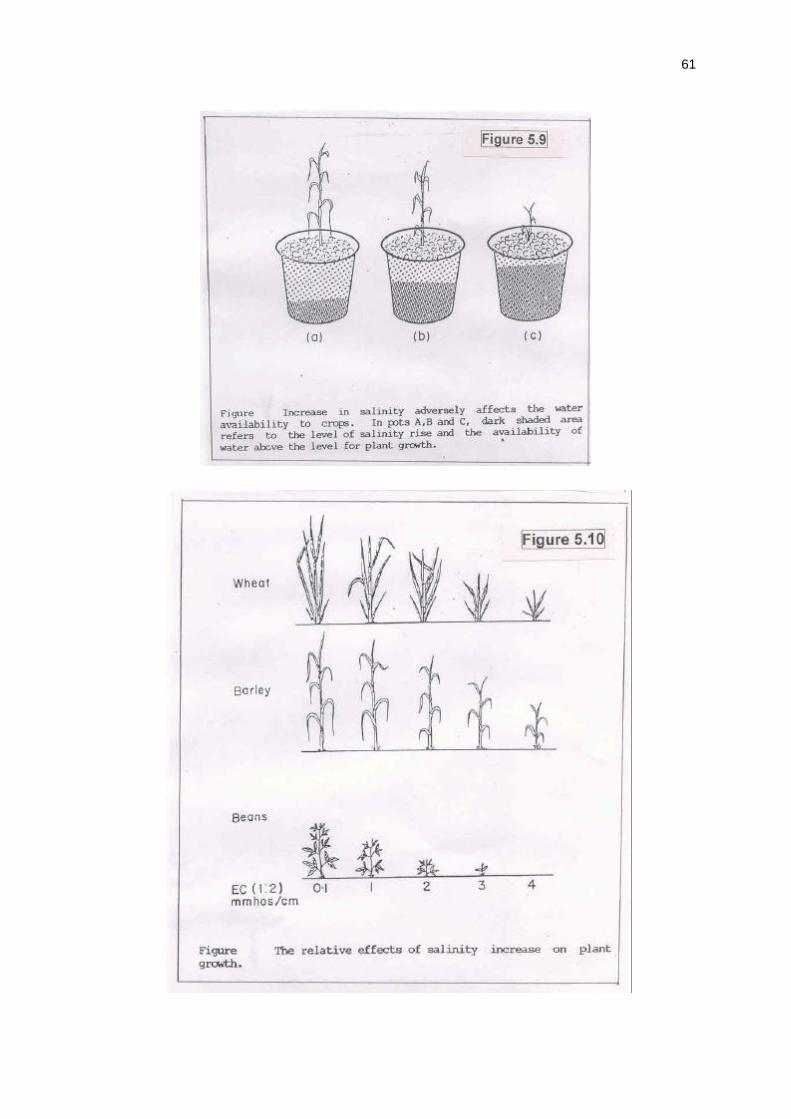
61
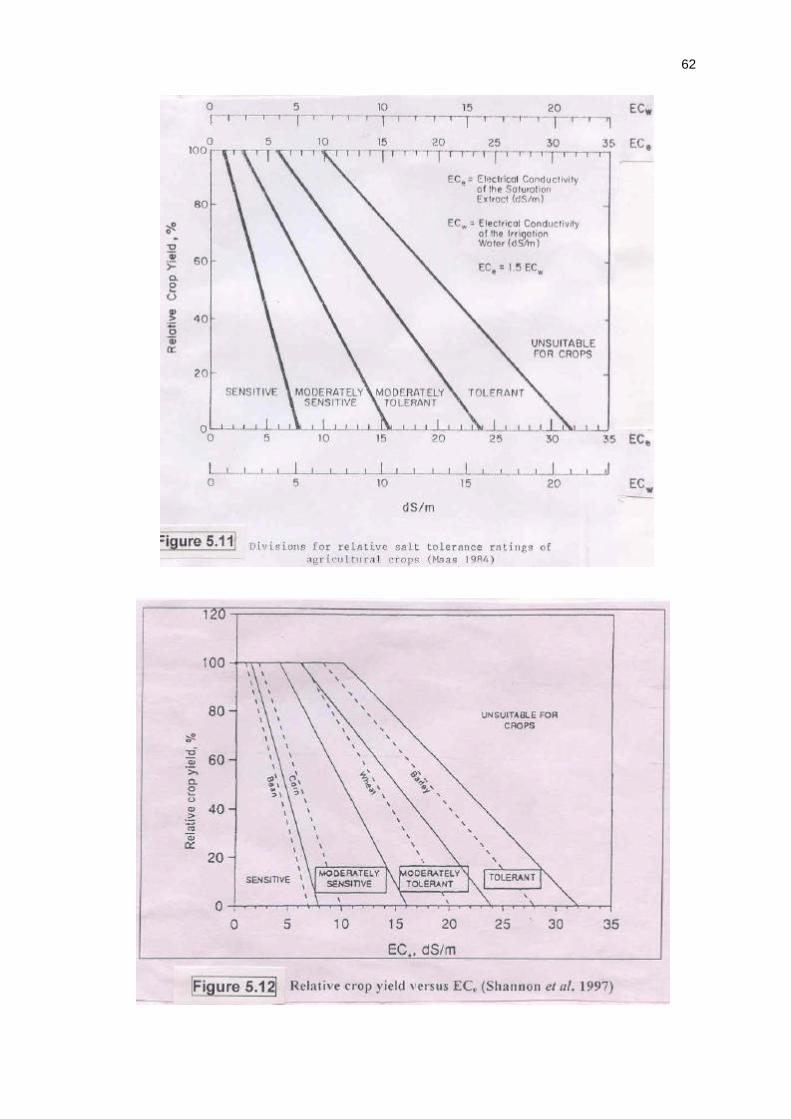
62
63
The general equation describing the response of plant yield to salinity is in the following form (FAO 1985). Y = 100 – (ECe-a) b (1)
ECe, the soil salinity expressed as the electric conductivity of the saturation extract (1:2) in dS/m a, the threshold salinity for 100% yield potential b, the increased salinity value or yield loss per unit increase in salinity The value of (b) can be determined from the equation in the following form.
b= yieldatECyieldatEC ee %100%0
100−
(2)
The ECe values for different percentages of crop yields outer than those associated with 100% yield are calculated from the yield equation of Mass and Hoffman (1976) by rearranging equation (5) in the following form.
ECe = b
yab −+100 (3)
where, ECe, the soil salinity associated with a designated percent yield (Y) As a general rule of thumb, at a 15-20% leaching fraction, the salinity of the applied irrigation water (ECiw) can be used to predict or estimate soil water salinity (ECsw) or soil salinity (ECe) using the following equation (average at water use pattern of 40:30:20:10). ECsw = 3 ECiw (4) ECe = 1.5 ECiw (5) ECsw = 2 ECe (6) If irrigation practices result in greater or less leaching than the 15-20% LF assumed above, a more correct concentration factor can be calculated using a new estimated leaching fraction under a specified crop water use pattern. Figure 5.5 provides the relative salt tolerance ratings of agricultural crop (ECe) assigned based upon best judgment from field experience and observation (Mass 1984). Mass (1984) grouped the relative crop salinity tolerance rating in terms of soil salinity (ECe) at which yield loss begins given in Table 5.3.
Table 5.3
Relative crop salinity tolerance rating
Relative crop salinity tolerance Soil salinity (ECe) at which yield loss begins, dS/m
1. Sensive Less than 3 2. Moderately Sensitive 1.3-3 3. Moderately tolerant 3-6 4. Tolerant 6-10
5.Unsuitable unless reduced yield acceptable
More than 10
Source : Mass (1984) 5.4.2 Climate Variation Plant tolerance may be strongly affected by climate variables. Climatic factors: temperature, humidity and rainfall may interact with salinity so that tolerance levels reported from one location may not be applicable under other conditions, although these is general
64
agreement in the world as to the relative tolerance of many crops (Framji 1976). High temperature decreases the salt tolerance of crops; some of them are alfalfa, bean, beet, carrot, cotton, onion and tomatoes. Higher atmospheric humidity tends to increase somewhat the tolerance of crops as reported in USA, India, Near East and other countries. Rainfall, though does not have a direct effect on crop tolerance, may indirectly affect by leaching the response of plants to irrigation with saline water. 5.4.3 Crop Growth Stages and Varietal Differences Plants are more sensitive during the early growth period than at later stages (germination, emergence, seedling). The salt tolerance increases as the plant advances towards maturity. The saline waters considered unacceptable in early stages of plant growth could be used profitably during later stages of growth without any reduction in crop growth (CSSRI, 2000). Rice is sensitive at seedling and flowering stages. Sugarbeet is tolerant at later growth stages but is sensitive during germination stage. Corn is tolerant at germination but is more sensitive at seedling, growth, ear and grain yield stages. All India coordinated Research Project (AICRP) under Indian Council of Agriculture Research (ICAR) found in saline water conditions at Baptala 24% yield reduction in rice two days after transplanting followed by at fillering stage 17%, in onion yield reduction 78% with saline water irrigation at transplanting stage followed by 56% at bud formation stage and 18% at bulb development stage, in clusterbean 12% yield reduction at pod development stage; at Dharwad in maize about 13% yield reduction at sowing stage followed by 7% at tasseling stage and at Agra in safflower yield reduction was found at 21% at germination stage followed by 7% at rosette stage. Varietal difference among crops may cause strong differences regarding salt tolerance among varieties and root stocks of fruit trees and vine crops. Tolerant plants require multiple adaptations to enable them to grow in saline environments. The problem faced by plant scientist wishing to enhance tolerance in crop plants is how to manipulate complex multigenic traits. The research work needs to be aimed at basic information about the genetic of physiological traits and attempts to discover genes regulating salt tolerance following the imposition of salinity stress and understating signaling cascades. Modern molecular techniques can be used to analyze the genetics of quantitative traits determined by quantitative traits loci (QTLS) developing practical makers and map their positions for positional cloning to discover genes. The use of DNA-based technology is capable of dealing with large number of samples, markers may be a valuable means of assisting in the development of salt tolerance in plants. The molecular biological approaches may be helpful to enhancing salt tolerance (CSSRI 1993). 5.4.4 Crop Selection Crop selection is an important management decision. The most desirable characteristics in selecting crop for irrigation with saline water are: (1) high marketability (2) high economics value, (3) ease of management (4) tolerance to salts and specific ions, (5) ability to maintain quality under saline conditions, (6) low potentional to accumulate trace elements, and (7) compatibility in crop rotation (Grattan and Rhoades 1990 – Tanji 1994). Other factors in crop or their evaporative demands are lower at planting stage. 5.4.5 Cultural Practices Many factor that facilitate the use of saline water are related to management practices for short and long term salinity control. Adequate drainage and leaching to control salinity within the tolerances of the crops (or change to more salt tolerant crop that require less leaching for adequate salt control) are the ones most appropriate management practices for long term salinity control but there are separate cultural practices that can have a profound effect upon germination, early seeding growth and ultimately on yield of crop. The short term cultural practices that facilitates salinity control become more important as the irrigation water salinity increase over the time. These practices are adopted on annual or continual basis.
65
The cultural practices in relation to crop management too include certain management practices common as adopted in the case of water and soil management. These are described as: (1) seed treatment, (2) land smoothening and grading, (3) plant population and placement, (4) fertilization, (5) irrigation dose and frequency, (6) timing of irrigation and, (7) methods of irrigation. These are cultural practices as salinity control alternatives are required each year or for each crop and are another set of management technique to improve existing soil conditions permanently, those land development or as an aid to deterioration of deteriorated land. These alternatives for salinity include: (1) land grading, (2) integrated surface and subsurface drainage, (3) deep cultivation, (4) ponding or reclamation leaching and, (5) cyclic change or blending of water supplies. 5.5 Management Issues on Saline Water Use Salinity is a major increasing problem in irrigated areas worldwide and although much efforts have been made for the development of saline water resource, salt tolerant crops and irrigation methods, there has been little impact on farmers’ fields. Large amount of laboratory research and on farm applied and adaptive research activities have been executed in number of developed and developing countries, especially the USA, Australia, India, China, former USSR (Russia), Africa, Turkey, Cyprus, Jordan, Israel, Lebanon, Sudan, United Arab Republic, (UAR) and Republic of Yemen. The countries of Malaysia, Indonesia, Thailand and Philippines have also involved in certain activities on salinity control. The state-of-the-art document on saline water management for irrigation identifies some latest development in the field of salinity resources and describes some significant issues on water, soil, crop and human management technologies related to use of saline water and salt affected soils. The translation of research findings into area specific acceptable solutions is an enormous challenge to which researchers, modelers, planners, and field development and implementing agencies should rise in pursing the sustainable and higher agricultural production for ever increasing population in the world. Ø Water Management: In the water management field, the challenges are as follows:
• To prevent waterlogging and salinity and to increase the efficiency and uniformity of
irrigation water application. • To make cost-effective seepage control from canals and distributaries. • To monitor real time water quality and measures to control salinity and contamination
and to develop technology for estimation of shallow ground water contribution to crop evapotraspiriation (ET) under saline conditions.
• To explore suitable measures to minimize demand for irrigation water and drainage requirement.
• To make reuse of drainage water in irrigation. • To develop precise land grading equipments to be employed for small land holding. • To develop appropriate water harvesting technologies to facilitate multitier cropping. • To develop shallow skimming well designs, and • To develop and refine water management models including solute transport elements
and to improve water production functions. Ø Soil Management: In the soil management field, the challenges are as follows:
• To effect efficiency of applied nitrogen and deep placement of area in appropriate soil
water plant relation, so as to improve N harvest index. • To minimize micro nutrient deficiencies. • To improve overall effective fertilization of soils. • To mitigate the effects of toxic ions on plants. • To determine precisely the effects of soil salinity on micro-nutrients uptake and
utilization. • To make suitable fertilization for increasing soil organic C and N. • To maximize use of bio-fertilizers, and
66
• To improve soil water potential. Ø Crop Management: In the crop management, the challenges are as follows:
• To enhance salinity tolerance of plants. • To make technological break down in screening/breading of salt tolerant verities of
plants. • To evaluate crop rotations requiring less amount of chemical amendments. • To rationalize cropping pattern for saline waterlogged areas and dry land areas of
saline water use. • To determine extent to which transpiration rate (TR) can be manipulated. • To develop irrigation methods for higher water use efficiency (WUE). • To improve the conventional cultural practices, and • To enhance crop production function.
Ø Participatory Management: In participatory resource management the challenges are
as follows:
• To forge new management partnership by farmers and government agencies for improving the productivity and cost efficiency of irrigation and drainage investments.
• To transfer irrigation and drainage management from a centralized government agency to a local level of government, a public utility or some kind of private sector organization in the form of a farmer water user association, an irrigation district, a mutual company, a private company, or a controller.
• To develop and effectively manage the service of water delivery and drainage for farming with sustainable water rights, compatible irrigation infrastructure, clear management responsibilities and authority, adequate resource, and accountability and incentives.
• To convert resources into service entailing the operation, maintenance, and management of the system and to finance the system and settle the disputes.
• To deliberate upon the objectives among a large member of participatory elements about improved cost recovery, better operation and maintenance, higher water use efficiency, relief of management and financial burden, improved irrigation and drainage service quality, sense of ownership, greater conflict resolution capabilities, enhanced sustainability, transfer of water rights and improved farm income.
The World Bank (1996) defines participation as the involvement of water resource users in all aspects and all levels of management. All aspects include planning, design, construction, operation and maintenance, financing and policy matters. All levels include tertiary, secondary, primary system level, project and sector level. In coming days, we will have to value the true worth of fresh water, saline water, drainage water, and wastewater. Very appropriately this situation can be described in the words of English poet Lord Byron Who said about two centuries ago that, “Till taught by pain – Men really know no water’s worth”. 5.6 Peoples Participation in Saline Water Management There is a wide gap of knowledge level between functionaries and farmers. The land drainage projects are much expensive ventures and so also the use of saline water for irrigation is a complex project frame needing adequate knowledge at farmers level. The voluntary participation of farmers is essential in saline water management. Many of the irrigation and drainage projects failed because of the non-cooperation and non-involvement of the local people in their planning, design, construction, operation and maintenance. The peoples’ participation in saline water management programmes can be attracted by mobilising and motivating them through mutual trust and credibility, useful practical advice, gradual change in their outlook through creating awareness and appreciation of the knowledge of technical skills for better utilisation of their limited land and water resources.
67
The mobilisation of the people needs a multipurpose approach which includes : (1) well planned educational programmes to familiarize the people, (2) personnel to get exposed to various social concepts so as to built in them skills for working with people effectively, as individuals, groups and masses, (3) integration of local political, social and educational facilities so that the political leadership can contribute in creating favouranble politico-system; social leaders can help in creating rapport with the masses; and educators can impart the programmes to various interest groups, (4) training to be imparted to the people for effective participation, (5) efforts to be made to create credible image and legitimacy of agencies in the eyes of the people, and 6) emphasis be laid on intrinsic motivational approach to ensure education and voluntary participation. The women force is intimately associated to the water utilization in all walks of life. This is more so true in the rural area. Association and participation of the women force in planning saline water appraisal and their involvement especially in monitoring activity would be more advantageous. PIA training can be imparted to them in these activities to make their effective participation.
Chapter 6
SALINE WATER USE IN AGRICULTURE
6.1 Introduction The assessment of the suitability of saline water for crop production is an imperative need along with practical guidelines, especially for the water uses in agriculture. The water of much higher salinities than those customarily classified as “unsuitable for irrigation” can, in fact, be used effectively for production of selected crops under the right conditions (FAO 1992). The water quality assessment and guidelines for the use of saline waters assume vital importance. 6.2 Agricultural Uses of Water Agricultural water uses include irrigation of food crops, fibre crops, agroforestry crops, and livestock production and agriculture. Food crops consists of cereals, oil seeds, pulses and vegetables. Grasses and forage crops too are irrigated. Fibre crops include cotton, jute, hemp, wool and other similar products. Agro-forestry is defined as land use systems in which trees are grown in association with agricultural crops and/ or pasture and livestock in which there both an economic and ecological inculcation between the tree and non tree components of the system (Young 1988- Tanji 1994). Agriculture is another agricultural water use for the culture of fish, prawn, mollusks crustaceans of sea weed in fresh, brackish or marine waters. 6.3 Classification of Saline Waters The water quality classification is a complicated task. It is not advisable to have uniform water classification for assessing the suitability of water for irrigation. The total salt concentration is the major quality factor generally limiting the use of saline water for crop production. Common irrigation water quality parameters needed to analyse in the laboratory and their usual range in irrigation waters are presented in Table 6.1.
Table 6.1
Laboratory determinations needed to evaluate common irrigation water quality
Water parameter Symbol Unit1 Usual range in
irrigation water Salinity
Salt Content Electrical Conductivity (or) Total Dissolved Solids
Ecw TDS
dS/m mg/1
0. –3 dS/m 0 – 2000 mg/1
Cations and Anions Calcium Ca++ me/1 0-20 me/1 Magnesium Mg++ me/1 0-5 me/1 Sodium Na+ me/1 0-40 me/1 Carbonate CO3
-- me/1 0-.1 me/1 Bicarbonate HCO3
--- me/1 0-10 me/1 Chloride C1-- me/1 0-30 me/1 Sulphate SO4
--- me/1 0-20 me/1 NUTRIENTS2 Nitrate-Nitrogen NO3-N mg/1 0-10 mg/1 Ammonium-Nitrogen NH4-N mg/1 0-5 mg/1
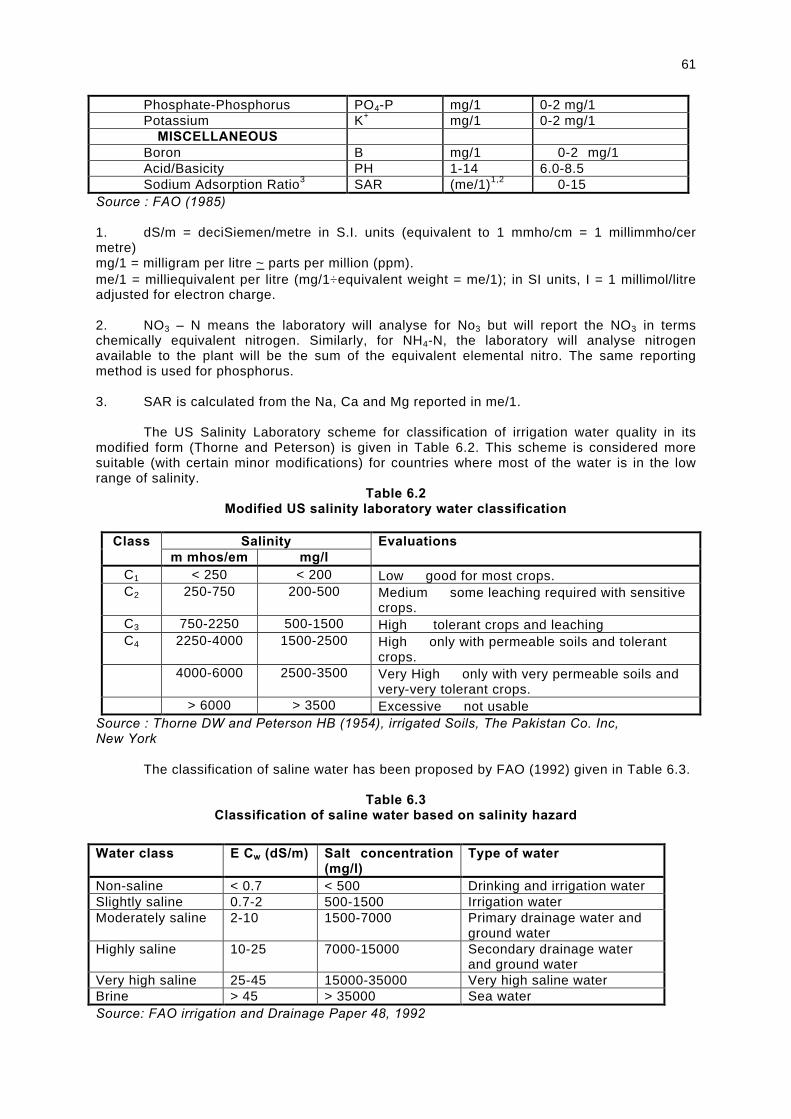
61
Phosphate-Phosphorus PO4-P mg/1 0-2 mg/1 Potassium K+ mg/1 0-2 mg/1
MISCELLANEOUS Boron B mg/1 0-2 mg/1 Acid/Basicity PH 1-14 6.0-8.5 Sodium Adsorption Ratio3 SAR (me/1)1,2 0-15 Source : FAO (1985) 1. dS/m = deciSiemen/metre in S.I. units (equivalent to 1 mmho/cm = 1 millimmho/cer metre) mg/1 = milligram per litre ~ parts per million (ppm). me/1 = milliequivalent per litre (mg/1÷equivalent weight = me/1); in SI units, I = 1 millimol/litre adjusted for electron charge. 2. NO3 – N means the laboratory will analyse for No3 but will report the NO3 in terms chemically equivalent nitrogen. Similarly, for NH4-N, the laboratory will analyse nitrogen available to the plant will be the sum of the equivalent elemental nitro. The same reporting method is used for phosphorus. 3. SAR is calculated from the Na, Ca and Mg reported in me/1. The US Salinity Laboratory scheme for classification of irrigation water quality in its modified form (Thorne and Peterson) is given in Table 6.2. This scheme is considered more suitable (with certain minor modifications) for countries where most of the water is in the low range of salinity.
Table 6.2 Modified US salinity laboratory water classification
Salinity Class
m mhos/em mg/l Evaluations
C1 < 250 < 200 Low good for most crops. C2 250-750 200-500 Medium some leaching required with sensitive
crops. C3 750-2250 500-1500 High tolerant crops and leaching C4 2250-4000 1500-2500 High only with permeable soils and tolerant
crops. 4000-6000 2500-3500 Very High only with very permeable soils and
very-very tolerant crops. > 6000 > 3500 Excessive not usable
Source : Thorne DW and Peterson HB (1954), irrigated Soils, The Pakistan Co. Inc, New York The classification of saline water has been proposed by FAO (1992) given in Table 6.3.
Table 6.3 Classification of saline water based on salinity hazard
Water class E Cw (dS/m) Salt concentration
(mg/l) Type of water
Non-saline < 0.7 < 500 Drinking and irrigation water Slightly saline 0.7-2 500-1500 Irrigation water Moderately saline 2-10 1500-7000 Primary drainage water and
ground water Highly saline 10-25 7000-15000 Secondary drainage water
and ground water Very high saline 25-45 15000-35000 Very high saline water Brine > 45 > 35000 Sea water Source: FAO irrigation and Drainage Paper 48, 1992
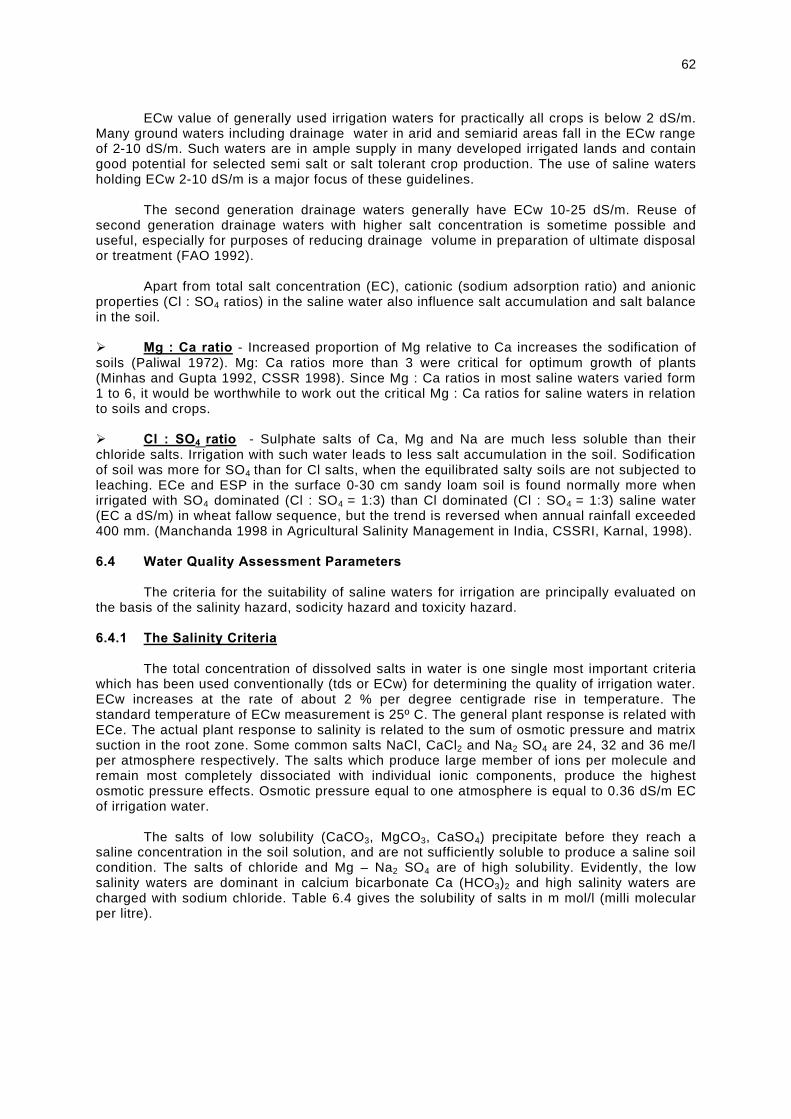
62
ECw value of generally used irrigation waters for practically all crops is below 2 dS/m. Many ground waters including drainage water in arid and semiarid areas fall in the ECw range of 2-10 dS/m. Such waters are in ample supply in many developed irrigated lands and contain good potential for selected semi salt or salt tolerant crop production. The use of saline waters holding ECw 2-10 dS/m is a major focus of these guidelines.
The second generation drainage waters generally have ECw 10-25 dS/m. Reuse of
second generation drainage waters with higher salt concentration is sometime possible and useful, especially for purposes of reducing drainage volume in preparation of ultimate disposal or treatment (FAO 1992). Apart from total salt concentration (EC), cationic (sodium adsorption ratio) and anionic properties (Cl : SO4 ratios) in the saline water also influence salt accumulation and salt balance in the soil. Ø Mg : Ca ratio - Increased proportion of Mg relative to Ca increases the sodification of soils (Paliwal 1972). Mg: Ca ratios more than 3 were critical for optimum growth of plants (Minhas and Gupta 1992, CSSR 1998). Since Mg : Ca ratios in most saline waters varied form 1 to 6, it would be worthwhile to work out the critical Mg : Ca ratios for saline waters in relation to soils and crops. Ø Cl : SO4 ratio - Sulphate salts of Ca, Mg and Na are much less soluble than their chloride salts. Irrigation with such water leads to less salt accumulation in the soil. Sodification of soil was more for SO4 than for Cl salts, when the equilibrated salty soils are not subjected to leaching. ECe and ESP in the surface 0-30 cm sandy loam soil is found normally more when irrigated with SO4 dominated (Cl : SO4 = 1:3) than Cl dominated (Cl : SO4 = 1:3) saline water (EC a dS/m) in wheat fallow sequence, but the trend is reversed when annual rainfall exceeded 400 mm. (Manchanda 1998 in Agricultural Salinity Management in India, CSSRI, Karnal, 1998). 6.4 Water Quality Assessment Parameters The criteria for the suitability of saline waters for irrigation are principally evaluated on the basis of the salinity hazard, sodicity hazard and toxicity hazard. 6.4.1 The Salinity Criteria The total concentration of dissolved salts in water is one single most important criteria which has been used conventionally (tds or ECw) for determining the quality of irrigation water. ECw increases at the rate of about 2 % per degree centigrade rise in temperature. The standard temperature of ECw measurement is 25º C. The general plant response is related with ECe. The actual plant response to salinity is related to the sum of osmotic pressure and matrix suction in the root zone. Some common salts NaCl, CaCl2 and Na2 SO4 are 24, 32 and 36 me/l per atmosphere respectively. The salts which produce large member of ions per molecule and remain most completely dissociated with individual ionic components, produce the highest osmotic pressure effects. Osmotic pressure equal to one atmosphere is equal to 0.36 dS/m EC of irrigation water. The salts of low solubility (CaCO3, MgCO3, CaSO4) precipitate before they reach a saline concentration in the soil solution, and are not sufficiently soluble to produce a saline soil condition. The salts of chloride and Mg – Na2 SO4 are of high solubility. Evidently, the low salinity waters are dominant in calcium bicarbonate Ca (HCO3)2 and high salinity waters are charged with sodium chloride. Table 6.4 gives the solubility of salts in m mol/l (milli molecular per litre).
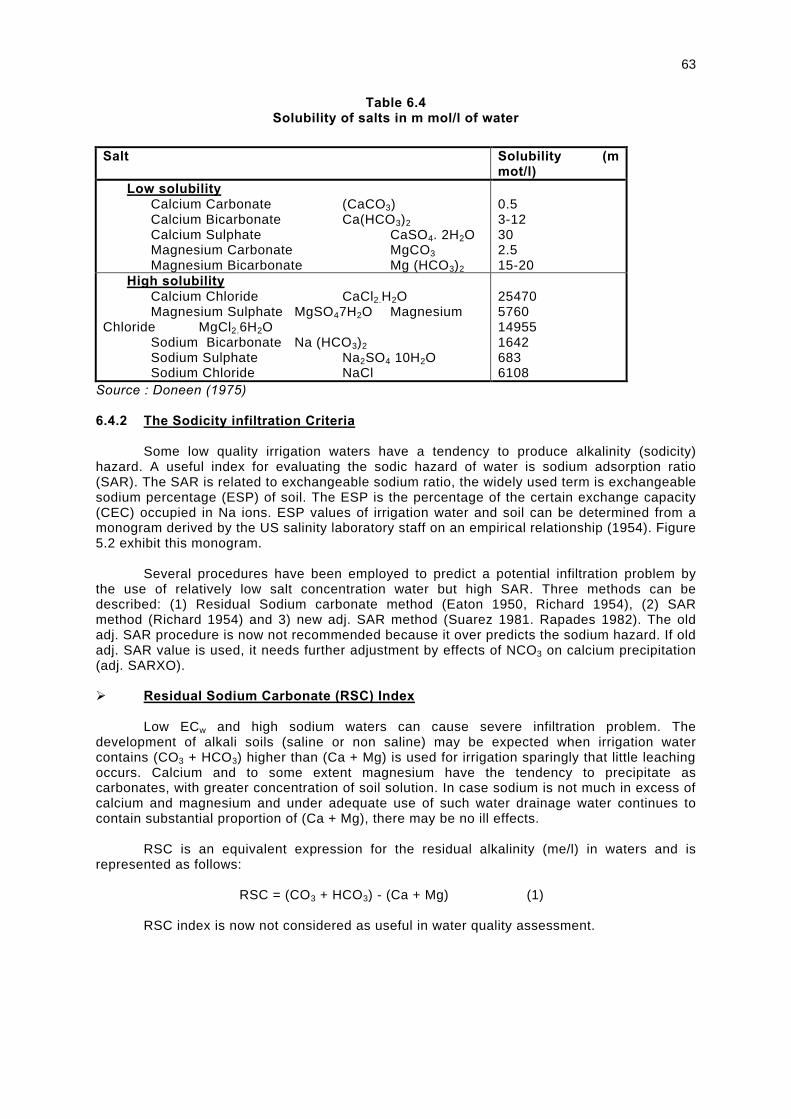
63
Table 6.4 Solubility of salts in m mol/l of water
Salt Solubility (m
mot/l) Low solubility
Calcium Carbonate (CaCO3) Calcium Bicarbonate Ca(HCO3)2 Calcium Sulphate CaSO4. 2H2O Magnesium Carbonate MgCO3 Magnesium Bicarbonate Mg (HCO3)2
0.5 3-12 30 2.5 15-20
High solubility Calcium Chloride CaCl2.H2O Magnesium Sulphate MgSO47H2O Magnesium Chloride MgCl2.6H2O Sodium Bicarbonate Na (HCO3)2 Sodium Sulphate Na2SO4 10H2O Sodium Chloride NaCl
25470 5760 14955 1642 683 6108
Source : Doneen (1975) 6.4.2 The Sodicity infiltration Criteria Some low quality irrigation waters have a tendency to produce alkalinity (sodicity) hazard. A useful index for evaluating the sodic hazard of water is sodium adsorption ratio (SAR). The SAR is related to exchangeable sodium ratio, the widely used term is exchangeable sodium percentage (ESP) of soil. The ESP is the percentage of the certain exchange capacity (CEC) occupied in Na ions. ESP values of irrigation water and soil can be determined from a monogram derived by the US salinity laboratory staff on an empirical relationship (1954). Figure 5.2 exhibit this monogram. Several procedures have been employed to predict a potential infiltration problem by the use of relatively low salt concentration water but high SAR. Three methods can be described: (1) Residual Sodium carbonate method (Eaton 1950, Richard 1954), (2) SAR method (Richard 1954) and 3) new adj. SAR method (Suarez 1981. Rapades 1982). The old adj. SAR procedure is now not recommended because it over predicts the sodium hazard. If old adj. SAR value is used, it needs further adjustment by effects of NCO3 on calcium precipitation (adj. SARXO). Ø Residual Sodium Carbonate (RSC) Index Low ECw and high sodium waters can cause severe infiltration problem. The development of alkali soils (saline or non saline) may be expected when irrigation water contains (CO3 + HCO3) higher than (Ca + Mg) is used for irrigation sparingly that little leaching occurs. Calcium and to some extent magnesium have the tendency to precipitate as carbonates, with greater concentration of soil solution. In case sodium is not much in excess of calcium and magnesium and under adequate use of such water drainage water continues to contain substantial proportion of (Ca + Mg), there may be no ill effects. RSC is an equivalent expression for the residual alkalinity (me/l) in waters and is represented as follows: RSC = (CO3 + HCO3) - (Ca + Mg) (1) RSC index is now not considered as useful in water quality assessment.
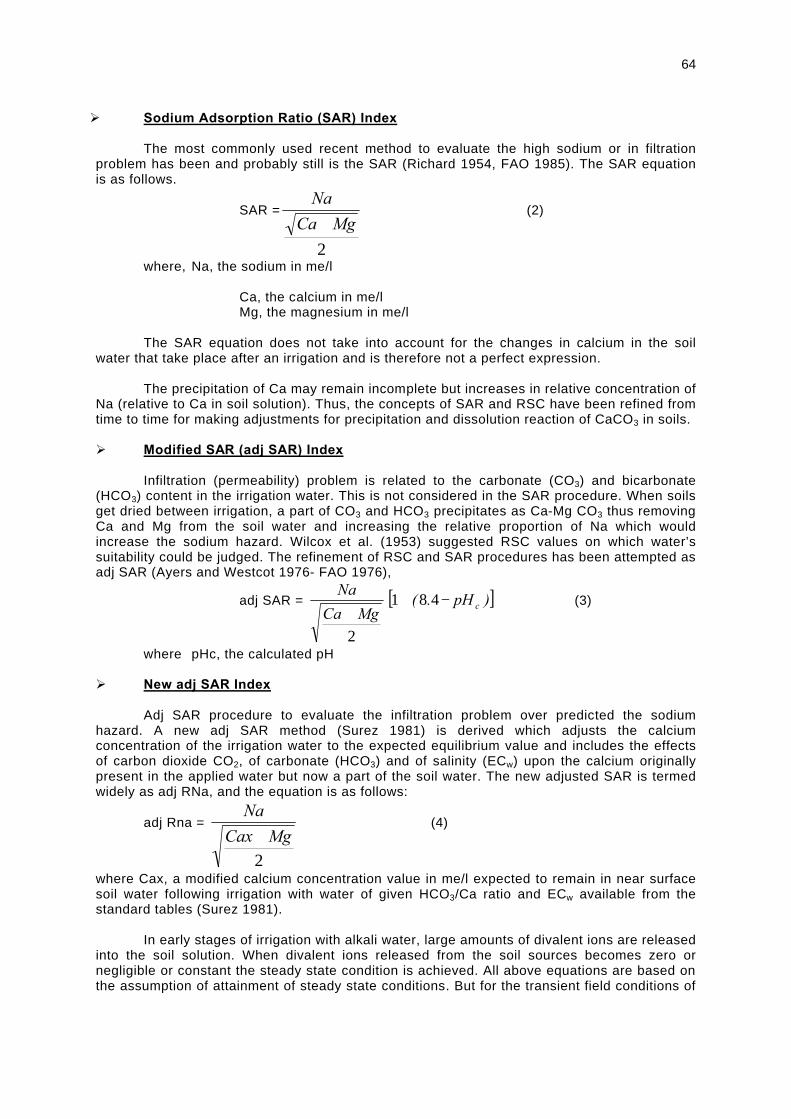
64
Ø Sodium Adsorption Ratio (SAR) Index The most commonly used recent method to evaluate the high sodium or in filtration problem has been and probably still is the SAR (Richard 1954, FAO 1985). The SAR equation is as follows.
SAR =
2
MgCa
Na
+ (2)
where, Na, the sodium in me/l Ca, the calcium in me/l Mg, the magnesium in me/l The SAR equation does not take into account for the changes in calcium in the soil water that take place after an irrigation and is therefore not a perfect expression. The precipitation of Ca may remain incomplete but increases in relative concentration of Na (relative to Ca in soil solution). Thus, the concepts of SAR and RSC have been refined from time to time for making adjustments for precipitation and dissolution reaction of CaCO3 in soils. Ø Modified SAR (adj SAR) Index Infiltration (permeability) problem is related to the carbonate (CO3) and bicarbonate (HCO3) content in the irrigation water. This is not considered in the SAR procedure. When soils get dried between irrigation, a part of CO3 and HCO3 precipitates as Ca-Mg CO3 thus removing Ca and Mg from the soil water and increasing the relative proportion of Na which would increase the sodium hazard. Wilcox et al. (1953) suggested RSC values on which water’s suitability could be judged. The refinement of RSC and SAR procedures has been attempted as adj SAR (Ayers and Westcot 1976- FAO 1976),
adj SAR = [ ])pH.(MgCa
Nac−+
+481
2
(3)
where pHc, the calculated pH
Ø New adj SAR Index Adj SAR procedure to evaluate the infiltration problem over predicted the sodium hazard. A new adj SAR method (Surez 1981) is derived which adjusts the calcium concentration of the irrigation water to the expected equilibrium value and includes the effects of carbon dioxide CO2, of carbonate (HCO3) and of salinity (ECw) upon the calcium originally present in the applied water but now a part of the soil water. The new adjusted SAR is termed widely as adj RNa, and the equation is as follows:
adj Rna =
2MgCax
Na
+ (4)
where Cax, a modified calcium concentration value in me/l expected to remain in near surface soil water following irrigation with water of given HCO3/Ca ratio and ECw available from the standard tables (Surez 1981). In early stages of irrigation with alkali water, large amounts of divalent ions are released into the soil solution. When divalent ions released from the soil sources becomes zero or negligible or constant the steady state condition is achieved. All above equations are based on the assumption of attainment of steady state conditions. But for the transient field conditions of
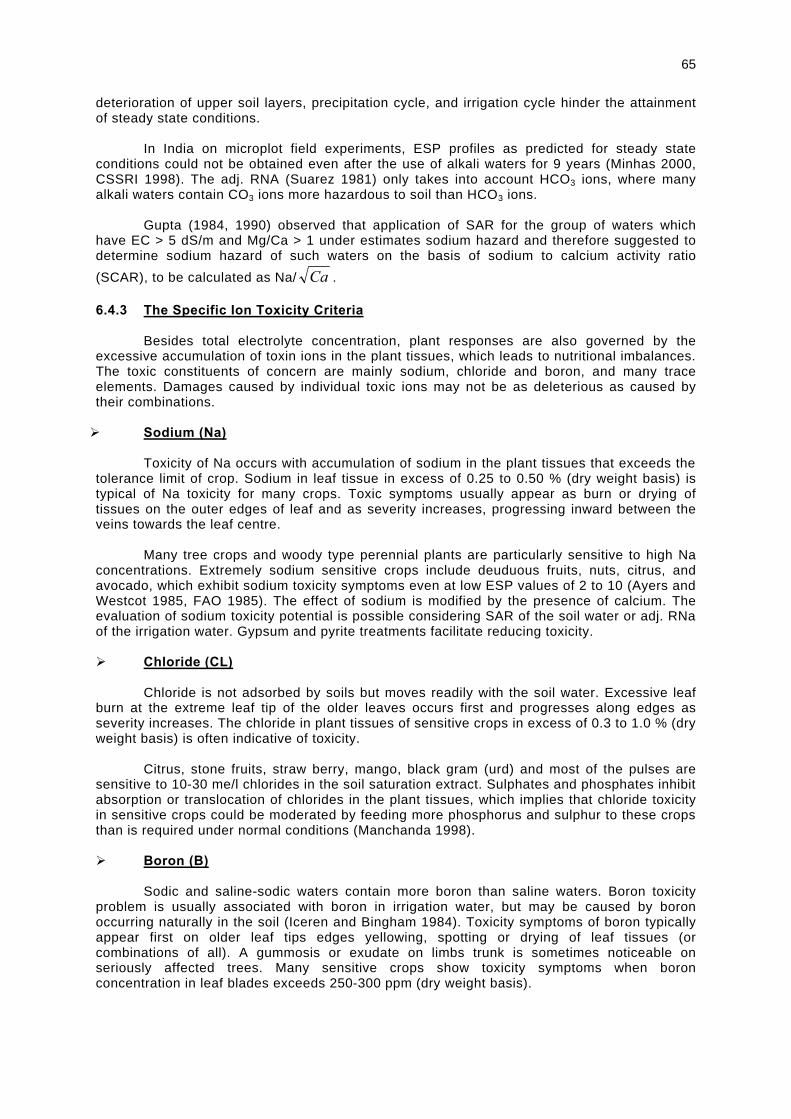
65
deterioration of upper soil layers, precipitation cycle, and irrigation cycle hinder the attainment of steady state conditions. In India on microplot field experiments, ESP profiles as predicted for steady state conditions could not be obtained even after the use of alkali waters for 9 years (Minhas 2000, CSSRI 1998). The adj. RNA (Suarez 1981) only takes into account HCO3 ions, where many alkali waters contain CO3 ions more hazardous to soil than HCO3 ions. Gupta (1984, 1990) observed that application of SAR for the group of waters which have EC > 5 dS/m and Mg/Ca > 1 under estimates sodium hazard and therefore suggested to determine sodium hazard of such waters on the basis of sodium to calcium activity ratio
(SCAR), to be calculated as Na/ Ca . 6.4.3 The Specific Ion Toxicity Criteria Besides total electrolyte concentration, plant responses are also governed by the excessive accumulation of toxin ions in the plant tissues, which leads to nutritional imbalances. The toxic constituents of concern are mainly sodium, chloride and boron, and many trace elements. Damages caused by individual toxic ions may not be as deleterious as caused by their combinations. Ø Sodium (Na) Toxicity of Na occurs with accumulation of sodium in the plant tissues that exceeds the tolerance limit of crop. Sodium in leaf tissue in excess of 0.25 to 0.50 % (dry weight basis) is typical of Na toxicity for many crops. Toxic symptoms usually appear as burn or drying of tissues on the outer edges of leaf and as severity increases, progressing inward between the veins towards the leaf centre.
Many tree crops and woody type perennial plants are particularly sensitive to high Na
concentrations. Extremely sodium sensitive crops include deuduous fruits, nuts, citrus, and avocado, which exhibit sodium toxicity symptoms even at low ESP values of 2 to 10 (Ayers and Westcot 1985, FAO 1985). The effect of sodium is modified by the presence of calcium. The evaluation of sodium toxicity potential is possible considering SAR of the soil water or adj. RNa of the irrigation water. Gypsum and pyrite treatments facilitate reducing toxicity.
Ø Chloride (CL) Chloride is not adsorbed by soils but moves readily with the soil water. Excessive leaf burn at the extreme leaf tip of the older leaves occurs first and progresses along edges as severity increases. The chloride in plant tissues of sensitive crops in excess of 0.3 to 1.0 % (dry weight basis) is often indicative of toxicity. Citrus, stone fruits, straw berry, mango, black gram (urd) and most of the pulses are sensitive to 10-30 me/l chlorides in the soil saturation extract. Sulphates and phosphates inhibit absorption or translocation of chlorides in the plant tissues, which implies that chloride toxicity in sensitive crops could be moderated by feeding more phosphorus and sulphur to these crops than is required under normal conditions (Manchanda 1998). Ø Boron (B) Sodic and saline-sodic waters contain more boron than saline waters. Boron toxicity problem is usually associated with boron in irrigation water, but may be caused by boron occurring naturally in the soil (Iceren and Bingham 1984). Toxicity symptoms of boron typically appear first on older leaf tips edges yellowing, spotting or drying of leaf tissues (or combinations of all). A gummosis or exudate on limbs trunk is sometimes noticeable on seriously affected trees. Many sensitive crops show toxicity symptoms when boron concentration in leaf blades exceeds 250-300 ppm (dry weight basis).
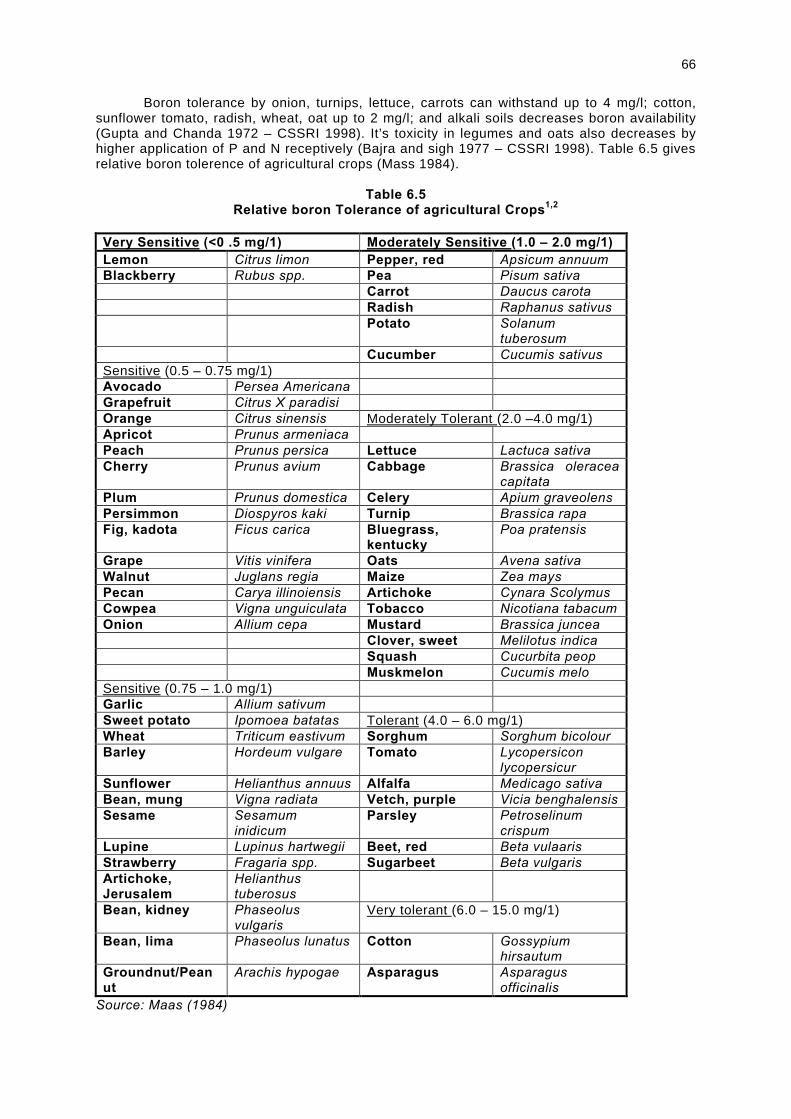
66
Boron tolerance by onion, turnips, lettuce, carrots can withstand up to 4 mg/l; cotton, sunflower tomato, radish, wheat, oat up to 2 mg/l; and alkali soils decreases boron availability (Gupta and Chanda 1972 – CSSRI 1998). It’s toxicity in legumes and oats also decreases by higher application of P and N receptively (Bajra and sigh 1977 – CSSRI 1998). Table 6.5 gives relative boron tolerence of agricultural crops (Mass 1984).
Table 6.5
Relative boron Tolerance of agricultural Crops1,2
Very Sensitive (<0 .5 mg/1) Moderately Sensitive (1.0 – 2.0 mg/1) Lemon Citrus limon Pepper, red Apsicum annuum Blackberry Rubus spp. Pea Pisum sativa Carrot Daucus carota Radish Raphanus sativus Potato Solanum
tuberosum Cucumber Cucumis sativus Sensitive (0.5 – 0.75 mg/1) Avocado Persea Americana Grapefruit Citrus X paradisi Orange Citrus sinensis Moderately Tolerant (2.0 –4.0 mg/1) Apricot Prunus armeniaca Peach Prunus persica Lettuce Lactuca sativa Cherry Prunus avium Cabbage Brassica oleracea
capitata Plum Prunus domestica Celery Apium graveolens Persimmon Diospyros kaki Turnip Brassica rapa Fig, kadota Ficus carica Bluegrass,
kentucky Poa pratensis
Grape Vitis vinifera Oats Avena sativa Walnut Juglans regia Maize Zea mays Pecan Carya illinoiensis Artichoke Cynara Scolymus Cowpea Vigna unguiculata Tobacco Nicotiana tabacum Onion Allium cepa Mustard Brassica juncea Clover, sweet Melilotus indica Squash Cucurbita peop Muskmelon Cucumis melo Sensitive (0.75 – 1.0 mg/1) Garlic Allium sativum Sweet potato Ipomoea batatas Tolerant (4.0 – 6.0 mg/1) Wheat Triticum eastivum Sorghum Sorghum bicolour Barley Hordeum vulgare Tomato Lycopersicon
lycopersicur Sunflower Helianthus annuus Alfalfa Medicago sativa Bean, mung Vigna radiata Vetch, purple Vicia benghalensis Sesame Sesamum
inidicum Parsley Petroselinum
crispum Lupine Lupinus hartwegii Beet, red Beta vulaaris Strawberry Fragaria spp. Sugarbeet Beta vulgaris Artichoke, Jerusalem
Helianthus tuberosus
Bean, kidney Phaseolus vulgaris
Very tolerant (6.0 – 15.0 mg/1)
Bean, lima Phaseolus lunatus Cotton Gossypium hirsautum
Groundnut/Peanut
Arachis hypogae Asparagus Asparagus officinalis
Source: Maas (1984)
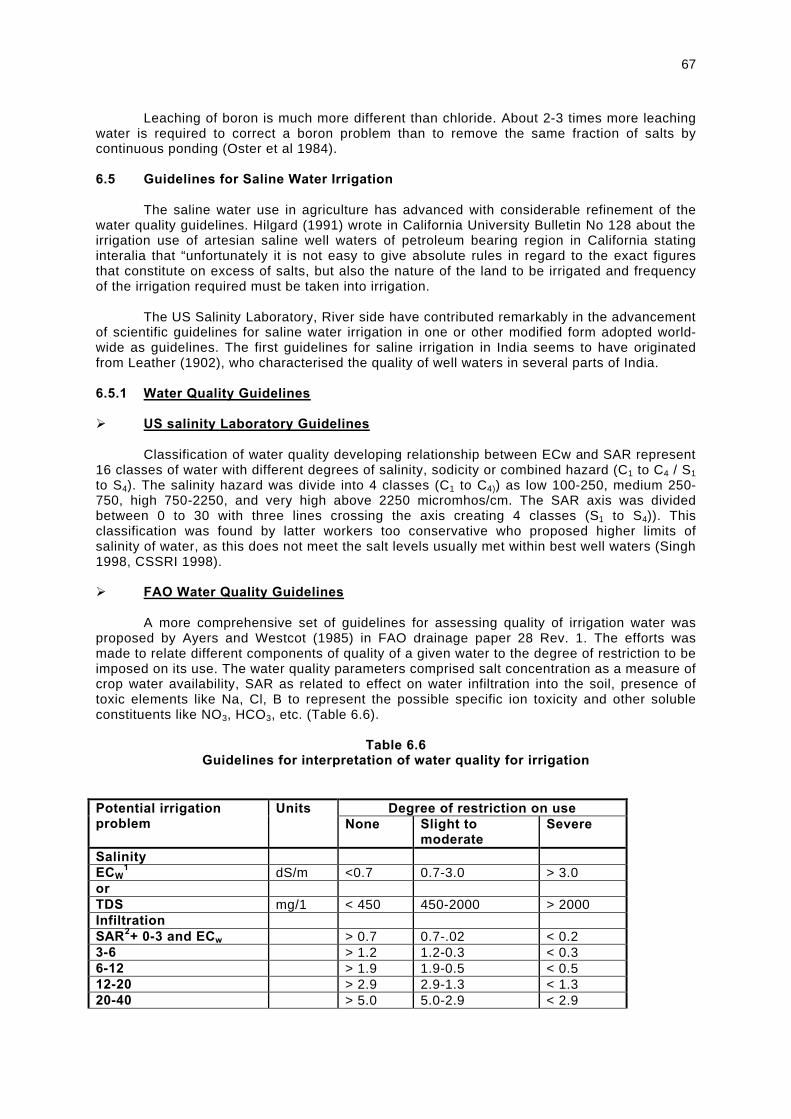
67
Leaching of boron is much more different than chloride. About 2-3 times more leaching water is required to correct a boron problem than to remove the same fraction of salts by continuous ponding (Oster et al 1984). 6.5 Guidelines for Saline Water Irrigation The saline water use in agriculture has advanced with considerable refinement of the water quality guidelines. Hilgard (1991) wrote in California University Bulletin No 128 about the irrigation use of artesian saline well waters of petroleum bearing region in California stating interalia that “unfortunately it is not easy to give absolute rules in regard to the exact figures that constitute on excess of salts, but also the nature of the land to be irrigated and frequency of the irrigation required must be taken into irrigation. The US Salinity Laboratory, River side have contributed remarkably in the advancement of scientific guidelines for saline water irrigation in one or other modified form adopted world-wide as guidelines. The first guidelines for saline irrigation in India seems to have originated from Leather (1902), who characterised the quality of well waters in several parts of India. 6.5.1 Water Quality Guidelines Ø US salinity Laboratory Guidelines Classification of water quality developing relationship between ECw and SAR represent 16 classes of water with different degrees of salinity, sodicity or combined hazard (C1 to C4 / S1 to S4). The salinity hazard was divide into 4 classes (C1 to C4)) as low 100-250, medium 250-750, high 750-2250, and very high above 2250 micromhos/cm. The SAR axis was divided between 0 to 30 with three lines crossing the axis creating 4 classes (S1 to S4)). This classification was found by latter workers too conservative who proposed higher limits of salinity of water, as this does not meet the salt levels usually met within best well waters (Singh 1998, CSSRI 1998).
Ø FAO Water Quality Guidelines A more comprehensive set of guidelines for assessing quality of irrigation water was proposed by Ayers and Westcot (1985) in FAO drainage paper 28 Rev. 1. The efforts was made to relate different components of quality of a given water to the degree of restriction to be imposed on its use. The water quality parameters comprised salt concentration as a measure of crop water availability, SAR as related to effect on water infiltration into the soil, presence of toxic elements like Na, Cl, B to represent the possible specific ion toxicity and other soluble constituents like NO3, HCO3, etc. (Table 6.6).
Table 6.6
Guidelines for interpretation of water quality for irrigation
Degree of restriction on use Potential irrigation
problem Units
None Slight to moderate
Severe
Salinity ECW
1 dS/m <0.7 0.7-3.0 > 3.0 or TDS mg/1 < 450 450-2000 > 2000 Infiltration SAR2+ 0-3 and ECw > 0.7 0.7-.02 < 0.2 3-6 > 1.2 1.2-0.3 < 0.3 6-12 > 1.9 1.9-0.5 < 0.5 12-20 > 2.9 2.9-1.3 < 1.3 20-40 > 5.0 5.0-2.9 < 2.9

68
Degree of restriction on use Potential irrigation problem
Units None Slight to
moderate Severe
Specific ion toxicity Sodium (Na) Surface irrigation SAR < 3 3 – 9 > 9 Sprinkler irrigation me/1 < 3 > 3 Chloride (C1) Surface irrigation me/1 < 4 4 – 10 > 10 Sprinkler irrigation m3/1 < 3 > 3 Boron (B) mg/1 < 0.7 0.7 – 3.0 > 3.0 Miscellaneous effects Nitrogen (NO3-N)3 mg/1 < 5 5 – 30 > 30 Bicarbonate (HCO3) me/1 < 1.5 1.5 – 8.5 > 8.5 pH Normal range 6.5 – 8.4 Source : FAO (1985) 1. EXw means electrical conductivity in deciSiemens per metre at 25ºC 2. SAR means sodium adsorption ratio 3. NO3-N means nitrate nitrogen reported in terms of elemental nitrogen These guidelines appear to be very conservative in respect of ECw and SAR of irrigation waters. The limits of HCO3 apply only for overhead sprinklers and not for flood irrigation. The basic assumptions in the guidelines comprised crop yield potential, soil conditions, methods of timing of irrigation, water uptake pattern of crops and three divisions of the restriction on use. These guideline do not consider rainfall, better quality water for conjunctive use, and possible use for supplemental irrigation. Intensive researches on water quality criteria have been done in India incorporating, besides the water quality parameters as the soil, irrigation, consideration of soil texture, crop tolerance and rainfall for saline and alkali waters. Table 6.7 provides the guidelines for using saline waters. (RSC < 2.5 me/l).
Table 6.7
Guidelines for using saline waters (India)
Upper limits of ECiw (ds m-1) for crops (mm) region Sensitive crops Semi-tolerant crops Tolerant crops
Soil texture (% clay) Rain
fall (mm)
<350
350-500
550-750
<350
350-500
550-750
<350 350-500
550-750
Fine (> 30%)
1.0 1.0 1.5 1.5 2.0 3.0 2.0 3.0 4.5
Moderately fine
(20-30%)
1.5 2.0 2.5 2.0 3.0 4.5 4.0 6.0 8.0
Moderately
coarse (10-
20%)
2.0 2.5 3.0 4.0 6.0 8.0 6.0 8.0 10.0
Coarse (< 10%)
- 3.0 3.0 6.0 7.5 9.0 8.0 10.0 12.5
Source : CSSRI 1998
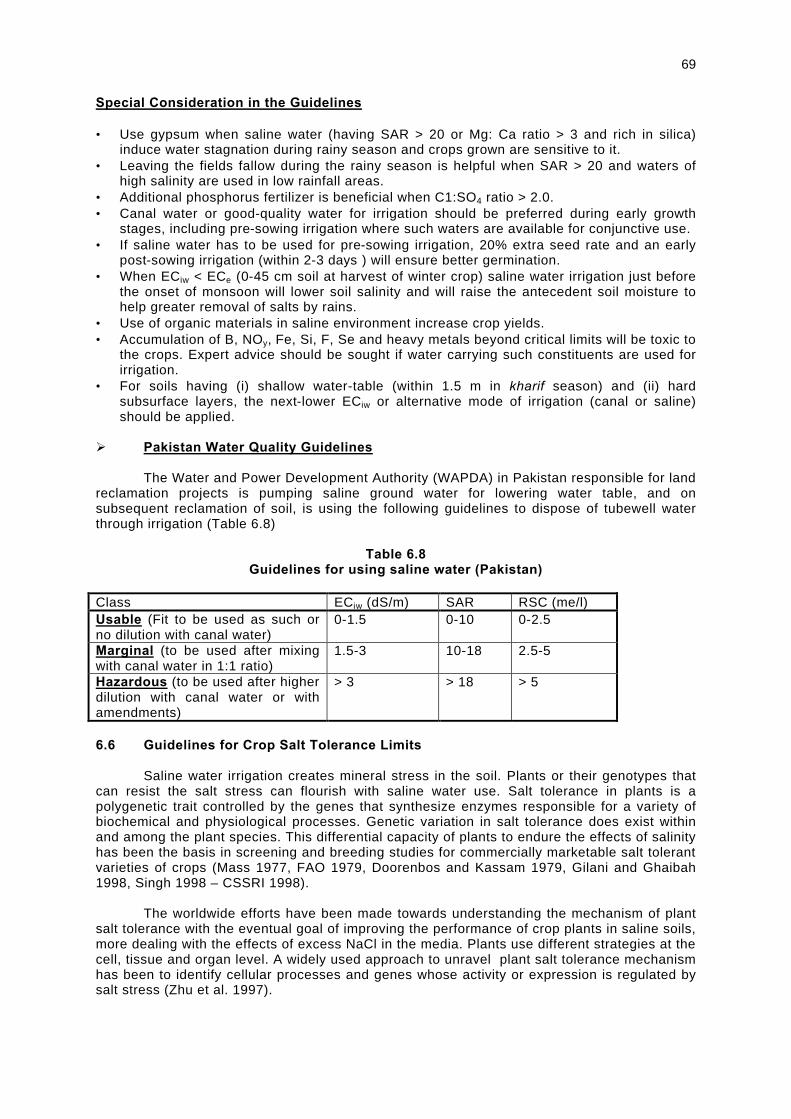
69
Special Consideration in the Guidelines • Use gypsum when saline water (having SAR > 20 or Mg: Ca ratio > 3 and rich in silica)
induce water stagnation during rainy season and crops grown are sensitive to it. • Leaving the fields fallow during the rainy season is helpful when SAR > 20 and waters of
high salinity are used in low rainfall areas. • Additional phosphorus fertilizer is beneficial when C1:SO4 ratio > 2.0. • Canal water or good-quality water for irrigation should be preferred during early growth
stages, including pre-sowing irrigation where such waters are available for conjunctive use. • If saline water has to be used for pre-sowing irrigation, 20% extra seed rate and an early
post-sowing irrigation (within 2-3 days ) will ensure better germination. • When ECiw < ECe (0-45 cm soil at harvest of winter crop) saline water irrigation just before
the onset of monsoon will lower soil salinity and will raise the antecedent soil moisture to help greater removal of salts by rains.
• Use of organic materials in saline environment increase crop yields. • Accumulation of B, NOy, Fe, Si, F, Se and heavy metals beyond critical limits will be toxic to
the crops. Expert advice should be sought if water carrying such constituents are used for irrigation.
• For soils having (i) shallow water-table (within 1.5 m in kharif season) and (ii) hard subsurface layers, the next-lower ECiw or alternative mode of irrigation (canal or saline) should be applied.
Ø Pakistan Water Quality Guidelines The Water and Power Development Authority (WAPDA) in Pakistan responsible for land reclamation projects is pumping saline ground water for lowering water table, and on subsequent reclamation of soil, is using the following guidelines to dispose of tubewell water through irrigation (Table 6.8)
Table 6.8
Guidelines for using saline water (Pakistan)
Class ECiw (dS/m) SAR RSC (me/l) Usable (Fit to be used as such or no dilution with canal water)
0-1.5 0-10 0-2.5
Marginal (to be used after mixing with canal water in 1:1 ratio)
1.5-3 10-18 2.5-5
Hazardous (to be used after higher dilution with canal water or with amendments)
> 3 > 18 > 5
6.6 Guidelines for Crop Salt Tolerance Limits Saline water irrigation creates mineral stress in the soil. Plants or their genotypes that can resist the salt stress can flourish with saline water use. Salt tolerance in plants is a polygenetic trait controlled by the genes that synthesize enzymes responsible for a variety of biochemical and physiological processes. Genetic variation in salt tolerance does exist within and among the plant species. This differential capacity of plants to endure the effects of salinity has been the basis in screening and breeding studies for commercially marketable salt tolerant varieties of crops (Mass 1977, FAO 1979, Doorenbos and Kassam 1979, Gilani and Ghaibah 1998, Singh 1998 – CSSRI 1998). The worldwide efforts have been made towards understanding the mechanism of plant salt tolerance with the eventual goal of improving the performance of crop plants in saline soils, more dealing with the effects of excess NaCl in the media. Plants use different strategies at the cell, tissue and organ level. A widely used approach to unravel plant salt tolerance mechanism has been to identify cellular processes and genes whose activity or expression is regulated by salt stress (Zhu et al. 1997).
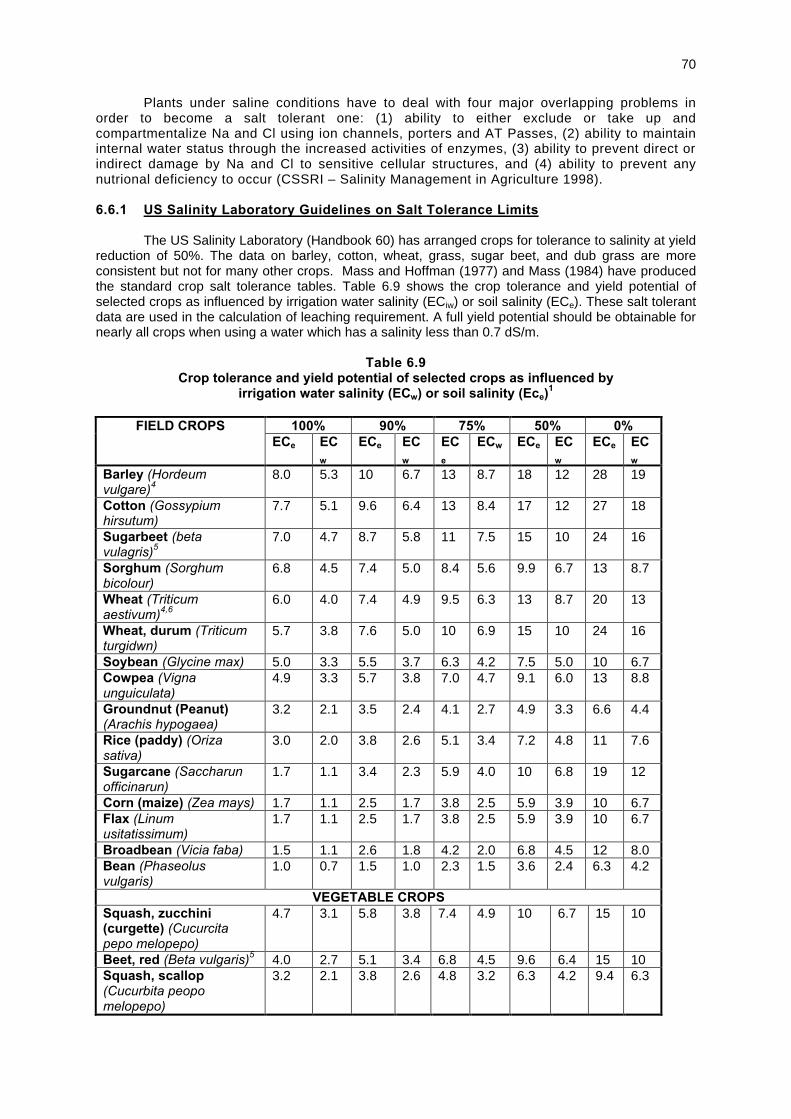
70
Plants under saline conditions have to deal with four major overlapping problems in order to become a salt tolerant one: (1) ability to either exclude or take up and compartmentalize Na and Cl using ion channels, porters and AT Passes, (2) ability to maintain internal water status through the increased activities of enzymes, (3) ability to prevent direct or indirect damage by Na and Cl to sensitive cellular structures, and (4) ability to prevent any nutrional deficiency to occur (CSSRI – Salinity Management in Agriculture 1998). 6.6.1 US Salinity Laboratory Guidelines on Salt Tolerance Limits The US Salinity Laboratory (Handbook 60) has arranged crops for tolerance to salinity at yield reduction of 50%. The data on barley, cotton, wheat, grass, sugar beet, and dub grass are more consistent but not for many other crops. Mass and Hoffman (1977) and Mass (1984) have produced the standard crop salt tolerance tables. Table 6.9 shows the crop tolerance and yield potential of selected crops as influenced by irrigation water salinity (ECiw) or soil salinity (ECe). These salt tolerant data are used in the calculation of leaching requirement. A full yield potential should be obtainable for nearly all crops when using a water which has a salinity less than 0.7 dS/m.
Table 6.9
Crop tolerance and yield potential of selected crops as influenced by irrigation water salinity (ECw) or soil salinity (Ece)
1
100% 90% 75% 50% 0% FIELD CROPS
ECe ECw
ECe ECw
ECe
ECw ECe ECw
ECe ECw
Barley (Hordeum vulgare)4
8.0 5.3 10 6.7 13 8.7 18 12 28 19
Cotton (Gossypium hirsutum)
7.7 5.1 9.6 6.4 13 8.4 17 12 27 18
Sugarbeet (beta vulagris)5
7.0 4.7 8.7 5.8 11 7.5 15 10 24 16
Sorghum (Sorghum bicolour)
6.8 4.5 7.4 5.0 8.4 5.6 9.9 6.7 13 8.7
Wheat (Triticum aestivum)4,6
6.0 4.0 7.4 4.9 9.5 6.3 13 8.7 20 13
Wheat, durum (Triticum turgidwn)
5.7 3.8 7.6 5.0 10 6.9 15 10 24 16
Soybean (Glycine max) 5.0 3.3 5.5 3.7 6.3 4.2 7.5 5.0 10 6.7 Cowpea (Vigna unguiculata)
4.9 3.3 5.7 3.8 7.0 4.7 9.1 6.0 13 8.8
Groundnut (Peanut) (Arachis hypogaea)
3.2 2.1 3.5 2.4 4.1 2.7 4.9 3.3 6.6 4.4
Rice (paddy) (Oriza sativa)
3.0 2.0 3.8 2.6 5.1 3.4 7.2 4.8 11 7.6
Sugarcane (Saccharun officinarun)
1.7 1.1 3.4 2.3 5.9 4.0 10 6.8 19 12
Corn (maize) (Zea mays) 1.7 1.1 2.5 1.7 3.8 2.5 5.9 3.9 10 6.7 Flax (Linum usitatissimum)
1.7 1.1 2.5 1.7 3.8 2.5 5.9 3.9 10 6.7
Broadbean (Vicia faba) 1.5 1.1 2.6 1.8 4.2 2.0 6.8 4.5 12 8.0 Bean (Phaseolus vulgaris)
1.0 0.7 1.5 1.0 2.3 1.5 3.6 2.4 6.3 4.2
VEGETABLE CROPS Squash, zucchini (curgette) (Cucurcita pepo melopepo)
4.7 3.1 5.8 3.8 7.4 4.9 10 6.7 15 10
Beet, red (Beta vulgaris)5 4.0 2.7 5.1 3.4 6.8 4.5 9.6 6.4 15 10 Squash, scallop (Cucurbita peopo melopepo)
3.2 2.1 3.8 2.6 4.8 3.2 6.3 4.2 9.4 6.3
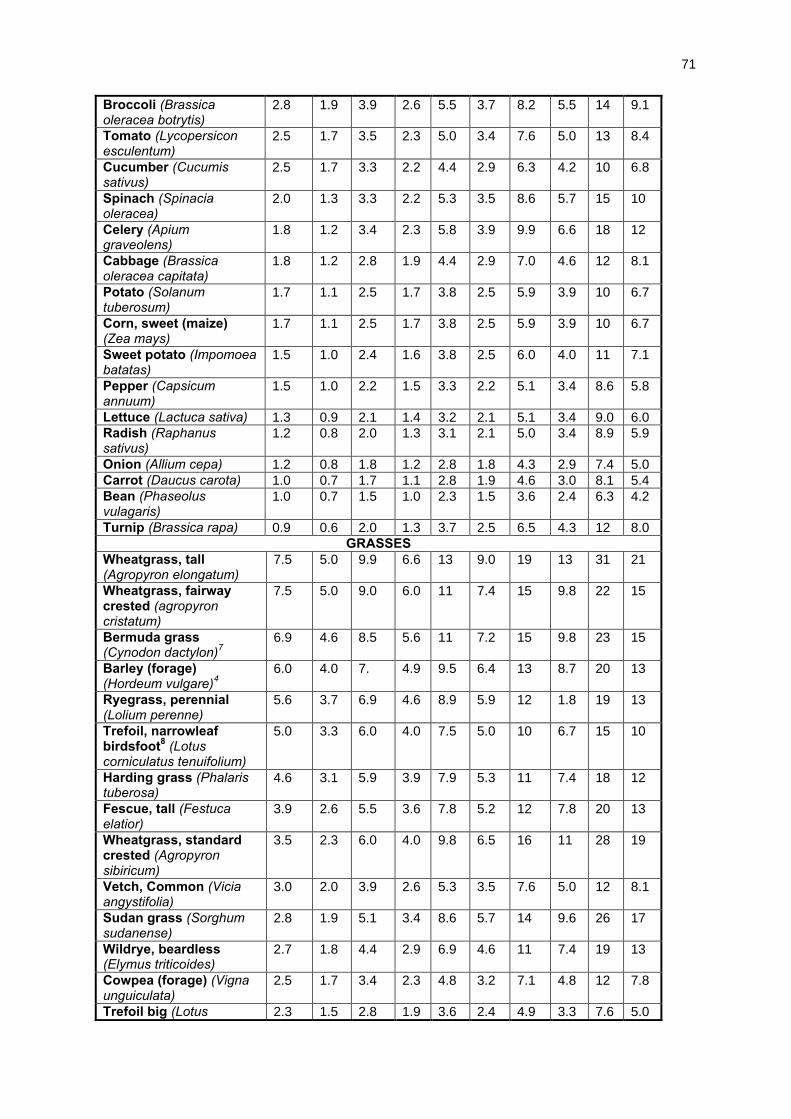
71
Broccoli (Brassica oleracea botrytis)
2.8 1.9 3.9 2.6 5.5 3.7 8.2 5.5 14 9.1
Tomato (Lycopersicon esculentum)
2.5 1.7 3.5 2.3 5.0 3.4 7.6 5.0 13 8.4
Cucumber (Cucumis sativus)
2.5 1.7 3.3 2.2 4.4 2.9 6.3 4.2 10 6.8
Spinach (Spinacia oleracea)
2.0 1.3 3.3 2.2 5.3 3.5 8.6 5.7 15 10
Celery (Apium graveolens)
1.8 1.2 3.4 2.3 5.8 3.9 9.9 6.6 18 12
Cabbage (Brassica oleracea capitata)
1.8 1.2 2.8 1.9 4.4 2.9 7.0 4.6 12 8.1
Potato (Solanum tuberosum)
1.7 1.1 2.5 1.7 3.8 2.5 5.9 3.9 10 6.7
Corn, sweet (maize) (Zea mays)
1.7 1.1 2.5 1.7 3.8 2.5 5.9 3.9 10 6.7
Sweet potato (Impomoea batatas)
1.5 1.0 2.4 1.6 3.8 2.5 6.0 4.0 11 7.1
Pepper (Capsicum annuum)
1.5 1.0 2.2 1.5 3.3 2.2 5.1 3.4 8.6 5.8
Lettuce (Lactuca sativa) 1.3 0.9 2.1 1.4 3.2 2.1 5.1 3.4 9.0 6.0 Radish (Raphanus sativus)
1.2 0.8 2.0 1.3 3.1 2.1 5.0 3.4 8.9 5.9
Onion (Allium cepa) 1.2 0.8 1.8 1.2 2.8 1.8 4.3 2.9 7.4 5.0 Carrot (Daucus carota) 1.0 0.7 1.7 1.1 2.8 1.9 4.6 3.0 8.1 5.4 Bean (Phaseolus vulagaris)
1.0 0.7 1.5 1.0 2.3 1.5 3.6 2.4 6.3 4.2
Turnip (Brassica rapa) 0.9 0.6 2.0 1.3 3.7 2.5 6.5 4.3 12 8.0 GRASSES
Wheatgrass, tall (Agropyron elongatum)
7.5 5.0 9.9 6.6 13 9.0 19 13 31 21
Wheatgrass, fairway crested (agropyron cristatum)
7.5 5.0 9.0 6.0 11 7.4 15 9.8 22 15
Bermuda grass (Cynodon dactylon)7
6.9 4.6 8.5 5.6 11 7.2 15 9.8 23 15
Barley (forage) (Hordeum vulgare)4
6.0 4.0 7. 4.9 9.5 6.4 13 8.7 20 13
Ryegrass, perennial (Lolium perenne)
5.6 3.7 6.9 4.6 8.9 5.9 12 1.8 19 13
Trefoil, narrowleaf birdsfoot8 (Lotus corniculatus tenuifolium)
5.0 3.3 6.0 4.0 7.5 5.0 10 6.7 15 10
Harding grass (Phalaris tuberosa)
4.6 3.1 5.9 3.9 7.9 5.3 11 7.4 18 12
Fescue, tall (Festuca elatior)
3.9 2.6 5.5 3.6 7.8 5.2 12 7.8 20 13
Wheatgrass, standard crested (Agropyron sibiricum)
3.5 2.3 6.0 4.0 9.8 6.5 16 11 28 19
Vetch, Common (Vicia angystifolia)
3.0 2.0 3.9 2.6 5.3 3.5 7.6 5.0 12 8.1
Sudan grass (Sorghum sudanense)
2.8 1.9 5.1 3.4 8.6 5.7 14 9.6 26 17
Wildrye, beardless (Elymus triticoides)
2.7 1.8 4.4 2.9 6.9 4.6 11 7.4 19 13
Cowpea (forage) (Vigna unguiculata)
2.5 1.7 3.4 2.3 4.8 3.2 7.1 4.8 12 7.8
Trefoil big (Lotus 2.3 1.5 2.8 1.9 3.6 2.4 4.9 3.3 7.6 5.0
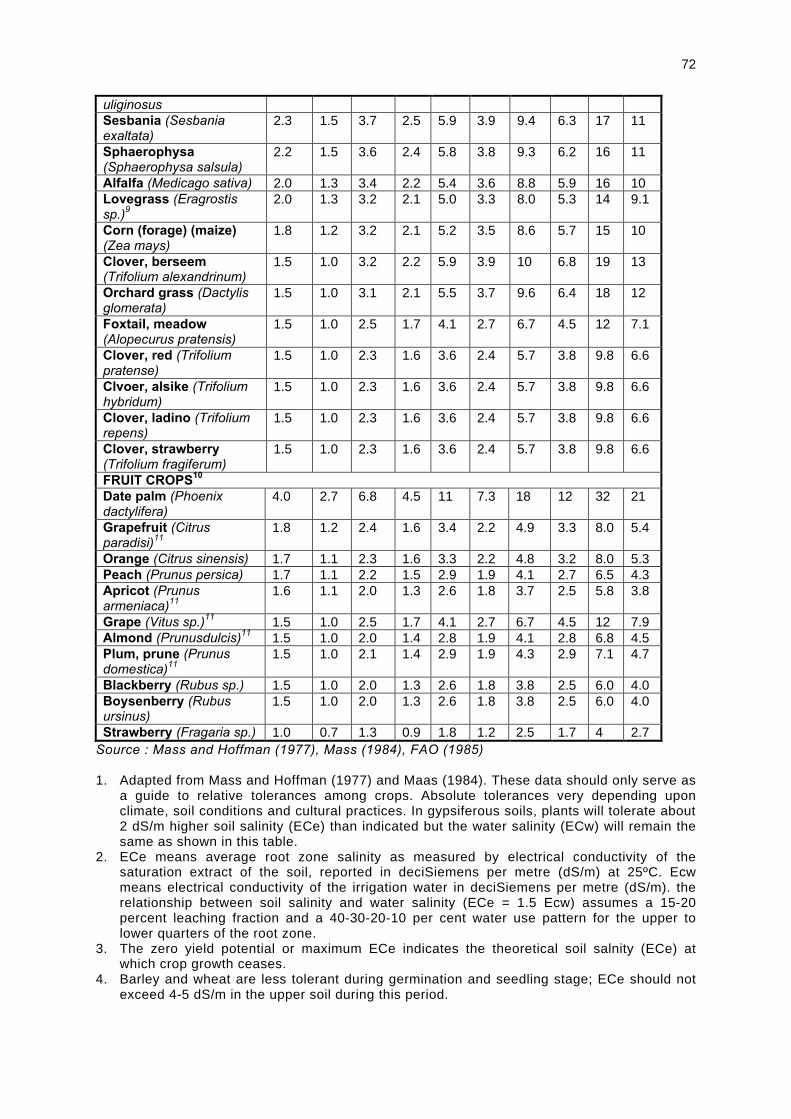
72
uliginosus Sesbania (Sesbania exaltata)
2.3 1.5 3.7 2.5 5.9 3.9 9.4 6.3 17 11
Sphaerophysa (Sphaerophysa salsula)
2.2 1.5 3.6 2.4 5.8 3.8 9.3 6.2 16 11
Alfalfa (Medicago sativa) 2.0 1.3 3.4 2.2 5.4 3.6 8.8 5.9 16 10 Lovegrass (Eragrostis sp.)9
2.0 1.3 3.2 2.1 5.0 3.3 8.0 5.3 14 9.1
Corn (forage) (maize) (Zea mays)
1.8 1.2 3.2 2.1 5.2 3.5 8.6 5.7 15 10
Clover, berseem (Trifolium alexandrinum)
1.5 1.0 3.2 2.2 5.9 3.9 10 6.8 19 13
Orchard grass (Dactylis glomerata)
1.5 1.0 3.1 2.1 5.5 3.7 9.6 6.4 18 12
Foxtail, meadow (Alopecurus pratensis)
1.5 1.0 2.5 1.7 4.1 2.7 6.7 4.5 12 7.1
Clover, red (Trifolium pratense)
1.5 1.0 2.3 1.6 3.6 2.4 5.7 3.8 9.8 6.6
Clvoer, alsike (Trifolium hybridum)
1.5 1.0 2.3 1.6 3.6 2.4 5.7 3.8 9.8 6.6
Clover, ladino (Trifolium repens)
1.5 1.0 2.3 1.6 3.6 2.4 5.7 3.8 9.8 6.6
Clover, strawberry (Trifolium fragiferum)
1.5 1.0 2.3 1.6 3.6 2.4 5.7 3.8 9.8 6.6
FRUIT CROPS10 Date palm (Phoenix dactylifera)
4.0 2.7 6.8 4.5 11 7.3 18 12 32 21
Grapefruit (Citrus paradisi)11
1.8 1.2 2.4 1.6 3.4 2.2 4.9 3.3 8.0 5.4
Orange (Citrus sinensis) 1.7 1.1 2.3 1.6 3.3 2.2 4.8 3.2 8.0 5.3 Peach (Prunus persica) 1.7 1.1 2.2 1.5 2.9 1.9 4.1 2.7 6.5 4.3 Apricot (Prunus armeniaca)11
1.6 1.1 2.0 1.3 2.6 1.8 3.7 2.5 5.8 3.8
Grape (Vitus sp.)11 1.5 1.0 2.5 1.7 4.1 2.7 6.7 4.5 12 7.9 Almond (Prunusdulcis)11 1.5 1.0 2.0 1.4 2.8 1.9 4.1 2.8 6.8 4.5 Plum, prune (Prunus domestica)11
1.5 1.0 2.1 1.4 2.9 1.9 4.3 2.9 7.1 4.7
Blackberry (Rubus sp.) 1.5 1.0 2.0 1.3 2.6 1.8 3.8 2.5 6.0 4.0 Boysenberry (Rubus ursinus)
1.5 1.0 2.0 1.3 2.6 1.8 3.8 2.5 6.0 4.0
Strawberry (Fragaria sp.) 1.0 0.7 1.3 0.9 1.8 1.2 2.5 1.7 4 2.7 Source : Mass and Hoffman (1977), Mass (1984), FAO (1985) 1. Adapted from Mass and Hoffman (1977) and Maas (1984). These data should only serve as
a guide to relative tolerances among crops. Absolute tolerances very depending upon climate, soil conditions and cultural practices. In gypsiferous soils, plants will tolerate about 2 dS/m higher soil salinity (ECe) than indicated but the water salinity (ECw) will remain the same as shown in this table.
2. ECe means average root zone salinity as measured by electrical conductivity of the saturation extract of the soil, reported in deciSiemens per metre (dS/m) at 25ºC. Ecw means electrical conductivity of the irrigation water in deciSiemens per metre (dS/m). the relationship between soil salinity and water salinity (ECe = 1.5 Ecw) assumes a 15-20 percent leaching fraction and a 40-30-20-10 per cent water use pattern for the upper to lower quarters of the root zone.
3. The zero yield potential or maximum ECe indicates the theoretical soil salnity (ECe) at which crop growth ceases.
4. Barley and wheat are less tolerant during germination and seedling stage; ECe should not exceed 4-5 dS/m in the upper soil during this period.
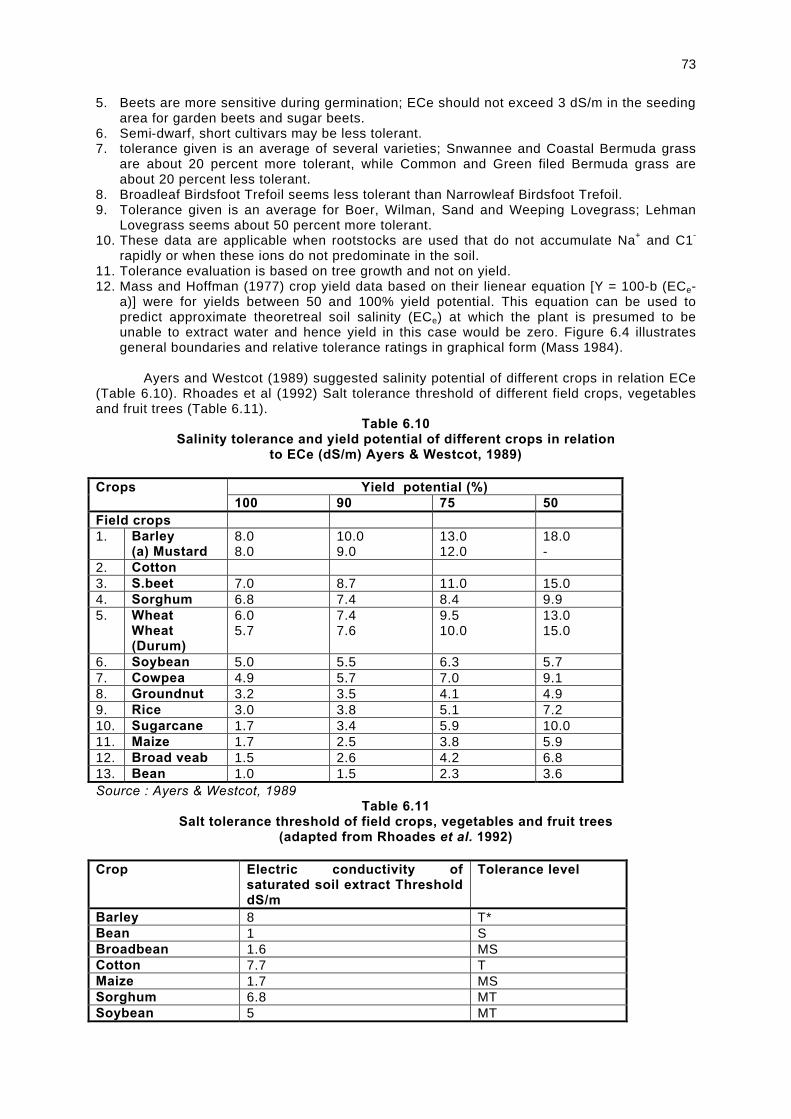
73
5. Beets are more sensitive during germination; ECe should not exceed 3 dS/m in the seeding area for garden beets and sugar beets.
6. Semi-dwarf, short cultivars may be less tolerant. 7. tolerance given is an average of several varieties; Snwannee and Coastal Bermuda grass
are about 20 percent more tolerant, while Common and Green filed Bermuda grass are about 20 percent less tolerant.
8. Broadleaf Birdsfoot Trefoil seems less tolerant than Narrowleaf Birdsfoot Trefoil. 9. Tolerance given is an average for Boer, Wilman, Sand and Weeping Lovegrass; Lehman
Lovegrass seems about 50 percent more tolerant. 10. These data are applicable when rootstocks are used that do not accumulate Na+ and C1-
rapidly or when these ions do not predominate in the soil. 11. Tolerance evaluation is based on tree growth and not on yield. 12. Mass and Hoffman (1977) crop yield data based on their lienear equation [Y = 100-b (ECe-
a)] were for yields between 50 and 100% yield potential. This equation can be used to predict approximate theoretreal soil salinity (ECe) at which the plant is presumed to be unable to extract water and hence yield in this case would be zero. Figure 6.4 illustrates general boundaries and relative tolerance ratings in graphical form (Mass 1984).
Ayers and Westcot (1989) suggested salinity potential of different crops in relation ECe
(Table 6.10). Rhoades et al (1992) Salt tolerance threshold of different field crops, vegetables and fruit trees (Table 6.11).
Table 6.10 Salinity tolerance and yield potential of different crops in relation
to ECe (dS/m) Ayers & Westcot, 1989)
Yield potential (%) Crops 100 90 75 50
Field crops 1. Barley
(a) Mustard 8.0 8.0
10.0 9.0
13.0 12.0
18.0 -
2. Cotton 3. S.beet 7.0 8.7 11.0 15.0 4. Sorghum 6.8 7.4 8.4 9.9 5. (a) Wheat
(b) Wheat (Durum)
6.0 5.7
7.4 7.6
9.5 10.0
13.0 15.0
6. Soybean 5.0 5.5 6.3 5.7 7. Cowpea 4.9 5.7 7.0 9.1 8. Groundnut 3.2 3.5 4.1 4.9 9. Rice 3.0 3.8 5.1 7.2 10. Sugarcane 1.7 3.4 5.9 10.0 11. Maize 1.7 2.5 3.8 5.9 12. Broad veab 1.5 2.6 4.2 6.8 13. Bean 1.0 1.5 2.3 3.6 Source : Ayers & Westcot, 1989
Table 6.11 Salt tolerance threshold of field crops, vegetables and fruit trees
(adapted from Rhoades et al. 1992)
Crop Electric conductivity of saturated soil extract Threshold dS/m
Tolerance level
Barley 8 T* Bean 1 S Broadbean 1.6 MS Cotton 7.7 T Maize 1.7 MS Sorghum 6.8 MT Soybean 5 MT
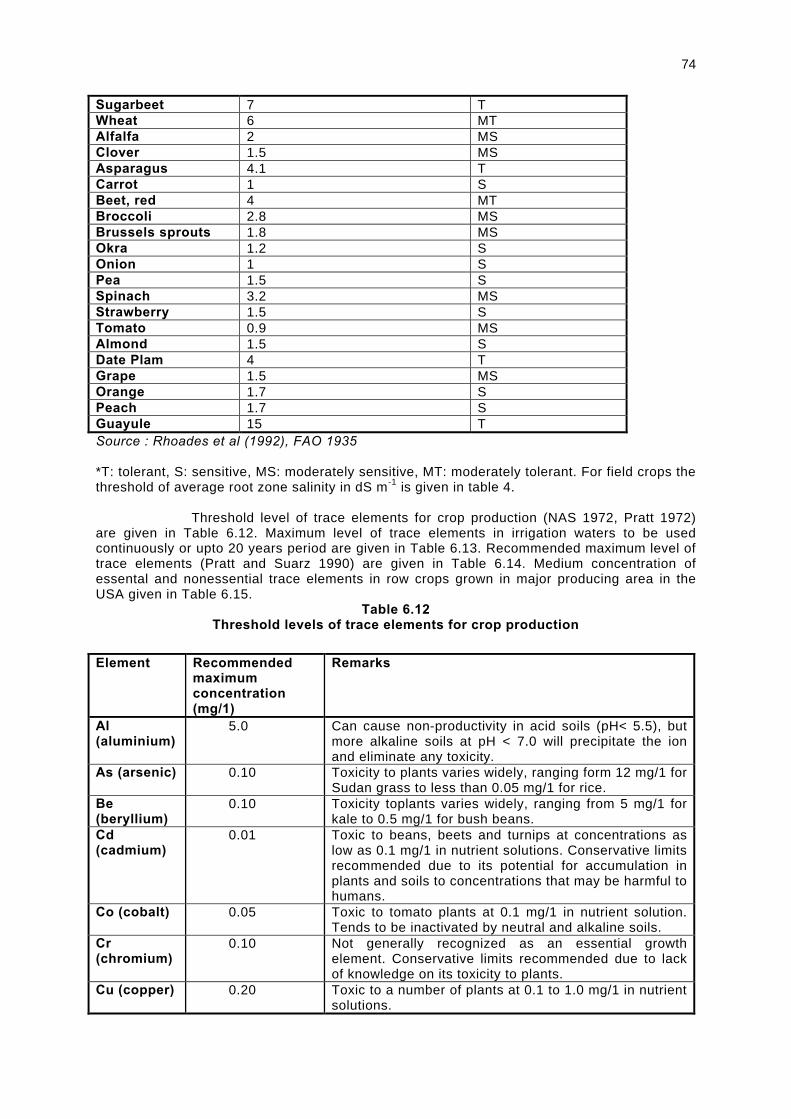
74
Sugarbeet 7 T Wheat 6 MT Alfalfa 2 MS Clover 1.5 MS Asparagus 4.1 T Carrot 1 S Beet, red 4 MT Broccoli 2.8 MS Brussels sprouts 1.8 MS Okra 1.2 S Onion 1 S Pea 1.5 S Spinach 3.2 MS Strawberry 1.5 S Tomato 0.9 MS Almond 1.5 S Date Plam 4 T Grape 1.5 MS Orange 1.7 S Peach 1.7 S Guayule 15 T Source : Rhoades et al (1992), FAO 1935 *T: tolerant, S: sensitive, MS: moderately sensitive, MT: moderately tolerant. For field crops the threshold of average root zone salinity in dS m-1 is given in table 4. Threshold level of trace elements for crop production (NAS 1972, Pratt 1972) are given in Table 6.12. Maximum level of trace elements in irrigation waters to be used continuously or upto 20 years period are given in Table 6.13. Recommended maximum level of trace elements (Pratt and Suarz 1990) are given in Table 6.14. Medium concentration of essental and nonessential trace elements in row crops grown in major producing area in the USA given in Table 6.15.
Table 6.12 Threshold levels of trace elements for crop production
Element Recommended
maximum concentration (mg/1)
Remarks
Al (aluminium)
5.0 Can cause non-productivity in acid soils (pH< 5.5), but more alkaline soils at pH < 7.0 will precipitate the ion and eliminate any toxicity.
As (arsenic) 0.10 Toxicity to plants varies widely, ranging form 12 mg/1 for Sudan grass to less than 0.05 mg/1 for rice.
Be (beryllium)
0.10 Toxicity toplants varies widely, ranging from 5 mg/1 for kale to 0.5 mg/1 for bush beans.
Cd (cadmium)
0.01 Toxic to beans, beets and turnips at concentrations as low as 0.1 mg/1 in nutrient solutions. Conservative limits recommended due to its potential for accumulation in plants and soils to concentrations that may be harmful to humans.
Co (cobalt) 0.05 Toxic to tomato plants at 0.1 mg/1 in nutrient solution. Tends to be inactivated by neutral and alkaline soils.
Cr (chromium)
0.10 Not generally recognized as an essential growth element. Conservative limits recommended due to lack of knowledge on its toxicity to plants.
Cu (copper) 0.20 Toxic to a number of plants at 0.1 to 1.0 mg/1 in nutrient solutions.
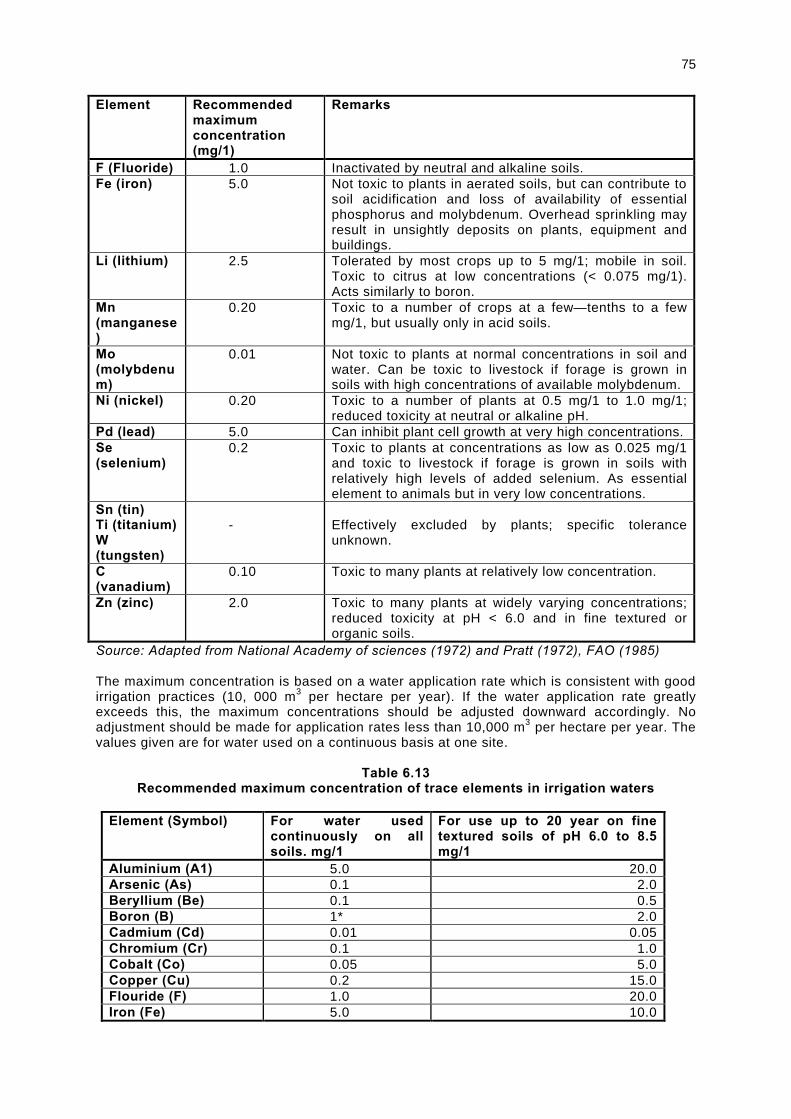
75
Element Recommended maximum concentration (mg/1)
Remarks
F (Fluoride) 1.0 Inactivated by neutral and alkaline soils. Fe (iron) 5.0 Not toxic to plants in aerated soils, but can contribute to
soil acidification and loss of availability of essential phosphorus and molybdenum. Overhead sprinkling may result in unsightly deposits on plants, equipment and buildings.
Li (lithium) 2.5 Tolerated by most crops up to 5 mg/1; mobile in soil. Toxic to citrus at low concentrations (< 0.075 mg/1). Acts similarly to boron.
Mn (manganese)
0.20 Toxic to a number of crops at a few—tenths to a few mg/1, but usually only in acid soils.
Mo (molybdenum)
0.01 Not toxic to plants at normal concentrations in soil and water. Can be toxic to livestock if forage is grown in soils with high concentrations of available molybdenum.
Ni (nickel) 0.20 Toxic to a number of plants at 0.5 mg/1 to 1.0 mg/1; reduced toxicity at neutral or alkaline pH.
Pd (lead) 5.0 Can inhibit plant cell growth at very high concentrations. Se (selenium)
0.2 Toxic to plants at concentrations as low as 0.025 mg/1 and toxic to livestock if forage is grown in soils with relatively high levels of added selenium. As essential element to animals but in very low concentrations.
Sn (tin) Ti (titanium) W (tungsten)
-
Effectively excluded by plants; specific tolerance unknown.
C (vanadium)
0.10 Toxic to many plants at relatively low concentration.
Zn (zinc) 2.0 Toxic to many plants at widely varying concentrations; reduced toxicity at pH < 6.0 and in fine textured or organic soils.
Source: Adapted from National Academy of sciences (1972) and Pratt (1972), FAO (1985) The maximum concentration is based on a water application rate which is consistent with good irrigation practices (10, 000 m3 per hectare per year). If the water application rate greatly exceeds this, the maximum concentrations should be adjusted downward accordingly. No adjustment should be made for application rates less than 10,000 m3 per hectare per year. The values given are for water used on a continuous basis at one site.
Table 6.13
Recommended maximum concentration of trace elements in irrigation waters
Element (Symbol) For water used continuously on all soils. mg/1
For use up to 20 year on fine textured soils of pH 6.0 to 8.5 mg/1
Aluminium (A1) 5.0 20.0 Arsenic (As) 0.1 2.0 Beryllium (Be) 0.1 0.5 Boron (B) 1* 2.0 Cadmium (Cd) 0.01 0.05 Chromium (Cr) 0.1 1.0 Cobalt (Co) 0.05 5.0 Copper (Cu) 0.2 15.0 Flouride (F) 1.0 20.0 Iron (Fe) 5.0 10.0
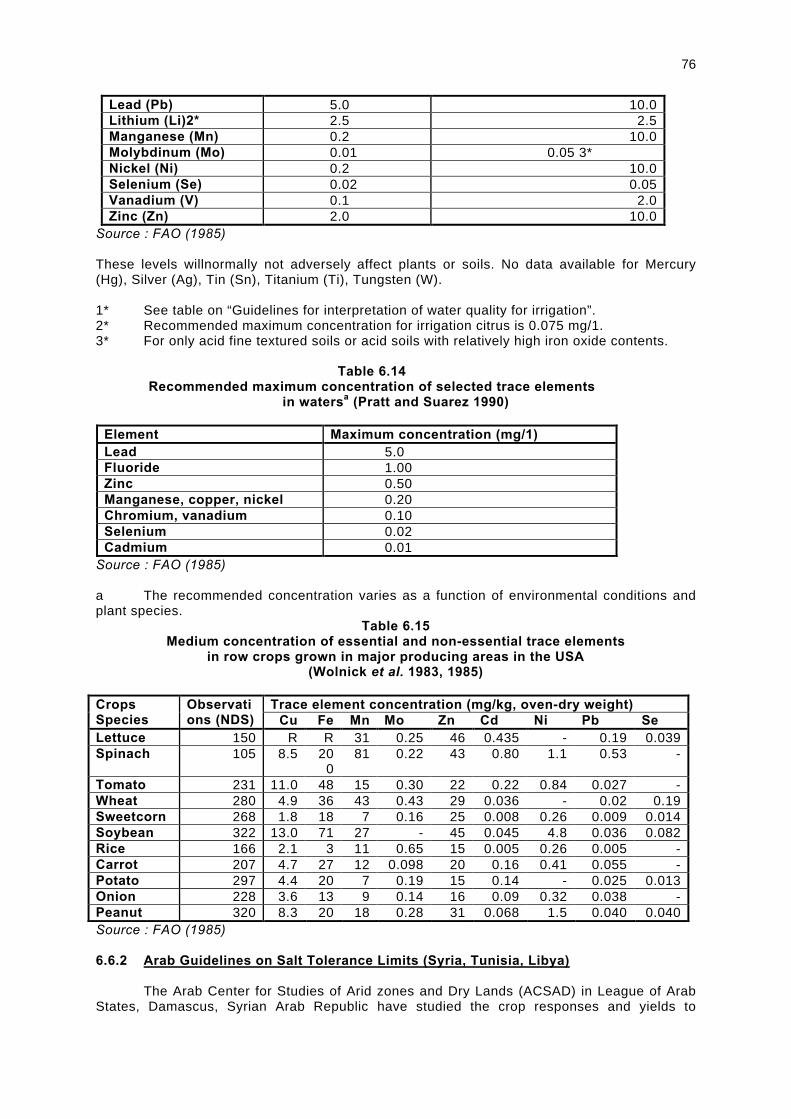
76
Lead (Pb) 5.0 10.0 Lithium (Li)2* 2.5 2.5 Manganese (Mn) 0.2 10.0 Molybdinum (Mo) 0.01 0.05 3* Nickel (Ni) 0.2 10.0 Selenium (Se) 0.02 0.05 Vanadium (V) 0.1 2.0 Zinc (Zn) 2.0 10.0
Source : FAO (1985) These levels willnormally not adversely affect plants or soils. No data available for Mercury (Hg), Silver (Ag), Tin (Sn), Titanium (Ti), Tungsten (W). 1* See table on “Guidelines for interpretation of water quality for irrigation”. 2* Recommended maximum concentration for irrigation citrus is 0.075 mg/1. 3* For only acid fine textured soils or acid soils with relatively high iron oxide contents.
Table 6.14
Recommended maximum concentration of selected trace elements in watersa (Pratt and Suarez 1990)
Element Maximum concentration (mg/1) Lead 5.0 Fluoride 1.00 Zinc 0.50 Manganese, copper, nickel 0.20 Chromium, vanadium 0.10 Selenium 0.02 Cadmium 0.01
Source : FAO (1985)
a The recommended concentration varies as a function of environmental conditions and plant species.
Table 6.15 Medium concentration of essential and non-essential trace elements
in row crops grown in major producing areas in the USA (Wolnick et al. 1983, 1985)
Trace element concentration (mg/kg, oven-dry weight) Crops
Species Observations (NDS) Cu Fe Mn Mo Zn Cd Ni Pb Se
Lettuce 150 R R 31 0.25 46 0.435 - 0.19 0.039 Spinach 105 8.5 20
0 81 0.22 43 0.80 1.1 0.53 -
Tomato 231 11.0 48 15 0.30 22 0.22 0.84 0.027 - Wheat 280 4.9 36 43 0.43 29 0.036 - 0.02 0.19 Sweetcorn 268 1.8 18 7 0.16 25 0.008 0.26 0.009 0.014 Soybean 322 13.0 71 27 - 45 0.045 4.8 0.036 0.082 Rice 166 2.1 3 11 0.65 15 0.005 0.26 0.005 - Carrot 207 4.7 27 12 0.098 20 0.16 0.41 0.055 - Potato 297 4.4 20 7 0.19 15 0.14 - 0.025 0.013 Onion 228 3.6 13 9 0.14 16 0.09 0.32 0.038 - Peanut 320 8.3 20 18 0.28 31 0.068 1.5 0.040 0.040 Source : FAO (1985)
6.6.2 Arab Guidelines on Salt Tolerance Limits (Syria, Tunisia, Libya) The Arab Center for Studies of Arid zones and Dry Lands (ACSAD) in League of Arab States, Damascus, Syrian Arab Republic have studied the crop responses and yields to
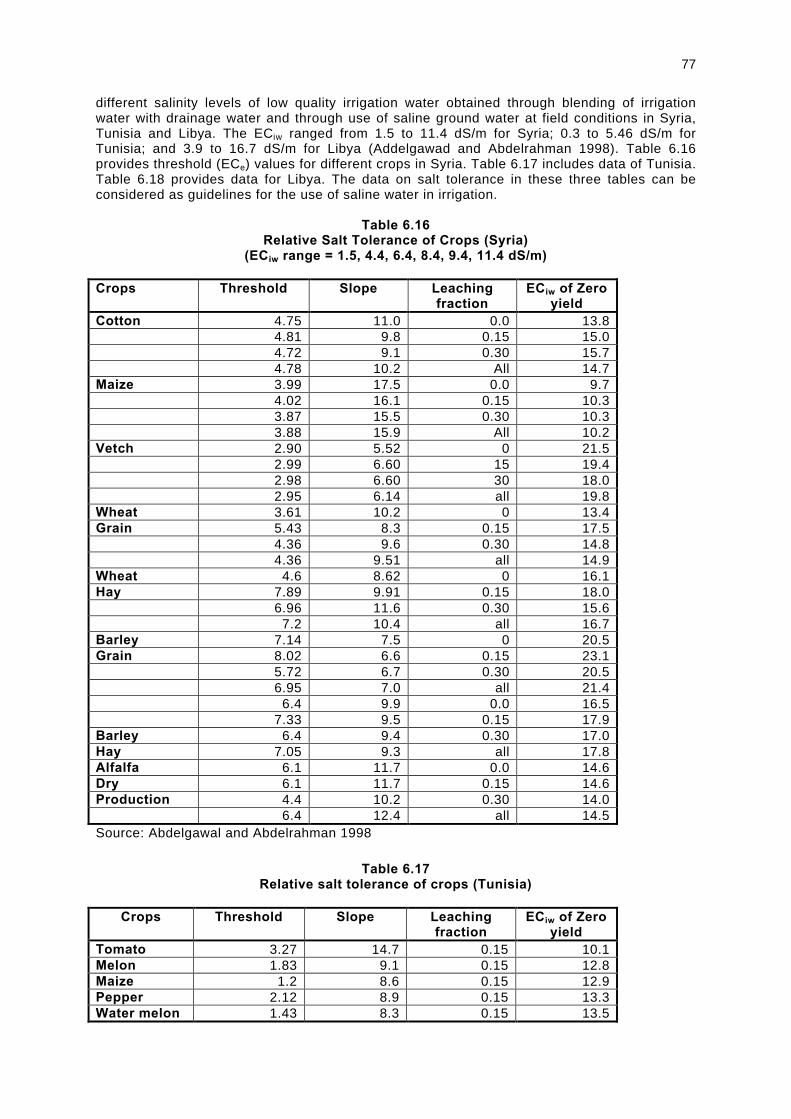
77
different salinity levels of low quality irrigation water obtained through blending of irrigation water with drainage water and through use of saline ground water at field conditions in Syria, Tunisia and Libya. The ECiw ranged from 1.5 to 11.4 dS/m for Syria; 0.3 to 5.46 dS/m for Tunisia; and 3.9 to 16.7 dS/m for Libya (Addelgawad and Abdelrahman 1998). Table 6.16 provides threshold (ECe) values for different crops in Syria. Table 6.17 includes data of Tunisia. Table 6.18 provides data for Libya. The data on salt tolerance in these three tables can be considered as guidelines for the use of saline water in irrigation.
Table 6.16
Relative Salt Tolerance of Crops (Syria) (ECiw range = 1.5, 4.4, 6.4, 8.4, 9.4, 11.4 dS/m)
Crops Threshold Slope Leaching
fraction ECiw of Zero
yield Cotton 4.75 11.0 0.0 13.8 4.81 9.8 0.15 15.0 4.72 9.1 0.30 15.7 4.78 10.2 All 14.7 Maize 3.99 17.5 0.0 9.7 4.02 16.1 0.15 10.3 3.87 15.5 0.30 10.3 3.88 15.9 All 10.2 Vetch 2.90 5.52 0 21.5 2.99 6.60 15 19.4 2.98 6.60 30 18.0 2.95 6.14 all 19.8 Wheat 3.61 10.2 0 13.4 Grain 5.43 8.3 0.15 17.5 4.36 9.6 0.30 14.8 4.36 9.51 all 14.9 Wheat 4.6 8.62 0 16.1 Hay 7.89 9.91 0.15 18.0 6.96 11.6 0.30 15.6 7.2 10.4 all 16.7 Barley 7.14 7.5 0 20.5 Grain 8.02 6.6 0.15 23.1 5.72 6.7 0.30 20.5 6.95 7.0 all 21.4 6.4 9.9 0.0 16.5 7.33 9.5 0.15 17.9 Barley 6.4 9.4 0.30 17.0 Hay 7.05 9.3 all 17.8 Alfalfa 6.1 11.7 0.0 14.6 Dry 6.1 11.7 0.15 14.6 Production 4.4 10.2 0.30 14.0 6.4 12.4 all 14.5 Source: Abdelgawal and Abdelrahman 1998
Table 6.17
Relative salt tolerance of crops (Tunisia)
Crops Threshold Slope Leaching fraction
ECiw of Zero yield
Tomato 3.27 14.7 0.15 10.1 Melon 1.83 9.1 0.15 12.8 Maize 1.2 8.6 0.15 12.9 Pepper 2.12 8.9 0.15 13.3 Water melon 1.43 8.3 0.15 13.5
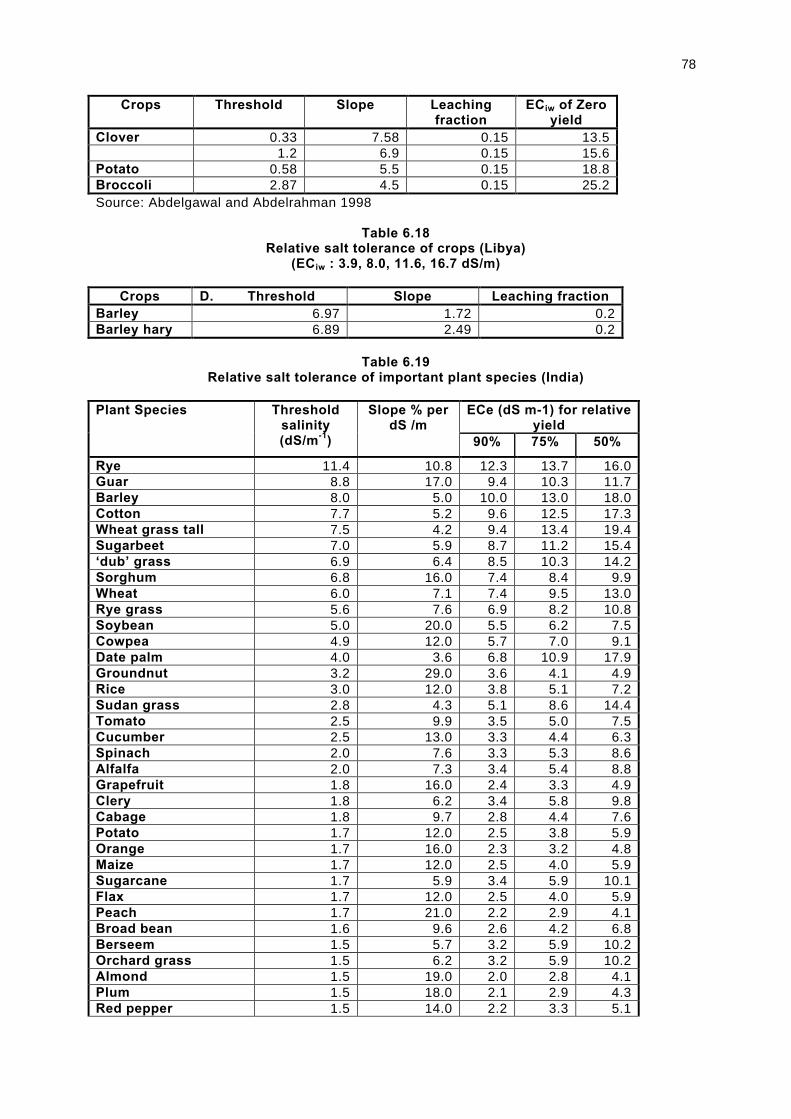
78
Crops Threshold Slope Leaching fraction
ECiw of Zero yield
Clover 0.33 7.58 0.15 13.5 1.2 6.9 0.15 15.6 Potato 0.58 5.5 0.15 18.8 Broccoli 2.87 4.5 0.15 25.2 Source: Abdelgawal and Abdelrahman 1998
Table 6.18
Relative salt tolerance of crops (Libya) (ECiw : 3.9, 8.0, 11.6, 16.7 dS/m)
Crops D. Threshold Slope Leaching fraction
Barley 6.97 1.72 0.2 Barley hary 6.89 2.49 0.2
Table 6.19
Relative salt tolerance of important plant species (India)
ECe (dS m-1) for relative yield
Plant Species Threshold salinity (dS/m-1)
Slope % per dS /m
90% 75% 50%
Rye 11.4 10.8 12.3 13.7 16.0 Guar 8.8 17.0 9.4 10.3 11.7 Barley 8.0 5.0 10.0 13.0 18.0 Cotton 7.7 5.2 9.6 12.5 17.3 Wheat grass tall 7.5 4.2 9.4 13.4 19.4 Sugarbeet 7.0 5.9 8.7 11.2 15.4 ‘dub’ grass 6.9 6.4 8.5 10.3 14.2 Sorghum 6.8 16.0 7.4 8.4 9.9 Wheat 6.0 7.1 7.4 9.5 13.0 Rye grass 5.6 7.6 6.9 8.2 10.8 Soybean 5.0 20.0 5.5 6.2 7.5 Cowpea 4.9 12.0 5.7 7.0 9.1 Date palm 4.0 3.6 6.8 10.9 17.9 Groundnut 3.2 29.0 3.6 4.1 4.9 Rice 3.0 12.0 3.8 5.1 7.2 Sudan grass 2.8 4.3 5.1 8.6 14.4 Tomato 2.5 9.9 3.5 5.0 7.5 Cucumber 2.5 13.0 3.3 4.4 6.3 Spinach 2.0 7.6 3.3 5.3 8.6 Alfalfa 2.0 7.3 3.4 5.4 8.8 Grapefruit 1.8 16.0 2.4 3.3 4.9 Clery 1.8 6.2 3.4 5.8 9.8 Cabage 1.8 9.7 2.8 4.4 7.6 Potato 1.7 12.0 2.5 3.8 5.9 Orange 1.7 16.0 2.3 3.2 4.8 Maize 1.7 12.0 2.5 4.0 5.9 Sugarcane 1.7 5.9 3.4 5.9 10.1 Flax 1.7 12.0 2.5 4.0 5.9 Peach 1.7 21.0 2.2 2.9 4.1 Broad bean 1.6 9.6 2.6 4.2 6.8 Berseem 1.5 5.7 3.2 5.9 10.2 Orchard grass 1.5 6.2 3.2 5.9 10.2 Almond 1.5 19.0 2.0 2.8 4.1 Plum 1.5 18.0 2.1 2.9 4.3 Red pepper 1.5 14.0 2.2 3.3 5.1
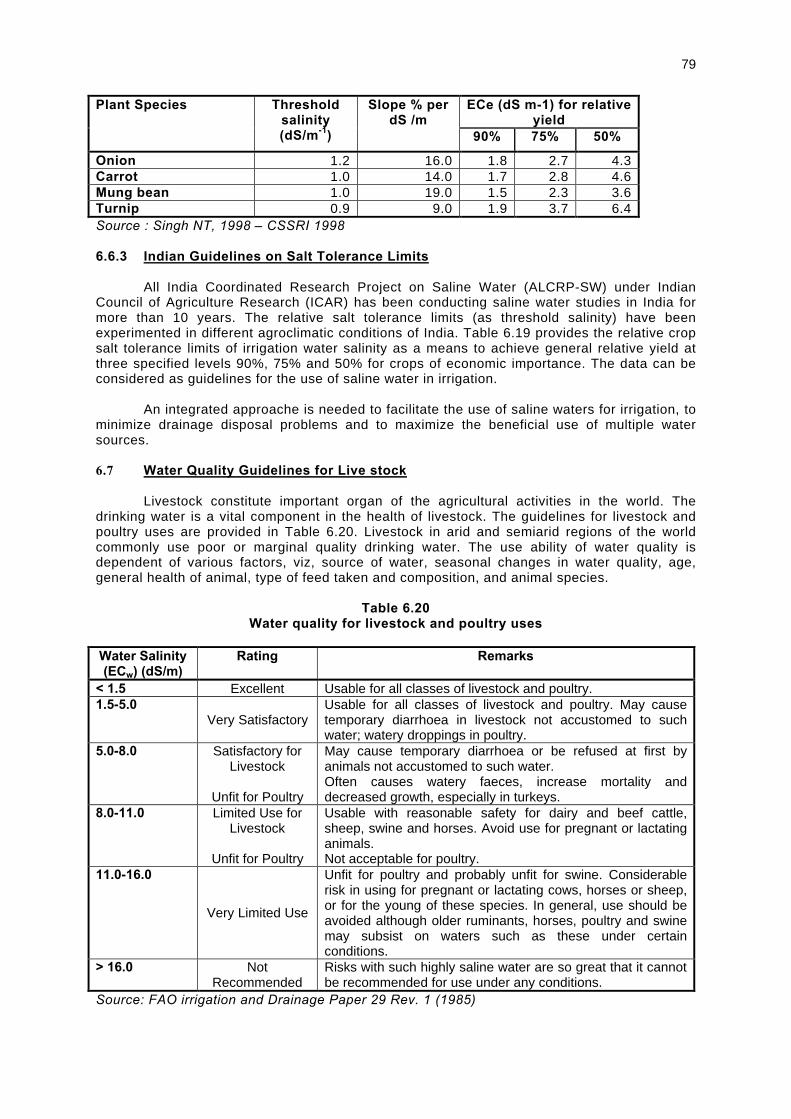
79
ECe (dS m-1) for relative yield
Plant Species Threshold salinity (dS/m-1)
Slope % per dS /m
90% 75% 50%
Onion 1.2 16.0 1.8 2.7 4.3 Carrot 1.0 14.0 1.7 2.8 4.6 Mung bean 1.0 19.0 1.5 2.3 3.6 Turnip 0.9 9.0 1.9 3.7 6.4 Source : Singh NT, 1998 – CSSRI 1998 6.6.3 Indian Guidelines on Salt Tolerance Limits All India Coordinated Research Project on Saline Water (ALCRP-SW) under Indian Council of Agriculture Research (ICAR) has been conducting saline water studies in India for more than 10 years. The relative salt tolerance limits (as threshold salinity) have been experimented in different agroclimatic conditions of India. Table 6.19 provides the relative crop salt tolerance limits of irrigation water salinity as a means to achieve general relative yield at three specified levels 90%, 75% and 50% for crops of economic importance. The data can be considered as guidelines for the use of saline water in irrigation. An integrated approache is needed to facilitate the use of saline waters for irrigation, to minimize drainage disposal problems and to maximize the beneficial use of multiple water sources. 6.7 Water Quality Guidelines for Live stock Livestock constitute important organ of the agricultural activities in the world. The drinking water is a vital component in the health of livestock. The guidelines for livestock and poultry uses are provided in Table 6.20. Livestock in arid and semiarid regions of the world commonly use poor or marginal quality drinking water. The use ability of water quality is dependent of various factors, viz, source of water, seasonal changes in water quality, age, general health of animal, type of feed taken and composition, and animal species.
Table 6.20
Water quality for livestock and poultry uses
Water Salinity (ECw) (dS/m)
Rating Remarks
< 1.5 Excellent Usable for all classes of livestock and poultry. 1.5-5.0
Very Satisfactory Usable for all classes of livestock and poultry. May cause temporary diarrhoea in livestock not accustomed to such water; watery droppings in poultry.
5.0-8.0 Satisfactory for Livestock
Unfit for Poultry
May cause temporary diarrhoea or be refused at first by animals not accustomed to such water. Often causes watery faeces, increase mortality and decreased growth, especially in turkeys.
8.0-11.0 Limited Use for Livestock
Unfit for Poultry
Usable with reasonable safety for dairy and beef cattle, sheep, swine and horses. Avoid use for pregnant or lactating animals. Not acceptable for poultry.
11.0-16.0
Very Limited Use
Unfit for poultry and probably unfit for swine. Considerable risk in using for pregnant or lactating cows, horses or sheep, or for the young of these species. In general, use should be avoided although older ruminants, horses, poultry and swine may subsist on waters such as these under certain conditions.
> 16.0 Not Recommended
Risks with such highly saline water are so great that it cannot be recommended for use under any conditions.
Source: FAO irrigation and Drainage Paper 29 Rev. 1 (1985)
80
Livestock normally tolerate marginal quality of waters readily but reported effect is sometimes depression of the appetite caused by water imbalance. The high level of magnesium is known to cause scouring and diarrhoea. Table 6.21 gives the suggested limits of magnesium in drinking of water for livestock.
Table 6.21
Suggested limits for magnesium in drinking water for livestock
Magnesium Concentration Livestock
(mg/1) (me/1)
Poultry2 < 250 < 21 Swine2 < 250 < 21 Horses 250 < 21 Cows (lactating) 250 < 21 Ewes with lambs 250 < 21 Beef cattle 400 33 Adult sheep on dry feed 500 41
Source : FAO Irrigation Drainage Paper 29 Rev. 1 (1985) Toxic substances in water generally cause toxicity in animals. Waters are more harmful as these contain greater toxic substances Table 6.22 provides guidelines for levels of toxic substances in livestock drinking water.
Table 6.22
Guidelines for levels of toxic substances in livestock drinking Water1
Constituent (Symbol) Upper Limit (mg/1) Aluminium (A1) 5.0 Arsenic (As) 0.2 Beryllium (Be2) 0.1 Boron (B) 5.0 Cadmium (Cd) 0.05 Chromium (Cr) 1.0 Cobalt (Co) 1.0 Copper (Cu) 0.5 Fluoride (F) 2.0 Iron (Fe) Not needed Lead (Pb)3 0.1 Manganese (Mn)4 0.05 Mercury (Hg) 0.01 Nitrate + Nitrite (NO3 – N + NO2 – N) 100.0 Nitrite (NO2 – N) 10.0 Selenium (Se) 0.05 Vanadium (V) 0.10 Zinc (Zn) 24.0
Source : FAO Irrigation Drainage Paper 29 Rev. 1 (1985) 1. Adapted from national Academy of Sciences (1972). 2. Insufficient data for livestock. Value for marine aquatic life is used here. 3. Lead is accumulative and problems may begin at a threshold value of 0.05 mg/1. 4. Insufficient data for livestock. Value for human drinking water used.
CHAPTER 7
DRAINAGE WATER REUSE IN AGRICULTURE
7.1 Introduction
In the water use chain, under the condition of scarcity and surplus, the water is stored or diverted from rivers for conservation, irrigation, and disposal of surplus flow into the sea. The drainage water, from natural or artificial land drainage systems, are still not adequately reused. The emphasis on water supply management worldwide is changing with the urban and industrial growth. Good quality supplies, which were previously plentiful and readily available have been over developed. Intense competition for the remaining finite supply is increasing. There is increasing attention on protecting these limited supplies from any type of degradation, which might reduce their usability or limit their development (Westcot 1988). The term drainage water ‘reuse’ has been employed mostly in the literature, but in strict sense it is a beneficial ‘use’ of saline subsurface drainage water before it is disposed of into sea or elsewhere. Drainage water reuse and disposal are relatively new areas of management. Tanji (1994) reported that effective management of drainage water demands the protection of surface and ground water from the impacts of water quality deterioration. There is a limitation for the disposal as the subsurface drainage water contains not only accretion of dissolved salts but also trace elements that may be of serious environmental concern. Modern irrigation technologies improve the efficiency of water conservation practices and reduces the quantity of subsurface drainage effluent. Shannon et al (1997) has produced a regional drainage water reuse plan (Figure 7.1). Rhoades (1998) stressed that reuse of saline drainage water and shallow ground water, should be made an integral component of water conservation, soil conservation and environmental protection programes. The reuse of saline drainage waters should not result in excessive saline soils or cause waterlogging. It was emphasised that the interception of drainage waters percolating below root zones and their reuse for irrigation should reduce the overall amount of soil degradation associated with excessive deep percolation salt mobilization,
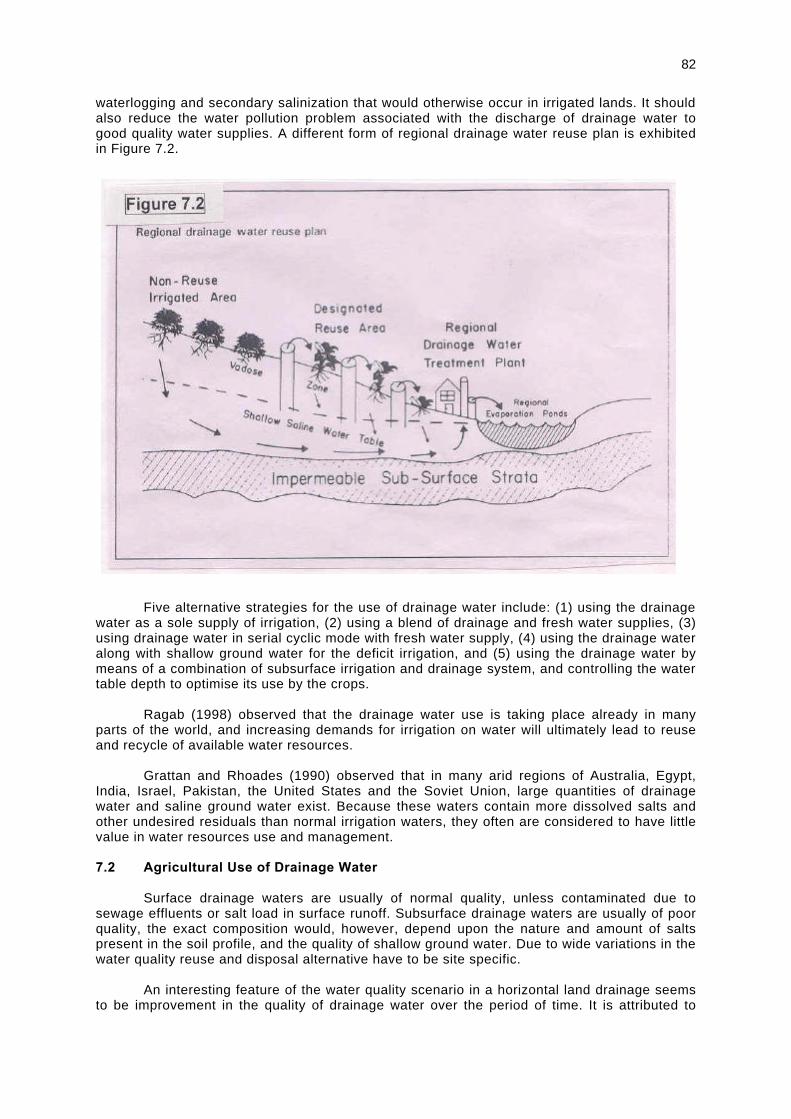
82
waterlogging and secondary salinization that would otherwise occur in irrigated lands. It should also reduce the water pollution problem associated with the discharge of drainage water to good quality water supplies. A different form of regional drainage water reuse plan is exhibited in Figure 7.2. Five alternative strategies for the use of drainage water include: (1) using the drainage water as a sole supply of irrigation, (2) using a blend of drainage and fresh water supplies, (3) using drainage water in serial cyclic mode with fresh water supply, (4) using the drainage water along with shallow ground water for the deficit irrigation, and (5) using the drainage water by means of a combination of subsurface irrigation and drainage system, and controlling the water table depth to optimise its use by the crops. Ragab (1998) observed that the drainage water use is taking place already in many parts of the world, and increasing demands for irrigation on water will ultimately lead to reuse and recycle of available water resources. Grattan and Rhoades (1990) observed that in many arid regions of Australia, Egypt, India, Israel, Pakistan, the United States and the Soviet Union, large quantities of drainage water and saline ground water exist. Because these waters contain more dissolved salts and other undesired residuals than normal irrigation waters, they often are considered to have little value in water resources use and management. 7.2 Agricultural Use of Drainage Water Surface drainage waters are usually of normal quality, unless contaminated due to sewage effluents or salt load in surface runoff. Subsurface drainage waters are usually of poor quality, the exact composition would, however, depend upon the nature and amount of salts present in the soil profile, and the quality of shallow ground water. Due to wide variations in the water quality reuse and disposal alternative have to be site specific.
An interesting feature of the water quality scenario in a horizontal land drainage seems
to be improvement in the quality of drainage water over the period of time. It is attributed to

83
dilution and over a long period the development of perched fresh water lenses may occur over native saline water. Agricultural use of drainage water or disposal should account for the quality and quantity of the available water. The management principles as applicable for the use of saline water for irrigation normally hold good for the reuse of the drainage water. A careful analysis of various factors need more stringent approach for the purpose of first generation or second generation reuse in the waterlogged and saline areas.
The sensitive crops are irrigated in rotation with primarily low salinity drainage water,
while the salt tolerant crops can be irrigated regularity with the low saline drainage water. In a serial cyclic strategy, the switching to saline water irrigation is usually made after seedling establishment. Pre-plant and initial irrigation is generally preferred with the fresh water or low salinity water. The secondary drainage water resulting from the reuse is collected, isolated and used serially for crops of increasingly greater tolerance (halophytes). The ultimate unusable drainage waters should be disposed of to appropriate outlets or treatment plants (Rhoades 1998). The subsurface drainage system laid at the sample agricultural farm in Haryana (India) has shown interesting results about the agricultural use of drainage water (Tyagi and Sharma, 1998). A subsurface drainage system was installed at a depth 1.75 m. Blend of drainage water for different salinities (6,9,12 and 18 dS/m) was used for post plant irrigation. Blending and cyclic modes of irrigation were employed using fresh water from canal and saline water as drainage effluent. Average composition of canal water, drainage water and ground water was measured from 1986-87 to 1992-93. While the salinity in canal water and ground water virtually remained same, the drainage water salinity reduced from ECdw 26.5 dS/m to 10.5 dS/m from 1986-87 to 1992-93 (Table 7.1).
Table 7.1
Average composition of canal water, drainage water and ground water during the irrigation season (December to March)
Solute concentration (me/l) Water EC
(dS/m) SAR
Ca+Mg Na HCO3 Cl Canal Water 0.5 0.8 2.0 0.8 1.7 1.0 Drainage Water (1 - 3m) 1986-87 26.5 16.8 173 156 1.8 315 1987-88 27.0 17.0 187 164 2.2 325 1988-89 18.0 14.7 135 121 2.1 232 1998-90 15.0 14.5 126 115 1.6 221 1990-91 14.0 14.5 120 112 1.5 192 1991-92 12.5 12.3 103 88 1.8 162 1992-93 10.5 11.5 85 75 1.6 151 Ground Water (20 m) 32.5 11.9 280 141 4.7 405 Source: Tayagi and Sharma 1998, ICID 1998
The use of drainage water (ECiw 10.5 to 15.5 dS/m) and canal waters in pearlmillet-wheat and sorghum- mustard rotations, supports the suitability of cyclic use strategy (Teyagi and Sharma 1998). Table 6.3 provides the positive effects of cyclic mode of irrigation for wheat and mustard crops. The use of drainage water (ECiw 6 – 18.8 dS/m) and canal water in pearl millet and Sorghum in succeeding Kharif crops after a pre-plant irrigation with canal water. Table 7.2 provides the effects of cyclic mode of irrigation.
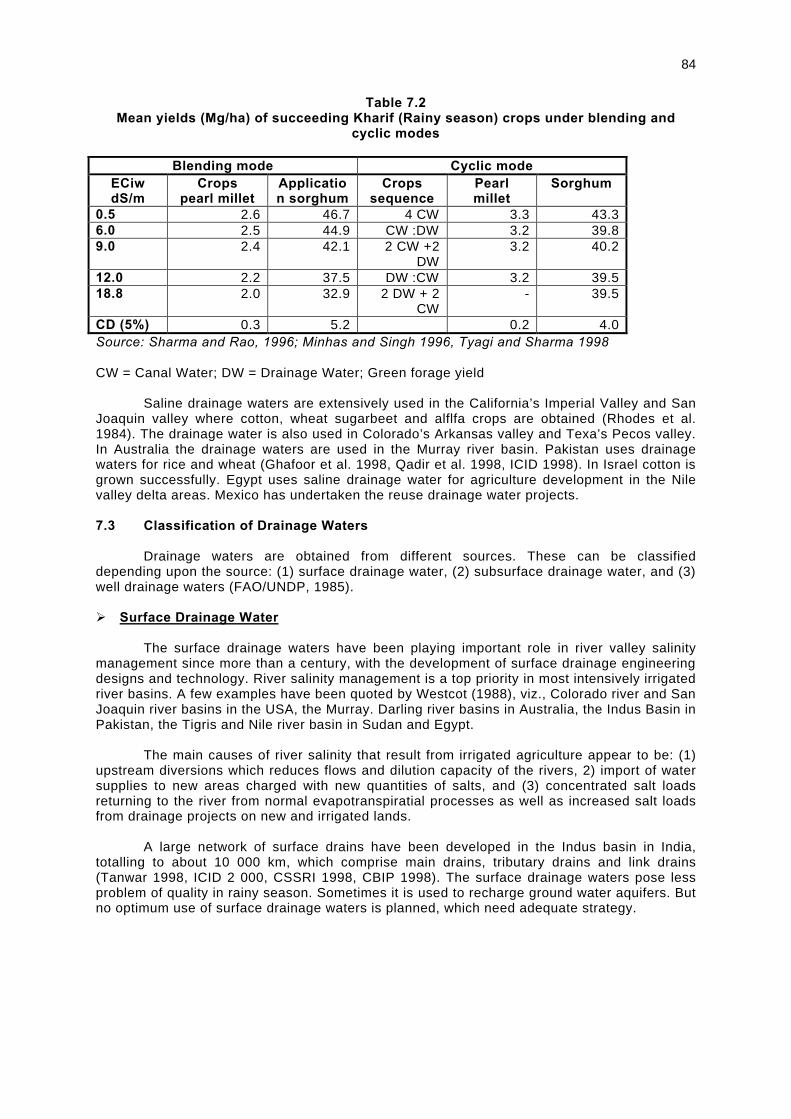
84
Table 7.2 Mean yields (Mg/ha) of succeeding Kharif (Rainy season) crops under blending and
cyclic modes
Blending mode Cyclic mode ECiw dS/m
Crops pearl millet
Application sorghum
Crops sequence
Pearl millet
Sorghum
0.5 2.6 46.7 4 CW 3.3 43.3 6.0 2.5 44.9 CW :DW 3.2 39.8 9.0 2.4 42.1 2 CW +2
DW 3.2 40.2
12.0 2.2 37.5 DW :CW 3.2 39.5 18.8 2.0 32.9 2 DW + 2
CW - 39.5
CD (5%) 0.3 5.2 0.2 4.0 Source: Sharma and Rao, 1996; Minhas and Singh 1996, Tyagi and Sharma 1998 CW = Canal Water; DW = Drainage Water; Green forage yield Saline drainage waters are extensively used in the California’s Imperial Valley and San Joaquin valley where cotton, wheat sugarbeet and alflfa crops are obtained (Rhodes et al. 1984). The drainage water is also used in Colorado’s Arkansas valley and Texa’s Pecos valley. In Australia the drainage waters are used in the Murray river basin. Pakistan uses drainage waters for rice and wheat (Ghafoor et al. 1998, Qadir et al. 1998, ICID 1998). In Israel cotton is grown successfully. Egypt uses saline drainage water for agriculture development in the Nile valley delta areas. Mexico has undertaken the reuse drainage water projects. 7.3 Classification of Drainage Waters Drainage waters are obtained from different sources. These can be classified depending upon the source: (1) surface drainage water, (2) subsurface drainage water, and (3) well drainage waters (FAO/UNDP, 1985). Ø Surface Drainage Water The surface drainage waters have been playing important role in river valley salinity management since more than a century, with the development of surface drainage engineering designs and technology. River salinity management is a top priority in most intensively irrigated river basins. A few examples have been quoted by Westcot (1988), viz., Colorado river and San Joaquin river basins in the USA, the Murray. Darling river basins in Australia, the Indus Basin in Pakistan, the Tigris and Nile river basin in Sudan and Egypt.
The main causes of river salinity that result from irrigated agriculture appear to be: (1)
upstream diversions which reduces flows and dilution capacity of the rivers, 2) import of water supplies to new areas charged with new quantities of salts, and (3) concentrated salt loads returning to the river from normal evapotranspiratial processes as well as increased salt loads from drainage projects on new and irrigated lands.
A large network of surface drains have been developed in the Indus basin in India,
totalling to about 10 000 km, which comprise main drains, tributary drains and link drains (Tanwar 1998, ICID 2 000, CSSRI 1998, CBIP 1998). The surface drainage waters pose less problem of quality in rainy season. Sometimes it is used to recharge ground water aquifers. But no optimum use of surface drainage waters is planned, which need adequate strategy.
85
Ø Subsurface Drainage Water The subsurface drainage, reuse and disposal of drainage waters are relatively new areas of management. The subsurface drainage water quality is generally degraded, but varies considerably within a river basin. Early concerns about agricultural drain waters were centred around the degree of salinity (total dissolved salts). Until recently boron was the trace element of concern. Recent findings in the Central Valley of California have shown other trace elements, some of that may be potentially toxic, which are also found in subsurface drainage problem areas. The Tulare Lake Basin in California Shows arsenic concentration as high as 1 mg/l (DWR 1985 – Westcot 1988). The trace elements in shallow ground water are of geochemical origin and toxic in nature which are removed by subsurface drainage systems. Concentration of one trace element, selenium, in the San Jaoquin rier has occurred as a result of changes in subsurface drainage water management (Westcot 1988). URS (1986) has reported the deep well injection of agricultural drain waters under San Jaoquin Valley drainage programme. Ø Well Drainage Water The well drainage and reuse of drainage waters is done on large scale in India and Pakistan. Large number of shallow tubewells have been sunk by farmers in India, whereas Pakistan has resorted to a large number of medium public tubewells. Tanwar and Gupta (1988) reported the well drainage programme of Haryana at UNESCOs international seminar on Hydrological Aspects of Drainage in Irrigated Areas at Tandojam in Pakistan. Tanwar (1998) observed inland salinity changes due to drainage of shallow ground water and reported the phenomena at international conference of the International Association on Water Quality at New Delhi. Tanwar and Kruseman (1985) studied the well drainage Phenomena in Haryana and reported it as a means of the saline ground water management (18th 1AH congress in Cambridge UK). 7.4 Quality Assessment Parameters The quality of drainage water is of specific importance in arid and semiarid zones where extremes of high temperatures and low relative humidity result in high rate of evaporation, with consequent deposition of salts, which tend to accumulate in the soil profile. The physical and mechanical properties of soils, such as dispersion of particles, stability of aggregates, soil structure, and permeability, are very sensitive to the type of exchangeable ions present in drainage water. Thus, when drainage effluent use is being planned, several factors related to soil properties must be taken into consideration (FAO 1985 and 1992). The chemical properties including salinity, sodicity and toxicity hazards, and trace elements are of the major concern in water quality assessment. The water quality parameters of drainage water use are similar as related to saline water use. Occasionally the surface drainage water to be used for irrigation may contain suspended solids, organic compounds, microorganisms and excess of nitrogen and phosphorus. In such cases, the quality parameters of health significance become important, which are discussed in Chapter 8 relating wastewater use in agriculture. Ø Drainage Water Quality The quality of drainage waters largely varies from one region to other regions and locally from one site to other sites. The surface drainage water is normally ample in rainy season but in dry season it is particularly of not any quantitative significance in planning its use. The quantity of water from subsurface drainage depends upon the intensity of irrigation, drainage layout, design, leaching requirement, soil characteristics, intensity and duration of rain, types of crops and seepage from adjoining area. The agricultural land drainage system, under subsurface drainage networks, generally carry the drainage coefficient values in the range of 2 mm /day to 10 mm / day or more. The
86
drainage coefficient is high in the rainy (monsoon) season, and low in the dry season (monsoon). But when high dose of irrigation water is applied in the dry season, temporarily, the value of drainage coefficient may increase towards higher side. The salt load, however, decreases with increase in drainage water load (Tanwar and Kruseman 1985, Rolston et al 1988, Rhoades 1974, ICID 1998, CSSRI 1998). The quality of well drainage water is a function of the hydrogeological parameters of the shallow aquifer systems and drainage requirement of the region (Boumans et al 1998). It is, however dependent upon the drainage, well design potential and energy availability as to how much drainage water (ground water) could be pumped, from an irrigated area facing waterlogging and salinity. Peoples participation is too an important factor as the people should be willing to cooperate in a drainage programme. 7.5 Drainage Water Reuse Five strategies can exist for using drainage water as supplemental source for irrigation. One is to mange shallow saline ground water table depth to compensate deficit irrigation, which also help to minimize or reduce the drainage coefficient two is to use the drainage water as a ‘sole’ source with no other supplemental irrigation. Three is to blend drainage and fresh water before doing traditional irrigation to obtain a water of acceptable quality. Four is to mange cyclic water use by repeating again and again until the period of crop maturity. Five is to use drainage water in controlled combination or jointly carry on subsurface irrigation and drainage, which controls the water table depth to optimise the use of shallow ground water by the corp. The advantages and disadvantages of these five strategies have been analysed and are given in Table 7.3.
Table 7.3
Advantages and disadvantages of drainage water reuse strategies
Reuse strategy Advantages Disadvantages Drainage waters as source of deficit irrigation.
Salt build up in top soil prohibited. No need of drainage collector. Lowest cost implication Disposal needs met in a closed loop.
Lack of control on drainage water and time schedule. Poor control of water table. Increase in salinity of ground water
Drainage water as sole source of irrigation.
Independent irrigation supply. No irrigation infrastructure needed.
Constant salt build-up in soil profile. Least opportunity for sensitive crops. Hurdle in establishment of plant stand.
Blending water supplies before irrigation
Higher to soil salinity. Hurdle in establishment of seedling. Low crop yield. Low opportunity for salt sensitive crops. Net loss of consumable water.
No change in management fabric. No extra cost.
Cyclic serial water supplies for alternative irrigation.
Low soil salinity. High opportunity for salt sensitive crops. Shallow water table not necessary. Conventional irrigation and drainage in cyclic order Reuse of secondary drainage water simultaneously.
Separate need for drainage storage tank or alternative from primary water supply. Primary water supply. Adsorbed sodium and born concretions is top soil need removal. Special management need to maintain soil filth.
Joint control of subsurface
Build of salts and Na, B in top soil prevented.
High management needs.
87
irrigation and drainage.
Better water table control then deficit irrigation strategy. Final disposal met in a closed loop network as in deficit system.
Not operable in serial mode. Not extensively studied.
The drainage water reuse strategies are applied in different parts of the world as per local suitability and the reuse mode of the drainage water. The drainage water reuse practices in some countries are indicated in Table 7.4 (Grattan and Rhoades 1990).
Table 7.4
Salinity of drainage waters reused for different crops in selected countries of the world
Salinity
Place Crops grown ECiw
(dS/m) tds (mg/l)
1. Arkansas valley. Alfalfa, Sorghum, Wheat
- 1 500-5 000
2. Pecos Valley Texas. Wheat - 2 500
Alamo water imperial Valley. Sugarbeet, Wheat - 3 500
Sam Joaquin Valley California. Cotton, Wheat, Sugarbeet (drip)
8 5 500
Iraq Pear trees - 4 000
Israel Cotton 4.6 3 000
India Wheat, Cotton 4-5 3 500
Uzbekistan Cotton - 5 000-6 000
Source: Grattan and Rhoades (1990) Note: 1. Cyclic use of drainage water permits use of high salinity water. 2. Waters that are suitable for many specialized irrigated need to be used. 3. High reuse potential exits. Among the methods of reuse of drainage water, it is important to understand the advantage of cyclic use strategy in comparison to blending. Possible sources of waters are from canals, pipe drainage network and waters that are present in shallow ground water systems. Reuse of drainage water is facilitated if non-saline good quality water is available in sufficient quantity. When rainfall occurs at certain times of the year it periodically meets some of the crop water needs and leaching requirements. Saline drainage water reuse might be most practical in areas where the costs of non-saline water are prohibitive. The saline drainage water could be used to irrigate crops of moderate to high salt tolerance at later growth stages with economical advantages even if the yield is somewhat reduced.
88
7.6 Guidelines for Drainage Water Reuse Management The management skills to reuse of drainage waters shall be addressed to implement more efficient irrigation practices and minimize water application, reduce deep percolation, and intercept, isolate, and reuse unavoidable drainage waters for salt tolerant crops. Crops or cultivars that accumulate large quantity of toxic elements need not be grown in areas where drainage water leaves potentially hazardous residuals. The drainage water reuse management parameters as guidelines are presented in Table 7.5.
Table 7.5
Guidelines for drainage water reuse management
Parameter Guidelines Climate environment conditions.
Precipitation, temperature and humidity dictate type of crop to be grown study the environment conditions and select project area.
Soil types hydro geological conditions.
Soil conditions most significant irrigation, drainage and crop behaviours due to permeability filth, salt concentration and soil water potential – analyse soils for associated characteristics.
Water quality and availability.
Water analysis and evaluation essential to determine drainage water reuse potential – analyse these parameters for the drainage project area.
Drainage system designs and reuse potential.
Critical analysis of complete drainage systems and land use pattern.
Cropping system Prevalent cropping pattern in existence and future required modifications in view of irrigation and drainage investments.
Crop selection Most important management decision based on selection criteria: crop economic value/ marketability, salt tolerance capacity, ability to absorb toxic elements (toxicity accumulation potential and proportional distribution of toxic elements within the plant) crop quality, compatibility of crop rotation, crop environmental requirements.
Irrigation water management selection of irrigation methods
Irrigation methods coherent to water quality soil conditions and crop physiology (osmatic and matric potentials), selection criteria for irrigation methods (surface furrow or basin irrigation, sprinkler irrigation and drip irrigation)
Miscellaneous crop stand establishment foliar conditions.
Avoid soil crusting, control high exchangeable sodium. Avoid excessive wetting of leaves with salty water.
Selection of strategy Select reuse strategy as application. Extension agents Develop co-operative extension agents to have information
on the saline water management practices for irrigation. They should provide useful tips to farmers on water, soil and crop managements.
Numerous factors are involved that facilitate reuse of drainage water, which must be accessible. Water supplies should be analysed and managed. Soil conditions must be clearly understood taking into account all physicochemical characteristics. Criteria for selecting crops include in major economic considerations, tolerance to salinity, specific elements, toxic elements and crop quality. Among irrigation management criteria, assessing water suitability for irrigation, irrigation method, scheduling and delta, need careful considerations. In irrigation management with saline drainage water the seed germination and crop stand establishment are vital stages, which need adequate attention. Thus, in reuse plan of the drainage water, all parameters need careful evaluation and implementation.
Chapter 8
WASTEWATER USE IN AGRICULTURE
8.1 Introduction Wastewater use for agricultural and landscape irrigation has been practiced in many parts of the world for centuries. With the advent of sewerage systems it has become non-conventional source of agricultural irrigation, especially in the vicinity of the urban centres and large rural towns. In many arid and semiarid countries the scarcity of water is a real constraint, where municipal sewage water can be considered as an integral part of the water resources as an efficient means of recycling scarce water on economic, social and environmental grounds to promote further development. Since the development of sewage systems, interest in wastewater farming or land treatment became one of the principal means of sewage disposal. Sewage farms were established as early as in year 1531 in Bunzlau Germany and those of Edinburgh, Scotland which were active around 1650 (Shuval et al 1986). First Royal Commission on sewage disposal in England in its report of 1865 stated- “the right way to dispose of town sewage is to apply it continuously to the land. And it is by such application that the pollution of rivers can be avoided”. In 1968, Victor Huge gave voice to this view in ‘Less Miserables’ “All the human and animal manure which the world loses – by discharge of sewage to rivers – and if this is returned to the land, instead of being thrown into the sea, would suffice to nourish the world”. Thus, the initial impetus was strong in favour of reusing wastewater in agriculture or through pollution in rivers and conserving water and nutrients to improve agriculture. One by one sewage farms grew along broad irrigation with strong motivation in various major cites of the developed nations viz. United Kingdom, France, Germany, Australia, USA and other countries. The sewage farming however, came into jeopardy in early 1900’s when encroachment of lands under expanding urbanization commenced and the health authorities intervened when the odor from these sites became a nuisance. Early municipal sewage irrigation projects near Los Angeles and Chicago (USA) had to be abandoned, but at the same time in 1910, the monthly Bulletin of the State Board of Health, California recommended perhaps with strong economic motivation that “In California where water is so valuable for irrigation wastewater use should be considered.” The wave did not stop and many of the early broad irrigation and sewage projects in Europe, as in the United States, were eventually abandoned because urban development had encroached upon the sewage farm areas and the problem of odor and concerns for the public health risks in transmission of disease from vegetable crops (particularly salad crops usually eaten uncooked) irrigated with raw sewage. More so, the newly invented biological processes of sewage treatment requiring much less land took trend away from sewage farming by 1912. Eventually then sewage farming was almost completely abandoned in most of the countries in the western world. But, all this changed for the world war II, when a new thrust of scientific and engineering interest in wastewater reuse developed in both the industrialized nations and the developing countries. Shuval et al (1986) have presented a detail historical perspective on early major wastewater irrigation projects of the world in World Bank Technical paper 51 of the UNDP project management report number 6. The wastewater use regained the interest among health authorities, scientists and the people to saw this as a method of preventing river pollution and the major economic benefit that could be gained by utilizing it as a water resource for agricultural development in the areas of deficit water supplies. The pioneering work has been done by a number of slate health development in the United States, and some other counties, which established guidelines and regulations to control the sanitary aspects of wastewater use in agriculture.
89
Pescod (1982) presented a comprehensive account of the wastewater treatment and use in agriculture in FAO Irrigation and Drainage Paper 47. WHO (1981) dealt with health aspects of treated sewage reuse in its report on WHO seminar, Algiers (June 1-5, 1980). In many industrialized nations, a number of planned wastewater reclamation and reuse projects have been developed as a matter of necessity to meet growing water needs in irrigation and other uses in developing countries, particularly those in arid parts of the world. This is a need to develop low cost, low technology methods for acquiring new water supplies, protecting existing water sources from pollution (Tanji 1994). Spearheading ‘second generation’ wastewater on marginal land to create new farm land may prove important in arid countries. Process of filtering wastewater through soil removes all particulate matter, most cations and some anions including phosphate are strongly adsorbed, and organic matter is decomposed by soil bacteria. These action facilitate nutrient rich soils to the advantage of agricultural productivity. The relevant aspects of the wastewater uses are discussed along with classification, quality parameters and guidelines for the use of wastewater in irrigation. The prominent countries are listed making the current reuse of wastewater as an integrated water resources planning and management. 8.2 Common wastewater Uses Agriculture is the major user of water and accept more lower quality water than domestic and industrial uses. It is evident than, that will be a growing tendency to look toward irrigated agriculture for solutions to the overall effluent disposal problem. In addition to the problem of salinity, sodicity, toxicity, nutrient and trace, elements in common waters of the arid and semiarid regions, the wastewater contains suspended solids, biodegradable organic matter (BOD), nutrients (nitrogen, phosphorous and potassium), residual chlorine and pathogens (indicate coliform organism) and other impurities. The wastewater use in agriculture or other uses could be managed if associated problems with these impurities are understood and allowances are made for them broadly. The uses of wastewater are indicted as follows. § Agricultural irrigation. § Agricultural use of sewage sludge. § Agriculture ponds – fertilizing for plants and fisheries. § Aquifer recharge. 8.3 Classification of Wastewaters Wastewater can be classified as per sources of generation and availability. These are: § Municipal Wastewater. § Domestic wastewater. § Industrial wastewater. Municipal wastewater is composed of domestic or sanitary wastewater as sewage, industrial wastewater and infiltration inflow into the sewage effluent. Domestic wastewater is the spent water supply of the community after it has undergone a variety of uses in domestic houses, commercial buildings and institutions. Industrial wastewater is spent water from manufacturing and food processing plants including thermal power plants. Inflow is storm runoff that enters the sewer system through manholes and other openings and infiltration is ground water that seeps into the sewer through improper joints or other openings. Sometimes or often in many countries the storm water is collected in a separate sewer system and is discharged into the nearest surface water course/river usually without treatment. The sewage flow is conveyed to the wastewater treatment plant for normal or advanced treatment.
90
The volume of wastewater generated in a community on per capita basis varies from 0.15 to 0.6 m3/day, excluding industrial wastewater (Tanji 1994). 8.4 Wastewater Quality Parameters in Agricultural Use The quality of wastewater in agricultural use can be considered in two ways: (1) direct agricultural needs for crops, and (2) indirect needs of the health of agricultural workers, and concern for the health impacts on the people using agricultural products grown out of the wastewater farming. 8.4.1 Parameters of Agricultural Significance The primary wastewater quality parameters of importance from an agricultural viewpoint are: total salt concentration or total dissolved solids (tds), electrical conductivity (ECw). SAR, toxic ions (boron, chloride and sodium), trace elements and heavy metals, hydrogen ion activity (pH). FAO Irrigation and Drainage Paper No. 29 Rev. 1 prepared by Ayers and Westcot (1985) provides the details of the quality parameters used in the evaluation of the agricultural water quality, which have been further discussed in the preceding sections of Chapter 6. These quality parameters can be used for guidance in the use of wastewater. 8.4.2 Parameters of Health Significance Organic chemicals usually exist in municipal wastewater at very low concentrations and ingestion over prolonged periods would be necessary to produce detrimental effects on human health. WHO (1984) has included limit values in health guidelines for organic substances as well as toxic substances. Main organic constituents include aldrin, benzene, chlordane, chloroform, DDT, hexachlorobenzene, lindane and tetrachlorethylene. Main inorganic constituents include arsenic, cadmium, cyanide, fluoride, lead, mercury, nitrate and selenium. Pathogenic organisms (viruses, bacteria and parasites) are the greatest health concern in agricultural use of wastewater. Type of pathogens include viruses, bacteria, protozoa, and helminths. The high-risk health impact of pathogenic agents is due to high incidence of excess infection from helminths; medium risk by enteric bacteria and low risk by enteric viruses. The helminthic diseases caused by Ascaris and Trichuris pathogenic agents are endemic in the population and transmission of these infections liking to occur through uncooked eaten salad crops irrigated with waste waters. The sewage farm worker exposed to raw wastewater in areas where infections are endemic through helminth parasites of Ancylostoma (hookworm) and Ascaris (nematod). Sewage farm workers are also liable to become infected with cholera if practising irrigation with raw wastewater derived from an urban area in which an cholera (enteric bacteria) epidemic is in progress (FAO 1992). Wastewater irrigation workers or wastewater treatment plant workers have excess prevalence of viral diseases. The microbiological parameters important from health point of view are: (1) indicator organism of coliform group of bacteria. Faecal streptococci group of organism and clostridium group, (2) pathogens of salmonella species (agents for typhoid), enteroviruses (agents of respiratory infections), rota-viruses (agents for gastro-intestinal problems) and intestinal nematodes (agents for infections). Crops affected by the toxic effects of wastewater irrigation can be categorised into two groups in relation to health control measures. These categories are as follows. Category A • Protection required for consumers, agricultural workers, and the
general public: Includes crops likely to be eaten uncooked, spray-irrigated fruits and grass (sports fields, public parks and lawns):
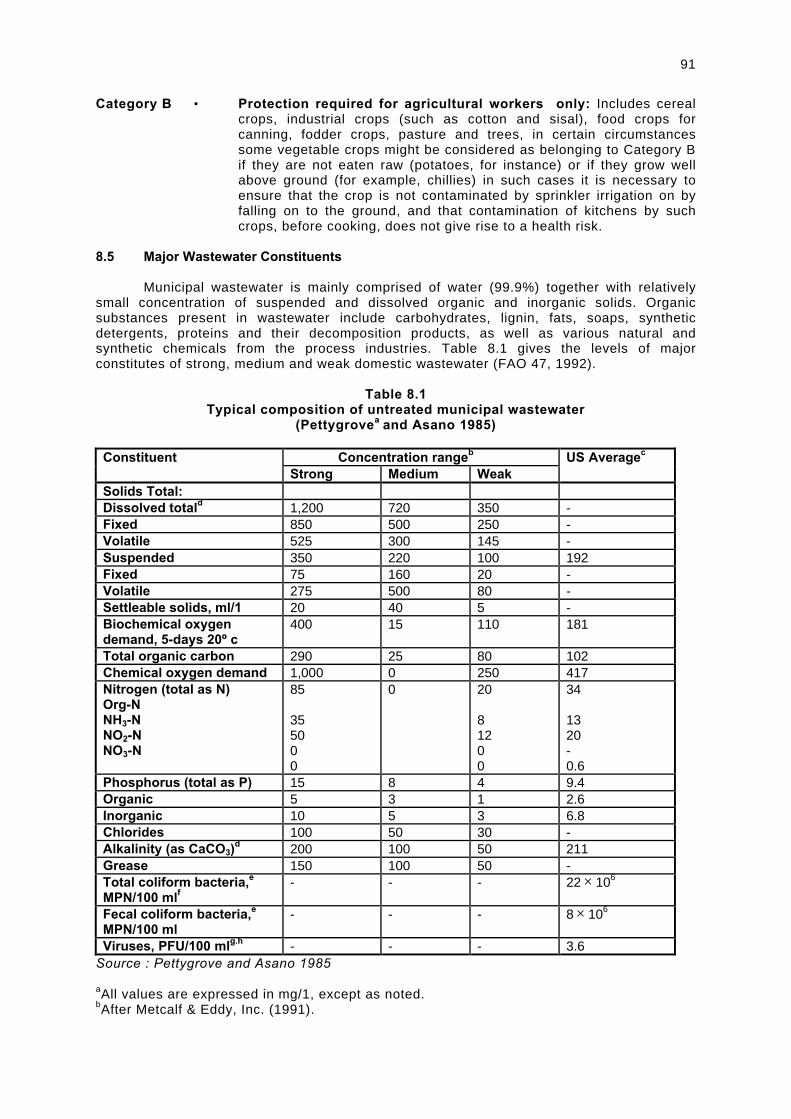
91
Category B • Protection required for agricultural workers only: Includes cereal crops, industrial crops (such as cotton and sisal), food crops for canning, fodder crops, pasture and trees, in certain circumstances some vegetable crops might be considered as belonging to Category B if they are not eaten raw (potatoes, for instance) or if they grow well above ground (for example, chillies) in such cases it is necessary to ensure that the crop is not contaminated by sprinkler irrigation on by falling on to the ground, and that contamination of kitchens by such crops, before cooking, does not give rise to a health risk.
8.5 Major Wastewater Constituents Municipal wastewater is mainly comprised of water (99.9%) together with relatively small concentration of suspended and dissolved organic and inorganic solids. Organic substances present in wastewater include carbohydrates, lignin, fats, soaps, synthetic detergents, proteins and their decomposition products, as well as various natural and synthetic chemicals from the process industries. Table 8.1 gives the levels of major constitutes of strong, medium and weak domestic wastewater (FAO 47, 1992).
Table 8.1
Typical composition of untreated municipal wastewater (Pettygrovea and Asano 1985)
Concentration rangeb Constituent Strong Medium Weak
US Averagec
Solids Total: Dissolved totald 1,200 720 350 - Fixed 850 500 250 - Volatile 525 300 145 - Suspended 350 220 100 192 Fixed 75 160 20 - Volatile 275 500 80 - Settleable solids, ml/1 20 40 5 - Biochemical oxygen demand, 5-days 20º c
400 15 110 181
Total organic carbon 290 25 80 102 Chemical oxygen demand 1,000 0 250 417 Nitrogen (total as N) Org-N NH3-N NO2-N NO3-N
85 35 50 0 0
0 20 8 12 0 0
34 13 20 - 0.6
Phosphorus (total as P) 15 8 4 9.4 Organic 5 3 1 2.6 Inorganic 10 5 3 6.8 Chlorides 100 50 30 - Alkalinity (as CaCO3)
d 200 100 50 211 Grease 150 100 50 - Total coliform bacteria,e
MPN/100 mlf - - - 22 × 106
Fecal coliform bacteria,e
MPN/100 ml - - - 8 × 10⁶
Viruses, PFU/100 mlg.h - - - 3.6 Source : Pettygrove and Asano 1985
aAll values are expressed in mg/1, except as noted. bAfter Metcalf & Eddy, Inc. (1991).
92
c Culp et al (1979). d Values should be increased by amount in demostic water supply. e Geldreich (1978). f Most problem number/100 ml of water sample. g Berg and Metcalf (1978). h Plaque-forming units. Total solids varies between 350 mg/l and 1200 mg/l with BOD from 100 to 300. The quality of tds will depend upon the nature of water supply. Table 8.2 provides the average composition of wastewater in Amman (Jordan), which shows medium to strong nature of wastewater quality, the total dissolved solids being in the range of 1170 mg/l. Chemical composition of untreated wastewater is also given in Table 8.3 by comparisons of some constituents with US averages, which seems to be in the category of medium to strong concentration range.
Table 8.2
Average composition of wastewater in Amman, (Jordan)
Constituent Concentration mg/l Dissolve solids (TDS) 1170 Suspended solids 900 Nitrogen (as N) 150 Phosphorus (as P) 25 Alkalinity (as CaCO3) 850 Sulphate (as SO4) 90 BOD5 770 COD1 1830 TOC1 220
Source: Al-Salem (1987) 1. COD is chemical oxygen demand 2. TOC is total organic carbon
Table 8.3
Major constituents of typical domestic wastewater
Concentration, mg/l Constituent Strong Medium Weak
Total solids 1200 700 350 Dissolve solids (TDS)1 850 500 250 Suspended solids 350 200 100 Nitrogen (as N) 85 40 20 Phosphorus (as P) 20 10 6 Chloride1 100 50 30 Alkalinity (as CaCO3) 200 100 50 Grease 150 100 50 BOD2
5 300 200 100 Source: UN Department of Technical Cooperation for Development (1985) 1. The amounts of TDS and chloride should be increased by the concentrations of these constituents in the carriage water. 2. BOD is the biochemical oxygen demand at 20º c over 5 days and is a measure of the biodegradable organic matter in the wastewater. Municipal wastewater also contains a variety of inorganic substances from domestic and industrial sources. Table 8.4 shows the physico-chemical properties of some industrial effluents in India. Effluents from various industrial plants of paper industries, distillery, aqueous oil, chemical fertilizers, zine smelter and refinery have a large variation in stranger
93
of inorganic ions. Heavy metals do very in wide range as per the nature of soil sludge (Table 8.5).
Table 8.4
Physico-chemical properties of some industrial effluent in India
Properties Paper Distillery Aqueous
Oil Chemical Fertilizers
Zinc Smelter
Refinery
PH 8.3 7.8 6.2 9.5 6.6 8.2 EC (ds/m) 1.76 3.0 - - 4.4
0.72
BOD (mg/L) 0.17 - 128 - COD(mg/L) 0.45 - 278 - Ca (m mol L-1) 10.6 4.8 - 122.4 546.5 Mg (m mol L-1) 3.4 7.5 - 25.3 179.5 Na (m mol L-1) 20.2 6.9 - 295.5 336.6 K(m mol L-1) 2.7 10.5 - 22.0 10.1 CO3 -(m mol L-1) - - - 101.3 HCO3 (m mol L-1) 8.4 11.6 - 586.7 CI (m mol L-1) 14.0 14.4 - - 219.5 15.0 SO4 (m mol L-1) 9.5 4.2 - - 1957 SAR (m mol L-1) 7.6 4.3 - - - Zn (mg/L) - 0.04 1.86 - 10.6 Tr Mn (mg/L) - 0.1 - - - 0.55 Fe (mg/L) - 2.2 - - 0.68 3.77 Cu (mg/L) - 0.03 2.11 - 0.05 0.23 Pb (mg/L) - - 0.254 - 0.05 0.86 Cd (mg/L) - - 0.274 - - Cr (mg/L) - - 0.140 - -
Source : NIRI Nagpur (India)
Table 8.5 Heavy metals (g/g) in soil fed with industrial effluent
Cd Pb Cr Cu Zn Mc Fe Soil 1 3.7-3.9 22-23 3.3-5.0 30-31 15.5-16 226-232 79-88 Soil 2 - - - .26-.34 1.8-2.9 9.2-11.5 9.3- 10.3 Soil 3 1265 240 17 106.5 143 Soil 4 - - - 1.1-1.6 1.2-14.2 2.9-4.0 7.7-8.4 Soil 5 - - - 5.6-7.6 4.8-17.9 8.2-11.0 22.2- 34.7
1Singh & Singh 19942 Palaniswami and shree Ramula, 19943 llangovan and Vivekanandan4,5
Totawat 1991 Pettygrove and Asano (1985) have analysed the reasons for concern as a result of constituents in wastewater treatment as well irrigation with reclaimed wastewater given in Table 8.6. Suspended solids in untreated wastewater lead to development of sludge deposits and anaerobic conditions in aquatic environment and plugging in irrigation systems. Biodegradable organics lead to depletion of dissolved oxygen (BOD). Nutrients enhances value of wastewater, but in excess of nutrients when discharged lead to the growth of unwanted aquatic life (weeds and pathogens) and pollution of ground water. Stable (refractory) organics resist conventional methods of wastewater treatment and their presence in excess may limit the sustainability of wastewater for irrigation Hydrogen ion activity (pH) leads to metal solubility and alkalinity of soils. Excessive dissolved organics in wastewater lead to salinity and permeability. Excessive chloride leads to toxic effects on crops and ground water contamination.
94
Table 8.6
Average characteristics of treated wastewater (TW) and well waters (WW) used for irrigation (in mg/l) in lasoukra compared to FAO recommended maximum
concentrations
Parameter TW WW FAO PHEC 7.6 7.60 6.5-8.5 EC 2.97 2.61 3.0 TDS(g/l) 1.82 1.71 2.0 SM 13.4 4.3 COD 51 - HCO3 370.0 228.5 600 SO4 363.0 87.5 1000 CI 554.0 648.0 1100 Ca 154.5 249.0 400 Mg 56.5 48.5 60 K 36.5 3.0 Na 366.0 214.0 900 SAR 6.4 3.2 15 N (total) 2.5-43 - 30 NH4 0.26-50.5 0.09 NO3 1.33-83.5 92.8 NO2 0.07-5.0 0.08 P (total) 4.10 - PO4 11.6 0.06 Cd - - 0.01 Co 0.05 0.04 0.05 Cr 0.02 - 0.1 Cu 0.03 0.02 0.1 Fe 0.33 0.11 5 Mn 0.05 0.01 0.2 Ni 0.06 0.05 5 Pb 0.19 0.16 2 Zn 0.12 0.04 TC/100 ml 10e4-10e6 FC/100 ml 10e4-10e6 FS/100 ml 10e4-10e6 Salmonella No Cholerae No
Source : Pettyzrove and Asano (1985) EC : electrical conductivity (in dS/m at 25º)
8.6 Wastewater Treatment The wastewater treatment allows the effluent disposal and use without danger to human health or damage to the natural environment. Irrigation with wastewater is a form of both disposal and utilization and is an effecting form of wastewater disposal. But, some degree of low cost wastewater treatment is imperative to raw municipal waster before it can be used for agricultural and landscape irrigation or aquaculture, so us to meet the recommended microbiological (limiting pathogens) and chemical quality guidelines. Municipal wastewater treatment consists of a combination of physical, chemical and biological processes and operation to remove solids, organic matter, pathogens, and sometimes nutrients from wastewater. In the order of increasing treatment level, the degree of treatment can be preliminary, primary, secondary and tertiary and advanced wastewater treatment. A disinfection step to inactivate pathogens usually follows the last treatment step.
95
8.6.1 Conventional High Rate Biological Process Treatment Systems The preliminary treatment aims at removal of coarse solids and other large materials often found in raw wastewater. The primary treatment aims at removal of settleable organic and inorganic solids by the processes of sedimentation and skimming. During primary treatment about 25 to 50% of the incoming biochemical oxygen (SS) demand (BOD), 50 to 70% of the total suspended solids, and 65% of the oil and grease are removed. Some organic (N, P) and inorganic (trace metals) associated with solids are removed, but collides and dissolved constituents remain unaffated. The secondary treatment aims at removal of biodegradable dissolved organise and collidal organic matter using aerobic biological treatment processes (activated sludge process, biofilter process, oxidation ditches process and rotating biological contactors (RBC) process. At this stage 85% of BOD, all suspended solids, and some heavy metals are removed from the wastewater, when coupled with disinfection step, substantial removal of bacteria and virus can be achieved the tertiary and or advanced treatment also referred as high rate secondary treatment aims at removal of remaining constituents of nitrogen, phosphorus, additional suspended solids, refractory organics, heavy metals and dissolved solids. The advanced treatment aims at removal of the balance organics or inorganic harmful constituents by disinfaction (injecting chlorine dosage 5 to 15 mg/l or ozone and ultra violet irradiation). A storage facility is normally created for treated wastewater to develop and maintain a critical link between the wastewater treatment plant and the irrigation system. It helps equalize daily variations in flow from the treatment plant and irrigation demands, to meet peak irrigation demands, to minimize the effects of disruptions in operation of treatment plant and irrigation system, and finally to provide additional treatment, if any required. 8.6.2 Natural Low Rate Biological Treatment Systems The natural low rate biological treatment system include: (1) wastewater stabilization ponds, (2) overland treatment, and (3) macrophyte nutrient film techniques. Stabilization ponds are the preferred wastewater treatment process (World Bank – Shuval et al 1986) in developing countries, where land is often available at reasonable opportunity cost along with enough unskilled or partly skilled labour. Wastewater stabilization pond systems are designed to achieve different forms of treatment in three stages: (1) anaerobic ponds (in use for stronger or wastes BOD upto 1000 mg/l), (2) primary facultative ponds, and (3) maturation ponds (if further pathogen reduction necessary). In overland treatment of wastewater, the effluent is made to move over water – tolerant grasses on fairly impermeable soils and the flow is collected at the bottom edge of the area into collecting ditches. The total land area is divided into small plots to allow alternating land treatment applications of efficient at intermittent intervals. The sole characteristics and design features include: land grade finished stage 2 to 8% slope, field area 6 to 44 ha, soil permeability slow with impermeable barrier, wastewater annual application rate 3 to 20 m, and typical weekly application rate 6 to 40 cm (EPA 1977 – FAO 47, 1992). Macrophyte treatment includes aquatic plant species (macrophytes) to upgrade the status of effluents from stabilization ponds. The techniques are floating macrophyte water hyacinth system and emergent macrophyle (water hyacinth) system and emergent macrophyte system. Macrophytes take up large amounts of inorganic nutrients (N, P) and heavy metals (such as Cd, Cu, Hg and Zn) as a consequent of growth requirements and decrease the concentration of algal cells through light shading by the leaf canopy and possible adherence to gelatinous biomass grown on the roots. 8.6.3 Advantages of Treatment Systems Among various sewage treatment plants, different system have certain advantages and disadvantages one over other. These depicted in Table 8.7. It is evident that low cost
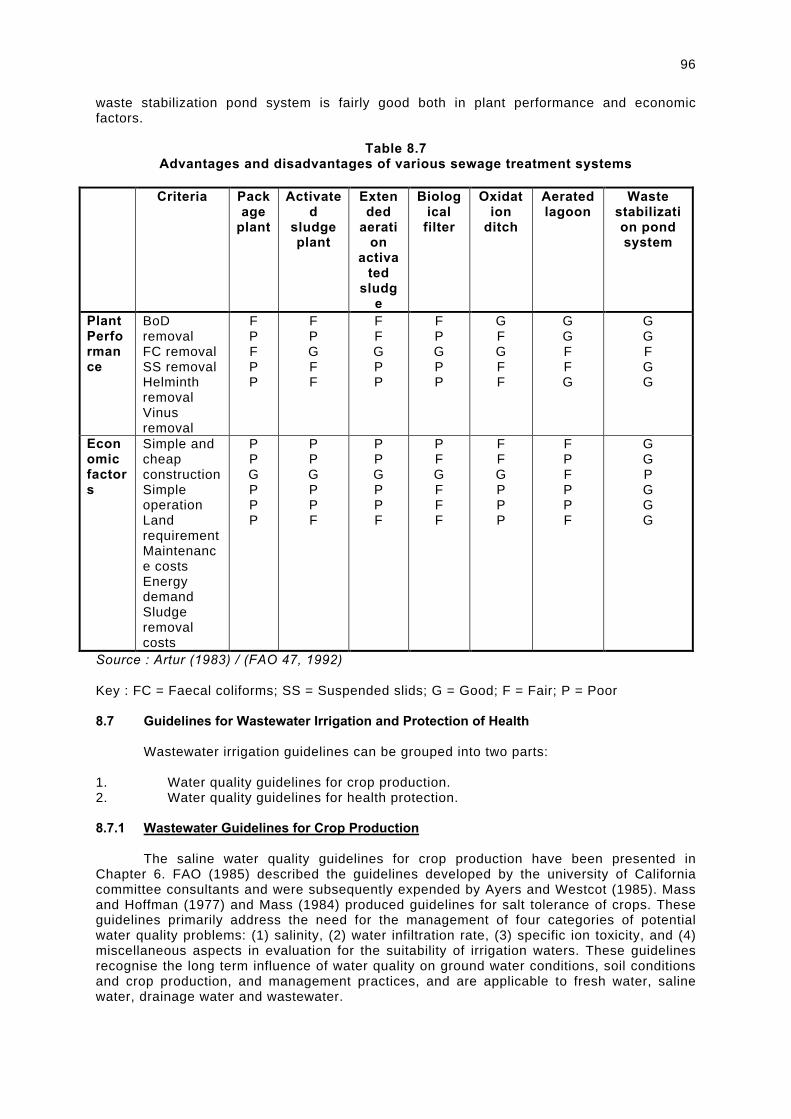
96
waste stabilization pond system is fairly good both in plant performance and economic factors.
Table 8.7
Advantages and disadvantages of various sewage treatment systems
Criteria Package
plant
Activated
sludge plant
Extended
aeration
activated
sludge
Biological
filter
Oxidation
ditch
Aerated lagoon
Waste stabilization pond system
Plant Performance
BoD removal FC removal SS removal Helminth removal Vinus removal
F P F P P
F P G F F
F F G P P
F P G P P
G F G F F
G G F F G
G G F G G
Economic factors
Simple and cheap construction Simple operation Land requirement Maintenance costs Energy demand Sludge removal costs
P P G P P P
P P G P P F
P P G P P F
P F G F F F
F F G P P P
F P F P P F
G G P G G G
Source : Artur (1983) / (FAO 47, 1992) Key : FC = Faecal coliforms; SS = Suspended slids; G = Good; F = Fair; P = Poor
8.7 Guidelines for Wastewater Irrigation and Protection of Health Wastewater irrigation guidelines can be grouped into two parts: 1. Water quality guidelines for crop production. 2. Water quality guidelines for health protection. 8.7.1 Wastewater Guidelines for Crop Production The saline water quality guidelines for crop production have been presented in Chapter 6. FAO (1985) described the guidelines developed by the university of California committee consultants and were subsequently expended by Ayers and Westcot (1985). Mass and Hoffman (1977) and Mass (1984) produced guidelines for salt tolerance of crops. These guidelines primarily address the need for the management of four categories of potential water quality problems: (1) salinity, (2) water infiltration rate, (3) specific ion toxicity, and (4) miscellaneous aspects in evaluation for the suitability of irrigation waters. These guidelines recognise the long term influence of water quality on ground water conditions, soil conditions and crop production, and management practices, and are applicable to fresh water, saline water, drainage water and wastewater.
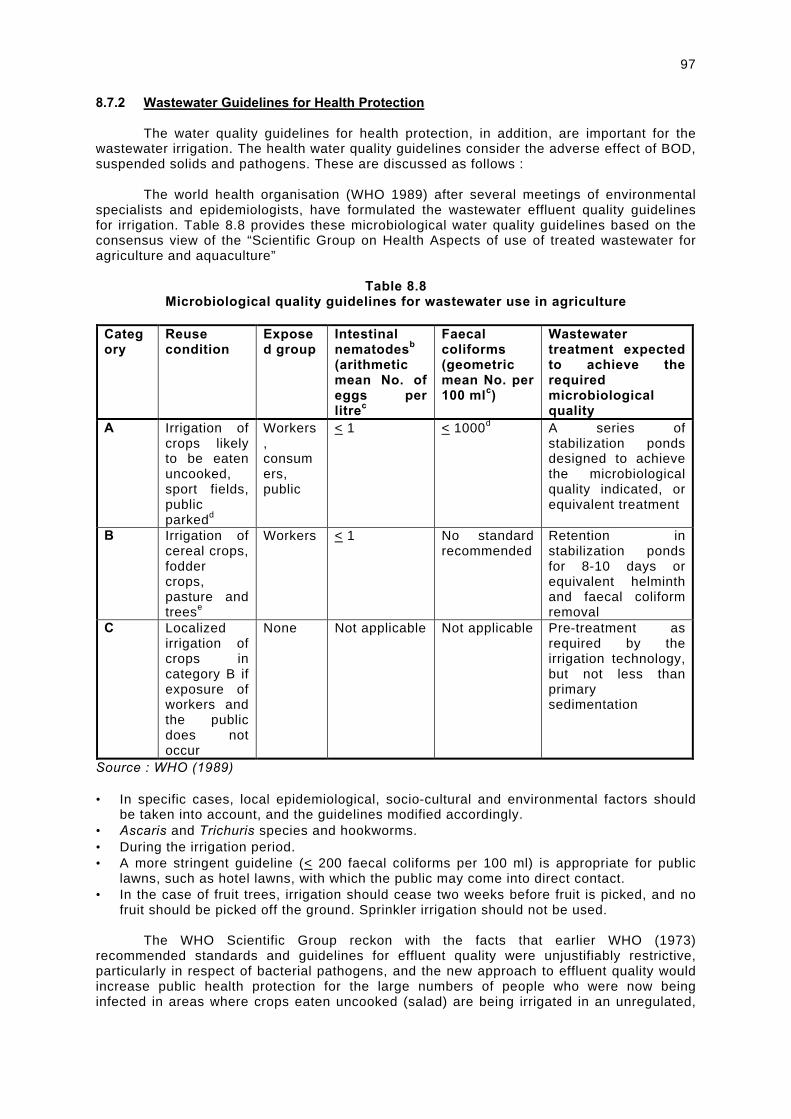
97
8.7.2 Wastewater Guidelines for Health Protection The water quality guidelines for health protection, in addition, are important for the wastewater irrigation. The health water quality guidelines consider the adverse effect of BOD, suspended solids and pathogens. These are discussed as follows : The world health organisation (WHO 1989) after several meetings of environmental specialists and epidemiologists, have formulated the wastewater effluent quality guidelines for irrigation. Table 8.8 provides these microbiological water quality guidelines based on the consensus view of the “Scientific Group on Health Aspects of use of treated wastewater for agriculture and aquaculture”
Table 8.8
Microbiological quality guidelines for wastewater use in agriculture
Category
Reuse condition
Exposed group
Intestinal nematodesb (arithmetic mean No. of eggs per litrec
Faecal coliforms (geometric mean No. per 100 mlc)
Wastewater treatment expected to achieve the required microbiological quality
A Irrigation of crops likely to be eaten uncooked, sport fields, public parkedd
Workers, consumers, public
< 1 < 1000d A series of stabilization ponds designed to achieve the microbiological quality indicated, or equivalent treatment
B Irrigation of cereal crops, fodder crops, pasture and treese
Workers < 1 No standard recommended
Retention in stabilization ponds for 8-10 days or equivalent helminth and faecal coliform removal
C Localized irrigation of crops in category B if exposure of workers and the public does not occur
None Not applicable Not applicable Pre-treatment as required by the irrigation technology, but not less than primary sedimentation
Source : WHO (1989)
• In specific cases, local epidemiological, socio-cultural and environmental factors should be taken into account, and the guidelines modified accordingly.
• Ascaris and Trichuris species and hookworms. • During the irrigation period. • A more stringent guideline (< 200 faecal coliforms per 100 ml) is appropriate for public
lawns, such as hotel lawns, with which the public may come into direct contact. • In the case of fruit trees, irrigation should cease two weeks before fruit is picked, and no
fruit should be picked off the ground. Sprinkler irrigation should not be used. The WHO Scientific Group reckon with the facts that earlier WHO (1973) recommended standards and guidelines for effluent quality were unjustifiably restrictive, particularly in respect of bacterial pathogens, and the new approach to effluent quality would increase public health protection for the large numbers of people who were now being infected in areas where crops eaten uncooked (salad) are being irrigated in an unregulated,
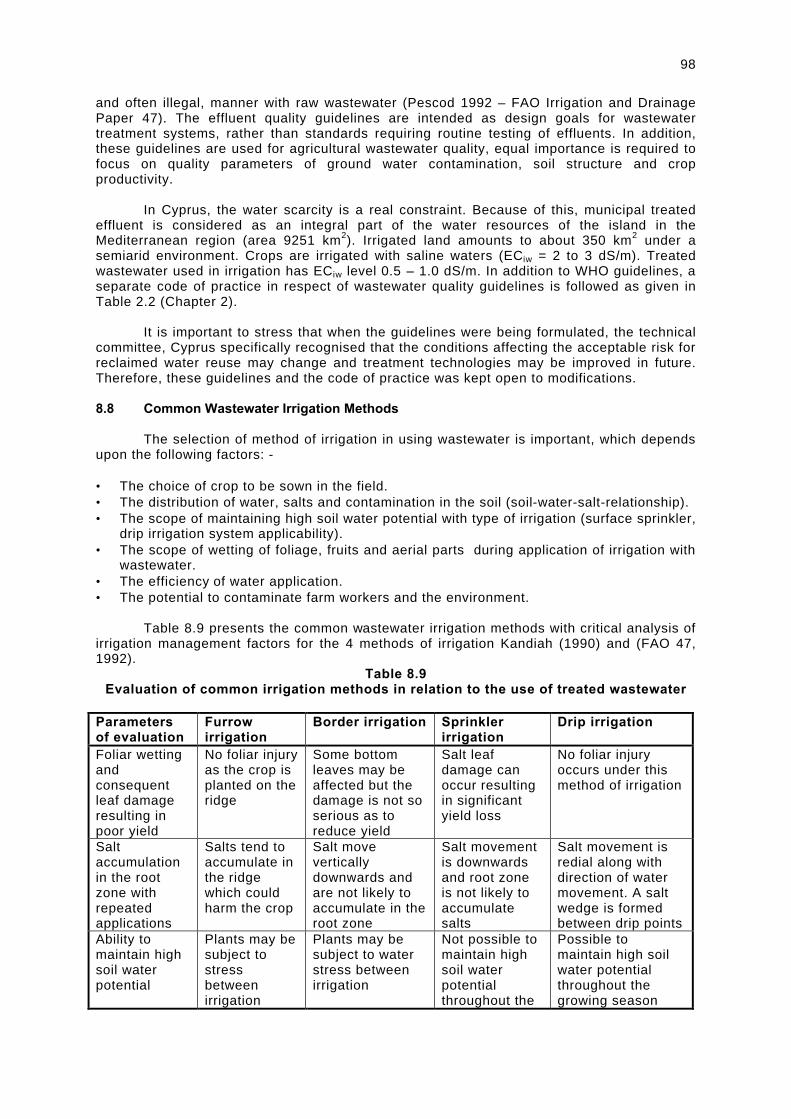
98
and often illegal, manner with raw wastewater (Pescod 1992 – FAO Irrigation and Drainage Paper 47). The effluent quality guidelines are intended as design goals for wastewater treatment systems, rather than standards requiring routine testing of effluents. In addition, these guidelines are used for agricultural wastewater quality, equal importance is required to focus on quality parameters of ground water contamination, soil structure and crop productivity. In Cyprus, the water scarcity is a real constraint. Because of this, municipal treated effluent is considered as an integral part of the water resources of the island in the Mediterranean region (area 9251 km2). Irrigated land amounts to about 350 km2 under a semiarid environment. Crops are irrigated with saline waters (ECiw = 2 to 3 dS/m). Treated wastewater used in irrigation has ECiw level 0.5 – 1.0 dS/m. In addition to WHO guidelines, a separate code of practice in respect of wastewater quality guidelines is followed as given in Table 2.2 (Chapter 2). It is important to stress that when the guidelines were being formulated, the technical committee, Cyprus specifically recognised that the conditions affecting the acceptable risk for reclaimed water reuse may change and treatment technologies may be improved in future. Therefore, these guidelines and the code of practice was kept open to modifications. 8.8 Common Wastewater Irrigation Methods The selection of method of irrigation in using wastewater is important, which depends upon the following factors: - • The choice of crop to be sown in the field. • The distribution of water, salts and contamination in the soil (soil-water-salt-relationship). • The scope of maintaining high soil water potential with type of irrigation (surface sprinkler,
drip irrigation system applicability). • The scope of wetting of foliage, fruits and aerial parts during application of irrigation with
wastewater. • The efficiency of water application. • The potential to contaminate farm workers and the environment.
Table 8.9 presents the common wastewater irrigation methods with critical analysis of
irrigation management factors for the 4 methods of irrigation Kandiah (1990) and (FAO 47, 1992).
Table 8.9 Evaluation of common irrigation methods in relation to the use of treated wastewater
Parameters of evaluation
Furrow irrigation
Border irrigation Sprinkler irrigation
Drip irrigation
Foliar wetting and consequent leaf damage resulting in poor yield
No foliar injury as the crop is planted on the ridge
Some bottom leaves may be affected but the damage is not so serious as to reduce yield
Salt leaf damage can occur resulting in significant yield loss
No foliar injury occurs under this method of irrigation
Salt accumulation in the root zone with repeated applications
Salts tend to accumulate in the ridge which could harm the crop
Salt move vertically downwards and are not likely to accumulate in the root zone
Salt movement is downwards and root zone is not likely to accumulate salts
Salt movement is redial along with direction of water movement. A salt wedge is formed between drip points
Ability to maintain high soil water potential
Plants may be subject to stress between irrigation
Plants may be subject to water stress between irrigation
Not possible to maintain high soil water potential throughout the
Possible to maintain high soil water potential throughout the growing season
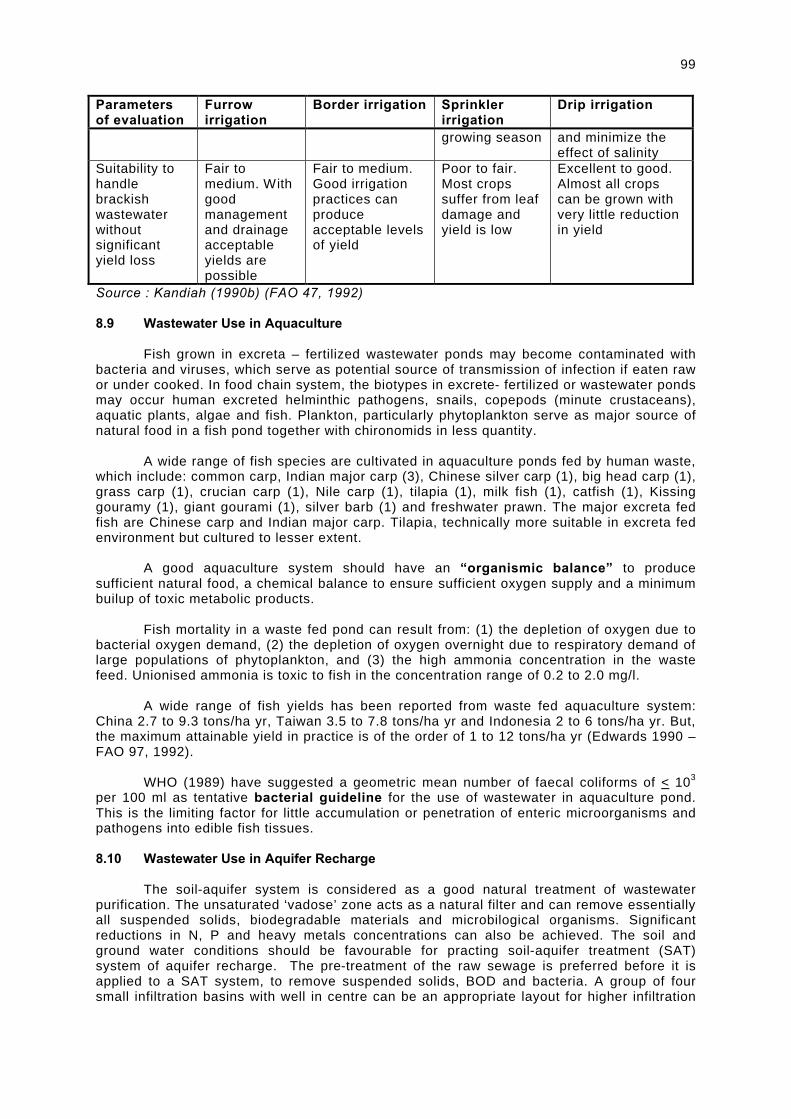
99
Parameters of evaluation
Furrow irrigation
Border irrigation Sprinkler irrigation
Drip irrigation
growing season and minimize the effect of salinity
Suitability to handle brackish wastewater without significant yield loss
Fair to medium. With good management and drainage acceptable yields are possible
Fair to medium. Good irrigation practices can produce acceptable levels of yield
Poor to fair. Most crops suffer from leaf damage and yield is low
Excellent to good. Almost all crops can be grown with very little reduction in yield
Source : Kandiah (1990b) (FAO 47, 1992) 8.9 Wastewater Use in Aquaculture Fish grown in excreta – fertilized wastewater ponds may become contaminated with bacteria and viruses, which serve as potential source of transmission of infection if eaten raw or under cooked. In food chain system, the biotypes in excrete- fertilized or wastewater ponds may occur human excreted helminthic pathogens, snails, copepods (minute crustaceans), aquatic plants, algae and fish. Plankton, particularly phytoplankton serve as major source of natural food in a fish pond together with chironomids in less quantity. A wide range of fish species are cultivated in aquaculture ponds fed by human waste, which include: common carp, Indian major carp (3), Chinese silver carp (1), big head carp (1), grass carp (1), crucian carp (1), Nile carp (1), tilapia (1), milk fish (1), catfish (1), Kissing gouramy (1), giant gourami (1), silver barb (1) and freshwater prawn. The major excreta fed fish are Chinese carp and Indian major carp. Tilapia, technically more suitable in excreta fed environment but cultured to lesser extent. A good aquaculture system should have an “organismic balance” to produce sufficient natural food, a chemical balance to ensure sufficient oxygen supply and a minimum builup of toxic metabolic products. Fish mortality in a waste fed pond can result from: (1) the depletion of oxygen due to bacterial oxygen demand, (2) the depletion of oxygen overnight due to respiratory demand of large populations of phytoplankton, and (3) the high ammonia concentration in the waste feed. Unionised ammonia is toxic to fish in the concentration range of 0.2 to 2.0 mg/l. A wide range of fish yields has been reported from waste fed aquaculture system: China 2.7 to 9.3 tons/ha yr, Taiwan 3.5 to 7.8 tons/ha yr and Indonesia 2 to 6 tons/ha yr. But, the maximum attainable yield in practice is of the order of 1 to 12 tons/ha yr (Edwards 1990 – FAO 97, 1992). WHO (1989) have suggested a geometric mean number of faecal coliforms of < 103 per 100 ml as tentative bacterial guideline for the use of wastewater in aquaculture pond. This is the limiting factor for little accumulation or penetration of enteric microorganisms and pathogens into edible fish tissues. 8.10 Wastewater Use in Aquifer Recharge The soil-aquifer system is considered as a good natural treatment of wastewater purification. The unsaturated ‘vadose’ zone acts as a natural filter and can remove essentially all suspended solids, biodegradable materials and microbilogical organisms. Significant reductions in N, P and heavy metals concentrations can also be achieved. The soil and ground water conditions should be favourable for practing soil-aquifer treatment (SAT) system of aquifer recharge. The pre-treatment of the raw sewage is preferred before it is applied to a SAT system, to remove suspended solids, BOD and bacteria. A group of four small infiltration basins with well in centre can be an appropriate layout for higher infiltration
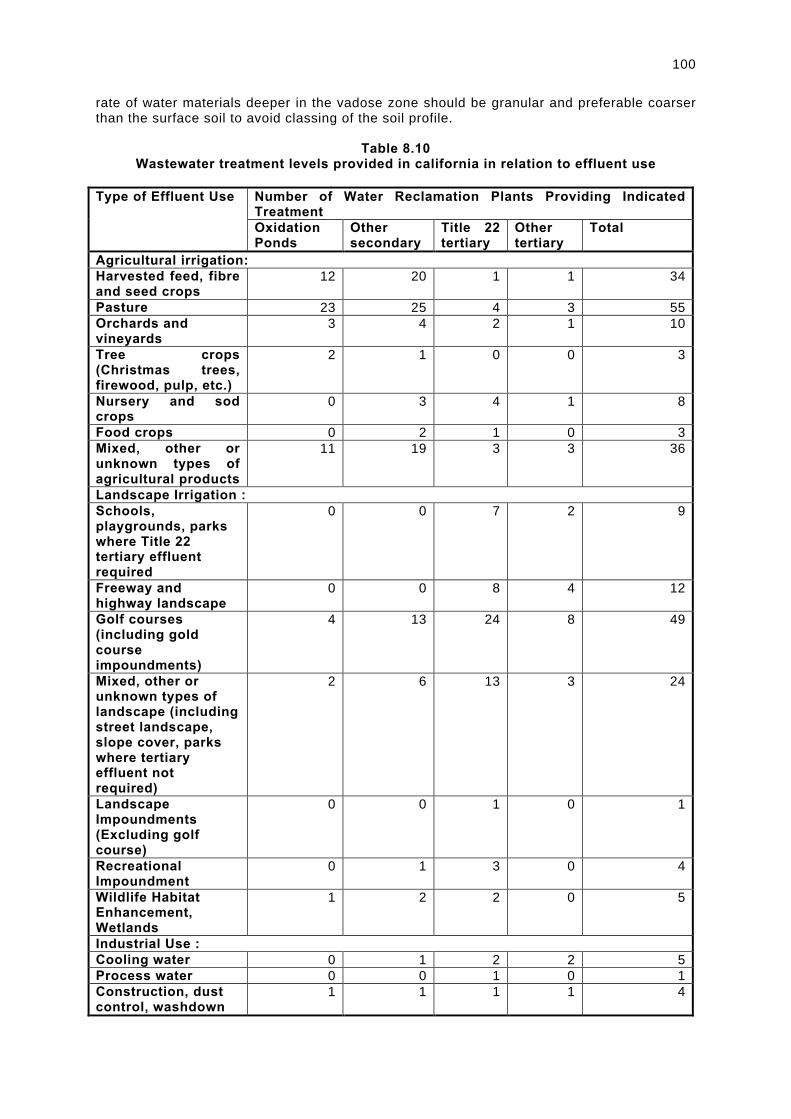
100
rate of water materials deeper in the vadose zone should be granular and preferable coarser than the surface soil to avoid classing of the soil profile.
Table 8.10
Wastewater treatment levels provided in california in relation to effluent use
Number of Water Reclamation Plants Providing Indicated Treatment
Type of Effluent Use
Oxidation Ponds
Other secondary
Title 22 tertiary
Other tertiary
Total
Agricultural irrigation: Harvested feed, fibre and seed crops
12 20 1 1 34
Pasture 23 25 4 3 55 Orchards and vineyards
3 4 2 1 10
Tree crops (Christmas trees, firewood, pulp, etc.)
2 1 0 0 3
Nursery and sod crops
0 3 4 1 8
Food crops 0 2 1 0 3 Mixed, other or unknown types of agricultural products
11 19 3 3 36
Landscape Irrigation : Schools, playgrounds, parks where Title 22 tertiary effluent required
0 0 7 2 9
Freeway and highway landscape
0 0 8 4 12
Golf courses (including gold course impoundments)
4 13 24 8 49
Mixed, other or unknown types of landscape (including street landscape, slope cover, parks where tertiary effluent not required)
2 6 13 3 24
Landscape Impoundments (Excluding golf course)
0 0 1 0 1
Recreational Impoundment
0 1 3 0 4
Wildlife Habitat Enhancement, Wetlands
1 2 2 0 5
Industrial Use : Cooling water 0 1 2 2 5 Process water 0 0 1 0 1 Construction, dust control, washdown
1 1 1 1 4
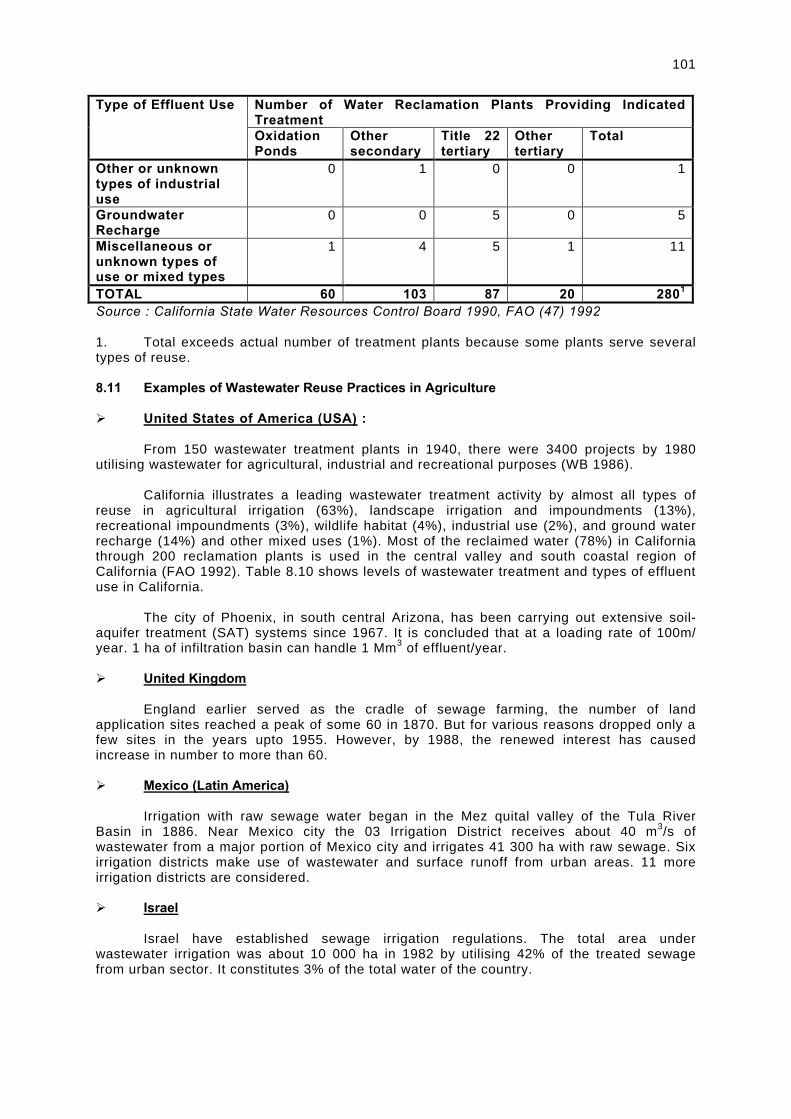
101
Number of Water Reclamation Plants Providing Indicated Treatment
Type of Effluent Use
Oxidation Ponds
Other secondary
Title 22 tertiary
Other tertiary
Total
Other or unknown types of industrial use
0 1 0 0 1
Groundwater Recharge
0 0 5 0 5
Miscellaneous or unknown types of use or mixed types
1 4 5 1 11
TOTAL 60 103 87 20 2801 Source : California State Water Resources Control Board 1990, FAO (47) 1992 1. Total exceeds actual number of treatment plants because some plants serve several types of reuse.
8.11 Examples of Wastewater Reuse Practices in Agriculture Ø United States of America (USA) : From 150 wastewater treatment plants in 1940, there were 3400 projects by 1980 utilising wastewater for agricultural, industrial and recreational purposes (WB 1986). California illustrates a leading wastewater treatment activity by almost all types of reuse in agricultural irrigation (63%), landscape irrigation and impoundments (13%), recreational impoundments (3%), wildlife habitat (4%), industrial use (2%), and ground water recharge (14%) and other mixed uses (1%). Most of the reclaimed water (78%) in California through 200 reclamation plants is used in the central valley and south coastal region of California (FAO 1992). Table 8.10 shows levels of wastewater treatment and types of effluent use in California. The city of Phoenix, in south central Arizona, has been carrying out extensive soil-aquifer treatment (SAT) systems since 1967. It is concluded that at a loading rate of 100m/ year. 1 ha of infiltration basin can handle 1 Mm3 of effluent/year.
Ø United Kingdom England earlier served as the cradle of sewage farming, the number of land application sites reached a peak of some 60 in 1870. But for various reasons dropped only a few sites in the years upto 1955. However, by 1988, the renewed interest has caused increase in number to more than 60. Ø Mexico (Latin America) Irrigation with raw sewage water began in the Mez quital valley of the Tula River Basin in 1886. Near Mexico city the 03 Irrigation District receives about 40 m3/s of wastewater from a major portion of Mexico city and irrigates 41 300 ha with raw sewage. Six irrigation districts make use of wastewater and surface runoff from urban areas. 11 more irrigation districts are considered.
Ø Israel Israel have established sewage irrigation regulations. The total area under wastewater irrigation was about 10 000 ha in 1982 by utilising 42% of the treated sewage from urban sector. It constitutes 3% of the total water of the country.
102
Ø India Wastewater reuse is widely practiced for both agriculture and aquaculture. Delhi, Mumbai, Kolkata and Chenai are the major cities encouraging wastewater irrigation, besides large number of medium and small cities in India. About 4% of 3113 cities in India have the central sewerage systems. It has been estimated that daily amount of sewage produced in India reaches 3.6 Mm3 of wastewater and about 50 to 55% is being utilised for irrigation (World Bank 1986).
Ø Germany Out of 1200 Mm3/yr water use in irrigation, the Federal Republic of Germany makes use of wastewater about 100 Mm3/yr (1958). About 3% of the total quantity of wastewater collected in sewerage system is disposed of by irrigation. Ø South Africa Wastewater use is an integral part of the overall management in South Africa, 32% of the effluent is reused which includes 16% is in irrigation (1977).
Ø Tunisia The volume of treated wastewater in 1988 was 78 Mm3 and in the succeeding year it was probably 125 Mm3. 26 treatment plants are mainly located along sea coast to prevent pollution which increased to about 54 (1996). Tunisia plans to use 95% of the treated wastewater in agriculture. Tunis city alone produces about 60% of the country’s wastewater. Irrigation rating is about 6000 m3/ha.
Ø Kuwait Raw sewage was used to irrigate forestry plantations. By 1937, four treatment plants were in operation with a total capacity of sewage treatment about 0.22 Mm3/day. Irrigation with potable water, brackish water and wastewater is practiced. By 1976, total cropped area was only 732 ha. Master plant to use treated wastewater in operation under implementation covering the period.
Ø Australia Melbourne is a principal city which has disposed of its wastewater in irrigation at 109 km2 Board of works Farm at Werribee. A total of 4200 ha of the farm is employed for irrigated pasture. 8.12 Wastewater Use Policy Implications The importance of wastewater use in agricultural irrigation has been increasingly recognized during last more than 100 years. The concept of land application and wastewater reuse has gone through a complete cycle. In early years of the twentieth century, however, the sewage irrigation projects were often ill-conceived, inadequately funded, and poorly regulated, and thus were eventually abandoned. Subsequently, the concept of reuse fell into disrepute. Today, wastewater reuse is becoming widely accepted once again, except that now it is based on rational scientific and engineering principles. In some countries, it is used to control water pollution, but more frequently it is seen as an economically feasible source of water in water scarcity areas (World Bank 1986). While the overall benefits of wastewater use in agriculture are obvious and the technology and expertise exist to allow it to be achieved without determent to public health or the environment, governments must be prepared to control the process within a broader framework of a national effluent use policy forming part of the national plan for water resources. Further, lines of responsibility and cost allocation formulae have to be worked out between the various sectors involved; local authorities responsible for wastewater treatment
103
and disposal, farmers who will benefit from any efficient use scheme and the state which is concerned with the provision of adequate water supplies, protection of the environment and the promotion of the public health. Sufficient attention must be given to the social, institutional, and organisational aspects of effluent use in agriculture and aquaculture to ensure long term sustainability (FAO 1992). Aforesaid views expressed by the World Bank Report (1986) and FAO Irrigation and Drainage Paper, 47 (1992) are absolutely relevant in respect of planning, implementation and management of the wastewater use in agriculture in different countries over the world. Adopted approach has been arbitrary and incoherent to the real needs involving the integrated development and management of the total wastewater reuse. A legislative framework for effluent use in agriculture can have an significant influence on projects feasibilities. An effective coordination is needed between the sanitary, irrigation and agriculture authorities along with farmers associations to understand, act and use wastewater in agriculture. The wastewater use project will have different cost components; collection, treatment and disposal costs, environmental protection and management costs, and disbrution cost farmers wishing to take advantage of the effluent are often able and willing to pay for what they use but not prepared to subsidize other aforesaid components of the cost structure. Authorities will need to take balanced cost sharing decision, looking the farmers capacity to share the financial burden. Institutional responsibilities must be clearly defined on allocation of effluent among competing uses, maintenance of quality standards and system reliability and investment in supporting resource with managerial and technical personnel required to administer each component of an effluent use scheme (FAO 1992). A policy framework is imperative to promote an integrated planning, design, development and management of the wastewater irrigation systems.
Chapter 9
PARTICIPATORY MANAGEMENT STRATEGY
9.1 Introduction The world countries that once promoted more government involvement in irrigation management are now adopting new polices to allow people as stake holders to organise and participate in efficient management of irrigation and drainage systems. The states role is changing significantly towards effective service organization to play an essential management role. The orientation in new thinking of the peoples participation in irrigation management is a rationalization of the respective roles of the government and water users (Groenfeldt 1997, World Bank 1994). A few decades ago the perception on irrigation management, particularly in the developing countries, was that government only is capable of managing large irrigation systems. The principal reasons for this attitude were the notion that these development projects need large capital investment, legal framework, specialized technical inputs and difficulty in charging irrigation fees from farmers. In the recent past, countries that once advocated only government involvement in irrigation management are now making significant departure from this policy and are promoting the concept of ‘Irrigation Management Transfer (IMT)’ and possible ‘Drainage Management Transfer (DMT)’ to farmers. Farmers who are chief stakeholders of irrigation as well as drainage systems, were found to have stronger inclination to manage water most efficiently (Pal 200, Tanwar 1997). Participatory Irrigation Management (PIM) challenges the assumption that only the state is capable of managing large irrigation schemes through examples from around the world that the programme demonstrates how farmers and government agencies can work together to forge new management partnership for improving the productivity and cost efficiency of irrigation investments (EDI, world bank 1996). The Economic Development Institute (EDI) of the World Bank, Washington has developed an awareness programme on PIM, through series of seminars in selected countries, lending to action plans, and subsequent guidance during the implementation of PIM program. The first international seminar was organized by EDI, World Bank in February 1995 in Mexico, than it followed to Turkey in April 1996 and in turn to a number of other countries (Groenfeldt, Svendsen and Sharma 1996). The irrigation sector in many countries of the world, particularly in developing nations is in a state of crisis. Maintenance is a financial burden on governments owing to practically negligible irrigation revenue and the rate of recovery very low. PIM is more productive and cost effective as “bottom-up management” rather than existing “top-down management” system. PIM is not an easy task but is politically feasible as it benefits both farmers and government and inevitable opposition by vested interests can be overcome.
9.2 The PIM Concept
The World Bank (1996) defined the PIM as “the involvement of irrigation users in all
aspects and all levels of irrigation management” this includes aspects of planning, design, construction, operation and maintenance, and financing at any and all levels, including the tertiary, secondary, primary main systems as well as project and sector levels.
Management is categorised into three units: (1) public sector management, (2) private
sector management, and (3) user sector management (usersism). The process of transferring management to users can be termed “userization”, which has been conceptualised by the Word Bank (1996). It has been realized that public sector management is inefficient and burdensome to the government, and the private sector management is unfit to irrigation management as it involves innumerable small and marginal farmers.
105
Navalwala (2000) has advocated that mere pre-requisites for the success of the PIM lies in three words – “Purpose, Initiative and Motivation”. Purpose is to mean the optimisation of irrigation water use efficiently; initiative is to mean the policy initiatives to promote and sustain the farmers participation in irrigation (drainage) management; and motivation is to mean to stakeholders and more particularly to government personnel because it is the latter’s mind set which is often frustrating the promotion of PIM.
The saline water management for irrigation is little more complicated process, in which
people have to play greater role to understand the problem and implement solution through PIM mechanism (Tanwar 2001). Figure 9.1 exhibits the components of the peoples’ participation in saline water management potential. The foremost central action is to develop motive among the people and create a complete mindset on PIM and then to adopt mechanism. 9.3 World PIM Issues The world over government owned and managed the irrigation sector, which is construction oriented and lacks a good management culture. Service is unreliable, untimely and inequitable. Water rates are uneconomical and poor recovery. Maintenance system is poor and irrigation infrastructure is deteriorating. The developed nations long back oriented their policies of irrigation management towards people’s participation. The developing nations are now following this. Path the USA have irrigation districts, which are managed by the people as water users. Ø India has huge gap between potential created and utilised. Low production is a common phenomena on per unit land and water production. Dependence syndrome exists among users. This situation exists in India, which is a top prominent irrigator over the world having about 75 Mha irrigated area (1996). Irrigation sector does not yield deserved efficiency, effectiveness and economy. Ø China has irrigated area of about 50 Mha with 5000 large and medium irrigation schemes each with irrigated area more than 600 ha and in addition 10 million small irrigation schemas (constructed by farmers and owned by collective/ co-operatives). Low water rates with less recovery prohibit repair and maintenance of some projects. Farmers water management organisations are not well established as collectives/ co-operatives, and ownership and responsibilities not clear on most small projects. PIM is practiced in many places, farmers demand better service and a reduction of irrigation costs and desire to receive assistance from World Bank to implement PIM. Ø Egypt has an irrigable area 3 Mha (7.5 million feddans). The Nile river shares 55.5 Bm3/yr. Recent amendment to irrigation and drainage laws permits establishment of water user groups (WUGs) on tertiary level for full operation and maintenance responsibilities. Functions contemplated to transfer to WUGs are full operation & maintenance and cost recovery. Egypt moves to expand participatory approach at secondary systems. Incentives include move from rotational to continuous level of canal water supply and reduce operation and maintenance cost. Ø Morocco, under Mediterranean climate has arable land around 9 Mha with land suitable for irrigation 1.35 Mha (1 Mha irrigation upto 2 000). Farmers are experienced in PIM. 1990 Law dictates pre-requisite of PIM for rehabilitation or new investment projects. PIM strategy is based on opening consultations with farmers, their needs and constraints, objectives and formalisation of a constraints for PIM defining the rights and obligation of both parties. PIM is developed first in pilot sectors with motivation. Incentives include rehabilitation and improvement of the network, provisions of a part of water fee, availability of bank loans and participation of farmers in planning and distribution of water. Farmers are finally involved to establish water user association (WUAs). Thus, the programme consists of PIM phase I-promotion, PIM Phase II-implementation in pilot area, and PIM phase III-expansion to the programme to other irrigation areas.

21
People’s Participation Process in Water Management
Farmers 3 Attitude Motivation
Technique 2 Training Technology
Physical 4 Financial Resources
Peoples Motive Mindset Process
Social Legal 1 Political Environment
Best water use Benefit
Peoples Participation Management
Towards Economic Development
Towards Personal Development
Towards Social Development
PIM Purpose Initiative Motivation IN è in PIM Participatory Irrigation Management
5
6
7
8 9 10
Farmers Participation in Operation and maintenance (PIM) India Dr. B. S. Tanwar
107
Ø Turkey at the end of Mediterranean sea, has average of 500 mm/yr. precipitation. Out of 77.94 Mha country’s area, gross irrigation potential is 8.5 Mha (93% surface water potential). About 3.85 Mha irrigation potential was developed upto 1995, with private farmers and Government agencies (General Directorate of Rural Services and General Directorate of State Hydraulic Works). PIM in Turkey was adopted as national policy in early 1995’s but real action was initiated when Accelerated Transferred Programme (ATP) was launched after 1993. isolated schemes of about 2 000 ha were transferred each year. World Bank sent more than 50 senior officials to Mexico and USA in 1993 and 1994 to learn about ongoing transfer programmes. This event accelerated the PIM and ATP successfully implemented. DSI support is on the quality of management in the transferred schemas and their sustainability. Irrigation associations are closely linked with civilised effort of budgetary crisis led to squeeze on financial allocations to DSI in general and O& M department in particular. Farmers avoided terminal deterioration of schemes and safeguarding the quality of irrigation services. Irrigation Association manages each about 6500 ha size of irrigation unit, with 95% of total irrigation transferred (EDI/World Bank 1996). Ø Mexico has 6 Mha irrigated area out of 200 Mha geographical area. The water availability is 5 000 m3/yr per person, through 2 200 storage dams, 2 600 diversion dams, 50 000 km canals, 4 7000 km drains, and 61 000 deep irrigation wells. Irrigation district have been transferred to 316 water users associations. Infrastructural perspective in favour of PIM is to avoid unplanned farmer intervention (like destruction of structures), to have better maintenance, to enable a quick response to system breakdown reducing maintenance costs, to reduce water theft to encourage farmers to follow cropping and water distribution schedules, to reduce conflict with government agencies. Social perspective in favour of anticipated advantages is to create feeling of ownership and commitment, to simulate self development and democratic way of living, to attain greater equity, to eliminate corruption and to achieve more efficient management. The financial perspective is to pay fee by farmers, increased level of payment of water charges, staff costs be cheaper (staff reduction, lower salaries, smaller benefit package or temporary instead of permanent employment), and better supervision of staff and contractors. The decentralisation perspective includes giving active directions to some ones own life, government agencies become more service oriented, farmers represent action (their leaders), more equitable water distribution, spin-offs from self-organization to other sectors, empowerment of water users, and water users become partners instead of beneficiaries. PIM can be introduced successfully, when incentives exist for the government agency to change its role (loss of staff in government diverted for establishing new WUA), incentive to the farmers (creation of win-win situation for government and farmers). Financial crisis in Mexico was a negative incentive. Farmers need to get awareness about rights and responsibilities together. WUAs need guidance and external support services. Political commitment and contained support are needed to WUAs. Ø Philippines has formed national irrigation Association (NIA) which become a service oriented institution. Government has supported institutional and legislative changes, thereby farmers became responsible for operation and maintenance of irrigation systems below 1 000 ha. National irrigation system and commercial irrigation systems coexist, with size difference less or more than 1 000 ha. Amendments to the charter or national irrigation systems in 1974 opened the door for a wide range of farmers participation in irrigation development. In 1975, three conditions were laid mandatory for construction of an irrigation project: (1) formation of water user association, (2) registration of WUAS with Exchange Committee of the Government, and (3) turning over the management of the completed irrigation system to the Irrigation Association (IA) under to terms and conditions of the contract between NIA and IA. Irrigation is a federal subject and any law/decree passed by the federal government is applicable to the entire country.
108
9.4 PIM-A New Paradigm The world has entered a new paradigm (model) of irrigation management. This new paradigm can be called “Userism” or management control by the water users. The world trend no longer find expending irrigation agencies. As is clear from the aforementioned global trends, one by one world countries are adopting PIM in more stronger convictions. Among various countries each of the cases of the Phillippines, Mexico and Turkey, has some unique features. The Phillippnes PIM took birth in mid 1970s when the government took a policy decision to move towards “self financing”. In Mexico, PIM was born from the “debt crisis” of the 1980s which forced the government into bankruptcy. In 1990, Mexico transferred the first irrigation district to the water users. By 1995, more than two-third of the country’s 3.2 Mha irrigation network divided into 80 irrigation districts, had been transferred to 316, irrigation associations. The farmers hired their own technical staff-engineers and accountants to run their system. The canal would be of water users on a 20 year concession, which is in practice a transfer of ownership. But, there was also a ‘stick’. If farmers refused to take over management, the government could offer no assurance that the canal network could be kept in proper repair and maintenance. So, it is called as ‘carrot’ and ‘stick’ approach. In case of turkey, it was a dramatically a rapid transfer of management responsibility from the government to farmers, with a more attractive package to lure the farmers into self management under Accelerated Transfer Programme, (ATP) which allowed farmers associations subsidy of water fee if that took over full operation and partial maintenance of the systems. Thus, the phillipines is an example of “Gradual Organising Approach” using social catalysts”, in Mexico it was a “big bang” approach; and. Turkey adopted a third model by rapidly transferring operational functions, but only gradually transferring maintenance function as ‘see-go’ approach, linking the association, closely to local municipal governments.
9.5 International Network on Participatory Irrigation Management (INPIM) INPIM was established in May 1995 as a non-profit organization with a mission to facilitate participatory irrigation management ‘through the exchange of people, ideas, and training materials. INPIM is registered in Washington, DC, USA. The Economic Development Institute (EDI) of the World Bank serves as the secretariat. Financial Support to INPIM is provided through a grant from the Netherlands government which is administered by EDI. The objective of INPIM is to stimulate high level policy dialogue on PIM within individual countries, and eventually worldwide, leading to policy commitment and actions. INPIM pursues this objective primarily through the exchange of information and experience among professionals working on PIM> the organisation exchange ideas through a quarterly INPIM newsletter, and training materials. It has some “Fellowship Programmes” and “consultant Referral Service”. 9.6 PIM and Saline Water Management for Irrigation PIM is still at infancy stage for the centuries old irrigation systems all over the developing world. The problem of use of saline water, particularly in the saline waterlogged areas in canal commands, is intimately associated with the existing irrigation network. It is evident that the saline water management for irrigation and PIM are inseparable element. Normal PIM concepts, objectives, and implementation steps here to follow in the same mode as that of the prevalent irrigation infrastructure. Figure 9.1 shows the components of the participation in the saline water management program. 9.7 Participatory Drainage Management The drainage in an irrigation command proceed hand in hand, depending upon the creation of waterlogging and salinity and water management needs. The drainage management includes: improve drainage service, improve drainage efficiency, better operation and
109
maintenance, legal aspects of drainage, financing of the drainage management activities, awareness motivation and training to farmers drainage societies and local persons involved in drainage management. The examples of participatory drainage management organisation are not much available. Singh et al. (1995) have reported a study about achieving farmers participation for accelerating adoption of subsurface drainage technology under an Indo-Dutch operational research project on subsurface drainage in Haryana, India. Actual farmers beneficiaries 28 were chosen to find out their response on various aspects of subsurface drainage technology. A need for ‘farmer participation’ has long being acknowledged, many on-farm projects have lacked meaningful interactions with local people (Farrington and Martin 1987 – CSSRI 1995). Farmers organisation need development, particularly in managing farm level subsurface drainage and reuse of drainage waters in crop production. The long term strategic plan for the farmers participation on the subsurface project (HOPP, Gohana, Haryana) under the Netherlands assistance comprised of five distinct objectives: • Creation of an atmosphere of pilot drainage area farmers cooperation with HOPP goals and
objectives. • Mobilization of Project area farmers for drainage construction intervention. • Organisation of farmers in each drainage block into a FDS. • Turnover of the operation and maintenance of the installed SSD system to the farmers
drainage societies. • Monitoring, evaluating and faciliting the viability and functioning of the farmers drainage
societies. Formers are aware of the goals of the HOPP subsurface drainage intervention. While there are occasional difficulty with some individual farmers it is evident that overall there is spirit of cooperation. Drainage blocks on completion have been transferred for drainage management to the farmers drainage societies. It is emphasized that the ongoing vitality of the farmers drainage societies will depend upon the considerable support of the project. 9.8 Women’s Participation in Saline Water Management Traditionally, it is believed that men’s role is more predominant in irrigation activities rather than women in irrigation. Particularly in large irrigation systems, the conflicts that arise in water scarcity conditions and interaction with other neighbouring farmers in sharing the water, and also with the irrigation officials are the constraints normally identified for women’s non-acting role in irrigation water resource management. The traditional arguments like “Women are not the direct stake holders of irrigation systems; the social norms and values are constraints to the women’s active participation; and the women’s burden will be increased etc.”, which are all practically true in the larger sense, are put-forth against the participation of women in irrigation management. Margreet-Zwartween (1993), International Irrigation Management Institute, Colmbo, Srilanka in a paper on “Gender issues, Water issues – Discussion” draws references to suggest that few women in countries of Peru, Pakistan, Indonesia and Philippines are directly engaged in irrigation. In the same study she says – “In the process of turning over operation and maintenance responsibilities from the irrigation agency to farmers, female irrigators unexpectedly turned out to be very interested and willing to participate in WUAs. This wish was strongly supported by their husbands; it was felt that some tasks would be better performed by women and that irrigation decision making is something which concerns both male and female members of households”. Water crisis being faced today is newly that of distribution of water, knowledge of resource, and not one of absolute scarcity. Therefore, the “ethics of distribution” and “relative deprivation” underlie most water management decisions. Meaningful participation of stakeholders especially women is a necessary condition to realize the human right to water. Ethical issues concerning water uses tend to revolve around distribution of benefit and costs of
110
the services and distribution of risks. These include service for nature and ecology as well as people. Women are the key water managers in many small villages and communities. As such they become the keys to maintenance and operation of facilities and frequently have the greatest direct interest in and bear the greatest direct impact of water procedures. But, they are rarely involved in strategic decision making process regarding water resources management. Studies show that participation of women in both “ethical approach” as well as the “pragmatic approach”. Water projects with women’s participation are more likely to be sustained and to generate expected benefits. This importance was normally recognized in the Dublin principles and clearly implied in many other UN deliberations. Guaranting women’s rights to water has a direct impact on the community. Participation of women in water management becomes an ethical imperative for social development (Uamas and Priscoli, 2000). Historically, it has been men from the more settled and powerful groups that have had greatest access to the benefits and increased income from irrigated agriculture (FAO 53, 1995). The United Nations has spearheaded a global debate on the role of women for decades. There now exists a worldwide awareness of gender issues, which nevertheless remain a vital concern for humanity. There appears to be a consensus about women’s participation in water management to ensure sustainable development of water resources. Many water programmes now place a focus on women’s participations. This can simply result in placing more burden on the women. To ensure that women receive the resources needed to contribute to water management and ensure sustainability of these programmes, women must receive an equitable share of development resources and benefits.
Chapter 10
ENVIRONMENTAL AND SOCIOECONOMIC IMPACTS OF SALINE WATER USE
10.1 Introduction The challenges of poverty and hunger remain as ever great in compelling situation of the increasing population in the world with much faster rate in the developing countries. The number of the world’s undernourished is still on the increase, despite the remarkable achievement made in agricultural development, particularly in developing regions. Increasing food production to meet the needs of the increasing world population on a sustainable basis remain the primary goal of all nations (FAO 48, 1992) on this context, the irrigation plays a paramount role (17% of the total arable lands accounts for 35% of the global harvests). Irrigation has the ability not only to increase the production for unit area of land but also to stabilise productions with minimum probability of crop failures. However, irrigation requires large water input, an essential commodity but now in short supply with increase in demand. Conventional water supply of good quality water resource is increasingly becoming scarce, such as saline ground water, drainage water and wastewater for irrigation. Shalhevel and Kamburov (1976) reported that waters with salinity as high as 6000 mg/l (0.6%) have been used for irrigating salt tolerant crops. Mass (1990) reported the successful crops with salinity of 1.3 to 9.4 dS/m. Rhoades (1992) has emphasised the use of saline water and reuse of drainage water for food production to meet increasing demands. Kandiah (1998) focused the importance of saline water use in agriculture, emphasizing the potential problems of salinity, sodicity, specific ion toxicity and nutrient imbalance, which are damaging the environment in general and to the aquatic ecosystem in particular. It was suggested by him that not only on-farm level but the environmental and economic impacts of saline water use should be evaluated at all levels, that is, on-farm, off-farm (downstream in on-farms areas) and basis level, before introducing saline water use in irrigation development projects, and measures to mitigate such effects should be enforced for sustainability of these projects. Similarly, the care has to be taken when applying wastewater or sewage sludge to prevent any form of environmental impacts (FAO 47, 1992). The poor quality saline and alkaline waters can be used for irrigation more effectively if proper crop, soil and water management projects are followed but there is little information about its social and economic consequences, where the problem is acute and adversely affecting agricultural production, soil fertility and environment (CSSRI 1995, 2000). It is imperative to develop appropriate approaches to study socio-economic aspects due to use of low quality irrigation waters and evolve economically viable techniques for the safe utilization of saline waters for irrigation to reduce economic losses for sustaining crop production in the saline environment. Two economic aspects are mainly involved: one relating to the reclamation of saline and sodic soils prior to cultivation by leaching or drainage and the two is to the use of saline water for irrigation. 10.2 Environmental Impacts of Saline Water Use Agricultural as the single largest user of fresh water under conventional irrigation systems on a global basis is a major cause for degradation of surface and ground water resource, through soil erosion and chemical runoff, has become a major concern for the global implications of water quality. All types of agricultural practices and land use including animal feeding practices are treated as non-point environmental pollution source (FAO 55, 1996). The on-farm, off-farm and basin environmental impacts of the saline water use, evidently, are considered as non-point impacts. The environmental impacts of saline water use are discussed as follows.
111
Ø Environmental Impacts: On-Farm Phase The farm level effects of the saline water use are not adequately managed includes: 1) degradation of soil quality and productivity, and 2) degradation of crops health and productivity, and 3) degradation of perched ground water. The adverse environmental impacts on soil system may include: soil salinization, soil sodification, soil hardening, and other associated phenomena. Soil salinization or sodification occur due to accumulation of salts in the root zone and in perched ground water in absence of adequate drainage when the saline water is used without following suitable soil and water management practices. In presence of high sodium content in the saline irrigation water (sodic water) the soil complex accumulates the excess sodium ions and the soil will turn into sodic soils. These soils loose their permeability and tilth, which is considered as high damage. The misuse of saline water may cause waterlogging and salinity. The soil submergence under water ponding, loss of crop cover, soil crusting and soil erosion are the other environmental impacts. Some saline waters may have high concentration of toxic elements (Na, Cl, B), which affects directly the crop health and productivity. The saline drainage water with excess nutrients (NO3, P) is harmful to the corps. In the case of sprinkler irrigation with saline water, the foliage / fruit may get damaged and hence reduced marketability. Farm level adverse impacts can be mitigated if proper environmental management measures are addressed like leaching and drainage. There are appropriate technologies available to employ leaching methods and integrated farm drainage including surface drains, subsurface pipe drains, and drainage wells, as per the standards of applicability. Ø Environmental Impacts: Off-Farm Phase The drainage disposal downstream of farm drainage through collector lines causes the soil salinity, which may adversely affect the environment. The degree of negative impacts will depend upon the quantity and quality of the disposal effluent. The reuse of drainage water in unscientific manner may accentuate the problem. Kandiah (1990, 1998) identified various environmental hazards, which include: (1) waterlogging and soil salinization, (2) surface water pollution in streams and other water bodies, (3) ground water pollution, (4) pollution of wetlands and changes in flora and fauna, (5) specific ion toxicity in wetlands and drainage evaporation ponds, (6) entry of toxic elements into human food chain and consequent upon outbreak of malaria and other waterborne diseases. Kandiah (1998) indicated the off-farm environmental degradation examples from the Mahi Right Bank canal project, Gujarat (India), Amibara (Ethiopia) irrigation project, and the San Jaoquin valley of California (USA). The California example is most critical, where disposed of effluent in the evaporation basins or ponds contain dissolved salt concentrations in the range of 2 500 to 65 000 mg/l along with severe trace elements (As, B, Mo, Se, U and V). The maximum environmental hazard was from Se, which caused immense damage to aquatic birds in their reduced reproduction, deformity and deaths (Cervinka 1990). The mitigation of serious environmental hazards at off-farm phase is a function of complex combinations of physical, chemical, biological and integrated processes. These processes in integrated applications control excess salt concentration, agrochemical, nutrients and toxic substances. It is a common agricultural practice to reuse surface return water or the discharge runoff to local watercourses usually for downstream reuse, but excess contamination and accretion of harardous elements become a matter of great environmental concern. Tanji (1994) reported the degree of concentration of salts content in drainage water of the San Jaoquin Valley must be reduced from average 9820 mg/l to 600 mg/l to meet water standards. Emphasis is more now on reducing toxic trace elements, pesticides and herbicides and nutrients. The developed countries are concentrating on research activities for cost effective removal of pesticides, herbicides, trace elements and other toxic elements, by high-tech process treatments.
112
Numerous potential technologies have been identified but there are a few viable, technically effective and economically feasible technologies. The technology applications include: desalination, biological process, chemical treatment and physical treatment. The treatment of agricultural subsurface drainage water for removal of dissolved and reduction of trace elements still leave residuals composed of brines, salts and waste solids. The residual products can be disposed in many ways: (1) local surface waters, (2) evaporation ponds, and (3) deep well injection Alternatively, the residual products can locally be recycled in agriculture to become second generation drainage water, use in salt tolerant crops and in cooling water plants. The treatment technologies have as yet centered on selenium as a primary trace element of concern. Removal of other trace elements from drainage such as boron, molybdenum, chromium, and arsenic should be investigated in a broadly based drainage management programme (Tanji 1994). Disposal of treated effluent and residual by-products presents technical and environmental problems. The dilution of residual products can be preached if adequate surface water of good quality is available. The diluted water can be reused for irrigating agro-forestry and salt tolerant plants (halophytes). Ø Environmental impacts: Basinwide Phase A large scale degradation at basin level can result, if the saline waters have the influence on Basinwide area. Degradation of soils, surface water, ground water can occur on ecosystem and environment. Kandiah (1998) reported the classical case of basinwide adverse impact of improper management of agricultural drainage in the central valley of California, USA. During 1990s substantial reduction in birds life, almost total disappearance of fish and sickness of plant community were the major hazards because of the mismanagement of drainage water. In fact, a master plan prepared in 1960s to convey the drainage water through 320 km long main drain remains unimplemented in this valley. The basinwide examples are also cited as Stillwater national wildlife refuge in Nevada, the Ouray national wildlife refuge in north-eastern Utah and Kendrik project near Casper, Wyoming. The Murray-Darling basin in Australia intended to hold saline water only temporarily and then relesed into nearby rivers during high flows. Thus, there can be different drainage water disposal options. The basinwide environmental impacts can be mitigated by adopting an integrated approach right from the on-farm and basin level scale. Kandiah (1998) suggested the following interventions from on-farm level to basin level:
• Asses the drainage water quality and quantity for suitability in irrigation, • If found suitable, apply irrigation methods, water management practices, drainage and
reuse or disposal of the effluent, • Practice efficient farm management practices and effect drainage source reduction, • Minimize drainage volume and make successive reuse, • Adopt treatment of drainage effluent to remove specific toxic ions (such as Se) where
appropriate, • Make safe disposal of final unusable drainage volume into a) suitably defined evaporation
pond or/and, b) river flow in high stages, or c) nearby ocean, if exists.
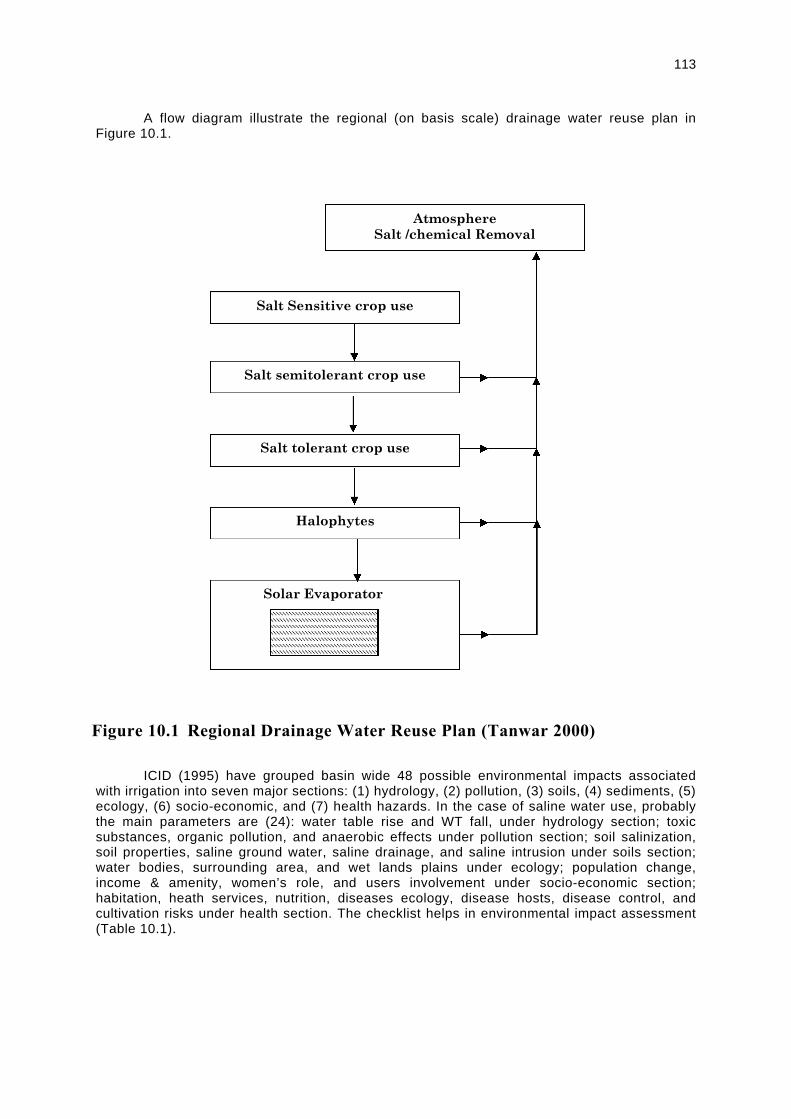
113
A flow diagram illustrate the regional (on basis scale) drainage water reuse plan in Figure 10.1. ICID (1995) have grouped basin wide 48 possible environmental impacts associated with irrigation into seven major sections: (1) hydrology, (2) pollution, (3) soils, (4) sediments, (5) ecology, (6) socio-economic, and (7) health hazards. In the case of saline water use, probably the main parameters are (24): water table rise and WT fall, under hydrology section; toxic substances, organic pollution, and anaerobic effects under pollution section; soil salinization, soil properties, saline ground water, saline drainage, and saline intrusion under soils section; water bodies, surrounding area, and wet lands plains under ecology; population change, income & amenity, women’s role, and users involvement under socio-economic section; habitation, heath services, nutrition, diseases ecology, disease hosts, disease control, and cultivation risks under health section. The checklist helps in environmental impact assessment (Table 10.1).
Salt Sensitive crop use
Atmosphere Salt /chemical Removal
Salt semitolerant crop use
Salt tolerant crop use
Halophytes
Solar Evaporator
Figure 10.1 Regional Drainage Water Reuse Plan (Tanwar 2000)

114
Table 10.1 Checklist indicating the possible environmental hazards (ICID)
Environmental Impact parameters Score Positive Negative No impact I. Hydrology
1.1 1.2 1.3 1.4 1.5
Low flow regime Flood regime Flow compensation Water table fall Water table rise
4 4 5 5 7
II. Pollution 2.1 2.2 2.3 2.4 2.5
Solute dispersion Toxic substances Organic pollution Anaerobic effects Gas emissions
7 5 7 4 4
III. Soils 3.1 3.2 3.3 3.4 3.5
Soil salinization Soil properties Saline groundwater Saline drainage Saline intrusion
7 7 7 7 5
IV. Sediments
4.1 4.2 4.3 4.4 4.5 4.6 4.7
Local erosion Sediment yield Channel regime Local siltation Hinterland effect River morphology Estuary erosion
7 5 4 4 4 4 5
V. Ecology 5.1 5.2 5.3 5.4 5.5 5.6 5.7 5.8
Project bodies Water bodies Surrounding area Valleys & shores Wetlands & plains Rare species Animal irrigation Natural industry
5 8 4 5 4 4 4 5
VI. Socio-Economics
6.1 6.2 6.3 6.4 6.5 6.6 6.7 6.8 6.9
Population change Income & amenity Human migration Resettlement Women’s role Minority groups Heritage sites Regional effects User involvement
4 2 5 4 4 4 4 4 5
VII. Health 7.1 7.2 7.3 7.4 7.5 7.6 7.7 7.8 7.9
Water & sanitation Habitation Health services Nutrition Relocation effect Disease ecology Disease hosts Disease control Cultivation risks
5 4 2 2 4 5 7 4 5
Note: FAO revised the list and made addition to hazards as Group VIII: Imbalances – Pests & weeds, animal diseases, aquatic weeds, structural damage, and animal imbalances (FAO 53, 1995) FAO 53 (1995) have considered some additional hazards along with another group of 5 hazards as imbalances. While assessing the hazard they may be classified as positive, negative and no impact.

115
10.3 Socio-Economic Impacts of Saline Water Use The major purpose of irrigated agricultural is to increase agricultural production and consequently improve the economic and social status of the inhabitants of the project area. Most of the irrigation schemes could not achieve full benefits owing to less attention paid by the project authorities to social and economic structure of the project area. The environmental impact assessment (EIA) needs equally to concentrate on means in which positive impacts can be enhanced as on negative impacts mitigated (FAO-53, 1995). This concept is more relevant in the case of saline water irrigation, because such areas having saline water are mostly arid and semiarid regions, and the people have to resort to saline irrigated agriculture generally under more social and economic poor conditions. The socio-economic factors include: population change, income and amenity, women’s role, minority groups, and user involvement (participation). Generally, in the case of saline water irrigation, the economic analysis has three major aspects: one relating to the reclamation of saline and sodic soils prior to cultivation; two the continuous use of saline water for irrigation and; three the drainage installations and reuse of drainage water for irrigation. Shalhevet and Kamburov (1976), a world wide survey on irrigation and salinity (edited by Framji) reported that the farm income was reduced in the saline-affected Kerang region by 73% as compared to non-saline shepparton region in Victoria, Australia. A leaching experiment in Iran (Karkheh, Khusistan) demonstrated very substantial yield increase. In Republic of China, the net increase in productivity due to reclamation was equivalent to 2.5 to 3 tons/ha of sugar. The waterlogging and salinity drastically reduces the cotton yield. In the Enphrates River valley, salinity in its various degrees caused a 70000 ton/yr loss in cotton yield, which, at 1970 prices, was equivalent to 17 million US dollar. The possibilities when the use of saline water irrigation is considered are more complex, and so is the analysis. The salinity tolerance of crops is important in productivity and production. Datta (1998) developed an approach to estimate direct economic damages due to use of poor quality saline irrigation water, to evolve techniques for the safe utilization of saline water for irrigation in order to reduce the economic losses for sustaining crop production in the saline environment. The farmers have practiced the agriculture with saline waters under various resources and institutional constraints. The resource constraints are mainly: insufficient and untimely availability of good quality waters; non availability to salt tolerant hybrid yield varieties of seeds, organic material and amendments; and high cost on energy and tubewell installation. The institutional constraints are: small size holdings, fragmentation of holdings, and non-availability of credits. The study reveal the following policy inferences for the management of saline water irrigation. • Modern technologies for the use of saline water reflect private than social incentives. • Marginal value of environmental improvement of technology is missing due to externalities. • Subsidy is needed to encourage farmers use saline water irrigation. • Incentives should cover extension of technology, availability of required inputs of right time and
place, and credit facilities are needed. • Amendments should be available timely at low cost. • Availability of canal water during the time of crop sowing is essential. • Need to have a good technology transfer. • Need to establish strong linkages between research and the end users. • Need to have a strong extension team. The saline water use for irrigation is a vital necessity in large parts of the world, especially arid and semiarid areas. Technologies are available to adopt a holistic management approach which includes the interception, isolation and reuse of saline drainage water for irrigation, besides the intensive use of natural saline waters in many arid and semiarid areas, and the use of wastewaters too in their full capacity range to achieve optimum land and poor quality water resources management, a major contributory role to be played in advancing the cause of food security for millions of suffering people, particularly in the under developed and developing world.
REFERENCES AND BIBLIOGRAPHY Abdegawad G (1995). The use of highly saline waters for irrigation, Desertification Bulletin
No. 26, The Arab Center for the Studies of Arab zones and Dry Lands (ACSAD), League of Arab States, Post Box. 2240, Damascus, Syrian Arab Republic.
Abdel Al IS, Sabrah REA, Rabie RK, Abdel Magid HM (1997). Evaluation of ground water quality for irrigation in Central Saudi Arabia Arab Gulf Jr. of Sci Resh. 1997, 5:2 pp. 361-377.
Abelson PH (1991). Desalination of brackish and marine waters. Science 25 (4999): 1289. Abu-Zeid M (1988). Egypt’s policy to use low-quality water for irrigation. Proc Symp Reuse of
low-quality water for irrigation. Water Research Centre, Cairo. Afro-Asian Conference (10th) (1998). Proceedings of the International Workshop on the Use
of Saline and Brackish Water for Irrigation. Bali, Indonesia, July 23-24, 1998, p. 338. Agricultural Affairs and Fish Resources Authority, Kuwait (1988). Treated Sewage Effluent for
Irrigation in Kuwait Treatment and use of sewage effluent for irrigation. MB Pescod and Arar A (eds.). Butterworths, Sevenoaks, Kent.
Ahmed N (1972). Groundwater Resources of Pakistan. Water and Power development Authority, Lahore.
Australian Water Resources Council (1969). Quality Aspects of Farm Water Supplies. Development of National Development, Canberra, pp. 45.
Ayers RS Westcot DW (1985). Water Quality for Agriculture. FAO Irrigation and Drainage Paper 29 rev. 1. FAO, Rome.
Baker JL, Johnson HP (1977). Impact of subsurface drainage on water quality. In: Proc 3rd National Drainage Symp, Chicago, ASAE Publ. 7-1, 2950 Niles RD, St Joseph, MI.
Bartone CR (1986). Introduction to wastewater irrigation: extent and approach. Third Annual World Bank Irrigation and Drainage Seminar, Annapolis, Maryland. The World Bank, Washington DC.
Berner EK, Berner RA (1987). The Global Water Cycle. Prentice Hall, New York. Bernstein L (1964), Salt tolerance of plants. USDA Agricultural Information Bulletin 283, pp.
23. Bernstein L (1965) Salt tolerance of fruit crops. USDA Agricultural Information Bulletin 292,
pp. 8. Bhatti HM (1986). Management of irrigation water qualities for crop production. Final Tech
Report PL-480. USDA Grant FG-Pa-266, PK-ARS-76, p. 115. Bhumbla DR (1969). Water quality and use of saline water for crop production. Symposium
on Soil and Water Management. Indian Council for Agriculture Research (ICAR). New Delhi, pp. 87-108.
Biswas AK (1987). Irrigation in Africa. ICID Bull 36(2): 1-11. Blass S (1964). Surface Irrigation, Hassadeh 45, 1. Boumans JH, Van Hoorn JW, Kruseman GP and Tanwar BS (1988). Water table control,
reuse and disposal of drainage water in Haryana. Agric Water Management 14: 537-545.
Bouwer H (1969). Salt balance, irrigation efficiency and drainage design. ASCE, Proc. 95 (IRI) : 153-170.
Bouwer H (1987). Soil-aquifer treatment of sewage. Land and Water Development Division, FAO, Rome.
Bush CD, Turner FJ (1967). Sprinkler irrigation with high salt-content water. Transactions ASAE 10(4): 494-496.
Bustan A, Cohen S, Sagi M, Golan R, Demalach Y, Pasternak D (1998). Saline water irrigation of horticultural crops on desert dunes. In: Proc 10th Afro-Asian Conference, Bali, Indonesia, pp. 193-200.
CBIP – Central Board of Irrigation and Power (1998). Water quality and its management. Proc First International Specialized Conference. 2-6 March 1998, New Delhi, India, Varma CVJ, Rao CRJ, Kaushish Sp (eds), p. 583.
Central Ground Water Board (1989-99). Ground water exploration reports, CGWB, Faridabad, India.
Central Water Commission (1992). Guidelines for sustainable water resources development and management, India.
118
Cole JA (ed) (1974). Groundwater Pollution in Europe. Proc Confr. Held in Rending, England. Water Information Centre Inc., Port Washington, NY.
Congress on Irrigation and Drainage (16th) (1996). Sustainability of irrigated agriculture, ICID-CIID, Transaction/Actes, Cairo, Egypt.
Council of the European Communities (1986). Council directive of 12 June 1986 on the protection of the environment and in particular of soil, when sewage sludge is used in agriculture (86/278/EEC). Official Journal of the European Communities. L181 (6) 29.
Craig JR (1980). Saline Waters: genesis and relationship to sediments and host rocks. In: Saline Water Proc Symp Groundwater Salinity, 46th Annual Meeting. Mattox RB (ed). Amer Assoc Adv Sei (AAAS).
Crites RW (1974). Irrigation with wastewater in Bakers field, California. Report by Metcalf and Eddy Inc., Polo Alto, California.
CSSRI – Central Soil Salinity Research Institute (1991-99). Annual Reports. CSSRI, Karnal, India.
CSSRI – Central Soil Salinity Research Institute (1998). Biennial Report (1996-98), AICRP on Management of Salt affected Soils and Use of Saline Water in Agriculture, CSSRI, Karnal, India, p. 138.
Dabbagh TA, Al-Sagabi A (1989). The increasing demand for desalination. Desalination 73(1-3): 3-26.
Daniel H (1997). Small-scale irrigation for arid zones – principles and options. FAO Development Series 2, FAO, Rome.
Daoud Y, Halitrim A (1994). Irrigation and Salinization in the Algerian Saheca Institute, National Agronomical EI Harrach, Algeria Sechae Resse. 5:3 151-160.
Dhir RD (1976). Investigations into use of highly saline waters in an arid environment Salinity and alkali hazard conditions in soil under a cyclic management system. In: Proc Int Manag Conf Managing Saline Water on irrigation. Texas Tech Univ, Lubbock, pp. 608-609.
Dhir RP (1998). Origin and accumulation of salts in soils and ground waters. In : Agricultural Salinity Management in India. Tyagi and Minhas (ed.), CSSRI (India), pp. 41-60.
Dinar A, Letcy J, Vaux HJ Jr. (1986), Optimal ratio of saline and non saline irrigation waters for crop production. Soil Sci. Soc, of America J. 50(2) : 440-443.
Dragoric S, Ciroric M, Hadzic V (1998). Irrigation water quality and its effect on soil in Northern Yugoslavia. In: Proc. 10th Agro-Asian Confr. Bali, Indonesia, pp. 116-126.
Dubey SK, Gupta SK and Mandal RC (1991), Pitcher irrigation techniques for arid and semi arid zones. Dryland Resources and Technology 6, pp. 137-177.
FAO – Food and Agriculture Organisation (1971). Salinity Seminar Baghdad – report on regional seminar on methods of amelioration of saline and waterlogged soils, Baghdad, Iraq, 5-14 December 1970, Water Resources and Development Service, Land and Water Development Division, FAO, Rome, p. 254.
FAO – Food and Agriculture Organisation (1979). Groundwater pollution. FAO Irrigation Drainage Paper 31, FAO, Rome, p. 137.
FAO – Food and Agriculture Organisation (1985). Water quality for agriculture. Ayers ORS, Westcot DW. FAO Irrigation and Drainage Paper 29 (rev 1), FAO, Rome, p. 174.
FAO – Food and Agriculture Organisation (1992). The use of saline waters for crop production. Rhodes JD, Kandiah A, Mashak AM. FAO Irrigation and Drainage Paper 48. FAO, Rome.
FAO – Food and Agriculture Organisation (1992)/ Waste water treatment and use in agriculture. Pescod MB. FAO Irrigation and Drainage Paper 47, FAO, Rome.
FAO – Food and Agriculture Organisation (1995). Environmental impact assessment of irrigation and drainage projects. Dougherty TC, Haji AW. FAO Irrigation and Drainage Paper 53, FAO, Rome.
FAO – Food and Agriculture Organisation (1996). Control of water pollution from agriculture. Ongley ED: FAO Irrigation and Drainage Paper 55, FAO, Rome.
FAO – Food and Agriculture Organisation UNESCO (1973). Irrigation, drainage and Salinity. An international source book, Paris, UNESCO Hutchinson Publishers, London, p. 510.
Feizi M (1998). Long term effect of using saline water on soil salinity and sodicity. In: Proc 10th Afro-Asian Confr Bali, Indonesia, pp. 89-95.
Framji KK (1984). Second ND Gulati memorial lecture for international cooperation in irrigation, ICID Bull 33 (2): 1-58.
Framji KK (ed) (1976). Irrigation and Salinity – a worldwide survey. ICID, New Delhi, p. 106.
119
Frenkel H, Meiri A (1975). Irrigation with Brackish Water: chemical and hydraulic changes in soils irrigated with brackish water under cotton production In: Irrigation with brackish water. Int Symp Beer-Sheva, Israel Neowe Univ. press, Jerusalem, pp. 175-183.
Gappa WS (1990). The Colorado River Salinity Program, an overall perspective. In: Proc 1990 Natl Conf Irrigation and Drainage. ASCE, 11-13 July 1990, Durango, CO.
Gavis J (1971). Waste water reuse. (Prepared for Narona water commission), National Technical Information Service. Springfield, Virginia 22151, USA. Accession No. pp. 210-535.
Gilani A, Ghaibah A (1998). Crop response to irrigation with low quality water. In: Proc 10th Afro-Asian Confr, Bali, Indonesia, pp. 59-71.
Gleick PH ed. (1993). Water in crisis. A guide to the world’s fresh water resources. New York Oxford University Press, pp. 473.
Gohring TR, Wallender WW (1987). Economics of Sprinkler irrigation systems. Trans ASAE 30: 1083-1090.
Grattan SR, Rhoades JD (1990). Irrigation with saline ground water and drainage water. In: Tonji KK (ed) Agricultural Salinity Assessment and Management. ASCE Manu Rep Eng Practices 71, pp. 432-449.
Grattan SR, Shennan C, May D, Roberts B, Hillhouse C, Burau RG (1991). Continuation in the long-term cyclic use of saline drainage water in a rotation of cotton and processing tomato. Tech Prog Rep, UC Salinity/Drainage Task Force, Div Agric Nat Resource, Univ Cal, Davis.
Groenfeldt D (1997). Introduction to PIM, Natural conference on PIM, New Delhi (India), Jan. 20-22,1997.
Gupta IC (1990). Use of saline water in agriculture – a study of arid and semiarid zones in India (rev ed). Oxford and IBH Publishing, New Delhi.
Gupta RK, Tomar OS, Minhas PS (1995). Managing Salty Soils and Waters for Afforestation. Bulletin No. 7/95. CSSRI, Karnal, India, p. 23.
Handa BK (1979). Saline Water Resources of India. Tech. Manual No. 5 Central Ground Water Board, Faridabad, pp. 246.
Heaton RD (1981). Worldwide aspects of municipal wastewater reclamation and reuse. In: D’Itsi FM, Martinez JA, Lambarri MA (eds), Municipal Wastewater in Agriculture. Academic Press, New York, pp. 43-74.
ICID – International Commission on Irrigation and Drainage (2000). Proc. 8th ICID International drainage workshop, New Delhi, India.
ICID – International Commission on Irrigation and Drainage (1996). 16th Congress on Irrigation and Drainage. Cairo, Egypt, Keynote address (Walter HW, Kandiah A – FAO Rome) and Proceedings.
ICID – International Commission on Irrigation and Drainage (1998). 10th Afro-Asian Regional Conference Bali, Indonesia. Proceedings of the International Workshop on the Use of Saline and Brackish Water for Irrigation, p. 338.
IPTRID: An ICID vision (1995): International Commission on Irrigation and Drainage, New Delhi, Indian and Other Reports of IPTRID.
Kandiah A (1990a). Water quality management for sustainable agriculture development. Natural Resources Forum, 14 (1): 22-32.
Kandiah A (1998). Strategies to minimize adverse environmental impacts of saline water use in agriculture. In: Proc of the International workshop on the Use of Saline and Brackish Water for irrigation – at 10th Afro-Asian Confr. Bali, Indonesia, pp. 305-315.
Kandiah A (ed) (1990b). Criteria and classification of saline water. Water, soil and crop management practices relating to the use of saline water. AGL/MIC/16/90. FAO, Rome, pp. 34-51.
Karam F (1999). The effect of saline irrigation water on sunflower production : Assessment of leaching fraction for the control of root zone salinity, In: Proce. Of Regional Symposium, JUST, I rid, Jordan June 1999, pp. 98-107.
Kelleners TJ, Choudahry Mr. (1998). Drainage water salinity of tubewells and pipe drains – a study from Pakistan. Agricultural Water Management, 37 : 1, pp. 41-43.
Keller J, Bliesner RD (1990). Sprinkle and trickle irrigation. Van Nostrand Reinholt, New York, p. 652.
Kovda VA, Berg C, Hagen RM (1973). Irrigation, drainage and salinity. Unesco and FAO. Hutchinson Press, London.
120
Lee EW (1991). Treatment, reuse and disposal of drain waters. Water Sai Terhnol 24:183-188
Lovell CJ, Murata M, Batchelor CH, Chilton PS (1998). Use of saline groundwater for community based irrigation in dry land areas of Southern Africa. In: Proe. 10th Afro-Asian confr. Bali, Indonesia. pp. 106-115
Manchanda HR (1998). Management of saline irrigation. In: Agricultural Salinity Management in India. CSSRI, Karnal, pp. 407-430.
Marsh AW (1974). Water use by drip and sprinkle irrigated avocados related to plant cover, evaporation and temperature. Proc Second International Drop Congress, San Drop, California, pp. 346-350.
Mass EV (1985). Crop tolerance to saline sprinkling waters. Plant Soil 89: 273-284. Mass EV (1990). Crop salt tolerance. In: Tanji KK (ed) Agricultural Salinity Assessment and
Management. ASCE Manu Rep Eng Practices 71. Minhas PS (1998). Use of poor quality waters. In: 50 years of Natural Resources
Management Research. Singh GB, Sharma BR (eds). Division of Natural Resource Management. ICAR, New Delhi, India, pp. 327-346.
Minhas PS, Tyagi NK (1998). Guidelines for irrigation with saline and alkali waters. Bull no. 1/98. CSSRI, Karnal, India, p. 36.
Mock JF, Bolton P (1993). The ICID environmental checklist to identify environmental effects of irrigation, drainage and food control projects. HR Walling Ford, Walling Ford, UK.
Moore JW (1990). In organic contamination of surface water. Springer, Berlin Heidelberg, New York, p. 334.
National Research Council – NRC (1989). Irrigation induced water quality problems. National Academy Press, Washington DC.
Navalwala BN (2001). Participatory Irrigation Management. Water Resource Advisor, Planning Commission, New Delhi.
Ogino Y, Hatcho N, Tsutsui H (1998). Salinization and water management in the arid region with emphasis on Kazakhstan. In: Proc. 10th Afro-Asian Confr. Bali, Indonesia, pp. 244-253.
Oosterbaan RJ (1991). Drainage and salinity control/agriculture drainage. Lecture Notes. Indo – Netherlands collaborative project training course. Central soil salinity Research institute , Karnal September 30- October.
Oster JD (1994). Irrigation with poor quality water. Agricultural Water Management, 25 pp. 271-297.
Oster JD and Rhoades JD (1983). Irrigation with saline water. In: Soil and Water Newsletter. Univ California Cooperative Extension Fall 1983, no. 56, pp. 1-3.
Oster JD, Schroer FW (1979). In filtration as influenced by irrigation water quality. Soil Sci Soc Am J 43: 444-447.
Paliwal KV (1992). Irrigation with saline water monograph 2. Water Technology Center, IARI, New Delhi.
Pallas PH (1985). Water for animals, FAO, Rome, AGL/Misac/4/85, p. 76. Papadopoulos I (1998). Use of saline waters for irrigation: Cyprus case. In: Proc Internal
Workshop on the Use of Saline and Brackish Water for Irrigation at 10th Afro-Asian Confr, Bali, Indonesia, July 23-24, 1998.
Pescod MB (1992). Wastewater treatment and use in agriculture. Irrigation and Drainage Paper 47. FAO, Rome, Italy.
Pescod MB, Arar A (eds) (1998). Treatment and use of sewage effluent for irrigation, Butterworths, London.
Petty Grove, Asano (1985). (ed.) Irrigation with reclaimed municipal wastewater – A Guidance manual. Lewis Publishers Inc. ISBN 0-87371 064-4.
Pillsbury AF (1968). Sprinkler irrigation. FAO Agricultural Development Paper 88. FAO, Rome.
Postel S (1990). Saving water for agriculture. In: State of the World 1989. World Watch Institute, Washington DC, pp. 39-58.
Pratt PF, Suarez DL (1990). Irrigation water quality Assessments. In: Tanji KK (ed) Agricultural salinity Assessment and Management, ASCE, New York, pp. 221-226.
Qadir M, Ghafoor A, Murtaza G (1998). Reuse of drainage water fore crop production and reclamation of a saline-solid soil (Pakistan). In: Proc 10th Afro-Asian Confr. Bali, Indonesia, pp. 225-229.
121
Ragab R (1998). The use of saline/brackish water for irrigation: possibilities and constraints. In: Proc Internal Workshop on the use of saline and brackish waters for irrigation – Implications for the management of irrigation, drainage and crops. 10th Afro-Asian confr., Bali, Indonesia, July 13-14, 1998, pp. 12-41.
Ragab R, Fathi A (1986). Estimating water table contribution to the water supply of maize. Agricultural Water Management. 11: 221-230.
Ragab R, Fathi A (1987). Predicting water table contribution to crop evapo-transpiration in Central Nile Delta by CUF model. Journal of Rural Engineering and Development.
Reiff FM (1987). Health aspects of waste water reuse for irrigation of crops. In : Proceedings of the International Seminar on Non conventional Water Resources Use in Developing Countries. April 22-28, 1985, Series 22, United Nation, New York, pp. 245-259.
Rhoades JD (1972). Quality of water for irrigation. Soil Sci 113:pp. 277-289. Rhoades JD (1974). Drainage for salinity control. In: Drainage for Agriculture. Van
Schiltgaarde J (ed), Amer Soc Agron Monograph no. 17, pp. 443-462. Rhoades JD (1977). Potential for using saline agricultural drainage water for irrigation. Proc
Conf Water Manag Irrig Drain, July 1977, ASCE, Reno, pp. 85-116. Rhoades JD (1984). Use of saline water for irrigation. Cal Agri 38 (10): 42-43. Rhoades JD (1984a). Reusing saline drainage waters for irrigation: A strategy to reduce salt
loading of rivers. In: salinity in water causes and reservoirs, French RH (ed), Proc 1983 Internet. Symp on State-of-the-Art Control of Salinity, 13-15 July 1983, Salt Lake City, Utah, AAS, pp. 455-464.
Rhoades JD (1984b). New strategy for using saline waters for irrigation. In: Water, Today and Tomorrow. Proc Speciality Conference at Flagstaff Arizona, ASCE.
Rhoades JD (1998). Use of saline and brackish water for irrigation: implications and role in increasing food production, consuming water, sustaining irrigation and controlling soil and water degradation. In: Proc of the International Workshop on the use of saline and Brackish water for irrigation – at 10th Afro-Asian Confr. Bali, Indonesia, pp. 261-304.
Rolston DE, Rains DW, Biggar JW, Lauchli A (1988): Reuse of saline drain water for irrigation. In: UCD/INIFAP Conf. Guadaljara, Mex, March 1988.
Rosegrant M (1995). Water resources in the 21st century: increasing scarcity, declining quality implications for action. Conference on sustainable future of the global system. United Nations Univ and National Institute for Environmental Studies, Tokyo, Japan.
Sabater F, Sabate S, Armengol J (1990). Chemical characteristics of a Mediterranean rivers as influenced by land uses in the Watershed (Spain). Water Research Oxford, 24 : 2, pp. J 143-155.
Sampson K (1996). Irrigation with saline water in the Sheraton irrigation region. Jr. soil water conservation, 9: 3, pp. 9-33.
Shalhevet J, Kamburovj (1976). Irrigation and salinity: a worldwide survey. Int Commis Irig Drainage, p. 106.
Shalhevet J, Shainberg I (eds) (1984). Soil salinity under irrigation. Springler, Berlin Heidelberg, New York, p. 349.
Sheith My (1998). Proper management needed for better and safe utilization of saline water for irrigation in Palestine. In : Prve. Inter. Works, on the use of saline water for irrigation. 10th Africa, Asian corner Bali, Indonesia, pp. 178-192.
Shiati K (1998). Brackish water as a source of irrigation: behaviour and management of salt affected reservoirs (Iran). In: 10th Afro-Asian Confr. Bali, Indonesia, pp. 72-82.
Shiklamanov IA (1990). Global water resources. Natl Resour 26(3): 34-43. Shuval HI (1987). The development of water reuse in Israel, ambio 16(4): 186-190. Shuval HI, Adin A, Fattal B, Rawtiz E, Yekutiel P (1986). Wastewater irrigation in developing
countries – health effects and technical solutions. World Bank Tech Paper 51, Washington, DC.
Smedma LK (1995). Salinity control of irrigated land. In: Water Report no. 4 Vidal A (ed), FAO, Rome, pp. 141-150.
Tanji KK (1990). Agricultural Salinity Assessment and Management, Ame Soc. Civil Eng. Manual 71, New York.
Tanwar BS (1981). A perspective plan for saline ground water development in Haryana. XVII Annual convention of Indian Society of Agricultural Engineers. CSSRI, Karnal, India. Feb. 26-28, 1980.
122
Tanwar BS (1981). Groundwater pollution and its protection in Haryana State India. In: Proc. International Symposium on Quality of Groundwater, Amsterdam, The Netherlands, 23-27 March 1981.
Tanwar BS (1997). PIM potential in India – Methods and Momentum. National Conference on PIM. Ministry of Water Resources New Delhi, India (Jan. 20-22,1997).
Tanwar BS (1998). Conjunctive use strategies for multi source waters to check waterlogging and salinity in canal commands. National Seminar on Strategies for Management of Poor Quality Water in Agriculture CSSRI, Karnal, India, August 4-5, 1998.
Tanwar BS (1998). Drainage management and disposal of saline water in northwest India. in: Proc. 10th Afro-Asian Confr, Bali, Indonesia, pp. 166-177.
Tanwar BS (1998). Inland salinity and challenges on water quality management in Haryana (India). Proc. First International specialized conference. International Association on Water Quality and Central Board of Irrigation and Power, CBIP, New Delhi, India, pp. 182-191.
Tanwar BS, Gupta AN (1988). Studies on subsurface drainage techniques in Haryana. In: Proc International Seminar on Hydrological Aspects of Drainage in Irrigated Areas. UNESCO-PCRWR & DRIP at Tandojam, Pakistan, March 1988.
Tanwar BS, Kruseman GP (1985). Saline groundwater management in Haryana State, India. In: Proc 18th IAH Congress in Cambridge, UK, September 1985.
Todd DK, Tinlin RM, Schmidt KD, Everett LG (1976). Monitoring groundwater quality: Monitoring Methodology. US Envn Protec Agency Report EPA 600/4-76-026.
Twersky M (1971). Factors of chemical fertilization in saline water irrigation – A review. The Negev institute for Arid Zone Research, Beer Sheva, Israel.
Tyagi NK (1998). Improvement of irrigation system for control of salinity. In: Agricultural Salinity Management in India, CSSRI, Karnal, pp. 309-324.
Tyagi NK, Minhas PS (eds) (1998). Agricultural Salinity Management in India. Central Soil Salinity Research Institute, Karnal, India, p. 526.
Tyagi NK, Sharma DP (1998). Experiences with use of saline drainage effluents for crop production in India. in: 10th Afro-Asian Confr. Bali, Indonesia, pp. 127-138.
UN Department of Technical Cooperation for Development (1985). The use of non-conventional water resources in developing countries. Natural water resources series no. 14. United Nations DTCD, New York.
UNCED (1992). Agenda 21 of the United Nations conference on Environment. UNDP – FAO (1985). Studies for the use of saline water in the command areas of irrigation
projects in Haryana, India, report of UNDP project, FAO, Rome. AG:DP/IND/81/010. UNEP (1991). Environmental guidelines for municipal waste water reuse in the Mediterranean
region. Tedeschi S, Pescod MB (eds). Mediterranean Action Plan – Priority Actions Programme, Regional Activity Centre, Split, Yugoslavia.
UNESCO (1972). Hydrological aspects of saline water resources : A provisional annotated bibliography. Distribution No. S/C/WS/433. New York 10016, USA.
UNESCO-UNDP (1970). Research and training on irrigation with saline water. Tech Report of UNDP Project: Tunisia S, p. 250.
USAID (1996). Water and population dynamics – Local approaches to global challenge. Booklect. USA.
USBR – US Bureau of Reclamation (ed) (1985) Colorado River basin salinity control project, background, plan and status report. USBR, Denver.
USDA – United States Department of Agriculture (1954). Agriculture Handbook No. 60, Washington DC, p. 160.
USDA (ed) (1991). Farm irrigation rating index (FIRI): a method for planning, evaluating and improving irrigation management. UDSA, Soil Conser Serv, West Natl Tech Centre, Portland OR, p. 56.
US-EPA (1994). National Water quality inventory. 1992 report to Congress. EPA-841-R-94-001. Office of Water, Washington DC.
Van Hoorn J.W. (1971). Quality of irrigation water, limits of use and prediction of long term effects. In, Salinity Seminar Baghdad, FAO Irrigation and Drainage Paper 7, FAO, Rome.
Westcot DW (1988). Reuse and disposal of higher salinity subsurface drainage water – a review. Agriculture Management, 14 : 483-5120.
123
WHO – World Health Organization (1981). Health aspect of treated sewage reuse. In: Rep WHO Sem. Algiers 1-5 June 1980. EURO Rep Stud 42, WHO Reg Off Eur. Copenhagen.
WHO (1989). Health guidelines for the use of wastewater in agriculture and aquaculture. Tech Report no. 778. WHO, Geneva, p. 74.
WHO (1993). Guidelines for drinking water quality. Vol. 1 Recommendations, WHO, Geneva, Switzerland.
Wilcox LV (1948). The quality of water for irrigation. US Dept Agric. Tech Bull no. 62: 1-40. Willianson DR, (1990). Salinity – an old environmental problem. In: Year Book Australia 1990.
Canberra : Australian Govt. Publishing service, pp. 202-211. World Bank (1994). A review of World Bank experience in irrigation, World Bank, Washington
DC. World Watch Institute (1997). Data base disc. Jan 1997. Washington. WPCF (1989). Water Reuse, Manual of Practice SM-3, 2nd edn. Water Pollution Control
Federation, Washington DC. WRI – World Resources Institute (1994). World resources. A guide to the global environment,
Oxford Univ Press, New York. Yeo AR, Flowers TJ (1998). Will better modelling of plant response to salinity increase the
efficiency of irrigation and drainage? In: Proc Intnl Workshop on the Use of Saline and Brackish Water for Irrigation – at 10th Afro-Asian Conference, Bali, Indonesia, July 23-24, 1998.