seasonal and spatial variations in the nutrient limitation of bacterioplankton growth in the...
TRANSCRIPT
AQUATIC MICROBIAL ECOLOGYAquat Microb Ecol
Vol. 27: 47–56, 2002 Published February 18
INTRODUCTION
It is generally considered that nitrogen is the nutrientthat limits primary productivity in most oceans (Codis-poti 1989, Tyrrell & Law 1997, Tyrrell 1999). However,an increasing number of studies show that phosphorusmay limit primary production in some areas of theocean, such as the Sargasso Sea (Wu et al. 2000), andiron can be limiting in high-nutrient, low-chlorophyllzones (Martin & Fitzwater 1988, Coale et al. 1996,
Landry et al. 1997, Boyd et al. 2000). Recent evidencepoints to phosphorus limitation in areas of the oceanthat were thought to be limited mainly by nitrogen(Karl et al. 1998, Karl 1999, 2000).
There is growing evidence that the limiting nutrientin the Mediterranean Sea is phosphorus. The dissolvednitrogen to phosphorus ratio in the Mediterranean hasbeen reported to be about 21 to 23 in the western part(Bethoux et al. 1992), and even higher in the easternbasin (Krom et al. 1991), which is quite different fromthe ratio of 15 found in the global ocean (Tyrrell 1999).Experimental studies in the eastern Mediterraneanhave always shown phosphorus limitation, both at
© Inter-Research 2002 · www.int-res.com
*E-mail: [email protected]
Seasonal and spatial variations in the nutrientlimitation of bacterioplankton growth in the
northwestern Mediterranean
Maria Montserrat Sala*, Francesc Peters, Josep M. Gasol, Carlos Pedrós-Alió,Celia Marrasé, Dolors Vaqué
Departament de Biologia Marina i Oceanografia, Institut de Ciències del Mar-CMIMA (CSIC), P. Marítim 37–49,08003 Barcelona, Spain
ABSTRACT: Nutrient limitation of bacterioplankton growth was studied in the western Mediter-ranean Sea to determine its spatial and temporal variations. Shipboard microcosm experiments wereperformed in June 1995, June 1996 and September 1996. Seawater was amended with carbon (C, asglucose), nitrate (N) and phosphate (P), individually or in combination. The limiting nutrient wasinferred from the combination that stimulated the highest bacterial production and generated thehighest bacterial biomass in the experiments. The results of the experiments carried out along acoastal-to-open sea transect, with both surface and deep chlorophyll maximum depth waters (DCM),suggest that there is a strong variability in the factors limiting bacteria. While phosphorus was mostoften the limiting nutrient in the surface samples, at the DCM depths nitrogen or carbon limitationwas also found. The surface waters of the open sea station were also studied during the 3 cruises toprovide an estimate of seasonal variation of bacterial limitation. Phosphorus limitation was found inthe 3 periods: very clear phosphorus limitation in September 1996, possible phosphorus limitation inJune 1995 and possible co-limitation with carbon in June 1996. Our results show that phosphorus isthe main nutrient limiting bacterioplankton growth in the NW Mediterranean. However, while phos-phorus was usually the limiting nutrient in the surface layers, nitrogen and carbon limitation alsooccurred at other depths. Thus, seasonal and spatial variability in the nutrient limiting bacterialgrowth should be expected.
KEY WORDS: Nutrient limitation · Bacterioplankton · NW Mediterranean · Spatial variation ·Temporal variation
Resale or republication not permitted without written consent of the publisher
Aquat Microb Ecol 27: 47–56, 2002
coastal stations (Bonin et al. 1989) and in deep waters(Berland et al. 1990, Zohary & Robarts 1998). In addi-tion, experiments performed in the NW MediterraneanSea coastal waters showed phosphorus as the limitingfactor for phytoplankton growth (Jacques et al. 1973,Fiala et al. 1976).
Intimately connected to the nutrient limitation of pri-mary production in the photic zone is the question ofwhether this nutrient limitation also applies to thegrowth and activity of heterotrophic bacteria. Untilrecently it was thought that available organic carbonwas the limiting nutrient for heterotrophic bacterialgrowth in the oceans. However, in recent years, it hasbeen recognised that heterotrophic bacteria are strongcompetitors of phytoplankton for inorganic nutrients(i.e. Thingstad & Rassoulzadegan 1995) and that theseinorganic nutrients may directly limit heterotrophicbacterial activity in some aquatic ecosystems (Kupari-nen & Heinanen 1993, Caron 1994, Kirchman 1994,Elser et al. 1995, Pomeroy et al. 1995, Rivkin & Ander-son 1997, Caron et al. 2000), including the Mediter-ranean (Zohary & Robarts 1998). In the western part ofthis sea, the few existing studies on bacterioplanktonlimitation have been done at a single station off theVillefranche-sur-mer coast (Zweifel et al. 1993,Thingstad et al. 1998), and have always found phos-
phorus deficiencies. The aim of our work was to testthe existence of phosphorus limitation of heterotrophicbacterial growth in open waters of the westernMediterranean, and to determine whether there werevariations in space and time.
In order to test this hypothesis, we designed severalmultifactorial experiments that consisted of addinginorganic nutrients (nitrate [N], phosphate [P] or both)and a source of carbon (C, as glucose), and monitoringthe response of the microbial populations. This wasdone by measuring the rate of leucine incorporationinto bacterial biomass and the changes in bacterialnumbers. If the assumption that phosphorus was thelimiting nutrient for the community held true, wewould expect that addition of P alone would be enoughto stimulate bacterial growth. We focused our study onheterotrophic bacterioplankton growth limitation (1) inthe open sea, in both spring and autumn; (2) at 3 sta-tions located within the main hydrographical featuresof the inshore-offshore gradient: the coastal area overthe continental shelf, the slope and the open sea atdepths >2000 m; and (3) both in surface waters and atthe depth of the deep chlorophyll maximum (DCM).
MATERIAL AND METHODS
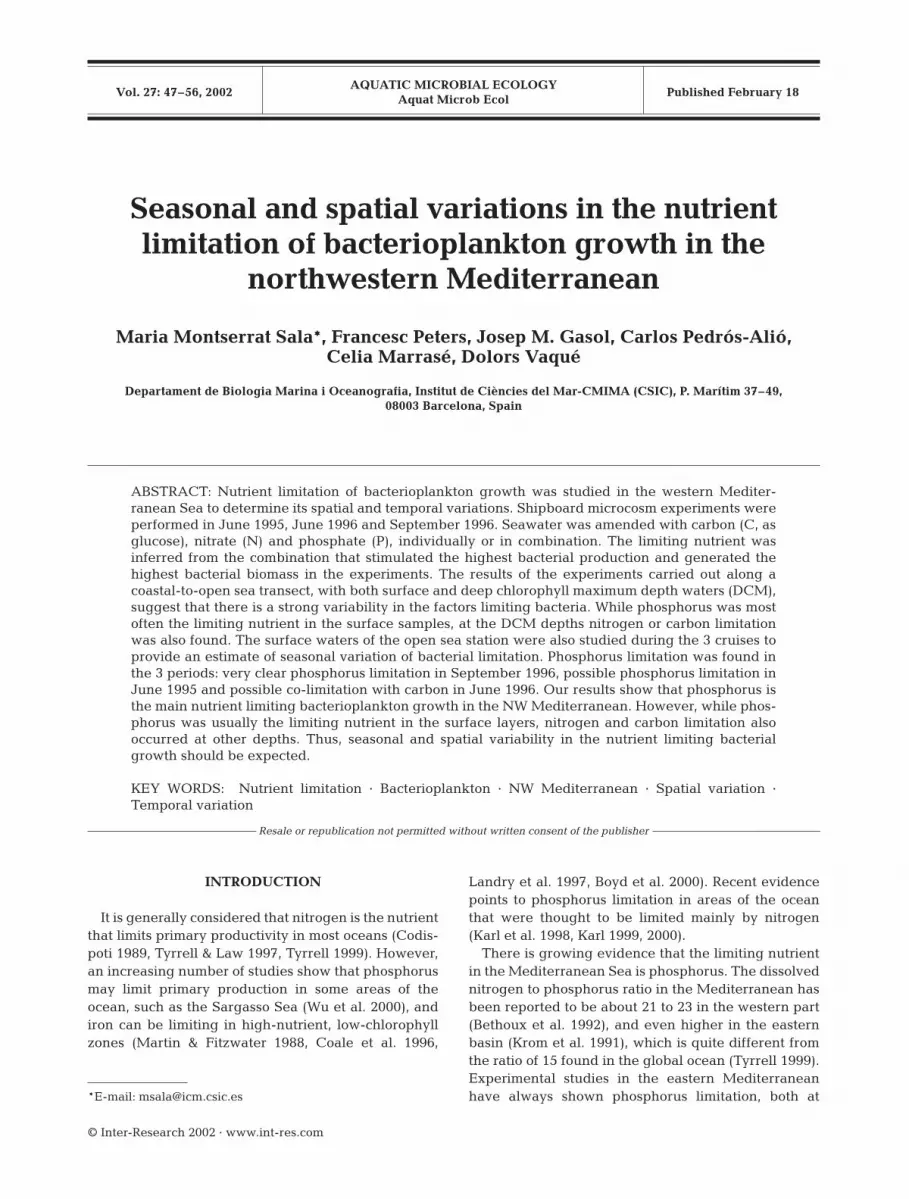
We established 2 types of shipboard microcosmexperiments at a total of 5 stations in the Catalano-Balearic basin of the Mediterranean Sea (Fig. 1), 3located in the open sea (Table 1), 1 above the shelfslope, and 1 above the coastal shelf.
During June 1996 and September 1996 we carriedout microcosm experiments with surface water from anopen ocean (open sea O) station. The experiments dif-fered mainly in the combination of nutrient additions(Table 2). In June 1996 the treatments were K (controlwithout additions), N (nitrate), NP (nitrate + phos-phate), C(glucose) N, and CNP. In September, we had8 treatments: K, C, N, P, CN, CP, NP and CNP. Eachtreatment was carried out in 2 replicate bottles.
On a cruise in June 1995 we established 6 microcosmexperiments with waters from 3 stations placed in thetransect between Barcelona and the channel betweenMallorca and Minorca, which has been repeatedlystudied in the last few years (e.g. Estrada et al. 1993,Pedrós-Alió et al. 1999). The 3 stations selected alongthe transect were chosen to represent the 3 mainhydrographic zones: the shelf coastal waters (coastalC), the slope frontal zone (slope S) and the offshoreopen sea zone. Two depths were studied at each sta-tion: surface and DCM depth. Characteristics of phyto-plankton and bacterioplankton production in the tran-sect have been summarised elsewhere (Estrada 1996,Pedrós-Alió et al. 1999). Additions in the experiments
48
Fig. 1. Map of the northwestern Mediterranean Sea with thestations sampled during the 3 cruises. The transect wassampled in June 1995 (J95) and the stations were coastal (C-J95), slope (S-J95) and open sea (O-J95). Other open seastations were sampled in June 1996 (O-J96) and September
1996 (O-S96)

Sala et al.: Variations in nutrient limitation
conducted in the transects were all K, C, N, P and CNP(Table 2).
Experimental design. The experimental conditionsare described in Table 2. For the 2 microcosm experi-ments carried out in 1996, duplicate 5 l plastic carboyswere filled with water. In June, we chose water from5 m and in September from 20 m. The carboys werefilled during the night in order to avoid sunlight phyto-plankton damage.
The carboys were incubated on deck in a 1 m3 tankwith circulating surface seawater to maintain in situtemperatures. The tank was covered with a mesh tosimulate the light intensity available at the sampleddepths. Light intensity in the tank was regularlychecked.
Nutrients were added daily to provide a final enrich-ment of 4 µM nitrate (NaNO3), 0.13 µM phosphate(NaH2PO4·H2O) and 40 µM C-glucose. Subsampleswere collected daily from each carboy to determinedissolved nutrient concentrations, chlorophyll a (chl a),bacterial abundance and bacterial activity.
The 1995 experiments differ in that bacteria were di-luted and the predators were removed: the water was
sequentially filtered through 200 µm mesh, 1 µm porefilters and 0.8 µm Nuclepore filters, and this inoculumwas diluted 1/10 with 0.2 µm filtered seawater. The re-sulting mixture was incubated in 1 l sterile and acid-rinsed Pyrex bottles for 4 d in the dark and at tempera-tures close to those in situ (20°C for surface and 15°C forDCM samples). The bottles were sampled daily for de-termination of bacterial numbers and bacterial activity.
Nutrients. Samples for inorganic nutrient determina-tions were taken daily in plastic bottles and frozenuntil analysis in the laboratory. Inorganic phosphorus,nitrate, nitrite and ammonium were analysed with anEvolution II (Alliance Instruments, Tecnova, France)autoanalyser according to the methodology ofGrasshoff et al. (1983).
Bacterial abundance and production. Subsamples(100 ml) were fixed with cold glutaraldehyde (1% finalconcentration). Bacteria were stained with 4',6-diamidino-2-phenylindole (DAPI) (final concentration5 µg ml–1) and filtered on black polycarbonate filters(0.2 pore diameter) following the procedure describedby Porter & Feig (1980). Cells on the filters werecounted with a Nikon Labophot epifluorescence
49
Stn Cruise RV Latitude, Maximal Surfacelongitude depth (m) temp. (°C)
C-J95 Varimed 95 BIO ‘Hespérides’ 41° 22’ 02” N 1168 18.502° 17’ 30” E
S-J95 Varimed 95 BIO ‘Hespérides’ 41° 06’ 10” N 1114 18.502° 26’ 13” E
O-J95 Varimed 95 BIO ‘Hespérides’ 40° 40’ 25” N 2093 18.502° 52’ 00” E
O-J96 Varimed 96 BO ‘García del Cid’ 40° 39’ 35” N 2048 20.503° 00’ 20” E
O-S96 Fronts 96 BO ‘García del Cid’ 41° 04’ 02” N 2413 21.503° 50’ 49” E
Table 1. Characteristics of the stations sampled in the NW Mediterranean Sea. The transect was sampled in June 1995 (J95) andthe stations were coastal (C-J95), slope (S-J95) and open sea (O-J95). Other open sea stations were sampled in June 1996 (O-J96)
and September 96 (O-S96)
Stn Sampling Treatments Incubation Incubation Incubationdepth (m) (d) temp. (°C) volume (l)
C-J95 00 K, C, N, P, CNP 4 18.5 1C-J95 50 K, C, N, P, CNP 4 13.5 1S-J95 00 K, C, N, P, CNP 4 18.5 1S-J95 50 K, C, N, P, CNP 4 13.5 1O-J95 00 K, C, N, P, CNP 4 18.5 1O-J95 50 K, C, N, P, CNP 4 13.5 1O-J96 05 K, N, NP, CNP 5 20.5 5O-S96 20 K, C, P, N, CN, CP, NP, CNP 4 21.5 5
Table 2. Description of the enrichment experiments: treatments, sampling depths, duration of the incubations, temperature andvolume of the experimental vessels. C: glucose; K: control without additions; N: nitrate; P: phosphate

Aquat Microb Ecol 27: 47–56, 2002
microscope at 1250× magnification. Cell volumes forthe 1995 samples were determined with an imageanalysis system measuring at least 200 cells sample–1
(Massana et al. 1997).The rate of incorporation of tritiated leucine into
macromolecules was measured for estimation of bacte-rial activity, following the method of Kirchman et al.(1985) with the modifications suggested by Smith &Azam (1992). Tritiated leucine (151 mCi mmol–1, Amer-sham) was brought to a concentration of 1 µM andmixed with non-radioactive leucine at 10% hot:90%cold, and dispensed (final concentration 40 nM) to1.2 ml of sample. This concentration was enough tosaturate incorporation according to the tests done dur-ing the first cruise. Three replicates and 2 blanks killedwith trichloroacetic acid (TCA) (5% final concentra-tion) per sample were incubated for 1 to 2 h in the darkat in situ temperature. The incubation was stoppedwith TCA (5% final concentration). Samples wererinsed twice by centrifugation in 5% TCA and thencounted in a Packard scintillation counter after addi-tion of Optiphase Hisafe II scintillation cocktail(Optiphase, Hipahase 2, Wallac, UK).
For the evaluation of the nutrient deficiency of bacte-rial cells we calculated 3 different indicators: the specificgrowth rate, the potential bacterial abundance or bio-volume reached at the end of the experiment and theintegrated bacterial activity. The use of these 3 para-meters has been shown to provide useful information inthe study of the limitation of microheterotrophic sourcesby resource abundance in Antarctic waters (Calderón-Paz 1997) or in freshwaters (Eriksson & Pedrós-Alió1990). Specific growth rates were determined as theslope of simple linear regressions of log-transformedabundance versus time during exponential growth. Wedefined potential biovolume as the maximal abundancereached in each culture, multiplied by the cellularvolume of the bacterial cells at the end of the experiment.In the experiments of 1996, we did not measure bacter-ial cell size and we thus used potential abundance, themaximal abundance reached in each culture. Total inte-grated leucine incorporation was expected to reflect thewhole synthesis of protein throughout each experimentand was calculated as the integrated area of the leucineincorporation versus time.
RESULTS
Spring versus autumn variations in the open sea station
Concentrations of inorganic nutrients were quitesimilar in the 2 periods studied (Table 3), leading tovery similar nitrogen to phosphorus ratios at the startof both experiments: 13.4 (June) and 10.4 (September).Bacterial concentrations were higher in June thanin September. Leucine incorporation rates, on thecontrary, were about 5 times higher in September(194 pmol l–1 h–1) than in June (40 pmol l–1 h–1), andbacterial growth rates were thus much higher inSeptember than in June.
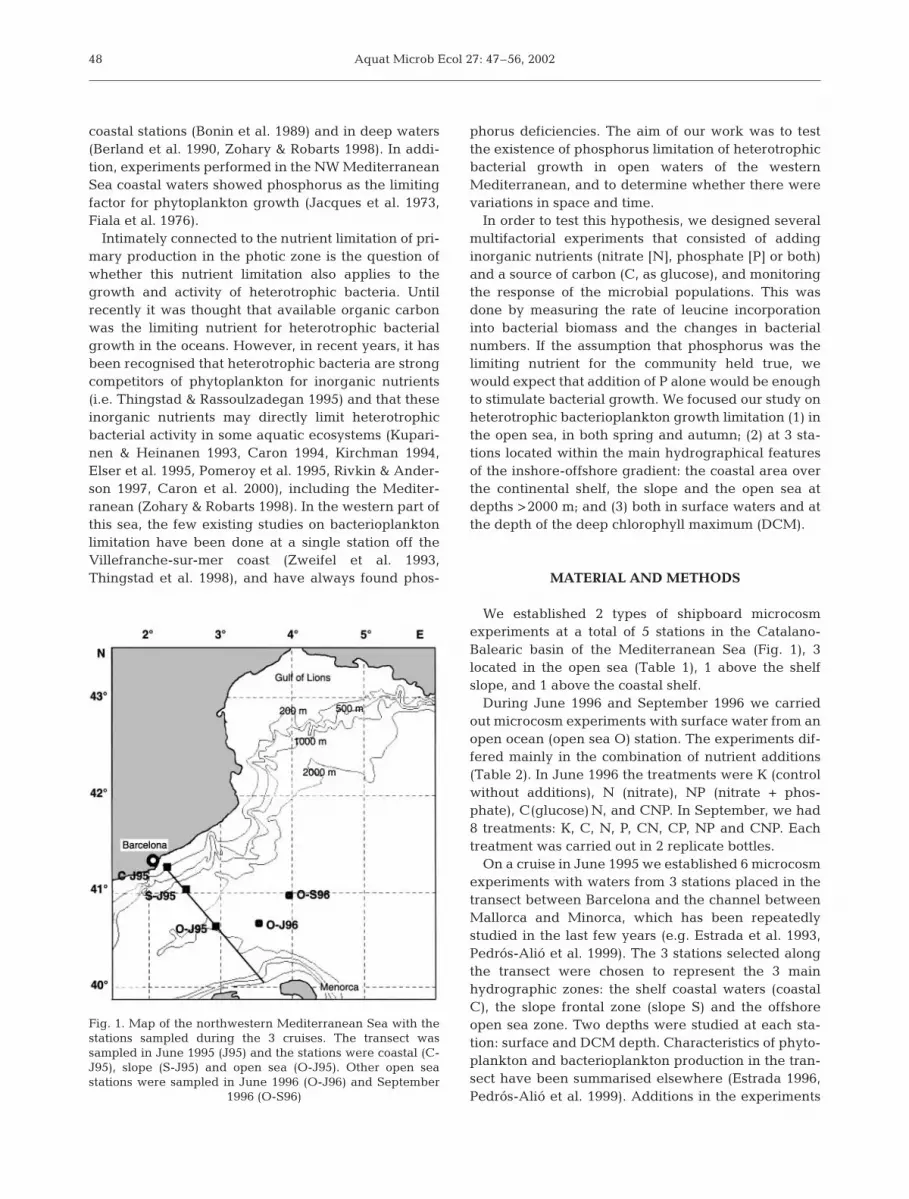
Both in June and September, inorganic phosphoruswas generally below 0.2 µM in the treatments with noP addition (Figs. 2a & 3a). Treatments with P additionshowed an accumulation of phosphorus until a plateauwas reached. The levels of this plateau were near 4 µMin NP in June and close to 1 µM for the P, CP and NPtreatments in September. The exceptions to this cleartrend were the CNP treatments, where phosphorusdecreased soon after the addition and remained lowthroughout the experiments. Total inorganic nitrogen(NH4 + NO3 + NO2) remained below 4 µM in the treat-ments where N was not added (Figs. 2b & 3b). In thetreatments with added N, the concentration increasedto values near 30 (June) or 20 µM (September). As inthe case of PO4 concentration, the only exception tothis clear trend was the CNP treatment, where, afterthe first addition, nitrogen decreased to values around1 µM.
Bacterial abundance (Figs. 2c & 3c) in the CNPtreatments showed a clear increase up to the secondday (7.9 × 10⁶ and 3.8 × 10⁶ bacteria ml–1 in June andSeptember, respectively), when they reached aplateau. A decrease was observed after Day 4 in Junedown to 5.0 × 10⁵ bacteria ml–1. We found no cleardifferences among the other treatments in June,when bacterial concentrations varied between 1 × 10⁶
and 3 × 10⁶ bacteria ml–1. In September, however,treatments with P addition (P, CP, NP) showedslightly higher concentrations of bacteria than thetreatments without P addition.
50
Expt Chl a PO4 NO3 NO2 NH4 Bacterial Leu incorporation(µg l–1) (µM) (µM) (µM) (µM) abundance rate (pmol l–1 h–1)
(cells ml–1)
Jun 1996 0.09 0.08 0.28 0.04 0.75 7.08 × 10⁵ 040Sep 1996 0.35 0.12 0.21 0.06 0.98 5.27 × 10⁵ 194
Table 3. Initial values of different parameters in experiments carried out in June and September 1996. Chl a: chlorophyll a
Sala et al.: Variations in nutrient limitation
Bacterial activity, presented as the cumulativeleucine incorporation, increased in June in all treat-ments, regardless of the type of addition, but only NPshowed values slightly higher than the control (Fig. 2d).In September (Fig. 3d), cumulative leucine incorpora-tion was always higher in the P additions, and the high-est levels were always observed in the CNP treatment.
We used 3 different parameters to test for nutrientdeficiency: specific growth rate, potential abundance,
and integrated leucine incorporation (Fig. 4). In bothJune and September, CNP treatments showed thehighest specific growth rates and potential abun-dance. CNP treatments also had the highest inte-grated leucine incorporation in September. All para-meters tended to be higher in the treatmentscontaining P. Differences among treatments weretested statistically with an ANOVA for each of the 3nutrients and for the combinations of 2 nutrients. Foreach analysis, treatments were split into 2 groups:with and without the nutrient amendment. Table 4
51
Fig. 2. (a) Evolution of PO4 concentration, (b) nitrogenconcentration, (c) bacterial abundance and (d) cumulativeleucine incorporation in the experiment of June 1996. Barsshow standard deviation of 2 replicate bottles. Treatments arecontrol (K), nitrate addition (N), nitrate and phosphateaddition (NP), carbon (glucose) and nitrate addition (CN), and
glucose, nitrate and phosphate additions (CNP)
Fig. 3. (a) Evolution of PO4 concentration, (b) nitrogenconcentration, (c) bacterial abundance and (d) cumulativeleucine incorporation in the experiment of September 1996.Bars show standard deviation of 2 replicate bottles. Treat-
ments are as in Fig. 2

Aquat Microb Ecol 27: 47–56, 2002
shows the amendments that produced a significantincrease in one or more of the 3 parameters, with theirrespective levels of significance. We considered that anutrient was limiting when 2 or more of the 3 parame-ters showed significant changes after addition. If anincrease was detected in only one parameter, we indi-cate that a possible limitation by that nutrientoccurred. In June, the CNP additions caused highlysignificant increases in specific growth rate andpotential abundance. Since NP showed only a slightly
significant increase in potential abundance, we sus-pect that there was a limitation of carbon and phos-phorus in that month even though we did not test thatparticular combination.
In September we had a clear phosphorus limitationsince all parameters were significantly higher in thetreatments in which P was added. A second limitingnutrient was carbon, which in combination with phos-phorus caused significant increases in potential abun-dance and integrated production.
52
Fig. 4. Parameters calculated to evaluate nutrient limitation of bacterioplankton (bact) growth in the experiments performed inJune and September 1996. Specific growth rate is the slope of simple linear regressions of log-transformed abundance with timeduring exponential growth. Potential abundance is the maximal abundance reached in each culture. Integrated leucine incorpo-ration is the integrated area of the leucine incorporation up to the point of maximal cell abundance. Error bars are the standard
deviation of 2 replicate treatments
Month Specific growth rate Potential abundance Integrated production Diagnosis
Jun 1996 CNP** CNP***, NP* ns P, CP possibleSep 1996 P* CNP*** P**, CP**, CNP*** P***, CP***, CNP*** P
Table 4. Additions, or combination of additions, that elicited higher bacterial specific growth rates, potential abundances orintegrated bacterial activity in the experiments performed in June and September 1996. Results of a 1-way ANOVA (see text).Limitation by a nutrient was diagnosed when at least 2 of the parameters were significantly different. A possible limitation isindicated when only one of the parameters was significantly higher. ns: none of the nutrient additions caused a significant
increase in the parameter; *p < 0.05; **p < 0.01; ***p < 0.001

Sala et al.: Variations in nutrient limitation
Spatial variation
Six bioassays at 2 depths (surface and DCM) at 3 sta-tions along an inshore-offshore transect were per-formed in June 1995. As in the seasonal comparisonabove, 3 different parameters were used as indicatorsof nutrient deficiency: specific growth rate, potentialbiovolume (in this case we had estimates of bacterialcell size), and integrated production. Fig. 5 shows theaverage results of these 3 different parameters in allthe samples. In this case there were no replicate bot-tles, as we preferred to carry out more experimentswith different samples rather than spend our efforts onreplicated bottles that, as can be seen in Figs. 2 & 3,tend to be quite close. The time course of the differentparameters evolved as in the previous experiments,and is thus not detailed here.
Without nutrient additions, we found the highestspecific growth rates, potential biovolume and inte-grated bacterial production at the DCM depth of thecoastal station. Differences among treatments weretested statistically as explained above. For each ofthese analyses, treatments were split into 2 groups:
with the nutrient amendment (n = 2) and without thenutrient amendment (n = 3). Addition of P (Table 5)caused significant increases in specific growth rates in4 out of 6 samples. Differences were significant for allsurface samples, but only at the open sea station for theDCM samples. Altogether, it appeared that the effectsof adding P increased from coastal to open sea stations.P also caused significant increases in potential biovol-ume at the slope-surface station and in the open seaDCM sample. N amendments only caused significantincreases at the coastal DCM station, in both potentialbiovolume and integrated production. Finally, C addi-tion caused only a significant increase in the potentialbiovolume of the slope DCM sample.
As before, we considered that a nutrient was limitingwhen 2 or more of the 3 parameters caused significantdifferences after its addition. This was the case forphosphorus in the slope-surface and open sea DCMsamples, and a possible phosphorus limitation in thecoastal surface and open sea surface samples. Wefound nitrogen limitation in 1 of the 6 samples, thecoastal DCM, and a possible carbon limitation at theslope DCM station.
53
Fig. 5. Parameters calculated to evaluate nutrient limitation of bacterioplankton growth in the experiments performed at thesurface and at the deep chlorophyll maximum (DCM) depth of the stations situated in the coastal, slope and open sea zone. Treat-ments are as in Fig. 2. Specific growth rate is the slope of simple linear regressions of log-transformed abundance with timeduring exponential growth. Potential abundance is the maximal abundance reached in each culture. Integrated leucine incorpo-
ration is the integrated area of the leucine incorporation up to the point of maximal biomass

Aquat Microb Ecol 27: 47–56, 2002
DISCUSSION
The aim of our study was to determine whethergrowth of the heterotrophic bacterial populations ofthe western Mediterranean Sea was phosphoruslimited, and whether this limitation varied in space andtime. We consider that a nutrient is limiting bacterialgrowth when the availability of that nutrient is lowrelative to the demand of the bacterial cells (Redfield1958, Cotner et al. 1997). This was expressed as anincrease of bacterial growth after the addition of thenutrient alone or in combination with other nutrients.We used 3 indicators of nutrient defficiency: growthrate, cumulative leucine incorporation and potentialbiomass achieved. Nutrient defficiency can affect indifferent ways the growth and metabolism of bacteria.If the actual growth rate is lower than the maximalgrowth rate, then the nutrient available is obviouslylimiting bacterial growth. A second possibility is thatthe growth rate is not affected but that the finalbiomass yield may be lower than the theoretical poten-tial. This would be detected in our bioassays by a lowercumulative leucine incorporation or by a lower poten-tial biomass achieved at the end of the experiments.These 3 indicators combine information from differenteffects of nutrients and integrate the response of thepopulations through the whole growth curve. There-fore, they are a sensitive tool to detect nutrientdeficiency.
After the enrichment experiments, surface waters ofthe open sea stations showed that phosphorus was thelimiting nutrient for heterotrophic bacterioplanktongrowth for the 3 periods of sampling: June 1995, June1996 and September 1996. This limitation was foundwith several degrees: clear phosphorus limitation inSeptember 1996, possible phosphorus limitation inJune 1995, and possible phosphorus co-limitation withcarbon in June 1996. We found that, regardless of theyear or season, phosphorus was limiting bacterio-plankton growth. Previous studies at a NW Mediter-
ranean coastal station during summer have alwaysshown a phosphorus limitation of bacterioplankton(Thingstad et al. 1998), short turnover rates of phos-phorus (Dolan et al. 1995), and phosphorus limitationof Synechococcus sp. growth (Vaulot et al. 1996); thesame has also been observed in autumn (Hagström etal. 2001). In summer a coastal station in Blanes Bay alsoshowed a phosphorus-limited plankton in mesocosmexperiments (Vidal & Duarte 2000). In the NE Mediter-ranean, bacteria and phytoplankton growth has beenshown to be phosphorus limited in winter (Zohary &Robarts 1998), although no other studies have beenpublished from other seasons.
There seemed to be a phosphorus or possible phos-phorus limitation in all the samples taken at thesurface of the stations in the transect analysed in June1995. These observations are in agreement with theresults obtained in similar enrichment experiments inthe surface seawater of a coastal station (Zweifel et al.1993, Thingstad et al. 1998, Hagström et al. 2001). Atthe DCM depth, however, such a clear pattern couldnot be detected. We found possible limitation by allnutrients: nitrogen at the coastal station, carbon at theslope station and phosphorus at the open sea stations.A well-developed DCM is a characteristic of theMediterranean Sea during a large part of the year(Estrada 1985, Estrada et al. 1993). It can be explainedby the reduced physical losses and the significantphytoplankton growth due to simultaneous availabilityof nutrients and light. Phytoplankton compete withbacteria for inorganic nutrients, and therefore higherphytoplankton concentrations could lead to a higherinorganic limitation of bacterial growth. The chl a con-centration did not differ greatly among the stations,varying from 0.6 µg l–1 at the coastal station to 0.8 µg l–1
at the slope and open sea stations (Pedrós-Alió et al.1999). However, results of samples taken in the tran-sect on the September 1996 cruise showed clear differ-ences in the size of the algal populations at the differ-ent stations. The open sea station showed the lowest
54
Stn Depth Specific growth rate Potential biovolume Integrated production Diagnosis
Coastal Surface P** ns ns P possibleDCM ns N** N* N
Slope Surface P** P** ns PDCM ns C** ns C possible
Open sea Surface P** ns ns P possibleDCM P** P** ns P
Table 5. Additions, or combination of additions, that elicited higher bacterial specific growth rates, potential biovolumes orintegrated bacterial activity in the experiments performed in 1995 in 3 stations (coastal, slope and open sea) situated in aninshore-offshore transect. Results of a 1-way ANOVA (see text). Experiments were performed both at the surface and at the deepchlorophyll maximum (DCM) depth. Limitation by a nutrient was diagnosed when at least 2 of the parameters were significantlydifferent. A possible limitation is indicated when only one of the parameters was significantly higher. ns: none of the
nutrient additions caused a significant increase of the parameter; *p < 0.05; **p < 0.01; ***p < 0.001

Sala et al.: Variations in nutrient limitation
concentrations of nanophytoplankton and the highestof Prochlorococcus sp. These small phototrophic bacte-ria can compete more efficiently with heterotrophicbacteria for nutrients. A possible explanation for thevariability in the nutrient that was limiting heterotro-phic bacterial growth in the DCM could be found inthe sporadic instabilities of the DCM that can providenutrient inputs from deeper layers.
The slope DCM sample showed no limitation by anyinorganic nutrient; rather, it showed a possible carbonlimitation. Pedrós-Alió et al. (1999) showed that bacte-ria from the slope station had higher growth rates thanthose from the coastal or open sea stations, perhapsdue to small-scale fertilisation events associated withthe slope front. Inorganic nutrient inputs from thisfront may eliminate the inorganic nutrient limitation ofbacterioplankton growth and eventually, perhaps, leadto a shift to carbon limitation.
Finally, coastal DCM waters did not show clear phos-phorus limitation, whereas nitrogen limitation wasfound. It may be possible that terrestrial phosphorusinputs can alter the nitrogen to phosphorus ratio andthen induce nitrogen limitation of bacterioplanktongrowth at this site, which was located on the continen-tal shelf. Diel variations in bacterial activity and dis-solved organic carbon (DOC) concentrations weredetected at the slope and open sea stations of this tran-sect (Gasol et al. 1998), suggesting an algal-bacterialcoupling at these stations, but not at the coastal station.This suggests that bacteria at the coastal station de-pend largely on allochthonous organic carbon.
Our enrichment bioassays have shown that phospho-rus is the most likely nutrient to become limiting to theheterotrophic bacterioplankton in the surface layer,and that this occurs in different seasons, at differentdepths and at stations with different degrees of coastalinfluence. In the DCM we found phosphorus, nitrogenand possible carbon limitation at different stations. It isnot possible to generalise the existence of a givenlimitation in these zones since they probably vary atshort time intervals, responding to variations in nutri-ent concentrations driven by small-scale physical phe-nomena. It seems likely that the DCM is a very activezone, where heterotrophic bacteria co-exist with sev-eral phytoplankton species with different degrees ofaffinity for nutrients, which can act as competitors andmodify the bacterial nutrient environment. Addition-ally, inputs from deeper layers can alleviate the defi-ciency of one nutrient and probably create a differentdeficiency. We can imagine that this must be a rathervariable environment. Additional studies on bacterio-plankton growth in this layer with a higher resolutionin time and space seem promising, even though itappears that bacterioplankton diversity is quite homo-geneous in this layer over large spatial scales, at least
during the summer (Acinas et al. 1997). The study ofthis variability would require the search for appropri-ate direct and quick limitation indicators (e.g. Berdaletet al. 1996, Sala et al. 2001), which would avoid the useof long incubation experiments during which the com-munity composition typically changes (Massana et al.2001 and references therein). The bacterioplankton ofthe oligotrophic Mediterranean Sea live in a dynamicequilibrium in which slight changes in grazing pres-sure, competition and nutrient concentrations can shiftthe communities from one type of nutrient limitation toanother.
Acknowledgements. We thank the captains, crews and chiefscientists (Marta Estrada, Miquel Alcaraz and Anna Sabatés)of research vessels BO ‘García del Cid’ and BIO ‘Hespérides’.We are also grateful to Kristine Lysnes, Laura Arin and Mer-cedes Castaño for their technical help and to Jarone Pinhassifor fruitful discussions. Funding was provided by the SpanishCICYT projects AMB94-0853 and MAR98-0932, and the EUproject BIOHAB (EVK3-CT99-00015) and NATP (EVK3-CT-2000-00022) . This is ELOISE contribution no. 263/40.
LITERATURE CITED
Acinas SG, Rodríguez-Valera F, Pedrós-Alió C (1997) Spatialand temporal variation in marine bacterioplankton diver-sity as shown by RFLP fingerprinting of PCR amplified 16SrDNA. FEMS Microbiol Ecol 24:27–40
Berdalet E, Marrasé C, Estrada M, Arin L, MacLean ML(1996) Microbial community responses to nitrogen- andphosphorus-deficient nutrient inputs: microplanktondynamics and biochemical characterization. J PlanktonRes 18:1627–1641
Berland BR, Maestrini SY, Burlakova ZP, Georgieva L,Kholodov VY, Krupatkina DK (1990) Limitation de la crois-sance algale dans les eaux ultra-oligotrophes de la mer duLevant (Mediterrannée orientale). Mem Biol MarOceanogr 18:5–28
Bethoux JP, Morin P, Madec C, Gentili B (1992) Phosphorusand nitrogen behaviour in the Mediterranean sea. Deep-Sea Res 39:1641–1654
Bonin DJ, Bonin MC, Berman T (1989) Mise en évidenceexpérimentale des facteurs nutritifs limitants de la produc-tion du micro-nanoplancton et de l’ultraplankton dans uneeau côtiere de la Méditerranée orientale (Haïfa, Israël).Aquat Sci 51:129–152
Boyd PW, Watson AJ, Law CS, Abraham ER and 31 others(2000) A mesoscale phytoplankton bloom in the polarSouthern Ocean stimulated by iron fertilization. Nature407:695–702
Calderón-Paz I (1997) Ecología de las bacterias heterotróficasen ecosistemas planctónicos. PhD thesis, Universitat deBarcelona
Caron DA (1994) Inorganic nutrients, bacteria and the micro-bial loop. Microb Ecol 28:295–298
Caron DA, Lim EL, Sanders RW, Dennett MR, Berninger UG(2000) Responses to bacterioplankton and phytoplanktonto organic carbon and inorganic nutrients additions incontrasting oceanic ecosystems. Aquat Microb Ecol 22:175–184
Coale KH, Johnson KS, Fitzwater SE, Gordon RM and 15others (1996) A massive phytoplankton bloom induced by
55

Aquat Microb Ecol 27: 47–56, 2002
an ecosystem-scale iron fertilization experiment in theequatorial Pacific Ocean. Nature 383:495–501
Codispoti LA (1989) Phosphorus vs nitrogen limitation of newand export production. In: Berger WH, Smetacek VS,Wefer G (eds) Productivity of the ocean: present and past.Report of the Dahlem Workshop on Productivity of theOcean, Present and Past, Berlin 1988, April 24–29. Wiley,New York, p 377–408
Cotner JB, Ammermann JW, Peele ER, Bentzen E (1997)Phosphorus-limited bacterioplankton growth in the Sar-gasso Sea. Aquat Microb Ecol 13:141–149
Dolan JR, Thingstad TF, Rassoulzadegan F (1995) Phosphatetransfer between microbial size-fractions in VillefrancheBay (NW Mediterranean sea), France in autumn 1992.Ophelia 41:71–85
Elser JJ, Stabler LB, Hasset RP (1995) Nutrient limitation ofbacterial growth and rates of bacterivory in lakes andoceans: a comparative study. Aquat Microb Ecol 9:105–110
Eriksson C, Pedrós-Alió C (1990) Selenium as a nutrient forfreshwater bacterioplankton and its interactions withphosphorus. Can J Microbiol 36:475–483
Estrada M (1985) Deep phytoplankton and chlorophyllmaxima in the Western Mediterranean. In: Moraitou-Apostolopoulou M, Kiortsis M (eds) Mediterranean marineecosystems. Plenum Press, New York, p 247–277
Estrada M (1996) Primary production in the northwesternMediterranean. Sci Mar 60:55–64
Estrada M, Marrasé C, Latasa M, Berdalet E, Delgado M,Riera T (1993) Variability of deep chlorophyll maximum inthe Northwestern Mediterranean. Mar Ecol Prog Ser 92:289–300
Fiala M, Cahet G, Jacques G, Neveux J, Panousse M (1976)Fertilisation de communautés phytoplanktoniques, I. Casd’un milieu oligotrophe: mediterranée nord-occidentale.J Exp Mar Biol Ecol 24:151–163
Gasol JM, Doval MD, Pinhassi J, Calderón-Paz JI and 3 others(1998) Diel variations in bacterial heterotrophic produc-tion in the Nortwestern Mediterranean Sea. Mar Ecol ProgSer 164:125–133
Grasshoff K, Ehrhardt M, Kremling K (1983) Methods on sea-water analysis, 2nd edn. Verlag Chemie, Weinheim
Hagström Å, Pinhassi J, Zweifel UL (2001) Marine bacterio-plankton show bursts of rapid growth induced by sub-strate shifts. Aquat Microb Ecol 24:19–115
Jacques G, Cahet G, Fiala M, Panousse M (1973) Enrichisse-ment de communautés phytoplanctoniques néritiques deméditerranée nord occidentale. J Exp Mar Biol Ecol 11:287–295
Karl DM (1999) A sea of change: biogeochemical variability inthe North Pacific Subtropical Gyre. Ecosystems 2:181–214
Karl DM (2000) Phosphorus, the staff of life. Nature 406:31–32Karl DM, Hebel DV, Björkman H, Letelier RM (1998) The role
of dissolved organic matter release in the productivity ofthe oligotrophic North Pacific Ocean. Limnol Oceanogr43:1270–1286
Kirchman DL (1994) The uptake of inorganic nutrients by het-erotrophic bacteria. Microb Ecol 28:255–271
Kirchman DL, K’nees E, Hodson R (1985) Leucine incorpora-tion and its potential as a measure of protein synthesis bybacteria in natural aquatic systems. Appl Environ Micro-biol 49:599–607
Krom MD, Kress N, Brenner S, Gordon LI (1991) Phosphoruslimitation of primary productivity in the eastern Mediter-ranean Sea. Limnol Oceanogr 36:424–432
Kuparinen J, Heinanen A (1993) Inorganic nutrient and car-bon controlled bacterioplankton growth in the Baltic Sea.
Est Coast Shelf Sci. 37:271–285Landry MR, Barber RT, Bidigare R, Chai F and 9 others (1997)
Iron and grazing constraints on primary production in thecentral equatorial Pacific: an EqPac synthesis. LimnolOceanogr 42:405–418
Martin JH, Fitzwater SE (1988) Iron deficiency limits phyto-plankton growth in the north-east Pacific Subarctic.Nature 331:341–343
Massana R, Gasol JM, Bjørsen PK, Blackburn N and 5 others(1997) Measurement of bacterial size via image analysis ofepifluorescence preparations: description of an inexpen-sive system and solutions to some of the most commonproblems. Sci Mar 61:397–407
Massana R, Pedrós-Alió C, Casamayor EO, Gasol JM (2001)Changes in marine bacterioplankton phylogenetic compo-sition during incubations designed to measure biogeo-chemically significant parameters. Limnol Oceanogr 46:1181–1188
Pedrós-Alió C, Calderón-Paz JI, Guixa-Boixereu N, EstradaM, Gasol JM (1999) Bacterioplankton and phytoplanktonbiomass and production during summer stratification inthe northwestern Mediterranean Sea. Deep-Sea Res 46:985–1019
Pomeroy LR Sheldon JE, Sheldon WM Jr, Peters F (1995)Limits to growth and respiration of bacterioplankton in theGulf of Mexico. Mar Ecol Prog Ser 117:259–268
Porter KG, Feig YS (1980) The use of DAPI for identifying andcounting aquatic microflora. Limnol Oceanogr 25:943–948
Redfield AC (1958) The biological control of chemical factorsin the environment. Am Sci 46:205–221
Rivkin RB, Anderson MR (1997) Inorganic nutrient limitationof oceanic bacterioplankton. Limnol Oceanogr 42:730–740
Sala MM, Karner M, Arin L, Marrasé C (2001) Measurementof ectoenzyme activities as an indication of inorganicnutrient imbalance in microbial communities. AquatMicrob Ecol 23:301–311
Smith DC, Azam F (1992) A simple, economical method formeasuring bacterial protein synthesis rates in seawaterusing 3H-leucine. Mar Microb Food Webs 6:107–114
Thingstad TF, Rassoulzadegan F (1995) Nutrient limitations,microbial food webs, and ‘biological C-pumps’: suggestedinteractions in a P-limited Mediterranean. Mar Ecol ProgSer 117:299–306
Thingstad TF, Zweifel UL, Rassoulzadegan F (1998) P limita-tion of heterotrophic bacteria and phytoplankton in thenorthwest Mediterranean. Limnol Oceanogr 43:88–94
Tyrrell T (1999) The relative influences of nitrogen and phos-phorus on oceanic primary production. Nature 400:525–531
Tyrrell T, Law CS (1997) Low nitrate:phosphate ratios in theglobal ocean. Nature 387:793–796
Vaulot D, LeBot N, Marie D, Fukai E (1996) Effect of phos-phorus on the Synechococcus cell cycle in surfaceMediterranean waters during summer. Appl EnvironMicrobiol 62:2527–2533
Vidal M, Duarte CM (2000) Nutrient accumulation at differ-ent supply rates in experimental Mediterranean plank-tonic communities. Mar Ecol Prog Ser 207:1–11
Wu JF, Sunda W, Boyle EA, Karl DM (2000) Phosphate deple-tion in the Western North Atlantic Ocean. Science 289:759–762
Zohary T, Robarts RD (1998) Experimental study of microbialP limitation in the eastern Mediterranean. LimnolOceanogr 43:387–395
Zweifel UL, Norrman B, Hagström A (1993) Consumption ofdissolved organic carbon by marine bacteria and demandfor inorganic nutrients. Mar Ecol Prog Ser 101:23–32
56
Editorial responsibility: Frede Thingstad,Bergen, Norway
Submitted: August 2, 2001; Accepted: December 4, 2001Proofs received from author(s): January 14, 2002