scharr public health evidence report 2.3 - the university
TRANSCRIPT
ScHARR Public Health Evidence Report 2.3
Alcohol use disorders – preventing harmful drinking
Screening and brief interventions: Cost effectiveness review
Authors: Nicholas Latimer, Louise Guillaume, Elizabeth Goyder, Jim Chilcott, Nick Payne
Public Health Collaborating Centre

Screening and brief interventions: Cost effectiveness review
2
Commissioned by:
NICE Centre for Public Health Excellence
Produced by: ScHARR Public Health Collaborating Centre
Correspondence to: Vivienne Walker
School of Health and Related Research (ScHARR) University of Sheffield Regent Court 30 Regent Street Sheffield S1 4DA [email protected]
This report should be referenced as follows: Latimer Nicholas, Guillaume Louise, Goyder Elizabeth, Chilcott Jim, Payne Nick. (2009). Interventions on control of alcohol price, promotion and availability for prevention of alcohol use disorders in adults and young people. ScHARR Public Health Evidence Report 2.3
© 2009 ScHARR (School of Health and Related Research) University of Sheffield ISBN 190075267

Screening and brief interventions: Cost effectiveness review
3
About the ScHARR Public Health Collaborating Centre
The School of Health and Related Research (ScHARR), in the Faculty of Medicine,
Dentistry and Health, University of Sheffield, is a multidisciplinary research-led
academic department with established strengths in health technology assessment,
health services research, public health, medical statistics, information science, health
economics, operational research and mathematical modelling, and qualitative
research methods. It has close links with the NHS locally and nationally and an
extensive programme of undergraduate and postgraduate teaching, with Masters
courses in public health, health services research, health economics and decision
modelling.
ScHARR is one of the two Public Health Collaborating Centres for the Centre for
Public Health Excellence (CPHE) in the National Institute for Health and Clinical
Excellence (NICE) established in May 2008. The Public Health Collaborating Centres
work closely with colleagues in the Centre for Public Health Excellence to produce
evidence reviews, economic appraisals, systematic reviews and other evidence
based products to support the development of guidance by the public health advisory
committees of NICE (the Public Health Interventions Advisory Committee (PHIAC)
and Programme Development Groups).
Contribution of Authors
Nick Latimer was the author. Louise Guillaume developed and undertook literature
searches. Elizabeth Goyder, Jim Chilcott and Nick Payne were the senior leads.
Acknowledgements
This report was commissioned by the Centre for Public Health Excellence of behalf of
the National Institute for Health and Clinical Excellence. The views expressed in the
report are those of the authors and not necessarily those of the Centre for Public
Health Excellence or the National Institute for Health and Clinical Excellence. The
final report and any errors remain the responsibility of the University of Sheffield.
Elizabeth Goyder and Jim Chilcott are guarantors.
Screening and brief interventions: Cost effectiveness review
4
CONTENTS Page
Executive Summary 5 Introduction 13 Methods 14 Results 17 Emergency Care Setting 17 Hospital Inpatients and Outpatients 23 Primary Care 31 Further Analysis 60 Report Conclusion 72 Evidence Statements
Appendices References
74 77
194
Table 1 Studies Reviewed – Emergency Care Setting 17 Table 2 Studies Reviewed – Hospital Inpatient Setting 23 Table 3 Studies Reviewed – Primary Care Setting 30 Table 4 Studies assessing total cost impact 60 Table 5 DALY and QALY estimates from the literature 63 Table 6 Adjusted DALY and QALY gains – lifetime period 66 Table 7 Screening and Brief Intervention costing in a UK context
based on one application of intervention 67
Table 8
Lifetime QALY/DALY gains and total lifetime intervention costs in a UK context
68
Figure 1 Studies included in cost effectiveness review 15 Appendix A Appendix B Appendix C Appendix D Appendix E
Key characteristics and summary of studies included in the economic review Evidence Tables Inclusion and Exclusion criteria Excluded studies Search details
77
84
186
189
192
Screening and brief interventions: Cost effectiveness review
5
EXECUTIVE SUMMARY Background Alcohol misuse is associated with significant clinical and social consequences. The National Institute for Health and Clinical Excellence has been asked by the Department of Health to develop public health guidance to promote the prevention and early identification of alcohol-use disorders in adults and adolescents. Objectives The objective of this paper is to complete a review of the literature to address the following topics from an economics perspective: 1. The effectiveness and cost-effectiveness of alcohol screening questionnaires, biochemical indicators and clinical indicators of alcohol misuse in identifying adults and young people who currently misuse or are at risk of misusing alcohol 2. The effectiveness and cost-effectiveness of brief interventions in preventing hazardous and harmful drinking among adults and young people Methods A detailed literature search and review will be presented. The relevant existing economic literature will be critically appraised. The evidence review will not be split based on evidence for screening tools and evidence for brief interventions. This is because for an assessment of the cost effectiveness of a screening tool the intervention that follows it must also be considered. The evidence for screening and brief interventions in different settings will be considered separately because any guidance relating to these interventions is likely to be specific regarding the setting it should take place in. It is plausible that interventions administered in different settings may have different effects, necessitating this separation of settings in the review. Further economic analysis will be undertaken where the evidence in the existing literature is not sufficient for conclusions to be made. Results and Evidence Statements Settings for which existing economic evidence was found were: Emergency Care; Hospital inpatients; Primary Care. Three papers (2 in the hospital setting and 1 set in primary care) were found that assessed screening only, with all other papers focussing on brief interventions but including a screening aspect.
• Emergency Care Three papers were found which investigated the economic aspects of screening plus a brief intervention in the emergency care setting (Gentilello, 2005; Kunz, 2004; Barrett, 2006). Two papers were based in the US and one was based in the UK. All are of moderate to high quality.
Screening and brief interventions: Cost effectiveness review
6
Gentilello et al (2005) conduct a cost minimisation analysis including screening and intervention costs as well as future emergency department and hospitalisation costs. The authors find that screening plus intervention are likely to lead to cost savings for the health care payer due to reduced future hospitalisations. Kunz, French, & Bazargan-Hejazi (2004) conduct a cost effectiveness analysis based on consumption outcomes and direct screening and intervention costs. The results of the paper are of limited use within a UK context because of an unrepresentative population and a non-generic outcome measure. Barrett, Byford, Crawford et al (2006) conduct a 12-month cost effectiveness analysis of a brief intervention carried out by alcohol health workers in a hospital setting following screening in the accident and emergency department, using consumption outcomes and societal costs. The costs in the intervention group and the control group were not statistically significantly different from one another, with the intervention group slightly more expensive on average. The cost of screening, which was received by both the control group and the intervention group, was not included. Consumption was statistically significantly lower in the intervention group at 6 months, though this was no longer significant after 12 months. The consumption outcome used did not enable a conclusion as to whether the intervention was cost effective with regard to cost per quality adjusted life years (QALYs) gained to be drawn, but the non-significant cost difference between the study groups suggests that the intervention may be cost effective.
Evidence Statement e6.1: Cost effectiveness evidence for screening and brief interventions in the Emergency Care setting is scarce. The available evidence does not allow firm conclusions regarding the long-term cost effectiveness of these interventions in a UK setting to be made. However, the evidence does suggest that brief interventions in the Emergency Care setting may be cost effective in the UK. One Study suggests that screening plus brief intervention may produce long term cost savings (Gentilello et al, 2005) (study quality +), but the applicability of this evidence to the UK is uncertain. One UK study suggests that a brief intervention administered by alcohol health workers in a hospital setting will reduce consumption in the short term without significantly increasing costs, but long term evidence is lacking (Barrett, Byford, Crawford et al, 2006) (study quality ++). Gentilello et al. (2005) Study quality + Barrett, Byford, Crawford et al. (2006) Study quality ++ Applicability: 1 US study provides evidence on total costs of a screening plus brief intervention program. However the results are based on limited future resource use data from one US trial. The applicability of this data to the UK is therefore uncertain. 1 UK study provides evidence from a UK setting. However, this evidence is based upon an intervention administered by alcohol health workers within a hospital setting and so may not be generalisable to hospitals who do not employ alcohol health workers.
• Hospital Inpatients Three studies were found which address the cost effectiveness of screening and/or brief interventions for alcohol misuse in the hospital setting. One study estimates the costs and savings associated with screening and brief intervention in a general
Screening and brief interventions: Cost effectiveness review
7
hospital inpatient setting (Ryder 2000). The study is Australia-based and is of low quality due to a lack of clarity regarding costs included in the analysis. The authors conclude that the intervention is likely to generate net cost savings for the health care payer due to reduced future hospital admissions; however this conclusion is highly uncertain due to the extrapolation of key effectiveness data from results that were based on low patient numbers and which were not statistically significant from a separate study. Tolley and Rowland (1991) present a UK economic evaluation of screening alone, undertaken by different occupational groups in a hospital inpatient setting. The study is of moderate quality but is dated and suffers from some methodological flaws. A re-analysis of this data shows that it cannot be concluded whether screening with nurses or doctors is most cost effective because higher costs of screening are associated with increased identification of problem drinking. Whether this is cost effective will depend upon the cost effectiveness of the brief intervention which follows a positive screen. Holder et al (1991) conduct one of the first attempts to estimate the cost effectiveness of screening and brief intervention for alcohol misuse. They cost the intervention as if it were carried out through mental health outpatient appointments, based in a hospital in the United States. The study is of moderate quality but the effectiveness measure does not allow an assessment of the effect size of the intervention and as such the cost effectiveness of the intervention cannot be ascertained.
Evidence Statement e6.2: Cost effectiveness evidence for screening and brief interventions in the hospital setting is scarce. The available evidence does not allow conclusions regarding the cost effectiveness of these interventions in a UK setting to be made. A UK study presents evidence for screening by doctors and nurses in a general hospital setting (Tolley & Rowland 1991) (study quality +), but this does not allow a conclusion to be reached regarding the most cost effective screening method. One Study suggests that screening plus brief intervention may produce long term cost savings (Ryder 2000) (study quality -), but the reliability of this evidence is low due to the uncertainty in resource use estimates. Ryder (2000) Study quality - Tolley and Rowland (1991) Study quality + Applicability: One Australian study provides evidence on total costs of a screening plus brief intervention program. However the results are highly uncertain due to being based on very limited future resource use data from one UK trial. The reliability of results based on this data is therefore low.
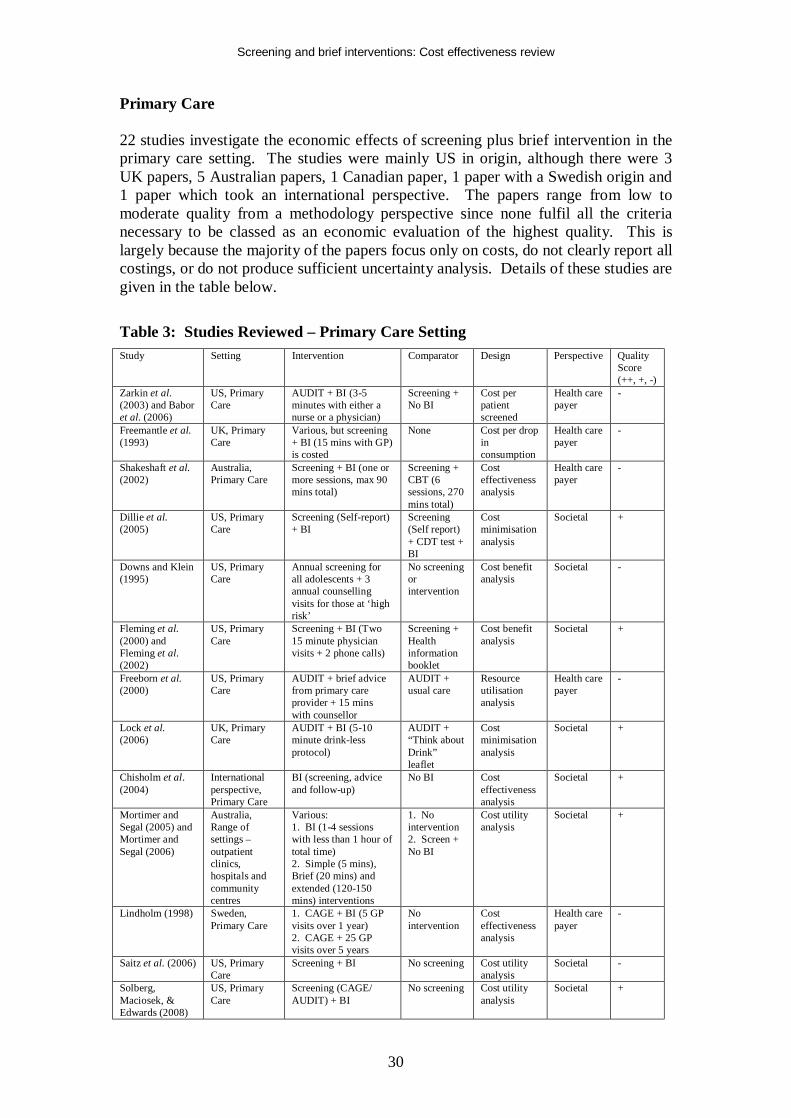
• Primary Care 22 studies investigate the economic effects of screening plus brief intervention in the primary care setting. The studies were mainly US in origin, although there were 3 UK papers, 5 Australian papers, 1 Canadian paper, 1 paper with a Swedish origin and 1 paper which took an international perspective. The papers range from low to moderate quality from a methodology perspective since none fulfil all the criteria necessary to be classed as an economic evaluation of the highest
Screening and brief interventions: Cost effectiveness review
8
quality. This is largely because the majority of the papers focus only on costs, do not clearly report all cost sources, or do not produce sufficient uncertainty analysis. This does not mean that the papers cannot be usefully reviewed, but does mean that the evidence sometimes requires careful interpretation. One key result from the review of the economics literature set in primary care is that one UK paper of moderate quality analyses the cost effectiveness of different screening methods, and clear results in favour of the alcohol use disorders identification test (AUDIT) are produced (Coulton et al. 2006). This study is useful for assessing the screening tools it considers, but it is important to note that it does not include all of the tools assessed in the clinical review of screening. Hence conclusions regarding the relative cost effectiveness of screening tools such as the reduced version of AUDIT, the AUDIT-C, cannot be made based on the existing economics literature.
Evidence Statement e5.1: One study shows that the alcohol use disorders identification test (AUDIT) is a more cost effective screening tool than measures of y-glutamyltransferase, aspartate aminotransferase, per cent carbohydrate deficient transferrin, and ethrocyte mean cell volume (Coulton et al. 2006) because AUDIT is both cheaper and more effective than these other tests (study quality +). The evidence does not allow a ranking of the cost effectiveness of these other screening methods. Coulton et al. (2006) Study quality + Applicability: UK study applicable to primary care.
Regarding the cost effectiveness of screening plus brief intervention, the key issues that arise when an overview of the studies is taken are: - Long-term impact of the intervention It is not clear how long the impact of a brief intervention can be expected to last. Assuming the impact of a brief intervention is maintained in the long term without re-application is likely to result in very different cost effectiveness estimates compared to a scenario whereby it is assumed that the intervention must be re-applied every year to maintain the effect. Of the cost-utility papers reviewed one assumed a relatively short maintenance of effect time period based on early and late follow-up results from clinical trials, but did not state how long this period was or at what rate the effect was assumed to be lost {Mortimer, 2005 971 /id}. One study assumed that the intervention was repeated every year between the ages of 18 and 54, and biennially after the age of 54 to maintain the effect {Solberg, 2008 4049 /id}. Another study assumed that the intervention had to be repeated once every 5 years in order to maintain the effect {Chisholm, 2004 1740 /id}.
- Differentiated Brief Interventions While some studies investigated screening followed by very brief interventions (ie less than 10-15 minutes (Lock et al. 2006; Solberg, Maciosek, & Edwards 2008; Wutzke et al. 2001a)), others investigated more extended interventions (eg 2 GP visits in close succession as well as follow-up phone calls, or more) (Chisholm et al. 2004; Dillie et al. 2005; Fleming et al. 2000; Fleming et al. 2002; Lindholm 1998b).
Screening and brief interventions: Cost effectiveness review
9
It is difficult to assess the relative cost effectiveness of the different brief interventions considered within studies due to varying results: The results from Lock et al (2006) are inconclusive from a cost effectiveness point of view, which could be put down to the very brief nature of the intervention considered. However, Wutzke et al (2001a) also consider a very brief intervention (less than 5 minutes per patient) but present strong results in terms of cost per life years saved. Solberg, Maciosek, & Edwards (2008) also consider a very brief intervention (6 minutes for a true positive patient) and estimate that the intervention is dominant from a societal perspective, and produces QALY savings at very low costs from a health care payer perspective. These papers show that even when considering a very brief BI the cost effectiveness results appear encouraging. As would be expected, the studies which consider more extended BIs generally show bigger consumption and resource use effects. Fleming et al (2000 and 2002) estimate that from both a health care payer and a societal perspective the BI (2 physician visits plus 2 follow-up phone calls) will be cost saving. Dillie et al use data from Project TrEAT and so come to similar conclusions as Fleming et al. However, it is more informative to consider the results of the clinical review when discussing efficacy issues, and with regard to brief intervention intensity the review concludes that even very brief interventions may be effective in reducing alcohol-related negative outcomes, with inconclusive evidence of an additional positive impact resulting from increased dose. In light of this, it is logical that the most brief intervention is likely to be the most cost effective.
- Uncertainty over long term health care resource use, crime and motor vehicle
accident effects Several studies estimate that long term resource use cost savings will be made, particularly with regards to motor vehicle accidents (MVAs) which often drive the results of the studies (Dillie et al. 2005; Downs & Klein 1995; Fleming et al. 2002; Solberg, Maciosek, & Edwards 2008). These costs are uncertain – limited data means that they can only be estimated with wide confidence intervals – and this uncertainty is usually not dealt with rigorously be the authors. One paper finds that the intervention group incurs more MVA costs than the control group (Mundt et al. 2005). Because of the uncertainty around these costs, when it is these that cause an intervention to appear cost saving the results of the study must be treated with some caution. However, it is also important to note that in the two studies where it is possible to split out MVA costs from other costs both studies would present favourable economic results even if MVAs were not included (Solberg, Maciosek, & Edwards 2008; Fleming et al. 2002). This allows a more confident positive conclusion regarding the economic results of these studies. - Uncertainty over HRQL effects of BI Relatively few studies included HRQL effects of BI (Chisholm et al. 2004; Mortimer and Segal 2005; Mortimer and Segal 2006; Saitz et al. 2006; Solberg, Maciosek, & Edwards 2008). Of those that did, Mortimer et al (2005 and 2006) and Chisholm et al both used utility weights taken from the same paper (Stouthard, Essink-Bot, & Bonsel 2000). Neither of these studies included long term resource use costs due to uncertainty surrounding these, and both estimated that additional QALYs could be saved at low cost through screening plus BI.
Screening and brief interventions: Cost effectiveness review
10
Solberg, Maciosek, & Edwards (2008) estimated QALY gains based on reductions in alcohol-attributable diseases and include future health and other costs and conclude that the BI is cost saving from the societal perspective. It is difficult to compare the QALY and DALY estimates reported by these papers, because Chisholm et al (2004) presents an annual average QALY gain per individual population member, Mortimer and Segal (2005) present a lifetime QALY gain per person treated, and Solberg, Maciosek, & Edwards (2008) present a lifetime QALY gain per individual population member. Additionally, the specific intervention considered in these papers differs markedly, particularly with regard to the repetition of the intervention over time.
The primary care studies overall appear to show that screening plus BI result in modest effect sizes. However, the economic analyses suggest that these effect sizes in tandem with resource use and other cost effects are sufficient for the interventions to be classed as cost effective. In considering this though, the above uncertainties and cautions must be taken into account. There is considerable uncertainty as to whether a brief intervention will be cost saving in the long term. In addition, there is some uncertainty regarding the QALY gains associated with brief interventions, because the estimated QALY gains reported in the relevant studies included in this review are not comparable to one another. It was therefore deemed necessary to conduct further analysis into these specific areas in order to ascertain with more confidence whether brief interventions are likely to be cost saving or cost effective in a UK context. Further Analysis of the Literature A more detailed analysis of the papers that assessed the future health and other resource use and costs associated with screening and brief interventions was undertaken (Dillie et al. 2005; Fleming et al. 2000; Fleming et al. 2002; Freeborn et al. 2000; Gentilello et al. 2005; Lock et al. 2006; Mundt et al. 2005; Ryder 2000; Solberg, Maciosek, & Edwards 2008). This overview illustrated the uncertainty surrounding the issue. While a number of papers estimate a net cost saving for the intervention this is frequently based on statistically non-significant data, which is understandable given the low event numbers in some of the expensive cost categories. Additionally some data exists which shows opposite results for certain cost categories – such as MVAs – which places further uncertainty on the conclusions. Few papers deal with the uncertainty surrounding net cost impacts satisfactorily which therefore means that it is not possible to draw strong conclusions on the net cost impact of screening + BI. However, it does appear likely that a brief intervention will not result in significant long-term societal cost increases. Evidence Statement e6.3: Several studies of varying quality provide evidence on the likely future resource impact associated with brief interventions (Dillie et al. 2005; Fleming et al. 2000; Fleming et al. 2002; Freeborn et al. 2000; Gentilello et al. 2005; Lock et al. 2006; Mundt et al. 2005; Ryder 2000; Solberg, Maciosek, & Edwards 2008). These studies do not allow firm conclusions to be made regarding the net cost impact of brief interventions. The evidence is uncertain as to whether screening plus brief intervention for alcohol misuse will result in either net costs or savings. Gentilello et al. (2005) Study quality + Ryder (2000) Study quality –
Screening and brief interventions: Cost effectiveness review
11
Lock et al. (2006) Study quality + Fleming et al. (2000) Study quality + Fleming et al. (2002) Study quality + Dillie et al. (2005) Study quality + Mundt et al. (2005) Study quality + Freeborn et al. (2000) Study quality – Solberg, Maciosek, & Edwards (2008) Study quality + Applicability: The majority (6) of the studies are set in US primary care. One study is set in UK primary care, 1 in an Australian hospital setting, and 1 in US emergency care. Caution should be taken in extrapolating US resource use effect data to the UK, but given the content of this recommendation the applicability of the recommendation to the UK is unaltered. Further analysis was also undertaken on the four fully reported studies which present evidence on the likely QALY gain associated with screening and brief intervention (Chisholm et al. 2004; Mortimer and Segal 2005; Mortimer and Segal 2006; Solberg, Maciosek, & Edwards 2008). This analysis showed that the per individual population member QALY gain is likely to be small but positive. Due to the low costs of the interventions they are likely to be cost effective based on a cost effectiveness threshold of £20,000 per additional QALY. However, because of the synthesised evidence used in the economic evaluations analysed, it was not possible to conduct an accurate incremental cost effectiveness analysis of alternative interventions, or to estimate the relative cost effectiveness of offering screening and brief intervention to different population groups. Based on the conclusion from the clinical review of brief interventions it appears that it is most likely that very brief interventions are likely to be the most cost effective option. Evidence Statement e6.4: Four fully reported studies of moderate quality (study quality +) provide evidence on the likely Quality Adjusted Life Year (QALY) gain associated with screening plus brief intervention for alcohol misuse (Chisholm et al. 2004; Mortimer and Segal 2005; Mortimer and Segal 2006; Solberg, Maciosek, & Edwards 2008). These studies estimate that the lifetime QALY gain per individual population member due to screening plus brief intervention is likely to be in the region of 0.004 – 0.019 compared to no intervention, depending on the exact intervention and if it is repeated over time. Further evidence suggests that this could be higher if within-family external quality of life effects are included in the analysis (Mortimer and Segal 2006) (study quality +). An analysis of the likely costs of screening plus brief intervention in a UK context shows that interventions that bring such gains will be cost effective based on a cost effectiveness threshold of £20,000 per additional QALY. However the economic evidence does not allow a specific brief intervention which delivers these effect sizes to be outlined due to effect size evidence synthesis within economic studies. Based on the clinical review, it is most likely that very brief interventions are likely to be most cost effective, given the inconclusive evidence of increased effect with increased duration and/or intensity of the intervention. The existing economic evidence does not allow conclusions to be made regarding the relative cost effectiveness of offering screening and brief intervention to specific population groups. Chisholm et al. (2004) Study quality +
Screening and brief interventions: Cost effectiveness review
12
Mortimer and Segal (2005) Study quality + Mortimer and Segal (2006) Study quality + Solberg, Maciosek, & Edwards (2008) Study quality + Applicability: The evidence is taken from 1 study applied to Europe Region A with a primary care setting, 1 US primary care study and 2 primary care based Australian studies. It is difficult to apply these results directly to the UK primarily due to costing issues. However additional analysis has allowed more confidence over the application of these results to the UK. Conclusion This review of the economic literature for screening and brief interventions for alcohol misuse is in line with previous reviews in the area (Anderson & Baumberg 2006; Ludbrook et al. 2001; Ludbrook 2004). That is, screening plus brief intervention is cost effective, but there is a desire for more research because considerable uncertainties exist, particularly regarding the cost effectiveness of specific types of brief intervention. Further analysis has allowed a conclusion that screening plus brief intervention is cost effective in the primary care setting, but sufficient evidence does not exist to make the same conclusions for the hospital and emergency care settings, although the evidence is suggestive that this may be the case in an emergency care setting. Additionally the existing economic literature does not allow firm conclusions to be drawn as to the relative cost effectiveness of different types of brief intervention, although on the assumption (based on the clinical review) that increasing the intensity of the intervention does not increase the effectiveness, very brief interventions are likely to be more cost effective than extended brief interventions. The existing economics literature does not allow conclusions to be drawn on the relative cost effectiveness of intervening in different population groups.
Screening and brief interventions: Cost effectiveness review
13
INTRODUCTION Alcohol misuse is associated with significant clinical and social consequences. The National Institute for Health and Clinical Excellence has been asked by the Department of Health to develop public health guidance to promote the prevention and early identification of alcohol-use disorders in adults and adolescents. In order to develop such guidance both clinical and health economic aspects must be taken into account. The aim of this paper is to complete a review of the literature to address the following issues from an economics perspective: 1. The effectiveness and cost-effectiveness of alcohol screening questionnaires, biochemical indicators and clinical indicators of alcohol misuse in identifying adults and young people who currently misuse or are at risk of misusing alcohol 2. The effectiveness and cost-effectiveness of brief interventions in preventing hazardous and harmful drinking among adults and young people To this end, this paper presents a detailed critical appraisal of existing health economic studies which examine screening and/or brief interventions (BI) for the prevention of alcohol misuse. If sufficient data is not contained in the papers reviewed for guidance to be made in a UK context the review will be used to inform a separate economic modelling analysis.

Screening and brief interventions: Cost effectiveness review
14
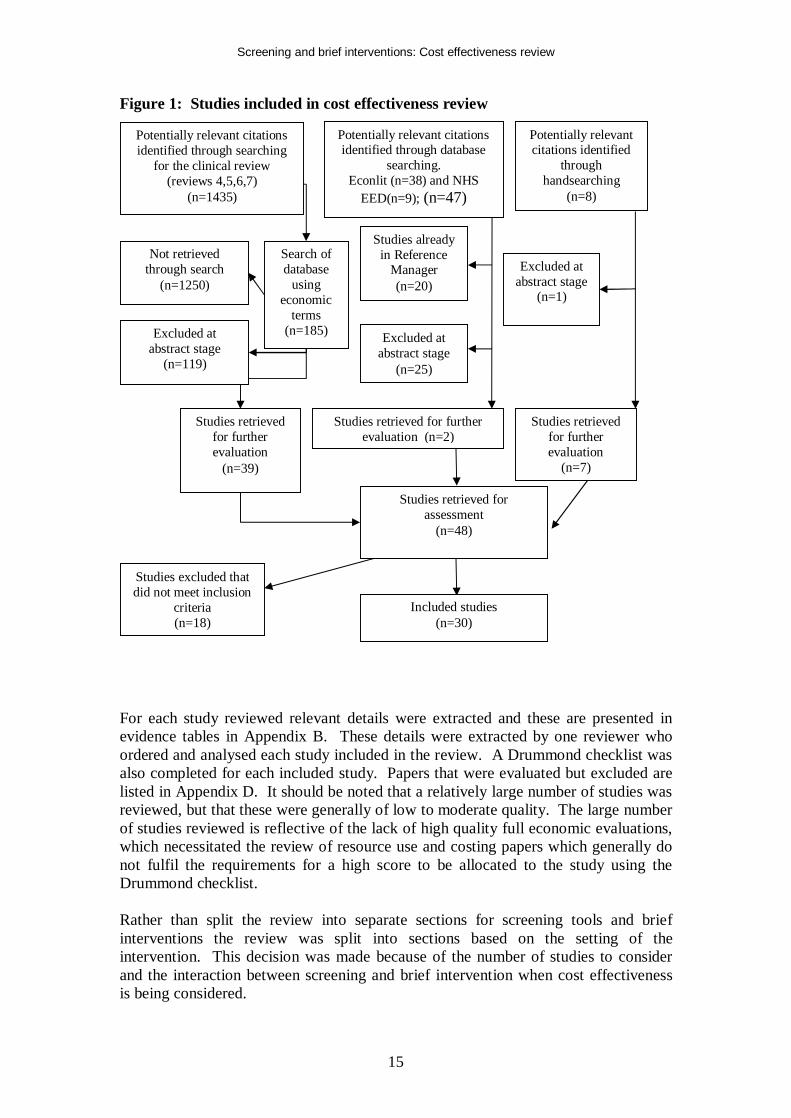
METHODS A detailed literature search was undertaken for both the clinical and economic sections of the review. Full details of the search model are available in the report for the effectiveness review. An outline of the search process is given below, with details of search terms and inclusion and exclusion criteria in Appendix C and Appendix E. For the cost effectiveness reviews, the first search undertaken was to search the Reference Manager database of studies retrieved for the effectiveness reviews of brief interventions (see methods for effectiveness reviews for search terms and databases searched) for studies which related to cost effectiveness or economics (see keywords searched for in Appendix E. Following this, specific searches were undertaken in NHS EED and Econlit. Finally, handsearching and checking reference lists of included papers was undertaken. The number of papers found at each stage of the literature search is outlined below.
Screening and brief interventions: Cost effectiveness review
15
Figure 1: Studies included in cost effectiveness review
For each study reviewed relevant details were extracted and these are presented in evidence tables in Appendix B. These details were extracted by one reviewer who ordered and analysed each study included in the review. A Drummond checklist was also completed for each included study. Papers that were evaluated but excluded are listed in Appendix D. It should be noted that a relatively large number of studies was reviewed, but that these were generally of low to moderate quality. The large number of studies reviewed is reflective of the lack of high quality full economic evaluations, which necessitated the review of resource use and costing papers which generally do not fulfil the requirements for a high score to be allocated to the study using the Drummond checklist. Rather than split the review into separate sections for screening tools and brief interventions the review was split into sections based on the setting of the intervention. This decision was made because of the number of studies to consider and the interaction between screening and brief intervention when cost effectiveness is being considered.
Studies retrieved for further evaluation
(n=39)
Studies retrieved for further evaluation (n=2)
Studies retrieved for further evaluation
(n=7)
Excluded at abstract stage
(n=1)
Studies already in Reference
Manager (n=20)
Search of database
using economic
terms (n=185)
Not retrieved through search
(n=1250)
Excluded at abstract stage
(n=25)
Potentially relevant citations identified through database
searching. Econlit (n=38) and NHS
EED(n=9); (n=47)
Studies retrieved for assessment
(n=48)
Included studies (n=30)
Studies excluded that did not meet inclusion
criteria (n=18)
Potentially relevant citations identified
through handsearching
(n=8)
Potentially relevant citations identified through searching
for the clinical review (reviews 4,5,6,7)
(n=1435)
Excluded at abstract stage
(n=119)
Screening and brief interventions: Cost effectiveness review
16
The number of studies reviewed in both the clinical systematic review and the economics review meant that it was deemed helpful to split the papers by health care setting, particularly because forthcoming guidance is likely to be specific as regards the setting of the intervention. Economics studies were found in the emergency care, hospital inpatient and primary care settings. No economic evidence was found for any other settings, such as the criminal justice setting. Therefore, if any guidance is to be made relating to this or any other setting for which there is no existing economics evidence then additional economic analysis will be required. The cost effectiveness of a screening tool is dependent on the effectiveness of the intervention that follows it. Therefore it was deemed inappropriate to consider screening and brief interventions separately from an economics perspective. This fitted in well with the papers that were subsequently reviewed, since the vast majority considered the costs and effects of a screening tool combined with a brief intervention. The following sections present a critical appraisal of each study reviewed, categorised by health care setting. Following the discussion of each study within a health care setting a summary for the setting is given. For ease of reference brief characteristics, results and limitations of the studies included in the review are given in Appendix A.
Screening and brief interventions: Cost effectiveness review
17
RESULTS
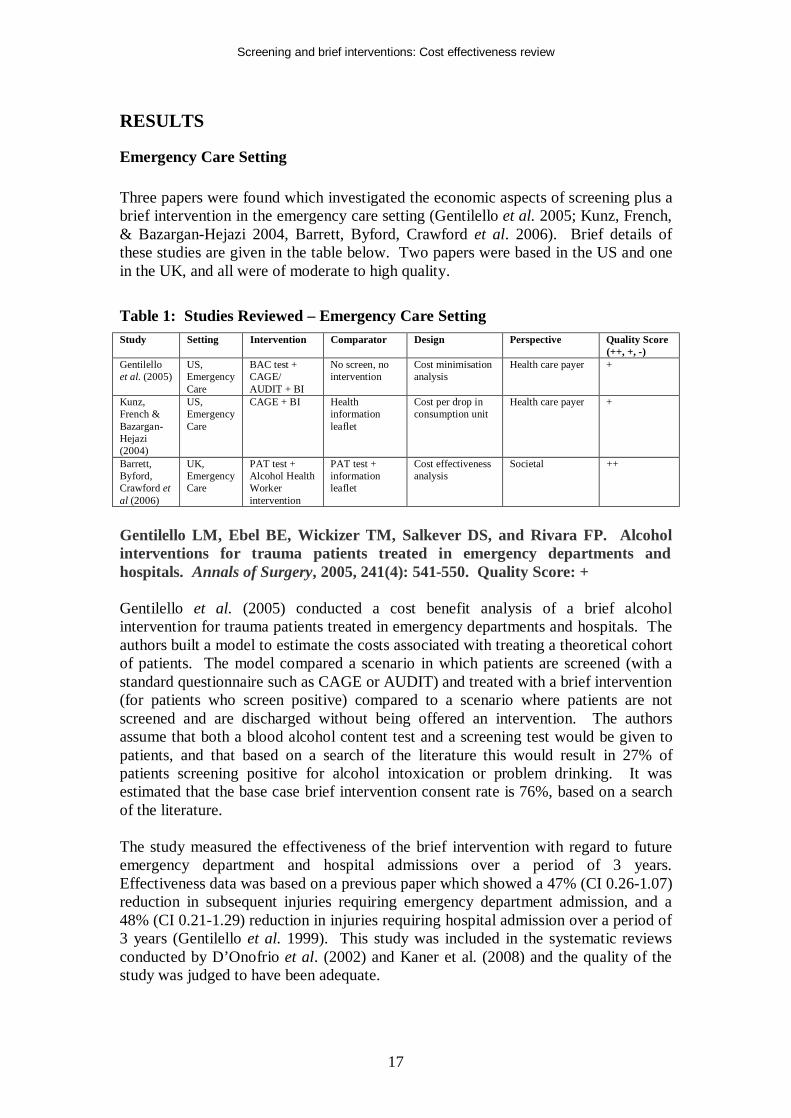
Emergency Care Setting Three papers were found which investigated the economic aspects of screening plus a brief intervention in the emergency care setting (Gentilello et al. 2005; Kunz, French, & Bazargan-Hejazi 2004, Barrett, Byford, Crawford et al. 2006). Brief details of these studies are given in the table below. Two papers were based in the US and one in the UK, and all were of moderate to high quality.
Table 1: Studies Reviewed – Emergency Care Setting Study Setting Intervention Comparator Design Perspective Quality Score
(++, +, -) Gentilello et al. (2005)
US, Emergency Care
BAC test + CAGE/ AUDIT + BI
No screen, no intervention
Cost minimisation analysis
Health care payer +
Kunz, French & Bazargan-Hejazi (2004)
US, Emergency Care
CAGE + BI Health information leaflet
Cost per drop in consumption unit
Health care payer +
Barrett, Byford, Crawford et al (2006)
UK, Emergency Care
PAT test + Alcohol Health Worker intervention
PAT test + information leaflet
Cost effectiveness analysis
Societal ++
Gentilello LM, Ebel BE, Wickizer TM, Salkever DS, and Rivara FP. Alcohol interventions for trauma patients treated in emergency departments and hospitals. Annals of Surgery, 2005, 241(4): 541-550. Quality Score: + Gentilello et al. (2005) conducted a cost benefit analysis of a brief alcohol intervention for trauma patients treated in emergency departments and hospitals. The authors built a model to estimate the costs associated with treating a theoretical cohort of patients. The model compared a scenario in which patients are screened (with a standard questionnaire such as CAGE or AUDIT) and treated with a brief intervention (for patients who screen positive) compared to a scenario where patients are not screened and are discharged without being offered an intervention. The authors assume that both a blood alcohol content test and a screening test would be given to patients, and that based on a search of the literature this would result in 27% of patients screening positive for alcohol intoxication or problem drinking. It was estimated that the base case brief intervention consent rate is 76%, based on a search of the literature. The study measured the effectiveness of the brief intervention with regard to future emergency department and hospital admissions over a period of 3 years. Effectiveness data was based on a previous paper which showed a 47% (CI 0.26-1.07) reduction in subsequent injuries requiring emergency department admission, and a 48% (CI 0.21-1.29) reduction in injuries requiring hospital admission over a period of 3 years (Gentilello et al. 1999). This study was included in the systematic reviews conducted by D’Onofrio et al. (2002) and Kaner et al. (2008) and the quality of the study was judged to have been adequate.
Screening and brief interventions: Cost effectiveness review
18
Screening costs (Blood Alcohol Content (BAC) test ($15) and a questionnaire ($1 for paper costs)), intervention costs (professional expenses) including a base case of 1.4 hours of psychologist time per intervention (initial intervention, follow-up and documentation - $38), cost per emergency department visit and cost of hospitalisations were included. Sensitivity analysis tested different salary ranges – for social workers to physicians. The results of the paper showed that for every patient screened $89 was saved (US $, 2000). This was driven by future health care cost savings outweighing the cost of the intervention and screening. A Monte Carlo analysis, allowing all parameters to vary within their confidence intervals, estimated that in 91% of simulations the screening plus BI was cost saving. The results were not sensitive to factors which influenced the cost of the intervention as these costs were small in comparison to subsequent health care costs. Thus, assumptions regarding emergency department and hospital readmittance rates were of most importance. If the intervention was not successful in reducing these rates it would not be cost saving. Kunz FM, French MT and Bazargan-Hejazi S. Cost-effectiveness analysis of a brief intervention delivered to problem drinkers presenting at an inner-city hospital emergency department. Journal of Studies on Alcohol 2004, 65 (3): 363-370. Quality Score: + Kunz, French and Bazargan-Hejazi (2004) conducted a cost effectiveness analysis of screening (the CAGE questionnaire was used) plus a brief intervention (discussion with a ‘Health Promotion Advocate’ resulting in development of an action plan and a follow-up session, as well as collection of more data such as the AUDIT questionnaire score) in a similar emergency department setting (Kunz, French, & Bazargan-Hejazi 2004). This study differs from that conducted by Gentilello et al (2005) in a number of important ways:
• Effectiveness is derived from an accompanying RCT rather than a literature review. The quality of this RCT was assessed as ‘unclear’ by Kaner et al. (2008) due to the unclear nature of the randomisation and intention to treat analysis present in the study.
• Effectiveness is measured in terms of unit reductions in AUDIT questionnaire scores, a one drink drop in average number of drinks consumed per week, and a 1% drop in the probability of engaging in heavy episodic drinking. The effect on future health care resource use is not included
• The population studied is a low-income, poorly educated, African-American and Hispanic population suffering from high levels of poverty and unemployment
Because this study does not account for any health care cost savings in the future, it results in a positive incremental cost for screening plus BI compared to no screening or BI. This cost is estimated to be $631.89 per patient who receives the BI, $496.54 of which is due to screening. The cost year is not stated in the paper, but these intervention costs appear much higher per patient than estimated by Gentilello et al (2005). Kunz, French and Bazargan-Hejazi (2004) report that they include a wider range of costs than is reported in Gentilello et al. Also, the way that Kunz, French
Screening and brief interventions: Cost effectiveness review
19
and Bazargan-Hejazi (2004) report their costs (screening cost per patient who receives the BI) may be misleading. This does not make it clear whether the costs for the entire population who were screened were included (1,036 patients) and divided by the number who went on to receive the BI, or whether only the screening costs for those who received the BI were included (151 patients), which has a substantial impact on the interpretation of the cost estimates. It seems likely that the costs for all patients screened would have been included, and as such it can be calculated that the average cost per screen was approximately $72. Compared to the $16 per screen stated by Gentilello et al (2005) this may be reasonable considering the population being studied and the fact that much more baseline data was collected as part of the screening process by Kunz, French and Bazargan-Hejazi (2004) – thus taking up more health professional time. Additionally a $10 monetary inducement was offered to patients completing the baseline survey by Kunz, French and Bazargan-Hejazi (2004), and in the Gentilello et al (2005) study patients were assumed to complete the screening questionnaire themselves (costing only $1 in printing costs). The BI cost per patient is also higher in the study by Kunz, French and Bazargan-Hejazi (2004) compared to Gentilello et al (2005) (approximately $135.35 vs $38). However this may be explained by staff grades, the study population, and because Gentilello et al (2005) included only staff costs whereas Kunz, French and Bazargan-Hejazi (2004) report that staff costs make up only 60% of their estimated costs. Additionally further monetary inducements ($20) were offered to patients who completed follow-up surveys. Kunz, French and Bazargan-Hejazi (2004) note that use of ‘Health Promotion Advocates’ (HPAs) rather than doctors or nurses reduces costs, but that patients may not pay as much attention to HPAs. Additional concerns reflect the patient population being studied – the authors note that the results are not generalisable to the rest of the US population. Additionally patients were not blinded to the intervention which may have caused bias in the results if patients were influenced by the desire to report results that they felt were expected. When correcting for baseline differences between patients in the intervention and control groups Kunz, French and Bazargan-Hejazi (2004) find that the intervention reduces AUDIT scores by a mean of 1.77, equivalent to a cost of $357 per one-point drop in AUDIT score. Average weekly number of drinks is reduced by 0.42, at a cost of $1,505 per one drink reduction. The probability of engaging in heavy episodic drinking is reduced by 8.35%, equivalent to a cost of $75.70 per percentage-point drop in the probability. Barrett, B, Byford S, Crawford MJ, Patton R, Drummond C, Henry JA and Touquet R. Cost-effectiveness of screening and referral to an alcohol health worker in alcohol misusing patients attending an accident and emergency department: A decision-making approach. Drug and Alcohol Dependence 2006; 81; 1: 47-54. Quality Score: ++ This paper analyses the cost effectiveness of a brief intervention administered by specifically employed alcohol health workers (AHWs) in a hospital in London, UK {Barrett, 2006 1231 /id}. Ordinarily the specialist nature of the AHW staff who administered the intervention would mean that this study would be excluded from the
Screening and brief interventions: Cost effectiveness review
20
review presented in this document, since this review primarily examines interventions administered by generalist staff. However, given the scarcity of studies in this setting, particularly set in the UK, the decision has been made to include this study. The study is a well conducted economic evaluation. The study involved patients aged over 18 who attended the accident and emergency department of a London hospital between March 2001 and April 2002. Patients were selectively screened for alcohol misuse and those who screened positive were told that they were drinking alcohol at a level which might be detrimental to their health and were asked if they were willing to receive a brief intervention. Patients who accepted were randomised into two groups: the control group received the “Think about drink” information leaflet; the intervention group received the same leaflet and also an appointment card asking the patient to re-attend for an appointment with an AHW. Such appointments are typically 30-50 minutes in duration. The authors collected cost data from a societal perspective, and also alcohol units consumed per week at 6 months and 12 months after randomisation. AHW costs, other hospital costs, primary care costs, and social services, voluntary services, fire services, criminal justice and productivity costs were included. Full 12-month service use data was available for 290 of the participants, 48% of the total, and the data for these participants is reported. Because of this relatively low follow-up, in sensitivity analysis data for participants for whom 6-month data were available was analysed, and no significant differences in results were found. The AHW costs were very low in comparison to total costs, at a mean of just £6 per patient in the intervention arm (2001/02 prices) because only 31% of intervention group patients attended their AHW appointment. The only other significant cost difference between the intervention and control groups after 12 months were voluntary services costs, which were £106 per patient in the intervention group and £54 per patient in the control group. Overall, primary care costs, social services costs, voluntary services costs, fire services costs, criminal justice costs and productivity losses were marginally higher in the intervention group than in the control group. ‘Other hospital costs’ were slightly higher in the control group (£2,567 vs £2385, p=0.81) but total costs in the intervention group were higher (£5,454 vs £5,207, p=0.85). This suggests that there was very little difference in costs incurred by patients in the intervention group and the control group. It should be noted that the cost of screening, which was incurred by both intervention group and control group patients, is not included in the paper. After 6 months the difference in the mean number of alcohol units consumed per week was statistically significantly lower in the intervention group (59.7 vs 83.1, p=0.02). At 12 months this difference was no longer significant (56.2 vs 67.2, p=0.09). Data on units consumed at baseline are not given. The 12 month data is associated with an incremental cost effectiveness ratio of £22 per unit reduction in alcohol consumed per week, reflecting the slightly higher cost of the intervention group, and the lower unit consumption. A cost effectiveness acceptability curve (CEAC) is presented, but the willingness to pay figures are difficult to interpret because it is not clear what quality of life impact a unit reduction in alcohol consumption is associated with. Hence based on this study alone it is not possible to determine whether the intervention corresponds to good value for money. However, the paper suggests that the intervention does not have a significant cost impact and if in fact the intervention proved to be cost neutral it would be very likely to be cost
Screening and brief interventions: Cost effectiveness review
21
effective due to the reduced consumption it results in. In addition, the CEAC presented suggests that even at a willingness to pay of £0 for a unit reduction in alcohol consumption there is a 65% probability that the intervention will be cost effective. If correct this would suggest that there is a significant skew in the cost data, because this is despite the fact that on average the total costs in the intervention group are higher than in the control group. Without further explanation it is therefore difficult to interpret this result. On average (at the mean) the intervention is cost additive, and so on average it is not possible to conclude whether or not the intervention is cost effective. A weakness of the study is that AHWs may not be employed in other hospitals in the UK, and so their employment would result in additional set-up costs not included in this analysis. Also, the 12 month timescale of the study means that it does not incorporate long term resource use impacts.
Emergency Care Setting Summary The results reported in the two US papers above differ markedly. Kunz, French and Bazargan-Hejazi (2004) estimate much higher intervention costs which may be due to the population being screened, the costs included, or a combination of both of these factors. Additionally the interventions studied were conducted in different ways. Kunz, French and Bazargan-Hejazi (2004) offered monetary inducements to people who completed initial and follow-up surveys, and also staff time was taken up by the completion of these surveys. In contrast to this Gentilello et al (2005) assumed that participants completed questionnaires themselves and so a very small cost was associated with this. Also, whereas Gentilello et al (2005) only included staff costs in their calculations, Kunz, French and Bazargan-Hejazi (2004) included staff and other costs, such that staff costs only made up 60% of total intervention costs. The results reported by Kunz, French and Bazargan-Hejazi (2004) are of limited use in a decision making context because the effectiveness measures used do not allow cost effectiveness comparisons to be drawn across disease areas. Therefore for this study to aid UK decision making at the minimum the impact of the intervention on consumption would need to be converted into an impact on resource use so that the net cost impact can be calculated. This link is made in Gentilello et al (2005), which makes this paper of more use in a decision-making context. Gentilello et al (2005) estimate that screening plus BI is likely to be cost saving, but this is dependent on uncertain assumptions regarding emergency department use and hospital readmission. The study reported by Barrett, Byford, Crawford et al (2006) is useful because it is a well conducted study set in the UK. However it is limited because it focuses on an intervention supplied by specialist alcohol health workers who may not be available in many hospitals, and has a relatively short 12 month timeframe. The authors find that the cost of the intervention itself is very low, largely because only a minority of the intervention group actually received the intervention. However, in any case the intervention costs would have been much smaller than the sum of other health care costs and other societal costs. On average these costs are higher in the intervention arm of the trial, but this is not statistically significant. The paper shows that the BI
Screening and brief interventions: Cost effectiveness review
22
has a significant short-term consumption effect associated with a short-term non-significant increase in societal costs. None of the studies reviewed include a link between consumption and utility scores that would allow a quality of life impact to be estimated. Gentilello et al. (2005) report the impact of the BI on resource utilisation, but do not report the impact on alcohol consumption, whereas Kunz, French and Bazargan-Hejazi (2004) report alcohol consumption effects but not resource implications. Barrett, Byford, Crawford et al (2006) present 12-month consumption and societal cost impacts, but the consumption effect is not transformed into a quality of life effect. Therefore none of the studies allow a cost per Quality Adjusted Life Year (QALY) estimate to be made, which is key for recommendations on cost effectiveness in the UK. In conclusion, the evidence for the cost effectiveness of screening and brief interventions in the emergency care setting is sparse, but suggestive that these interventions may be cost effective in the UK. Evidence Statement e6.1: Cost effectiveness evidence for screening and brief interventions in the Emergency Care setting is scarce. The available evidence does not allow firm conclusions regarding the long-term cost effectiveness of these interventions in a UK setting to be made. However, the evidence does suggest that brief interventions in the Emergency Care setting may be cost effective in the UK. One Study suggests that screening plus brief intervention may produce long term cost savings (Gentilello et al, 2005) (study quality +), but the applicability of this evidence to the UK is uncertain. One UK study suggests that a brief intervention administered by alcohol health workers in a hospital setting will reduce consumption in the short term without significantly increasing costs, but long term evidence is lacking (Barrett, Byford, Crawford et al, 2006) (study quality ++). Gentilello et al. (2005) Study quality + Barrett, Byford, Crawford et al. (2006) Study quality ++ Applicability: 1 US study provides evidence on total costs of a screening plus brief intervention program. However the results are based on limited future resource use data from one US trial. The applicability of this data to the UK is therefore uncertain. 1 UK study provides evidence from a UK setting. However, this evidence is based upon an intervention administered by alcohol health workers within a hospital setting and so may not be generalisable to hospitals who do not employ alcohol health workers.
Screening and brief interventions: Cost effectiveness review
23
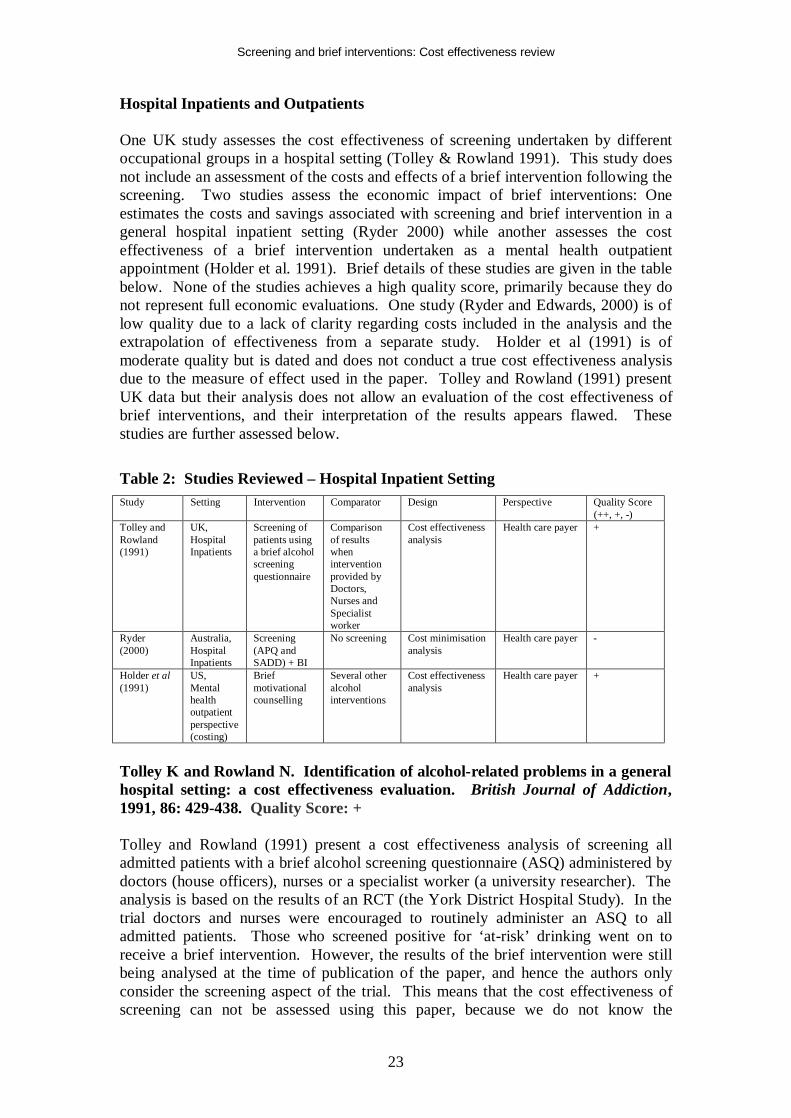
Hospital Inpatients and Outpatients One UK study assesses the cost effectiveness of screening undertaken by different occupational groups in a hospital setting (Tolley & Rowland 1991). This study does not include an assessment of the costs and effects of a brief intervention following the screening. Two studies assess the economic impact of brief interventions: One estimates the costs and savings associated with screening and brief intervention in a general hospital inpatient setting (Ryder 2000) while another assesses the cost effectiveness of a brief intervention undertaken as a mental health outpatient appointment (Holder et al. 1991). Brief details of these studies are given in the table below. None of the studies achieves a high quality score, primarily because they do not represent full economic evaluations. One study (Ryder and Edwards, 2000) is of low quality due to a lack of clarity regarding costs included in the analysis and the extrapolation of effectiveness from a separate study. Holder et al (1991) is of moderate quality but is dated and does not conduct a true cost effectiveness analysis due to the measure of effect used in the paper. Tolley and Rowland (1991) present UK data but their analysis does not allow an evaluation of the cost effectiveness of brief interventions, and their interpretation of the results appears flawed. These studies are further assessed below. Table 2: Studies Reviewed – Hospital Inpatient Setting Study Setting Intervention Comparator Design Perspective Quality Score
(++, +, -) Tolley and Rowland (1991)
UK, Hospital Inpatients
Screening of patients using a brief alcohol screening questionnaire
Comparison of results when intervention provided by Doctors, Nurses and Specialist worker
Cost effectiveness analysis
Health care payer +
Ryder (2000)
Australia, Hospital Inpatients
Screening (APQ and SADD) + BI
No screening Cost minimisation analysis
Health care payer -
Holder et al (1991)
US, Mental health outpatient perspective (costing)
Brief motivational counselling
Several other alcohol interventions
Cost effectiveness analysis
Health care payer +
Tolley K and Rowland N. Identification of alcohol-related problems in a general hospital setting: a cost effectiveness evaluation. British Journal of Addiction, 1991, 86: 429-438. Quality Score: + Tolley and Rowland (1991) present a cost effectiveness analysis of screening all admitted patients with a brief alcohol screening questionnaire (ASQ) administered by doctors (house officers), nurses or a specialist worker (a university researcher). The analysis is based on the results of an RCT (the York District Hospital Study). In the trial doctors and nurses were encouraged to routinely administer an ASQ to all admitted patients. Those who screened positive for ‘at-risk’ drinking went on to receive a brief intervention. However, the results of the brief intervention were still being analysed at the time of publication of the paper, and hence the authors only consider the screening aspect of the trial. This means that the cost effectiveness of screening can not be assessed using this paper, because we do not know the
Screening and brief interventions: Cost effectiveness review
24
effectiveness of the following intervention with regard to a final outcome measure (such as quality of life). However the paper does provide evidence on the relative cost effectiveness of screening administered by different occupational groups. Hence this paper can help decipher who should undertake screening, if screening itself is classed as cost effective. The authors assess the proportion of patients seen by each occupational group who are screened. The results showed that doctors only screened a small proportion of patients (27%) compared to nurses (48%). Of those screened, doctors classed 9.8% of patients as ‘at-risk’ drinkers, compared to 7.8% of those screened by nurses. As a relative comparator, a specialist worker screened a random sample of patients and classed 12.5% as ‘at-risk’ drinkers. The cost of each staff group was based on salaries. It was estimated that the screen took 1.5 minutes to administer, and the authors estimated that based on the trial results the average cost per positive screen was £1.29 for nurses, £1.17 for doctors, and £1.20 for the specialist worker. Using this data the authors estimate that if doctors and nurses both screened 1000 patients the doctors would identify 20 additional at-risk drinkers at a cost of £0.65 per additional positive identification. However, the authors’ state that this analysis does not take into account that doctors have a lower screening rate of admitted patients (27% vs 48%). When this is taken into account the authors estimate that doctors will identify fewer patients as ‘at-risk’ compared to nurses, at higher cost. Therefore the authors state that it is not cost effective to screen patients using doctors rather than nurses. The authors conclude that screening by a specialist worker is the most effective option, but also the most costly with a cost of £0.56 per additional positive identified compared to screening with nurses. However, the methodology used to generate these estimates may be regarded as flawed. Although the authors take into account the effect that a lower screening rate has on the number of at-risk drinkers positively identified, they do not consider that a lower screening rate will also reduce screening costs. Taking into account the lower screening rate associated with doctors actually means that screening with doctors will cost less than screening with nurses. This would mean that doctors are possibly cost effective compared to nurses because although they will positively identify fewer at-risk drinkers, they will do so at lower cost. A reanalysis of the data incorporating screening rates into the cost as well as the effect calculation alters the authors’ results. In this case doctors represent the lowest cost but least effective screening option. The marginal cost of identifying one additional at-risk drinker is £1.61 when screening is undertaken by nurses rather than doctors. The marginal cost of identifying one additional at-risk drinker is £1.15 when screening is undertaken by a specialist rather than nurses. Under standard economic decision rules this means that screening by nurses is extendedly dominated and as such the relevant comparison for an indication of the most cost effective occupation type to undertake the screening is doctors compared to a specialist worker. The data in the study mean that the marginal cost of identifying one additional at-risk drinker is £1.20 when screening is undertaken by a specialist worker rather than a doctor. It is also important to consider that the costings used by the authors are now very dated. Hence it is useful to re-calculate the results of the paper using current unit
Screening and brief interventions: Cost effectiveness review
25
costs for doctors and nurses (Curtis 2007). Using hourly cost data for foundation house officers and day ward nurses the cost of a 1.5 minute screen is £0.55 for a nurse and £0.80 for a doctor. This equates to an average cost per positive screen of £7.05 for nurses, and £8.16 for doctors, using screening data from the paper. When screening rates from the study are taken into account the average cost of a policy of screening 1000 admitted patients is £264.00 for nurses, and £216.00 for doctors. Nurses will positively identify 37.44 at-risk drinkers, and doctors will positively identify 26.46 at-risk drinkers. This equates to an additional cost of £4.37 per additional positively identified at-risk drinker when screening is by nurses rather than doctors. If it were assumed that whether screening was undertaken by nurses or doctors 100% of patients would be screened, doctors would identify 20 more at-risk drinkers in every 1000 people screened, at a cost of £12.50 per additional positively identified at-risk drinker. In this analysis we have not considered screening being undertaken by a specialist worker since this is not within our definition of a brief intervention as we assume the intervention must be carried out by a generalist. The results of this paper and the re-analysis based on current costs and including the effect of screening rates are difficult to interpret. The re-calculated results show that any conclusions regarding cost effectiveness are very dependent on screening rates. Counter-intuitively screening by doctors may actually be less costly than screening with nurses because of lower screening rates. Also possibly counter-intuitively, screening with nurses may be more effective than screening with doctors because of the higher screening rate associated with nurses. Hence screening by doctors rather than nurses is likely to be less expensive but not as effective, and so could be cost effective. It is not possible to conclude which is likely to be the most cost effective option without knowing the effectiveness and cost effectiveness of the brief intervention which follows for patients who screen positive. If the intervention is very cost effective it is likely that identifying additional patients is important and so the screening option which identifies most patients will be the most cost effective even if it is relatively high cost. However if the cost effectiveness of the brief intervention is more borderline the most effective, most expensive screening option may not be the most cost effective strategy. It is important to note that this does not match the conclusion of the authors of this paper, because although screening rates were taken into account with regard to the effectiveness of screening, it was not taken into account in the costings. This led the authors to conclude that screening by doctors was more expensive and less effective than screening by nurses, precluding screening by doctors from being deemed cost effective. An additional important limitation of this paper (which is noted by the authors) is that no allowance for false positives or negatives is made, and no allowance for any differences in the characteristics of patients screened is made. It is assumed that a higher positive screening rate is equal to a more effective screen. However this may reflect incorrectly identified patients, or incorrectly unidentified patients, or simple differences in the patient populations screened by each staff group. This is of particular importance because the authors note that the populations screened by each occupational group did differ – suggesting that any difference in positive screening rates might be legitimate.
Screening and brief interventions: Cost effectiveness review
26
Ryder D and Edwards T. Screening for alcohol related problems in general hospitals: the costs and savings of brief intervention. Journal of Substance Use. 2000, 4: 211-215. Quality Score: - This study estimates the costs and savings associated with BI in a general hospital setting (Ryder 2000). The study involved administering the Alcohol Problems Questionnaire (APQ) and the Severity of Alcohol Dependence Data (SADD) questionnaire to all patients aged between 18 and 65 who were admitted to two hospital wards in an 84-bed Western Australian hospital. Those who scored above the cut-offs in the APQ were given a BI session and self-help materials by a specifically trained nurse prior to their discharge. The study did not involve following up these patients in order to ascertain the effectiveness of the intervention. Instead it is assumed that the effectiveness of a previous study (Chick, Lloyd & Crombie 1985) which used similar (but not identical) screening techniques followed by a BI could be applied to the patient numbers in the Western Australian hospital in order to estimate cost savings for the hospital. Chick, Lloyd & Crombie (1985) was included in the systematic review undertaken by Bien et al. (1993) and received a quality score of 12/17, losing marks due to sub-optimal randomisation, quality control of treatments delivered, non-inclusion of collateral verification interviews, and no multi-site replication. The authors use their screening results to inform them on the expected proportion of patients being admitted to the two wards in one year who would be eligible for a BI. They assess the cost of providing this BI by estimating the number of patients who would require the BI and the amount of time required by a staff member to be spent on providing the BI. The authors estimated that 212 patients would require the BI and that this would require 0.2 FTE of a clinical nurse level 2 (assuming 3 hours per patient, including the BI and administration), which based on salary and on-costs equated to Aus$7,885.47 per annum in 1994, which equates to $37.20 per patient. The authors estimate that based on Chick, Lloyd & Crombie (1985) the BI will reduce hospital readmission rates by 4%, from 19% to 15%, and that the average cost per readmission is Aus$1,807.71 based on Australian data. The authors report total costs and savings for the patient numbers expected in the two hospital wards being investigated. They calculate that the BI will prevent 8 readmissions at a total saving of Aus$14,461.68, resulting in total savings of Aus$6,576.21 if all low dependence problem drinkers receive a BI. If all problem drinkers (high and low dependence) receive the BI, and assuming that this does not further influence readmission rates, the savings are reduced to Aus$4,642.04. These results are not useful in their current state, since they are based on specific patient numbers. However, a simple calculation shows that for every Aus$ spent on a BI for low dependence problem drinkers, Aus$1.83 are estimated to be saved through reduced hospital readmissions. However this is dependent on the cost of the staff member delivering the BI, and the cost of the hospital admission avoided. From a UK perspective, an analysis of reference cost data shows that the average cost of an inpatient (elective or non-elective) FCE was £1,575 in 2006/7 (Department of Health 2008). Assuming a 4% saving (as Chick, Lloyd & Crombie (1985), a UK study, found that hospital readmissions fell by 4% following BI) based on this cost equates to £63. Assuming, similarly to Ryder (2000) that 3 hours of nurse time is required per
Screening and brief interventions: Cost effectiveness review
27
intervention, and estimating that half of that time will be spent with the patient, and half on administrative tasks, the cost per intervention is £93 based on PSSRU 2007 national unit costs (Curtis 2008). Hence in this UK context a saving would not be made through the introduction of BI in a hospital setting, if the only output considered is repeat hospital admissions (£93 - £63 = £30 net cost). For a full analysis, though, account would need to be taken of any effects of the BI on Accident & Emergency visits and primary care costs from a health care payer perspective. From a societal perspective other costs which should be considered include crime, motor vehicle accidents (MVAs) and productivity. Ideally the effect on quality of life should also be considered. Holder H, Longabaugh R, Miller WR and Rubonis AV. The Cost Effectiveness of Treatment for Alcoholism: A First Approximation. Journal of Studies on Alcohol, 1991; 52; 6: 517-540. Quality Score: + Holder et al (1991) conducted what the authors’ classed as a ‘first approximation’ cost effectiveness analysis of a range of interventions for the treatment of alcoholism. The authors state that their results are not definitive and that they expect their results to be updated in the future. The authors conduct a review of randomised controlled trials (RCTs) and assess the results of each trial with regards to the direction of the effect of the study intervention. They come up with a weighted evidence index (WEI) for a number of interventions based on the direction of the effect for each intervention according to each RCT examined. One of the interventions assessed relates to brief motivational advice, for which 9 RCTs were found. Eight of these found a positive effect for the intervention, while one found a negative effect. Based on this the intervention was awarded a WEI score of +13 by the authors. A score of +1 was allocated for the first two positive trials for any intervention, and any additional positive trials resulted in two points per trial. The authors used this technique because they felt positive results were less likely than negative results and a clear pattern of results over a number of trials should result in additional points. In essence this places greater weighting on positive trials than on negative trials. Considering the 8 vs 1 result found for brief motivational interventions this is unimportant as the conclusion of the authors that there is good evidence for a positive effect associated with the intervention is reasonable. To estimate the cost of the interventions under consideration the authors surveyed a number of clinical experts to assess the minimum resource use that would be required for each intervention. For brief motivational interventions it was estimated that the total time spent with a medical professional would be approximately 67 minutes spread over 1-2 sessions. The authors costed this time based on the least cost medical practitioner who – in the opinion of the surveyed experts – could conduct this intervention. The authors therefore applied a cost of $41 per hour (resulting in a cost per intervention of $46) based on a mental health outpatient appointment (1987 US$), which was slightly lower cost than the estimated cost to consult a general practitioner. It is for this costing reason that this paper is regarded as dealing with hospital outpatient appointment brief interventions, even though it is likely that the majority of effectiveness studies included in the paper were primary care based.
Screening and brief interventions: Cost effectiveness review
28
Based on these results the authors found that brief motivational interventions for alcoholism were amongst the cheapest of all alcohol interventions, and also had one of the highest evidence levels of positive effect. Hence it would appear that brief motivational interventions are cost effective compared to other alcohol interventions. However, importantly the effect measurement used in this paper was related to the direction of the effect of the intervention in each RCT found. It was not related to effect size. Therefore this analysis does not allow the relative cost effectiveness of effective interventions to be assessed – ie there may be many papers showing a positive effect for brief interventions, but this does not mean that the effect size is bigger than an intervention that has fewer RCTs showing its effectiveness. Additionally the analysis does not consider the cost effectiveness of the interventions compared to no treatment. The paper is informative and undoubtedly important in bringing cost effectiveness issues to the fore in the alcoholism disease area, but its analysis does not allow an evaluation of the cost effectiveness of brief interventions.
Hospital Inpatients Setting Summary The economic evidence for screening plus BI in the hospital setting is inconclusive. Tolley and Rowland (1991) present a useful UK evaluation of screening with different occupational groups, but a re-analysis of their data leads to the conclusion that screening by nurses or doctors may be cost effective – neither can be ruled out in comparison to each other. Which is the most cost effective depends on the cost effectiveness of the following brief intervention for positively identified patients. It is not clear whether the paper by Ryder (2000) includes costs of screening in the analysis, and the costs that are included may not be reflective of equivalent costs in the UK. More information regarding the amount and type of health care and other resource use avoided due to the administration of screening and BI are required in order to establish the cost effectiveness of the intervention. Holder et al (1991) conduct an important analysis as their paper represents one of the first attempts to consider cost effectiveness in the alcoholism disease area. However the paper is dated, and the way effectiveness is measured in particular means that the analysis does not assess the true cost effectiveness of interventions according to effect size. In sum, there is not enough published evidence of the cost effectiveness of screening and BI in the hospital setting to conclude whether or not the intervention is cost effective. Evidence Statement e6.2: Cost effectiveness evidence for screening and brief interventions in the hospital setting is scarce. The available evidence does not allow conclusions regarding the cost effectiveness of these interventions in a UK setting to be made. A UK study presents evidence for screening by doctors and nurses in a general hospital setting (Tolley & Rowland 1991) (study quality +), but this does not allow a conclusion to be reached regarding the most cost effective screening method. One Study suggests that screening plus brief intervention may produce long term cost savings (Ryder 2000) (study quality -), but the reliability of this evidence is low due to the uncertainty in resource use estimates. Ryder (2000) Study quality - Tolley and Rowland (1991) Study quality +

Screening and brief interventions: Cost effectiveness review
29
Applicability: One Australian study provides evidence on total costs of a screening plus brief intervention program. However the results are highly uncertain due to being based on very limited future resource use data from one UK trial. The reliability of results based on this data is therefore low.
Screening and brief interventions: Cost effectiveness review
30
Primary Care 22 studies investigate the economic effects of screening plus brief intervention in the primary care setting. The studies were mainly US in origin, although there were 3 UK papers, 5 Australian papers, 1 Canadian paper, 1 paper with a Swedish origin and 1 paper which took an international perspective. The papers range from low to moderate quality from a methodology perspective since none fulfil all the criteria necessary to be classed as an economic evaluation of the highest quality. This is largely because the majority of the papers focus only on costs, do not clearly report all costings, or do not produce sufficient uncertainty analysis. Details of these studies are given in the table below.
Table 3: Studies Reviewed – Primary Care Setting Study Setting Intervention Comparator Design Perspective Quality
Score (++, +, -)
Zarkin et al. (2003) and Babor et al. (2006)
US, Primary Care
AUDIT + BI (3-5 minutes with either a nurse or a physician)
Screening + No BI
Cost per patient screened
Health care payer
-
Freemantle et al. (1993)
UK, Primary Care
Various, but screening + BI (15 mins with GP) is costed
None Cost per drop in consumption
Health care payer
-
Shakeshaft et al. (2002)
Australia, Primary Care
Screening + BI (one or more sessions, max 90 mins total)
Screening + CBT (6 sessions, 270 mins total)
Cost effectiveness analysis
Health care payer
-
Dillie et al. (2005)
US, Primary Care
Screening (Self-report) + BI
Screening (Self report) + CDT test + BI
Cost minimisation analysis
Societal +
Downs and Klein (1995)
US, Primary Care
Annual screening for all adolescents + 3 annual counselling visits for those at ‘high risk’
No screening or intervention
Cost benefit analysis
Societal -
Fleming et al. (2000) and Fleming et al. (2002)
US, Primary Care
Screening + BI (Two 15 minute physician visits + 2 phone calls)
Screening + Health information booklet
Cost benefit analysis
Societal +
Freeborn et al. (2000)
US, Primary Care
AUDIT + brief advice from primary care provider + 15 mins with counsellor
AUDIT + usual care
Resource utilisation analysis
Health care payer
-
Lock et al. (2006)
UK, Primary Care
AUDIT + BI (5-10 minute drink-less protocol)
AUDIT + “Think about Drink” leaflet
Cost minimisation analysis
Societal +
Chisholm et al. (2004)
International perspective, Primary Care
BI (screening, advice and follow-up)
No BI Cost effectiveness analysis
Societal +
Mortimer and Segal (2005) and Mortimer and Segal (2006)
Australia, Range of settings – outpatient clinics, hospitals and community centres
Various: 1. BI (1-4 sessions with less than 1 hour of total time) 2. Simple (5 mins), Brief (20 mins) and extended (120-150 mins) interventions
1. No intervention 2. Screen + No BI
Cost utility analysis
Societal +
Lindholm (1998) Sweden, Primary Care
1. CAGE + BI (5 GP visits over 1 year) 2. CAGE + 25 GP visits over 5 years
No intervention
Cost effectiveness analysis
Health care payer
-
Saitz et al. (2006) US, Primary Care
Screening + BI No screening Cost utility analysis
Societal -
Solberg, Maciosek, & Edwards (2008)
US, Primary Care
Screening (CAGE/ AUDIT) + BI
No screening Cost utility analysis
Societal +
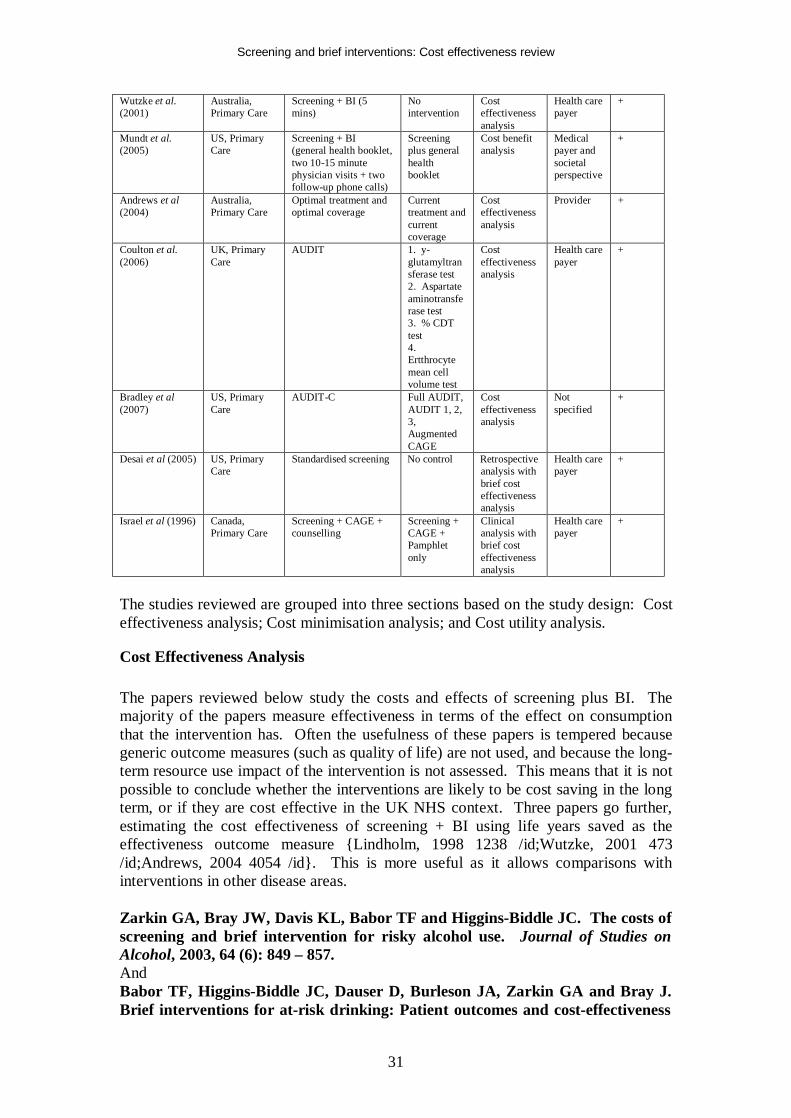
Screening and brief interventions: Cost effectiveness review
31
Wutzke et al. (2001)
Australia, Primary Care
Screening + BI (5 mins)
No intervention
Cost effectiveness analysis
Health care payer
+
Mundt et al. (2005)
US, Primary Care
Screening + BI (general health booklet, two 10-15 minute physician visits + two follow-up phone calls)
Screening plus general health booklet
Cost benefit analysis
Medical payer and societal perspective
+
Andrews et al (2004)
Australia, Primary Care
Optimal treatment and optimal coverage
Current treatment and current coverage
Cost effectiveness analysis
Provider +
Coulton et al. (2006)
UK, Primary Care
AUDIT 1. y-glutamyltransferase test 2. Aspartate aminotransferase test 3. % CDT test 4. Ertthrocyte mean cell volume test
Cost effectiveness analysis
Health care payer
+
Bradley et al (2007)
US, Primary Care
AUDIT-C Full AUDIT, AUDIT 1, 2, 3, Augmented CAGE
Cost effectiveness analysis
Not specified
+
Desai et al (2005) US, Primary Care
Standardised screening No control Retrospective analysis with brief cost effectiveness analysis
Health care payer
+
Israel et al (1996) Canada, Primary Care
Screening + CAGE + counselling
Screening + CAGE + Pamphlet only
Clinical analysis with brief cost effectiveness analysis
Health care payer
+
The studies reviewed are grouped into three sections based on the study design: Cost effectiveness analysis; Cost minimisation analysis; and Cost utility analysis.
Cost Effectiveness Analysis The papers reviewed below study the costs and effects of screening plus BI. The majority of the papers measure effectiveness in terms of the effect on consumption that the intervention has. Often the usefulness of these papers is tempered because generic outcome measures (such as quality of life) are not used, and because the long-term resource use impact of the intervention is not assessed. This means that it is not possible to conclude whether the interventions are likely to be cost saving in the long term, or if they are cost effective in the UK NHS context. Three papers go further, estimating the cost effectiveness of screening + BI using life years saved as the effectiveness outcome measure {Lindholm, 1998 1238 /id;Wutzke, 2001 473 /id;Andrews, 2004 4054 /id}. This is more useful as it allows comparisons with interventions in other disease areas. Zarkin GA, Bray JW, Davis KL, Babor TF and Higgins-Biddle JC. The costs of screening and brief intervention for risky alcohol use. Journal of Studies on Alcohol, 2003, 64 (6): 849 – 857. And Babor TF, Higgins-Biddle JC, Dauser D, Burleson JA, Zarkin GA and Bray J. Brief interventions for at-risk drinking: Patient outcomes and cost-effectiveness
Screening and brief interventions: Cost effectiveness review
32
in managed care organizations. Alcohol and Alcoholism, 2006, Vol. 41, No. 6, pp.624-631. Quality Score: - The papers by Zarkin et al (2003) and Babor et al (2006) have been grouped together here because both report results from the same study. The study assesses the costs and effects of screening (using the AUDIT questionnaire) plus BI in 15 family or internal medicine clinics within 5 Managed Care Organisations (MCOs) in the US. All patients aged over 18 were offered participation in the study. 50,411 eligible patients agreed to take part and were screened. These patients were cluster randomised by clinic to three groups: The ‘S’ group involved mid-level professionals (usually nurses) administering the intervention; The ‘P’ group involved licensed physicians, physician assistants or nurse practitioners administering the intervention; and the ‘C’ group represented a control group to whom no intervention was administered (but an initial screening was administered). The intervention involved advice (3-5 minutes) and information brochures. 1,124 screened positive in the S group and received the intervention, compared to 1,151 in the P group and 1,955 in the C group (who did not receive an intervention). 216 of sampled patients completed 12 months follow-up in the S group, 222 in the P group and 299 in the C group. These papers are not reviewed in any of the clinical systematic reviews. Staff and capital costs were included for screening and the BI. The total screening cost was $0.71 per patient screened (US$, 2001) and the intervention cost was $2.82 per patient for the ‘S’ group and $4.16 per patient for the ‘P’ group. After 12 months patients in all groups had reduced their alcohol consumption and although there was a statistically significant difference between the ‘C’ group and the ‘S’ and ‘P’ groups combined, people in the ‘S’ and ‘P’ groups only drank on average 1 drink less per week than those in the ‘C’ group. No difference was noted between the ‘S’ and ‘P’ groups, leading to the conclusion that the ‘S’ strategy is more cost effective as it is cheaper. The study collected SF-12 quality of life data but no difference between the groups were captured. Both the effect size and the cost of this intervention are small, reflecting the very brief nature of the advice administered. No attempt was made to present the cost effectiveness of the intervention using a cost per effect ratio, instead costs and effects are reported separately. In any case a cost per consumption decrease measure could not be easily interpreted as a definitive cost effectiveness measure. Freemantle N, Gill P, Godfrey C, Long A, Richards C, Sheldon TA, Song F, and Webb J. Brief interventions and alcohol use. Quality in Health Care 1993, 2(4): 267-273. Quality Score: - Freemantle et al (1993) conduct a systematic review to assess the effects of BIs in the primary care setting on alcohol consumption. The authors assume that screening takes 2 minutes to administer and an intervention takes 15 minutes, and if the intervention is administered by a GP this results in a cost per patient of between £6.80 and £20.40, depending on if overheads are included (1993 costs). Freemantle et al add on £2 per patient for the cost of booklets or educational leaflets, resulting in a total estimated cost of between £8.80 and £22.40. Using a sensitivity and specificity of AUDIT of 92% and 94% respectively, and assuming that 28% of men and 11% of women drink heavily and would warrant the BI based on a search of the literature, Freemantle et al estimate a cost of £15 - £40 for each person with raised consumption
Screening and brief interventions: Cost effectiveness review
33
that is treated. On average it is estimated that these patients may reduce their consumption by 24%. Without any other data as to the quality of life effects or the future resource use impact of the BI, the Freemantle et al paper is not useful for decision making. According to 2006/7 national unit costs the cost of 17 minutes of GP time is between £37.40 and £49.30 and so it could be estimated that in the present day the cost per person with raised consumption who is treated may be approximately double that estimated by Freemantle et al in 1993 (Curtis 2007). However without further information these findings can not be interpreted usefully. Shakeshaft AP, Bowman JA, Burrows S, Doran CM and Sanson-Fisher RW. Community-based alcohol counselling: a randomized clinical trial. Addiction, 2002, 87, 1449-1463. Quality Score: - Shakeshaft et al (2002) compare a brief intervention to cognitive behavioural therapy (CBT) in a community-based drug and alcohol counselling service in the US. All patients received personalised feedback based on their computer assessment screen (which included the AUDIT questionnaire). 147 patients were randomised to the BI and received a self-help guide as well as one or more sessions which could not exceed 90 minutes in length in total. 148 patients were randomised to CBT and received a workbook manual as well as 6 consecutive weekly face-to-face counselling sessions, totalling 270 minutes of face-to-face contact. Costs included in the analysis included the direct costs associated with providing the intervention and it was estimated that the BI was less than half the cost of CBT. The effectiveness of the interventions was assessed based on a range of consumption-based measures. The authors’ paper has been included in a published systematic review of BIs and received a methodological quality score of 10/17 (Vasilaki et al. 2006). The results showed that there was no statistically significant difference in the results and therefore BI appears more cost effective than CBT. However, without a control arm in the trial the cost effectiveness of the two interventions cannot be assessed compared to no treatment. Lindholm L. Alcohol advice in primary health care – is it a wise use of resources? Health Policy, 1998, 45: 47-56. Quality Score: - Lindholm (1998c) conducts a cost effectiveness analysis of two different hypothetical intervention programmes based in primary care, which aim to reduce the intake of alcohol from a ‘high’ to a ‘moderate’ level. The analysis takes into account the costs and the outcomes of the interventions, as well as the long term differences in morbidity, mortality and health care costs between ‘heavy’ and ‘moderate’ drinkers. The results are presented in terms of cost per life years gained. The population considered is a cohort of 1,000 Swedish men aged 40 and costs are presented in 1997 ECUs and are calculated over the expected lifetime of the cohort. Costs and life years are discounted at a rate of 5%. The interventions considered are based on the BI found in Wallace et al (1988). One intervention involves 5 GP visits during 1 year, (similar to the group that showed the largest effect in the Wallace et al study), while the other intervention involves 25 GP visits over 5 years. Both the interventions are evaluated twice, once assuming a GP
Screening and brief interventions: Cost effectiveness review
34
contact and once assuming a nurse contact. Both interventions include screening through a questionnaire such as CAGE being distributed at the health care centre. The author estimates life years saved by assuming that moderate drinkers have the same age-specific mortality risk as the general Swedish population, and that heavy drinkers have double that age-specific mortality risk between the ages of 40 and 70. This is based on estimates in the literature which the author states range between 1.5 and 3.0. After the age of 70 the two cohorts are assumed to have the same mortality rates as it is known that heavy drinkers reduce their consumption as they get older. The effect of the intervention is analysed by considering the results of the economic model for different effect sizes of the intervention in terms of the % that change from ‘heavy’ to ‘moderate’ drinkers. The cost of a CAGE questionnaire screen is included (120 European Currency Unit (ECU) per person) but the source of this cost is not stated. Local costs were used for GP and nurse visits. The author assumes that moderate drinkers have the same average health care costs as the average for the Swedish population. It is assumed that the health care costs for heavy drinkers are twice as high, though little evidence is provided to support this. The author states, however, that this may be conservative as a study based on the Swedish register of twins shows a 3-fold difference (Andreasson 1995). The results of the paper show that for the 5-visit intervention the intervention will have a cost per life year saved of less than zero (ie it is cost saving) if 10%-20% of patients change from being ‘heavy’ to ‘moderate’ drinkers. This is true whether the intervention is undertaken by a nurse or a doctor, and for a range of relative risks for mortality between 1.25 and 2.0. If 2% of patients change their behaviour the cost per life year saved is ECU 10,000 with a 2.0 relative risk, and ECU 40,000 with a 1.25 relative risk if the intervention is administered by doctors. These ratios fall to ECU 5,000 – ECU 20,000 if the intervention is administered by nurses. For the 25 visit intervention the cost per life years saved are substantially higher, but this is to be expected when it is being assumed that the interventions have the same effectiveness. Hence a key question that is not answered is whether reapplication of the intervention is required to maintain its effect over time. The costs included in the paper are of concern due to the limited data presented to support the estimates – particularly with respect to health care resource costs for moderate and heavy drinkers. However, papers such as Fleming et al (2000) suggest that health care resource use costs may be double in the control group as compared to the intervention group. Considering not all of the patients included in the Fleming et al (2000) intervention group will have altered their behaviour, this suggests that an assumption of medical resource use being twice as high for heavy drinkers compared to moderate drinkers may indeed be a conservative estimate – as suggested by the author. It is not clear whether the costs of screening have been applied to all patients or only the patients who received the intervention (which would not be realistic). However, given the other costs of medical resource use this is unlikely to have a very high impact on the results. The results of this study are only of use if the percentage of patients who are likely to alter their behaviour from being a heavy drinker to a
Screening and brief interventions: Cost effectiveness review
35
moderate drinker due to a BI is known. Without this, the results of the paper are speculative. Wutzke SE, Shiell A, Gomel MK and Conigrave KM. Cost effectiveness of brief interventions for reducing alcohol consumption. Social Science and Medicine 52 (2001) 863-870. Quality Score: + Wutzke et al (2001c) estimate the cost effectiveness of the Drink-less intervention for reducing alcohol consumption by estimating the costs and life years saved associated with the intervention. The intervention included screening and then counselling for each ‘at risk’ drinker. The intervention was designed not to take more than 5 minutes of the GPs time on average per patient. The setting for the study was Australia. Costs are presented in 1996 Australian $. Life years saved were discounted at a rate of 3%. Estimates of post-intervention consumption were taken from Saunders et al 1991 which represented the Australian arm of the WHO collaboration. The study found that alcohol consumption fell by 28% on average in hazardous and harmful drinkers. The duration for which this reduction in consumption was applied is not stated. Results from the trial were used to estimate the number of people who would be screened, the % of those who would be ‘at risk’ drinkers, and the % of ‘at risk’ drinkers who would subsequently be counselled. Estimates of the number of potential life years saved by the intervention were calculated using estimates of the impact of the programme along with evidence on the health effects of excess alcohol consumption. Pre- and post-intervention aetiological (attributable) fractions of potential alcohol-caused mortality were applied to the counselled population. The number of lives saved was translated into a number of life years saved using evidence from the Australian literature (English et al 1995). According to this an average of 17 life years were saved for every man and 11 life years for each woman whose death from alcohol-related causes could be prevented. All costs associated with the intervention were included. This included costs associated with tele-marketing the package to physicians ($5.35 per successful GP participant); costs associated with training and support (scenarios included very low levels of support to regular and extensive support); screening and counselling. Physicians could claim a level C consultation (lasting 20 minutes) for the intervention rather than the usual lower level B consultation. This placed a fee of Aus$17 on the intervention as this is the difference in the costs between the two types of consultation, but it is unclear if this is a fair reflection of the actual cost of the intervention. It would seem more appropriate to include the full cost of the consultation rather than the incremental cost compared to a usual consultation, unless the benefits of the usual consultation were also being included, which they were not. The analysis showed that at baseline 17% of men and 15% of women were drinking at unsafe levels. After intervention this fell to 6% and 5%, and the authors estimated that this would reduce the proportion of deaths due to unsafe drinking from 0.005 for men and 0.004 for women, to 0.002 and 0.0, based on the aetiological fractions of potential alcohol-caused mortality. This seems a large drop in alcohol-caused mortality (rates are more than halved). Further analysis of these figures is not possible using the data provided in the paper.
Screening and brief interventions: Cost effectiveness review
36
Scenarios where more support was given to the GPs were estimated to lead to greater screening rates, and as such where more support was offered more lives were estimated to be saved. Compared to no intervention, a scenario in which the screening plus BI was administered with no training or support was estimated to save one life year for an incremental cost of Aus$645. A scenario where training but no support was given to GPs led to a marginal cost per life year saved of Aus$1,223 compared to the no training, no support scenario. A scenario where training and support was given to GPs had a marginal cost per life year saved of Aus$1,873 compared to the training but no support scenario. Hence it was estimated that life years could be saved at relatively low cost using the Drink-less intervention, and that the more intensive support scenarios resulted in estimates of more lives saved at relatively low incremental costs. The authors conducted one-way sensitivity analysis and found their results to be robust. They state that even in a worst case scenario where the effectiveness of the intervention is reduced by 50% the average cost per life year saved remains below Aus$1,500. This study is specific to Australia, but the authors state that the cost per life year saved estimates are so low that unit cost differences in other countries are unlikely to make any significant differences to the results. However, the effect of the intervention modelled by the authors seems less convincing. The authors estimate that in the most intensively supported intervention scenario approximately 65% of at risk patients are counselled. According to the results presented in the paper, the number of deaths attributable to alcohol in the counselled population falls by approximately 72%. Given that the effectiveness of the intervention was assumed to be an average reduction in alcohol consumption of 28% (for an unspecified period) in hazardous and harmful drinkers, this fall in alcohol-attributable deaths seems particularly high. Assuming that this is correct, the paper presents strong results in favour of screening plus BI, especially when it is considered that long term medical and other costs, and individual and family quality of life were not incorporated in the analysis. Andrews G, Issakidis C, Sanderson K, Corry J and Lapsley H. Utilising survey data to inform public policy: comparison of the cost effectiveness of treatment of ten mental disorders. British Journal of Psychiatry (2004), 184, 526-533. Quality Score: + This paper presents a cost effectiveness analysis of a number of different interventions for a number of mental disorders (Andrews et al. 2004). Two of these relate to alcohol use: harmful use of alcohol; and alcohol dependence. The paper estimated the efficiency of current treatment patterns in Australia compared to estimated efficiency of optimal treatment. The exact interventions analysed in the paper were not stated, but it was stated that optimal treatment could include cognitive behavioural therapy, counselling or medication and two or more visits with a clinician. Optimal treatment was assumed based on the literature, and the discussion in the paper suggests that for harmful alcohol use this was based on BI in a primary care setting. The paper estimated efficiency based on the cost of the interventions and the number of years lived with disability (YLDs) averted under current and optimal treatment regimes. The paper is based around the assessment of treatments for mental disorders and as
Screening and brief interventions: Cost effectiveness review
37
such the YLDs averted did not include mortality, but instead used a disability weighting on a 0-1 scale applied to each mental disorder considered. Costs included in the study were the direct health care costs of the intervention. Hence the perspective of the study was the health care payer, and indirect resource use impacts were not included in the study. The authors estimated costs and YLDs averted based on current Australian coverage for harmful alcohol use (estimated at 8.1%) compared to optimal treatments at a coverage of 70%. The authors estimated that compared to current coverage in Australia the cost per patient covered could fall drastically – from $449 per case to $83 per case (1997 Aus$). This is due to the inefficient interventions currently used in Australia. Increasing coverage from 8.1% to 70% is estimated to increase total intervention costs from $9.2 million to $14.6 million. Whereas the current provision of services is estimated to result in costs of $96,813 per YLD averted, the optimal provision is estimated to result in costs of $13,775 per YLD averted. Hence, it is estimated that increasing the coverage of interventions for the harmful use of alcohol, and using optimal rather than sub-optimal interventions, will result in greater efficiency in the Australian health care system. However this will also result in higher costs. This paper is highly Australia-specific due to its policy-orientated nature. It is therefore difficult to assess its use in a UK context, particularly as the focus is both on effectiveness of interventions (optimal intervention use rather than sub-optimal intervention use) and coverage levels. It is difficult to separate the cost effectiveness results that are associated with a switch in interventions, and that are associated with increased coverage. Also the control interventions are not described, making it difficult to assess the cost effectiveness of the ‘optimal’ treatment compared to the control, and indeed the assumed optimal treatments are not well defined. This is due to the nature of the paper which is Australian policy-orientated and which focuses on a number of mental disorder areas without going into detail on any. This does not necessarily reflect a weakness of the paper, as the paper is not set out as a detailed economic evaluation. However, this does make the results of the paper difficult to interpret in a UK context. Coulton S, Drummond C, James D, Godfrey C, Bland M, Parrott S, Peters T. Opportunistic screening for alcohol use disorders in primary care: comparative study, British Medical Journal, 2006, 332; 511-517. Quality Score: + One study considers the cost effectiveness of screening strategies in a primary care setting, without considering any further intervention (Coulton et al. 2006). The authors undertake a clinical study of the sensitivity, specificity and positive predictive value of the AUDIT questionnaire, y-glutamyltransferase, aspartate aminotransferase, % carbohydrate deficient transferrin, and erythrocyte mean cell volume tests. The study included a costing element in order to determine the cost per true positive for each screening method. 192 male primary care attendees aged 18 or over were included in the analysis, which was set in 6 general practices in South Wales. All patients completed AUDIT and then undertook a blood test so that the other screening tests could be conducted. This selection bias in the trial was minimised. To establish whether a patient was engaging in hazardous consumption of alcohol a detailed interview obtained information on the number of weeks in the previous 180 days that
Screening and brief interventions: Cost effectiveness review
38
the patient had exceeded the ‘safe’ level of consumption (greater than 21 units in one week), and the frequency with which the patient engaged in binge alcohol consumption (greater than 8 units of alcohol in one day). Alcohol dependence was established using the Diagnostic and Statistical Manual of Mental Disorders. Costs included in the study were printing costs, venepuncture costs, salary costs, analysis and interpretation costs and the costs of premises. National unit costs (2000-1 UK £) were used where possible. AUDIT was assumed to take 5 minutes of practice nurse time (£1.10) and was the cheapest screen with a total cost per test of £1.70. The cost per test of a y-glutamyltransferase test was estimated at £5.25, aspartate aminotransferase: £5.25, % carbohydrate deficient transferring: £27.25, and erythrocyte mean cell volume test: £8.25. In total 50 patients fulfilled the criteria for alcohol dependence, and 121 fulfilled the criteria for hazardous alcohol consumption. The AUDIT test had the highest sensitivity, specificity, and positive predictive value of all the tests for all alcohol outcomes. As such the cost per true positive test result for hazardous alcohol consumption was approximately 5 times less than the next most cost effective test (y- glutamyltransferase - £7.19-£9.35 vs £35.13-£48.89). For alcohol dependence the cost per true positive was £16.49 for AUDIT compared to £135.79 for y- glutamyltransferase which was the next most cost effective test. After AUDIT, %CDT was the next most effective test with regards to true positive, but its high cost meant that the cost per true positive was lower for y- glutamyltransferase. These results are conclusive as to which test is the most cost effective for screening for alcohol misuse. The AUDIT test is both the cheapest to administer and the most effective. It is more difficult to interpret the results usefully for the other tests because, for example, the additional cost per true positive for %CDT compared to y- glutamyltransferase may be worthwhile if the following intervention is effective and because %CDT picks up more true positives than y- glutamyltransferase. However this is not an issue when interpreting the AUDIT results because AUDIT was found to identify the most true positives. However, some caution with these results should be taken because the study was only in men, and the sample size was small, meaning that many of the confidence intervals for the different screens overlapped. Bradley KA, DeBenedetti AF, Volk RJ, Williams EC, Frank D and Kivlahan DR. AUDIT-C as a brief screen for alcohol misuse in primary care. Alcoholism: Clinical and Experimental Research, 2007; 31; 7: 1208-1217. Quality Score: + In this paper the authors conduct a study in 1,319 people aged over 18 visiting a family practice clinic in the US to compare five screening methods used to identify alcohol misuse {Bradley, 2007 1966 /id}. A reduced version of the AUDIT questionnaire, the AUDIT-Consumption (AUDIT-C), which includes the first 3 questions of the standard AUDIT questionnaire, was compared against the full AUDIT, AUDIT question number 3 only, the CAGE questionnaire augmented with AUDIT C, and self-reported risky drinking based on answers to individual questions 1, 2 and 3 from AUDIT. The primary reference standard used in the study to assess the sensitivity and specificity of the different screening methods was alcohol misuse in the past year, defined as either meeting diagnostic criteria for a past-year alcohol use disorder based on the Diagnostic and Statistical Manual 4th edition, or drinking
Screening and brief interventions: Cost effectiveness review
39
above recommended limits based on National Institute on Alcohol Abuse and Alcoholism criteria. The authors found that the AUDIT-C performed as well as the full AUDIT and significantly better than the augmented CAGE, AUDIT question 3 and the self-reported risky drinking measure. The optimal screening threshold was defined as the threshold at which sensitivity and specificity were maximised, and for men this was shown to be at a screening threshold of ≥4 points on the AUDIT-C. For women the authors stated that the optimal screening threshold was either ≥2 points or ≥3 points. However the authors went on to note that optimal screening thresholds will not always only be a function of sensitivity and specificity: costs and prevalence of alcohol misuse will also need to be considered. With regard to costs, the ratio between the value of a true positive and the cost of a false positive (the cost-benefit ratio) is important – where there is a higher cost to a false positive compared to the benefit of a true positive a higher screening threshold might be preferable. This may be the case where true positives are not followed up, or where false positives receive extensive care. Similarly in areas where there is a low prevalence of alcohol misuse a higher threshold might be preferable. The authors then estimated the optimal screening threshold for the AUDIT-C for different alcohol misuse prevalence levels and cost-benefit ratios. They find that for a cost-benefit ratio of 1.0 the optimal screening threshold for men is ≥5 for an alcohol misuse prevalence of 10%-25%. For women the optimal threshold is ≥5 at an alcohol misuse prevalence of 10%, ≥4 for 15%-20%, and ≥3 for 25%. For a cost-benefit ratio of 0.5 the optimal screening threshold for men is ≥5 for an alcohol misuse prevalence of 10%-15% and ≥4 for 20%-25%. For women the optimal threshold is ≥4 for an alcohol prevalence of 10% and ≥3 for a prevalence of 15%-25%. The paper therefore does not provide a cost effectiveness analysis of different screening methods, rather it shows that they optimal use of a screening method will depend upon the alcohol misuse prevalence in specific areas, and the benefit-cost ratio between false positives and true positives. Therefore, this paper does not enable us to determine which type of screening is the most cost-effective. The AUDIT-C appears to be the most effective, but without cost data for the different methods (and data on the effectiveness of resulting interventions) included, it is not possible to conclude which screen is the most cost effective. Desai MM, Rosenheck RA and Craig TJ. Screening for alcohol use disorders among medical outpatients: The influence of individual and facility characteristics. American Journal of Psychiatry, 2005; 162: 1521-1526. Quality Score: + In this paper a sample of 15,580 Department of Veterans Affairs primary care patients in the US was used to assess the effectiveness of screening for alcohol use disorders {Desai, 2005 5004 /id}. The study population was relatively elderly, with a mean age of 61.3, which may have an impact upon alcohol misuse levels. Any people with a known substance use disorder were excluded from the study. The study was retrospective and examined medical records to determine whether patients had been screened with a standardised instrument in the past year, and if so whether they had screened positive and whether they had received a follow-up evaluation and a clinical diagnosis. The authors found that 74.2% of patients had had documented screening in
Screening and brief interventions: Cost effectiveness review
40
the past year. 4.2% of these screened positive, 76.4% of whom received either primary care or specialty mental health care follow-up. 53.5% (198) of these patients were subsequently diagnosed with an alcohol use disorder, which is equivalent to 1.7% of the original screened sample. The authors go on to estimate the cost of screening as $4.88 (year 2000) per patient based on a depression in primary care screening study, and the cost of an intervention based on the 2000 Medicare Physician Schedule ($33.68 for a primary care intervention, and $138.77 for a mental health clinic intervention). Using these costs they estimate that the cost of identifying each case of an alcohol use disorder is $428. The authors do not take this any further with regard to establishing whether this is a cost effective use of resources, stating that detailed treatment and outcome data were not available to allow this. The authors conclude that the cost of identifying cases of alcohol use disorders may be justified based on the health, social and economic burdens of alcohol misuse. Israel Y, Hollander O, Sanchez-Craig M, Booker S, Miller V, Gingrich R and Rankin J. Screening for problem drinking and counselling by the primary care physician-nurse team. Alcoholism: Clinical and Experimental Research, 1996; 20: 8: 1443-1450. Quality Score: + This Canadian study analyses the use of the CAGE screening questionnaire in a sample of 15,686 patients who attended the practices of 42 primary care physicians in Ontario. The paper is primarily clinical, but includes a short section which estimates the overall cost impact of the intervention. The screening section of the study involves a number of stages. First, all willing patients were asked 4 alcohol-neutral trauma questions in the reception area, prior to meeting the doctor. If they answered “yes” to any one of these questions a further alcohol-related trauma question was asked by the doctor when the patient’s consultation began. If the patient answered “yes” to any 2 of the trauma questions the doctor would ask the patient about their alcohol consumption and if the patient consumed 56 or more drinks in 4 weeks, or consumed 5 or more drinks per day four or more times in 4 weeks, they were administered the CAGE questionnaire. Following this, if a patient drank more than 3 drinks per day on average; drank 5 or more drinks per day 8 times or more in the previous 4 weeks; or answered positively to 2 or more of the CAGE questions, they were referred on to lifestyle counselling by a nurse. Those eligible for lifestyle counselling were then randomised into two groups. One group received only a pamphlet with guidelines for acceptable drinking. The other group received the same pamphlet as well as an initial 30 minute discussion using cognitive behavioural techniques, and further 20 minute consultations every 2 months for the following year. 15,686 patients answered the initial trauma questionnaire, and 15.19% of these went on to also answer the physician questionnaire. 3.49% (548) of the original sample were identified as problem drinkers and those who had not “just quit drinking” were referred for further care. 231 patients accepted referral, and 105 were entered into the intervention part of the study (66 did not complete the assessment, 48 were excluded due to criteria regarding alcohol dependence, and 12 did not give consent). In these patients the patients who only received the pamphlet
Screening and brief interventions: Cost effectiveness review
41
reduced their alcohol consumption from a mean of 138.6 drinks per 4 weeks at baseline to 74.9 after 1 year (a 46% reduction). The group who received further counselling reduced their consumption from a mean of 152.3 drinks per 4 weeks at baseline to 46.0 after 1 year (a 70% reduction). Thus consumption in both groups reduced significantly at 1 year after the intervention, and this was more pronounced in the group where counselling was given. The authors base their cost analysis on estimating the cost of the screening, the cost of the brief intervention, and the cost offsets related to hospitalisations and physician visits. In estimating the cost of screening the authors estimate that it took 2 minutes for doctors to determine an absence of an alcohol problem in the group of patients who had answered “yes” to 1 initial trauma question. They estimate that it took a further 10 minutes to assess and refer (if necessary) the patients consuming alcohol at higher levels, and thus it took a total of approximately 9,500 physician minutes to identify the 548 patients with alcohol-related problems. This is equivalent to 0.6 minutes per patient screened by the doctor, which the authors value as less than $1 (currency year not stated) per patient screened. The authors do not note that this implies that there is no cost to the 4 screening questions asked to the 13,304 patients in the reception area who did not answer “yes” to any of the initial trauma questions and who were therefore not asked any further questions by the physician. This is unlikely to be true. Although the cost associated with asking these questions may be low on a per person basis, they may still be important considering that none of these patients went on to benefit from the screen in any way. The authors do not explicitly cost the intervention received by the counselling group patients. It is reported that these patients spent 3 hours each with the nurse over the course of the 12 month intervention period. The rationale for the authors not costing this is that an analysis of a small sub-sample (n=29) of the intervention patients showed that over a 2-year period the number of primary care physician visits in the counselling group reduced by 3-5 consultations compared to the 2 years prior to the intervention. Thus, the authors estimate that the intervention is likely to be cost neutral. Great caution should be taken with this conclusion for a number of reasons. Firstly, the costs of the intervention and the offset consultations have not been calculated in order to see if they cancel each other out. Secondly, the subset of patients for whom a consultation analysis was undertaken was very small and therefore is highly uncertain. Third, the consultation analysis showed that the mean number of consultations in the subset that were analysed was actually decreasing at a similar rate in the 2 years prior to the intervention to that after the intervention. Fourth, the cost of screening has not been estimated adequately (including the initial screen). Therefore, the conclusion of cost neutrality made by the authors is difficult to support based on the analysis shown.
Cost Minimisation Analysis The following papers studied the costs and effectiveness of screening and BI in a primary care setting, primarily through estimating future resource costs for people who consumed alcohol hazardously who have and have not received BI.
Screening and brief interventions: Cost effectiveness review
42
Dillie KS, Mundt M, French MT and Fleming MF. Cost-Benefit Analysis of a New Alcohol Biomarker, Carbohydrate Deficient Transferrin, in a Chronic Illness Primary Care Sample, Alcoholism: Clinical & Experimental Research 2005, 29(11): 2008-2014. Quality Score: + Dillie et al. (2005) use a decision tree model to estimate the costs of Carbohydrate Deficient Transferrin (CDT) testing, self-reporting and brief interventions in a primary care population being treated for diabetes and hypertension compared to a scenario involving no CDT testing (Dillie et al. 2005). Both intervention scenarios involve treatment with a BI for those that test positive for heavy alcohol use (>60 drinks per month for females and >90 drinks per month for males), the difference is that one scenario includes CDT testing for those that have a negative self-report, whereas the other scenario takes no further action when a patient self-reports negatively. The sensitivity and specificity of self-report screening interviews was assumed to be 40% and 95% respectively, based on Aertgeerts et al. (2001) and Hermansson et al. (2000), and for CDT was assumed to be 60% and 90% based on Fleming and Mundt (2004) (Aertgeerts et al. 2001; Fleming et al. 2004; Hermansson et al. 2000). The authors used data from Project TrEAT to estimate screening costs, intervention costs (2 face-to-face physician visits and 2 follow-up phone calls), patient costs (opportunity costs of travel and clinic time), and outcome costs (medical – clinic visits, hospital/emergency/urgent care use, motor vehicle crashes (MVA) and legal criminal costs) over a period of 48 months (Fleming et al. 1997; Fleming et al. 2002). The cost estimates were based directly on those reported by Fleming et al 2002, who analyse the effects of the same type of BI (ie 2 face-to-face physician visits and 2 follow-up phone calls). Based on this each drinker is allocated a medical and other cost depending on if they received the intervention or not. Administering CDT after a negative self-report ensures that more heavy drinkers are identified, resulting in fewer false negatives who on average without intervention go on to accrue high medical, motor vehicle and legal costs. The authors’ analysis estimates that adding a CDT test to a self-report screening strategy, followed by BI for heavy drinkers leads to cost savings (net benefit) of $212.30 per patient screened compared to a strategy that relies only upon self-reporting, over a 48 month period. Hence in the analysis the additional intervention costs are outweighed by the costs saved due to intervening for a greater number of heavy drinkers. This analysis was most sensitive to legal and motor vehicle accidents cost estimates for heavy drinkers who do not receive an intervention. The ranges of these costs were very wide, and the mean costs were much higher than estimated medical and intervention costs. As such the results of the analysis are highly dependent on these costs. Added uncertainty surrounds these cost estimates for this outcome because the analysis estimates substantially lower medical/MVA/legal costs for a heavy drinker who receives an intervention compared to a non-heavy drinker who receives no intervention, which appears questionable. Although this does not bias the results of the analysis greatly (ie if the same medical/MVA/legal costs are applied to a non-heavy drinker as to a heavy drinker who receives an intervention the mean results of the analysis change only very slightly), if this is a reflection that the medical/MVA/legal costs applied to heavy drinkers who have and have not received an intervention are uncertain and inaccurate, the mean results of the study could be
Screening and brief interventions: Cost effectiveness review
43
misleading. At present the positive results for adding CDT to the intervention strategy are driven mainly by the large difference in MVA and crime costs applied to heavy drinkers who have and have not received an intervention. Downs S and Klein J. Clinical Preventive Services Efficacy and Adolescents’ Risky Behaviours. Archives of Pediatrics and Adolescent Medicine. 1995; 149(4): 374-379. Quality Score: - Downs and Klein (1995) model the cost effectiveness of office-based clinical services for adolescents based on resource use between the ages of 15 and 19 (Downs & Klein 1995). The intervention under scrutiny involved annual screening of all adolescents, and 3 annual counselling visits for adolescents identified as being ‘high risk’. The modelling exercise assumes that high risk adolescents are more likely to engage in alcohol abuse and unsafe sexual activity. In turn alcohol abuse may cause death or motor vehicle crashes, while unsafe sexual activity may cause pregnancy, sexually transmitted diseases or HIV. The probabilities of these events occurring for high risk and low risk adolescents were sometimes based on the literature, sometimes data-based and sometimes assumed by the authors. In particular, the MVA estimates for high and low risk adolescents was derived from US adolescent MVA data, the relationship between alcohol and MVAs, and the proportion of adolescents who drink heavily. This resulted in an estimate of a 40% 5-year MVA-likelihood for a low risk adolescent, and a 74% risk for high risk adolescents. The costs included in the model included the preventive program cost per adolescent at high and low risk, the societal cost of a motor vehicle crash, the cost of treating an STD, HIV and a teenage pregnancy. The study was set in the US, but the cost year is not stated. Despite the model studying a 5-year time period, the authors did not use a discount rate, which could bias the results in favour of the intervention which results in future cost savings. The authors calculated that when a value of $600,000 for each death averted was set the efficacy of the programme would need to be 5.6% (ie 5.6% will change their behaviour) in order for the marginal cost to be $0. When the value of an averted death is altered between $0 and $1 million the efficacy required to achieve a $0 marginal cost varied between 5% and 7%. Limited sensitivity analysis is reported by the authors, and the results of the model are heavily reliant on a number of assumptions, in particular surrounding the cost of managing a teenage pregnancy, HIV and motor vehicle crashes, as well as the probability of these events occurring for high and low risk adolescents. The authors claim that because knock-on effects such as the spread of STDs and other disease outcomes are ignored, the results are conservative with regards to the effectiveness and cost effectiveness of the intervention. The analysis also shows that a relatively small effect of the intervention is required in order for it to be regarded as cost effective, or cost neutral (when a cost per life saved is included). However for the results of this analysis to be useful in a UK decision making context a number of cost outcomes and event probabilities would need to be validated.
Screening and brief interventions: Cost effectiveness review
44
Fleming MF, Mundt MP, French MT, Manwell LB, Stauffacher EA and Barry KL. Benefit-Cost Analysis of Brief Physician Advice With Problem Drinkers in Primary Care Settings. Medical Care, 2000, 38(1): 7-18 And Fleming MF, Mundt MP, French MT, Manwell LB, Stauffacher EA and Barry KL. Brief Physician Advice for Problem Drinkers: Long Term Efficacy and Benefit Cost Analysis. Alcoholism: Clinical and Experimental Research, 2002, 26(1): 36-43. Quality Score: + Fleming et al (2000 and 2002) present results of a benefit-cost analysis of brief physician advice for problem drinkers aged between 18 and 65 in a primary care setting based on data from 17 clinics in Wisconsin (Project TrEAT). Here the most recent results, from 48 month data (reported in the 2002 paper), are discussed (Fleming et al. 2002). All patients with regularly scheduled appointments between April 1992 and April 1994 were asked to complete a self-administered Health Screen Survey. Those who screened positive were invited to attend a face-to-face interview which determined eligibility through the Research Lifestyle Interview which asks for alcohol consumption information from the previous 7 days, 28 days, and 3 months. Problem drinkers were defined as men who consumed more than 14 drinks per week and women who consumed more than 11 drinks per week. 17,695 patients were screened and 2,925 screened positive for problem drinking on the Health Screening Survey. After the Research Lifestyle Interview 774 patients were randomised to a control group (382) or the intervention (392). Follow-up rates were high – 83% (643 patients) at 48 months and an ITT analysis was undertaken. Data from this paper were included in the recent Cochrane systematic review (Kaner 2007). Both groups received a health booklet with information on general health issues. The brief intervention included two 15 minute visits with the physician scheduled 1 month apart. Each patient also received a follow-up phone call from the clinic nurse 2 weeks after each meeting with the physician. The outcome measures included changes in alcohol use (previous 7 day use, binge drinking, excessive drinking), health care utilisation (hospital days and emergency department visits) and changes in alcohol-related events (accidents, injuries, crime). Costs and benefits for the health care payer, the patient and society were included in the analysis. For the health care payer the cost of the intervention in terms of equipment and personnel was calculated, as were any savings relating to future reduced emergency care and hospitalisations, treatments and clinic visits. The costs of lost wages (based on occupation, or average local wage if unemployed) and transportation were included for patients. For society, benefits in terms of reduced alcohol related incidents and legal events were included. The results of the study show that the cost of the intervention was $166 to the medical payer per patient, and $39 to the patient in 1993 US$. Almost half of the costs to the medical payer were due to screening. These costs were outweighed by the savings accrued by the intervention group compared to the control group. Medical savings totalled $712 per patient driven by fewer emergency department visits and days of hospitalisation (p=0.02). Legal cost savings amounted to $102 per patient partially due to significantly more controlled substance/liqor violations in the control group compared to the intervention group (11 vs. 2, p<0.05). The largest savings were
Screening and brief interventions: Cost effectiveness review
45
accrued as a result of motor vehicle event savings, which amounted to $7,171 per patient (p = 0.03, CI: $396 – $13,965) due to 281 events in the intervention arm compared to 307 in the control arm. These results meant that there was a net benefit of $546 per patient from the medical perspective (P=0.08) and $7,780 from the societal perspective (P=0.01), which are associated with benefit-cost ratios of 4.3:1 and 39:1 respectively. It is of note that when crime and motor vehicle event estimates are not included the results are no longer statistically significant, although the intervention is still expected to lead to cost savings. From an alcohol consumption perspective the reductions in alcohol use and binge drinking were significantly greater in the intervention group than in the control group at 6 and 12 months. The reduced consumption in the intervention group was in general maintained through to 48 months, whereas in the control group consumption gradually fell over time, so that after 48 months the difference between the two groups was no longer significant. However, the binge drinking measure remained significantly lower in the intervention group compared to the control group after 48 months. Over 48 months there were 7 deaths in the control group, and 3 in the intervention group. All 7 in the control group drank heavily throughout the study and their deaths were possibly alcohol-related (2 motor vehicle accidents, CAD, respiratory failure). 1 death in the intervention group was virtue of suicide by a heavy drinker. The other 2 deaths were in patients who had reduced their drinking significantly but died of MI. As in other resource use studies, the results of this analysis are heavily reliant on the cost and prevalence of motor vehicle events. The average costs of these events far outweigh medical and patient costs because each single event is relatively expensive. The difference in the costs of motor vehicle events was significant between the intervention arm and the control arm, but the relatively small difference in the number of events was not. There were 2 fatal crashes in the control arm compared to 0 in the intervention arm; 31 crashes with non-fatal injuries in the control arm compared to 20 in the intervention arm; 72 vs 67 crashes with property damage only; 25 vs 25 events of operating while intoxicated; and 177 vs 169 other moving violations. Because the more serious motor vehicle events are the most costly it is these differences in relatively small event numbers which drive the magnitude of the overall benefit of the intervention. Hence more certain data on this aspect of the analysis would be desirable in order to be confident about the magnitude of the benefit of the intervention. However, the medical resource use results support the results of the analysis, which may increase confidence in their validity. There were statistically significantly fewer emergency department visits (P<0.10) and days of hospitalisation (P<0.05) in the intervention group than in the control group. The cost savings of these on their own are likely to outweigh the costs of the intervention according to the base case analysis. The papers do not include any quality of life effects for patients, which may underestimate the benefit of the intervention. Importantly, the authors do not present any baseline, or pre-baseline figures for health care resource use, crime, or motor vehicle events. This does not allow a comparison in order to highlight any pre-intervention differences between the randomised groups with regards to these cost categories. This is important as such analysis may help explain some of the post-
Screening and brief interventions: Cost effectiveness review
46
intervention differences between the intervention and control groups, and therefore although the results of the study are strongly positive they must be treated with some caution. Freeborn DK, Polen MR, Hollis JF and Senft RA. Screening and Brief Intervention for Hazardous Drinking in an HMO: Effects on Medical Care Utilisation. The Journal of Behavioural Health Services and Research. 2000, 27(4): 446-453. Quality Score: - In this paper the authors perform a resource utilisation study based on a brief intervention study (Freeborn et al. 2000). The clinical paper reporting the effectiveness of the brief intervention had previously been published (Senft et al. 1997). The setting was a Health Maintenance Organisation (HMO) in the US where between 1992 and 1994 516 hazardous drinkers were identified via the AUDIT questionnaire while in the waiting room prior to seeing their primary care provider. The participants were randomised to an intervention group or a control group consisting of usual care. The intervention consisted of brief advice from the primary care provider (approximately 30 seconds) followed immediately by a 15-minute motivational session with a trained counsellor. The study by Senft et al (1997) was included in the recent Cochrane systematic review which concluded that the methodological quality of the study was ‘unclear’, primarily due to a lack of clarity regarding the randomisation methods used in the trial (Kaner 2007). Costs were not calculated by the authors, instead outpatient visit data and hospitalisations were collected for the year before and 2 years after the intervention. These data were collected from the HMO’s automated administrative databases. Although the results of this study showed a general trend towards slightly lower resource use in the intervention group in the 2 years following the intervention in no cases did any differences approach significance. These results were sustained in regression analyses which controlled for the prior year’s utilisation, duration of health plan membership, chronic disease score, gender, age, BMI, educational level, cigarettes smoking status and medical facility. At 6 months the intervention group reported significantly less total drinks in the previous 3 months and drinking days per week, but after 12 months only the drinking days per week (2.7 vs 3.1, P=0.04) measure remained significant. This study therefore shows much less encouraging results for the resource use impact of brief interventions, compared to Fleming et al (2002). The authors note a number of reasons for this:
• Fleming et al. (2002) collected resource use data through self-reporting as well as medical record audits, whereas Freeborn et al. (2000) relied upon HMO databases which may not be kept up to date satisfactorily.
• The alcohol consumption effect of the intervention was relatively small and less long-lasting compared to that found in Fleming et al. (2002) which may be due to the increased brevity of the intervention considered.
• The authors state that the Fleming at al (2002) trial is in essence an efficacy trial whereby clinicians were screened for their willingness to be trained and to follow the protocol, and were paid for participating. In contrast the authors describe their own trial as an effectiveness trial in which clinicians were
Screening and brief interventions: Cost effectiveness review
47
encouraged to participate but were not paid to do so, reflecting a more realistic setting.
It seems likely that the increased brevity of the intervention analysed by the authors is one of the key drivers of the reduced effectiveness of the intervention. However the data presented, the more realistic setting, and the fact that the authors can control for previous resource use provides evidence that casts some uncertainty over the generalisability of results reported by Fleming et al (2002). Lock CA, Kaner E, Heather N, Doughty J, Crawshaw A, McNamee P, Purdy S and Pearson P. Effectiveness of nurse-led brief alcohol intervention: a cluster randomized controlled trial. Journal of Advanced Nursing 54 (4) 2006; 426-439. Quality Score: + In this paper the authors report the cost minimisation results based on resource use from an RCT investigating the effectiveness of a nurse-led brief alcohol intervention (Lock et al. 2006). The study was based in the UK and recruited 127 patients from 40 GP clusters. The 127 patients were aged 16 or over and were identified opportunistically using AUDIT. Randomisation was at the practice level meaning that nurses involved consistently delivered either the intervention or the control which involved standard advice on cutting down drinking and a UK Government Health Education Authority leaflet entitled “Think about Drink”. The intervention involved a 5-10 minute nurse-led intervention using the “Drink-less” protocol. Follow-up occurred at 6 and 12 months post intervention. The study was included in the recent Cochrane systematic review, and the methodology used was classed as ‘adequate’ (Kaner 2007). A broad cost perspective was taken. Using a patient-based approach data was collected on GP consultations, nurse consultations, A&E attendances, inpatient and outpatient visits, travelling time and waiting time at surgeries and hospitals, time spent in appointments and transport costs. Data on the number of days of work and other out of pocket expenses related to property damage or accidents for a 1-year period pre and post intervention were collected. Healthcare costs were calculated using national unit costs. The cost of the intervention was calculated to equal £28.57 per patient in 2001/2 UK£, made up of programme materials and 10 minutes nurse time to implement the intervention. It is not clear whether this includes the costs of screening to determine patients who are eligible for the intervention (ie were the screening costs of those found not to be eligible for the intervention included in this average cost?). The 12 month results show a trend towards lower mean health care resource use and costs in the intervention group, but these results are not significant. Total health care costs per patient are estimated at £291.73 (£359.04 standard deviation) in the intervention group and £392.06 (£970.52 standard deviation) in the control group. Patient costs were very low in both study arms (£0.48 in the intervention arm, £2.12 in the control arm). The vast majority of the cost difference is driven by hospital inpatient care costs, of which there were more cases in the intervention group (0.37 vs 0.31), but which resulted in higher mean costs in the control group (£238.87 vs 546.00). Given the small sample size and the small event numbers these costs could have been heavily influenced by one or two very high cost events. This appears to be the case in
Screening and brief interventions: Cost effectiveness review
48
the control group, which has a standard deviation of £1,369.54 for this cost category. It is uncertain whether this high cost was attributable to alcohol consumption. The alcohol consumption and health outcome measures showed no significant differences between the study arms at 6 or 12 months, though there was a general trend of greater reductions in consumption in the intervention arm. The study collected SF-12 data but no meaningful patterns were observed. The study lacked power due to the small patient numbers. Therefore the results are uncertain, particularly regarding differences in resource use where event occurrences are low. Another cause of the weak results may be the similarity between the two study arms. The control arm included usual nurse advice on cutting down drinking, as well as the “Think about Drink” leaflet, as compared to the intervention arm which included only a 5-10 minute intervention plus a self-help manual. The difference between usual nurse advice and the 5-10 minute intervention may have been small. Mundt MP, French MT, Roebuck MC, Manwell LB and Barry KL. Brief Physician Advice for Problem Drinking among Older Adults: An Economic Analysis of Costs and Benefits. Journal of Studies on Alcohol, 2005 66: 389-394, 2005. Quality Score: + This paper estimates the impact of an intervention similar to the one studied by Fleming et al (2000 and 2002) when applied to an elderly population (Mundt et al. 2005). As such, patients aged over 65 were screened and assessed for alcohol use, and those that were deemed positive for problem drinking were randomised into an intervention and a control group. The intervention group received a general health booklet and two 10-15 minute physician visits were scheduled one month apart. Two weeks after each physician consultation a clinic nurse made telephone contact with the intervention group patients. Those received to the control group received a general health booklet only. The clinical effectiveness of the intervention was evaluated by the Guiding Older Adults Lifestyles (GOAL) RCT, which used similar research procedures and measures as Project TrEAT, which informed the analysis undertaken by Fleming et al (2000 and 2002). As in Fleming et al (2000 and 2002) costs and benefits for the health care payer, the patient and society were included in the analysis. For the health care payer the cost of the intervention in terms of equipment and personnel was calculated, as were any savings relating to future reduced emergency care and hospitalisations, treatments and clinic visits. The costs of lost wages and transportation were included for patients. For society, benefits in terms of reduced alcohol related incidents and legal events were included. The results of the study were quite different to those found by Fleming et al (2000 and 2002). The cost per patient of the intervention was slightly higher than in the Fleming et al study ($236 vs $205). This may be expected as the cost year is 1996 US$ compared to 1993 US$ reported in Fleming et al. However the resource use results differed by a larger margin. As reported above the intervention studied by Fleming et al led to medical savings totalling $712 per patient driven by fewer emergency department visits and days of hospitalisation (p=0.02). Legal cost savings amounted to $102 per patient and motor vehicle event savings amounted to $7,171 per patient (p
Screening and brief interventions: Cost effectiveness review
49
= 0.03, CI: $396 – $13,965) due to 281 events in the intervention arm compared to 307 in the control arm. These results meant that there was a net benefit of $546 per patient from the medical perspective (P=0.08) and $7,780 from the societal perspective (P=0.01). In Mundt et al (2005) medical resource use differences between the intervention and control groups led to average per patient savings of $664 for the intervention group. This was due to lower hospitalisation costs in the intervention group – emergency department visits, prescription and over-the-counter drug costs, clinic visits and outpatient lab and x-ray costs were all very similar between the two groups. However, while the difference in medical resource use costs were significant in the Fleming et al study, in Mundt et al this difference was not significant: the mean hospitalisation cost in the intervention group was $2,755 with confidence intervals of £1,664-$3,846, as compared to a mean of $3,433 and confidence intervals of $1,666 - $5,200 in the control group. This shows that the mean difference in medical resource use between the two study arms is uncertain. In addition, the intervention group savings with regard to motor vehicle accidents (MVAs) were much lower in Mundt et al compared to Fleming et al. Fleming et al reported a statistically significant MVA cost saving of $7,171 per patient, whereas in Mundt et al the MVA costs were actually $1,410 per patient higher in the intervention group than in the control group. One addition to the Fleming et al analysis that is included in the Mundt et al analysis is that Mundt et al included the cost of life years lost during the study. This was included by observing any cases of mortality that occurred in either study arm, and by placing a cost of $50,000 on each life year lost. Four deaths occurred in the control arm, and one occurred in the intervention arm, which was estimated to result in a cost saving of $1,893 for the intervention arm. In total Mundt et al estimated costs of $5,241 (95% confidence intervals of $2,995 – $7,487) for the intervention group and $6,289 ($3,549 – $9,029) for the control group. Hence although on average it would be expected that the intervention would result in cost savings this is uncertain due to confidence intervals which overlap substantially. The authors note that the standard deviations of resource use cost point estimates were high, and that the economic results of the study were ambiguous and non-significant. Considering the importance of MVA costs based on low event numbers in other studies included in this review it is of interest that – again based on low event numbers – in this study the intervention group incurred a higher MVA cost than the control group. This highlights the importance of the uncertainty surrounding MVA event numbers and costs. However it should be noted that Mundt et al’s analysis still estimates that the intervention will on average lead to cost savings. This is largely due to the cost of lost life years. However this cost also has to be considered uncertain due to the low event numbers and if this cost was not included the total costs of the intervention group would be $845 higher than the control group. Despite these uncertainties the results of this study are not wholly discouraging. The study found that the intervention did result in significant reductions in alcohol consumption and heavy drinking episodes (although this reduction gradually diminished over the 2-year study period). If a quality of life aspect was included in the study this may be expected to have led to a Quality Adjusted Life Year (QALY)
Screening and brief interventions: Cost effectiveness review
50
gain for the intervention group, which could render the intervention cost effective even if it was not cost saving. Cost Utility Analysis Chisholm D, Rehm J, Van Ommeren M and Monteiro M. Reducing the Global Burden of Hazardous Alcohol Use: A Comparative Cost-Effectiveness Analysis. Journal of Studies on Alcohol, 2004, 65: 782-793. Quality Score: + Here, the authors conduct an economic evaluation using a state transition population model that traces the development of a subregional population over a life time horizon (Chisholm et al. 2004). Disability Adjusted Life Years (DALYs) were used as the outcome measure. A societal perspective was adopted but factors such as productivity, crime, and family effects were not included. The analyses were carried out at the level of WHO regions. A number of interventions were compared to ‘no intervention’. In each intervention scenario it was assumed that the intervention would be implemented for 10 years, following which epidemiological rates and health state valuations move back to natural history values. The interventions evaluated were: Tax on alcoholic beverages; Drink-driving legislation and road-side breath testing; Reduced hours of sale; Advertising bans; Brief Interventions. The risk factor studied by the authors relates to hazardous alcohol use, defined as an average rate of consumption of more than 20g pure alcohol daily for women and more than 40g for men. Rates of hazardous alcohol use were taken from the WHO comparative risk assessment (2002) as were fatality rates (Rehm et al. 2003b; Rehm et al. 2003a). Based on these the authors estimated relative risks of mortality for hazardous and non-hazardous drinkers (2.5 for people aged 15-44, 1.3 for men aged over 44, 1.4 for women aged over 44). Health state valuations were included so that DALYs could be computed. A health state valuation of 0.846 was derived based on the proportion of hazardous (80%) and harmful (20%) drinkers in the WHO comparative risk assessment, and preference values for these health states from a Dutch disability weight study (Stouthard, Essink-Bot, & Bonsel 2000). Brief Interventions were modelled to influence the prevalence of hazardous drinking by increasing remission and reducing disability. The authors note that efficacy reviews show an estimated 22% net reduction in consumption amongst hazardous drinkers (Babor et al. 2003; Higgins-Biddle & Babor 1996; Moyer et al. 2002). If applied to the total population at risk this would reduce overall prevalence by 35%-50%, equivalent to a 14%-18% improvement in the rate of recovery over no treatment. However the authors take into account treatment adherence (70%) and target coverage in the population (50% of hazardous drinkers). After this population-level remission rates were estimated to be 4.9%-6.4% better than natural history rates. Additionally an expected reduction in the number of heaviest drinkers while in treatment (but prior to remission) was assumed and resulted in a small gain in the average level of disability – the treated health state valuation was 0.858, an improvement of 1.3% after adjusting for coverage and adherence. Costs included in the analysis consisted of program-level resource inputs used in the production of an intervention, patient-level resource inputs used in the provision of an intervention, and unit costs of program-level and patient-level resource inputs. For
Screening and brief interventions: Cost effectiveness review
51
brief interventions the key costs were the patient-level resource inputs. It was assumed that the BI would consist of 4 primary care visits over 1 year (allowing for initial assessment, educative sessions and follow-up), plus an additional 0.33 outpatient visits and 0.25 inpatient days based on Fleming et al. 2000. These resource inputs were applied to the 50% of prevalent hazardous drinkers in receipt of brief advice in year 1, and because an enduring effect for 10 years was modelled, also in year 6; and to the 50% of incidence cases in years 2-5 and 7-10. Costs were stated in International dollars. Costs were converted to this measure using international prices for traded goods and a regression approach to establish the price of non-traded goods in each subregion. Costs and DALYs were discounted at 3%. For Europe Region A (high income, low premature mortality) the BI was estimated to be the most expensive of the interventions considered by a significant amount (Int$4.44m per 1m population per annum, compared to next most expensive Int$0.61m (breath testing)). It was also estimated to be the most effective intervention, averting 1,889 DALYs per 1 million population compared to 247-459 for breath testing, restricted access and an advertising ban, and 1,365-1,764 for different taxation scenarios. Because of the relatively high cost BIs had the highest average cost per DALY averted, and when compared to the current taxation schemes in place in the Europe Region A countries the incremental cost per additional DALY averted was Int$7,607. It is notable that combinations of some of the other interventions (for example increased tax plus an advertising ban) were both cheaper and more effective than the BI. However, the authors do not conduct a true incremental analysis of their results and so dominated options are not highlighted in this way, instead only options dominated by the existing system in place in the region in question are stated as such. Intuitively, the model results showed that in regions where there was a high prevalence of hazardous drinking the most effective single interventions were BI and taxation. In other areas where there was a lower prevalence of hazardous drinking the differences in the effects of the interventions was not so pronounced. This increases confidence in the validity of the model. Probabilistic sensitivity analysis was undertaken but the presentation of results is unhelpful in determining the results of this. The currency used by the authors is difficult to interpret but the authors state that in each of the subregions the most efficient strategy averts 1 DALY for less than the average annual income per capita, which the authors believe demonstrates cost effectiveness. While in this study it appears that BI may be a cost effective option, the results suggest other strategies may be more incrementally cost effective due to their lower costs and effects. Additionally, combinations of other strategies may dominate the BI, although this may not be a relevant consideration if the individual interventions are classed as complimentary rather than substitutable. Indeed the authors also present results for a scenario involving increased taxation, an advertising ban, and BI, which has an ICER of Int$1,718 compared to the current taxation system in Europe Region A and as such would be deemed to extendedly dominate BI alone, if such a comparison was made. Because the authors consider a number of interventions there is not a large amount of detail provided surrounding the model inputs for each individual intervention. This represents a key weakness in the paper and means that we cannot be sure exactly what
Screening and brief interventions: Cost effectiveness review
52
costs were included – for example it is not clear that screening costs have been included in this analysis for all patients screened. Also, the model results are not specific for any single country, making it more difficult to determine applicability in an English context. Mortimer D and Segal L. Economic evaluation of interventions for problem drinking and alcohol dependence: Cost per QALY estimates. Alcohol and Alcoholism, 2005, Vol. 40, No. 6, pp. 549-555 And Mortimer D and Segal L. Economic evaluation of interventions for problem drinking and alcohol dependence: Do within-family external effects make a difference? Alcohol and Alcoholism, 2006, Vol. 41, No. 1, pp. 92-98. Quality Score: + In these papers the authors present a cost utility analysis of various brief interventions for problem drinking using a time-dependent state-transition model (Mortimer & Segal 2005). The authors take a societal perspective but do not include future health care cost savings, productivity gains or private costs due to uncertainty around estimates of these. The analysis is based on Australian costs and effectiveness estimates are taken from two studies: One paper assessed the effectiveness of various BIs delivered in a range of settings – outpatient clinics, hospitals and community centres – with an intensity ranging from 1-4 sessions, all with less than 1 hour of total counselling time (Wilk et al. 1997). The other paper provided data on simple (5 minutes), brief (20 minutes) and extended (120-150 minutes over four sessions) interventions (Saunders et al. 1991). Mortimer and Segal (2005) took effectiveness of the interventions directly from these papers and compared the cost effectiveness of the different BIs, taking into account quality of life considerations. Health related quality of life (HRQL) estimates are included in the analysis, based on disability weights from a Dutch disability-weight study (Stouthard, Essink-Bot, & Bonsel 2000). Returning problem and dependent drinkers to a ‘safe’ consumption pattern is assumed to imply annual QALY gains of 0.110 and 0.330 respectively. Despite the societal perspective taken the only costs (2003 Aus$) included are programme costs which are based on a description of resource use in intervention and control groups obtained from the study reports. Costs and QALYs were discounted at a rate of 5%. For the various brief interventions considered by Wilk et al 1997 the authors estimate average incremental QALY gains of 0.091 for males and 0.125 for females at an average incremental cost of Aus$60.98, leading to ICERs of Aus$671 for males and Aus$490 for females, with a range of Aus$245-10,549. For the simple, brief and extended interventions discussed by Saunders et al 1991 the authors report that none of the levels of intervention are dominated or extendedly dominated and thus the most intensive version (ie the most effective affordable intervention) should be selected as the treatment of choice. The ‘simple’ intervention has an ICER of less than Aus$82 per QALY compared to a control arm. The ‘Brief’ intervention has an ICER of less than Aus$118 compared to the ‘simple’ intervention, and the ‘Extended’ intervention has and ICER of less than Aus$282 compared to the ‘Brief’ intervention.
Screening and brief interventions: Cost effectiveness review
53
The authors state that a degree of pessimism would be advisable with regards to the maintenance of the intervention effect. In their base case they based maintenance of effect on early and late follow-up results from the clinical trials used, but they give no indication about what this meant for their model results, or the rate at which they assumed the treatment effect to diminish. The ICERs presented in this paper are well within implied funding thresholds. However the paper analyses a number of alcohol interventions of which BIs are only one. Therefore data is not provided regarding the BI model inputs with respect to exact cost and effectiveness figures (although the authors note that more information will be provided upon request). As such it is difficult to gauge the suitability of the modelling. The results of the paper suggest that even if future cost savings with regards to medical use and crime and motor vehicle accidents are not included, BIs are cost effective due to their beneficial effects on quality of life. It is not clear here which costs are included in the model, and in particular if screening costs are included. However, the ICERs are so low that even the inclusion of these costs would be unlikely to increase the ICER above acceptable levels. This is due to the incremental QALY gains and therefore much is dependent on the assumed effectiveness of the BIs (details of which are not included in the paper) and the suitability of the utility scores used. The Wilk et al meta-analysis is included in our clinical systematic review which accompanies this economics report, and although the specific Saunders et al (1991) paper is not included in any of the systematic reviews considered in the clinical review, a 1992 paper from the same authors and reporting on the same study results is included in two of the included meta analyses (Cuijpers et al. 2004b; Moyer et al. 2002). It is of note that Mortimer and Segal also assessed the difference to the results of their earlier paper that would occur if ‘external effects’ – health impacts from the behaviour change of one individual that accrue to others – were included (Mortimer, & Segal 2006). They estimated a health related quality of life (HRQL) benefit that could be applied to all persons within the family unit of a problem drinker who benefits from a successful intervention. In effect this over doubled the QALY gain associated with the BIs, and as a result the ICERs more than halved. This strengthens the argument that even ignoring future cost offsets to BIs, the HRQL impact of the interventions cause them to be cost effective given currently implied cost effectiveness thresholds. Saitz R, Svikis D, D’Onofrio G, Kraemer KL and Perl J. Challenges applying alcohol brief intervention in diverse practice settings: populations, outcomes and costs. Alcoholism: Clinical and Experimental Research, 2006, 30 (2): 332-338. Quality Score: - In this paper the authors summarise the proceedings of a symposium that took place at the 2005 Research Society on Alcoholism conference in California (Saitz et al. 2006). The symposium covered four topics, of which cost effectiveness of screening and BI was only one. Unfortunately this means that little detail is given regarding the analysis undertaken. The economic evaluation discussed was in the form of cost utility analysis using a Markov model which had six health states (abstinence, safe drinking, at-risk drinking, alcohol abuse, alcohol dependence, and alcohol dependence
Screening and brief interventions: Cost effectiveness review
54
in recovery). The exact intervention analysed is unspecified, but it certainly included a screening plus BI arm compared to a no-screening control. The effectiveness data used in the model was taken from published papers for parameters such as screening sensitivity and specificity, prevalence of alcohol problems in primary care, efficacy of BI, transition between alcohol-related health states, mortality, costs for alcohol screening and intervention, and lifetime health care costs. The authors state that where published data was not available simplifying assumptions were made that reflected actual primary care practices or that were biased against alcohol screening and intervention, however it is not specified which parameters this applied to. Importantly, this study included utility estimates for each alcohol-related health state. These were obtained using the standard gamble technique from a clinic/community sample (Kraemer et al. 2005). The authors state that a societal perspective was taken, but details on which costs were included are not given. However it is certain that costs for screening, intervention, and lifetime health care costs were included – though the sources for the estimates of these costs are not stated. Costs as well as benefits were discounted at a rate of 3%. The authors report results that they state were robust to a range of sensitivity analysis. The screening plus BI intervention was expected to yield a gain of 0.05 QALYs per man or woman screened, and would also result in savings of $300 (cost year not stated) per man or woman screened. Hence the intervention was a dominant treatment strategy compared to no screening. Given the other evidence available this result is perhaps to be expected since most studies which include long term future costs show BI to result in cost savings, and those that examine quality of life show benefits accrued due to BI. However the results of this paper cannot be relied upon since not enough details are provided about the methods used in the modelling and the parameter inputs. This analysis could prove important for decision makers, but until a full paper is published a detailed review cannot be undertaken. Solberg LI, Maciosek MV and Edwards NM. Primary Care Intervention to Reduce Alcohol Misuse: Ranking Its Health Impact and Cost Effectiveness. American Journal of Preventative Medicine 2008; 34(2): 143 – 152. Quality Score: + Here the authors present a full economic evaluation of screening and BI for alcohol misuse in a US primary care setting (Solberg, Maciosek, & Edwards 2008). The authors use an algebraic model and take a societal perspective. One particular strength of the analysis is the inclusion of QALY effects of future alcohol-related illness, as well as the costs of these illnesses. The objective of the study was to estimate the cost effectiveness of regular screening for alcohol misuse using questionnaires such as CAGE and AUDIT, followed by evaluation of initial positives and brief counselling of true positives. The exact BI investigated was not specified. A literature review was undertaken in 2005 to obtain effectiveness estimates for screening and BIs. The effectiveness of the intervention was determined by four parameters which the literature review informed upon: adherence with screening (assumed to be 86%), sensitivity of screening (70%), effectiveness of counselling in
Screening and brief interventions: Cost effectiveness review
55
producing behaviour change (17.4%), and efficacy of behaviour change in reducing the health consequences of acute conditions (90%) and chronic conditions (25%). Based on US data the study included assumptions that the prevalence of problem drinking between ages 18-54 was 25.01%, and above the age of 54 was 6.47%. Based on this, it would be estimated that screening plus intervention will change the behaviour of 2.6% of all the people screened aged between 18 and 54, and 0.9% of all people screened aged above 54. The authors do not state these figures but have confirmed via personal communication that this is the correct interpretation of their analysis. The lifetime burden of alcohol-attributable disease in terms of QALYs lost was estimated by multiplying current morbidity and mortality for each included condition by published estimates of each condition’s alcohol-attributable fraction (AAF). All conditions that had an AAF of greater than 0 on the Alcohol-Related Disease Impact (ARDI) website were included (National Center for Chronic Disease Prevention and Health Promotion 2008). Based on behaviour change the mortality and morbidity of each condition is reduced by screening and BI. The burden of morbidity and mortality was estimated in a situation without screening and BI and in a situation with screening and BI. In this way a QALY gain based on reduced mortality and morbidity (using average disease durations and QALY weights) associated with screening plus BI was calculated. Costs included were physician time, patient time, long-term health care costs, costs of alcohol-related crimes, motor vehicle crashes, fire destruction and social welfare administration. These costs were calculated over a life time period. Each screening plus BI visit involved a 1 minute screen. True and false negatives would only incur this time. False positives would incur a total time of 3 minutes, and true positives would incur a total time of 6 minutes. The authors assumed that screening would be annual between the ages 18-54, and biennial after the age of 54, in order to maintain efficacy over time. Each office visit was assumed to take up 2 hours of a patient’s time and this was costed based on average US hourly earnings in 2000. The future medical costs and other alcohol-related costs were calculated based on Harwood’s estimate of the annual societal costs of alcohol abuse (Harwood 2000). Similarly as for acute medical conditions, it was assumed that behaviour change resulted in a 90% reduction in non-medical alcohol-attributable costs. In comparison to intervention costs, these future medical and non-medical alcohol-attributable costs were high: $5,143 for medical costs and $9,136 for non-medical costs. The results of the model showed that screening plus BI was expected to lead to QALY savings of 0.012 (0.045 undiscounted). The discounted costs of screening, intervention and patient time were low compared to alcohol-attributable medical costs and other costs (screening, intervention and patient time costs totalled approximately 16% of alcohol-attributable medical costs, and 8% of other alcohol-attributable costs which represented the most expensive cost component). As a result the reduction in alcohol-attributable medical and other costs outweighed the increased screening and intervention costs such that the intervention was expected to be cost saving ($257 per patient) from a societal perspective. As such, from a societal perspective the intervention was dominant. From a medical sector perspective there were marginal costs to the intervention because the future alcohol-attributable medical costs savings
Screening and brief interventions: Cost effectiveness review
56
($152 per patient) did not outweigh the extra cost of the intervention ($172 per patient). This led to an incremental cost of $21 per patient, and an ICER of $1,688 per QALY saved. In sensitivity analysis, the authors found that the results of their analysis were very sensitive to some variables, such as effectiveness of counselling at changing behaviour and frequency of counselling necessary to maintain effectiveness. However the vast majority of one-way sensitivity analysis maintained a result that from the societal perspective the intervention would be cost saving. The authors also undertook multivariate sensitivity analysis, varying three parameters at a time. Details on which interventions were adjusted are not given, but the authors note that the results were very sensitive to this analysis, with the ICER rising to $98,800 in one analysis. It is of note that the largest cost saving associated with the intervention is in non-medical alcohol-attributable costs, such as motor vehicle accidents. This is in line with other studies (Fleming et al. 2002). However this cost saving may be uncertain. If future alcohol-attributable medical and other costs were not included in the analysis, the discounted incremental cost of the intervention would be $172 from the medical payer perspective, and $340 from the societal perspective. The discounted QALY gain of 0.012 would thus give ICERs of $14,333 and $28,333 from the medical payer and societal perspectives respectively. The intervention costs included in this analysis appear low in comparison to some other studies which may be a result of the very brief nature of the intervention modelled (full intervention plus screening undertaken in 6 minutes). However, in line with this the authors have assumed a fairly low success rate of the intervention (17.4%) and the intervention is only expected to change the behaviour of 2.6% of the population originally screened (aged between 18 and 54). The authors also assume that the intervention is repeated annually for this age group in order to maintain effectiveness. These assumptions appear reasonable and possibly conservative and may signify that the long-term effects of alcohol misuse are such that when a relatively low cost intervention is used only a small proportion of peoples’ behaviour must be altered in order for the intervention to be classed as cost effective. The QALYs saved estimates presented by the authors are based on a technique which relies heavily on AAFs. These are calculated directly and indirectly. Direct estimates are based on direct observations about the relationship between alcohol and a given health outcome, typically from studies assessing the proportion of deaths from a particular condition at or above a specified blood alcohol concentration. Indirect estimates are based on meta-analyses on the relationship between alcohol and various alcohol-related health outcomes (eg types of cancer) as well as data on the prevalence of alcohol use at specific consumption levels (National Center for Chronic Disease Prevention and Health Promotion 2008). Although data availability makes such analysis difficult due to uncertainty, this seems a reasonable way to estimate the quality of life effects of alcohol abuse. However, any quality of life decrement associated with heavy alcohol consumption and not experiencing an alcohol-related illness will not be picked up by such an analysis. This would suggest that the QALYs saved estimate for the intervention may be an underestimate. Additionally any intra-family quality of life effects of alcohol consumption will not be included by this technique.
Screening and brief interventions: Cost effectiveness review
57
Primary Care Setting Summary Numerous studies investigate the economic effects of screening plus BI for the prevention of alcohol misuse in the primary care setting. One key result is that one UK paper of moderate quality analyses the cost effectiveness of different screening methods, and clear results in favour of the alcohol use disorders identification test (AUDIT) are produced (Coulton et al. 2006). This study is useful for assessing the screening tools it considers, but it is important to note that it does not include all of the tools assessed in the clinical review of screening. Hence conclusions regarding the relative cost effectiveness of screening tools such as the reduced version of AUDIT, the AUDIT-C, cannot be made based on the existing economics literature.
Evidence Statement e5.1: One study shows that the alcohol use disorders identification test (AUDIT) is a more cost effective screening tool than measures of y-glutamyltransferase, aspartate aminotransferase, per cent carbohydrate deficient transferrin, and ethrocyte mean cell volume (Coulton et al. 2006) because AUDIT is both cheaper and more effective than these other tests (study quality +). The evidence does not allow a ranking of the cost effectiveness of these other screening methods. Coulton et al. (2006) Study quality + Applicability: UK study applicable to primary care. With regard to the cost effectiveness of screening plus brief intervention in the primary care setting, the key issues that arise when an overview of the studies is taken are:
• Long-term impact of the intervention It is not clear how long the impact of a brief intervention can be expected to last. Assuming the impact of a brief intervention is maintained in the long term without re-application is likely to result in very different cost effectiveness estimates compared to a scenario whereby it is assumed that the intervention must be re-applied every year to maintain the effect. Of the cost-utility papers reviewed one assumed a relatively short maintenance of effect time period based on early and late follow-up results from clinical trials, but did not state how long this period was or at what rate the effect was lost {Mortimer, 2005 971 /id}. One study assumed that the intervention was repeated every year between the ages of 18 and 54, and biennially after the age of 54 to maintain the effect {Solberg, 2008 4049 /id}. Another study assumed that the intervention had to be repeated once every 5 years in order to maintain the effect {Chisholm, 2004 1740 /id}.
• Differentiated BIs While some studies investigated screening followed by very brief interventions (ie less than 10-15 minutes (Lock et al. 2006; Solberg, Maciosek, & Edwards 2008; Wutzke et al. 2001d)), others investigated more extended interventions (eg 2 GP visits in close succession as well as follow-up phone calls, or more (Chisholm et al. 2004; Dillie et al. 2005; Fleming et al. 2000; Fleming et al. 2002; Lindholm 1998d)).
Screening and brief interventions: Cost effectiveness review
58
The results from Lock et al (2006) are inconclusive from a cost effectiveness point of view, which could be put down to the very brief nature of the intervention considered. However, Wutzke et al also consider a very brief intervention (less than 5 minutes per patient) but present strong results in terms of cost per life years saved. This is based on an assumption that the intervention results in a 28% average decrease in consumption and a 72% reduction in alcohol-related mortality in those counselled. The validity of these estimates should be considered. Solberg, Maciosek, & Edwards (2008) also consider a very brief intervention (6 minutes for a true positive patient). They assume effectiveness such that 17.4% of those counselled will change their behaviour. The authors take into account long term health care and other alcohol attributable costs as well as QALYs saved due to the avoidance of certain diseases, and estimate that the intervention is dominant from a societal perspective, and produces QALY savings at very low costs from a health care payer perspective. These papers show that even when considering a very brief BI the cost effectiveness results appear encouraging. As would be expected, the studies which consider more extended BIs generally show bigger consumption and resource use effects. Fleming et al (2000 and 2002) estimate that from both a health care payer and a societal perspective the BI (2 physician visits plus 2 follow-up phone calls) will be cost saving. Dillie et al use data from Project TrEAT and so come to similar conclusions as Fleming et al. However, it is more informative to consider the results of the clinical review when discussing efficacy issues, and with regard to brief intervention intensity the review concludes that even very brief interventions may be effective in reducing alcohol-related negative outcomes, with inconclusive evidence of an additional positive impact resulting from increased dose. In light of this, it is logical that the most brief intervention is likely to be the most cost effective. • Uncertainty over long term health care resource use, crime and MVA effects Several studies estimate that long term resource use cost savings will be made, particularly with regards to motor vehicle accidents (MVAs) which often drive the results of the studies (Dillie et al. 2005; Downs & Klein 1995; Fleming et al. 2002; Solberg, Maciosek, & Edwards 2008). These costs are uncertain – limited data means that they can only be estimated with wide confidence intervals – and this uncertainty is usually not dealt with rigorously be the authors. One paper finds that the intervention group incurs more MVA costs than the control group (Mundt et al. 2005). Because of the uncertainty around these costs, when it is these that cause an intervention to appear cost saving the results of the study must be treated with some caution. However, it is also important to note that in the two studies where it is possible to split out MVA costs from other costs both studies would present favourable economic results even if MVAs were not included (Solberg, Maciosek, & Edwards 2008; Fleming et al. 2002). This allows a more confident positive conclusion regarding the economic results of these studies. • Uncertainty over HRQL effects of BI Relatively few studies included HRQL effects of BI (Chisholm et al. 2004; Mortimer, & Segal 2005; Mortimer, & Segal 2006; Saitz et al. 2006; Solberg, Maciosek, & Edwards 2008). Of those that did, Mortimer and Segal (2005 and
Screening and brief interventions: Cost effectiveness review
59
2006) and Chisholm et al both used utility weights taken from a Dutch disability-weight study (Stouthard, Essink-Bot, & Bonsel 2000). Neither of these papers included long term resource use costs due to uncertainty surrounding these, and both estimated that additional QALYs could be saved at low cost through screening plus BI. Solberg, Maciosek, & Edwards (2008) estimated QALY gains based on reductions in alcohol-attributable diseases and include future health and other costs and conclude that the BI is cost saving from the societal perspective. It is difficult to compare the QALY and DALY estimates reported by these papers, because Chisholm et al (2004) presents an annual average QALY gain per individual population member, Mortimer and Segal (2005) present a lifetime QALY gain per person treated, and Solberg, Maciosek, & Edwards (2008) present a lifetime QALY gain per individual population member. Therefore in none of the studies are the QALY gains directly comparable.
The primary care studies overall appear to show that screening plus BI result in modest effect sizes. However, the economic analyses suggest that these effect sizes in tandem with resource use and other cost effects are sufficient for the interventions to be classed as cost effective. In considering this though, the above uncertainties and cautions must be taken into account. There is considerable uncertainty as to whether a brief intervention will be cost saving in the long term. In addition, there is some uncertainty regarding the QALY gains associated with brief interventions, because the estimated QALY gains reported in the relevant studies included in this review are not comparable to one another. It is therefore necessary to conduct further analysis into these specific areas in order to ascertain whether brief interventions are likely to be cost saving or cost effective. This analysis appears in the following section of this report. In addition, economic modelling taking a UK perspective has also been undertaken and this is presented in a separate report.
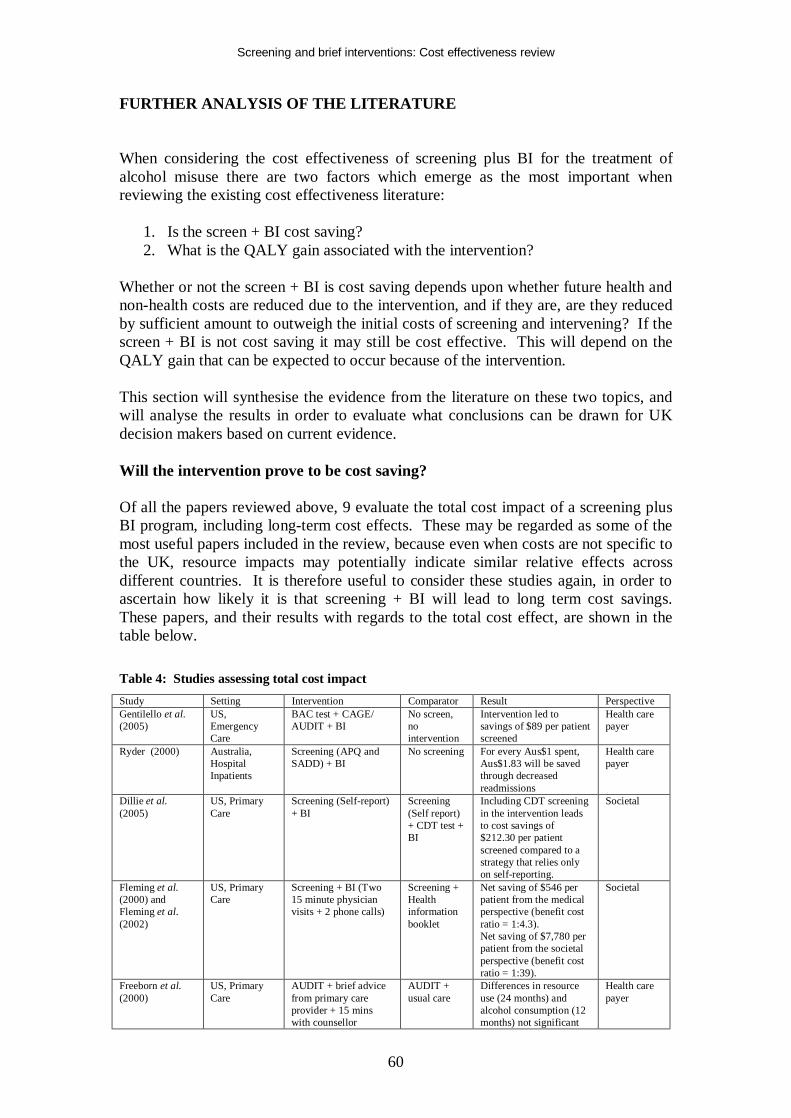
Screening and brief interventions: Cost effectiveness review
60
FURTHER ANALYSIS OF THE LITERATURE When considering the cost effectiveness of screening plus BI for the treatment of alcohol misuse there are two factors which emerge as the most important when reviewing the existing cost effectiveness literature:
1. Is the screen + BI cost saving? 2. What is the QALY gain associated with the intervention?
Whether or not the screen + BI is cost saving depends upon whether future health and non-health costs are reduced due to the intervention, and if they are, are they reduced by sufficient amount to outweigh the initial costs of screening and intervening? If the screen + BI is not cost saving it may still be cost effective. This will depend on the QALY gain that can be expected to occur because of the intervention. This section will synthesise the evidence from the literature on these two topics, and will analyse the results in order to evaluate what conclusions can be drawn for UK decision makers based on current evidence. Will the intervention prove to be cost saving? Of all the papers reviewed above, 9 evaluate the total cost impact of a screening plus BI program, including long-term cost effects. These may be regarded as some of the most useful papers included in the review, because even when costs are not specific to the UK, resource impacts may potentially indicate similar relative effects across different countries. It is therefore useful to consider these studies again, in order to ascertain how likely it is that screening + BI will lead to long term cost savings. These papers, and their results with regards to the total cost effect, are shown in the table below. Table 4: Studies assessing total cost impact Study Setting Intervention Comparator Result Perspective Gentilello et al. (2005)
US, Emergency Care
BAC test + CAGE/ AUDIT + BI
No screen, no intervention
Intervention led to savings of $89 per patient screened
Health care payer
Ryder (2000) Australia, Hospital Inpatients
Screening (APQ and SADD) + BI
No screening For every Aus$1 spent, Aus$1.83 will be saved through decreased readmissions
Health care payer
Dillie et al. (2005)
US, Primary Care
Screening (Self-report) + BI
Screening (Self report) + CDT test + BI
Including CDT screening in the intervention leads to cost savings of $212.30 per patient screened compared to a strategy that relies only on self-reporting.
Societal
Fleming et al. (2000) and Fleming et al. (2002)
US, Primary Care
Screening + BI (Two 15 minute physician visits + 2 phone calls)
Screening + Health information booklet
Net saving of $546 per patient from the medical perspective (benefit cost ratio = 1:4.3). Net saving of $7,780 per patient from the societal perspective (benefit cost ratio = 1:39).
Societal
Freeborn et al. (2000)
US, Primary Care
AUDIT + brief advice from primary care provider + 15 mins with counsellor
AUDIT + usual care
Differences in resource use (24 months) and alcohol consumption (12 months) not significant
Health care payer
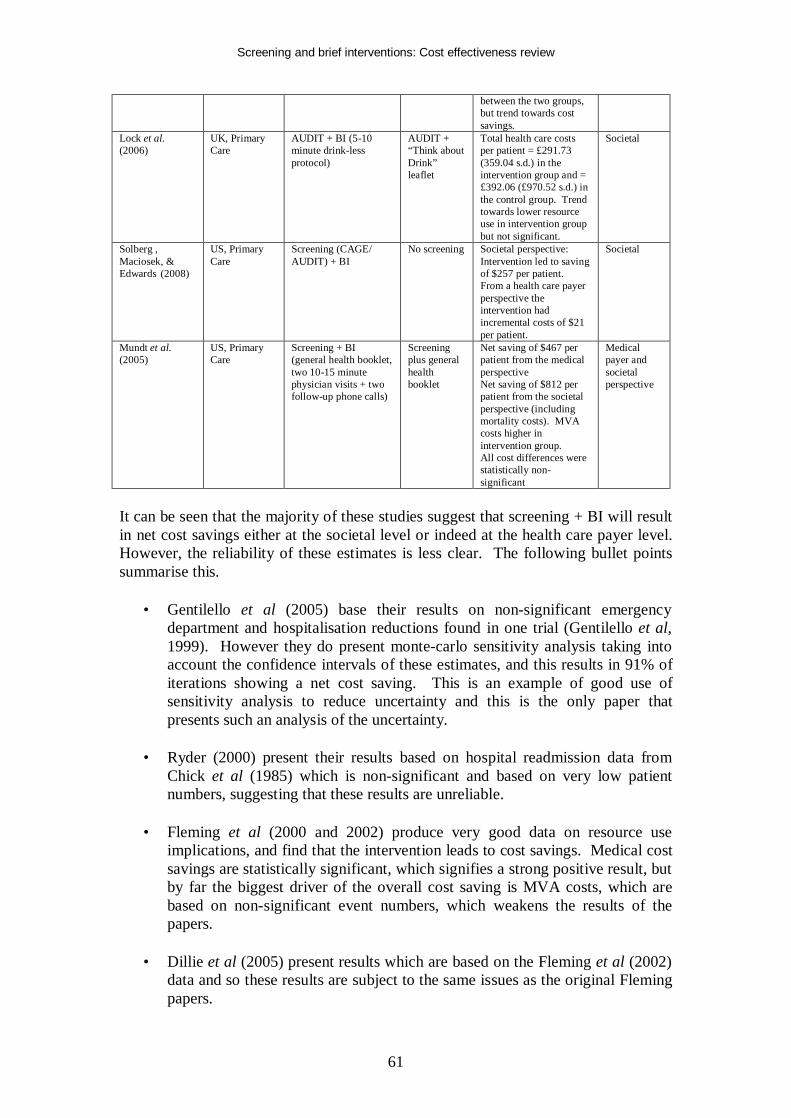
Screening and brief interventions: Cost effectiveness review
61
between the two groups, but trend towards cost savings.
Lock et al. (2006)
UK, Primary Care
AUDIT + BI (5-10 minute drink-less protocol)
AUDIT + “Think about Drink” leaflet
Total health care costs per patient = £291.73 (359.04 s.d.) in the intervention group and = £392.06 (£970.52 s.d.) in the control group. Trend towards lower resource use in intervention group but not significant.
Societal
Solberg , Maciosek, & Edwards (2008)
US, Primary Care
Screening (CAGE/ AUDIT) + BI
No screening Societal perspective: Intervention led to saving of $257 per patient. From a health care payer perspective the intervention had incremental costs of $21 per patient.
Societal
Mundt et al. (2005)
US, Primary Care
Screening + BI (general health booklet, two 10-15 minute physician visits + two follow-up phone calls)
Screening plus general health booklet
Net saving of $467 per patient from the medical perspective Net saving of $812 per patient from the societal perspective (including mortality costs). MVA costs higher in intervention group. All cost differences were statistically non-significant
Medical payer and societal perspective
It can be seen that the majority of these studies suggest that screening + BI will result in net cost savings either at the societal level or indeed at the health care payer level. However, the reliability of these estimates is less clear. The following bullet points summarise this.
• Gentilello et al (2005) base their results on non-significant emergency department and hospitalisation reductions found in one trial (Gentilello et al, 1999). However they do present monte-carlo sensitivity analysis taking into account the confidence intervals of these estimates, and this results in 91% of iterations showing a net cost saving. This is an example of good use of sensitivity analysis to reduce uncertainty and this is the only paper that presents such an analysis of the uncertainty.
• Ryder (2000) present their results based on hospital readmission data from
Chick et al (1985) which is non-significant and based on very low patient numbers, suggesting that these results are unreliable.
• Fleming et al (2000 and 2002) produce very good data on resource use
implications, and find that the intervention leads to cost savings. Medical cost savings are statistically significant, which signifies a strong positive result, but by far the biggest driver of the overall cost saving is MVA costs, which are based on non-significant event numbers, which weakens the results of the papers.
• Dillie et al (2005) present results which are based on the Fleming et al (2002)
data and so these results are subject to the same issues as the original Fleming papers.
Screening and brief interventions: Cost effectiveness review
62
• Freeborn et al (2000) present results which suggest a pattern towards resource use reductions in the intervention group, but the authors state that these are non-significant.
• Lock et al (2006) present results which suggest a pattern towards cost savings
for the intervention group, but again these are statistically non-significant. There is particular uncertainty surrounding these costs because the main cost driver is hospital admissions. There were relatively few of these, but there were actually more admissions in the intervention group, however the cost of the individual admissions were such that the mean total cost of admissions was lower in the intervention group.
• Mundt et al (2005) present the results of a similar study to that examined by
Fleming et al (2000 and 2002), except in an older population. The results show a trend towards lower medical costs in the intervention group, but the authors conclude that these are non-significant. In addition, higher MVA costs are found in the intervention group. Again these are non-significant, but this highlights the uncertainty over whether a BI can be expected to lead to MVA cost savings.
• Solberg, Maciosek, & Edwards (2008) present marginal cost savings for the
intervention group, but this is based on resource use impacts which are assumed, rather than being based on actual data. This is the only paper that estimates cost savings over a life-time period. This allows the impact of alcohol attributable diseases to be taken into account.
This overview of the total cost impact of screening + BI illustrates the uncertainty surrounding the issue. While a number of papers estimate a net cost saving for the intervention this is often based on statistically non-significant data, and some data exists which find opposite results for certain cost categories – such as MVAs – which places further uncertainty on the conclusions. Few papers deal with the uncertainty surrounding net cost impacts satisfactorily which therefore means that it is not possible to draw strong conclusions on the net cost impact of screening + BI. Therefore it is concluded that there is not sufficient evidence on the effect of screening plus brief intervention on future net costs for confident conclusions to be made as to whether screening + BI will result in either net costs or net savings. This is not to say that there is evidence of no effect on net costs, rather that the effect on net costs is uncertain. What is the likely QALY gain of the intervention? Even if screening + BI does not result in net cost savings, the intervention may still be cost effective, ie if we assume the net resource use impact of the intervention is neutral, the QALY gain attributed to the intervention may be enough to justify the intervention costs. This depends on the QALY gain that can be expected from the intervention. To summarise this issue, the following table shows the total life year and QALY gains estimated by the relevant papers identified in the review above.
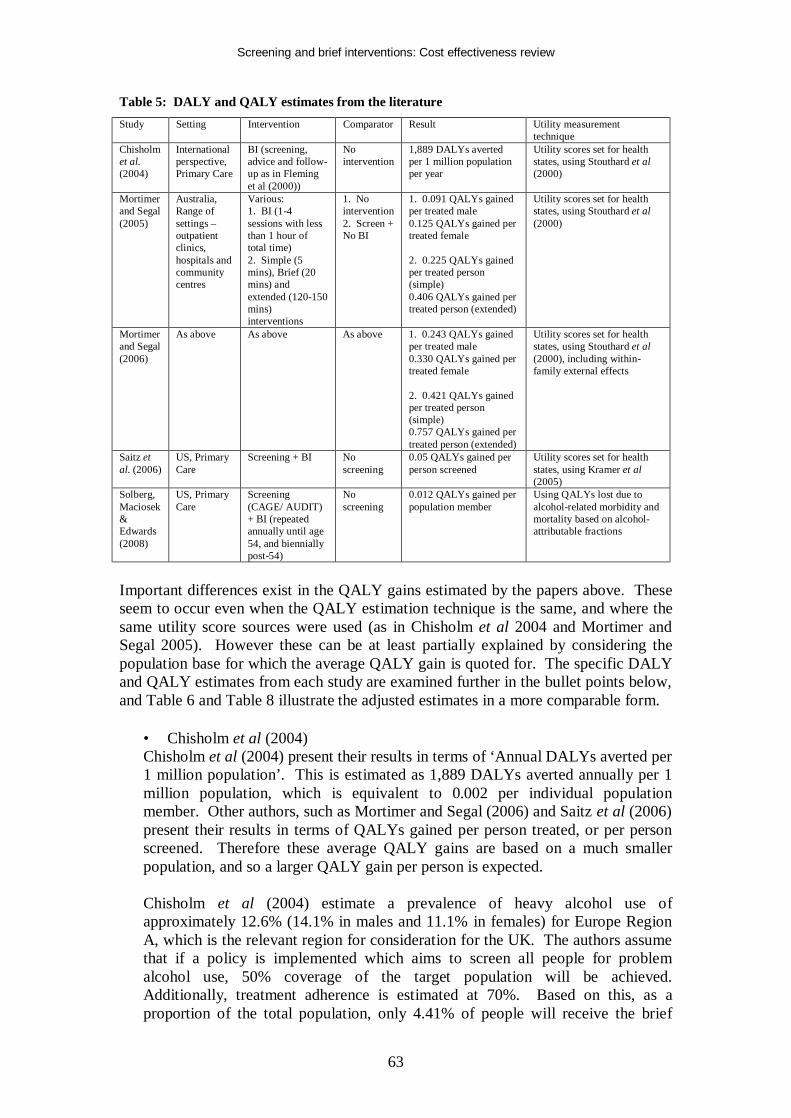
Screening and brief interventions: Cost effectiveness review
63
Table 5: DALY and QALY estimates from the literature Study Setting Intervention Comparator Result Utility measurement
technique Chisholm et al. (2004)
International perspective, Primary Care
BI (screening, advice and follow-up as in Fleming et al (2000))
No intervention
1,889 DALYs averted per 1 million population per year
Utility scores set for health states, using Stouthard et al (2000)
Mortimer and Segal (2005)
Australia, Range of settings – outpatient clinics, hospitals and community centres
Various: 1. BI (1-4 sessions with less than 1 hour of total time) 2. Simple (5 mins), Brief (20 mins) and extended (120-150 mins) interventions
1. No intervention 2. Screen + No BI
1. 0.091 QALYs gained per treated male 0.125 QALYs gained per treated female 2. 0.225 QALYs gained per treated person (simple) 0.406 QALYs gained per treated person (extended)
Utility scores set for health states, using Stouthard et al (2000)
Mortimer and Segal (2006)
As above As above As above 1. 0.243 QALYs gained per treated male 0.330 QALYs gained per treated female 2. 0.421 QALYs gained per treated person (simple) 0.757 QALYs gained per treated person (extended)
Utility scores set for health states, using Stouthard et al (2000), including within-family external effects
Saitz et al. (2006)
US, Primary Care
Screening + BI No screening
0.05 QALYs gained per person screened
Utility scores set for health states, using Kramer et al (2005)
Solberg, Maciosek & Edwards (2008)
US, Primary Care
Screening (CAGE/ AUDIT) + BI (repeated annually until age 54, and biennially post-54)
No screening
0.012 QALYs gained per population member
Using QALYs lost due to alcohol-related morbidity and mortality based on alcohol-attributable fractions
Important differences exist in the QALY gains estimated by the papers above. These seem to occur even when the QALY estimation technique is the same, and where the same utility score sources were used (as in Chisholm et al 2004 and Mortimer and Segal 2005). However these can be at least partially explained by considering the population base for which the average QALY gain is quoted for. The specific DALY and QALY estimates from each study are examined further in the bullet points below, and Table 6 and Table 8 illustrate the adjusted estimates in a more comparable form.
• Chisholm et al (2004) Chisholm et al (2004) present their results in terms of ‘Annual DALYs averted per 1 million population’. This is estimated as 1,889 DALYs averted annually per 1 million population, which is equivalent to 0.002 per individual population member. Other authors, such as Mortimer and Segal (2006) and Saitz et al (2006) present their results in terms of QALYs gained per person treated, or per person screened. Therefore these average QALY gains are based on a much smaller population, and so a larger QALY gain per person is expected. Chisholm et al (2004) estimate a prevalence of heavy alcohol use of approximately 12.6% (14.1% in males and 11.1% in females) for Europe Region A, which is the relevant region for consideration for the UK. The authors assume that if a policy is implemented which aims to screen all people for problem alcohol use, 50% coverage of the target population will be achieved. Additionally, treatment adherence is estimated at 70%. Based on this, as a proportion of the total population, only 4.41% of people will receive the brief
Screening and brief interventions: Cost effectiveness review
64
intervention. Thus, any QALY gain due to the intervention will appear very small when averaged out across the entire population. This helps explain the relatively low DALY gain presented by Chisholm et al – when estimates from other papers are adjusted to reflect the same population base they will appear much more similar. • Mortimer and Segal (2005) Mortimer and Segal (2005) present their results in terms of ‘QALYs gained per patient treated’ – which can be interpreted as the average QALY gain achieved by a patient who received the brief intervention. This average QALY gain will appear much lower if it is averaged out across the entire population. For example, if it is assumed – as in Chisholm et al (2004) – that the prevalence of heavy alcohol use is 12.6%, 50% of the target population are screened and 70% adhere to treatment, the QALY gain per treated person must be scaled down by 95.6% (12.6%*50%*70% = 4.41%) in order to present the results as a QALY gain per population member. This results in a QALY gain of 0.004 for males and 0.005 for females based on data from Wilk et al (1997) (reduced from 0.091 and 0.125 per male and female treated), and QALY gains of 0.010 and 0.018 based on data from Saunders et al (1991) (reduced from 0.225 per treated person (simple intervention) and 0.406 per treated person (extended intervention)). Additionally, the Mortimer and Segal (2005) estimate reflects a lifetime QALY gain, whereas the Chisholm et al (2004) estimate is an average annual gain. Mortimer and Segal (2005) took into account that the time period over which the brief intervention’s effect was maintained was likely to be relatively short, although exact details of how long the duration of effect was assumed to be are not stated. Chisholm et al (2004) assume that the brief intervention is repeated once every 5 years over a 10 year period in order to maintain the effect. Therefore it is assumed by Chisholm et al (2004) that the average effect of two applications of the brief intervention is 0.002 DALYs averted each year for 10 years, after which any effect disappears. Hence the total effect over time of two applications of the intervention would be estimated to be 0.019 (0.002*10). This does not need to be discounted because the average figure of 0.002 is stated to have been discounted by the authors. Taking this into account, it appears that the DALYs averted over the expected duration of effect of the intervention estimated by Chisholm et al (2004), and the lifetime QALYs gained estimated by Mortimer and Segal (2005) are different, but that this is to be expected because Chisholm et al (2004) assume reapplication of the intervention. • Saitz et al (2006) Saitz et al (2006) use different utility health state scores than Chisholm et al (2004) and Segal et al (2005) and therefore it is to be expected that their estimated QALY gains will be different. Saitz et al (2006) present their results in terms of ‘QALYs gained per person screened’, and this is estimated as 0.05 QALYs. If, according to Chisholm et al, it is assumed that 50% of the population are screened, the QALY gain per person screened must be factored down by 50% in order to come to an estimate of QALYs gained per population member and to be comparable to Chisholm et al’s estimates. This results in an estimated QALY gain of 0.025 per population member, which is similar to that estimated by Chisholm et al (2004). Unfortunately the analysis summarised by Saitz et al (2006) has not yet been fully presented in a publication meaning a fuller analysis
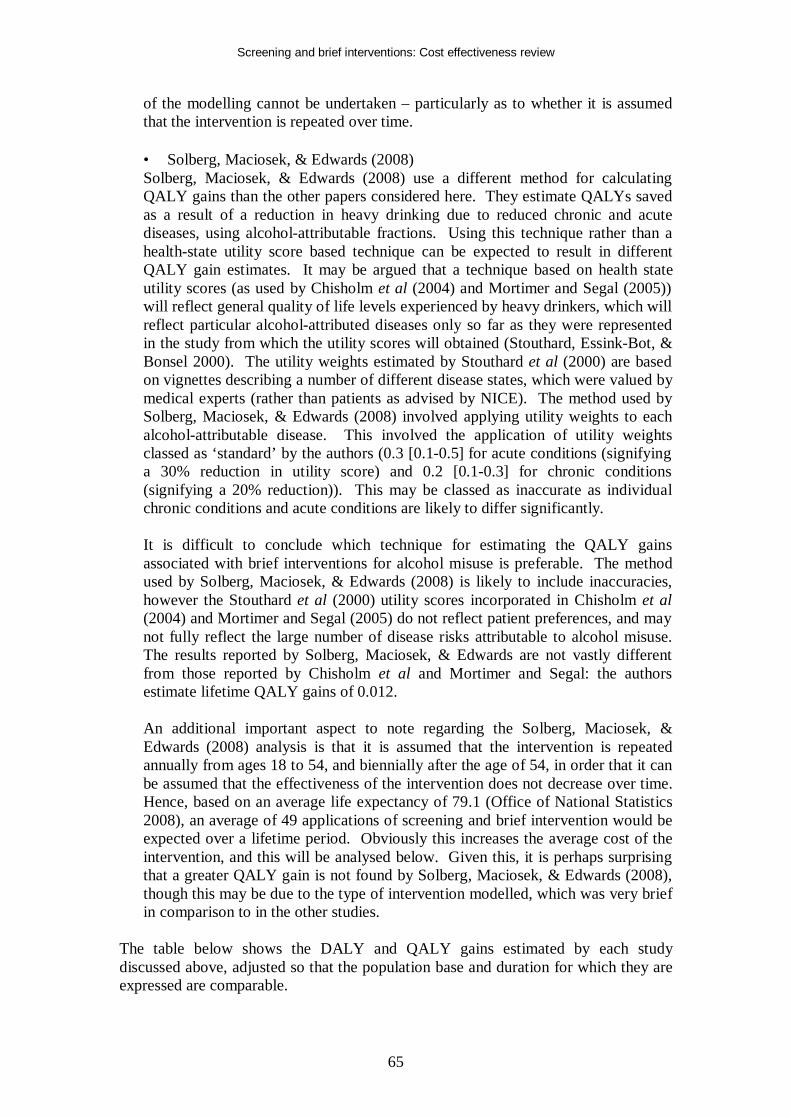
Screening and brief interventions: Cost effectiveness review
65
of the modelling cannot be undertaken – particularly as to whether it is assumed that the intervention is repeated over time. • Solberg, Maciosek, & Edwards (2008) Solberg, Maciosek, & Edwards (2008) use a different method for calculating QALY gains than the other papers considered here. They estimate QALYs saved as a result of a reduction in heavy drinking due to reduced chronic and acute diseases, using alcohol-attributable fractions. Using this technique rather than a health-state utility score based technique can be expected to result in different QALY gain estimates. It may be argued that a technique based on health state utility scores (as used by Chisholm et al (2004) and Mortimer and Segal (2005)) will reflect general quality of life levels experienced by heavy drinkers, which will reflect particular alcohol-attributed diseases only so far as they were represented in the study from which the utility scores will obtained (Stouthard, Essink-Bot, & Bonsel 2000). The utility weights estimated by Stouthard et al (2000) are based on vignettes describing a number of different disease states, which were valued by medical experts (rather than patients as advised by NICE). The method used by Solberg, Maciosek, & Edwards (2008) involved applying utility weights to each alcohol-attributable disease. This involved the application of utility weights classed as ‘standard’ by the authors (0.3 [0.1-0.5] for acute conditions (signifying a 30% reduction in utility score) and 0.2 [0.1-0.3] for chronic conditions (signifying a 20% reduction)). This may be classed as inaccurate as individual chronic conditions and acute conditions are likely to differ significantly. It is difficult to conclude which technique for estimating the QALY gains associated with brief interventions for alcohol misuse is preferable. The method used by Solberg, Maciosek, & Edwards (2008) is likely to include inaccuracies, however the Stouthard et al (2000) utility scores incorporated in Chisholm et al (2004) and Mortimer and Segal (2005) do not reflect patient preferences, and may not fully reflect the large number of disease risks attributable to alcohol misuse. The results reported by Solberg, Maciosek, & Edwards are not vastly different from those reported by Chisholm et al and Mortimer and Segal: the authors estimate lifetime QALY gains of 0.012. An additional important aspect to note regarding the Solberg, Maciosek, & Edwards (2008) analysis is that it is assumed that the intervention is repeated annually from ages 18 to 54, and biennially after the age of 54, in order that it can be assumed that the effectiveness of the intervention does not decrease over time. Hence, based on an average life expectancy of 79.1 (Office of National Statistics 2008), an average of 49 applications of screening and brief intervention would be expected over a lifetime period. Obviously this increases the average cost of the intervention, and this will be analysed below. Given this, it is perhaps surprising that a greater QALY gain is not found by Solberg, Maciosek, & Edwards (2008), though this may be due to the type of intervention modelled, which was very brief in comparison to in the other studies.
The table below shows the DALY and QALY gains estimated by each study discussed above, adjusted so that the population base and duration for which they are expressed are comparable.
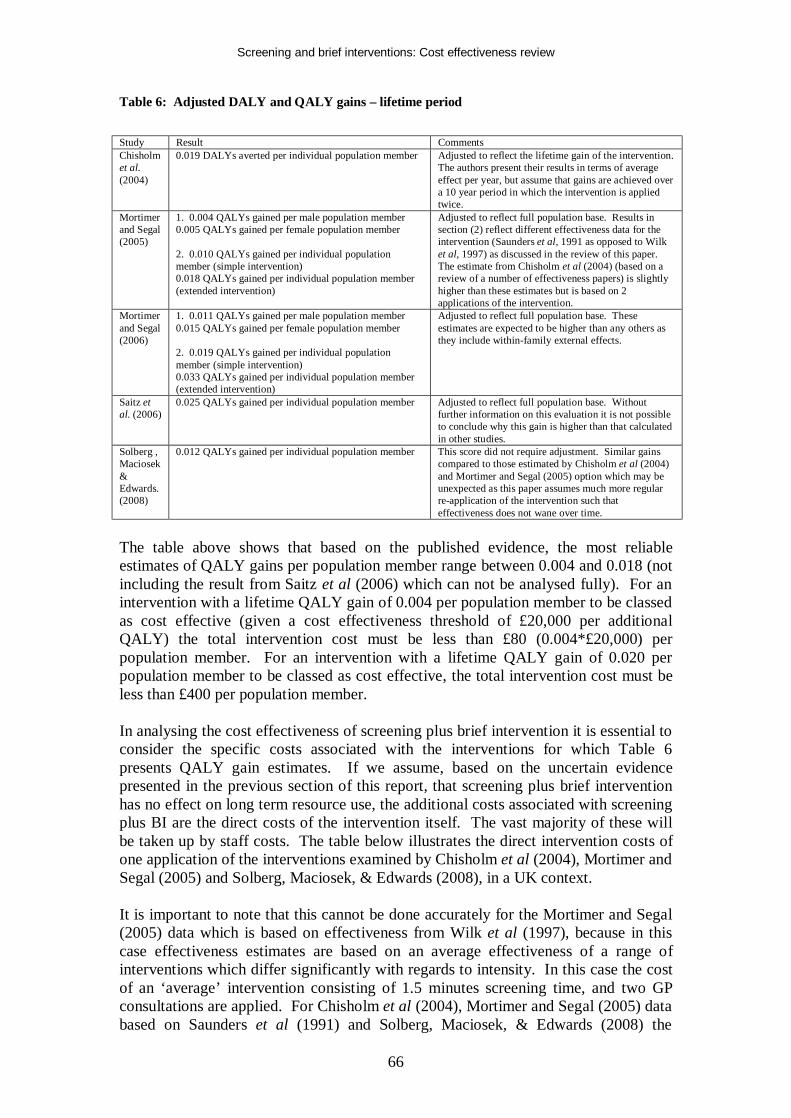
Screening and brief interventions: Cost effectiveness review
66
Table 6: Adjusted DALY and QALY gains – lifetime period
Study Result Comments Chisholm et al. (2004)
0.019 DALYs averted per individual population member Adjusted to reflect the lifetime gain of the intervention. The authors present their results in terms of average effect per year, but assume that gains are achieved over a 10 year period in which the intervention is applied twice.
Mortimer and Segal (2005)
1. 0.004 QALYs gained per male population member 0.005 QALYs gained per female population member 2. 0.010 QALYs gained per individual population member (simple intervention) 0.018 QALYs gained per individual population member (extended intervention)
Adjusted to reflect full population base. Results in section (2) reflect different effectiveness data for the intervention (Saunders et al, 1991 as opposed to Wilk et al, 1997) as discussed in the review of this paper. The estimate from Chisholm et al (2004) (based on a review of a number of effectiveness papers) is slightly higher than these estimates but is based on 2 applications of the intervention.
Mortimer and Segal (2006)
1. 0.011 QALYs gained per male population member 0.015 QALYs gained per female population member 2. 0.019 QALYs gained per individual population member (simple intervention) 0.033 QALYs gained per individual population member (extended intervention)
Adjusted to reflect full population base. These estimates are expected to be higher than any others as they include within-family external effects.
Saitz et al. (2006)
0.025 QALYs gained per individual population member Adjusted to reflect full population base. Without further information on this evaluation it is not possible to conclude why this gain is higher than that calculated in other studies.
Solberg , Maciosek & Edwards. (2008)
0.012 QALYs gained per individual population member This score did not require adjustment. Similar gains compared to those estimated by Chisholm et al (2004) and Mortimer and Segal (2005) option which may be unexpected as this paper assumes much more regular re-application of the intervention such that effectiveness does not wane over time.
The table above shows that based on the published evidence, the most reliable estimates of QALY gains per population member range between 0.004 and 0.018 (not including the result from Saitz et al (2006) which can not be analysed fully). For an intervention with a lifetime QALY gain of 0.004 per population member to be classed as cost effective (given a cost effectiveness threshold of £20,000 per additional QALY) the total intervention cost must be less than £80 (0.004*£20,000) per population member. For an intervention with a lifetime QALY gain of 0.020 per population member to be classed as cost effective, the total intervention cost must be less than £400 per population member. In analysing the cost effectiveness of screening plus brief intervention it is essential to consider the specific costs associated with the interventions for which Table 6 presents QALY gain estimates. If we assume, based on the uncertain evidence presented in the previous section of this report, that screening plus brief intervention has no effect on long term resource use, the additional costs associated with screening plus BI are the direct costs of the intervention itself. The vast majority of these will be taken up by staff costs. The table below illustrates the direct intervention costs of one application of the interventions examined by Chisholm et al (2004), Mortimer and Segal (2005) and Solberg, Maciosek, & Edwards (2008), in a UK context. It is important to note that this cannot be done accurately for the Mortimer and Segal (2005) data which is based on effectiveness from Wilk et al (1997), because in this case effectiveness estimates are based on an average effectiveness of a range of interventions which differ significantly with regards to intensity. In this case the cost of an ‘average’ intervention consisting of 1.5 minutes screening time, and two GP consultations are applied. For Chisholm et al (2004), Mortimer and Segal (2005) data based on Saunders et al (1991) and Solberg, Maciosek, & Edwards (2008) the
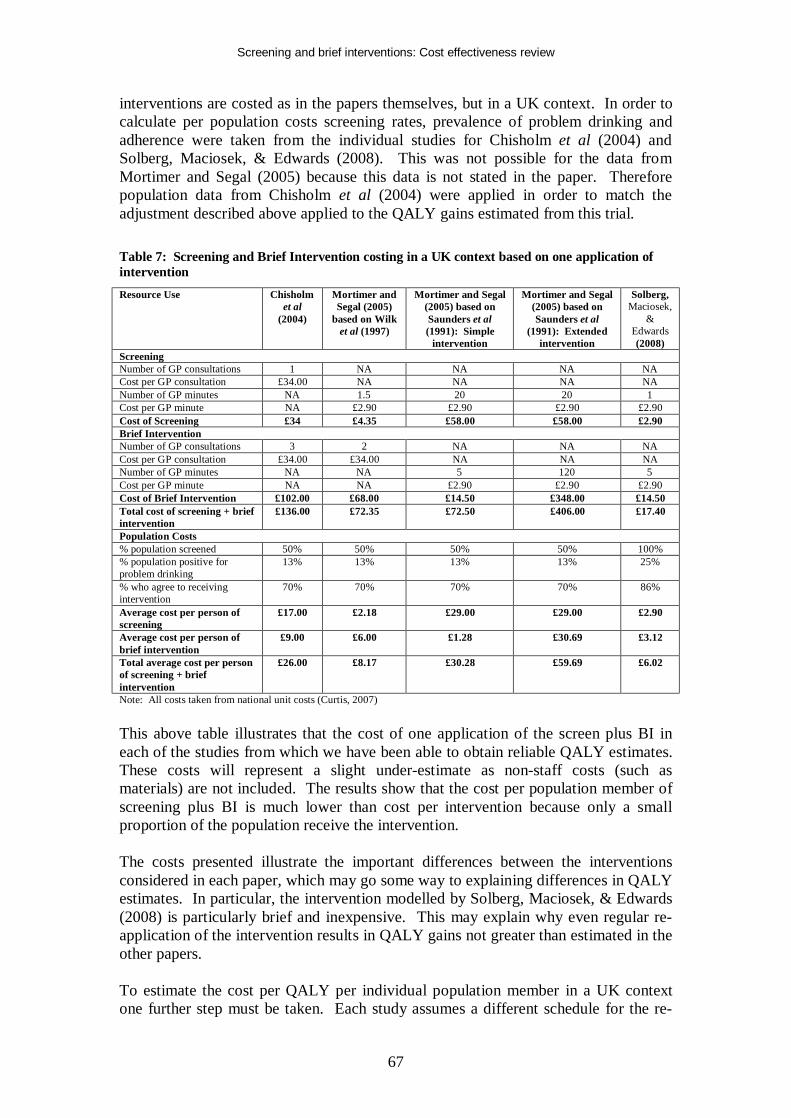
Screening and brief interventions: Cost effectiveness review
67
interventions are costed as in the papers themselves, but in a UK context. In order to calculate per population costs screening rates, prevalence of problem drinking and adherence were taken from the individual studies for Chisholm et al (2004) and Solberg, Maciosek, & Edwards (2008). This was not possible for the data from Mortimer and Segal (2005) because this data is not stated in the paper. Therefore population data from Chisholm et al (2004) were applied in order to match the adjustment described above applied to the QALY gains estimated from this trial. Table 7: Screening and Brief Intervention costing in a UK context based on one application of intervention Resource Use Chisholm
et al (2004)
Mortimer and Segal (2005)
based on Wilk et al (1997)
Mortimer and Segal (2005) based on Saunders et al (1991): Simple
intervention
Mortimer and Segal (2005) based on Saunders et al
(1991): Extended intervention
Solberg, Maciosek,
& Edwards (2008)
Screening Number of GP consultations 1 NA NA NA NA Cost per GP consultation £34.00 NA NA NA NA Number of GP minutes NA 1.5 20 20 1 Cost per GP minute NA £2.90 £2.90 £2.90 £2.90 Cost of Screening £34 £4.35 £58.00 £58.00 £2.90 Brief Intervention Number of GP consultations 3 2 NA NA NA Cost per GP consultation £34.00 £34.00 NA NA NA Number of GP minutes NA NA 5 120 5 Cost per GP minute NA NA £2.90 £2.90 £2.90 Cost of Brief Intervention £102.00 £68.00 £14.50 £348.00 £14.50 Total cost of screening + brief intervention
£136.00 £72.35 £72.50 £406.00 £17.40
Population Costs % population screened 50% 50% 50% 50% 100% % population positive for problem drinking
13% 13% 13% 13% 25%
% who agree to receiving intervention
70% 70% 70% 70% 86%
Average cost per person of screening
£17.00 £2.18 £29.00 £29.00 £2.90
Average cost per person of brief intervention
£9.00 £6.00 £1.28 £30.69 £3.12
Total average cost per person of screening + brief intervention
£26.00 £8.17 £30.28 £59.69 £6.02
Note: All costs taken from national unit costs (Curtis, 2007) This above table illustrates that the cost of one application of the screen plus BI in each of the studies from which we have been able to obtain reliable QALY estimates. These costs will represent a slight under-estimate as non-staff costs (such as materials) are not included. The results show that the cost per population member of screening plus BI is much lower than cost per intervention because only a small proportion of the population receive the intervention. The costs presented illustrate the important differences between the interventions considered in each paper, which may go some way to explaining differences in QALY estimates. In particular, the intervention modelled by Solberg, Maciosek, & Edwards (2008) is particularly brief and inexpensive. This may explain why even regular re-application of the intervention results in QALY gains not greater than estimated in the other papers. To estimate the cost per QALY per individual population member in a UK context one further step must be taken. Each study assumes a different schedule for the re-
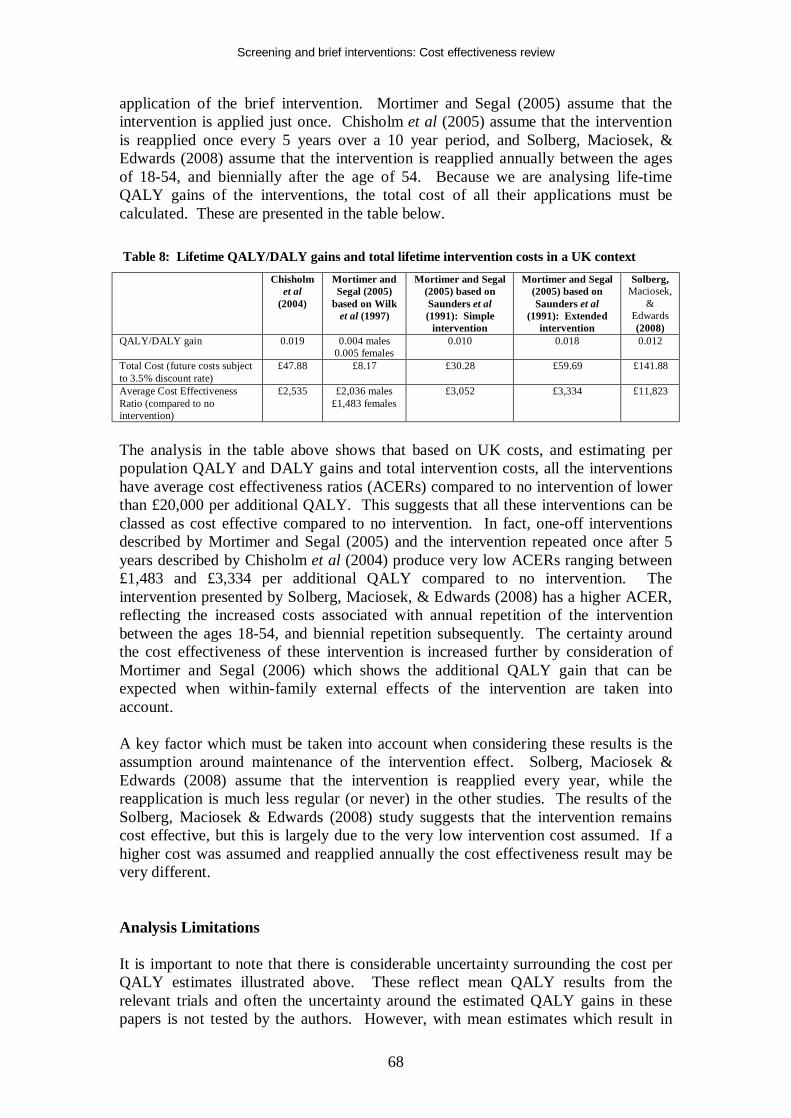
Screening and brief interventions: Cost effectiveness review
68
application of the brief intervention. Mortimer and Segal (2005) assume that the intervention is applied just once. Chisholm et al (2005) assume that the intervention is reapplied once every 5 years over a 10 year period, and Solberg, Maciosek, & Edwards (2008) assume that the intervention is reapplied annually between the ages of 18-54, and biennially after the age of 54. Because we are analysing life-time QALY gains of the interventions, the total cost of all their applications must be calculated. These are presented in the table below. Table 8: Lifetime QALY/DALY gains and total lifetime intervention costs in a UK context Chisholm
et al (2004)
Mortimer and Segal (2005)
based on Wilk et al (1997)
Mortimer and Segal (2005) based on Saunders et al (1991): Simple
intervention
Mortimer and Segal (2005) based on Saunders et al
(1991): Extended intervention
Solberg, Maciosek,
& Edwards (2008)
QALY/DALY gain 0.019 0.004 males 0.005 females
0.010
0.018 0.012
Total Cost (future costs subject to 3.5% discount rate)
£47.88 £8.17 £30.28 £59.69 £141.88
Average Cost Effectiveness Ratio (compared to no intervention)
£2,535 £2,036 males £1,483 females
£3,052 £3,334 £11,823
The analysis in the table above shows that based on UK costs, and estimating per population QALY and DALY gains and total intervention costs, all the interventions have average cost effectiveness ratios (ACERs) compared to no intervention of lower than £20,000 per additional QALY. This suggests that all these interventions can be classed as cost effective compared to no intervention. In fact, one-off interventions described by Mortimer and Segal (2005) and the intervention repeated once after 5 years described by Chisholm et al (2004) produce very low ACERs ranging between £1,483 and £3,334 per additional QALY compared to no intervention. The intervention presented by Solberg, Maciosek, & Edwards (2008) has a higher ACER, reflecting the increased costs associated with annual repetition of the intervention between the ages 18-54, and biennial repetition subsequently. The certainty around the cost effectiveness of these intervention is increased further by consideration of Mortimer and Segal (2006) which shows the additional QALY gain that can be expected when within-family external effects of the intervention are taken into account. A key factor which must be taken into account when considering these results is the assumption around maintenance of the intervention effect. Solberg, Maciosek & Edwards (2008) assume that the intervention is reapplied every year, while the reapplication is much less regular (or never) in the other studies. The results of the Solberg, Maciosek & Edwards (2008) study suggests that the intervention remains cost effective, but this is largely due to the very low intervention cost assumed. If a higher cost was assumed and reapplied annually the cost effectiveness result may be very different. Analysis Limitations It is important to note that there is considerable uncertainty surrounding the cost per QALY estimates illustrated above. These reflect mean QALY results from the relevant trials and often the uncertainty around the estimated QALY gains in these papers is not tested by the authors. However, with mean estimates which result in
Screening and brief interventions: Cost effectiveness review
69
ICERs which are very low in comparison to cost effectiveness thresholds, it is unlikely that this uncertainty would alter conclusions from a decision-making perspective. Additionally, although the analysis shows the probable cost effectiveness of the interventions considered, a key limitation is that – with the exception of the Mortimer and Segal (2005) results based on data from Saunders et al (1991) – all of the analyses use effectiveness estimates based on reviews of a number of different brief interventions. This is true for the analyses by Mortimer and Segal (2005) which is based on data from Wilk et al (1997), as well as the analyses by Chisholm et al (2004) and Solberg, Maciosek, & Edwards (2008). Because of this, it is not possible to be confident over whether the costs estimated for the intervention have been calculated in such a way that accurately reflects the mix of interventions which contributed to the efficacy estimate. It is important to note that this analysis is designed to present a simple assessment of whether screening + BI is likely to be cost effective in the UK setting, based on existing cost utility studies. Therefore as far as possible costs have been estimated for the ‘average’ intervention included within each paper. The clinical review has concluded that there is inconclusive evidence as to whether added duration or intensity of brief interventions adds effect. The analysis presented here estimates different QALY gains for different interventions, but this is to be expected given the different clinical data and modelling methods used, and so this analysis does not aim to suggest that one type of intervention is more cost effective than another. Rather, it serves to illustrate that a given screening + BI intervention is likely to be cost effective. Based on the clinical review, it is likely that very brief interventions are likely to be more cost effective than extended brief interventions. Finally, the synthesised nature of the effectiveness evidence used in the economic evaluations here means that it is not possible to unpick specific cost effectiveness results for specific patient groups. Mortimer and Segal (2005) suggest that it may be marginally more cost effective to provide screening and brief intervention for females rather than males – however the analysis shows that intervention is cost effective for both groups. Analysis Conclusion The above analysis analyses the papers deemed to be most helpful to decision makers regarding the cost effectiveness of screening and brief interventions in a more detailed manner than would result from a standard review of the papers. From a UK decision making context the papers that can be most helpful are those that analyse the long term net cost impact of screening plus brief interventions, and those that estimate QALY gains. Upon further analysis it can only be concluded that although a number of studies do show that screening plus brief intervention may result in cost savings, it is not possible to conclude with confidence whether the net impact on future health and other resource use is positive or negative. The evidence is too uncertain to conclude whether the intervention will result in either net savings or net costs. Further analysis of the likely QALY gain associated with screening and brief interventions shows that the per individual population member gain is likely to be
Screening and brief interventions: Cost effectiveness review
70
small. However due to the low costs of the interventions they are likely to be cost effective based on a cost effectiveness threshold of £20,000 per additional QALY. Because of the synthesised evidence used in the economic evaluations analysed here, it is not possible to conduct an accurate incremental cost effectiveness analysis of alternative interventions. The uncertainties that remain even after conducting this further analysis are important. These are addressed further by additional economic modelling that takes a UK perspective that is presented in a separate report. Evidence Statement e6.3: Several studies of varying quality provide evidence on the likely future resource impact associated with brief interventions (Dillie et al. 2005; Fleming et al. 2000; Fleming et al. 2002; Freeborn et al. 2000; Gentilello et al. 2005; Lock et al. 2006; Mundt et al. 2005; Ryder 2000; Solberg, Maciosek, & Edwards 2008). These studies do not allow firm conclusions to be made regarding the net cost impact of brief interventions. The evidence is uncertain as to whether screening plus brief intervention for alcohol misuse will result in either net costs or savings. Gentilello et al. (2005) Study quality + Ryder (2000) Study quality – Lock et al. (2006) Study quality + Fleming et al. (2000) Study quality + Fleming et al. (2002) Study quality + Dillie et al. (2005) Study quality + Mundt et al. (2005) Study quality + Freeborn et al. (2000) Study quality – Solberg, Maciosek, & Edwards (2008) Study quality + Applicability: The majority (6) of the studies are set in US primary care. One study is set in UK primary care, 1 in an Australian hospital setting, and 1 in US emergency care. Caution should be taken in extrapolating US resource use effect data to the UK, but given the content of this recommendation the applicability of the recommendation to the UK is unaltered. Evidence Statement e6.4: Four fully reported studies of moderate quality (study quality +) provide evidence on the likely Quality Adjusted Life Year (QALY) gain associated with screening plus brief intervention for alcohol misuse (Chisholm et al. 2004; Mortimer and Segal 2005; Mortimer and Segal 2006; Solberg, Maciosek, & Edwards 2008). These studies estimate that the lifetime QALY gain per individual population member due to screening plus brief intervention is likely to be in the region of 0.004 – 0.019 compared to no intervention, depending on the exact intervention and if it is repeated over time. Further evidence suggests that this could be higher if within-family external quality of life effects are included in the analysis (Mortimer and Segal 2006) (study quality +). An analysis of the likely costs of screening plus brief intervention in a UK context shows that interventions that bring such gains will be cost effective based on a cost effectiveness threshold of £20,000 per additional QALY. However the economic evidence does not allow a specific brief intervention which delivers these effect sizes to be outlined due to effect size evidence synthesis within economic studies. Based on the clinical review, it is most likely that very brief interventions are likely to be most cost effective, given the
Screening and brief interventions: Cost effectiveness review
71
inconclusive evidence of increased effect with increased duration and/or intensity of the intervention. The existing economic evidence does not allow conclusions to be made regarding the relative cost effectiveness of offering screening and brief intervention to specific population groups. Chisholm et al. (2004) Study quality + Mortimer and Segal (2005) Study quality + Mortimer and Segal (2006) Study quality + Solberg, Maciosek, & Edwards (2008) Study quality + Applicability: The evidence is taken from 1 study applied to Europe Region A with a primary care setting, 1 US primary care study and 2 primary care based Australian studies. It is difficult to apply these results directly to the UK primarily due to costing issues. However additional analysis has allowed more confidence over the application of these results to the UK.
Screening and brief interventions: Cost effectiveness review
72
REPORT CONCLUSION This review shows that the existing economic evidence relating to screening and brief intervention for alcohol misuse – supplemented by further analysis of key papers – allows a conclusion that in primary care screening plus brief intervention is likely to be cost effective. Sufficient evidence does not exist to make the same conclusion based on a hospital inpatient or outpatient, or an emergency care setting, although evidence is suggestive that this may be the case when screening is conducted in the emergency care setting (Barrett, Byford, Crawford et al 2006). Similarly, there is not sufficient robust evidence to conclude that brief interventions are cost saving in primary care, due to important uncertainties regarding important cost drivers which are not dealt with sufficiently within the evidence-base. Additionally, the economics literature does not allow firm conclusions to be drawn as to the most cost effective types of brief intervention. The literature suggests that the AUDIT questionnaire is likely to be the most cost effective screening technique, but a cost effectiveness comparison of the full AUDIT and reduced versions has not been undertaken. Due to synthesised effect sizes from clinical papers which consider many different types of brief interventions within economic evaluations included in this review it is not clear which types of brief interventions are most cost effective. The clinical review suggests that there is inconclusive evidence that increasing the duration or intensity of brief interventions increases effectiveness, and therefore it may be concluded that very brief interventions are likely to be more cost effective than extended interventions. The synthesised effect sizes contained within the key economic evaluations also means that conclusions cannot be drawn regarding the relative cost effectiveness of screening different patient groups. Mortimer and Segal (2005) suggest that screening females is marginally more cost effective than screening males – although screening both groups is cost effective. Data from Mundt et al (2005) suggests that it may be less cost effective to offer screening and brief intervention to older people (aged over 65) compared to people aged under 65. This is primarily due to lower resource use impacts in these patients – however our further analysis shows that screening plus brief intervention is likely to be cost effective even assuming zero long term resource use impacts. Also, despite not finding any significant resource use effects, Mundt et al (2005) did find significant consumption effects which would be expected to lead to QALY gains. Hence Mundt et al (2005) do not present evidence that it is not cost effective to offer screening and brief intervention to older people. The conclusions of this report are in line with those of previous reviews of the cost effectiveness literature. Anderson and Baumberg (2006) found that brief interventions provided quality of life gains at little cost (Anderson & Baumberg 2006). Ludbrook et al (2001 and 2004) acknowledge that few papers can be found in the area which can be classed as full economic evaluations, and that caution must be taken with applying resource impacts found in predominantly US studies to the UK (with reference to Scotland) (Ludbrook et al. 2001; Ludbrook 2004). However, similar to this review, Ludbrook et al conduct further analysis in a Scottish context and conclude that brief interventions are cost effective with very low cost effectiveness ratios (similar to those found in the further analysis presented here).

Screening and brief interventions: Cost effectiveness review
73
Ludbrook et al state that if potential future resource use savings are taken into account interventions may be cost saving. None of these previous reviews have made conclusions based on specific interventions or population groups, and indeed Ludbrook et al (2001 and 2004) state that further research into specific interventions is required in order to test their relative cost effectiveness. It is therefore not surprising that this review has come to similar conclusions.
Screening and brief interventions: Cost effectiveness review
74
EVIDENCE STATEMENTS Emergency Care Evidence Statement e6.1: Cost effectiveness evidence for screening and brief interventions in the Emergency Care setting is scarce. The available evidence does not allow firm conclusions regarding the long-term cost effectiveness of these interventions in a UK setting to be made. However, the evidence does suggest that brief interventions in the Emergency Care setting may be cost effective in the UK. One Study suggests that screening plus brief intervention may produce long term cost savings (Gentilello et al, 2005) (study quality +), but the applicability of this evidence to the UK is uncertain. One UK study suggests that a brief intervention administered by alcohol health workers in a hospital setting will reduce consumption in the short term without significantly increasing costs, but long term evidence is lacking (Barrett, Byford, Crawford et al, 2006) (study quality ++). Gentilello et al. (2005) Study quality + Barrett, Byford, Crawford et al. (2006) Study quality ++ Applicability: 1 US study provides evidence on total costs of a screening plus brief intervention program. However the results are based on limited future resource use data from one US trial. The applicability of this data to the UK is therefore uncertain. 1 UK study provides evidence from a UK setting. However, this evidence is based upon an intervention administered by alcohol health workers within a hospital setting and so may not be generalisable to hospitals who do not employ alcohol health workers.
Hospital Inpatients and Outpatients Evidence Statement e6.2: Cost effectiveness evidence for screening and brief interventions in the hospital setting is scarce. The available evidence does not allow conclusions regarding the cost effectiveness of these interventions in a UK setting to be made. A UK study presents evidence for screening by doctors and nurses in a general hospital setting (Tolley & Rowland 1991) (study quality +), but this does not allow a conclusion to be reached regarding the most cost effective screening method. One Study suggests that screening plus brief intervention may produce long term cost savings (Ryder 2000) (study quality -), but the reliability of this evidence is low due to the uncertainty in resource use estimates. Ryder (2000) Study quality - Tolley and Rowland (1991) Study quality + Applicability: One Australian study provides evidence on total costs of a screening plus brief intervention program. However the results are highly uncertain due to being based on very limited future resource use data from one UK trial. The reliability of results based on this data is therefore low. Primary Care Evidence Statement e5.1: One study shows that the alcohol use disorders identification test (AUDIT) is a more cost effective screening tool than measures of y-
Screening and brief interventions: Cost effectiveness review
75
glutamyltransferase, aspartate aminotransferase, per cent carbohydrate deficient transferrin, and ethrocyte mean cell volume (Coulton et al. 2006) because AUDIT is both cheaper and more effective than these other tests (study quality +). The evidence does not allow a ranking of the cost effectiveness of these other screening methods. Coulton et al. (2006) Study quality + Applicability: UK study applicable to primary care. Evidence Statement e6.3: Several studies of varying quality provide evidence on the likely future resource impact associated with brief interventions (Dillie et al. 2005; Fleming et al. 2000; Fleming et al. 2002; Freeborn et al. 2000; Gentilello et al. 2005; Lock et al. 2006; Mundt et al. 2005; Ryder 2000; Solberg, Maciosek, & Edwards 2008). These studies do not allow firm conclusions to be made regarding the net cost impact of brief interventions. The evidence is uncertain as to whether screening plus brief intervention for alcohol misuse will result in either net costs or savings. Gentilello et al. (2005) Study quality + Ryder (2000) Study quality – Lock et al. (2006) Study quality + Fleming et al. (2000) Study quality + Fleming et al. (2002) Study quality + Dillie et al. (2005) Study quality + Mundt et al. (2005) Study quality + Freeborn et al. (2000) Study quality – Solberg, Maciosek, & Edwards (2008) Study quality + Applicability: The majority (6) of the studies are set in US primary care. One study is set in UK primary care, 1 in an Australian hospital setting, and 1 in US emergency care. Caution should be taken in extrapolating US resource use effect data to the UK, but given the content of this recommendation the applicability of the recommendation to the UK is unaltered. Evidence Statement e6.4: Four fully reported studies of moderate quality (study quality +) provide evidence on the likely Quality Adjusted Life Year (QALY) gain associated with screening plus brief intervention for alcohol misuse (Chisholm et al. 2004; Mortimer and Segal 2005; Mortimer and Segal 2006; Solberg, Maciosek, & Edwards 2008). These studies estimate that the lifetime QALY gain per individual population member due to screening plus brief intervention is likely to be in the region of 0.004 – 0.019 compared to no intervention, depending on the exact intervention and if it is repeated over time. Further evidence suggests that this could be higher if within-family external quality of life effects are included in the analysis (Mortimer and Segal 2006) (study quality +). An analysis of the likely costs of screening plus brief intervention in a UK context shows that interventions that bring such gains will be cost effective based on a cost effectiveness threshold of £20,000 per additional QALY. However the economic evidence does not allow a specific brief intervention which delivers these effect sizes to be outlined due to effect size evidence synthesis within economic studies. Based on the clinical review, it is most likely that very brief interventions are likely to be most cost effective, given the inconclusive evidence of increased effect with increased duration and/or intensity of the intervention. The existing economic evidence does not allow conclusions to be

Screening and brief interventions: Cost effectiveness review
76
made regarding the relative cost effectiveness of offering screening and brief intervention to specific population groups. Chisholm et al. (2004) Study quality + Mortimer and Segal (2005) Study quality + Mortimer and Segal (2006) Study quality + Solberg, Maciosek, & Edwards (2008) Study quality + Applicability: The evidence is taken from 1 study applied to Europe Region A with a primary care setting, 1 US primary care study and 2 primary care based Australian studies. It is difficult to apply these results directly to the UK primarily due to costing issues. However additional analysis has allowed more confidence over the application of these results to the UK.
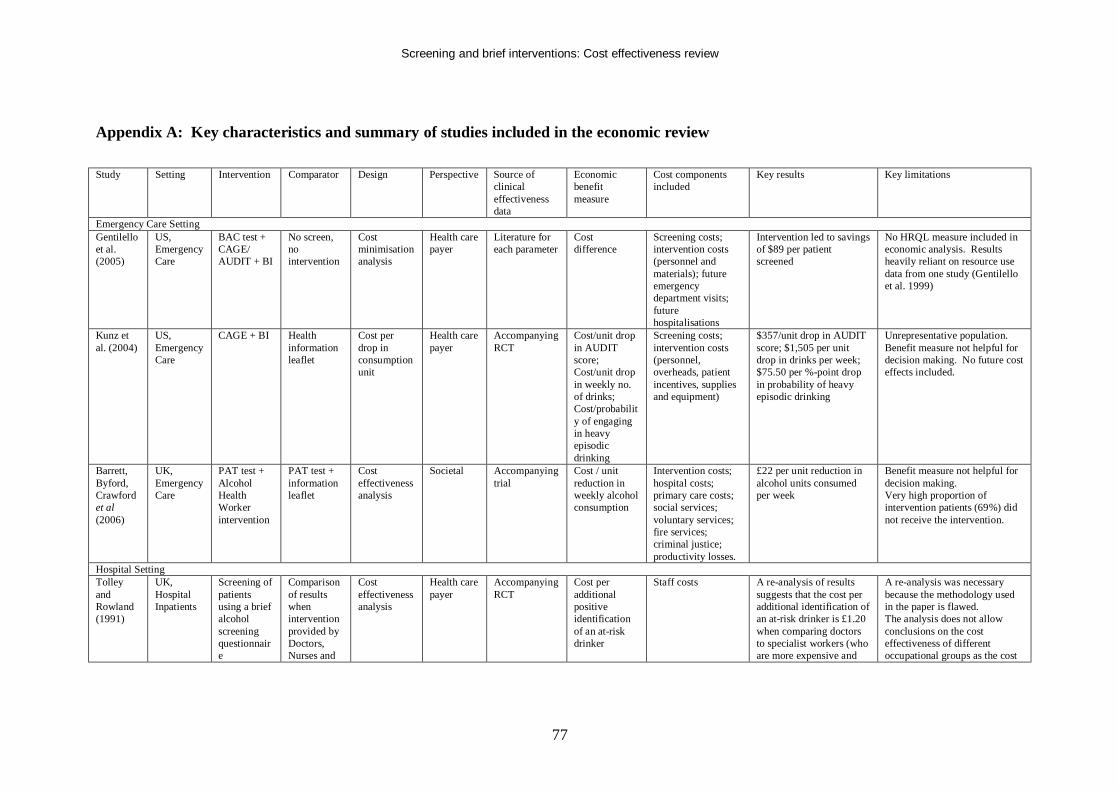
Screening and brief interventions: Cost effectiveness review
77
Appendix A: Key characteristics and summary of studies included in the economic review Study Setting Intervention Comparator Design Perspective Source of
clinical effectiveness data
Economic benefit measure
Cost components included
Key results Key limitations
Emergency Care Setting Gentilello et al. (2005)
US, Emergency Care
BAC test + CAGE/ AUDIT + BI
No screen, no intervention
Cost minimisation analysis
Health care payer
Literature for each parameter
Cost difference
Screening costs; intervention costs (personnel and materials); future emergency department visits; future hospitalisations
Intervention led to savings of $89 per patient screened
No HRQL measure included in economic analysis. Results heavily reliant on resource use data from one study (Gentilello et al. 1999)
Kunz et al. (2004)
US, Emergency Care
CAGE + BI Health information leaflet
Cost per drop in consumption unit
Health care payer
Accompanying RCT
Cost/unit drop in AUDIT score; Cost/unit drop in weekly no. of drinks; Cost/probability of engaging in heavy episodic drinking
Screening costs; intervention costs (personnel, overheads, patient incentives, supplies and equipment)
$357/unit drop in AUDIT score; $1,505 per unit drop in drinks per week; $75.50 per %-point drop in probability of heavy episodic drinking
Unrepresentative population. Benefit measure not helpful for decision making. No future cost effects included.
Barrett, Byford, Crawford et al (2006)
UK, Emergency Care
PAT test + Alcohol Health Worker intervention
PAT test + information leaflet
Cost effectiveness analysis
Societal Accompanying trial
Cost / unit reduction in weekly alcohol consumption
Intervention costs; hospital costs; primary care costs; social services; voluntary services; fire services; criminal justice; productivity losses.
£22 per unit reduction in alcohol units consumed per week
Benefit measure not helpful for decision making. Very high proportion of intervention patients (69%) did not receive the intervention.
Hospital Setting Tolley and Rowland (1991)
UK, Hospital Inpatients
Screening of patients using a brief alcohol screening questionnaire
Comparison of results when intervention provided by Doctors, Nurses and
Cost effectiveness analysis
Health care payer
Accompanying RCT
Cost per additional positive identification of an at-risk drinker
Staff costs A re-analysis of results suggests that the cost per additional identification of an at-risk drinker is £1.20 when comparing doctors to specialist workers (who are more expensive and
A re-analysis was necessary because the methodology used in the paper is flawed. The analysis does not allow conclusions on the cost effectiveness of different occupational groups as the cost
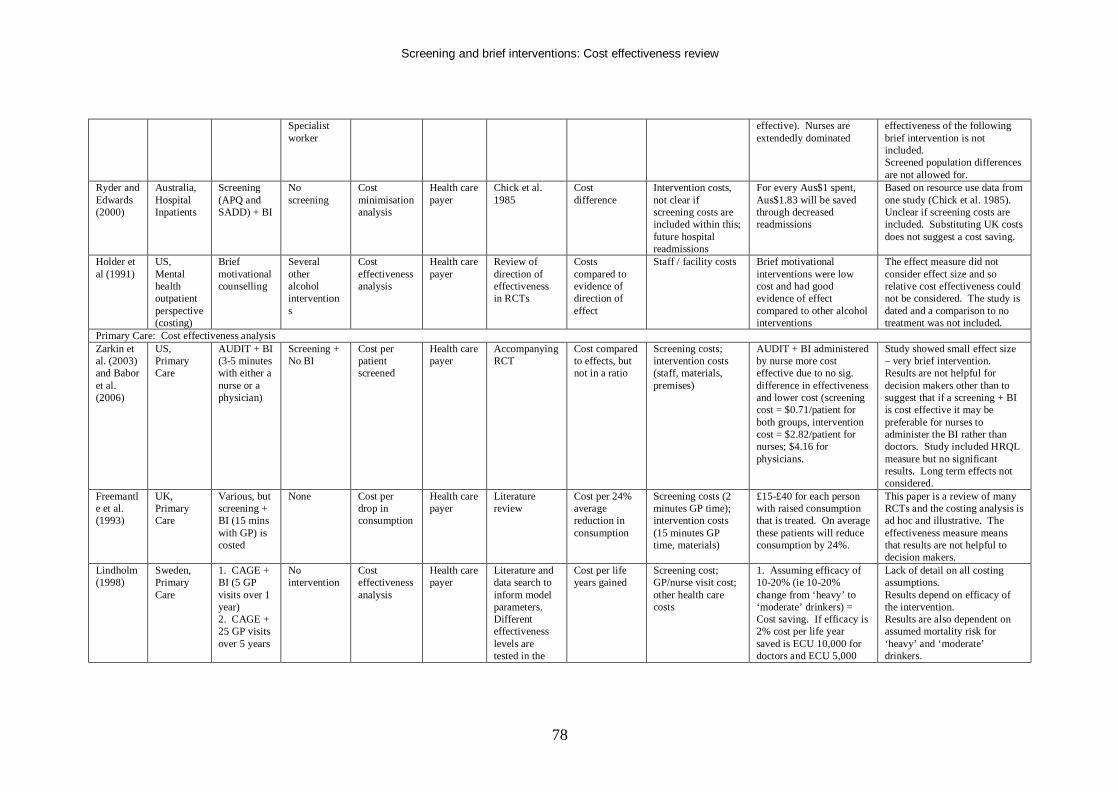
Screening and brief interventions: Cost effectiveness review
78
Specialist worker
effective). Nurses are extendedly dominated
effectiveness of the following brief intervention is not included. Screened population differences are not allowed for.
Ryder and Edwards (2000)
Australia, Hospital Inpatients
Screening (APQ and SADD) + BI
No screening
Cost minimisation analysis
Health care payer
Chick et al. 1985
Cost difference
Intervention costs, not clear if screening costs are included within this; future hospital readmissions
For every Aus$1 spent, Aus$1.83 will be saved through decreased readmissions
Based on resource use data from one study (Chick et al. 1985). Unclear if screening costs are included. Substituting UK costs does not suggest a cost saving.
Holder et al (1991)
US, Mental health outpatient perspective (costing)
Brief motivational counselling
Several other alcohol interventions
Cost effectiveness analysis
Health care payer
Review of direction of effectiveness in RCTs
Costs compared to evidence of direction of effect
Staff / facility costs Brief motivational interventions were low cost and had good evidence of effect compared to other alcohol interventions
The effect measure did not consider effect size and so relative cost effectiveness could not be considered. The study is dated and a comparison to no treatment was not included.
Primary Care: Cost effectiveness analysis Zarkin et al. (2003) and Babor et al. (2006)
US, Primary Care
AUDIT + BI (3-5 minutes with either a nurse or a physician)
Screening + No BI
Cost per patient screened
Health care payer
Accompanying RCT
Cost compared to effects, but not in a ratio
Screening costs; intervention costs (staff, materials, premises)
AUDIT + BI administered by nurse more cost effective due to no sig. difference in effectiveness and lower cost (screening cost = $0.71/patient for both groups, intervention cost = $2.82/patient for nurses; $4.16 for physicians.
Study showed small effect size – very brief intervention. Results are not helpful for decision makers other than to suggest that if a screening + BI is cost effective it may be preferable for nurses to administer the BI rather than doctors. Study included HRQL measure but no significant results. Long term effects not considered.
Freemantle et al. (1993)
UK, Primary Care
Various, but screening + BI (15 mins with GP) is costed
None Cost per drop in consumption
Health care payer
Literature review
Cost per 24% average reduction in consumption
Screening costs (2 minutes GP time); intervention costs (15 minutes GP time, materials)
£15-£40 for each person with raised consumption that is treated. On average these patients will reduce consumption by 24%.
This paper is a review of many RCTs and the costing analysis is ad hoc and illustrative. The effectiveness measure means that results are not helpful to decision makers.
Lindholm (1998)
Sweden, Primary Care
1. CAGE + BI (5 GP visits over 1 year) 2. CAGE + 25 GP visits over 5 years
No intervention
Cost effectiveness analysis
Health care payer
Literature and data search to inform model parameters. Different effectiveness levels are tested in the
Cost per life years gained
Screening cost; GP/nurse visit cost; other health care costs
1. Assuming efficacy of 10-20% (ie 10-20% change from ‘heavy’ to ‘moderate’ drinkers) = Cost saving. If efficacy is 2% cost per life year saved is ECU 10,000 for doctors and ECU 5,000
Lack of detail on all costing assumptions. Results depend on efficacy of the intervention. Results are also dependent on assumed mortality risk for ‘heavy’ and ‘moderate’ drinkers.
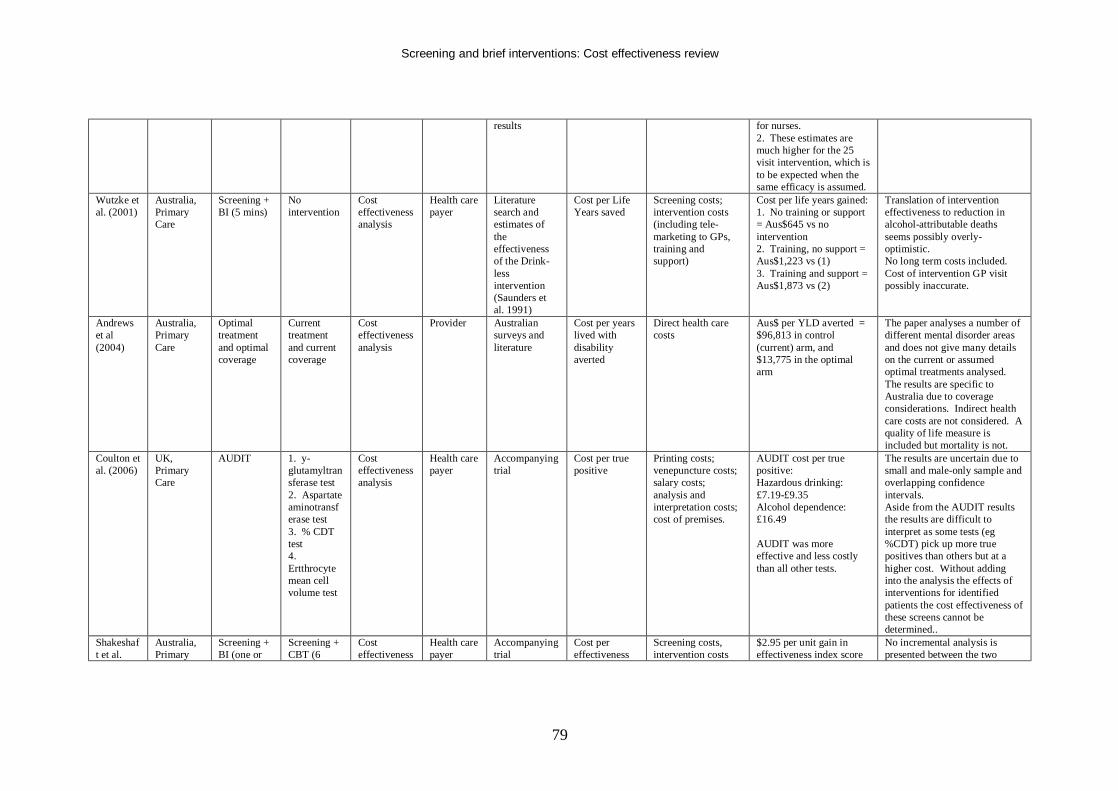
Screening and brief interventions: Cost effectiveness review
79
results for nurses. 2. These estimates are much higher for the 25 visit intervention, which is to be expected when the same efficacy is assumed.
Wutzke et al. (2001)
Australia, Primary Care
Screening + BI (5 mins)
No intervention
Cost effectiveness analysis
Health care payer
Literature search and estimates of the effectiveness of the Drink-less intervention (Saunders et al. 1991)
Cost per Life Years saved
Screening costs; intervention costs (including tele-marketing to GPs, training and support)
Cost per life years gained: 1. No training or support = Aus$645 vs no intervention 2. Training, no support = Aus$1,223 vs (1) 3. Training and support = Aus$1,873 vs (2)
Translation of intervention effectiveness to reduction in alcohol-attributable deaths seems possibly overly-optimistic. No long term costs included. Cost of intervention GP visit possibly inaccurate.
Andrews et al (2004)
Australia, Primary Care
Optimal treatment and optimal coverage
Current treatment and current coverage
Cost effectiveness analysis
Provider Australian surveys and literature
Cost per years lived with disability averted
Direct health care costs
Aus$ per YLD averted = $96,813 in control (current) arm, and $13,775 in the optimal arm
The paper analyses a number of different mental disorder areas and does not give many details on the current or assumed optimal treatments analysed. The results are specific to Australia due to coverage considerations. Indirect health care costs are not considered. A quality of life measure is included but mortality is not.
Coulton et al. (2006)
UK, Primary Care
AUDIT 1. y-glutamyltransferase test 2. Aspartate aminotransferase test 3. % CDT test 4. Ertthrocyte mean cell volume test
Cost effectiveness analysis
Health care payer
Accompanying trial
Cost per true positive
Printing costs; venepuncture costs; salary costs; analysis and interpretation costs; cost of premises.
AUDIT cost per true positive: Hazardous drinking: £7.19-£9.35 Alcohol dependence: £16.49 AUDIT was more effective and less costly than all other tests.
The results are uncertain due to small and male-only sample and overlapping confidence intervals. Aside from the AUDIT results the results are difficult to interpret as some tests (eg %CDT) pick up more true positives than others but at a higher cost. Without adding into the analysis the effects of interventions for identified patients the cost effectiveness of these screens cannot be determined..
Shakeshaft et al.
Australia, Primary
Screening + BI (one or
Screening + CBT (6
Cost effectiveness
Health care payer
Accompanying trial
Cost per effectiveness
Screening costs, intervention costs
$2.95 per unit gain in effectiveness index score
No incremental analysis is presented between the two
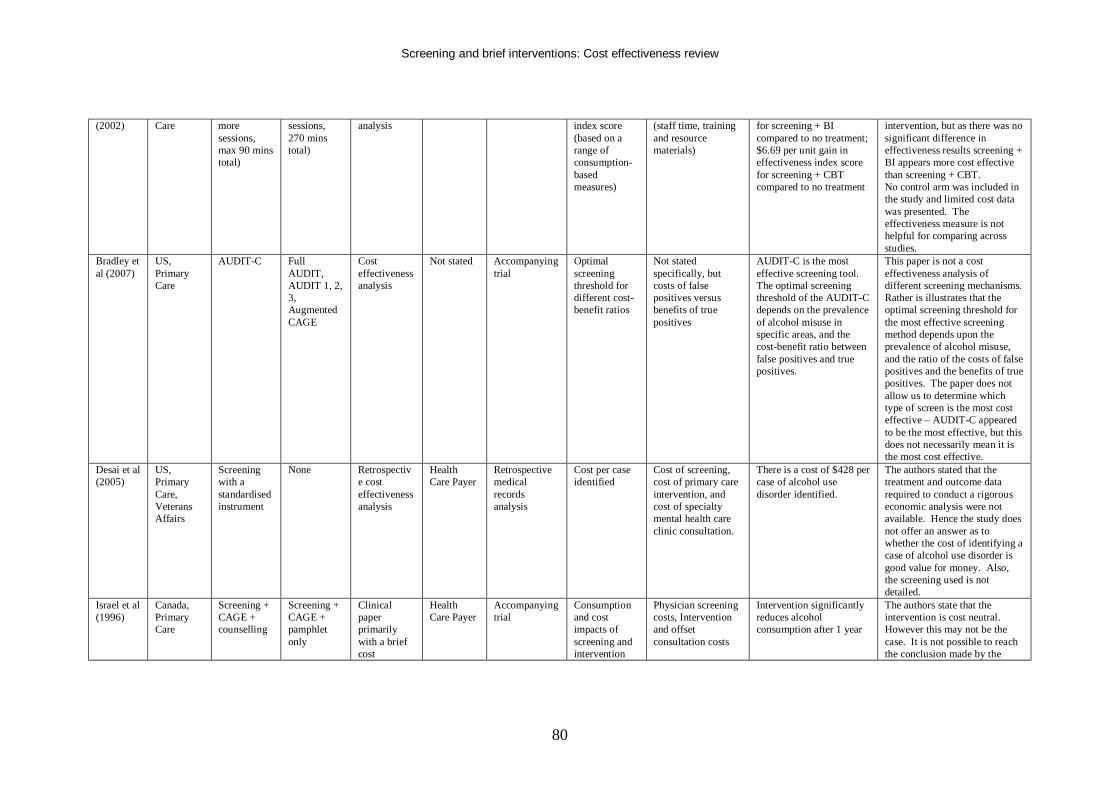
Screening and brief interventions: Cost effectiveness review
80
(2002) Care more sessions, max 90 mins total)
sessions, 270 mins total)
analysis index score (based on a range of consumption-based measures)
(staff time, training and resource materials)
for screening + BI compared to no treatment; $6.69 per unit gain in effectiveness index score for screening + CBT compared to no treatment
intervention, but as there was no significant difference in effectiveness results screening + BI appears more cost effective than screening + CBT. No control arm was included in the study and limited cost data was presented. The effectiveness measure is not helpful for comparing across studies.
Bradley et al (2007)
US, Primary Care
AUDIT-C Full AUDIT, AUDIT 1, 2, 3, Augmented CAGE
Cost effectiveness analysis
Not stated Accompanying trial
Optimal screening threshold for different cost-benefit ratios
Not stated specifically, but costs of false positives versus benefits of true positives
AUDIT-C is the most effective screening tool. The optimal screening threshold of the AUDIT-C depends on the prevalence of alcohol misuse in specific areas, and the cost-benefit ratio between false positives and true positives.
This paper is not a cost effectiveness analysis of different screening mechanisms. Rather is illustrates that the optimal screening threshold for the most effective screening method depends upon the prevalence of alcohol misuse, and the ratio of the costs of false positives and the benefits of true positives. The paper does not allow us to determine which type of screen is the most cost effective – AUDIT-C appeared to be the most effective, but this does not necessarily mean it is the most cost effective.
Desai et al (2005)
US, Primary Care, Veterans Affairs
Screening with a standardised instrument
None Retrospective cost effectiveness analysis
Health Care Payer
Retrospective medical records analysis
Cost per case identified
Cost of screening, cost of primary care intervention, and cost of specialty mental health care clinic consultation.
There is a cost of $428 per case of alcohol use disorder identified.
The authors stated that the treatment and outcome data required to conduct a rigorous economic analysis were not available. Hence the study does not offer an answer as to whether the cost of identifying a case of alcohol use disorder is good value for money. Also, the screening used is not detailed.
Israel et al (1996)
Canada, Primary Care
Screening + CAGE + counselling
Screening + CAGE + pamphlet only
Clinical paper primarily with a brief cost
Health Care Payer
Accompanying trial
Consumption and cost impacts of screening and intervention
Physician screening costs, Intervention and offset consultation costs
Intervention significantly reduces alcohol consumption after 1 year
The authors state that the intervention is cost neutral. However this may not be the case. It is not possible to reach the conclusion made by the
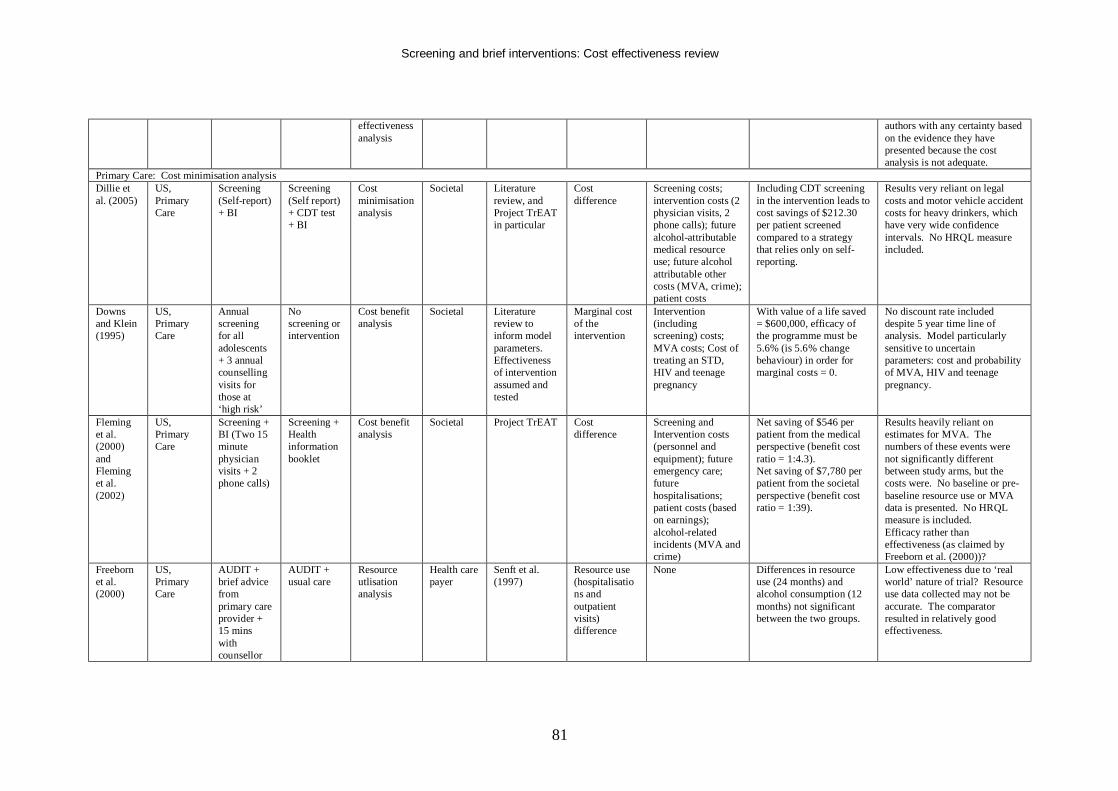
Screening and brief interventions: Cost effectiveness review
81
effectiveness analysis
authors with any certainty based on the evidence they have presented because the cost analysis is not adequate.
Primary Care: Cost minimisation analysis Dillie et al. (2005)
US, Primary Care
Screening (Self-report) + BI
Screening (Self report) + CDT test + BI
Cost minimisation analysis
Societal Literature review, and Project TrEAT in particular
Cost difference
Screening costs; intervention costs (2 physician visits, 2 phone calls); future alcohol-attributable medical resource use; future alcohol attributable other costs (MVA, crime); patient costs
Including CDT screening in the intervention leads to cost savings of $212.30 per patient screened compared to a strategy that relies only on self-reporting.
Results very reliant on legal costs and motor vehicle accident costs for heavy drinkers, which have very wide confidence intervals. No HRQL measure included.
Downs and Klein (1995)
US, Primary Care
Annual screening for all adolescents + 3 annual counselling visits for those at ‘high risk’
No screening or intervention
Cost benefit analysis
Societal Literature review to inform model parameters. Effectiveness of intervention assumed and tested
Marginal cost of the intervention
Intervention (including screening) costs; MVA costs; Cost of treating an STD, HIV and teenage pregnancy
With value of a life saved = $600,000, efficacy of the programme must be 5.6% (is 5.6% change behaviour) in order for marginal costs = 0.
No discount rate included despite 5 year time line of analysis. Model particularly sensitive to uncertain parameters: cost and probability of MVA, HIV and teenage pregnancy.
Fleming et al. (2000) and Fleming et al. (2002)
US, Primary Care
Screening + BI (Two 15 minute physician visits + 2 phone calls)
Screening + Health information booklet
Cost benefit analysis
Societal Project TrEAT Cost difference
Screening and Intervention costs (personnel and equipment); future emergency care; future hospitalisations; patient costs (based on earnings); alcohol-related incidents (MVA and crime)
Net saving of $546 per patient from the medical perspective (benefit cost ratio = 1:4.3). Net saving of $7,780 per patient from the societal perspective (benefit cost ratio = 1:39).
Results heavily reliant on estimates for MVA. The numbers of these events were not significantly different between study arms, but the costs were. No baseline or pre-baseline resource use or MVA data is presented. No HRQL measure is included. Efficacy rather than effectiveness (as claimed by Freeborn et al. (2000))?
Freeborn et al. (2000)
US, Primary Care
AUDIT + brief advice from primary care provider + 15 mins with counsellor
AUDIT + usual care
Resource utlisation analysis
Health care payer
Senft et al. (1997)
Resource use (hospitalisations and outpatient visits) difference
None Differences in resource use (24 months) and alcohol consumption (12 months) not significant between the two groups.
Low effectiveness due to ‘real world’ nature of trial? Resource use data collected may not be accurate. The comparator resulted in relatively good effectiveness.
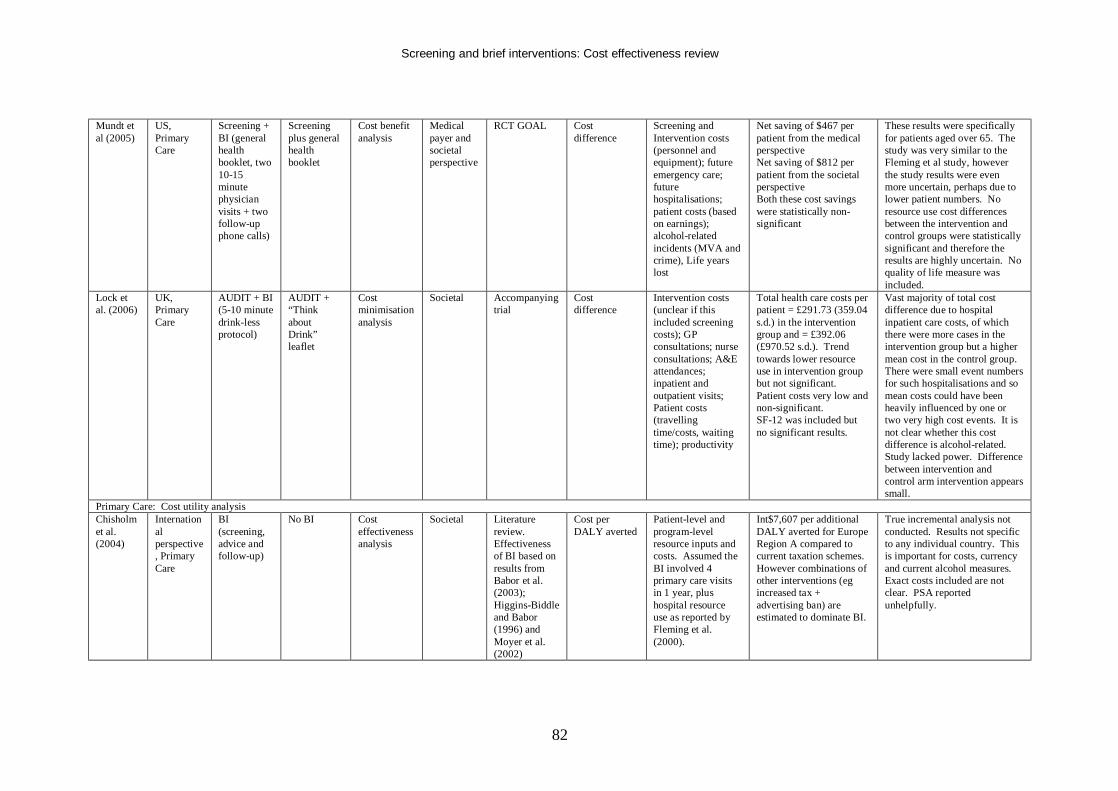
Screening and brief interventions: Cost effectiveness review
82
Mundt et al (2005)
US, Primary Care
Screening + BI (general health booklet, two 10-15 minute physician visits + two follow-up phone calls)
Screening plus general health booklet
Cost benefit analysis
Medical payer and societal perspective
RCT GOAL Cost difference
Screening and Intervention costs (personnel and equipment); future emergency care; future hospitalisations; patient costs (based on earnings); alcohol-related incidents (MVA and crime), Life years lost
Net saving of $467 per patient from the medical perspective Net saving of $812 per patient from the societal perspective Both these cost savings were statistically non-significant
These results were specifically for patients aged over 65. The study was very similar to the Fleming et al study, however the study results were even more uncertain, perhaps due to lower patient numbers. No resource use cost differences between the intervention and control groups were statistically significant and therefore the results are highly uncertain. No quality of life measure was included.
Lock et al. (2006)
UK, Primary Care
AUDIT + BI (5-10 minute drink-less protocol)
AUDIT + “Think about Drink” leaflet
Cost minimisation analysis
Societal Accompanying trial
Cost difference
Intervention costs (unclear if this included screening costs); GP consultations; nurse consultations; A&E attendances; inpatient and outpatient visits; Patient costs (travelling time/costs, waiting time); productivity
Total health care costs per patient = £291.73 (359.04 s.d.) in the intervention group and = £392.06 (£970.52 s.d.). Trend towards lower resource use in intervention group but not significant. Patient costs very low and non-significant. SF-12 was included but no significant results.
Vast majority of total cost difference due to hospital inpatient care costs, of which there were more cases in the intervention group but a higher mean cost in the control group. There were small event numbers for such hospitalisations and so mean costs could have been heavily influenced by one or two very high cost events. It is not clear whether this cost difference is alcohol-related. Study lacked power. Difference between intervention and control arm intervention appears small.
Primary Care: Cost utility analysis Chisholm et al. (2004)
International perspective, Primary Care
BI (screening, advice and follow-up)
No BI Cost effectiveness analysis
Societal Literature review. Effectiveness of BI based on results from Babor et al. (2003); Higgins-Biddle and Babor (1996) and Moyer et al. (2002)
Cost per DALY averted
Patient-level and program-level resource inputs and costs. Assumed the BI involved 4 primary care visits in 1 year, plus hospital resource use as reported by Fleming et al. (2000).
Int$7,607 per additional DALY averted for Europe Region A compared to current taxation schemes. However combinations of other interventions (eg increased tax + advertising ban) are estimated to dominate BI.
True incremental analysis not conducted. Results not specific to any individual country. This is important for costs, currency and current alcohol measures. Exact costs included are not clear. PSA reported unhelpfully.
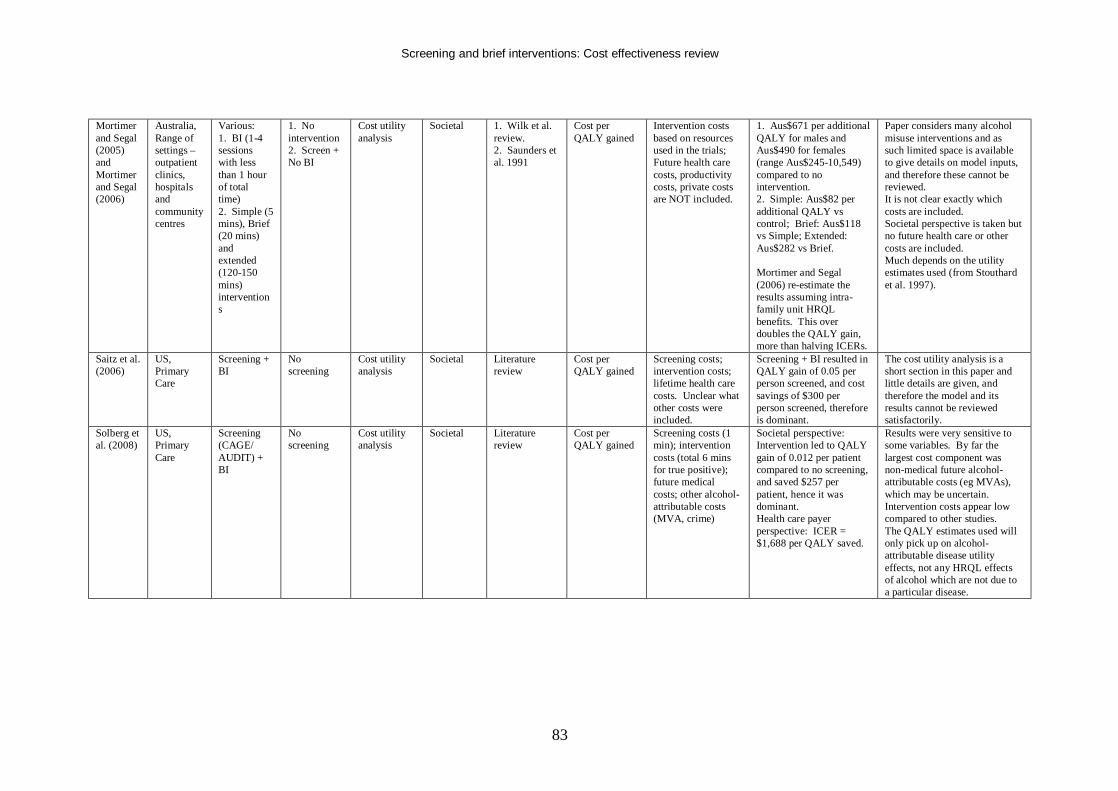
Screening and brief interventions: Cost effectiveness review
83
Mortimer and Segal (2005) and Mortimer and Segal (2006)
Australia, Range of settings – outpatient clinics, hospitals and community centres
Various: 1. BI (1-4 sessions with less than 1 hour of total time) 2. Simple (5 mins), Brief (20 mins) and extended (120-150 mins) interventions
1. No intervention 2. Screen + No BI
Cost utility analysis
Societal 1. Wilk et al. review. 2. Saunders et al. 1991
Cost per QALY gained
Intervention costs based on resources used in the trials; Future health care costs, productivity costs, private costs are NOT included.
1. Aus$671 per additional QALY for males and Aus$490 for females (range Aus$245-10,549) compared to no intervention. 2. Simple: Aus$82 per additional QALY vs control; Brief: Aus$118 vs Simple; Extended: Aus$282 vs Brief. Mortimer and Segal (2006) re-estimate the results assuming intra-family unit HRQL benefits. This over doubles the QALY gain, more than halving ICERs.
Paper considers many alcohol misuse interventions and as such limited space is available to give details on model inputs, and therefore these cannot be reviewed. It is not clear exactly which costs are included. Societal perspective is taken but no future health care or other costs are included. Much depends on the utility estimates used (from Stouthard et al. 1997).
Saitz et al. (2006)
US, Primary Care
Screening + BI
No screening
Cost utility analysis
Societal Literature review
Cost per QALY gained
Screening costs; intervention costs; lifetime health care costs. Unclear what other costs were included.
Screening + BI resulted in QALY gain of 0.05 per person screened, and cost savings of $300 per person screened, therefore is dominant.
The cost utility analysis is a short section in this paper and little details are given, and therefore the model and its results cannot be reviewed satisfactorily.
Solberg et al. (2008)
US, Primary Care
Screening (CAGE/ AUDIT) + BI
No screening
Cost utility analysis
Societal Literature review
Cost per QALY gained
Screening costs (1 min); intervention costs (total 6 mins for true positive); future medical costs; other alcohol-attributable costs (MVA, crime)
Societal perspective: Intervention led to QALY gain of 0.012 per patient compared to no screening, and saved $257 per patient, hence it was dominant. Health care payer perspective: ICER = $1,688 per QALY saved.
Results were very sensitive to some variables. By far the largest cost component was non-medical future alcohol-attributable costs (eg MVAs), which may be uncertain. Intervention costs appear low compared to other studies. The QALY estimates used will only pick up on alcohol-attributable disease utility effects, not any HRQL effects of alcohol which are not due to a particular disease.
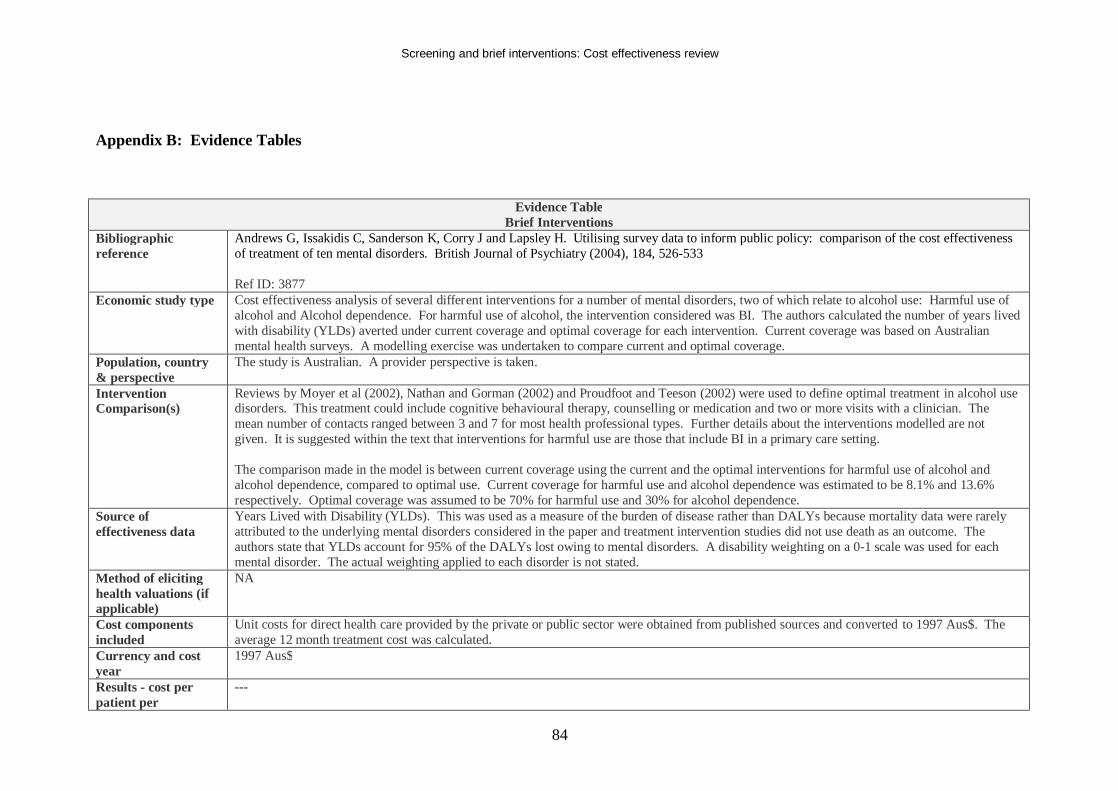
Screening and brief interventions: Cost effectiveness review
84
Appendix B: Evidence Tables
Evidence Table Brief Interventions
Bibliographic reference
Andrews G, Issakidis C, Sanderson K, Corry J and Lapsley H. Utilising survey data to inform public policy: comparison of the cost effectiveness of treatment of ten mental disorders. British Journal of Psychiatry (2004), 184, 526-533 Ref ID: 3877
Economic study type Cost effectiveness analysis of several different interventions for a number of mental disorders, two of which relate to alcohol use: Harmful use of alcohol and Alcohol dependence. For harmful use of alcohol, the intervention considered was BI. The authors calculated the number of years lived with disability (YLDs) averted under current coverage and optimal coverage for each intervention. Current coverage was based on Australian mental health surveys. A modelling exercise was undertaken to compare current and optimal coverage.
Population, country & perspective
The study is Australian. A provider perspective is taken.
Intervention Comparison(s)
Reviews by Moyer et al (2002), Nathan and Gorman (2002) and Proudfoot and Teeson (2002) were used to define optimal treatment in alcohol use disorders. This treatment could include cognitive behavioural therapy, counselling or medication and two or more visits with a clinician. The mean number of contacts ranged between 3 and 7 for most health professional types. Further details about the interventions modelled are not given. It is suggested within the text that interventions for harmful use are those that include BI in a primary care setting. The comparison made in the model is between current coverage using the current and the optimal interventions for harmful use of alcohol and alcohol dependence, compared to optimal use. Current coverage for harmful use and alcohol dependence was estimated to be 8.1% and 13.6% respectively. Optimal coverage was assumed to be 70% for harmful use and 30% for alcohol dependence.
Source of effectiveness data
Years Lived with Disability (YLDs). This was used as a measure of the burden of disease rather than DALYs because mortality data were rarely attributed to the underlying mental disorders considered in the paper and treatment intervention studies did not use death as an outcome. The authors state that YLDs account for 95% of the DALYs lost owing to mental disorders. A disability weighting on a 0-1 scale was used for each mental disorder. The actual weighting applied to each disorder is not stated.
Method of eliciting health valuations (if applicable)
NA
Cost components included
Unit costs for direct health care provided by the private or public sector were obtained from published sources and converted to 1997 Aus$. The average 12 month treatment cost was calculated.
Currency and cost year
1997 Aus$
Results - cost per patient per
---
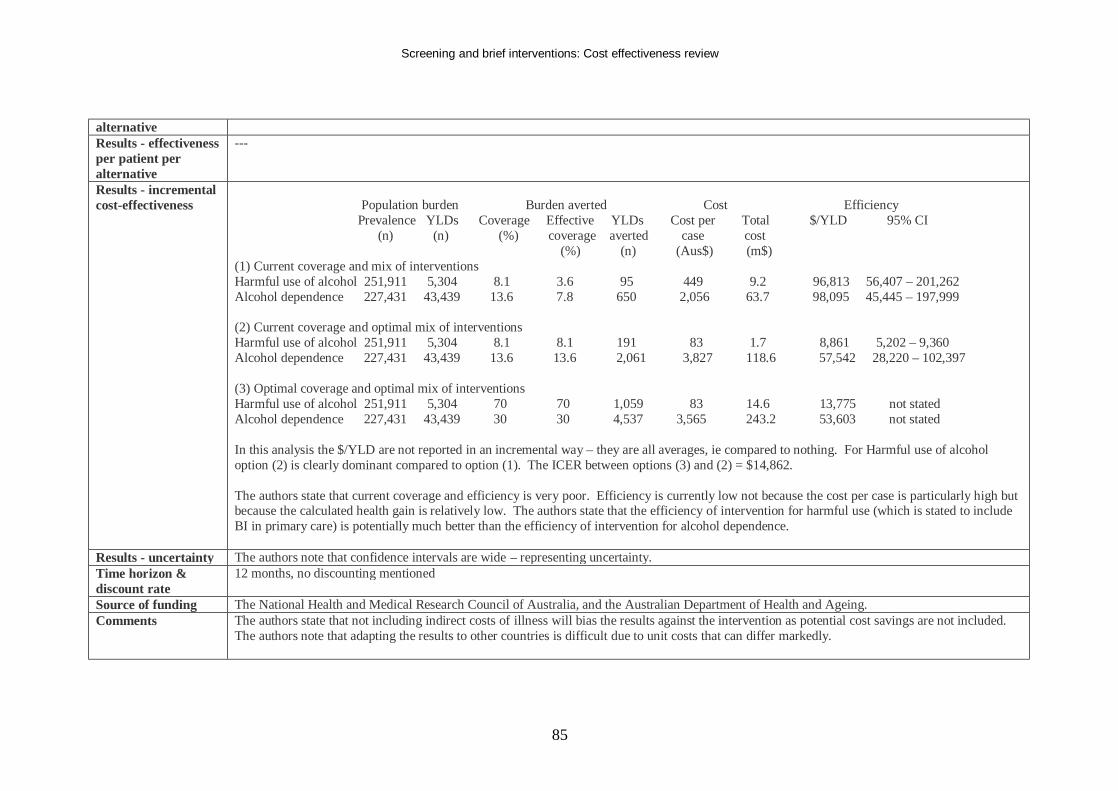
Screening and brief interventions: Cost effectiveness review
85
alternative Results - effectiveness per patient per alternative
---
Results - incremental cost-effectiveness
Population burden Burden averted Cost Efficiency Prevalence YLDs Coverage Effective YLDs Cost per Total $/YLD 95% CI (n) (n) (%) coverage averted case cost (%) (n) (Aus$) (m$) (1) Current coverage and mix of interventions Harmful use of alcohol 251,911 5,304 8.1 3.6 95 449 9.2 96,813 56,407 – 201,262 Alcohol dependence 227,431 43,439 13.6 7.8 650 2,056 63.7 98,095 45,445 – 197,999 (2) Current coverage and optimal mix of interventions Harmful use of alcohol 251,911 5,304 8.1 8.1 191 83 1.7 8,861 5,202 – 9,360 Alcohol dependence 227,431 43,439 13.6 13.6 2,061 3,827 118.6 57,542 28,220 – 102,397 (3) Optimal coverage and optimal mix of interventions Harmful use of alcohol 251,911 5,304 70 70 1,059 83 14.6 13,775 not stated Alcohol dependence 227,431 43,439 30 30 4,537 3,565 243.2 53,603 not stated In this analysis the $/YLD are not reported in an incremental way – they are all averages, ie compared to nothing. For Harmful use of alcohol option (2) is clearly dominant compared to option (1). The ICER between options (3) and (2) = $14,862. The authors state that current coverage and efficiency is very poor. Efficiency is currently low not because the cost per case is particularly high but because the calculated health gain is relatively low. The authors state that the efficiency of intervention for harmful use (which is stated to include BI in primary care) is potentially much better than the efficiency of intervention for alcohol dependence.
Results - uncertainty The authors note that confidence intervals are wide – representing uncertainty. Time horizon & discount rate
12 months, no discounting mentioned
Source of funding The National Health and Medical Research Council of Australia, and the Australian Department of Health and Ageing. Comments The authors state that not including indirect costs of illness will bias the results against the intervention as potential cost savings are not included.
The authors note that adapting the results to other countries is difficult due to unit costs that can differ markedly.
Screening and brief interventions: Cost effectiveness review
86
The paper focuses on a broad range of mental disorders, with a particular focus on schizophrenia. Therefore the analysis of alcohol disorders is not presented in a large amount of detail.
Overall study quality (++,+,-)
+
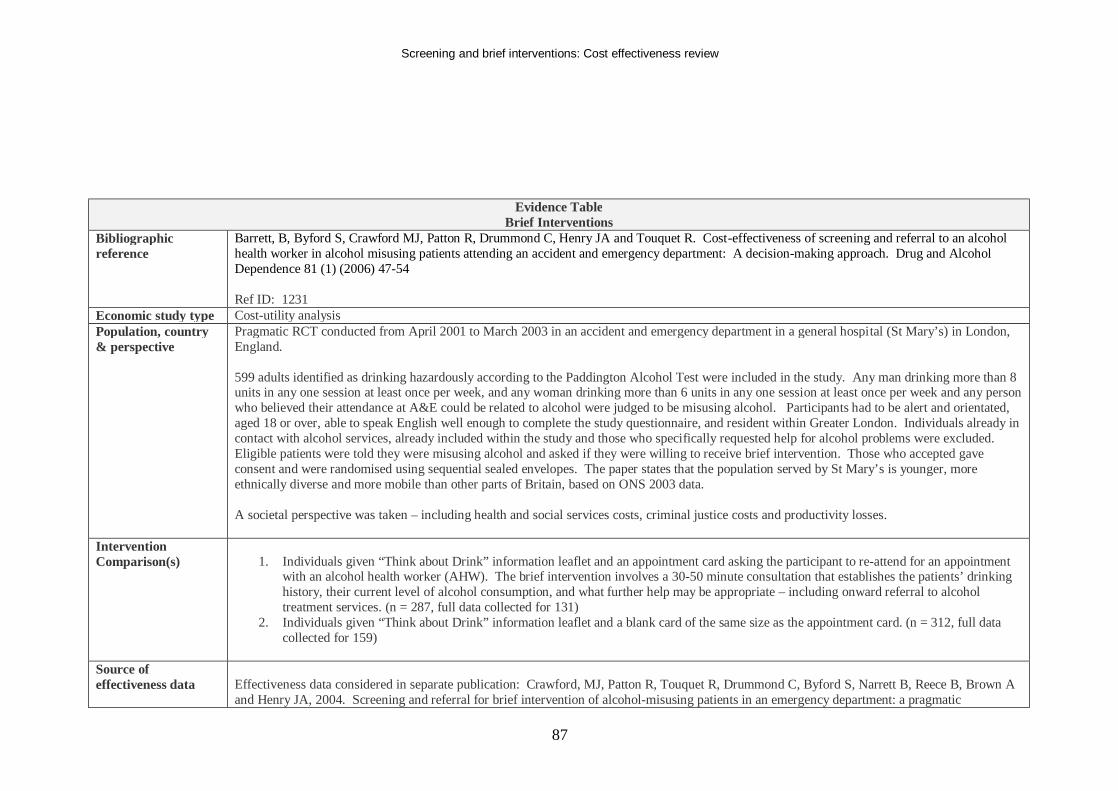
Screening and brief interventions: Cost effectiveness review
87
Evidence Table Brief Interventions
Bibliographic reference
Barrett, B, Byford S, Crawford MJ, Patton R, Drummond C, Henry JA and Touquet R. Cost-effectiveness of screening and referral to an alcohol health worker in alcohol misusing patients attending an accident and emergency department: A decision-making approach. Drug and Alcohol Dependence 81 (1) (2006) 47-54 Ref ID: 1231
Economic study type Cost-utility analysis Population, country & perspective
Pragmatic RCT conducted from April 2001 to March 2003 in an accident and emergency department in a general hospital (St Mary’s) in London, England. 599 adults identified as drinking hazardously according to the Paddington Alcohol Test were included in the study. Any man drinking more than 8 units in any one session at least once per week, and any woman drinking more than 6 units in any one session at least once per week and any person who believed their attendance at A&E could be related to alcohol were judged to be misusing alcohol. Participants had to be alert and orientated, aged 18 or over, able to speak English well enough to complete the study questionnaire, and resident within Greater London. Individuals already in contact with alcohol services, already included within the study and those who specifically requested help for alcohol problems were excluded. Eligible patients were told they were misusing alcohol and asked if they were willing to receive brief intervention. Those who accepted gave consent and were randomised using sequential sealed envelopes. The paper states that the population served by St Mary’s is younger, more ethnically diverse and more mobile than other parts of Britain, based on ONS 2003 data. A societal perspective was taken – including health and social services costs, criminal justice costs and productivity losses.
Intervention Comparison(s)
1. Individuals given “Think about Drink” information leaflet and an appointment card asking the participant to re-attend for an appointment
with an alcohol health worker (AHW). The brief intervention involves a 30-50 minute consultation that establishes the patients’ drinking history, their current level of alcohol consumption, and what further help may be appropriate – including onward referral to alcohol treatment services. (n = 287, full data collected for 131)
2. Individuals given “Think about Drink” information leaflet and a blank card of the same size as the appointment card. (n = 312, full data collected for 159)
Source of effectiveness data
Effectiveness data considered in separate publication: Crawford, MJ, Patton R, Touquet R, Drummond C, Byford S, Narrett B, Reece B, Brown A and Henry JA, 2004. Screening and referral for brief intervention of alcohol-misusing patients in an emergency department: a pragmatic
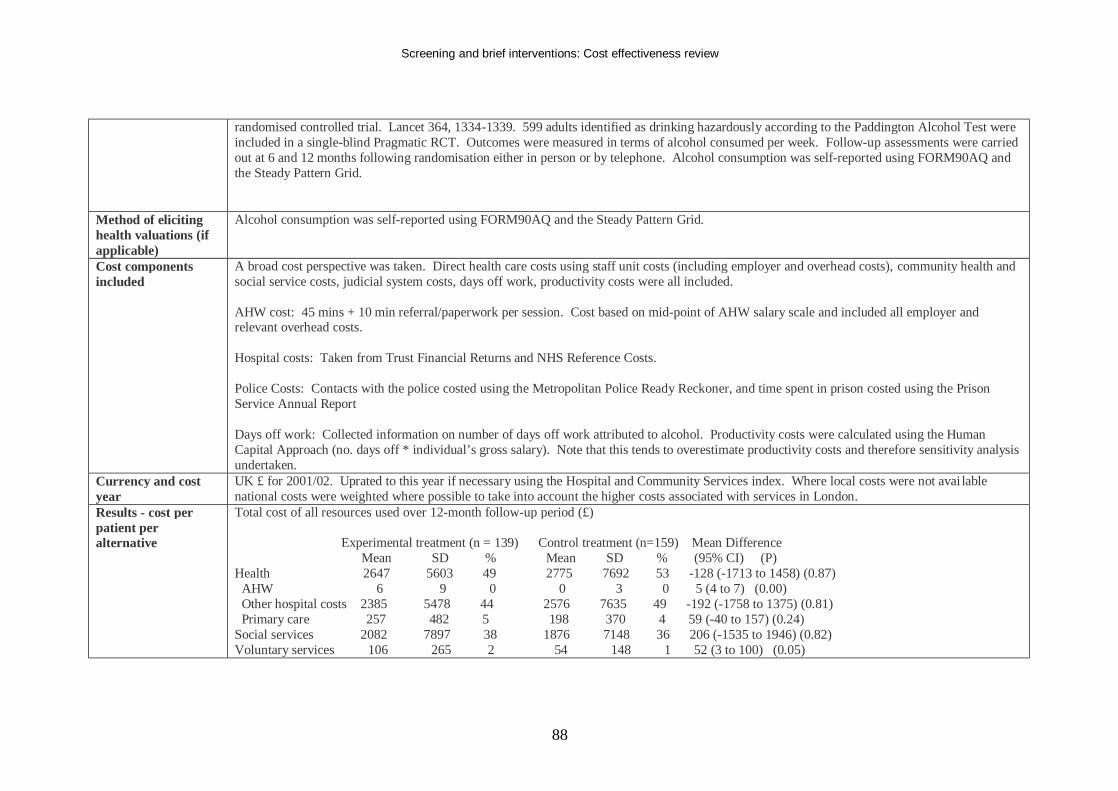
Screening and brief interventions: Cost effectiveness review
88
randomised controlled trial. Lancet 364, 1334-1339. 599 adults identified as drinking hazardously according to the Paddington Alcohol Test were included in a single-blind Pragmatic RCT. Outcomes were measured in terms of alcohol consumed per week. Follow-up assessments were carried out at 6 and 12 months following randomisation either in person or by telephone. Alcohol consumption was self-reported using FORM90AQ and the Steady Pattern Grid.
Method of eliciting health valuations (if applicable)
Alcohol consumption was self-reported using FORM90AQ and the Steady Pattern Grid.
Cost components included
A broad cost perspective was taken. Direct health care costs using staff unit costs (including employer and overhead costs), community health and social service costs, judicial system costs, days off work, productivity costs were all included. AHW cost: 45 mins + 10 min referral/paperwork per session. Cost based on mid-point of AHW salary scale and included all employer and relevant overhead costs. Hospital costs: Taken from Trust Financial Returns and NHS Reference Costs. Police Costs: Contacts with the police costed using the Metropolitan Police Ready Reckoner, and time spent in prison costed using the Prison Service Annual Report Days off work: Collected information on number of days off work attributed to alcohol. Productivity costs were calculated using the Human Capital Approach (no. days off * individual’s gross salary). Note that this tends to overestimate productivity costs and therefore sensitivity analysis undertaken.
Currency and cost year
UK £ for 2001/02. Uprated to this year if necessary using the Hospital and Community Services index. Where local costs were not avai lable national costs were weighted where possible to take into account the higher costs associated with services in London.
Results - cost per patient per alternative
Total cost of all resources used over 12-month follow-up period (£) Experimental treatment (n = 139) Control treatment (n=159) Mean Difference Mean SD % Mean SD % (95% CI) (P) Health 2647 5603 49 2775 7692 53 -128 (-1713 to 1458) (0.87) AHW 6 9 0 0 3 0 5 (4 to 7) (0.00) Other hospital costs 2385 5478 44 2576 7635 49 -192 (-1758 to 1375) (0.81) Primary care 257 482 5 198 370 4 59 (-40 to 157) (0.24) Social services 2082 7897 38 1876 7148 36 206 (-1535 to 1946) (0.82) Voluntary services 106 265 2 54 148 1 52 (3 to 100) (0.05)
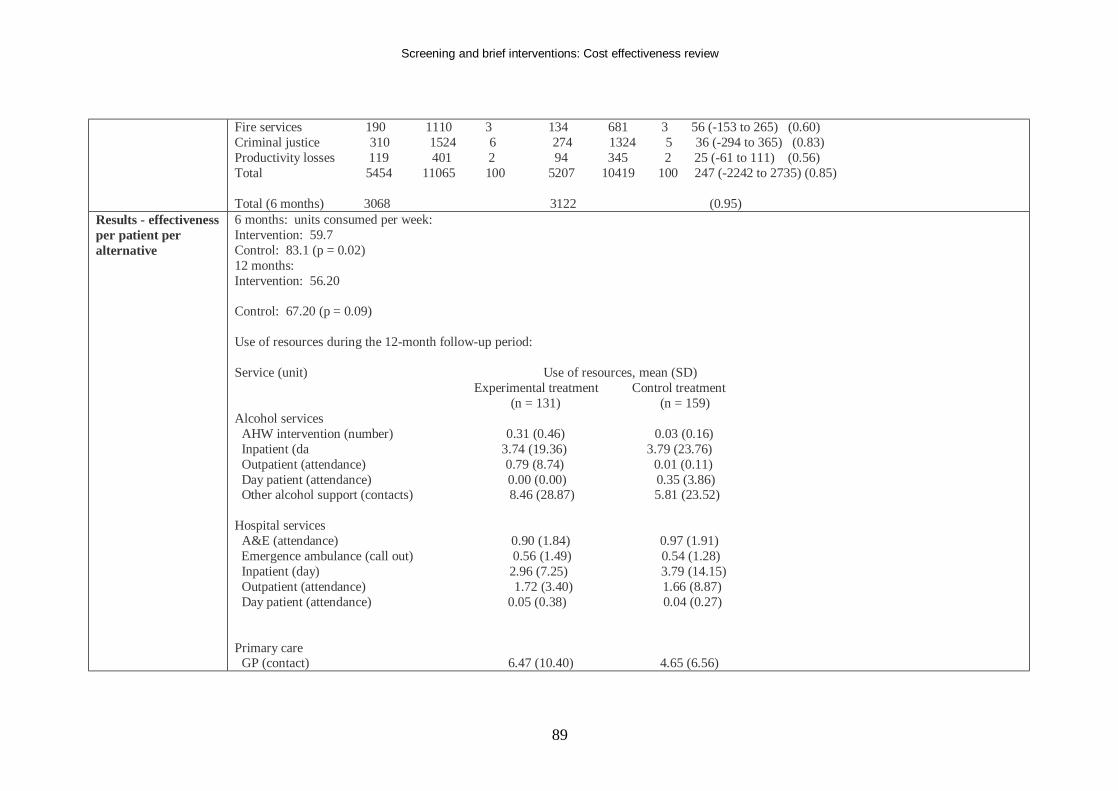
Screening and brief interventions: Cost effectiveness review
89
Fire services 190 1110 3 134 681 3 56 (-153 to 265) (0.60) Criminal justice 310 1524 6 274 1324 5 36 (-294 to 365) (0.83) Productivity losses 119 401 2 94 345 2 25 (-61 to 111) (0.56) Total 5454 11065 100 5207 10419 100 247 (-2242 to 2735) (0.85) Total (6 months) 3068 3122 (0.95)
Results - effectiveness per patient per alternative
6 months: units consumed per week: Intervention: 59.7 Control: 83.1 (p = 0.02) 12 months: Intervention: 56.20 Control: 67.20 (p = 0.09) Use of resources during the 12-month follow-up period: Service (unit) Use of resources, mean (SD) Experimental treatment Control treatment (n = 131) (n = 159) Alcohol services AHW intervention (number) 0.31 (0.46) 0.03 (0.16) Inpatient (da 3.74 (19.36) 3.79 (23.76) Outpatient (attendance) 0.79 (8.74) 0.01 (0.11) Day patient (attendance) 0.00 (0.00) 0.35 (3.86) Other alcohol support (contacts) 8.46 (28.87) 5.81 (23.52) Hospital services A&E (attendance) 0.90 (1.84) 0.97 (1.91) Emergence ambulance (call out) 0.56 (1.49) 0.54 (1.28) Inpatient (day) 2.96 (7.25) 3.79 (14.15) Outpatient (attendance) 1.72 (3.40) 1.66 (8.87) Day patient (attendance) 0.05 (0.38) 0.04 (0.27) Primary care GP (contact) 6.47 (10.40) 4.65 (6.56)
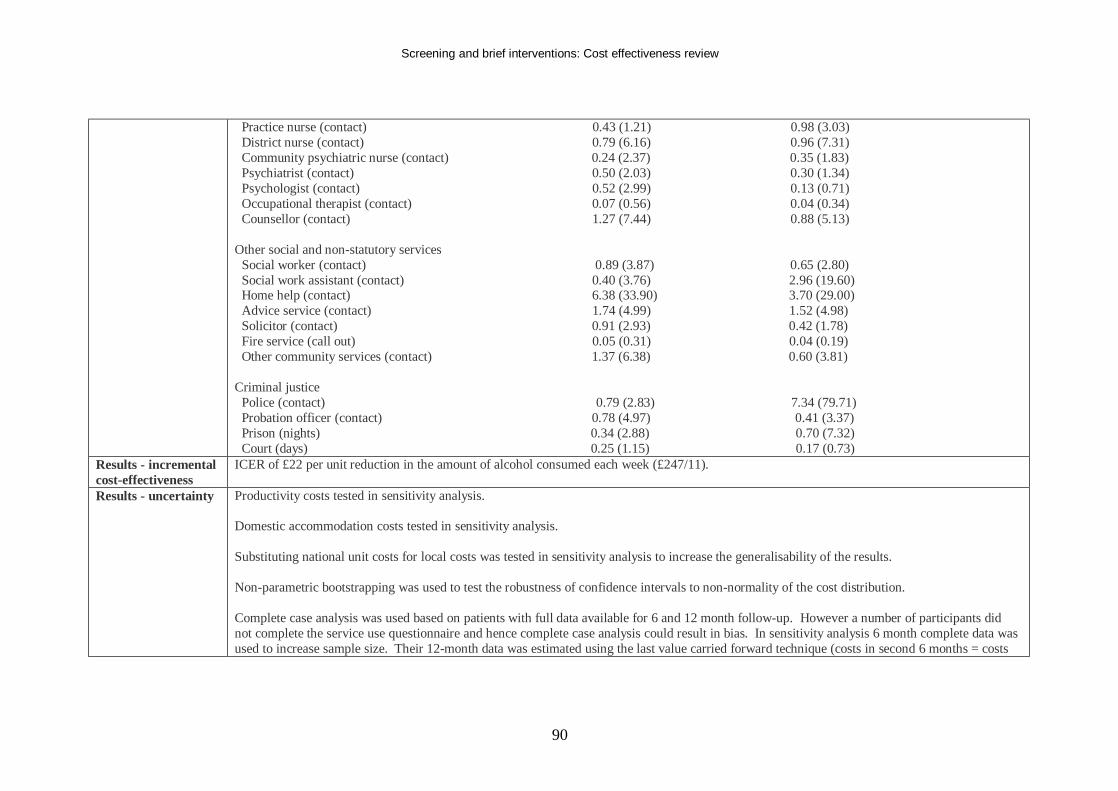
Screening and brief interventions: Cost effectiveness review
90
Practice nurse (contact) 0.43 (1.21) 0.98 (3.03) District nurse (contact) 0.79 (6.16) 0.96 (7.31) Community psychiatric nurse (contact) 0.24 (2.37) 0.35 (1.83) Psychiatrist (contact) 0.50 (2.03) 0.30 (1.34) Psychologist (contact) 0.52 (2.99) 0.13 (0.71) Occupational therapist (contact) 0.07 (0.56) 0.04 (0.34) Counsellor (contact) 1.27 (7.44) 0.88 (5.13) Other social and non-statutory services Social worker (contact) 0.89 (3.87) 0.65 (2.80) Social work assistant (contact) 0.40 (3.76) 2.96 (19.60) Home help (contact) 6.38 (33.90) 3.70 (29.00) Advice service (contact) 1.74 (4.99) 1.52 (4.98) Solicitor (contact) 0.91 (2.93) 0.42 (1.78) Fire service (call out) 0.05 (0.31) 0.04 (0.19) Other community services (contact) 1.37 (6.38) 0.60 (3.81) Criminal justice Police (contact) 0.79 (2.83) 7.34 (79.71) Probation officer (contact) 0.78 (4.97) 0.41 (3.37) Prison (nights) 0.34 (2.88) 0.70 (7.32) Court (days) 0.25 (1.15) 0.17 (0.73)
Results - incremental cost-effectiveness
ICER of £22 per unit reduction in the amount of alcohol consumed each week (£247/11).
Results - uncertainty Productivity costs tested in sensitivity analysis. Domestic accommodation costs tested in sensitivity analysis. Substituting national unit costs for local costs was tested in sensitivity analysis to increase the generalisability of the results. Non-parametric bootstrapping was used to test the robustness of confidence intervals to non-normality of the cost distribution. Complete case analysis was used based on patients with full data available for 6 and 12 month follow-up. However a number of participants did not complete the service use questionnaire and hence complete case analysis could result in bias. In sensitivity analysis 6 month complete data was used to increase sample size. Their 12-month data was estimated using the last value carried forward technique (costs in second 6 months = costs
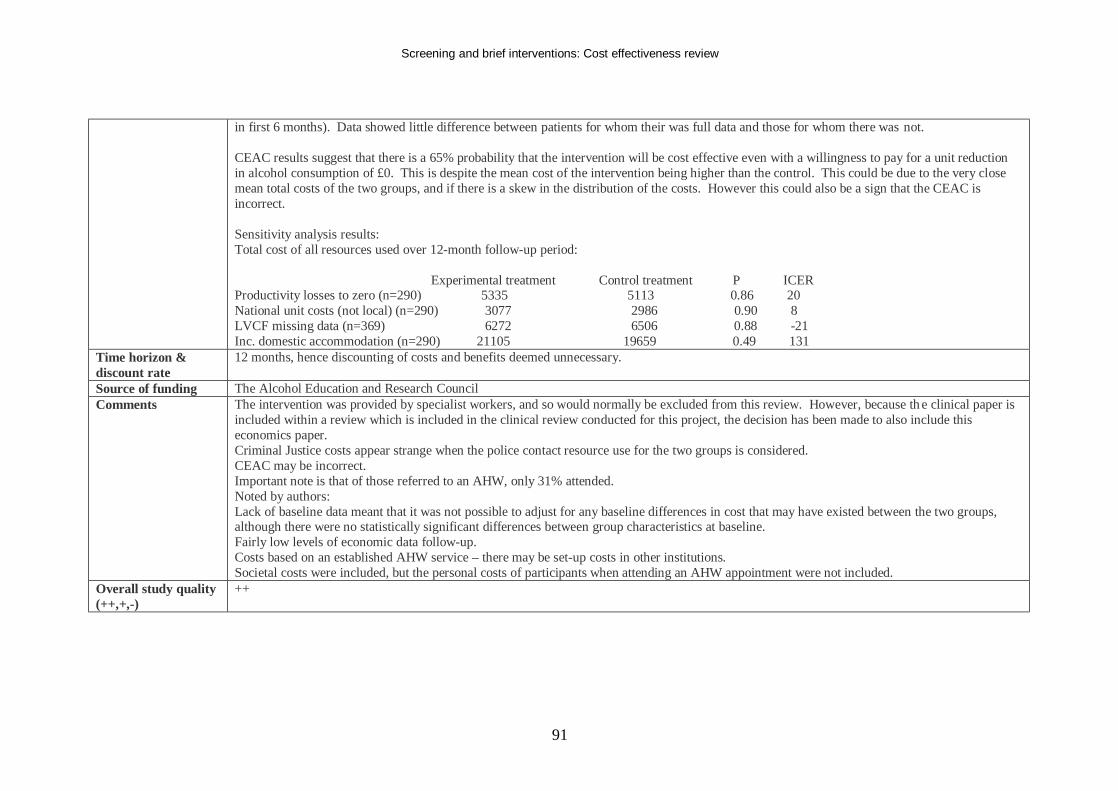
Screening and brief interventions: Cost effectiveness review
91
in first 6 months). Data showed little difference between patients for whom their was full data and those for whom there was not. CEAC results suggest that there is a 65% probability that the intervention will be cost effective even with a willingness to pay for a unit reduction in alcohol consumption of £0. This is despite the mean cost of the intervention being higher than the control. This could be due to the very close mean total costs of the two groups, and if there is a skew in the distribution of the costs. However this could also be a sign that the CEAC is incorrect. Sensitivity analysis results: Total cost of all resources used over 12-month follow-up period: Experimental treatment Control treatment P ICER Productivity losses to zero (n=290) 5335 5113 0.86 20 National unit costs (not local) (n=290) 3077 2986 0.90 8 LVCF missing data (n=369) 6272 6506 0.88 -21 Inc. domestic accommodation (n=290) 21105 19659 0.49 131
Time horizon & discount rate
12 months, hence discounting of costs and benefits deemed unnecessary.
Source of funding The Alcohol Education and Research Council Comments The intervention was provided by specialist workers, and so would normally be excluded from this review. However, because th e clinical paper is
included within a review which is included in the clinical review conducted for this project, the decision has been made to also include this economics paper. Criminal Justice costs appear strange when the police contact resource use for the two groups is considered. CEAC may be incorrect. Important note is that of those referred to an AHW, only 31% attended. Noted by authors: Lack of baseline data meant that it was not possible to adjust for any baseline differences in cost that may have existed between the two groups, although there were no statistically significant differences between group characteristics at baseline. Fairly low levels of economic data follow-up. Costs based on an established AHW service – there may be set-up costs in other institutions. Societal costs were included, but the personal costs of participants when attending an AHW appointment were not included.
Overall study quality (++,+,-)
++
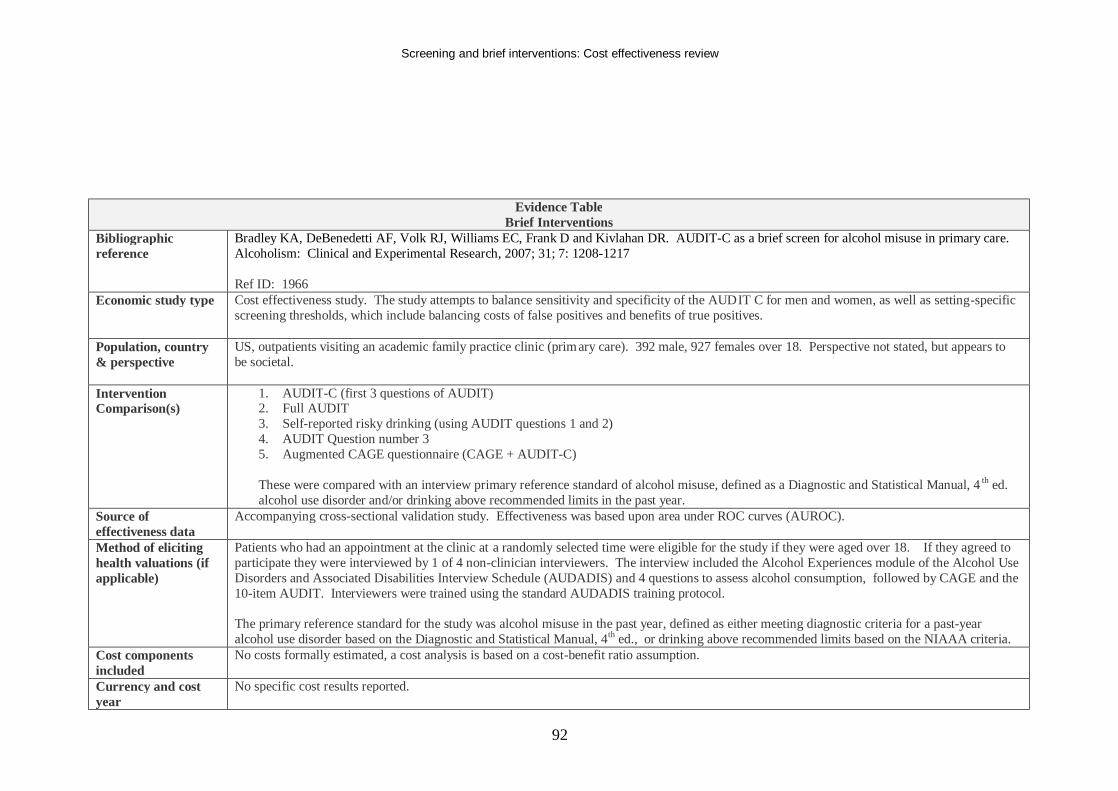
Screening and brief interventions: Cost effectiveness review
92
Evidence Table Brief Interventions
Bibliographic reference
Bradley KA, DeBenedetti AF, Volk RJ, Williams EC, Frank D and Kivlahan DR. AUDIT-C as a brief screen for alcohol misuse in primary care. Alcoholism: Clinical and Experimental Research, 2007; 31; 7: 1208-1217 Ref ID: 1966
Economic study type Cost effectiveness study. The study attempts to balance sensitivity and specificity of the AUDIT C for men and women, as well as setting-specific screening thresholds, which include balancing costs of false positives and benefits of true positives.
Population, country & perspective
US, outpatients visiting an academic family practice clinic (primary care). 392 male, 927 females over 18. Perspective not stated, but appears to be societal.
Intervention Comparison(s)
1. AUDIT-C (first 3 questions of AUDIT) 2. Full AUDIT 3. Self-reported risky drinking (using AUDIT questions 1 and 2) 4. AUDIT Question number 3 5. Augmented CAGE questionnaire (CAGE + AUDIT-C) These were compared with an interview primary reference standard of alcohol misuse, defined as a Diagnostic and Statistical Manual, 4 th ed. alcohol use disorder and/or drinking above recommended limits in the past year.
Source of effectiveness data
Accompanying cross-sectional validation study. Effectiveness was based upon area under ROC curves (AUROC).
Method of eliciting health valuations (if applicable)
Patients who had an appointment at the clinic at a randomly selected time were eligible for the study if they were aged over 18. If they agreed to participate they were interviewed by 1 of 4 non-clinician interviewers. The interview included the Alcohol Experiences module of the Alcohol Use Disorders and Associated Disabilities Interview Schedule (AUDADIS) and 4 questions to assess alcohol consumption, followed by CAGE and the 10-item AUDIT. Interviewers were trained using the standard AUDADIS training protocol. The primary reference standard for the study was alcohol misuse in the past year, defined as either meeting diagnostic criteria for a past-year alcohol use disorder based on the Diagnostic and Statistical Manual, 4th ed., or drinking above recommended limits based on the NIAAA criteria.
Cost components included
No costs formally estimated, a cost analysis is based on a cost-benefit ratio assumption.
Currency and cost year
No specific cost results reported.
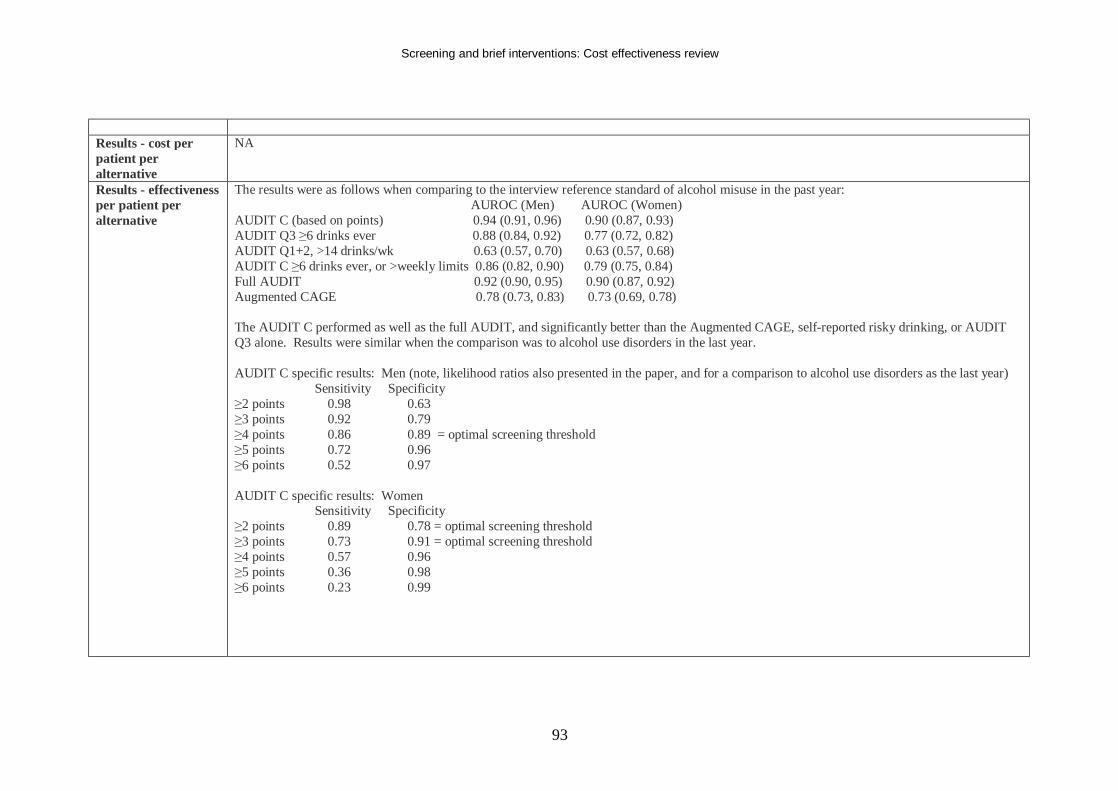
Screening and brief interventions: Cost effectiveness review
93
Results - cost per patient per alternative
NA
Results - effectiveness per patient per alternative
The results were as follows when comparing to the interview reference standard of alcohol misuse in the past year: AUROC (Men) AUROC (Women) AUDIT C (based on points) 0.94 (0.91, 0.96) 0.90 (0.87, 0.93) AUDIT Q3 ≥6 drinks ever 0.88 (0.84, 0.92) 0.77 (0.72, 0.82) AUDIT Q1+2, >14 drinks/wk 0.63 (0.57, 0.70) 0.63 (0.57, 0.68) AUDIT C ≥6 drinks ever, or >weekly limits 0.86 (0.82, 0.90) 0.79 (0.75, 0.84) Full AUDIT 0.92 (0.90, 0.95) 0.90 (0.87, 0.92) Augmented CAGE 0.78 (0.73, 0.83) 0.73 (0.69, 0.78) The AUDIT C performed as well as the full AUDIT, and significantly better than the Augmented CAGE, self-reported risky drinking, or AUDIT Q3 alone. Results were similar when the comparison was to alcohol use disorders in the last year. AUDIT C specific results: Men (note, likelihood ratios also presented in the paper, and for a comparison to alcohol use disorders as the last year) Sensitivity Specificity ≥2 points 0.98 0.63 ≥3 points 0.92 0.79 ≥4 points 0.86 0.89 = optimal screening threshold ≥5 points 0.72 0.96 ≥6 points 0.52 0.97 AUDIT C specific results: Women Sensitivity Specificity ≥2 points 0.89 0.78 = optimal screening threshold ≥3 points 0.73 0.91 = optimal screening threshold ≥4 points 0.57 0.96 ≥5 points 0.36 0.98 ≥6 points 0.23 0.99
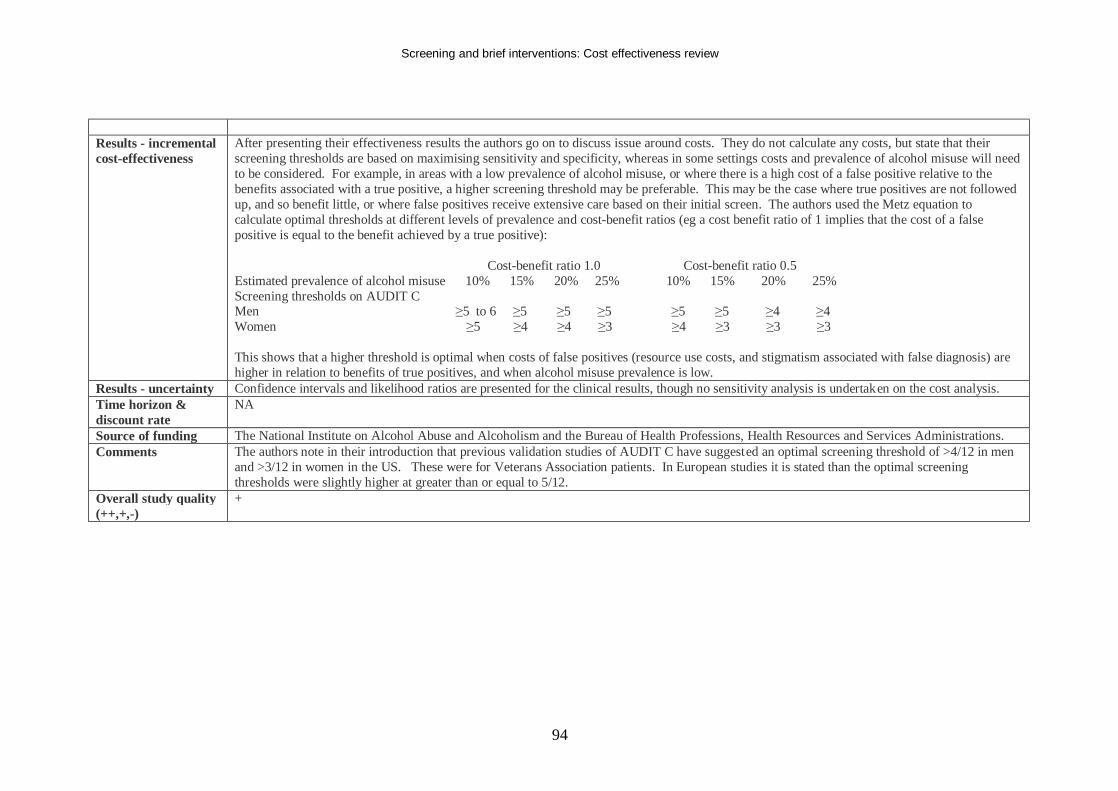
Screening and brief interventions: Cost effectiveness review
94
Results - incremental cost-effectiveness
After presenting their effectiveness results the authors go on to discuss issue around costs. They do not calculate any costs, but state that their screening thresholds are based on maximising sensitivity and specificity, whereas in some settings costs and prevalence of alcohol misuse will need to be considered. For example, in areas with a low prevalence of alcohol misuse, or where there is a high cost of a false positive relative to the benefits associated with a true positive, a higher screening threshold may be preferable. This may be the case where true positives are not followed up, and so benefit little, or where false positives receive extensive care based on their initial screen. The authors used the Metz equation to calculate optimal thresholds at different levels of prevalence and cost-benefit ratios (eg a cost benefit ratio of 1 implies that the cost of a false positive is equal to the benefit achieved by a true positive): Cost-benefit ratio 1.0 Cost-benefit ratio 0.5 Estimated prevalence of alcohol misuse 10% 15% 20% 25% 10% 15% 20% 25% Screening thresholds on AUDIT C Men ≥5 to 6 ≥5 ≥5 ≥5 ≥5 ≥5 ≥4 ≥4 Women ≥5 ≥4 ≥4 ≥3 ≥4 ≥3 ≥3 ≥3 This shows that a higher threshold is optimal when costs of false positives (resource use costs, and stigmatism associated with false diagnosis) are higher in relation to benefits of true positives, and when alcohol misuse prevalence is low.
Results - uncertainty Confidence intervals and likelihood ratios are presented for the clinical results, though no sensitivity analysis is undertaken on the cost analysis. Time horizon & discount rate
NA
Source of funding The National Institute on Alcohol Abuse and Alcoholism and the Bureau of Health Professions, Health Resources and Services Administrations. Comments The authors note in their introduction that previous validation studies of AUDIT C have suggested an optimal screening threshold of >4/12 in men
and >3/12 in women in the US. These were for Veterans Association patients. In European studies it is stated than the optimal screening thresholds were slightly higher at greater than or equal to 5/12.
Overall study quality (++,+,-)
+
Screening and brief interventions: Cost effectiveness review
95
Evidence Table Brief Interventions
Bibliographic reference
Chisholm D, Rehm J, Van Ommeren M and Monteiro M. Reducing the Global Burden of Hazardous Alcohol Use: A Comparative Cost-Effectivenss Analysis. Journal of Studies on Alcohol, 2004, 65: 782-793 Ref ID: 1740
Economic study type Cost effectiveness analysis, using DALYs as the outcome measure. A state transition population model that traces the development of a subregional population taking into account births, deaths and the specified risk factor was used. Key transition rates included the incidence of hazardous alcohol use in the population, case-fatality, and remission. Health state values were specified for time spent at risk or as a heavy drinker.
Population, country & perspective
Societal perspective. Analyses were carried out at the level of WHO regions (Africa, The Americas, Eastern Mediterranean, Eu rope, South East Asia, Western Pacific) each of which was split into subregions based on rates of adult and child mortality. Rates of alcohol use were very low in the Eastern Mediterranean region so this region was excluded from the analysis.
Intervention Comparison(s)
Two epidemiological scenarios were modelled: 1. No interventions available to reduce hazardous alcohol use (natural history) 2. The population-level impact of each specified intervention implemented for a period of 10 years (after which epidemiological rates and
health state valuations move back to natural history values) The difference between these scenarios represents the population-level health gain (expressed as DALYs averted) as a result of the intervention. Interventions included were:
- Tax on alcoholic beverages - Drink-driving legislation and RBT (roadside breath testing) - Reduced hours of sale (retail outlets) - Advertising bans - Brief interventions
Source of effectiveness data
The analysis relates to the risk factor of hazardous alcohol use, defined as an average rate of consumption of more than 20g pure alcohol daily for women and more than 40g for men. Rates of hazardous alcohol use were taken from the WHO comparative risk assessment (2002) as were fatality rates. From these the following relative risks of mortality were derived: 2.5: men and women aged 15-44 1.3: men in older age groups 1.4: women in older age groups
Screening and brief interventions: Cost effectiveness review
96
Remission rates were derived with reference to an average duration of 10.9 years to recovery. A health state valuation of 0.846 was derived for hazardous alcohol use (equivalent to a disability weighting of 0.154) which represented a weighted average based on the severity breakdown of hazardous drinkers from the WHO comparative risk assessment (80% hazardous, 20% harmful) and preference values for these health states from the Dutch disability weight study (0.89 and 0.67 respectively, Stouthard et al 2000).
- Taxation. This reduces consumption based on price elasticities. Price elasticities (adjusted downwards by one third to reflect reduced responsiveness in heavy drinkers) were derived with respect to preferred type of alcohol (wine, beer, spirits) in the 12 subregions. These were constructed from country level data contained in WHO’s Global Alcohol Database. Baseline elasticities were 0.3 for the most preferred beverage, -1.0 for the next most preferred and -1.5 for the least preferred. The current level of tax as well as increases of 25% and 50% was evaluated, adjusting for expected unrecorded use (due to illicit production or smuggling). In countries were unrecorded consumption is high tax increases can have a regressive impact on incidence if unrecorded consumption also increases.
- Drink drive legislation and RBT. This was based on a strategy which has been used in Scandinavia prevent alcohol sales for a 24-hour period at the weekend. On the basis of studies analysing this strategy the authors modelled a reduction of 1.5%-3.0% in the incidence of hazardous drinking and 1.5%-4.0% in alcohol-related traffic fatalities, depending on the subregional pattern of drinking (largest effects in areas with the highest level of hazardous drinking occasions).
- Advertising bans. The effects of a comprehensive advertising ban are modelled, based on the latest international time-series analysis (Grube and Agostinelli, 2000; Saffer, 2000; Saffer and Dave 2002). The effect is modelled as a 2-4% reduction in the incidence of hazardous drinking, adjusted for subregional variations in patterns of drinking.
- Brief Interventions. These were modelled to influence the prevalence of hazardous drinking by increasing remission and reducing disability. The authors note that efficacy reviews show an estimated 22% net reduction in consumption amongst hazardous drinkers (Babor et al 2003, Higgins-Biddle and Babor 1996, Moyer et al 2002). If applied to the total population at risk this would reduce overall prevalence by 35%-50%, equivalent to a 14%-18% improvement in the rate of recovery over no treatment. However the authors take into account treatment adherence (70%) and target coverage in the population (50% of hazardous drinkers), population-level remission rates were estimated to be 4.9%-6.4% better than natural history rates. Additionally an expected reduction in the number of heaviest drinkers while in treatment (but prior to remission) was assumed and resulted in a small gain in the average level of disability – treated health state valuation was 0.858, an improvement of 1.3% after adjusting for coverage and adherence
Method of eliciting health valuations (if applicable)
A health state valuation of 0.846 was derived for hazardous alcohol use (equivalent to a disability weighting of 0.154) which represented a weighted average based on the severity breakdown of hazardous drinkers from the WHO comparative risk assessment (80% hazardous, 20% harmful) and preference values for these health states from the Dutch disability weight study (0.89 and 0.67 respectively, Stouthard et al 2000).
Cost components included
- Program-level resource inputs used in the production of an intervention. These are used in the production of an intervention at the level above the patient or health care facility. Eg administrative functions or resources devoted to enforcing drink-drive legislation by police officers. Estimated quantities of resources required were estimated by costing experts from each subregion and validated against the literature.
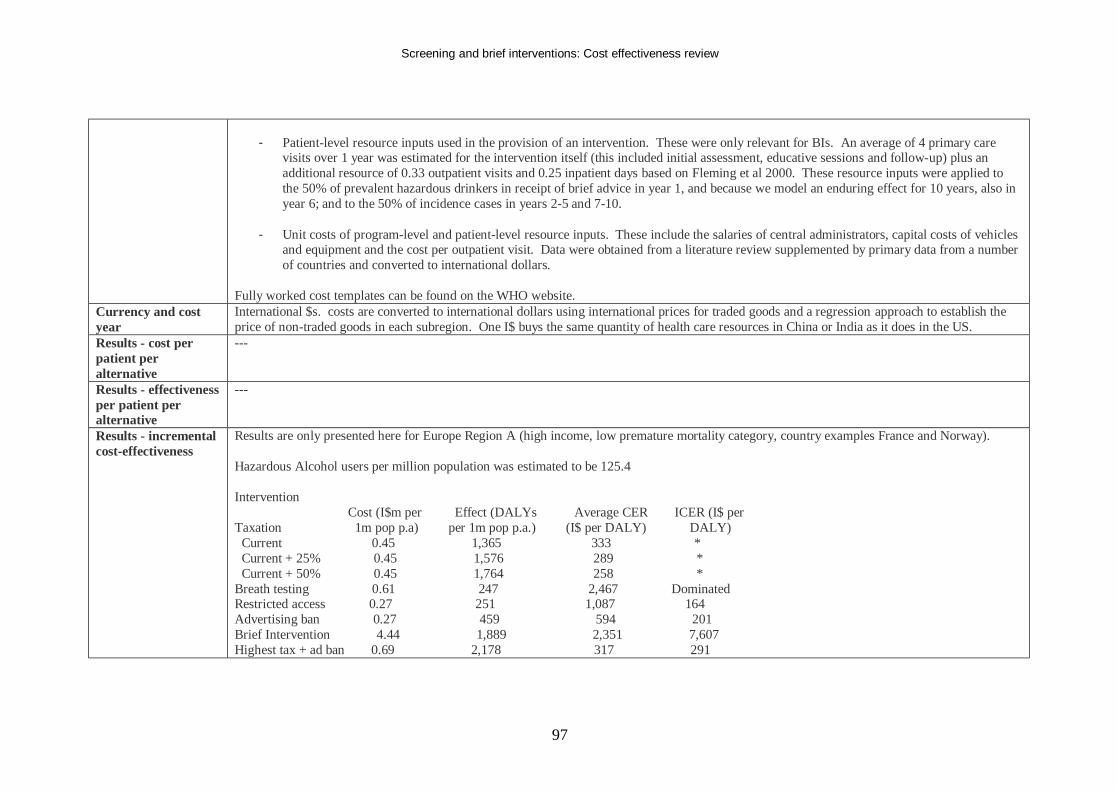
Screening and brief interventions: Cost effectiveness review
97
- Patient-level resource inputs used in the provision of an intervention. These were only relevant for BIs. An average of 4 primary care
visits over 1 year was estimated for the intervention itself (this included initial assessment, educative sessions and follow-up) plus an additional resource of 0.33 outpatient visits and 0.25 inpatient days based on Fleming et al 2000. These resource inputs were applied to the 50% of prevalent hazardous drinkers in receipt of brief advice in year 1, and because we model an enduring effect for 10 years, also in year 6; and to the 50% of incidence cases in years 2-5 and 7-10.
- Unit costs of program-level and patient-level resource inputs. These include the salaries of central administrators, capital costs of vehicles
and equipment and the cost per outpatient visit. Data were obtained from a literature review supplemented by primary data from a number of countries and converted to international dollars.
Fully worked cost templates can be found on the WHO website.
Currency and cost year
International $s. costs are converted to international dollars using international prices for traded goods and a regression approach to establish the price of non-traded goods in each subregion. One I$ buys the same quantity of health care resources in China or India as it does in the US.
Results - cost per patient per alternative
---
Results - effectiveness per patient per alternative
---
Results - incremental cost-effectiveness
Results are only presented here for Europe Region A (high income, low premature mortality category, country examples France and Norway). Hazardous Alcohol users per million population was estimated to be 125.4 Intervention Cost (I$m per Effect (DALYs Average CER ICER (I$ per Taxation 1m pop p.a) per 1m pop p.a.) (I$ per DALY) DALY) Current 0.45 1,365 333 * Current + 25% 0.45 1,576 289 * Current + 50% 0.45 1,764 258 * Breath testing 0.61 247 2,467 Dominated Restricted access 0.27 251 1,087 164 Advertising ban 0.27 459 594 201 Brief Intervention 4.44 1,889 2,351 7,607 Highest tax + ad ban 0.69 2,178 317 291
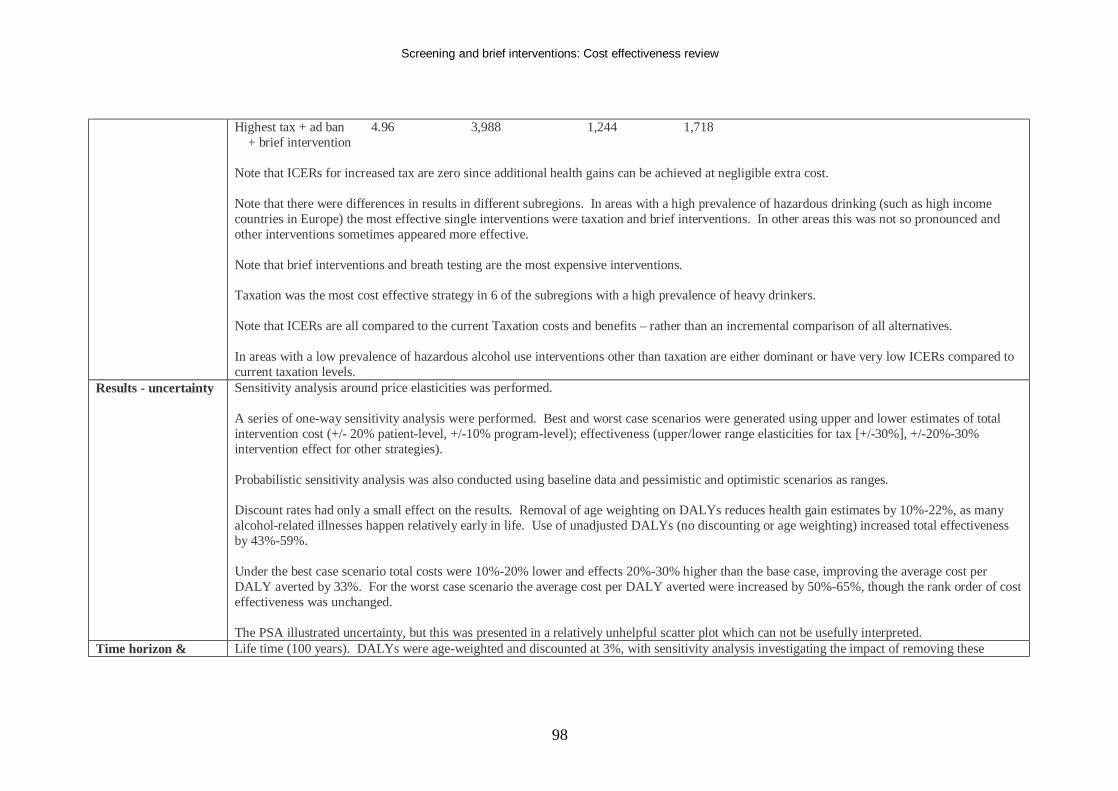
Screening and brief interventions: Cost effectiveness review
98
Highest tax + ad ban 4.96 3,988 1,244 1,718 + brief intervention Note that ICERs for increased tax are zero since additional health gains can be achieved at negligible extra cost. Note that there were differences in results in different subregions. In areas with a high prevalence of hazardous drinking (such as high income countries in Europe) the most effective single interventions were taxation and brief interventions. In other areas this was not so pronounced and other interventions sometimes appeared more effective. Note that brief interventions and breath testing are the most expensive interventions. Taxation was the most cost effective strategy in 6 of the subregions with a high prevalence of heavy drinkers. Note that ICERs are all compared to the current Taxation costs and benefits – rather than an incremental comparison of all alternatives. In areas with a low prevalence of hazardous alcohol use interventions other than taxation are either dominant or have very low ICERs compared to current taxation levels.
Results - uncertainty Sensitivity analysis around price elasticities was performed. A series of one-way sensitivity analysis were performed. Best and worst case scenarios were generated using upper and lower estimates of total intervention cost (+/- 20% patient-level, +/-10% program-level); effectiveness (upper/lower range elasticities for tax [+/-30%], +/-20%-30% intervention effect for other strategies). Probabilistic sensitivity analysis was also conducted using baseline data and pessimistic and optimistic scenarios as ranges. Discount rates had only a small effect on the results. Removal of age weighting on DALYs reduces health gain estimates by 10%-22%, as many alcohol-related illnesses happen relatively early in life. Use of unadjusted DALYs (no discounting or age weighting) increased total effectiveness by 43%-59%. Under the best case scenario total costs were 10%-20% lower and effects 20%-30% higher than the base case, improving the average cost per DALY averted by 33%. For the worst case scenario the average cost per DALY averted were increased by 50%-65%, though the rank order of cost effectiveness was unchanged. The PSA illustrated uncertainty, but this was presented in a relatively unhelpful scatter plot which can not be usefully interpreted.
Time horizon & Life time (100 years). DALYs were age-weighted and discounted at 3%, with sensitivity analysis investigating the impact of removing these
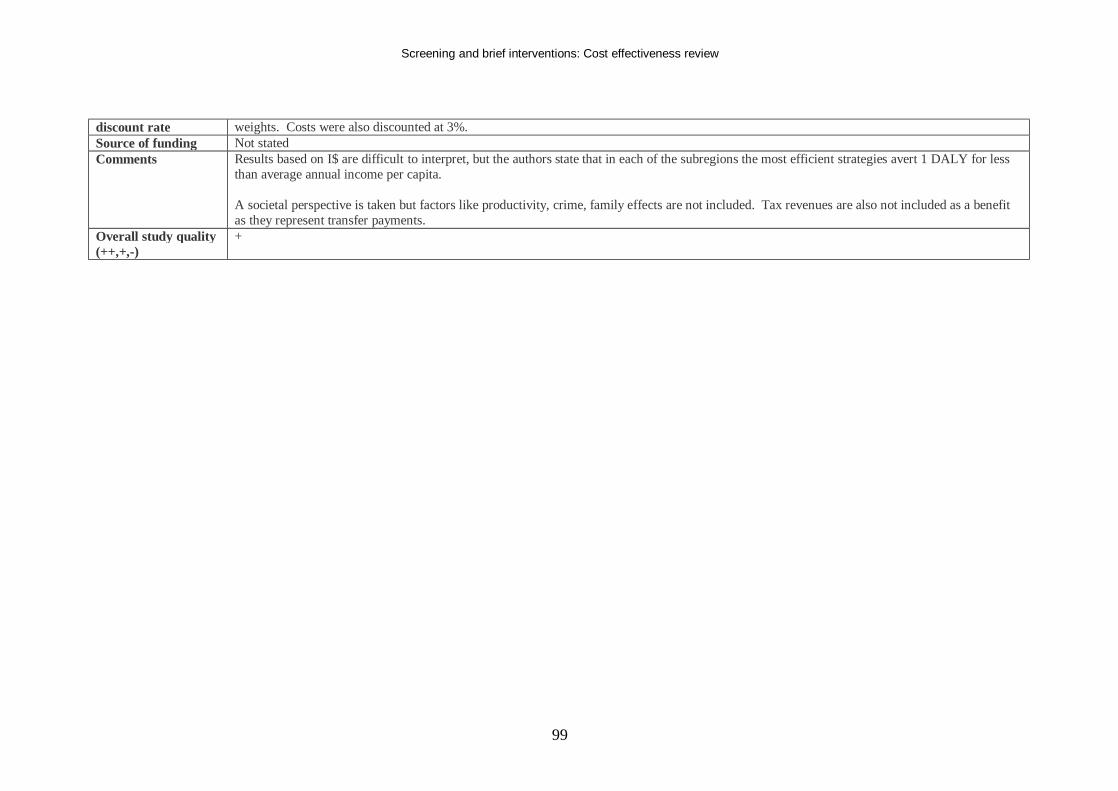
Screening and brief interventions: Cost effectiveness review
99
discount rate weights. Costs were also discounted at 3%. Source of funding Not stated Comments Results based on I$ are difficult to interpret, but the authors state that in each of the subregions the most efficient strategies avert 1 DALY for less
than average annual income per capita. A societal perspective is taken but factors like productivity, crime, family effects are not included. Tax revenues are also not included as a benefit as they represent transfer payments.
Overall study quality (++,+,-)
+
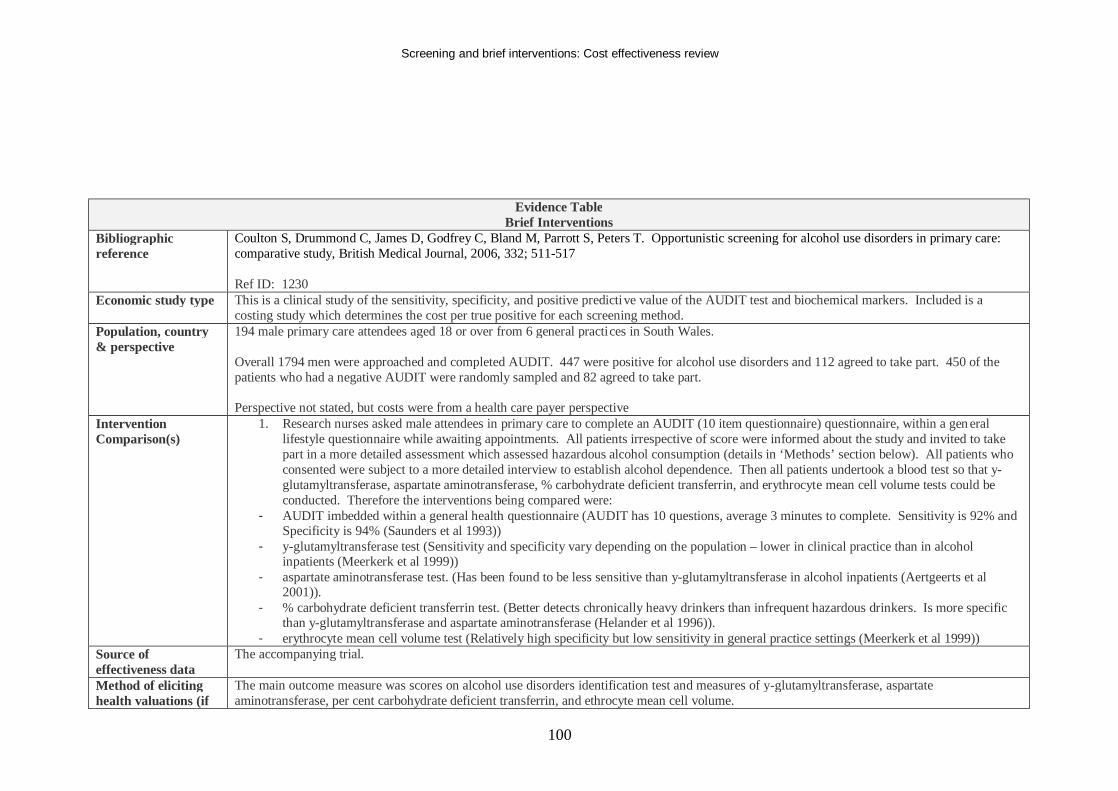
Screening and brief interventions: Cost effectiveness review
100
Evidence Table Brief Interventions
Bibliographic reference
Coulton S, Drummond C, James D, Godfrey C, Bland M, Parrott S, Peters T. Opportunistic screening for alcohol use disorders in primary care: comparative study, British Medical Journal, 2006, 332; 511-517 Ref ID: 1230
Economic study type This is a clinical study of the sensitivity, specificity, and positive predictive value of the AUDIT test and biochemical markers. Included is a costing study which determines the cost per true positive for each screening method.
Population, country & perspective
194 male primary care attendees aged 18 or over from 6 general practices in South Wales. Overall 1794 men were approached and completed AUDIT. 447 were positive for alcohol use disorders and 112 agreed to take part. 450 of the patients who had a negative AUDIT were randomly sampled and 82 agreed to take part. Perspective not stated, but costs were from a health care payer perspective
Intervention Comparison(s)
1. Research nurses asked male attendees in primary care to complete an AUDIT (10 item questionnaire) questionnaire, within a gen eral lifestyle questionnaire while awaiting appointments. All patients irrespective of score were informed about the study and invited to take part in a more detailed assessment which assessed hazardous alcohol consumption (details in ‘Methods’ section below). All patients who consented were subject to a more detailed interview to establish alcohol dependence. Then all patients undertook a blood test so that y-glutamyltransferase, aspartate aminotransferase, % carbohydrate deficient transferrin, and erythrocyte mean cell volume tests could be conducted. Therefore the interventions being compared were:
- AUDIT imbedded within a general health questionnaire (AUDIT has 10 questions, average 3 minutes to complete. Sensitivity is 92% and Specificity is 94% (Saunders et al 1993))
- y-glutamyltransferase test (Sensitivity and specificity vary depending on the population – lower in clinical practice than in alcohol inpatients (Meerkerk et al 1999))
- aspartate aminotransferase test. (Has been found to be less sensitive than y-glutamyltransferase in alcohol inpatients (Aertgeerts et al 2001)).
- % carbohydrate deficient transferrin test. (Better detects chronically heavy drinkers than infrequent hazardous drinkers. Is more specific than y-glutamyltransferase and aspartate aminotransferase (Helander et al 1996)).
- erythrocyte mean cell volume test (Relatively high specificity but low sensitivity in general practice settings (Meerkerk et al 1999)) Source of effectiveness data
The accompanying trial.
Method of eliciting health valuations (if
The main outcome measure was scores on alcohol use disorders identification test and measures of y-glutamyltransferase, aspartate aminotransferase, per cent carbohydrate deficient transferrin, and ethrocyte mean cell volume.
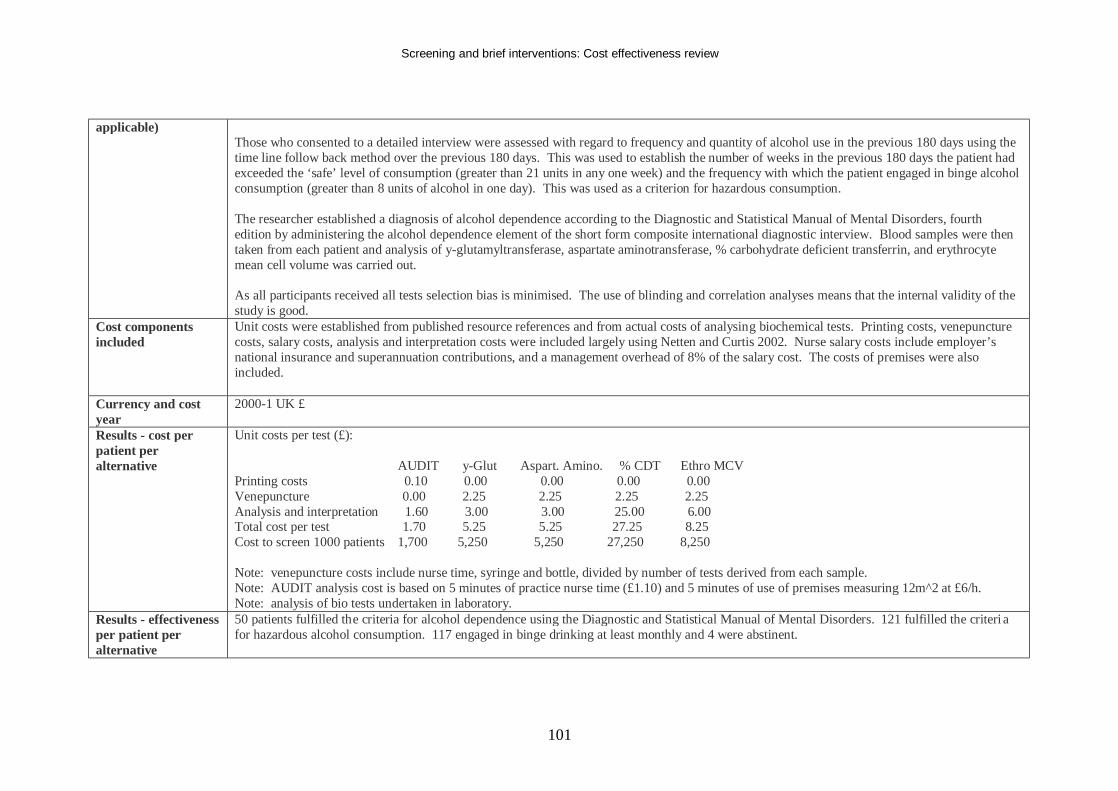
Screening and brief interventions: Cost effectiveness review
101
applicable) Those who consented to a detailed interview were assessed with regard to frequency and quantity of alcohol use in the previous 180 days using the time line follow back method over the previous 180 days. This was used to establish the number of weeks in the previous 180 days the patient had exceeded the ‘safe’ level of consumption (greater than 21 units in any one week) and the frequency with which the patient engaged in binge alcohol consumption (greater than 8 units of alcohol in one day). This was used as a criterion for hazardous consumption. The researcher established a diagnosis of alcohol dependence according to the Diagnostic and Statistical Manual of Mental Disorders, fourth edition by administering the alcohol dependence element of the short form composite international diagnostic interview. Blood samples were then taken from each patient and analysis of y-glutamyltransferase, aspartate aminotransferase, % carbohydrate deficient transferrin, and erythrocyte mean cell volume was carried out. As all participants received all tests selection bias is minimised. The use of blinding and correlation analyses means that the internal validity of the study is good.
Cost components included
Unit costs were established from published resource references and from actual costs of analysing biochemical tests. Printing costs, venepuncture costs, salary costs, analysis and interpretation costs were included largely using Netten and Curtis 2002. Nurse salary costs include employer’s national insurance and superannuation contributions, and a management overhead of 8% of the salary cost. The costs of premises were also included.
Currency and cost year
2000-1 UK £
Results - cost per patient per alternative
Unit costs per test (£): AUDIT y-Glut Aspart. Amino. % CDT Ethro MCV Printing costs 0.10 0.00 0.00 0.00 0.00 Venepuncture 0.00 2.25 2.25 2.25 2.25 Analysis and interpretation 1.60 3.00 3.00 25.00 6.00 Total cost per test 1.70 5.25 5.25 27.25 8.25 Cost to screen 1000 patients 1,700 5,250 5,250 27,250 8,250 Note: venepuncture costs include nurse time, syringe and bottle, divided by number of tests derived from each sample. Note: AUDIT analysis cost is based on 5 minutes of practice nurse time (£1.10) and 5 minutes of use of premises measuring 12m^2 at £6/h. Note: analysis of bio tests undertaken in laboratory.
Results - effectiveness per patient per alternative
50 patients fulfilled the criteria for alcohol dependence using the Diagnostic and Statistical Manual of Mental Disorders. 121 fulfilled the criteri a for hazardous alcohol consumption. 117 engaged in binge drinking at least monthly and 4 were abstinent.
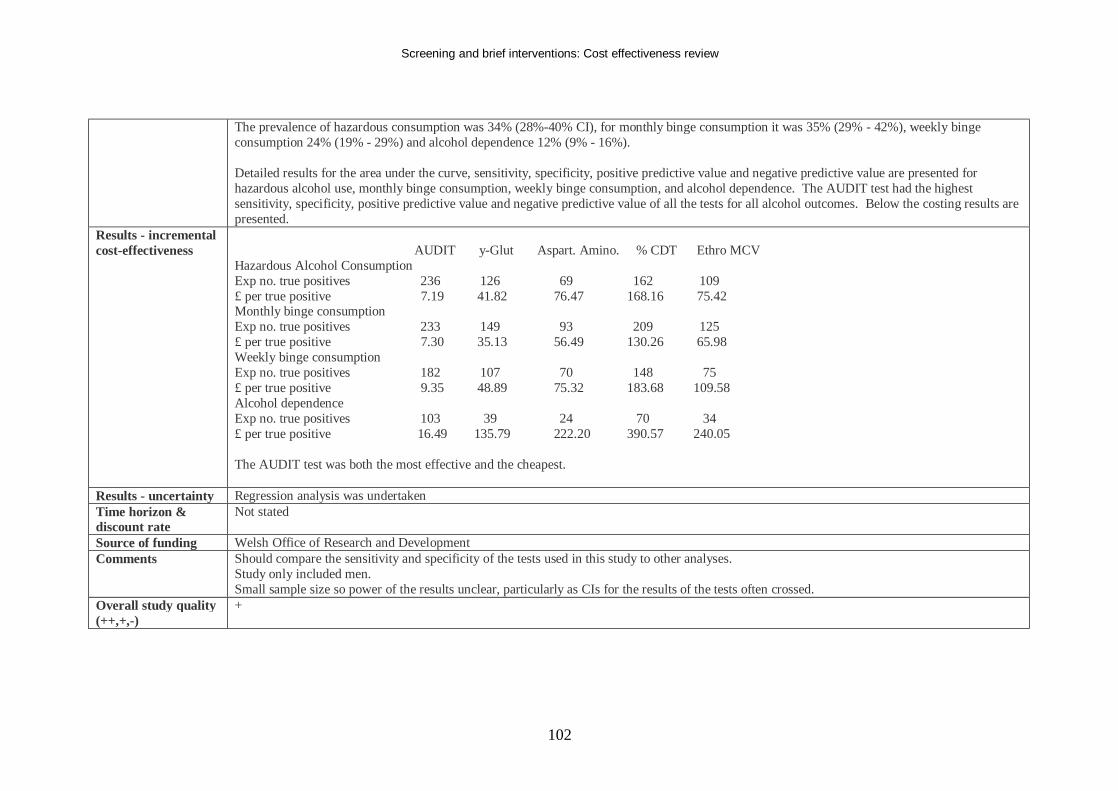
Screening and brief interventions: Cost effectiveness review
102
The prevalence of hazardous consumption was 34% (28%-40% CI), for monthly binge consumption it was 35% (29% - 42%), weekly binge consumption 24% (19% - 29%) and alcohol dependence 12% (9% - 16%). Detailed results for the area under the curve, sensitivity, specificity, positive predictive value and negative predictive value are presented for hazardous alcohol use, monthly binge consumption, weekly binge consumption, and alcohol dependence. The AUDIT test had the highest sensitivity, specificity, positive predictive value and negative predictive value of all the tests for all alcohol outcomes. Below the costing results are presented.
Results - incremental cost-effectiveness
AUDIT y-Glut Aspart. Amino. % CDT Ethro MCV Hazardous Alcohol Consumption Exp no. true positives 236 126 69 162 109 £ per true positive 7.19 41.82 76.47 168.16 75.42 Monthly binge consumption Exp no. true positives 233 149 93 209 125 £ per true positive 7.30 35.13 56.49 130.26 65.98 Weekly binge consumption Exp no. true positives 182 107 70 148 75 £ per true positive 9.35 48.89 75.32 183.68 109.58 Alcohol dependence Exp no. true positives 103 39 24 70 34 £ per true positive 16.49 135.79 222.20 390.57 240.05 The AUDIT test was both the most effective and the cheapest.
Results - uncertainty Regression analysis was undertaken Time horizon & discount rate
Not stated
Source of funding Welsh Office of Research and Development Comments Should compare the sensitivity and specificity of the tests used in this study to other analyses.
Study only included men. Small sample size so power of the results unclear, particularly as CIs for the results of the tests often crossed.
Overall study quality (++,+,-)
+
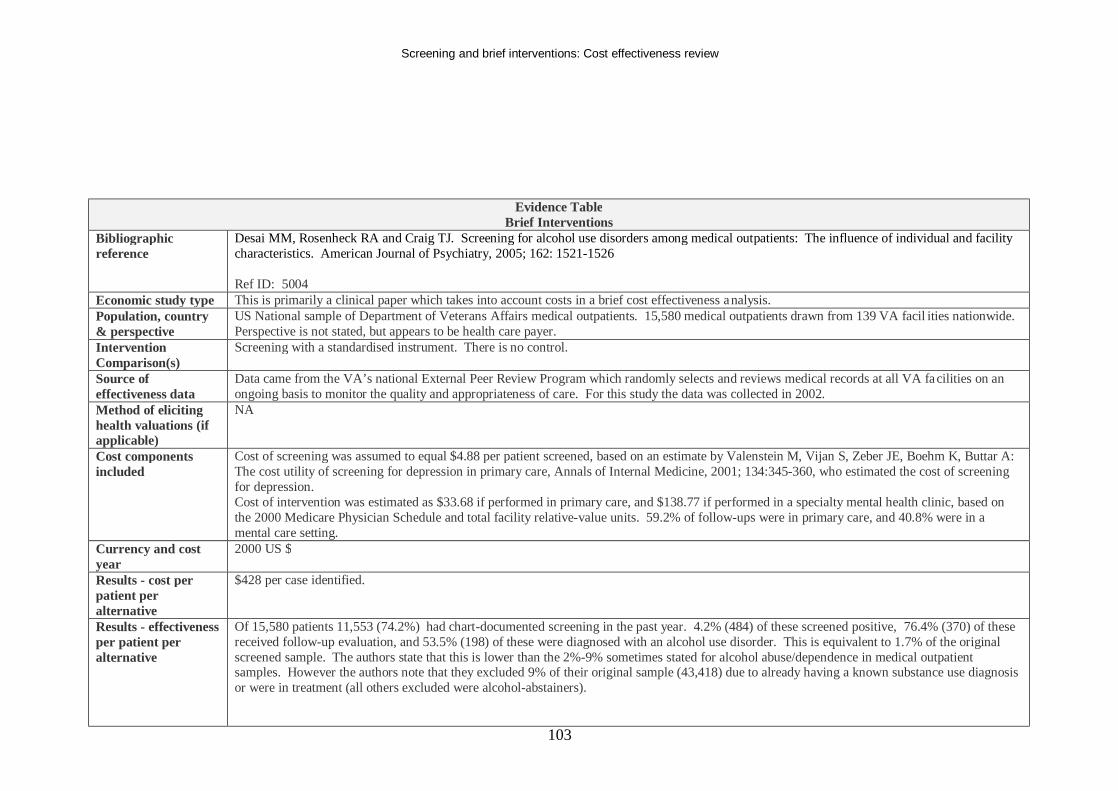
Screening and brief interventions: Cost effectiveness review
103
Evidence Table Brief Interventions
Bibliographic reference
Desai MM, Rosenheck RA and Craig TJ. Screening for alcohol use disorders among medical outpatients: The influence of individual and facility characteristics. American Journal of Psychiatry, 2005; 162: 1521-1526 Ref ID: 5004
Economic study type This is primarily a clinical paper which takes into account costs in a brief cost effectiveness analysis. Population, country & perspective
US National sample of Department of Veterans Affairs medical outpatients. 15,580 medical outpatients drawn from 139 VA facil ities nationwide. Perspective is not stated, but appears to be health care payer.
Intervention Comparison(s)
Screening with a standardised instrument. There is no control.
Source of effectiveness data
Data came from the VA’s national External Peer Review Program which randomly selects and reviews medical records at all VA facilities on an ongoing basis to monitor the quality and appropriateness of care. For this study the data was collected in 2002.
Method of eliciting health valuations (if applicable)
NA
Cost components included
Cost of screening was assumed to equal $4.88 per patient screened, based on an estimate by Valenstein M, Vijan S, Zeber JE, Boehm K, Buttar A: The cost utility of screening for depression in primary care, Annals of Internal Medicine, 2001; 134:345-360, who estimated the cost of screening for depression. Cost of intervention was estimated as $33.68 if performed in primary care, and $138.77 if performed in a specialty mental health clinic, based on the 2000 Medicare Physician Schedule and total facility relative-value units. 59.2% of follow-ups were in primary care, and 40.8% were in a mental care setting.
Currency and cost year
2000 US $
Results - cost per patient per alternative
$428 per case identified.
Results - effectiveness per patient per alternative
Of 15,580 patients 11,553 (74.2%) had chart-documented screening in the past year. 4.2% (484) of these screened positive, 76.4% (370) of these received follow-up evaluation, and 53.5% (198) of these were diagnosed with an alcohol use disorder. This is equivalent to 1.7% of the original screened sample. The authors state that this is lower than the 2%-9% sometimes stated for alcohol abuse/dependence in medical outpatient samples. However the authors note that they excluded 9% of their original sample (43,418) due to already having a known substance use diagnosis or were in treatment (all others excluded were alcohol-abstainers).
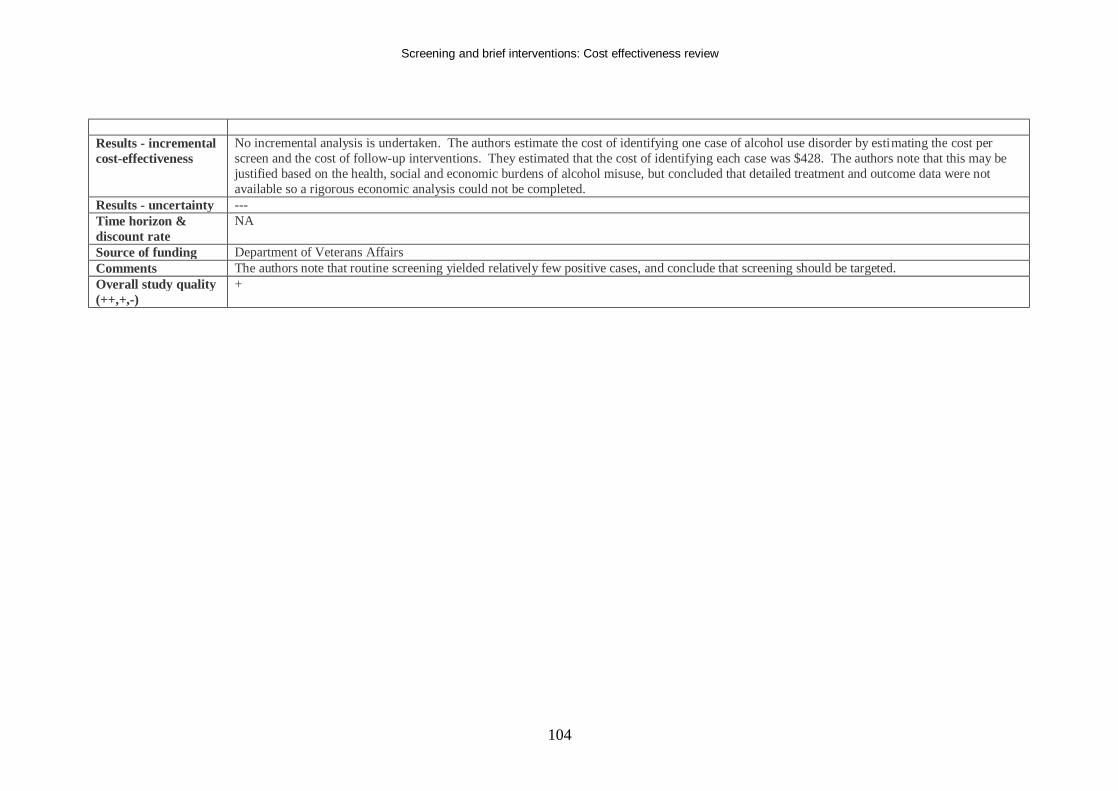
Screening and brief interventions: Cost effectiveness review
104
Results - incremental cost-effectiveness
No incremental analysis is undertaken. The authors estimate the cost of identifying one case of alcohol use disorder by estimating the cost per screen and the cost of follow-up interventions. They estimated that the cost of identifying each case was $428. The authors note that this may be justified based on the health, social and economic burdens of alcohol misuse, but concluded that detailed treatment and outcome data were not available so a rigorous economic analysis could not be completed.
Results - uncertainty --- Time horizon & discount rate
NA
Source of funding Department of Veterans Affairs Comments The authors note that routine screening yielded relatively few positive cases, and conclude that screening should be targeted. Overall study quality (++,+,-)
+
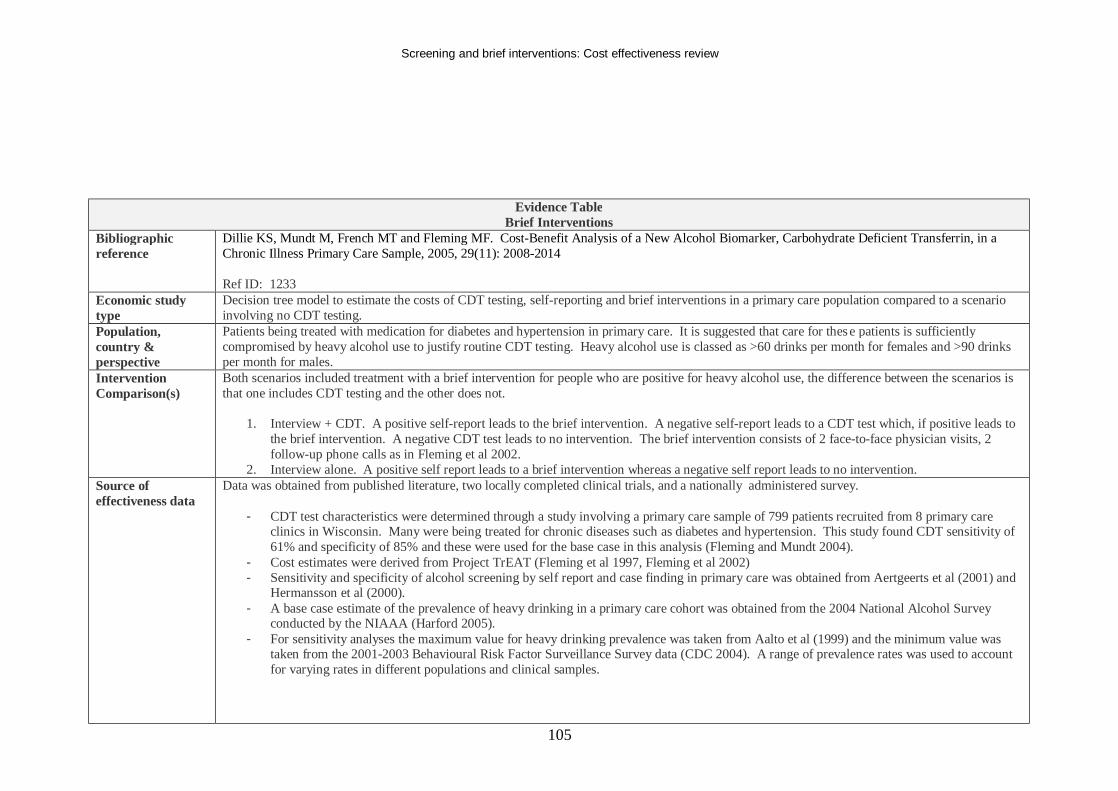
Screening and brief interventions: Cost effectiveness review
105
Evidence Table Brief Interventions
Bibliographic reference
Dillie KS, Mundt M, French MT and Fleming MF. Cost-Benefit Analysis of a New Alcohol Biomarker, Carbohydrate Deficient Transferrin, in a Chronic Illness Primary Care Sample, 2005, 29(11): 2008-2014 Ref ID: 1233
Economic study type
Decision tree model to estimate the costs of CDT testing, self-reporting and brief interventions in a primary care population compared to a scenario involving no CDT testing.
Population, country & perspective
Patients being treated with medication for diabetes and hypertension in primary care. It is suggested that care for these patients is sufficiently compromised by heavy alcohol use to justify routine CDT testing. Heavy alcohol use is classed as >60 drinks per month for females and >90 drinks per month for males.
Intervention Comparison(s)
Both scenarios included treatment with a brief intervention for people who are positive for heavy alcohol use, the difference between the scenarios is that one includes CDT testing and the other does not.
1. Interview + CDT. A positive self-report leads to the brief intervention. A negative self-report leads to a CDT test which, if positive leads to the brief intervention. A negative CDT test leads to no intervention. The brief intervention consists of 2 face-to-face physician visits, 2 follow-up phone calls as in Fleming et al 2002.
2. Interview alone. A positive self report leads to a brief intervention whereas a negative self report leads to no intervention. Source of effectiveness data
Data was obtained from published literature, two locally completed clinical trials, and a nationally administered survey.
- CDT test characteristics were determined through a study involving a primary care sample of 799 patients recruited from 8 primary care clinics in Wisconsin. Many were being treated for chronic diseases such as diabetes and hypertension. This study found CDT sensitivity of 61% and specificity of 85% and these were used for the base case in this analysis (Fleming and Mundt 2004).
- Cost estimates were derived from Project TrEAT (Fleming et al 1997, Fleming et al 2002) - Sensitivity and specificity of alcohol screening by self report and case finding in primary care was obtained from Aertgeerts et al (2001) and
Hermansson et al (2000). - A base case estimate of the prevalence of heavy drinking in a primary care cohort was obtained from the 2004 National Alcohol Survey
conducted by the NIAAA (Harford 2005). - For sensitivity analyses the maximum value for heavy drinking prevalence was taken from Aalto et al (1999) and the minimum value was
taken from the 2001-2003 Behavioural Risk Factor Surveillance Survey data (CDC 2004). A range of prevalence rates was used to account for varying rates in different populations and clinical samples.
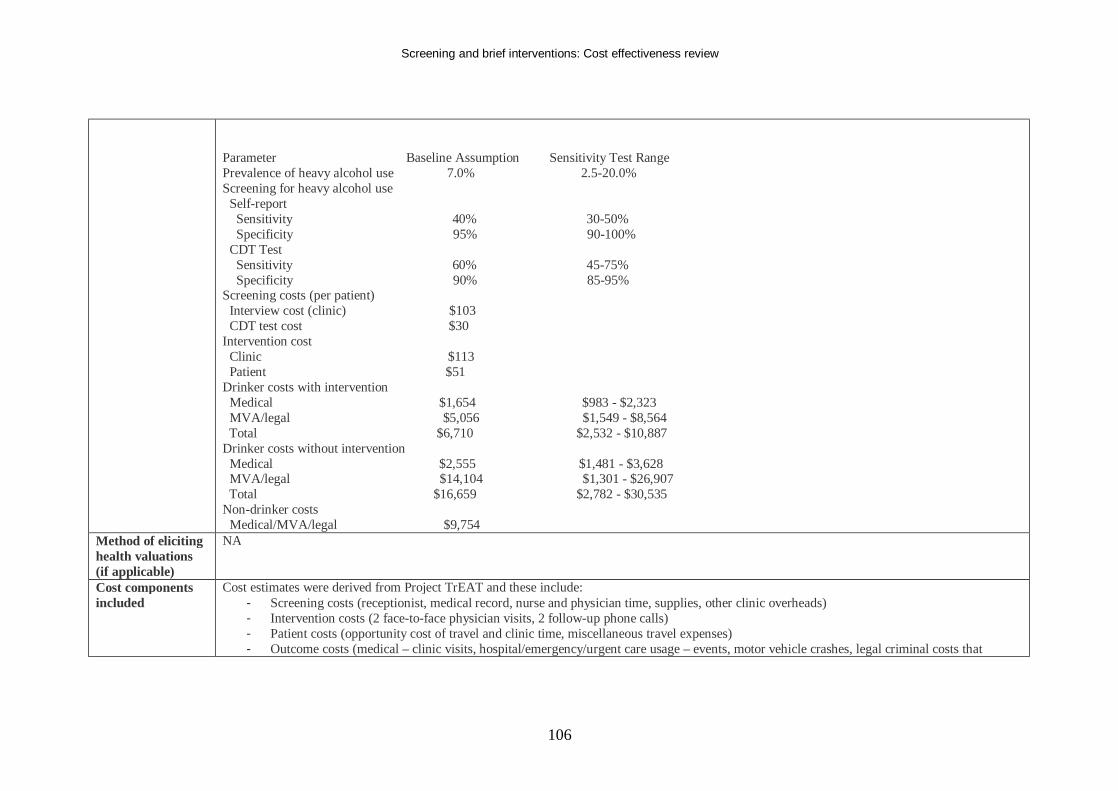
Screening and brief interventions: Cost effectiveness review
106
Parameter Baseline Assumption Sensitivity Test Range Prevalence of heavy alcohol use 7.0% 2.5-20.0% Screening for heavy alcohol use Self-report Sensitivity 40% 30-50% Specificity 95% 90-100% CDT Test Sensitivity 60% 45-75% Specificity 90% 85-95% Screening costs (per patient) Interview cost (clinic) $103 CDT test cost $30 Intervention cost Clinic $113 Patient $51 Drinker costs with intervention Medical $1,654 $983 - $2,323 MVA/legal $5,056 $1,549 - $8,564 Total $6,710 $2,532 - $10,887 Drinker costs without intervention Medical $2,555 $1,481 - $3,628 MVA/legal $14,104 $1,301 - $26,907 Total $16,659 $2,782 - $30,535 Non-drinker costs Medical/MVA/legal $9,754
Method of eliciting health valuations (if applicable)
NA
Cost components included
Cost estimates were derived from Project TrEAT and these include: - Screening costs (receptionist, medical record, nurse and physician time, supplies, other clinic overheads) - Intervention costs (2 face-to-face physician visits, 2 follow-up phone calls) - Patient costs (opportunity cost of travel and clinic time, miscellaneous travel expenses) - Outcome costs (medical – clinic visits, hospital/emergency/urgent care usage – events, motor vehicle crashes, legal criminal costs that
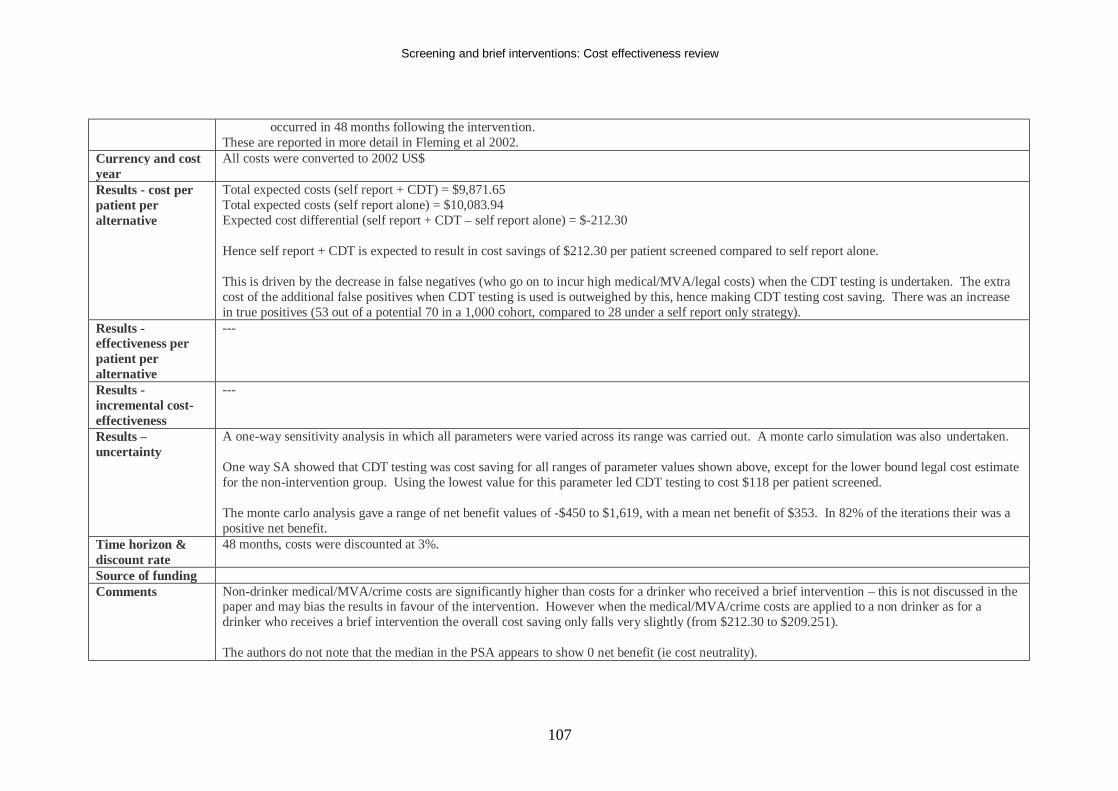
Screening and brief interventions: Cost effectiveness review
107
occurred in 48 months following the intervention. These are reported in more detail in Fleming et al 2002.
Currency and cost year
All costs were converted to 2002 US$
Results - cost per patient per alternative
Total expected costs (self report + CDT) = $9,871.65 Total expected costs (self report alone) = $10,083.94 Expected cost differential (self report + CDT – self report alone) = $-212.30 Hence self report + CDT is expected to result in cost savings of $212.30 per patient screened compared to self report alone. This is driven by the decrease in false negatives (who go on to incur high medical/MVA/legal costs) when the CDT testing is undertaken. The extra cost of the additional false positives when CDT testing is used is outweighed by this, hence making CDT testing cost saving. There was an increase in true positives (53 out of a potential 70 in a 1,000 cohort, compared to 28 under a self report only strategy).
Results - effectiveness per patient per alternative
---
Results - incremental cost-effectiveness
---
Results – uncertainty
A one-way sensitivity analysis in which all parameters were varied across its range was carried out. A monte carlo simulation was also undertaken. One way SA showed that CDT testing was cost saving for all ranges of parameter values shown above, except for the lower bound legal cost estimate for the non-intervention group. Using the lowest value for this parameter led CDT testing to cost $118 per patient screened. The monte carlo analysis gave a range of net benefit values of -$450 to $1,619, with a mean net benefit of $353. In 82% of the iterations their was a positive net benefit.
Time horizon & discount rate
48 months, costs were discounted at 3%.
Source of funding Comments Non-drinker medical/MVA/crime costs are significantly higher than costs for a drinker who received a brief intervention – this is not discussed in the
paper and may bias the results in favour of the intervention. However when the medical/MVA/crime costs are applied to a non drinker as for a drinker who receives a brief intervention the overall cost saving only falls very slightly (from $212.30 to $209.251). The authors do not note that the median in the PSA appears to show 0 net benefit (ie cost neutrality).
Screening and brief interventions: Cost effectiveness review
108
The results are highly dependent on the high MVA/legal costs associated with a drinker who does not have a brief intervention. A lot depends on whether this is a true parameter. The authors note that Fleming et al 2002 and 2004 provide evidence that this is not accidental. No quality of life scores are included. Higher rates of heavy drinking prevalence are associated with higher cost savings with CDT testing.
Overall study quality (++,+,-)
+
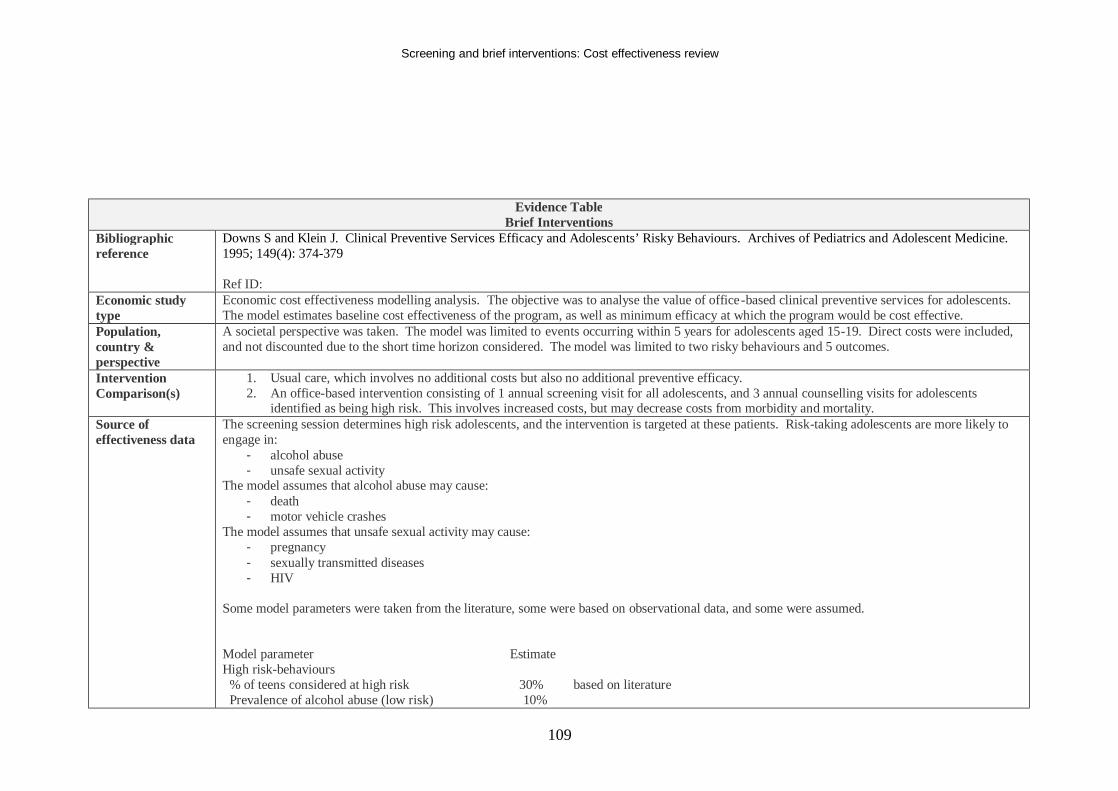
Screening and brief interventions: Cost effectiveness review
109
Evidence Table Brief Interventions
Bibliographic reference
Downs S and Klein J. Clinical Preventive Services Efficacy and Adolescents’ Risky Behaviours. Archives of Pediatrics and Adolescent Medicine. 1995; 149(4): 374-379 Ref ID:
Economic study type
Economic cost effectiveness modelling analysis. The objective was to analyse the value of office-based clinical preventive services for adolescents. The model estimates baseline cost effectiveness of the program, as well as minimum efficacy at which the program would be cost effective.
Population, country & perspective
A societal perspective was taken. The model was limited to events occurring within 5 years for adolescents aged 15-19. Direct costs were included, and not discounted due to the short time horizon considered. The model was limited to two risky behaviours and 5 outcomes.
Intervention Comparison(s)
1. Usual care, which involves no additional costs but also no additional preventive efficacy. 2. An office-based intervention consisting of 1 annual screening visit for all adolescents, and 3 annual counselling visits for adolescents
identified as being high risk. This involves increased costs, but may decrease costs from morbidity and mortality. Source of effectiveness data
The screening session determines high risk adolescents, and the intervention is targeted at these patients. Risk-taking adolescents are more likely to engage in:
- alcohol abuse - unsafe sexual activity
The model assumes that alcohol abuse may cause: - death - motor vehicle crashes
The model assumes that unsafe sexual activity may cause: - pregnancy - sexually transmitted diseases - HIV
Some model parameters were taken from the literature, some were based on observational data, and some were assumed. Model parameter Estimate High risk-behaviours % of teens considered at high risk 30% based on literature Prevalence of alcohol abuse (low risk) 10%
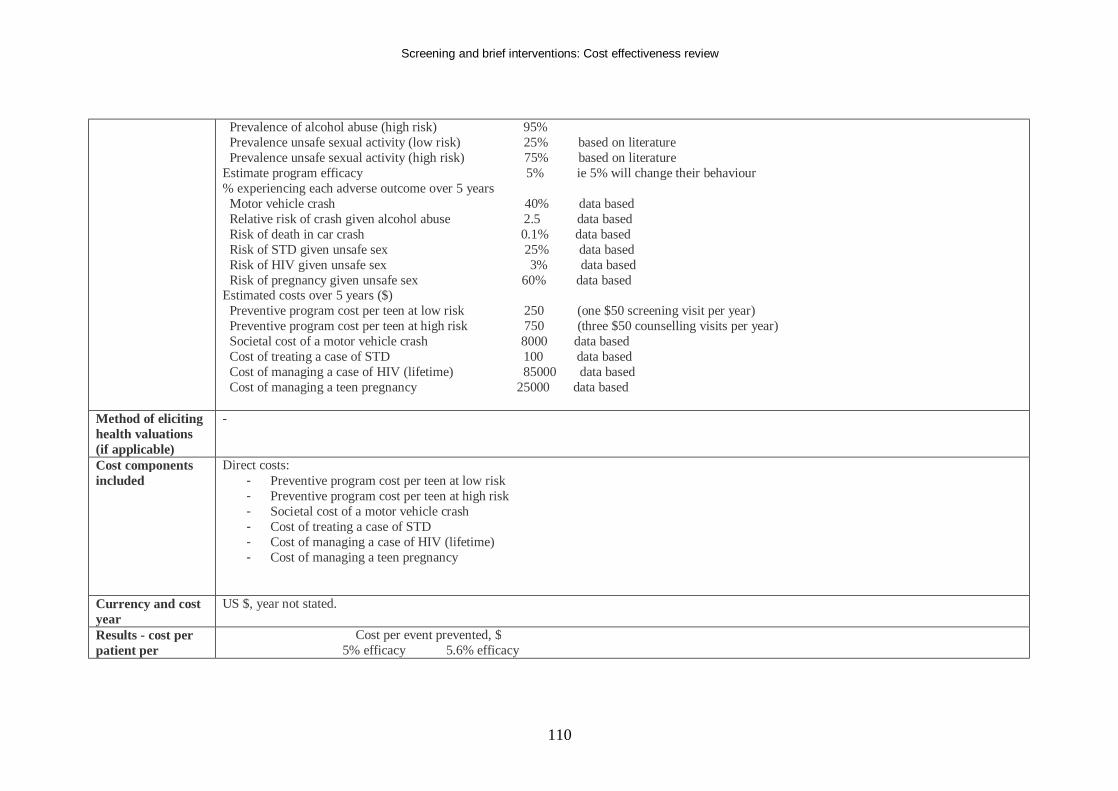
Screening and brief interventions: Cost effectiveness review
110
Prevalence of alcohol abuse (high risk) 95% Prevalence unsafe sexual activity (low risk) 25% based on literature Prevalence unsafe sexual activity (high risk) 75% based on literature Estimate program efficacy 5% ie 5% will change their behaviour % experiencing each adverse outcome over 5 years Motor vehicle crash 40% data based Relative risk of crash given alcohol abuse 2.5 data based Risk of death in car crash 0.1% data based Risk of STD given unsafe sex 25% data based Risk of HIV given unsafe sex 3% data based Risk of pregnancy given unsafe sex 60% data based Estimated costs over 5 years ($) Preventive program cost per teen at low risk 250 (one $50 screening visit per year) Preventive program cost per teen at high risk 750 (three $50 counselling visits per year) Societal cost of a motor vehicle crash 8000 data based Cost of treating a case of STD 100 data based Cost of managing a case of HIV (lifetime) 85000 data based Cost of managing a teen pregnancy 25000 data based
Method of eliciting health valuations (if applicable)
-
Cost components included
Direct costs: - Preventive program cost per teen at low risk - Preventive program cost per teen at high risk - Societal cost of a motor vehicle crash - Cost of treating a case of STD - Cost of managing a case of HIV (lifetime) - Cost of managing a teen pregnancy
Currency and cost year
US $, year not stated.
Results - cost per patient per
Cost per event prevented, $ 5% efficacy 5.6% efficacy
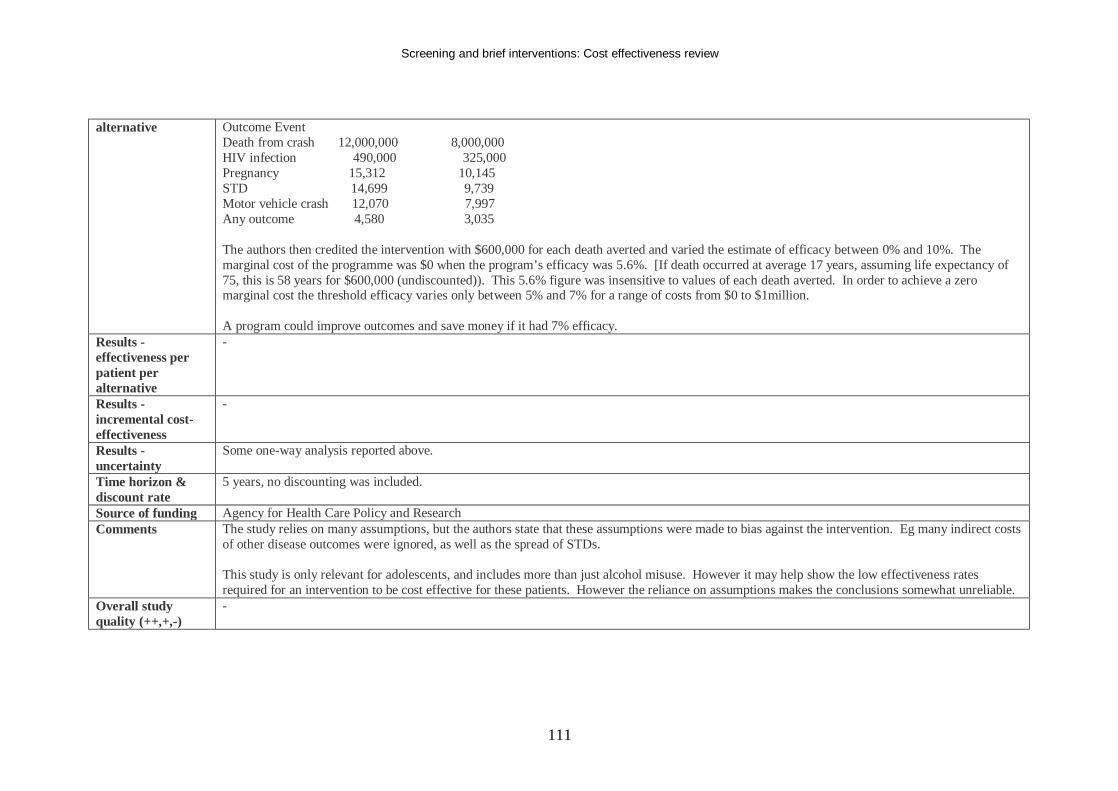
Screening and brief interventions: Cost effectiveness review
111
alternative Outcome Event Death from crash 12,000,000 8,000,000 HIV infection 490,000 325,000 Pregnancy 15,312 10,145 STD 14,699 9,739 Motor vehicle crash 12,070 7,997 Any outcome 4,580 3,035 The authors then credited the intervention with $600,000 for each death averted and varied the estimate of efficacy between 0% and 10%. The marginal cost of the programme was $0 when the program’s efficacy was 5.6%. [If death occurred at average 17 years, assuming life expectancy of 75, this is 58 years for $600,000 (undiscounted)). This 5.6% figure was insensitive to values of each death averted. In order to achieve a zero marginal cost the threshold efficacy varies only between 5% and 7% for a range of costs from $0 to $1million. A program could improve outcomes and save money if it had 7% efficacy.
Results - effectiveness per patient per alternative
-
Results - incremental cost-effectiveness
-
Results - uncertainty
Some one-way analysis reported above.
Time horizon & discount rate
5 years, no discounting was included.
Source of funding Agency for Health Care Policy and Research Comments The study relies on many assumptions, but the authors state that these assumptions were made to bias against the intervention. Eg many indirect costs
of other disease outcomes were ignored, as well as the spread of STDs. This study is only relevant for adolescents, and includes more than just alcohol misuse. However it may help show the low effectiveness rates required for an intervention to be cost effective for these patients. However the reliance on assumptions makes the conclusions somewhat unreliable.
Overall study quality (++,+,-)
-
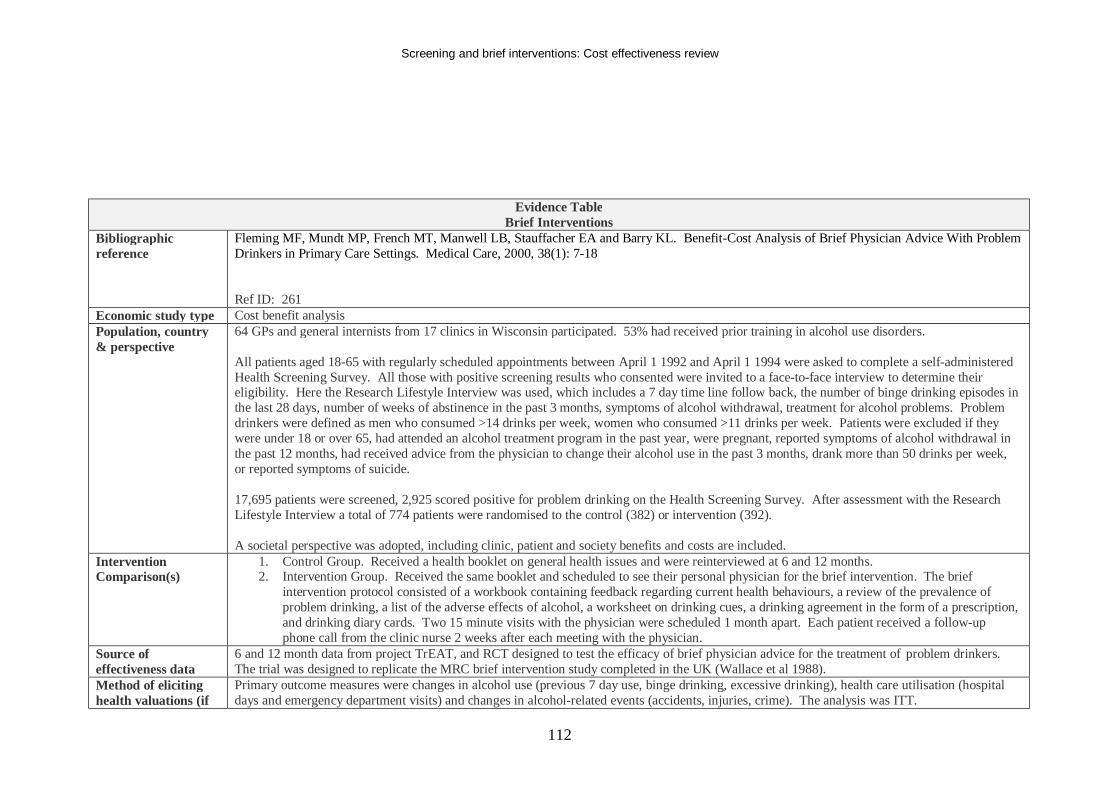
Screening and brief interventions: Cost effectiveness review
112
Evidence Table Brief Interventions
Bibliographic reference
Fleming MF, Mundt MP, French MT, Manwell LB, Stauffacher EA and Barry KL. Benefit-Cost Analysis of Brief Physician Advice With Problem Drinkers in Primary Care Settings. Medical Care, 2000, 38(1): 7-18 Ref ID: 261
Economic study type Cost benefit analysis Population, country & perspective
64 GPs and general internists from 17 clinics in Wisconsin participated. 53% had received prior training in alcohol use disorders. All patients aged 18-65 with regularly scheduled appointments between April 1 1992 and April 1 1994 were asked to complete a self-administered Health Screening Survey. All those with positive screening results who consented were invited to a face-to-face interview to determine their eligibility. Here the Research Lifestyle Interview was used, which includes a 7 day time line follow back, the number of binge drinking episodes in the last 28 days, number of weeks of abstinence in the past 3 months, symptoms of alcohol withdrawal, treatment for alcohol problems. Problem drinkers were defined as men who consumed >14 drinks per week, women who consumed >11 drinks per week. Patients were excluded if they were under 18 or over 65, had attended an alcohol treatment program in the past year, were pregnant, reported symptoms of alcohol withdrawal in the past 12 months, had received advice from the physician to change their alcohol use in the past 3 months, drank more than 50 drinks per week, or reported symptoms of suicide. 17,695 patients were screened, 2,925 scored positive for problem drinking on the Health Screening Survey. After assessment with the Research Lifestyle Interview a total of 774 patients were randomised to the control (382) or intervention (392). A societal perspective was adopted, including clinic, patient and society benefits and costs are included.
Intervention Comparison(s)
1. Control Group. Received a health booklet on general health issues and were reinterviewed at 6 and 12 months. 2. Intervention Group. Received the same booklet and scheduled to see their personal physician for the brief intervention. The brief
intervention protocol consisted of a workbook containing feedback regarding current health behaviours, a review of the prevalence of problem drinking, a list of the adverse effects of alcohol, a worksheet on drinking cues, a drinking agreement in the form of a prescription, and drinking diary cards. Two 15 minute visits with the physician were scheduled 1 month apart. Each patient received a follow-up phone call from the clinic nurse 2 weeks after each meeting with the physician.
Source of effectiveness data
6 and 12 month data from project TrEAT, and RCT designed to test the efficacy of brief physician advice for the treatment of problem drinkers. The trial was designed to replicate the MRC brief intervention study completed in the UK (Wallace et al 1988).
Method of eliciting health valuations (if
Primary outcome measures were changes in alcohol use (previous 7 day use, binge drinking, excessive drinking), health care utilisation (hospital days and emergency department visits) and changes in alcohol-related events (accidents, injuries, crime). The analysis was ITT.
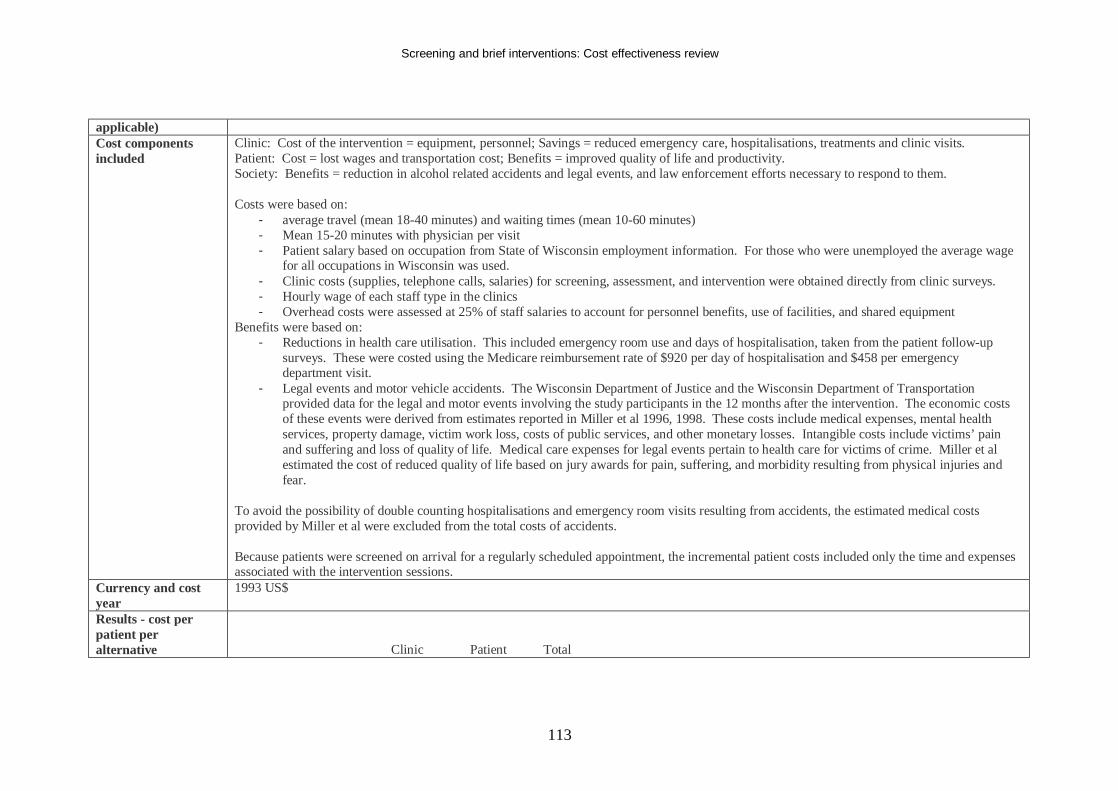
Screening and brief interventions: Cost effectiveness review
113
applicable) Cost components included
Clinic: Cost of the intervention = equipment, personnel; Savings = reduced emergency care, hospitalisations, treatments and clinic visits. Patient: Cost = lost wages and transportation cost; Benefits = improved quality of life and productivity. Society: Benefits = reduction in alcohol related accidents and legal events, and law enforcement efforts necessary to respond to them. Costs were based on:
- average travel (mean 18-40 minutes) and waiting times (mean 10-60 minutes) - Mean 15-20 minutes with physician per visit - Patient salary based on occupation from State of Wisconsin employment information. For those who were unemployed the average wage
for all occupations in Wisconsin was used. - Clinic costs (supplies, telephone calls, salaries) for screening, assessment, and intervention were obtained directly from clinic surveys. - Hourly wage of each staff type in the clinics - Overhead costs were assessed at 25% of staff salaries to account for personnel benefits, use of facilities, and shared equipment
Benefits were based on: - Reductions in health care utilisation. This included emergency room use and days of hospitalisation, taken from the patient follow-up
surveys. These were costed using the Medicare reimbursement rate of $920 per day of hospitalisation and $458 per emergency department visit.
- Legal events and motor vehicle accidents. The Wisconsin Department of Justice and the Wisconsin Department of Transportation provided data for the legal and motor events involving the study participants in the 12 months after the intervention. The economic costs of these events were derived from estimates reported in Miller et al 1996, 1998. These costs include medical expenses, mental health services, property damage, victim work loss, costs of public services, and other monetary losses. Intangible costs include victims’ pain and suffering and loss of quality of life. Medical care expenses for legal events pertain to health care for victims of crime. Miller et al estimated the cost of reduced quality of life based on jury awards for pain, suffering, and morbidity resulting from physical injuries and fear.
To avoid the possibility of double counting hospitalisations and emergency room visits resulting from accidents, the estimated medical costs provided by Miller et al were excluded from the total costs of accidents. Because patients were screened on arrival for a regularly scheduled appointment, the incremental patient costs included only the time and expenses associated with the intervention sessions.
Currency and cost year
1993 US$
Results - cost per patient per alternative
Clinic Patient Total
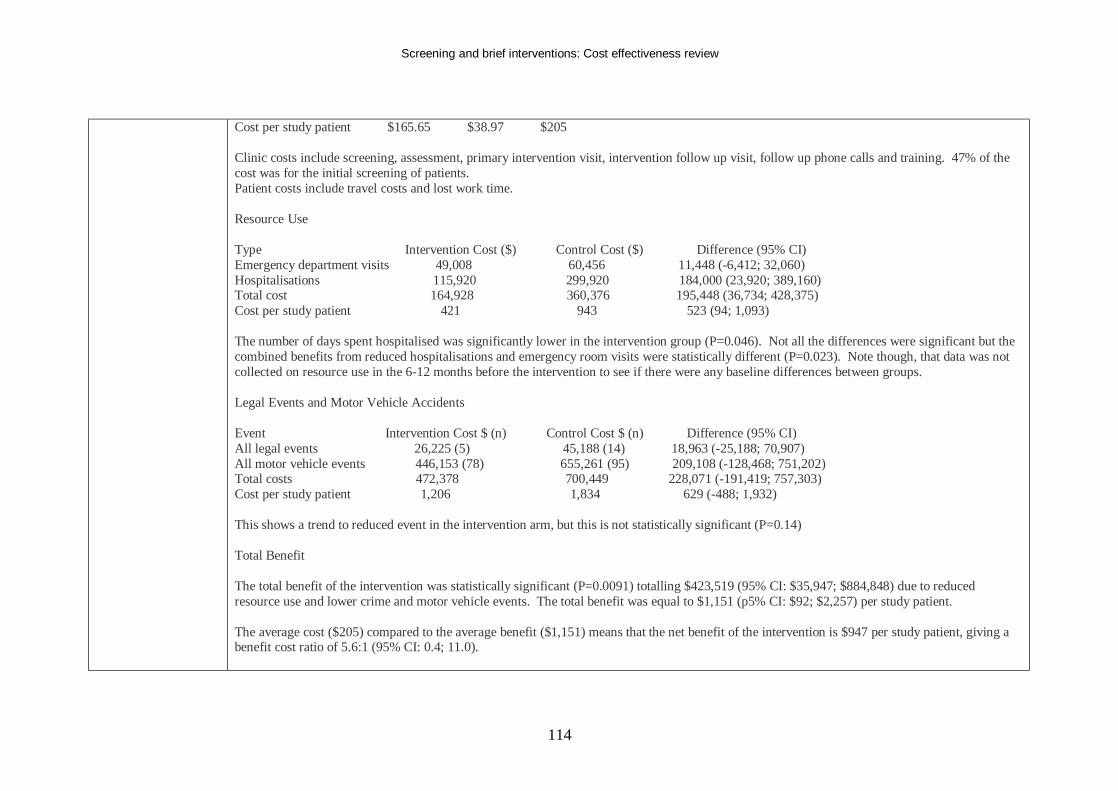
Screening and brief interventions: Cost effectiveness review
114
Cost per study patient $165.65 $38.97 $205 Clinic costs include screening, assessment, primary intervention visit, intervention follow up visit, follow up phone calls and training. 47% of the cost was for the initial screening of patients. Patient costs include travel costs and lost work time. Resource Use Type Intervention Cost ($) Control Cost ($) Difference (95% CI) Emergency department visits 49,008 60,456 11,448 (-6,412; 32,060) Hospitalisations 115,920 299,920 184,000 (23,920; 389,160) Total cost 164,928 360,376 195,448 (36,734; 428,375) Cost per study patient 421 943 523 (94; 1,093) The number of days spent hospitalised was significantly lower in the intervention group (P=0.046). Not all the differences were significant but the combined benefits from reduced hospitalisations and emergency room visits were statistically different (P=0.023). Note though, that data was not collected on resource use in the 6-12 months before the intervention to see if there were any baseline differences between groups. Legal Events and Motor Vehicle Accidents Event Intervention Cost $ (n) Control Cost $ (n) Difference (95% CI) All legal events 26,225 (5) 45,188 (14) 18,963 (-25,188; 70,907) All motor vehicle events 446,153 (78) 655,261 (95) 209,108 (-128,468; 751,202) Total costs 472,378 700,449 228,071 (-191,419; 757,303) Cost per study patient 1,206 1,834 629 (-488; 1,932) This shows a trend to reduced event in the intervention arm, but this is not statistically significant (P=0.14) Total Benefit The total benefit of the intervention was statistically significant (P=0.0091) totalling $423,519 (95% CI: $35,947; $884,848) due to reduced resource use and lower crime and motor vehicle events. The total benefit was equal to $1,151 (p5% CI: $92; $2,257) per study patient. The average cost ($205) compared to the average benefit ($1,151) means that the net benefit of the intervention is $947 per study patient, giving a benefit cost ratio of 5.6:1 (95% CI: 0.4; 11.0).
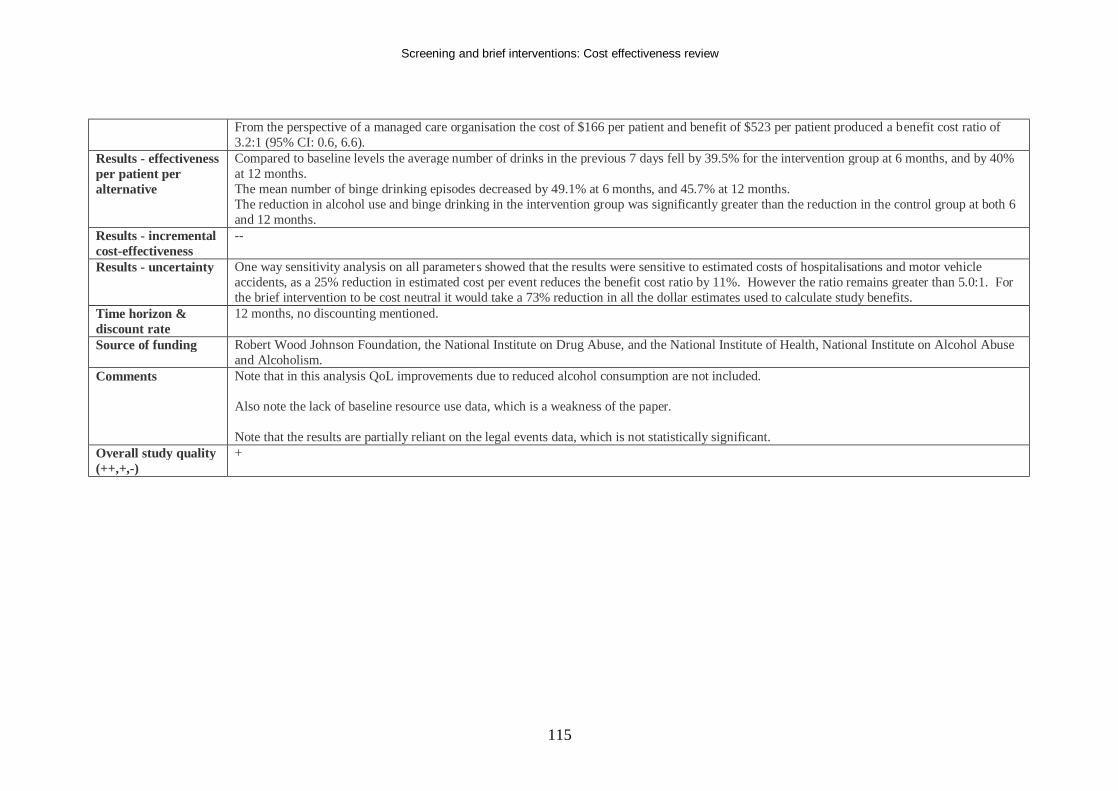
Screening and brief interventions: Cost effectiveness review
115
From the perspective of a managed care organisation the cost of $166 per patient and benefit of $523 per patient produced a benefit cost ratio of 3.2:1 (95% CI: 0.6, 6.6).
Results - effectiveness per patient per alternative
Compared to baseline levels the average number of drinks in the previous 7 days fell by 39.5% for the intervention group at 6 months, and by 40% at 12 months. The mean number of binge drinking episodes decreased by 49.1% at 6 months, and 45.7% at 12 months. The reduction in alcohol use and binge drinking in the intervention group was significantly greater than the reduction in the control group at both 6 and 12 months.
Results - incremental cost-effectiveness
--
Results - uncertainty One way sensitivity analysis on all parameters showed that the results were sensitive to estimated costs of hospitalisations and motor vehicle accidents, as a 25% reduction in estimated cost per event reduces the benefit cost ratio by 11%. However the ratio remains greater than 5.0:1. For the brief intervention to be cost neutral it would take a 73% reduction in all the dollar estimates used to calculate study benefits.
Time horizon & discount rate
12 months, no discounting mentioned.
Source of funding Robert Wood Johnson Foundation, the National Institute on Drug Abuse, and the National Institute of Health, National Institute on Alcohol Abuse and Alcoholism.
Comments Note that in this analysis QoL improvements due to reduced alcohol consumption are not included. Also note the lack of baseline resource use data, which is a weakness of the paper. Note that the results are partially reliant on the legal events data, which is not statistically significant.
Overall study quality (++,+,-)
+
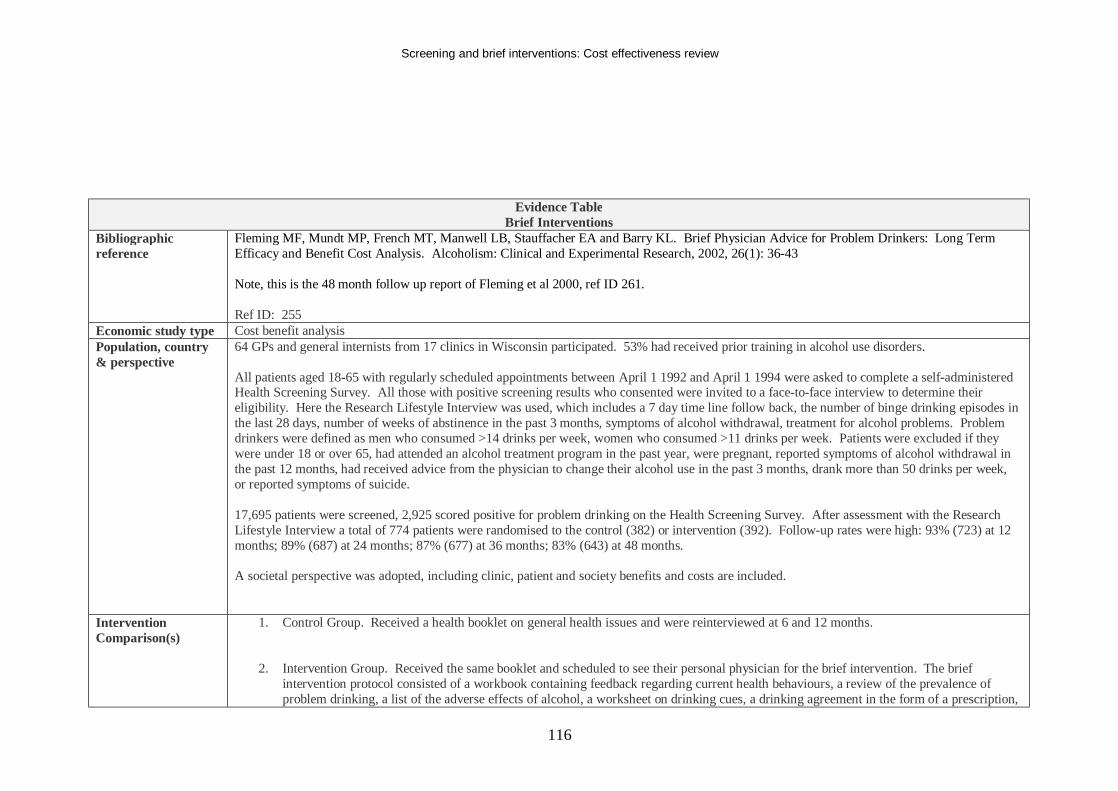
Screening and brief interventions: Cost effectiveness review
116
Evidence Table Brief Interventions
Bibliographic reference
Fleming MF, Mundt MP, French MT, Manwell LB, Stauffacher EA and Barry KL. Brief Physician Advice for Problem Drinkers: Long Term Efficacy and Benefit Cost Analysis. Alcoholism: Clinical and Experimental Research, 2002, 26(1): 36-43 Note, this is the 48 month follow up report of Fleming et al 2000, ref ID 261. Ref ID: 255
Economic study type Cost benefit analysis Population, country & perspective
64 GPs and general internists from 17 clinics in Wisconsin participated. 53% had received prior training in alcohol use disorders. All patients aged 18-65 with regularly scheduled appointments between April 1 1992 and April 1 1994 were asked to complete a self-administered Health Screening Survey. All those with positive screening results who consented were invited to a face-to-face interview to determine their eligibility. Here the Research Lifestyle Interview was used, which includes a 7 day time line follow back, the number of binge drinking episodes in the last 28 days, number of weeks of abstinence in the past 3 months, symptoms of alcohol withdrawal, treatment for alcohol problems. Problem drinkers were defined as men who consumed >14 drinks per week, women who consumed >11 drinks per week. Patients were excluded if they were under 18 or over 65, had attended an alcohol treatment program in the past year, were pregnant, reported symptoms of alcohol withdrawal in the past 12 months, had received advice from the physician to change their alcohol use in the past 3 months, drank more than 50 drinks per week, or reported symptoms of suicide. 17,695 patients were screened, 2,925 scored positive for problem drinking on the Health Screening Survey. After assessment with the Research Lifestyle Interview a total of 774 patients were randomised to the control (382) or intervention (392). Follow-up rates were high: 93% (723) at 12 months; 89% (687) at 24 months; 87% (677) at 36 months; 83% (643) at 48 months. A societal perspective was adopted, including clinic, patient and society benefits and costs are included.
Intervention Comparison(s)
1. Control Group. Received a health booklet on general health issues and were reinterviewed at 6 and 12 months.
2. Intervention Group. Received the same booklet and scheduled to see their personal physician for the brief intervention. The brief
intervention protocol consisted of a workbook containing feedback regarding current health behaviours, a review of the prevalence of problem drinking, a list of the adverse effects of alcohol, a worksheet on drinking cues, a drinking agreement in the form of a prescription,
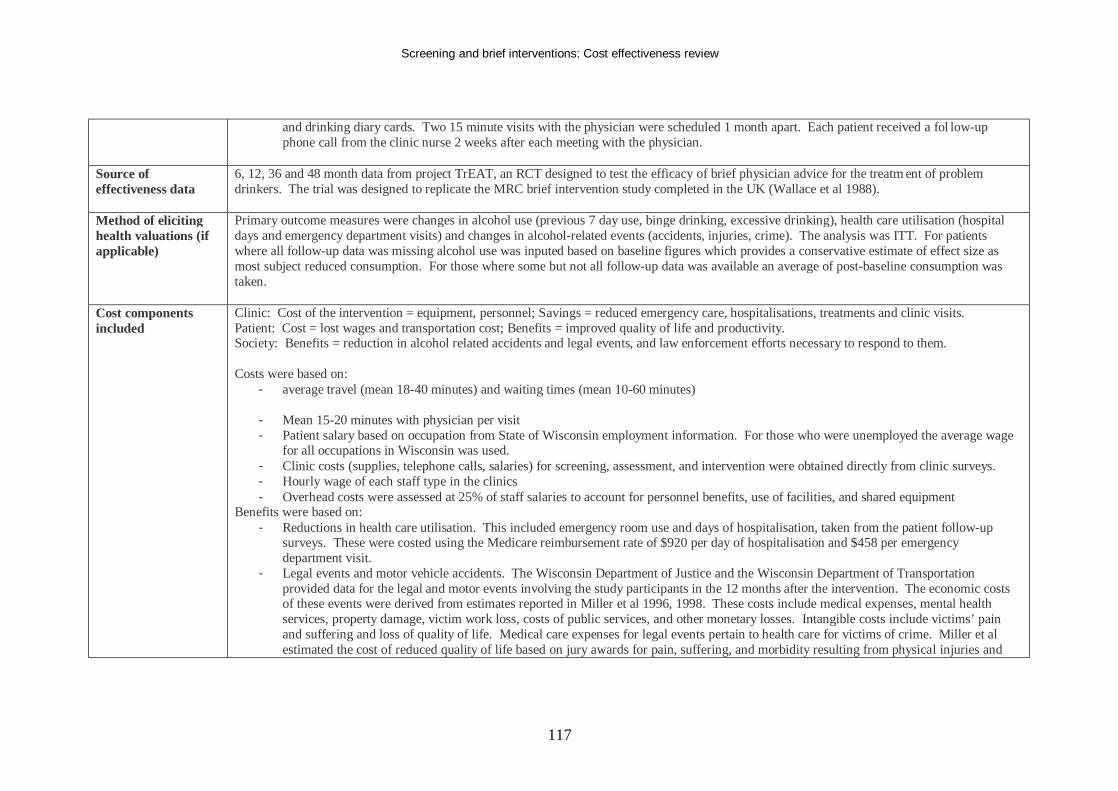
Screening and brief interventions: Cost effectiveness review
117
and drinking diary cards. Two 15 minute visits with the physician were scheduled 1 month apart. Each patient received a fol low-up phone call from the clinic nurse 2 weeks after each meeting with the physician.
Source of effectiveness data
6, 12, 36 and 48 month data from project TrEAT, an RCT designed to test the efficacy of brief physician advice for the treatm ent of problem drinkers. The trial was designed to replicate the MRC brief intervention study completed in the UK (Wallace et al 1988).
Method of eliciting health valuations (if applicable)
Primary outcome measures were changes in alcohol use (previous 7 day use, binge drinking, excessive drinking), health care utilisation (hospital days and emergency department visits) and changes in alcohol-related events (accidents, injuries, crime). The analysis was ITT. For patients where all follow-up data was missing alcohol use was inputed based on baseline figures which provides a conservative estimate of effect size as most subject reduced consumption. For those where some but not all follow-up data was available an average of post-baseline consumption was taken.
Cost components included
Clinic: Cost of the intervention = equipment, personnel; Savings = reduced emergency care, hospitalisations, treatments and clinic visits. Patient: Cost = lost wages and transportation cost; Benefits = improved quality of life and productivity. Society: Benefits = reduction in alcohol related accidents and legal events, and law enforcement efforts necessary to respond to them. Costs were based on:
- average travel (mean 18-40 minutes) and waiting times (mean 10-60 minutes)
- Mean 15-20 minutes with physician per visit - Patient salary based on occupation from State of Wisconsin employment information. For those who were unemployed the average wage
for all occupations in Wisconsin was used. - Clinic costs (supplies, telephone calls, salaries) for screening, assessment, and intervention were obtained directly from clinic surveys. - Hourly wage of each staff type in the clinics - Overhead costs were assessed at 25% of staff salaries to account for personnel benefits, use of facilities, and shared equipment
Benefits were based on: - Reductions in health care utilisation. This included emergency room use and days of hospitalisation, taken from the patient follow-up
surveys. These were costed using the Medicare reimbursement rate of $920 per day of hospitalisation and $458 per emergency department visit.
- Legal events and motor vehicle accidents. The Wisconsin Department of Justice and the Wisconsin Department of Transportation provided data for the legal and motor events involving the study participants in the 12 months after the intervention. The economic costs of these events were derived from estimates reported in Miller et al 1996, 1998. These costs include medical expenses, mental health services, property damage, victim work loss, costs of public services, and other monetary losses. Intangible costs include victims’ pain and suffering and loss of quality of life. Medical care expenses for legal events pertain to health care for victims of crime. Miller et al estimated the cost of reduced quality of life based on jury awards for pain, suffering, and morbidity resulting from physical injuries and
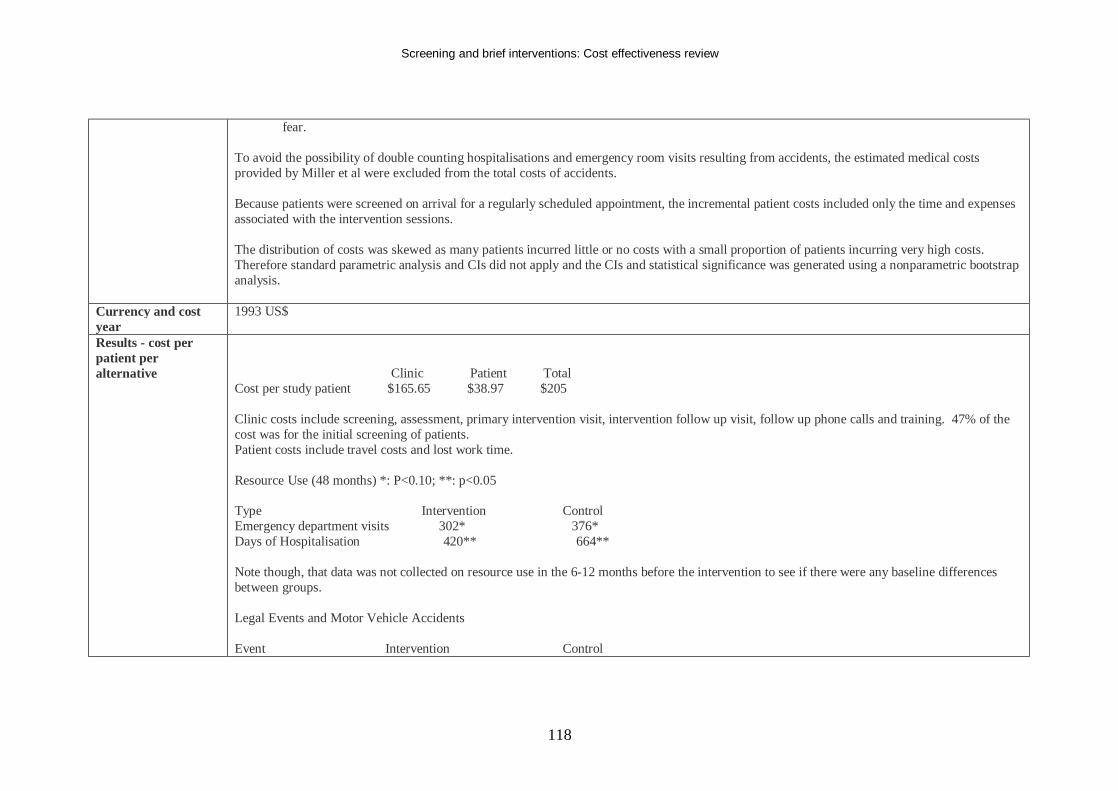
Screening and brief interventions: Cost effectiveness review
118
fear. To avoid the possibility of double counting hospitalisations and emergency room visits resulting from accidents, the estimated medical costs provided by Miller et al were excluded from the total costs of accidents. Because patients were screened on arrival for a regularly scheduled appointment, the incremental patient costs included only the time and expenses associated with the intervention sessions. The distribution of costs was skewed as many patients incurred little or no costs with a small proportion of patients incurring very high costs. Therefore standard parametric analysis and CIs did not apply and the CIs and statistical significance was generated using a nonparametric bootstrap analysis.
Currency and cost year
1993 US$
Results - cost per patient per alternative
Clinic Patient Total Cost per study patient $165.65 $38.97 $205 Clinic costs include screening, assessment, primary intervention visit, intervention follow up visit, follow up phone calls and training. 47% of the cost was for the initial screening of patients. Patient costs include travel costs and lost work time. Resource Use (48 months) *: P<0.10; **: p<0.05 Type Intervention Control Emergency department visits 302* 376* Days of Hospitalisation 420** 664** Note though, that data was not collected on resource use in the 6-12 months before the intervention to see if there were any baseline differences between groups. Legal Events and Motor Vehicle Accidents Event Intervention Control
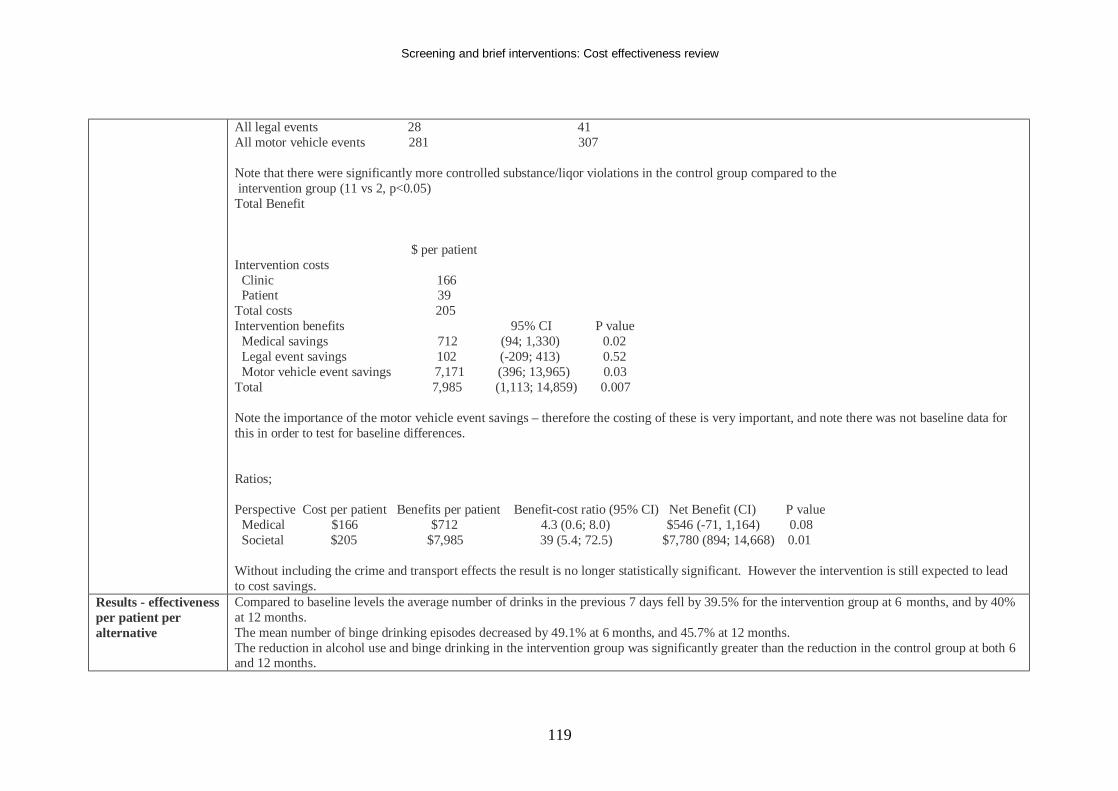
Screening and brief interventions: Cost effectiveness review
119
All legal events 28 41 All motor vehicle events 281 307 Note that there were significantly more controlled substance/liqor violations in the control group compared to the intervention group (11 vs 2, p<0.05) Total Benefit $ per patient Intervention costs Clinic 166 Patient 39 Total costs 205 Intervention benefits 95% CI P value Medical savings 712 (94; 1,330) 0.02 Legal event savings 102 (-209; 413) 0.52 Motor vehicle event savings 7,171 (396; 13,965) 0.03 Total 7,985 (1,113; 14,859) 0.007 Note the importance of the motor vehicle event savings – therefore the costing of these is very important, and note there was not baseline data for this in order to test for baseline differences. Ratios; Perspective Cost per patient Benefits per patient Benefit-cost ratio (95% CI) Net Benefit (CI) P value Medical $166 $712 4.3 (0.6; 8.0) $546 (-71, 1,164) 0.08 Societal $205 $7,985 39 (5.4; 72.5) $7,780 (894; 14,668) 0.01 Without including the crime and transport effects the result is no longer statistically significant. However the intervention is still expected to lead to cost savings.
Results - effectiveness per patient per alternative
Compared to baseline levels the average number of drinks in the previous 7 days fell by 39.5% for the intervention group at 6 months, and by 40% at 12 months. The mean number of binge drinking episodes decreased by 49.1% at 6 months, and 45.7% at 12 months. The reduction in alcohol use and binge drinking in the intervention group was significantly greater than the reduction in the control group at both 6 and 12 months.
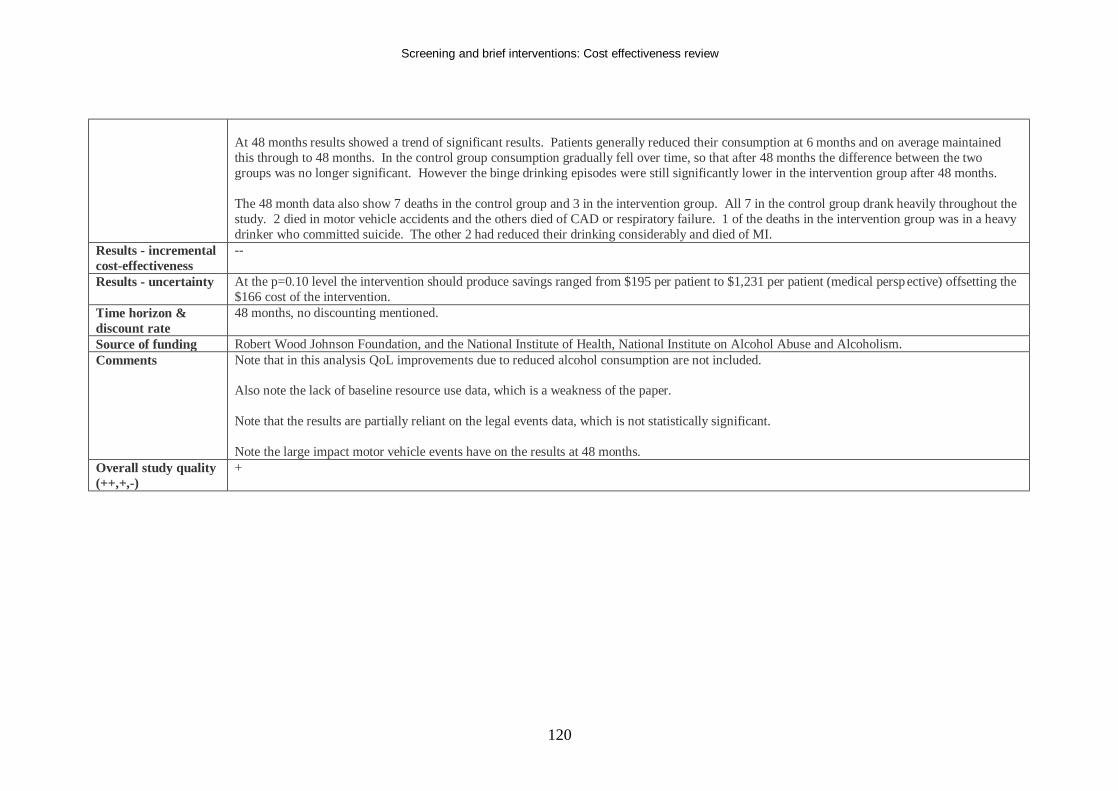
Screening and brief interventions: Cost effectiveness review
120
At 48 months results showed a trend of significant results. Patients generally reduced their consumption at 6 months and on average maintained this through to 48 months. In the control group consumption gradually fell over time, so that after 48 months the difference between the two groups was no longer significant. However the binge drinking episodes were still significantly lower in the intervention group after 48 months. The 48 month data also show 7 deaths in the control group and 3 in the intervention group. All 7 in the control group drank heavily throughout the study. 2 died in motor vehicle accidents and the others died of CAD or respiratory failure. 1 of the deaths in the intervention group was in a heavy drinker who committed suicide. The other 2 had reduced their drinking considerably and died of MI.
Results - incremental cost-effectiveness
--
Results - uncertainty At the p=0.10 level the intervention should produce savings ranged from $195 per patient to $1,231 per patient (medical persp ective) offsetting the $166 cost of the intervention.
Time horizon & discount rate
48 months, no discounting mentioned.
Source of funding Robert Wood Johnson Foundation, and the National Institute of Health, National Institute on Alcohol Abuse and Alcoholism. Comments Note that in this analysis QoL improvements due to reduced alcohol consumption are not included.
Also note the lack of baseline resource use data, which is a weakness of the paper. Note that the results are partially reliant on the legal events data, which is not statistically significant. Note the large impact motor vehicle events have on the results at 48 months.
Overall study quality (++,+,-)
+
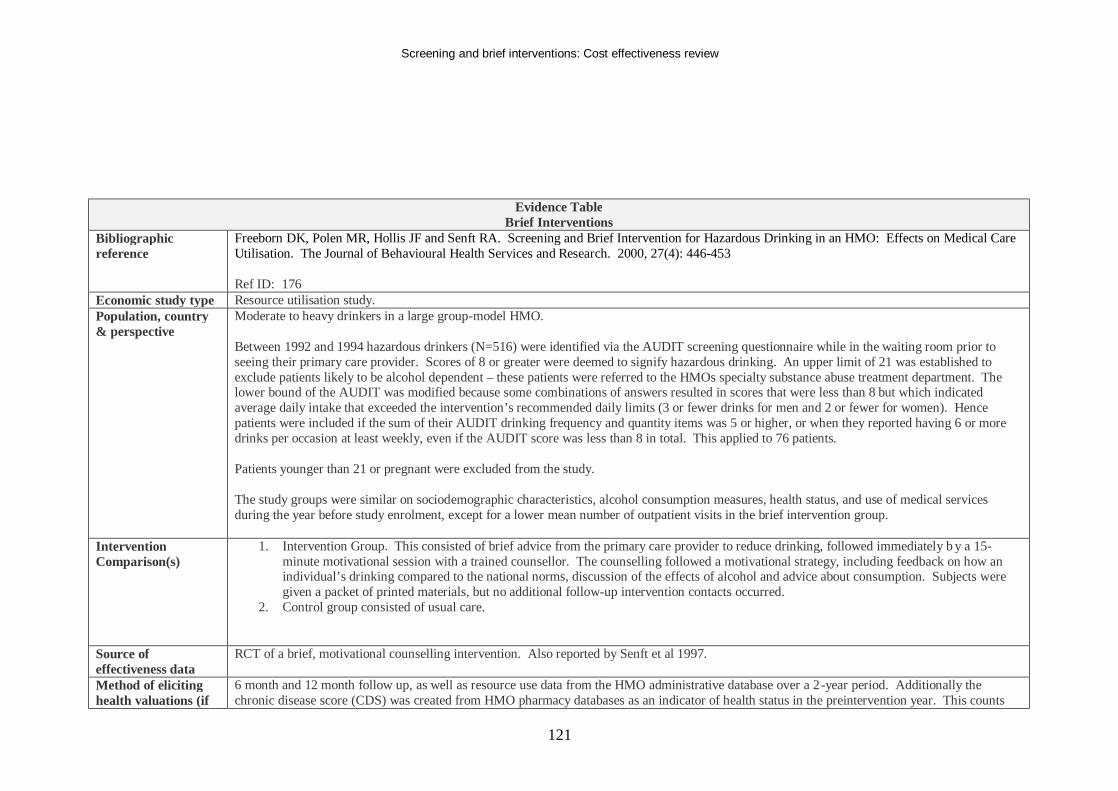
Screening and brief interventions: Cost effectiveness review
121
Evidence Table Brief Interventions
Bibliographic reference
Freeborn DK, Polen MR, Hollis JF and Senft RA. Screening and Brief Intervention for Hazardous Drinking in an HMO: Effects on Medical Care Utilisation. The Journal of Behavioural Health Services and Research. 2000, 27(4): 446-453 Ref ID: 176
Economic study type Resource utilisation study. Population, country & perspective
Moderate to heavy drinkers in a large group-model HMO. Between 1992 and 1994 hazardous drinkers (N=516) were identified via the AUDIT screening questionnaire while in the waiting room prior to seeing their primary care provider. Scores of 8 or greater were deemed to signify hazardous drinking. An upper limit of 21 was established to exclude patients likely to be alcohol dependent – these patients were referred to the HMOs specialty substance abuse treatment department. The lower bound of the AUDIT was modified because some combinations of answers resulted in scores that were less than 8 but which indicated average daily intake that exceeded the intervention’s recommended daily limits (3 or fewer drinks for men and 2 or fewer for women). Hence patients were included if the sum of their AUDIT drinking frequency and quantity items was 5 or higher, or when they reported having 6 or more drinks per occasion at least weekly, even if the AUDIT score was less than 8 in total. This applied to 76 patients. Patients younger than 21 or pregnant were excluded from the study. The study groups were similar on sociodemographic characteristics, alcohol consumption measures, health status, and use of medical services during the year before study enrolment, except for a lower mean number of outpatient visits in the brief intervention group.
Intervention Comparison(s)
1. Intervention Group. This consisted of brief advice from the primary care provider to reduce drinking, followed immediately b y a 15-minute motivational session with a trained counsellor. The counselling followed a motivational strategy, including feedback on how an individual’s drinking compared to the national norms, discussion of the effects of alcohol and advice about consumption. Subjects were given a packet of printed materials, but no additional follow-up intervention contacts occurred.
2. Control group consisted of usual care.
Source of effectiveness data
RCT of a brief, motivational counselling intervention. Also reported by Senft et al 1997.
Method of eliciting health valuations (if
6 month and 12 month follow up, as well as resource use data from the HMO administrative database over a 2-year period. Additionally the chronic disease score (CDS) was created from HMO pharmacy databases as an indicator of health status in the preintervention year. This counts
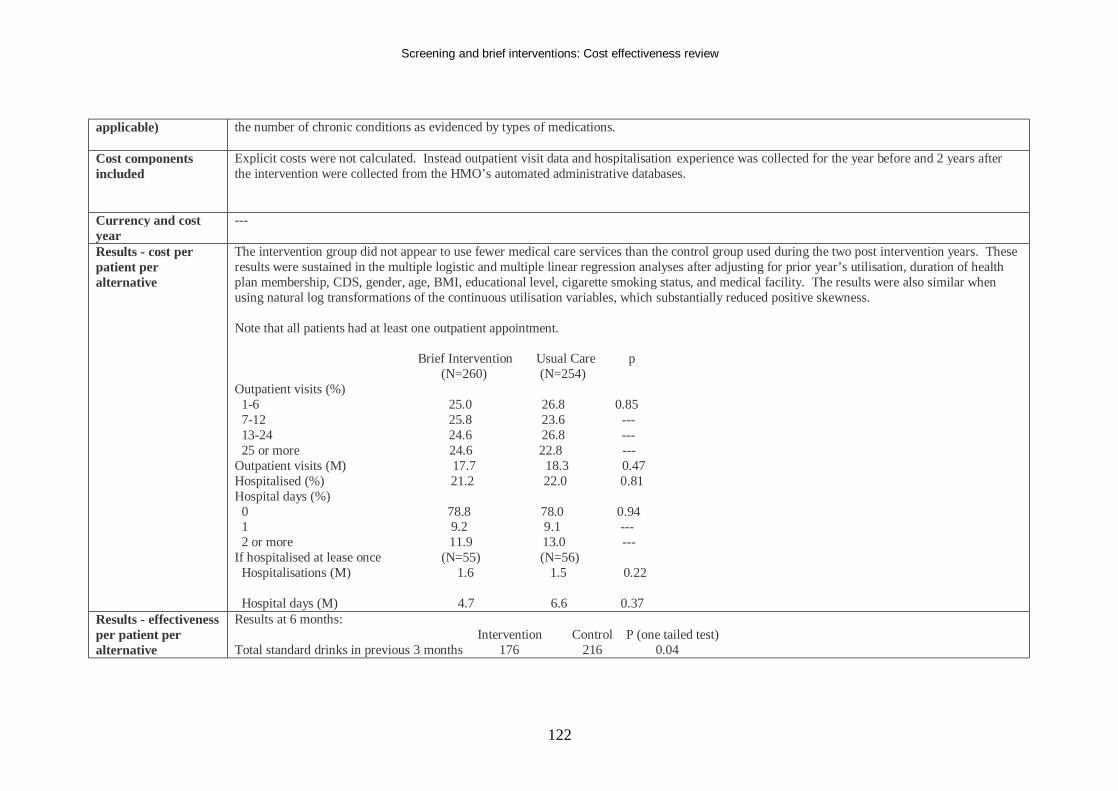
Screening and brief interventions: Cost effectiveness review
122
applicable) the number of chronic conditions as evidenced by types of medications.
Cost components included
Explicit costs were not calculated. Instead outpatient visit data and hospitalisation experience was collected for the year before and 2 years after the intervention were collected from the HMO’s automated administrative databases.
Currency and cost year
---
Results - cost per patient per alternative
The intervention group did not appear to use fewer medical care services than the control group used during the two post intervention years. These results were sustained in the multiple logistic and multiple linear regression analyses after adjusting for prior year’s utilisation, duration of health plan membership, CDS, gender, age, BMI, educational level, cigarette smoking status, and medical facility. The results were also similar when using natural log transformations of the continuous utilisation variables, which substantially reduced positive skewness. Note that all patients had at least one outpatient appointment. Brief Intervention Usual Care p (N=260) (N=254) Outpatient visits (%) 1-6 25.0 26.8 0.85 7-12 25.8 23.6 --- 13-24 24.6 26.8 --- 25 or more 24.6 22.8 --- Outpatient visits (M) 17.7 18.3 0.47 Hospitalised (%) 21.2 22.0 0.81 Hospital days (%) 0 78.8 78.0 0.94 1 9.2 9.1 --- 2 or more 11.9 13.0 --- If hospitalised at lease once (N=55) (N=56) Hospitalisations (M) 1.6 1.5 0.22 Hospital days (M) 4.7 6.6 0.37
Results - effectiveness per patient per alternative
Results at 6 months: Intervention Control P (one tailed test) Total standard drinks in previous 3 months 176 216 0.04
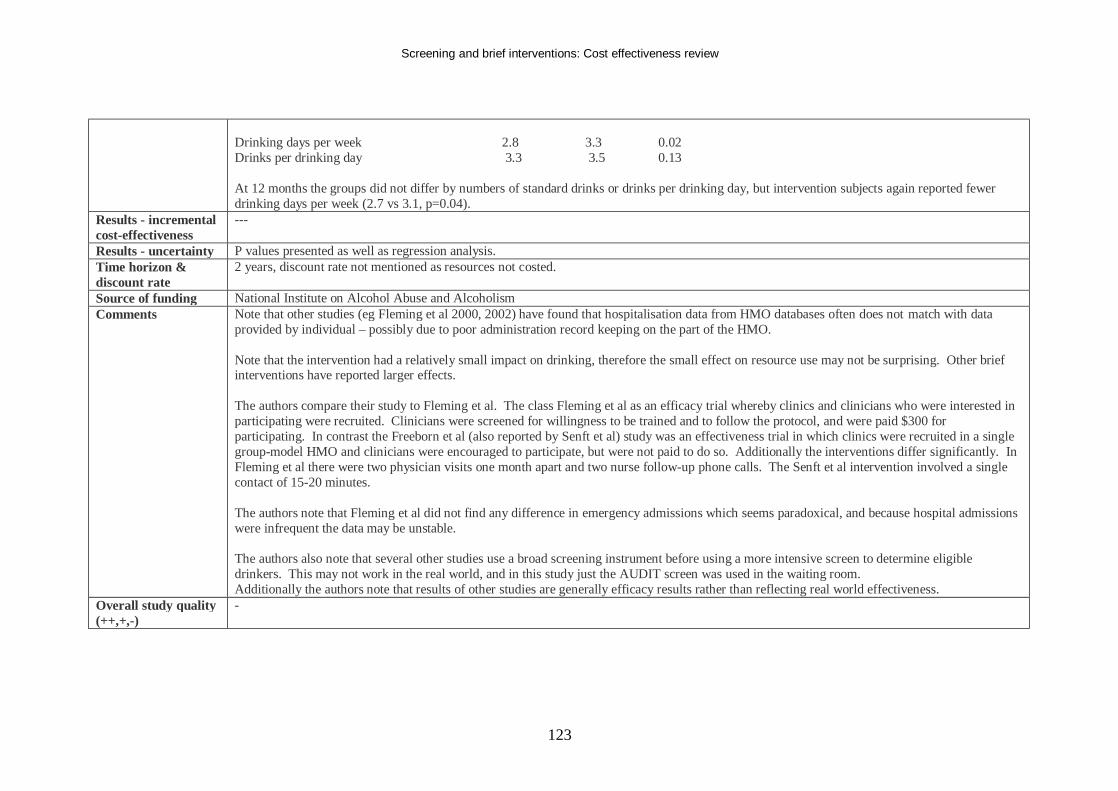
Screening and brief interventions: Cost effectiveness review
123
Drinking days per week 2.8 3.3 0.02 Drinks per drinking day 3.3 3.5 0.13 At 12 months the groups did not differ by numbers of standard drinks or drinks per drinking day, but intervention subjects again reported fewer drinking days per week (2.7 vs 3.1, p=0.04).
Results - incremental cost-effectiveness
---
Results - uncertainty P values presented as well as regression analysis. Time horizon & discount rate
2 years, discount rate not mentioned as resources not costed.
Source of funding National Institute on Alcohol Abuse and Alcoholism Comments Note that other studies (eg Fleming et al 2000, 2002) have found that hospitalisation data from HMO databases often does not match with data
provided by individual – possibly due to poor administration record keeping on the part of the HMO. Note that the intervention had a relatively small impact on drinking, therefore the small effect on resource use may not be surprising. Other brief interventions have reported larger effects. The authors compare their study to Fleming et al. The class Fleming et al as an efficacy trial whereby clinics and clinicians who were interested in participating were recruited. Clinicians were screened for willingness to be trained and to follow the protocol, and were paid $300 for participating. In contrast the Freeborn et al (also reported by Senft et al) study was an effectiveness trial in which clinics were recruited in a single group-model HMO and clinicians were encouraged to participate, but were not paid to do so. Additionally the interventions differ significantly. In Fleming et al there were two physician visits one month apart and two nurse follow-up phone calls. The Senft et al intervention involved a single contact of 15-20 minutes. The authors note that Fleming et al did not find any difference in emergency admissions which seems paradoxical, and because hospital admissions were infrequent the data may be unstable. The authors also note that several other studies use a broad screening instrument before using a more intensive screen to determine eligible drinkers. This may not work in the real world, and in this study just the AUDIT screen was used in the waiting room. Additionally the authors note that results of other studies are generally efficacy results rather than reflecting real world effectiveness.
Overall study quality (++,+,-)
-
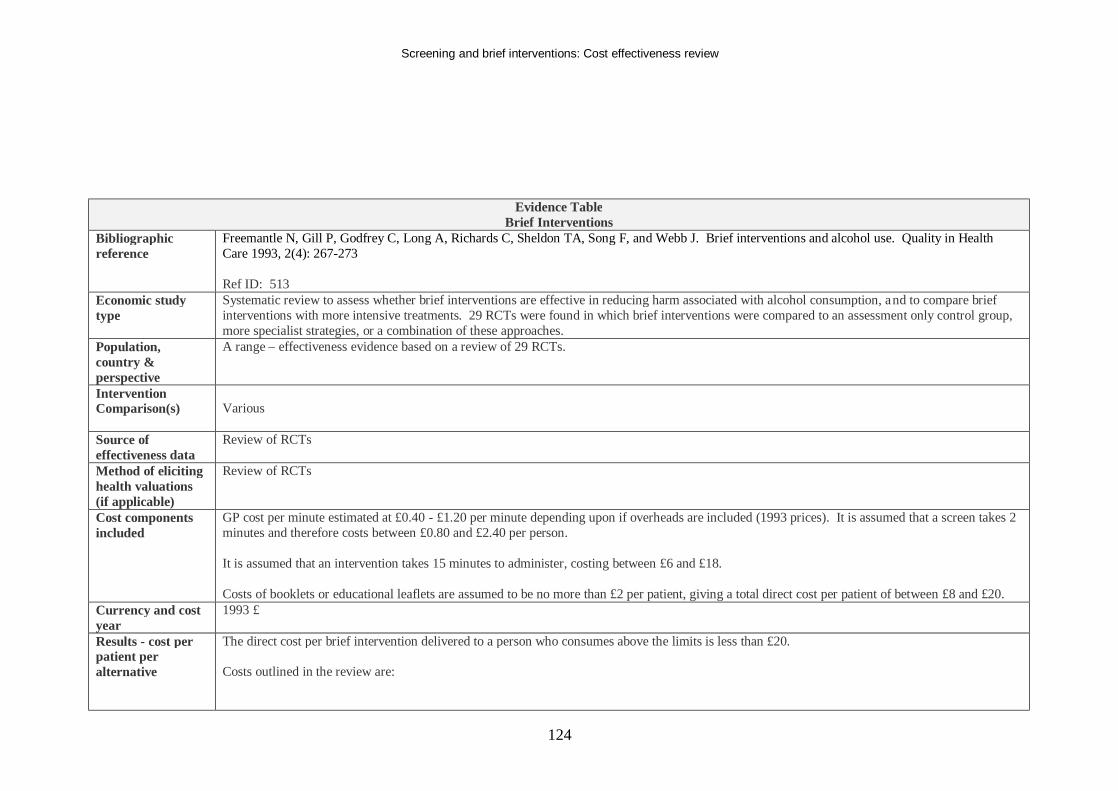
Screening and brief interventions: Cost effectiveness review
124
Evidence Table Brief Interventions
Bibliographic reference
Freemantle N, Gill P, Godfrey C, Long A, Richards C, Sheldon TA, Song F, and Webb J. Brief interventions and alcohol use. Quality in Health Care 1993, 2(4): 267-273 Ref ID: 513
Economic study type
Systematic review to assess whether brief interventions are effective in reducing harm associated with alcohol consumption, and to compare brief interventions with more intensive treatments. 29 RCTs were found in which brief interventions were compared to an assessment only control group, more specialist strategies, or a combination of these approaches.
Population, country & perspective
A range – effectiveness evidence based on a review of 29 RCTs.
Intervention Comparison(s)
Various
Source of effectiveness data
Review of RCTs
Method of eliciting health valuations (if applicable)
Review of RCTs
Cost components included
GP cost per minute estimated at £0.40 - £1.20 per minute depending upon if overheads are included (1993 prices). It is assumed that a screen takes 2 minutes and therefore costs between £0.80 and £2.40 per person. It is assumed that an intervention takes 15 minutes to administer, costing between £6 and £18. Costs of booklets or educational leaflets are assumed to be no more than £2 per patient, giving a total direct cost per patient of between £8 and £20.
Currency and cost year
1993 £
Results - cost per patient per alternative
The direct cost per brief intervention delivered to a person who consumes above the limits is less than £20. Costs outlined in the review are:
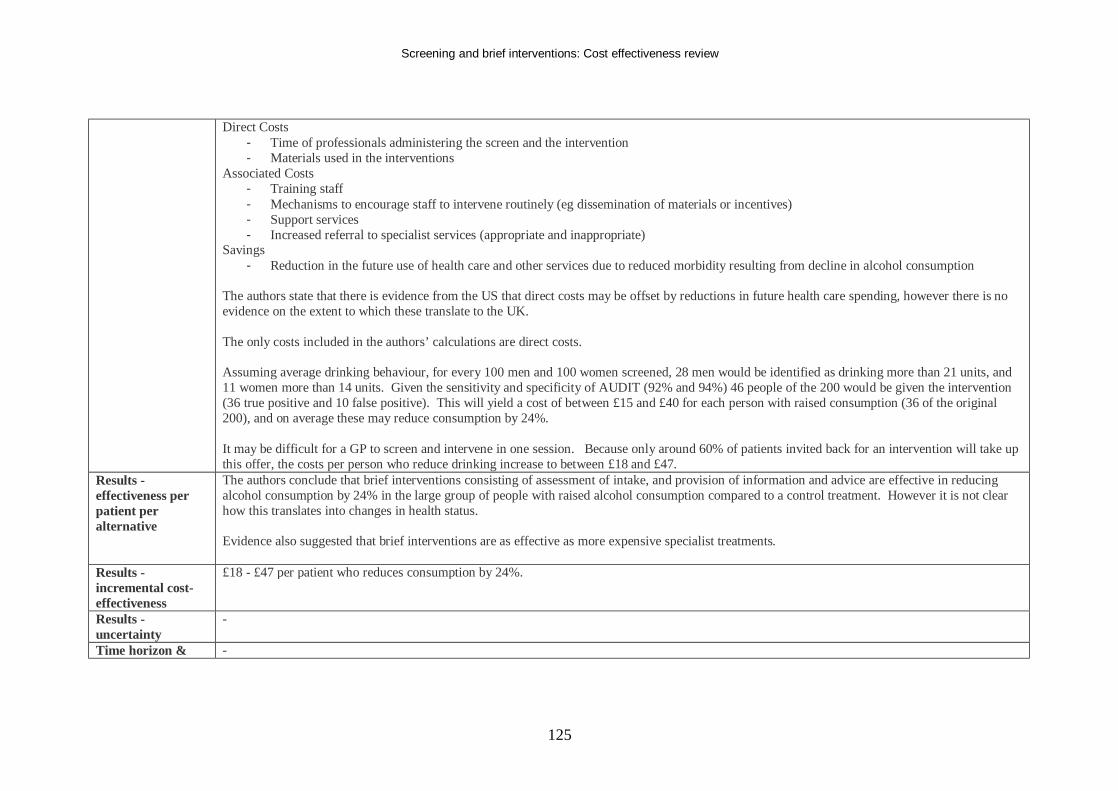
Screening and brief interventions: Cost effectiveness review
125
Direct Costs - Time of professionals administering the screen and the intervention - Materials used in the interventions
Associated Costs - Training staff - Mechanisms to encourage staff to intervene routinely (eg dissemination of materials or incentives) - Support services - Increased referral to specialist services (appropriate and inappropriate)
Savings - Reduction in the future use of health care and other services due to reduced morbidity resulting from decline in alcohol consumption
The authors state that there is evidence from the US that direct costs may be offset by reductions in future health care spending, however there is no evidence on the extent to which these translate to the UK. The only costs included in the authors’ calculations are direct costs. Assuming average drinking behaviour, for every 100 men and 100 women screened, 28 men would be identified as drinking more than 21 units, and 11 women more than 14 units. Given the sensitivity and specificity of AUDIT (92% and 94%) 46 people of the 200 would be given the intervention (36 true positive and 10 false positive). This will yield a cost of between £15 and £40 for each person with raised consumption (36 of the original 200), and on average these may reduce consumption by 24%. It may be difficult for a GP to screen and intervene in one session. Because only around 60% of patients invited back for an intervention will take up this offer, the costs per person who reduce drinking increase to between £18 and £47.
Results - effectiveness per patient per alternative
The authors conclude that brief interventions consisting of assessment of intake, and provision of information and advice are effective in reducing alcohol consumption by 24% in the large group of people with raised alcohol consumption compared to a control treatment. However it is not clear how this translates into changes in health status. Evidence also suggested that brief interventions are as effective as more expensive specialist treatments.
Results - incremental cost-effectiveness
£18 - £47 per patient who reduces consumption by 24%.
Results - uncertainty
-
Time horizon & -
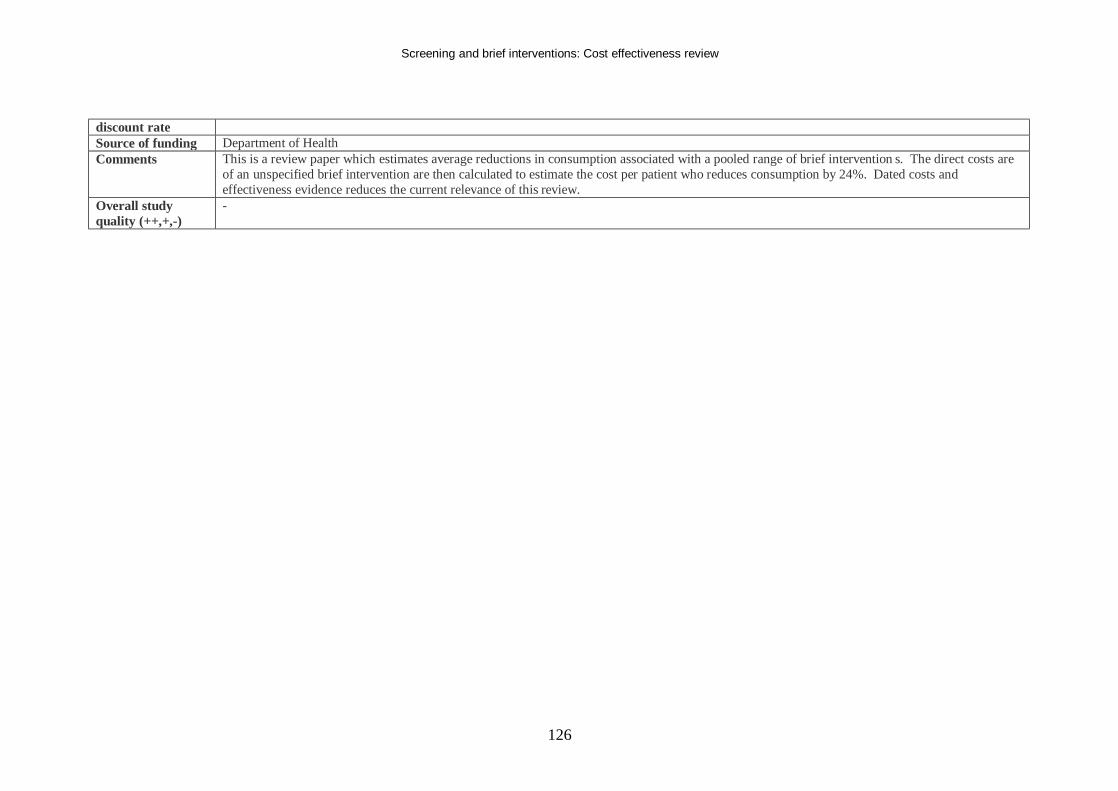
Screening and brief interventions: Cost effectiveness review
126
discount rate Source of funding Department of Health Comments This is a review paper which estimates average reductions in consumption associated with a pooled range of brief intervention s. The direct costs are
of an unspecified brief intervention are then calculated to estimate the cost per patient who reduces consumption by 24%. Dated costs and effectiveness evidence reduces the current relevance of this review.
Overall study quality (++,+,-)
-
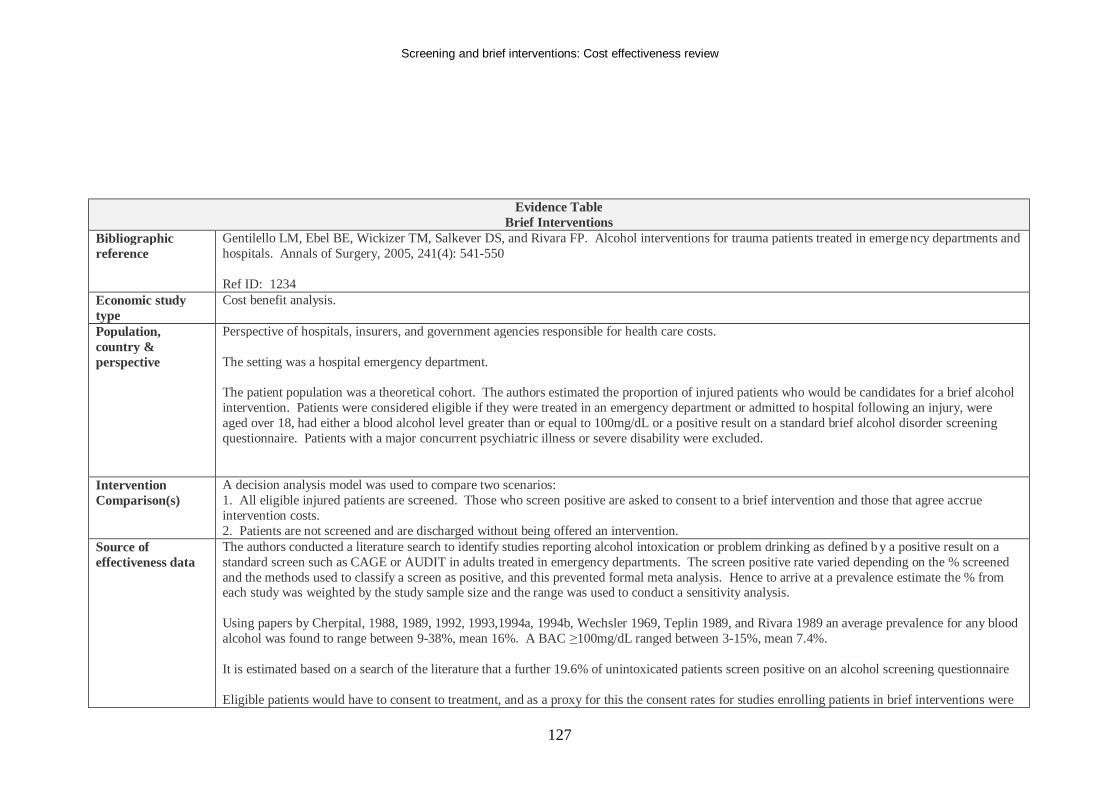
Screening and brief interventions: Cost effectiveness review
127
Evidence Table Brief Interventions
Bibliographic reference
Gentilello LM, Ebel BE, Wickizer TM, Salkever DS, and Rivara FP. Alcohol interventions for trauma patients treated in emergency departments and hospitals. Annals of Surgery, 2005, 241(4): 541-550 Ref ID: 1234
Economic study type
Cost benefit analysis.
Population, country & perspective
Perspective of hospitals, insurers, and government agencies responsible for health care costs. The setting was a hospital emergency department. The patient population was a theoretical cohort. The authors estimated the proportion of injured patients who would be candidates for a brief alcohol intervention. Patients were considered eligible if they were treated in an emergency department or admitted to hospital following an injury, were aged over 18, had either a blood alcohol level greater than or equal to 100mg/dL or a positive result on a standard brief alcohol disorder screening questionnaire. Patients with a major concurrent psychiatric illness or severe disability were excluded.
Intervention Comparison(s)
A decision analysis model was used to compare two scenarios: 1. All eligible injured patients are screened. Those who screen positive are asked to consent to a brief intervention and those that agree accrue intervention costs. 2. Patients are not screened and are discharged without being offered an intervention.
Source of effectiveness data
The authors conducted a literature search to identify studies reporting alcohol intoxication or problem drinking as defined b y a positive result on a standard screen such as CAGE or AUDIT in adults treated in emergency departments. The screen positive rate varied depending on the % screened and the methods used to classify a screen as positive, and this prevented formal meta analysis. Hence to arrive at a prevalence estimate the % from each study was weighted by the study sample size and the range was used to conduct a sensitivity analysis. Using papers by Cherpital, 1988, 1989, 1992, 1993,1994a, 1994b, Wechsler 1969, Teplin 1989, and Rivara 1989 an average prevalence for any blood alcohol was found to range between 9-38%, mean 16%. A BAC ≥100mg/dL ranged between 3-15%, mean 7.4%. It is estimated based on a search of the literature that a further 19.6% of unintoxicated patients screen positive on an alcohol screening questionnaire Eligible patients would have to consent to treatment, and as a proxy for this the consent rates for studies enrolling patients in brief interventions were
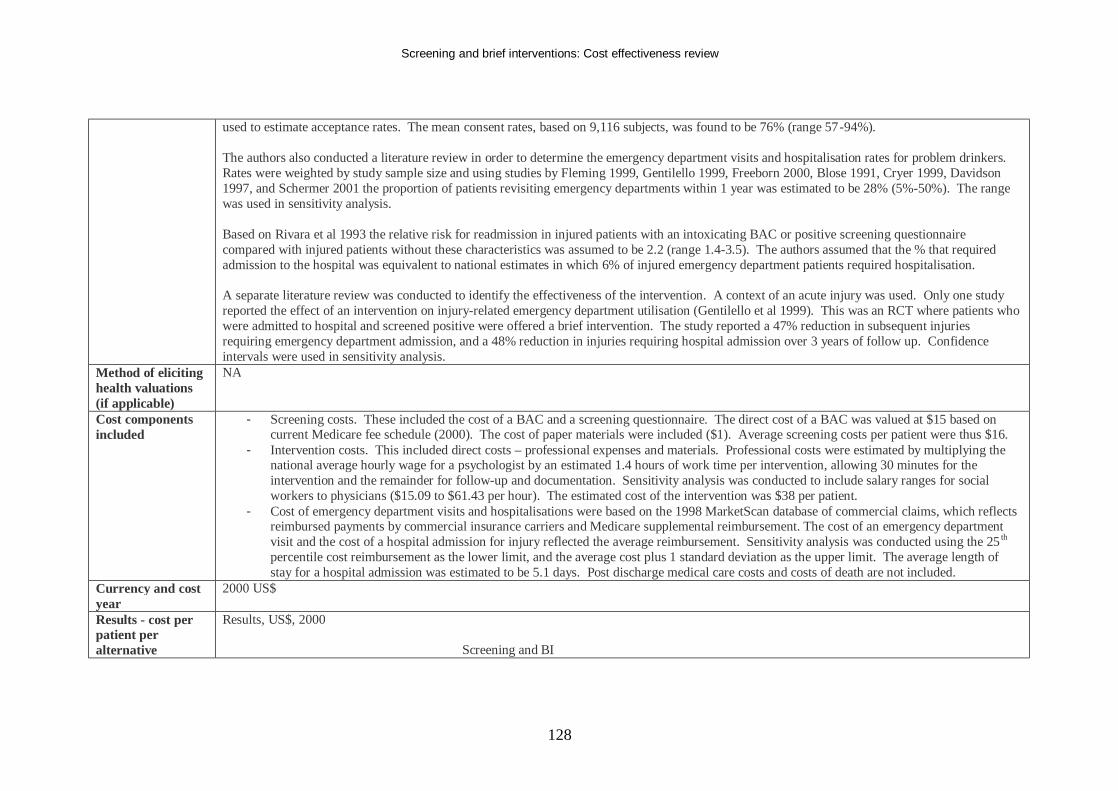
Screening and brief interventions: Cost effectiveness review
128
used to estimate acceptance rates. The mean consent rates, based on 9,116 subjects, was found to be 76% (range 57-94%). The authors also conducted a literature review in order to determine the emergency department visits and hospitalisation rates for problem drinkers. Rates were weighted by study sample size and using studies by Fleming 1999, Gentilello 1999, Freeborn 2000, Blose 1991, Cryer 1999, Davidson 1997, and Schermer 2001 the proportion of patients revisiting emergency departments within 1 year was estimated to be 28% (5%-50%). The range was used in sensitivity analysis. Based on Rivara et al 1993 the relative risk for readmission in injured patients with an intoxicating BAC or positive screening questionnaire compared with injured patients without these characteristics was assumed to be 2.2 (range 1.4-3.5). The authors assumed that the % that required admission to the hospital was equivalent to national estimates in which 6% of injured emergency department patients required hospitalisation. A separate literature review was conducted to identify the effectiveness of the intervention. A context of an acute injury was used. Only one study reported the effect of an intervention on injury-related emergency department utilisation (Gentilello et al 1999). This was an RCT where patients who were admitted to hospital and screened positive were offered a brief intervention. The study reported a 47% reduction in subsequent injuries requiring emergency department admission, and a 48% reduction in injuries requiring hospital admission over 3 years of follow up. Confidence intervals were used in sensitivity analysis.
Method of eliciting health valuations (if applicable)
NA
Cost components included
- Screening costs. These included the cost of a BAC and a screening questionnaire. The direct cost of a BAC was valued at $15 based on current Medicare fee schedule (2000). The cost of paper materials were included ($1). Average screening costs per patient were thus $16.
- Intervention costs. This included direct costs – professional expenses and materials. Professional costs were estimated by multiplying the national average hourly wage for a psychologist by an estimated 1.4 hours of work time per intervention, allowing 30 minutes for the intervention and the remainder for follow-up and documentation. Sensitivity analysis was conducted to include salary ranges for social workers to physicians ($15.09 to $61.43 per hour). The estimated cost of the intervention was $38 per patient.
- Cost of emergency department visits and hospitalisations were based on the 1998 MarketScan database of commercial claims, which reflects reimbursed payments by commercial insurance carriers and Medicare supplemental reimbursement. The cost of an emergency department visit and the cost of a hospital admission for injury reflected the average reimbursement. Sensitivity analysis was conducted using the 25 th percentile cost reimbursement as the lower limit, and the average cost plus 1 standard deviation as the upper limit. The average length of stay for a hospital admission was estimated to be 5.1 days. Post discharge medical care costs and costs of death are not included.
Currency and cost year
2000 US$
Results - cost per patient per alternative
Results, US$, 2000 Screening and BI
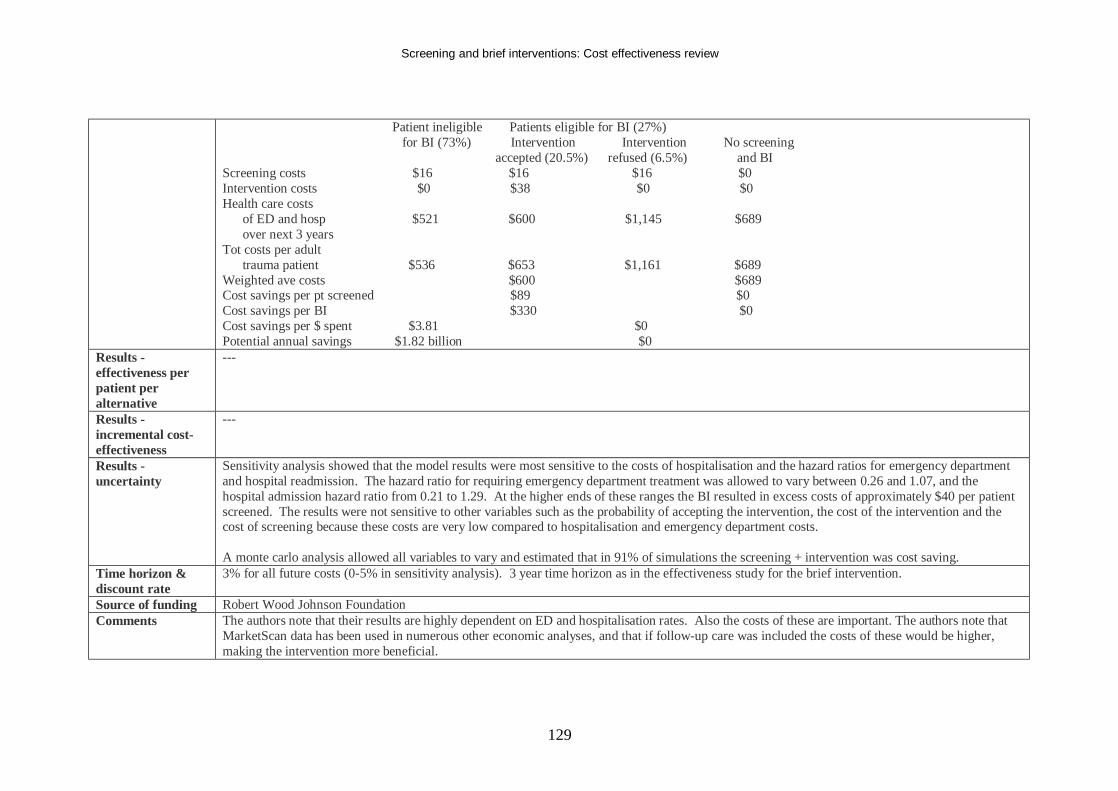
Screening and brief interventions: Cost effectiveness review
129
Patient ineligible Patients eligible for BI (27%) for BI (73%) Intervention Intervention No screening accepted (20.5%) refused (6.5%) and BI Screening costs $16 $16 $16 $0 Intervention costs $0 $38 $0 $0 Health care costs of ED and hosp $521 $600 $1,145 $689 over next 3 years Tot costs per adult trauma patient $536 $653 $1,161 $689 Weighted ave costs $600 $689 Cost savings per pt screened $89 $0 Cost savings per BI $330 $0 Cost savings per $ spent $3.81 $0 Potential annual savings $1.82 billion $0
Results - effectiveness per patient per alternative
---
Results - incremental cost-effectiveness
---
Results - uncertainty
Sensitivity analysis showed that the model results were most sensitive to the costs of hospitalisation and the hazard ratios for emergency department and hospital readmission. The hazard ratio for requiring emergency department treatment was allowed to vary between 0.26 and 1.07, and the hospital admission hazard ratio from 0.21 to 1.29. At the higher ends of these ranges the BI resulted in excess costs of approximately $40 per patient screened. The results were not sensitive to other variables such as the probability of accepting the intervention, the cost of the intervention and the cost of screening because these costs are very low compared to hospitalisation and emergency department costs. A monte carlo analysis allowed all variables to vary and estimated that in 91% of simulations the screening + intervention was cost saving.
Time horizon & discount rate
3% for all future costs (0-5% in sensitivity analysis). 3 year time horizon as in the effectiveness study for the brief intervention.
Source of funding Robert Wood Johnson Foundation Comments The authors note that their results are highly dependent on ED and hospitalisation rates. Also the costs of these are important. The authors note that
MarketScan data has been used in numerous other economic analyses, and that if follow-up care was included the costs of these would be higher, making the intervention more beneficial.
Screening and brief interventions: Cost effectiveness review
130
Societal are not included.
Overall study quality (++,+,-)
+
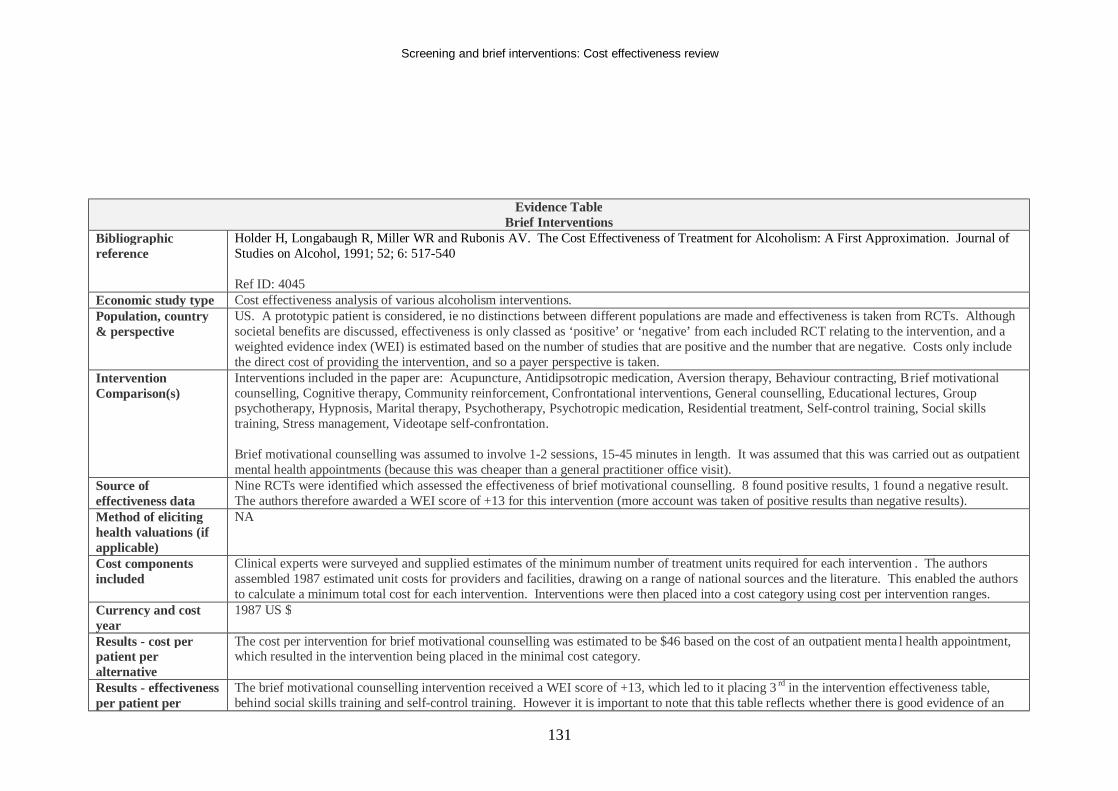
Screening and brief interventions: Cost effectiveness review
131
Evidence Table Brief Interventions
Bibliographic reference
Holder H, Longabaugh R, Miller WR and Rubonis AV. The Cost Effectiveness of Treatment for Alcoholism: A First Approximation. Journal of Studies on Alcohol, 1991; 52; 6: 517-540 Ref ID: 4045
Economic study type Cost effectiveness analysis of various alcoholism interventions. Population, country & perspective
US. A prototypic patient is considered, ie no distinctions between different populations are made and effectiveness is taken from RCTs. Although societal benefits are discussed, effectiveness is only classed as ‘positive’ or ‘negative’ from each included RCT relating to the intervention, and a weighted evidence index (WEI) is estimated based on the number of studies that are positive and the number that are negative. Costs only include the direct cost of providing the intervention, and so a payer perspective is taken.
Intervention Comparison(s)
Interventions included in the paper are: Acupuncture, Antidipsotropic medication, Aversion therapy, Behaviour contracting, Brief motivational counselling, Cognitive therapy, Community reinforcement, Confrontational interventions, General counselling, Educational lectures, Group psychotherapy, Hypnosis, Marital therapy, Psychotherapy, Psychotropic medication, Residential treatment, Self-control training, Social skills training, Stress management, Videotape self-confrontation. Brief motivational counselling was assumed to involve 1-2 sessions, 15-45 minutes in length. It was assumed that this was carried out as outpatient mental health appointments (because this was cheaper than a general practitioner office visit).
Source of effectiveness data
Nine RCTs were identified which assessed the effectiveness of brief motivational counselling. 8 found positive results, 1 found a negative result. The authors therefore awarded a WEI score of +13 for this intervention (more account was taken of positive results than negative results).
Method of eliciting health valuations (if applicable)
NA
Cost components included
Clinical experts were surveyed and supplied estimates of the minimum number of treatment units required for each intervention . The authors assembled 1987 estimated unit costs for providers and facilities, drawing on a range of national sources and the literature. This enabled the authors to calculate a minimum total cost for each intervention. Interventions were then placed into a cost category using cost per intervention ranges.
Currency and cost year
1987 US $
Results - cost per patient per alternative
The cost per intervention for brief motivational counselling was estimated to be $46 based on the cost of an outpatient menta l health appointment, which resulted in the intervention being placed in the minimal cost category.
Results - effectiveness per patient per
The brief motivational counselling intervention received a WEI score of +13, which led to it placing 3 rd in the intervention effectiveness table, behind social skills training and self-control training. However it is important to note that this table reflects whether there is good evidence of an
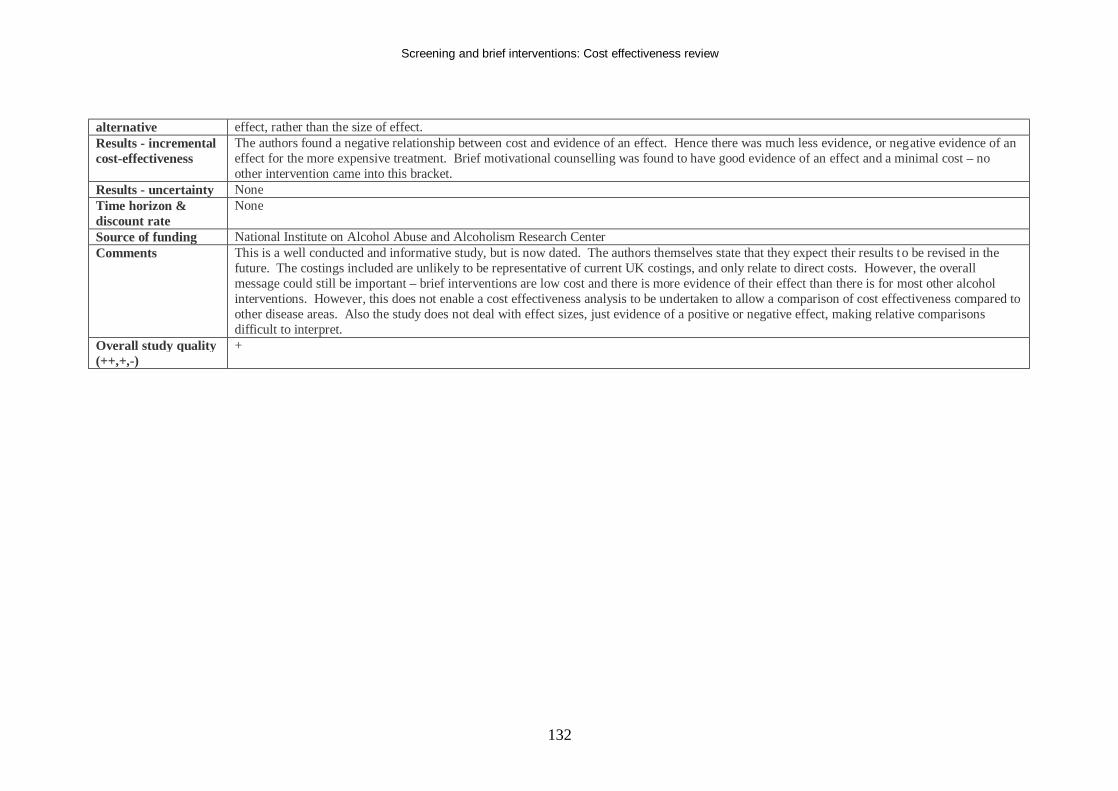
Screening and brief interventions: Cost effectiveness review
132
alternative effect, rather than the size of effect. Results - incremental cost-effectiveness
The authors found a negative relationship between cost and evidence of an effect. Hence there was much less evidence, or negative evidence of an effect for the more expensive treatment. Brief motivational counselling was found to have good evidence of an effect and a minimal cost – no other intervention came into this bracket.
Results - uncertainty None Time horizon & discount rate
None
Source of funding National Institute on Alcohol Abuse and Alcoholism Research Center Comments This is a well conducted and informative study, but is now dated. The authors themselves state that they expect their results to be revised in the
future. The costings included are unlikely to be representative of current UK costings, and only relate to direct costs. However, the overall message could still be important – brief interventions are low cost and there is more evidence of their effect than there is for most other alcohol interventions. However, this does not enable a cost effectiveness analysis to be undertaken to allow a comparison of cost effectiveness compared to other disease areas. Also the study does not deal with effect sizes, just evidence of a positive or negative effect, making relative comparisons difficult to interpret.
Overall study quality (++,+,-)
+
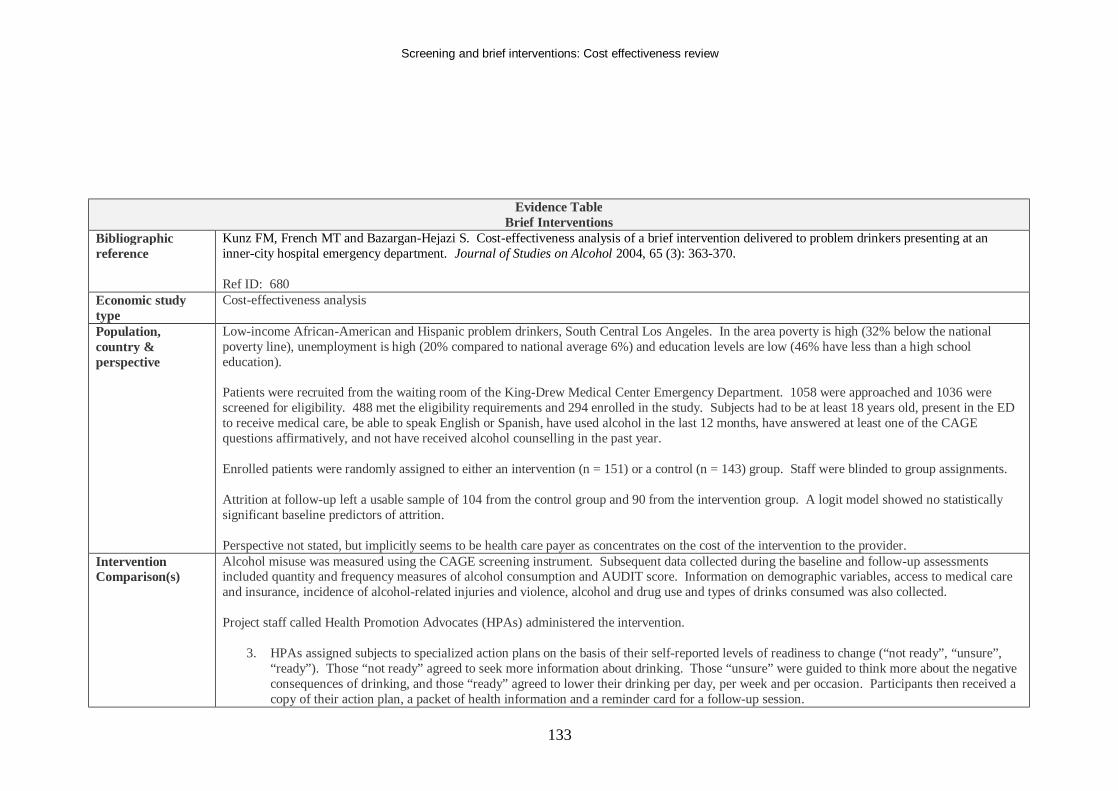
Screening and brief interventions: Cost effectiveness review
133
Evidence Table Brief Interventions
Bibliographic reference
Kunz FM, French MT and Bazargan-Hejazi S. Cost-effectiveness analysis of a brief intervention delivered to problem drinkers presenting at an inner-city hospital emergency department. Journal of Studies on Alcohol 2004, 65 (3): 363-370. Ref ID: 680
Economic study type
Cost-effectiveness analysis
Population, country & perspective
Low-income African-American and Hispanic problem drinkers, South Central Los Angeles. In the area poverty is high (32% below the national poverty line), unemployment is high (20% compared to national average 6%) and education levels are low (46% have less than a high school education). Patients were recruited from the waiting room of the King-Drew Medical Center Emergency Department. 1058 were approached and 1036 were screened for eligibility. 488 met the eligibility requirements and 294 enrolled in the study. Subjects had to be at least 18 years old, present in the ED to receive medical care, be able to speak English or Spanish, have used alcohol in the last 12 months, have answered at least one of the CAGE questions affirmatively, and not have received alcohol counselling in the past year. Enrolled patients were randomly assigned to either an intervention (n = 151) or a control (n = 143) group. Staff were blinded to group assignments. Attrition at follow-up left a usable sample of 104 from the control group and 90 from the intervention group. A logit model showed no statistically significant baseline predictors of attrition. Perspective not stated, but implicitly seems to be health care payer as concentrates on the cost of the intervention to the provider.
Intervention Comparison(s)
Alcohol misuse was measured using the CAGE screening instrument. Subsequent data collected during the baseline and follow-up assessments included quantity and frequency measures of alcohol consumption and AUDIT score. Information on demographic variables, access to medical care and insurance, incidence of alcohol-related injuries and violence, alcohol and drug use and types of drinks consumed was also collected. Project staff called Health Promotion Advocates (HPAs) administered the intervention.
3. HPAs assigned subjects to specialized action plans on the basis of their self-reported levels of readiness to change (“not ready”, “unsure”,
“ready”). Those “not ready” agreed to seek more information about drinking. Those “unsure” were guided to think more about the negative consequences of drinking, and those “ready” agreed to lower their drinking per day, per week and per occasion. Participants then received a copy of their action plan, a packet of health information and a reminder card for a follow-up session.
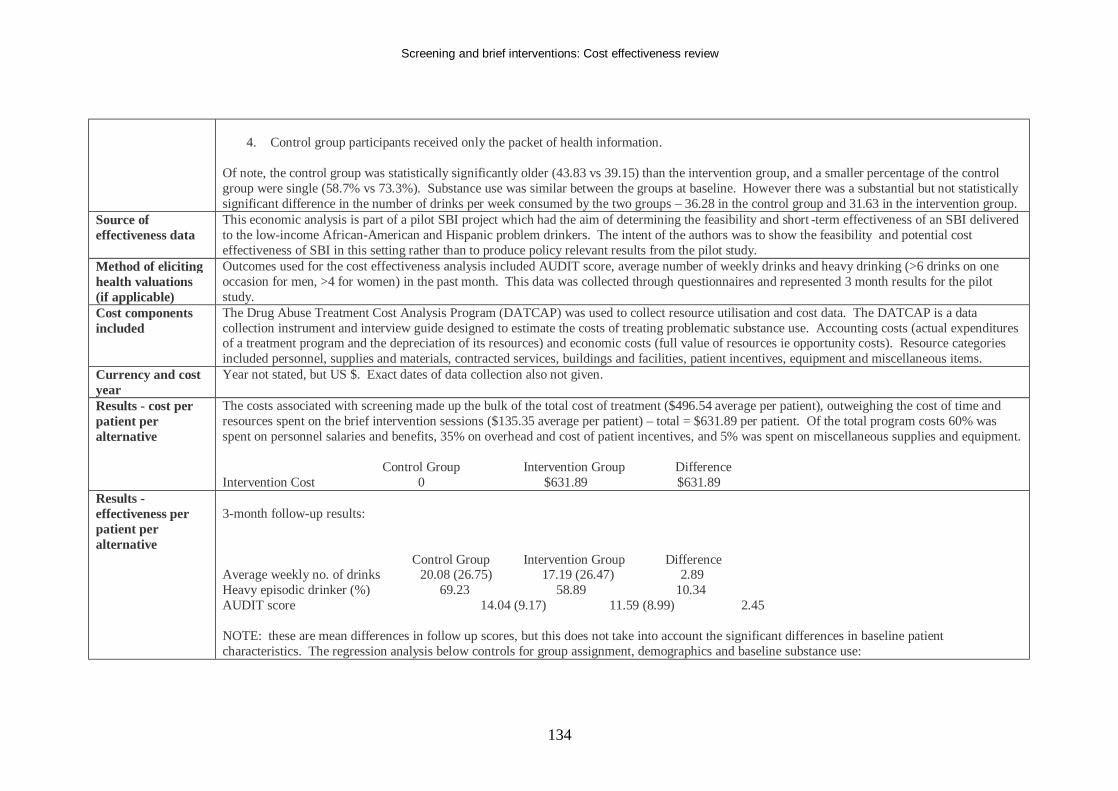
Screening and brief interventions: Cost effectiveness review
134
4. Control group participants received only the packet of health information.
Of note, the control group was statistically significantly older (43.83 vs 39.15) than the intervention group, and a smaller percentage of the control group were single (58.7% vs 73.3%). Substance use was similar between the groups at baseline. However there was a substantial but not statistically significant difference in the number of drinks per week consumed by the two groups – 36.28 in the control group and 31.63 in the intervention group.
Source of effectiveness data
This economic analysis is part of a pilot SBI project which had the aim of determining the feasibility and short -term effectiveness of an SBI delivered to the low-income African-American and Hispanic problem drinkers. The intent of the authors was to show the feasibility and potential cost effectiveness of SBI in this setting rather than to produce policy relevant results from the pilot study.
Method of eliciting health valuations (if applicable)
Outcomes used for the cost effectiveness analysis included AUDIT score, average number of weekly drinks and heavy drinking (>6 drinks on one occasion for men, >4 for women) in the past month. This data was collected through questionnaires and represented 3 month results for the pilot study.
Cost components included
The Drug Abuse Treatment Cost Analysis Program (DATCAP) was used to collect resource utilisation and cost data. The DATCAP is a data collection instrument and interview guide designed to estimate the costs of treating problematic substance use. Accounting costs (actual expenditures of a treatment program and the depreciation of its resources) and economic costs (full value of resources ie opportunity costs). Resource categories included personnel, supplies and materials, contracted services, buildings and facilities, patient incentives, equipment and miscellaneous items.
Currency and cost year
Year not stated, but US $. Exact dates of data collection also not given.
Results - cost per patient per alternative
The costs associated with screening made up the bulk of the total cost of treatment ($496.54 average per patient), outweighing the cost of time and resources spent on the brief intervention sessions ($135.35 average per patient) – total = $631.89 per patient. Of the total program costs 60% was spent on personnel salaries and benefits, 35% on overhead and cost of patient incentives, and 5% was spent on miscellaneous supplies and equipment. Control Group Intervention Group Difference Intervention Cost 0 $631.89 $631.89
Results - effectiveness per patient per alternative
3-month follow-up results: Control Group Intervention Group Difference Average weekly no. of drinks 20.08 (26.75) 17.19 (26.47) 2.89 Heavy episodic drinker (%) 69.23 58.89 10.34 AUDIT score 14.04 (9.17) 11.59 (8.99) 2.45 NOTE: these are mean differences in follow up scores, but this does not take into account the significant differences in baseline patient characteristics. The regression analysis below controls for group assignment, demographics and baseline substance use:
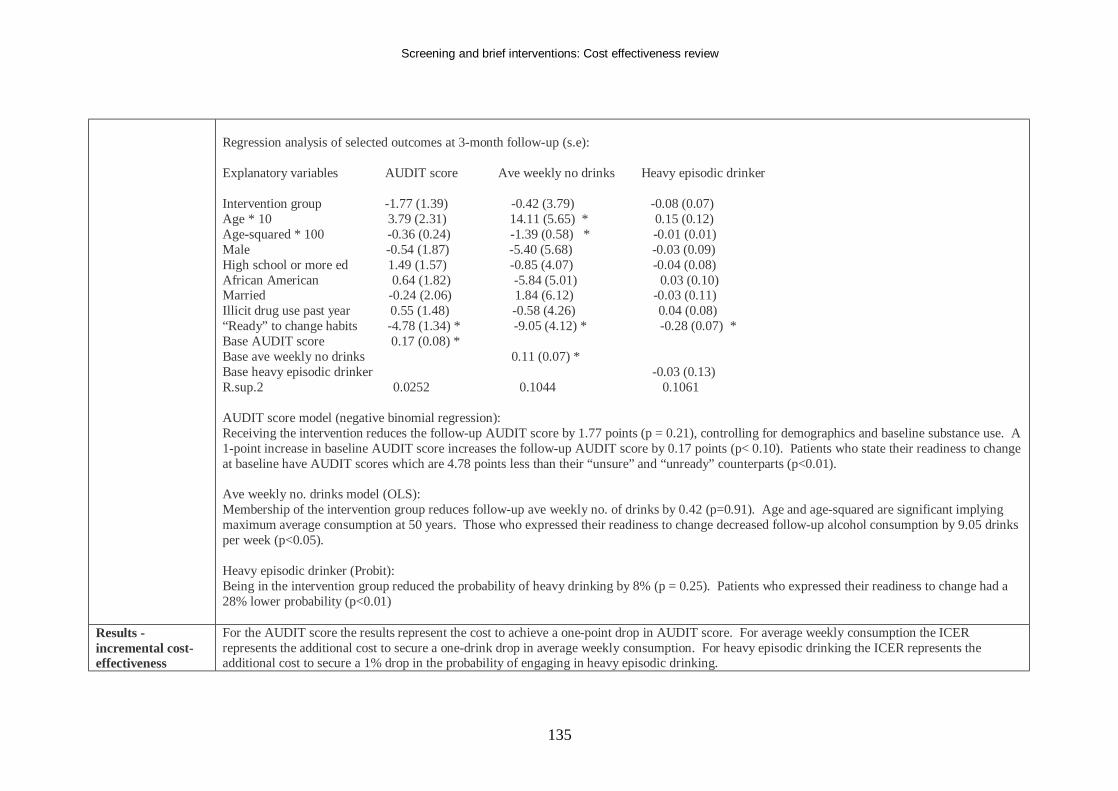
Screening and brief interventions: Cost effectiveness review
135
Regression analysis of selected outcomes at 3-month follow-up (s.e): Explanatory variables AUDIT score Ave weekly no drinks Heavy episodic drinker Intervention group -1.77 (1.39) -0.42 (3.79) -0.08 (0.07) Age * 10 3.79 (2.31) 14.11 (5.65) * 0.15 (0.12) Age-squared * 100 -0.36 (0.24) -1.39 (0.58) * -0.01 (0.01) Male -0.54 (1.87) -5.40 (5.68) -0.03 (0.09) High school or more ed 1.49 (1.57) -0.85 (4.07) -0.04 (0.08) African American 0.64 (1.82) -5.84 (5.01) 0.03 (0.10) Married -0.24 (2.06) 1.84 (6.12) -0.03 (0.11) Illicit drug use past year 0.55 (1.48) -0.58 (4.26) 0.04 (0.08) “Ready” to change habits -4.78 (1.34) * -9.05 (4.12) * -0.28 (0.07) * Base AUDIT score 0.17 (0.08) * Base ave weekly no drinks 0.11 (0.07) * Base heavy episodic drinker -0.03 (0.13) R.sup.2 0.0252 0.1044 0.1061 AUDIT score model (negative binomial regression): Receiving the intervention reduces the follow-up AUDIT score by 1.77 points (p = 0.21), controlling for demographics and baseline substance use. A 1-point increase in baseline AUDIT score increases the follow-up AUDIT score by 0.17 points (p< 0.10). Patients who state their readiness to change at baseline have AUDIT scores which are 4.78 points less than their “unsure” and “unready” counterparts (p<0.01). Ave weekly no. drinks model (OLS): Membership of the intervention group reduces follow-up ave weekly no. of drinks by 0.42 (p=0.91). Age and age-squared are significant implying maximum average consumption at 50 years. Those who expressed their readiness to change decreased follow-up alcohol consumption by 9.05 drinks per week (p<0.05). Heavy episodic drinker (Probit): Being in the intervention group reduced the probability of heavy drinking by 8% (p = 0.25). Patients who expressed their readiness to change had a 28% lower probability (p<0.01)
Results - incremental cost-effectiveness
For the AUDIT score the results represent the cost to achieve a one-point drop in AUDIT score. For average weekly consumption the ICER represents the additional cost to secure a one-drink drop in average weekly consumption. For heavy episodic drinking the ICER represents the additional cost to secure a 1% drop in the probability of engaging in heavy episodic drinking.
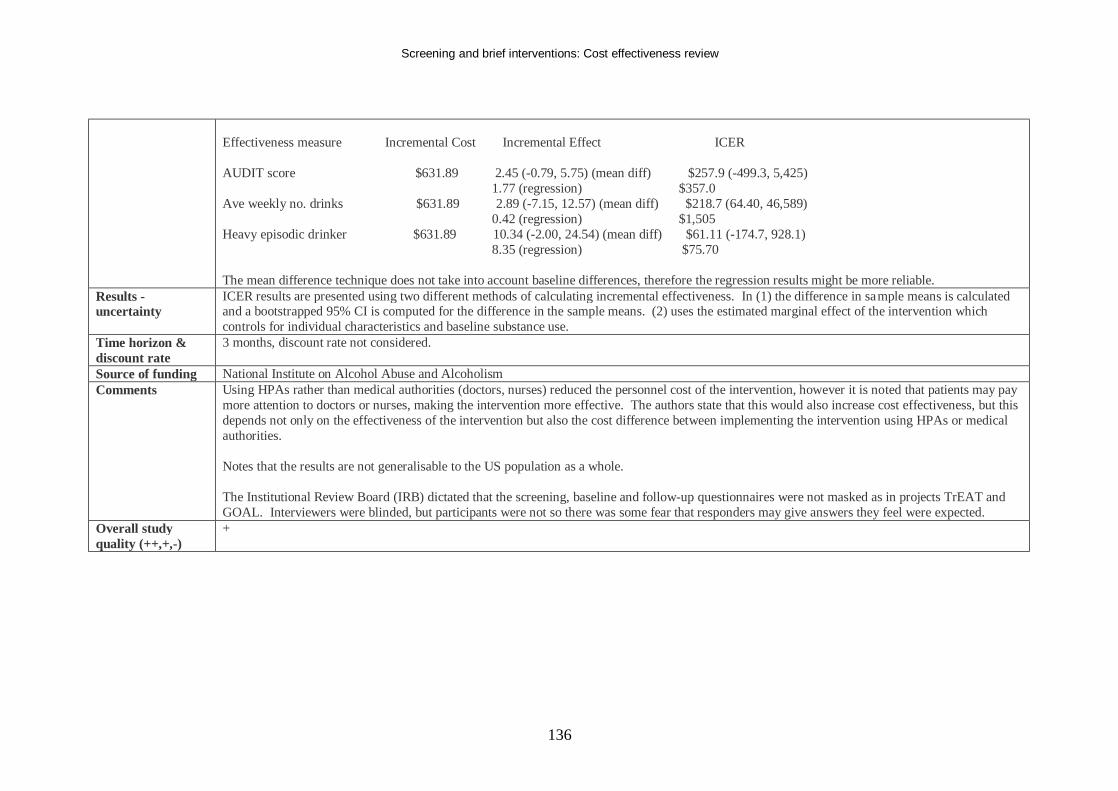
Screening and brief interventions: Cost effectiveness review
136
Effectiveness measure Incremental Cost Incremental Effect ICER AUDIT score $631.89 2.45 (-0.79, 5.75) (mean diff) $257.9 (-499.3, 5,425) 1.77 (regression) $357.0 Ave weekly no. drinks $631.89 2.89 (-7.15, 12.57) (mean diff) $218.7 (64.40, 46,589) 0.42 (regression) $1,505 Heavy episodic drinker $631.89 10.34 (-2.00, 24.54) (mean diff) $61.11 (-174.7, 928.1) 8.35 (regression) $75.70 The mean difference technique does not take into account baseline differences, therefore the regression results might be more reliable.
Results - uncertainty
ICER results are presented using two different methods of calculating incremental effectiveness. In (1) the difference in sample means is calculated and a bootstrapped 95% CI is computed for the difference in the sample means. (2) uses the estimated marginal effect of the intervention which controls for individual characteristics and baseline substance use.
Time horizon & discount rate
3 months, discount rate not considered.
Source of funding National Institute on Alcohol Abuse and Alcoholism Comments Using HPAs rather than medical authorities (doctors, nurses) reduced the personnel cost of the intervention, however it is noted that patients may pay
more attention to doctors or nurses, making the intervention more effective. The authors state that this would also increase cost effectiveness, but this depends not only on the effectiveness of the intervention but also the cost difference between implementing the intervention using HPAs or medical authorities. Notes that the results are not generalisable to the US population as a whole. The Institutional Review Board (IRB) dictated that the screening, baseline and follow-up questionnaires were not masked as in projects TrEAT and GOAL. Interviewers were blinded, but participants were not so there was some fear that responders may give answers they feel were expected.
Overall study quality (++,+,-)
+
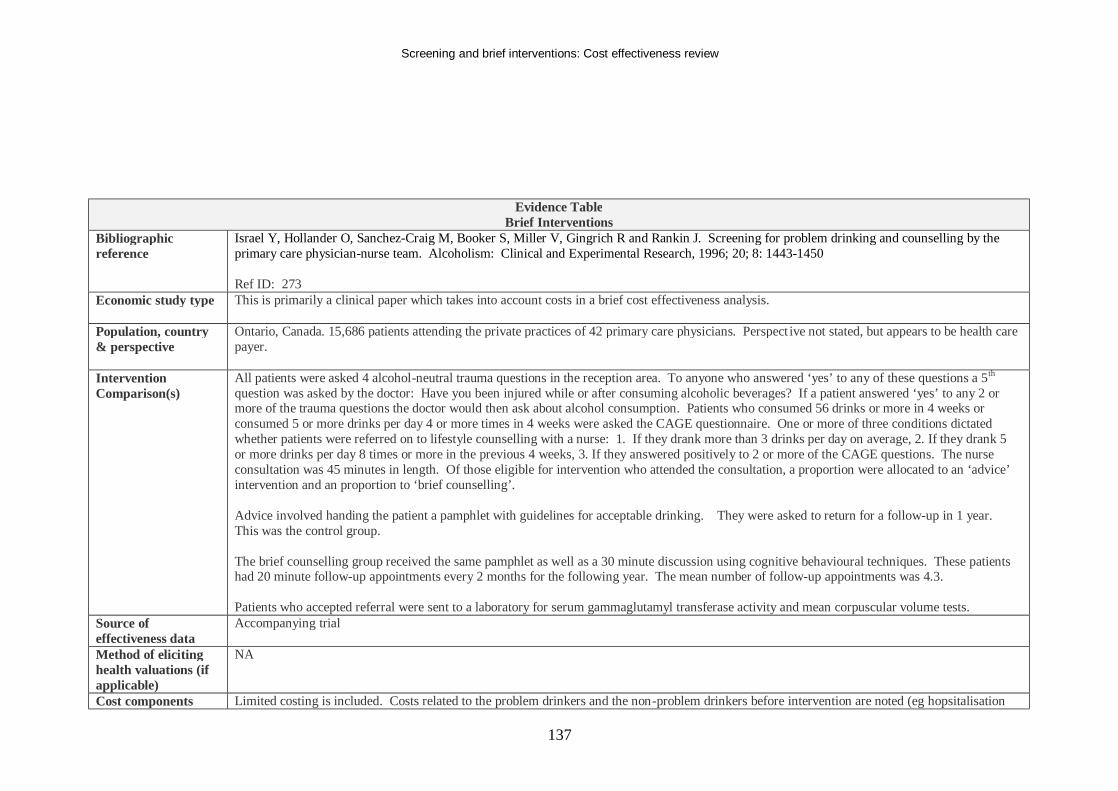
Screening and brief interventions: Cost effectiveness review
137
Evidence Table Brief Interventions
Bibliographic reference
Israel Y, Hollander O, Sanchez-Craig M, Booker S, Miller V, Gingrich R and Rankin J. Screening for problem drinking and counselling by the primary care physician-nurse team. Alcoholism: Clinical and Experimental Research, 1996; 20; 8: 1443-1450 Ref ID: 273
Economic study type This is primarily a clinical paper which takes into account costs in a brief cost effectiveness analysis.
Population, country & perspective
Ontario, Canada. 15,686 patients attending the private practices of 42 primary care physicians. Perspect ive not stated, but appears to be health care payer.
Intervention Comparison(s)
All patients were asked 4 alcohol-neutral trauma questions in the reception area. To anyone who answered ‘yes’ to any of these questions a 5th question was asked by the doctor: Have you been injured while or after consuming alcoholic beverages? If a patient answered ‘yes’ to any 2 or more of the trauma questions the doctor would then ask about alcohol consumption. Patients who consumed 56 drinks or more in 4 weeks or consumed 5 or more drinks per day 4 or more times in 4 weeks were asked the CAGE questionnaire. One or more of three conditions dictated whether patients were referred on to lifestyle counselling with a nurse: 1. If they drank more than 3 drinks per day on average, 2. If they drank 5 or more drinks per day 8 times or more in the previous 4 weeks, 3. If they answered positively to 2 or more of the CAGE questions. The nurse consultation was 45 minutes in length. Of those eligible for intervention who attended the consultation, a proportion were allocated to an ‘advice’ intervention and an proportion to ‘brief counselling’. Advice involved handing the patient a pamphlet with guidelines for acceptable drinking. They were asked to return for a follow-up in 1 year. This was the control group. The brief counselling group received the same pamphlet as well as a 30 minute discussion using cognitive behavioural techniques. These patients had 20 minute follow-up appointments every 2 months for the following year. The mean number of follow-up appointments was 4.3. Patients who accepted referral were sent to a laboratory for serum gammaglutamyl transferase activity and mean corpuscular volume tests.
Source of effectiveness data
Accompanying trial
Method of eliciting health valuations (if applicable)
NA
Cost components Limited costing is included. Costs related to the problem drinkers and the non-problem drinkers before intervention are noted (eg hopsitalisation
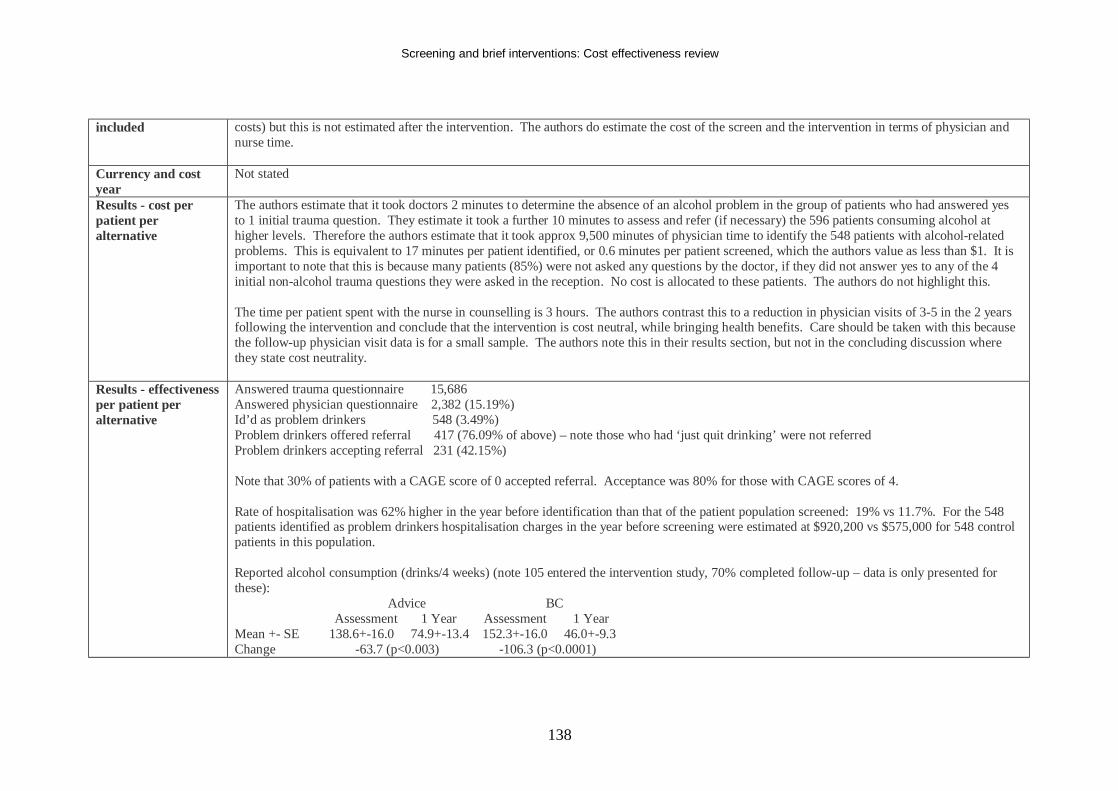
Screening and brief interventions: Cost effectiveness review
138
included costs) but this is not estimated after the intervention. The authors do estimate the cost of the screen and the intervention in terms of physician and nurse time.
Currency and cost year
Not stated
Results - cost per patient per alternative
The authors estimate that it took doctors 2 minutes to determine the absence of an alcohol problem in the group of patients who had answered yes to 1 initial trauma question. They estimate it took a further 10 minutes to assess and refer (if necessary) the 596 patients consuming alcohol at higher levels. Therefore the authors estimate that it took approx 9,500 minutes of physician time to identify the 548 patients with alcohol-related problems. This is equivalent to 17 minutes per patient identified, or 0.6 minutes per patient screened, which the authors value as less than $1. It is important to note that this is because many patients (85%) were not asked any questions by the doctor, if they did not answer yes to any of the 4 initial non-alcohol trauma questions they were asked in the reception. No cost is allocated to these patients. The authors do not highlight this. The time per patient spent with the nurse in counselling is 3 hours. The authors contrast this to a reduction in physician visits of 3-5 in the 2 years following the intervention and conclude that the intervention is cost neutral, while bringing health benefits. Care should be taken with this because the follow-up physician visit data is for a small sample. The authors note this in their results section, but not in the concluding discussion where they state cost neutrality.
Results - effectiveness per patient per alternative
Answered trauma questionnaire 15,686 Answered physician questionnaire 2,382 (15.19%) Id’d as problem drinkers 548 (3.49%) Problem drinkers offered referral 417 (76.09% of above) – note those who had ‘just quit drinking’ were not referred Problem drinkers accepting referral 231 (42.15%) Note that 30% of patients with a CAGE score of 0 accepted referral. Acceptance was 80% for those with CAGE scores of 4. Rate of hospitalisation was 62% higher in the year before identification than that of the patient population screened: 19% vs 11.7%. For the 548 patients identified as problem drinkers hospitalisation charges in the year before screening were estimated at $920,200 vs $575,000 for 548 control patients in this population. Reported alcohol consumption (drinks/4 weeks) (note 105 entered the intervention study, 70% completed follow-up – data is only presented for these): Advice BC Assessment 1 Year Assessment 1 Year Mean +- SE 138.6+-16.0 74.9+-13.4 152.3+-16.0 46.0+-9.3 Change -63.7 (p<0.003) -106.3 (p<0.0001)
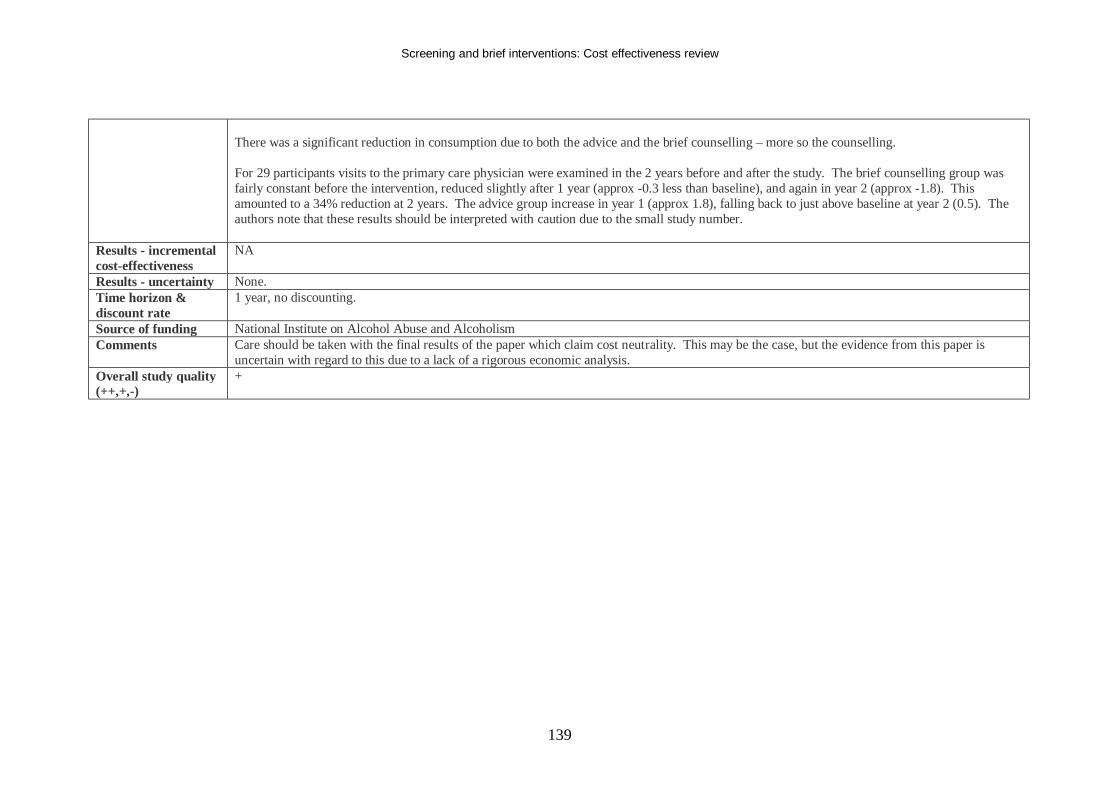
Screening and brief interventions: Cost effectiveness review
139
There was a significant reduction in consumption due to both the advice and the brief counselling – more so the counselling. For 29 participants visits to the primary care physician were examined in the 2 years before and after the study. The brief counselling group was fairly constant before the intervention, reduced slightly after 1 year (approx -0.3 less than baseline), and again in year 2 (approx -1.8). This amounted to a 34% reduction at 2 years. The advice group increase in year 1 (approx 1.8), falling back to just above baseline at year 2 (0.5). The authors note that these results should be interpreted with caution due to the small study number.
Results - incremental cost-effectiveness
NA
Results - uncertainty None. Time horizon & discount rate
1 year, no discounting.
Source of funding National Institute on Alcohol Abuse and Alcoholism Comments Care should be taken with the final results of the paper which claim cost neutrality. This may be the case, but the evidence from this paper is
uncertain with regard to this due to a lack of a rigorous economic analysis. Overall study quality (++,+,-)
+
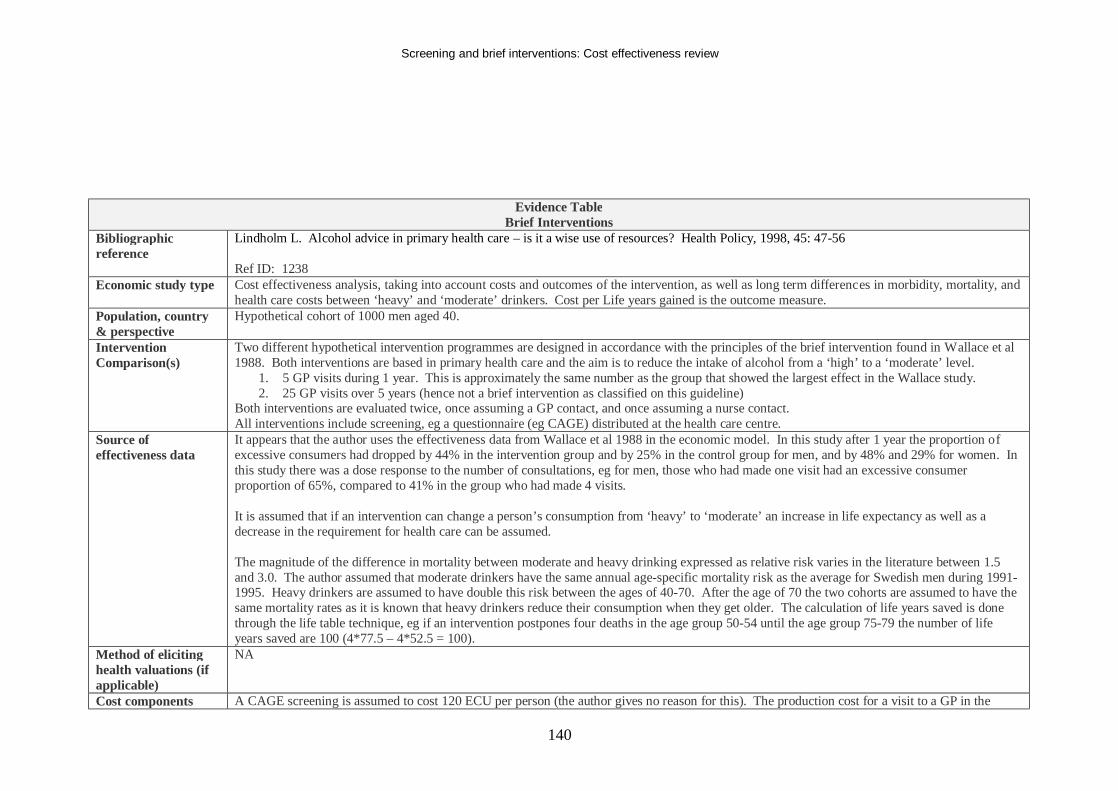
Screening and brief interventions: Cost effectiveness review
140
Evidence Table Brief Interventions
Bibliographic reference
Lindholm L. Alcohol advice in primary health care – is it a wise use of resources? Health Policy, 1998, 45: 47-56 Ref ID: 1238
Economic study type Cost effectiveness analysis, taking into account costs and outcomes of the intervention, as well as long term differences in morbidity, mortality, and health care costs between ‘heavy’ and ‘moderate’ drinkers. Cost per Life years gained is the outcome measure.
Population, country & perspective
Hypothetical cohort of 1000 men aged 40.
Intervention Comparison(s)
Two different hypothetical intervention programmes are designed in accordance with the principles of the brief intervention found in Wallace et al 1988. Both interventions are based in primary health care and the aim is to reduce the intake of alcohol from a ‘high’ to a ‘moderate’ level.
1. 5 GP visits during 1 year. This is approximately the same number as the group that showed the largest effect in the Wallace study. 2. 25 GP visits over 5 years (hence not a brief intervention as classified on this guideline)
Both interventions are evaluated twice, once assuming a GP contact, and once assuming a nurse contact. All interventions include screening, eg a questionnaire (eg CAGE) distributed at the health care centre.
Source of effectiveness data
It appears that the author uses the effectiveness data from Wallace et al 1988 in the economic model. In this study after 1 year the proportion of excessive consumers had dropped by 44% in the intervention group and by 25% in the control group for men, and by 48% and 29% for women. In this study there was a dose response to the number of consultations, eg for men, those who had made one visit had an excessive consumer proportion of 65%, compared to 41% in the group who had made 4 visits. It is assumed that if an intervention can change a person’s consumption from ‘heavy’ to ‘moderate’ an increase in life expectancy as well as a decrease in the requirement for health care can be assumed. The magnitude of the difference in mortality between moderate and heavy drinking expressed as relative risk varies in the literature between 1.5 and 3.0. The author assumed that moderate drinkers have the same annual age-specific mortality risk as the average for Swedish men during 1991-1995. Heavy drinkers are assumed to have double this risk between the ages of 40-70. After the age of 70 the two cohorts are assumed to have the same mortality rates as it is known that heavy drinkers reduce their consumption when they get older. The calculation of life years saved is done through the life table technique, eg if an intervention postpones four deaths in the age group 50-54 until the age group 75-79 the number of life years saved are 100 (4*77.5 – 4*52.5 = 100).
Method of eliciting health valuations (if applicable)
NA
Cost components A CAGE screening is assumed to cost 120 ECU per person (the author gives no reason for this). The production cost for a visit to a GP in the
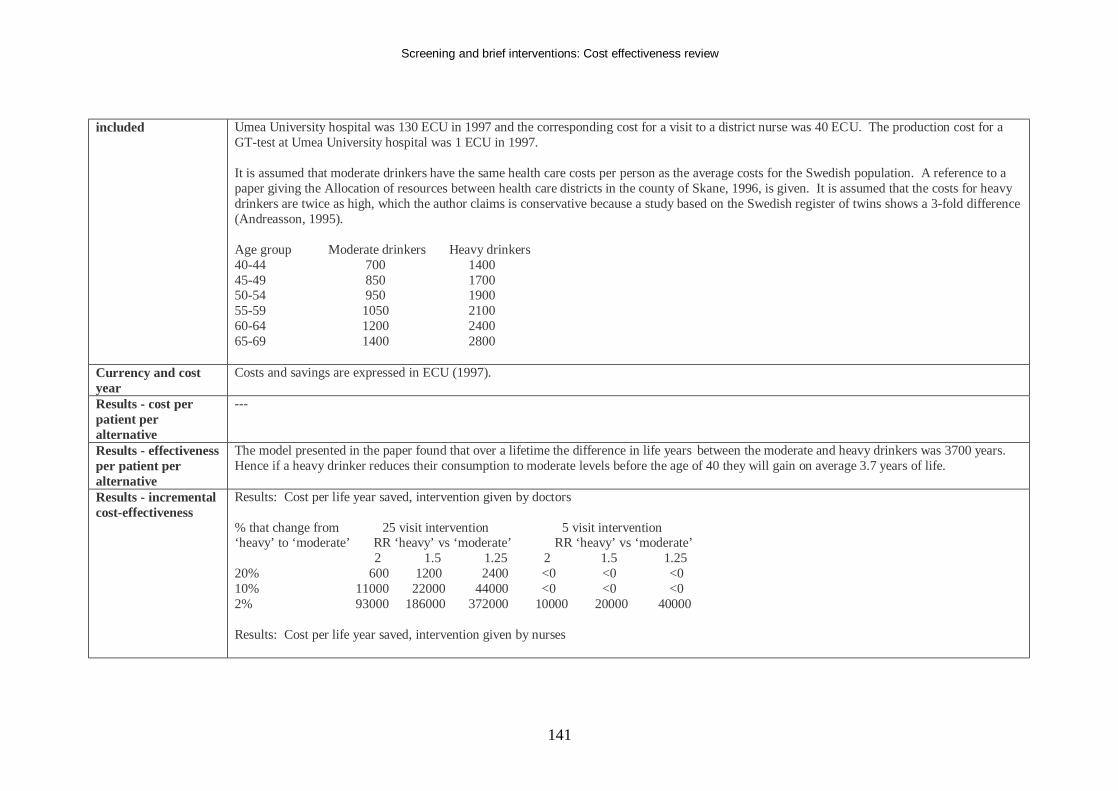
Screening and brief interventions: Cost effectiveness review
141
included Umea University hospital was 130 ECU in 1997 and the corresponding cost for a visit to a district nurse was 40 ECU. The production cost for a GT-test at Umea University hospital was 1 ECU in 1997. It is assumed that moderate drinkers have the same health care costs per person as the average costs for the Swedish population. A reference to a paper giving the Allocation of resources between health care districts in the county of Skane, 1996, is given. It is assumed that the costs for heavy drinkers are twice as high, which the author claims is conservative because a study based on the Swedish register of twins shows a 3-fold difference (Andreasson, 1995). Age group Moderate drinkers Heavy drinkers 40-44 700 1400 45-49 850 1700 50-54 950 1900 55-59 1050 2100 60-64 1200 2400 65-69 1400 2800
Currency and cost year
Costs and savings are expressed in ECU (1997).
Results - cost per patient per alternative
---
Results - effectiveness per patient per alternative
The model presented in the paper found that over a lifetime the difference in life years between the moderate and heavy drinkers was 3700 years. Hence if a heavy drinker reduces their consumption to moderate levels before the age of 40 they will gain on average 3.7 years of life.
Results - incremental cost-effectiveness
Results: Cost per life year saved, intervention given by doctors % that change from 25 visit intervention 5 visit intervention ‘heavy’ to ‘moderate’ RR ‘heavy’ vs ‘moderate’ RR ‘heavy’ vs ‘moderate’ 2 1.5 1.25 2 1.5 1.25 20% 600 1200 2400 <0 <0 <0 10% 11000 22000 44000 <0 <0 <0 2% 93000 186000 372000 10000 20000 40000 Results: Cost per life year saved, intervention given by nurses
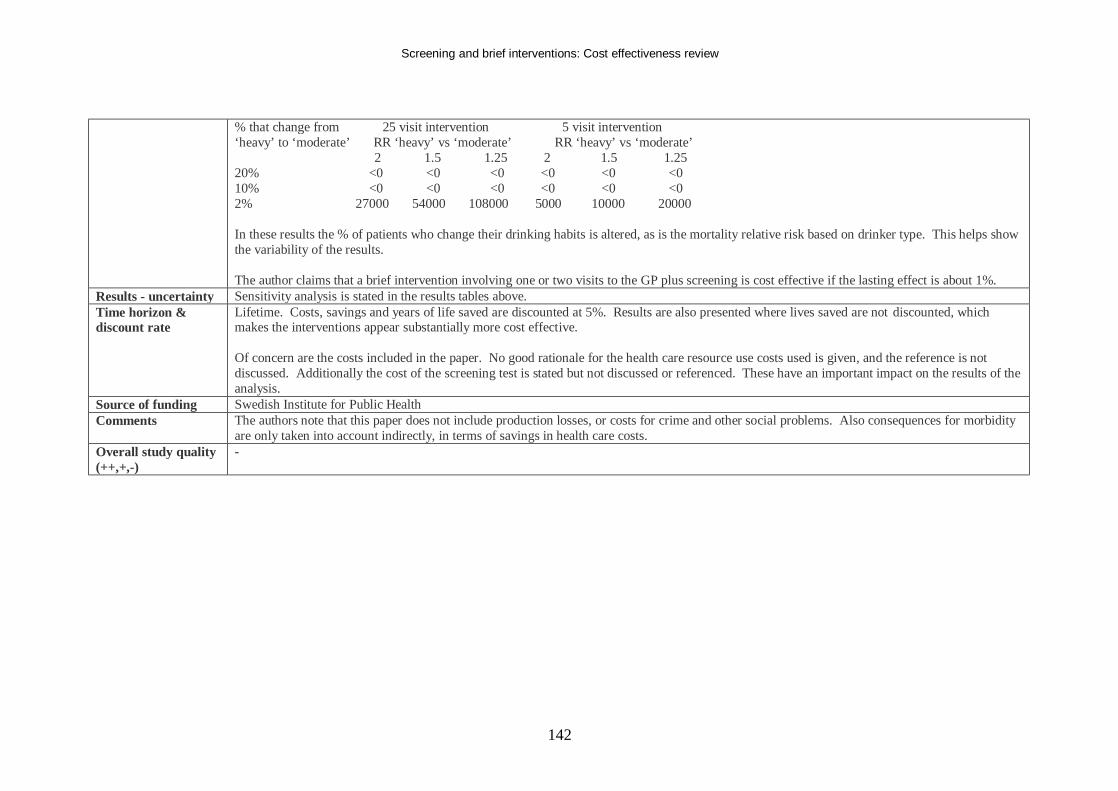
Screening and brief interventions: Cost effectiveness review
142
% that change from 25 visit intervention 5 visit intervention ‘heavy’ to ‘moderate’ RR ‘heavy’ vs ‘moderate’ RR ‘heavy’ vs ‘moderate’ 2 1.5 1.25 2 1.5 1.25 20% <0 <0 <0 <0 <0 <0 10% <0 <0 <0 <0 <0 <0 2% 27000 54000 108000 5000 10000 20000 In these results the % of patients who change their drinking habits is altered, as is the mortality relative risk based on drinker type. This helps show the variability of the results. The author claims that a brief intervention involving one or two visits to the GP plus screening is cost effective if the lasting effect is about 1%.
Results - uncertainty Sensitivity analysis is stated in the results tables above. Time horizon & discount rate
Lifetime. Costs, savings and years of life saved are discounted at 5%. Results are also presented where lives saved are not discounted, which makes the interventions appear substantially more cost effective. Of concern are the costs included in the paper. No good rationale for the health care resource use costs used is given, and the reference is not discussed. Additionally the cost of the screening test is stated but not discussed or referenced. These have an important impact on the results of the analysis.
Source of funding Swedish Institute for Public Health Comments The authors note that this paper does not include production losses, or costs for crime and other social problems. Also consequences for morbidity
are only taken into account indirectly, in terms of savings in health care costs. Overall study quality (++,+,-)
-
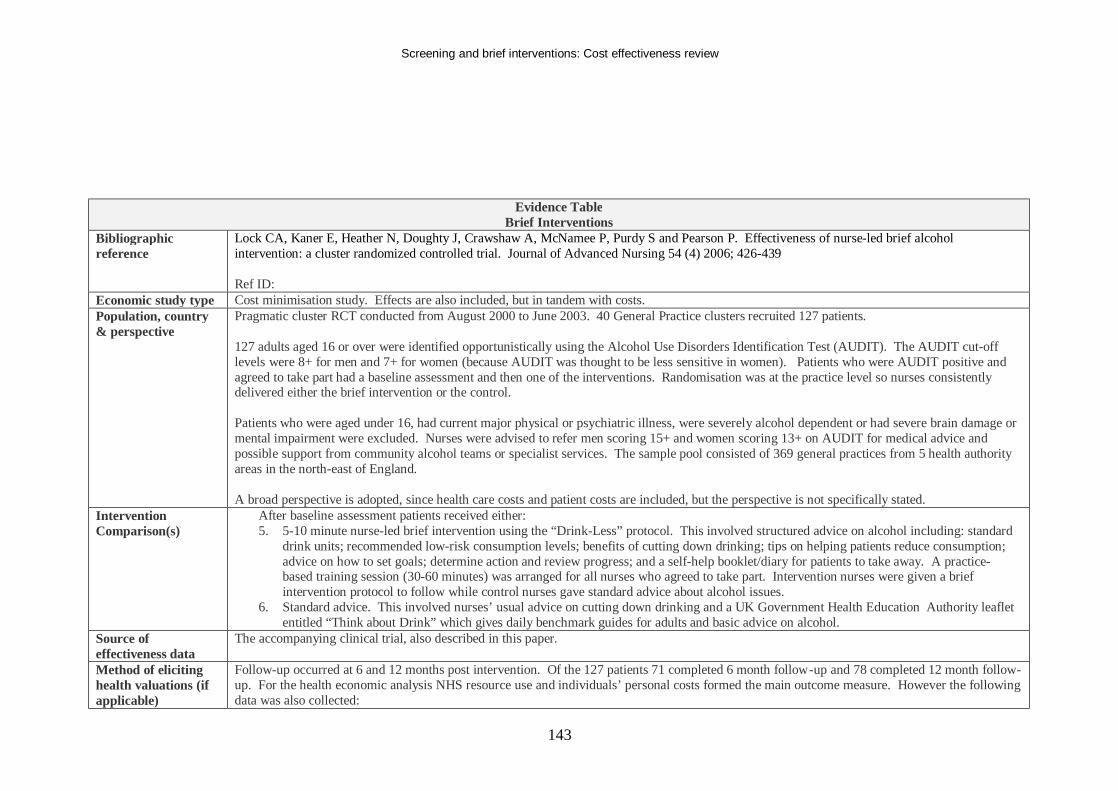
Screening and brief interventions: Cost effectiveness review
143
Evidence Table Brief Interventions
Bibliographic reference
Lock CA, Kaner E, Heather N, Doughty J, Crawshaw A, McNamee P, Purdy S and Pearson P. Effectiveness of nurse-led brief alcohol intervention: a cluster randomized controlled trial. Journal of Advanced Nursing 54 (4) 2006; 426-439 Ref ID:
Economic study type Cost minimisation study. Effects are also included, but in tandem with costs. Population, country & perspective
Pragmatic cluster RCT conducted from August 2000 to June 2003. 40 General Practice clusters recruited 127 patients. 127 adults aged 16 or over were identified opportunistically using the Alcohol Use Disorders Identification Test (AUDIT). The AUDIT cut-off levels were 8+ for men and 7+ for women (because AUDIT was thought to be less sensitive in women). Patients who were AUDIT positive and agreed to take part had a baseline assessment and then one of the interventions. Randomisation was at the practice level so nurses consistently delivered either the brief intervention or the control. Patients who were aged under 16, had current major physical or psychiatric illness, were severely alcohol dependent or had severe brain damage or mental impairment were excluded. Nurses were advised to refer men scoring 15+ and women scoring 13+ on AUDIT for medical advice and possible support from community alcohol teams or specialist services. The sample pool consisted of 369 general practices from 5 health authority areas in the north-east of England. A broad perspective is adopted, since health care costs and patient costs are included, but the perspective is not specifically stated.
Intervention Comparison(s)
After baseline assessment patients received either: 5. 5-10 minute nurse-led brief intervention using the “Drink-Less” protocol. This involved structured advice on alcohol including: standard
drink units; recommended low-risk consumption levels; benefits of cutting down drinking; tips on helping patients reduce consumption; advice on how to set goals; determine action and review progress; and a self-help booklet/diary for patients to take away. A practice-based training session (30-60 minutes) was arranged for all nurses who agreed to take part. Intervention nurses were given a brief intervention protocol to follow while control nurses gave standard advice about alcohol issues.
6. Standard advice. This involved nurses’ usual advice on cutting down drinking and a UK Government Health Education Authority leaflet entitled “Think about Drink” which gives daily benchmark guides for adults and basic advice on alcohol.
Source of effectiveness data
The accompanying clinical trial, also described in this paper.
Method of eliciting health valuations (if applicable)
Follow-up occurred at 6 and 12 months post intervention. Of the 127 patients 71 completed 6 month follow-up and 78 completed 12 month follow-up. For the health economic analysis NHS resource use and individuals’ personal costs formed the main outcome measure. However the following data was also collected:
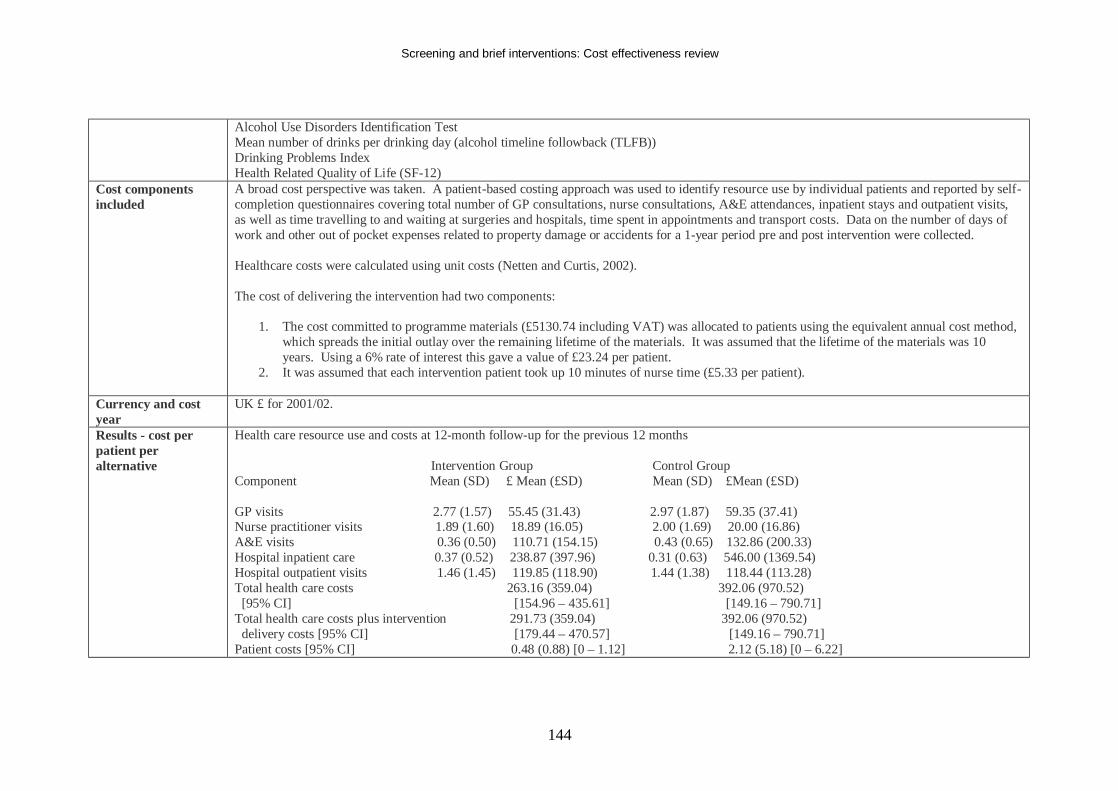
Screening and brief interventions: Cost effectiveness review
144
Alcohol Use Disorders Identification Test Mean number of drinks per drinking day (alcohol timeline followback (TLFB)) Drinking Problems Index Health Related Quality of Life (SF-12)
Cost components included
A broad cost perspective was taken. A patient-based costing approach was used to identify resource use by individual patients and reported by self-completion questionnaires covering total number of GP consultations, nurse consultations, A&E attendances, inpatient stays and outpatient visits, as well as time travelling to and waiting at surgeries and hospitals, time spent in appointments and transport costs. Data on the number of days of work and other out of pocket expenses related to property damage or accidents for a 1-year period pre and post intervention were collected. Healthcare costs were calculated using unit costs (Netten and Curtis, 2002). The cost of delivering the intervention had two components:
1. The cost committed to programme materials (£5130.74 including VAT) was allocated to patients using the equivalent annual cost method, which spreads the initial outlay over the remaining lifetime of the materials. It was assumed that the lifetime of the materials was 10 years. Using a 6% rate of interest this gave a value of £23.24 per patient.
2. It was assumed that each intervention patient took up 10 minutes of nurse time (£5.33 per patient).
Currency and cost year
UK £ for 2001/02.
Results - cost per patient per alternative
Health care resource use and costs at 12-month follow-up for the previous 12 months Intervention Group Control Group Component Mean (SD) £ Mean (£SD) Mean (SD) £Mean (£SD) GP visits 2.77 (1.57) 55.45 (31.43) 2.97 (1.87) 59.35 (37.41) Nurse practitioner visits 1.89 (1.60) 18.89 (16.05) 2.00 (1.69) 20.00 (16.86) A&E visits 0.36 (0.50) 110.71 (154.15) 0.43 (0.65) 132.86 (200.33) Hospital inpatient care 0.37 (0.52) 238.87 (397.96) 0.31 (0.63) 546.00 (1369.54) Hospital outpatient visits 1.46 (1.45) 119.85 (118.90) 1.44 (1.38) 118.44 (113.28) Total health care costs 263.16 (359.04) 392.06 (970.52) [95% CI] [154.96 – 435.61] [149.16 – 790.71] Total health care costs plus intervention 291.73 (359.04) 392.06 (970.52) delivery costs [95% CI] [179.44 – 470.57] [149.16 – 790.71] Patient costs [95% CI] 0.48 (0.88) [0 – 1.12] 2.12 (5.18) [0 – 6.22]
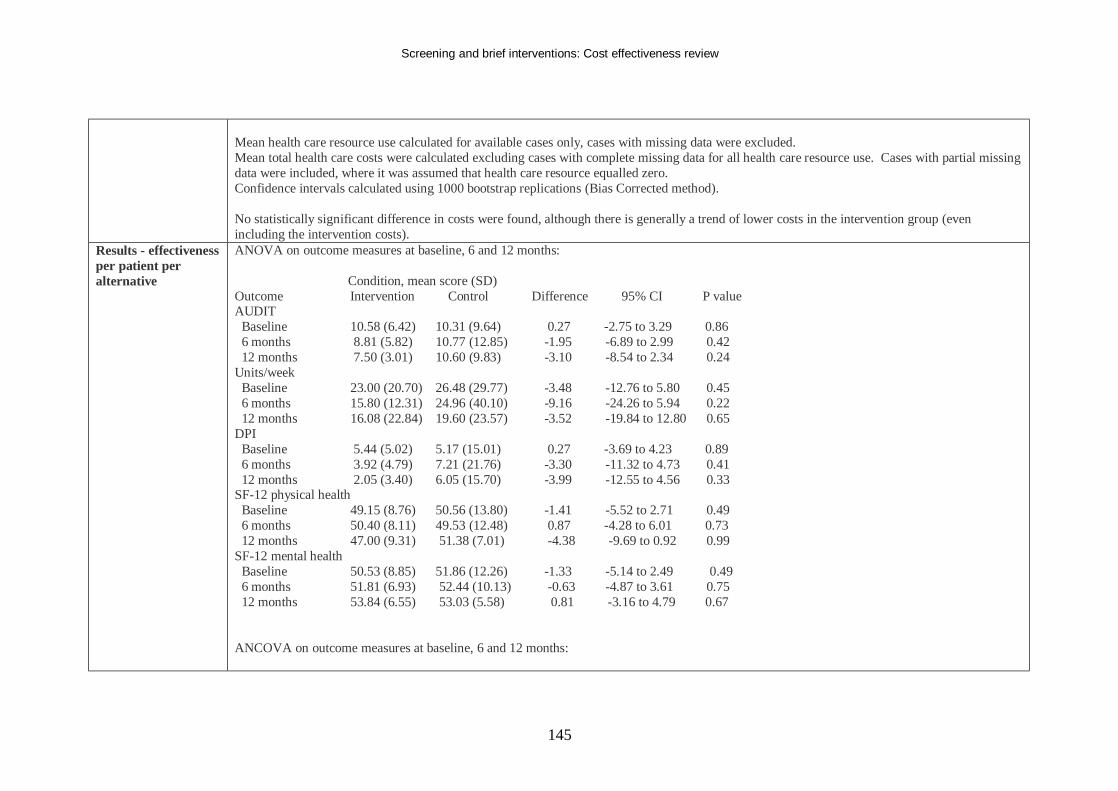
Screening and brief interventions: Cost effectiveness review
145
Mean health care resource use calculated for available cases only, cases with missing data were excluded. Mean total health care costs were calculated excluding cases with complete missing data for all health care resource use. Cases with partial missing data were included, where it was assumed that health care resource equalled zero. Confidence intervals calculated using 1000 bootstrap replications (Bias Corrected method). No statistically significant difference in costs were found, although there is generally a trend of lower costs in the intervention group (even including the intervention costs).
Results - effectiveness per patient per alternative
ANOVA on outcome measures at baseline, 6 and 12 months: Condition, mean score (SD) Outcome Intervention Control Difference 95% CI P value AUDIT Baseline 10.58 (6.42) 10.31 (9.64) 0.27 -2.75 to 3.29 0.86 6 months 8.81 (5.82) 10.77 (12.85) -1.95 -6.89 to 2.99 0.42 12 months 7.50 (3.01) 10.60 (9.83) -3.10 -8.54 to 2.34 0.24 Units/week Baseline 23.00 (20.70) 26.48 (29.77) -3.48 -12.76 to 5.80 0.45 6 months 15.80 (12.31) 24.96 (40.10) -9.16 -24.26 to 5.94 0.22 12 months 16.08 (22.84) 19.60 (23.57) -3.52 -19.84 to 12.80 0.65 DPI Baseline 5.44 (5.02) 5.17 (15.01) 0.27 -3.69 to 4.23 0.89 6 months 3.92 (4.79) 7.21 (21.76) -3.30 -11.32 to 4.73 0.41 12 months 2.05 (3.40) 6.05 (15.70) -3.99 -12.55 to 4.56 0.33 SF-12 physical health Baseline 49.15 (8.76) 50.56 (13.80) -1.41 -5.52 to 2.71 0.49 6 months 50.40 (8.11) 49.53 (12.48) 0.87 -4.28 to 6.01 0.73 12 months 47.00 (9.31) 51.38 (7.01) -4.38 -9.69 to 0.92 0.99 SF-12 mental health Baseline 50.53 (8.85) 51.86 (12.26) -1.33 -5.14 to 2.49 0.49 6 months 51.81 (6.93) 52.44 (10.13) -0.63 -4.87 to 3.61 0.75 12 months 53.84 (6.55) 53.03 (5.58) 0.81 -3.16 to 4.79 0.67 ANCOVA on outcome measures at baseline, 6 and 12 months:
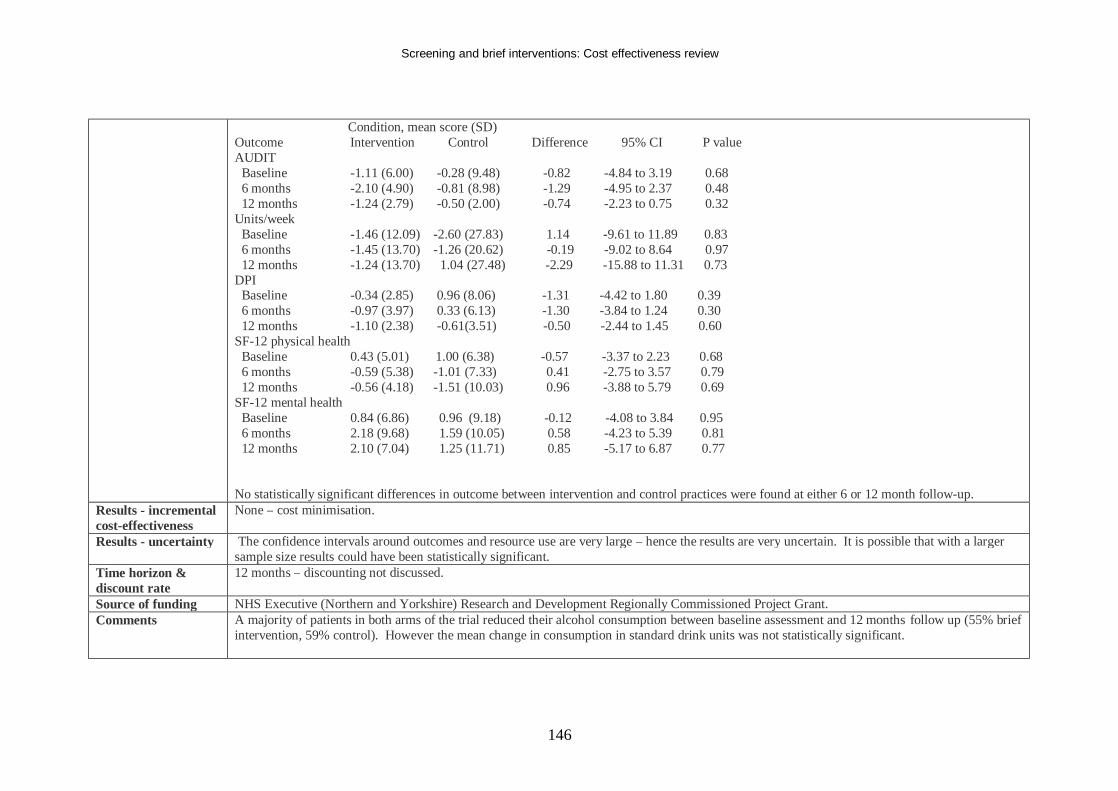
Screening and brief interventions: Cost effectiveness review
146
Condition, mean score (SD) Outcome Intervention Control Difference 95% CI P value AUDIT Baseline -1.11 (6.00) -0.28 (9.48) -0.82 -4.84 to 3.19 0.68 6 months -2.10 (4.90) -0.81 (8.98) -1.29 -4.95 to 2.37 0.48 12 months -1.24 (2.79) -0.50 (2.00) -0.74 -2.23 to 0.75 0.32 Units/week Baseline -1.46 (12.09) -2.60 (27.83) 1.14 -9.61 to 11.89 0.83 6 months -1.45 (13.70) -1.26 (20.62) -0.19 -9.02 to 8.64 0.97 12 months -1.24 (13.70) 1.04 (27.48) -2.29 -15.88 to 11.31 0.73 DPI Baseline -0.34 (2.85) 0.96 (8.06) -1.31 -4.42 to 1.80 0.39 6 months -0.97 (3.97) 0.33 (6.13) -1.30 -3.84 to 1.24 0.30 12 months -1.10 (2.38) -0.61(3.51) -0.50 -2.44 to 1.45 0.60 SF-12 physical health Baseline 0.43 (5.01) 1.00 (6.38) -0.57 -3.37 to 2.23 0.68 6 months -0.59 (5.38) -1.01 (7.33) 0.41 -2.75 to 3.57 0.79 12 months -0.56 (4.18) -1.51 (10.03) 0.96 -3.88 to 5.79 0.69 SF-12 mental health Baseline 0.84 (6.86) 0.96 (9.18) -0.12 -4.08 to 3.84 0.95 6 months 2.18 (9.68) 1.59 (10.05) 0.58 -4.23 to 5.39 0.81 12 months 2.10 (7.04) 1.25 (11.71) 0.85 -5.17 to 6.87 0.77 No statistically significant differences in outcome between intervention and control practices were found at either 6 or 12 month follow-up.
Results - incremental cost-effectiveness
None – cost minimisation.
Results - uncertainty The confidence intervals around outcomes and resource use are very large – hence the results are very uncertain. It is possible that with a larger sample size results could have been statistically significant.
Time horizon & discount rate
12 months – discounting not discussed.
Source of funding NHS Executive (Northern and Yorkshire) Research and Development Regionally Commissioned Project Grant. Comments A majority of patients in both arms of the trial reduced their alcohol consumption between baseline assessment and 12 months follow up (55% brief
intervention, 59% control). However the mean change in consumption in standard drink units was not statistically significant.
Screening and brief interventions: Cost effectiveness review
147
Authors noted that: 93 practices were originally recruited, but 53 withdrew without recruiting any patients. The authors suggest that this could be due to nurses unease with aspects of the study protocol since a previous similar study (Kaner et al 2003; Lock and Kaner 2004) had not required patient written consent, could be recruited anonymously and did not undergo baseline assessment other than AUDIT. This was because the previous study had a focus of nurse activity. Therefore nurses may have viewed this new study as being overly time-consuming. 62 patients declined to take part and this group was statistically significantly younger than the trial participants. Lack of statistical significance may be due to lack of a true (no treatment) control – both groups showed a reduction in alcohol consumption. Power calculations were undertaken, but the lack of statistical significance may have been due to lack of power.
Overall study quality (++,+,-)
+
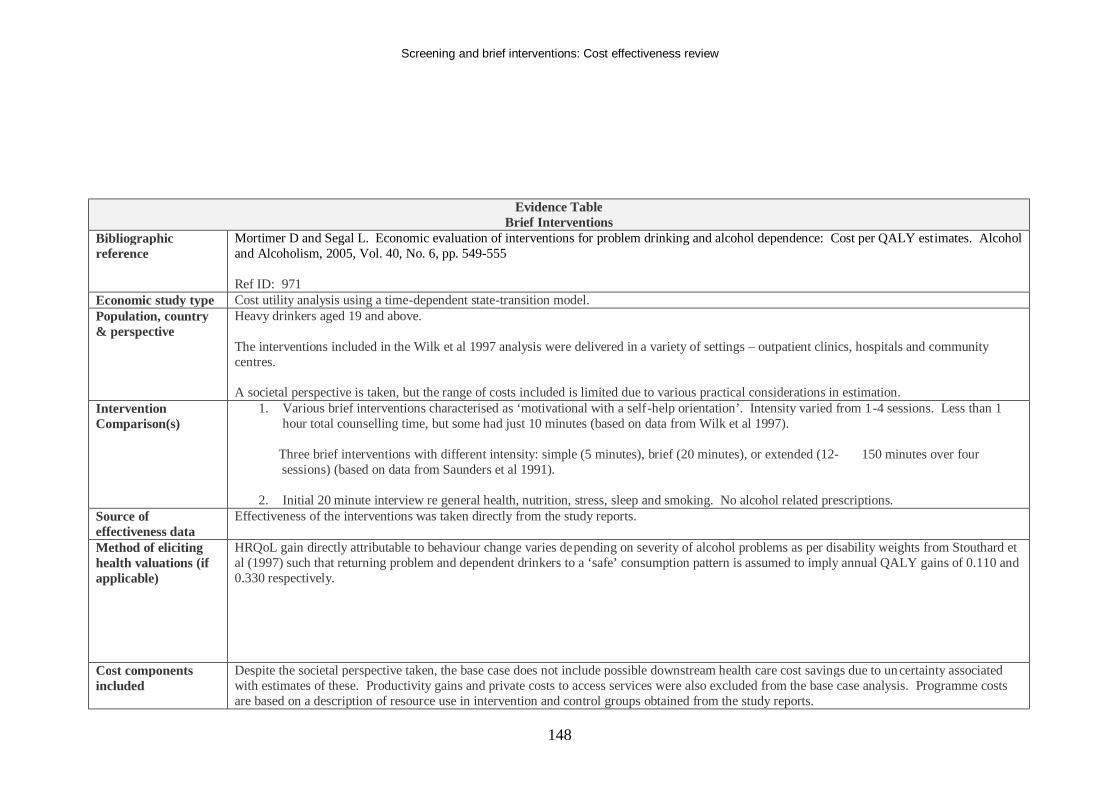
Screening and brief interventions: Cost effectiveness review
148
Evidence Table Brief Interventions
Bibliographic reference
Mortimer D and Segal L. Economic evaluation of interventions for problem drinking and alcohol dependence: Cost per QALY estimates. Alcohol and Alcoholism, 2005, Vol. 40, No. 6, pp. 549-555 Ref ID: 971
Economic study type Cost utility analysis using a time-dependent state-transition model. Population, country & perspective
Heavy drinkers aged 19 and above. The interventions included in the Wilk et al 1997 analysis were delivered in a variety of settings – outpatient clinics, hospitals and community centres. A societal perspective is taken, but the range of costs included is limited due to various practical considerations in estimation.
Intervention Comparison(s)
1. Various brief interventions characterised as ‘motivational with a self-help orientation’. Intensity varied from 1-4 sessions. Less than 1 hour total counselling time, but some had just 10 minutes (based on data from Wilk et al 1997).
Three brief interventions with different intensity: simple (5 minutes), brief (20 minutes), or extended (12- 150 minutes over four
sessions) (based on data from Saunders et al 1991). 2. Initial 20 minute interview re general health, nutrition, stress, sleep and smoking. No alcohol related prescriptions.
Source of effectiveness data
Effectiveness of the interventions was taken directly from the study reports.
Method of eliciting health valuations (if applicable)
HRQoL gain directly attributable to behaviour change varies depending on severity of alcohol problems as per disability weights from Stouthard et al (1997) such that returning problem and dependent drinkers to a ‘safe’ consumption pattern is assumed to imply annual QALY gains of 0.110 and 0.330 respectively.
Cost components included
Despite the societal perspective taken, the base case does not include possible downstream health care cost savings due to uncertainty associated with estimates of these. Productivity gains and private costs to access services were also excluded from the base case analysis. Programme costs are based on a description of resource use in intervention and control groups obtained from the study reports.
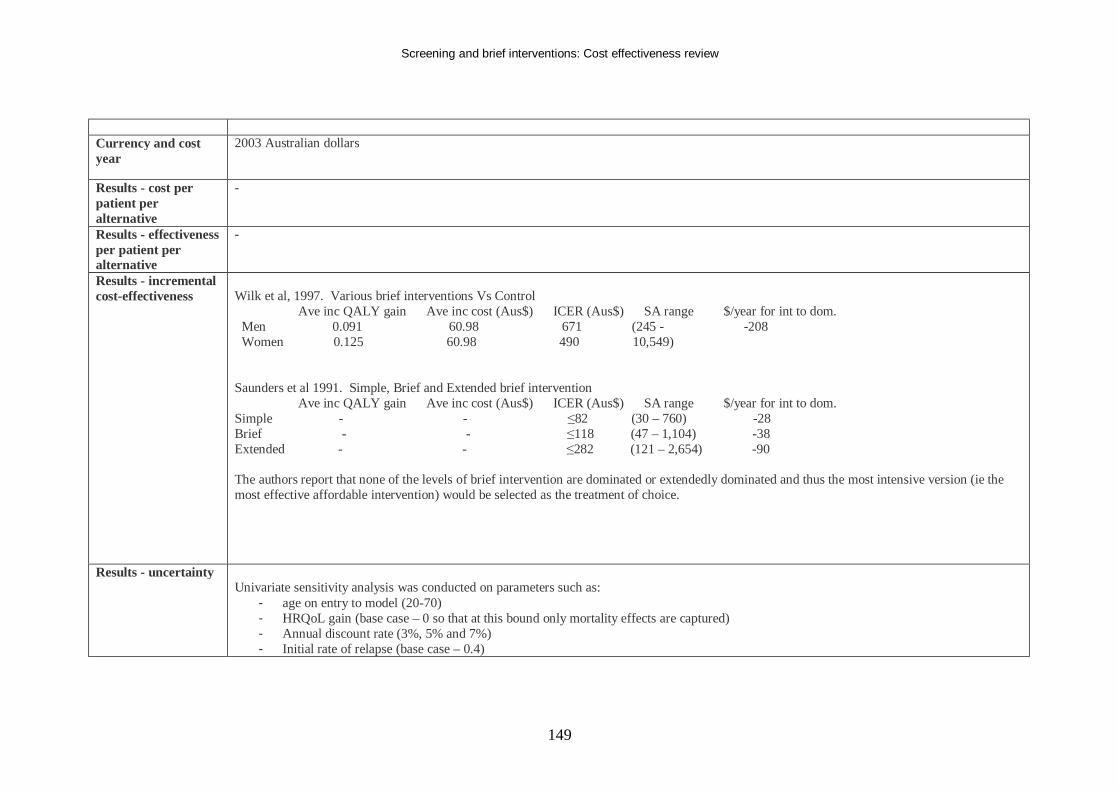
Screening and brief interventions: Cost effectiveness review
149
Currency and cost year
2003 Australian dollars
Results - cost per patient per alternative
-
Results - effectiveness per patient per alternative
-
Results - incremental cost-effectiveness
Wilk et al, 1997. Various brief interventions Vs Control Ave inc QALY gain Ave inc cost (Aus$) ICER (Aus$) SA range $/year for int to dom. Men 0.091 60.98 671 (245 - -208 Women 0.125 60.98 490 10,549) Saunders et al 1991. Simple, Brief and Extended brief intervention Ave inc QALY gain Ave inc cost (Aus$) ICER (Aus$) SA range $/year for int to dom. Simple - - ≤82 (30 – 760) -28 Brief - - ≤118 (47 – 1,104) -38 Extended - - ≤282 (121 – 2,654) -90 The authors report that none of the levels of brief intervention are dominated or extendedly dominated and thus the most intensive version (ie the most effective affordable intervention) would be selected as the treatment of choice.
Results - uncertainty Univariate sensitivity analysis was conducted on parameters such as:
- age on entry to model (20-70) - HRQoL gain (base case – 0 so that at this bound only mortality effects are captured) - Annual discount rate (3%, 5% and 7%) - Initial rate of relapse (base case – 0.4)
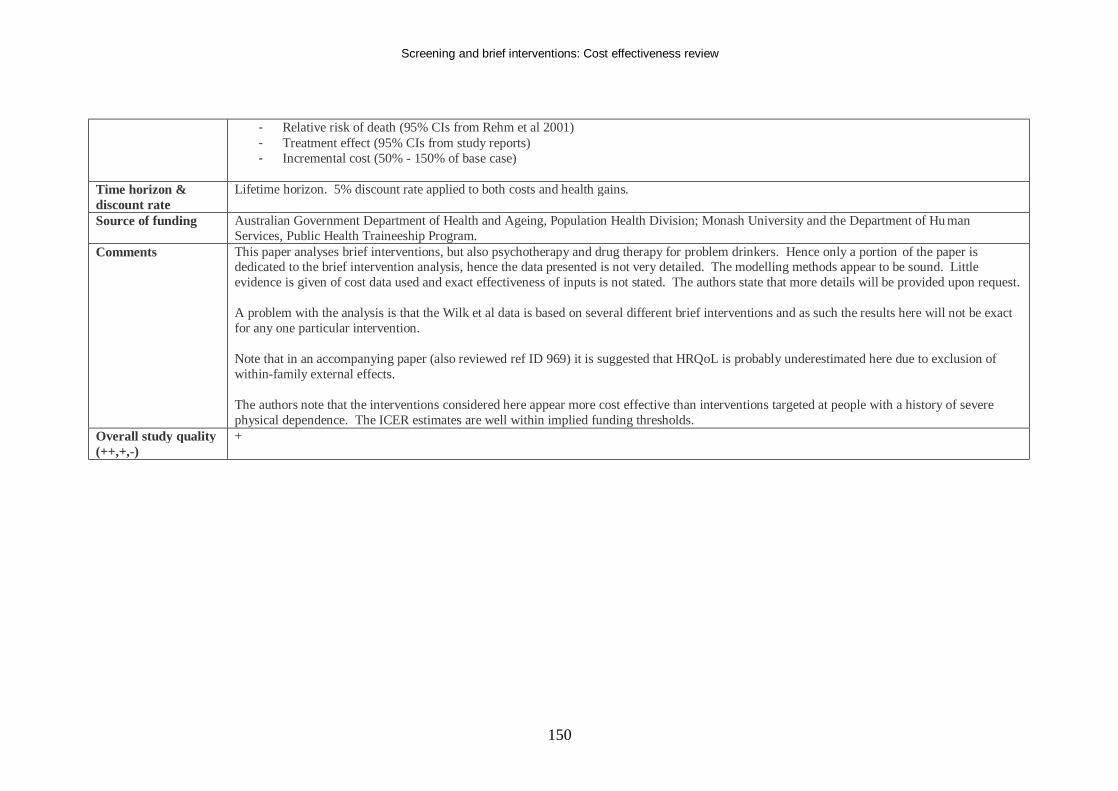
Screening and brief interventions: Cost effectiveness review
150
- Relative risk of death (95% CIs from Rehm et al 2001) - Treatment effect (95% CIs from study reports) - Incremental cost (50% - 150% of base case)
Time horizon & discount rate
Lifetime horizon. 5% discount rate applied to both costs and health gains.
Source of funding Australian Government Department of Health and Ageing, Population Health Division; Monash University and the Department of Hu man Services, Public Health Traineeship Program.
Comments This paper analyses brief interventions, but also psychotherapy and drug therapy for problem drinkers. Hence only a portion of the paper is dedicated to the brief intervention analysis, hence the data presented is not very detailed. The modelling methods appear to be sound. Little evidence is given of cost data used and exact effectiveness of inputs is not stated. The authors state that more details will be provided upon request. A problem with the analysis is that the Wilk et al data is based on several different brief interventions and as such the results here will not be exact for any one particular intervention. Note that in an accompanying paper (also reviewed ref ID 969) it is suggested that HRQoL is probably underestimated here due to exclusion of within-family external effects. The authors note that the interventions considered here appear more cost effective than interventions targeted at people with a history of severe physical dependence. The ICER estimates are well within implied funding thresholds.
Overall study quality (++,+,-)
+
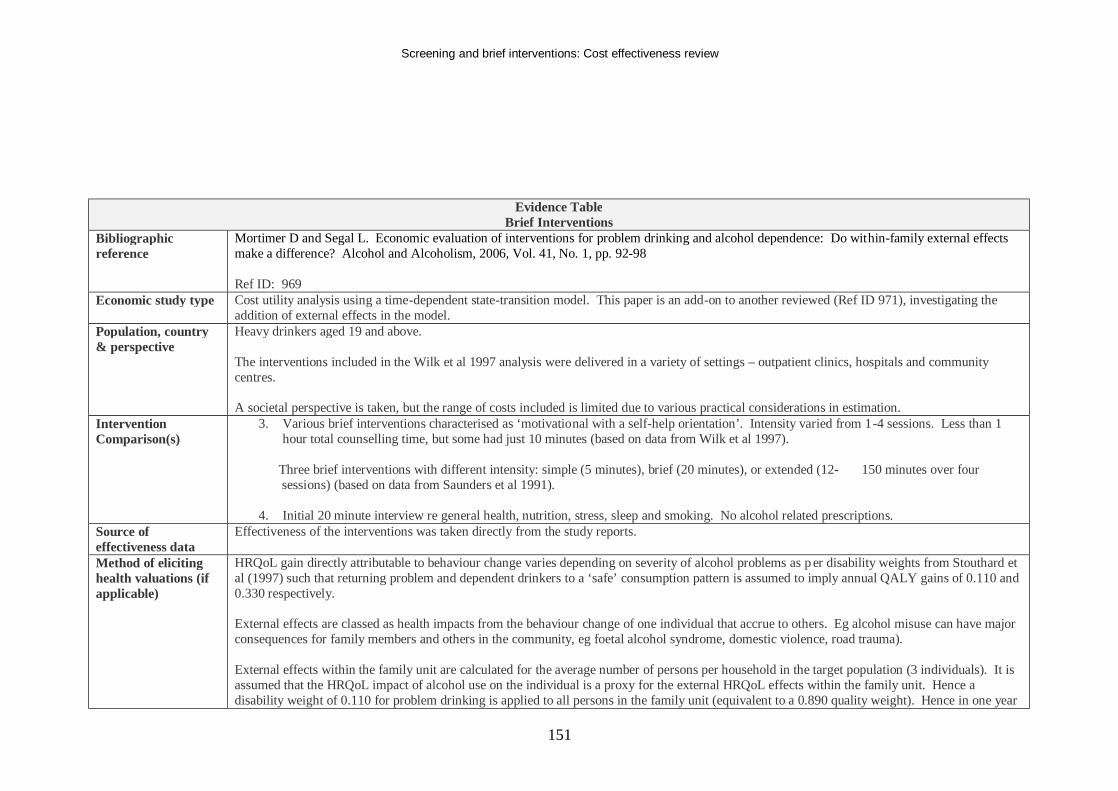
Screening and brief interventions: Cost effectiveness review
151
Evidence Table Brief Interventions
Bibliographic reference
Mortimer D and Segal L. Economic evaluation of interventions for problem drinking and alcohol dependence: Do within-family external effects make a difference? Alcohol and Alcoholism, 2006, Vol. 41, No. 1, pp. 92-98 Ref ID: 969
Economic study type Cost utility analysis using a time-dependent state-transition model. This paper is an add-on to another reviewed (Ref ID 971), investigating the addition of external effects in the model.
Population, country & perspective
Heavy drinkers aged 19 and above. The interventions included in the Wilk et al 1997 analysis were delivered in a variety of settings – outpatient clinics, hospitals and community centres. A societal perspective is taken, but the range of costs included is limited due to various practical considerations in estimation.
Intervention Comparison(s)
3. Various brief interventions characterised as ‘motivational with a self-help orientation’. Intensity varied from 1-4 sessions. Less than 1 hour total counselling time, but some had just 10 minutes (based on data from Wilk et al 1997).
Three brief interventions with different intensity: simple (5 minutes), brief (20 minutes), or extended (12- 150 minutes over four
sessions) (based on data from Saunders et al 1991). 4. Initial 20 minute interview re general health, nutrition, stress, sleep and smoking. No alcohol related prescriptions.
Source of effectiveness data
Effectiveness of the interventions was taken directly from the study reports.
Method of eliciting health valuations (if applicable)
HRQoL gain directly attributable to behaviour change varies depending on severity of alcohol problems as p er disability weights from Stouthard et al (1997) such that returning problem and dependent drinkers to a ‘safe’ consumption pattern is assumed to imply annual QALY gains of 0.110 and 0.330 respectively. External effects are classed as health impacts from the behaviour change of one individual that accrue to others. Eg alcohol misuse can have major consequences for family members and others in the community, eg foetal alcohol syndrome, domestic violence, road trauma). External effects within the family unit are calculated for the average number of persons per household in the target population (3 individuals). It is assumed that the HRQoL impact of alcohol use on the individual is a proxy for the external HRQoL effects within the family unit. Hence a disability weight of 0.110 for problem drinking is applied to all persons in the family unit (equivalent to a 0.890 quality weight). Hence in one year
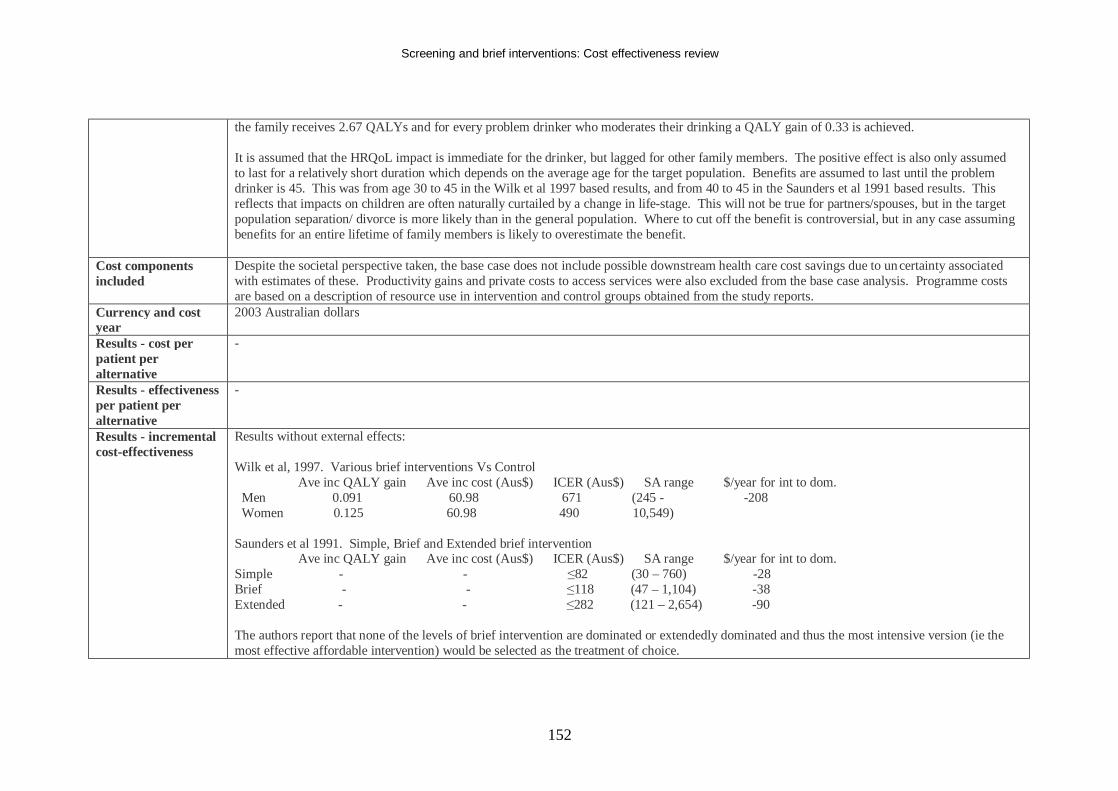
Screening and brief interventions: Cost effectiveness review
152
the family receives 2.67 QALYs and for every problem drinker who moderates their drinking a QALY gain of 0.33 is achieved. It is assumed that the HRQoL impact is immediate for the drinker, but lagged for other family members. The positive effect is also only assumed to last for a relatively short duration which depends on the average age for the target population. Benefits are assumed to last until the problem drinker is 45. This was from age 30 to 45 in the Wilk et al 1997 based results, and from 40 to 45 in the Saunders et al 1991 based results. This reflects that impacts on children are often naturally curtailed by a change in life-stage. This will not be true for partners/spouses, but in the target population separation/ divorce is more likely than in the general population. Where to cut off the benefit is controversial, but in any case assuming benefits for an entire lifetime of family members is likely to overestimate the benefit.
Cost components included
Despite the societal perspective taken, the base case does not include possible downstream health care cost savings due to uncertainty associated with estimates of these. Productivity gains and private costs to access services were also excluded from the base case analysis. Programme costs are based on a description of resource use in intervention and control groups obtained from the study reports.
Currency and cost year
2003 Australian dollars
Results - cost per patient per alternative
-
Results - effectiveness per patient per alternative
-
Results - incremental cost-effectiveness
Results without external effects: Wilk et al, 1997. Various brief interventions Vs Control Ave inc QALY gain Ave inc cost (Aus$) ICER (Aus$) SA range $/year for int to dom. Men 0.091 60.98 671 (245 - -208 Women 0.125 60.98 490 10,549) Saunders et al 1991. Simple, Brief and Extended brief intervention Ave inc QALY gain Ave inc cost (Aus$) ICER (Aus$) SA range $/year for int to dom. Simple - - ≤82 (30 – 760) -28 Brief - - ≤118 (47 – 1,104) -38 Extended - - ≤282 (121 – 2,654) -90 The authors report that none of the levels of brief intervention are dominated or extendedly dominated and thus the most intensive version (ie the most effective affordable intervention) would be selected as the treatment of choice.
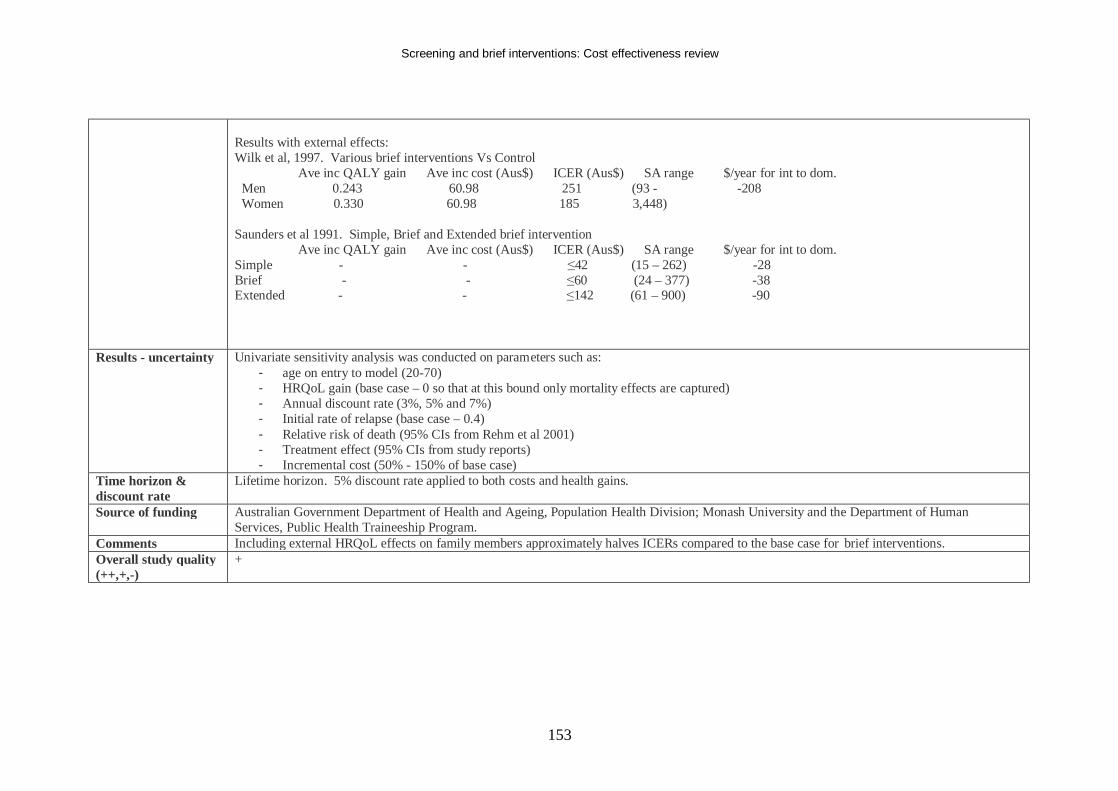
Screening and brief interventions: Cost effectiveness review
153
Results with external effects: Wilk et al, 1997. Various brief interventions Vs Control Ave inc QALY gain Ave inc cost (Aus$) ICER (Aus$) SA range $/year for int to dom. Men 0.243 60.98 251 (93 - -208 Women 0.330 60.98 185 3,448) Saunders et al 1991. Simple, Brief and Extended brief intervention Ave inc QALY gain Ave inc cost (Aus$) ICER (Aus$) SA range $/year for int to dom. Simple - - ≤42 (15 – 262) -28 Brief - - ≤60 (24 – 377) -38 Extended - - ≤142 (61 – 900) -90
Results - uncertainty Univariate sensitivity analysis was conducted on parameters such as: - age on entry to model (20-70) - HRQoL gain (base case – 0 so that at this bound only mortality effects are captured) - Annual discount rate (3%, 5% and 7%) - Initial rate of relapse (base case – 0.4) - Relative risk of death (95% CIs from Rehm et al 2001) - Treatment effect (95% CIs from study reports) - Incremental cost (50% - 150% of base case)
Time horizon & discount rate
Lifetime horizon. 5% discount rate applied to both costs and health gains.
Source of funding Australian Government Department of Health and Ageing, Population Health Division; Monash University and the Department of Human Services, Public Health Traineeship Program.
Comments Including external HRQoL effects on family members approximately halves ICERs compared to the base case for brief interventions. Overall study quality (++,+,-)
+
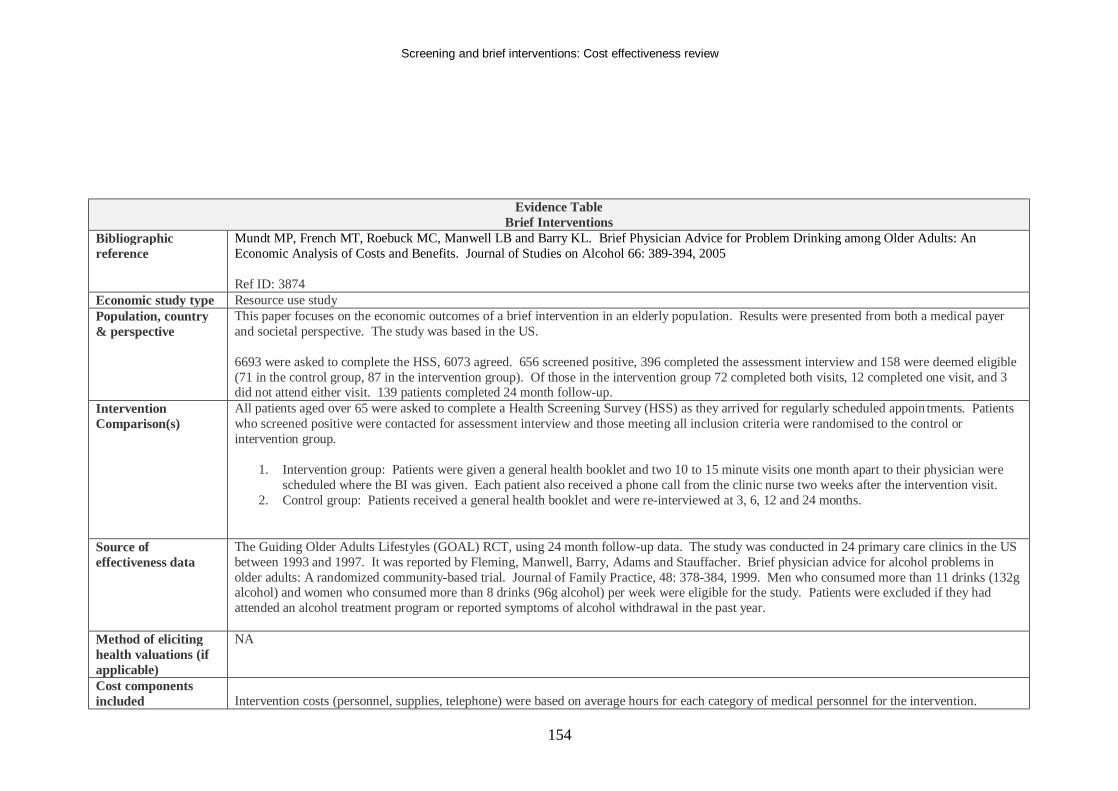
Screening and brief interventions: Cost effectiveness review
154
Evidence Table Brief Interventions
Bibliographic reference
Mundt MP, French MT, Roebuck MC, Manwell LB and Barry KL. Brief Physician Advice for Problem Drinking among Older Adults: An Economic Analysis of Costs and Benefits. Journal of Studies on Alcohol 66: 389-394, 2005 Ref ID: 3874
Economic study type Resource use study Population, country & perspective
This paper focuses on the economic outcomes of a brief intervention in an elderly population. Results were presented from both a medical payer and societal perspective. The study was based in the US. 6693 were asked to complete the HSS, 6073 agreed. 656 screened positive, 396 completed the assessment interview and 158 were deemed eligible (71 in the control group, 87 in the intervention group). Of those in the intervention group 72 completed both visits, 12 completed one visit, and 3 did not attend either visit. 139 patients completed 24 month follow-up.
Intervention Comparison(s)
All patients aged over 65 were asked to complete a Health Screening Survey (HSS) as they arrived for regularly scheduled appoin tments. Patients who screened positive were contacted for assessment interview and those meeting all inclusion criteria were randomised to the control or intervention group.
1. Intervention group: Patients were given a general health booklet and two 10 to 15 minute visits one month apart to their physician were scheduled where the BI was given. Each patient also received a phone call from the clinic nurse two weeks after the intervention visit.
2. Control group: Patients received a general health booklet and were re-interviewed at 3, 6, 12 and 24 months.
Source of effectiveness data
The Guiding Older Adults Lifestyles (GOAL) RCT, using 24 month follow-up data. The study was conducted in 24 primary care clinics in the US between 1993 and 1997. It was reported by Fleming, Manwell, Barry, Adams and Stauffacher. Brief physician advice for alcohol problems in older adults: A randomized community-based trial. Journal of Family Practice, 48: 378-384, 1999. Men who consumed more than 11 drinks (132g alcohol) and women who consumed more than 8 drinks (96g alcohol) per week were eligible for the study. Patients were excluded if they had attended an alcohol treatment program or reported symptoms of alcohol withdrawal in the past year.
Method of eliciting health valuations (if applicable)
NA
Cost components included
Intervention costs (personnel, supplies, telephone) were based on average hours for each category of medical personnel for the intervention.
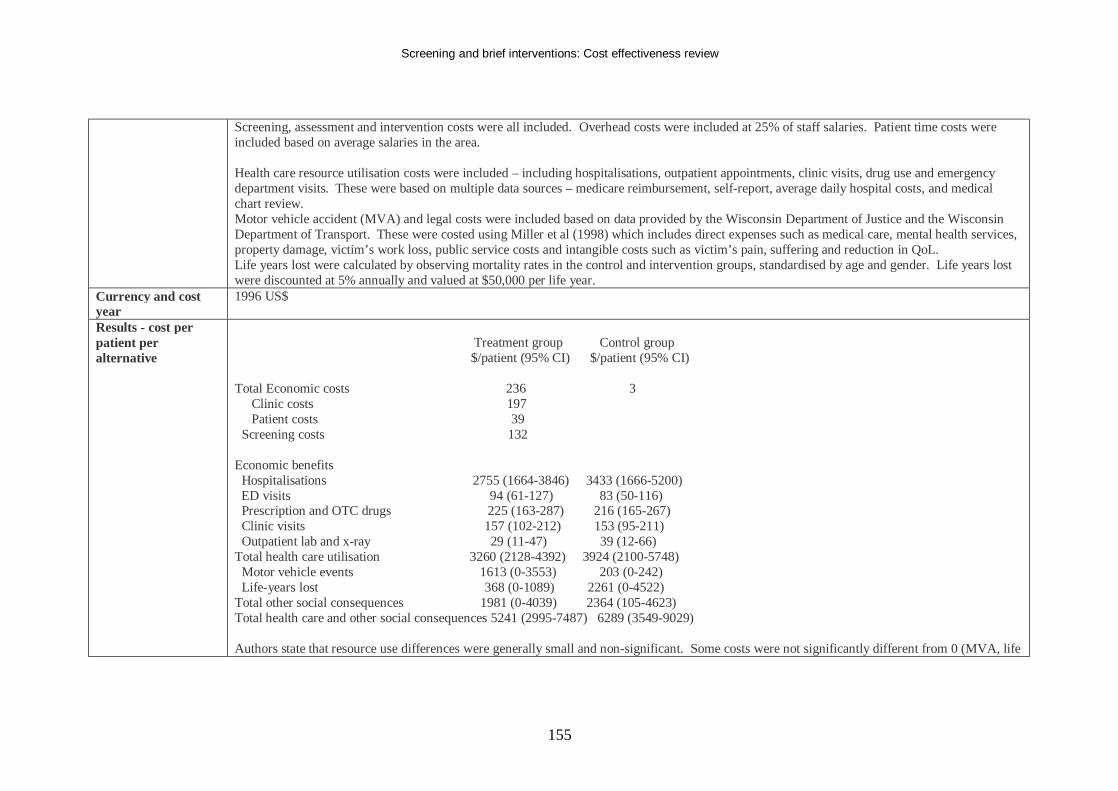
Screening and brief interventions: Cost effectiveness review
155
Screening, assessment and intervention costs were all included. Overhead costs were included at 25% of staff salaries. Patient time costs were included based on average salaries in the area. Health care resource utilisation costs were included – including hospitalisations, outpatient appointments, clinic visits, drug use and emergency department visits. These were based on multiple data sources – medicare reimbursement, self-report, average daily hospital costs, and medical chart review. Motor vehicle accident (MVA) and legal costs were included based on data provided by the Wisconsin Department of Justice and the Wisconsin Department of Transport. These were costed using Miller et al (1998) which includes direct expenses such as medical care, mental health services, property damage, victim’s work loss, public service costs and intangible costs such as victim’s pain, suffering and reduction in QoL. Life years lost were calculated by observing mortality rates in the control and intervention groups, standardised by age and gender. Life years lost were discounted at 5% annually and valued at $50,000 per life year.
Currency and cost year
1996 US$
Results - cost per patient per alternative
Treatment group Control group $/patient (95% CI) $/patient (95% CI) Total Economic costs 236 3 Clinic costs 197 Patient costs 39 Screening costs 132 Economic benefits Hospitalisations 2755 (1664-3846) 3433 (1666-5200) ED visits 94 (61-127) 83 (50-116) Prescription and OTC drugs 225 (163-287) 216 (165-267) Clinic visits 157 (102-212) 153 (95-211) Outpatient lab and x-ray 29 (11-47) 39 (12-66) Total health care utilisation 3260 (2128-4392) 3924 (2100-5748) Motor vehicle events 1613 (0-3553) 203 (0-242) Life-years lost 368 (0-1089) 2261 (0-4522) Total other social consequences 1981 (0-4039) 2364 (105-4623) Total health care and other social consequences 5241 (2995-7487) 6289 (3549-9029) Authors state that resource use differences were generally small and non-significant. Some costs were not significantly different from 0 (MVA, life
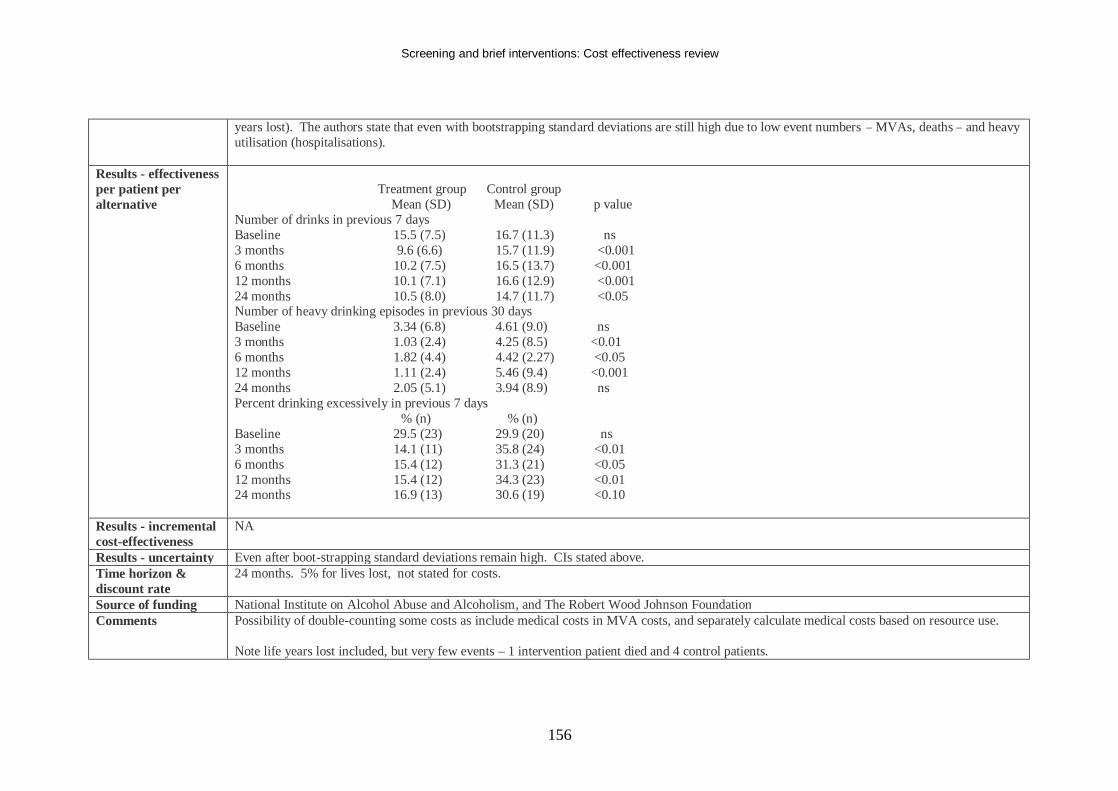
Screening and brief interventions: Cost effectiveness review
156
years lost). The authors state that even with bootstrapping standard deviations are still high due to low event numbers – MVAs, deaths – and heavy utilisation (hospitalisations).
Results - effectiveness per patient per alternative
Treatment group Control group Mean (SD) Mean (SD) p value Number of drinks in previous 7 days Baseline 15.5 (7.5) 16.7 (11.3) ns 3 months 9.6 (6.6) 15.7 (11.9) <0.001 6 months 10.2 (7.5) 16.5 (13.7) <0.001 12 months 10.1 (7.1) 16.6 (12.9) <0.001 24 months 10.5 (8.0) 14.7 (11.7) <0.05 Number of heavy drinking episodes in previous 30 days Baseline 3.34 (6.8) 4.61 (9.0) ns 3 months 1.03 (2.4) 4.25 (8.5) <0.01 6 months 1.82 (4.4) 4.42 (2.27) <0.05 12 months 1.11 (2.4) 5.46 (9.4) <0.001 24 months 2.05 (5.1) 3.94 (8.9) ns Percent drinking excessively in previous 7 days % (n) % (n) Baseline 29.5 (23) 29.9 (20) ns 3 months 14.1 (11) 35.8 (24) <0.01 6 months 15.4 (12) 31.3 (21) <0.05 12 months 15.4 (12) 34.3 (23) <0.01 24 months 16.9 (13) 30.6 (19) <0.10
Results - incremental cost-effectiveness
NA
Results - uncertainty Even after boot-strapping standard deviations remain high. CIs stated above. Time horizon & discount rate
24 months. 5% for lives lost, not stated for costs.
Source of funding National Institute on Alcohol Abuse and Alcoholism, and The Robert Wood Johnson Foundation Comments Possibility of double-counting some costs as include medical costs in MVA costs, and separately calculate medical costs based on resource use.
Note life years lost included, but very few events – 1 intervention patient died and 4 control patients.
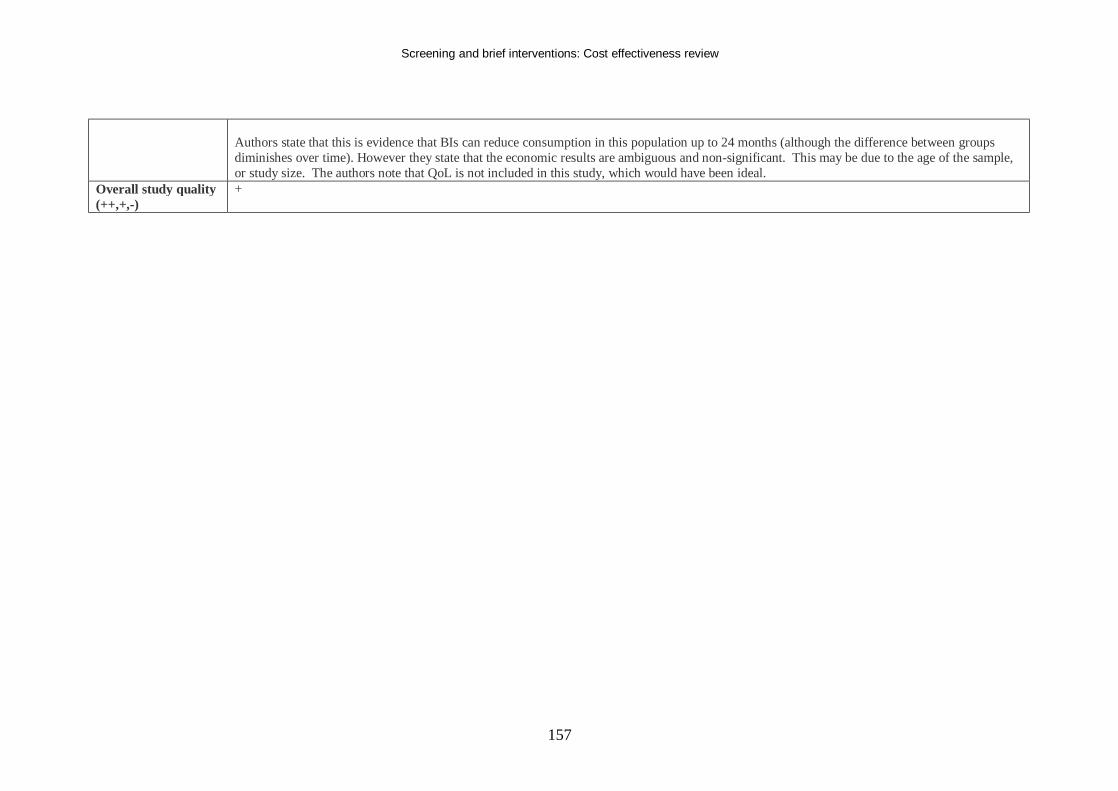
Screening and brief interventions: Cost effectiveness review
157
Authors state that this is evidence that BIs can reduce consumption in this population up to 24 months (although the difference between groups diminishes over time). However they state that the economic results are ambiguous and non-significant. This may be due to the age of the sample, or study size. The authors note that QoL is not included in this study, which would have been ideal.
Overall study quality (++,+,-)
+
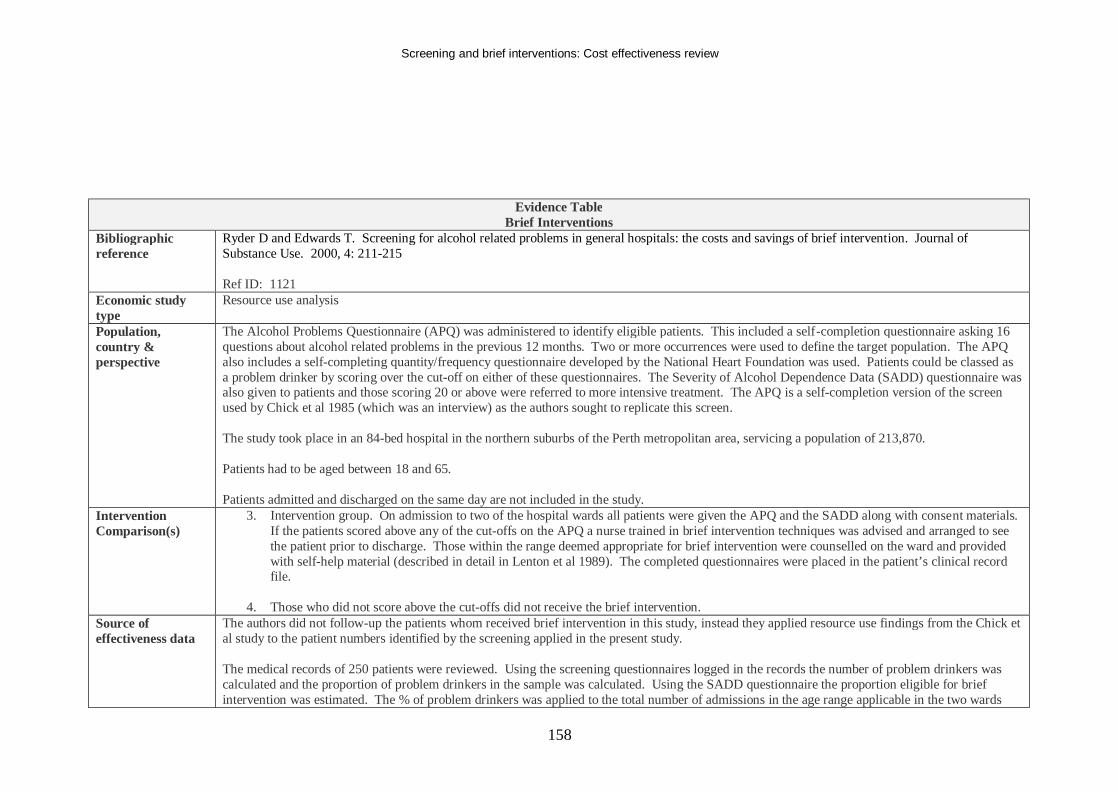
Screening and brief interventions: Cost effectiveness review
158
Evidence Table Brief Interventions
Bibliographic reference
Ryder D and Edwards T. Screening for alcohol related problems in general hospitals: the costs and savings of brief intervention. Journal of Substance Use. 2000, 4: 211-215 Ref ID: 1121
Economic study type
Resource use analysis
Population, country & perspective
The Alcohol Problems Questionnaire (APQ) was administered to identify eligible patients. This included a self-completion questionnaire asking 16 questions about alcohol related problems in the previous 12 months. Two or more occurrences were used to define the target population. The APQ also includes a self-completing quantity/frequency questionnaire developed by the National Heart Foundation was used. Patients could be classed as a problem drinker by scoring over the cut-off on either of these questionnaires. The Severity of Alcohol Dependence Data (SADD) questionnaire was also given to patients and those scoring 20 or above were referred to more intensive treatment. The APQ is a self-completion version of the screen used by Chick et al 1985 (which was an interview) as the authors sought to replicate this screen. The study took place in an 84-bed hospital in the northern suburbs of the Perth metropolitan area, servicing a population of 213,870. Patients had to be aged between 18 and 65. Patients admitted and discharged on the same day are not included in the study.
Intervention Comparison(s)
3. Intervention group. On admission to two of the hospital wards all patients were given the APQ and the SADD along with consent materials. If the patients scored above any of the cut-offs on the APQ a nurse trained in brief intervention techniques was advised and arranged to see the patient prior to discharge. Those within the range deemed appropriate for brief intervention were counselled on the ward and provided with self-help material (described in detail in Lenton et al 1989). The completed questionnaires were placed in the patient’s clinical record file.
4. Those who did not score above the cut-offs did not receive the brief intervention.
Source of effectiveness data
The authors did not follow-up the patients whom received brief intervention in this study, instead they applied resource use findings from the Chick et al study to the patient numbers identified by the screening applied in the present study. The medical records of 250 patients were reviewed. Using the screening questionnaires logged in the records the number of problem drinkers was calculated and the proportion of problem drinkers in the sample was calculated. Using the SADD questionnaire the proportion eligible for brief intervention was estimated. The % of problem drinkers was applied to the total number of admissions in the age range applicable in the two wards
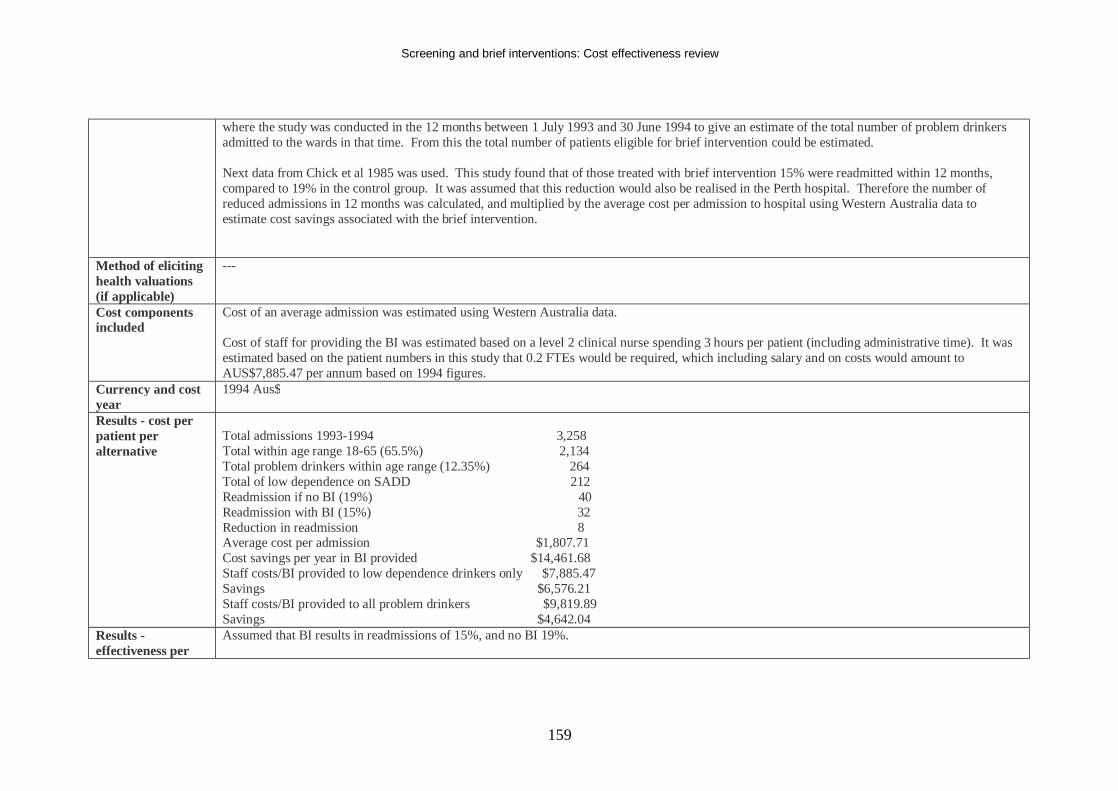
Screening and brief interventions: Cost effectiveness review
159
where the study was conducted in the 12 months between 1 July 1993 and 30 June 1994 to give an estimate of the total number of problem drinkers admitted to the wards in that time. From this the total number of patients eligible for brief intervention could be estimated. Next data from Chick et al 1985 was used. This study found that of those treated with brief intervention 15% were readmitted within 12 months, compared to 19% in the control group. It was assumed that this reduction would also be realised in the Perth hospital. Therefore the number of reduced admissions in 12 months was calculated, and multiplied by the average cost per admission to hospital using Western Australia data to estimate cost savings associated with the brief intervention.
Method of eliciting health valuations (if applicable)
---
Cost components included
Cost of an average admission was estimated using Western Australia data. Cost of staff for providing the BI was estimated based on a level 2 clinical nurse spending 3 hours per patient (including administrative time). It was estimated based on the patient numbers in this study that 0.2 FTEs would be required, which including salary and on costs would amount to AUS$7,885.47 per annum based on 1994 figures.
Currency and cost year
1994 Aus$
Results - cost per patient per alternative
Total admissions 1993-1994 3,258 Total within age range 18-65 (65.5%) 2,134 Total problem drinkers within age range (12.35%) 264 Total of low dependence on SADD 212 Readmission if no BI (19%) 40 Readmission with BI (15%) 32 Reduction in readmission 8 Average cost per admission $1,807.71 Cost savings per year in BI provided $14,461.68 Staff costs/BI provided to low dependence drinkers only $7,885.47 Savings $6,576.21 Staff costs/BI provided to all problem drinkers $9,819.89 Savings $4,642.04
Results - effectiveness per
Assumed that BI results in readmissions of 15%, and no BI 19%.
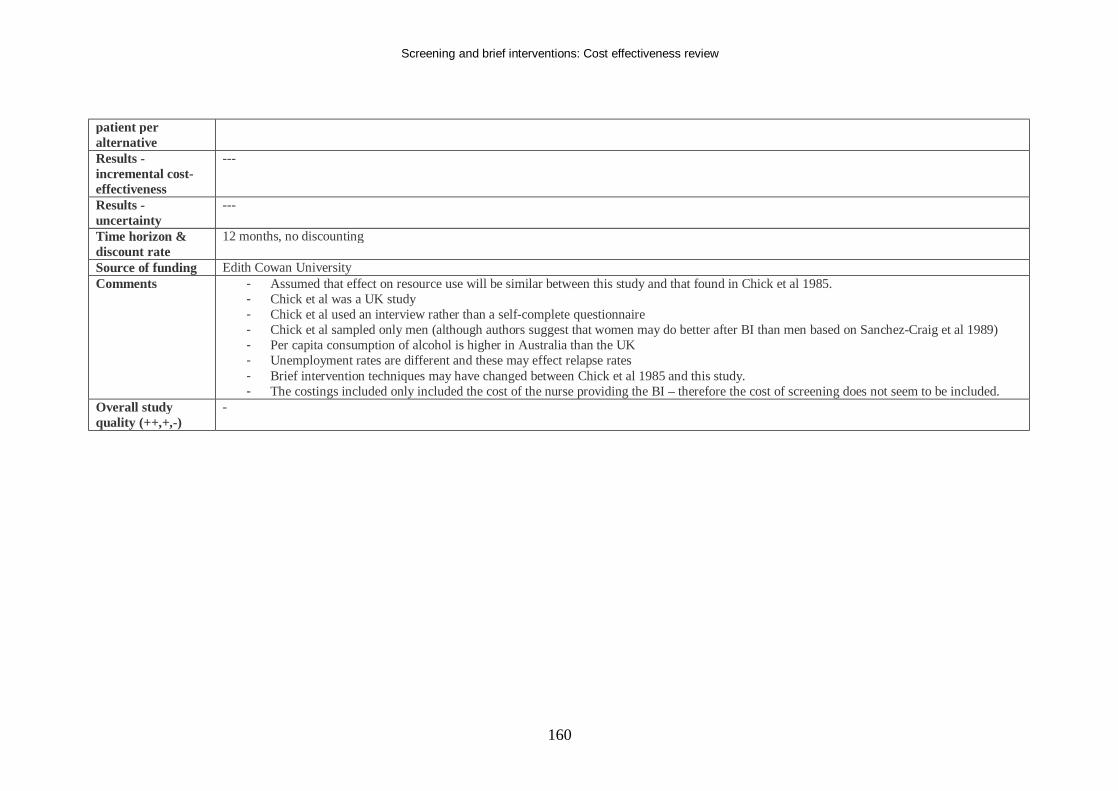
Screening and brief interventions: Cost effectiveness review
160
patient per alternative Results - incremental cost-effectiveness
---
Results - uncertainty
---
Time horizon & discount rate
12 months, no discounting
Source of funding Edith Cowan University Comments - Assumed that effect on resource use will be similar between this study and that found in Chick et al 1985.
- Chick et al was a UK study - Chick et al used an interview rather than a self-complete questionnaire - Chick et al sampled only men (although authors suggest that women may do better after BI than men based on Sanchez-Craig et al 1989) - Per capita consumption of alcohol is higher in Australia than the UK - Unemployment rates are different and these may effect relapse rates - Brief intervention techniques may have changed between Chick et al 1985 and this study. - The costings included only included the cost of the nurse providing the BI – therefore the cost of screening does not seem to be included.
Overall study quality (++,+,-)
-
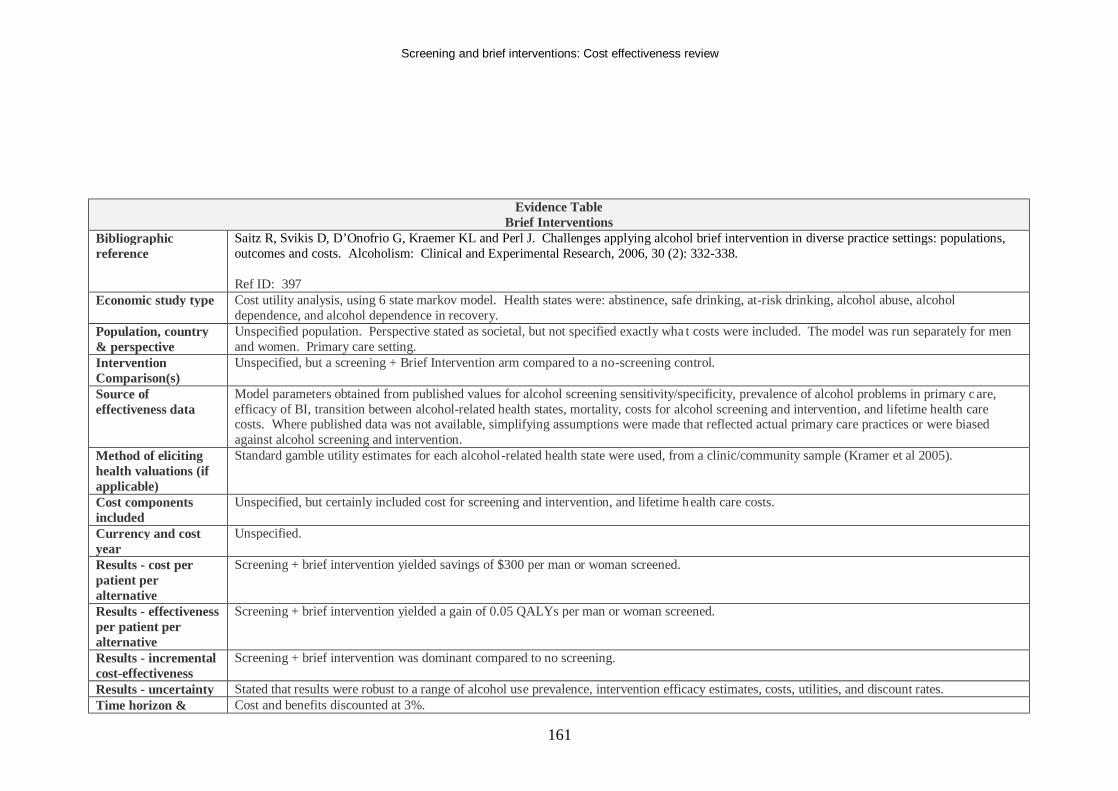
Screening and brief interventions: Cost effectiveness review
161
Evidence Table Brief Interventions
Bibliographic reference
Saitz R, Svikis D, D’Onofrio G, Kraemer KL and Perl J. Challenges applying alcohol brief intervention in diverse practice settings: populations, outcomes and costs. Alcoholism: Clinical and Experimental Research, 2006, 30 (2): 332-338. Ref ID: 397
Economic study type Cost utility analysis, using 6 state markov model. Health states were: abstinence, safe drinking, at-risk drinking, alcohol abuse, alcohol dependence, and alcohol dependence in recovery.
Population, country & perspective
Unspecified population. Perspective stated as societal, but not specified exactly wha t costs were included. The model was run separately for men and women. Primary care setting.
Intervention Comparison(s)
Unspecified, but a screening + Brief Intervention arm compared to a no-screening control.
Source of effectiveness data
Model parameters obtained from published values for alcohol screening sensitivity/specificity, prevalence of alcohol problems in primary c are, efficacy of BI, transition between alcohol-related health states, mortality, costs for alcohol screening and intervention, and lifetime health care costs. Where published data was not available, simplifying assumptions were made that reflected actual primary care practices or were biased against alcohol screening and intervention.
Method of eliciting health valuations (if applicable)
Standard gamble utility estimates for each alcohol-related health state were used, from a clinic/community sample (Kramer et al 2005).
Cost components included
Unspecified, but certainly included cost for screening and intervention, and lifetime health care costs.
Currency and cost year
Unspecified.
Results - cost per patient per alternative
Screening + brief intervention yielded savings of $300 per man or woman screened.
Results - effectiveness per patient per alternative
Screening + brief intervention yielded a gain of 0.05 QALYs per man or woman screened.
Results - incremental cost-effectiveness
Screening + brief intervention was dominant compared to no screening.
Results - uncertainty Stated that results were robust to a range of alcohol use prevalence, intervention efficacy estimates, costs, utilities, and discount rates. Time horizon & Cost and benefits discounted at 3%.
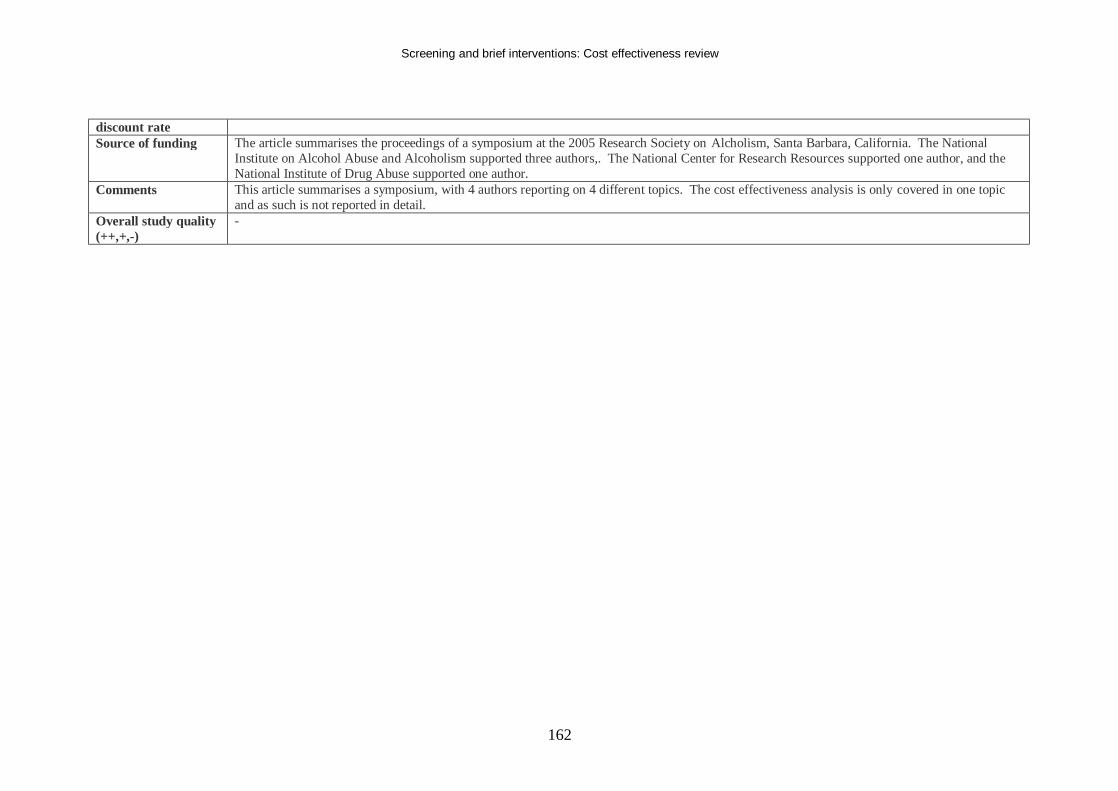
Screening and brief interventions: Cost effectiveness review
162
discount rate Source of funding The article summarises the proceedings of a symposium at the 2005 Research Society on Alcholism, Santa Barbara, California. The National
Institute on Alcohol Abuse and Alcoholism supported three authors,. The National Center for Research Resources supported one author, and the National Institute of Drug Abuse supported one author.
Comments This article summarises a symposium, with 4 authors reporting on 4 different topics. The cost effectiveness analysis is only covered in one topic and as such is not reported in detail.
Overall study quality (++,+,-)
-
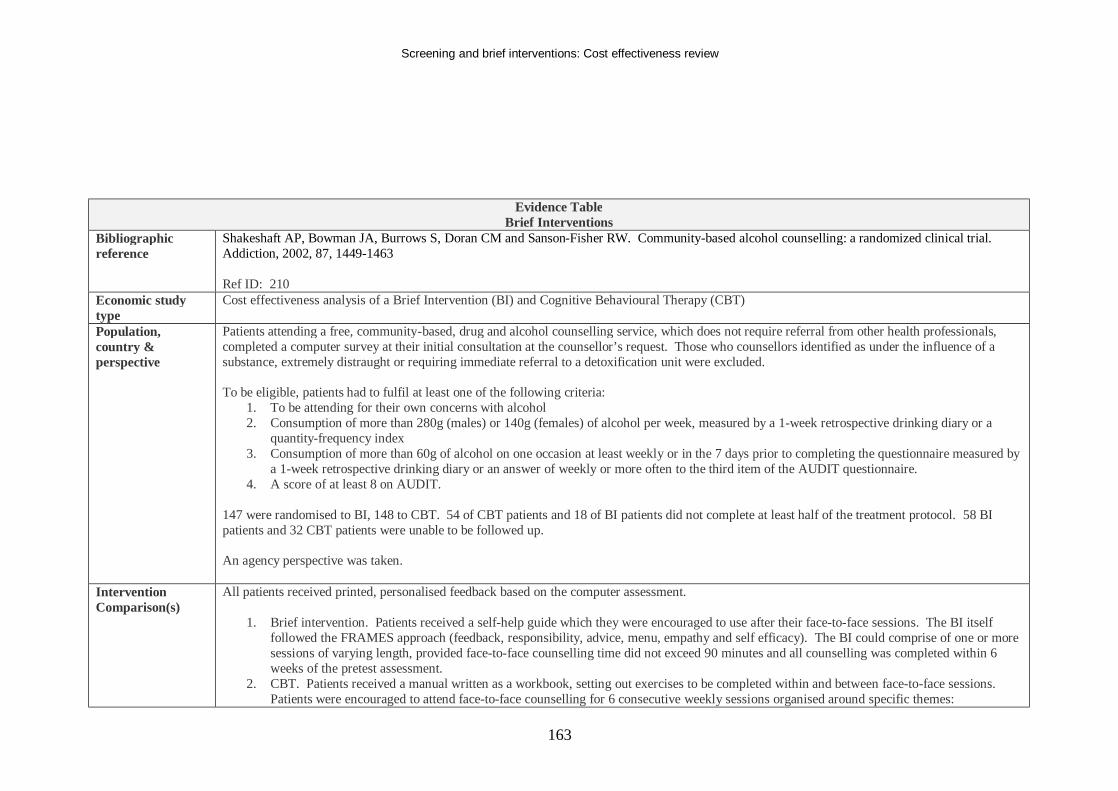
Screening and brief interventions: Cost effectiveness review
163
Evidence Table Brief Interventions
Bibliographic reference
Shakeshaft AP, Bowman JA, Burrows S, Doran CM and Sanson-Fisher RW. Community-based alcohol counselling: a randomized clinical trial. Addiction, 2002, 87, 1449-1463 Ref ID: 210
Economic study type
Cost effectiveness analysis of a Brief Intervention (BI) and Cognitive Behavioural Therapy (CBT)
Population, country & perspective
Patients attending a free, community-based, drug and alcohol counselling service, which does not require referral from other health professionals, completed a computer survey at their initial consultation at the counsellor’s request. Those who counsellors identified as under the influence of a substance, extremely distraught or requiring immediate referral to a detoxification unit were excluded. To be eligible, patients had to fulfil at least one of the following criteria:
1. To be attending for their own concerns with alcohol 2. Consumption of more than 280g (males) or 140g (females) of alcohol per week, measured by a 1-week retrospective drinking diary or a
quantity-frequency index 3. Consumption of more than 60g of alcohol on one occasion at least weekly or in the 7 days prior to completing the questionnaire measured by
a 1-week retrospective drinking diary or an answer of weekly or more often to the third item of the AUDIT questionnaire. 4. A score of at least 8 on AUDIT.
147 were randomised to BI, 148 to CBT. 54 of CBT patients and 18 of BI patients did not complete at least half of the treatment protocol. 58 BI patients and 32 CBT patients were unable to be followed up. An agency perspective was taken.
Intervention Comparison(s)
All patients received printed, personalised feedback based on the computer assessment.
1. Brief intervention. Patients received a self-help guide which they were encouraged to use after their face-to-face sessions. The BI itself followed the FRAMES approach (feedback, responsibility, advice, menu, empathy and self efficacy). The BI could comprise of one or more sessions of varying length, provided face-to-face counselling time did not exceed 90 minutes and all counselling was completed within 6 weeks of the pretest assessment.
2. CBT. Patients received a manual written as a workbook, setting out exercises to be completed within and between face-to-face sessions. Patients were encouraged to attend face-to-face counselling for 6 consecutive weekly sessions organised around specific themes:
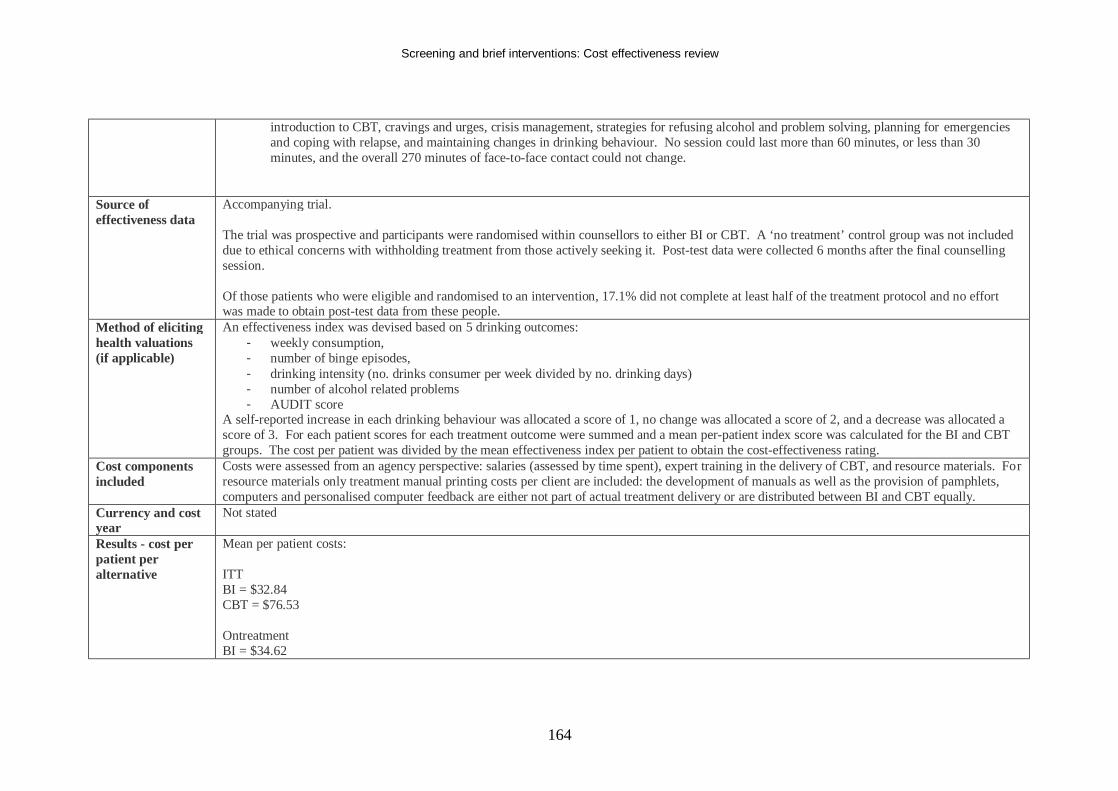
Screening and brief interventions: Cost effectiveness review
164
introduction to CBT, cravings and urges, crisis management, strategies for refusing alcohol and problem solving, planning for emergencies and coping with relapse, and maintaining changes in drinking behaviour. No session could last more than 60 minutes, or less than 30 minutes, and the overall 270 minutes of face-to-face contact could not change.
Source of effectiveness data
Accompanying trial. The trial was prospective and participants were randomised within counsellors to either BI or CBT. A ‘no treatment’ control group was not included due to ethical concerns with withholding treatment from those actively seeking it. Post-test data were collected 6 months after the final counselling session. Of those patients who were eligible and randomised to an intervention, 17.1% did not complete at least half of the treatment protocol and no effort was made to obtain post-test data from these people.
Method of eliciting health valuations (if applicable)
An effectiveness index was devised based on 5 drinking outcomes: - weekly consumption, - number of binge episodes, - drinking intensity (no. drinks consumer per week divided by no. drinking days) - number of alcohol related problems - AUDIT score
A self-reported increase in each drinking behaviour was allocated a score of 1, no change was allocated a score of 2, and a decrease was allocated a score of 3. For each patient scores for each treatment outcome were summed and a mean per-patient index score was calculated for the BI and CBT groups. The cost per patient was divided by the mean effectiveness index per patient to obtain the cost-effectiveness rating.
Cost components included
Costs were assessed from an agency perspective: salaries (assessed by time spent), expert training in the delivery of CBT, and resource materials. For resource materials only treatment manual printing costs per client are included: the development of manuals as well as the provision of pamphlets, computers and personalised computer feedback are either not part of actual treatment delivery or are distributed between BI and CBT equally.
Currency and cost year
Not stated
Results - cost per patient per alternative
Mean per patient costs: ITT BI = $32.84 CBT = $76.53 Ontreatment BI = $34.62
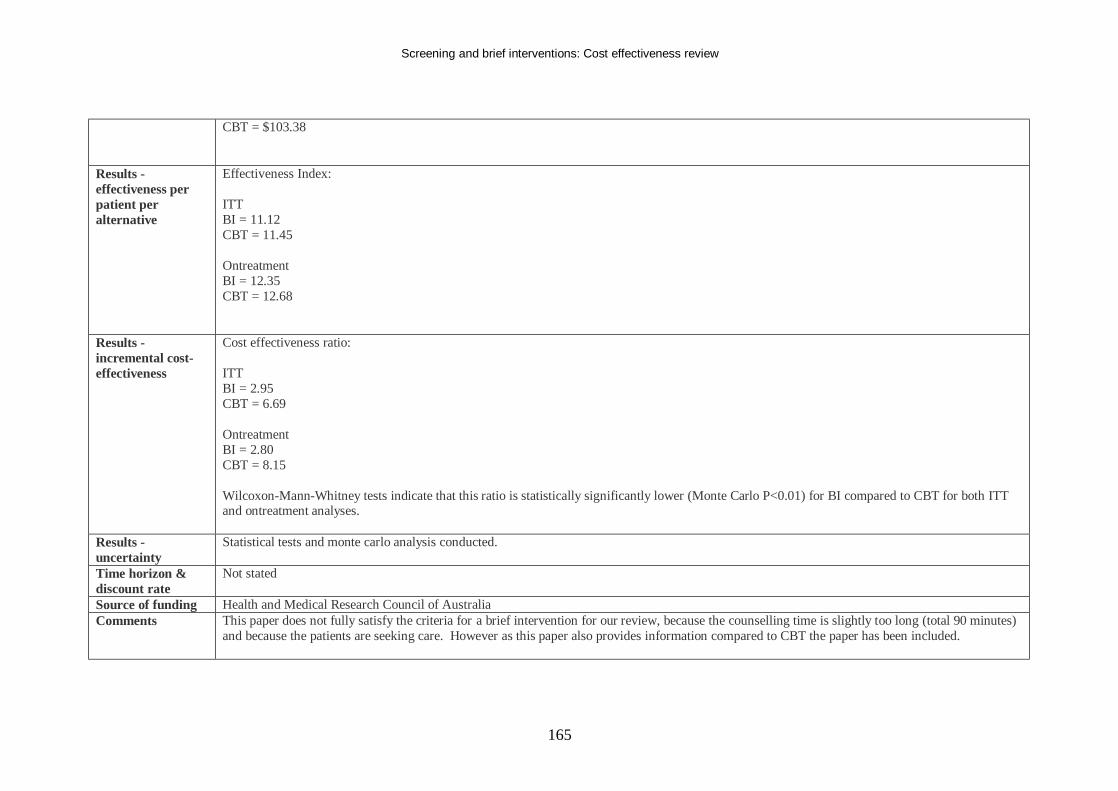
Screening and brief interventions: Cost effectiveness review
165
CBT = $103.38
Results - effectiveness per patient per alternative
Effectiveness Index: ITT BI = 11.12 CBT = 11.45 Ontreatment BI = 12.35 CBT = 12.68
Results - incremental cost-effectiveness
Cost effectiveness ratio: ITT BI = 2.95 CBT = 6.69 Ontreatment BI = 2.80 CBT = 8.15 Wilcoxon-Mann-Whitney tests indicate that this ratio is statistically significantly lower (Monte Carlo P<0.01) for BI compared to CBT for both ITT and ontreatment analyses.
Results - uncertainty
Statistical tests and monte carlo analysis conducted.
Time horizon & discount rate
Not stated
Source of funding Health and Medical Research Council of Australia Comments This paper does not fully satisfy the criteria for a brief intervention for our review, because the counselling time is slightly too long (total 90 minutes)
and because the patients are seeking care. However as this paper also provides information compared to CBT the paper has been included.
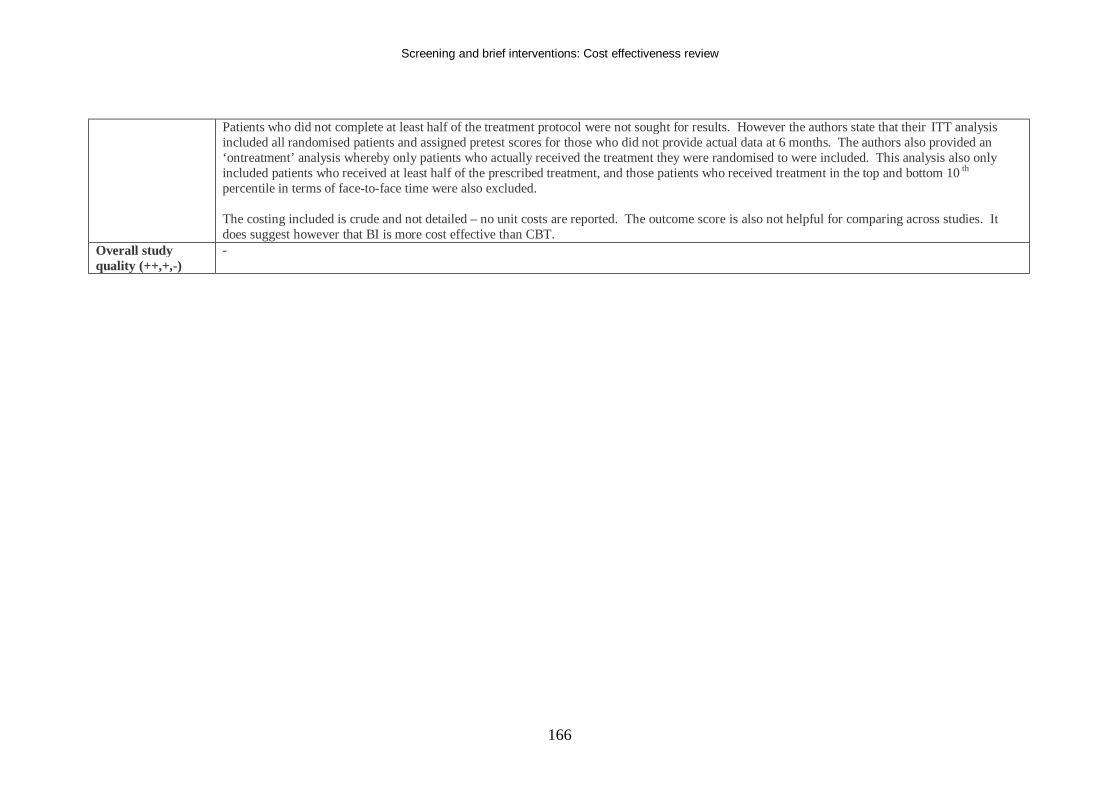
Screening and brief interventions: Cost effectiveness review
166
Patients who did not complete at least half of the treatment protocol were not sought for results. However the authors state that their ITT analysis included all randomised patients and assigned pretest scores for those who did not provide actual data at 6 months. The authors also provided an ‘ontreatment’ analysis whereby only patients who actually received the treatment they were randomised to were included. This analysis also only included patients who received at least half of the prescribed treatment, and those patients who received treatment in the top and bottom 10 th percentile in terms of face-to-face time were also excluded. The costing included is crude and not detailed – no unit costs are reported. The outcome score is also not helpful for comparing across studies. It does suggest however that BI is more cost effective than CBT.
Overall study quality (++,+,-)
-
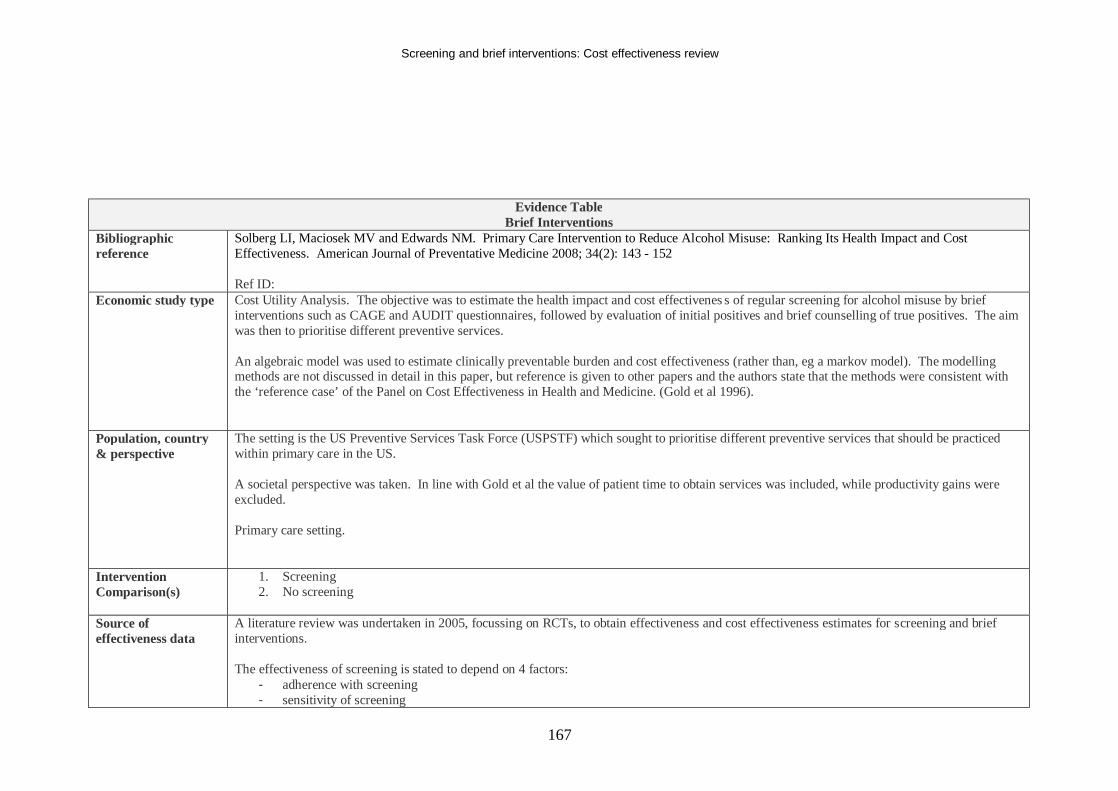
Screening and brief interventions: Cost effectiveness review
167
Evidence Table Brief Interventions
Bibliographic reference
Solberg LI, Maciosek MV and Edwards NM. Primary Care Intervention to Reduce Alcohol Misuse: Ranking Its Health Impact and Cost Effectiveness. American Journal of Preventative Medicine 2008; 34(2): 143 - 152 Ref ID:
Economic study type Cost Utility Analysis. The objective was to estimate the health impact and cost effectivenes s of regular screening for alcohol misuse by brief interventions such as CAGE and AUDIT questionnaires, followed by evaluation of initial positives and brief counselling of true positives. The aim was then to prioritise different preventive services. An algebraic model was used to estimate clinically preventable burden and cost effectiveness (rather than, eg a markov model). The modelling methods are not discussed in detail in this paper, but reference is given to other papers and the authors state that the methods were consistent with the ‘reference case’ of the Panel on Cost Effectiveness in Health and Medicine. (Gold et al 1996).
Population, country & perspective
The setting is the US Preventive Services Task Force (USPSTF) which sought to prioritise different preventive services that should be practiced within primary care in the US. A societal perspective was taken. In line with Gold et al the value of patient time to obtain services was included, while productivity gains were excluded. Primary care setting.
Intervention Comparison(s)
1. Screening 2. No screening
Source of effectiveness data
A literature review was undertaken in 2005, focussing on RCTs, to obtain effectiveness and cost effectiveness estimates for screening and brief interventions. The effectiveness of screening is stated to depend on 4 factors:
- adherence with screening - sensitivity of screening
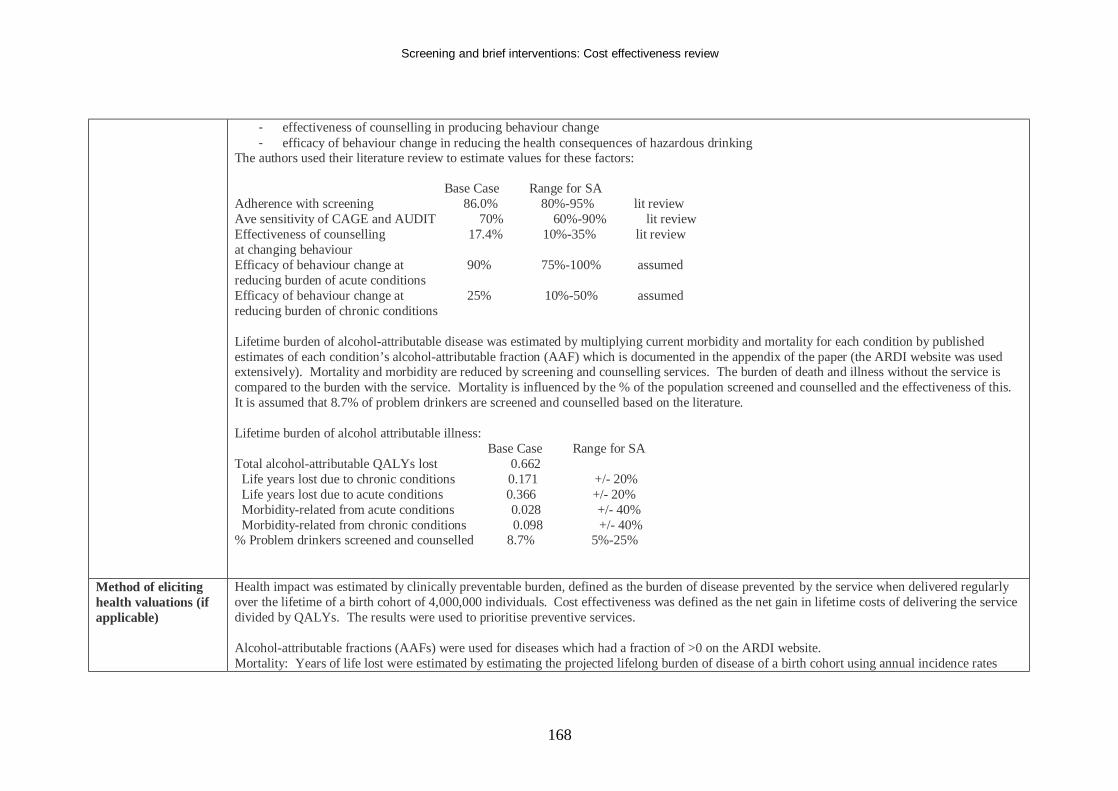
Screening and brief interventions: Cost effectiveness review
168
- effectiveness of counselling in producing behaviour change - efficacy of behaviour change in reducing the health consequences of hazardous drinking
The authors used their literature review to estimate values for these factors: Base Case Range for SA Adherence with screening 86.0% 80%-95% lit review Ave sensitivity of CAGE and AUDIT 70% 60%-90% lit review Effectiveness of counselling 17.4% 10%-35% lit review at changing behaviour Efficacy of behaviour change at 90% 75%-100% assumed reducing burden of acute conditions Efficacy of behaviour change at 25% 10%-50% assumed reducing burden of chronic conditions Lifetime burden of alcohol-attributable disease was estimated by multiplying current morbidity and mortality for each condition by published estimates of each condition’s alcohol-attributable fraction (AAF) which is documented in the appendix of the paper (the ARDI website was used extensively). Mortality and morbidity are reduced by screening and counselling services. The burden of death and illness without the service is compared to the burden with the service. Mortality is influenced by the % of the population screened and counselled and the effectiveness of this. It is assumed that 8.7% of problem drinkers are screened and counselled based on the literature. Lifetime burden of alcohol attributable illness: Base Case Range for SA Total alcohol-attributable QALYs lost 0.662 Life years lost due to chronic conditions 0.171 +/- 20% Life years lost due to acute conditions 0.366 +/- 20% Morbidity-related from acute conditions 0.028 +/- 40% Morbidity-related from chronic conditions 0.098 +/- 40% % Problem drinkers screened and counselled 8.7% 5%-25%
Method of eliciting health valuations (if applicable)
Health impact was estimated by clinically preventable burden, defined as the burden of disease prevented by the service when delivered regularly over the lifetime of a birth cohort of 4,000,000 individuals. Cost effectiveness was defined as the net gain in lifetime costs of delivering the service divided by QALYs. The results were used to prioritise preventive services. Alcohol-attributable fractions (AAFs) were used for diseases which had a fraction of >0 on the ARDI website. Mortality: Years of life lost were estimated by estimating the projected lifelong burden of disease of a birth cohort using annual incidence rates
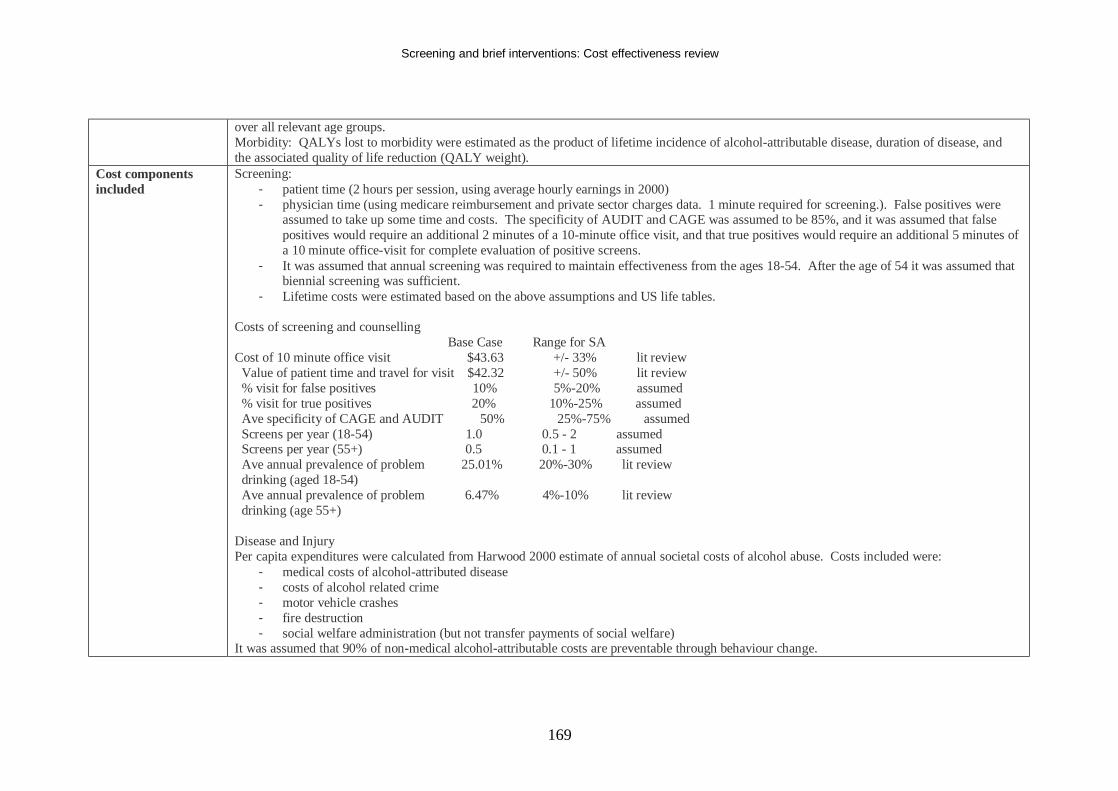
Screening and brief interventions: Cost effectiveness review
169
over all relevant age groups. Morbidity: QALYs lost to morbidity were estimated as the product of lifetime incidence of alcohol-attributable disease, duration of disease, and the associated quality of life reduction (QALY weight).
Cost components included
Screening: - patient time (2 hours per session, using average hourly earnings in 2000) - physician time (using medicare reimbursement and private sector charges data. 1 minute required for screening.). False positives were
assumed to take up some time and costs. The specificity of AUDIT and CAGE was assumed to be 85%, and it was assumed that false positives would require an additional 2 minutes of a 10-minute office visit, and that true positives would require an additional 5 minutes of a 10 minute office-visit for complete evaluation of positive screens.
- It was assumed that annual screening was required to maintain effectiveness from the ages 18-54. After the age of 54 it was assumed that biennial screening was sufficient.
- Lifetime costs were estimated based on the above assumptions and US life tables. Costs of screening and counselling Base Case Range for SA Cost of 10 minute office visit $43.63 +/- 33% lit review Value of patient time and travel for visit $42.32 +/- 50% lit review % visit for false positives 10% 5%-20% assumed % visit for true positives 20% 10%-25% assumed Ave specificity of CAGE and AUDIT 50% 25%-75% assumed Screens per year (18-54) 1.0 0.5 - 2 assumed Screens per year (55+) 0.5 0.1 - 1 assumed Ave annual prevalence of problem 25.01% 20%-30% lit review drinking (aged 18-54) Ave annual prevalence of problem 6.47% 4%-10% lit review drinking (age 55+) Disease and Injury Per capita expenditures were calculated from Harwood 2000 estimate of annual societal costs of alcohol abuse. Costs included were:
- medical costs of alcohol-attributed disease - costs of alcohol related crime - motor vehicle crashes - fire destruction - social welfare administration (but not transfer payments of social welfare)
It was assumed that 90% of non-medical alcohol-attributable costs are preventable through behaviour change.
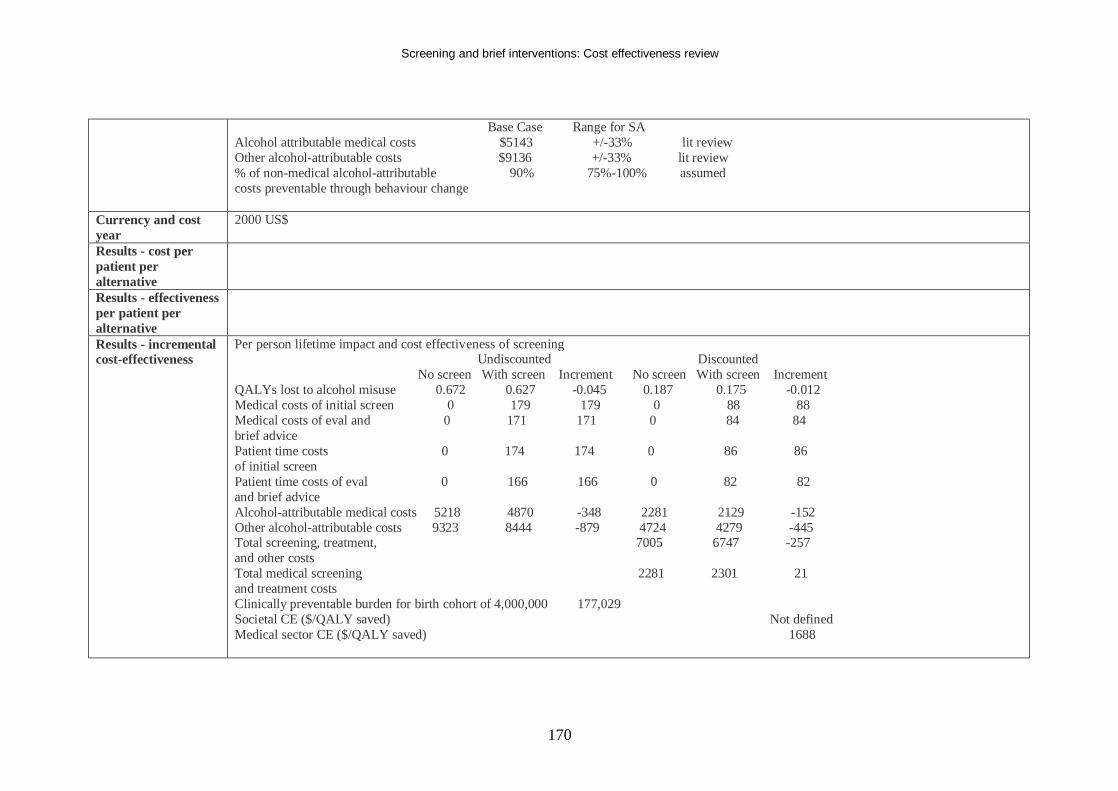
Screening and brief interventions: Cost effectiveness review
170
Base Case Range for SA Alcohol attributable medical costs $5143 +/-33% lit review Other alcohol-attributable costs $9136 +/-33% lit review % of non-medical alcohol-attributable 90% 75%-100% assumed costs preventable through behaviour change
Currency and cost year
2000 US$
Results - cost per patient per alternative
Results - effectiveness per patient per alternative
Results - incremental cost-effectiveness
Per person lifetime impact and cost effectiveness of screening Undiscounted Discounted No screen With screen Increment No screen With screen Increment QALYs lost to alcohol misuse 0.672 0.627 -0.045 0.187 0.175 -0.012 Medical costs of initial screen 0 179 179 0 88 88 Medical costs of eval and 0 171 171 0 84 84 brief advice Patient time costs 0 174 174 0 86 86 of initial screen Patient time costs of eval 0 166 166 0 82 82 and brief advice Alcohol-attributable medical costs 5218 4870 -348 2281 2129 -152 Other alcohol-attributable costs 9323 8444 -879 4724 4279 -445 Total screening, treatment, 7005 6747 -257 and other costs Total medical screening 2281 2301 21 and treatment costs Clinically preventable burden for birth cohort of 4,000,000 177,029 Societal CE ($/QALY saved) Not defined Medical sector CE ($/QALY saved) 1688
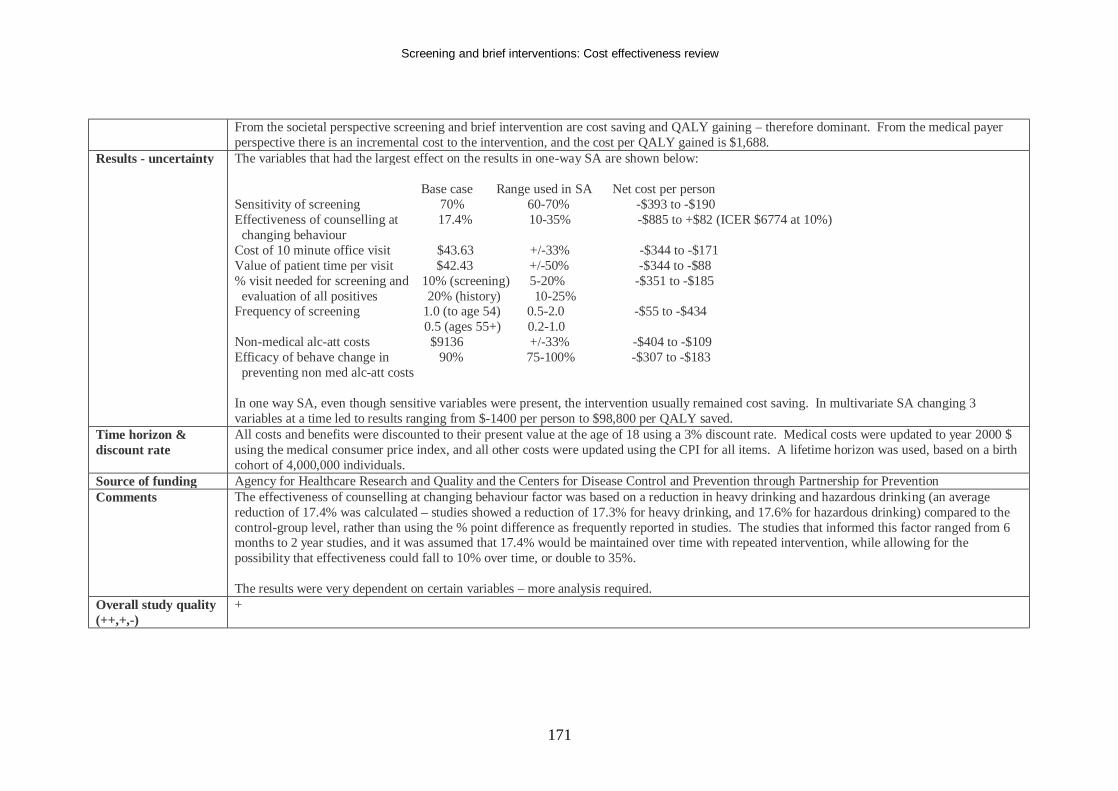
Screening and brief interventions: Cost effectiveness review
171
From the societal perspective screening and brief intervention are cost saving and QALY gaining – therefore dominant. From the medical payer perspective there is an incremental cost to the intervention, and the cost per QALY gained is $1,688.
Results - uncertainty The variables that had the largest effect on the results in one-way SA are shown below: Base case Range used in SA Net cost per person Sensitivity of screening 70% 60-70% -$393 to -$190 Effectiveness of counselling at 17.4% 10-35% -$885 to +$82 (ICER $6774 at 10%) changing behaviour Cost of 10 minute office visit $43.63 +/-33% -$344 to -$171 Value of patient time per visit $42.43 +/-50% -$344 to -$88 % visit needed for screening and 10% (screening) 5-20% -$351 to -$185 evaluation of all positives 20% (history) 10-25% Frequency of screening 1.0 (to age 54) 0.5-2.0 -$55 to -$434 0.5 (ages 55+) 0.2-1.0 Non-medical alc-att costs $9136 +/-33% -$404 to -$109 Efficacy of behave change in 90% 75-100% -$307 to -$183 preventing non med alc-att costs In one way SA, even though sensitive variables were present, the intervention usually remained cost saving. In multivariate SA changing 3 variables at a time led to results ranging from $-1400 per person to $98,800 per QALY saved.
Time horizon & discount rate
All costs and benefits were discounted to their present value at the age of 18 using a 3% discount rate. Medical costs were updated to year 2000 $ using the medical consumer price index, and all other costs were updated using the CPI for all items. A lifetime horizon was used, based on a birth cohort of 4,000,000 individuals.
Source of funding Agency for Healthcare Research and Quality and the Centers for Disease Control and Prevention through Partnership for Prevention Comments The effectiveness of counselling at changing behaviour factor was based on a reduction in heavy drinking and hazardous drinking (an average
reduction of 17.4% was calculated – studies showed a reduction of 17.3% for heavy drinking, and 17.6% for hazardous drinking) compared to the control-group level, rather than using the % point difference as frequently reported in studies. The studies that informed this factor ranged from 6 months to 2 year studies, and it was assumed that 17.4% would be maintained over time with repeated intervention, while allowing for the possibility that effectiveness could fall to 10% over time, or double to 35%. The results were very dependent on certain variables – more analysis required.
Overall study quality (++,+,-)
+
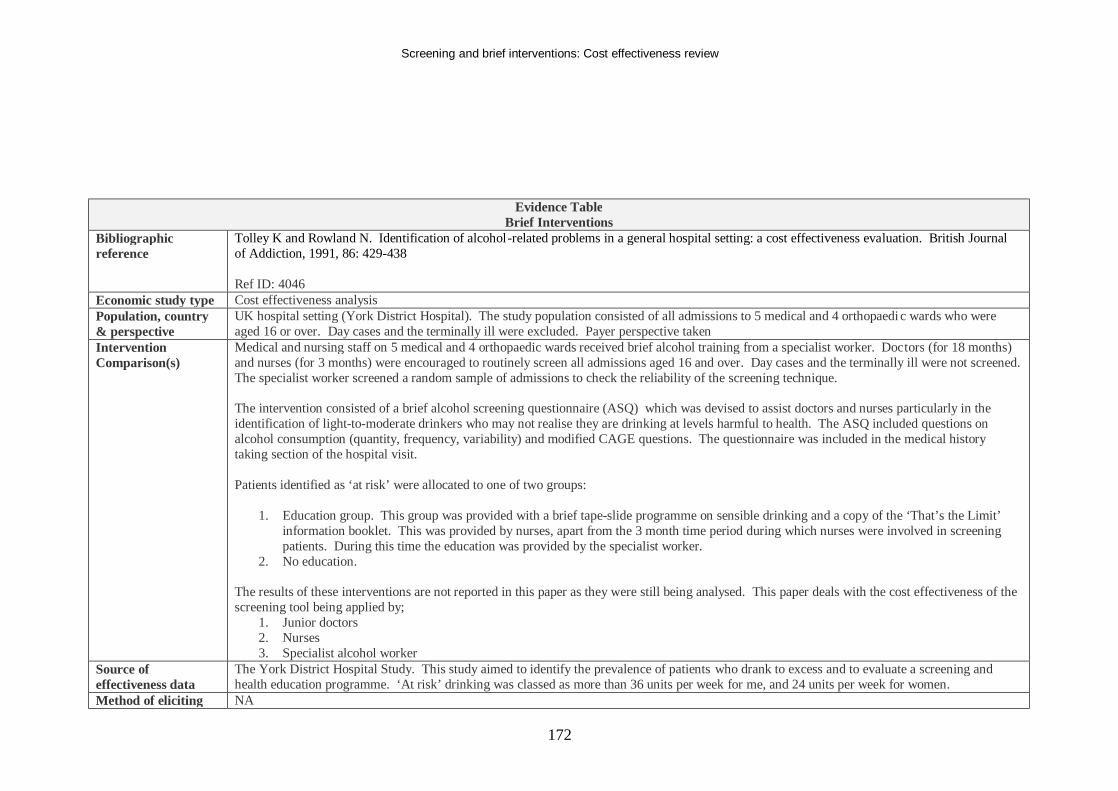
Screening and brief interventions: Cost effectiveness review
172
Evidence Table Brief Interventions
Bibliographic reference
Tolley K and Rowland N. Identification of alcohol-related problems in a general hospital setting: a cost effectiveness evaluation. British Journal of Addiction, 1991, 86: 429-438 Ref ID: 4046
Economic study type Cost effectiveness analysis Population, country & perspective
UK hospital setting (York District Hospital). The study population consisted of all admissions to 5 medical and 4 orthopaedi c wards who were aged 16 or over. Day cases and the terminally ill were excluded. Payer perspective taken
Intervention Comparison(s)
Medical and nursing staff on 5 medical and 4 orthopaedic wards received brief alcohol training from a specialist worker. Doctors (for 18 months) and nurses (for 3 months) were encouraged to routinely screen all admissions aged 16 and over. Day cases and the terminally ill were not screened. The specialist worker screened a random sample of admissions to check the reliability of the screening technique. The intervention consisted of a brief alcohol screening questionnaire (ASQ) which was devised to assist doctors and nurses particularly in the identification of light-to-moderate drinkers who may not realise they are drinking at levels harmful to health. The ASQ included questions on alcohol consumption (quantity, frequency, variability) and modified CAGE questions. The questionnaire was included in the medical history taking section of the hospital visit. Patients identified as ‘at risk’ were allocated to one of two groups:
1. Education group. This group was provided with a brief tape-slide programme on sensible drinking and a copy of the ‘That’s the Limit’ information booklet. This was provided by nurses, apart from the 3 month time period during which nurses were involved in screening patients. During this time the education was provided by the specialist worker.
2. No education. The results of these interventions are not reported in this paper as they were still being analysed. This paper deals with the cost effectiveness of the screening tool being applied by;
1. Junior doctors 2. Nurses 3. Specialist alcohol worker
Source of effectiveness data
The York District Hospital Study. This study aimed to identify the prevalence of patients who drank to excess and to evaluate a screening and health education programme. ‘At risk’ drinking was classed as more than 36 units per week for me, and 24 units per week for women.
Method of eliciting NA
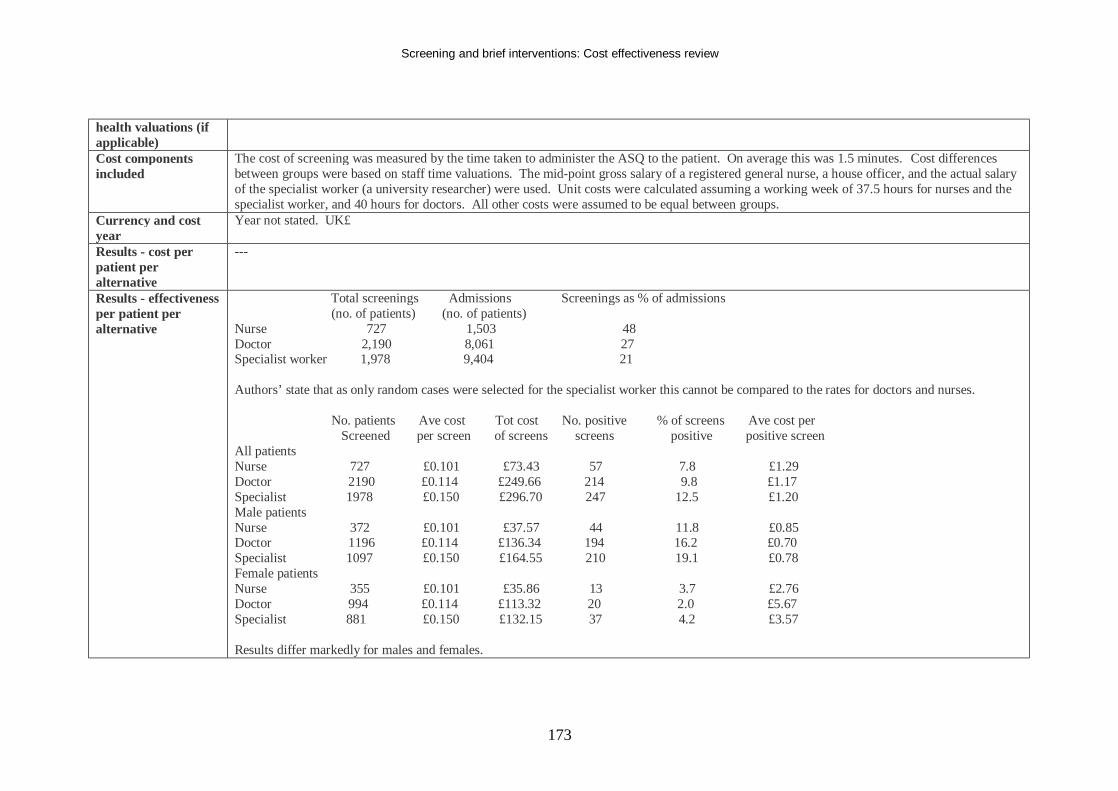
Screening and brief interventions: Cost effectiveness review
173
health valuations (if applicable) Cost components included
The cost of screening was measured by the time taken to administer the ASQ to the patient. On average this was 1.5 minutes. Cost differences between groups were based on staff time valuations. The mid-point gross salary of a registered general nurse, a house officer, and the actual salary of the specialist worker (a university researcher) were used. Unit costs were calculated assuming a working week of 37.5 hours for nurses and the specialist worker, and 40 hours for doctors. All other costs were assumed to be equal between groups.
Currency and cost year
Year not stated. UK£
Results - cost per patient per alternative
---
Results - effectiveness per patient per alternative
Total screenings Admissions Screenings as % of admissions (no. of patients) (no. of patients) Nurse 727 1,503 48 Doctor 2,190 8,061 27 Specialist worker 1,978 9,404 21 Authors’ state that as only random cases were selected for the specialist worker this cannot be compared to the rates for doctors and nurses. No. patients Ave cost Tot cost No. positive % of screens Ave cost per Screened per screen of screens screens positive positive screen All patients Nurse 727 £0.101 £73.43 57 7.8 £1.29 Doctor 2190 £0.114 £249.66 214 9.8 £1.17 Specialist 1978 £0.150 £296.70 247 12.5 £1.20 Male patients Nurse 372 £0.101 £37.57 44 11.8 £0.85 Doctor 1196 £0.114 £136.34 194 16.2 £0.70 Specialist 1097 £0.150 £164.55 210 19.1 £0.78 Female patients Nurse 355 £0.101 £35.86 13 3.7 £2.76 Doctor 994 £0.114 £113.32 20 2.0 £5.67 Specialist 881 £0.150 £132.15 37 4.2 £3.57 Results differ markedly for males and females.
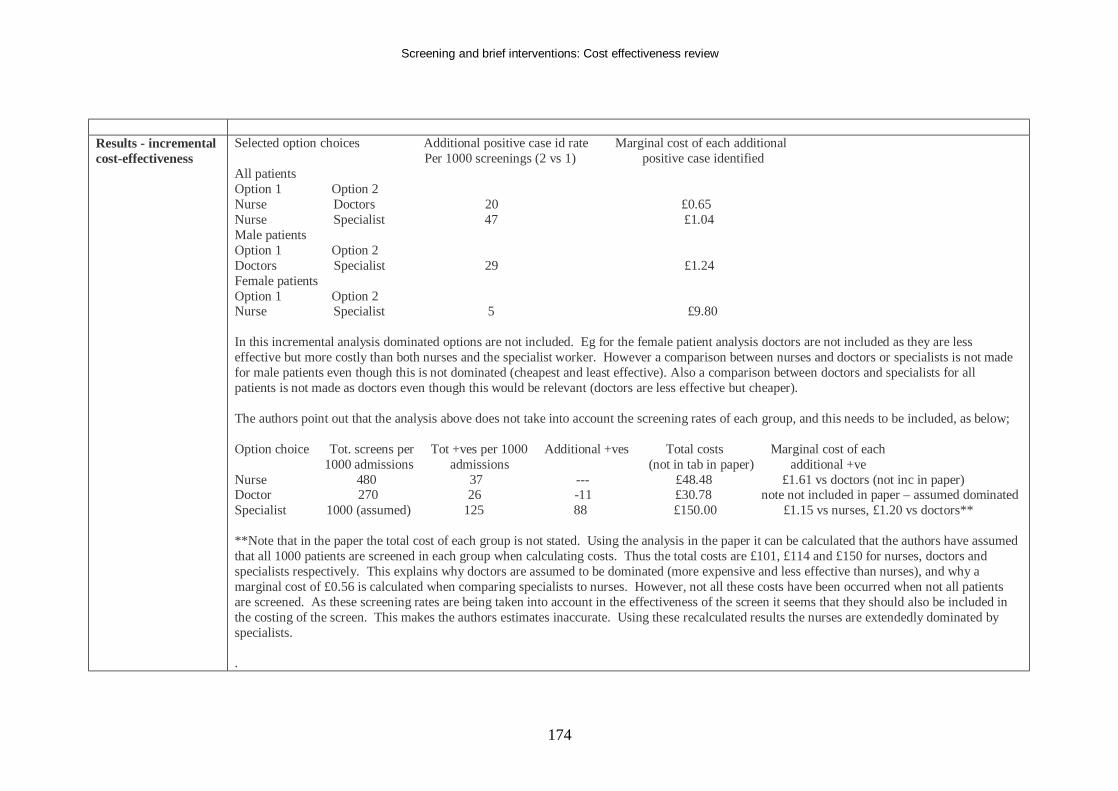
Screening and brief interventions: Cost effectiveness review
174
Results - incremental cost-effectiveness
Selected option choices Additional positive case id rate Marginal cost of each additional Per 1000 screenings (2 vs 1) positive case identified All patients Option 1 Option 2 Nurse Doctors 20 £0.65 Nurse Specialist 47 £1.04 Male patients Option 1 Option 2 Doctors Specialist 29 £1.24 Female patients Option 1 Option 2 Nurse Specialist 5 £9.80 In this incremental analysis dominated options are not included. Eg for the female patient analysis doctors are not included as they are less effective but more costly than both nurses and the specialist worker. However a comparison between nurses and doctors or specialists is not made for male patients even though this is not dominated (cheapest and least effective). Also a comparison between doctors and specialists for all patients is not made as doctors even though this would be relevant (doctors are less effective but cheaper). The authors point out that the analysis above does not take into account the screening rates of each group, and this needs to be included, as below; Option choice Tot. screens per Tot +ves per 1000 Additional +ves Total costs Marginal cost of each 1000 admissions admissions (not in tab in paper) additional +ve Nurse 480 37 --- £48.48 £1.61 vs doctors (not inc in paper) Doctor 270 26 -11 £30.78 note not included in paper – assumed dominated Specialist 1000 (assumed) 125 88 £150.00 £1.15 vs nurses, £1.20 vs doctors** **Note that in the paper the total cost of each group is not stated. Using the analysis in the paper it can be calculated that the authors have assumed that all 1000 patients are screened in each group when calculating costs. Thus the total costs are £101, £114 and £150 for nurses, doctors and specialists respectively. This explains why doctors are assumed to be dominated (more expensive and less effective than nurses), and why a marginal cost of £0.56 is calculated when comparing specialists to nurses. However, not all these costs have been occurred when not all patients are screened. As these screening rates are being taken into account in the effectiveness of the screen it seems that they should also be included in the costing of the screen. This makes the authors estimates inaccurate. Using these recalculated results the nurses are extendedly dominated by specialists. .
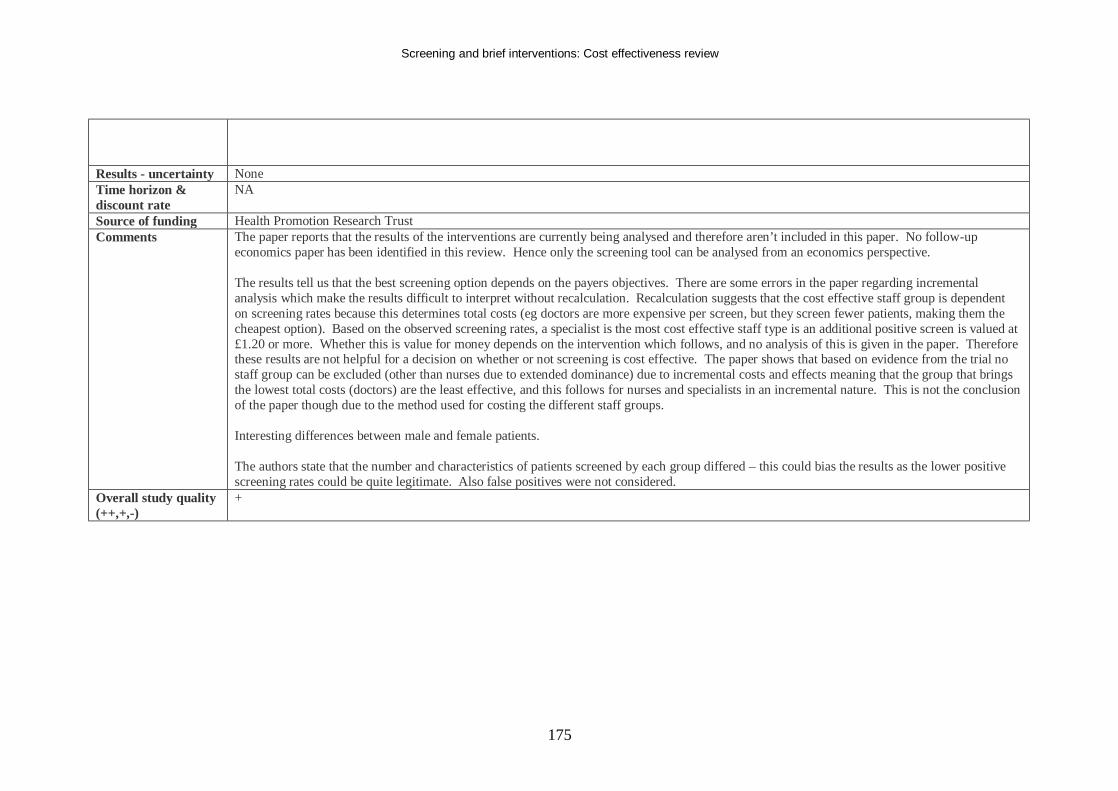
Screening and brief interventions: Cost effectiveness review
175
Results - uncertainty None Time horizon & discount rate
NA
Source of funding Health Promotion Research Trust Comments The paper reports that the results of the interventions are currently being analysed and therefore aren’t included in this paper. No follow-up
economics paper has been identified in this review. Hence only the screening tool can be analysed from an economics perspective. The results tell us that the best screening option depends on the payers objectives. There are some errors in the paper regarding incremental analysis which make the results difficult to interpret without recalculation. Recalculation suggests that the cost effective staff group is dependent on screening rates because this determines total costs (eg doctors are more expensive per screen, but they screen fewer patients, making them the cheapest option). Based on the observed screening rates, a specialist is the most cost effective staff type is an additional positive screen is valued at £1.20 or more. Whether this is value for money depends on the intervention which follows, and no analysis of this is given in the paper. Therefore these results are not helpful for a decision on whether or not screening is cost effective. The paper shows that based on evidence from the trial no staff group can be excluded (other than nurses due to extended dominance) due to incremental costs and effects meaning that the group that brings the lowest total costs (doctors) are the least effective, and this follows for nurses and specialists in an incremental nature. This is not the conclusion of the paper though due to the method used for costing the different staff groups. Interesting differences between male and female patients. The authors state that the number and characteristics of patients screened by each group differed – this could bias the results as the lower positive screening rates could be quite legitimate. Also false positives were not considered.
Overall study quality (++,+,-)
+
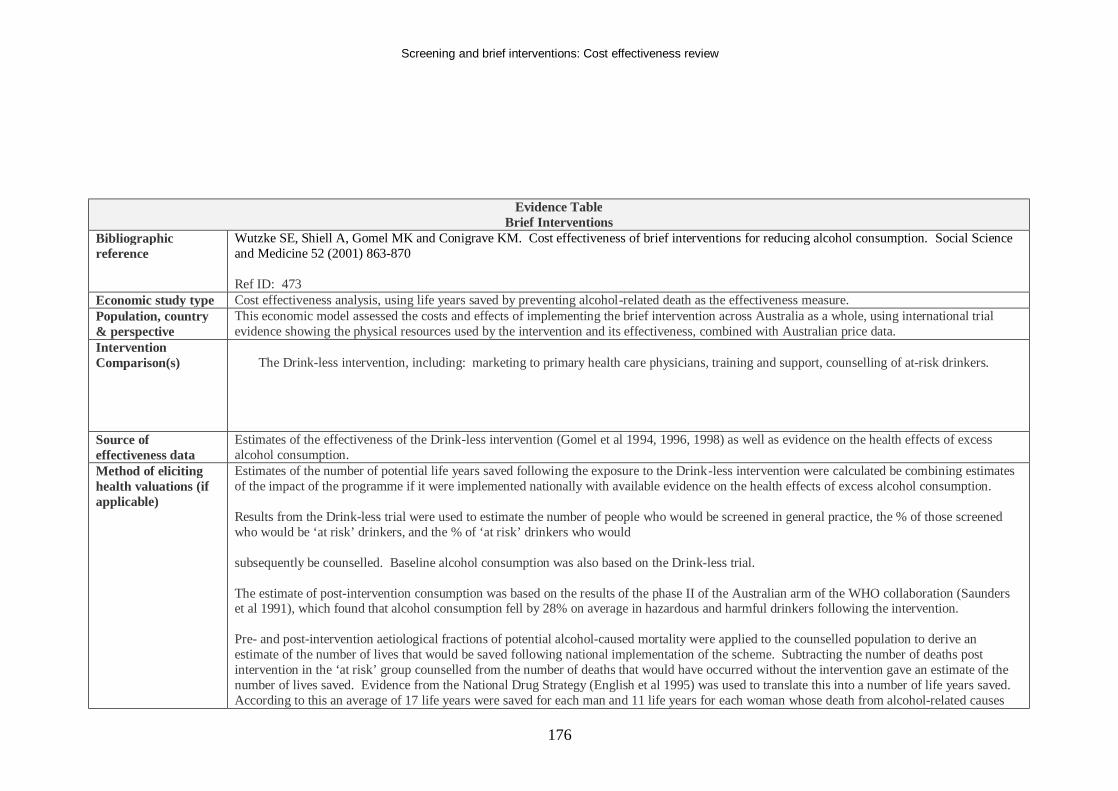
Screening and brief interventions: Cost effectiveness review
176
Evidence Table Brief Interventions
Bibliographic reference
Wutzke SE, Shiell A, Gomel MK and Conigrave KM. Cost effectiveness of brief interventions for reducing alcohol consumption. Social Science and Medicine 52 (2001) 863-870 Ref ID: 473
Economic study type Cost effectiveness analysis, using life years saved by preventing alcohol-related death as the effectiveness measure. Population, country & perspective
This economic model assessed the costs and effects of implementing the brief intervention across Australia as a whole, using international trial evidence showing the physical resources used by the intervention and its effectiveness, combined with Australian price data.
Intervention Comparison(s)
The Drink-less intervention, including: marketing to primary health care physicians, training and support, counselling of at-risk drinkers.
Source of effectiveness data
Estimates of the effectiveness of the Drink-less intervention (Gomel et al 1994, 1996, 1998) as well as evidence on the health effects of excess alcohol consumption.
Method of eliciting health valuations (if applicable)
Estimates of the number of potential life years saved following the exposure to the Drink-less intervention were calculated be combining estimates of the impact of the programme if it were implemented nationally with available evidence on the health effects of excess alcohol consumption. Results from the Drink-less trial were used to estimate the number of people who would be screened in general practice, the % of those screened who would be ‘at risk’ drinkers, and the % of ‘at risk’ drinkers who would subsequently be counselled. Baseline alcohol consumption was also based on the Drink-less trial. The estimate of post-intervention consumption was based on the results of the phase II of the Australian arm of the WHO collaboration (Saunders et al 1991), which found that alcohol consumption fell by 28% on average in hazardous and harmful drinkers following the intervention. Pre- and post-intervention aetiological fractions of potential alcohol-caused mortality were applied to the counselled population to derive an estimate of the number of lives that would be saved following national implementation of the scheme. Subtracting the number of deaths post intervention in the ‘at risk’ group counselled from the number of deaths that would have occurred without the intervention gave an estimate of the number of lives saved. Evidence from the National Drug Strategy (English et al 1995) was used to translate this into a number of life years saved. According to this an average of 17 life years were saved for each man and 11 life years for each woman whose death from alcohol-related causes
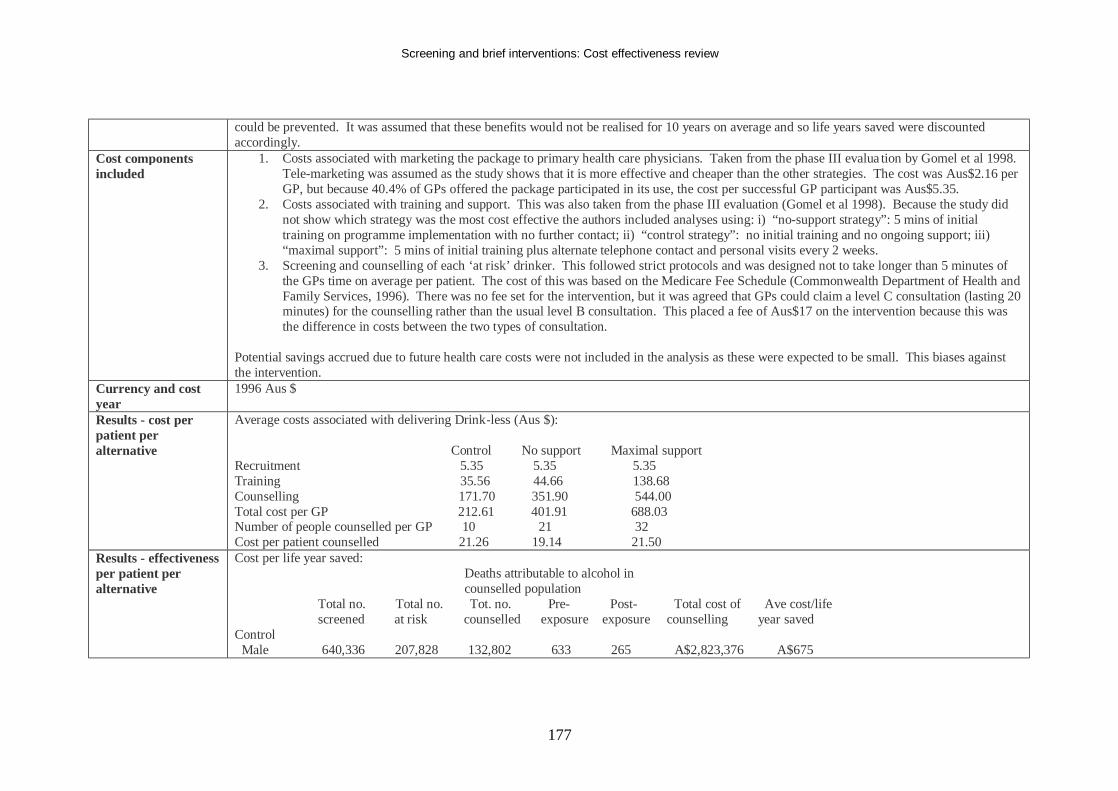
Screening and brief interventions: Cost effectiveness review
177
could be prevented. It was assumed that these benefits would not be realised for 10 years on average and so life years saved were discounted accordingly.
Cost components included
1. Costs associated with marketing the package to primary health care physicians. Taken from the phase III evalua tion by Gomel et al 1998. Tele-marketing was assumed as the study shows that it is more effective and cheaper than the other strategies. The cost was Aus$2.16 per GP, but because 40.4% of GPs offered the package participated in its use, the cost per successful GP participant was Aus$5.35.
2. Costs associated with training and support. This was also taken from the phase III evaluation (Gomel et al 1998). Because the study did not show which strategy was the most cost effective the authors included analyses using: i) “no-support strategy”: 5 mins of initial training on programme implementation with no further contact; ii) “control strategy”: no initial training and no ongoing support; iii) “maximal support”: 5 mins of initial training plus alternate telephone contact and personal visits every 2 weeks.
3. Screening and counselling of each ‘at risk’ drinker. This followed strict protocols and was designed not to take longer than 5 minutes of the GPs time on average per patient. The cost of this was based on the Medicare Fee Schedule (Commonwealth Department of Health and Family Services, 1996). There was no fee set for the intervention, but it was agreed that GPs could claim a level C consultation (lasting 20 minutes) for the counselling rather than the usual level B consultation. This placed a fee of Aus$17 on the intervention because this was the difference in costs between the two types of consultation.
Potential savings accrued due to future health care costs were not included in the analysis as these were expected to be small. This biases against the intervention.
Currency and cost year
1996 Aus $
Results - cost per patient per alternative
Average costs associated with delivering Drink-less (Aus $): Control No support Maximal support Recruitment 5.35 5.35 5.35 Training 35.56 44.66 138.68 Counselling 171.70 351.90 544.00 Total cost per GP 212.61 401.91 688.03 Number of people counselled per GP 10 21 32 Cost per patient counselled 21.26 19.14 21.50
Results - effectiveness per patient per alternative
Cost per life year saved: Deaths attributable to alcohol in counselled population Total no. Total no. Tot. no. Pre- Post- Total cost of Ave cost/life screened at risk counselled exposure exposure counselling year saved Control Male 640,336 207,828 132,802 633 265 A$2,823,376 A$675
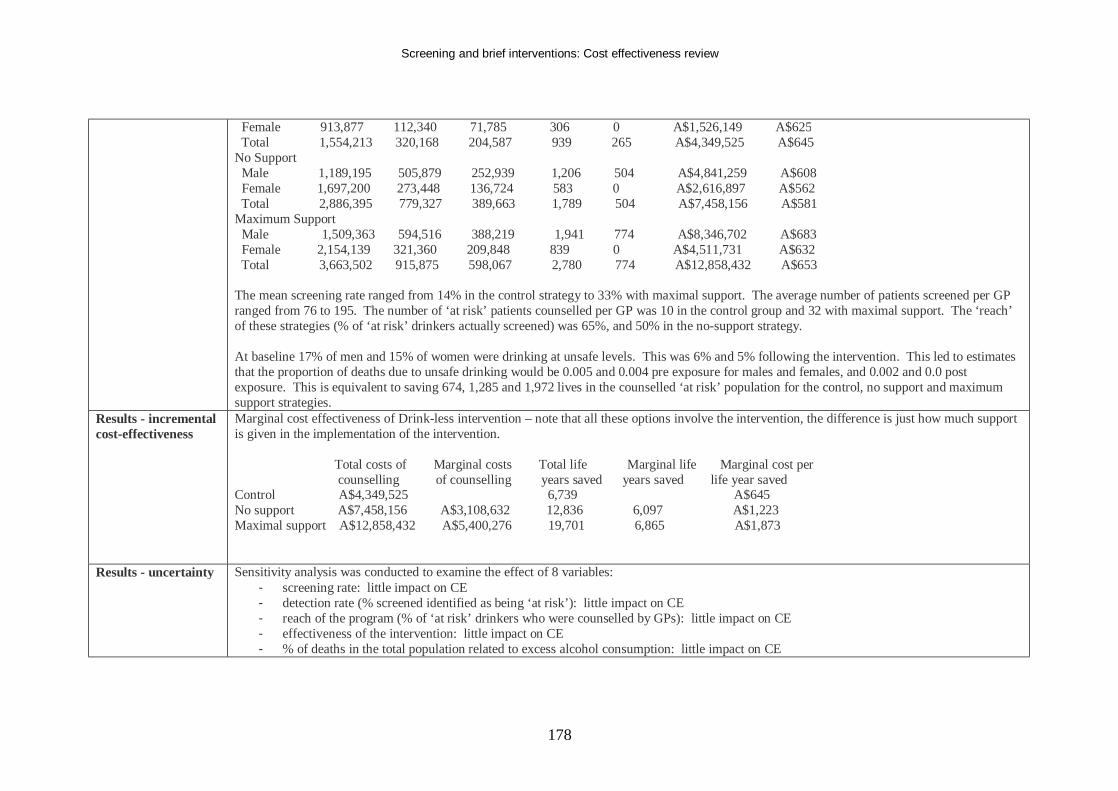
Screening and brief interventions: Cost effectiveness review
178
Female 913,877 112,340 71,785 306 0 A$1,526,149 A$625 Total 1,554,213 320,168 204,587 939 265 A$4,349,525 A$645 No Support Male 1,189,195 505,879 252,939 1,206 504 A$4,841,259 A$608 Female 1,697,200 273,448 136,724 583 0 A$2,616,897 A$562 Total 2,886,395 779,327 389,663 1,789 504 A$7,458,156 A$581 Maximum Support Male 1,509,363 594,516 388,219 1,941 774 A$8,346,702 A$683 Female 2,154,139 321,360 209,848 839 0 A$4,511,731 A$632 Total 3,663,502 915,875 598,067 2,780 774 A$12,858,432 A$653 The mean screening rate ranged from 14% in the control strategy to 33% with maximal support. The average number of patients screened per GP ranged from 76 to 195. The number of ‘at risk’ patients counselled per GP was 10 in the control group and 32 with maximal support. The ‘reach’ of these strategies (% of ‘at risk’ drinkers actually screened) was 65%, and 50% in the no-support strategy. At baseline 17% of men and 15% of women were drinking at unsafe levels. This was 6% and 5% following the intervention. This led to estimates that the proportion of deaths due to unsafe drinking would be 0.005 and 0.004 pre exposure for males and females, and 0.002 and 0.0 post exposure. This is equivalent to saving 674, 1,285 and 1,972 lives in the counselled ‘at risk’ population for the control, no support and maximum support strategies.
Results - incremental cost-effectiveness
Marginal cost effectiveness of Drink-less intervention – note that all these options involve the intervention, the difference is just how much support is given in the implementation of the intervention. Total costs of Marginal costs Total life Marginal life Marginal cost per counselling of counselling years saved years saved life year saved Control A$4,349,525 6,739 A$645 No support A$7,458,156 A$3,108,632 12,836 6,097 A$1,223 Maximal support A$12,858,432 A$5,400,276 19,701 6,865 A$1,873
Results - uncertainty Sensitivity analysis was conducted to examine the effect of 8 variables: - screening rate: little impact on CE - detection rate (% screened identified as being ‘at risk’): little impact on CE - reach of the program (% of ‘at risk’ drinkers who were counselled by GPs): little impact on CE - effectiveness of the intervention: little impact on CE - % of deaths in the total population related to excess alcohol consumption: little impact on CE
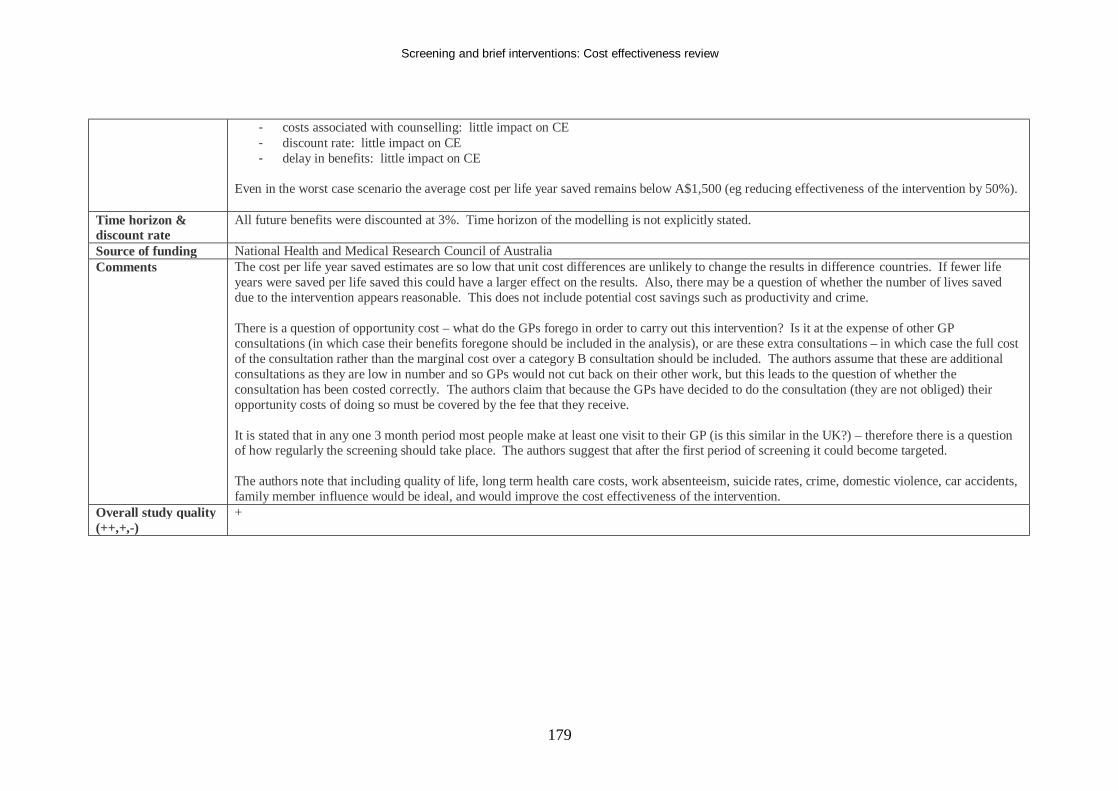
Screening and brief interventions: Cost effectiveness review
179
- costs associated with counselling: little impact on CE - discount rate: little impact on CE - delay in benefits: little impact on CE
Even in the worst case scenario the average cost per life year saved remains below A$1,500 (eg reducing effectiveness of the intervention by 50%).
Time horizon & discount rate
All future benefits were discounted at 3%. Time horizon of the modelling is not explicitly stated.
Source of funding National Health and Medical Research Council of Australia Comments The cost per life year saved estimates are so low that unit cost differences are unlikely to change the results in difference countries. If fewer life
years were saved per life saved this could have a larger effect on the results. Also, there may be a question of whether the number of lives saved due to the intervention appears reasonable. This does not include potential cost savings such as productivity and crime. There is a question of opportunity cost – what do the GPs forego in order to carry out this intervention? Is it at the expense of other GP consultations (in which case their benefits foregone should be included in the analysis), or are these extra consultations – in which case the full cost of the consultation rather than the marginal cost over a category B consultation should be included. The authors assume that these are additional consultations as they are low in number and so GPs would not cut back on their other work, but this leads to the question of whether the consultation has been costed correctly. The authors claim that because the GPs have decided to do the consultation (they are not obliged) their opportunity costs of doing so must be covered by the fee that they receive. It is stated that in any one 3 month period most people make at least one visit to their GP (is this similar in the UK?) – therefore there is a question of how regularly the screening should take place. The authors suggest that after the first period of screening it could become targeted. The authors note that including quality of life, long term health care costs, work absenteeism, suicide rates, crime, domestic violence, car accidents, family member influence would be ideal, and would improve the cost effectiveness of the intervention.
Overall study quality (++,+,-)
+
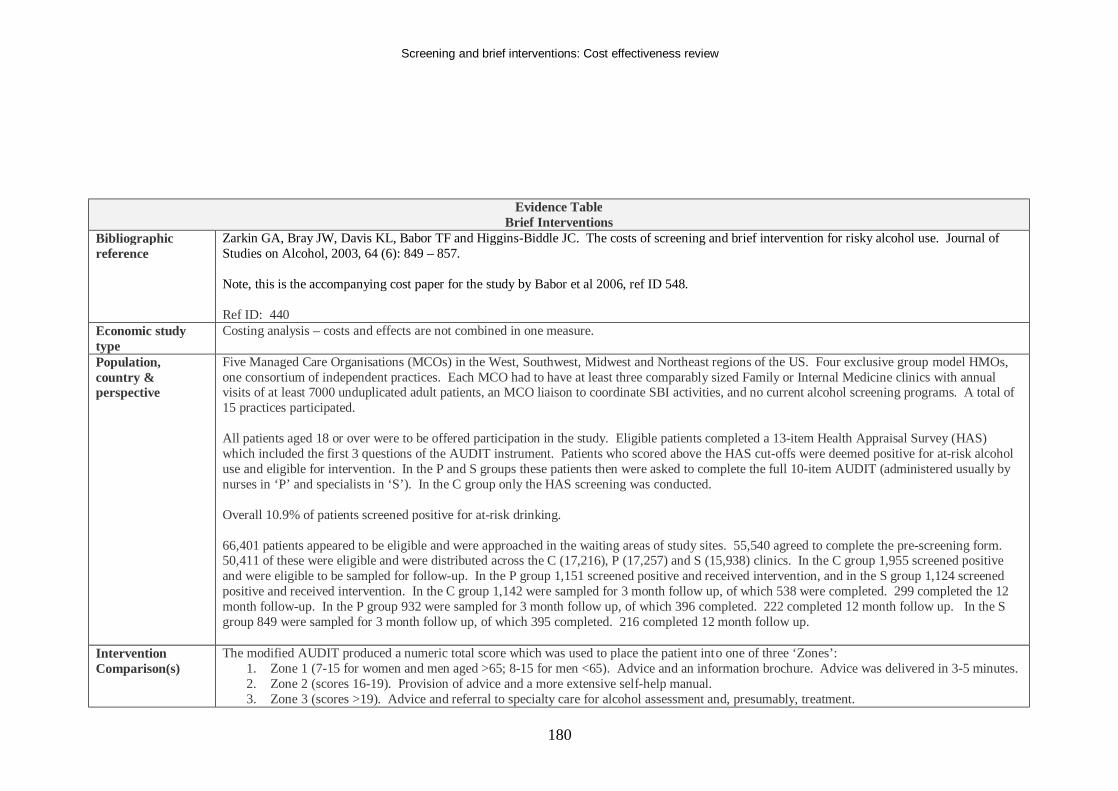
Screening and brief interventions: Cost effectiveness review
180
Evidence Table Brief Interventions
Bibliographic reference
Zarkin GA, Bray JW, Davis KL, Babor TF and Higgins-Biddle JC. The costs of screening and brief intervention for risky alcohol use. Journal of Studies on Alcohol, 2003, 64 (6): 849 – 857. Note, this is the accompanying cost paper for the study by Babor et al 2006, ref ID 548. Ref ID: 440
Economic study type
Costing analysis – costs and effects are not combined in one measure.
Population, country & perspective
Five Managed Care Organisations (MCOs) in the West, Southwest, Midwest and Northeast regions of the US. Four exclusive group model HMOs, one consortium of independent practices. Each MCO had to have at least three comparably sized Family or Internal Medicine clinics with annual visits of at least 7000 unduplicated adult patients, an MCO liaison to coordinate SBI activities, and no current alcohol screening programs. A total of 15 practices participated. All patients aged 18 or over were to be offered participation in the study. Eligible patients completed a 13-item Health Appraisal Survey (HAS) which included the first 3 questions of the AUDIT instrument. Patients who scored above the HAS cut-offs were deemed positive for at-risk alcohol use and eligible for intervention. In the P and S groups these patients then were asked to complete the full 10-item AUDIT (administered usually by nurses in ‘P’ and specialists in ‘S’). In the C group only the HAS screening was conducted. Overall 10.9% of patients screened positive for at-risk drinking. 66,401 patients appeared to be eligible and were approached in the waiting areas of study sites. 55,540 agreed to complete the pre-screening form. 50,411 of these were eligible and were distributed across the C (17,216), P (17,257) and S (15,938) clinics. In the C group 1,955 screened positive and were eligible to be sampled for follow-up. In the P group 1,151 screened positive and received intervention, and in the S group 1,124 screened positive and received intervention. In the C group 1,142 were sampled for 3 month follow up, of which 538 were completed. 299 completed the 12 month follow-up. In the P group 932 were sampled for 3 month follow up, of which 396 completed. 222 completed 12 month follow up. In the S group 849 were sampled for 3 month follow up, of which 395 completed. 216 completed 12 month follow up.
Intervention Comparison(s)
The modified AUDIT produced a numeric total score which was used to place the patient into one of three ‘Zones’: 1. Zone 1 (7-15 for women and men aged >65; 8-15 for men <65). Advice and an information brochure. Advice was delivered in 3-5 minutes. 2. Zone 2 (scores 16-19). Provision of advice and a more extensive self-help manual. 3. Zone 3 (scores >19). Advice and referral to specialty care for alcohol assessment and, presumably, treatment.
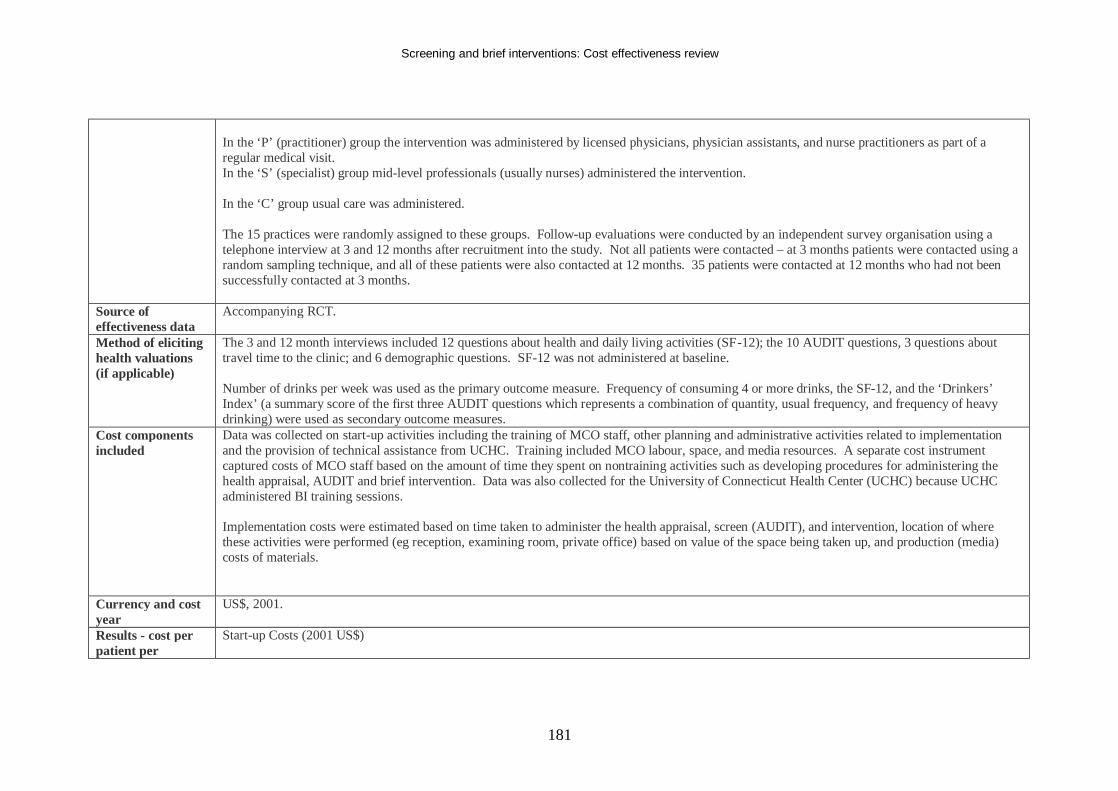
Screening and brief interventions: Cost effectiveness review
181
In the ‘P’ (practitioner) group the intervention was administered by licensed physicians, physician assistants, and nurse practitioners as part of a regular medical visit. In the ‘S’ (specialist) group mid-level professionals (usually nurses) administered the intervention. In the ‘C’ group usual care was administered. The 15 practices were randomly assigned to these groups. Follow-up evaluations were conducted by an independent survey organisation using a telephone interview at 3 and 12 months after recruitment into the study. Not all patients were contacted – at 3 months patients were contacted using a random sampling technique, and all of these patients were also contacted at 12 months. 35 patients were contacted at 12 months who had not been successfully contacted at 3 months.
Source of effectiveness data
Accompanying RCT.
Method of eliciting health valuations (if applicable)
The 3 and 12 month interviews included 12 questions about health and daily living activities (SF-12); the 10 AUDIT questions, 3 questions about travel time to the clinic; and 6 demographic questions. SF-12 was not administered at baseline. Number of drinks per week was used as the primary outcome measure. Frequency of consuming 4 or more drinks, the SF-12, and the ‘Drinkers’ Index’ (a summary score of the first three AUDIT questions which represents a combination of quantity, usual frequency, and frequency of heavy drinking) were used as secondary outcome measures.
Cost components included
Data was collected on start-up activities including the training of MCO staff, other planning and administrative activities related to implementation and the provision of technical assistance from UCHC. Training included MCO labour, space, and media resources. A separate cost instrument captured costs of MCO staff based on the amount of time they spent on nontraining activities such as developing procedures for administering the health appraisal, AUDIT and brief intervention. Data was also collected for the University of Connecticut Health Center (UCHC) because UCHC administered BI training sessions. Implementation costs were estimated based on time taken to administer the health appraisal, screen (AUDIT), and intervention, location of where these activities were performed (eg reception, examining room, private office) based on value of the space being taken up, and production (media) costs of materials.
Currency and cost year
US$, 2001.
Results - cost per patient per
Start-up Costs (2001 US$)
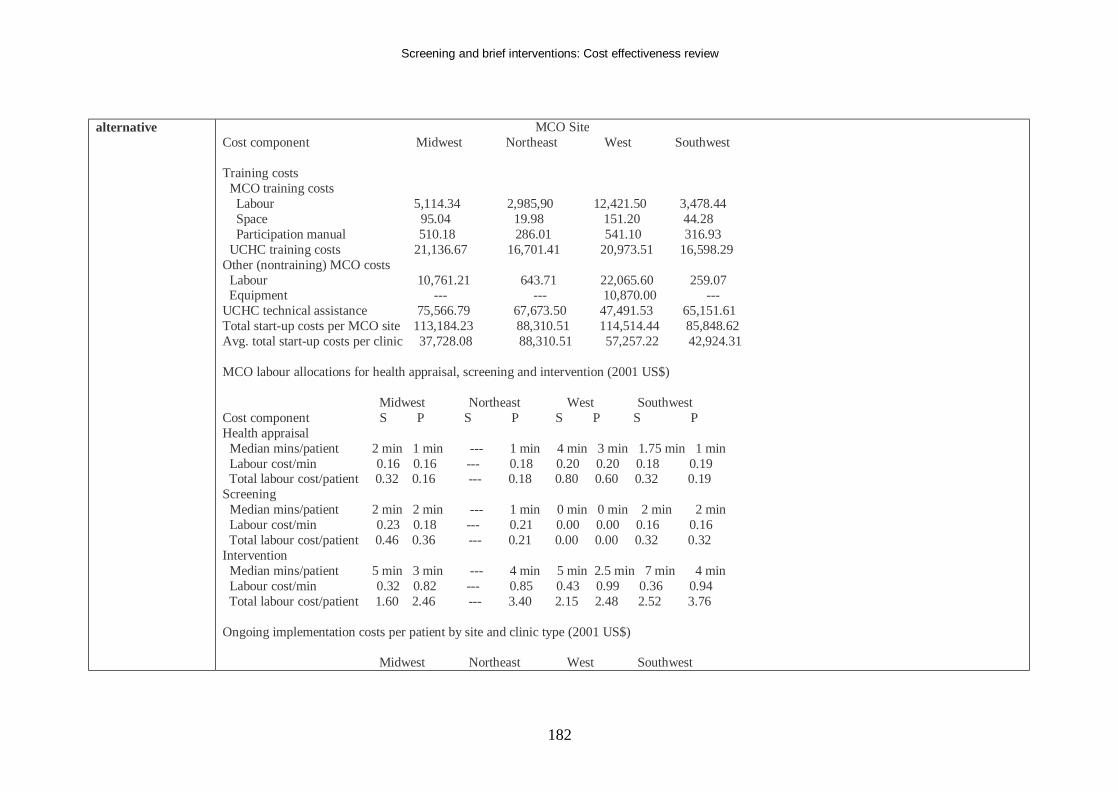
Screening and brief interventions: Cost effectiveness review
182
alternative MCO Site Cost component Midwest Northeast West Southwest Training costs MCO training costs Labour 5,114.34 2,985,90 12,421.50 3,478.44 Space 95.04 19.98 151.20 44.28 Participation manual 510.18 286.01 541.10 316.93 UCHC training costs 21,136.67 16,701.41 20,973.51 16,598.29 Other (nontraining) MCO costs Labour 10,761.21 643.71 22,065.60 259.07 Equipment --- --- 10,870.00 --- UCHC technical assistance 75,566.79 67,673.50 47,491.53 65,151.61 Total start-up costs per MCO site 113,184.23 88,310.51 114,514.44 85,848.62 Avg. total start-up costs per clinic 37,728.08 88,310.51 57,257.22 42,924.31 MCO labour allocations for health appraisal, screening and intervention (2001 US$) Midwest Northeast West Southwest Cost component S P S P S P S P Health appraisal Median mins/patient 2 min 1 min --- 1 min 4 min 3 min 1.75 min 1 min Labour cost/min 0.16 0.16 --- 0.18 0.20 0.20 0.18 0.19 Total labour cost/patient 0.32 0.16 --- 0.18 0.80 0.60 0.32 0.19 Screening Median mins/patient 2 min 2 min --- 1 min 0 min 0 min 2 min 2 min Labour cost/min 0.23 0.18 --- 0.21 0.00 0.00 0.16 0.16 Total labour cost/patient 0.46 0.36 --- 0.21 0.00 0.00 0.32 0.32 Intervention Median mins/patient 5 min 3 min --- 4 min 5 min 2.5 min 7 min 4 min Labour cost/min 0.32 0.82 --- 0.85 0.43 0.99 0.36 0.94 Total labour cost/patient 1.60 2.46 --- 3.40 2.15 2.48 2.52 3.76 Ongoing implementation costs per patient by site and clinic type (2001 US$) Midwest Northeast West Southwest
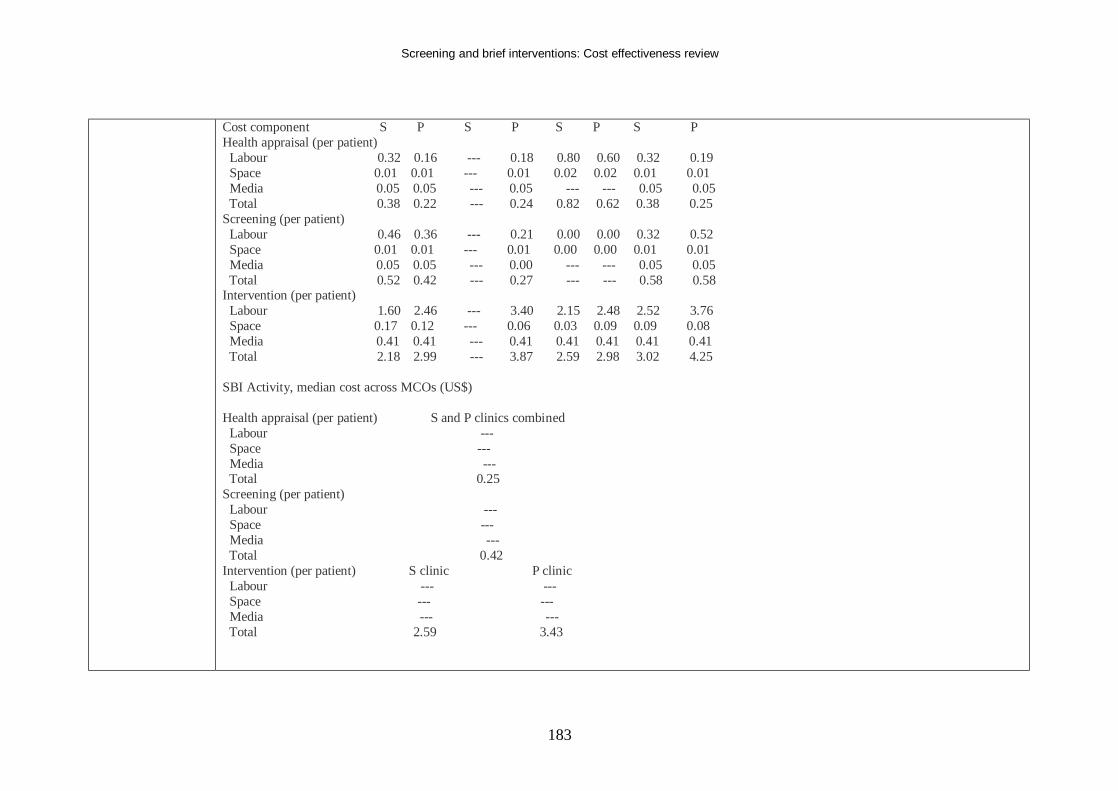
Screening and brief interventions: Cost effectiveness review
183
Cost component S P S P S P S P Health appraisal (per patient) Labour 0.32 0.16 --- 0.18 0.80 0.60 0.32 0.19 Space 0.01 0.01 --- 0.01 0.02 0.02 0.01 0.01 Media 0.05 0.05 --- 0.05 --- --- 0.05 0.05 Total 0.38 0.22 --- 0.24 0.82 0.62 0.38 0.25 Screening (per patient) Labour 0.46 0.36 --- 0.21 0.00 0.00 0.32 0.52 Space 0.01 0.01 --- 0.01 0.00 0.00 0.01 0.01 Media 0.05 0.05 --- 0.00 --- --- 0.05 0.05 Total 0.52 0.42 --- 0.27 --- --- 0.58 0.58 Intervention (per patient) Labour 1.60 2.46 --- 3.40 2.15 2.48 2.52 3.76 Space 0.17 0.12 --- 0.06 0.03 0.09 0.09 0.08 Media 0.41 0.41 --- 0.41 0.41 0.41 0.41 0.41 Total 2.18 2.99 --- 3.87 2.59 2.98 3.02 4.25 SBI Activity, median cost across MCOs (US$) Health appraisal (per patient) S and P clinics combined Labour --- Space --- Media --- Total 0.25 Screening (per patient) Labour --- Space --- Media --- Total 0.42 Intervention (per patient) S clinic P clinic Labour --- --- Space --- --- Media --- --- Total 2.59 3.43
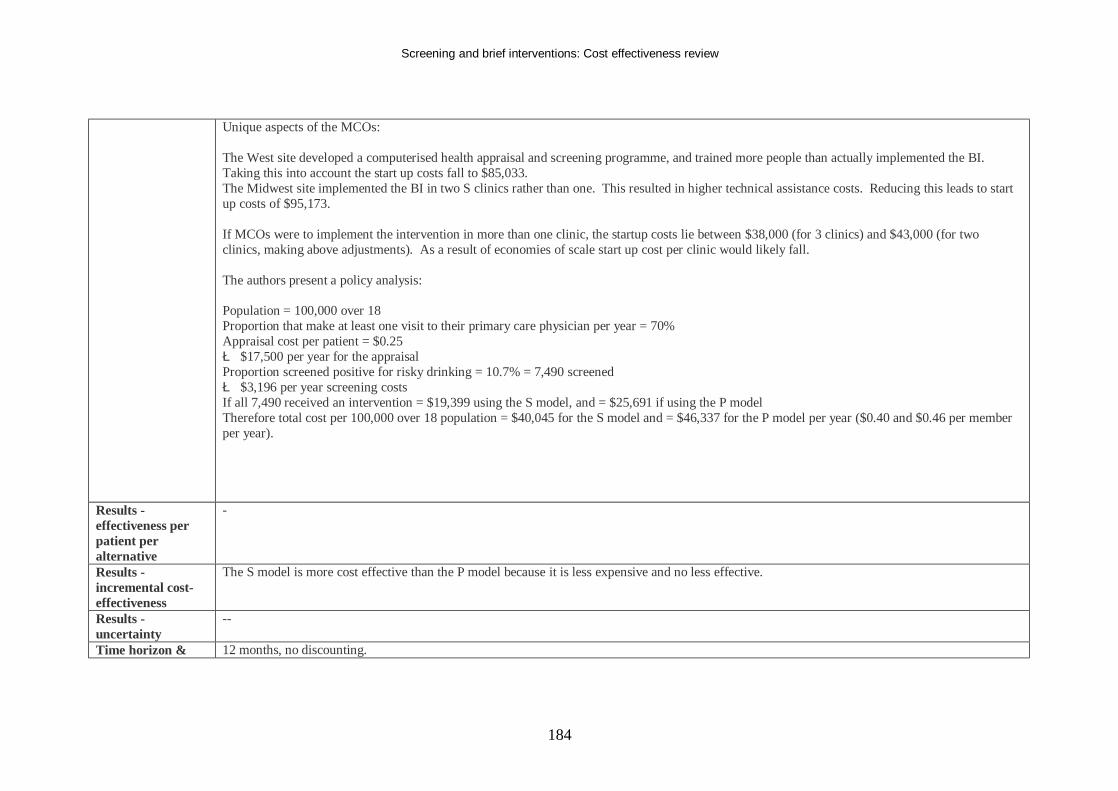
Screening and brief interventions: Cost effectiveness review
184
Unique aspects of the MCOs: The West site developed a computerised health appraisal and screening programme, and trained more people than actually implemented the BI. Taking this into account the start up costs fall to $85,033. The Midwest site implemented the BI in two S clinics rather than one. This resulted in higher technical assistance costs. Reducing this leads to start up costs of $95,173. If MCOs were to implement the intervention in more than one clinic, the startup costs lie between $38,000 (for 3 clinics) and $43,000 (for two clinics, making above adjustments). As a result of economies of scale start up cost per clinic would likely fall. The authors present a policy analysis: Population = 100,000 over 18 Proportion that make at least one visit to their primary care physician per year = 70% Appraisal cost per patient = $0.25 è $17,500 per year for the appraisal Proportion screened positive for risky drinking = 10.7% = 7,490 screened è $3,196 per year screening costs If all 7,490 received an intervention = $19,399 using the S model, and = $25,691 if using the P model Therefore total cost per 100,000 over 18 population = $40,045 for the S model and = $46,337 for the P model per year ($0.40 and $0.46 per member per year).
Results - effectiveness per patient per alternative
-
Results - incremental cost-effectiveness
The S model is more cost effective than the P model because it is less expensive and no less effective.
Results - uncertainty
--
Time horizon & 12 months, no discounting.
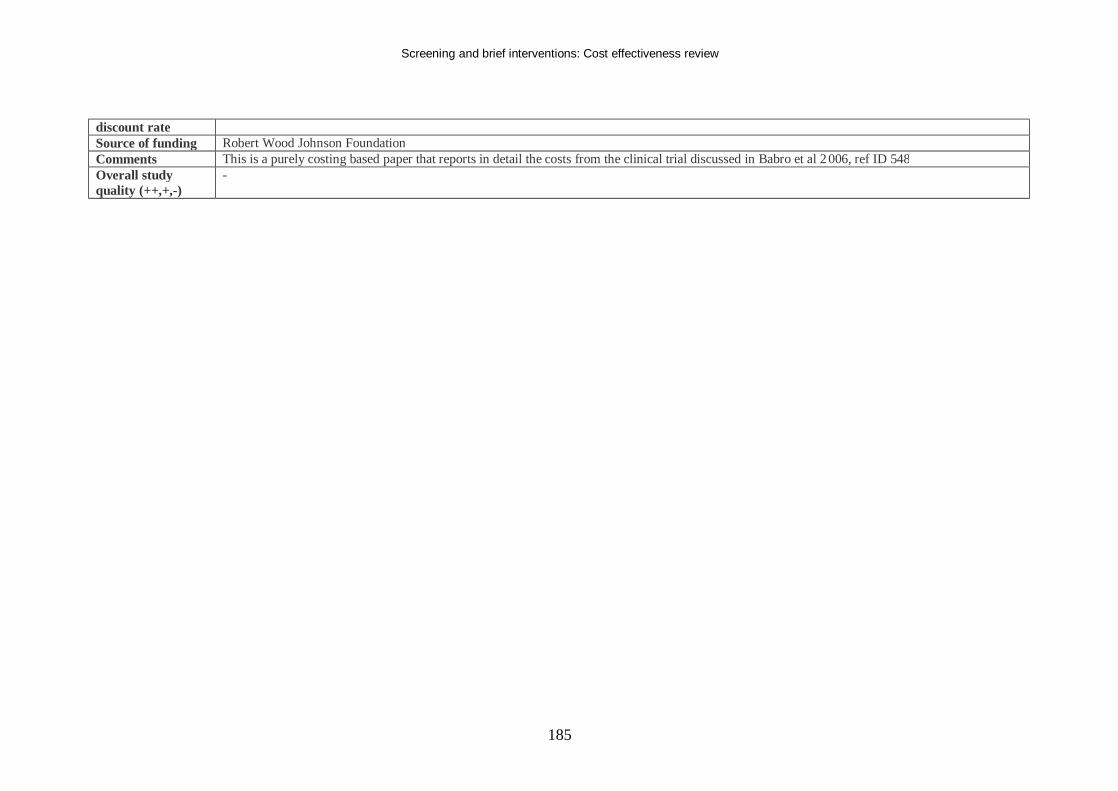
Screening and brief interventions: Cost effectiveness review
185
discount rate Source of funding Robert Wood Johnson Foundation Comments This is a purely costing based paper that reports in detail the costs from the clinical trial discussed in Babro et al 2 006, ref ID 548 Overall study quality (++,+,-)
-

Screening and brief interventions: Cost effectiveness review
186
Appendix C: Inclusion and Exclusion Criteria
Screening Inclusion criteria The following inclusion criteria were applied as follows: Population Adults and young people aged 10 years and above Interventions Use of i) alcohol screening questionnaires, ii) biochemical indicators of alcohol misuse, iii) clinical indicators of alcohol misuse to identify individuals who currently misuse or are at risk of misusing alcohol. The scope of the interventions under study was determined in an emergent process by consultation with the PDG. Outcomes Costs, quality adjusted life years (thus incremental cost effectiveness ratios) and other economic outcomes. Study types Cost effectiveness, cost utility and cost consequence studies were included Exclusion criteria Studies which are only published in languages other than English were excluded. Studies in which the study population is solely below 10 years of age were also ineligible. Evidence not originating in economically developed countries (as categorised by membership of the Organisation for Economic Co-operation and Development) would be excluded on grounds of having limited relevance to the application of screening within a UK-specific context. Papers not published in peer-reviewed journals were excluded. Studies relating to the use of the following interventions are outside the remit of this guidance and are also excluded:
• Drink-driving schemes
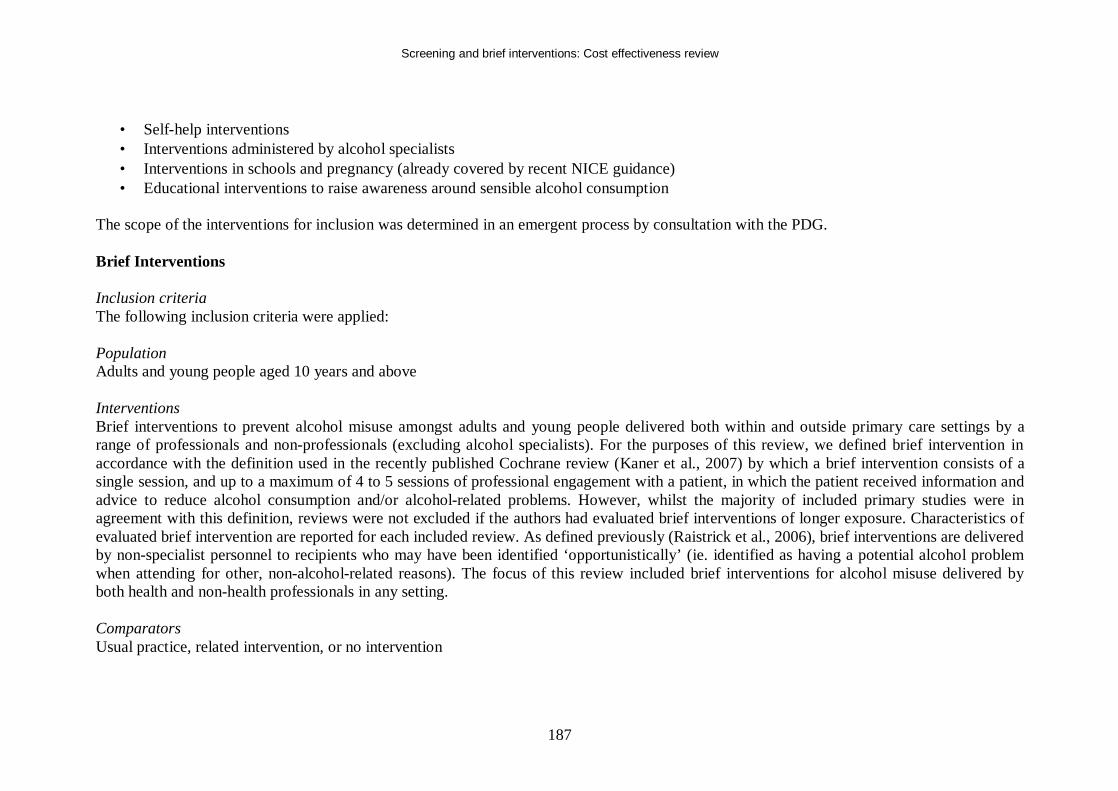
Screening and brief interventions: Cost effectiveness review
187
• Self-help interventions • Interventions administered by alcohol specialists • Interventions in schools and pregnancy (already covered by recent NICE guidance) • Educational interventions to raise awareness around sensible alcohol consumption
The scope of the interventions for inclusion was determined in an emergent process by consultation with the PDG. Brief Interventions Inclusion criteria The following inclusion criteria were applied: Population Adults and young people aged 10 years and above Interventions Brief interventions to prevent alcohol misuse amongst adults and young people delivered both within and outside primary care settings by a range of professionals and non-professionals (excluding alcohol specialists). For the purposes of this review, we defined brief intervention in accordance with the definition used in the recently published Cochrane review (Kaner et al., 2007) by which a brief intervention consists of a single session, and up to a maximum of 4 to 5 sessions of professional engagement with a patient, in which the patient received information and advice to reduce alcohol consumption and/or alcohol-related problems. However, whilst the majority of included primary studies were in agreement with this definition, reviews were not excluded if the authors had evaluated brief interventions of longer exposure. Characteristics of evaluated brief intervention are reported for each included review. As defined previously (Raistrick et al., 2006), brief interventions are delivered by non-specialist personnel to recipients who may have been identified ‘opportunistically’ (ie. identified as having a potential alcohol problem when attending for other, non-alcohol-related reasons). The focus of this review included brief interventions for alcohol misuse delivered by both health and non-health professionals in any setting. Comparators Usual practice, related intervention, or no intervention
Screening and brief interventions: Cost effectiveness review
188
Outcomes Costs, quality adjusted life years (thus incremental cost effectiveness ratios) and other economic outcomes. Study types Cost effectiveness, cost utility and cost consequence studies were included. Exclusion criteria Exclusion criteria were applied as described above.
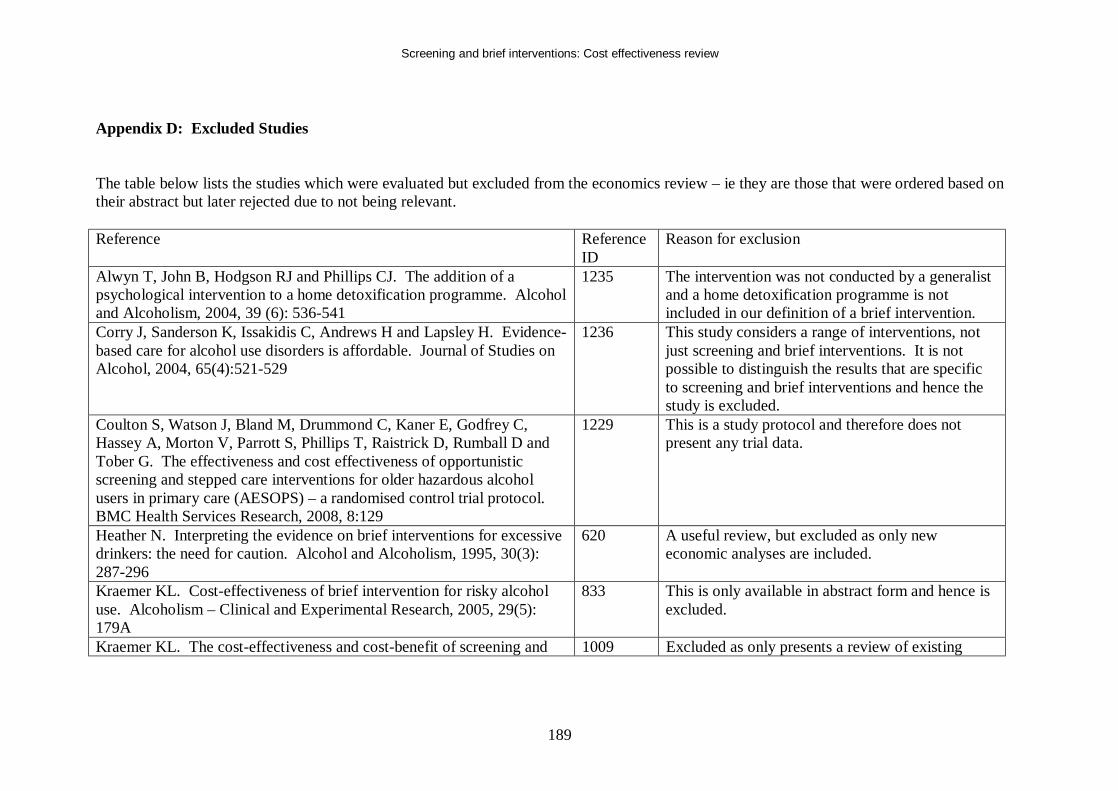
Screening and brief interventions: Cost effectiveness review
189
Appendix D: Excluded Studies The table below lists the studies which were evaluated but excluded from the economics review – ie they are those that were ordered based on their abstract but later rejected due to not being relevant. Reference Reference
ID Reason for exclusion
Alwyn T, John B, Hodgson RJ and Phillips CJ. The addition of a psychological intervention to a home detoxification programme. Alcohol and Alcoholism, 2004, 39 (6): 536-541
1235 The intervention was not conducted by a generalist and a home detoxification programme is not included in our definition of a brief intervention.
Corry J, Sanderson K, Issakidis C, Andrews H and Lapsley H. Evidence-based care for alcohol use disorders is affordable. Journal of Studies on Alcohol, 2004, 65(4):521-529
1236 This study considers a range of interventions, not just screening and brief interventions. It is not possible to distinguish the results that are specific to screening and brief interventions and hence the study is excluded.
Coulton S, Watson J, Bland M, Drummond C, Kaner E, Godfrey C, Hassey A, Morton V, Parrott S, Phillips T, Raistrick D, Rumball D and Tober G. The effectiveness and cost effectiveness of opportunistic screening and stepped care interventions for older hazardous alcohol users in primary care (AESOPS) – a randomised control trial protocol. BMC Health Services Research, 2008, 8:129
1229 This is a study protocol and therefore does not present any trial data.
Heather N. Interpreting the evidence on brief interventions for excessive drinkers: the need for caution. Alcohol and Alcoholism, 1995, 30(3): 287-296
620 A useful review, but excluded as only new economic analyses are included.
Kraemer KL. Cost-effectiveness of brief intervention for risky alcohol use. Alcoholism – Clinical and Experimental Research, 2005, 29(5): 179A
833 This is only available in abstract form and hence is excluded.
Kraemer KL. The cost-effectiveness and cost-benefit of screening and 1009 Excluded as only presents a review of existing
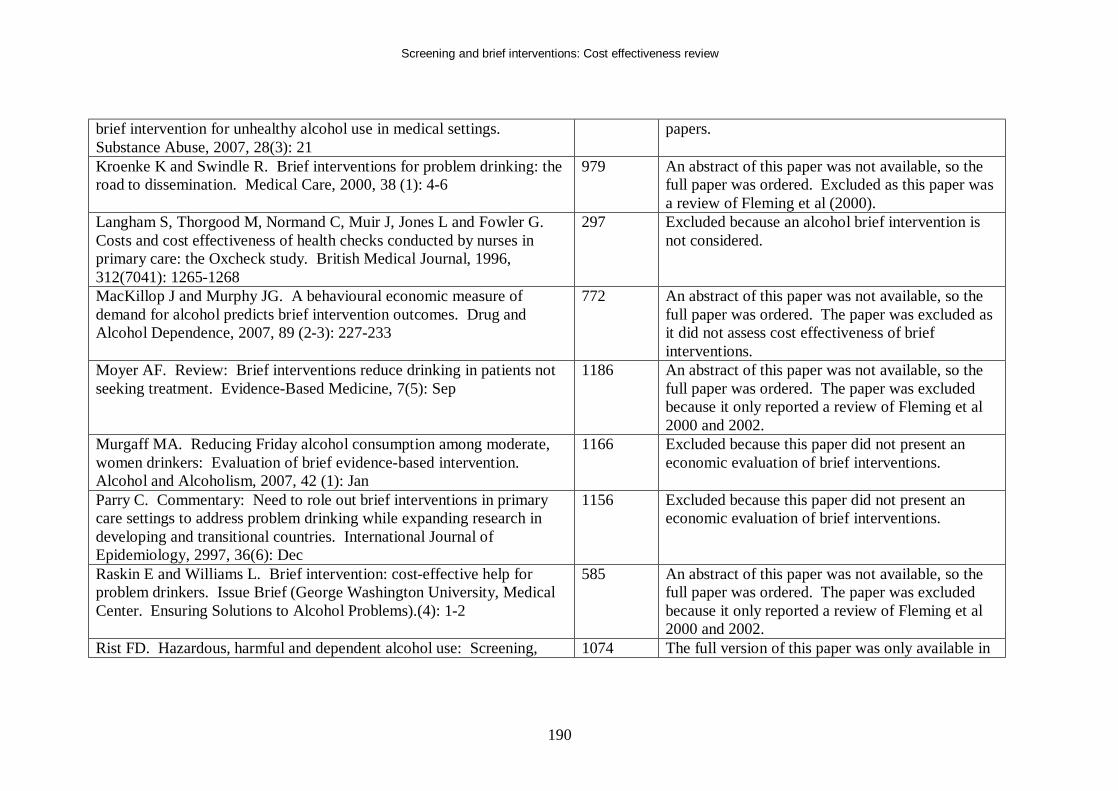
Screening and brief interventions: Cost effectiveness review
190
brief intervention for unhealthy alcohol use in medical settings. Substance Abuse, 2007, 28(3): 21
papers.
Kroenke K and Swindle R. Brief interventions for problem drinking: the road to dissemination. Medical Care, 2000, 38 (1): 4-6
979 An abstract of this paper was not available, so the full paper was ordered. Excluded as this paper was a review of Fleming et al (2000).
Langham S, Thorgood M, Normand C, Muir J, Jones L and Fowler G. Costs and cost effectiveness of health checks conducted by nurses in primary care: the Oxcheck study. British Medical Journal, 1996, 312(7041): 1265-1268
297 Excluded because an alcohol brief intervention is not considered.
MacKillop J and Murphy JG. A behavioural economic measure of demand for alcohol predicts brief intervention outcomes. Drug and Alcohol Dependence, 2007, 89 (2-3): 227-233
772 An abstract of this paper was not available, so the full paper was ordered. The paper was excluded as it did not assess cost effectiveness of brief interventions.
Moyer AF. Review: Brief interventions reduce drinking in patients not seeking treatment. Evidence-Based Medicine, 7(5): Sep
1186 An abstract of this paper was not available, so the full paper was ordered. The paper was excluded because it only reported a review of Fleming et al 2000 and 2002.
Murgaff MA. Reducing Friday alcohol consumption among moderate, women drinkers: Evaluation of brief evidence-based intervention. Alcohol and Alcoholism, 2007, 42 (1): Jan
1166 Excluded because this paper did not present an economic evaluation of brief interventions.
Parry C. Commentary: Need to role out brief interventions in primary care settings to address problem drinking while expanding research in developing and transitional countries. International Journal of Epidemiology, 2997, 36(6): Dec
1156 Excluded because this paper did not present an economic evaluation of brief interventions.
Raskin E and Williams L. Brief intervention: cost-effective help for problem drinkers. Issue Brief (George Washington University, Medical Center. Ensuring Solutions to Alcohol Problems).(4): 1-2
585 An abstract of this paper was not available, so the full paper was ordered. The paper was excluded because it only reported a review of Fleming et al 2000 and 2002.
Rist FD. Hazardous, harmful and dependent alcohol use: Screening, 1074 The full version of this paper was only available in
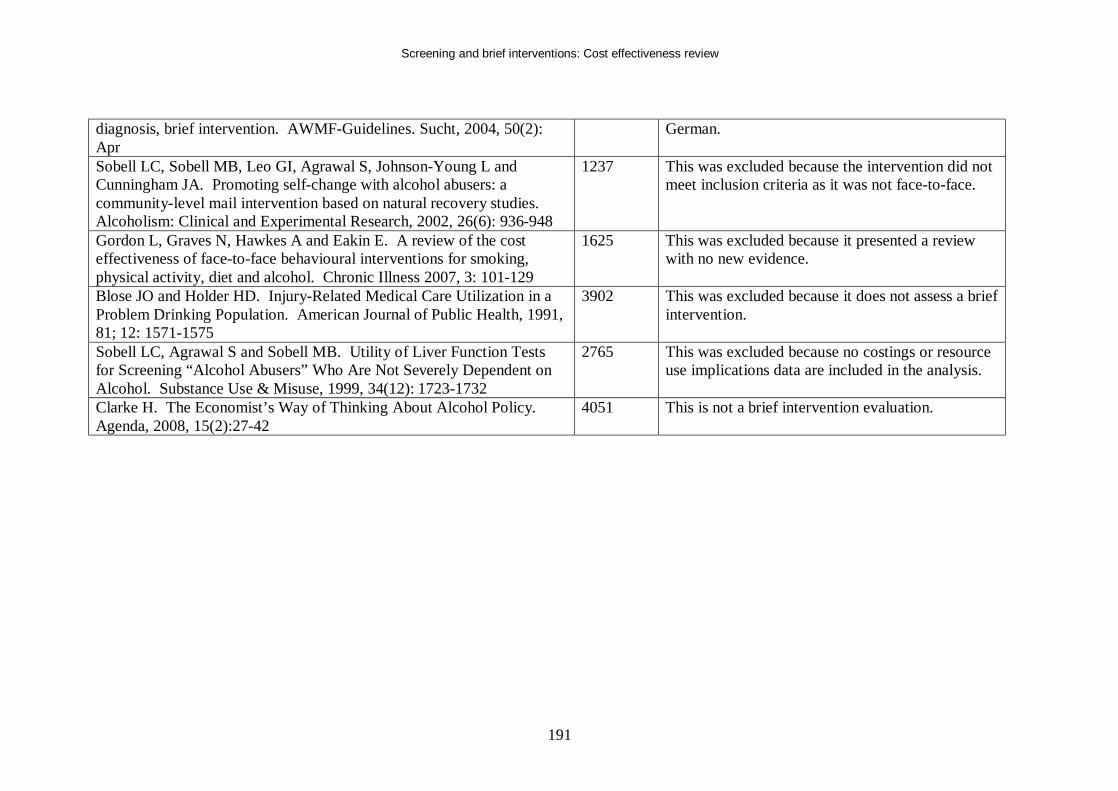
Screening and brief interventions: Cost effectiveness review
191
diagnosis, brief intervention. AWMF-Guidelines. Sucht, 2004, 50(2): Apr
German.
Sobell LC, Sobell MB, Leo GI, Agrawal S, Johnson-Young L and Cunningham JA. Promoting self-change with alcohol abusers: a community-level mail intervention based on natural recovery studies. Alcoholism: Clinical and Experimental Research, 2002, 26(6): 936-948
1237 This was excluded because the intervention did not meet inclusion criteria as it was not face-to-face.
Gordon L, Graves N, Hawkes A and Eakin E. A review of the cost effectiveness of face-to-face behavioural interventions for smoking, physical activity, diet and alcohol. Chronic Illness 2007, 3: 101-129
1625 This was excluded because it presented a review with no new evidence.
Blose JO and Holder HD. Injury-Related Medical Care Utilization in a Problem Drinking Population. American Journal of Public Health, 1991, 81; 12: 1571-1575
3902 This was excluded because it does not assess a brief intervention.
Sobell LC, Agrawal S and Sobell MB. Utility of Liver Function Tests for Screening “Alcohol Abusers” Who Are Not Severely Dependent on Alcohol. Substance Use & Misuse, 1999, 34(12): 1723-1732
2765 This was excluded because no costings or resource use implications data are included in the analysis.
Clarke H. The Economist’s Way of Thinking About Alcohol Policy. Agenda, 2008, 15(2):27-42
4051 This is not a brief intervention evaluation.
Screening and brief interventions: Cost effectiveness review
192
Appendix E: Search 1 –Reference Manager. 1a. All indexed fields, title primary and keywords for cost* OR economic*. 1b. Keyword search for: (Alcoholic Beverages/ec [Economics]) OR (Alcohol Drinking .economics .epidemiology .prevention & control) OR (Alcohol Drinking .economics .epidemiology .therapy) OR (Alcoholic Intoxication/ec [Economics]) OR (Alcoholism .economics .rehabilitation) OR (Alcoholism/ec [Economics]) OR (Ambulatory Care/ec [Economics]) OR (Alcohol Drinking/ec [Economics]) OR (Anxiety Disorders/ec [Economics]) OR (Behavior Therapy .economics .methods) OR (behavioral economics) OR (BENEFIT-COST-ANALYSIS) OR (Brief/ec [Economics]) OR (Cardiovascular Diseases/ec [Economics]) OR (Cognitive Therapy/ec [Economics]) OR (Coloring Agents .economics) OR (Commerce .economics) OR (Commerce/ec [Economics]) OR (Community Mental Health Services/ec [Economics]) OR (Computer-Assisted Instruction/ec [Economics]) OR (Continuing/ec [Economics]) OR (Cost) OR (cost-benefit-analysis) OR (Cost-Benefit Analysis) OR (Cost-Benefit Analysis .methods) OR (Cost-Benefit Analysis/ec [Economics]) OR (Cost-Benefit Analysis/mt [Methods]) OR (Cost-Benefit Analysis/sn [Statistics & Numerical Data]) OR (COST-EFFECTIVENESS) OR (Cost Benefit Analysis) OR (Cost Control) OR(Cost effectiveness) OR (Cost Effectiveness Analysis) OR (Cost of Illness) OR (Cost Savings) OR (Cost Savings/sn [Statistics & Numerical Data]) OR (Cost Utility Analysis) OR (COSTS) OR (Costs and Cost Analysis) OR (Costs and Cost Analysis/ec [Economics]) OR (Counseling/ec [Economics]) OR (Crisis Intervention/ec [Economics]) OR (Economic) OR (ECONOMIC-EVALUATION) OR (Economic Aspect) OR (Economic Evaluation) OR (Economics) OR (Emergency Medical Services .economics) OR (Emergency Medical Services/ec [Economics]) OR (Employee/ec [Economics]) OR (Employment/ec [Economics]) OR (Ethanol .economics) OR (Evidence-Based Medicine/ec [Economics]) OR (Family Practice/ec [Economics]) OR (Family Therapy/ec [Economics]) OR (Reimbursement/ec [Economics]) OR (Randomized Controlled Trials as Topic/ec [Economics]) OR (Referral and Consultation/ec [Economics]) OR (Group/ec [Economics]) OR (health care cost) OR (Health Care Costs) OR (Health Care Costs/sn [Statistics & Numerical Data]) OR (Health Care Rationing/ec [Economics]) OR (Health Education .economics .methods .organization & administration) OR (Health Education/ec [Economics]) OR (Health Expenditures) OR (Health Expenditures/sn [Statistics & Numerical Data]) OR (Health Maintenance Organizations .economics) OR (Health Maintenance Organizations/ec [Economics]) OR (Health Policy/ec [Economics]) OR (Health Promotion .economics) OR (Health Promotion .economics .methods) OR (Health Promotion/ec [Economics]) OR (Health Resources/ec [Economics]) OR (Health Services Accessibility/ec [Economics]) OR (Health Services Research/ec [Economics]) OR (Health Services/ec [Economics]) OR (Health/ec [Economics]) OR (Hospital/ec [Economics]) OR (Hospitalization/ec [Economics]) OR (Insurance Benefits/ec [Economics]) OR (Insurance Coverage/ec [Economics]) OR (Internet/ec [Economics]) OR (Length of Stay/ec [Economics]) OR (Liver Function Tests/ec [Economics]) OR (Managed Care Programs/ec [Economics]) OR (Marketing of Health Services .economics .methods) OR (Marketing of Health Services/ec [Economics]) OR (Mass Screening .economics .methods) OR (Mass Screening .economics .methods .standards) OR (Mass Screening/ec [Economics]) OR (Medical Audit/ec [Economics]) OR (Mental Disorders/ec [Economics]) OR (Mental Health Services/ec [Economics]) OR (Methanol .economics) OR (Mood Disorders/ec [Economics]) OR (Nursing Assessment/ec [Economics]) OR (Patient Education .economics .methods) OR (Patient Education as Topic .economics .methods) OR (Patient Education as Topic/ec [Economics]) OR (Preoperative Care/ec [Economics]) OR (Preventive Health Services/ec [Economics]) OR (Primary Health Care/ec [Economics]) OR (Psychiatric/ec [Economics]) OR (Psychoses,Alcoholic/ec [Economics]) OR (Psychotherapy,Brief .economics) OR (Psychotherapy,Brief .economics .methods) OR (Public Health/ec [Economics]) OR (Quality-Adjusted Life Years) OR (Quality Adjusted Life Year) OR (Quality of Life) OR (Questionnaires/ec [Economics]) OR (Resource Allocation/ec [Economics]) OR (Self Care/ec [Economics]) OR (Social Problems/ec [Economics]) OR (Staining and Labeling .economics .methods .standards) OR (State Medicine/ec [Economics])
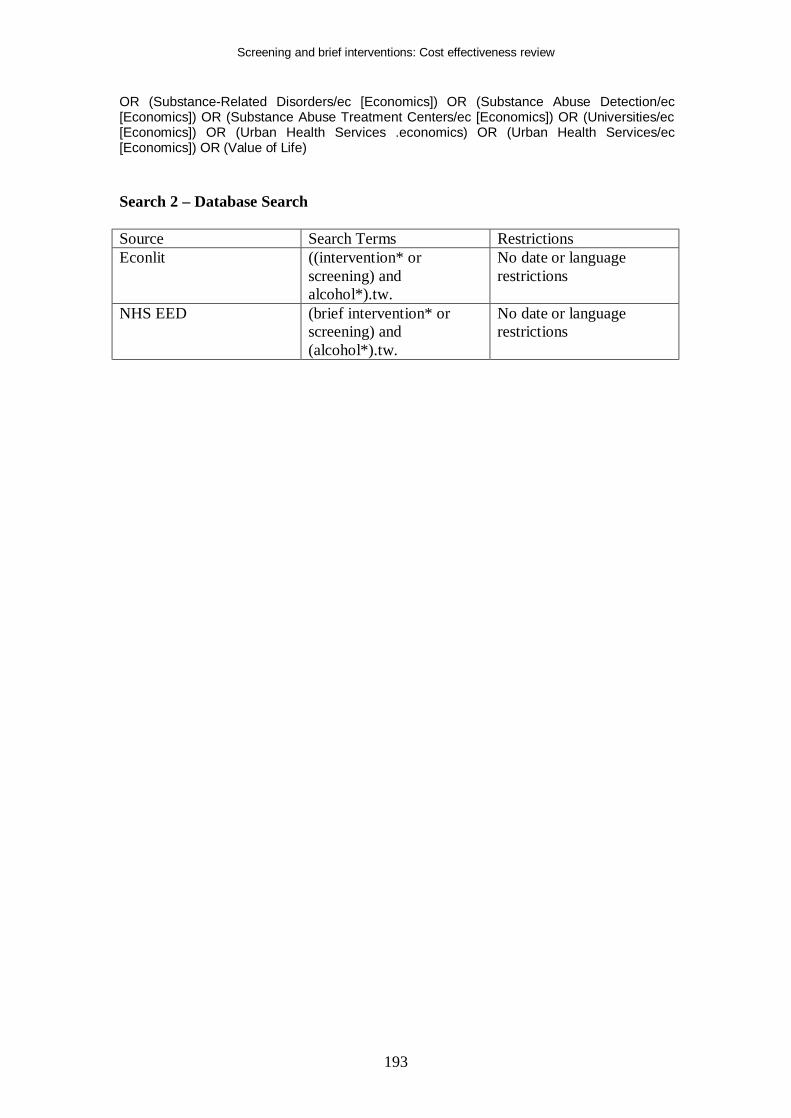
Screening and brief interventions: Cost effectiveness review
193
OR (Substance-Related Disorders/ec [Economics]) OR (Substance Abuse Detection/ec [Economics]) OR (Substance Abuse Treatment Centers/ec [Economics]) OR (Universities/ec [Economics]) OR (Urban Health Services .economics) OR (Urban Health Services/ec [Economics]) OR (Value of Life) Search 2 – Database Search Source Search Terms Restrictions Econlit ((intervention* or
screening) and alcohol*).tw.
No date or language restrictions
NHS EED (brief intervention* or screening) and (alcohol*).tw.
No date or language restrictions
Screening and brief interventions: Cost effectiveness review
194
REFERENCES Aertgeerts, B., Buntinx, F., Ansoms, S., & Fevery, J. 2001, "Screening properties of questionnaires and laboratory tests for the detection of alcohol abuse or dependence in a general practice population.[see comment]", British Journal of General Practice, vol. 51, no. 464, pp. 206-217.
Anderson, P. & Baumberg, B. 2006, Alcohol in Europe: A Public Health Perspective. A Report for the European Commission, Institute of Alcohol Studies, London.
Andreasson, S. Vårdutnuttjande och ekonomiska effekter (Health care utilization and economic effects). Landstingsförbundet . 1995. Stockholm. Ref Type: Generic
Andrews, G., Issakidis, C., Sanderson, K., Corry, J., & Lapsley, H. Utilising survey data to inform public policy: comparison of the cost effectiveness of treatment of ten mental disorders. British Journal of Psychiatry 184, 526-533. 2004. Ref Type: Generic
Babor, T., Caetano, R., Casswell, S., Edwards, G., Giesbrecht, N., Graham, K., Grube, J., Gurenewald, P., Hill, L., Holder, H., Homel, R., Osterberg, E., Rehm J, Room, R., & Rossow, I. Alcohol: No Ordinary Commodity: Research and Public Policy. 2003. New York, Oxford University Press. Ref Type: Generic
Babor, T. F., Higgins-Biddle, J. C., Dauser, D., Burleson, J. A., Zarkin, G. A., & Bray, J. 2006, "Brief interventions for at-risk drinking: patient outcomes and cost-effectiveness in managed care organizations", Alcohol & Alcoholism, vol. 41, no. 6, pp. 624-631.
Bien, T. H., Miller, W. R., & Tonigan, J. S. 1993, "Brief interventions for alcohol problems: a review.[see comment]. [Review] [85 refs]", Addiction, vol. 88, no. 3, pp. 315-335.
Chick, J., Lloyd, G., & Crombie, E. Counselling problem drinkers in medical wards: a controlled study. British Medical Journal 290[6473], 965-967. 1985. Ref Type: Generic
Chisholm, D., Rehm, J., an Ommeren, M., & Monteiro, M. A comparative cost effectiveness analysis. Journal of Studies on Alcohol 65, 782-793. 2004. Ref Type: Journal (Full)
Coulton, S., Drummond, C., James, D., Godfrey, C., Bland, J. M., Parrott, S., Peters, T., & Stepwice Research Team. 2006, "Opportunistic screening for alcohol use disorders in primary care: comparative study.[see comment]", BMJ, vol. 332, no. 7540, pp. 511-517.
Cuijpers, P., Riper, H., & Lemmers, L. 2004b, "The effects on mortality of brief interventions for problem drinking: a meta-analysis", Addiction, vol. 99, no. 7, pp. 839-845.
Screening and brief interventions: Cost effectiveness review
195
Curtis, L. Unit Costs of Health and Social Care 2007. Personal Social Services Research Unit. 2008. University of Kent. Ref Type: Generic
D'Onofrio, G., & Degutis, L. C. 2002, "Preventive care in the emergency department: screening and brief intervention for alcohol problems in the emergency department: a systematic review. [Review] [73 refs]", Acad.Emerg.Med., vol. 9, no. 6, pp. 627-638.
Department of Health. National Schedule of Reference Costs 2006-07 for NHS Trusts. 2008. Ref Type: Generic
Dillie, K. S., Mundt, M., French, M. T., & Fleming, M. F. 2005, "Cost-benefit analysis of a new alcohol biomarker, carbohydrate deficient transferrin, in a chronic illness primary care sample", Alcoholism: Clinical & Experimental Research, vol. 29, no. 11, pp. 2008-2014.
Downs, S. & Klein, J. Clinical Preventive Services Efficacy and Adolescents' Risky Behaviours. Archives of Pediatrics and Adolescent Medicine 149[4], 374-379. 1995. Ref Type: Generic
English, D. R., Holman, C. D. J., Milne, E., Winter, M. G., Hulse, G. K., Codde, J. P., Bower, C. I., Cort, B., de Klerk, N., Knuiman, M. W., Kurinczul, J. J., Lewin, G. F., & Ryan, G. A. The quantification of drug caused morbidity and mortality in Australia. 1995. Canberra, Commonwealth Department of Human Services and Health. Ref Type: Generic
Fleming, M., & Mundt, M. 2004, "Carbohydrate-deficient transferrin: validity of a new alcohol biomarker in a sample of patients with diabetes and hypertension", Journal of the American Board of Family Practice, vol. 17, no. 4, pp. 247-255.
Fleming, M. F., Barry, K. L., Manwell, L. B., Johnson, K., & London, R. 1997, "Brief physician advice for problem alcohol drinkers. A randomized controlled trial in community-based primary care practices.[see comment]", JAMA, vol. 277, no. 13, pp. 1039-1045.
Fleming, M. F., Mundt, M. P., French, M. T., Manwell, L. B., Stauffacher, E. A., & Barry, K. L. 2000, "Benefit-cost analysis of brief physician advice with problem drinkers in primary care settings.[see comment]", Medical Care, vol. 38, no. 1, pp. 7-18.
Fleming, M. F., Mundt, M. P., French, M. T., Manwell, L. B., Stauffacher, E. A., & Barry, K. L. 2002, "Brief physician advice for problem drinkers: long-term efficacy and benefit-cost analysis.[see comment]", Alcoholism: Clinical & Experimental Research, vol. 26, no. 1, pp. 36-43.
Freeborn, D. K., Polen, M. R., Hollis, J. F., & Senft, R. A. 2000, "Screening and brief intervention for hazardous drinking in an HMO: effects on medical care utilization", Journal of Behavioral Health Services & Research, vol. 27, no. 4, pp. 446-453.
Screening and brief interventions: Cost effectiveness review
196
Freemantle, N., Gill, P., Godfrey, C., Long, A., Richards, C., Sheldon, T. A., Song, F., & Webb, J. 1993, "Brief interventions and alcohol use. [Review] [88 refs]", Quality in Health Care, vol. 2, no. 4, pp. 267-273.
Gentilello, L. M., Ebel, B. E., Wickizer, T. M., Salkever, D. S., & Rivara, F. P. 2005, "Alcohol interventions for trauma patients treated in emergency departments and hospitals: a cost benefit analysis", Annals of Surgery, vol. 241, no. 4, pp. 541-550.
Gentilello, L. M., Rivara, F. P., Donovan, D. M., Jurkovich, G. J., Daranciang, E., Dunn, C. W., Villaveces, A., Copass, M., & Ries, R. R. 1999, "Alcohol interventions in a trauma center as a means of reducing the risk of injury recurrence", Annals of Surgery, vol. 230, no. 4, pp. 473-480.
Harwood, H. Updating estimates of the economic costs of alcohol abuse in the United States: estimates, update methods, and data. 2000. Rockville MD, National Institutes of Health. Ref Type: Generic
Hermansson, U., Helander, A., Huss, A., Brandt, L., & Ronnberg, S. 2000, "The Alcohol Use Disorders Identification Test (AUDIT) and carbohydrate-deficient transferrin (CDT) in a routine workplace health examination", Alcoholism: Clinical & Experimental Research, vol. 24, no. 2, pp. 180-187.
Higgins-Biddle, J. & Babor, T. Reducing risky drinking. 1996. Farmington, University of Connecticut Health Center. Ref Type: Generic
Holder, H., Longabaugh, R., Miller, W. R., & Rubonis, A. V. The Cost Effectiveness of Treatment for Alcoholism: A First Approximation. Journal of Studies on Alcohol 52[6], 517-540. 1991. Ref Type: Generic
Kaner, E. F. S. 2007, "Brief interventions in primary care for alcohol misuse: Cochrane review", International Journal of Epidemiology, vol. 36, no. 6, p. Dec.
Kraemer, K. L., Roberts, M. S., Horton, N. J., Palfai, T., Samet, J. H., Freedner, N., Tibbetts, N., & Saitz, R. Health utility ratings for a spectrum of alcohol-related health states. Medical Care 43, 541-550. 2005. Ref Type: Generic
Kunz, F. M., French, M. T., & Bazargan-Hejazi, S. 2004, "Cost-effectiveness analysis of a brief intervention delivered to problem drinkers presenting at an inner-city hospital emergency department", Journal of Studies on Alcohol, vol. 65, no. 3, pp. 363-370.
Lindholm, L. & Lindholm, L. 1998c, "Alcohol advice in primary health care--is it a wise use of resources?", Health Policy, vol. 45, no. 1, pp. 47-56.
Lock, C. A., Kaner, E., Heather, N., Doughty, J., Crawshaw, A., McNamee, P., Purdy, S., & Pearson, P. 2006, "Effectiveness of nurse-led brief alcohol intervention: a cluster randomized controlled trial", Journal of Advanced Nursing, vol. 54, no. 4, pp. 426-439.
Screening and brief interventions: Cost effectiveness review
197
Ludbrook, A. 2004, Effective and Cost Effective Measures to reduce Alcohol Misuse in Scotland: An Update to the Literature Review, Scottish Executive.
Ludbrook, A., Godfrey, C., Wyness, L., Parrott, S., Haw, S., Napper, M., & van Teijlingen, E. 2001, Effective and Cost Effective Measures to Reduce Alcohol Misuse in Scotland, Scottish Executive.
Mortimer, D., & Segal, L. 2005, "Economic evaluation of interventions for problem drinking and alcohol dependence: cost per QALY estimates", Alcohol & Alcoholism, vol. 40, no. 6, pp. 549-555.
Mortimer, D., & Segal, L. 2006, "Economic evaluation of interventions for problem drinking and alcohol dependence: do within-family external effects make a difference?", Alcohol & Alcoholism, vol. 41, no. 1, pp. 92-98.
Moyer, A., Finney, J. W., Swearingen, C. E., & Vergun, P. 2002, "Brief interventions for alcohol problems: a meta-analytic review of controlled investigations in treatment-seeking and non-treatment-seeking populations.[see comment]. [Review] [100 refs]", Addiction, vol. 97, no. 3, pp. 279-292.
Mundt, French, M. T., Roebuck, M. C., Marwell, L. B., & Barry, K. L. Brief Physician Advice for Problem Drinking among Older Adults: An Economic Analysis of Costs and Benefits. Journal of Studies on Alcohol 66, 389-394. 2005. Ref Type: Generic
National Center for Chronic Disease Prevention and Health Promotion. Alcohol-Related Disease Impact (ARDI) website. 2008. Ref Type: Generic
Office of National Statistics. Life Expectancy. 2008. Ref Type: Generic
Rehm, J., Rehn, N., Room, R., Monteiro, M., Gmel, G., Jernigan, D., & Frick, U. The global distribution of average volume of alcohol consumption and patterns of drinking. European Addiction Research 9, 147-156. 2003a. Ref Type: Generic
Rehm, J., Room, R., Monteiro M, Gmel, G., & Rehn, N. Alcohol as a risk factor for global burden of disease. European Addiction Research 9, 157-164. 2003b. Ref Type: Generic
Ryder, D. E. 2000, "Screening for alcohol related problems in general hospitals: The costs and savings of brief intervention", Journal of Substance Use, vol. 4, no. 4, p. 2000.
Saitz, R., Svikis, D., D'Onofrio, G., Kraemer, K. L., & Perl, H. 2006, "Challenges applying alcohol brief intervention in diverse practice settings: populations, outcomes, and costs", Alcoholism: Clinical & Experimental Research, vol. 30, no. 2, pp. 332-338.
Saunders, J., Hanratty, S. J., Burns, F. H., Douglas, A., Clarke, J. I., & Reznik, R. B. Successful early intervention for harmful alcohol consumption: results from the
Screening and brief interventions: Cost effectiveness review
198
WHO randomised controlled trial on alcohol and other drugs. Autumn School of Studies proceedings , 183-192. 1991. Ref Type: Generic
Senft, R. A., Polen, M. R., Freeborn, D. K., Hollis, J. F., Senft, R. A., Polen, M. R., Freeborn, D. K., & Hollis, J. F. 1997, "Brief intervention in a primary care setting for hazardous drinkers", American Journal of Preventive Medicine, vol. 13, no. 6, pp. 464-470.
Shakeshaft, A. P., Bowman, J. A., Burrows, S., Doran, C. M., & Sanson-Fisher, R. W. 2002, "Community-based alcohol counselling: a randomized clinical trial", Addiction, vol. 97, no. 11, pp. 1449-1463.
Solberg, L. I., Maciosek, M. V., & Edwards, N. M. Primary Care Intervention to Reduce Alcohol Misuse: Ranking Its Health Impact and Cost Effectiveness. American Journal of Preventive Medicine 34[2], 143-152. 2008a. Ref Type: Generic
Solberg, L. I., Maciosek, M. V., & Edwards, N. M. Primary care intervention to reduce alcohol misuse: ranking its health impact and cost effectiveness. American Journal of Preventive Medicine 34[4], 143-152. 2008b. Ref Type: Journal (Full)
Stouthard, M. E., Essink-Bot, M. L., & Bonsel, G. L. Disability weights for diseases: A modified protocol and results for a Western European region. European Journal of Public Health 10, 24-30. 2000. Ref Type: Generic
Tolley, K. & Rowland, N. Identification of alcohol-related problems in a general hospital setting: a cost-effectiveness evaluation. British Journal of Addiction 86, 429-438. 1991. Ref Type: Generic
Vasilaki, E. I., Hosier, S. G., & Cox, W. M. 2006, "The efficacy of motivational interviewing as a brief intervention for excessive drinking: a meta-analytic review. [Review] [49 refs]", Alcohol & Alcoholism, vol. 41, no. 3, pp. 328-335.
Wallace, P., Cutler, S., & Haines, A. 1988, "Randomised controlled trial of general practitioner intervention in patients with excessive alcohol consumption", BMJ, vol. 297, no. 6649, pp. 663-668.
Wilk, A. I., Jensen, N. M., & Havighurst, T. C. 1997, "Meta-analysis of randomized control trials addressing brief interventions in heavy alcohol drinkers", Journal of General Internal Medicine, vol. 12, no. 5, pp. 274-283.
Wutzke, S. E., Shiell, A., Gomel, M. K., & Conigrave, K. M. 2001c, "Cost effectiveness of brief interventions for reducing alcohol consumption", Soc.Sci.Med., vol. 52, no. 6, pp. 863-870.
Zarkin, G. A., Bray, J. W., Davis, K. L., Babor, T. F., & Higgins-Biddle, J. C. 2003, "The costs of screening and brief intervention for risky alcohol use", J Stud.Alcohol, vol. 64, no. 6, pp. 849-857.

Screening and brief interventions: Cost effectiveness review
199