the incidence of public spending on healthcare: comparative evidence from asia
TRANSCRIPT

The Incidence of Public Spending on Healthcare:Comparative Evidence from Asia
Owen O’Donnell, Eddy van Doorslaer, Ravi P. Rannan-Eliya,Aparnaa Somanathan, Shiva Raj Adhikari, Deni Harbianto,
Charu C. Garg, Piya Hanvoravongchai, Mohammed N. Huq,Anup Karan, Gabriel M. Leung, Chiu Wan Ng, Badri Raj Pande,
Keith Tin, Kanjana Tisayaticom, Laksono Trisnantoro,Yuhui Zhang, and Yuxin Zhao
The article compares the incidence of public healthcare across 11 Asian countries andprovinces, testing the dominance of healthcare concentration curves against an equaldistribution and Lorenz curves and across countries. The analysis reveals that thedistribution of public healthcare is prorich in most developing countries. That distri-bution is avoidable, but a propoor incidence is easier to realize at higher nationalincomes. The experiences of Malaysia, Sri Lanka, and Thailand suggest that increas-ing the incidence of propoor healthcare requires limiting the use of user fees, orprotecting the poor effectively from them, and building a wide network of healthfacilities. Economic growth may not only relax the government budget constraint onpropoor policies but also increase propoor incidence indirectly by raising richerindividuals’ demand for private sector alternatives. JEL Codes: H22, H42, H51.
Owen O’Donnell (corresponding author) is an assistant professor of quantitative methods at the
University of Macedonia, Greece; his email address is [email protected]. Eddy van Doorslaer is a professor
of health economics at Erasmus University, the Netherlands; his email address is [email protected].
nl. Ravi P. Rannan-Eliya is director of the Institute for Health Policy in Sri Lanka; his email address is
[email protected]. Aparnaa Somanathan is a fellow at the Institute for Health Policy, Sri Lanka; her email
address is [email protected]. Badri Raj Pande is the director of the Nepal Health Economics Association;
his email address is [email protected]. Shiva Raj Adhikari is a researcher at the Nepal Health
Economics Association; his email address is [email protected]. Laksono Trisnantoro is a
professor of health policy at Gadjah Mada University, Indonesia; his email address is trisnantoro@
yahoo.com. Deni Harbianto is a researcher at Gadjah Mada University, Indonesia; his email address is
[email protected]. Charu C. Garg is a health economist at the World Health Organization; her
email address is [email protected]. Piya Hanvoravongchai is a researcher at the International Health Policy
Programme, Thailand; his email address is [email protected]. Kanjana Tisayaticom is a
researcher at the International Health Policy Programme, Thailand; her email address is kanjana@ihpp.
thaigov.net. Mohammed N. Huq is a lecturer at Jahangirnagar University, Bangladesh; his email
address is [email protected]. Anup Karan is a Takemi Fellow at the Harvard School of
Public Health; his email address is [email protected]. Gabriel M. Leung is a professor of
THE WORLD BANK ECONOMIC REVIEW, VOL. 21, NO. 1, pp. 93–123 doi:10.1093/wber/lhl009Advance Access Publication 24 January 2007# The Author 2007. Published by Oxford University Press on behalf of the International Bankfor Reconstruction and Development / THE WORLD BANK. All rights reserved. For permissions,please e-mail: [email protected]
93

Propoor public spending on healthcare and other services is a stated objectiveof national governments and international agencies. It is central to the missionof the World Bank and is a key component of the Heavily Indebted PoorCountries Initiative and the International Monetary Fund’s Poverty Reductionand Growth Facility. Motivations include redressing inequity in the distributionof healthcare, reducing health inequality, and raising the human capital of thepoor and thereby the growth potential of the economy. In low-incomecountries, where administrative constraints on redistribution through cashtransfers are particularly binding, a subsidiary justification for public spendingon healthcare may be the alleviation of poverty and the reduction of inequality(Besley and Coate 1991). The validity of these arguments for public spendingon healthcare rests on the empirical question of whether the spending is in facttargeted to the poor.
Benefit incidence analysis identifies the recipients of public spending inrelation to their position in the income distribution. Benefit incidence studies,many conducted by the World Bank, generally find that public spending onhealthcare in developing countries is not concentrated on the poor (van deWalle 1995; Castro-Leal and others 2000; Mahal and others 2000; Sahn andYounger 2000; Filmer 2003). Most of these studies have been conducted on anad hoc basis, with relatively little attention to consistency in methods.Limitations in the comparability of the evidence make it difficult to drawlessons about the economic, political, and health system characteristics thatexplain greater and lesser success in targeting health spending to the poor.
This article presents comparable evidence on the incidence of public healthspending using consistent methods across eight Asian countries (Bangladesh,India, Indonesia, Malaysia, Nepal, Sri Lanka, Thailand, and Vietnam) andthree Chinese provinces or regions (Gansu, Heilongjiang, and Hong KongSpecial Administrative Region). Dominance tests are used to determinewhether the distribution of public healthcare deviates significantly from perfectequality. Many indicators show that poorer individuals are generally lesshealthy (Gwatkin and others 2003) and, one may presume, in greater need ofhealthcare. From an egalitarian perspective an equitable distribution of health-care demands that resources be concentrated on the poor. Evidence that the
translational public health at the University of Hong Kong; his email address is [email protected]. Keith
Tin is a researcher at the University of Hong Kong; his email address is [email protected]. Chiu
Wan Ng is a lecturer at the University of Malaya, Malaysia; her email address is chiuwan.ng@ummc.
edu.my. Yuxin Zhao is a professor of health economics at the National Health Economics Institute,
China; her email address is [email protected]. Yuhui Zhang is a researcher at the National
Health Economics Institute, China; his email address is [email protected]. The authors thank three
anonymous referees and the editor for valuable comments. The European Commission International
Research Cooperation with Developing Countries (INCO-DEV) program (ICA4-CT-2001-10015)
funded the Equity in Asia–Pacific Health Systems (Equitap) project from which this article derives. The
Health, Welfare, and Food Bureau of the government of the Hong Kong Special Administrative Region
funded the analysis for Hong Kong. A supplemental appendix to this article is available at http://wber.
oxfordjournals.org/.
94 T H E W O R L D B A N K E C O N O M I C R E V I E W

poor do not receive their population share of health spending would be suffi-cient to reject equity in the allocation of public healthcare. While the main jus-tification for public provision of healthcare is likely to be its impact on thelevel and distribution of population health, redistribution of living standardsmay be a further motivation in largely informal economies that are constrainedin the execution of tax and cash transfer policies.1 To assess the redistributiveimpact of public health spending, its distribution is compared with the Lorenzcurve of household income.
One limitation of many previous benefit incidence studies is the crudeness ofthe unit cost data used to value services (van de Walle 1998; Sahn andYounger 2000). This study derives costs from detailed health accounts, avail-able for most of the countries and provinces, which document public expendi-tures across health services, facilities, and regions. This allows examination ofwhether conclusions about the incidence of public healthcare are sensitive toanalysis of use or expenditure data.
Data and methods are described in the next section and results are presentedand discussed in section II. The findings are summarized in section III.
I . D A T A A N D M E T H O D S
The objective is to estimate and assess the distribution of public healthcare inrelation to economic status. For each country data are from recent health orsocioeconomic surveys that provide information on both use of public health-care and a suitable measure of living standards (see table S-1 in the supplemen-tal appendix, available at http://wber.oxfordjournals.org/). All are nationallyrepresentative except for the surveys of Chinese provinces. The preferred proxyfor living standards is household (per adult equivalent) consumption, whichincludes the value of goods produced by the household for its own consump-tion and a use-value of housing and durable goods.2 Household expenditure,rather than consumption, is used for Hong Kong SAR, where householdproduction is much less significant. For Malaysia the only available measure ofliving standards included in the health survey is household income, which islikely to understate the living standards of rural households. It is, however, themeasure that has been used in previous incidence studies of Malaysia(Meerman 1979; Hammer, Nabi, and Cercone 1995).
Distributions of three categories of public healthcare—hospital inpatientcare, hospital outpatient care, and nonhospital care—are examined.
1. In Latin America cash transfers are increasingly used to affect the distribution of income, as well
as that of health and education services, but this is less so in the low-income economies of Asia, where
in-kind transfers, such as healthcare, continue to predominate.
2. The equivalence scale used is eh ¼ (Ahþ 0.5Kh)0.75, where Ah is the number of adults in
household h, and Kh is the number of children 0–14 years old. Parameter values were set on the basis
of estimates summarized in Deaton (1997, pp. 241–70).
O’Donnell and others 95

Nonhospital care is an aggregate of visits to doctors, polyclinics, healthcenters, and antenatal care (table S-2). For inpatient care the recall period is 12months, except in Bangladesh (3 months) and Sri Lanka (2 weeks). For allother care the recall period is generally 2 weeks to 1 month, except inBangladesh where it is 3 months.
Use data do not capture variations in the quality of services received acrossfacilities and geographic locations. This is a potentially important deficiencygiven evidence of marked quality differences favoring richer neighborhoodseven within a single city, such as Delhi, India (Das and Hammer 2005). Theservice-specific non-negative public subsidy received by an individual can bedefined as:
Ski ¼ maxð0; qkickj � fkiÞð1Þ
where qki is the quantity of service k used by individual i, ckj is the unit cost ofproviding k in region j where i resides, and fki is the amount paid for k by i.Where possible, variations in costs by facility (local, district, teaching hospital)and service (inpatient/outpatient) are taken into account. Unit costs are com-puted as:
ckj ¼TREkjP
i[j
qkiwið2Þ
where TREkj is total recurrent public expenditure and wi is an expansion factorthat inflates sample use to population use. The total public subsidy received byan individual is computed as Si ¼
Pk akSki, where the ak terms are scaling
factors that standardize use recall periods across services.National health accounts, available for Bangladesh, the Chinese provinces,
Hong Kong SAR, Sri Lanka, and Thailand, are used to disaggregate expenditurefigures by facility, service, and region. Full accounts are not available for India,Indonesia, Malaysia, Nepal, and Vietnam. For India unit subsidies computed foranother benefit incidence study are used (Mahal and others 2000). These arespecific to 960 subgroups (three facilities, 16 major states, urban–ruralresidence, gender, and five income quintiles). For Indonesia public health expen-diture review figures allow expenditures to be disaggregated for each of 30provinces. For Malaysia expenditure data were disaggregated to five levels ofpublic hospital care, but geographic disaggregation was not undertaken since theuse data could not be analyzed by this dimension. Incomplete health accountsfor Nepal allow disaggregation by hospital and nonhospital care by region. ForVietnam public accounts and hospital costing estimates were used to computeunit costs by service and facility but not by region (World Bank 2001).
Subtraction of the user payment from equation (1) to get the net benefit ofthe service is appropriate provided that quality is not responsive to the
96 T H E W O R L D B A N K E C O N O M I C R E V I E W

payment. This is an untestable assumption with the available data. For China,India, Indonesia, Malaysia, Nepal, and Sri Lanka either the survey data do notcontain information on payments made by individuals for public health ser-vices or the data are not considered sufficiently reliable, for example, becausepayments for public and other care are likely to be confused. For thesecountries it is assumed that all users in a particular region pay the samecharge for a given service. Waiting and travel time also reduce the net benefitfrom care and should, in principle, be valued and subtracted in computing thesubsidy. The survey data do not permit this, however. As a consequence,benefits to the rural poor, in particular, may be overstated to the extentthat they travel long distances to access better quality care. By contrast, thecost of waiting time will be less for the poor if time is valued according towage rates.
The incidence of public healthcare is described by its concentration curve,which plots the cumulative proportion of healthcare use and subsidy againstthe cumulative proportion of the population ranked by household consumptionper adult equivalent. To establish whether the subsidy is propoor, in the sensethat lower income individuals receive more of the subsidy than the better-off, atest is conducted of whether the concentration curve dominates (lies above) the458 line. Whether the poorest 20 percent of individuals consume more than 20percent of healthcare is also tested. Dominance of the concentration curve overthe Lorenz curve of household consumption is tested to establish whetherspending on public healthcare reduces inequality.
For the dominance tests standard errors of the ordinates of curves and ofdifferences in ordinates are computed, allowing for dependence between curveswhere appropriate (Bishop, Chow, and Formby 1994; Davidson and Duclos1997).3 A multiple comparison approach to testing is adopted (Beach andRichmond 1985; Bishop, Formby, and Thistle 1992), with the null defined ascurves being indistinguishable. This is tested against both dominance and cross-ing of curves (Dardanoni and Forcina 1999). The null is rejected in favor ofdominance if there is at least one significant difference between the ordinatesof two curves in one direction and no significant difference in the other direc-tion across 19 evenly spaced quantile points from 0.05 to 0.95. The null isrejected in favor of crossing if there is at least one significant difference in eachdirection. The 5 percent level of significance is used with critical values fromthe studentized maximum modulus distribution to allow for the joint nature ofthe test (Beach and Richmond 1985).4
An alternative dominance test consistent with the intersection–union prin-ciple (Kaur, Rao, and Singh 1994; Howes 1996), which has been used in the
3. The computation is carried out in Stata.
4. Dardanoni and Forcina (1999) show that the probability that this test will falsely reject the null
in favor of dominance does not exceed the significance level and report Monte Carlo evidence
suggesting that the actual significance level is well below its nominal value.
O’Donnell and others 97

benefit incidence literature (Sahn and Younger 2000; Sahn, Younger, andSimler 2000), takes nondominance as the null and tests this against the alterna-tive of strict dominance. This is a conservative test that requires statisticallysignificant differences in ordinates at all points of comparison for the null to berejected. Dardanoni and Forcina (1999) present Monte Carlo evidence showingthat while this test reduces the probability of falsely rejecting nondominance toa negligible value, compared with the multiple comparison approach it hasgreatly reduced power of detecting dominance when true. Given these results,most weight in the discussion below is given to the results from the multiplecomparison tests, but discrepancies with the more conservative intersection–union test are pointed out.
I I . R E S U L T S
In Hong Kong SAR, Malaysia, and Thailand the concentration curve of thetotal public health subsidy dominates both the Lorenz curve and the 458 line ofequality (table 1, final column), indicating that the subsidy is bothinequality-reducing and propoor. With the exception of the comparison withthe 458 line in the case of Thailand, these dominance results are robust to useof the stricter test. In Sri Lanka an equal distribution of the total subsidy is notrejected. In relative terms this shifts the distribution of living standards towardthe poor, as the concentration curve dominates the Lorenz curve. In theremaining countries and provinces the concentration curve of the total subsidyis dominated by the 458 line but, with the exceptions of India and Nepal, dom-inates the Lorenz curve. That is, the subsidy is prorich but inequality reducing.For Bangladesh and the two Chinese provinces nondominance relative to boththe Lorenz curve and the 458 line cannot be rejected when the more conserva-tive intersection–union test is employed.5
The degree to which the public health subsidy is targeted to the poor can beseen more explicitly by examining the share of the subsidy received by thepoorest 20 percent of individuals (table 2). Public healthcare is clearly mostpropoor in Hong Kong SAR, with the poorest fifth of the population receivingalmost two-fifths of the total subsidy (table 2, final column). In Malaysia thepoorest quintile also receives significantly more than 20 percent of the totalsubsidy, but the propoor bias is much less than it is in Hong Kong SAR. In SriLanka and Thailand the poorest quintile’s share of the total subsidy does notdiffer significantly from 20 percent. In the remainder of countries and pro-vinces, with the exception of Bangladesh, the poorest 20 percent of individualsreceive significantly less than 20 percent of the public health subsidy. The sharegoing to the poorest 20 percent of individuals is lowest in Nepal, at less than 7percent, followed by the two Chinese provinces, at 8–10 percent. In these
5. Concentration and Kakwani indices, which provide summary measures of the magnitude by
which the concentration curve deviates from the 458 line and the Lorenz curve, are given in table S-3.
98 T H E W O R L D B A N K E C O N O M I C R E V I E W

TA B L E 1. Tests of Dominance of Concentration Curves for Public Health Service Use and Subsidy against the Lorenz Curveand the 45 Degree Line of Equality
Country, province, or region
Use Subsidy
Hospitalinpatient
Hospitaloutpatient Nonhospital
Hospitalinpatient
Hospitaloutpatient Nonhospital Total
Lorenz 458 Lorenz 458 Lorenz 458 Lorenz 458 Lorenz 458 Lorenz 458 Lorenz 458
Bangladesh 2 þ 2 þ þ 2 þ þ –Gansu, China þ 2* þ* 2 n.a. n.a. þ 2 þ 2 n.a. n.a. þ 2
Heilongjiang, China 2* þ* 2 n.a. n.a. þ 2 þ 2 n.a. n.a. þ 2
Hong Kong SAR þ* þ* þ* þ* þ* þ* þ* þ* þ* þ* þ* þ* þ* þ*India 2* þ* 2* þ* þ 2* þ* þ* þ* 2*Indonesia 2 2* x 2* þ* þ 2* 2* 2 2* þ* þ þ* 2*Malaysia þ* þ þ* þ* þ* þ* þ þ* þ* þ* þ* þ*Nepala þ 2* n.a. n.a. þ* 2 2* n.a. n.a. x 2* x 2*Sri Lanka þ* þ* þ þ* þ* þ* n.a. n.a. þ*Thailand þ* þ* x þ* þ* þ* þ* þ þ* þ* þ* þVietnam þ 2* 2* þ* þ þ* 2 þ 2* þ* þ þ* 2
Blank cell indicates failure to reject the null hypothesis that curves are indistinguishable using the multiple comparison test (Bishop, Formby, andThistle 1992) at the 5 percent significance level.
x indicates rejection of the null hypothesis that curves are indistinguishable in favor of curves crossing using the same test.
þ /2 indicates rejection of the same null hypothesis in favor of dominance using the same test. Aþ indicates that healthcare is more concentrated onthe poor than is household consumption per adult (Lorenz) or equal per capita distribution (458), while a – indicates that it is less concentrated.
*indicates rejection of the null hypothesis of nondominance in favor of an alternative of strict dominance using the intersection–union test (Howes1996) and a 5 percent significance level. Dominance is in the direction indicated by theþ or –, as above.
n.a. means that data were not available to conduct the test.aThe results in the hospital inpatient columns refer to both inpatient and outpatient.
Source: Authors’ calculations based on survey data documented in table S.1 (see supplemental appendix available at http://wber.oxfordjournals.org/).
O’D
onnell
and
oth
ers99

TA B L E 2. Share of Total Household Consumption and Public Healthcare Subsidy Received by Poorest Quintileof Individuals (percent)
Country, province,or region
Household consumptionper adult equivalent
Hospital care
Nonhospital care Total subsidyInpatient Outpatient
Bangladesh 7.25* (0.0437) 15.20 (6.3732) 11.60* (1.8853) 24.42 (5.5695) 16.78 (3.4916)Gansu, Chinaa 5.24* (0.0695) 7.27* (1.5331) 9.57* (1.6473) n.a. 8.17* (1.2265)Heilongjiang, Chinaa 5.98* (0.0759) 6.57* (1.8184) 12.32* (2.5677) n.a. 10.47* (1.8729)Hong Kong SAR 6.82* (0.0377) 38.77* (3.2580) 38.68* (2.2048) 38.19* (1.7718) 38.73* (2.7463)India 10.50* (0.0083) 10.70* (1.1086) 18.59 (1.6219) 26.23* (1.5471) 12.49* (0.9553)Indonesia 9.77* (0.0078) 3.80* (0.3762) 5.77* (0.4857) 19.73 (0.3199) 13.46* (0.2582)Malaysia 7.20* (0.0370) 21.19 (0.8807) 18.72 (1.1208) 32.25* (1.3422) 22.95* (0.6921)Nepalb 8.05* (0.0534) 3.52* (1.4851) 3.52* (1.4851) 9.04* (1.7220) 6.64* (1.1780)Sri Lankac 8.31* (0.0725) 20.76 (2.6013) 21.11 (1.9418) n.a. 20.88 (1.8367)Thailand 6.94* (0.0589) 21.26 (1.4144) 17.70* (1.0278) 31.16* (1.9137) 20.06 (0.8963)Vietnam 8.78* (0.0429) 13.64* (1.9209) 11.55* (1.7049) 19.73 (1.7346) 14.79* (1.5416)
*Significantly different from 20 percent at the 5 percent significance level. Bold indicates that the subsidy share is significantly different from thehousehold consumption share.
n.a. means that data were not available to conduct the test.
Note: Numbers in parentheses are standard errors.aThere are no data on nonhospital care, but low-level hospitals, equivalent to polyclinics and health centers, are included.bIt is not possible to distinguish between hospital inpatient and outpatient visits.cThe subsidy specific to nonhospital care cannot be computed.
Source: Authors’ calculations based on data documented in table S.1 (see supplemental appendix available at http://wber.oxfordjournals.org/).
100
TH
EW
OR
LD
BA
NK
EC
ON
OM
IC
RE
VIE
W

cases, and in Bangladesh, India, and Indonesia, the richest quintile receivesmore than 30 percent of the total subsidy (not shown in table). In all cases butNepal the share of the subsidy going to the poorest quintile is significantlygreater than its share of total household consumption.
Differences in Incidence across Health Services
Only in Hong Kong SAR does the concentration curve dominate the 458 linefor both hospital inpatient and outpatient care and for nonhospital care (seetable 1), with the poorest quintile receiving about 39 percent of the subsidy toall three services (see table 2). In Malaysia the concentration curves for inpati-ent and nonhospital care lie above the 458 line, but the outpatient care curvedoes not deviate significantly from the line of equality (see table 1). InThailand it is inpatient care that is equally distributed, while the concentrationcurves for the other types of care dominate the diagonal, at least using the lessstringent test criteria. However, in both Malaysia and Thailand the poorestquintile receives significantly more than 20 percent of the subsidy only for non-hospital care (see table 2). In Sri Lanka there is equality in the distributions ofall services except for a propoor distribution of outpatient care as measured byuse (see table 1). In the remainder of countries and provinces, concentrationcurves for hospital care tend to lie below the diagonal—meaning that thebetter-off consume more—while the curves for nonhospital care lie above it.The poorest quintile fairly consistently receives less than 20 percent of thesubsidy for hospital care and significantly more than 20 percent of the subsidyfor nonhospital care only in India (see table 2).
For most countries and provinces the distribution of nonhospital care domi-nates that of hospital inpatient and outpatient care (table 3), confirming thatnonhospital care is generally more targeted to the poor than is hospital care.
Comparison of Use and Subsidy Distributions
Estimating the incidence of the public healthcare subsidy requires much moreinformation than that of raw use. Unit costs must be estimated at the facilityand regional levels and, where appropriate and possible, fees paid by individ-uals must be identified. The effort involved to obtain this extra information isworthwhile only if there is significant variation in unit costs or fees with theindicator of household living standards and if this covariance is sufficientlylarge relative to that for use. The dominance tests reported in table 1 display aconsiderable consistency across the use and subsidy measures. Only in 10 of 58pairwise comparisons do the conclusions of the test differ depending onwhether the distribution of use or the subsidy is examined. This is not aninsubstantial degree of disagreement, but it suggests that the results of domi-nance tests are generally robust to the measure over which incidence is exami-ned and that variation in use, not unit subsidies, is the main driver of thepublic subsidy distribution. This increases the confidence that can be placed instudies that look only at use. It is consistent with the findings of Sahn and
O’Donnell and others 101

TA B L E 3. Tests of Dominance between Concentration Curves for Different Public Health Services and between Use andSubsidy Distributions
Country, province,or region
Use Use and subsidy
Hospital inpatientversus outpatient
Hospital inpatientversus nonhospital
Hospital outpatientversus nonhospital
Hospitalinpatient
Hospitaloutpatient Nonhospital
Bangladesh op.ipGansu, China op.ip* n.a. n.a. use.subsidy n.a.Heilongjiang, China op.ip n.a. n.a. n.a.Hong Kong SAR use.subsidyIndia op.ip* non-h.ip* non-h.op* subsidy.use subsidy.useIndonesia op.ip non-h.ip* non-h.op use.subsidy* use.subsidy* use.subsidyMalaysia non-h.ip non-h.op use.subsidy* use.subsidy* n.a.Nepal non-h.(ipþ op)a non-h.(ipþ op)a use.subsidySri Lanka op.non-h use.subsidy use.subsidy n.a.Thailand non-h.ip non-h.op* subsidy.useVietnam non-h.ip* non-h.op* subsidy.use*
ip is inpatient, op is outpatient, non-h is non hospital.
Blank cell indicates failure to reject the null hypothesis that curves are indistinguishable using the multiple comparison test at the 5 percentsignificance level.
. indicates that the null hypothesis is rejected in favor of dominance, for example, op . ip indicates that outpatient care is more propoor thaninpaticare and use . subsidy indicates that the use distribution is more propoor than the subsidy distribution.
*indicates rejection of the null hypothesis of nondominance in favor of an alternative strict dominance in the direction indicated by ., as above, usingthe intersection–union test and a 5 percent significance level.
aTest is between all hospital care (inpatient and outpatient) and all nonhospital care.
Source: Authors’ calculations based on survey data documented in table S.1 (see supplemental appendix S.1 available at http://wber.oxfordjournals.org/).
102
TH
EW
OR
LD
BA
NK
EC
ON
OM
IC
RE
VIE
W

Younger (2000) but somewhat stronger, since the current study allows formore sources of heterogeneity in unit subsidies.
Notwithstanding this result, there are significant differences between thedistributions of use and subsidy. In Indonesia, Malaysia, and Sri Lanka theuse distributions dominate—they are more propoor than the subsidydistributions—for all services, and in Gansu, Hong Kong SAR, and Nepal thisis true for some services (see table 3). Dominance is not always found using themore conservative test, however. Urban–rural and regional differences in thequality of care are the most likely reason that the subsidy is less propoor thanuse. Only in India, Thailand, and Vietnam does the subsidy distribution domi-nate the use distribution for certain services, indicating that the subsidy perunit of care falls as household consumption rises. This is likely due to userpayments rising with household consumption, whether because of exemptionsgranted to the poor or because richer households are paying for higher qualitycare that is not reflected in the unit cost figures.
Cross-Country Comparisons
As would be expected from the results already presented, the subsidy concen-tration curve of Hong Kong SAR dominates that of all other countries andprovinces (table 4).6 The incidence of public care is so skewed toward the poorthat the distribution of total healthcare (public and private) in Hong KongSAR is propoor (Leung, Tin, and O’Donnell 2005).7 While this is in strikingcontrast with the distribution of healthcare in the low- and middle-incomecountries examined in this article, it is consistent with the distribution that pre-vails in most high-income economies (Van Doorslaer, Masseria, and Koolman2006).
There are no significant differences between the concentration curves ofMalaysia, Sri Lanka, and Thailand, where the subsidies range from slightlypropoor to evenly distributed. On the less strict test the Vietnamese distri-bution is dominated by that of Hong Kong SAR, Malaysia, and Thailand andit is indistinguishable from that of Sri Lanka. It dominates the subsidy distri-butions of all the remaining countries and provinces using the less stringenttest.8 For most pairwise comparisons the subsidy concentration curves ofBangladesh, Gansu, Heilongjing, India, Indonesia, and Nepal are indistinguish-able. Exceptions are that India and Indonesia dominate Gansu and Nepalusing the less strict test. In all these countries and provinces the public healthsubsidy is significantly and substantially prorich (see tables 1 and 2). This is
6. See table S-4 for cross-country dominance tests for each type of health service subsidy.
7. Some 43.5 percent of total expenditure on health in Hong Kong SAR is funded from private
sources (Hong Kong Domestic Health Accounts 1999–2000).
8. This is not due simply to the fact that unit subsidies are negatively correlated with household
consumption in Vietnam, unlike in most other countries and provinces. Only one cross-country
dominance result for Vietnam becomes insignificant when use of each service rather than the subsidy to
each service is examined.
O’Donnell and others 103

TA B L E 4. Cross-Country Dominance of Public Health Subsidy Concentration Curves
Malaysia Thailand Sri Lanka Vietnam Bangladesh Indonesia India Gansu Heilongjiang Nepal
Hong Kong SAR D* D* D* D D* D* D* D* D* D*Malaysia n.s. n.s. D D D* D* D* D* D*Thailand n.s. D D D* D* D D* D*Sri Lanka n.s. ns D D D D* D*Vietnam D D* D D* D D*Bangladesh ns ns ns ns nsIndonesia ns D ns DIndia D ns DGansu, China ns nsHeilongjiang, China ns
n.s. indicates failure to reject the null hypothesis that the curves are indistinguishable using the multiple comparison test at the 5 percent significancelevel.
D indicates rejection of the null in favor of dominance (more propoor) of the row country over the column country by the same test.
*indicates that the intersection–union test rejects the null of nondominance against the alternative of strict dominance at the 5 percent significancelevel.
Source: Authors’ calculations based on survey data documented in table S.1 (see supplemental appendix available at http://wber.oxfordjournals.org/).
104
TH
EW
OR
LD
BA
NK
EC
ON
OM
IC
RE
VIE
W

consistent with the findings of the majority of benefit incidence studies con-ducted in developing countries (van de Walle 1995; Castro-Leal and others2000; Mahal and others 2000; Sahn and Younger 2000; Filmer 2003). ButMalaysia, Thailand, Sri Lanka, and to a lesser extent Vietnam stand out asexceptions to this norm of prorich bias. Why is it that public healthcare ismore propoor in these four countries than it is in other developing countries ofAsia and elsewhere?
National income is an obvious candidate to explain cross-country variationin the targeting of public health spending. Public healthcare is strongly targetedto the poor in Hong Kong SAR in large part because Hong Kong is richenough to afford a dual system of universal public healthcare funded fromgeneral taxation and a private healthcare system used predominantly by thebetter-off to bypass the bottlenecks and inconveniences of the public system. Itis surely no coincidence that Malaysia and Thailand are the only other twocountries where public health spending is significantly propoor. While they arenot nearly as rich as Hong Kong SAR, they are considerably better off than theother countries included in this study (see table S-5).
Economic development is not the sole explanation for cross-country differ-ences in the incidence of public healthcare. It does not explain why Sri Lanka,despite a lower GDP per capita than Indonesia, achieves a distribution ofhealth resources that is much more favorable to the poor. Levels of publicspending on health and health system characteristics might be expected toexplain part of the residual cross-country variation in targeting of the poor. Inper capita terms Sri Lanka spends 2.5 times as much as Indonesia on publichealthcare (table S-5). The scale of public spending may influence its incidenceby affording a wider geographic distribution of public health facilities and sobring services closer to poor, rural populations.
There may also be a trickle-down effect. At low levels of spending the politi-cally powerful, higher income urban elite may be more successful than therural poor in capturing spending for programs that meet their own needs. Asspending levels rise and more of the health needs of higher income groups aresatisfied, additional programs can be better targeted to the needs of the poor(Lanjouw and Ravallion 1999). Countering this tendency, the pressure fromhigher income groups for prioritization of tertiary-level city hospitals may bemaintained by the attraction of continuing advances in medical technology(Victora and others 2000).
The extent to which higher income groups claim the benefits from publichealthcare will depend on whether an attractive private sector alternativeexists. Income-elastic demand for healthcare quality, in particular amenitiesand convenience of service, will lead to greater substitution of private forpublic care by an expanding middle-class as the economy grows. Hammer,Nabi, and Cercone (1995) argue that this mechanism was largely responsiblefor the increased propoor incidence of public health spending in Malaysiabetween the mid-1970s and the mid-1980s. The private sector continues to
O’Donnell and others 105

grow in Malaysia, driven in part by dissatisfaction with the responsiveness ofthe public system (Shepard, Savedoff, and Phua 2002). In Thailand, whichhas also achieved impressive economic growth in recent years, the privatesector is also expanding rapidly (Towse, Mills, and Tangcharoensathien2004).
The combination of (near) universal public provision, a private sectoroffering an attractive alternative, and incomes that make demand for thisalternative effective leads to redistribution through public provision in theway that theory predicts (Besley and Coate 1991). This mechanism implies apossibly uncomfortable tradeoff between the quality of public healthcare andthe extent to which it is targeted to the poor. In lower income countries,such as Bangladesh, India, and Indonesia, separation of low- and high-income groups into the public and private sectors is constrained not only bythe limited purchasing power of the middle class but also by marked intra-sectoral quality differentials. There is evidence of pronounced income gradi-ents in the quality of private sector care used in India (Das and Hammer2005). There, as in Bangladesh, the poor make extensive use of unqualifiedprivate providers.
This discussion suggests that economic development, the scale of publichealth spending, and the availability and quality of private sector alternativesmay each help explain cross-country variation in the incidence of public healthspending. Regression analysis is used to examine whether this is the case acrossthe study countries and provinces and others for which benefit incidence resultsare available from other studies (Filmer 2003). Only 24 observations are avail-able for this analysis, and so the results (table 5) should be treated with duecaution. It is an exploratory exercise and not an empirical test of hypotheses.The dependent variable is the (log) percentage of the total public subsidyreceived by the poorest quintile. This share increases significantly with GDPper capita, with an elasticity of about 0.3. At a lower level of significance (10percent), the poorest quintile’s share is also increasing with public healthspending as a percentage of GDP, with an elasticity of about 0.5. So, for agiven GDP there is some evidence that the share of the subsidy going to thepoor is increasing with the scale of public health spending.
To examine whether, for a given level of public expenditure, the share of thesubsidy going to the poor increases with use of private sector alternatives,public spending as a percentage of total expenditure on health is included inthe regression. Consistent with the hypothesis, the coefficient is negative butdoes not reach conventional levels of significance. The regression residuals arelargest, in absolute value, for the two Chinese provinces. Public health spend-ing in these provinces is much less targeted on the poor than would beexpected given GDP and the scale of public spending and its share of totalhealth financing. This is most likely due to the extensive imposition of usercharges with no income-related exemptions. Excluding these two provincesincreases the magnitude and significance of the coefficients. In particular, the
106 T H E W O R L D B A N K E C O N O M I C R E V I E W

negative coefficient on the public health financing share becomes significant at5 percent.9 Although this study has found that the public health subsidy is nottargeted on the poor in the majority of the 11 Asian countries and provincesexamined, the distribution appears to be even more skewed toward the better-off in Eastern Europe and Central Asia and in Sub-Saharan Africa.10
TA B L E 5. Cross-Country Regression Analysis of Targeting of the PublicHealth Subsidy (Dependent variable: log of percentage of public health subsidyreceived by poorest quintile)
Full sampleExcluding Gansu and
Heilongjiang
CoefficientRobust standard
errora CoefficientRobust standard
errora
Log of gdp per capitab 0.3214*** 0.1002 0.3426*** 0.0889Public health expenditure
as percent of gdp0.2337* 0.1190 0.2971*** 0.0884
Public health expenditureas percent of total healthexpenditure
20.0080 0.0049 20.0110** 0.0043
Eastern Europe andCentral Asia
20.3308 0.2091 20.4895** 0.1889
Latin America andCarribean
20.2478 0.3535 20.4338 0.2990
Sub-Saharan Africa 20.8630*** 0.3004 21.0750*** 0.2093Constant 0.0691 0.7465 0.0294 0.7118Sample size 24 22R2 0.5712 p-value 0.7421 p-valueRESET (F3,n-k-3) 0.76 0.5371 0.71 0.5671
*Significant at the 10 percent level; **significant at the 5 percent level; ***significant at the 1percent level.
Note: Observations are the 11 countries and provinces for the years of this study plus thosefrom Filmer (2003): Armenia (1999) Bangladesh (1995), Bulgaria (1995), Costa Rice (1992),Cote d’Ivoire (1995), Ecuador (1998), Georgia (2000), Ghana (1994), Guinea (1994), Honduras(1995), Nicaragua (1996), South Africa (1994), and Vietnam (1993).
aRobust to heteroscedasticity of general form.bGross domestic product per capita in purchasing power parity dollars at constant 2000
prices.
source: Dependent variable, authors’ calculations based on data in table S. 1 (seesupplemental appendix available at http://wber.oxfordjournals.org/) and that reported in Filmer(2003). GDP, World Bank, various years, World Development Indicators. Health expenditure,WHO, various years, National Health Accounts and World Health Report Statistical Annexes.
9. The results are similar if the weight given to observations with large absolute residuals is reduced,
but not set to zero, using robust regression. The results are also robust to the exclusion of Hong Kong
SAR, where the subsidy is much more propoor and GDP is much higher than in the other countries and
provinces.
10. Other potential explanatory factors, including the Gini coefficient, the urbanization rate, and
the doctor supply rate, were not found to be significant.
O’Donnell and others 107

These regression results tell only of associations in a fairly small sample ofcountries and should not be interpreted as causal effects. GDP may be acting asa proxy for a number of primary determinants of incidence, such as the qualityof governance and preferences for redistribution. Through human capitalacquisition, assuming that the marginal product of investments in health ishigher for poorer (and sicker) individuals, GDP may itself be responsive to thetargeting of healthcare to the poor. Polices are of course endogenous. Thepositive correlation between the scale and the propoor incidence of publicspending may derive from the degree of political commitment to reaching thepoor. Reducing racial conflict in post-independence Malaysia was a majormotivation for the expansion in access to healthcare and the channeling ofpublic resources to the rural Malay population (Hammer, Nabi, and Cercone1995). The early adoption of democracy and female suffrage in Sri Lankacontributed to the high priority given to healthcare and the wide geographicaldistribution of health resources in response to the lobbying of local politicians(McNay, Keith, and Penrose 2004). In fact, a 1928 commission proposedthe full enfranchisement of women at the same time as men as a means ofsecuring a political lobby for the prioritization of healthcare (Rannan-Eliya2001). High rates of female literacy and a relatively high degree of femaleautonomy have raised awareness of maternal and child health problems,leading to high rates of use of modern health facilities and medicines (Caldwell1986).
Political and economic circumstances determine the motivation andresources for the pursuit of propoor public healthcare, but realization of theobjective depends on the specific health sector policies adopted. One policy hasbeen to minimize charges for poor patients in accessing care. There arevirtually no fees for public health services in Sri Lanka, and fees are minimal inboth Hong Kong SAR and Malaysia (table S-6). In all three cases fees arenot retained by facilities or even by the health sector, but accrue to generalrevenues, thus undermining providers’ incentives for generating fee revenue.The near avoidance of user fees in resource-poor Sri Lanka has been feasibleonly by driving down unit costs (Rannan-Eliya 2001). Nonmonetaryincentives, such as professional development and opportunities to worksimultaneously in the private sector, help maintain high levels of staffproductivity. In Thailand fees have been much higher. Prior to the introductionof universal coverage in 2001, public hospitals received 20–50 percent oftheir revenue from user fees (Towse, Mills, and Tangcharoensathien 2004).But the disincentive effect on use by the poor was limited through a fairlyeffective healthcard scheme that covered about two-thirds of the poor.Crucially, this scheme compensated providers for fee exemptions from adesignated budget.
A geographically dispersed network of health facilities close to the ruralpopulation also appears to contribute to the propoor targeting of health spend-ing. In Malaysia half the population lives within 10 kilometers of a public
108 T H E W O R L D B A N K E C O N O M I C R E V I E W

hospital and within 4.6 kilometers of a public clinic.11 In Sri Lanka most ofthe population has lived within 5 kilometers of a healthcare facility since theearly 1970s, and most of the rural population is within 5–10 kilometers of aperipheral facility (Hsiao 2000). In Thailand, although beds and doctors arehighly concentrated in Bangkok, an extensive rural infrastructure has beendeveloped over decades. There are primary care health centers in all subdis-tricts and community hospitals in all districts (Towse, Mills, andTangcharoensathien 2004). The introduction of universal coverage has initiateda major shift of resources from urban hospitals to primary care. Vietnam alsohas a relatively high level of provision in rural areas through a comprehensivenetwork of commune health centers.
But the contribution of primary care to propoor public health spendingshould not be exaggerated. Public health spending is better targeted on thepoor in Hong Kong SAR, Malaysia, Thailand, Sri Lanka, and Vietnam becausethe distribution of hospital care is more favorable to the poor and not becausemore resources are devoted to nonhospital care (see table S-3). Of course, hos-pitals differ. In Malaysia and Sri Lanka many hospitals are small in scale andnot particularly well equipped. But their wide geographic distribution makesthem accessible to the rural poor. In many other low-income countries, such asBangladesh, resources are more concentrated in large, well-equipped hospitalsin urban centers that are inaccessible to the poor.
I I I . C O N C L U S I O N
The analysis reveals substantial variation across Asia in the incidence of publicsubsidies for healthcare. Public spending is strongly propoor in high-incomeHong Kong SAR. The total public health subsidy is more moderately propoorin low- to middle-income Malaysia and Thailand and it is evenly distributed inlow-income Sri Lanka. At a still lower level of national income the subsidy ismildly prorich in Vietnam. In the remainder of the low-income countries andprovinces examined, which account for the far greater share of the Asian popu-lation, the better-off receive substantially more of the subsidy than do thepoor. In most cases there is prorich bias in the distribution of hospital care,while nonhospital care is propoor. A greater share of the healthcare subsidygoes to hospital care, and so this dominates the overall distribution. Whilepublic health subsidies are typically not propoor, they are inequality reducingin all cases except India and Nepal.
Most within- and between-country dominance tests are robust to whetherthe distribution of healthcare use or the value of the subsidy is examined. Thisis a reassuring result since the health accounts data required for analysis ofsubsidy incidence are often unavailable and raw use data must be relied on.There are, however, significant differences between the distribution of
11. Authors’ calculations from the 1996 National Health and Morbidity Survey.
O’Donnell and others 109

healthcare use and healthcare subsidies, with use often more propoor. Wherethis occurs, the likely explanation is urban–rural and interregional differencesin the nature and funding of facilities.
The analysis shows that the prorich distribution of public healthcare subsi-dies that is pervasive in most developing countries is avoidable but that effec-tive targeting is easier to realize at higher levels of national incomes. Theexperiences of Malaysia, Sri Lanka, Thailand, and Vietnam suggest that achiev-ing a more propoor incidence of public health spending requires limiting theuse of user fees, or at least effectively protecting the poor from them; buildinga wide geographic network of health facilities; and ensuring that hospital care,which absorbs most spending, is sufficiently targeted at the poor.
110 T H E W O R L D B A N K E C O N O M I C R E V I E W

TA B L E S1. Description of sample surveys
CountrySurveyyear
Surveyname
Institutionconducting
surveySurvey
coverage Survey designSampling
unitResponse
rateSample sizeindividuals
Bangladesh 1999–2000
Health andDemographicSurvey (HDS)
2000
Bangladesh Bureauof Statistics(BBS)
National Stratified Household andIndividual
99% 56,010
Gansu(China)
2003 National HealthHousehold
InterviewSurveys
Ministry of Health Gansu province(poor in
west China)
Stratified, clustersample. Self-
weighting
Household 100% 15,535
Heilongjiang(China)
2003 HeilongjiangHealthHousehold
Interview Survey
Health bureau ofHeilongjiangprovince
Heilongjiangprovince(north-east
China)
Stratified, clustersample. Self-weighting
Household 100% 11,572
Hong Kong
SAR
April–
June2002
Thematic
HouseholdSurvey in thesecond quarter
of 2002
Census and
StatisticsDepartment,Government of
Hong KongSAR
National Stratified.
Sampleweightsapplied
Household
(noninstitutional;individual(institutional)
78.4%
(noninstitutional);97.2%(institutional)
31,672
India 1995–96 National SampleSurvey 52ndround
National SampleSurveyOrganisation
National Stratified, clustersample.Weights
applied
Household 100% 629,024
Indonesia 2001 SocioeconomicSurvey
(SUSENAS)
National Board ofStatistics
National Stratified, clustersampling. Self-
weighted
Household 98% 889,413
(Continued)
A P P E N D I X : T H E I N C I D E N C E O F P U B L I C S P E N D I N G O N H E A L T H C A R E : C O M P A R A T I V E E V I D E N C E F R O M A S I A
O’D
onnell
and
oth
ers111

TABLE S1. Continued
CountrySurveyyear
Surveyname
Institutionconducting
surveySurvey
coverage Survey designSampling
unitResponse
rateSample sizeindividuals
Malaysia 1996 National Health
and MorbiditySurvey II
Public Health
Institute,Ministry of
Health
National Stratified, cluster
sample.Weights
applied
Household 86.90% 59,903
Nepal 1995/96 Nepal LivingStandards
Survey
Central Bureau ofStatistics (CBS)
National Stratified, clustersample.
Weightsapplied
Household 96.60% 18,855
Sri Lanka 1996/97 Consumer Finance
Survey
Central Bank Excluded
NorthernProvince due
to civil war.
Stratified Household 98% 399,28
Thailand Jan–June2002
SocioeconomicSurvey
National StatisticalOffice
National Stratified Household 80% 17,489
Vietnam 1998 Living StandardsSurvey
General StatisticalOffice
National Stratified, clustersample.
Weightsapplied
Household 70% 28,623
112
TH
EW
OR
LD
BA
NK
EC
ON
OM
IC
RE
VIE
W

TA B L E S2. Measures of healthcare utilisation
Hospital care
Doctor visits
Nonhospital carePolyclinic/health
center Antenatal care CommentsInpatients outpatients
BangladeshReference period last episode in previous 3 months last episode in previous 3 months 3months Care at satellite and community
clinics also included but notchild immunisation
Measurement unit Number of days Number ofvisits
Number ofvisits
Gansu and Heilongjiang (China)Reference period 12months 2 weeks n.a. 2 weeks n.a. Data on hospital care only. Five
levels of hospital aredistinguished, the lowest ofwhich are equivalent topolyclinics.
Measurement unit Number of days Number ofvisits
Number ofvisits
Hong Kong SARReference period 12 months 30 days 30 days n.a. n.a. Hospital outpatient includes
visits to specialist and A&E.Doctor visits is generaloutpatient visits.
Measurement unit Number of days Number ofvisits
Number ofvisits
IndiaReference period 12 months 2 weeks 2 weeks 2 weeks 2 weeksMeasurement unit Number of days any visits any treatment period any visits
IndonesiaReference period 12 months 1 month n.a. 1 month 1 month Puskesmas (inpatients and
outpatients) andsupplementary Puskesmas(outpatients) included inhealth centre/polyclinic.Polindes and Posyandu inantenatal care.
Measurement unit Number of days Number ofvisits
n.a. Number of visits,Number of days forinpatient
Number ofvisits
(Continued)
O’D
onnell
and
oth
ers113
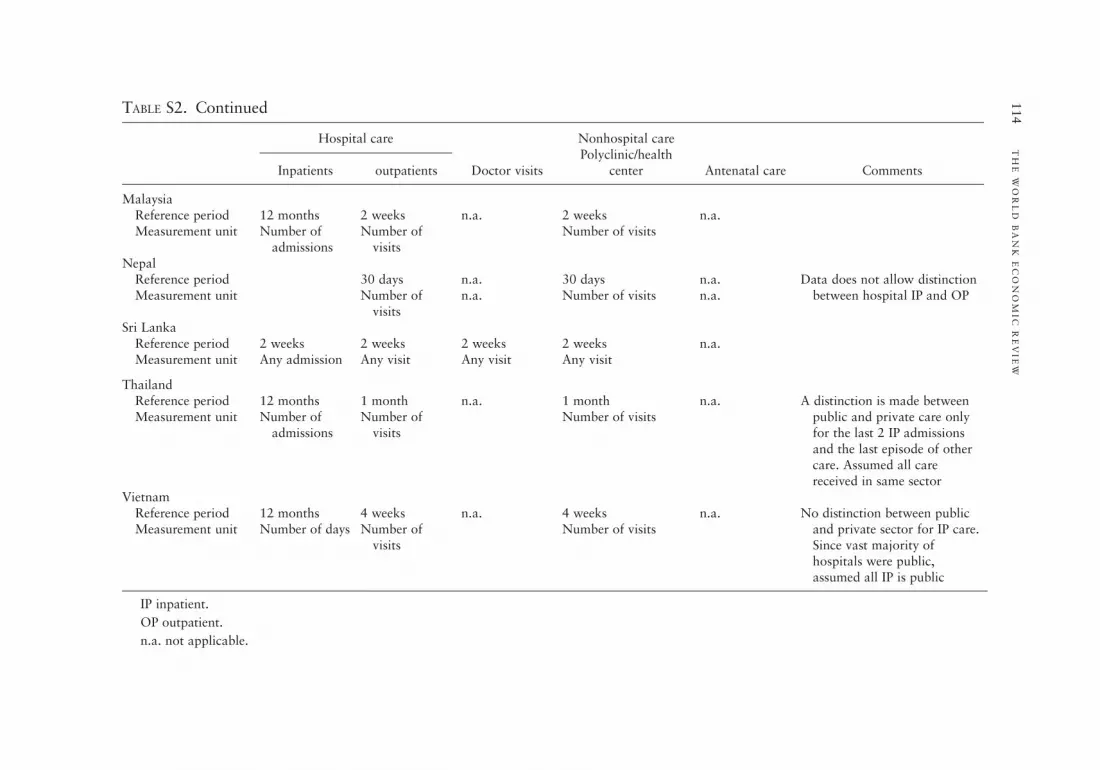
TABLE S2. Continued
Hospital care
Doctor visits
Nonhospital carePolyclinic/health
center Antenatal care CommentsInpatients outpatients
MalaysiaReference period 12 months 2 weeks n.a. 2 weeks n.a.Measurement unit Number of
admissionsNumber of
visitsNumber of visits
NepalReference period 30 days n.a. 30 days n.a. Data does not allow distinction
between hospital IP and OPMeasurement unit Number ofvisits
n.a. Number of visits n.a.
Sri LankaReference period 2 weeks 2 weeks 2 weeks 2 weeks n.a.Measurement unit Any admission Any visit Any visit Any visit
ThailandReference period 12 months 1 month n.a. 1 month n.a. A distinction is made between
public and private care onlyfor the last 2 IP admissionsand the last episode of othercare. Assumed all carereceived in same sector
Measurement unit Number ofadmissions
Number ofvisits
Number of visits
VietnamReference period 12 months 4 weeks n.a. 4 weeks n.a. No distinction between public
and private sector for IP care.Since vast majority ofhospitals were public,assumed all IP is public
Measurement unit Number of days Number ofvisits
Number of visits
IP inpatient.
OP outpatient.
n.a. not applicable.
114
TH
EW
OR
LD
BA
NK
EC
ON
OM
IC
RE
VIE
W

TA B L E S3. Summary indices of incidence of incidence of the public healthcare subsidy
Hospital care
Non-hospital care Total public subsidyInpatient Outpatient
BangladeshConcentration index 0.2325 (0.1154) 0.1356 (0.0360) 0.0474 (0.0838) 0.1588 (0.0609)Kakwani index 20.1338 (0.0909) 20.2388 (0.0372) 20.3358 (0.0692) 20.2244 (0.0499)Subsidy share 47.99% 25.33% 26.69% 100%
Gansu (China)Concentration index 0.2442 (0.0509) 0.1199 (0.0373) 0.1199 (0.0373) 0.1970 (0.0365)Kakwani index 20.2286 (0.0439) 20.3529 (0.0360) 20.3529 (0.0360) 20.2758 (0.0332)Subsidy share 65.42% 34.58% 34.58% 100%
Heilongjiang (China)Concentration index 0.03232 (0.0605) 0.2192 (0.0474) 0.2192 (0.0474) 0.2527 (0.0385)Kakwani index 20.1242 (0.0652) 20.2281 (0.0510) 20.2281 (0.0510) 20.1946 (0.0424)Subsidy share 60.09% 39.91% 39.91% 100%
Hong Kong SARConcentration index 20.3193 (0.0355) 20.2762 (0.0264) 20.2444 (0.0232) 20.3104 (0.300)Kakwani index 20.6919 (0.0356) 20.6491 (0.0265) 20.6173 (0.0232) 20.6831 (0.0301)Subsidy share 82.47% 13.36% 4.17% 100%
IndiaConcentration index 0.2630 (0.0193) 0.00296 (0.0211) 20.1325 (0.0328) 0.2117 (0.0164)Kakwani index 0.0122 (0.01928) 20.2476 (0.02113) 20.3830 (0.03281) 20.0390 (0.0165)Subsidy share 83.68% 9.62% 6.65% 100%
IndonesiaConcentration index 0.4896 (0.0254) 0.3891 (0.0186) 20.0078 (0.0045) 0.1822 (0.0081)Kakwani index 0.1752 (0.0248) 0.0880 (0.0187) 20.3142 (0.0047 20.1245 (0.0080)Subsidy share 26.54% 14.86% 58.59% 100%
MalaysiaConcentration index 20.0416 (0.0124) 20.0165 (0.0231) 20.2410 (0.0181) 20.0807 (0.0116)Kakwani index 20.4100 (0.0131) 20.3863 (0.0235) 20.3863 (0.0235) 20.4493 (0.0123)
(Continued)
O’D
onnell
and
oth
ers115

TABLE S3. Continued
Hospital care
Non-hospital care Total public subsidyInpatient Outpatient
Subsidy share 37.02% 38.53% 24.45% 100%Nepal
Concentration index 0.3422 (0.0709) 0.3422 (0.0709) 0.1865 (0.0411) 0.2541 (0.0398)Kakwani index 0.1268 (0.0605) 0.1268 (0.0605) 20.0677 (0.0487) 0.0384 (0.405)Subsidy share 54.58% 54.58% 45.24% 100%
Sri Lanka
Concentration index 0.0220 (0.0377) 20.0486 (0.0304) 20.0486 (0.0304) 20.0020 (0.0269)Kakwani index 20.3313 (0.0252) 20.4042 (0.0172) 20.4042 (0.0172) 20.3561 (0.0284)Subsidy share 68.00% 32.00% 32.00% 100%
Thailand
Concentration index 20.0242 (0.0308) 20.0392 (0.0227) 20.2506 (0.0325) 20.0404 (0.0195)Kakwani index 20.4199 (0.0317) 20.4348 (0.0242) 20.6463 (0.0335) 20.4361 (0.0210)Subsidy share 50.74% 45.16% 4.18% 100%
Vietnam
Concentration index 0.0354 (0.0359) 0.1672 (0.0349) 20.1065 (0.0272) 0.0114 (0.0283)Kakwani index 20.1495 (0.0471) 20.0599 (0.0667) 20.4623 20.2573 (0.0458)Subsidy share 86.88% 2.13% 10.98% 100%
Robust standard errors in parentheses.
Source: Authors’ calculations from data documented in table S-1.
116
TH
EW
OR
LD
BA
NK
EC
ON
OM
IC
RE
VIE
W

TA B L E S4. Cross-country Dominance of Public Health Subsidy Concentration Curves
Total subsidy Malaysia Thailand Sri Lanka Vietnam Bangladesh Indonesia Gansu India Heilongjiang Nepal
Hong Kong SAR D* D* D* D D* D* D* D* D* D*Malaysia n.s. n.s. D D D* D* D* D* D*Thailand n.s. D D D* D D* D* D*Sri Lanka n.s. n.s. D D D* D* D*Vietnam D D* D* D D D*Bangladesh n.s. n.s. n.s. n.s. n.s.Indonesia D n.s. n.s. DGansu (China) n.s. n.s.India D n.s. DHeilongjiang (China) n.s.
Hospital inpatient subsidy Malaysia Thailand Sri Lanka Vietnam Bangladesh Gansu India Heilongjiang Nepal Indonesia
Hong Kong SAR D* D* D* D D D* D* D* D* D*Malaysia n.s. n.s. D n.s. D* D* D* D* D*Thailand n.s. D n.s. D D* D D* D*Sri Lanka n.s. n.s. D D* D D* D*Vietnam n.s. D D D D* DBangladesh n.s. n.s. n.s. n.s. n.s.Gansu (China) n.s. n.s. n.s. n.s.India n.s. D D*Heilongjiang (China) n.s. n.s.Nepala
Indonesia D
Hospital outpatient subsidy Sri Lanka Thailand Malaysia India Gansu Bangladesh Vietnam Heilongjiang Indonesia
Hong Kong SAR D* D* D D* D* D D* D* D*Sri Lanka n.s. n.s. n.s. D D D* D D*Thailand n.s. n.s. D D D D D*
(Continued)
O’D
onnell
and
oth
ers117

TABLE S4. Continued
Total subsidy Malaysia Thailand Sri Lanka Vietnam Bangladesh Indonesia Gansu India Heilongjiang Nepal
Malaysia n.s. D D D* D D*India D D D* D D*Gansu (China) n.s. n.s. n.s. DBangladesh n.s. n.s. DVietnam n.s. DHeilongjiang (China) D
Non-hospital subsidy Hong Kong Malaysia India Vietnam Indonesia Bangladesh Nepal
Thailand D D D D D* D D*Hong Kong SAR n.s. D D D* D* D*Malaysia D D D D D*India n.s. D* D D*Vietnam D D D*Indonesia n.s. D*Bangladesh n.s.
Note: Countries/provinces are ranked from most to least propoor according to values of concentration indices.
Tests follow the multiple comparison approach with the null hypothesis defined as curves being indistinguishable. n.s. indicates failure to reject thenull at 5% significance.
D indicates that the subsidy concentration curve of the row country/province dominates (is more pro-poor) than that of the column country/province.There are no cases of crossing concentration curves.
*indicates that the intersection union principle test rejects the (different) null of nondominance against the alternative of strict dominance at 5%. Ifno *appears, then this test does not reject its null.
acomparison with Nepal are for the aggregate of inpatient and outpatient subsidies.
118
TH
EW
OR
LD
BA
NK
EC
ON
OM
IC
RE
VIE
W

TA B L E S5. National Income and Government Expenditure on Health
Territory YearaGDP per capita,
PPP $b
General governmentexpenditure on
health as % GDPc
General governmentexpenditure on health
per capital, PPP $
General government expenditureon health as % total
expenditure on health
Bangladesh 1999 1495 0.98 15 27China 2002 4568 2.26 103 42Gansu (China) 2002 2661 2.38 63 42Heilongjiang(China)
2002 5434 1.48 80 36
Hong KongSAR
2001/02 26049 3.26 849 57
India 1996 1994 0.81 16 16Indonesia 2001 3146 0.57 18 36Malaysia 1996 8254 1.34 111 58Nepal 1995/96 1179 1.20 14 24Sri Lanka 1996/97 2951 1.63 48 50Thailand 2000 6740 2.04 138 61Vietnam 1998 1854 1.44 27 33
aYear of survey used for distributional analysis.bGDP per capita in international $ using purchasing power parity (PPP) exchange rates. Constant year 2000 prices.cGeneral government expenditure on health including social insurance.
Source: GDP per capita—World Development Indicators, World Bank. Health expenditures—National health accounts estimates, except: India,Malaysia and Vietnam from World Health Report, Stastistical Annexes, WHO, and Nepal from (HMG/Nepal 2000 and Hotchkiss, Rous and others1998).
O’D
onnell
and
oth
ers119

TA B L E S6. Charges and exemptions for public healthcare
Charged services Free Services Income/poverty related fee waiversNonpoor groups exempt from
charges
Bangladesh Secondary services (nominalregistration fee for inpatient/outpatient); Inpatient care inmajor hospitals
Most primary care (or localservices); medicines withinfacility; immunization; somereproductive healthcare
Poor exempt or pay lower charge Civil servants (selected services)
China Inpatient (including etcmedicines); Outpatient(including medicines);Immunisation
Family planning None Old Red Army soldiers andRetirees
Hong KongSAR
Inpatient (including medicines);outpatient (includingmedicines); dental
Accident and emergency (untilDecember 2002)
Welfare recipients exempt Civil servants and dependents(reduced rate for Inpatients);hospital staff and dependents
India Inpatient bed charge;outpatient registrationcharge; certain medicines;tests/x-rays; dental
Hospital consultation and certainmedicines. Primary care/healthcenter/polyclinic consultationand medicines. Family planning.Vaccinations and immunizations
None formally. Indirect relation toincome through pricedifferentiation in inpatient care.Informally, “poor” can beexempted partially or fully fromcharges
Civil sevants
Indonesia All medical care and medicines None Poor exempt from all charges.Indirect relation of inpatientcharges to income through pricediscrimination
Charges determined at localgovernment level. Some betteroff local govts. Provide freehealth centre care
Malaysia Hospital inpatient andoutpatient. Primary care.Dental care. Diagnostics andx-rays
Family planning and vaccinations/immunizations. Outpatient anteand postnatal care. Treatment ofinfectious diseases on third classwards. Dental care for pregnantwomen and pre school children
Hospital directors have discretionto waive fees for destitute.Upper limit on charges for thirdclass ward patients
Infants less than 1 year(outpatient). State rulers,Governors and families. Civilservants (including retired)and dependents. Localauthority employees anddependents
120
TH
EW
OR
LD
BA
NK
EC
ON
OM
IC
RE
VIE
W

Nepal All medical care and medicines.Nominal charge foroutpatient varying withfacility.
Emergency services; selectedvaccines, immunization andreproductive health services.60% subsidy for medicines atHealth Posts and Primary Carecentres.
Poor either exempt or pay reducedcharge but not fullyimplemented.
None
Sri Lanka Family planning services.Patients occasionally askedto buy medicines/suppliesfrom private retailers whenout of stock at facility.
All medical and medicines exceptfamily planning.
No official exemptions, but limitedsurvey evidence suggests thatfacility staff tend to avoid askingthe poorest patients to self-purchase medicines and supplies,or ration available stocks tothem.
None
Thailand All medical care and medicines.After Oct 2001, fixed fee (30Baht) UC scheme means veryminimal co-payment.
Nonpersonal healthcare; EPIvaccination
Poor exempted from user fees andco-payments. Informally, those“unable to pay” are exempted.
children ,12; elderly .60;public health volunteers;monks.
Vietnam Fees for most servicesintroduced in 1989.Medicines rarely providedfree of charge.
Outpatient services at communehealth centres.
Fee exemptions for individualswho have certification ofindigency from neighbourhoodor village People’s Committee.
Families of health personnel,certain classes of patients (likehandicapped, TB), orphans.
O’D
onnell
and
oth
ers121

RE F E R E N C E S
Beach, Charles M., and James Richmond. 1985. “Joint Confidence Intervals for Income Shares and
Lorenz Curves.” International Economic Review 26:439–50.
Besley, Timothy, and Stephen Coate. 1991. “Public Provision of Private Goods and the Redistribution
of Income.” American Economic Review 81(4):979–84.
Bishop, John A., K. Victor Chow, and John P. Formby. 1994. “Testing for Marginal Changes in Income
Distributions with Lorenz and Concentration Curves.” International Economic Review 35(2):479–88.
Bishop, John A., John P. Formby, and Paul D. Thistle. 1992. “Convergence of the South and
Non-South Income Distributions, 1969–1979.” American Economic Review 82(1):262–72.
Caldwell, John C. 1986. “Routes to Low Mortality in Poor Countries.” Population and Development
Review 12(2):171–220.
Castro-Leal, Florencia, Julia Dayton, Lionel Demery, and Kalpana Mehra. 2000. “Public Spending
on Health Care in Africa: Do the Poor Benefit?” Bulletin of the World Health Organisation
78(1):66–74.
Dardanoni, Valentino, and Antonio Forcina. 1999. “Inference for Lorenz Curve Orderings.”
Econometrics Journal 2(1):49–75.
Das, Jishnu, and Jeffrey Hammer. 2005. “Which Doctor? Combining Vignettes and Item Response to
Measure Clinical Competence.” Journal of Development Economics 78(2):348–83.
Davidson, Russell, and Jean-Yves Duclos. 1997. “Statistical Inference for the Measurement of the
Incidence of Taxes and Transfers.” Econometrica 65(6):1453–65.
Deaton, Angus. 1997. The Analysis of Household Surveys: A Microeconometric Approach to
Development Policy. Baltimore, MD: Johns Hopkins University Press.
Filmer, Deon. 2003. “The Incidence of Public Expenditures on Health and Education.” Background
note for the World Development Report 2004: Making Services Work for the Poor. Washington,
D.C.: World Bank.
Gwatkin, Davidson R., Shea Rustein, Kiersten Johnson, Roshni Pande, and Adam Wagstaff. 2003.
Initial Country-Level Information about Socio-Economic Differentials in Health, Nutrition and
Population, vols.I and II. Washington, D.C.: World Bank, Health, Population, and Nutrition
Division.
Hammer, Jeffrey S., Ijaz Nabi, and James A. Cercone. 1995. “Distributional Effects of Social Sector
Expenditures in Malaysia, 1974–89.” In Walle Domenique van de, and Nead Kimberly eds., Public
Spending and the Poor. Baltimore, MD: Johns Hopkins University Press.
Howes, Stephen. 1996. “A New Test for Inferring Dominance from Sample Data.” World Bank,
Washington, D.C.
Hsiao, William. 2000. “A Preliminary Assessment of Sri Lanka’s Health Sector and Steps Forward.”
Cambridge, Mass.: Harvard School of Public Health.
Kaur, Aamrjot, B. L. S. Prakasa Rao, and Harshinder Singh. 1994. “Testing for Second-Order
Stochastic Dominance of Two Distributions.” Econometric Theory 10(5):849–66.
Lanjouw, Peter, and Martin Ravallion. 1999. “Benefit Incidence, Public Spending Reforms and the
Timing of Program Capture.” World Bank Economic Review 13(2):257–73.
Leung, Gabriel M., Keith Tin, and Owen O’Donnell. 2005. “Redistribution or Horizontal Equity in
Hong Kong’s Mixed Public-Private Health System: A Policy Conundrum.” EQUITAP Working
Paper 22, Erasmus, Rotterdam, Netherlands, and Institute for Policy Studies, Colombo.
Mahal, Ajay, Janmejaya Sing, Farzana Afridi, Vikram Lamba, Anil Gumber, and V Selvaraju. 2000.
“Who Benefits from Public Health Spending in India?” New Delhi: National Council for Applied
Economic Research.
McNay, Kirsty, Regina Keith, and Angela Penrose. 2004. Bucking the Trend: How Sri Lanka Has
Achieved Good Health at Low Cost—Challenges and Policy Lessons for the 21st Century. London:
Save the Children.
122 T H E W O R L D B A N K E C O N O M I C R E V I E W

Meerman, Jacob. 1979. Public Expenditure in Malaysia: Who Benefits and Why? New York: Oxford
University Press.
Rannan-Eliya, Ravindra P. 2001. “Strategies for Improving the Health of the Poor—the Sri Lankan
Experience.” Health Policy Programme, Institute of Policy Studies, Colombo.
Sahn, David E., and Stephen D. Younger. 2000. “Expenditure Incidence in Africa: Microeconomic
Evidence.” Fiscal Studies 21(3):321–48.
Sahn, David E., Stephen D. Younger, and Kenneth R. Simler. 2000. “Dominance Testing of Transfers in
Romania.” Review of Income and Wealth 46(3):309–27.
Shepard, Donald S., William Savedoff, and Kai Hong Phua. 2002. Health Care Reform Initiatives in
Malaysia: Report of a Consultation with the Planning and Development Division, Ministry of
Health, Malaysia. Waltham, Mass.: Brandeis University, Shneider Insitute for Health Policy.
Towse, Adrian, Anne Mills, and Viroj Tangcharoensathien. 2004. “Learning from Thailand’s Health
Reforms.” British Medical Journal 328:103–05.
van de Walle, Domenique. 1995. “The Distribution of Subsidies through Public Health Services in
Indonesia, 1978–87.” In Dominique van de Walle, and Nead Kimberly eds., Public Spending and
the Poor. Baltimore, MD: Johns Hopkins University Press.
van de Walle, Domenique. 1998. “Assessing the Welfare Impacts of Public Spending.” World
Development 26(3):365–79.
Van Doorslaer, Eddy, and Cristina Masseria, Xander Koolman and the OECD Health Group Equity
Research. 2006. “Inequalities in Access to Medical Care by Income in Developed Countries.”
Canadian Medical Association Journal 174(2):177–83.
Victora, C. G., J. P. Vaughan, F. C. Barros, A. C. Silva, and E Tomasi. 2000. “Explaining Trends in
Inequalities: Evidence from Brazilian Child Health Studies.” The Lancet 356(9235):1093–98.
World Bank. 2001. Vietnam: Growing Healthy—A Review of Vietnam’s Health Sector. Hanoi.
World Bank. Various years. World Development Indicators. Washington, D.C.
World Health Organization. Various years. World Health Report: Statistical Annexes. Geneva.
O’Donnell and others 123

Reproduced with permission of the copyright owner. Further reproduction prohibited without permission.