reconnaissance thermoluminescence dating of northern australian coastal dune systems
TRANSCRIPT

QUATERNARY RESEARCH 34, 169-185 (1%))
Reconnaissance Thermoluminescence Dating of Northern Australian Coastal Dune Systems
BRIAN G. LEES
Department of Geography, Australian National University, Box 4, Canberra, ACT 2601, Australia
Lu YANCHOU
Xian Laboratory of Loess and Quaternaty Geology, Academica Sinica, Box 17 Xian. Shaanxi Province, People’s Republic of China
AND
JOHN HEAD
Radiocarbon Laboratory, Australian National University, Box 4, Canberra, ACT 2601, Australia
Received March 15. 1989
Quatemary lithostratigraphic units in coastal dunes have been dated at three locations in north- em Australia, Cobourg Peninsula, Shelburne Bay, and Cape Flattery, by both radiocarbon dating of shell and organic carbon and thermoluminescence (TL) sediment dating. Both coarse fraction and tine fraction TL methods were used. Seventeen TL dates were measured. None of the TL dates contradict the ages given by radiocarbon. Where multiple TL dates were taken from a unit, they overlap within 1 standard deviation giving added confidence in the results. A phase of dune emplacement during the late Holocene (ca. 270&1800 yr B.P.) was identified in two of the dune- fields, an early Holocene phase of dune emplacement (ca. 8600-7500 yr B.P.) in two of the dune- fields, and a late Pleistocene episode (ca. 24,000-17,000 yr B.P.) in both the Cape York dunefields. Three older units gave dates of about 29,000,81,000, and 17 1,000 yr B.P., but these must be treated with caution. 0 1990 University of Washington.
INTRODUCTION
Tropical Australia has extensive, deeply weathered siliceous sand dunes on the east coast of Cape York and on the eastern coast of Arnhem Land. Significant areas also oc- cur on Groote Eylandt and the Cobourg Peninsula (Fig. 1). The region has a mon- soon climate, and the dunes occur on coasts with rainfalls of 1100 to 1600 mm. Dominant winds are southeast trades which persist through the May to October dry sea- son.
Conflicting hypotheses have been pro- posed for dune emplacement on the Austra- lian coast. Pye (1984) has suggested that dune formation is episodic with periods of eolian activity alternating with periods of dune stabilization, weathering, and pe- dogenesis. Data are insufficient to decide
whether the discrete dune emplacement events observed by Pye and others in northern Australia are random events re- lated to local sediment budget changes, or whether these are nonrandom events asso- ciated with glacial low sea levels (Coal- drake, 1962; Ward, 1977; Willmott and Powell, 1977), marine transgressions (Pye, 1984; Pye and Bowman, 1984), cycles of storminess (Thorn, 1978), or anthropogenic disturbance. Such hypotheses might be tested by dating the dune sequences at sev- eral sites.
There are problems in dating sand bod- ies, particularly those of northern Austra- lia. Radiocarbon dating is difficult in humid tropical environments, as organic matter and shells in freely drained quartz dunes decay or dissolve relatively rapidly. The only dated units so far described are those
169 0033-5894/90 $3.00 Copyright 0 1990 by the University of Washington. All rights of reproduction in any form reserved.

170 LEES, YANCHOU, AND HEAD LEES, YANCHOU, AND HEAD
1340 1340
Cobourg Cobourg
0 200 400 0 200 400 km km -, -,
FIG. I. Map showing the distribution of major coastal dunefields in northern Australia (after Gal- FIG. I. Map showing the distribution of major coastal dunefields in northern Australia (after Gal- loway et nl., 1980).
around Cape Flattery, to the north of Cook- town (Pye and Switsur, 198 1; Pye and Bow- man, 1984). The advent of coarse fraction thermoluminescence (TL) dating provides the first opportunity to assess the ages of many of these deposits.
This investigation was initiated following a statistical analysis of the dates of chenier formation across northern Australia which identified a statistically significant regional increase in chenier building between 2800 and 1600 yr B.P. (Lees and Clements, 1987). Chenier records are ambiguous indi- cators of environmental change. It was hy- pothezised by Lees and Clements that this period of regional chenier building indi- cated a period of decreased wet-season pre- cipitation. A simultaneous increase in eo- lian sediment transport across northern Australia might be expected. This hypoth- esis is investigated here by TL dating. Older dune deposits have also been dated to address the wider problem of the epi- sodic nature of dune emplacement.
METHODOLOGY
Extensive field investigations, which in- cluded the sinking of about 120 auger holes, determined the stratigraphy of each dune field. Samples for TL dating were selected from representative dune field sections in
the Cobourg Peninsula (11” 22’ 30” S 132” 55’ 30” E), Shelburne Bay (11’ 52’ S 142” 53’ E), and Cape Flattery (15” 03’ 30” S 145” 15’ 20” E) (Fig. 1). Each stratigraphic sample was matched for reference, where possible, with a surface sample assumed to have been zeroed in sunlight. Two methods of themoluminescence dating were used. Three of the samples were processed at Al- pha Analytic, Florida, using fine fraction techniques (4 to 11 Fm). In dune podsols the fine fraction can move down the profile to accumulate in the B horizon, and con- tamination by more recently arrived sur- face material cannot be discounted. This can result in anomalously young ages when the fine fraction TL method is used (Stipp, personal communication, 1985). The coarse fraction (90 to 125 km) provides a poten- tially more reliable estimate of the age of B horizon material and 14 of the 17 samples discussed were analyzed using the coarse fraction TL method. Measurements of the thermoluminescence of the coarse fraction samples were carried out at the Xian Lab- oratory of Loess and Quaternary Geology, Academica Sinica.
PREPARATION OF COARSE FRACTION TL SAMPLES
The preparation procedure for these sam-

AUSTRALIAN DUNE AGES 171
ples was similar to that described by Flem- ing (1979) and Aitken (1985) for quartz in- clusions in pottery. The coarse quartz (90- 125 Frn) fraction was selected by sieving and the very small heavy mineral fraction was removed by magnetic separation. Cal- cite grains were removed with dilute hydro- chloric acid. Careful checking of the min- eral composition of more than 400 grains for the unprepared samples Au-03, -05, -09, -13, and -17 revealed no zircon or feldspar grains. These samples are almost pure quartz. The typical chemical and mineral- ogical composition of uncleaned bulk sam- ples was determined for both the Cape York sites. As the Cobourg Peninsula sites were in an Aboriginal sacred site, extensive bulk sampling was not carried out. Un- treated bulk samples from Cape Flattery range from 99.2 to 99.9% quartz, and the zircon content was about 0.14%. Those from Shelburne Bay range from 99.8 to 99.9% quartz, with a zircon content of less than 0.015%. The grains were etched in hy- drofluoric acid for about an hour to remove feldspars and the clay matrix, as well as the outer layer of the quartz grains affected by particles from interstitial materials. They were then washed in distilled water several times, oven dried, and then resieved to ob- tain the 90- to 125~pm fraction. This proce- dure was also followed in the preparation of the surface reference samples. The U and Th contents of Au-03 and Au-09, before and
TABLE 1. EFFECT OF HF ETCHING ON U AND Th CONTENT
Au-03 Au-09
U Th U Th Sample (wm) (pm) @pm) (mm)
Before HF etching 1.2 1.1 0.2 0.5
After HF etching 0.3 0.4 0.1 0.3
Note. The before and after etching U and Th con- tents of samples Au-03 and Au-05 are shown as typical examples of the results of this procedure.
after HF etching, are shown as typical ex- amples of the result of this treatment in Ta- ble 1. The quartz grain surfaces are typi- cally deeply pitted and, given the very low zircon content of the sediments, may con- tain small amounts of clay containing the traces of uranium and thorium identified. The IY. and p radiations from the U and Th would contribute to the internal dose rate for the grains.
PALAEODOSE MEASUREMENT
About 5 mg of prepared quartz grains was placed on each of 26- to 28-10 mm alu- minium discs for each sample. A single grain layer was achieved by spraying 6% silicone lube onto the disc before attaching the grains. All the sample discs were heated to a temperature of 500°C at a rate of S”C/sec in a pure nitrogen atmosphere. TL signals were measured with a Daybreak TL system. Corning 7-59 and 4-69 filters were used. Weight-normalization or dose- normalization for each sample was done later, to compensate for disc-to-disc varia- tion. TL intensity for 5-20% reproducibility error was obtained before and after normal- ization by weight. The regeneration TL method (Readhead, 1982; Aitken, 1985; Lu et al., 1987) was used to determine the palaeodose (P) for all samples as shown in Fig. 2. The residual TL method (Singhvi et al., 1982) was also used to measure the P value of several samples (Fig. 3). Values obtained by both methods agree within 1 standard deviation. The TL glow curves of sample AU-07 are shown, as an example, in Fig. 5. A 125mC ?Sr-P plane source with an active diameter of 9 mm was used for irradiation. Samples were bleached for 95 hr 100 mm below a Sylvania 275-W sun- lamp. The relationship between the surface sample TL and the sample natural TL is shown in Figs. 2 and 4. Most samples have a good palaeodose plateau for temperature at about 330”-380°C (Table 2).
Sample Au- 16 was processed with a later

172 LEES, YANCHOU, AND HEAD LEES, YANCHOU, AND HEAD
5~0~ 350°C Au-05 data 5*o- 350°C Au-05 data
Regeneration (Beta) Regeneration (Beta)
P= P= 88.5 i/--7.3 Gy 88.5 i/--7.3 Gy
-ED=lll.O+/--5.4 Gy -ED=111.0+/--5.4 Gy
b 0 75 150 2;5 225 Beta-dose (Gy) Beta-dose (Gy)
FIG. 2. A regenerated TL growth curve at 350°C for sample Au-05 showing the palaeodose deter- FIG. 2. A regenerated TL growth curve at 350°C for sample Au-05 showing the palaeodose deter- mination. N and S are the mean values of the sample natural TL and of the surface sample TL. The mination. N and S are the mean values of the sample natural TL and of the surface sample TL. The circles and spots are data points of the N+ UV+ and the N+, respectively. circles and spots are data points of the N+ UV+ and the N+, respectively.
batch of samples and both the residual and first growth curve methods were used. In the latter case, the palaeodose (P) = EDn - EDs, where EDn and EDs were derived
35OT AU-05
Residual (Beta)
from the first growth curves of the sample and surface sample, respectively. The ages derived from both methods correspond closely (Table 2).
0 25 50 75 100
p - dose (Gy)
FIG. 3. The TL growth curve for a temperature 350°C from sample Au-05 showing palaeodose (P) determination by the residual method.
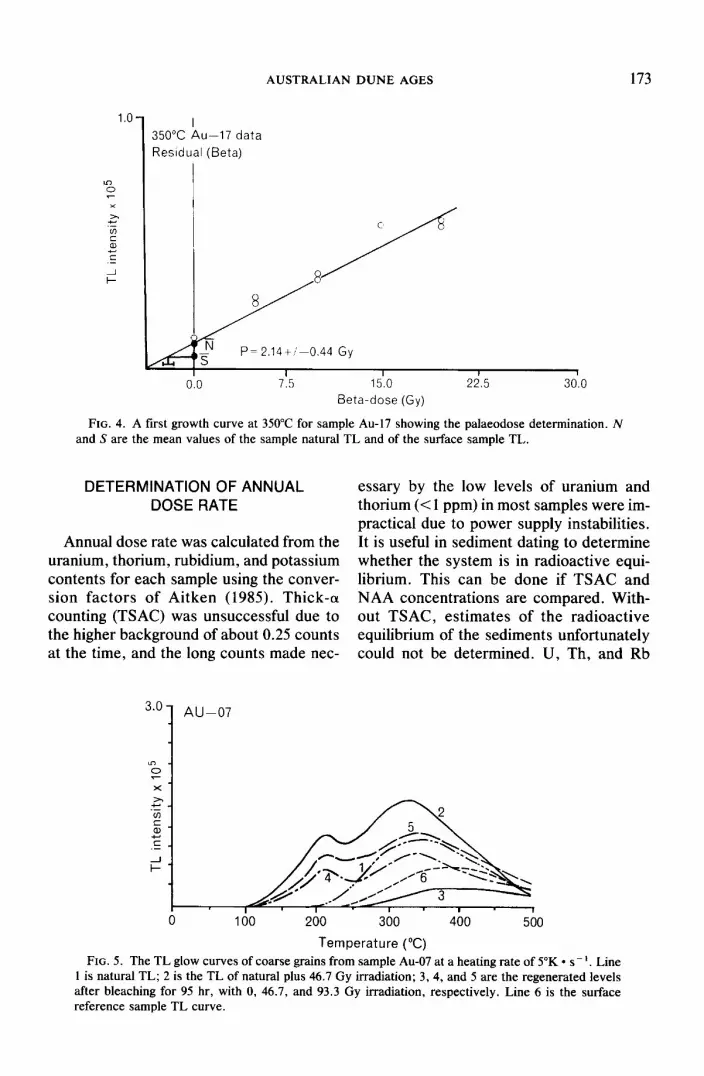
AUSTRALIAN DUNE AGES 173
l.O- 1.0
1 I I 35OT Au-17 data 35OT Au-17 data
Residual (Beta) Residual (Beta)
P- 2.14+!-0.44 Gy
7.5 15:o 15.0 22.5 22.5 30.0 30.0 Beta-dose (Gy) Beta-dose (Gy)
FIG. 4. A first growth curve at 350°C for sample Au-17 showing the palaeodose determination. N and S are the mean values of the sample natural TL and of the surface sample TL.
DETERMINATION OF ANNUAL DOSE RATE
Annual dose rate was calculated from the uranium, thorium, rubidium, and potassium contents for each sample using the conver- sion factors of Aitken (1985). Thick-a counting (TSAC) was unsuccessful due to the higher background of about 0.25 counts at the time, and the long counts made nec-
3.0 - AU-07
essary by the low levels of uranium and thorium (< 1 ppm) in most samples were im- practical due to power supply instabilities. It is useful in sediment dating to determine whether the system is in radioactive equi- librium. This can be done if TSAC and NAA concentrations are compared. With- out TSAC, estimates of the radioactive equilibrium of the sediments unfortunately could not be determined. U, Th, and Rb
Temperature (“C)
FIG. 5. The TL glow curves of coarse grains from sample Au-07 at a heating rate of 5°K l s- ‘. Line 1 is natural TL; 2 is the TL of natural plus 46.7 Gy irradiation; 3, 4, and 5 are the regenerated levels after bleaching for 95 hr, with 0, 46.7, and 93.3 Gy irradiation, respectively. Line 6 is the surface reference sample TL curve.

TABL
E 2.
TH
ERM
OLUM
INES
CENC
E RE
SULT
S AN
D AN
ALYS
IS
DATA
FO
R DU
NESA
ND
SAM
PLES
CO
LLEC
TED
FROM
NO
RTHE
RN
AUST
RALI
A.
2A.
COAR
SE
FRAC
TION
TE
CHNI
QUE
(XIA
N LA
BORA
TORY
OF
LO
ESS
AND
QUA
TERN
ARY
GEOL
OGY)
Ref.
Rem
ark
U Th
Rb
K,
O wa
ter
fit,
fi‘m
~t
ota,
Pl
atea
u Pa
laeo
dose
TL
ag
e (yr
)
(w-d
(w
m)
km)
Pm
(%)
( Gy
/Ka
) (C
) GY
) (1
) (2
) 3
Au-0
3 1.
2 4
Au-0
4 0.
7 5
Au-0
5 0.
4 6
AU-0
6 0.
8 8
Au-0
7 1.
2 9
AU-0
9 0.
2 11
Au
-l 1
3.3
12
Au-1
2 2.
2 13
Au
-13
0.4
15
Au-1
5 0.
9 16
Au
-16
0.9
16
Au-1
6 17
Au
-17
0.7
18
Au-1
8 0.
6 19
Au
-19
0.6
1.1
1.5
0.05
1
0.42
1 0.
550
0.97
1 0.
7 1.
5 0.
02
1 0.
239
0.37
3 0.
612
0.7
0.8
0.02
1
0.16
8 0.
318
0.48
5 0.
9 1.
0 0.
02
1 0.
244
0.43
1 0.
675
2.5
I 0.
02
1 0.
547
0.65
9 1.
206
0.5
1.0
0.01
1
0.08
8 0.
243
0.33
1 10
.4
12.6
0.
05
5 1.
780
1.72
0 3.
500
8.1
10.8
0.
14
2 1.
256
1.44
0 2.
6%
1.4
1.5
0.02
2
0.21
5 0.
368
0.57
3 1.
0 I
0.01
5
0.30
8 0.
453
0.76
1 1.
1 0.
5 0.
06
I 0.
341
0.47
9 0.
820
(F-m
etho
d;
Firs
t gr
owth
cu
rves
of
sa
mpl
e an
d su
rface
sa
mpl
e)
1.4
1.5
0.02
5
0.30
6 0.
436
0.74
2 0.
6 1.
4 0.
02
1 0.
208
0.37
7 0.
585
0.9
1.3
0.02
1
0.21
3 0.
379
0.59
2
330-
370
340-
380
310-
390
350-
390
310-
360
300-
350
35(c
100
330-
370
290-
340
340-
390
33&3
60
Note
. Th
e TL
ag
e of
th
e sa
mpl
e wa
s de
rived
fro
m
the
equa
tion
as
TL
age
(lo3
yr)
= Pa
laeo
dose
(G
y) To
tal
dose
ra
te
(Gy/1
03
yr)
Or
TL
age
(10’
yr)
= Pa
laeo
dose
(G
y) O
utsid
e do
se
rate
(G
y/103
yr)
’
340-
390
31&3
50
3OS3
40
2.0
-t 1.
0 20
00~1
000
12.2
2
1.4
19,8
00
+ 23
00
83.4
-t
2.2
171,
000
‘- 13
,000
16
.1
k 1.
6 23
,800
+
2400
34
.3
2 1.
6 28
,400
5
1300
9.
9 t
0.8
29,9
00
+ 24
00
15.9
+
2.0
9300
f
1100
11
7 +
12
81,4
00
2 85
00
4.9
2 0.
8 86
00
? 14
00
1.46
-c
0.3
3 19
00~4
00
2.29
2
0.54
28
00
t 70
0 2.
27
2 0.
20
2800
f
200
1.96
2
0.24
26
00~3
00
11.2
8 2
2.09
19
,208
+
3400
13
.44
e 1.
71
22,7
00
+ 28
00
(1) (2)
The
abov
e sa
mpl
es,
exclu
ding
sa
mpl
es
Au-l
1 an
d Au
-12
which
ha
ve
relat
ively
highe
r U
and
Th c
onte
nts,
ha
ve
very
low
U,
Th,
and
pota
ssiu
m
value
s co
nfirm
ing
that
th
ese
cons
ist
main
ly of
qua
rtz.
The
TL
age
obta
ined
fro
m
Eq.
(1)
is t
here
fore
th
e be
st
estim
ate
of
age.
Th
e be
st
estim
ate
of
age
for
sam
ples
Au
-1
1 an
d Au
-12
is o
btai
ned
from
Eq
. (2
). 2B
. FI
NE
FRAC
TION
TE
CHNI
QUE
(ALP
HA
ANAL
YTIC
)
Ref.
Rem
ark
1 a-
2589
7
a-25
94
10
a-25
91
U (p
pm)
4.4
3.3
2.7
Th
(ppm
)
12.9
6.
3 8.
4
Rb
(wm
) K,
O m
0.06
0.
06
0.06
Wat
er
m
TL
age
(yr)
X6,0
00
15,0
00
* 11
00
17,6
00
f 14
00
Note
. Fo
r sa
mpl
es
1, 7
, an
d 10
the
4- t
o 11
-pm
pa
rticle
siz
e fra
ctio
n,
polym
iner
alic,
wa
s se
para
ted
for
mul
tiple
glo
w an
alys
es
by
the
tine-
fract
ion
tech
niqu
e,
usin
g in
tern
al
datin
g ch
eckin
g m
etho
ds:
Rege
n,
Resid
ual,
and
R-8.
M
inera
l se
nsitiv
ity
and
ED
was
dete
rmine
d by
CL
and
8 irr
adia
tions
wi
th
calib
rate
d Am
-241
an
d Sr
-90
plac
k so
urce
s.
U,
Th,
and
K co
nten
ts
for
inte
rnal
do
se
rate
s we
re
mea
sure
d by
th
ick
sour
ce
a co
untin
g an
d at
omic
abso
rptio
n.
Wat
er
was
take
n as
ini
tial
cont
ent.
Cosm
ic do
se
was
take
n as
0.
14
Gy/lO
) yr
(a A
nalyt
ic).
Sam
ple
1 ((r
-258
9)
is c
lose
to
the
ons
et
of
satu
ratio
n.
Addi
tive
8 an
d a
dose
s fo
r re
sidua
l an
d R-
8 te
chni
ques
ar
e in
sat
urat
ion.
Th
is
sam
ple
also
sh
ows
30%
fad
ing.
On
ly a
grea
ter-t
han
age
coul
d be
der
ived,
as
sum
ing
that
th
e sa
mpl
e m
ater
ial
had
been
bl
each
ed
to r
esid
ual
in t
he
field
. It
can
be s
een
that
al
l of
the
sa
mpl
es
take
n fro
m
piso
lithi
c,
or f
errip
an,
B ho
rizon
m
ater
ial
had
com
para
tively
hi
gh T
h,
and
to a
less
er e
xtent
U
and
Rb,
value
s (A
u-l
1, A
u-12
, a-
2589
). As
disc
usse
d in
the
tex
t, th
ese
date
s ar
e lik
ely
to
be c
onsid
erab
le
unde
rest
imat
es
of t
he
actu
al
age
of t
he
depo
sits.

AUSTRALIAN DUNE AGES 175
contents of the sample were obtained by neutron activation analysis. The detection limit of neutron activation analysis for the U and Th contents of the samples is about 0.05 ppm, and the uncertainties in U and Th analysis are about 5-10%. The potassium content was determined by atomic absorp- tion spectrometric analysis.
Because the uranium, thorium, and po- tassium contents are very low (el%) for most of the samples (Table 2), the internal dose rates, supplied by the uranium and thorium within the quartz grains, have to be considered. In this situation the annual dose rate (&,tal) is given by
where
bin = K&X + 0.42&
and
&ut = 0.9ofip + b,r + b>,,
where &, and b>,,t are the internal and ex- ternal annual dose rates. for the quartz grains. The Da, Dp, D-y, D, are the contri- butions to the dose rate from (Y, l3, y, and cosmic radiation, respectively.
The K value for TL effectiveness of the (Y particle was taken to be 0.1 for all samples which probably causes an uncertainty of about 5 to 10% for the TL age estimate of the sample. The factor of 0.10 is an average correction for the attenuation of p-radiation within the quartz grain (Aitken, 1985, p. 260). Correction to dose rate values for the water content of the sample were made according to the equations given by Flem- ing (1979).
ESTIMATE OF TL AGE
Results for the 14 samples of dune sand analyzed using the coarse fraction tech- nique are shown in Table 2, which gives the analysis data, the weighted mean palaeo- doses for plateau temperatures of about 330”-380°C and the estimates of TL age recommended for each sample. Ages of
samples with very low U and Th content were calculated using the equation
TL age (IO3 yr) =
Palaeodose (Gy) Total Dose Rate (Gy/103 yr) ’ (1)
The age of samples with relatively higher U and Th content was calculated using the equation
TL age (lo3 yr) =
Palaeodose (Gy) Outside Dose Rate (Gy/103 yr) . (2)
FINE-GRAIN TECHNIQUE
Three of the samples (Alpha 2589, 2594, and 2597) were submitted to Alpha Ana- lytic, Inc., for thermoluminescence dating on the individual sediment basis. The 4- to l l-p.rn polymineralic particle size fraction was separated for multiple glow analyses by the fine-grain technique using three methods: regeneration, residual, and R-P. Mineral sensitivity and ED were deter- mined by CX- and p-irradiations with cali- brated Am-241 and S-90 plack sources. Uranium and thorium contents for internal dose rates were measured by thick-source (Y counting, and atomic absorption spec- trometry in the case of potassium. As with the coarse fraction, water content was taken as sample content. Cosmic dose was taken as 0.14 Gy/103 yr. Results are listed in Table 2B.
DESCRIPTION OF SAMPLE SITES AND RESULTS
Cape Flattery
Samples from the Cape Flattery dune- field were collected from a major exposure of palaeosols 12 km southwest of the Cape Flattery settlement. A 40-m-deep section of the dunefield stratigraphy is exposed by a blow-out and six dunesand units (A to F; Fig. 6) are identified. These units have been dated using both 14C and TL.

76 LEES, YANCHOU, AND HEAD
FIG. 6. Map showing sample location, core diagrams, and schematic stratigraphy of the Cape Flattery sites. The Bedford Dunesand unit of Pye (7WO-gOOO yr B.P.) is not present in the exposure investigated and there may be intervening units between F and G.

AUSTRALIAN DUNE AGES 177
Pye (Pye and Switsur, 1981; Pye and Bowman, 1984) has a number of 14C ages from around Cape Flattery. Only three of Pye’s dates are useful in assembling a chro- nostratigraphy of the dune field. These were collected from a quarry adjacent to the Cape Flattery mine camp. All are from charcoal associated with the Bedford Dune- sand unit (Pye and Switsur, 1981) and give age estimations of this unit of 7480 + 75 yr B.P. (Q-2081), 7560 + 90 yr B.P. (B-2494) and 8200 + 85 yr. B.P. (Q-2082). This unit does not appear to be extensive in the northern half of the dunefield and was not identified in the section investigated.
Within the blow-out sampled in this study the upper unit (unit A, Fig. 6) consists of 0.6 m of reworked, dull-yellow-orange sand (IOYR 7/4). This appears to corre- spond to the Mitchell Dunesand unit iden- tified by Pye (Pye and Switsur, 1981) and overlies a thin layer of charcoal. Radiocar- bon dating of this material gave an age of 220 2 70 yr B.P. (ANU 6171) (Table 3). Below this unit is 9 to 10 m of light- purplish-grey (5RP 7/l) medium to line sand (unit B). A sample taken 1.5 m below the top of this sand gave a TL age of 2000 ? 1000 yr (Xian Au-03). This grades down- ward to a dull-orange sand (5YR 6/4) by 10 m depth (unit C) with the distinct vertical white pipes of A horizon material typical of deep, well-drained dune podsols (Thomp- son, 1983). A sample taken at 10 m gave a TL age of 19,200 + 3400 years (Xian Au- 18). The sand becomes lighter (7.5YR 714) toward 16 m depth and then grades through a mottled brown and white sand to become, by 20 m depth, mottled light grey (2.5Y 8/l). A sample from this depth gave a TL age of 22,700 ? 2800 years (Xian-Au-19).
Underlying this, and separated by a marked erosional break, are 5 m of mottled brown and white sand (unit D), from which a sample gave a TL age of 19,800 & 2300 years (Xian Au-04). TL dates for samples Au-18, Au-19, and Au-04 overlap at 1 stan- dard deviation so no significant difference in age of deposition can be ascertained within the limits of error. Below this de- posit is a distinctive, very indurated unit (unit E) which forms the main deflation base of the “blow-out” at about 60 m above present sea level. It is composed of greyish- brown sand which has become steel-grey where exposed to the surface. The sample from this unit gave a TL age of 171,000 + 13,000 years (Xian Au-05). In some places this unit has been completely eroded, ex- posing an underlying unit (unit F). This is also very indurated, and it was not possible to recover a satisfactory sample for dating. A search of the adjacent seaward slope of the dunesand massif for outcropping units below this level was largely unsuccessful. The lower part of the slope was character- ized by a lag of ferripan fragments. A sam- ple of the material (unit G) underlying the ferripan “armor” of the lower, seaward slopes of the dunesand massif was dated using line fraction techniques. The sample (a-2589) was close to the onset of satura- tion. Additive p and 01 doses for the residual and R-B techniques were in saturation. The sample also showed 30% fading and so only a minimum age could be derived, assuming that the sample material had been bleached to residual in the field. The TL age deter- mined was >66,000 years (a-2589), but the true age is likely to be considerably older.
In the section sampled there was no trace of the Bedford Dunesand identified by Pye
TABLE3. RADIOCARBON DATES
Lab no. Location 14C age (yr B.P.)
ANU 4980 Shelbume Bay 29,000 k 3030 ANU 6171 Cape Flattery 220 t 70 p-5045 Cape Grenville 930 + 135” ANU 6029 Cobourg Peninsula 180 k 105”
a All shell samples were corrected for reservoir effect (- 450 yr).
Sample type
Wood (cellulose fraction) Charcoal Shell hash Shell

178 LEES, YANCHOU, AND HEAD
Unddferentmted
CORAL SEA
A Sand Dune
\ Lake
HELBURNE BAY ,/--
CHEMATIC CHRONOSTRATIGRAPHY
FIG. 7. Map showing sample location, core diagrams, and schematic stratigraphy of the Shelbume Bay sites; the presence of unit B is inferred because it has not yet been successfully identified and dated.

AUSTRALIAN DUNE AGES 179
farther north at Cape Flattery. As-yet-un- identified units also probably lie between units F and G. Recovery of samples from these units would require a powered drilling rig.
Shelburne Bay
In the Shelburne Bay dunefield (Fig. 7) samples for TL dating were collected from a backhoe pit at Conical Hill (11” 56’ 00” S, 143” 07’ 30” E), the cliff at Double Point (11” 52’ 20” S, 142” 53’ 30” E), and from the scarped shoreline at Red Cliffs (11” 50’ 00” S, 142” 52’ 15” E).
Red Cliffs samples were collected from two sites. At the first, three stratigraphic units were observed. Only one TL date was obtained here (17,600 + 1400 yr; a-2597), using the fine-fraction technique. We inter- pret this date as being anomalously young because, as it is a remnant of a B horizon of a dune podsol, the modern dose rate is likely to be higher than the average dose rate of this deposit through time. Also, ac- cession of tine-grained material from above may have occurred. Although it is not pos- sible to assess the proportion of fine- grained material from outside this unit which may have been illuviated down the profile, it would be prudent, on both counts, to assess this date as providing only a minimum age for the unit. The three units below this sand consist of (i) a weathered, clay-rich sand less than 1 m thick and con- taining extensive layers of pisolithic gravels interpreted as colluvium, (ii) 5-10 cm offer- ripan which incorporated some poorly sorted quartz and grains, and (iii) weath- ered bedrock. These were clearly not re- lated to dune sand deposition of late Qua- ternary age.
At the second site at Red Cliffs, 100 m to the south, a TL age of 28,400 + 1300 years (Xian Au-07) was obtained for the lower part of a brown palaeosol. This palaeosol is 6-8 m deep and is underlain by another palaeosol, grey in appearance with brown pipes. A TL date for this sand measured 29,900 ‘- 2400 years (Xian Au-09). At the
base of the section, and cropping out at beach level, is a humate-cemented sand (Swanson and Palacas, 1965; referred to as humicrete by Pye, 1982). This sand con- tains detrital logs, the cellulose fraction of one returning a 14C age of 29,740 ? 3030 yr B.P. (ANU 4980) (Table 3). All three ages overlap at 1 standard deviation, so no sig- nificant difference in age of deposition can be ascertained within the limits of error. These sands are ascribed to unit D (Fig. 7). An X-ray diffraction pattern of the wood from the log indicated a relatively high de- gree of preservation of cellulose (Head, 1982); hence, the 14C age can be considered reliable.
On the southern side of Shelbume Bay, at Double Point, a 2- to 5-m layer of dune sand overlies the local sandstone and shale bedrock. This thin dune sand cover con- tains two units, a recent upper unit and an older, humic-rich lower unit which gave a TL age of 23,800 ? 2400 yr (Xian Au-06). This is ascribed to unit C (Fig. 7). Some 25 km to the east, at Conical Hill, a red piso- lithic sand, in color similar to the unit from which a-2597 was collected at Red Cliff beach, was exposed in a backhoe pit. A TL age of 15,000 + 1100 yr (Alpha 2594) was measured on this material but, as this age was achieved by dating only the fine frac- tion, and the sample was collected from a pisolithic layer, the date provides only a minimum age. This unit is identified as an exposure of unit C.
Unit C in the dunefield appears as low hills of B horizon material, the A horizon having been eroded. The depositional unit (unit B) apparently corresponding to this erosional event has not been successfully dated due to its extensive reworking by modem, active dunes (unit A).
The reworking of unit B takes the form of elongate parabolic dunes within the dune field, and a transgressive dune sheet closer to the southern shoreline. These are both ascribed to unit A (Fig. 7). Shell hash from the youngest beach ridge underlying this transgressive dune sheet yielded a reser-

180 LEES, YANCHOU, AND HEAD
voir-corrected i4C age of 930 + 135 yr B.P. (B-5045) (Table 3). This date provides only a maximum age for the overlying dunes. Thus, Pye’s (1983) estimate, based on aerial photography and assumed rates of dune movement, that eolian reactivation of unit B may have begun 300-500 yr ago appears reasonable.
Arnhem Land
Samples of dunesand from the Arnhem Land dunetields were collected from sites on the Cobourg Peninsula south of Cape Cockburn (11” 22’ 30” S, 132” 55’ 30” E). The steep cliffs of the coastline are cut into indurated dune material exposing layers of pisolithic bauxite overlying the ferruginous and mottled fine sandstones of truncated podsol profiles (Whitehead, 1983). In order to avoid the serious problems associated with dating these older palaeosols, dated samples were collected only from the younger dunesands overlying the indurated deposits. No sample was collected from the currently mobile dunes (unit A; Fig. 8). Landward of these modem dunes an erod- ing section of older dunesands was sam- pled. Two units could be clearly identified in this section. The younger unit (unit B; Fig. 8) gave a TL age of 1900 + 400 yr (Xian Au-15), and the older (unit C; Fig. 8) 2800 2 500 yr (Xian Au-16) and 2600 t 300 yr (Xian Au-17). The date quoted for sample Au-16 is the mean of the R-method (2800 5 700) and F-method (2800 2 200) results. Neither unit showed any signs of profile develop- ment and the ages appear reasonable. As a cross-check, an aboriginal shell midden, which overlay the two units, was sampled. Shell from this sample gave a 14C reservoir- corrected age of 180 -+ 105 yr B.P. (ANU- 6029) (Table 3). This date provides only a minimum age for the underlying sand.
Immediately inland from this site is an elongate parabolic dune vegetated by low closed forest. Some profile development was evident in this dune, with 20 cm of A horizon overlying a distinct B horizon (unit D; Fig. 8). A sample from 1 m depth gave a
TL age of 8600 * 1400 yr (Xian Au-13). To the south of this elongate parabolic dune is a deposit of cemented pisoliths which has a marked “hairpin” shape suggesting that it might be the remnant of a much older elon- gate parabolic dune. The trailing arms of the dune visibly extend out to sea for some distance. A sample of sand collected imme- diately beneath this layer of pisoliths (Xian Au- 1 I) was found to have a relatively high U and Th content and gave a TL age of 9300 + 1100 yr. Another sample from the same unit (unit E; Fig. 8) was collected from a sea-cliff exposure to the south. This also had relatively high U and Th content and gave a TL age of 81,400 -+ 8500 yr (Xian Au-12). Sample Au-12 was collected from the middle of a good exposure of this unit well away from the pisolith layer, while the other sample (Au-l 1) was collected close to the pisolithic surface. Horsfall and Wilkes (1975) noted a close correlation between the distribution of bauxite and thorium in this area and it is likely that the postdepo- sitional processes that resulted in the con- centration of alumina in the pisolithic layer also have led to a similar local concentra- tion of thorium and, to a lesser extent, ura- nium. Thorium enrichment of pisoliths is common in Australian palaeosols, being ev- ident on a number of radiometric surveys. Clearly, the radiation history of samples collected from, or near, these pisolithic lay- ers has varied considerably over time as natural solution and redeposition of the ra- dioelements has taken place. Given the marked pedological difference between the deposit from which Au-13 was coflected and the deposit from which Au-l 1 and Au- 12 were collected, the date derived from sample Xian Au-11 is thought to be too young. It would also be prudent to consider Au-12 as a minimum age.
DISCUSSION
There must remain some uncertainty about the reliability of the TL dating method itself until it has been more thor- oughly validated. A number of recent in-

AUSTRALIAN DUNE AGES 181
MALA Y EA Y
ARAFURA SEA Arnhem Land Aboriglnal Reserve
t Sand Dune
v+? Shore platforms
m Cliff
:OBOURG PENINSULA 0
CHEMATIC CHRONOSTRATIGRAPHY 26OOt 300yr (AU~17. TL)
~~oo~,~oo~~~/\u~I~.TL~, 2800i500yr(AU’6~TL1 1900~400yr (NJl5. TL)
,,160fKXyr BP (ANU 6029 ‘%)
1.400i6500yr (AU-12 TL)
FIG. 8. Map showing sample location, core diagrams, and schematic stratigraphy of the Cobourg Peninsula sites. Unit F represents the topmost of a sequence of indurated palaeosols which have not been sampled; these would not be suitable for TL dating due to the certainty of serious dose rate problems. At least three units appear to be present below F.

vestigations using both 14C and thermolu- minescence dating methods suggest that TL provides reliable estimates of age within the range where the two methods can be com- pared (Nanson and Young, 1987; Gardner et al., 1987). To move beyond the recon- naissance phase of investigation multiple replicates of dates must be measured in or- der to reduce the inherent inaccuracies of the TL method, currently believed to be be- tween 10 and 20%. In addition, the problem of long-term variability in dose rate is a very serious one for older samples and one for which a satisfactory solution is not yet at hand (Prescott, 1987).
As discussed above in relation to sample Au-l 1, older dune podsols present some problems. The radiation history of the de- posit will vary as profile development oc- curs. The TL dates calculated for samples from the zone of depletion, the A horizon, are likely to be too old, and those from the zone of accumulation, the B horizon, too young. Based on our experiences in these and other dunefields, still under examina- tion, the problem is likely to be most acute with samples from the top of the B horizon, particularly if pisoliths are forming. In this environment, in dunes where drainage is impeded, or where the radioelement con- tent is comparatively high, we believe that dates older than about 20,000 years may be significantly in error. Where the dunes are deeply drained, and the radioelement con- tent is comparatively low, we believe that dates older than about 50,000 years may be significantly in error. This effect is likely to be a significant problem for samples a-2589, a-2579, a-2594, Au-05, Au-11, and Au-12. These must be considered as only offering minimum ages for the units sam- pled.
In deposits where the initial composition of the sediments is 99.8 to 99.9% quartz and detailed geochemistry (Lees, 1981, 1986) shows only very minor differences between the A and B horizons, as through much of the more recent parts of the Shelburne
182 LEES, YANCHOU, AND HEAD
Bay and Cape Flattery dunefields, the dose rate should not be as serious a problem. The close correspondence between Au-09 (29,900 + 2400) and the 14C age of the log underlying it (29,740 + 3030 yr B.P.) tends to support this view. Similarly, the poten- tial long-term variability in depositional en- vironment means that the corrections for sample water content must be viewed with caution for older samples. All the samples described in this paper were deliberately collected well above the water table in freely drained sand bodies; as there was no evidence for changes in the water content of the samples, it was assumed that the wa- ter content of samples, as collected, was representative of the depositional environ- ment through time. Despite these caveats, a sequence of dune emplacements is pro- posed for northern Australia- Excluding the most recent dune activation, three events are proposed with some confidence.
2600-1800 yr B.P.
The dates of three samples (Au-H, Au-16, and Au-17) from the Cobourg Peninsula and one from Cape Flattery (AU-~) fall into the 2800-1600 yr B.P. period identified by Lees and Clements (1987) as being a period of widespread regional change in climatic con- ditions. Stabilizing vegetation cover on sand bodies decreases with an increase in the evaporation/precipitation ratio. Al- though Ash and Wasson (1983; Wasson, 1984) argue that wind, rather than vegeta- tion, is the most important limit on dune mobility in desert areas, a reduction in veg- etation cover with the seasonally persis- tent, strong winds of northern Australia would certainly lead to the mobilization of dunes. Chenier formation can be influenced by increased marine energy associated with stormier conditions, but the evidence, par- ticularly from the Point Stuart chenier plain (Lees, 1987), suggests there was a reduc- tion in fluvial input to the coast during this period. Therefore, taken together, the evi- dence from both the dunes and cheniers in-

AUSTRALIAN DUNE AGES 183
dicates a possible period of reduced wet- season precipitation. There is insufficient evidence from the dune and chenier records to determine the magnitude of the decline in rainfall or whether this period of lower pre- cipitation was coupled with an increased variability of the climate. However, high- resolution pollen analyses of cores from the Magela Creek floodplain, western Arnhem Land (Clark and Guppy, 1988), suggest that there may have been considerable variabil- ity through this period.
8500-7000 yr B.P.
The early Holocene age (Xian Au- 13) of 8600 + 1400 TL years obtained from the Cobourg Peninsula dunefield is similar to the ages obtained by Pye and Switsur (1981) for the Bedford dunesand unit at Cape Flat- tery and may represent the end of a period of dune instability initiated by shoreline erosion associaated with rising sea level. This adds some support to the Cooper- Thorn hypothesis, expounded by Pye (1984; Pye and Bowman, 1984), which argues that there appear to be episodes of dune activity associated with marine transgressions. By this hypothesis, rising sea level leads to shoreline erosion, the destruction of fore- dune and beach ridge vegetation, the for- mation of blow-outs, and the initiation of transgressive dunes. Pye and Bowman (1984) discuss 14C ages from the Sydney area, Myall Lakes, and Cape Flattery in support of this hypothesis (Thorn, 1978). The cluster of dates around 8500-7500 yr B.P. appear to represent surface stabiliza- tion following this episode of dune trans- gression and tie in with interpretations of the vegetation history based on work on sites in the Atherton Tableland by Kershaw (1973, 1978, 1983). There is a marked change from drier to wetter conditions at most of his sites by 7500 to 7000 yr B.P. (Kershaw, 1983). Numerical comparisons of dryland fossil and modern pollen spectra from these sites suggest that rainfall may
have been up to 50% higher during the pe- riod 7000 to 3000 yr B.P. (Kershaw, 1983).
24,00&18,000 yr B.P.
The cluster of dates at both Cape Flattery and Shelburne Bay between 24,000 and 18,000 yr B.P. appear to represent a period of widespread dune activity associated with the last glacial maximum. This adds some support to arguments put forward by Coaldrake (I962), Ward (1977), and others that some dune formation occurred during glacial low sea levels when wide areas of continental shelf became exposed to wind action. The reworking of these dunes pro- vides much of the sand incorporated into the later units. However, most of the mor- phostratigraphic evidence of such dune ac- tivity has been destroyed on the shelf by rising sea levels.
The remaining dates are difficult to dis- cuss in isolation. The oldest of the units at Shelburne Bay (about 30,000 yr B.P.) has some soil profile development indicating a period of stability before the reactivation of the deposit during the last glacial maxi- mum. This can reasonably be considered a separate episode of dune activity possibly associated with a late Pleistocene intersta- dial transgression.
The TL age of 81,400 f 8500 yr (Xian Au- 12) from the Cobourg Peninsula and the oldest of the TL dates obtained (171,000 -+ 13,000 yr Xian Au-05), from Cape Flattery, may be significantly in error due to prob- lems of dose rate estimation. As both of these latter samples were collected from B horizon material, the dates must be consid- ered as minimum ages for the samples con- cerned.
CONCLUSION
Dune emplacement across the investi- gated northern Australian dunefields is ep- isodic. Although this has often been as- serted, no evidence of episodicity has been presented prior to this study. Our recon- naissance dating also provides data sug-

184 LEES, YANCHOU, AND HEAD
gesting that these dune emplacements have occurred synchronously across the east- ern part of north Australia. Three distinct events can be identified; the first falls be- tween 2600 and 1800 yr B.P., a second be- tween 8500 and 7000 yr B.P., and a third phase between 24,000 and 18,000 yr B.P. Other isolated dates may represent major or local events at about 81,000 and 171,000 yr B.P. but, with the limited data thus far available, no firm conclusions regarding these inferred events can be reached.
ACKNOWLEDGMENTS
Professor Yang carried out the NAA determina- tions. Samples were analyzed by Zhang Jingzhao. Samples were collected with the assistance, at various times, of Andrew Lishmund, Wendy Southern, and Geoff Hope. Financial support for this work came from Thomas Essington Breen and Australian Na- tional University Faculties Research Fund. We are grateful for helpful comments on earlier versions of this paper by John Chappell, Bruce Thorn, Martin Williams, Gerald Nanson, David Price, John Prescott, John Hutton, and James Shulmeister. Diagrams were drawn by Val Lyon.
REFERENCES
Aitken, M. J. (1985). “Thermoluminescence Dating.” Academic Press, London.
Ash, J. E., and Wasson, R. J. (1983). Vegetation and sand mobility in the Australian desert dunefield. Zeitschrif Geomorphologie, Supplementband 45, 7-25.
Chappell, J. (1983). A new detailed sea-level record for last 300,000 years from New Guinea. Search 14,9% 100.
Clark, R. L., and Guppy, J. C. (1988). A transition from mangrove forest to freshwater wetland in the monsoon tropics of Australia. Journal of Biogeog- ruphy 1.5, 665-684.
Coaldrake, J. E. (1962). The coastal dunes of southern Queensland. Proceedings of the Royal Society of Queensland 72, 101-l 16.
Fleming, S. J. (1979). “Thermoluminescence Tech- niques in Archaeology.” Clarendon, Oxford.
Galloway, R. W., Storey, R., Cooper, R., and Yapp, G. A. (1980). Coastal Lands of Australia. CSIRO Australian Division of Land Use Research, Techni- cal Memo. 80/24.
Gardner, G. J., Mortlock, A. J., Price, D. M., Read- head, M. L., and Wasson, R. J. (1987). Thermolu- minescence and radiocarbon dating of Australian desert dunes. Australian Journal of Earth Sciences 34, 343-357.
Head, M. J. (1982). The degree of degradation of fossil material from archaeological sites: Can the influence of past environments be defined? In “Archaeome- try: An Australian Perspective” (W. Ambrose and P. Duerdin, Eds.), pp. 22&227. Australian National University.
Horsfall, K., and Wilkes, P. (1975). Aeromagnetic and radiometric survey of Cobourg Peninsula, Alligator River and Mount Evelyn 1: 250,OUO Sheet areas, Northern Territory, 1971-72. Bureau ofMineral Re- sources, Geology and Geophysics, Report (Austra- h) 1975189.
Kershaw, A. P. (1973). “Late Quaternary Vegetation of the Atherton Tableland, North-East Queensland, Australia.” Unpublished Ph.D. thesis, Australian National University.
Kershaw, A. P. (1978). Record of last interglacial- glacial cycle from northeastern Queensland. Nature (London) 272, 159-161.
Kershaw, A. P. (1983). The vegetation record from north eastern Australia 722 KA. In “Proceedings of First CLIMANZ.” (J. M. A. Chappell and A. Grin- drod, Eds.). Department of Biogeography & Geo- morphology, RSPacS, Australian National Univer- sity.
Lees, B. G. (1981) Final report on exploration in A to P 2479M and 2480M Thursday Island. BISQ. Open File Report 10127, Queensland Mines Department, 120 pp.
Lees, B. G. (1986) Final report on exploration in A to P 2545M and 2546M Cooktown. BISQ. Open File Report 15352, Queensland Mines Department, 151 PP.
Lees, B. G. (1987). Age structure of the Point Stuart chenier plain. A reassessment. Search 18(5), 257- 259.
Lees, B. G., and Clements, A. M. (1987). Climatic im- plications of chenier dates in northern Australia. Ra- diocarbon 29(3), 31 l-317.
Lu Yanchou, Mortlock, A. J., Price, D. M., and Readhead, M. L. (1987). Thermoluminescence dat- ing of coarse grain quartz loess from the Malan Loess at Zhaitang section, China. Quaternary Re- search 28, 356-363.
Nanson, G. C.. and Young, R. W. (1987). Comparison of thermoluminescence and radiocarbon age-deter- minations from late-Pleistocene alluvial deposits near Sydney, Australia. Quaternary Research 27, 263-269.
Prescott, J. R. (1987). Some experiences with sedi- ment dating. In (W. Ambrose and J. M. J. Mum- mery, Eds.), “Archaeometry: Further Australasian Studies” Australian National University, 181-188.
Pye, K. (1982). Characteristics and significance of some humate-cemented sands (humicrete) at Cape Flattery, Queensland, Australian Geological Maga- zine 119, 229-242.
Pye. K. (1983). Formation and history of Queensland

AUSTRALIAN DUNE AGES 185
coastal dunes. Zeitschrift fir Geomorphology 45,
175-204. Pye, K. (1984). Models of transgressive coastal dune
building episodes and their relationship to Quater- nary sea level changes: A discussion with reference from eastern Australia. In “Coastal Research: U.K. Perspectives” (M. Clark, Ed.), pp. 81-104. Geo- books, Norwich.
Pye, K., and Bowman, G. M. (1984). The Holocene marine transgression as a forcing function in epi- sodic dune activity on the Eastern Australian coast. In “Coastal Geomorphology in Australia” (B. G. Thorn, Ed.), pp. 179-196. Academic Press, Sydney.
Pye, K., and Switsur, V. R. (1981). Radiocarbon dates from the Cape Bedford-Cape Flattery dunefield, North Queensland. Search 12, 225-226.
Readhead, M. L. (1982). Extending thermolumines- cence dating to geological sediments. In “Archae- ometry, An Australian Perspective” (W. Ambrose and P. Duerdin, Eds.), pp. 276281. Australian Na- tional University Press, Canberra.
Singhvi, A. K., Sharma, Y. P., and Agrawal, D. P. (1982). Thermoluminescence dating of sand dunes in Rajastan, India. Nature (London) 295, 313-315.
Swanson, V. E., and Palacas, J. G. (1965). Humate in coastal sands of northwest Florida. U.S. Geological
Survey Bulletin, B 1214.
Thorn, B. G. (1978). Coastal sand deposition in south- east Australia during the Holocene. In “Land- form Evolution in Australasia” (J. L. Davies and M. A. J. Williams, Eds.), pp. 197-214. Australian National University Press, Canberra.
Thompson, C. H. (1983). Development and weather- ing of large parabolic dune systems along the sub- tropical coast of eastern Australia. Zeitschrift Geo-
morphologie 45, 205-225.
Ward, W. T. (1977). Sand movement on Fraser Island: A response to changing climates. In “Occasional Papers in Anthropology” (P. K. Lauer, Ed.). No. 8, pp. 113-126. Anthropology Museum, University of Queensland.
Wasson, R. J. (1984). Late Quatemary palaeoenviron- ments in the desert dunetields of Australia. In “Late Cainozoic Palaeoclimates of the Southern Hemi- sphere” (J. C. Vogel, Ed.). Balkema, Rotterdam.
Whitehead, B. R. (1983). An information package on the geology and mineral resources of Bathurst ls- land, Melville Island and Cobourg Peninsula. Tech- nical Report GS 83/4. Northern Territory Geological Survey, Darwin.
Willmott, W. F., and Powell, B. S. (1977). Explana- tory Notes, 1:250,000 Geol. Map, Cape Weymouth, Queensland. BMR, Canberra.